UNITED STATES
SECURITIES AND EXCHANGE COMMISSION
Washington, D.C. 20549
----------------------------------------------------------------
FORM N-CSR
CERTIFIED SHAREHOLDER REPORT
OF REGISTERED MANAGEMENT
INVESTMENT COMPANIES
Investment Company Act File Number 811-23333
----------------------------------------------------------------
Cliffwater Corporate Lending Fund
(Exact name of registrant as specified in charter)
----------------------------------------------------------------
c/o UMB Fund Services, Inc.
235 West Galena Street
Milwaukee, WI 53212
Registrant’s telephone number, including area code: (414) 299-2000
Terrance P. Gallagher
235 West Galena Street
Milwaukee, WI 53212
(Name and address of agent for service)
----------------------------------------------------------------
Date of fiscal year end: March 31
Date of reporting period: March 31, 2023
Item 1. Report to Shareholders
CLIFFWATER CORPORATE LENDING FUND
![]()
Annual Report
For the Year Ended March 31, 2023
Cliffwater Corporate Lending Fund |
Table of Contents For the Year Ended March 31, 2023 |
2 | ||
4 | ||
5 | ||
6-61 | ||
62 | ||
63 | ||
64 | ||
65-66 | ||
67-68 | ||
69-109 | ||
110-111 | ||
112-113 | ||
114-115 |
This report is submitted for the general information of the shareholders of the Fund. It is not authorized for distribution to prospective investors unless preceded or accompanied by an effective prospectus, which includes information regarding the Fund’s risks, objectives, fees and expenses, experience of its management and other information.
www.cliffwaterfunds.com
1
To our shareholders:
We recently completed three and three-quarter years of operation and want to thank you for the continued trust you have placed in us. Performance has been consistently strong relative to our objective.
The Cliffwater Corporate Lending Fund (the “Fund”) produced a net 8.15% annualized return from its June 5, 2019 inception, through March 31, 2023. This compares to a 3.59% annualized return for the Morningstar LSTA US Leveraged Loan Index. The Fund also reported relatively consistent monthly returns. Its annualized standard deviation measured 2.08% for the same period compared to 8.02% for the Morningstar LSTA US Leveraged Loan Index.
The Fund experienced strong investor inflows over the trailing year, with net-asset-value growing from $6.7 billion on March 31, 2022, to $11.1 billion on March 31, 2023. This asset growth has been supported by significant investment in personnel and technology to grow our platform and the onboarding of additional strategic lending partners to access high quality senior corporate loans. Factors materially affecting the Fund’s performance during the most recently completed quarter include a high current cash yield, and few realized losses.
We remain confident in the Fund’s continued performance despite the uncertain economic environments brought by inflation and the Fed’s increase in interest rates. The Fund’s 10.6% net current yield remains attractive, and we believe that the floating rate nature of our loans should continue to react favorably in a rising interest rate economy.
We again sincerely thank you for your support.
Regards,
Stephen L. Nesbitt
Chief Investment Officer
Cliffwater LLC
The performance data shown represents past performance which does not guarantee future results. It is net of all fees. Current performance may be lower or higher than the performance quoted. All performance shown assumes reinvestment of dividends.
2
Cliffwater Corporate Lending Fund |
Letter to Shareholders March 31, 2023 (Unaudited) (Continued) |
Important Disclosures
The Fund’s investment program is speculative and entails substantial risks. There can be no assurance that the Fund’s investment objectives will be achieved or that its investment program will be successful. Investors should consider the Fund as a supplement to an overall investment program and should invest only if they are willing to undertake the risks involved. Investors could lose some or all of their investment.
Shares are an illiquid investment.
We do not intend to list the Fund’s shares (“Shares”) on any securities exchange and we do not expect a secondary market in the Shares to develop.
You should generally not expect to be able to sell your Shares (other than through the limited repurchase process), regardless of how we perform.
Although we are required to implement a Share repurchase program, only a limited number of Shares will be eligible for repurchase by us.
You should consider that you may not have access to the money you invest for an indefinite period of time.
An investment in the Shares is not suitable for you if you have foreseeable need to access the money you invest.
Because you will be unable to sell your Shares or have them repurchased immediately, you will find it difficult to reduce your exposure on a timely basis during a market downturn.
The Fund is a non-diversified management investment company and may be more susceptible to any single economic or regulatory occurrence than a diversified investment company. Cybersecurity risks have significantly increased in recent years and the Fund could suffer such losses in the future. One of the fundamental risks associated with the Fund’s investments is the risk that an issuer will be unable to make principal and interest payments on its outstanding debt obligations when due. Other risk factors include interest rate risk (a rise in interest rates causes a decline in the value of debt securities) and prepayment risk (the debtor may pay its obligation early, reducing the amount of interest payments).
3
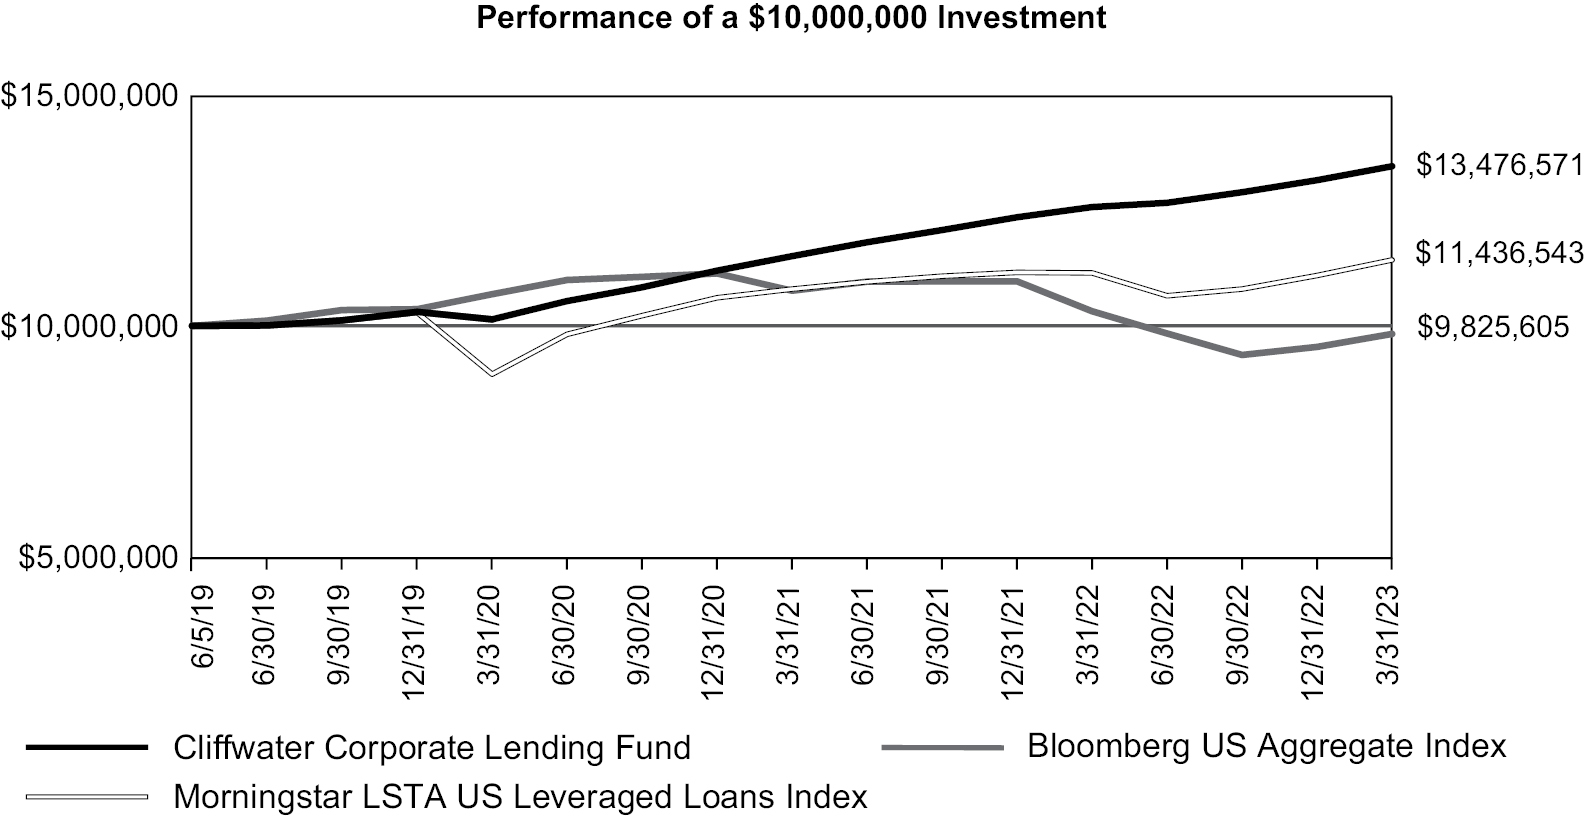
This graph compares a hypothetical $10,000,000 investment in the Fund’s Class I Shares with a similar investment in the Morningstar LSTA US Leveraged Loans Index and Bloomberg US Aggregate Index. These indices do not serve as benchmarks for the Fund and are shown for illustrative purposes only. The Fund does not have a designated performance benchmark. Results include the reinvestment of all dividends and capital gains. These indices do not reflect expenses, fees, or sales charges, which would lower performance.
The Morningstar LSTA US Leveraged Loans Index (previously named S&P LSTA Leveraged Loans Index) is designed to deliver comprehensive, precise coverage of the US leveraged loan market. The Morningstar LSTA US Leveraged Loans Index is a market value weighted index tracking institutional leveraged loans in the United States based upon market weightings, spreads and interest payment, including Term Loan A, Term Loan B and Second Lien tranches. The Morningstar LSTA US Leveraged Loans Index is unmanaged and it is not available for investment.
The Bloomberg US Aggregate Index is a broad based, market capitalization-weighted bond market index representing intermediate term investment grade bonds traded in the United States. The index is unmanaged and it is not available for investment.
Average Annual Total Returns as of March 31, 2023 | 1 Year | 3 Year | Since | ||||||
Cliffwater Corporate Lending Fund (Inception Date June 5, 2019) | 7.06 | % | 9.94 | % | 8.15 | % | |||
Morningstar LSTA US Leveraged Loans Index | 2.54 | % | 8.52 | % | 3.59 | % | |||
Bloomberg US Aggregate Index | -4.78 | % | -2.77 | % | -0.46 | % | |||
The performance data quoted here represents past performance and past performance is not a guarantee of future results. Investment return and principal value will fluctuate so that an investor’s shares, when redeemed, may be worth more or less than their original cost. Current performance may be lower or higher than the performance information quoted. The most recent quarter end performance may be obtained by calling 1 (888) 442-4420.
Effective March 6, 2023, the Fund terminated the Expense Limitation and Reimbursement Agreement. Prior to March 6, 2023, the Fund had entered into an expense limitation agreement that limits the Fund’s annualized ordinary fund-wide operating expenses to 2.25% through March 6, 2023 (the “Waiver”). Ordinary fund-wide operating expenses exclude any taxes, fees and interest payments on borrowed funds, distribution and servicing fees, brokerage and distribution costs and expenses, acquired fund fees and expenses, expenses incurred in connection with any merger or reorganization, and extraordinary or non-routine expenses, such as litigation expenses. Ordinary fund-wide operating expenses include, for the voidance of doubt, the Investment Management Fee and the Fund’s start-up, offering and organizational expenses. The performance quoted above reflects the Waiver in effect and would have been lower in its absence.
For the Fund’s current expense ratios, please refer to the Financial Highlights Section of this report.
Returns reflect the reinvestment of distributions made by the Fund, if any. The graph and the performance table above do not reflect the deduction of taxes that a shareholder would pay on Fund distributions or the redemption of Fund shares.
4
To the Shareholders and Board of Trustees of
Cliffwater Corporate Lending Fund
Opinion on the Financial Statements
We have audited the accompanying consolidated statement of assets and liabilities, including the consolidated schedules of investments, swap contracts and forward foreign currency exchange contracts, of Cliffwater Corporate Lending Fund (the “Fund”) as of March 31, 2023, the related consolidated statements of operations, cash flows, and changes in net assets, the related notes, and the consolidated financial highlights for each of the periods indicated below (collectively referred to as the “financial statements”). In our opinion, the financial statements present fairly, in all material respects, the financial position of the Fund as of March 31, 2023, the results of its operations, its cash flows, the changes in net assets, and the financial highlights for each of the periods indicated below, in conformity with accounting principles generally accepted in the United States of America.
Fund Name | Consolidated Statement of Operations | Consolidated Statement of Cash Flows | Consolidated Statements of Changes in Net Assets | Consolidated Financial Highlights | ||||
Cliffwater Corporate Lending Fund | For the year ended March 31, 2023 | For the year ended March 31, 2023, for the period January 1, 2022 through March 31, 2022 and for the year ended December 31, 2021 | For the year ended March 31, 2023, for the period January 1, 2022 through March 31, 2022, for the years ended December 31, 2021, and 2020, and for the period March 6, 2019 (commencement of operations) through December 31, 2019 | |||||
Basis for Opinion
These financial statements are the responsibility of the Fund’s management. Our responsibility is to express an opinion on the Fund’s financial statements based on our audits. We are a public accounting firm registered with the Public Company Accounting Oversight Board (United States) (“PCAOB”) and are required to be independent with respect to the Fund in accordance with the U.S. federal securities laws and the applicable rules and regulations of the Securities and Exchange Commission and the PCAOB.
We conducted our audits in accordance with the standards of the PCAOB. Those standards require that we plan and perform the audit to obtain reasonable assurance about whether the financial statements are free of material misstatement whether due to error or fraud.
Our audits included performing procedures to assess the risks of material misstatement of the financial statements, whether due to error or fraud, and performing procedures that respond to those risks. Such procedures included examining, on a test basis, evidence regarding the amounts and disclosures in the financial statements. Our procedures included confirmation of securities owned as of March 31, 2023, by correspondence with the custodian, brokers, agent banks, and underlying fund administrators or managers; when replies were not received, we performed other auditing procedures. Our audits also included evaluating the accounting principles used and significant estimates made by management, as well as evaluating the overall presentation of the financial statements. We believe that our audits provide a reasonable basis for our opinion.
We have served as the Fund’s auditor since 2019.

COHEN & COMPANY, LTD.
Milwaukee, Wisconsin
June 7, 2023
5
Principal | Value | |||||
SENIOR SECURED LOANS — 84.8% | ||||||
| COMMUNICATIONS — 2.5% |
| ||||
$ | 2,917,500 | 1236904 B.C. Ltd. | $ | 2,826,404 | ||
| 24,680,398 | AG-Twin Brook Communication Services |
| 24,580,657 | ||
| Aspen Opco, LLC |
| ||||
| 2,840,909 | Revolver, 0.500%, 12/1/20272,4,6 |
| 2,774,974 | ||
| 21,875,000 | First Lien Term Loan, 10.771% (LIBOR+550 basis points), 12/1/20272,3,4 |
| 21,367,298 | ||
| 4,962,312 | BrightSign |
| |||
| First Lien Term Loan, 10.909% (LIBOR+575 basis points), 10/14/20272,3,4 |
| 4,837,197 | |||
| CM Acquisitions Holdings, Inc. |
| ||||
| 810,971 | Incremental Term Loan, 9.798% (SOFR+490 basis points), 5/6/20252,3,4 |
| 775,899 | ||
| 2,600,593 | First Lien Term Loan, 9.798% (SOFR+490 basis points), 5/6/20252,3,4 |
| 2,488,128 | ||
| 298,125 | Delayed Draw, 9.799% (SOFR+490 basis points), 5/6/20252,3,4 |
| 285,233 | ||
| GBP 1,772,638 | CSL DualCom Ltd. |
| 2,151,404 | ||
| 10,000,000 | EP Purchaser, LLC |
| 9,583,985 | ||
| Fingerpaint Marketing, Inc. |
| ||||
| 1,209,677 | Revolver, 0.500%, 12/30/20262,4,6 |
| 1,163,423 | ||
| 2,335,714 | Delayed Draw, 1.000%, 12/30/20262,4,6 |
| 2,293,968 | ||
| 5,961,682 | Delayed Draw, 11.409% (LIBOR+625 basis points), 12/30/20262,3,4 |
| 5,733,726 | ||
| 8,058,140 | First Lien Term Loan, 11.409% (LIBOR+625 basis points), 12/30/20262,3,4 |
| 7,750,022 | ||
| 3,379,331 | First Lien Term Loan, 11.627% (LIBOR+625 basis points), 12/30/20262,3,4 |
| 3,318,932 | ||
| 2,633,891 | Delayed Draw, 11.749% (LIBOR+625 basis points), 12/30/20262,3,4 |
| 2,586,815 | ||
| 470,430 | Revolver, 13.250% (LIBOR+625 basis points), 12/30/20262,3,4 |
| 452,442 | ||
| 12,250,564 | FuseFX, LLC |
| 12,201,519 | ||
| 15,000,000 | HH Global Finance Limited |
| 13,622,474 | ||
| HPS Telecommunications |
| ||||
| 9,725,000 | First Lien Term Loan, 11.159% (LIBOR+600 basis points), 5/30/20252,3,4,5 |
| 9,394,271 | ||
| 10,000,000 | First Lien Term Loan, 10.617% (LIBOR+600 basis points), 7/23/20262,3,4,5 |
| 9,971,021 | ||
| Iconic Purchaser Corporation |
| ||||
| 1,025,641 | Revolver, 0.500%, 11/5/20272,4,6 |
| 1,006,358 | ||
| 512,821 | Revolver, 9.959% (LIBOR+525 basis points), 11/5/20272,3,4 |
| 503,179 | ||
| 18,230,769 | First Lien Term Loan, 10.090% (LIBOR+525 basis points), 11/5/20282,3,4 |
| 17,858,787 | ||
| 9,707,143 | KeyImpact Holdings, Inc. |
| 9,506,160 | ||
| 2,000,000 | Lifesize |
| 621,000 | ||
| MBS Holdings, Inc. |
| ||||
| 1,271,186 | Revolver, 0.500%, 4/6/20272,4,6 |
| 1,232,132 | ||
| 13,488,559 | First Lien Term Loan, 10.590% (LIBOR+575 basis points), 4/6/20272,3,4 |
| 13,074,150 | ||
See accompanying Notes to Consolidated Financial Statements.
6
Cliffwater Corporate Lending Fund |
Consolidated Schedule of Investments As of March 31, 2023 (Continued) |
Principal | Value | |||||
SENIOR SECURED LOANS (Continued) | ||||||
| COMMUNICATIONS (Continued) |
| ||||
$ | 12,371,145 | MBS Services Holdings, LLC | $ | 12,123,722 | ||
| Mc Group Ventures Corporation |
| ||||
| 1,634,615 | Delayed Draw, 1.000%, 6/30/20272,4,6 |
| 1,608,141 | ||
| 15,115,385 | First Lien Term Loan, 10.325% (LIBOR+550 basis points), 6/30/20272,3,4 |
| 14,870,570 | ||
| 7,889,904 | Delayed Draw, 10.325% (LIBOR+550 basis points), 6/30/20272,3,4 |
| 7,762,116 | ||
| OneCare Media, LLC |
| ||||
| 1,333,333 | Revolver, 0.500%, 9/29/20262,4,6 |
| 1,306,395 | ||
| 9,381,366 | First Lien Term Loan, 11.340% (LIBOR+650 basis points), 9/29/20262,3,4 |
| 9,191,827 | ||
| AUD 2,800,000 | Permaconn TopCo Pty, Ltd. |
| 1,805,717 | ||
| Royal Buyer, LLC |
| ||||
| 191,667 | Revolver, 0.500%, 8/31/20282,4,6 |
| 187,833 | ||
| 471,250 | Delayed Draw, 1.000%, 8/31/20282,4,6 |
| 466,538 | ||
| 58,333 | Revolver, 10.399% (SOFR+600 basis points), 8/31/20282,3,4 |
| 57,167 | ||
| 2,493,750 | First Lien Term Loan, 10.399% (SOFR+600 basis points), 8/31/20282,3,4 |
| 2,443,875 | ||
| 28,750 | Delayed Draw, 10.874% (SOFR+600 basis points), 8/31/20282,3,4 |
| 28,463 | ||
| 11,970,000 | TA TT Buyer |
| 11,760,525 | ||
| Trunk Acquisition, Inc. |
| ||||
| 2,500,000 | Revolver, 0.500%, 2/19/20262,4,6 |
| 2,404,408 | ||
| 1,193,049 | Revolver, 0.500%, 2/19/20262,4,5,6 |
| 1,147,431 | ||
| 22,243,057 | First Lien Term Loan, 10.659% (LIBOR+550 basis points), 2/19/20272,3,4 |
| 21,392,553 | ||
|
| 272,518,839 | ||||
| CONSUMER DISCRETIONARY — 7.3% |
| ||||
| A1 Garage Equity, LLC |
| ||||
| 1,515,152 | Revolver, 0.500%, 12/22/20282,4,6 |
| 1,472,172 | ||
| 3,143,561 | Delayed Draw, 1.000%, 12/22/20282,4,6 |
| 3,093,435 | ||
| 1,020,548 | Delayed Draw, 11.124% (SOFR+650 basis points), 12/22/20282,3,4 |
| 1,004,275 | ||
| 9,294,886 | First Lien Term Loan, 11.498% (SOFR+650 basis points), 12/22/20282,3,4 |
| 9,031,223 | ||
| ADS Buyer, Inc. |
| ||||
| 11,556,049 | First Lien Term Loan, 10.298% (SOFR+525 basis points), 12/30/20272,3,4 |
| 11,287,841 | ||
| 6,475,590 | First Lien Term Loan, 10.298% (SOFR+525 basis points), 12/30/20272,3,4 |
| 6,325,296 | ||
| AG-Twin Brook Consumer Discretionary |
| ||||
| 24,651,888 | First Lien Term Loan, 12.043% (SOFR+675 basis points), 2/14/20242,3,4,5 |
| 24,371,163 | ||
| 9,775,302 | First Lien Term Loan, 11.660% (SOFR+650 basis points), 4/22/20262,3,4,5 |
| 9,745,269 | ||
| 19,739,515 | First Lien Term Loan, 11.660% (SOFR+650 basis points), 4/22/20262,3,4,5 |
| 19,678,869 | ||
| 14,850,000 | First Lien Term Loan, 10.660% (SOFR+550 basis points), 11/30/20262,3,4,5 |
| 14,806,966 | ||
| 23,824,333 | First Lien Term Loan, 10.659% (LIBOR+550 basis points), 12/14/20272,3,4,5 |
| 23,622,386 | ||
See accompanying Notes to Consolidated Financial Statements.
7
Cliffwater Corporate Lending Fund |
Consolidated Schedule of Investments As of March 31, 2023 (Continued) |
Principal | Value | |||||
SENIOR SECURED LOANS (Continued) | ||||||
| CONSUMER DISCRETIONARY (Continued) |
| ||||
| Archimede |
| ||||
| EUR 8,500,000 | First Lien Term Loan, 8.265% (EURIBOR+525 basis points), 10/17/20272,3,4,7 | $ | 8,893,324 | ||
| EUR 1,500,000 | Delayed Draw, 8.265% (EURIBOR+525 basis points), 10/27/20272,3,4,7 |
| 1,569,410 | ||
| EUR 7,800,000 | First Lien Term Loan, 8.265% (EURIBOR+525 basis points), 10/27/20272,3,4,7 |
| 8,160,933 | ||
$ | 10,766,498 | Astro Acquisition, LLC |
| 8,206,196 | ||
| Auveco Holdings, Inc. |
| ||||
| 986,842 | Revolver, 0.500%, 5/5/20282,4,6 |
| 951,580 | ||
| 1,973,684 | Delayed Draw, 1.000%, 5/5/20282,4,6 |
| 1,903,160 | ||
| 328,947 | Revolver, 10.291% (SOFR+575 basis points), 5/5/20282,3,4 |
| 317,193 | ||
| 9,141,447 | First Lien Term Loan, 10.291% (SOFR+575 basis points), 5/5/20282,3,4 |
| 8,814,803 | ||
| Bendon |
| ||||
| 1,800,000 | Revolver, 0.750%, 12/11/20252,4,6 |
| 1,722,157 | ||
| 11,848,858 | First Lien Term Loan, 12.548% (LIBOR+750 basis points), 12/11/20252,3,4 |
| 11,336,443 | ||
| 2,943,844 | Chop’t Creative Salad Company LLC |
| 2,961,474 | ||
| Club Car Wash |
| ||||
| 2,142,334 | Delayed Draw, 1.000%, 6/16/20272,4,6 |
| 2,078,064 | ||
| 2,844,423 | Delayed Draw, 8.972% (SOFR+650 basis points), 6/16/20272,3,4 |
| 2,759,090 | ||
| Denali Midco 2 LLC |
| ||||
| 4,300,000 | Delayed Draw, 1.000%, 12/22/20272,4,6 |
| 4,165,657 | ||
| 3,196,250 | Delayed Draw, 11.407% (SOFR+650 basis points), 12/22/20272,3,4 |
| 3,096,391 | ||
| 7,462,500 | First Lien Term Loan, 11.407% (SOFR+650 basis points), 12/22/20272,3,4 |
| 7,229,352 | ||
| Evergreen Acqco 1 LP |
| ||||
| 10,908,961 | First Lien Term Loan, 10.660% (LIBOR+550 basis points), 3/26/20282,3 |
| 10,472,602 | ||
| FQSR, LLC |
| ||||
| 3,875,488 | Delayed Draw, 1.000% PIK, 5/26/20272,4,6,8 |
| 3,659,356 | ||
| 2,210,205 | Delayed Draw, 11.616% PIK (LIBOR+650 basis points), 5/26/20272,3,4,8 |
| 2,086,945 | ||
| Gateway US Holdings, Inc. |
| ||||
| 409,091 | Revolver, 0.500%, 9/22/20242,4,6 |
| 397,763 | ||
| 191,424 | Delayed Draw, 1.000%, 9/22/20242,4,6 |
| 186,124 | ||
| 800,000 | Delayed Draw, 1.000%, 9/22/20262,4,6 |
| 777,849 | ||
| 6,166,593 | Delayed Draw, 11.548% (SOFR+650 basis points), 9/22/20262,3,4 |
| 5,995,844 | ||
| 500,000 | Revolver, 11.548% (SOFR+650 basis points), 9/22/20262,3,4 |
| 486,155 | ||
| 23,756,818 | First Lien Term Loan, 11.548% (SOFR+650 basis points), 9/22/20262,3,4 |
| 23,099,008 | ||
| 29,696,203 | GSM Acquisition Corp. |
| 29,319,359 | ||
| GSV Holding, LLC |
| ||||
| 33,327,505 | Delayed Draw, 10.548% (LIBOR+550 basis points), 4/3/20282,3,4 |
| 32,637,470 | ||
| 16,535,262 | Delayed Draw, 1.000%, 4/30/20282,4,6 |
| 16,192,905 | ||
| 17,000,000 | Harbor Purchaser, Inc. |
| 16,492,404 | ||
See accompanying Notes to Consolidated Financial Statements.
8
Cliffwater Corporate Lending Fund |
Consolidated Schedule of Investments As of March 31, 2023 (Continued) |
Principal | Value | |||||
SENIOR SECURED LOANS (Continued) | ||||||
| CONSUMER DISCRETIONARY (Continued) |
| ||||
| HPS Consumer Discretionary |
| ||||
$ | 4,056,795 | First Lien Term Loan, 13.159% PIK (LIBOR+800 basis points), 10/31/20242,3,4,5,8 | $ | 3,666,361 | ||
| 5,118,325 | First Lien Term Loan, 10.635% (LIBOR+600 basis points), 6/27/20252,3,4,5 |
| 4,935,303 | ||
| 15,385,685 | First Lien Term Loan, 11.557% (LIBOR+675 basis points), 7/26/20262,3,4,5 |
| 14,499,976 | ||
| HS Spa Holdings, Inc. |
| ||||
| 311,429 | Revolver, 0.500%, 6/2/20282,4,6 |
| 303,608 | ||
| 2,163,650 | First Lien Term Loan, 10.445% (SOFR+575 basis points), 6/2/20292,3,4 |
| 2,106,714 | ||
| 7,103,998 | Hudson’s Bay Company |
| 7,007,512 | ||
| 13,968,181 | HY Cite Enterprises LLC |
| 13,532,040 | ||
| 14,606,996 | Ingenio, LLC |
| 14,136,275 | ||
| Innovetive Petcare, LLC |
| ||||
| 587,633 | Delayed Draw, 1.000%, 12/2/20262,4,6 |
| 579,881 | ||
| 1,350,118 | Delayed Draw, 9.778% (LIBOR+500 basis points), 12/2/20262,3,4,5 |
| 1,332,309 | ||
| KBP Investments LLC |
| ||||
| 3,444,691 | Delayed Draw, 1.000% PIK, 5/26/20272,4,6,8 |
| 3,252,584 | ||
| 23,992,297 | Delayed Draw, 11.616% PIK (LIBOR+650 basis points), 5/26/20272,3,4,5,8 |
| 22,654,272 | ||
| 13,509,812 | Leonard Group, Inc. |
| 13,442,352 | ||
| 8,650,296 | Mammoth Holdings, LLC |
| 8,625,228 | ||
| Margaritaville Enterprises LLC |
| ||||
| 312,500 | Revolver, 0.500%, 6/17/20272,4,6 |
| 301,886 | ||
| 5,108,297 | Delayed Draw, 1.000%, 6/17/20272,4,6 |
| 4,934,793 | ||
| 10,620,148 | First Lien Term Loan, 9.650% (SOFR+475 basis points), 6/17/20272,3,4 |
| 10,259,434 | ||
| EUR 5,769,231 | NKD Group GmbH |
| 6,154,810 | ||
| NL1 Acquire Corp. |
| ||||
| CAD 369,740 | Revolver, 0.500%, 5/26/20262,4,6,7 |
| 262,870 | ||
| CAD 960,260 | Revolver, 10.520% (CDOR+550 basis points), 5/26/20262,3,4,7 |
| 682,706 | ||
| CAD 1,930,959 | Delayed Draw, 1.000%, 5/26/20282,4,7 |
| 1,372,833 | ||
| 1,182,780 | Delayed Draw, 1.000%, 5/26/20282,4,6 |
| 1,076,529 | ||
| CAD 1,939,218 | Delayed Draw, 10.520% (CDOR+550 basis points), 5/26/20282,3,4,7 |
| 1,378,705 | ||
| CAD 9,633,300 | First Lien Term Loan, 10.520% (CDOR+550 basis points), 5/26/20282,3,4,7 |
| 6,848,885 | ||
| 235,155 | Delayed Draw, 10.659% (LIBOR+550 basis points), 5/26/20282,3,4 |
| 214,030 | ||
| 2,079,000 | First Lien Term Loan, 10.659% (LIBOR+550 basis points), 5/26/20282,3,4 |
| 1,892,241 | ||
| 29,656,571 | Owl Rock Consumer Discretionary |
| 28,968,265 | ||
| 6,137,868 | Penney Borrower LLC |
| 6,095,640 | ||
See accompanying Notes to Consolidated Financial Statements.
9
Cliffwater Corporate Lending Fund |
Consolidated Schedule of Investments As of March 31, 2023 (Continued) |
Principal | Value | |||||
SENIOR SECURED LOANS (Continued) | ||||||
| CONSUMER DISCRETIONARY (Continued) |
| ||||
| POY Holdings, LLC |
| ||||
$ | 2,406,511 | Revolver, 0.500%, 11/17/20272,4,6 | $ | 2,350,658 | ||
| 989,658 | Delayed Draw, 1.000%, 11/17/20272,4,6 |
| 966,689 | ||
| 911,247 | Delayed Draw, 10.230% (LIBOR+550 basis points), 11/17/20272,3,4 |
| 890,097 | ||
| 19,218,397 | First Lien Term Loan, 10.548% (LIBOR+550 basis points), 11/17/20272,3,4 |
| 18,772,353 | ||
| 1,477,132 | Quality Automotive Services, LLC |
| 1,398,454 | ||
| Race Winning Brands, Inc. |
| ||||
| 1,305,774 | Revolver, 0.500%, 11/16/20272,4,6 |
| 1,262,386 | ||
| 1,819,226 | Revolver, 10.090% (LIBOR+525 basis points), 11/16/20272,3,4 |
| 1,758,778 | ||
| 26,187,857 | First Lien Term Loan, 10.090% (LIBOR+525 basis points), 11/16/20272,3,4 |
| 25,317,698 | ||
| 9,038,081 | First Lien Term Loan, 10.090% (LIBOR+525 basis points), 11/16/20272,3,4,5 |
| 8,737,768 | ||
| 1,939,850 | RCS Consumer Discretionary |
| 1,909,403 | ||
| RefrigiWear, LLC |
| ||||
| 1,506,389 | First Lien Term Loan, 9.615% (SOFR+475 basis points), 11/2/20272,3,4 |
| 1,463,881 | ||
| 2,601,896 | Revolver, 0.500%, 11/2/20272,4,6 |
| 2,528,474 | ||
| 15,501,878 | First Lien Term Loan, 9.615% (SOFR+475 basis points), 11/2/20272,3,4 |
| 15,064,439 | ||
| Regent Holding Company, LLC |
| ||||
| 1,409,774 | Revolver, 0.500%, 2/25/20262,4,6 |
| 1,365,756 | ||
| 11,495,301 | First Lien Term Loan, 12.590% (LIBOR+775 basis points), 2/25/20261,2,3,4,9,10 |
| 11,136,372 | ||
| 1,409,774 | Revolver, 12.590% (LIBOR+775 basis points), 2/25/20262,3,4 |
| 1,365,756 | ||
| 1,099,624 | First Lien Term Loan, 12.590% (LIBOR+775 basis points), 2/26/20262,3,4 |
| 1,065,290 | ||
| Showtime Acquisition, L.L.C |
| ||||
| 203,148 | Delayed Draw, 1.000%, 2/6/20282,4,6 |
| 199,580 | ||
| 3,555,094 | First Lien Term Loan, 12.197% (SOFR+750 basis points), 8/7/20282,3,4 |
| 3,439,466 | ||
| Spanx, LLC |
| ||||
| 8,548,279 | Revolver, 0.500%, 11/18/20272,4,6 |
| 8,142,290 | ||
| 71,845,104 | First Lien Term Loan, 9.885% (LIBOR+550 basis points), 11/18/20282,3,4 |
| 68,039,152 | ||
| 3,548,342 | Revolver, 10.095% (LIBOR+525 basis points), 11/18/20272,3,4 |
| 3,379,818 | ||
| Speedstar Holding Corporation |
| ||||
| 1,320,828 | First Lien Term Loan, 12.161% (SOFR+725 basis points), 1/22/20272,3,4 |
| 1,277,624 | ||
| 310,345 | Delayed Draw, 12.306% (SOFR+725 basis points), 1/22/20272,3,4 |
| 300,194 | ||
| Spotless Brands, LLC |
| ||||
| 200,000 | Revolver, 0.500%, 6/21/20282,4,6 |
| 196,000 | ||
| 50,000 | Revolver, 11.000% (SOFR+665 basis points), 6/21/20282,3,4 |
| 49,000 | ||
| 7,565,386 | First Lien Term Loan, 11.310% (SOFR+665 basis points), 6/21/20282,3,4 |
| 7,414,078 | ||
| 2,700,358 | Delayed Draw, 11.340% (SOFR+660 basis points), 6/21/20282,3,4 |
| 2,673,354 | ||
| 7,470,670 | Delayed Draw, 1.000%, 7/25/20282,4,6 |
| 7,358,610 | ||
| 4,980,447 | First Lien Term Loan, 11.520% (SOFR+665 basis points), 7/25/20282,3,4 |
| 4,880,838 | ||
See accompanying Notes to Consolidated Financial Statements.
10
Cliffwater Corporate Lending Fund |
Consolidated Schedule of Investments As of March 31, 2023 (Continued) |
Principal | Value | |||||
SENIOR SECURED LOANS (Continued) | ||||||
| CONSUMER DISCRETIONARY (Continued) |
| ||||
| Stanton Carpet Corp. |
| ||||
$ | 1,189,468 | Revolver, 0.500%, 10/1/20262,4,6 | $ | 1,152,924 | ||
| 9,210,536 | First Lien Term Loan, 10.159% (LIBOR+500 basis points), 10/1/20272,3,4 |
| 8,927,560 | ||
| 303,719 | First Lien Term Loan, 10.159% (SOFR+500 basis points), 10/1/20272,3,4 |
| 294,388 | ||
| Summit Buyer, L.L.C. |
| ||||
| 1,382,979 | Revolver, 0.500%, 1/14/20262,4,6 |
| 1,341,182 | ||
| 1,898,298 | Delayed Draw, 1.000%, 1/14/20262,4,6 |
| 1,840,927 | ||
| 3,270,591 | Delayed Draw, 1.000%, 1/14/20262,4,6 |
| 3,171,747 | ||
| 16,559,162 | Delayed Draw, 10.741% (LIBOR+585 basis points), 1/14/20262,3,4 |
| 16,058,710 | ||
| 14,811,923 | First Lien Term Loan, 10.741% (LIBOR+585 basis points), 1/14/20262,3,4 |
| 14,364,276 | ||
| 10,000,000 | Travel Leaders Group, LLC |
| 9,760,297 | ||
| Truck-Lite Co., LLC |
| ||||
| 218,406 | First Lien Term Loan, 11.141% (SOFR+625 basis points), 12/13/20262,3,4 |
| 208,085 | ||
| 9,897,959 | First Lien Term Loan, 11.142% (SOFR+625 basis points), 12/13/20262,3,4 |
| 9,430,248 | ||
| 8,000,000 | Woof Holdings, Inc. |
| 7,732,226 | ||
| 7,444,223 | Zips Car Wash, LLC |
| 7,295,339 | ||
|
| 807,208,113 | ||||
| CONSUMER STAPLES — 0.9% |
| ||||
| 1,555,383 | AmerCareRoyal, LLC |
| 1,542,091 | ||
| 13,847,069 | BCPE North Star US Holdings Co. |
| 12,747,958 | ||
| 3,486,509 | C.P. Converters, Inc. |
| 3,476,405 | ||
| JTM Foods, LLC |
| ||||
| 386,122 | Delayed Draw, 0.500%, 5/14/20272,4,6 |
| 372,325 | ||
| 559,597 | Revolver, 0.500%, 5/14/20272,4,6 |
| 539,601 | ||
| 772,244 | Delayed Draw, 9.980% (LIBOR+525 basis points), 5/14/20272,3,4 |
| 744,650 | ||
| 1,119,194 | Revolver, 10.122% (LIBOR+525 basis points), 5/14/20272,3,4 |
| 1,079,203 | ||
| 7,606,603 | First Lien Term Loan, 10.122% (LIBOR+525 basis points), 5/14/20272,3,4 |
| 7,334,803 | ||
| 1,354,225 | First Lien Term Loan, 10.409% (LIBOR+525 basis points), 5/14/20272,3,4 |
| 1,305,836 | ||
| LJ Perimeter Buyer, Inc. |
| ||||
| 2,964,579 | Delayed Draw, 1.000%, 10/31/20282,4,6 |
| 2,920,111 | ||
| 2,106,177 | Delayed Draw, 1.000%, 10/31/20282,4,6 |
| 2,079,527 | ||
| 109,013 | Delayed Draw, 7.500% (SOFR+650 basis points), 10/31/20282,3,4 |
| 107,633 | ||
| 18,203,189 | First Lien Term Loan, 11.326% (SOFR+650 basis points), 10/31/20282,3,4 |
| 17,675,082 | ||
See accompanying Notes to Consolidated Financial Statements.
11
Cliffwater Corporate Lending Fund |
Consolidated Schedule of Investments As of March 31, 2023 (Continued) |
Principal | Value | |||||
SENIOR SECURED LOANS (Continued) | ||||||
| CONSUMER STAPLES (Continued) |
| ||||
| Nellson Nutraceutical, Inc. |
| ||||
$ | 14,970,376 | First Lien Term Loan, 10.493% (SOFR+575 basis points), 12/23/20252,3,4 | $ | 14,545,720 | ||
| Purfoods, LLC |
| ||||
| 4,387,500 | First Lien Term Loan, 11.114% (LIBOR+625 basis points), 8/12/20262,3,4 |
| 4,329,625 | ||
| 2,964,494 | Delayed Draw, 11.119% (LIBOR+625 basis points), 8/12/20262,3,4 |
| 2,925,389 | ||
| RB Holdings Interco, LLC |
| ||||
| 230,847 | Revolver, 0.500%, 5/4/20282,4,6 |
| 222,598 | ||
| 2,770,160 | Delayed Draw, 1.000%, 5/4/20282,4,5,6 |
| 2,685,052 | ||
| 1,154,234 | Revolver, 9.782% (SOFR+500 basis points), 5/4/20282,3,4,5 |
| 1,112,990 | ||
| 5,026,742 | Specialty Ingredients, LLC |
| 4,926,207 | ||
| SWK Buyer, Inc. |
| ||||
| 521,930 | Revolver, 0.500%, 3/11/20292,4,6 |
| 478,443 | ||
| 3,070,176 | Delayed Draw, 1.000%, 3/11/20292,4,6 |
| 2,814,370 | ||
| 706,140 | Revolver, 10.099% (SOFR+525 basis points), 3/11/20292,3,4 |
| 647,305 | ||
| 13,135,746 | First Lien Term Loan, 10.739% (SOFR+525 basis points), 3/11/20292,3,4 |
| 12,041,283 | ||
| 4,974,874 | Woodland Foods, Inc. |
| 4,470,658 | ||
|
| 103,124,865 | ||||
| ENERGY — 0.6% |
| ||||
| 3,429,266 | Brock Holdings III, Inc. |
| 3,326,388 | ||
| 4,783,546 | Drilling Info Holdings, Inc. |
| 4,681,045 | ||
| 12,501,869 | Floating Infrastructure Holdings Finance LLC |
| 12,251,831 | ||
| Integrated Power Services |
| ||||
| 2,225,125 | Revolver, 0.500%, 11/22/20272,4,5,6 |
| 2,145,617 | ||
| 505,710 | Revolver, 9.340% (LIBOR+450 basis points), 11/22/20272,3,4,5 |
| 487,640 | ||
| Island Energy Services |
| ||||
| 2,894,230 | Delayed Draw, 1.000%, 1/13/20282,4,6 |
| 2,804,632 | ||
| 2,592,403 | First Lien Term Loan, 13.249% (INDEX SPREAD+825 basis points), 1/13/20282,3,4 |
| 2,512,149 | ||
| Kene Acquisition, Inc. |
| ||||
| 9,975,000 | First Lien Term Loan, 8.900% (LIBOR+425 basis points), 8/8/20262,3,4 |
| 9,943,354 | ||
| 14,925,000 | First Lien Term Loan, 9.409% (LIBOR+425 basis points), 8/8/20262,3,4 |
| 14,877,650 | ||
| Service Compression, LLC |
| ||||
| 1,581,333 | Delayed Draw, 0.500% PIK, 5/6/20272,4,6,8 |
| 1,507,877 | ||
| 2,586,560 | Delayed Draw, 14.907% PIK (SOFR+1,000 basis points), 5/6/20272,3,4,5,8 |
| 2,466,410 | ||
| 13,085,446 | First Lien Term Loan, 14.907% PIK (SOFR+1,000 basis points), 5/6/20272,3,4,5,8 |
| 12,477,603 | ||
|
| 69,482,196 | ||||
See accompanying Notes to Consolidated Financial Statements.
12
Cliffwater Corporate Lending Fund |
Consolidated Schedule of Investments As of March 31, 2023 (Continued) |
Principal | Value | |||||
SENIOR SECURED LOANS (Continued) | ||||||
| FINANCIALS — 11.6% |
| ||||
| 1364720 B.C. LTD |
| ||||
| CAD 2,000,000 | Revolver, 0.500%, 9/9/20282,4,6,7 | $ | 1,467,730 | ||
| CAD 5,000,000 | Delayed Draw, 1.000%, 9/9/20282,4,6,7 |
| 3,687,856 | ||
| CAD 11,471,250 | First Lien Term Loan, 9.528% (SOFR+450 basis points), 9/9/20282,3,4,7 |
| 8,418,347 | ||
| Adenza Group, Inc. |
| ||||
$ | 731,098 | Revolver, 0.500%, 12/3/20252,4,6 |
| 721,455 | ||
| 713,267 | Delayed Draw, 1.000%, 12/3/20272,4,6 |
| 711,004 | ||
| 10,862,161 | First Lien Term Loan, 10.590% (LIBOR+575 basis points), 12/3/20272,3,4 |
| 10,718,880 | ||
| Alera Group Holdings, Inc. |
| ||||
| 510,853 | Delayed Draw, 1.000%, 9/30/20282,4,6 |
| 500,636 | ||
| 1,012,500 | Delayed Draw, 1.000%, 9/30/20282,4,6 |
| 989,594 | ||
| 2,003,316 | Delayed Draw, 10.687% (SOFR+650 basis points), 9/30/20282,3,4 |
| 1,963,249 | ||
| 24,818,016 | Delayed Draw, 10.907% (SOFR+600 basis points), 9/30/20282,3,4 |
| 23,931,214 | ||
| 24,811,083 | First Lien Term Loan, 10.907% (SOFR+600 basis points), 9/30/20282,3,4 |
| 23,924,529 | ||
| 3,742,558 | First Lien Term Loan, 11.407% (SOFR+650 basis points), 9/30/20282,3,4 |
| 3,661,182 | ||
| 3,970,531 | Delayed Draw, 11.407% (SOFR+650 basis points), 9/30/20282,3,4 |
| 3,880,705 | ||
| Amba Buyer, Inc. |
| ||||
| 14,257,915 | Delayed Draw, 1.000%, 7/30/20272,4,6 |
| 13,784,159 | ||
| 12,350,919 | First Lien Term Loan, 10.215% (SOFR+525 basis points), 7/30/20272,3,4 |
| 11,878,659 | ||
| Amerilife Holdings LLC |
| ||||
| 2,454,545 | Revolver, 0.500%, 8/31/20282,4,6 |
| 2,354,544 | ||
| 1,636,364 | Delayed Draw, 1.000%, 8/31/20292,4,6 |
| 1,577,893 | ||
| 3,264,545 | Delayed Draw, 10.150% (SOFR+575 basis points), 8/31/20292,3,4 |
| 3,147,896 | ||
| 19,587,273 | First Lien Term Loan, 10.879% (SOFR+575 basis points), 8/31/20292,3,4 |
| 18,789,260 | ||
| GBP 10,791,367 | Apus Bidco Limited |
| 12,603,716 | ||
| AQ Sage Buyer, LLC |
| ||||
| 11,268,606 | Delayed Draw, 10.696% (SOFR+575 basis points), 1/25/20272,3,4 |
| 10,837,730 | ||
| 13,593,870 | First Lien Term Loan, 10.792% (SOFR+575 basis points), 1/25/20272,3,4 |
| 12,971,943 | ||
| AQ Sunshine, Inc. |
| ||||
| 200,000 | Revolver, 0.500%, 4/15/20242,4,6 |
| 193,354 | ||
| 1,883,333 | Revolver, 11.409% (LIBOR+625 basis points), 4/15/20242,3,4 |
| 1,820,755 | ||
| 22,698,021 | Delayed Draw, 11.409% (LIBOR+625 basis points), 4/15/20252,3,4 |
| 21,943,820 | ||
| CC SAG Acquisition Corp. |
| ||||
| 699,301 | Revolver, 0.500%, 6/29/20272,4,6 |
| 665,724 | ||
| 1,356,643 | Delayed Draw, 1.000%, 6/29/20282,4,6 |
| 1,291,505 | ||
| 3,864,292 | Delayed Draw, 10.909% (LIBOR+575 basis points), 6/29/20282,3,4 |
| 3,678,751 | ||
| 18,770,105 | First Lien Term Loan, 10.909% (LIBOR+575 basis points), 6/29/20282,3,4 |
| 17,868,871 | ||
See accompanying Notes to Consolidated Financial Statements.
13
Cliffwater Corporate Lending Fund |
Consolidated Schedule of Investments As of March 31, 2023 (Continued) |
Principal | Value | |||||
SENIOR SECURED LOANS (Continued) | ||||||
| FINANCIALS (Continued) |
| ||||
| Cerity Partners, LLC |
| ||||
$ | 443,192 | Revolver, 0.500%, 7/28/20292,4,6 | $ | 412,926 | ||
| 17,500,000 | Delayed Draw, 1.000%, 7/28/20292,4,6 |
| 16,977,160 | ||
| 7,183,873 | First Lien Term Loan, 11.291% (SOFR+650 basis points), 7/28/20292,3,4 |
| 6,693,273 | ||
| 12,500,000 | First Lien Term Loan, 11.541% (SOFR+650 basis points), 7/28/20292,3,4 |
| 12,126,543 | ||
| CFGI Holdings, LLC |
| ||||
| 1,751,825 | Revolver, 0.500%, 11/2/20272,4,6 |
| 1,698,003 | ||
| 2,189,781 | Delayed Draw, 1.000%, 11/2/20272,4,6 |
| 2,138,958 | ||
| 15,897,810 | First Lien Term Loan, 10.157% (LIBOR+525 basis points), 11/2/20272,3,4 |
| 15,409,382 | ||
| Cherry Bekaert Advisory LLC |
| ||||
| 1,661,392 | Revolver, 0.500%, 6/30/20282,4,6 |
| 1,626,994 | ||
| 712,025 | Revolver, 10.307% (SOFR+550 basis points), 6/30/20282,3,4,5 |
| 697,283 | ||
| Credit Connection, LLC |
| ||||
| 9,689,500 | First Lien Term Loan, 10.909% (LIBOR+575 basis points), 7/30/20262,3,4 |
| 9,611,056 | ||
| 600,000 | Revolver, 0.500%, 7/30/20262,4,6 |
| 595,142 | ||
| 9,080,098 | Cresset Asset Management, LLC |
| 8,979,972 | ||
| EUR 627,356 | Dreamstart BidCo |
| 662,520 | ||
| EdgeCo Buyer, Inc. |
| ||||
| 10,000,000 | Delayed Draw, 1.000%, 6/30/20232,4,6 |
| 9,685,757 | ||
| 2,475,000 | First Lien Term Loan, 9.715% (SOFR+475 basis points), 9/29/20232,3,4 |
| 2,397,225 | ||
| 11,969,925 | Eisner Advisory Group LLC |
| 11,509,005 | ||
| EP Wealth Advisors, LLC |
| ||||
| 8,640,000 | Delayed Draw, 1.000%, 9/4/20262,4,6 |
| 8,525,494 | ||
| 3,960,000 | Delayed Draw, 10.728% (SOFR+575 basis points), 9/4/20262,3,4 |
| 3,907,518 | ||
| 5,386,500 | First Lien Term Loan, 10.798% (SOFR+575 basis points), 9/4/20262,3,4 |
| 5,234,172 | ||
| Exegy, Inc. |
| ||||
| 10,779,645 | First Lien Term Loan, 10.907% (LIBOR+600 basis points), 5/17/20262,3,4 |
| 10,466,821 | ||
| Foundation Risk Partners, Corp. |
| ||||
| 5,090,909 | Delayed Draw, 1.000%, 10/29/20282,4,6 |
| 5,004,458 | ||
| 4,772,727 | Delayed Draw, 1.000%, 10/29/20282,4,6 |
| 4,691,679 | ||
| 21,136,364 | First Lien Term Loan, 11.748% (SOFR+675 basis points), 10/29/20282,3,4 |
| 20,461,029 | ||
| Galway Borrower, LLC |
| ||||
| 127,566 | Delayed Draw, 1.000%, 9/30/20232,4,6 |
| 122,369 | ||
| 545,223 | Revolver, 0.500%, 9/30/20272,4,6 |
| 523,010 | ||
| 576,059 | Revolver, 0.500%, 9/30/20272,4,6 |
| 552,589 | ||
| 690,616 | Revolver, 0.500%, 9/30/20272,4,6 |
| 662,479 | ||
| 293,856 | Revolver, 0.500%, 9/30/20272,4,6 |
| 281,884 | ||
See accompanying Notes to Consolidated Financial Statements.
14
Cliffwater Corporate Lending Fund |
Consolidated Schedule of Investments As of March 31, 2023 (Continued) |
Principal | Value | |||||
SENIOR SECURED LOANS (Continued) | ||||||
| FINANCIALS (Continued) |
| ||||
$ | 149,329 | Revolver, 10.413% (SOFR+525 basis points), 9/30/20272,3,4 | $ | 143,245 | ||
| 238,257 | Revolver, 10.413% (SOFR+525 basis points), 9/30/20272,3,4 |
| 228,550 | ||
| 189,150 | Revolver, 10.413% (SOFR+525 basis points), 9/30/20272,3,4 |
| 181,443 | ||
| 261,395 | Delayed Draw, 1.000%, 9/30/20282,4,6 |
| 250,745 | ||
| 42,135,248 | First Lien Term Loan, 10.409% (SOFR+525 basis points), 9/30/20282,3,4 |
| 40,418,601 | ||
| EUR 8,500,000 | Groupe Premium |
| 9,191,376 | ||
| Helibron Midco B.V. |
| ||||
| EUR 322,466 | First Lien Term Loan, 7.698% (EURIBOR+500 basis points), 9/17/20262,3,4,7 |
| 334,234 | ||
| EUR 14,409,908 | First Lien Term Loan, 7.698% (EURIBOR+500 basis points), 9/18/20262,3,4,7 |
| 14,935,799 | ||
| EUR 26,551,148 | HG Genesis 9 Sumoco Limited |
| 28,563,991 | ||
| Higginbotham Insurance Agency, Inc. |
| ||||
| 5,357,500 | Delayed Draw, 1.000%, 11/25/20262,4,6 |
| 5,301,322 | ||
| 9,557,129 | Delayed Draw, 1.000%, 11/25/20262,4,6 |
| 9,456,914 | ||
| 9,611,435 | Delayed Draw, 10.090% (LIBOR+525 basis points), 11/25/20262,3,4 |
| 9,510,651 | ||
| 17,145,634 | Delayed Draw, 10.090% (LIBOR+525 basis points), 11/25/20262,3,4,5 |
| 16,965,846 | ||
| 18,112,780 | First Lien Term Loan, 10.090% (LIBOR+525 basis points), 11/25/20262,3,4,5 |
| 17,922,850 | ||
| HPS Financials |
| ||||
| 2,677,508 | First Lien Term Loan, 12.159% (LIBOR+700 basis points), 6/29/20232,3,4,5 |
| 2,706,877 | ||
| EUR 3,570,450 | First Lien Term Loan, 7.602% (EURIBOR+550 basis points), 9/30/20262,3,4,7 |
| 3,860,865 | ||
| GBP 4,517,888 | First Lien Term Loan, 9.055% (SONIA+500 basis points), 9/30/20262,3,4,7 |
| 5,557,359 | ||
| HPS Specialty Loan Fund V Feeder LP |
| ||||
| 116,250,000 | First Lien Term Loan, 7.954%, 5/14/20312,4,11 |
| 116,250,000 | ||
| 71,250,000 | First Lien Term Loan, 7.954%, 5/14/20312,4,6 |
| 71,250,000 | ||
| EUR 3,700,000 | iM Global Partner |
| 3,891,311 | ||
| Integrity Marketing Acquisition, LLC |
| ||||
| 1,477,496 | Revolver, 0.500%, 8/27/20252,4,6 |
| 1,362,990 | ||
| 2,927,367 | Delayed Draw, 1.000%, 8/27/20252,4,6 |
| 2,874,089 | ||
| 13,061,603 | Delayed Draw, 10.911% (SOFR+602 basis points), 8/27/20252,3,4,5 |
| 12,823,881 | ||
| 1,477,496 | First Lien Term Loan, 11.391% (SOFR+650 basis points), 8/27/20252,3,4 |
| 1,451,640 | ||
| J S Held, LLC |
| ||||
| 7,620,003 | Delayed Draw, 1.000%, 7/1/20252,4,6 |
| 7,581,324 | ||
| 45,344,635 | First Lien Term Loan, 10.659% (LIBOR+550 basis points), 7/1/20252,3,4,5 |
| 45,114,466 | ||
| 9,789,028 | Delayed Draw, 10.230% (LIBOR+550 basis points), 7/1/20252,3,4,5 |
| 9,739,339 | ||
| 8,767,395 | First Lien Term Loan, 10.230% (LIBOR+550 basis points), 7/1/20252,3,4,5 |
| 8,722,892 | ||
| 2,977,017 | Delayed Draw, 10.319% (LIBOR+550 basis points), 7/1/20252,3,4,5 |
| 2,961,906 | ||
| Kensington Private Equity Fund |
| ||||
| 6,800,000 | Delayed Draw, 1.000%, 3/28/20262,4,5,6 |
| 6,708,959 | ||
| 6,800,000 | First Lien Term Loan, 11.900% PIK (SOFR+700 basis points), 3/28/20262,3,4,5,8 |
| 6,708,959 | ||
See accompanying Notes to Consolidated Financial Statements.
15
Cliffwater Corporate Lending Fund |
Consolidated Schedule of Investments As of March 31, 2023 (Continued) |
Principal | Value | |||||
SENIOR SECURED LOANS (Continued) | ||||||
| FINANCIALS (Continued) |
| ||||
| Keystone Agency Investors |
| ||||
$ | 6,163,035 | Delayed Draw, 1.000%, 5/3/20272,4,6 | $ | 6,054,572 | ||
| 8,952,750 | Delayed Draw, 10.798% (SOFR+575 basis points), 5/3/20272,3,4 |
| 8,795,191 | ||
| 5,596,875 | Delayed Draw, 10.798% (SOFR+575 basis points), 5/3/20272,3,4 |
| 5,498,376 | ||
| 3,786,555 | Delayed Draw, 10.798% (SOFR+575 basis points), 5/3/20272,3,4 |
| 3,719,915 | ||
| 15,406,910 | First Lien Term Loan, 10.798% (SOFR+575 basis points), 5/3/20272,3,4 |
| 15,135,765 | ||
| KWOR Acquisition, Inc. |
| ||||
| 1,154,699 | Revolver, 0.500%, 12/22/20272,4,6 |
| 1,125,007 | ||
| 954,340 | Revolver, 12.000% (LIBOR+525 basis points), 12/22/20272,3,4 |
| 929,800 | ||
| 15,313,231 | Delayed Draw, 1.000%, 12/22/20282,4,5,6 |
| 15,072,883 | ||
| 15,109,154 | First Lien Term Loan, 10.090% (LIBOR+525 basis points), 12/22/20282,3,4 |
| 14,720,639 | ||
| Mclarens Midco, Inc. |
| ||||
| 580,838 | Revolver, 0.500%, 12/19/20252,4,5,6 |
| 567,357 | ||
| 2,904,188 | Revolver, 10.514% (LIBOR+575 basis points), 12/19/20252,3,4,5 |
| 2,836,784 | ||
| Oakbridge Insurance Agency LLC |
| ||||
| 343,966 | Revolver, 0.500%, 12/31/20262,4,6 |
| 333,019 | ||
| 12,008,621 | Delayed Draw, 1.000%, 12/31/20262,4,6 |
| 11,626,446 | ||
| 3,021,632 | Delayed Draw, 10.657% (SOFR+575 basis points), 12/31/20262,3,4 |
| 2,925,469 | ||
| 259,483 | Revolver, 10.657% (SOFR+575 basis points), 12/31/20262,3,4 |
| 251,225 | ||
| 1,792,241 | First Lien Term Loan, 10.657% (SOFR+575 basis points), 12/31/20262,3,4 |
| 1,735,203 | ||
| Patriot Growth Insurance Services, LLC |
| ||||
| 2,660,377 | Revolver, 0.500%, 10/14/20282,4,6 |
| 2,571,979 | ||
| 1,854,545 | Delayed Draw, 1.000%, 10/14/20282,4,6 |
| 1,820,793 | ||
| 24,830,120 | Delayed Draw, 1.000%, 10/14/20282,4,6 |
| 24,378,210 | ||
| 5,795,536 | Delayed Draw, 10.401% (LIBOR+550 basis points), 10/14/20282,3,4 |
| 5,690,057 | ||
| 24,703,138 | First Lien Term Loan, 10.663% (LIBOR+550 basis points), 10/14/20282,3,4 |
| 23,882,312 | ||
| Peter C. Foy & Associates Insurance Services, LLC |
| ||||
| 53,353,616 | Delayed Draw, 11.124% (SOFR+600 basis points), 11/1/20282,3,4 |
| 53,199,001 | ||
| 21,321,429 | First Lien Term Loan, 11.124% (SOFR+600 basis points), 11/1/20282,3,4 |
| 21,259,640 | ||
| Petrus Buyer, Inc. |
| ||||
| 1,923,077 | Revolver, 0.500%, 10/17/20292,4,6 |
| 1,869,747 | ||
| 5,494,505 | Delayed Draw, 1.000%, 10/17/20292,4,6 |
| 5,424,744 | ||
| 17,582,418 | First Lien Term Loan, 10.699% (SOFR+650 basis points), 10/17/20292,3,4 |
| 17,094,829 | ||
| 16,039,152 | Retail Services Corporation |
| 15,524,494 | ||
| Riveron Acquisition Holdings, Inc. |
| ||||
| 855,545 | First Lien Term Loan, 8.001% (LIBOR+575 basis points), 5/22/20252,3,4 |
| 853,066 | ||
| 7,926,061 | First Lien Term Loan, 10.909% (LIBOR+575 basis points), 5/22/20252,3,4 |
| 7,903,091 | ||
| RSC Acquisition, Inc. |
| ||||
| 48,299,149 | First Lien Term Loan, 10.326% (SOFR+550 basis points), 10/30/20262,3,4,5 |
| 46,452,345 | ||
| 2,641,633 | Delayed Draw, 10.541% (SOFR+550 basis points), 10/30/20262,3,4,5 |
| 2,540,626 | ||
| 3,330,549 | Revolver, 0.500%, 11/1/20262,4,5,6 |
| 3,203,199 | ||
| 16,289,385 | First Lien Term Loan, 10.326% (SOFR+550 basis points), 11/1/20262,3,4 |
| 15,666,532 | ||
See accompanying Notes to Consolidated Financial Statements.
16
Cliffwater Corporate Lending Fund |
Consolidated Schedule of Investments As of March 31, 2023 (Continued) |
Principal | Value | |||||
SENIOR SECURED LOANS (Continued) | ||||||
| FINANCIALS (Continued) |
| ||||
$ | 5,360,000 | Revolver, 10.683% (SOFR+550 basis points), 11/1/20262,3,4,5 | $ | 5,155,050 | ||
| 1,414,737 | Delayed Draw, 1.000%, 5/31/20292,4,6 |
| 1,360,642 | ||
| 157,895 | Delayed Draw, 10.541% (SOFR+550 basis points), 5/31/20292,3,4 |
| 151,857 | ||
| Spirit RR Holdings, Inc. |
| ||||
| 100,316 | Revolver, 0.500%, 9/13/20282,4,6 |
| 97,307 | ||
| 1,217,466 | First Lien Term Loan, 11.498% (SOFR+650 basis points), 9/13/20282,3,4 |
| 1,180,942 | ||
| 1,500,000 | StarCompliance Intermediate, LLC |
| 1,405,076 | ||
| 1,424,528 | The Ultimus Group Midco, LLC |
| 1,402,170 | ||
| THG Acquisition, LLC |
| ||||
| 619,903 | Revolver, 0.500%, 12/2/20252,4,6 |
| 614,831 | ||
| 123,981 | Revolver, 10.590% (LIBOR+575 basis points), 12/2/20252,3,4 |
| 122,966 | ||
| 4,327,750 | Delayed Draw, 1.000%, 12/2/20262,4,6 |
| 4,259,824 | ||
| 9,909,961 | Delayed Draw, 10.340% (LIBOR+550 basis points), 12/2/20262,3,4 |
| 9,754,420 | ||
| Turbo Buyer, Inc. |
| ||||
| 3,000,000 | Delayed Draw, 1.000%, 12/2/20252,4,6 |
| 2,897,312 | ||
| 4,949,000 | Delayed Draw, 11.151% (LIBOR+600 basis points), 12/2/20252,3,4 |
| 4,779,598 | ||
| 4,937,500 | First Lien Term Loan, 11.151% (LIBOR+600 basis points), 12/2/20252,3,4 |
| 4,768,492 | ||
| 1,998,667 | Delayed Draw, 11.151% (LIBOR+600 basis points), 12/2/20252,3,4 |
| 1,930,253 | ||
| Vale Insurance Services LLC |
| ||||
| 2,419,355 | Revolver, 0.500%, 12/1/20272,4,6 |
| 2,337,269 | ||
| 22,354,839 | First Lien Term Loan, 10.048% (LIBOR+500 basis points), 12/1/20272,3,4 |
| 21,596,364 | ||
| 439,990 | Wealth Enhancement Group, LLC |
| 425,371 | ||
| World Insurance Associates, LLC |
| ||||
| 5,405,000 | Delayed Draw, 1.000%, 5/26/20282,4,6 |
| 5,245,440 | ||
| 12,264,344 | Delayed Draw, 10.648% (SOFR+575 basis points), 12/1/20272,3,4 |
| 11,902,291 | ||
| 2,677,869 | First Lien Term Loan, 10.648% (SOFR+575 basis points), 4/1/20262,3,4 |
| 2,598,816 | ||
| 14,595,000 | Delayed Draw, 10.648% (SOFR+575 basis points), 5/26/20282,3,4 |
| 14,164,144 | ||
|
| 1,283,424,837 | ||||
| GOVERNMENTS — 0.3% |
| ||||
| Govdelivery Holdings, LLC |
| ||||
| 7,063 | First Lien Term Loan, 0.000%, 1/29/20272,4,6 |
| 6,935 | ||
| 254,493 | Revolver, 0.500%, 1/29/20272,4,6 |
| 249,862 | ||
| 6,054,193 | First Lien Term Loan, 10.340% PIK (SOFR+550 basis points), 1/29/20272,3,4,8 |
| 5,944,006 | ||
| 281,908 | Revolver, 11.170% (SOFR+650 basis points), 1/29/20272,3,4 |
| 276,777 | ||
| 8,370,190 | Delayed Draw, 10.841% (SOFR+600 basis points), 1/29/20272,3,4 |
| 8,217,851 | ||
| Prime Buyer, LLC |
| ||||
| 3,213,443 | Revolver, 0.500%, 12/22/20262,4,6 |
| 3,109,566 | ||
| 642,689 | Revolver, 10.157% (LIBOR+525 basis points), 12/22/20262,3,4 |
| 621,913 | ||
| 9,369,294 | First Lien Term Loan, 10.157% (LIBOR+525 basis points), 12/22/20262,3,4 |
| 9,066,423 | ||
|
| 27,493,333 | ||||
See accompanying Notes to Consolidated Financial Statements.
17
Cliffwater Corporate Lending Fund |
Consolidated Schedule of Investments As of March 31, 2023 (Continued) |
Principal | Value | |||||
SENIOR SECURED LOANS (Continued) | ||||||
| HEALTH CARE — 16.5% |
| ||||
| 123Dentist, Inc. |
| ||||
| CAD 6,681,175 | Delayed Draw, 1.000%, 8/10/20292,4,6,7 | $ | 4,927,843 | ||
| CAD 3,333,333 | Delayed Draw, 1.000%, 8/10/20292,4,7 |
| 2,446,228 | ||
| CAD 50,030,877 | First Lien Term Loan, 10.673% (CDOR+575 basis points), 8/10/20292,3,4,7 |
| 36,468,908 | ||
| AAH Topco, LLC |
| ||||
$ | 423,729 | Revolver, 0.500%, 12/22/20272,4,6 |
| 407,527 | ||
| 1,423,117 | Delayed Draw, 1.000%, 12/22/20272,4,6 |
| 1,379,395 | ||
| 2,932,143 | Delayed Draw, 10.340% (LIBOR+550 basis points), 12/22/20272,3,4 |
| 2,842,059 | ||
| 4,066,947 | First Lien Term Loan, 10.340% (LIBOR+550 basis points), 12/22/20272,3,4 |
| 3,911,440 | ||
| ACI Group Holdings, Inc. |
| ||||
| 2,214,643 | Delayed Draw, 1.000% PIK, 8/2/20282,4,6,8 |
| 2,167,014 | ||
| 1,529,985 | Delayed Draw, 10.590% PIK (LIBOR+575 basis points), 8/2/20282,3,4,8 |
| 1,497,081 | ||
| 10,057,686 | First Lien Term Loan, 10.657% PIK (LIBOR+575 basis points), 8/2/20282,3,4,8 |
| 9,841,384 | ||
| ADCS Clinics Intermediate Holdings, LLC |
| ||||
| 5,433,471 | Delayed Draw, 1.000%, 5/7/20272,4,6 |
| 5,015,595 | ||
| 10,913,058 | First Lien Term Loan, 11.428% (LIBOR+650 basis points), 5/7/20272,3,4 |
| 10,001,601 | ||
| 2,236,999 | Delayed Draw, 11.747% (LIBOR+650 basis points), 5/7/20272,3,4 |
| 2,064,957 | ||
| ADMA Bilogics, Inc. |
| ||||
| 3,571,429 | Delayed Draw, 1.000%, 3/23/20272,4,5,6 |
| 3,561,079 | ||
| 22,246,818 | First Lien Term Loan, 14.407% PIK (SOFR+950 basis points), 3/23/20272,3,4,5,8 |
| 22,182,348 | ||
| Advarra Holdings, Inc. |
| ||||
| 352,200 | Delayed Draw, 1.000%, 8/24/20292,4,6 |
| 349,118 | ||
| 3,888,055 | First Lien Term Loan, 10.557% (SOFR+575 basis points), 8/24/20292,3,4 |
| 3,820,015 | ||
| 1,123,541 | AEC Parent Holdings, Inc. |
| 1,103,092 | ||
| Affinity Hospice Intermediate Holdings, LLC |
| ||||
| 2,724,335 | Delayed Draw, 1.000%, 12/17/20272,4,5,6 |
| 2,654,281 | ||
| 11,153,583 | First Lien Term Loan, 9.909% (LIBOR+475 basis points), 12/17/20272,3,4,5 |
| 10,838,846 | ||
| AG-Twin Brook Healthcare |
| ||||
| 7,570,000 | Delayed Draw, 11.438% (SOFR+650 basis points), 4/2/20242,3,4 |
| 7,533,082 | ||
| 12,114,999 | First Lien Term Loan, 11.652% (SOFR+650 basis points), 4/2/20242,3,4 |
| 12,055,916 | ||
| 19,432,886 | First Lien Term Loan, 11.381% (SOFR+650 basis points), 5/16/20242,3,4,5 |
| 19,334,201 | ||
| 29,441,256 | First Lien Term Loan, 12.160% (SOFR+700 basis points), 7/1/20242,3,4,5 |
| 28,896,575 | ||
| 13,783,430 | First Lien Term Loan, 11.409% (LIBOR+625 basis points), 11/27/20242,3,4,5 |
| 13,716,276 | ||
| 1,676,549 | First Lien Term Loan, 11.172% (SOFR+625 basis points), 7/3/20252,3,4,5 |
| 1,664,792 | ||
| 19,749,338 | First Lien Term Loan, 10.910% (SOFR+575 basis points), 9/25/20252,3,4,5 |
| 19,553,099 | ||
| 6,865,682 | First Lien Term Loan, 11.160% (SOFR+600 basis points), 3/5/20262,3,4,5 |
| 2,963,915 | ||
| 9,850,520 | First Lien Term Loan, 10.922% (LIBOR+600 basis points), 6/10/20262,3,4,5 |
| 9,788,407 | ||
| CAD 24,625,000 | First Lien Term Loan, 10.778% (LIBOR+575 basis points), 7/23/20262,3,4,7 |
| 17,999,266 | ||
| 14,812,500 | First Lien Term Loan, 11.422% (LIBOR+650 basis points), 8/20/20262,3,4,5 |
| 14,676,863 | ||
| 24,625,000 | First Lien Term Loan, 10.401% (LIBOR+525 basis points), 9/22/20262,3,4,5 |
| 24,321,098 | ||
| 19,800,000 | First Lien Term Loan, 11.085% (SOFR+600 basis points), 10/8/20262,3,4,5 |
| 19,673,603 | ||
| 19,895,555 | Delayed Draw, 11.410% (SOFR+625 basis points), 10/29/20262,3,4,5 |
| 19,684,195 | ||
See accompanying Notes to Consolidated Financial Statements.
18
Cliffwater Corporate Lending Fund |
Consolidated Schedule of Investments As of March 31, 2023 (Continued) |
Principal | Value | |||||
SENIOR SECURED LOANS (Continued) | ||||||
| HEALTH CARE (Continued) |
| ||||
$ | 19,700,000 | First Lien Term Loan, 10.590% (LIBOR+575 basis points), 12/14/20262,3,4,5 | $ | 19,569,811 | ||
| 14,850,000 | First Lien Term Loan, 11.160% (LIBOR+600 basis points), 12/31/20262,3,4,5 |
| 14,647,005 | ||
| 9,930,556 | Delayed Draw, 1.000%, 2/23/20272,4,6 |
| 9,840,067 | ||
| 2,200,000 | Delayed Draw, 11.160% (SOFR+600 basis points), 2/23/20272,3,4 |
| 2,179,953 | ||
| 12,718,750 | First Lien Term Loan, 11.160% (SOFR+600 basis points), 2/23/20272,3,4 |
| 12,602,855 | ||
| AHR Intermediate, Inc. |
| ||||
| 10,500,000 | Delayed Draw, 1.000%, 7/29/20272,4,6 |
| 10,424,719 | ||
| 24,316,250 | First Lien Term Loan, 10.902% (SOFR+575 basis points), 7/29/20272,3,4 |
| 24,118,262 | ||
| Alcami Corporation |
| ||||
| 3,052,838 | Revolver, 0.500%, 12/21/20282,4,6 |
| 2,950,949 | ||
| 1,908,023 | Delayed Draw, 1.000%, 12/21/20282,4,6 |
| 1,844,343 | ||
| 22,839,041 | First Lien Term Loan, 11.907% (SOFR+710 basis points), 12/21/20282,3,4 |
| 22,076,790 | ||
| 5,253,731 | Alegeus Technologies Holding Corp. |
| 5,223,905 | ||
| 11,790,000 | American Renal Associates Holdings, Inc. |
| 11,002,768 | ||
| 7,860,000 | AWC-MH Acquisition |
| 4,699,836 | ||
| Biocare Medical LLC |
| ||||
| 2,583,333 | Revolver, 0.500%, 12/9/20272,4,6 |
| 2,497,495 | ||
| 194,444 | Revolver, 10.704% (LIBOR+575 basis points), 12/9/20272,3,4 |
| 187,984 | ||
| 21,944,444 | First Lien Term Loan, 10.741% (LIBOR+575 basis points), 12/9/20272,3,4 |
| 21,215,283 | ||
| 12,003,487 | Bridges Consumer Healthcare |
| 11,634,703 | ||
| Carevet LLC |
| ||||
| 4,530,505 | Delayed Draw, 1.000%, 9/1/20252,4,6 |
| 4,466,205 | ||
| 9,850,000 | Delayed Draw, 11.340% (LIBOR+650 basis points), 9/1/20252,3,4 |
| 9,710,202 | ||
| 7,581,000 | Delayed Draw, 11.340% (LIBOR+650 basis points), 9/1/20252,3,4 |
| 7,473,405 | ||
| 5,712,041 | First Lien Term Loan, 16.840% (LIBOR+1,200 basis points), 9/1/20252,3,4 |
| 5,637,339 | ||
| CNSI Holdings LLC |
| ||||
| 1,735,776 | Revolver, 0.500%, 12/17/20272,4,6 |
| 1,678,101 | ||
| 18,218,563 | First Lien Term Loan, 11.093% (SOFR+650 basis points), 12/17/20282,3,4 |
| 17,613,204 | ||
| 41,000,000 | Color Intermediate, LLC |
| 40,253,995 | ||
| Community Medical Acquisition Corp. |
| ||||
| 2,578,774 | Revolver, 0.500%, 12/15/20272,4,6 |
| 2,467,252 | ||
| 1,105,189 | Revolver, 9.504% (LIBOR+475 basis points), 12/15/20272,3,4 |
| 1,057,394 | ||
| 4,333,814 | Delayed Draw, 1.000%, 12/15/20282,4,6 |
| 4,178,957 | ||
| 25,470,048 | First Lien Term Loan, 9.519% (LIBOR+475 basis points), 12/15/20282,3,4 |
| 24,368,571 | ||
See accompanying Notes to Consolidated Financial Statements.
19
Cliffwater Corporate Lending Fund |
Consolidated Schedule of Investments As of March 31, 2023 (Continued) |
Principal | Value | |||||
SENIOR SECURED LOANS (Continued) | ||||||
| HEALTH CARE (Continued) |
| ||||
| Connect America.com, LLC |
| ||||
$ | 216,146 | Revolver, 0.500%, 6/30/20262,4,6 | $ | 202,901 | ||
| 7,346,835 | First Lien Term Loan, 12.041% (LIBOR+700 basis points), 6/30/20262,3,4 |
| 6,896,628 | ||
| 462,915 | Revolver, 12.048% (LIBOR+700 basis points), 6/30/20262,3,4 |
| 434,548 | ||
| CORA Health Holdings Corp. |
| ||||
| 5,169,567 | Delayed Draw, 0.500%, 6/15/20272,4,6 |
| 4,958,951 | ||
| 134,615 | Revolver, 0.500%, 6/15/20272,4,6 |
| 129,131 | ||
| 13,621,489 | First Lien Term Loan, 10.717% (LIBOR+575 basis points), 6/15/20272,3,4 |
| 13,066,531 | ||
| 634,615 | Revolver, 10.870% (LIBOR+575 basis points), 6/15/20272,3,4 |
| 608,760 | ||
| 230,861 | Delayed Draw, 10.878% (LIBOR+575 basis points), 6/15/20272,3,4 |
| 221,456 | ||
| Covaris Intermediate 3, LLC |
| ||||
| 789,474 | Revolver, 0.500%, 1/21/20282,4,6 |
| 755,728 | ||
| 5,921,053 | Delayed Draw, 1.000%, 1/21/20282,4,6 |
| 5,667,957 | ||
| 394,737 | Revolver, 9.909% (LIBOR+475 basis points), 1/21/20282,3,4 |
| 377,864 | ||
| 7,835,526 | First Lien Term Loan, 9.909% (LIBOR+475 basis points), 1/21/20282,3,4 |
| 7,500,596 | ||
| CPC/Cirtec Holdings, Inc. |
| ||||
| 826,873 | Revolver, 0.500%, 10/31/20282,4,6 |
| 797,766 | ||
| 206,718 | Revolver, 11.067% (SOFR+625 basis points), 10/31/20282,3,4 |
| 199,441 | ||
| 8,966,408 | First Lien Term Loan, 11.148% (SOFR+625 basis points), 1/30/20292,3,4 |
| 8,650,771 | ||
| CPF Dental, LLC |
| ||||
| 587,121 | Delayed Draw, 1.000%, 8/30/20242,4,6 |
| 574,082 | ||
| 5,314,906 | First Lien Term Loan, 13.500% (LIBOR+850 basis points), 8/30/20242,3,4,5 |
| 5,196,875 | ||
| 2,861,089 | Delayed Draw, 13.688% (LIBOR+850 basis points), 8/30/20242,3,4,5 |
| 2,797,552 | ||
| 7,225,481 | Delayed Draw, 13.688% (LIBOR+850 basis points), 8/30/20242,3,4,5 |
| 7,065,022 | ||
| 13,825,000 | Crossroads Holding, LLC |
| 13,296,376 | ||
| D4C Dental Brands, Inc. |
| ||||
| 357,143 | Revolver, 0.500%, 12/30/20262,4,6 |
| 356,108 | ||
| 376,771 | Delayed Draw, 1.000%, 12/30/20262,4,6 |
| 378,653 | ||
| 357,143 | Revolver, 11.429% (SOFR+650 basis points), 12/30/20262,3,4 |
| 356,108 | ||
| 2,625,810 | Delayed Draw, 11.541% (SOFR+650 basis points), 12/30/20262,3,4 |
| 2,638,920 | ||
| 1,921,001 | Delayed Draw, 11.541% (SOFR+650 basis points), 12/30/20262,3,4 |
| 1,930,592 | ||
| 6,458,482 | First Lien Term Loan, 11.548% (SOFR+650 basis points), 12/30/20262,3,4 |
| 6,490,728 | ||
| DCA Holdings LLC |
| ||||
| 15,789,663 | First Lien Term Loan, 10.386% (LIBOR+600 basis points), 3/12/20272,3,4,5 |
| 15,105,242 | ||
| 3,934,938 | Delayed Draw, 10.718% (LIBOR+600 basis points), 3/12/20272,3,4,5 |
| 3,764,373 | ||
| Deca Dental Holdings, LLC |
| ||||
| 74,074 | Revolver, 0.500%, 8/26/20282,4,6 |
| 71,019 | ||
| 3,333,333 | Delayed Draw, 1.000%, 8/26/20282,4,6 |
| 3,195,859 | ||
| 1,459,259 | Delayed Draw, 10.909% (LIBOR+575 basis points), 8/26/20282,3,4 |
| 1,399,076 | ||
| 1,037,037 | Revolver, 10.909% (LIBOR+575 basis points), 8/26/20282,3,4 |
| 994,267 | ||
| 13,862,963 | First Lien Term Loan, 10.909% (LIBOR+575 basis points), 8/26/20282,3,4 |
| 13,291,222 | ||
See accompanying Notes to Consolidated Financial Statements.
20
Cliffwater Corporate Lending Fund |
Consolidated Schedule of Investments As of March 31, 2023 (Continued) |
Principal | Value | |||||
SENIOR SECURED LOANS (Continued) | ||||||
| HEALTH CARE (Continued) |
| ||||
| Dermatopathology Laboratory Of Central States, LLC |
| ||||
$ | 6,900,806 | First Lien Term Loan, 10.442% (SOFR+575 basis points), 6/1/20282,3,4 | $ | 6,724,052 | ||
| 10,351,210 | First Lien Term Loan, 10.542% (SOFR+575 basis points), 6/1/20282,3,4 |
| 10,086,077 | ||
| DOCS MSO LLC |
| ||||
| 967,742 | Revolver, 0.500%, 6/1/20282,4,6 |
| 942,955 | ||
| 645,161 | Revolver, 0.500%, 6/1/20282,4,6 |
| 628,636 | ||
| 3,629,032 | Delayed Draw, 1.000%, 6/1/20282,4,6 |
| 3,536,080 | ||
| 2,419,355 | Delayed Draw, 1.000%, 6/1/20282,4,6 |
| 2,357,386 | ||
| Emmes Blocker, Inc. |
| ||||
| 7,107,473 | Delayed Draw, 1.000%, 7/7/20282,4,5,6 |
| 7,049,322 | ||
| 3,475,610 | Delayed Draw, 1.000%, 7/7/20282,4,6 |
| 3,447,173 | ||
| 8,211,128 | First Lien Term Loan, 9.519% (SOFR+550 basis points), 7/7/20282,3,4 |
| 8,061,685 | ||
| 4,104,566 | Delayed Draw, 10.243% (SOFR+550 basis points), 7/7/20282,3,4,5 |
| 4,070,984 | ||
| 2,007,165 | Delayed Draw, 10.243% (SOFR+550 basis points), 7/7/20282,3,4 |
| 1,990,743 | ||
| 10,696,250 | Ensemble RCM, LLC |
| 10,287,260 | ||
| ERC Holdings, LLC |
| ||||
| 852,071 | Revolver, 0.500%, 11/10/20272,4,6 |
| 808,820 | ||
| 3,994,755 | Revolver, 0.500%, 11/10/20272,4,6 |
| 3,791,982 | ||
| 2,663,169 | Revolver, 10.150% (LIBOR+550 basis points), 11/10/20272,3,4,5 |
| 2,527,987 | ||
| 568,047 | Revolver, 10.267% (LIBOR+550 basis points), 11/10/20272,3,4 |
| 539,213 | ||
| 15,651,538 | First Lien Term Loan, 10.659% (LIBOR+550 basis points), 11/10/20282,3,4 |
| 14,857,070 | ||
| 14,812,500 | FH MD Buyer, Inc. |
| 14,246,118 | ||
| 20,000,000 | Finthrive Software Intermediate Holdings, Inc. |
| 19,125,817 | ||
| Fortis Life Sciences, LLC |
| ||||
| 1,095,652 | Revolver, 0.500%, 9/17/20272,4,6 |
| 1,061,990 | ||
| 8,671,280 | Delayed Draw, 1.000%, 9/17/20272,4,6 |
| 8,404,872 | ||
| 1,339,130 | Revolver, 10.351% (LIBOR+525 basis points), 9/17/20272,3,4 |
| 1,297,988 | ||
| 2,434,783 | Delayed Draw, 10.384% (LIBOR+525 basis points), 9/17/20272,3,4 |
| 2,359,979 | ||
| 14,305,059 | First Lien Term Loan, 10.409% (LIBOR+525 basis points), 9/17/20272,3,4 |
| 13,865,564 | ||
| CAD 36,758,217 | FYI Optical Acquisitions, Inc. & FYI USA Inc. |
| 26,275,288 | ||
| Helium Acquirer Corporation |
| ||||
| 1,325,448 | Revolver, 0.500%, 1/5/20292,4,6 |
| 1,287,291 | ||
| 3,313,620 | Delayed Draw, 1.000%, 1/5/20292,4,6 |
| 3,267,993 | ||
| 331,362 | Revolver, 11.998% (SOFR+710 basis points), 1/5/20292,3,4 |
| 321,823 | ||
| 10,904,570 | First Lien Term Loan, 11.998% (SOFR+710 basis points), 1/5/20292,3,4 |
| 10,590,646 | ||
| 9,596,286 | HPS Healthcare |
| 9,568,476 | ||
See accompanying Notes to Consolidated Financial Statements.
21
Cliffwater Corporate Lending Fund |
Consolidated Schedule of Investments As of March 31, 2023 (Continued) |
Principal | Value | |||||
SENIOR SECURED LOANS (Continued) | ||||||
| HEALTH CARE (Continued) |
| ||||
| Integrated Oncology Network, LLC |
| ||||
$ | 83,957 | Revolver, 0.500%, 6/24/20242,4,6 | $ | 83,714 | ||
| 7,422,431 | First Lien Term Loan, 10.743% (SOFR+600 basis points), 6/24/20242,3,4 |
| 7,400,921 | ||
| 134,701 | Revolver, 0.500%, 6/24/20252,4,6 |
| 134,311 | ||
| 1,114,395 | Delayed Draw, 1.000%, 6/24/20252,4,6 |
| 1,111,165 | ||
| 746,794 | Delayed Draw, 10.743% (SOFR+600 basis points), 6/24/20252,3,4 |
| 744,630 | ||
| IvyRehab Intermediate II, LLC |
| ||||
| 3,837,719 | Revolver, 0.500%, 4/21/20292,4,6 |
| 3,604,470 | ||
| 882,675 | Delayed Draw, 1.000%, 4/21/20292,4,6 |
| 833,450 | ||
| 6,766,667 | Delayed Draw, 9.483% (SOFR+485 basis points), 4/21/20292,3,4 |
| 6,389,297 | ||
| 23,310,691 | First Lien Term Loan, 9.483% (SOFR+485 basis points), 4/21/20292,3,4 |
| 21,893,911 | ||
| NZD 6,300,000 | Jon Bidco Limited |
| 3,796,730 | ||
| 14,285,714 | Liberty Dental Plan |
| 14,000,000 | ||
| Life Science Intermediate Holdings, LLC |
| ||||
| 188,281 | Revolver, 0.500%, 6/10/20272,4,6 |
| 181,374 | ||
| 468,376 | Revolver, 0.500%, 6/10/20272,4,6 |
| 451,194 | ||
| EUR 6,000,000 | Delayed Draw, 8.360%, 6/10/20272,4,7 |
| 6,268,188 | ||
| GBP 7,500,000 | Delayed Draw, 10.407% (SONIA+623 basis points), 6/10/20272,3,4,7 |
| 8,912,991 | ||
| 7,042,967 | Delayed Draw, 11.006% (SOFR+600 basis points), 6/10/20272,3,4 |
| 6,784,603 | ||
| 6,550,650 | Delayed Draw, 11.006% (SOFR+600 basis points), 6/10/20272,3,4 |
| 6,310,346 | ||
| 1,553,797 | Delayed Draw, 11.006% (SOFR+600 basis points), 6/10/20272,3,4 |
| 1,496,797 | ||
| 2,878,392 | First Lien Term Loan, 11.026% (SOFR+600 basis points), 6/10/20272,3,4 |
| 2,772,801 | ||
| 820,052 | Revolver, 11.026% (SOFR+600 basis points), 6/10/20272,3,4 |
| 789,969 | ||
| 329,651 | Revolver, 11.026% (SOFR+600 basis points), 6/10/20272,3,4 |
| 317,558 | ||
| MB2 Dental Solutions, LLC |
| ||||
| 1,805,556 | Delayed Draw, 1.000%, 1/29/20272,4,6 |
| 1,792,324 | ||
| 4,426,389 | Delayed Draw, 10.561% (SOFR+600 basis points), 1/29/20272,3,4 |
| 4,393,952 | ||
| 649,752 | Delayed Draw, 10.907% (SOFR+600 basis points), 1/29/20272,3,4 |
| 638,476 | ||
| 1,802,025 | First Lien Term Loan, 10.907% (SOFR+600 basis points), 1/29/20272,3,4 |
| 1,770,750 | ||
| MedMark Services, Inc. |
| ||||
| 7,880,000 | First Lien Term Loan, 10.159% (LIBOR+500 basis points), 6/11/20272,3,4 |
| 7,708,953 | ||
| 1,568,416 | Delayed Draw, 10.163% (LIBOR+500 basis points), 6/11/20272,3,4 |
| 1,534,371 | ||
| 4,518,247 | Delayed Draw, 10.163% (LIBOR+500 basis points), 6/11/20272,3,4 |
| 4,420,172 | ||
| MN Acquisition, Inc. |
| ||||
| 2,166,667 | Revolver, 0.500%, 8/25/20282,4,6 |
| 2,089,247 | ||
| 333,333 | Revolver, 10.261% (SOFR+550 basis points), 8/25/20282,3,4 |
| 321,423 | ||
| 22,387,500 | First Lien Term Loan, 10.407% (SOFR+550 basis points), 8/25/20282,3,4 |
| 21,587,545 | ||
| Myorthos Management, LLC |
| ||||
| 8,972,201 | Delayed Draw, 10.465% (SOFR+550 basis points), 11/1/20272,3,4,5 |
| 8,786,435 | ||
| 4,856,732 | First Lien Term Loan, 10.465% (SOFR+550 basis points), 11/1/20272,3,4,5 |
| 4,756,175 | ||
See accompanying Notes to Consolidated Financial Statements.
22
Cliffwater Corporate Lending Fund |
Consolidated Schedule of Investments As of March 31, 2023 (Continued) |
Principal | Value | |||||
SENIOR SECURED LOANS (Continued) | ||||||
| HEALTH CARE (Continued) |
| ||||
| National Dentex Labs LLC |
| ||||
$ | 137,931 | Revolver, 0.500%, 10/23/20252,4,6 | $ | 135,455 | ||
| 390,805 | Delayed Draw, 1.000%, 10/23/20252,4,6 |
| 383,790 | ||
| 781,609 | Revolver, 11.730% (LIBOR+700 basis points), 4/3/20262,3,4 |
| 767,580 | ||
| 2,973,523 | Delayed Draw, 13.048% PIK (LIBOR+800 basis points), 4/3/20262,3,4,8 |
| 2,920,149 | ||
| 6,960,813 | First Lien Term Loan, 13.048% PIK (LIBOR+800 basis points), 4/3/20262,3,4,8 |
| 6,835,869 | ||
| 528,735 | Delayed Draw, 13.048% PIK (LIBOR+800 basis points), 4/3/20262,3,4,8 |
| 519,245 | ||
| Novotech (Australia) Pty Limited |
| ||||
| 3,125,000 | Delayed Draw, 1.000%, 1/14/20282,4,6 |
| 3,030,644 | ||
| AUD 18,543,750 | Delayed Draw, 9.081% (BBSY+525 basis points), 1/14/20282,3,4,7 |
| 12,016,575 | ||
| 16,437,500 | First Lien Term Loan, 10.488% (SOFR+575 basis points), 1/14/20282,3,4 |
| 15,941,190 | ||
| OB Hospitalist Group |
| ||||
| 1,053,435 | Revolver, 0.500%, 9/27/20272,4,6 |
| 1,033,539 | ||
| 664,122 | Revolver, 10.548% (SOFR+550 basis points), 9/27/20272,3,4 |
| 651,579 | ||
| 37,927,495 | First Lien Term Loan, 10.548% (SOFR+550 basis points), 9/27/20272,3,4 |
| 37,211,165 | ||
| 6,947,368 | Office Ally |
| 6,772,205 | ||
| OIA Acquisition, LLC |
| ||||
| 1,928,571 | Revolver, 0.500%, 10/19/20272,4,6 |
| 1,869,320 | ||
| 459,000 | Delayed Draw, 1.000%, 10/19/20272,4,6 |
| 444,898 | ||
| 1,366,559 | Delayed Draw, 9.965% (LIBOR+500 basis points), 10/19/20272,3,4 |
| 1,324,574 | ||
| 11,088,214 | First Lien Term Loan, 9.965% (LIBOR+500 basis points), 10/19/20272,3,4 |
| 10,747,551 | ||
| OIS Management Services, LLC |
| ||||
| 1,328,205 | Revolver, 0.500%, 11/16/20282,4,6 |
| 1,297,379 | ||
| 4,188,590 | Delayed Draw, 1.000%, 11/16/20282,4,6 |
| 4,091,376 | ||
| 94,872 | Revolver, 10.861% (SOFR+525 basis points), 11/16/20282,3,4 |
| 92,670 | ||
| 12,333,333 | First Lien Term Loan, 10.869% (SOFR+575 basis points), 11/16/20282,3,4 |
| 12,047,086 | ||
| 555,000 | Delayed Draw, 10.998% (SOFR+525 basis points), 11/16/20282,3,4 |
| 542,119 | ||
| Ons Mso, LLC |
| ||||
| 2,763,592 | Revolver, 0.500%, 7/8/20242,4,6 |
| 2,678,686 | ||
| 2,763,592 | Revolver, 9.595% (LIBOR+475 basis points), 7/8/20242,3,4,5 |
| 2,678,686 | ||
| Org USME Buyer, LLC |
| ||||
| 411,942 | Revolver, 0.500%, 11/24/20262,4,6 |
| 401,349 | ||
| 743,478 | Delayed Draw, 1.000%, 11/24/20262,4,6 |
| 724,361 | ||
| 524,290 | Revolver, 10.515% (SOFR+575 basis points), 11/24/20262,3,4 |
| 510,808 | ||
| 16,311,693 | First Lien Term Loan, 10.791% (SOFR+575 basis points), 11/24/20262,3,4 |
| 15,892,256 | ||
| Orthodontic Partners, LLC |
| ||||
| 14,278,356 | Delayed Draw, 1.000%, 10/12/20272,4,6 |
| 14,102,341 | ||
| 9,721,644 | First Lien Term Loan, 11.125% (SOFR+625 basis points), 10/12/20272,3,4 |
| 9,504,813 | ||
See accompanying Notes to Consolidated Financial Statements.
23
Cliffwater Corporate Lending Fund |
Consolidated Schedule of Investments As of March 31, 2023 (Continued) |
Principal | Value | |||||
SENIOR SECURED LOANS (Continued) | ||||||
| HEALTH CARE (Continued) |
| ||||
| Pediatric Home Respiratory Services, LLC |
| ||||
$ | 856,529 | Delayed Draw, 1.000%, 12/4/20242,4,6 | $ | 834,504 | ||
| 4,687,355 | First Lien Term Loan, 10.791% (SOFR+575 basis points), 12/4/20242,3,4 |
| 4,566,825 | ||
| 1,150,894 | Delayed Draw, 11.291% (SOFR+625 basis points), 12/4/20242,3,4 |
| 1,121,300 | ||
| 6,257,209 | PerkinElmer U.S. LLC |
| 6,069,651 | ||
| Pinnacle Dermatology Management, LLC |
| ||||
| 680,412 | Revolver, 0.500%, 5/18/20232,4,6 |
| 673,141 | ||
| 1,221,649 | Delayed Draw, 1.000%, 5/18/20232,4,6 |
| 1,184,117 | ||
| 402,062 | Revolver, 9.500% (SOFR+400 basis points), 5/18/20232,3,4 |
| 397,765 | ||
| 1,318,284 | Delayed Draw, 10.548% (SOFR+425 basis points), 5/18/20232,3,4 |
| 1,277,782 | ||
| 11,262,881 | First Lien Term Loan, 11.125% (SOFR+575 basis points), 5/18/20232,3,4 |
| 10,775,807 | ||
| Pinnacle Treatment Centers, Inc. |
| ||||
| 9,363 | Revolver, 0.500%, 1/2/20262,4,6 |
| 9,168 | ||
| 424,904 | Revolver, 0.500%, 1/2/20262,4,6 |
| 416,079 | ||
| 276,352 | Revolver, 11.557% (SOFR+675 basis points), 1/2/20262,3,4 |
| 270,612 | ||
| 335,143 | Delayed Draw, 11.791% (SOFR+675 basis points), 1/2/20262,3,4 |
| 328,182 | ||
| 14,289,992 | First Lien Term Loan, 11.791% (SOFR+675 basis points), 1/2/20262,3,4 |
| 13,993,207 | ||
| 591,030 | Delayed Draw, 11.791% (SOFR+675 basis points), 1/2/20262,3,4 |
| 578,755 | ||
| 78,958 | Revolver, 11.791% (SOFR+650 basis points), 1/2/20262,3,4 |
| 77,318 | ||
| 157,143 | First Lien Term Loan, 11.791% (SOFR+675 basis points), 1/2/20262,3,4 |
| 153,879 | ||
| PPV Intermediate Holdings LLC |
| ||||
| 2,538,076 | Revolver, 0.500%, 8/31/20292,4,6 |
| 2,472,813 | ||
| 1,611,678 | Delayed Draw, 1.000%, 8/31/20292,4,6 |
| 1,586,382 | ||
| 264,996 | Delayed Draw, 1.000%, 8/31/20292,4,6 |
| 261,993 | ||
| 45,905 | Delayed Draw, 9.009% (SOFR+575 basis points), 8/31/20292,3,4 |
| 45,385 | ||
| 43,459,056 | First Lien Term Loan, 9.009% (SOFR+575 basis points), 8/31/20292,3,4 |
| 42,376,621 | ||
| 279,188 | Delayed Draw, 10.526% (SOFR+575 basis points), 8/31/20292,3,4 |
| 274,806 | ||
| 255,682 | Delayed Draw, 1.000%, 8/31/20302,4,6 |
| 251,669 | ||
| 1,619,318 | Delayed Draw, 13.000% (SOFR+575 basis points), 8/31/20302,3,4 |
| 1,593,902 | ||
| Premier Imaging, LLC |
| ||||
| 10,332,779 | Delayed Draw, 1.000%, 1/2/20252,4,6 |
| 10,196,480 | ||
| 23,060,204 | First Lien Term Loan, 10.840% (LIBOR+600 basis points), 1/2/20252,3,4 |
| 22,756,020 | ||
| 4,153,328 | Delayed Draw, 10.840% (LIBOR+600 basis points), 1/2/20252,3,4 |
| 4,098,542 | ||
| 14,925,000 | Premise Health Holding Corp. |
| 14,695,231 | ||
| Q-Centrix LLC |
| ||||
| 4,872,773 | First Lien Term Loan, 9.453% (LIBOR+450 basis points), 5/30/20252,3,4 |
| 4,784,089 | ||
| 831,213 | First Lien Term Loan, 9.953% (LIBOR+500 basis points), 5/30/20252,3,4 |
| 826,494 | ||
See accompanying Notes to Consolidated Financial Statements.
24
Cliffwater Corporate Lending Fund |
Consolidated Schedule of Investments As of March 31, 2023 (Continued) |
Principal | Value | |||||
SENIOR SECURED LOANS (Continued) | ||||||
| HEALTH CARE (Continued) |
| ||||
| Raven Buyer, Inc. |
| ||||
$ | 1,800,000 | Revolver, 0.500%, 2/1/20272,4,6 | $ | 1,771,748 | ||
| 245,455 | Revolver, 11.041% (SOFR+600 basis points), 2/1/20272,3,4 |
| 241,602 | ||
| 12,922,159 | First Lien Term Loan, 11.041% (SOFR+600 basis points), 2/1/20272,3,4 |
| 12,719,340 | ||
| 118,056 | RCS Healthcare |
| 117,090 | ||
| Redwood MSO, LLC |
| ||||
| 18,601,910 | First Lien Term Loan, 11.172% (SOFR+625 basis points), 7/3/20252,3,4,5 |
| 18,467,164 | ||
| Smile Doctors, LLC |
| ||||
| 247,350 | Revolver, 0.500%, 12/23/20272,4,6 |
| 237,049 | ||
| 1,961,131 | Revolver, 10.748% (LIBOR+575 basis points), 12/23/20272,3,4 |
| 1,879,463 | ||
| 3,076,413 | Delayed Draw, 10.748% (LIBOR+575 basis points), 12/23/20282,3,4 |
| 2,945,837 | ||
| 19,502,650 | First Lien Term Loan, 10.748% (LIBOR+575 basis points), 12/23/20282,3,4 |
| 18,600,624 | ||
| 39,800,000 | Southern Veterinary Partners, LLC |
| 39,023,783 | ||
| GBP 1,797,628 | SSCP Pegasus Midco Limited |
| 2,170,625 | ||
| The Smilist Management, Inc. |
| ||||
| 356,075 | Revolver, 0.500%, 12/22/20252,4,5,6 |
| 353,713 | ||
| 1,584,533 | Delayed Draw, 10.923%, 12/22/20252,4,6 |
| 1,574,022 | ||
| 1,771,473 | Delayed Draw, 11.407% (SOFR+650 basis points), 12/22/20252,3,4,5 |
| 1,759,721 | ||
| 3,193,992 | First Lien Term Loan, 11.407% (SOFR+650 basis points), 12/22/20252,3,4,5 |
| 3,172,804 | ||
| 3,773,237 | Delayed Draw, 11.407% (SOFR+650 basis points), 12/22/20252,3,4,5 |
| 3,748,206 | ||
| 1,966,335 | First Lien Term Loan, 10.923% (SOFR+650 basis points), 12/23/20252,3,4,5 |
| 1,953,290 | ||
| TheKey, LLC |
| ||||
| 19,468,737 | Delayed Draw, 1.000%, 3/30/20272,4,6 |
| 18,773,077 | ||
| 1,504,701 | Delayed Draw, 9.907% (SOFR+500 basis points), 3/30/20272,3,4,5 |
| 1,450,935 | ||
| Tivity Health, Inc. |
| ||||
| 42,837,267 | First Lien Term Loan, 10.898% (SOFR+600 basis points), 6/28/20282,3,4 |
| 40,710,066 | ||
| 5,000,000 | TPC Holdco, LLC |
| 4,796,509 | ||
| Troy Gastroenterology, P.C. |
| ||||
| 2,122,266 | Delayed Draw, 0.500%, 11/25/20252,4,6 |
| 2,094,271 | ||
| 295,567 | Revolver, 0.500%, 11/25/20252,4,6 |
| 291,668 | ||
| 2,755,453 | Delayed Draw, 10.754% (LIBOR+600 basis points), 11/25/20252,3,4 |
| 2,719,107 | ||
| 4,393,103 | First Lien Term Loan, 10.754% (LIBOR+600 basis points), 11/25/20252,3,4 |
| 4,335,155 | ||
| 295,566 | Revolver, 10.901% (LIBOR+600 basis points), 11/25/20252,3,4 |
| 291,668 | ||
| 1,816,524 | TurningPoint Healthcare Solutions, LLC |
| 1,765,265 | ||
| United Digestive MSO Parent, LLC |
| ||||
| 2,065,500 | Revolver, 0.500%, 3/30/20292,4,6 |
| 2,003,535 | ||
| 1,412,000 | Revolver, 0.500%, 3/30/20292,4,6 |
| 1,369,640 | ||
| 4,130,000 | Delayed Draw, 1.000%, 3/30/20292,4,6 |
| 4,068,050 | ||
See accompanying Notes to Consolidated Financial Statements.
25
Cliffwater Corporate Lending Fund |
Consolidated Schedule of Investments As of March 31, 2023 (Continued) |
Principal | Value | |||||
SENIOR SECURED LOANS (Continued) | ||||||
| HEALTH CARE (Continued) |
| ||||
$ | 2,825,000 | Delayed Draw, 1.000%, 3/30/20292,4,6 | $ | 2,782,625 | ||
| 26,430,000 | First Lien Term Loan, 11.641% (SOFR+675 basis points), 3/30/20292,3,4 |
| 25,637,100 | ||
| United Musculoskeletal Partners Acquisition Holdings, LLC |
| ||||
| 1,724,138 | Revolver, 0.500%, 7/15/20282,4,6 |
| 1,679,804 | ||
| 2,280,344 | Delayed Draw, 1.000%, 7/15/20282,4,6 |
| 2,221,708 | ||
| 3,230,888 | Delayed Draw, 9.653% (SOFR+575 basis points), 7/15/20282,3,4 |
| 3,147,809 | ||
| 3,115,594 | First Lien Term Loan, 9.658% (SOFR+575 basis points), 7/15/20282,3,4 |
| 3,035,480 | ||
| 8,275,862 | First Lien Term Loan, 10.158% (SOFR+575 basis points), 7/15/20282,3,4 |
| 8,063,058 | ||
| 7,000,000 | UroGPO, LLC |
| 6,900,651 | ||
| Urology Management Holdings, Inc. |
| ||||
| 1,190,476 | Revolver, 0.500%, 6/15/20262,4,5,6 |
| 1,150,919 | ||
| 3,266,667 | Delayed Draw, 1.000%, 6/15/20262,4,6 |
| 3,159,817 | ||
| 14,787,545 | Delayed Draw, 11.155% (SOFR+604 basis points), 6/15/20262,3,4 |
| 14,296,191 | ||
| 5,049,067 | First Lien Term Loan, 11.155% (SOFR+604 basis points), 6/15/20262,3,4 |
| 4,881,299 | ||
| 6,533,333 | First Lien Term Loan, 11.365% (SOFR+625 basis points), 6/15/20262,3,4 |
| 6,319,633 | ||
| Vardiman Black Holdings, LLC |
| ||||
| 1,434,904 | Delayed Draw, 1.000%, 3/18/20272,4,6 |
| 1,412,067 | ||
| 35,519,425 | Delayed Draw, 11.765% (SOFR+700 basis points), 3/18/20272,3,4 |
| 34,954,120 | ||
| 10,125,000 | First Lien Term Loan, 11.765% (SOFR+700 basis points), 3/18/20272,3,4 |
| 9,963,857 | ||
| Vermont Aus Pty Ltd. |
| ||||
| AUD 10,781,230 | First Lien Term Loan, 9.515% (BBSY+575 basis points), 3/23/20282,3,4,7 |
| 6,830,718 | ||
| 7,916,287 | First Lien Term Loan, 10.548% (SOFR+565 basis points), 3/23/20282,3,4 |
| 7,511,205 | ||
| Vital Care Buyer, LLC |
| ||||
| 1,777,778 | Revolver, 0.500%, 10/19/20252,4,6 |
| 1,754,327 | ||
| 5,514,119 | First Lien Term Loan, 10.170% (SOFR+525 basis points), 10/19/20252,3,4 |
| 5,441,383 | ||
| Web P.T., Inc. |
| ||||
| 696,429 | Revolver, 0.500%, 1/18/20282,4,6 |
| 682,009 | ||
| 616,071 | Revolver, 11.657% (LIBOR+675 basis points), 1/18/20282,3,4 |
| 603,316 | ||
| 9,000,000 | First Lien Term Loan, 11.741% (LIBOR+675 basis points), 1/18/20282,3,4 |
| 8,813,658 | ||
| Xeris Pharmaceuticals, Inc. |
| ||||
| 8,333,333 | Delayed Draw, 14.160% (SOFR+900 basis points), 3/8/20272,3,4,5 |
| 8,223,409 | ||
| 16,666,667 | First Lien Term Loan, 14.160% (SOFR+900 basis points), 3/8/20272,3,4,5 |
| 16,446,819 | ||
| Xifin, Inc. |
| ||||
| 1,284,995 | Revolver, 0.500%, 2/6/20262,4,6 |
| 1,239,079 | ||
| 856,663 | Revolver, 10.909% (LIBOR+575 basis points), 2/6/20262,3,4,5 |
| 826,053 | ||
| Zavation Medical Products, LLC |
| ||||
| 1,094,595 | Revolver, 0.500%, 6/30/20272,4,6 |
| 1,055,482 | ||
| 932,432 | Revolver, 9.659% (LIBOR+450 basis points), 6/30/20272,3,4 |
| 899,115 | ||
| 12,778,378 | First Lien Term Loan, 9.659% (LIBOR+450 basis points), 6/30/20272,3,4 |
| 12,321,779 | ||
|
| 1,825,570,362 | ||||
See accompanying Notes to Consolidated Financial Statements.
26
Cliffwater Corporate Lending Fund |
Consolidated Schedule of Investments As of March 31, 2023 (Continued) |
Principal | Value | |||||
SENIOR SECURED LOANS (Continued) | ||||||
| INDUSTRIALS — 19.4% |
| ||||
$ | 4,246,042 | 3SI Holdco, Inc. | $ | 4,136,860 | ||
| Accurus Aerospace Corporation |
| ||||
| 9,925,000 | First Lien Term Loan, 10.773% (LIBOR+575 basis points), 4/5/20282,3,4 |
| 9,585,273 | ||
| 14,829,609 | Aero Operating LLC |
| 14,002,578 | ||
| 7,275,000 | AG-Twin Brook Aerospace |
| 7,125,831 | ||
| Air Comm Corporation, LLC |
| ||||
| 571,216 | Revolver, 0.500%, 7/1/20272,4,6 |
| 556,527 | ||
| 1,136,951 | Revolver, 0.500%, 7/1/20272,4,6 |
| 1,107,715 | ||
| 13,685,575 | Delayed Draw, 10.230% (LIBOR+550 basis points), 7/1/20272,3,4 |
| 13,333,666 | ||
| 9,033,841 | Delayed Draw, 10.659% (LIBOR+550 basis points), 7/1/20272,3,4 |
| 8,801,547 | ||
| 1,867,809 | Revolver, 10.659% (LIBOR+550 basis points), 7/1/20272,3,4 |
| 1,819,780 | ||
| 13,213,415 | First Lien Term Loan, 10.659% (LIBOR+550 basis points), 7/1/20272,3,4 |
| 12,873,647 | ||
| 47,260 | Revolver, 10.659% (LIBOR+550 basis points), 7/1/20272,3,4 |
| 46,045 | ||
| Any Hour, LLC |
| ||||
| 2,000,000 | Revolver, 0.500%, 7/21/20272,4,6 |
| 1,943,563 | ||
| 6,600,000 | Delayed Draw, 10.405% (SOFR+563 basis points), 7/21/20272,3,4 |
| 6,413,758 | ||
| 11,163,333 | First Lien Term Loan, 10.405% (SOFR+563 basis points), 7/21/20272,3,4 |
| 10,848,322 | ||
| 6,604,267 | Delayed Draw, 10.405% (SOFR+563 basis points), 7/21/20272,3,4 |
| 6,417,905 | ||
| 9,961,417 | Delayed Draw, 10.405% (SOFR+563 basis points), 7/21/20272,3,4 |
| 9,680,321 | ||
| Apex Service Partners, LLC |
| ||||
| 1,000,000 | Revolver, 0.500%, 7/31/20252,4,6 |
| 981,800 | ||
| 1,000,000 | Revolver, 10.007% (LIBOR+525 basis points), 7/31/20252,3,4 |
| 981,800 | ||
| 4,986,400 | Delayed Draw, 10.046% (LIBOR+525 basis points), 7/31/20252,3,4 |
| 4,895,647 | ||
| 10,080,816 | Delayed Draw, 10.409% (LIBOR+525 basis points), 7/31/20252,3,4 |
| 9,897,344 | ||
| 6,715,000 | First Lien Term Loan, 10.460% (LIBOR+525 basis points), 7/31/20252,3,4 |
| 6,592,787 | ||
| 984,768 | First Lien Term Loan, 10.522% (LIBOR+525 basis points), 7/31/20252,3,4 |
| 966,845 | ||
| 2,464,694 | Delayed Draw, 10.747% (LIBOR+550 basis points), 7/31/20252,3,4 |
| 2,419,836 | ||
| 9,318,288 | First Lien Term Loan, 10.747% (LIBOR+550 basis points), 7/31/20252,3,4 |
| 9,148,695 | ||
| 9,417,281 | First Lien Term Loan, 12.500% PIK, 7/31/20252,4 |
| 9,057,195 | ||
| 3,796,836 | Aptean, Inc. |
| 3,652,860 | ||
| Armada Parent, Inc. |
| ||||
| 2,383,333 | Revolver, 0.500%, 10/29/20272,4,6 |
| 2,349,269 | ||
| 1,000,000 | Delayed Draw, 1.000%, 10/29/20272,4,6 |
| 985,707 | ||
| 16,667 | Revolver, 6.756% (LIBOR+575 basis points), 10/29/20272,3,4,5 |
| 16,428 | ||
| 995,000 | Delayed Draw, 10.657% (SOFR+575 basis points), 10/29/20272,3,4,5 |
| 980,779 | ||
| 19,750,000 | First Lien Term Loan, 10.657% (SOFR+575 basis points), 10/29/20272,3,4,5 |
| 19,467,715 | ||
| Arrowhead Holdco Company |
| ||||
| EUR 15,000,000 | First Lien Term Loan, 7.957% (EURIBOR+500 basis points), 8/31/20282,3,4,7 |
| 15,971,152 | ||
| 4,937,343 | First Lien Term Loan, 9.541% (SOFR+450 basis points), 8/31/20282,3,4,5 |
| 4,847,483 | ||
See accompanying Notes to Consolidated Financial Statements.
27
Cliffwater Corporate Lending Fund |
Consolidated Schedule of Investments As of March 31, 2023 (Continued) |
Principal | Value | |||||
SENIOR SECURED LOANS (Continued) | ||||||
| INDUSTRIALS (Continued) |
| ||||
| AWT Merger Sub, Inc. |
| ||||
$ | 928,571 | Revolver, 0.500%, 12/17/20262,4,6 | $ | 907,020 | ||
| 2,477,857 | Delayed Draw, 11.007% (LIBOR+600 basis points), 12/17/20262,3,4 |
| 2,420,348 | ||
| 142,857 | Revolver, 11.007% (LIBOR+600 basis points), 12/17/20262,3,4 |
| 139,542 | ||
| 6,300,000 | First Lien Term Loan, 11.007% (LIBOR+600 basis points), 12/17/20262,3,4 |
| 6,153,782 | ||
| 2,410,390 | Delayed Draw, 11.507% (LIBOR+600 basis points), 12/17/20262,3,4 |
| 2,354,446 | ||
| Beacon Mobility Corp. |
| ||||
| 807,969 | Revolver, 0.500%, 5/22/20242,4,6 |
| 786,788 | ||
| 192,031 | Revolver, 10.261% (LIBOR+610 basis points), 5/22/20242,3,4 |
| 186,997 | ||
| 4,898,953 | Delayed Draw, 10.834% (LIBOR+610 basis points), 5/22/20242,3,4 |
| 4,770,528 | ||
| 17,515,654 | Delayed Draw, 10.907% (LIBOR+610 basis points), 5/22/20242,3,4 |
| 17,056,486 | ||
| 2,226,096 | First Lien Term Loan, 10.907% (LIBOR+610 basis points), 5/22/20242,3,4 |
| 2,167,739 | ||
| Blackbird Purchaser, Inc. |
| ||||
| 6,406,542 | Delayed Draw, 1.000%, 4/8/20262,4,6 |
| 6,209,714 | ||
| 17,537,965 | First Lien Term Loan, 9.407% (LIBOR+450 basis points), 4/8/20262,3,4 |
| 16,911,295 | ||
| BlueHalo Global Holdings, LLC |
| ||||
| 529,412 | Revolver, 0.500%, 10/31/20252,4,6 |
| 517,125 | ||
| 17,165,013 | First Lien Term Loan, 10.730% (SOFR+600 basis points), 10/31/20252,3,4 |
| 16,766,626 | ||
| 756,303 | Revolver, 11.377% (SOFR+600 basis points), 10/31/20252,3,4 |
| 738,749 | ||
| 772,914 | First Lien Term Loan, 11.400% (SOFR+650 basis points), 10/31/20252,3,4 |
| 753,591 | ||
| 14,850,000 | BP Purchaser, LLC |
| 13,889,424 | ||
| BradyIFS Holdings LLC |
| ||||
| 2,256,157 | Delayed Draw, 1.000%, 11/22/20252,4,6 |
| 2,211,034 | ||
| 1,796,347 | First Lien Term Loan, 11.258% (SOFR+625 basis points), 11/22/20252,3,4 |
| 1,760,420 | ||
| British Engineering Services Holdco Limited |
| ||||
| GBP 950,968 | Revolver, 10.705% (LIBOR+703 basis points), 12/2/20272,3,4,7 |
| 1,130,658 | ||
| GBP 396,237 | First Lien Term Loan, 10.705% (LIBOR+703 basis points), 12/2/20272,3,4,7 |
| 471,108 | ||
| Caldwell & Gregory LLC |
| ||||
| 14,807,228 | First Lien Term Loan, 10.660% (SOFR+550 basis points), 12/5/20232,3,4 |
| 14,738,694 | ||
| 14,911,250 | Delayed Draw, 10.616% (SOFR+550 basis points), 12/5/20232,3,4 |
| 14,842,234 | ||
| 6,425,305 | Captive Resources Midco, LLC |
| 6,313,808 | ||
| CC WDW Borrower, Inc. |
| ||||
| 1,631,196 | Delayed Draw, 1.000%, 1/27/20282,4,6 |
| 1,607,799 | ||
| 3,246,079 | First Lien Term Loan, 11.576% (SOFR+675 basis points), 1/27/20282,3,4 |
| 3,154,754 | ||
| 11,492,868 | CGI Parent, LLC |
| 11,306,725 | ||
| Citrin Cooperman Advisors, LLC |
| ||||
| 14,472,727 | Delayed Draw, 1.000%, 10/1/20272,4,6 |
| 14,067,230 | ||
| 448,163 | Delayed Draw, 1.000%, 10/1/20272,4,5,6 |
| 440,403 | ||
See accompanying Notes to Consolidated Financial Statements.
28
Cliffwater Corporate Lending Fund |
Consolidated Schedule of Investments As of March 31, 2023 (Continued) |
Principal | Value | |||||
SENIOR SECURED LOANS (Continued) | ||||||
| INDUSTRIALS (Continued) |
| ||||
$ | 1,137,931 | Delayed Draw, 1.000%, 10/1/20272,4,6 | $ | 1,118,227 | ||
| 25,350,000 | Delayed Draw, 9.534% (SOFR+500 basis points), 10/1/20272,3,4 |
| 24,639,742 | ||
| 2,620,588 | Delayed Draw, 10.504% (SOFR+575 basis points), 10/1/20272,3,4 |
| 2,547,164 | ||
| 6,114,706 | First Lien Term Loan, 9.959% (SOFR+575 basis points), 10/1/20272,3,4 |
| 5,943,384 | ||
| 3,862,069 | First Lien Term Loan, 10.932% (SOFR+500 basis points), 10/1/20272,3,4 |
| 3,737,400 | ||
| 1,521,038 | First Lien Term Loan, 11.030% (SOFR+635 basis points), 10/1/20272,3,4 |
| 1,471,938 | ||
| Cobham Holdings, Inc. |
| ||||
| 2,343,750 | Revolver, 0.500%, 1/9/20282,4,6 |
| 2,273,727 | ||
| 24,751,361 | First Lien Term Loan, 11.648% (SOFR+675 basis points), 1/9/20302,3,4 |
| 23,986,661 | ||
| Colonial Bag, LLC |
| ||||
| 4,426,168 | First Lien Term Loan, 9.500% (LIBOR+450 basis points), 9/3/20252,3,4 |
| 4,378,869 | ||
| 9,825,000 | Incremental Term Loan, 10.138% (LIBOR+500 basis points), 9/3/20252,3,4 |
| 9,796,528 | ||
| Comar Holding Company, LLC |
| ||||
| 4,884,481 | First Lien Term Loan, 10.701% (SOFR+575 basis points), 6/18/20242,3,4 |
| 4,795,583 | ||
| 766,294 | Delayed Draw, 11.201% (SOFR+625 basis points), 6/18/20242,3,4 |
| 758,105 | ||
| Continental Acquisition Holdings, Inc. |
| ||||
| 2,645,256 | Delayed Draw, 11.398% (LIBOR+650 basis points), 1/20/20272,3,4 |
| 2,426,180 | ||
| 7,175,000 | First Lien Term Loan, 11.548% (LIBOR+650 basis points), 1/20/20272,3,4 |
| 6,580,777 | ||
| Coretrust Purchasing Group LLC |
| ||||
| 250,000 | Revolver, 0.500%, 9/30/20292,4,6 |
| 242,500 | ||
| 2,819,549 | Revolver, 0.500%, 9/30/20292,4,6 |
| 2,743,099 | ||
| 596,443 | Delayed Draw, 1.000%, 9/30/20292,4,6 |
| 587,496 | ||
| 2,819,549 | Delayed Draw, 1.000%, 9/30/20292,4,6 |
| 2,785,518 | ||
| 23,397,837 | First Lien Term Loan, 11.557% (SOFR+675 basis points), 9/30/20292,3,4 |
| 22,751,634 | ||
| EUR 900,000 | CVL 3 |
| 949,469 | ||
| Dispatch Acquisition Holdings, LLC |
| ||||
| 21,670,000 | First Lien Term Loan, 9.298% (LIBOR+425 basis points), 3/25/20282,3,4 |
| 21,038,968 | ||
| 2,736,250 | First Lien Term Loan, 9.673% (SOFR+463 basis points), 3/25/20282,3,4 |
| 2,587,764 | ||
| DTI Holdco, Inc. |
| ||||
| 102,309 | Revolver, 0.500%, 4/26/20272,4,6 |
| 94,687 | ||
| 779,664 | Revolver, 9.426% (PRIME+475 basis points), 4/26/20272,3,4,5 |
| 721,576 | ||
| Dwyer Instruments, Inc. |
| ||||
| 1,620,617 | Revolver, 0.500%, 7/21/20272,4,6 |
| 1,587,063 | ||
| 618,196 | Revolver, 0.500%, 7/21/20272,4,6 |
| 605,397 | ||
| 1,912,917 | Delayed Draw, 1.000%, 7/21/20272,4,5,6 |
| 1,887,684 | ||
| 300,114 | Revolver, 11.159% (LIBOR+600 basis points), 7/21/20272,3,4,5 |
| 293,901 | ||
| 338,262 | Revolver, 11.159% (LIBOR+600 basis points), 7/21/20272,3,4,5 |
| 331,259 | ||
| Easy Ice, LLC |
| ||||
| 4,322,257 | Delayed Draw, 1.000%, 12/31/20252,4,6 |
| 4,265,243 | ||
| 10,254,446 | First Lien Term Loan, 9.657% (LIBOR+475 basis points), 12/31/20252,3,4 |
| 10,119,181 | ||
| 2,902,105 | Delayed Draw, 9.657% (LIBOR+475 basis points), 12/31/20252,3,4 |
| 2,863,824 | ||
| 796,294 | First Lien Term Loan, 9.657% (LIBOR+475 basis points), 12/31/20252,3,4 |
| 785,790 | ||
See accompanying Notes to Consolidated Financial Statements.
29
Cliffwater Corporate Lending Fund |
Consolidated Schedule of Investments As of March 31, 2023 (Continued) |
Principal | Value | |||||
SENIOR SECURED LOANS (Continued) | ||||||
| INDUSTRIALS (Continued) |
| ||||
$ | 8,000,000 | Echo Global Logistics, Inc. | $ | 7,555,581 | ||
| 4,071,718 | EShipping LLC |
| 4,068,038 | ||
| Explorer Investor, Inc. |
| ||||
| 5,232,558 | Delayed Draw, 1.000%, 6/28/20292,4,6 |
| 4,903,165 | ||
| 24,581,686 | First Lien Term Loan, 10.641% (SOFR+575 basis points), 6/28/20292,3,4 |
| 23,034,252 | ||
| 14,200,000 | Florida Marine, LLC. |
| 13,815,812 | ||
| FLS Holding, Inc. |
| ||||
| 2,000,000 | Revolver, 0.500%, 12/17/20272,4,6 |
| 1,971,014 | ||
| 4,987,500 | Delayed Draw, 10.400% (LIBOR+525 basis points), 12/17/20282,3,4 |
| 4,915,215 | ||
| 22,942,500 | First Lien Term Loan, 10.402% (LIBOR+525 basis points), 12/17/20282,3,4 |
| 22,609,988 | ||
| Fortis Solutions Group, LLC |
| ||||
| 1,559,220 | Revolver, 0.500%, 10/15/20272,4,6 |
| 1,491,947 | ||
| 239,880 | Revolver, 10.340% (LIBOR+550 basis points), 10/15/20272,3,4 |
| 229,530 | ||
| 9,940,000 | Delayed Draw, 1.000%, 10/15/20282,4,6 |
| 9,843,737 | ||
| 50,975 | Delayed Draw, 10.340% (LIBOR+550 basis points), 10/15/20282,3,4 |
| 48,944 | ||
| 17,941,567 | First Lien Term Loan, 10.340% (LIBOR+550 basis points), 10/15/20282,3,4 |
| 17,088,376 | ||
| 60,000 | Delayed Draw, 10.340% (LIBOR+550 basis points), 10/15/20282,3,4 |
| 59,419 | ||
| Gerson Lehrman Group, Inc. |
| ||||
| 64,166,659 | First Lien Term Loan, 10.298% (SOFR+525 basis points), 12/5/20242,3,4 |
| 63,820,309 | ||
| Graffiti Buyer, Inc. |
| ||||
| 959,550 | Revolver, 0.500%, 8/10/20272,4,6 |
| 927,666 | ||
| 3,755,737 | Delayed Draw, 1.000%, 8/10/20272,4,6 |
| 3,630,942 | ||
| 1,286,441 | Delayed Draw, 10.659% (LIBOR+550 basis points), 8/10/20272,3,4 |
| 1,243,695 | ||
| 1,562,772 | Revolver, 10.659% (LIBOR+550 basis points), 8/10/20272,3,4 |
| 1,510,844 | ||
| 11,125,539 | First Lien Term Loan, 10.659% (LIBOR+550 basis points), 8/10/20272,3,4 |
| 10,755,864 | ||
| Groundworks, LLC |
| ||||
| 837,696 | Revolver, 0.500%, 3/14/20292,4,6 |
| 813,441 | ||
| 2,617,801 | Delayed Draw, 1.000%, 3/14/20302,4,6 |
| 2,577,722 | ||
| 14,345,550 | First Lien Term Loan, 11.360% (SOFR+650 basis points), 3/14/20302,3,4 |
| 13,910,799 | ||
| 27,586,299 | Guidehouse, Inc. |
| 27,107,096 | ||
| 19,950,000 | Highground Restoration Group, Inc. |
| 19,512,136 | ||
| HPS Industrials |
| ||||
| 9,740,441 | First Lien Term Loan, 10.909% (LIBOR+575 basis points), 7/25/20252,3,4,5 |
| 9,703,880 | ||
| 18,065,264 | First Lien Term Loan, 11.870% (LIBOR+700 basis points), 10/15/20262,3,4,5 |
| 18,012,912 | ||
| HSI Halo Acquisition, Inc. |
| ||||
| 175,000 | Revolver, 0.500%, 9/2/20252,4,6 |
| 171,815 | ||
| 875,000 | Revolver, 10.609% (LIBOR+575 basis points), 9/2/20252,3,4,5 |
| 859,075 | ||
See accompanying Notes to Consolidated Financial Statements.
30
Cliffwater Corporate Lending Fund |
Consolidated Schedule of Investments As of March 31, 2023 (Continued) |
Principal | Value | |||||
SENIOR SECURED LOANS (Continued) | ||||||
| INDUSTRIALS (Continued) |
| ||||
| iCIMS, Inc. |
| ||||
$ | 184,671 | Revolver, 0.500%, 9/12/20242,4,6 | $ | 181,541 | ||
| 1,904,761 | Revolver, 0.500%, 8/18/20282,4,6 |
| 1,872,480 | ||
| 20,000,000 | First Lien Term Loan, 12.054% PIK (SOFR+675 basis points), 8/18/20282,3,4,8 |
| 19,661,045 | ||
| 10,000,000 | First Lien Term Loan, 12.054% (SOFR+725 basis points), 8/18/20282,3,4 |
| 9,843,045 | ||
| 14,925,000 | ID Images Acquisition |
| 14,642,594 | ||
| 19,900,000 | Infogain Corporation |
| 19,487,621 | ||
| 14,772,722 | Intergulf Corp. |
| 14,717,861 | ||
| Isaac Heating & Air Conditioning |
| ||||
| 2,368,421 | Revolver, 0.500%, 5/7/20272,4,6 |
| 2,307,520 | ||
| 947,368 | Delayed Draw, 1.000%, 5/7/20272,4,6 |
| 923,008 | ||
| 3,754,737 | Delayed Draw, 10.052% (LIBOR+500 basis points), 5/7/20272,3,4 |
| 3,658,188 | ||
| 7,776,316 | First Lien Term Loan, 10.384% (LIBOR+500 basis points), 5/7/20272,3,4 |
| 7,576,357 | ||
| Jade Bidco Limited |
| ||||
| EUR 538,430 | First Lien Term Loan, 7.905% (EURIBOR+600 basis points), 12/3/20262,3,4,7 |
| 577,384 | ||
| 3,375,128 | First Lien Term Loan, 9.300% (SOFR+600 basis points), 12/3/20262,3,4 |
| 3,337,370 | ||
| 20,000,000 | First Lien Term Loan, 9.300% (SOFR+625 basis points), 12/3/20262,3,4 |
| 19,776,256 | ||
| Komline-Sanderson Group, Inc. |
| ||||
| 2,343,750 | Revolver, 0.500%, 3/17/20262,4,6 |
| 2,208,345 | ||
| 4,687,500 | Delayed Draw, 1.000%, 3/17/20262,4,6 |
| 4,416,691 | ||
| 8,481,916 | First Lien Term Loan, 10.688% (LIBOR+600 basis points), 3/17/20262,3,4 |
| 7,991,893 | ||
| 1,882,536 | First Lien Term Loan, 11.143% (LIBOR+600 basis points), 3/17/20262,3,4 |
| 1,773,777 | ||
| 9,237,812 | Delayed Draw, 11.188% (LIBOR+600 basis points), 3/17/20262,3,4 |
| 8,704,119 | ||
| KPSKY Acquisition, Inc. |
| ||||
| 3,812,500 | Delayed Draw, 1.000%, 10/19/20282,4,6 |
| 3,801,452 | ||
| 13,016,326 | First Lien Term Loan, 10.407% (LIBOR+550 basis points), 10/19/20282,3,4 |
| 12,492,543 | ||
| 1,496,995 | Delayed Draw, 10.484% (LIBOR+550 basis points), 10/19/20282,3,4 |
| 1,492,657 | ||
| 1,184,375 | Delayed Draw, 10.484% (LIBOR+550 basis points), 10/19/20282,3,4 |
| 1,180,943 | ||
| Lav Gear Holdings, Inc. |
| ||||
| 3,508,728 | Delayed Draw, 1.000%, 10/31/20242,4,6 |
| 3,403,466 | ||
| 234,451 | First Lien Term Loan, 10.548% PIK (SOFR+550 basis points), 10/31/20242,3,4,8 |
| 233,707 | ||
| 15,000,000 | Delayed Draw, 11.056% (SOFR+625 basis points), 10/31/20242,3,4 |
| 14,541,543 | ||
| 5,344,181 | First Lien Term Loan, 11.078% PIK (SOFR+603 basis points), 10/31/20242,3,4,8 |
| 5,327,227 | ||
| 3,491,272 | Delayed Draw, 11.291% (SOFR+625 basis points), 3/31/20242,3,4 |
| 3,386,534 | ||
| 18,222,500 | Lereta, LLC |
| 16,929,142 | ||
See accompanying Notes to Consolidated Financial Statements.
31
Cliffwater Corporate Lending Fund |
Consolidated Schedule of Investments As of March 31, 2023 (Continued) |
Principal | Value | |||||
SENIOR SECURED LOANS (Continued) | ||||||
| INDUSTRIALS (Continued) |
| ||||
| Liberty Purchaser, LLC |
| ||||
$ | 665,915 | Revolver, 0.500%, 11/22/20282,4,6 | $ | 645,938 | ||
| 48,430 | Delayed Draw, 1.000%, 11/22/20292,4,6 |
| 46,977 | ||
| 5,709,515 | First Lien Term Loan, 11.411% (SOFR+650 basis points), 11/22/20292,3,4 |
| 5,538,230 | ||
| 1,549,768 | Delayed Draw, 11.720% (SOFR+650 basis points), 11/22/20292,3,4 |
| 1,503,275 | ||
| Lithium Technologies, LLC |
| ||||
| 367,018 | Revolver, 0.500%, 1/3/20242,4,6 |
| 357,580 | ||
| 244,678 | Revolver, 12.670% (LIBOR+800 basis points), 1/3/20242,3,4 |
| 238,387 | ||
| 8,792,149 | First Lien Term Loan, 12.670% (LIBOR+800 basis points), 1/3/20242,3,4 |
| 8,566,069 | ||
| LJ Avalon Holdings, LLC |
| ||||
| 1,810,345 | Revolver, 0.500%, 2/1/20292,4,6 |
| 1,752,469 | ||
| 1,034,483 | Revolver, 0.500%, 2/1/20292,4,6 |
| 1,001,411 | ||
| 4,525,862 | Delayed Draw, 1.000%, 2/1/20302,4,6 |
| 4,448,923 | ||
| 2,586,207 | Delayed Draw, 1.000%, 2/1/20302,4,6 |
| 2,542,242 | ||
| 17,543,103 | First Lien Term Loan, 11.332% (SOFR+650 basis points), 2/1/20302,3,4 |
| 16,982,260 | ||
| 4,961,929 | Lynx Franchising, LLC |
| 4,871,622 | ||
| Majco LLC |
| ||||
| 1,266,667 | Revolver, 0.500%, 12/23/20272,4,6 |
| 1,230,923 | ||
| 400,000 | Revolver, 9.230% (SOFR+450 basis points), 12/23/20272,3,4 |
| 388,713 | ||
| 3,250,000 | Delayed Draw, 1.000%, 12/23/20282,4,6 |
| 3,166,430 | ||
| 6,058,708 | Delayed Draw, 9.240% (SOFR+450 basis points), 12/23/20282,3,4 |
| 5,902,916 | ||
| 8,932,500 | First Lien Term Loan, 9.243% (SOFR+450 basis points), 12/23/20282,3,4 |
| 8,680,439 | ||
| Management Consulting & Research, LLC |
| ||||
| 627,240 | Revolver, 11.103% (SOFR+600 basis points), 8/16/20272,3,4 |
| 616,516 | ||
| 1,553,484 | Delayed Draw, 10.691% (SOFR+575 basis points), 10/29/20272,3,4 |
| 1,526,922 | ||
| Marcone Yellowstone Buyer, Inc. |
| ||||
| 6,984,584 | Delayed Draw, 10.931% (LIBOR+550 basis points), 6/23/20282,3,4 |
| 6,822,477 | ||
| 21,695,076 | First Lien Term Loan, 11.291% (LIBOR+625 basis points), 6/23/20282,3,4 |
| 21,191,550 | ||
| Motion & Control Enterprises LLC |
| ||||
| 1,283,821 | Revolver, 0.500%, 6/1/20282,4,6 |
| 1,242,379 | ||
| 1,644,122 | Delayed Draw, 1.000%, 6/1/20282,4,5,6 |
| 1,615,653 | ||
| 126,744 | Revolver, 9.692% (SOFR+475 basis points), 6/1/20282,3,4,5 |
| 122,653 | ||
| 1,804,013 | First Lien Term Loan, 10.577% (SOFR+550 basis points), 6/1/20282,3,4,5 |
| 1,745,778 | ||
| Northstar Recycling, Inc. |
| ||||
| 2,000,000 | Revolver, 0.500%, 10/1/20272,4,6 |
| 1,963,600 | ||
| 11,220,250 | First Lien Term Loan, 9.748% (LIBOR+485 basis points), 10/1/20272,3,4 |
| 11,016,041 | ||
| Omni Intermediate Holdings, LLC |
| ||||
| 2,253,521 | Revolver, 0.500%, 12/30/20252,4,6 |
| 2,210,249 | ||
| 3,626,656 | Delayed Draw, 1.000%, 12/30/20262,4,5,6 |
| 3,557,018 | ||
| 906,664 | Delayed Draw, 9.967% (SOFR+500 basis points), 12/30/20262,3,4,5 |
| 889,254 | ||
| 27,424,605 | First Lien Term Loan, 10.048% (SOFR+500 basis points), 12/30/20262,3,4 |
| 26,898,001 | ||
See accompanying Notes to Consolidated Financial Statements.
32
Cliffwater Corporate Lending Fund |
Consolidated Schedule of Investments As of March 31, 2023 (Continued) |
Principal | Value | |||||
SENIOR SECURED LOANS (Continued) | ||||||
| INDUSTRIALS (Continued) |
| ||||
$ | 11,391,273 | First Lien Term Loan, 10.048% (SOFR+500 basis points), 12/30/20262,3,4,5 | $ | 11,172,539 | ||
| 10,074,046 | Delayed Draw, 10.048% (SOFR+500 basis points), 12/30/20262,3,4,5 |
| 9,880,605 | ||
| 6,964,736 | Omni Logistics, LLC |
| 6,830,999 | ||
| 34,825,000 | P20 Parent, Inc |
| 34,220,606 | ||
| 15,900,000 | Panda Acquisition LLC |
| 13,019,562 | ||
| 8,500,000 | PaperWorks Industries, Inc. |
| 8,407,562 | ||
| PCX Holding Corp. |
| ||||
| 437,500 | Revolver, 0.500%, 4/22/20272,4,6 |
| 423,971 | ||
| 3,081,602 | Delayed Draw, 11.409% (LIBOR+625 basis points), 4/22/20272,3,4 |
| 2,986,308 | ||
| 187,500 | Revolver, 11.409% (LIBOR+625 basis points), 4/22/20272,3,4 |
| 181,702 | ||
| 6,140,625 | First Lien Term Loan, 11.409% (LIBOR+625 basis points), 4/22/20272,3,4 |
| 5,950,736 | ||
| 3,101,914 | Delayed Draw, 11.409% (LIBOR+625 basis points), 4/22/20272,3,4 |
| 3,005,992 | ||
| Pele Buyer LLC |
| ||||
| 9,865,427 | First Lien Term Loan, 9.953% (LIBOR+575 basis points), 6/18/20242,3,4 |
| 9,685,875 | ||
| Planet US Buyer LLC |
| ||||
| 814,815 | Revolver, 0.500%, 2/1/20282,4,6 |
| 788,766 | ||
| 10,185,185 | First Lien Term Loan, 11.432% (SOFR+675 basis points), 2/1/20302,3,4 |
| 9,859,571 | ||
| Polyphase Elevator Holding Company |
| ||||
| 17,619,000 | Delayed Draw, 1.000%, 6/23/20272,4,6 |
| 17,033,563 | ||
| 3,363,675 | Delayed Draw, 10.498% (LIBOR+550 basis points), 6/23/20272,3,4 |
| 3,251,908 | ||
| 9,849,624 | First Lien Term Loan, 10.498% (LIBOR+550 basis points), 6/23/20272,3,4 |
| 9,398,998 | ||
| Potter Electric Signal Company, LLC |
| ||||
| 586,584 | Revolver, 0.500%, 12/19/20252,4,5,6 |
| 574,439 | ||
| 2,647,890 | Delayed Draw, 1.000%, 12/19/20252,4,5,6 |
| 2,593,067 | ||
| 51,007 | Revolver, 11.250% (LIBOR+550 basis points), 12/19/20252,3,4,5 |
| 49,951 | ||
| 5,000,000 | Pregis TopCo LLC |
| 4,971,028 | ||
| 13,824,425 | Prime Buyer, LLC |
| 13,377,538 | ||
| PrimeFlight Aviation Services, Inc. |
| ||||
| 6,009,797 | First Lien Term Loan, 10.254% (SOFR+550 basis points), 5/9/20242,3,4 |
| 5,840,210 | ||
| 24,687,500 | First Lien Term Loan, 10.304% (SOFR+550 basis points), 5/9/20242,3,4 |
| 23,990,858 | ||
| PT Intermediate Holdings III, LLC |
| ||||
| 1,667,000 | Delayed Draw, 1.000%, 11/1/20282,4,6 |
| 1,651,482 | ||
| 9,268,850 | Delayed Draw, 11.019% (SOFR+597 basis points), 11/1/20282,3,4 |
| 8,904,225 | ||
| 12,936,250 | Delayed Draw, 11.019% (SOFR+597 basis points), 11/1/20282,3,4 |
| 12,527,145 | ||
| 24,139,875 | First Lien Term Loan, 11.019% (SOFR+597 basis points), 11/1/20282,3,4 |
| 23,285,813 | ||
| 3,333,000 | First Lien Term Loan, 11.394% (SOFR+650 basis points), 11/1/20282,3,4 |
| 3,277,022 | ||
See accompanying Notes to Consolidated Financial Statements.
33
Cliffwater Corporate Lending Fund |
Consolidated Schedule of Investments As of March 31, 2023 (Continued) |
Principal | Value | |||||
SENIOR SECURED LOANS (Continued) | ||||||
| INDUSTRIALS (Continued) |
| ||||
| R1 Holdings LLC |
| ||||
$ | 2,097,285 | Revolver, 0.500%, 12/29/20282,4,6 | $ | 2,038,103 | ||
| 2,433,183 | Delayed Draw, 1.000%, 12/29/20282,4,6 |
| 2,401,087 | ||
| 1,074,108 | Delayed Draw, 11.115% (SOFR+625 basis points), 12/29/20282,3,4 |
| 1,059,939 | ||
| 617,647 | Revolver, 11.115% (SOFR+625 basis points), 12/29/20282,3,4 |
| 600,218 | ||
| 13,743,333 | First Lien Term Loan, 11.115% (SOFR+625 basis points), 12/29/20282,3,4 |
| 13,355,518 | ||
| Radwell Parent, LLC |
| ||||
| 2,531,793 | Revolver, 0.500%, 4/1/20282,4,6 |
| 2,433,717 | ||
| 1,744,152 | Revolver, 0.500%, 4/1/20282,4,6 |
| 1,691,827 | ||
| 389,507 | Revolver, 11.557% (SOFR+675 basis points), 4/1/20282,3,4 |
| 374,418 | ||
| 7,303,400 | Delayed Draw, 1.000%, 4/1/20292,4,6 |
| 6,996,338 | ||
| 54,364,485 | First Lien Term Loan, 11.523% (SOFR+652 basis points), 4/1/20292,3,4 |
| 52,078,797 | ||
| 31,865,945 | First Lien Term Loan, 11.648% (SOFR+675 basis points), 4/1/20292,3,4 |
| 30,909,967 | ||
| RCS Industrials |
| ||||
| 285,714 | Revolver, 0.500%, 1/31/20252,4,5,6 |
| 281,945 | ||
| 1,357,609 | First Lien Term Loan, 9.730% (LIBOR+500 basis points), 1/31/20252,3,4,5 |
| 1,339,701 | ||
| GBP 13,639,922 | Rocket Bidco Limited |
| 16,418,061 | ||
| RQM Buyer, Inc. |
| ||||
| 4,687,500 | Delayed Draw, 1.000%, 8/12/20262,4,6 |
| 4,664,110 | ||
| 27,684,179 | First Lien Term Loan, 10.970% (SOFR+575 basis points), 8/12/20262,3,4 |
| 27,545,095 | ||
| 4,664,063 | Delayed Draw, 10.970% (SOFR+575 basis points), 8/12/20262,3,4 |
| 4,640,789 | ||
| S4T Holdings Corp. |
| ||||
| 4,545,455 | Delayed Draw, 7.000%, 12/27/20262,4,6 |
| 4,462,727 | ||
| 15,261,364 | First Lien Term Loan, 10.925% (SOFR+600 basis points), 12/27/20262,3,4 |
| 14,983,606 | ||
| 9,978,182 | Safety Products Holdings, LLC |
| |||
| First Lien Term Loan, 11.210% (LIBOR+600 basis points), 12/15/20262,3,4 |
| 9,726,603 | |||
| 1,199,613 | SEI Holding I Corporation |
| |||
| Revolver, 0.500%, 3/24/20282,4,6 |
| 1,164,853 | |||
| 1,967,746 | Delayed Draw, 1.000%, 3/24/20282,4,6 |
| 1,940,277 | ||
| 364,812 | Delayed Draw, 11.648% (SOFR+675 basis points), 3/24/20282,3,4 |
| 359,719 | ||
| 16,227,906 | First Lien Term Loan, 11.648% (SOFR+675 basis points), 3/24/20282,3,4 |
| 15,757,694 | ||
| 239,923 | Revolver, 13.750% (SOFR+575 basis points), 3/24/20282,3,4 |
| 232,971 | ||
| Seacor Holdings, Inc. |
| ||||
| 14,324,366 | First Lien Term Loan, 11.374% (LIBOR+700 basis points), 10/15/20262,3,4 |
| 14,061,834 | ||
| Seko Global Logistics Network, LLC |
| ||||
| 52,582 | Revolver, 0.500%, 12/30/20262,4,6 |
| 51,625 | ||
| 12,134 | Revolver, 11.500% (LIBOR+500 basis points), 12/30/20262,3,4 |
| 11,914 | ||
| Seko Worldwide, LLC |
| ||||
| EUR 10,490,715 | First Lien Term Loan, 7.765% (LIBOR+475 basis points), 12/30/20262,3,4,7 |
| 11,169,920 | ||
| 9,923,858 | First Lien Term Loan, 9.909% (LIBOR+475 basis points), 12/30/20262,3,4 |
| 9,743,243 | ||
See accompanying Notes to Consolidated Financial Statements.
34
Cliffwater Corporate Lending Fund |
Consolidated Schedule of Investments As of March 31, 2023 (Continued) |
Principal | Value | |||||
SENIOR SECURED LOANS (Continued) | ||||||
| INDUSTRIALS (Continued) |
| ||||
$ | 7,128,320 | Sequa Corporation | $ | 6,765,019 | ||
| Sonny’s Enterprises, LLC |
| ||||
| 640,244 | Revolver, 0.500%, 8/5/20252,4,6 |
| 638,389 | ||
| 896,341 | Delayed Draw, 11.576% (LIBOR+675 basis points), 8/5/20262,3,4 |
| 893,744 | ||
| 5,811,360 | First Lien Term Loan, 11.576% (LIBOR+675 basis points), 8/5/20262,3,4 |
| 5,794,519 | ||
| Spartronics LLC |
| ||||
| 1,920,230 | Revolver, 0.500%, 12/31/20252,4,6 |
| 1,882,396 | ||
| 2,087,121 | Revolver, 10.100% (LIBOR+525 basis points), 12/31/20252,3,4 |
| 2,045,999 | ||
| 11,654,855 | First Lien Term Loan, 10.160% (LIBOR+525 basis points), 12/31/20252,3,4 |
| 11,449,741 | ||
| Speedstar Holding LLC |
| ||||
| 1,448,276 | Delayed Draw, 0.500%, 1/22/20272,4,6 |
| 1,400,904 | ||
| 10,215,993 | First Lien Term Loan, 12.291% (SOFR+725 basis points), 1/22/20272,3,4 |
| 9,881,836 | ||
| 9,900,000 | Standard Elevator Systems |
| 9,422,274 | ||
| 3,777,039 | Stats Intermediate Holdings, LLC |
| 3,560,100 | ||
| System Planning and Analysis, Inc. |
| ||||
| 1,568,100 | Revolver, 0.500%, 8/16/20272,4,6 |
| 1,541,289 | ||
| 15,113,351 | First Lien Term Loan, 10.691% (SOFR+575 basis points), 8/16/20272,3,4 |
| 14,854,943 | ||
| 3,643,011 | Delayed Draw, 1.000%, 10/29/20272,4,6 |
| 3,580,722 | ||
| Tank Holding Corp. |
| ||||
| 1,275,964 | Revolver, 0.500%, 3/31/20282,4,6 |
| 1,227,176 | ||
| 504,451 | Revolver, 10.657% (SOFR+585 basis points), 3/31/20282,3,4 |
| 485,162 | ||
| 47,978,487 | First Lien Term Loan, 10.657% (SOFR+585 basis points), 3/31/20282,3,4 |
| 46,143,943 | ||
| 14,925,000 | First Lien Term Loan, 10.657% (SOFR+575 basis points), 3/31/20282,3,4 |
| 14,354,316 | ||
| 9,685,535 | Texas Hydraulics, Inc. |
| 9,606,291 | ||
| The Arcticom Group, LLC |
| ||||
| 4,057,143 | Revolver, 0.500%, 12/22/20272,4,6 |
| 3,935,531 | ||
| 15,000,000 | Delayed Draw, 11.933% (SOFR+675 basis points), 12/22/20272,3,4 |
| 14,550,378 | ||
| 11,000,000 | Delayed Draw, 11.933% (SOFR+675 basis points), 12/22/20272,3,4 |
| 10,670,277 | ||
| 5,942,857 | Revolver, 11.940% (SOFR+600 basis points), 12/22/20272,3,4 |
| 5,764,721 | ||
| The Vertex Companies, Inc. |
| ||||
| 965,217 | Revolver, 0.500%, 8/31/20262,4,6 |
| 933,013 | ||
| 339,130 | Revolver, 10.157% (SOFR+525 basis points), 8/31/20262,3,4 |
| 327,815 | ||
| 820,565 | Delayed Draw, 1.000%, 8/31/20272,4,6 |
| 793,187 | ||
| 3,082,625 | Delayed Draw, 9.959% (SOFR+525 basis points), 8/31/20272,3,4 |
| 2,979,772 | ||
| 9,660,326 | First Lien Term Loan, 10.157% (SOFR+525 basis points), 8/31/20272,3,4 |
| 9,338,008 | ||
See accompanying Notes to Consolidated Financial Statements.
35
Cliffwater Corporate Lending Fund |
Consolidated Schedule of Investments As of March 31, 2023 (Continued) |
Principal | Value | |||||
SENIOR SECURED LOANS (Continued) | ||||||
| INDUSTRIALS (Continued) |
| ||||
| Time Manufacturing Acquisition, LLC |
| ||||
$ | 1,342,466 | Revolver, 0.500%, 2/3/20232,4,6 | $ | 1,263,253 | ||
| EUR 11,621,898 | First Lien Term Loan, 9.198% (EURIBOR+650 basis points), 12/1/20272,3,4,7 |
| 11,796,927 | ||
| 1,671,233 | Revolver, 11.453% (LIBOR+650 basis points), 12/1/20272,3,4 |
| 1,572,621 | ||
| 18,044,913 | First Lien Term Loan, 11.453% (LIBOR+650 basis points), 12/1/20272,3,4 |
| 16,980,165 | ||
| 23,403,846 | Tinicum Voltage Acquisition Corp. |
| 22,684,809 | ||
| Titan Group Holdco, LLC |
| ||||
| 1,450,000 | Revolver, 0.500%, 8/12/20272,4,6 |
| 1,398,188 | ||
| 3,236,317 | Delayed Draw, 1.000%, 8/12/20272,4,6 |
| 3,120,676 | ||
| 1,050,000 | Revolver, 8.500% (LIBOR+450 basis points), 8/12/20272,3,4 |
| 1,012,481 | ||
| 2,494,553 | Delayed Draw, 9.700% (LIBOR+450 basis points), 8/12/20272,3,4 |
| 2,405,417 | ||
| 513,683 | Delayed Draw, 9.510% (LIBOR+450 basis points), 8/12/20272,3,4 |
| 495,328 | ||
| 2,493,750 | Delayed Draw, 9.798% (LIBOR+450 basis points), 8/12/20272,3,4 |
| 2,404,643 | ||
| 8,640,625 | First Lien Term Loan, 9.798% (LIBOR+450 basis points), 8/12/20272,3,4 |
| 8,331,877 | ||
| TMC Buyer, Inc. |
| ||||
| 253,834 | Delayed Draw, 1.000%, 6/30/20282,4,6 |
| 220,835 | ||
| 3,671,387 | First Lien Term Loan, 10.865% (SOFR+600 basis points), 6/30/20282,3,4 |
| 3,194,107 | ||
| Trident Maritime Systems, Inc. |
| ||||
| 222,222 | Revolver, 0.500%, 2/26/20272,4,6 |
| 220,404 | ||
| 111,111 | Revolver, 1.000%, 2/26/20272,4,6 |
| 110,202 | ||
| 1,333,333 | Revolver, 9.459% (LIBOR+475 basis points), 2/26/20272,3,4 |
| 1,322,424 | ||
| 16,353,670 | First Lien Term Loan, 9.909% (LIBOR+475 basis points), 2/26/20272,3,4 |
| 16,219,870 | ||
| USRP Holdings, Inc. |
| ||||
| 645,161 | Revolver, 0.500%, 7/23/20272,4,6 |
| 623,724 | ||
| 3,145,613 | Revolver, 0.500%, 7/23/20272,4,5,6 |
| 3,041,091 | ||
| 2,193,178 | Delayed Draw, 1.000%, 7/23/20272,4,6 |
| 2,120,304 | ||
| 4,699,666 | Delayed Draw, 10.201% (LIBOR+550 basis points), 7/23/20272,3,4 |
| 4,543,508 | ||
| 16,359,017 | First Lien Term Loan, 10.548% (LIBOR+550 basis points), 7/23/20272,3,4 |
| 15,815,446 | ||
| EUR 1,300,000 | Utac Ceram |
| 1,386,991 | ||
| 18,977,220 | Valcourt Holdings II, LLC |
| 18,821,955 | ||
| VRC Companies, LLC |
| ||||
| 625,000 | Revolver, 0.500%, 6/29/20272,4,6 |
| 617,166 | ||
| 582,027 | Delayed Draw, 1.000%, 6/29/20272,4,6 |
| 574,732 | ||
| 4,302,014 | First Lien Term Loan, 10.574% (SOFR+575 basis points), 6/29/20272,3,4 |
| 4,248,089 | ||
| 21,520,313 | First Lien Term Loan, 10.651% (LIBOR+550 basis points), 6/29/20272,3,4 |
| 21,250,561 | ||
| 4,638,081 | Delayed Draw, 10.783% (SOFR+575 basis points), 6/29/20272,3,4 |
| 4,579,944 | ||
See accompanying Notes to Consolidated Financial Statements.
36
Cliffwater Corporate Lending Fund |
Consolidated Schedule of Investments As of March 31, 2023 (Continued) |
Principal | Value | |||||
SENIOR SECURED LOANS (Continued) | ||||||
| INDUSTRIALS (Continued) |
| ||||
| VSG Acquisition Corp. |
| ||||
$ | 2,310,000 | Revolver, 0.500%, 4/11/20282,4,6 | $ | 2,223,293 | ||
| 5,681,667 | Delayed Draw, 1.000%, 4/11/20282,4,6 |
| 5,468,402 | ||
| 17,368,750 | First Lien Term Loan, 10.659% (SOFR+550 basis points), 4/11/20282,3,4,5 |
| 16,716,805 | ||
| 2,484,592 | Delayed Draw, 10.660% (SOFR+550 basis points), 4/11/20282,3,4,5 |
| 2,391,331 | ||
| 23,333 | Revolver, 12.000% (SOFR+550 basis points), 4/11/20282,3,4,5 |
| 22,458 | ||
| VSTG Acquisition Corp. |
| ||||
| 41,790,000 | First Lien Term Loan, 10.157% (SOFR+525 basis points), 7/13/20292,3,4 |
| 40,182,424 | ||
| 30,000,000 | Watlow Electric Manufacturing Company |
| 29,868,900 | ||
|
| 2,144,011,976 | ||||
| MATERIALS — 3.6% |
| ||||
| 1,282,937 | ADG Acquisiton, LLC |
| 1,272,561 | ||
| Alpine Acquisition Corp. |
| ||||
| 428,281 | Revolver, 0.500%, 11/30/20262,4,6 |
| 406,542 | ||
| 50,769,397 | First Lien Term Loan, 10.265% (SOFR+550 basis points), 11/30/20262,3,4 |
| 48,192,356 | ||
| 47,587 | Revolver, 10.403% (SOFR+550 basis points), 11/30/20262,3,4 |
| 45,171 | ||
| 2,487,500 | First Lien Term Loan, 10.765% (SOFR+600 basis points), 11/30/20262,3,4 |
| 2,361,235 | ||
| 74,224,806 | ASP Unifrax Holdings, Inc. |
| 67,527,130 | ||
| Berlin Packaging LLC |
| ||||
| 2,828,099 | Delayed Draw, 1.000%, 11/7/20262,4,6 |
| 2,711,582 | ||
| EUR 13,068,750 | Second Lien Term Loan, 10.265% (EURIBOR+725 basis points), 12/28/20292,3,4,7 |
| 13,369,831 | ||
| EUR 2,271,901 | Second Lien Term Loan, 11.909% (EURIBOR+675 basis points), 12/28/20292,3,4,7 |
| 2,178,298 | ||
| Consolidated Label Co. |
| ||||
| 1,339,286 | Revolver, 0.500%, 7/15/20262,4,6 |
| 1,301,493 | ||
| 578,516 | Revolver, 0.500%, 7/15/20262,4,6 |
| 562,191 | ||
| 11,671,423 | First Lien Term Loan, 9.777% (LIBOR+500 basis points), 7/15/20262,3,4 |
| 11,342,074 | ||
| 4,925,000 | Incremental Term Loan, 9.840% (LIBOR+500 basis points), 7/15/20262,3,4 |
| 4,786,024 | ||
| 1,393,394 | Cyxtera Equipment Leases |
| 1,376,973 | ||
| 5,661,005 | ENS Holdings III Corp. |
| 5,529,617 | ||
| Formerra LLC |
| ||||
| 237,231 | Delayed Draw, 1.000%, 11/1/20282,4,6 |
| 233,376 | ||
| 5,930,768 | First Lien Term Loan, 12.082% (SOFR+725 basis points), 11/1/20282,3,4 |
| 5,738,018 | ||
See accompanying Notes to Consolidated Financial Statements.
37
Cliffwater Corporate Lending Fund |
Consolidated Schedule of Investments As of March 31, 2023 (Continued) |
Principal | Value | |||||
SENIOR SECURED LOANS (Continued) | ||||||
| MATERIALS (Continued) |
| ||||
$ | 7,229,613 | HPS Materials | $ | 7,171,142 | ||
| Indigo Buyer, Inc. |
| ||||
| 1,666,667 | Revolver, 0.500%, 5/23/20282,4,6 |
| 1,639,673 | ||
| 333,333 | Revolver, 8.632% (SOFR+585 basis points), 5/23/20282,3,4,5 |
| 327,935 | ||
| 12,967,500 | First Lien Term Loan, 8.632% (SOFR+585 basis points), 5/23/20282,3,4,5 |
| 12,757,473 | ||
| 5,000,000 | Delayed Draw, 10.532% (SOFR+585 basis points), 5/23/20282,3,4,5 |
| 4,919,018 | ||
| Nelipak Holding Company |
| ||||
| 24,806,701 | First Lien Term Loan, 9.075% (LIBOR+425 basis points), 7/2/20262,3,4 |
| 24,477,510 | ||
| New ILC Dover, Inc. |
| ||||
| 1,087,932 | Revolver, 0.500%, 2/2/20262,4,6 |
| 1,051,783 | ||
| 177,105 | Revolver, 11.500% (PRIME+400 basis points), 2/2/20262,3,4,5 |
| 171,221 | ||
| Oliver Packaging, LLC |
| ||||
| 380,952 | Revolver, 0.500%, 7/6/20282,4,6 |
| 375,550 | ||
| 888,889 | Revolver, 10.048% (SOFR+500 basis points), 7/6/20282,3,4 |
| 876,283 | ||
| 8,686,508 | First Lien Term Loan, 10.048% (SOFR+500 basis points), 7/6/20282,3,4 |
| 8,563,314 | ||
| Olympic Buyer, Inc. |
| ||||
| 2,352,941 | Revolver, 0.500%, 6/30/20282,4,6 |
| 2,295,503 | ||
| 26,257,751 | First Lien Term Loan, 9.157% (SOFR+435 basis points), 6/30/20282,3,4 |
| 25,616,762 | ||
| EUR 12,701,000 | Optimum Group |
| 13,274,919 | ||
| 20,000,000 | Oscar AcquisitionCo, LLC |
| 19,327,800 | ||
| Rohrer Corporation |
| ||||
| 11,907,997 | First Lien Term Loan, 9.209% (LIBOR+500 basis points), 3/15/20272,3,4,5 |
| 11,273,724 | ||
| SureWerx Purchaser III, Inc. |
| ||||
| 1,000,000 | Revolver, 0.500%, 12/28/20282,4,6 |
| 971,739 | ||
| 1,875,000 | Delayed Draw, 1.000%, 12/28/20292,4,6 |
| 1,840,795 | ||
| 9,125,000 | First Lien Term Loan, 11.649% (SOFR+675 basis points), 12/28/20292,3,4 |
| 8,867,121 | ||
| 2,500,000 | Tangent Technologies Acquisition, LLC |
| 2,455,463 | ||
| Technimark Holdings, LLC |
| ||||
| 15,000,000 | Second Lien Term Loan, 11.390% (LIBOR+675 basis points), 7/9/20292,3,4 |
| 14,430,176 | ||
| Tilley Chemical Co., Inc. |
| ||||
| 1,555,556 | Revolver, 0.500%, 12/31/20262,4,6 |
| 1,516,959 | ||
| 1,000,000 | Revolver, 0.500%, 12/31/20262,4,6 |
| 975,188 | ||
See accompanying Notes to Consolidated Financial Statements.
38
Cliffwater Corporate Lending Fund |
Consolidated Schedule of Investments As of March 31, 2023 (Continued) |
Principal | Value | |||||
SENIOR SECURED LOANS (Continued) | ||||||
| MATERIALS (Continued) |
| ||||
$ | 5,280,000 | Delayed Draw, 10.548% (SOFR+550 basis points), 12/31/20262,3,4 | $ | 5,156,926 | ||
| 1,490,714 | First Lien Term Loan, 10.548% (SOFR+550 basis points), 12/31/20262,3,4 |
| 1,453,726 | ||
| 18,921,411 | First Lien Term Loan, 10.757% (SOFR+550 basis points), 12/31/20262,3,4 |
| 18,451,930 | ||
| 24,687,500 | USALCO, LLC |
| 24,571,540 | ||
| V Global Holdings LLC |
| ||||
| 11,637,143 | Revolver, 0.500%, 12/22/20252,4,5,6 |
| 11,104,737 | ||
| 2,096,131 | Revolver, 10.574% (SOFR+600 basis points), 12/22/20252,3,4,5 |
| 2,000,232 | ||
|
| 396,850,614 | ||||
| REAL ESTATE — 1.1% |
| ||||
| Associations, Inc. |
| ||||
| 18,366,667 | Revolver, 1.000%, 7/2/20272,4,6 |
| 18,313,441 | ||
| 21,472,082 | First Lien Term Loan, 11.365% PIK (SOFR+676 basis points), 7/2/20272,3,4,8 |
| 21,409,857 | ||
| 4,008,170 | Delayed Draw, 11.390% PIK (SOFR+676 basis points), 7/2/20272,3,4,8 |
| 3,996,555 | ||
| 6,654,895 | Delayed Draw, 11.419% PIK (SOFR+676 basis points), 7/2/20272,3,4,8 |
| 6,635,609 | ||
| CRS TH Holdings Corp |
| ||||
| 4,237,288 | Revolver, 0.500%, 12/1/20272,4,6 |
| 3,961,924 | ||
| 6,340,042 | Delayed Draw, 9.590% (LIBOR+475 basis points), 12/1/20272,3,4 |
| 5,928,029 | ||
| 14,262,712 | First Lien Term Loan, 9.590% (LIBOR+475 basis points), 12/1/20272,3,4 |
| 13,335,838 | ||
| 3,659,574 | Eagleview Technology |
| 3,567,201 | ||
| MRI Software LLC |
| ||||
| 2,159,885 | Revolver, 0.500%, 2/10/20262,4,5 |
| 2,085,521 | ||
| 5,645,000 | Delayed Draw, 1.000%, 2/10/20262,4,6 |
| 5,450,644 | ||
| 14,753,239 | First Lien Term Loan, 10.659% (LIBOR+550 basis points), 2/10/20262,3,4 |
| 14,245,288 | ||
| 20,000,000 | Royal Property Company |
| 19,543,200 | ||
|
| 118,473,107 | ||||
| TECHNOLOGY — 20.8% |
| ||||
| 1WS Intermediate, Inc. |
| ||||
| 10,629,854 | First Lien Term Loan, 9.797% (SOFR+500 basis points), 7/8/20252,3,4 |
| 10,478,988 | ||
| 143,159 | Delayed Draw, 9.883% (SOFR+500 basis points), 7/8/20252,3,4 |
| 141,127 | ||
| Abracon Group Holdings, LLC |
| ||||
| 865,385 | Revolver, 0.500%, 7/6/20282,4,6 |
| 860,472 | ||
| 1,730,769 | Revolver, 0.500%, 7/6/20282,4,6 |
| 1,725,754 | ||
| 4,326,923 | Delayed Draw, 1.000%, 7/6/20282,4,6 |
| 4,314,384 | ||
| 2,163,462 | Delayed Draw, 1.000%, 7/6/20282,4,6 |
| 2,157,192 | ||
| 35,823,678 | First Lien Term Loan, 10.890% (SOFR+575 basis points), 7/6/20282,3,4 |
| 35,620,303 | ||
See accompanying Notes to Consolidated Financial Statements.
39
Cliffwater Corporate Lending Fund |
Consolidated Schedule of Investments As of March 31, 2023 (Continued) |
Principal | Value | |||||
SENIOR SECURED LOANS (Continued) | ||||||
| TECHNOLOGY (Continued) |
| ||||
| Acquia, Inc. |
| ||||
$ | 2,031,627 | First Lien Term Loan, 11.789% (LIBOR+700 basis points), 10/31/20252,3,4 | $ | 2,015,005 | ||
| 302,938 | Revolver, 12.149% (LIBOR+700 basis points), 10/31/20252,3,4 |
| 300,459 | ||
| ACS |
| ||||
| 3,870,102 | First Lien Term Loan, 9.090% (LIBOR+425 basis points), 10/9/20262,3,4 |
| 3,780,668 | ||
| 6,876,457 | Second Lien Term Loan, 13.090% (LIBOR+825 basis points), 10/9/20272,3,4 |
| 6,763,618 | ||
| Affinipay Midco, LLC |
| ||||
| 2,209,945 | Revolver, 0.500%, 6/9/20282,4,6 |
| 2,191,642 | ||
| 4,640,884 | Delayed Draw, 1.000%, 6/9/20282,4,6 |
| 4,640,884 | ||
| 32,983,425 | First Lien Term Loan, 10.645% (SOFR+575 basis points), 6/9/20282,3,4 |
| 32,710,261 | ||
| Afiniti, Inc. |
| ||||
| 20,700,284 | First Lien Term Loan, 11.750% PIK, (1,025 basis points), 6/13/20242,4,5,8 |
| 20,007,749 | ||
| AG-Twin Brook Technology |
| ||||
| 9,875,000 | First Lien Term Loan, 10.159% (LIBOR+500 basis points), 10/29/20262,3,4,5 |
| 9,790,281 | ||
| 10,000,000 | First Lien Term Loan, 11.218% (SOFR+650 basis points), 10/5/20272,3,4,5 |
| 9,732,027 | ||
| 14,812,500 | First Lien Term Loan, 11.541% (SOFR+650 basis points), 10/5/20272,3,4,5 |
| 14,415,564 | ||
| 54,862,500 | AIDC Intermediate Co2, LLC |
| 54,149,517 | ||
| 25,000,000 | Anaplan, Inc. |
| 24,927,552 | ||
| GBP 12,230,216 | ANS Midco 3 Limited |
| 13,377,277 | ||
| Appfire Technologies, LLC |
| ||||
| 924,000 | Revolver, 0.500%, 3/9/20272,4,6 |
| 912,089 | ||
| 8,791,021 | Delayed Draw, 1.000%, 3/9/20272,4,6 |
| 8,736,710 | ||
| 20,088,562 | First Lien Term Loan, 10.326% (SOFR+550 basis points), 3/9/20272,3,4 |
| 19,829,614 | ||
| 56,000 | Revolver, 10.326% (SOFR+550 basis points), 3/9/20272,3,4 |
| 55,278 | ||
| Applied Technical Services LLC |
| ||||
| 250,000 | Revolver, 0.500%, 12/29/20262,4,6 |
| 244,098 | ||
| 1,340,909 | Delayed Draw, 1.000%, 12/29/20262,4,6 |
| 1,312,340 | ||
| 659,091 | Revolver, 12.750% (PRIME+475 basis points), 12/29/20262,3,4 |
| 643,530 | ||
| 2,252,386 | Delayed Draw, 10.909% (LIBOR+575 basis points), 12/29/20262,3,4 |
| 2,199,208 | ||
| 6,715,909 | First Lien Term Loan, 10.909% (LIBOR+575 basis points), 12/29/20262,3,4 |
| 6,557,347 | ||
| 2,681,818 | Delayed Draw, 10.909% (LIBOR+575 basis points), 12/29/20262,3,4 |
| 2,624,680 | ||
| 2,067,841 | Delayed Draw, 10.909% (LIBOR+575 basis points), 12/29/20262,3,4 |
| 2,023,784 | ||
| Apptio, Inc. |
| ||||
| 92,871 | Revolver, 0.500%, 1/10/20252,4,6 |
| 91,297 | ||
| 8,232,848 | First Lien Term Loan, 9.806% (LIBOR+500 basis points), 1/10/20252,3,4 |
| 8,093,320 | ||
| 835,835 | Revolver, 10.806% (LIBOR+725 basis points), 1/10/20252,3,4 |
| 821,669 | ||
| Apryse Software Corp. |
| ||||
| 1,625,000 | Delayed Draw, 1.000%, 7/15/20272,4,6 |
| 1,606,974 | ||
| 20,262,366 | First Lien Term Loan, 10.306% (SOFR+550 basis points), 7/15/20272,3,4 |
| 19,623,606 | ||
| 3,375,000 | First Lien Term Loan, 10.806% (SOFR+550 basis points), 7/15/20272,3,4 |
| 3,312,214 | ||
See accompanying Notes to Consolidated Financial Statements.
40
Cliffwater Corporate Lending Fund |
Consolidated Schedule of Investments As of March 31, 2023 (Continued) |
Principal | Value | |||||
SENIOR SECURED LOANS (Continued) | ||||||
| TECHNOLOGY (Continued) |
| ||||
$ | 5,259,615 | AQA Acquisition Holding, Inc. | $ | 4,946,316 | ||
| Arcstor Midco LLC |
| ||||
| 96,063 | First Lien Term Loan, 8.468%, 3/16/20272,4,6 |
| 78,022 | ||
| 15,094,360 | First Lien Term Loan, 12.307% PIK (SOFR+750 basis points), 3/16/20272,3,4,8 |
| 12,259,557 | ||
| ASG II, LLC |
| ||||
| 3,281,391 | Delayed Draw, 1.000%, 5/25/20282,4,6 |
| 3,245,010 | ||
| 1,327,304 | Delayed Draw, 11.076% (SOFR+625 basis points), 5/25/20282,3,4 |
| 1,312,589 | ||
| 30,724,638 | First Lien Term Loan, 11.076% (SOFR+625 basis points), 5/25/20282,3,4 |
| 30,106,964 | ||
| 7,943,954 | ATP Intermediate, Inc. |
| 7,809,719 | ||
| AVALARA, Inc. |
| ||||
| 2,727,273 | Revolver, 0.500%, 10/19/20282,4,6 |
| 2,664,442 | ||
| 30,434,818 | First Lien Term Loan, 12.148% (SOFR+725 basis points), 10/19/20282,3,4 |
| 29,727,456 | ||
| 2,332,320 | AVI-SPL |
| 2,325,561 | ||
| Benefit Street Technology |
| ||||
| 1,333,333 | Revolver, 0.500%, 10/1/20262,4,5,6 |
| 1,313,475 | ||
| 1,333,333 | Revolver, 12.250% (LIBOR+550 basis points), 10/1/20262,3,4,5 |
| 1,313,475 | ||
| 24,750,000 | First Lien Term Loan, 10.201% (LIBOR+550 basis points), 10/1/20272,3,4,5 |
| 24,381,374 | ||
| 4,444,444 | Delayed Draw, 1.000%, 5/2/20282,4,6 |
| 4,318,610 | ||
| 35,377,778 | First Lien Term Loan, 10.984% (SOFR+625 basis points), 5/2/20282,3,4 |
| 34,376,139 | ||
| Beta Plus Technologies, Inc. |
| ||||
| 4,669,900 | Revolver, 0.500%, 7/1/20272,4,6 |
| 4,577,158 | ||
| 2,030,100 | Revolver, 9.148% (SOFR+525 basis points), 7/1/20272,3,4 |
| 1,989,783 | ||
| 50,000,000 | First Lien Term Loan, 9.374% (SOFR+525 basis points), 7/1/20292,3,4 |
| 49,132,357 | ||
| BetterCloud, Inc. |
| ||||
| 2,512,669 | Revolver, 0.500% PIK, 6/30/20282,4,6,8 |
| 2,468,578 | ||
| 3,801,052 | Revolver, 0.500%, 6/30/20282,4,5,6 |
| 3,790,037 | ||
| 42,070,503 | First Lien Term Loan, 11.891% PIK (SOFR+700 basis points), 6/30/20282,3,4,8 |
| 41,703,315 | ||
| Bigtime Software, Inc. |
| ||||
| 2,327,586 | Revolver, 0.500%, 6/30/20282,4,6 |
| 2,314,372 | ||
| 15,517,241 | First Lien Term Loan, 11.182% (SOFR+650 basis points), 6/30/20282,3,4 |
| 15,429,149 | ||
| 3,370,787 | Bluefin Holding, LLC |
| 3,264,727 | ||
| Bounteous, Inc. |
| ||||
| 558,000 | Revolver, 0.500%, 8/2/20272,4,6 |
| 511,508 | ||
| 4,300,000 | Delayed Draw, 1.000%, 8/2/20272,4,6 |
| 3,941,726 | ||
| 4,446,450 | Delayed Draw, 10.203% (SOFR+500 basis points), 8/2/20272,3,4 |
| 4,075,974 | ||
| 10,698,000 | First Lien Term Loan, 10.203% (SOFR+525 basis points), 8/2/20272,3,4 |
| 9,806,649 | ||
| 1,242,000 | Revolver, 10.236% (SOFR+525 basis points), 8/2/20272,3,4 |
| 1,138,517 | ||
See accompanying Notes to Consolidated Financial Statements.
41
Cliffwater Corporate Lending Fund |
Consolidated Schedule of Investments As of March 31, 2023 (Continued) |
Principal | Value | |||||
SENIOR SECURED LOANS (Continued) | ||||||
| TECHNOLOGY (Continued) |
| ||||
$ | 15,000,000 | Bullhorn, Inc. | $ | 14,771,884 | ||
| BusinesSolver.com, Inc. |
| ||||
| 1,260,606 | Delayed Draw, 1.000%, 12/1/20272,4,6 |
| 1,259,593 | ||
| 117,591 | Delayed Draw, 9.885% (LIBOR+550 basis points), 12/1/20272,3,4 |
| 117,496 | ||
| 5,070,000 | First Lien Term Loan, 10.659% (LIBOR+550 basis points), 12/1/20272,3,4 |
| 5,018,868 | ||
| 7,000,000 | CAI Software |
| 6,690,265 | ||
| Captify Intermediate Holdings Corp. |
| ||||
| 2,468,750 | Delayed Draw, 12.602% (LIBOR+800 basis points), 7/12/20262,3,4 |
| 2,442,368 | ||
| 8,596,875 | First Lien Term Loan, 12.830% (LIBOR+800 basis points), 7/12/20262,3,4 |
| 8,505,006 | ||
| CEB Acquisitionco, LLC |
| ||||
| 2,475,000 | First Lien Term Loan, 8.050% (LIBOR+375 basis points), 12/21/20272,3,4 |
| 2,357,345 | ||
| 2,500,000 | First Lien Term Loan, 10.410% (LIBOR+550 basis points), 12/21/20272,3,4 |
| 2,353,271 | ||
| Certify Inc. |
| ||||
| 2,016,129 | Delayed Draw, 10.340% (LIBOR+550 basis points), 2/28/20242,3,4 |
| 1,997,614 | ||
| 604,839 | Revolver, 0.500%, 2/28/20242,4,6 |
| 599,284 | ||
| 19,758,065 | First Lien Term Loan, 10.340% (LIBOR+550 basis points), 2/28/20242,3,4 |
| 19,576,616 | ||
| 2,419,355 | Delayed Draw, 10.340% (LIBOR+550 basis points), 2/28/20242,3,4 |
| 2,397,137 | ||
| 201,613 | Revolver, 10.340% (LIBOR+550 basis points), 2/28/20242,3,4 |
| 199,761 | ||
| Chronicle Bidco, Inc. |
| ||||
| 4,476,202 | Delayed Draw, 1.000%, 5/19/20292,4,6 |
| 4,409,059 | ||
| 7,954,929 | Delayed Draw, 11.615% (SOFR+675 basis points), 5/19/20292,3,4 |
| 7,835,605 | ||
| 4,730,254 | Delayed Draw, 1.000%, 5/18/20292,4,6 |
| 4,659,300 | ||
| Cleo Communications Holding, LLC |
| ||||
| 12,860,000 | First Lien Term Loan, 11.219% (LIBOR+650 basis points), 6/7/20272,3,4 |
| 12,424,963 | ||
| 2,140,000 | Revolver, 0.500%, 6/11/20282,4,6 |
| 2,067,607 | ||
| 3,596,755 | CommerceHub, Inc. |
| 3,344,982 | ||
| 10,000,000 | Conservice Midco, LLC |
| 9,866,015 | ||
| 4,577,234 | Corel Corporation |
| 4,299,739 | ||
| Coupa Holdings, LLC |
| ||||
| 1,771,654 | Revolver, 0.500%, 2/27/20292,4,6 |
| 1,723,960 | ||
| 395,719 | Delayed Draw, 1.000%, 2/28/20292,4,6 |
| 390,003 | ||
| 2,313,799 | Delayed Draw, 1.000%, 2/28/20292,4,6 |
| 2,280,376 | ||
| 30,346,605 | First Lien Term Loan, 12.292% (SOFR+750 basis points), 2/27/20302,3,4 |
| 29,529,662 | ||
| DataLink, LLC |
| ||||
| 620,968 | Revolver, 0.500%, 11/20/20262,4,6 |
| 586,337 | ||
| 225,806 | Revolver, 11.798% (LIBOR+675 basis points), 11/20/20262,3,4 |
| 213,213 | ||
| 6,197,117 | First Lien Term Loan, 11.798% (LIBOR+675 basis points), 11/20/20262,3,4 |
| 5,851,510 | ||
See accompanying Notes to Consolidated Financial Statements.
42
Cliffwater Corporate Lending Fund |
Consolidated Schedule of Investments As of March 31, 2023 (Continued) |
Principal | Value | |||||
SENIOR SECURED LOANS (Continued) | ||||||
| TECHNOLOGY (Continued) |
| ||||
$ | 12,500,000 | DCert Buyer, Inc. | $ | 11,585,782 | ||
| 24,874,055 | Diamondback Acquisition, Inc. |
| 24,399,813 | ||
| Diligent Corporation |
| ||||
| 10,218,000 | First Lien Term Loan, 10.590% (LIBOR+575 basis points), 8/4/20252,3,4 |
| 10,012,975 | ||
| 880,336 | Delayed Draw, 10.590% (LIBOR+575 basis points), 8/24/20252,3,4 |
| 861,756 | ||
| Disco Parent, LLC |
| ||||
| 331,390 | Revolver, 0.500%, 3/30/20292,4,6 |
| 323,105 | ||
| 3,313,901 | First Lien Term Loan, 12.391% (SOFR+750 basis points), 3/30/20292,3,4 |
| 3,231,053 | ||
| EUR 6,500,000 | Dragon Bidco |
| 6,800,777 | ||
| 2,756,575 | DS Admiral Bidco LLC |
| 2,673,877 | ||
| GBP 10,996,000 | ERG Bidco, Ltd. |
| 13,155,290 | ||
| ESG Investments, Inc. |
| ||||
| 2,142,857 | Revolver, 0.500%, 9/11/20272,4,6 |
| 2,001,884 | ||
| 8,035,714 | Delayed Draw, 1.000%, 3/11/20282,4,6 |
| 7,507,066 | ||
| 15,380,357 | First Lien Term Loan, 9.548% (SOFR+450 basis points), 3/11/20282,3,4 |
| 14,368,525 | ||
| 7,000,000 | FBF Investments Limited |
| 6,925,196 | ||
| FSS Buyer LLC |
| ||||
| 1,610,390 | Revolver, 0.500%, 8/31/20272,4,6 |
| 1,563,334 | ||
| 18,113,766 | First Lien Term Loan, 10.385% (LIBOR+575 basis points), 8/31/20282,3,4 |
| 17,584,477 | ||
| Gainsight, Inc. |
| ||||
| 2,625,000 | Revolver, 0.500% PIK, 7/30/20272,4,6,8 |
| 2,502,275 | ||
| 22,681,895 | First Lien Term Loan, 11.575% PIK (LIBOR+675 basis points), 7/30/20272,3,4,8 |
| 21,621,462 | ||
| SEK 11,250,000 | Goldcup 25952 AB |
| 986,927 | ||
| GovBrands Intermediate, Inc. |
| ||||
| 91,700 | Revolver, 0.500%, 4/4/20272,4,6 |
| 87,670 | ||
| 905,972 | Delayed Draw, 1.000%, 4/4/20272,4,6 |
| 866,157 | ||
| 1,936,515 | Delayed Draw, 10.659% (SOFR+550 basis points), 8/4/20272,3,4 |
| 1,851,411 | ||
| 825,300 | Revolver, 10.659% (SOFR+550 basis points), 8/4/20272,3,4 |
| 789,030 | ||
| 8,607,050 | First Lien Term Loan, 10.659% (SOFR+550 basis points), 8/4/20272,3,4 |
| 8,228,794 | ||
| GS Acquisitionco, Inc. |
| ||||
| 690,589 | Revolver, 0.500%, 5/22/20262,4,6 |
| 687,637 | ||
| 25,234,700 | First Lien Term Loan, 10.798% (SOFR+575 basis points), 5/22/20262,3,4 |
| 25,126,833 | ||
See accompanying Notes to Consolidated Financial Statements.
43
Cliffwater Corporate Lending Fund |
Consolidated Schedule of Investments As of March 31, 2023 (Continued) |
Principal | Value | |||||
SENIOR SECURED LOANS (Continued) | ||||||
| TECHNOLOGY (Continued) |
| ||||
$ | 19,950,000 | HCSS | $ | 19,387,042 | ||
| Help Systems Holdings, Inc. |
| ||||
| 9,755,497 | First Lien Term Loan, 8.776% (LIBOR+400 basis points), 11/19/20262,3 |
| 8,747,716 | ||
| 10,000,000 | Second Lien Term Loan, 11.657% (LIBOR+675 basis points), 11/19/20272,3,4 |
| 9,743,568 | ||
| 1,970,000 | HotSchedules |
| 1,845,333 | ||
| HPS Technology |
| ||||
| GBP 14,442,519 | First Lien Term Loan, 9.055% (SONIA+500 basis points), 8/3/20252,3,4,7 |
| 17,765,440 | ||
| GBP 7,523,888 | First Lien Term Loan, 9.677% (SONIA+625 basis points), 9/15/20272,3,4,7 |
| 9,056,332 | ||
| GBP 18,029,232 | Delayed Draw, 1.000%, 3/9/20292,4,6,7 |
| 21,702,278 | ||
| GBP 2,715,689 | Delayed Draw, 8.178% (SONIA+525 basis points), 9/15/20272,3,4,7 |
| 3,268,949 | ||
| AUD 2,737,949 | Delayed Draw, 9.677% (BBSW+550 basis points), 9/15/20272,3,4,7 |
| 1,785,708 | ||
| IG Investments |
| ||||
| 722,543 | Revolver, 0.500%, 9/22/20282,4,6 |
| 716,632 | ||
| 9,161,488 | First Lien Term Loan, 10.907% (LIBOR+600 basis points), 9/22/20282,3,4 |
| 9,086,532 | ||
| Imagine Acquisitionco, Inc. |
| ||||
| 1,157,556 | Revolver, 0.500%, 11/16/20272,4,6 |
| 1,119,093 | ||
| 1,607,717 | Delayed Draw, 1.000%, 11/16/20272,4,6 |
| 1,554,296 | ||
| 7,162,379 | First Lien Term Loan, 10.372% (LIBOR+550 basis points), 11/16/20272,3,4 |
| 6,924,391 | ||
| 20,000,000 | Infinite Bidco LLC |
| 19,363,421 | ||
| 1,090,909 | Invicti Intermediate 2, LLC |
| 1,049,196 | ||
| IQN Holding Corp. |
| ||||
| 577,540 | Revolver, 0.500%, 5/2/20282,4,6 |
| 572,757 | ||
| 1,335,080 | Delayed Draw, 1.000%, 5/2/20292,4,6 |
| 1,329,507 | ||
| 7,052,487 | First Lien Term Loan, 10.379% (SOFR+525 basis points), 5/2/20292,3,4 |
| 6,991,253 | ||
| 7,000,000 | Ivanti Software, Inc. |
| 4,231,502 | ||
| NOK 14,162,246 | Jigsaw Bidco AS |
| 1,315,331 | ||
| Kaseya, Inc. |
| ||||
| 4,100,000 | Delayed Draw, 0.500%, 6/23/20292,4,6 |
| 4,068,098 | ||
| 4,100,000 | Revolver, 0.500%, 6/23/20292,4,6 |
| 4,068,098 | ||
| 66,800,000 | First Lien Term Loan, 10.648% (SOFR+575 basis points), 6/23/20292,3,4 |
| 66,280,232 | ||
| Kona Buyer, LLC |
| ||||
| 18,514,190 | First Lien Term Loan, 9.648% (LIBOR+475 basis points), 12/11/20272,3,4 |
| 18,251,423 | ||
| Litera Bidco LLC |
| ||||
| 14,163,404 | First Lien Term Loan, 10.407% (LIBOR+550 basis points), 5/18/20232,3,4 |
| 13,586,367 | ||
| 10,645,890 | First Lien Term Loan, 10.907% (LIBOR+600 basis points), 5/18/20232,3,4 |
| 10,212,162 | ||
See accompanying Notes to Consolidated Financial Statements.
44
Cliffwater Corporate Lending Fund |
Consolidated Schedule of Investments As of March 31, 2023 (Continued) |
Principal | Value | |||||
SENIOR SECURED LOANS (Continued) | ||||||
| TECHNOLOGY (Continued) |
| ||||
| LMG Holdings, Inc. |
| ||||
$ | 285,714 | Revolver, 0.500%, 4/30/20262,4,6 | $ | 283,177 | ||
| 4,631,786 | First Lien Term Loan, 11.659% (LIBOR+650 basis points), 4/30/20262,3,4 |
| 4,590,006 | ||
| LogicMonitor, Inc. |
| ||||
| 28,608,279 | First Lien Term Loan, 11.310% (LIBOR+650 basis points), 5/17/20232,3,4,5 |
| 28,159,260 | ||
| 8,333,104 | MAG DS Corp. |
| 7,971,061 | ||
| 20,500,000 | Mandolin Technology Intermediate Holdings, Inc. |
| 20,282,207 | ||
| ManTech International Corporation |
| ||||
| 6,744,017 | Revolver, 0.500%, 9/14/20282,4,6 |
| 6,594,931 | ||
| 13,379,260 | Delayed Draw, 1.000%, 9/14/20292,4,6 |
| 13,216,998 | ||
| 54,602,339 | First Lien Term Loan, 10.426% (SOFR+575 basis points), 9/14/20292,3,4 |
| 53,395,275 | ||
| Marlin DTC-LS Midco 2, LLC |
| ||||
| 19,656,987 | First Lien Term Loan, 11.453% (LIBOR+650 basis points), 7/1/20252,3,4 |
| 19,145,623 | ||
| 1,886,606 | First Lien Term Loan, 11.453% (LIBOR+650 basis points), 7/1/20252,3,4 |
| 1,837,528 | ||
| Measurabl, Inc. |
| ||||
| 9,912,477 | First Lien Term Loan, 14.750% (PRIME+450 basis points), 4/21/20262,3,4 |
| 9,812,299 | ||
| 200,000 | First Lien Term Loan, 14.750%, 4/21/20262,4,6 |
| 197,979 | ||
| 1,470,000 | MEP-TS Midco LLC |
| 1,381,222 | ||
| Mindbody, Inc. |
| ||||
| 1,428,571 | Revolver, 0.500%, 2/14/20252,4,6 |
| 1,398,993 | ||
| 7,003,041 | First Lien Term Loan, 11.831% (LIBOR+700 basis points), 2/14/20252,3,4 |
| 6,858,046 | ||
| 168,116 | Misys, Ltd. |
| 157,804 | ||
| Netwrix Corporation And Concept Searching, Inc. |
| ||||
| 2,152,500 | Revolver, 0.500%, 6/9/20292,4,6 |
| 2,124,969 | ||
| 10,882,133 | Delayed Draw, 1.000%, 6/9/20292,4,6 |
| 10,793,099 | ||
| 36,152,360 | First Lien Term Loan, 9.827% (SOFR+500 basis points), 6/9/20292,3,4 |
| 35,689,966 | ||
| 717,500 | Revolver, 9.880% (SOFR+500 basis points), 6/9/20292,3,4 |
| 708,323 | ||
| New Era Merger Sub, Inc. |
| ||||
| 58,641 | Revolver, 0.500%, 10/31/20262,4,6 |
| 57,280 | ||
| 35,465 | Revolver, 0.500%, 10/31/20262,4,6 |
| 34,642 | ||
| 153,958 | Delayed Draw, 1.000%, 10/31/20262,4,6 |
| 150,385 | ||
See accompanying Notes to Consolidated Financial Statements.
45
Cliffwater Corporate Lending Fund |
Consolidated Schedule of Investments As of March 31, 2023 (Continued) |
Principal | Value | |||||
SENIOR SECURED LOANS (Continued) | ||||||
| TECHNOLOGY (Continued) |
| ||||
$ | 169,392 | Revolver, 11.032% (LIBOR+625 basis points), 10/31/20262,3,4 | $ | 165,460 | ||
| 3,117,922 | First Lien Term Loan, 11.075% (LIBOR+625 basis points), 10/31/20262,3,4 |
| 3,045,557 | ||
| 112,928 | Revolver, 11.258% (LIBOR+625 basis points), 10/31/20262,3,4 |
| 110,307 | ||
| 2,007,877 | Delayed Draw, 11.409% (LIBOR+625 basis points), 10/31/20262,3,4 |
| 1,961,275 | ||
| 1,875,589 | Delayed Draw, 11.409% (LIBOR+625 basis points), 10/31/20262,3,4 |
| 1,832,058 | ||
| Newscycle Solutions, Inc. |
| ||||
| 2,551,548 | First Lien Term Loan, 11.998% (LIBOR+700 basis points), 12/29/20232,3,4 |
| 2,485,938 | ||
| 345,032 | Delayed Draw, 11.998% (LIBOR+700 basis points), 12/29/20232,3,4 |
| 336,160 | ||
| 5,333,333 | OEConnection LLC |
| 5,265,889 | ||
| 9,873,437 | Options Technology Ltd. |
| 9,525,583 | ||
| Oranje Holdco, Inc. |
| ||||
| 1,629,556 | Revolver, 0.500%, 2/1/20292,4,6 |
| 1,585,921 | ||
| 14,916,287 | First Lien Term Loan, 12.432% (SOFR+775 basis points), 2/1/20292,3,4 |
| 14,516,877 | ||
| 7,443,750 | OSP Lakeside Intermediate Holdings, LLC |
| 7,359,730 | ||
| PC Dreamscape Opco, Inc. |
| ||||
| 1,052,632 | Revolver, 0.500%, 4/25/20282,4,6 |
| 1,005,317 | ||
| 3,289,474 | Delayed Draw, 1.000%, 4/25/20282,4,6 |
| 3,169,297 | ||
| 263,158 | Revolver, 10.641% (SOFR+575 basis points), 4/25/20282,3,4 |
| 251,329 | ||
| 3,264,803 | Delayed Draw, 10.648% (SOFR+575 basis points), 4/25/20282,3,4 |
| 3,145,527 | ||
| 12,014,474 | First Lien Term Loan, 10.648% (SOFR+575 basis points), 4/25/20282,3,4 |
| 11,474,434 | ||
| PCS Software, Inc. |
| ||||
| 363,714 | Revolver, 0.500%, 7/1/20242,4,6 |
| 360,669 | ||
| 5,223,373 | First Lien Term Loan, 11.048% (LIBOR+600 basis points), 7/1/20242,3,4 |
| 5,179,652 | ||
| 9,786,177 | PDI TA Holdings, Inc. |
| 9,421,789 | ||
| PDQ |
| ||||
| 1,764,706 | Revolver, 0.500%, 8/27/20272,4,6 |
| 1,750,268 | ||
| 7,303,235 | Delayed Draw, 9.748% (LIBOR+485 basis points), 8/27/20272,3,4 |
| 7,243,483 | ||
| 10,661,177 | First Lien Term Loan, 9.748% (LIBOR+485 basis points), 8/27/20272,3,4 |
| 10,573,950 | ||
| Pegasus Global Enterprise Holdings, LLC |
| ||||
| 1,281,257 | Delayed Draw, 10.909% (LIBOR+575 basis points), 5/29/20252,3,4 |
| 1,264,356 | ||
| 2,733,895 | First Lien Term Loan, 10.909% (LIBOR+575 basis points), 5/29/20252,3,4 |
| 2,697,833 | ||
See accompanying Notes to Consolidated Financial Statements.
46
Cliffwater Corporate Lending Fund |
Consolidated Schedule of Investments As of March 31, 2023 (Continued) |
Principal | Value | |||||
SENIOR SECURED LOANS (Continued) | ||||||
| TECHNOLOGY (Continued) |
| ||||
$ | 1,175,891 | Perforce Software, Inc. | $ | 1,097,329 | ||
| Ping Identity Corporation |
| ||||
| 250,000 | Revolver, 0.500%, 10/18/20282,4,6 |
| 243,750 | ||
| 3,277,972 | First Lien Term Loan, 11.756% (SOFR+700 basis points), 10/18/20292,3,4 |
| 3,196,023 | ||
| Planet US Buyer LLC |
| ||||
| 24,659,024 | First Lien Term Loan, 11.432% (SOFR+675 basis points), 2/1/20302,3,4 |
| 23,870,689 | ||
| 13,000,000 | Polaris Newco, LLC |
| 13,025,841 | ||
| Prism Parent Co., Inc. |
| ||||
| 601,852 | Delayed Draw, 1.000%, 9/16/20282,4,6 |
| 595,833 | ||
| 2,395,370 | First Lien Term Loan, 10.691% (SOFR+600 basis points), 9/16/20282,3,4 |
| 2,347,463 | ||
| ProcessUnity Holdings, LLC |
| ||||
| 550,000 | Revolver, 0.500%, 9/24/20282,4,6 |
| 526,325 | ||
| 750,000 | Delayed Draw, 1.000%, 9/24/20282,4,6 |
| 723,426 | ||
| 250,000 | Delayed Draw, 10.788% (LIBOR+600 basis points), 9/24/20282,3,4 |
| 241,142 | ||
| 450,000 | Revolver, 10.840% (LIBOR+600 basis points), 9/24/20282,3,4 |
| 430,629 | ||
| 5,000,000 | First Lien Term Loan, 11.159% (LIBOR+600 basis points), 9/24/20282,3,4 |
| 4,784,772 | ||
| Project Leopard Holdings, Inc. |
| ||||
| 74,490,633 | First Lien Term Loan, 9.803% (SOFR+525 basis points), 7/20/20292,3 |
| 68,915,753 | ||
| QF Holdings, Inc. |
| ||||
| 219,298 | Revolver, 0.500%, 12/15/20272,4,6 |
| 214,483 | ||
| 43,860 | Revolver, 11.058% (LIBOR+625 basis points), 12/15/20272,3,4 |
| 42,897 | ||
| 438,597 | Delayed Draw, 11.157% (LIBOR+625 basis points), 12/15/20272,3,4 |
| 428,966 | ||
| 2,192,982 | First Lien Term Loan, 11.157% (LIBOR+625 basis points), 12/15/20272,3,4 |
| 2,144,831 | ||
| Quantic Electronics, LLC |
| ||||
| 128,641 | Revolver, 0.500%, 11/19/20262,4,6 |
| 125,011 | ||
| 57,038 | Revolver, 0.500%, 11/19/20262,4,6 |
| 55,429 | ||
| 953,898 | Delayed Draw, 1.000%, 11/19/20262,4,6 |
| 926,980 | ||
| 371,359 | Revolver, 7.750% (LIBOR+625 basis points), 11/19/20262,3,4 |
| 360,880 | ||
| 3,940,000 | Delayed Draw, 11.215% (LIBOR+625 basis points), 11/19/20262,3,4 |
| 3,828,819 | ||
| 9,035,410 | First Lien Term Loan, 11.215% (LIBOR+625 basis points), 11/19/20262,3,4 |
| 8,780,446 | ||
| 2,440,020 | Delayed Draw, 11.215% (LIBOR+625 basis points), 11/19/20262,3,4 |
| 2,371,166 | ||
| 371,359 | Revolver, 11.215% (LIBOR+625 basis points), 11/19/20262,3,4 |
| 360,880 | ||
| 20,000,000 | Quest Software US Holdings, Inc. |
| 12,936,495 | ||
| Questel International |
| ||||
| EUR 2,153,391 | First Lien Term Loan, 9.165% (EURIBOR+625 basis points), 12/17/20272,3,4,7 |
| 2,224,961 | ||
| EUR 8,850,000 | First Lien Term Loan, 11.309% (EURIBOR+625 basis points), 12/17/20272,3,4,7 |
| 9,144,136 | ||
| 8,653,846 | Quickbase, Inc. |
| 8,544,412 | ||
See accompanying Notes to Consolidated Financial Statements.
47
Cliffwater Corporate Lending Fund |
Consolidated Schedule of Investments As of March 31, 2023 (Continued) |
Principal | Value | |||||
SENIOR SECURED LOANS (Continued) | ||||||
| TECHNOLOGY (Continued) |
| ||||
| Rally Buyer, Inc. |
| ||||
$ | 1,500,000 | Revolver, 0.500%, 7/19/20282,4,6 | $ | 1,472,700 | ||
| 1,682,180 | Revolver, 0.500%, 7/19/20282,4,6 |
| 1,651,564 | ||
| 2,640,000 | Delayed Draw, 1.000%, 7/19/20282,4,6 |
| 2,618,400 | ||
| 2,960,636 | Delayed Draw, 1.000%, 7/19/20282,4,6 |
| 2,936,413 | ||
| 360,000 | Delayed Draw, 10.527% (SOFR+575 basis points), 7/19/20282,3,4 |
| 357,055 | ||
| 403,723 | Delayed Draw, 10.527% (SOFR+575 basis points), 7/19/20282,3,4 |
| 400,420 | ||
| 22,275,259 | First Lien Term Loan, 10.604% (SOFR+575 basis points), 7/19/20282,3,4 |
| 21,869,847 | ||
| Ranger Buyer, Inc. |
| ||||
| 1,923,077 | Revolver, 0.500%, 11/18/20272,4,6 |
| 1,878,444 | ||
| 22,846,154 | First Lien Term Loan, 10.407% (LIBOR+550 basis points), 11/18/20282,3,4 |
| 22,315,912 | ||
| RCS Technology |
| ||||
| 2,178,710 | First Lien Term Loan, 11.040% (SOFR+550 basis points), 2/28/20252,3,4,5 |
| 2,155,427 | ||
| 339,792 | Delayed Draw, 10.070% (SOFR+575 basis points), 2/3/20262,3,4,5 |
| 337,012 | ||
| 90,278 | Revolver, 10.070% (SOFR+575 basis points), 2/3/20262,3,4,5 |
| 89,539 | ||
| 1,890,972 | First Lien Term Loan, 10.070% (SOFR+575 basis points), 2/3/20262,3,4,5 |
| 1,875,501 | ||
| Recorded Future, Inc. |
| ||||
| 178,771 | Revolver, 0.500%, 7/3/20252,4,6 |
| 175,965 | ||
| 1,114,894 | First Lien Term Loan, 10.403% (LIBOR+525 basis points), 7/3/20252,3,4 |
| 1,097,395 | ||
| Redwood Services Group, LLC |
| ||||
| 41,317 | Delayed Draw, 1.000%, 6/15/20292,4,6 |
| 40,822 | ||
| 13,189,693 | Delayed Draw, 1.000%, 6/15/20292,4,6 |
| 13,031,839 | ||
| 9,567,215 | Delayed Draw, 10.029% (SOFR+600 basis points), 6/15/20292,3,4 |
| 9,452,715 | ||
| 40,290,489 | First Lien Term Loan, 10.690% (SOFR+600 basis points), 6/15/20292,3,4 |
| 39,808,295 | ||
| 1,410,307 | Delayed Draw, 10.920% (SOFR+600 basis points), 6/15/20292,3,4 |
| 1,393,429 | ||
| Revalize, Inc. |
| ||||
| 681,000 | Revolver, 0.500%, 4/15/20272,4,6 |
| 676,315 | ||
| 19,760,114 | Delayed Draw, 10.657% (LIBOR+575 basis points), 4/15/20272,3,4 |
| 19,624,179 | ||
| 1,021,200 | Delayed Draw, 10.657% (LIBOR+575 basis points), 4/15/20272,3,4 |
| 1,014,175 | ||
| 4,596,147 | Delayed Draw, 10.657% (LIBOR+575 basis points), 4/15/20272,3,4 |
| 4,564,529 | ||
| Riskonnect Parent, LLC |
| ||||
| 30,882,250 | Delayed Draw, 1.000%, 12/7/20282,4,6 |
| 30,671,308 | ||
| 28,983,167 | First Lien Term Loan, 10.548% (SOFR+550 basis points), 12/7/20282,3,4 |
| 28,494,437 | ||
| 2,107,471 | Rocket Software, Inc. |
| |||
| First Lien Term Loan, 8.885% (LIBOR+425 basis points), 11/28/20252,3 |
| 2,073,488 | |||
| RPX Corporation |
| ||||
| 12,133,977 | First Lien Term Loan, 10.340% (LIBOR+550 basis points), 10/23/20252,3,4 |
| 11,670,013 | ||
| Safety Borrower Holdings |
| ||||
| 508,475 | Revolver, 0.500%, 9/1/20272,4,6 |
| 507,001 | ||
| 9,241,525 | First Lien Term Loan, 10.401% (LIBOR+425 basis points), 9/1/20272,3,4 |
| 9,214,744 | ||
| 169,492 | Revolver, 12.250% (LIBOR+525 basis points), 9/1/20272,3,4 |
| 169,000 | ||
| 603,840 | SailPoint Technologies, Inc. |
| 597,387 | ||
See accompanying Notes to Consolidated Financial Statements.
48
Cliffwater Corporate Lending Fund |
Consolidated Schedule of Investments As of March 31, 2023 (Continued) |
Principal | Value | |||||
SENIOR SECURED LOANS (Continued) | ||||||
| TECHNOLOGY (Continued) |
| ||||
| Securonix, Inc. |
| ||||
$ | 2,288,135 | Revolver, 0.500%, 4/1/20282,4,6 | $ | 2,281,504 | ||
| 12,711,865 | First Lien Term Loan, 11.103% (SOFR+650 basis points), 4/1/20282,3,4 |
| 12,607,860 | ||
| Seismic Software, Inc. |
| ||||
| 272,390 | Revolver, 0.500%, 10/15/20262,4,5,6 |
| 264,021 | ||
| 26,204,082 | Delayed Draw, 1.000%, 10/15/20262,4,5,6 |
| 25,399,013 | ||
| 1,458,750 | Smartlinx Solutions, LLC |
| 1,429,709 | ||
| Sonar Acquisitionco, Inc. |
| ||||
| 2,693,750 | Revolver, 0.500%, 7/7/20282,4,5,6 |
| 2,637,977 | ||
| 20,406,250 | First Lien Term Loan, 10.564% (SOFR+575 basis points), 7/7/20282,3,4,5 |
| 19,983,746 | ||
| GBP 3,613,000 | SSCP Pegasus Bidco Ltd. |
| 4,362,675 | ||
| Syntax Systems Ltd. |
| ||||
| 396,040 | Revolver, 0.500%, 10/29/20262,4,6 |
| 376,135 | ||
| 1,584,158 | Revolver, 10.590% (LIBOR+575 basis points), 10/29/20262,3,4 |
| 1,504,540 | ||
| 4,937,343 | First Lien Term Loan, 10.590% (LIBOR+575 basis points), 10/28/20282,3,4 |
| 4,689,198 | ||
| 4,950,495 | Delayed Draw, 1.000%, 10/29/20282,4,6 |
| 4,701,689 | ||
| 17,798,267 | First Lien Term Loan, 10.590% (LIBOR+575 basis points), 10/29/20282,3,4 |
| 16,903,747 | ||
| Tamarack Intermediate, L.L.C. |
| ||||
| 2,524,330 | Revolver, 0.500%, 3/11/20282,4,6 |
| 2,422,497 | ||
| 499,107 | Revolver, 10.334% (SOFR+550 basis points), 3/11/20282,3,4 |
| 478,973 | ||
| 18,384,180 | First Lien Term Loan, 10.757% (SOFR+550 basis points), 3/11/20282,3,4 |
| 17,642,550 | ||
| 10,060,247 | The NPD Group, Inc. |
| 9,859,042 | ||
| Thunder Purchase, Inc. |
| ||||
| 744,729 | Revolver, 0.500%, 6/30/20272,4,6 |
| 703,196 | ||
| 627,140 | Revolver, 10.913% (LIBOR+575 basis points), 6/30/20272,3,4,5 |
| 592,165 | ||
| TigerConnect, Inc. |
| ||||
| 1,875,000 | Revolver, 0.500% PIK, 2/16/20282,4,6,8 |
| 1,869,566 | ||
| 739,603 | Delayed Draw, 1.000% PIK, 2/16/20282,4,6,8 |
| 737,459 | ||
| 244,303 | Delayed Draw, 11.826% PIK (SOFR+725 basis points), 2/16/20282,3,4,8 |
| 243,596 | ||
| 13,125,000 | First Lien Term Loan, 11.826% PIK (SOFR+725 basis points), 2/16/20282,3,4,8 |
| 12,918,997 | ||
| Trackforce Acquireco, Inc. |
| ||||
| 667,845 | Revolver, 0.500%, 6/23/20282,4,5,6 |
| 655,690 | ||
| 445,230 | Revolver, 10.865% (SOFR+600 basis points), 6/23/20282,3,4,5 |
| 437,126 | ||
| 18,053,004 | First Lien Term Loan, 10.865% (SOFR+600 basis points), 6/23/20282,3,4,5 |
| 17,724,438 | ||
| Tribute Technology Holdings, LLC |
| ||||
| 3,487,842 | Revolver, 0.500%, 10/30/20262,4,6 |
| 3,371,949 | ||
| 1,395,137 | Revolver, 11.498% (LIBOR+650 basis points), 10/30/20262,3,4,5 |
| 1,348,780 | ||
| Trintech, Inc. |
| ||||
| 1,319,008 | First Lien Term Loan, 10.850% (LIBOR+600 basis points), 12/29/20242,3,4 |
| 1,288,395 | ||
See accompanying Notes to Consolidated Financial Statements.
49
Cliffwater Corporate Lending Fund |
Consolidated Schedule of Investments As of March 31, 2023 (Continued) |
Principal | Value | |||||
SENIOR SECURED LOANS (Continued) | ||||||
| TECHNOLOGY (Continued) |
| ||||
| U.S. Hospitality Publishers, Inc. |
| ||||
$ | 526,316 | Revolver, 0.500%, 12/17/20252,4,6 | $ | 518,846 | ||
| 4,148,912 | Delayed Draw, 11.840% (LIBOR+700 basis points), 12/17/20252,3,4 |
| 4,090,028 | ||
| 5,125,000 | First Lien Term Loan, 11.840% (LIBOR+700 basis points), 12/17/20252,3,4 |
| 5,052,262 | ||
| 2,631,579 | Delayed Draw, 1.000%, 12/18/20252,4,6 |
| 2,594,230 | ||
| User Zoom Technologies, Inc. |
| ||||
| 37,896,774 | First Lien Term Loan, 11.603% (SOFR+700 basis points), 4/5/20292,3,4 |
| 37,256,407 | ||
| 9,500,000 | First Lien Term Loan, 12.125% (SOFR+750 basis points), 4/5/20292,3,4 |
| 9,206,495 | ||
| 15,000,000 | Virgin Pulse, Inc. |
| 14,913,085 | ||
| Wilson Electronics Holdings, LLC |
| ||||
| 9,226,000 | Delayed Draw, 1.000%, 5/17/20272,4,6 |
| 8,996,159 | ||
| 28,416,850 | First Lien Term Loan, 11.514% (SOFR+585 basis points), 5/17/20272,3,4 |
| 27,669,063 | ||
| WorkForce Software, LLC |
| ||||
| 463,235 | Revolver, 0.500% PIK, 7/31/20252,4,6,8 |
| 450,164 | ||
| 4,499,940 | First Lien Term Loan, 9.460% PIK (SOFR+425 basis points), 7/31/20252,3,4,8 |
| 4,384,229 | ||
| Xactly Corporation |
| ||||
| 2,524,544 | First Lien Term Loan, 12.141% (SOFR+725 basis points), 7/31/20252,3,4 |
| 2,480,520 | ||
| 29,000,000 | First Lien Term Loan, 11.934% (SOFR+725 basis points), 2/3/20312,3,4 |
| 28,494,283 | ||
| Zendesk, Inc. |
| ||||
| 1,847,826 | Delayed Draw, 1.000%, 11/22/20282,4,6 |
| 1,829,348 | ||
| 7,391,304 | First Lien Term Loan, 11.876% (SOFR+650 basis points), 11/22/20282,3,4 |
| 7,243,478 | ||
|
| 2,306,555,242 | ||||
| UTILITIES — 0.2% |
| ||||
| 713,334 | EDPO, LLC |
| 689,631 | ||
| 7,783,766 | TS OpCo Holding LLC |
| 7,712,284 | ||
| Water Holdings Acquisition, LLC |
| ||||
| 358,591 | Revolver, 0.500%, 12/18/20262,4,6 |
| 349,083 | ||
| 3,817,808 | Delayed Draw, 1.000%, 12/18/20262,4,6 |
| 3,796,517 | ||
| 289,593 | Delayed Draw, 10.115% (LIBOR+525 basis points), 12/18/20262,3,4 |
| 287,977 | ||
| 927,123 | Revolver, 10.214% (LIBOR+525 basis points), 12/18/20262,3,4 |
| 902,540 | ||
| 13,542,857 | First Lien Term Loan, 10.215% (LIBOR+525 basis points), 12/18/20262,3,4 |
| 13,183,764 | ||
|
| 26,921,796 | ||||
| TOTAL SENIOR SECURED LOANS |
| ||||
| (Cost $9,529,351,404) |
| 9,381,635,280 | |||
See accompanying Notes to Consolidated Financial Statements.
50
Cliffwater Corporate Lending Fund |
Consolidated Schedule of Investments As of March 31, 2023 (Continued) |
Number of | Value | ||||
PRIVATE INVESTMENT VEHICLES — 45.3% | |||||
INVESTMENT PARTNERSHIPS — 4.9% |
| ||||
N/A | AG Direct Lending Fund II (Unlevered), L.P.2,11 | $ | 25,385,433 | ||
N/A | AG Direct Lending Fund II, L.P.2,11 |
| 19,819,302 | ||
N/A | AG Direct Lending Fund III, L.P.2,11 |
| 14,266,184 | ||
N/A | AG DLI, L.P.2,11 |
| 9,164,202 | ||
N/A | AG GTDL Fund II, L.P.2,11 |
| 25,507,913 | ||
N/A | AG GTDL Fund, L.P.2,11 |
| 3,047,916 | ||
N/A | AG KFHDL Fund, L.P.2,11 |
| 3,048,185 | ||
N/A | Antares Senior Loan Parallel Feeder Fund II (Cayman) LP2,11 |
| 27,578,597 | ||
N/A | Ares Commercial Finance LP2,11 |
| 17,841,187 | ||
N/A | Ares Priority Loan Co-Invest LP |
| 24,854,411 | ||
N/A | Banner Ridge DSCO Fund II (Offshore), LP |
| 182,906 | ||
N/A | Barings CMS Fund, LP2,11 |
| 3,205,755 | ||
N/A | CDL Tender Fund 2022-1, L.P.2,11 |
| 50,299,459 | ||
N/A | Crescent Mezzanine Partners VIIC, L.P.2,11 |
| 6,264,850 | ||
N/A | Crestline Specialty Lending III (US), L.P. |
| 18,821,824 | ||
N/A | HPS Mezzanine Partners 2019, L.P. |
| 9,057,612 | ||
N/A | HPS Specialty Loan Fund V Feeder, L.P. |
| 41,916,380 | ||
N/A | Marlin Credit Opportunities Fund, L.P. |
| 95,984,920 | ||
N/A | Odyssey Co-Investment Partners B, LLC |
| 1,522,703 | ||
N/A | Providence Debt Fund III (Non-US) L.P.2,11 |
| 9,068,558 | ||
N/A | Raven Asset-Based Credit Fund II LP |
| 19,451,135 | ||
N/A | Silver Point Specialty Credit Fund II, L.P.2,11 |
| 39,409,060 | ||
N/A | Summit Partners Credit Offshore Fund II, L.P.2,11 |
| 7,956,374 | ||
N/A | Thompson Rivers LLC2,11 |
| 5,749,959 | ||
N/A | Varagon Capital Direct Lending Fund, L.P.2,11 |
| 22,096,472 | ||
N/A | Vista Credit Partners Fund III, L.P.2,11 |
| 31,618,228 | ||
N/A | Waccamaw River LLC2,11 |
| 9,962,619 | ||
| 543,082,144 | ||||
JOINT VENTURES — 0.8% |
| ||||
N/A | FBLC Senior Loan Fund LLC2,11 |
| 71,110,878 | ||
N/A | Middle Market Credit Fund II, LLC2,11 |
| 14,669,248 | ||
| 85,780,126 | ||||
NON-LISTED BUSINESS DEVELOPMENT COMPANIES — 16.0% |
| ||||
4,950,891 | AGTB BDC Holdings, LP2,11 |
| 126,386,018 | ||
1,062,728 | Ares Strategic Income Fund2,11 |
| 26,857,892 | ||
4,312,845 | Barings Capital Investment Corporation2,11 |
| 93,556,934 | ||
44,235,355 | Barings Private Credit Corporation2,11 |
| 914,090,978 | ||
188,686 | Carlyle Secured Lending III2,11 |
| 3,797,857 | ||
5,283,172 | Franklin BSP Lending Corporation2,11 |
| 39,285,287 | ||
2,660,121 | Golub Capital BDC 4, Inc.2,11 |
| 40,636,411 | ||
2,186,386 | Golub Capital Direct Lending Corporation2,11 |
| 33,206,879 | ||
1,883,826 | Morgan Stanley Direct Lending Fund2,11 |
| 38,375,102 | ||
See accompanying Notes to Consolidated Financial Statements.
51
Cliffwater Corporate Lending Fund |
Consolidated Schedule of Investments As of March 31, 2023 (Continued) |
Number of Shares/ Principal Amount | Value | |||||
PRIVATE INVESTMENT VEHICLES (Continued) | ||||||
| NON-LISTED BUSINESS DEVELOPMENT COMPANIES (Continued) |
| ||||
$ | 10,000,000 | New Mountain Guardian III BDC, L.L.C. | $ | 97,536,673 | ||
| 750,000 | New Mountain Guardian IV BDC, L.L.C. |
| 7,513,742 | ||
| 16,163,843 | Owl Rock Core Income Corp.2,11 |
| 149,951,024 | ||
| 2,119,509 | Owl Rock Technology Finance Corp.2,11 |
| 36,125,056 | ||
| 2,673,813 | Owl Rock Technology Finance Corp. II2,11 |
| 39,379,668 | ||
| 2,271,227 | Redwood Enhanced Income Corp.2,11 |
| 32,355,235 | ||
| 625,828 | Sixth Street Lending Partners2,11 |
| 15,829,778 | ||
| N/A | Stellus Private Credit BDC Feeder LP2,11 |
| 13,787,453 | ||
| 1,003,345 | Stone Point Credit Corporation2,11 |
| 19,364,912 | ||
| 220,099 | TCW Direct Lending VIII LLC2,11 |
| 22,182,479 | ||
| 1,925,963 | Varagon Capital Corporation2,11 |
| 18,727,043 | ||
|
| 1,768,946,421 | ||||
| PRIVATE COLLATERALIZED LOAN OBLIGATIONS — 22.6% |
| ||||
| 106,770,833 | ABPCI Pacific Funding LP, 10.760%, 5/31/2031*,2,4,9,11 |
| 110,943,440 | ||
| 103,200,000 | Antares Loan Funding I Ltd., 18.530%, 2/17/2032*,2,4,9 |
| 105,176,850 | ||
| 29,600,000 | Antares Loan Funding I Ltd., 10.187%, (SOFR+525 basis points) 2/17/20322,4,9 |
| 29,600,000 | ||
| N/A | BlackRock Shasta Senior Loan Fund VII, LLC |
| 552,871,857 | ||
| N/A | Comvest Structured Note Issuer I LLC2,11 |
| 140,146,782 | ||
| N/A | NXT Capital Structured Note I LLC2,11 |
| 93,713,602 | ||
| N/A | Raven Senior Loan Fund LLC2,11 |
| 475,140,068 | ||
| N/A | Silver Point Loan Funding, LLC2,11 |
| 571,918,699 | ||
| N/A | Varagon Structured Notes Issuer I, LLC2,11 |
| 426,257,997 | ||
|
| 2,505,769,295 | ||||
| PRIVATE EQUITY — 0.1% |
| ||||
| N/A | CSL III Advisor LLC2,4,11 |
| 24,289 | ||
| 4 | Owl Rock Technology Holdings II, LLC Class A2,4 |
| 5,300,102 | ||
| N/A | Stellus Private BDC Advisor, LLC2,4 |
| 1,001,035 | ||
|
| 6,325,426 | ||||
| SPECIAL PURPOSE VEHICLE FOR PREFERRED EQUITY — 0.5% |
| ||||
| N/A | CCOF Sierra II, LP2,11 |
| 16,728,573 | ||
| N/A | Chilly HP SCF Investor, LP2,11 |
| 2,109,569 | ||
| N/A | HPS Mint Co-Invest, L.P.2,11 |
| 21,392,898 | ||
| N/A | Minerva Co-Invest, L.P. |
| 14,660,523 | ||
|
| 54,891,563 | ||||
| SPECIAL PURPOSE VEHICLE FOR SENIOR SECURED BONDS — 0.3% |
| ||||
| N/A | 17Capital Co-Invest (B) SCSp,7,11 |
| 23,628,267 | ||
| N/A | Endurance II Co-Invest, L.P.2,11 |
| 10,724,514 | ||
| N/A | Proxima Co-Invest, L.P.2,11 |
| 4,789,096 | ||
|
| 39,141,877 | ||||
| SPECIAL PURPOSE VEHICLE FOR SUBORDINATED DEBT — 0.1% |
| ||||
| N/A | Luther Co-Invest, L.P.2,11 |
| 15,038,565 | ||
| TOTAL PRIVATE INVESTMENT VEHICLES |
| ||||
| (Cost $4,927,730,336) |
| 5,018,975,417 | |||
See accompanying Notes to Consolidated Financial Statements.
52
Cliffwater Corporate Lending Fund |
Consolidated Schedule of Investments As of March 31, 2023 (Continued) |
Principal | Value | |||||
COLLATERALIZED LOAN OBLIGATIONS — 0.8% | ||||||
$ | 12,000,000 | ABPCI Direct Lending Fund CLO X LP | $ | 11,820,253 | ||
| 7,500,000 | ABPCI Direct Lending Fund CLO XII Ltd. |
| 7,200,000 | ||
| BlackRock Elbert CLO V LLC |
| ||||
| 13,000,000 | 13.733% (SOFR+870 basis points), 6/15/20341,2,3,4,9 |
| 11,482,616 | ||
| 39,500,000 | 19.000%, 6/15/20341,2,4,12 |
| 38,207,192 | ||
| 10,000,000 | Monroe Capital MML CLO IX Ltd. |
| 9,469,039 | ||
| 2,910,000 | Monroe Capital MML CLO VII Ltd. |
| 2,656,262 | ||
| 15,000,000 | Monroe Capital MML CLO VIII, Ltd. |
| 10,458,228 | ||
| TOTAL COLLATERALIZED LOAN OBLIGATIONS |
| ||||
| (Cost $97,736,016) |
| 91,293,590 | |||
Number of | ||||
PREFERRED STOCKS — 0.8% | ||||
HEALTH CARE — 0.3% | ||||
15,000 | nThrive, Inc., Series A-2 Preferred, 11.000% PIK2,4,8 | 14,742,173 | ||
17,500 | Propharma, LLC | 17,699,239 | ||
32,441,412 | ||||
INDUSTRIALS — 0.1% | ||||
| Atomic Transport, LLC | 904,225 | ||
2,500 | Atomic Blocker, LLC, Class A Preferred, 8.500% PIK2,4,8,15 | 2,395,841 | ||
11,250,000 | FSG Acquisition, LLC, — Senior Preferred, 12.250% PIK2,4,8 | 11,288,496 | ||
200 | S4T Holdings Corp. | 94,353 | ||
14,682,915 | ||||
TECHNOLOGY — 0.4% | ||||
15,000 | GS Holder, Inc. Preferred, 16.320% PIK2,4,8 | 14,550,000 | ||
10,000 | GS Holder, Inc. Preferred, 16.780% PIK2,4,8 | 9,700,000 | ||
6,500 | Mandolin Technology Holdings, Inc. — Series A Preferred, 10.500% PIK2,4,8 | 6,374,446 | ||
11,000 | Riskonnect Parent, LLC — Series B Preferred, 12.607% PIK2,4,8 | 10,780,000 | ||
41,404,446 | ||||
TOTAL PREFERRED STOCKS | ||||
(Cost $86,569,254) | 88,528,773 |
See accompanying Notes to Consolidated Financial Statements.
53
Cliffwater Corporate Lending Fund |
Consolidated Schedule of Investments As of March 31, 2023 (Continued) |
Number of | Value | ||||
COMMON STOCKS — 0.1% | |||||
CONSUMER DISCRETIONARY — 0.0% |
| ||||
1,500 | A1 Garage Blocker Aggregator, LP |
| |||
A1 Garage Equity, LLC, Class A Common2,4 | $ | 1,500,000 | |||
FINANCIALS — 0.1% |
| ||||
280,309 | Forbright, Inc.2,4 |
| 5,844,178 | ||
INDUSTRIALS — 0.0% |
| ||||
2,188 | Atomic Transport, LLC |
| 968,234 | ||
200 | S4T Holdings Corp. |
| 131,134 | ||
| 1,099,368 | ||||
TOTAL COMMON STOCKS |
| ||||
(Cost $5,865,607) |
| 8,443,546 | |||
Principal | |||||
SUBORDINATED DEBT — 1.4% | |||||
| FINANCIALS — 1.4% | ||||
| EUR 130,000,000 | Castor Finance Holdings Limited, 11.825% (EURIBOR+500 basis points), 9/14/20292,3,4,7 | 140,573,981 | ||
$ | 6,458,995 | KWOR Intermediate I, Inc., 14.590% PIK (SOFR+975 basis points), | 6,199,082 | ||
| 3,500,000 | North Haven Goldfinch, 15.480% PIK (LIBOR+1,075 basis points), 9/17/20242,3,4,8 | 3,409,195 | ||
| PAW Midco, Inc. | ||||
| 1,195,121 | 11.500% PIK, 12/22/20312,4,8 | 1,038,312 | ||
| 34,742 | 11.500%, 12/22/20312,4,6 | 30,183 | ||
| PPV Intermediate Holdings LLC | ||||
| 5,625,000 | 13.000% PIK, 8/31/20302,4,8 | 5,480,360 | ||
| 20,313 | 13.000%, 8/31/20302,4,6 | 19,790 | ||
| 5,500,000 | OTR Midco, LLC, 12.000%, 5/12/20262,4 | 5,468,131 | ||
| TOTAL SUBORDINATED DEBT | ||||
| (Cost $157,599,805) | 162,219,034 | |||
See accompanying Notes to Consolidated Financial Statements.
54
Cliffwater Corporate Lending Fund |
Consolidated Schedule of Investments As of March 31, 2023 (Continued) |
Number of | Value | ||||
WARRANTS — 0.0% | |||||
ENERGY — 0.0% |
| ||||
N/A | Service Compression, LLC – Series A-162,4 |
| |||
Exercise Price: $34,500,000 |
| ||||
Expiration: 5/6/2027 | $ | 423,276 | |||
HEALTH CARE — 0.0% |
| ||||
1,300,435 | ADMA Biologics, Inc.2,4 |
| |||
Exercise Price: $1.6478 |
| ||||
Expiration Date: 3/23/2029 |
| 3,172,124 | |||
219,298 | Xeris Biopharma Holdings, Inc.2,4 |
| |||
Exercise Price: $2.28 |
| ||||
Expiration Date: 3/8/2029 |
| 267,870 | |||
| 3,439,994 | ||||
TECHNOLOGY — 0.0% |
| ||||
21,640 | Afiniti, Inc. (via a participation with VHG Investment Fund I, L.P.)2,4 |
| |||
Exercise Price: $40.80 |
| ||||
Expiration: 6/13/2024 |
| 1,065,013 | |||
43,955 | Measurabl, Inc. (via a participation with Multiplier Capital, LLC)2,4,5 |
| |||
Exercise Price: $18.2005 |
| ||||
Expiration: 4/21/2032 |
| — | |||
| 1,065,013 | ||||
TOTAL WARRANTS |
| ||||
(Cost $1,152,261) |
| 4,928,283 | |||
Number of | ||||||
SHORT-TERM INVESTMENTS — 0.7% | ||||||
78,357,066 | State Street Institutional U.S. Government Money Market Fund, 4.64%2,17 |
| 78,357,066 |
| ||
TOTAL SHORT-TERM INVESTMENTS |
|
| ||||
(Cost $78,357,066) |
| 78,357,066 |
| |||
TOTAL INVESTMENTS — 133.9% |
|
| ||||
(Cost $14,884,361,749) |
| 14,834,380,989 |
| |||
Senior Notes (net of deferred offering costs of $7,141,344) — (16.5)% |
| (1,828,695,082 | ) | |||
Liabilities Less Other Assets — (17.4)% |
| (1,928,780,749 | ) | |||
NET ASSETS — 100.0% | $ | 11,076,905,158 |
| |||
Principal | |||||||
REVERSE REPURCHASE AGREEMENTS — (0.0)% | |||||||
$ | (3,870,000) | Agreement with Deutsche Bank AG, | $ | (3,870,000 | ) | ||
| TOTAL REVERSE REPURCHASE AGREEMENTS |
|
| ||||
| (Proceeds $3,870,000) | $ | (3,870,000 | ) | |||
See accompanying Notes to Consolidated Financial Statements.
55
Cliffwater Corporate Lending Fund |
Consolidated Schedule of Investments As of March 31, 2023 (Continued) |
AUD – Australian Dollars
CAD – Canadian Dollars
EUR – Euro
GBP – Pound Sterling
NOK – Norwegian Krone
NZD – New Zealand Dollar
SEK – Swedish Krona
US – United States
CDOR – Canadian Dollar Offered Rate
EURIBOR – Euro Interbank Offered Rate
LIBOR – London Interbank Offered Rate
PRIME – Prime Lending Rate
SOFR – Secured Overnight Financing Rate
SONIA - Sterling Overnight Index Average
STIBOR - Stockholm Interbank Offered Rate
BDC – Business Development Company
CLO – Collateralized Loan Obligation
LLC – Limited Liability Company
LP – Limited Partnership
LOC – Letter of Credit
RB – Revenue Bonds
* Subordinated note position. Rate shown is the effective yield as of period end.
** Shares represent underlying security
1 Callable.
2 As of March 31, 2023 all or a portion of the security has been pledged as collateral for a senior secured note. The value of the securities totaled $14,834,635,859 as of March 31, 2023. See Note 2, subsection Senior Notes of the Notes to Consolidated Financial Statements for additional information.
3 Floating rate security. Rate shown is the rate effective as of period end.
4 Value was determined using significant unobservable inputs.
5 This investment was made through a participation. Please see Note 2 for a description of loan participations.
6 Represents an unfunded loan commitment. The rate disclosed is equal to the commitment fee. See Note 2 for additional information.
7 Foreign securities entered into in foreign currencies are converted to U.S. Dollars using period end spot rates.
8 Principal includes accumulated payment in kind (“PIK”) interest and is net of repayments, if any.
9 Security exempt from registration under Rule 144A of the Securities Act of 1933. These securities are restricted. They may only be resold in transactions exempt from registration normally to qualified institutional buyers. The total value of these securities is $309,943,060, which represents 2.8% of total net assets of the Fund.
10 Step rate security.
11 Investment valued using net asset value per share as practical expedient. See Note 13 for respective investment categories, unfunded commitments, and redemptive restrictions.
12 Variable rate security. Rate shown is the rate in effect as of period end.
13 All or a portion of this security is segregated as collateral for reverse repurchase agreements. Total collateral had a fair value of $9,469,039 as of March 31, 2023. See Note 2 for additional information.
14 Jayhawk Intermediate, LLC is the holding company that owns ProPharma Group, LLC.
15 Atomic Blocker, LLC holds Class A Preferred Units and Class W Common Units in Atomic Holdings, LLC, which is the holding company that owns Atomic Transport, LLC.
16 Vistria ESS Holdings, LLC holds Series A Preferred Units and Class A Common Units in TVG ESS Holdings, LLC which is the parent company holdings company for S4T Holdings Corp.
17 The rate is the annualized seven-day yield at period end.
See accompanying Notes to Consolidated Financial Statements.
56
Cliffwater Corporate Lending Fund |
Consolidated Schedule of Investments As of March 31, 2023 (Continued) |
Additional information on restricted securities is as follows:
Security | First |
| Cost | ||
17Capital Co-Invest (B) SCSp | 9/23/2021 | $ | 25,090,931 | ||
ABPCI Pacific Funding LP | 6/9/2022 |
| 106,770,833 | ||
AG Direct Lending Fund II (Unlevered), L.P. | 3/31/2022 |
| 23,435,106 | ||
AG Direct Lending Fund II, L.P. | 3/31/2020 |
| 18,142,298 | ||
AG Direct Lending Fund III, L.P. | 6/28/2019 |
| 13,843,946 | ||
AG DLI, L.P. | 3/31/2022 |
| 8,138,331 | ||
AG GTDL Fund II, L.P. | 3/31/2022 |
| 23,603,103 | ||
AG GTDL Fund, L.P. | 3/31/2022 |
| 2,956,185 | ||
AG KFHDL Fund, L.P. | 3/31/2022 |
| 2,962,005 | ||
AGTB BDC Holdings, LP | 5/10/2022 |
| 125,000,000 | ||
Antares Loan Funding I Ltd. | 2/17/2023 |
| 103,200,000 | ||
Antares Senior Loan Parallel Feeder Fund II (Cayman) LP | 8/3/2022 |
| 25,995,953 | ||
Ares Commercial Finance LP | 3/31/2021 |
| 15,404,552 | ||
Ares Priority Loan Co-Invest LP | 1/25/2023 |
| 24,500,000 | ||
Ares Strategic Income Fund | 12/5/2022 |
| 26,673,300 | ||
Banner Ridge DSCO Fund II (Offshore), LP | 10/11/2022 |
| — | ||
Barings Capital Investment Corporation | 1/25/2021 |
| 95,000,000 | ||
Barings CMS Fund, LP | 12/28/2021 |
| 3,000,000 | ||
Barings Private Credit Corporation | 5/10/2021 |
| 900,000,000 | ||
BlackRock Shasta Senior Loan Fund VII, LLC | 2/10/2021 |
| 551,094,951 | ||
Carlyle Secured Lending III | 9/28/2022 |
| 3,750,000 | ||
CCOF Sierra II, L.P. | 8/2/2022 |
| 15,600,000 | ||
CDL Tender Fund 2022-1, L.P. | 4/4/2022 |
| 50,000,000 | ||
Chilly HP SCF Investor, LP | 2/9/2022 |
| 1,980,197 | ||
Comvest Structured Note Issuer I LLC | 11/17/2022 |
| 140,005,578 | ||
Crescent Mezzanine Partners VIIC, L.P. | 3/31/2021 |
| 5,426,693 | ||
Crestline Specialty Lending III (U.S.), L.P. | 8/30/2021 |
| 18,513,545 | ||
Endurance II Co-Invest, L.P. | 8/24/2020 |
| 9,754,940 | ||
FBLC Senior Loan Fund LLC | 4/1/2020 |
| 78,562,000 | ||
Franklin BSP Lending Corporation | 1/20/2021 |
| 30,483,901 | ||
Golub Capital BDC 4, Inc. | 4/21/2022 |
| 39,901,821 | ||
Golub Capital Direct Lending Corporation. | 7/13/2021 |
| 32,750,000 | ||
HPS Mezzanine Partners 2019, L.P. | 11/16/2020 |
| 8,233,224 | ||
HPS Mint Co-Invest Fund, L.P. | 5/25/2022 |
| 20,944,974 | ||
HPS Specialty Loan Fund V Feeder, L.P. | 5/14/2021 |
| 42,490,660 | ||
Luther Co-Invest, L.P. | 7/15/2022 |
| 14,579,288 | ||
Marlin Credit Opportunities Fund, L.P. | 5/21/2021 |
| 100,408,617 | ||
Middle Market Credit Fund II, LLC | 11/3/2020 |
| 12,708,191 | ||
Minerva Co-Invest, L.P. | 2/11/2022 |
| 14,720,019 | ||
Morgan Stanley Direct Lending Fund | 7/16/2021 |
| 39,339,489 |
See accompanying Notes to Consolidated Financial Statements.
57
Cliffwater Corporate Lending Fund |
Consolidated Schedule of Investments As of March 31, 2023 (Continued) |
Security | First |
| Cost | ||
New Mountain Guardian III BDC, L.L.C | 3/27/2020 | $ | 100,000,000 | ||
New Mountain Guardian IV BDC, L.L.C | 6/29/2022 |
| 7,500,000 | ||
NXT Capital Structured Note I L.L.C | 1/26/2022 |
| 93,695,908 | ||
Odyssey Co-Investment Partners B, LLC | 3/24/2022 |
| 1,555,423 | ||
Owl Rock Core Income Corp. | 7/29/2021 |
| 150,000,000 | ||
Owl Rock Technology Finance Corp. | 9/24/2020 |
| 35,000,000 | ||
Owl Rock Technology Finance Corp. II | 12/30/2021 |
| 38,437,905 | ||
Providence Debt Fund III (Non-US) L.P. | 3/31/2021 |
| 7,489,945 | ||
Proxima Co-Invest, L.P. | 11/2/2021 |
| 4,759,843 | ||
Raven Asset-Based Credit Fund II LP | 9/21/2021 |
| 18,009,990 | ||
Raven Senior Loan Fund LLC | 5/5/2022 |
| 454,636,092 | ||
Redwood Enhanced Income Corp. | 4/8/2022 |
| 32,716,582 | ||
Silver Point Loan Funding, LLC | 3/22/2022 |
| 552,749,005 | ||
Silver Point Specialty Credit Fund II, L.P. | 12/15/2020 |
| 41,326,575 | ||
Sixth Street Lending Partners | 8/31/2022 |
| 15,609,630 | ||
Stellus Private Credit BDC Feeder LP | 1/31/2022 |
| 13,687,742 | ||
Stone Point Credit Corporation | 12/30/2022 |
| 19,357,939 | ||
Summit Partners Credit Offshore Fund II, L.P. | 3/31/2022 |
| 6,932,335 | ||
TCW Direct Lending VIII LLC | 1/31/2022 |
| 22,009,914 | ||
Thompson Rivers, LLC | 6/29/2021 |
| 9,128,509 | ||
Varagon Capital Corporation | 5/23/2022 |
| 19,296,490 | ||
Varagon Capital Direct Lending Fund, L.P. | 3/25/2021 |
| 22,500,000 | ||
Varagon Structured Note Issuer I, LLC | 10/13/2021 |
| 415,000,000 | ||
Vista Credit Partners Fund III, L.P. | 9/15/2021 |
| 30,084,511 | ||
Waccamaw River LLC | 5/4/2021 |
| 11,278,065 | ||
Total | $ | 4,897,727,034 |
See accompanying Notes to Consolidated Financial Statements.
58
Cliffwater Corporate Lending Fund |
Consolidated Schedule of Swap Contracts As of March 31, 2023 |
SWAP CONTRACT
INTEREST RATE SWAPS
Counterparty1 | Payments | Payments Received/ | Termination | Notional | Upfront | Unrealized | ||||||||||
PNC Bank, N.A. | Daily Simple SOFR2 + 1.446% / Quarterly | 4.10% / Semi-annually | 3/28/2027 | $ | 650,000,000 | $ | — | $ | (21,526,922 | ) | ||||||
PNC Bank, N.A. | Daily Simple SOFR2 + 0.905% / Quarterly | 4.10% / Semi-annually | 3/28/2027 |
| 250,000,000 |
| — |
| (3,229,188 | ) | ||||||
PNC Bank, N.A. | Daily Simple SOFR2 + 2.619% / Quarterly | 7.06% / Semi-annually | 12/6/2025 |
| 34,000,000 |
| — |
| 450,607 |
| ||||||
PNC Bank, N.A. | Daily Simple SOFR2 + 3.005% / Quarterly | 7.10% / Semi-annually | 12/6/2027 |
| 95,000,000 |
| — |
| 2,431,809 |
| ||||||
PNC Bank, N.A. | Daily Simple SOFR2 + 3.010% / Quarterly | 7.10% / Semi-annually | 12/6/2027 |
| 10,000,000 |
| — |
| 254,327 |
| ||||||
PNC Bank, N.A. | Daily Simple SOFR2 + 3.214% / Quarterly | 7.17% / Semi-annually | 12/6/2029 |
| 141,000,000 |
| — |
| 5,036,856 |
| ||||||
MUFG Bank, Ltd. | Daily Simple SOFR2 + 2.052% / Quarterly | 5.44% / Semi-annually | 7/19/2025 |
| 215,000,000 |
| — |
| (3,543,278 | ) | ||||||
MUFG Bank, Ltd. | Daily Simple SOFR2 + 2.263% / Quarterly | 5.50% / Semi-annually | 7/19/2026 |
| 130,000,000 |
| — |
| (2,243,781 | ) | ||||||
MUFG Bank, Ltd. | Daily Simple SOFR2 + 2.477% / Quarterly | 5.61% / Semi-annually | 7/19/2027 |
| 130,000,000 |
| — |
| (2,389,609 | ) | ||||||
MUFG Bank, Ltd. | Daily Simple SOFR2 + 2.688% / Quarterly | 5.72% / Semi-annually | 7/19/2029 |
| 160,000,000 |
| — |
| (3,397,932 | ) | ||||||
MUFG Bank, Ltd. | Daily Simple SOFR2 + 2.245% / Quarterly | 5.50% / Semi-annually | 7/19/2026 |
| 10,000,000 |
| — |
| (166,654 | ) | ||||||
MUFG Bank, Ltd. | Daily Simple SOFR2 + 2.684% / Quarterly | 5.72% / Semi-annually | 7/19/2029 |
| 40,000,000 |
| — |
| (839,809 | ) | ||||||
|
|
|
| |||||||||||||
TOTAL INTEREST RATE SWAPS |
|
| $ | (29,163,574 | ) | |||||||||||
1 Instrument is used in a hedge accounting relationship. See Note 2, subsections Interest Rate Swap Contracts and Senior Notes.
2 Reset daily with a five business day look back.
See accompanying Notes to Consolidated Financial Statements.
59
Cliffwater Corporate Lending Fund |
Consolidated Schedule of Forward Foreign Currency Exchange Contracts As of March 31, 2023 |
FORWARD FOREIGN CURRENCY EXCHANGE CONTRACTS
Currency Sold | Counterparty | Currency | Settlement | Currency | Value at | Value at | Unrealized | |||||||||||||||
Australian Dollars | State Street | USD | May 17, 2023 | $ | (18,969,241 | ) | $ | (12,840,279 | ) | $ | (12,702,189 | ) | $ | 138,090 |
| |||||||
Australian Dollars | State Street | USD | June 06, 2023 |
| (2,808,577 | ) |
| (1,896,239 | ) |
| (1,882,093 | ) |
| 14,146 |
| |||||||
Australian Dollars | State Street | USD | June 30, 2023 |
| (13,591,930 | ) |
| (9,135,340 | ) |
| (9,116,044 | ) |
| 19,296 |
| |||||||
British Pound | State Street | USD | April 28, 2023 |
| (9,278,054 | ) |
| (11,492,725 | ) |
| (11,452,107 | ) |
| 40,618 |
| |||||||
British Pound | State Street | USD | May 03, 2023 |
| (11,756,421 | ) |
| (14,452,614 | ) |
| (14,513,007 | ) |
| (60,393 | ) | |||||||
British Pound | State Street | USD | May 04, 2023 |
| (2,014,326 | ) |
| (2,277,816 | ) |
| (2,486,685 | ) |
| (208,869 | ) | |||||||
British Pound | State Street | USD | May 10, 2023 |
| (1,752,605 | ) |
| (2,055,543 | ) |
| (2,163,852 | ) |
| (108,309 | ) | |||||||
British Pound | State Street | USD | June 14, 2023 |
| (5,484,832 | ) |
| (6,800,095 | ) |
| (6,776,138 | ) |
| 23,957 |
| |||||||
British Pound | State Street | USD | June 30, 2023 |
| (36,408,412 | ) |
| (45,133,891 | ) |
| (44,974,571 | ) |
| 159,320 |
| |||||||
British Pound | State Street | USD | July 31, 2023 |
| (1,369,914 | ) |
| (1,699,515 | ) |
| (1,692,987 | ) |
| 6,528 |
| |||||||
British Pound | State Street | USD | September 28, 2023 |
| (11,121,353 | ) |
| (13,803,601 | ) |
| (13,755,908 | ) |
| 47,693 |
| |||||||
British Pound | State Street | USD | September 29, 2023 |
| (14,934,532 | ) |
| (18,536,472 | ) |
| (18,472,665 | ) |
| 63,807 |
| |||||||
Canadian Dollars | State Street | USD | April 17, 2023 |
| (49,560,613 | ) |
| (36,625,022 | ) |
| (36,679,940 | ) |
| (54,918 | ) | |||||||
Canadian Dollars | State Street | USD | June 09, 2023 |
| (11,544,526 | ) |
| (8,396,019 | ) |
| (8,552,005 | ) |
| (155,986 | ) | |||||||
Canadian Dollars | State Street | USD | June 30, 2023 |
| (75,609,199 | ) |
| (55,941,756 | ) |
| (56,027,123 | ) |
| (85,367 | ) | |||||||
Euro | State Street | USD | April 28, 2023 |
| (18,290,312 | ) |
| (19,858,493 | ) |
| (19,866,867 | ) |
| (8,374 | ) | |||||||
Euro | State Street | USD | May 31, 2023 |
| (26,425,289 | ) |
| (28,566,029 | ) |
| (28,758,345 | ) |
| (192,316 | ) | |||||||
Euro | State Street | USD | June 05, 2023 |
| (540,533 | ) |
| (591,286 | ) |
| (588,425 | ) |
| 2,861 |
| |||||||
Euro | State Street | USD | June 13, 2023 |
| (27,071,584 | ) |
| (29,162,052 | ) |
| (29,483,762 | ) |
| (321,710 | ) | |||||||
Euro | State Street | USD | June 15, 2023 |
| (15,037,310 | ) |
| (16,218,641 | ) |
| (16,379,077 | ) |
| (160,436 | ) | |||||||
Euro | State Street | USD | June 21, 2023 |
| (916,609 | ) |
| (1,003,577 | ) |
| (998,742 | ) |
| 4,835 |
| |||||||
Euro | State Street | USD | June 30, 2023 |
| (240,072,417 | ) |
| (262,825,630 | ) |
| (261,581,636 | ) |
| 1,243,994 |
| |||||||
Euro | State Street | USD | September 29, 2023 |
| (3,453,939 | ) |
| (3,799,032 | ) |
| (3,781,223 | ) |
| 17,809 |
| |||||||
New Zealand Dollar | State Street | USD | June 30, 2023 |
| (6,317,429 | ) |
| (3,947,761 | ) |
| (3,948,471 | ) |
| (710 | ) | |||||||
Norwegian Krone | Marlin Equity Partners | USD | August 11, 2023 |
| (13,125,000 | ) |
| (1,451,399 | ) |
| (1,260,589 | ) |
| 190,810 |
| |||||||
Swedish Krona | Marlin Equity Partners | USD | August 23, 2024 |
| (11,250,000 | ) |
| (1,279,528 | ) |
| (1,108,630 | ) |
| 170,898 |
| |||||||
TOTAL FORWARD FOREIGN CURRENCY EXCHANGE CONTRACTS |
| $ | (609,790,355 | ) | $ | (609,003,081 | ) | $ | 787,274 |
| ||||||||||||
USD – U.S. Dollar
See accompanying Notes to Consolidated Financial Statements.
60
Cliffwater Corporate Lending Fund |
Consolidated Summary of Investments (Unaudited) As of March 31, 2023 |
Security Type/Sector | Percent of Total | ||
Senior Secured Loans |
| ||
Technology | 20.8 | % | |
Industrials | 19.4 | % | |
Health Care | 16.5 | % | |
Financials | 11.6 | % | |
Consumer Discretionary | 7.3 | % | |
Materials | 3.6 | % | |
Communications | 2.5 | % | |
Real Estate | 1.1 | % | |
Consumer Staples | 0.9 | % | |
Energy | 0.6 | % | |
Governments | 0.3 | % | |
Utilities | 0.2 | % | |
Total Senior Secured Loans | 84.8 | % | |
Private Investment Vehicles |
| ||
Private Collateralized Loan Obligations | 22.6 | % | |
Non-Listed Business Development Companies | 16.0 | % | |
Investment Partnerships | 4.9 | % | |
Joint Ventures | 0.8 | % | |
Special Purpose Vehicle for Preferred Equity | 0.5 | % | |
Special Purpose Vehicle for Senior Secured Bonds | 0.3 | % | |
Private Equity | 0.1 | % | |
Special Purpose Vehicle for Subordinated Debt | 0.1 | % | |
Total Private Investment Vehicles | 45.3 | % | |
Collateralized Loan Obligations | 0.8 | % | |
Preferred Stocks |
| ||
Technology | 0.4 | % | |
Health Care | 0.3 | % | |
Industrials | 0.1 | % | |
Total Preferred Stocks | 0.8 | % | |
Common Stocks |
| ||
Financials | 0.1 | % | |
Consumer Discretionary | 0.0 | % | |
Industrials | 0.0 | % | |
Total Common Stocks | 0.1 | % | |
Subordinated Debt |
| ||
Financials | 1.4 | % | |
Warrants |
| ||
Health Care | 0.0 | % | |
Technology | 0.0 | % | |
Energy | 0.0 | % | |
Total Warrants | 0.0 | % | |
Short-Term Investments | 0.7 | % | |
Total Investments | 133.9 | % | |
Senior Notes | (16.5 | )% | |
Liabilities in Excess of Other Assets | (17.4 | )% | |
Total Net Assets | 100.0 | % | |
See accompanying Notes to Consolidated Financial Statements.
61
Assets: |
| ||
Investments, at value (cost $14,793,091,558) | $ | 14,748,600,863 | |
Joint ventures, at value (cost $91,270,191) |
| 85,780,126 | |
Foreign currency, at value (cost $1,805,578) |
| 1,774,209 | |
Unrealized appreciation on forward foreign currency exchange contracts |
| 787,274 | |
Cash |
| 40,115,569 | |
Cash collateral for swap contracts |
| 48,410,000 | |
Receivables: |
| ||
Investment securities sold |
| 18,993,206 | |
Fund shares sold |
| 13,320,298 | |
Dividends and interest |
| 146,718,540 | |
Swap interest |
| 2,958,482 | |
Prepaid expenses |
| 3,188,055 | |
Prepaid commitment fees on secured credit facility |
| 11,100,879 | |
Total assets |
| 15,121,747,501 | |
| |||
Liabilities: |
| ||
Reverse repurchase agreements, at value (proceeds $3,870,000) |
| 3,870,000 | |
Unrealized depreciation on swap contracts |
| 29,163,574 | |
Payables: |
| ||
Senior notes (Net of deferred offering cost of $7,141,344) (Note 2) |
| 1,828,695,082 | |
Secured credit facility (Note 2) |
| 932,000,000 | |
Unfunded loan commitments (Note 2) |
| 1,219,116,687 | |
Investment securities purchased |
| 4,643,715 | |
Deferred tax liability |
| 1,421,142 | |
Interest on senior notes |
| 14,253,846 | |
Interest on secured credit facility |
| 3,751,244 | |
Interest on reverse repurchase agreements |
| 7,167 | |
Investment Management fees |
| 2,405,331 | |
Audit fees |
| 449,478 | |
Fund administration fees |
| 163,070 | |
Legal fees |
| 408,796 | |
Custody fees |
| 1,697,395 | |
Transfer Agency fees and expenses |
| 165,386 | |
Chief Compliance Officer fees |
| 10,417 | |
Other accrued expenses |
| 2,620,013 | |
Total liabilities |
| 4,044,842,343 | |
| |||
Net Assets | $ | 11,076,905,158 | |
| |||
Components of Net Assets: |
| ||
Paid-in capital (par value of $0.001 per share with an unlimited number of shares authorized) | $ | 10,853,836,787 | |
Total distributable earnings |
| 223,068,371 | |
Net Assets | $ | 11,076,905,158 | |
| |||
Class I Shares: |
| ||
Net assets applicable to shares outstanding | $ | 11,076,905,158 | |
Shares of beneficial interest issued and outstanding |
| 1,038,306,555 | |
Net asset value, offering, and redemption price per share | $ | 10.67 |
See accompanying Notes to Consolidated Financial Statements.
62
Cliffwater Corporate Lending Fund |
Consolidated Statement of Operations For the Year Ended March 31, 2023 |
Investment Income: |
|
| ||
Interest (net of withholding taxes of $279,223) | $ | 730,327,595 |
| |
PIK interest |
| 13,349,588 |
| |
Dividends |
| 5,492,002 |
| |
Distributions from private investment vehicles |
| 265,590,863 |
| |
Distributions from joint venture investments |
| 6,673,241 |
| |
Miscellaneous income |
| 881,439 |
| |
Total investment income |
| 1,022,314,728 |
| |
|
| |||
Expenses: |
|
| ||
Investment management fees |
| 91,395,208 |
| |
Interest on secured credit facility |
| 65,447,857 |
| |
Interest on reverse repurchase agreements |
| 183,915 |
| |
Interest on senior notes |
| 67,333,810 |
| |
Interest on secured borrowings |
| 18,679,699 |
| |
Interest on swap contracts |
| 5,243,410 |
| |
Legal fees |
| 1,501,221 |
| |
Fund administration fees |
| 5,707,493 |
| |
Registration fees |
| 786,242 |
| |
Transfer agent fees and expenses |
| 1,331,487 |
| |
Custody fees |
| 1,731,498 |
| |
Audit fees |
| 488,962 |
| |
Trustees’ fees and expenses |
| 300,000 |
| |
Shareholder reporting fees |
| 877,062 |
| |
Chief Compliance Officer fees |
| 77,965 |
| |
Insurance fees |
| 89,753 |
| |
Commitment fees on secured credit facility |
| 2,970,989 |
| |
Miscellaneous expenses |
| 5,471,745 |
| |
Total fees and expenses |
| 269,618,316 |
| |
Net investment income |
| 752,696,412 |
| |
|
| |||
Realized and Unrealized Gain (Loss): |
|
| ||
Net realized gain (loss) on: |
|
| ||
Investments |
| (8,476,399 | ) | |
Forward foreign currency exchange contracts |
| 4,252,987 |
| |
Foreign currency transactions |
| 8,200,700 |
| |
Net realized gain |
| 3,977,288 |
| |
Net change in unrealized appreciation/depreciation on: |
|
| ||
Investments |
| (112,403,450 | ) | |
Investments in joint ventures |
| (10,239,552 | ) | |
Forward foreign currency exchange contracts |
| 169,807 |
| |
Foreign currency translations |
| 1,925,113 |
| |
Deferred tax expense |
| (920,607 | ) | |
Net change in unrealized appreciation/(depreciation), net of deferred taxes |
| (121,468,689 | ) | |
Net realized and unrealized gain (loss) |
| (117,491,401 | ) | |
|
| |||
Net Increase in Net Assets from Operations | $ | 635,205,011 |
|
See accompanying Notes to Consolidated Financial Statements.
63
For the | For the Period | For the | ||||||||||
Net Increase in Net Assets from: |
|
|
|
|
|
| ||||||
Operations: |
|
|
|
|
|
| ||||||
Net investment income | $ | 752,696,412 |
| $ | 86,763,291 |
| $ | 158,812,770 |
| |||
Net realized gain/(loss) on investments, forward foreign currency exchange contracts and foreign currency transactions |
| 3,977,288 |
|
| 4,122,484 |
|
| 12,834,590 |
| |||
Net change in unrealized appreciation/(depreciation) on investments, forward foreign currency exchange contracts, foreign currency translations and deferred taxes |
| (121,468,689 | ) |
| 12,114,219 |
|
| 46,085,439 |
| |||
Net increase in net assets resulting from operations |
| 635,205,011 |
|
| 102,999,994 |
|
| 217,732,799 |
| |||
|
|
|
|
|
| |||||||
Distributions to shareholders: |
|
|
|
|
|
| ||||||
Distributions: |
|
|
|
|
|
| ||||||
Class I |
| (565,713,472 | ) |
| — |
|
| (173,398,542 | ) | |||
From return of capital: |
|
|
|
|
|
| ||||||
Class I |
| (122,545,406 | ) |
| — |
|
| (28,307,888 | ) | |||
Total |
| (688,258,878 | ) |
| — |
|
| (201,706,430 | ) | |||
|
|
|
|
|
| |||||||
Capital Transactions: |
|
|
|
|
|
| ||||||
Proceeds from shares sold: |
|
|
|
|
|
| ||||||
Class I |
| 5,201,847,669 |
|
| 2,007,446,986 |
|
| 4,062,844,184 |
| |||
Reinvestment of distributions: |
|
|
|
|
|
| ||||||
Class I |
| 233,479,444 |
|
| — |
|
| 62,384,398 |
| |||
Cost of shares repurchased: |
|
|
|
|
|
| ||||||
Class I |
| (1,048,151,552 | ) |
| (97,311,884 | ) |
| (156,498,524 | ) | |||
Net increase in net assets from capital transactions |
| 4,387,175,561 |
|
| 1,910,135,102 |
|
| 3,968,730,058 |
| |||
|
|
|
|
|
| |||||||
Net increase in net assets |
| 4,334,121,694 |
|
| 2,013,135,096 |
|
| 3,984,756,427 |
| |||
|
|
|
|
|
| |||||||
Net Assets: |
|
|
|
|
|
| ||||||
Beginning of period |
| 6,742,783,464 |
|
| 4,729,648,368 |
|
| 744,891,941 |
| |||
End of period | $ | 11,076,905,158 |
| $ | 6,742,783,464 |
| $ | 4,729,648,368 |
| |||
|
|
|
|
|
| |||||||
Capital Share Transactions: |
|
|
|
|
|
| ||||||
Shares sold: |
|
|
|
|
|
| ||||||
Class I |
| 490,074,099 |
|
| 187,681,586 |
|
| 382,870,006 |
| |||
Shares issued in reinvestment of distributions: |
|
|
|
|
|
| ||||||
Class I |
| 22,278,048 |
|
| — |
|
| 5,911,991 |
| |||
Shares redeemed: |
|
|
|
|
|
| ||||||
Class I |
| (98,700,669 | ) |
| (9,103,076 | ) |
| (14,649,800 | ) | |||
Net increase in capital shares outstanding |
| 413,651,478 |
|
| 178,578,510 |
|
| 374,132,197 |
| |||
* Fiscal year end changed to March 31, effective January 1, 2022.
See accompanying Notes to Consolidated Financial Statements.
64
Cliffwater Corporate Lending Fund |
Consolidated Statement of Cash Flows For the Year Ended March 31, 2023 |
Cash flows provided by (used in) operating activities: |
|
| ||
Net increase in net assets from operations | $ | 635,205,011 |
| |
Adjustments to reconcile net increase in net assets from operations to net cash provided by (used in) operating activities: |
|
| ||
Purchases of investments |
| (9,203,293,359 | ) | |
Sales of investments |
| 3,303,870,441 |
| |
Net accretion on investments |
| (11,967,552 | ) | |
Net realized gain on investments |
| 8,476,399 |
| |
Net realized gain on paydowns |
| (10,050,159 | ) | |
Net change in unrealized (appreciation)/depreciation |
| 122,643,002 |
| |
Return of capital distributions received |
| 108,023,317 |
| |
Original issue discount and amendment fees |
| (4,572,478 | ) | |
PIK interest |
| (13,349,588 | ) | |
Net change in deferred tax liability |
| 920,607 |
| |
Change in short-term investments, net |
| (2,108,701 | ) | |
(Increase)/Decrease in assets: |
|
| ||
Foreign currency |
| 184,747 |
| |
Investment securities sold |
| 869,329 |
| |
Dividends and interest |
| (63,110,867 | ) | |
Swap interest |
| (2,958,482 | ) | |
Prepaid expenses |
| (2,497,886 | ) | |
Prepaid commitment fees on secured credit facility |
| (1,368,058 | ) | |
Increase/(Decrease) in liabilities: |
|
| ||
Investment securities purchased |
| (74,870,327 | ) | |
Unfunded loan commitments |
| 151,459,657 |
| |
Investment management fees |
| 983,889 |
| |
Sub-advisory fees |
| (226,581 | ) | |
Interest on reverse repurchase agreements |
| 4,341 |
| |
Interest on secured credit facility |
| 3,660,463 |
| |
Interest on senior notes |
| 14,253,846 |
| |
Interest on secured borrowings |
| (166,705 | ) | |
Audit fees |
| 73,627 |
| |
Legal fees |
| 370,199 |
| |
Fund administration fees |
| (507,688 | ) | |
Custody fees |
| 1,108,458 |
| |
Transfer Agency fees and expenses |
| 19,796 |
| |
Chief Compliance Officer fees |
| (2,733 | ) | |
Other accrued expenses |
| 2,075,116 |
| |
Net cash used in operating activities |
| (5,036,848,919 | ) |
See accompanying Notes to Consolidated Financial Statements.
65
Cliffwater Corporate Lending Fund |
Consolidated Statement of Cash Flows For the Year Ended March 31, 2023 (Continued) |
Cash flows provided by (used in) financing activities: |
|
| ||
Proceeds from shares sold, net of receivable for fund shares sold | $ | 5,235,889,137 |
| |
Cost of shares repurchased |
| (1,048,151,552 | ) | |
Distributions paid to shareholders, net of reinvestments |
| (454,779,434 | ) | |
Proceeds from reverse repurchase agreements |
| 15,795,000 |
| |
Payments made on reverse repurchase agreements |
| (18,180,000 | ) | |
Proceeds from secured borrowings |
| 985,124,566 |
| |
Payments made on secured borrowings |
| (1,189,292,981 | ) | |
Proceeds from secured credit facility (see note 2) |
| 1,968,000,000 |
| |
Payments on secured credit facility (see note 2) |
| (1,643,000,000 | ) | |
Proceeds from senior notes |
| 1,215,000,000 |
| |
Net cash provided by financing activities |
| 5,066,404,736 |
| |
|
| |||
Net increase in cash and restricted cash |
| 29,555,817 |
| |
|
| |||
Cash and restricted cash |
|
| ||
Cash and restricted cash, beginning of year |
| 58,969,752 |
| |
Cash and restricted cash, end of year* | $ | 88,525,569 |
|
*Cash and restricted cash includes cash of $40,115,569 and cash deposited with broker for swap contracts of $48,410,000.
Non cash financing activities not included herein consist of $233,479,444 reinvested dividends.
Cash paid for interest on credit facility during the period was $61,787,394.
Cash paid for interest on reverse repurchase agreements during the period was $179,574.
Cash paid for interest on senior notes during the period was $53,246,669.
Cash paid for interest on secured borrowings during the period was $18,843,578.
See accompanying Notes to Consolidated Financial Statements.
66
Per share operating performance.
For a capital share outstanding throughout each period.
For the | For the Period | For the | For the | For the Period | ||||||||||||||||
Net asset value, beginning of period | $ | 10.79 |
| $ | 10.60 |
| $ | 10.35 |
| $ | 10.15 |
| $ | 10.00 |
| |||||
Income from Investment Operations: |
|
|
|
|
|
|
|
|
|
| ||||||||||
Net investment income1 |
| 0.87 |
|
| 0.16 |
|
| 0.72 |
|
| 0.72 |
|
| 0.34 |
| |||||
Net realized and unrealized gain (loss) on investments2 |
| (0.15 | ) |
| 0.03 |
|
| 0.27 |
|
| 0.19 |
|
| (0.04 | ) | |||||
Total income from investment operations |
| 0.72 |
|
| 0.19 |
|
| 0.99 |
|
| 0.91 |
|
| 0.30 |
| |||||
|
|
|
|
|
|
|
|
|
| |||||||||||
Less Distributions to shareholders: |
|
|
|
|
|
|
|
|
|
| ||||||||||
From net investment income |
| (0.69 | ) |
| — |
|
| (0.62 | ) |
| (0.62 | ) |
| (0.15 | ) | |||||
From return of capital |
| (0.15 | ) |
| — |
|
| (0.10 | ) |
| (0.09 | ) |
| — |
| |||||
From net realized gain |
| — |
|
| — |
|
| (0.02 | ) |
| —3 |
|
| —3 |
| |||||
Total Distributions to shareholders |
| (0.84 | ) |
| — |
|
| (0.74 | ) |
| (0.71 | ) |
| (0.15 | ) | |||||
|
|
|
|
|
|
|
|
|
| |||||||||||
Net asset value, end of period | $ | 10.67 |
| $ | 10.79 |
| $ | 10.60 |
| $ | 10.35 |
| $ | 10.15 |
| |||||
|
|
|
|
|
|
|
|
|
| |||||||||||
Total return4 |
| 7.06 | % |
| 1.79 | %5 |
| 10.38 | % |
| 9.25 | % |
| 3.05 | %5 | |||||
|
|
|
|
|
|
|
|
|
| |||||||||||
Ratios and Supplemental Data: |
|
|
|
|
|
|
|
|
|
| ||||||||||
Net assets, end of period (in thousands) | $ | 11,076,905 |
| $ | 6,742,783 |
| $ | 4,729,648 |
| $ | 744,892 |
| $ | 268,536 |
| |||||
|
|
|
|
|
|
|
|
|
| |||||||||||
Ratio of expenses to average net assets (excluding interest expense)7: |
|
|
|
|
|
|
|
|
|
| ||||||||||
Before fees waived and deferred tax expense |
| 1.23 | % |
| 1.28 | %6 |
| 1.32 | % |
| 1.80 | % |
| 2.25 | %6 | |||||
After fees waived |
| 1.23 | % |
| 1.28 | %6 |
| 1.32 | % |
| 1.80 | % |
| 1.78 | %6 | |||||
Deferred tax expense9 |
| 0.01 | % |
| — | % |
| — | % |
| — | % |
| — | %6 | |||||
With fees waived, after |
| 1.24 | % |
| 1.28 | % |
| 1.32 | % |
| 1.80 | % |
| 1.78 | %6 | |||||
Ratio of net investment income to average net assets (excluding interest expense)7: |
|
|
|
|
|
|
|
|
|
| ||||||||||
Before fees waived |
| 9.95 | % |
| 6.75 | %6 |
| 7.36 | % |
| 7.67 | % |
| 3.58 | %6 | |||||
After fees waived |
| 9.95 | % |
| 6.75 | %6 |
| 7.36 | % |
| 7.67 | % |
| 4.05 | %6 | |||||
See accompanying Notes to Consolidated Financial Statements.
67
Cliffwater Corporate Lending Fund |
Consolidated Financial Highlights Class I (Continued) |
For the | For the Period | For the | For the | For the Period | ||||||||||||||||
Ratio of expenses to average net assets (including interest expense, before taxes)7: |
|
|
|
|
|
|
|
|
|
| ||||||||||
Before fees waived, before taxes |
| 2.95 | % |
| 1.79 | %6 |
| 1.94 | % |
| 2.43 | % |
| 2.28 | %6 | |||||
After fees waived, before taxes |
| 2.95 | % |
| 1.79 | %6 |
| 1.94 | % |
| 2.43 | % |
| 1.81 | %6 | |||||
Deferred tax expense9 |
| 0.01 | % |
| — | % |
| — | % |
| — | % |
| — | %6 | |||||
With fees waived, interest and taxes |
| 2.96 | % |
| 1.79 | % |
| 1.94 | % |
| 2.43 | % |
| 1.81 | %6 | |||||
Ratio of net investment income to average net assets (including interest expense)7: |
|
|
|
|
|
|
|
|
|
| ||||||||||
Before fees waived |
| 8.23 | % |
| 6.24 | %6 |
| 6.74 | % |
| 7.04 | % |
| 3.55 | %6 | |||||
After fees waived |
| 8.23 | % |
| 6.24 | %6 |
| 6.74 | % |
| 7.04 | % |
| 4.02 | %6 | |||||
|
|
|
|
|
|
|
|
|
| |||||||||||
Senior Securities |
|
|
|
|
|
|
|
|
|
| ||||||||||
Total Amount Outstanding exclusive of Treasury Securities |
|
|
|
|
|
|
|
|
|
| ||||||||||
Reverse Repurchase Agreements8 | $ | 3,870,000 |
| $ | 6,255,000 |
| $ | 6,833,000 |
| $ | 12,557,000 |
| $ | 6,034,000 |
| |||||
Secured Borrowings8 |
| — |
|
| 204,168,415 |
|
| 249,990,230 |
|
| — |
|
| — |
| |||||
Senior Credit Facility |
| 932,000,000 |
|
| 607,000,000 |
|
| 1,195,000,000 |
|
| 190,000,000 |
|
| — |
| |||||
Senior Notes |
| 1,865,000,000 |
|
| 650,000,000 |
|
| — |
|
| — |
|
| — |
| |||||
Asset Coverage Per $1,000 of Borrowings |
|
|
|
|
|
|
|
|
|
| ||||||||||
Reverse Repurchase Agreements8 |
| 2,863,249 |
|
| 1,078,983 |
|
| 693,179 |
|
| 60,321 |
|
| 45,504 |
| |||||
Secured Borrowings8 |
| — |
|
| 34,026 |
|
| 19,919 |
|
| — |
|
| — |
| |||||
Senior Credit Facility |
| 12,885 |
|
| 12,108 |
|
| 4,958 |
|
| 4,916 |
|
| — |
| |||||
Senior Notes |
| 6,920 |
|
| 11,376 |
|
| — |
|
| — |
|
| — |
| |||||
|
|
|
|
|
|
|
|
|
| |||||||||||
Portfolio turnover rate |
| 26 | % |
| 16 | %5 |
| 29 | % |
| 29 | % |
| 15 | %5 | |||||
* Commencement of operations.
** Fiscal year end changed to March 31, effective January 1, 2022.
1 Based on average daily shares outstanding for the period.
2 Realized and unrealized gains and losses per share are balancing amounts necessary to reconcile the change in net asset value per share with the other per share information presented.
3 Amount represents less than $0.01 per share.
4 Total returns would have been lower had expenses not been waived by the Investment Manager. Returns shown do not reflect the deduction of taxes that a shareholder would pay on Fund distributions or the repurchase of Fund shares.
5 Not annualized.
6 Annualized.
7 These ratios exclude the impact of expenses of the underlying investment companies holdings as represented in the Schedule of Investments.
8 As a result of the Fund having earmarked or segregated securities to collateralize the transactions or otherwise having covered the transactions, in accordance with releases and interpretive letters issued by the Securities and Exchange Commission, the Fund does not treat its obligations under such transactions as senior securities representing indebtedness for purposes of the Investment Company Act of 1940.
9 Deferred tax expense estimate for the ratio calculation is derived from unrealized gain (losses).
See accompanying Notes to Consolidated Financial Statements.
68
1. Organization
The Cliffwater Corporate Lending Fund (the “Fund”) is a Delaware statutory trust registered under the Investment Company Act of 1940, as amended (the “Investment Company Act”), as a non-diversified, closed-end management investment company operating as an interval fund. The Fund operates under an Agreement and Declaration of Trust, as most recently amended and restated on September 15, 2021 (the “Declaration of Trust”). Cliffwater LLC serves as the investment adviser (the “Investment Manager”) of the Fund. The Investment Manager is an investment adviser registered with the Securities and Exchange Commission (the “SEC”) under the Investment Advisers Act of 1940, as amended. The Fund intends to continue to qualify and has elected to be treated as a regulated investment company under the Internal Revenue Code of 1986, as amended (the “Code”). The Fund commenced operations on March 6, 2019.
The SEC has granted the Fund exemptive relief permitting the Fund to offer multiple classes of shares. The Fund’s Registration Statement currently offers Class I Shares. Only Class I shares have been issued as of March 31, 2023.
The Fund’s primary investment objective is to seek consistent current income, while the Fund’s secondary objective is capital preservation. Under normal market conditions, the Fund seeks to achieve its investment objectives by investing at least 80% of its assets (net assets, plus any borrowings for investment purposes) in loans to companies (“corporate loans”). The Fund’s corporate loan investments are made through a combination of: (i) investing in loans to companies that are originated directly by a non-bank lender (for example, traditional direct lenders include asset management firms (on behalf of their investors), insurance companies, business development companies and specialty finance companies) (“direct loans”); (ii) investing in notes or other pass-through obligations representing the right to receive the principal and interest payments on a direct loan (or fractional portions thereof); (iii) purchasing asset-backed securities representing ownership or participation in a pool of direct loans; (iv) investing in companies and/or private investment funds (private funds that are excluded from the definition of “investment company” pursuant to Sections 3(c)(1) or 3(c)(7) of the Investment Company Act) that primarily hold direct loans (the foregoing investments listed in clauses (i) through (iv) are collectively referred to herein as the “Direct Loan Instruments”); (v) investments in high yield securities, including securities representing ownership or participation in a pool of such securities; (vi) investments in bank loans including securities representing ownership or participation in a pool of such loans; and (vii) SPVs and/or joint ventures that primarily hold loans or credit-like securities. The Fund may focus its investment strategy on, and its portfolio of investments may be focused in, a subset of one or more of these types of investments. The Fund’s investments in hedge funds and private equity funds that are excluded from the definition of “investment company” pursuant to Sections 3(c)(1) and 3(c)(7) of the Investment Company Act will be limited to no more than 15% of the Fund’s assets. The Fund may make non-U.S. investments, some of which may be denominated in currencies other than the U.S. dollar. In most cases, the currency fluctuations of investments will be hedged through the use of currency derivatives or other instruments. Most direct loans are not rated by any rating agency, will not be registered with the SEC or any state securities commission and will not be listed on any national securities exchange. The amount of public information available with respect to issuers of direct loans may generally be less extensive than that available for issuers of registered or exchange listed securities.
Consolidation of a Subsidiary
On February 3, 2020, CCLF SPV LLC (“CCLF SPV”) was formed as a limited liability company, and it is a wholly owned subsidiary of the Fund. The consolidated Schedule of Investments, Statement of Assets and Liabilities, Statements of Operations, Statements of Changes in Net Assets, Statement of Cash Flows and Financial Highlights of the Fund includes the accounts of CCLF SPV. All inter-company accounts and transactions have been eliminated in the consolidation for the Fund. As of March 31, 2023, net assets of the CCLF SPV were $3,576,225,802, or approximately 32.29% of the Fund’s total net assets.
On April 15, 2021, MCCW Holdings, LLC (“CCLF MCCW”) was formed as a limited liability company, and it is a wholly owned subsidiary of CCLF SPV. The consolidated Schedule of Investments, Statements of Assets and Liabilities, Statements of Operations, Statements of Changes in Net Assets, Statements of Cash Flows and Financial Highlights of the Fund includes the accounts of CCLF MCCW. All inter-company accounts and transactions have been eliminated in the consolidation for the Fund. As of March 31, 2023, net assets of the CCLF MCCW were $267,489,433, or approximately 2.41% of the Fund’s total net assets and are included in the net assets of CCLF SVP.
69
Cliffwater Corporate Lending Fund |
Notes to Consolidated Financial Statements March 31, 2023 (Continued) |
1. Organization (continued)
On May 25, 2021, CCLF Holdings LLC (“CCLF HOLD”) was formed as a limited liability company, and it is a wholly owned subsidiary of the Fund. The consolidated Schedule of Investments, Statements of Assets and Liabilities, Statements of Operations, Statements of Changes in Net Assets, Statements of Cash Flows and Financial Highlights of the Fund includes the accounts of CCLF HOLD. All inter-company accounts and transactions have been eliminated in the consolidation for the Fund. As of March 31, 2023, net assets of the CCLF HOLD were $20,471,759, or approximately 0.18% of the Fund’s total net assets.
On July 26, 2021, CCLF Holdings (D1) LLC (“CCLF HOLD (D1)”) was formed as a limited liability company, and is a wholly owned subsidiary of the Fund. The consolidated Schedule of Investments, Statements of Assets and Liabilities, Statements of Operations, Statements of Changes in Net Assets, Statements of Cash Flows and Financial Highlights of the Fund includes the accounts of CCLF HOLD (D1). All inter-company accounts and transactions have been eliminated in the consolidation for the Fund. As of March 31, 2023, net assets of the CCLF HOLD (D1) were $8,075,334, or approximately 0.07% of the Fund’s total net assets.
On July 26, 2021, CCLF Holdings (D2) LLC (“CCLF HOLD (D2)”) was formed as a limited liability company, and is a wholly owned subsidiary of the Fund. The consolidated Schedule of Investments, Statements of Assets and Liabilities, Statements of Operations, Statements of Changes in Net Assets, Statements of Cash Flows and Financial Highlights of the Fund includes the accounts of CCLF HOLD (D2). All inter-company accounts and transactions have been eliminated in the consolidation for the Fund. As of March 31, 2023, net assets of the CCLF HOLD (D2) were $258,354,473, or approximately 2.33% of the Fund’s total net assets.
On March 16, 2022, CCLF Holdings (D3) LLC (“CCLF HOLD (D3)”) was formed as a limited liability company, and is a wholly owned subsidiary of the Fund. The consolidated Schedule of Investments, Statements of Assets and Liabilities, Statements of Operations, Statements of Changes in Net Assets, Statements of Cash Flows and Financial Highlights of the Fund includes the accounts of CCLF HOLD (D3). All inter-company accounts and transactions have been eliminated in the consolidation for the Fund. As of March 31, 2023, net assets of the CCLF HOLD (D3) were $11,746,808, or approximately 0.11% of the Fund’s total net assets.
On June 14, 2022, KCLF Holdings LLC (“KCLF Holdings”) was formed as a limited liability company, and is a wholly owned subsidiary of the Fund. The consolidated Schedule of Investments, Statements of Assets and Liabilities, Statements of Operations, Statements of Changes in Net Assets, Statements of Cash Flows and Financial Highlights of the Fund includes the accounts of KCLF Holdings. All inter-company accounts and transactions have been eliminated in the consolidation for the Fund. As of March 31, 2023, net assets of the KCLF Holdings were $111,471,689, or approximately 1.01% of the Fund’s total net assets.
2. Significant Accounting Policies
Basis of Preparation and Use of Estimates
The Fund is an investment company and follows the accounting and reporting guidance under Financial Accounting Standards Board (“FASB”) Accounting Standards Codification (“ASC”) Topic 946, Financial Services — Investment Companies. The accompanying consolidated financial statements have been prepared in conformity with accounting principles generally accepted in the United States of America (“GAAP”). The preparation of the financial statements in accordance with GAAP requires management to make estimates and assumptions that affect the reported amounts of assets and liabilities and disclosure of contingent assets and liabilities at the date of the financial statements, as well as reported amounts of increases and decreases in net assets from operations during the reporting period. Actual results could differ from these estimates.
Investment Transactions and Related Investment Income
Investment transactions are accounted for on a trade-date basis. However, for daily net asset value (“NAV”) determination, portfolio securities transactions are reflected no later than in the first calculation on the first business day following trade date. Interest income is recognized on an accrual basis and includes, where applicable, the amortization of premium, accretion of discount and loan origination fees using the effective interest method over the respective term
70
Cliffwater Corporate Lending Fund |
Notes to Consolidated Financial Statements March 31, 2023 (Continued) |
2. Significant Accounting Policies (continued)
of the loan. Upon the prepayment of a loan or security, any unamortized loan origination fees, original issue discount and market discount are recorded as interest income. The Fund records prepayment premiums as interest income when it receives such amounts.
Interest income from investments in the “equity” class of collateralized loan obligation (“CLO”) funds will be recorded based upon an estimate of an effective yield to expected maturity utilizing assumed cash flows in accordance with FASB ASC 325-40, Beneficial Interests in Securitized Financial Assets. Effective yields for the CLO equity positions are updated generally once a quarter or on a transaction such as an add-on purchase, refinancing or reset. The estimated yield and investment cost may ultimately not be realized.
Realized gains and losses on investment transactions are determined using cost calculated on a specific identification basis. Paydown gains and losses are recorded as an adjustment to interest income in the consolidated Statements of Operations. Some or all of the interest payments of a loan or preferred equity may be structured in the form of PIK, which accrues to cost and principal on a current basis but is generally not paid in cash until maturity or some other determined payment date. Interest payments structured in the form of PIK are subject to the risk that a borrower could default when actual cash interest or principal payments are due. Dividends are recorded on the ex-dividend date. Distributions from private investments that represent returns of capital in excess of cumulative profits and losses are credited to investment cost rather than investment income.
Federal Income Taxes
The Fund intends to continue to qualify as a “regulated investment company” under Subchapter M of the Internal Revenue Code of 1986, as amended. As so qualified, the Fund will not be subject to federal income tax to the extent it distributes substantially all of its net investment income and capital gains to shareholders. Therefore, no federal income tax provision is required. Management of the Fund is required to determine whether a tax position taken by the Fund is more likely than not to be sustained upon examination by the applicable taxing authority, based on the technical merits of the position. Based on its analysis, there were no tax positions identified by management of the Fund that did not meet the “more likely than not” standard as of March 31, 2023.
The Fund’s policy is to classify interest and penalties associated with underpayment of federal and state income taxes as an income tax expense on the Consolidated Statements of Operations. For the year ended March 31, 2023, the Fund did not have interest or penalties associated with underpayment of income taxes.
CCLF SPV, CCLF MCCW, CCLF HOLD (D1), CCLF HOLD (D2), and KCLF Holdings are disregarded entities for income tax purposes. CCLF HOLD and CCLF HOLD (D3) are limited liability companies that have elected to be taxed as corporations and are therefore obligated to pay federal and state income tax on its taxable income. Currently, the federal income tax rate for a corporation is 21%. Deferred income taxes reflect the net tax effects of temporary differences between the carrying amounts of assets and liabilities for financial reporting purposes and the amounts used for income tax purposes. A valuation allowance is recognized if, based on the weight of available evidence, it is more likely than not that some portion or all of the deferred income tax asset will not be realized.
Distributions to Shareholders
Distributions are paid at least quarterly on the Shares in amounts representing substantially all of the Fund’s net investment income, if any, earned each year. The Fund determines annually whether to distribute any net realized long-term capital gains in excess of net realized short-term capital losses (including capital loss carryover); however, it may distribute any excess annually to its shareholders.
The exact amount of distributable income for each fiscal year can only be determined at the end of the Fund’s fiscal year, March 31. Under Section 19 of the Investment Company Act, the Fund is required to indicate the sources of certain distributions to shareholders. The estimated distribution composition may vary from quarter to quarter because it may be materially impacted by future income, expenses and realized gains and losses on securities and fluctuations in the value of the currencies in which Fund assets are denominated.
71
Cliffwater Corporate Lending Fund |
Notes to Consolidated Financial Statements March 31, 2023 (Continued) |
2. Significant Accounting Policies (continued)
Foreign Currency Translation
The Fund’s records are maintained in U.S. dollars. The value of securities, currencies and other assets and liabilities denominated in currencies other than U.S. dollars are translated into U.S. dollars based upon foreign exchange rates prevailing at the end of the reporting period. The currencies are translated into U.S. dollars by using the exchange rates quoted at the close of the London Stock Exchange prior to when the Fund’s NAV is next determined. Purchases and sales of investment securities, income and expenses are translated on the respective dates of such transactions.
The Fund does not isolate that portion of their net realized and unrealized gains and losses on investments resulting from changes in foreign exchange rates from the impact arising from changes in market prices. Such fluctuations are included with net realized and unrealized gain or loss from investments and foreign currency.
Net realized foreign currency transaction gains and losses arise from sales of foreign currencies, currency gains or losses realized between the trade and settlement dates on securities transactions, and the differences between the amounts of dividends, interest, and foreign withholding taxes recorded on the Fund’s books and the U.S. dollar equivalent of the amounts actually received or paid. Net unrealized foreign currency translation gains and losses arise from changes in the value of assets and liabilities, other than investments in securities, resulting from changes in the exchange rates.
Forward Foreign Currency Exchange Contracts
The Fund may utilize forward foreign currency exchange contracts (“forward contracts”) under which they are obligated to exchange currencies on specified future dates at specified rates, and are subject to the translations of foreign exchange rates fluctuations. All contracts are “marked-to-market” daily and any resulting unrealized gains or losses are recorded as unrealized appreciation or depreciation on foreign currency translations. The Fund records realized gains or losses at the time the forward contract is settled. Counter-parties to these forward contracts are major U.S. financial institutions. As of March 31, 2023, the Fund had twenty-six outstanding forward currency contracts sold short.
Interest Rate Swap Contracts
The Fund may engage in various swap transactions, including interest rate agreements, primarily to manage risk, or as alternatives to direct investments. Interest rate swaps are agreements between two parties to exchange cash flows based on a notional principal amount. The Fund may elect to pay a fixed rate and receive a floating rate or receive a fixed rate and pay a floating rate on a notional principal amount. The net interest received or paid on interest rate swap agreements is accrued daily as interest income/expense. Interest rate swaps are marked-to-market daily using fair value estimates provided by an independent pricing service. Pursuant to ASC Topic 815, Derivatives and Hedging, the Fund uses interest rate swaps to hedge its fixed rate debt. The Fund designated the interest rate swaps as the hedging instruments in effective hedge accounting relationships, and therefore the periodic payments are recognized as interest on swap contracts in the consolidated statement of operations. Depending on the nature of the balance at period end, the fair value of the interest rate swaps are either included as a derivative asset or derivative liability on the Fund’s consolidated statement of assets and liabilities. The change in fair value of the interest rate swaps is offset by a change in the carrying value of the fixed rate debt. Any amounts paid to the counterparties to cover collateral obligations under the terms of the interest rate swap agreements are included in cash deposited with brokers on the Fund’s consolidated statements of assets and liabilities. The risk of loss under a swap contract may exceed the amount recorded as an asset or a liability. As of March 31, 2023, the Fund had twelve outstanding interest rate swap contracts.
Collateralized Loan Obligations and Collateralized Debt Obligations
The Fund may invest in CLOs and Collateralized Debt Obligations (“CDOs”). CLOs and CDOs are created by the grouping of certain private loans and other lender assets/collateral into pools. A sponsoring organization establishes a special purpose vehicle to hold the assets/collateral and issue securities. Interests in these pools are sold as individual securities. Payments of principal and interest are passed through to investors and are typically supported by some form of credit enhancement, such as a letter of credit, surety bond, limited guaranty or senior/subordination. Payments from the asset pools may be divided into several different tranches of debt securities, offering investors various maturity and credit risk characteristics. Some tranches entitled to receive regular installments of principal and interest, other tranches entitled to receive regular installments of interest, with principal payable at maturity or upon specified call dates, and other tranches only entitled to receive payments of principal and accrued interest at maturity or upon specified call dates. Different tranches of securities will bear different interest rates, which may be fixed or floating.
72
Cliffwater Corporate Lending Fund |
Notes to Consolidated Financial Statements March 31, 2023 (Continued) |
2. Significant Accounting Policies (continued)
CLOs and CDOs are typically privately offered and sold, and thus, are not registered under the securities laws, which means less information about the security may be available as compared to publicly offered securities and only certain institutions may buy and sell them. As a result, investments in CLOs and CDOs may be characterized by the Fund as illiquid securities. An active dealer market may exist for CLOs and CDOs that can be resold in Rule 144A transactions, but there can be no assurance that such a market will exist or will be active enough for the Fund to sell such securities.
Participations and Assignments
The Fund may acquire interests in loans either directly (by way of original issuance, sale or assignment) or indirectly (by way of participation). The purchaser of an assignment typically succeeds to all the rights and obligations of the assigning institution and becomes a lender under the credit agreement with respect to the debt obligation; however, its rights can be more restricted than those of the assigning institution. Participation interests in a portion of a debt obligation typically result in a contractual relationship only with the institution participating in the interest, not with the borrower. In purchasing participations, the Fund generally will have no right to enforce compliance by the borrower with the terms of the loan agreement, nor any rights of set-off against the borrower, and the Fund may not directly benefit from the collateral supporting the debt obligation in which it has purchased the participation. As a result, the Fund will assume the credit risk of both the borrower and the institution selling the participation.
Commitments and Contingencies
Commercial loans purchased by the Fund (whether through participations or as a lender of record) may be structured to include both term loans, which are generally fully funded at the time of investment, and unfunded loan commitments, which are contractual obligations for future funding. Unfunded loan commitments may include revolving credit facilities and delayed draw term loans, which may obligate the Fund to supply additional cash to the borrower on demand, representing a potential financial obligation by the Fund in the future. The Fund may receive a commitment fee based on the undrawn portion of such unfunded loan commitments. The commitment fee is typically set as a percentage of the commitment amount. Commitment fees are processed as income when received and are part of the interest income in the Statement of Operations. As of March 31, 2023, the Fund received $8,473,696 in commitment fees. As of March 31, 2023, the Fund had the following unfunded loan commitments as noted in the Consolidated Schedule of Investments with a total principal amount of $1,219,116,687 reflected as unfunded loan commitments within the Consolidated Statement of Assets and Liabilities.
Borrower | Type | Principal | Value | |||||
123Dentist, Inc. | Delayed Draw | $ | 6,681,175 | $ | 4,927,843 | |||
123Dentist, Inc. | Delayed Draw |
| 3,333,333 |
| 2,446,228 | |||
1364720 B.C. LTD | Delayed Draw |
| 5,000,000 |
| 3,687,856 | |||
1364720 B.C. LTD | Revolver |
| 2,000,000 |
| 1,467,730 | |||
A1 Garage Equity, LLC | Delayed Draw |
| 3,143,561 |
| 3,093,435 | |||
A1 Garage Equity, LLC | Revolver |
| 1,515,152 |
| 1,472,172 | |||
AAH Topco, LLC | Delayed Draw |
| 1,423,117 |
| 1,379,395 | |||
AAH Topco, LLC | Revolver |
| 423,729 |
| 407,527 | |||
Abracon Group Holdings, LLC | Delayed Draw |
| 4,326,923 |
| 4,314,384 | |||
Abracon Group Holdings, LLC | Delayed Draw |
| 2,163,462 |
| 2,157,192 | |||
Abracon Group Holdings, LLC | Revolver |
| 865,385 |
| 860,472 | |||
Abracon Group Holdings, LLC | Revolver |
| 1,730,769 |
| 1,725,754 | |||
ACI Group Holdings, Inc. | Delayed Draw |
| 2,214,643 |
| 2,167,014 | |||
ADCS Clinics Intermediate Holdings, LLC | Delayed Draw |
| 5,433,471 |
| 5,015,595 | |||
Adenza Group, Inc. | Delayed Draw |
| 713,267 |
| 711,004 | |||
Adenza Group, Inc. | Revolver |
| 731,098 |
| 721,455 | |||
ADMA Bilogics, Inc. | Delayed Draw |
| 3,571,429 |
| 3,561,079 | |||
73
Cliffwater Corporate Lending Fund |
Notes to Consolidated Financial Statements March 31, 2023 (Continued) |
2. Significant Accounting Policies (continued)
Borrower | Type | Principal | Value | |||||
Advarra Holdings, Inc. | Delayed Draw | $ | 352,200 | $ | 349,118 | |||
AEC Parent Holdings, Inc. | Delayed Draw |
| 1,123,541 |
| 1,103,092 | |||
Affinipay Midco, LLC | Delayed Draw |
| 4,640,884 |
| 4,640,884 | |||
Affinipay Midco, LLC | Revolver |
| 2,209,945 |
| 2,191,642 | |||
Affinity Hospice Intermediate Holdings, LLC | Delayed Draw |
| 2,724,335 |
| 2,654,281 | |||
AG-Twin Brook Healthcare | Delayed Draw |
| 9,930,556 |
| 9,840,067 | |||
AHR Intermediate, Inc. | Delayed Draw |
| 10,500,000 |
| 10,424,719 | |||
Air Comm Corporation, LLC | Revolver |
| 1,136,951 |
| 1,107,715 | |||
Air Comm Corporation, LLC | Revolver |
| 571,216 |
| 556,527 | |||
Alcami Corporation | Delayed Draw |
| 1,908,023 |
| 1,844,343 | |||
Alcami Corporation | Revolver |
| 3,052,838 |
| 2,950,949 | |||
Alera Group Holdings, Inc. | Delayed Draw |
| 510,853 |
| 500,636 | |||
Alera Group Holdings, Inc. | Delayed Draw |
| 1,012,500 |
| 989,594 | |||
Alpine Acquisition Corp. | Revolver |
| 428,281 |
| 406,542 | |||
Amba Buyer, Inc. | Delayed Draw |
| 14,257,915 |
| 13,784,159 | |||
Amerilife Holdings LLC | Delayed Draw |
| 1,636,364 |
| 1,577,893 | |||
Amerilife Holdings LLC | Revolver |
| 2,454,545 |
| 2,354,544 | |||
Any Hour, LLC | Revolver |
| 2,000,000 |
| 1,943,563 | |||
Apex Service Partners, LLC | Revolver |
| 1,000,000 |
| 981,800 | |||
Appfire Technologies, LLC | Delayed Draw |
| 8,791,021 |
| 8,736,710 | |||
Appfire Technologies, LLC | Revolver |
| 924,000 |
| 912,089 | |||
Applied Technical Services LLC | Delayed Draw |
| 1,340,909 |
| 1,312,340 | |||
Applied Technical Services LLC | Revolver |
| 250,000 |
| 244,098 | |||
Apptio, Inc. | Revolver |
| 92,871 |
| 91,297 | |||
Apryse Software Corp. | Delayed Draw |
| 1,625,000 |
| 1,606,974 | |||
AQ Sunshine, Inc. | Revolver |
| 200,000 |
| 193,354 | |||
Arcstor Midco LLC | First Lien Term Loan |
| 96,063 |
| 78,022 | |||
Armada Parent, Inc. | Delayed Draw |
| 1,000,000 |
| 985,707 | |||
Armada Parent, Inc. | Revolver |
| 2,383,333 |
| 2,349,269 | |||
ASG II, LLC | Delayed Draw |
| 3,281,391 |
| 3,245,010 | |||
Aspen Opco, LLC | Revolver |
| 2,840,909 |
| 2,774,974 | |||
Associations, Inc. | Revolver |
| 18,366,667 |
| 18,313,441 | |||
Auveco Holdings, Inc. | Delayed Draw |
| 1,973,684 |
| 1,903,160 | |||
Auveco Holdings, Inc. | Revolver |
| 986,842 |
| 951,580 | |||
AVALARA, Inc. | Revolver |
| 2,727,273 |
| 2,664,442 | |||
AWT Merger Sub, Inc. | Revolver |
| 928,571 |
| 907,020 | |||
Beacon Mobility Corp. | Revolver |
| 807,969 |
| 786,788 | |||
Bendon | Revolver |
| 1,800,000 |
| 1,722,157 | |||
Benefit Street Technology | Delayed Draw |
| 4,444,444 |
| 4,318,610 | |||
Benefit Street Technology | Revolver |
| 1,333,333 |
| 1,313,475 | |||
Berlin Packaging LLC | Delayed Draw |
| 2,828,099 |
| 2,711,582 | |||
Beta Plus Technologies, Inc. | Revolver |
| 4,669,900 |
| 4,577,158 | |||
BetterCloud, Inc. | Revolver |
| 2,512,669 |
| 2,468,578 | |||
BetterCloud, Inc. | Revolver |
| 3,801,052 |
| 3,790,037 | |||
Bigtime Software, Inc. | Revolver |
| 2,327,586 |
| 2,314,372 | |||
74
Cliffwater Corporate Lending Fund |
Notes to Consolidated Financial Statements March 31, 2023 (Continued) |
2. Significant Accounting Policies (continued)
Borrower | Type | Principal | Value | |||||
Biocare Medical LLC | Revolver | $ | 2,583,333 | $ | 2,497,495 | |||
Blackbird Purchaser, Inc. | Delayed Draw |
| 6,406,542 |
| 6,209,714 | |||
BlueHalo Global Holdings, LLC | Revolver |
| 529,412 |
| 517,125 | |||
Bounteous, Inc. | Delayed Draw |
| 4,300,000 |
| 3,941,726 | |||
Bounteous, Inc. | Revolver |
| 558,000 |
| 511,508 | |||
BradyIFS Holdings LLC | Delayed Draw |
| 2,256,157 |
| 2,211,034 | |||
BusinesSolver.com, Inc. | Delayed Draw |
| 1,260,606 |
| 1,259,593 | |||
Carevet LLC | Delayed Draw |
| 4,530,505 |
| 4,466,205 | |||
CC SAG Acquisition Corp. | Delayed Draw |
| 1,356,643 |
| 1,291,505 | |||
CC SAG Acquisition Corp. | Revolver |
| 699,301 |
| 665,724 | |||
CC WDW Borrower, Inc. | Delayed Draw |
| 1,631,196 |
| 1,607,799 | |||
Certify Inc. | Revolver |
| 604,839 |
| 599,284 | |||
Cerity Partners, LLC | Delayed Draw |
| 17,500,000 |
| 16,977,160 | |||
Cerity Partners, LLC | Revolver |
| 443,192 |
| 412,926 | |||
CFGI Holdings, LLC | Delayed Draw |
| 2,189,781 |
| 2,138,958 | |||
CFGI Holdings, LLC | Revolver |
| 1,751,825 |
| 1,698,003 | |||
Cherry Bekaert Advisory LLC | Revolver |
| 1,661,392 |
| 1,626,994 | |||
Chronicle Bidco, Inc. | Delayed Draw |
| 4,730,254 |
| 4,659,300 | |||
Chronicle Bidco, Inc. | Delayed Draw |
| 4,476,202 |
| 4,409,059 | |||
Citrin Cooperman Advisors, LLC | Delayed Draw |
| 448,163 |
| 440,403 | |||
Citrin Cooperman Advisors, LLC | Delayed Draw |
| 14,472,727 |
| 14,067,230 | |||
Citrin Cooperman Advisors, LLC | Delayed Draw |
| 1,137,931 |
| 1,118,227 | |||
Cleo Communications Holding, LLC | Revolver |
| 2,140,000 |
| 2,067,607 | |||
Club Car Wash | Delayed Draw |
| 2,142,334 |
| 2,078,064 | |||
CNSI Holdings LLC | Revolver |
| 1,735,776 |
| 1,678,101 | |||
Cobham Holdings, Inc. | Revolver |
| 2,343,750 |
| 2,273,727 | |||
Community Medical Acquisition Corp. | Delayed Draw |
| 4,333,814 |
| 4,178,957 | |||
Community Medical Acquisition Corp. | Revolver |
| 2,578,774 |
| 2,467,252 | |||
Connect America.com, LLC | Revolver |
| 216,146 |
| 202,901 | |||
Consolidated Label Co. | Revolver |
| 1,339,286 |
| 1,301,493 | |||
Consolidated Label Co. | Revolver |
| 578,516 |
| 562,191 | |||
CORA Health Holdings Corp. | Delayed Draw |
| 5,169,567 |
| 4,958,951 | |||
CORA Health Holdings Corp. | Revolver |
| 134,615 |
| 129,131 | |||
Coretrust Purchasing Group LLC | Delayed Draw |
| 596,443 |
| 587,496 | |||
Coretrust Purchasing Group LLC | Revolver |
| 250,000 |
| 242,500 | |||
Coretrust Purchasing Group LLC | Delayed Draw |
| 2,819,549 |
| 2,785,518 | |||
Coretrust Purchasing Group LLC | Revolver |
| 2,819,549 |
| 2,743,099 | |||
Coupa Holdings, LLC | Delayed Draw |
| 395,719 |
| 390,003 | |||
Coupa Holdings, LLC | Delayed Draw |
| 2,313,799 |
| 2,280,376 | |||
Coupa Holdings, LLC | Revolver |
| 1,771,654 |
| 1,723,960 | |||
Covaris Intermediate 3, LLC | Delayed Draw |
| 5,921,053 |
| 5,667,957 | |||
Covaris Intermediate 3, LLC | Revolver |
| 789,474 |
| 755,728 | |||
CPC/Cirtec Holdings, Inc. | Revolver |
| 826,873 |
| 797,766 | |||
CPF Dental, LLC | Delayed Draw |
| 587,121 |
| 574,082 | |||
Credit Connection, LLC | Revolver |
| 600,000 |
| 595,142 | |||
75
Cliffwater Corporate Lending Fund |
Notes to Consolidated Financial Statements March 31, 2023 (Continued) |
2. Significant Accounting Policies (continued)
Borrower | Type | Principal | Value | |||||
CRS TH Holdings Corp | Revolver | $ | 4,237,288 | $ | 3,961,924 | |||
D4C Dental Brands, Inc. | Delayed Draw |
| 376,772 |
| 378,653 | |||
D4C Dental Brands, Inc. | Revolver |
| 357,143 |
| 356,108 | |||
DataLink, LLC | Revolver |
| 620,968 |
| 586,337 | |||
Deca Dental Holdings, LLC | Delayed Draw |
| 3,333,333 |
| 3,195,859 | |||
Deca Dental Holdings, LLC | Revolver |
| 74,074 |
| 71,019 | |||
Denali Midco 2 LLC | Delayed Draw |
| 4,300,000 |
| 4,165,657 | |||
Disco Parent, LLC | Revolver |
| 331,390 |
| 323,105 | |||
DOCS MSO LLC | Delayed Draw |
| 3,629,032 |
| 3,536,080 | |||
DOCS MSO LLC | Revolver |
| 967,742 |
| 942,955 | |||
DOCS MSO LLC | Delayed Draw |
| 2,419,355 |
| 2,357,386 | |||
DOCS MSO LLC | Revolver |
| 645,161 |
| 628,636 | |||
DTI Holdco, Inc. | Revolver |
| 102,309 |
| 94,687 | |||
Dwyer Instruments, Inc. | Delayed Draw |
| 1,912,917 |
| 1,887,684 | |||
Dwyer Instruments, Inc. | Revolver |
| 618,196 |
| 605,397 | |||
Dwyer Instruments, Inc. | Revolver |
| 1,620,617 |
| 1,587,063 | |||
Easy Ice, LLC | Delayed Draw |
| 4,322,257 |
| 4,265,243 | |||
EdgeCo Buyer, Inc. | Delayed Draw |
| 10,000,000 |
| 9,685,757 | |||
EDPO, LLC | Delayed Draw |
| 713,333 |
| 689,631 | |||
Emmes Blocker, Inc. | Delayed Draw |
| 7,107,473 |
| 7,049,322 | |||
Emmes Blocker, Inc. | Delayed Draw |
| 3,475,610 |
| 3,447,173 | |||
EP Wealth Advisors, LLC | Delayed Draw |
| 8,640,000 |
| 8,525,494 | |||
ERC Holdings, LLC | Revolver |
| 852,071 |
| 808,820 | |||
ERC Holdings, LLC | Revolver |
| 3,994,755 |
| 3,791,982 | |||
ESG Investments, Inc. | Delayed Draw |
| 8,035,714 |
| 7,507,066 | |||
ESG Investments, Inc. | Revolver |
| 2,142,857 |
| 2,001,884 | |||
Explorer Investor, Inc. | Delayed Draw |
| 5,232,558 |
| 4,903,165 | |||
Fingerpaint Marketing, Inc. | Delayed Draw |
| 2,335,714 |
| 2,293,968 | |||
Fingerpaint Marketing, Inc. | Revolver |
| 1,209,677 |
| 1,163,423 | |||
FLS Holding, Inc. | Revolver |
| 2,000,000 |
| 1,971,014 | |||
Formerra LLC | Delayed Draw |
| 237,231 |
| 233,376 | |||
Fortis Life Sciences, LLC | Delayed Draw |
| 8,671,280 |
| 8,404,872 | |||
Fortis Life Sciences, LLC | Revolver |
| 1,095,652 |
| 1,061,990 | |||
Fortis Solutions Group, LLC | Delayed Draw |
| 9,940,000 |
| 9,843,737 | |||
Fortis Solutions Group, LLC | Revolver |
| 1,559,220 |
| 1,491,947 | |||
Foundation Risk Partners, Corp. | Delayed Draw |
| 5,090,909 |
| 5,004,458 | |||
Foundation Risk Partners, Corp. | Delayed Draw |
| 4,772,727 |
| 4,691,679 | |||
FQSR, LLC | Delayed Draw |
| 3,875,488 |
| 3,659,356 | |||
FSS Buyer LLC | Revolver |
| 1,610,390 |
| 1,563,334 | |||
Gainsight, Inc. | Revolver |
| 2,625,000 |
| 2,502,275 | |||
Galway Borrower, LLC | Delayed Draw |
| 261,395 |
| 250,745 | |||
Galway Borrower, LLC | Revolver |
| 545,223 |
| 523,010 | |||
Galway Borrower, LLC | Revolver |
| 576,059 |
| 552,589 | |||
Galway Borrower, LLC | Revolver |
| 293,856 |
| 281,884 | |||
Galway Borrower, LLC | Delayed Draw |
| 127,566 |
| 122,369 | |||
Galway Borrower, LLC | Revolver |
| 690,616 |
| 662,479 | |||
76
Cliffwater Corporate Lending Fund |
Notes to Consolidated Financial Statements March 31, 2023 (Continued) |
2. Significant Accounting Policies (continued)
Borrower | Type | Principal | Value | |||||
Gateway US Holdings, Inc. | Delayed Draw | $ | 800,000 | $ | 777,849 | |||
Gateway US Holdings, Inc. | Delayed Draw |
| 191,424 |
| 186,124 | |||
Gateway US Holdings, Inc. | Revolver |
| 409,091 |
| 397,763 | |||
GovBrands Intermediate, Inc. | Delayed Draw |
| 905,972 |
| 866,157 | |||
GovBrands Intermediate, Inc. | Revolver |
| 91,700 |
| 87,670 | |||
Govdelivery Holdings, LLC | Revolver |
| 254,493 |
| 249,862 | |||
Govdelivery Holdings, LLC | First Lien Term Loan |
| 7,063 |
| 6,935 | |||
Graffiti Buyer, Inc. | Delayed Draw |
| 3,755,737 |
| 3,630,942 | |||
Graffiti Buyer, Inc. | Revolver |
| 959,550 |
| 927,666 | |||
Groundworks, LLC | Delayed Draw |
| 2,617,801 |
| 2,577,722 | |||
Groundworks, LLC | Revolver |
| 837,696 |
| 813,441 | |||
GSV Holding, LLC | Delayed Draw |
| 16,535,262 |
| 16,192,905 | |||
Helium Acquirer Corporation | Delayed Draw |
| 3,313,620 |
| 3,267,993 | |||
Helium Acquirer Corporation | Revolver |
| 1,325,448 |
| 1,287,291 | |||
Higginbotham Insurance Agency, Inc. | Delayed Draw |
| 9,557,129 |
| 9,456,914 | |||
Higginbotham Insurance Agency, Inc. | Delayed Draw |
| 5,357,500 |
| 5,301,322 | |||
HPS Specialty Loan Fund V Feeder LP | First Lien Term Loan |
| 71,250,000 |
| 71,250,000 | |||
HPS Technology | Delayed Draw |
| 18,029,232 |
| 21,702,278 | |||
HS Spa Holdings, Inc. | Revolver |
| 311,429 |
| 303,608 | |||
HSI Halo Acquisition, Inc. | Revolver |
| 175,000 |
| 171,815 | |||
iCIMS, Inc. | Revolver |
| 184,671 |
| 181,541 | |||
iCIMS, Inc. | Revolver |
| 1,904,761 |
| 1,872,480 | |||
Iconic Purchaser Corporation | Revolver |
| 1,025,641 |
| 1,006,358 | |||
IG Investments | Revolver |
| 722,543 |
| 716,632 | |||
Imagine Acquisitionco, Inc. | Delayed Draw |
| 1,607,717 |
| 1,554,296 | |||
Imagine Acquisitionco, Inc. | Revolver |
| 1,157,556 |
| 1,119,093 | |||
Indigo Buyer, Inc. | Revolver |
| 1,666,667 |
| 1,639,673 | |||
Innovetive Petcare, LLC | Delayed Draw |
| 587,633 |
| 579,881 | |||
insightsoftware | Revolver |
| 690,589 |
| 687,637 | |||
Integrated Oncology Network, LLC | Revolver |
| 83,957 |
| 83,714 | |||
Integrated Oncology Network, LLC | Delayed Draw |
| 1,114,395 |
| 1,111,165 | |||
Integrated Oncology Network, LLC | Revolver |
| 134,701 |
| 134,311 | |||
Integrated Power Services | Revolver |
| 2,225,125 |
| 2,145,617 | |||
Integrity Marketing Acquisition, LLC | Delayed Draw |
| 2,927,367 |
| 2,874,089 | |||
Integrity Marketing Acquisition, LLC | Revolver |
| 1,477,496 |
| 1,362,990 | |||
Invicti Intermediate 2, LLC | Revolver |
| 1,090,909 |
| 1,049,196 | |||
IQN Holding Corp. | Delayed Draw |
| 1,335,080 |
| 1,329,507 | |||
IQN Holding Corp. | Revolver |
| 577,540 |
| 572,757 | |||
Isaac Heating & Air Conditioning | Delayed Draw |
| 947,368 |
| 923,008 | |||
Isaac Heating & Air Conditioning | Revolver |
| 2,368,421 |
| 2,307,520 | |||
Island Energy Services | Delayed Draw |
| 2,894,230 |
| 2,804,632 | |||
IvyRehab Intermediate II, LLC | Delayed Draw |
| 882,675 |
| 833,450 | |||
IvyRehab Intermediate II, LLC | Revolver |
| 3,837,719 |
| 3,604,470 | |||
J S Held, LLC | Delayed Draw |
| 7,620,004 |
| 7,581,324 | |||
JTM Foods, LLC | Revolver |
| 559,597 |
| 539,601 | |||
JTM Foods, LLC | Delayed Draw |
| 386,122 |
| 372,325 | |||
77
Cliffwater Corporate Lending Fund |
Notes to Consolidated Financial Statements March 31, 2023 (Continued) |
2. Significant Accounting Policies (continued)
Borrower | Type | Principal | Value | |||||
Kaseya, Inc. | Delayed Draw | $ | 4,100,000 | $ | 4,068,098 | |||
Kaseya, Inc. | Revolver |
| 4,100,000 |
| 4,068,098 | |||
KBP Investments LLC | Delayed Draw |
| 3,444,691 |
| 3,252,584 | |||
Kensington Private Equity Fund | Delayed Draw |
| 6,800,000 |
| 6,708,959 | |||
Keystone Agency Investors | Delayed Draw |
| 6,163,035 |
| 6,054,572 | |||
Komline-Sanderson Group, Inc. | Delayed Draw |
| 4,687,500 |
| 4,416,691 | |||
Komline-Sanderson Group, Inc. | Revolver |
| 2,343,750 |
| 2,208,345 | |||
KPSKY Acquisition, Inc. | Delayed Draw |
| 3,812,500 |
| 3,801,452 | |||
KWOR Acquisition, Inc. | Delayed Draw |
| 15,313,231 |
| 15,072,883 | |||
KWOR Acquisition, Inc. | Revolver |
| 1,154,699 |
| 1,125,007 | |||
Lav Gear Holdings, Inc. | Delayed Draw |
| 3,508,728 |
| 3,403,466 | |||
Liberty Purchaser, LLC | Delayed Draw |
| 48,430 |
| 46,977 | |||
Liberty Purchaser, LLC | Revolver |
| 665,915 |
| 645,938 | |||
Life Science Intermediate Holdings, LLC | Revolver |
| 188,281 |
| 181,374 | |||
Life Science Intermediate Holdings, LLC | Revolver |
| 468,376 |
| 451,194 | |||
Lithium Technologies, LLC | Revolver |
| 367,018 |
| 357,580 | |||
LJ Avalon Holdings, LLC | Delayed Draw |
| 4,525,862 |
| 4,448,923 | |||
LJ Avalon Holdings, LLC | Revolver |
| 1,810,345 |
| 1,752,469 | |||
LJ Avalon Holdings, LLC | Delayed Draw |
| 2,586,207 |
| 2,542,242 | |||
LJ Avalon Holdings, LLC | Revolver |
| 1,034,483 |
| 1,001,411 | |||
LJ Perimeter Buyer, Inc. | Delayed Draw |
| 2,964,579 |
| 2,920,111 | |||
LJ Perimeter Buyer, Inc. | Delayed Draw |
| 2,106,177 |
| 2,079,527 | |||
LMG Holdings, Inc. | Revolver |
| 285,714 |
| 283,177 | |||
Majco LLC | Delayed Draw |
| 3,250,000 |
| 3,166,430 | |||
Majco LLC | Revolver |
| 1,266,667 |
| 1,230,923 | |||
ManTech International Corporation | Delayed Draw |
| 13,379,260 |
| 13,216,998 | |||
ManTech International Corporation | Revolver |
| 6,744,017 |
| 6,594,931 | |||
Margaritaville Enterprises LLC | Delayed Draw |
| 5,108,297 |
| 4,934,793 | |||
Margaritaville Enterprises LLC | Revolver |
| 312,500 |
| 301,886 | |||
MB2 Dental Solutions, LLC | Delayed Draw |
| 1,805,556 |
| 1,792,324 | |||
MBS Holdings, Inc. | Revolver |
| 1,271,186 |
| 1,232,132 | |||
Mc Group Ventures Corporation | Delayed Draw |
| 1,634,615 |
| 1,608,141 | |||
Mclarens Midco, Inc. | Revolver |
| 580,838 |
| 567,357 | |||
Measurabl, Inc. | First Lien Term Loan |
| 200,000 |
| 197,979 | |||
Mindbody, Inc. | Revolver |
| 1,428,571 |
| 1,398,993 | |||
MN Acquisition, Inc. | Revolver |
| 2,166,667 |
| 2,089,247 | |||
Motion & Control Enterprises LLC | Delayed Draw |
| 1,644,122 |
| 1,615,653 | |||
Motion & Control Enterprises LLC | Revolver |
| 1,283,821 |
| 1,242,379 | |||
MRI Software LLC | Delayed Draw |
| 5,645,000 |
| 5,450,644 | |||
MRI Software LLC | Revolver |
| 2,159,885 |
| 2,085,521 | |||
National Dentex Labs LLC | Delayed Draw |
| 390,805 |
| 383,790 | |||
National Dentex Labs LLC | Revolver |
| 137,931 |
| 135,455 | |||
Netwrix Corporation And Concept Searching, Inc. | Delayed Draw |
| 10,882,133 |
| 10,793,099 | |||
Netwrix Corporation And Concept Searching, Inc. | Revolver |
| 2,152,500 |
| 2,124,969 | |||
New Era Merger Sub, Inc. | Delayed Draw |
| 153,958 |
| 150,385 | |||
78
Cliffwater Corporate Lending Fund |
Notes to Consolidated Financial Statements March 31, 2023 (Continued) |
2. Significant Accounting Policies (continued)
Borrower | Type | Principal | Value | |||||
New Era Merger Sub, Inc. | Revolver | $ | 58,641 | $ | 57,280 | |||
New Era Merger Sub, Inc. | Revolver |
| 35,465 |
| 34,642 | |||
New ILC Dover, Inc. | Revolver |
| 1,087,932 |
| 1,051,783 | |||
NL1 Acquire Corp. | Delayed Draw |
| 1,930,959 |
| 1,372,833 | |||
NL1 Acquire Corp. | Delayed Draw |
| 1,182,780 |
| 1,076,529 | |||
NL1 Acquire Corp. | Revolver |
| 369,740 |
| 262,870 | |||
Northstar Recycling, Inc. | Revolver |
| 2,000,000 |
| 1,963,600 | |||
Novotech (Australia) Pty Limited | Delayed Draw |
| 3,125,000 |
| 3,030,644 | |||
Oakbridge Insurance Agency LLC | Delayed Draw |
| 12,008,621 |
| 11,626,446 | |||
Oakbridge Insurance Agency LLC | Revolver |
| 343,966 |
| 333,019 | |||
OB Hospitalist Group | Revolver |
| 1,053,435 |
| 1,033,539 | |||
OIA Acquisition, LLC | Delayed Draw |
| 459,000 |
| 444,898 | |||
OIA Acquisition, LLC | Revolver |
| 1,928,571 |
| 1,869,320 | |||
OIS Management Services, LLC | Delayed Draw |
| 4,188,590 |
| 4,091,376 | |||
OIS Management Services, LLC | Revolver |
| 1,328,205 |
| 1,297,379 | |||
Oliver Packaging, LLC | Revolver |
| 380,952 |
| 375,550 | |||
Olympic Buyer, Inc. | Revolver |
| 2,352,941 |
| 2,295,503 | |||
Omni Intermediate Holdings, LLC | Delayed Draw |
| 3,626,656 |
| 3,557,018 | |||
Omni Intermediate Holdings, LLC | Revolver |
| 2,253,521 |
| 2,210,249 | |||
OneCare Media, LLC | Revolver |
| 1,333,333 |
| 1,306,395 | |||
Ons Mso, LLC | Revolver |
| 2,763,592 |
| 2,678,686 | |||
Oranje Holdco, Inc. | Revolver |
| 1,629,556 |
| 1,585,921 | |||
Org USME Buyer, LLC | Delayed Draw |
| 743,478 |
| 724,361 | |||
Org USME Buyer, LLC | Revolver |
| 411,942 |
| 401,349 | |||
Orthodontic Partners, LLC | Delayed Draw |
| 14,278,356 |
| 14,102,341 | |||
Patriot Growth Insurance Services, LLC | Delayed Draw |
| 1,854,545 |
| 1,820,793 | |||
Patriot Growth Insurance Services, LLC | Delayed Draw |
| 24,830,120 |
| 24,378,210 | |||
Patriot Growth Insurance Services, LLC | Revolver |
| 2,660,377 |
| 2,571,979 | |||
PAW Midco, Inc. | First Lien Term Loan |
| 34,742 |
| 30,183 | |||
PC Dreamscape Opco, Inc. | Delayed Draw |
| 3,289,474 |
| 3,169,297 | |||
PC Dreamscape Opco, Inc. | Revolver |
| 1,052,632 |
| 1,005,317 | |||
PCS Software, Inc. | Revolver |
| 363,714 |
| 360,669 | |||
PCX Holding Corp. | Revolver |
| 437,500 |
| 423,971 | |||
PDQ | Revolver |
| 1,764,706 |
| 1,750,268 | |||
Pediatric Home Respiratory Services, LLC | Delayed Draw |
| 856,529 |
| 834,504 | |||
Petrus Buyer, Inc. | Delayed Draw |
| 5,494,505 |
| 5,424,744 | |||
Petrus Buyer, Inc. | Revolver |
| 1,923,077 |
| 1,869,747 | |||
Ping Identity Corporation | Revolver |
| 250,000 |
| 243,750 | |||
Pinnacle Dermatology Management, LLC | Delayed Draw |
| 1,221,649 |
| 1,184,117 | |||
Pinnacle Dermatology Management, LLC | Revolver |
| 680,412 |
| 673,141 | |||
Pinnacle Treatment Centers, Inc. | Revolver |
| 9,363 |
| 9,168 | |||
Pinnacle Treatment Centers, Inc. | Revolver |
| 424,904 |
| 416,079 | |||
Planet US Buyer LLC | Revolver |
| 814,815 |
| 788,766 | |||
Polyphase Elevator Holding Company | Delayed Draw |
| 17,619,000 |
| 17,033,563 | |||
Potter Electric Signal Company, LLC | Delayed Draw |
| 2,647,890 |
| 2,593,067 | |||
Potter Electric Signal Company, LLC | Revolver |
| 586,584 |
| 574,439 | |||
POY Holdings, LLC | Delayed Draw |
| 989,658 |
| 966,689 | |||
79
Cliffwater Corporate Lending Fund |
Notes to Consolidated Financial Statements March 31, 2023 (Continued) |
2. Significant Accounting Policies (continued)
Borrower | Type | Principal | Value | |||||
POY Holdings, LLC | Revolver | $ | 2,406,511 | $ | 2,350,658 | |||
PPV Intermediate Holdings LLC | Delayed Draw |
| 1,611,678 |
| 1,586,382 | |||
PPV Intermediate Holdings LLC | Revolver |
| 2,538,076 |
| 2,472,813 | |||
PPV Intermediate Holdings LLC | Delayed Draw |
| 264,996 |
| 261,993 | |||
PPV Intermediate Holdings LLC | Delayed Draw |
| 255,682 |
| 251,669 | |||
PPV Intermediate Holdings LLC | First Lien Term Loan |
| 20,313 |
| 19,790 | |||
Premier Imaging, LLC | Delayed Draw |
| 10,332,779 |
| 10,196,480 | |||
Prime Buyer, LLC | Revolver |
| 3,213,443 |
| 3,109,566 | |||
Prism Parent Co., Inc. | Delayed Draw |
| 601,852 |
| 595,833 | |||
ProcessUnity Holdings, LLC | Delayed Draw |
| 750,000 |
| 723,426 | |||
ProcessUnity Holdings, LLC | Revolver |
| 550,000 |
| 526,325 | |||
PT Intermediate Holdings III, LLC | Delayed Draw |
| 1,667,000 |
| 1,651,482 | |||
QF Holdings, Inc. | Revolver |
| 219,298 |
| 214,483 | |||
Quality Automotive Services, LLC | Revolver |
| 1,477,132 |
| 1,398,454 | |||
Quantic Electronics, LLC | Revolver |
| 128,641 |
| 125,011 | |||
Quantic Electronics, LLC | Delayed Draw |
| 953,898 |
| 926,980 | |||
Quantic Electronics, LLC | Revolver |
| 57,038 |
| 55,429 | |||
R1 Holdings LLC | Delayed Draw |
| 2,433,183 |
| 2,401,087 | |||
R1 Holdings LLC | Revolver |
| 2,097,285 |
| 2,038,103 | |||
Race Winning Brands, Inc. | Revolver |
| 1,305,774 |
| 1,262,386 | |||
Radwell Parent, LLC | Revolver |
| 1,744,152 |
| 1,691,827 | |||
Radwell Parent, LLC | Delayed Draw |
| 7,303,400 |
| 6,996,338 | |||
Radwell Parent, LLC | Revolver |
| 2,531,793 |
| 2,433,717 | |||
Rally Buyer, Inc. | Delayed Draw |
| 2,640,000 |
| 2,618,400 | |||
Rally Buyer, Inc. | Revolver |
| 1,500,000 |
| 1,472,700 | |||
Rally Buyer, Inc. | Delayed Draw |
| 2,960,636 |
| 2,936,413 | |||
Rally Buyer, Inc. | Revolver |
| 1,682,180 |
| 1,651,564 | |||
Ranger Buyer, Inc. | Revolver |
| 1,923,077 |
| 1,878,444 | |||
Raven Buyer, Inc. | Revolver |
| 1,800,000 |
| 1,771,748 | |||
RB Holdings Interco, LLC | Delayed Draw |
| 2,770,160 |
| 2,685,052 | |||
RB Holdings Interco, LLC | Revolver |
| 230,847 |
| 222,598 | |||
RCS Healthcare | Revolver |
| 118,056 |
| 117,090 | |||
RCS Industrials | Revolver |
| 285,714 |
| 281,945 | |||
Recorded Future, Inc. | Revolver |
| 178,771 |
| 175,965 | |||
Redwood Services Group, LLC | Delayed Draw |
| 13,189,693 |
| 13,031,839 | |||
Redwood Services Group, LLC | Delayed Draw |
| 41,317 |
| 40,822 | |||
RefrigiWear, LLC | Revolver |
| 2,601,896 |
| 2,528,474 | |||
Regent Holding Company, LLC | Revolver |
| 1,409,774 |
| 1,365,756 | |||
Revalize, Inc. | Revolver |
| 681,000 |
| 676,315 | |||
Riskonnect Parent, LLC | Delayed Draw |
| 30,882,250 |
| 30,671,308 | |||
Royal Buyer, LLC | Delayed Draw |
| 471,250 |
| 466,538 | |||
Royal Buyer, LLC | Revolver |
| 191,667 |
| 187,833 | |||
RQM Buyer, Inc. | Delayed Draw |
| 4,687,500 |
| 4,664,110 | |||
RSC Acquisition, Inc. | Revolver |
| 3,330,549 |
| 3,203,199 | |||
RSC Acquisition, Inc. | Delayed Draw |
| 1,414,737 |
| 1,360,642 | |||
S4T Holdings Corp. | Delayed Draw |
| 4,545,455 |
| 4,462,727 | |||
Safety Borrower Holdings | Revolver |
| 508,475 |
| 507,001 | |||
80
Cliffwater Corporate Lending Fund |
Notes to Consolidated Financial Statements March 31, 2023 (Continued) |
2. Significant Accounting Policies (continued)
Borrower | Type | Principal | Value | |||||
SailPoint Technologies, Inc. | Revolver | $ | 603,840 | $ | 597,387 | |||
SEI Holding I Corporation | Delayed Draw |
| 1,967,746 |
| 1,940,277 | |||
SEI Holding I Corporation | Revolver |
| 1,199,613 |
| 1,164,853 | |||
Securonix, Inc. | Revolver |
| 2,288,135 |
| 2,281,504 | |||
Seismic Software, Inc. | Revolver |
| 272,390 |
| 264,021 | |||
Seismic Software, Inc. | Delayed Draw |
| 26,204,082 |
| 25,399,013 | |||
Seko Global Logistics Network, LLC | Revolver |
| 52,582 |
| 51,625 | |||
Service Compression, LLC | Delayed Draw |
| 1,581,333 |
| 1,507,877 | |||
Showtime Acquisition, L.L.C | Delayed Draw |
| 203,148 |
| 199,580 | |||
Smile Doctors, LLC | Revolver |
| 247,350 |
| 237,049 | |||
Sonar Acquisitionco, Inc. | Revolver |
| 2,693,750 |
| 2,637,977 | |||
Sonny’s Enterprises, LLC | Revolver |
| 640,244 |
| 638,389 | |||
Spanx, LLC | Revolver |
| 8,548,279 |
| 8,142,290 | |||
Spartronics LLC | Revolver |
| 1,920,230 |
| 1,882,396 | |||
Spirit RR Holdings, Inc. | Revolver |
| 100,316 |
| 97,307 | |||
Spotless Brands, LLC | Delayed Draw |
| 7,470,670 |
| 7,358,610 | |||
Spotless Brands, LLC | Revolver |
| 200,000 |
| 196,000 | |||
Stanton Carpet Corp. | Revolver |
| 1,189,468 |
| 1,152,924 | |||
Summit Buyer, L.L.C. | Delayed Draw |
| 3,270,591 |
| 3,171,747 | |||
Summit Buyer, L.L.C. | Delayed Draw |
| 1,898,298 |
| 1,840,927 | |||
Summit Buyer, L.L.C. | Revolver |
| 1,382,979 |
| 1,341,182 | |||
SureWerx Purchaser III, Inc. | Delayed Draw |
| 1,875,000 |
| 1,840,795 | |||
SureWerx Purchaser III, Inc. | Revolver |
| 1,000,000 |
| 971,739 | |||
SWK Buyer, Inc. | Delayed Draw |
| 3,070,175 |
| 2,814,370 | |||
SWK Buyer, Inc. | Revolver |
| 521,930 |
| 478,443 | |||
Syntax Systems Ltd. | Delayed Draw |
| 4,950,495 |
| 4,701,689 | |||
Syntax Systems Ltd. | Revolver |
| 396,040 |
| 376,135 | |||
System Planning and Analysis, Inc. | Delayed Draw |
| 3,643,011 |
| 3,580,722 | |||
System Planning and Analysis, Inc. | Revolver |
| 1,568,100 |
| 1,541,289 | |||
Tamarack Intermediate, L.L.C. | Revolver |
| 2,524,330 |
| 2,422,497 | |||
Tank Holding Corp. | Revolver |
| 1,275,964 |
| 1,227,176 | |||
The Arcticom Group, LLC | Revolver |
| 4,057,143 |
| 3,935,531 | |||
The Smilist Management, Inc. | Delayed Draw |
| 1,584,533 |
| 1,574,022 | |||
The Smilist Management, Inc. | Revolver |
| 356,075 |
| 353,713 | |||
The Ultimus Group Midco, LLC | Revolver |
| 1,424,528 |
| 1,402,170 | |||
The Vertex Companies, Inc. | Delayed Draw |
| 820,565 |
| 793,187 | |||
The Vertex Companies, Inc. | Revolver |
| 965,217 |
| 933,013 | |||
TheKey, LLC | Delayed Draw |
| 19,468,737 |
| 18,773,077 | |||
THG Acquisition, LLC | Delayed Draw |
| 4,327,750 |
| 4,259,824 | |||
THG Acquisition, LLC | Revolver |
| 619,903 |
| 614,831 | |||
Thunder Purchase, Inc. | Revolver |
| 744,729 |
| 703,196 | |||
TigerConnect, Inc. | Delayed Draw |
| 739,603 |
| 737,459 | |||
TigerConnect, Inc. | Revolver |
| 1,875,000 |
| 1,869,566 | |||
Tilley Chemical Co., Inc. | Revolver |
| 1,000,000 |
| 975,188 | |||
Tilley Chemical Co., Inc. | Revolver |
| 1,555,556 |
| 1,516,959 | |||
Time Manufacturing Acquisition, LLC | Revolver |
| 1,342,466 |
| 1,263,253 | |||
Titan Group Holdco, LLC | Delayed Draw |
| 3,236,317 |
| 3,120,676 | |||
Titan Group Holdco, LLC | Revolver |
| 1,450,000 |
| 1,398,188 | |||
81
Cliffwater Corporate Lending Fund |
Notes to Consolidated Financial Statements March 31, 2023 (Continued) |
2. Significant Accounting Policies (continued)
Borrower | Type | Principal | Value | |||||
TMC Buyer, Inc. | Delayed Draw | $ | 253,834 | $ | 220,835 | |||
Trackforce Acquireco, Inc. | Revolver |
| 667,845 |
| 655,690 | |||
Transtar Holding Company | Delayed Draw |
| 1,448,276 |
| 1,400,904 | |||
Tribute Technology Holdings, LLC | Revolver |
| 3,487,842 |
| 3,371,949 | |||
Trident Maritime Systems, Inc. | Revolver |
| 222,222 |
| 220,404 | |||
Trident Maritime Systems, Inc. | Revolver |
| 111,111 |
| 110,202 | |||
Troy Gastroenterology, P.C. | Delayed Draw |
| 2,122,266 |
| 2,094,271 | |||
Troy Gastroenterology, P.C. | Revolver |
| 295,567 |
| 291,668 | |||
Trunk Acquisition, Inc. | Revolver |
| 1,193,049 |
| 1,147,431 | |||
Trunk Acquisition, Inc. | Revolver |
| 2,500,000 |
| 2,404,408 | |||
Turbo Buyer, Inc. | Delayed Draw |
| 3,000,000 |
| 2,897,312 | |||
TurningPoint Healthcare Solutions, LLC | Revolver |
| 1,816,524 |
| 1,765,265 | |||
U.S. Hospitality Publishers, Inc. | Delayed Draw |
| 2,631,579 |
| 2,594,230 | |||
U.S. Hospitality Publishers, Inc. | Revolver |
| 526,316 |
| 518,846 | |||
United Digestive MSO Parent, LLC | Delayed Draw |
| 4,130,000 |
| 4,068,050 | |||
United Digestive MSO Parent, LLC | Revolver |
| 2,065,500 |
| 2,003,535 | |||
United Digestive MSO Parent, LLC | Delayed Draw |
| 2,825,000 |
| 2,782,625 | |||
United Digestive MSO Parent, LLC | Revolver |
| 1,412,000 |
| 1,369,640 | |||
United Musculoskeletal Partners Acquisition Holdings, LLC | Delayed Draw |
| 2,280,344 |
| 2,221,708 | |||
United Musculoskeletal Partners Acquisition Holdings, LLC | Revolver |
| 1,724,138 |
| 1,679,804 | |||
Urology Management Holdings, Inc. | Delayed Draw |
| 3,266,667 |
| 3,159,817 | |||
Urology Management Holdings, Inc. | Revolver |
| 1,190,476 |
| 1,150,919 | |||
USRP Holdings, Inc. | Delayed Draw |
| 2,193,178 |
| 2,120,304 | |||
USRP Holdings, Inc. | Revolver |
| 645,161 |
| 623,724 | |||
USRP Holdings, Inc. | Revolver |
| 3,145,613 |
| 3,041,091 | |||
V Global Holdings LLC | Revolver |
| 11,637,143 |
| 11,104,737 | |||
Vale Insurance Services LLC | Revolver |
| 2,419,355 |
| 2,337,269 | |||
Vardiman Black Holdings, LLC | Delayed Draw |
| 1,434,904 |
| 1,412,067 | |||
Vital Care Buyer, LLC | Revolver |
| 1,777,778 |
| 1,754,327 | |||
VRC Companies, LLC | Delayed Draw |
| 582,027 |
| 574,732 | |||
VRC Companies, LLC | Revolver |
| 625,000 |
| 617,166 | |||
VSG Acquisition Corp. | Delayed Draw |
| 5,681,667 |
| 5,468,402 | |||
VSG Acquisition Corp. | Revolver |
| 2,310,000 |
| 2,223,293 | |||
Water Holdings Acquisition, LLC | Delayed Draw |
| 3,817,808 |
| 3,796,517 | |||
Water Holdings Acquisition, LLC | Revolver |
| 358,591 |
| 349,083 | |||
Wealth Enhancement Group, LLC | Revolver |
| 439,990 |
| 425,371 | |||
Web P.T., Inc. | Revolver |
| 696,429 |
| 682,009 | |||
Wilson Electronics Holdings, LLC | Delayed Draw |
| 9,226,000 |
| 8,996,159 | |||
WorkForce Software, LLC | Revolver |
| 463,235 |
| 450,164 | |||
World Insurance Associates, LLC | Delayed Draw |
| 5,405,000 |
| 5,245,440 | |||
Xifin, Inc. | Revolver |
| 1,284,995 |
| 1,239,079 | |||
Zavation Medical Products, LLC | Revolver |
| 1,094,595 |
| 1,055,482 | |||
Zendesk, Inc. | Delayed Draw |
| 1,847,826 |
| 1,829,348 | |||
Total | $ | 1,219,116,687 | $ | 1,190,172,271 | ||||
82
Cliffwater Corporate Lending Fund |
Notes to Consolidated Financial Statements March 31, 2023 (Continued) |
2. Significant Accounting Policies (continued)
Valuation of Investments
In December 2020, the SEC adopted a new rule providing a framework for fund valuation practices (“Rule 2a-5”). Rule 2a-5 established requirements for determining fair value in good faith for purposes of the Investment Company Act. Rule 2a-5 will permit fund boards to designate certain parties to perform fair value determinations, subject to board oversight and certain other conditions. Rule 2a-5 also defines when market quotations are “readily available” for purposes of the Investment Company Act and the threshold for determining whether a fund must fair value a security. In connection with Rule 2a-5, the SEC also adopted related recordkeeping requirements and is rescinding previously issued guidance, including with respect to the role of a board in determining fair value and the accounting and auditing of fund investments. Effective September 8, 2022, and pursuant to the requirements of Rule 2a-5, the Board of Trustees of the Fund (the “Board”) designated the Investment Manager as its valuation designee to perform fair value determinations and approved new Valuation Procedures for the Fund. The Board (the “Valuation Designee”) has approved the valuation policy and procedures for the Fund (the “Valuation Procedures”). Under the Valuation Procedures adopted by the Board, the Board has delegated day-to-day responsibility for fair value determinations and pricing to the Valuation Designee subject to the oversight of the Board. Securities listed on a securities exchange, market or automated quotation system for which quotations are readily available (except for securities traded on NASDAQ), including securities traded over the counter, are valued at the last quoted sale price on the primary exchange or market (foreign or domestic) on which they are traded on a day the Fund will calculate its net asset value as of the close of business on each day that the New York Stock Exchange is open for business and at such other times as the Board shall determine (each a “Determination Date” or at approximately 4:00 pm U.S. Eastern Time if a security’s primary exchange is normally open at that time), or, if there is no such reported sale on the Determination Date, the mean between the closing bid and asked prices and if no asked price is available, at the bid price. For securities traded on NASDAQ, the NASDAQ Official Closing Price (which is the last trade price at or before 4:00:02 p.m. U.S. Eastern Time adjusted up to NASDAQ’s best offer price if the last trade price is below such bid and down to NASDAQ’s best offer price if the last trade is above such offer price) will be used.
Fixed income securities (including corporate bonds and senior secured loans) with a remaining maturity of 60 days or more for which accurate market quotations are readily available will normally be valued according to dealer supplied mean quotations or mean quotations from a recognized pricing service. The independent pricing agents may employ methodologies that utilize actual market transactions (if the security is actively traded), broker-dealer supplied valuations, or matrix pricing. Matrix pricing determines a security’s value by taking into account such factors as security prices, yields, maturities, call features, ratings and developments relating to comparable securities. Debt obligations with remaining maturities of sixty days or less when originally acquired will be valued at their amortized cost, which approximates fair market value.
Corporate loans are generally valued using unobservable pricing inputs received from the Fund’s investment partners or other third-party pricing services. The Investment Manager will continuously monitor the valuations of Fund investments provided by investment partners or other third-party pricing services and review any material concerns with the Valuation Committee. The Investment Manager may conclude, however, in certain circumstances, that a fair valuation provided by an investment partner or other third-party pricing service does not represent the fair value of a Fund investment and is not indicative of what actual fair value would be in an active, liquid or established market. In those circumstances, the Fund might value such investment at a discount or a premium to the value it receives from an investment partner or other third-party pricing service, in accordance with the Fund’s valuation procedures. Any such decision would be made in good faith, and subject to the review and supervision of the Valuation Committee. The Investment Manager may choose to value certain immaterial direct corporate loans internally upon approval of the Valuation Committee. The Board will consider, no less frequently than quarterly, all relevant information and the reliability of pricing information provided by the investment partners or other third-party pricing services. Additionally, the values of the Funds’ direct loan investments are adjusted daily based on the estimated total return that the asset will generate during the current quarter. The Investment Manager, other third-party pricing services and the Valuation Committee monitor these estimates regularly and update them as necessary if macro or individual changes warrant any adjustments. At the end of the quarter, each direct loan’s value is adjusted based on the actual income and appreciation or depreciation realized by such loan when its quarterly valuations and income are reported. This information is updated as soon as the information becomes available.
83
Cliffwater Corporate Lending Fund |
Notes to Consolidated Financial Statements March 31, 2023 (Continued) |
2. Significant Accounting Policies (continued)
CLOs are not traded on a national securities exchange and instead are valued utilizing a market approach. The market approach is a method of determining the valuation of a security based on the selling price of similar securities. The types of factors that may be taken into account in pricing CLOs include: the yield of similar CLOs where pricing is available in the market; the riskiness of the underlying pool of loans; features of the CLO, including weighted average life test, liability pricing, management fees, covenant cushions, weighted average spread of underlying loans and net asset value.
Redeemable securities issued by open-end registered investment companies are valued at the investment company’s applicable net asset value as reported by such companies, with the exception of exchange-traded open-end registered investment companies which are priced in accordance with the first paragraph within this valuation of investments section.
The Fund may invest in interests or shares in private investment companies and/or funds (“Private Investment Funds”) where the net asset value is calculated and reported by respective unaffiliated investment managers on a monthly or quarterly basis. Unless the Valuation Designee is aware of information that a value reported to the Fund by a portfolio, underlying manager, or administrator does not accurately reflect the value of the Fund’s interest in that Private Investment Fund, the Valuation Designee will use the net asset value provided by the Private Investment Funds as a practical expedient to estimate the fair value of such interests.
Reverse Repurchase Agreements
In a reverse repurchase agreement, the Fund delivers a security in exchange for cash to a financial institution, the counterparty, with a simultaneous agreement to repurchase the same or substantially the same security at an agreed upon price and date. In an open maturity reverse repurchase agreement, there is no pre-determined repurchase date and the agreement can be terminated by the Fund or counterparty at any time. The Fund is entitled to receive principal and interest payments, if any, made on the security delivered to the counterparty during the term of the agreement. Cash received in exchange for securities delivered and accrued interest payments to be made by the Fund to counterparties are reflected as liabilities on the Consolidated Statement of Assets and Liabilities. Interest payments made by the Fund to counterparties are recorded as interest from reverse repurchase agreements on the consolidated Statement of Operations. In periods of increased demand for the security, the Fund may receive a fee for use of the security by the counterparty, which may result in interest income to the Fund. In the event the buyer of securities under a reverse repurchase agreement files for bankruptcy or becomes insolvent, the Fund’s use of the proceeds of the agreement may be restricted pending a determination by the other party, or its trustee or receiver, whether to enforce the Fund’s obligation to repurchase the securities. Reverse repurchase agreements involve leverage risk and also the risk that the market value of the securities to be repurchased may decline below the repurchase price.
Master Repurchase Agreements and Global Master Repurchase Agreements (individually and collectively “Master Repo Agreements”) govern repurchase, reverse repurchase, and certain sale-buyback transactions between the Fund and select counterparties. Master Repo Agreements maintain provisions for, among other things, initiation, income payments, events of default, and maintenance of collateral. The value of transactions under the Master Repo Agreement, collateral pledged or received, and the net exposure by counterparty as of period end are disclosed in the Consolidated Schedule of Investments and footnote 13 thereto. For the year ended March 31, 2023, the average balance outstanding and weighted average interest rate were $4,286,712 and 4.30%, respectively.
March 31, 2023 | |||||||||||||||
Remaining Contractual Maturity of the Agreements | |||||||||||||||
Reverse | Overnight and Continuous | Up to 30 days | 30 – 90 days | Greater Than 90 days | Total | ||||||||||
Collateralized Loan | $ | — | $ | — | $ | 3,870,000 | $ | — | $ | 3,870,000 | |||||
Total | $ | — | $ | — | $ | 3,870,000 | $ | — | $ | 3,870,000 | |||||
84
Cliffwater Corporate Lending Fund |
Notes to Consolidated Financial Statements March 31, 2023 (Continued) |
2. Significant Accounting Policies (continued)
Repurchase Offers
The Fund is a closed-end investment company structured as an interval fund and, as such, has adopted a fundamental policy to make quarterly repurchase offers, at per-class NAV, of not less than 5% of the Fund’s outstanding Shares on the repurchase request deadline. The Fund will offer to purchase only a small portion of its Shares each quarter, and there is no guarantee that shareholders will be able to sell all of the Shares that they desire to sell in any particular repurchase offer. Under current regulations, such offers must be for not less than 5% nor more than 25% of the Fund’s Shares outstanding on the repurchase request deadline. If a repurchase offer is oversubscribed, the Fund may repurchase only a pro rata portion of the Shares tendered by each shareholder. The potential for proration may cause some investors to tender more Shares for repurchase than they wish to have repurchased or result in investors being unable to liquidate all or a given percentage of their investment during in the particular repurchase offer.
Borrowing, Use of Leverage
On March 29, 2022, the Fund and certain of its wholly-owned subsidiaries (“Guarantors”) entered into a senior secured credit facility (the “Facility”) with Massachusetts Mutual Life Insurance Company as a joint lead arranger, PNC Bank, National Association (“PNC”) as administrative agent and joint lead arranger and with certain lenders from time to time as parties thereto (the “Lenders”). The Facility, as amended effective March 17, 2023, provides for borrowings on a committed basis in an aggregate principal amount up to $2,800,000,000. Under the Facility, the Fund has received a single 7-year term loan in the amount of $500,000,000 (“Term Loan”) and may borrow up to an additional $2,300,000,000 on a revolving basis (the “Revolving Loan”). The Fund may request the Revolving Loan to be increased from time to time up to an aggregate amount of $3,050,000, subject to the approval and discretion of the lenders. The Revolving Loan matures on March 17, 2028, and the Term Loan matures on March 28, 2029.
In connection with the Facility and Notes (discussed below under “Senior Notes”), the Fund and Guarantors have made certain customary representations and warranties and are required to comply with various customary covenants, reporting requirements and other requirements. The Facility and Notes each contain events of default customary for similar financing transactions, including: (i) the failure to make principal, interest or other payments when due after the applicable grace period; (ii) the insolvency or bankruptcy of the Guarantors or the Fund; or (iii) a change of management of the Fund. Upon the occurrence and during the continuation of an event of default, the Lenders or Note holders may declare the outstanding advances and all other obligations under the Facility and the Notes, respectively, immediately due and payable or incur a default rate of interest. The Facility and/or Notes may in the future be replaced or refinanced by entering into one or more new credit facilities or by the issuance of new debt securities, in each case having substantially different terms from the current Facility and Notes. For the year ended March 31, 2023, the average balance outstanding, maximum amount borrowed and weighted average interest rate under the Term Loan were $500,000,000, $500,000,000 and 5.09%, respectively. For the year ended March 31, 2023, the average balance outstanding, maximum amount borrowed and weighted average interest rate under the Revolving Loan were $831,586,301, $1,300,000,000 and 4.41%, respectively. In addition, the interest rate at period end on the Term Loan and Revolving Loan were 7.05% and 6.91%, respectively. The interest expense during the year ended March 31, 2023, was $65,447,856. Commitment fees incurred are prepaid and amortized over the term of the loan. For the year ended March 31, 2023, commitment fees were $2,970,989. Unused commitment fees for the year ended March 31, 2023, were $1,319,175.
The use of leverage increases both risk of loss and profit potential. The Fund is subject to the Investment Company Act requirement that an investment company satisfy an asset coverage requirement of 300% of its indebtedness, including amounts borrowed (including through one or more SPVs that are wholly-owned subsidiaries of the Fund), measured at the time the investment company incurs the indebtedness. This means that at any given time the value of the Fund’s total indebtedness may not exceed one-third the value of its total assets (including such indebtedness). The interests of persons with whom the Fund (or SPVs that are wholly-owned subsidiaries of the Fund) enters into leverage arrangements will not necessarily be aligned with the interests of the Fund’s shareholders and such persons will have claims on the Fund’s assets that are senior to those of the Fund’s shareholders. In addition to the risks created by the Fund’s use of leverage, the Fund is subject to the additional risk that it would be unable to timely, or at all, obtain leverage borrowing. The Fund might also be required to de-leverage, selling securities at a potentially inopportune time and incurring tax consequences. Further, the Fund’s ability to generate income from the use of leverage would be adversely affected.
85
Cliffwater Corporate Lending Fund |
Notes to Consolidated Financial Statements March 31, 2023 (Continued) |
2. Significant Accounting Policies (continued)
Secured Borrowings
From time to time, the Fund may engage in sale/buy-back agreements, which are a type of secured borrowing. The amount, interest rate and terms of these agreements will be individually negotiated on a transaction-by-transaction basis. Each borrowing is secured by an interest in an underlying asset which is participated or assigned to the sale/buy-back counter party for the duration of the agreement.
The Fund entered into sale/buy-back agreements with Macquarie US Trading LLC (“Macquarie”), and pursuant to such agreements, the Fund granted Macquarie a participation interest in certain assets, with a corresponding repurchase obligation at an agreed-upon price within 120 days after the sale date. Interest expense on secured borrowings for the year ended March 31, 2023 were $18,679,698. There were no secured borrowings outstanding as of March 31, 2023.
Senior Notes
On March 29, 2022, the Fund issued Series A Senior Secured Notes (the “Notes”) in a private placement to qualified institutional purchasers in the aggregate principal amount of $650 million, maturing on March 28, 2027. On June 7, 2022, the Fund issued additional Series A notes in a private placement to qualified institutional purchasers in the aggregate principal amount of $250 million, maturing on March 28, 2027. On July 22, 2022, the Fund issued Series B, Series C, Series E and Series F notes in a private placement to qualified institutional purchasers in the aggregate principal amount of $635 million with various maturities. On September 29, 2022, the Fund issued Series D and Series G notes in a private placement to qualified institutional purchasers in the aggregate principal amount of $50 million with various maturities. On December 6, 2022, the Fund issued Series H, Series I and Series J notes in a private placement to qualified institutional purchasers in the aggregate principal amount of $270 million with various maturities. On January 5, 2023, the Fund issued additional Series I notes in a private placement to qualified institutional purchasers in the aggregate principal amount of $10 million maturing on December 6, 2027. The obligations of the Fund and each of the Guarantors under the Facility and the Notes are secured by a first-priority security interest on substantially all of the assets of the Fund and each of the Guarantors.
In connection with the Notes, the Fund entered into interest rate swaps to more closely align the interest rates of its liabilities with its investment portfolio, which consists of predominately floating rate loans. Under the interest rate swap agreements, the Fund receives a fixed interest rate and pays a floating interest rate of daily simple SOFR plus various spreads as disclosed on the consolidated schedule of swap contracts on notional amounts equal to the principal outstanding of the Notes. The Fund designated the interest rate swaps as the hedging instruments in effective hedge accounting relationships. See Notes 10 and 11 for more information regarding the interest rate swaps.
The table below sets forth a summary of the key terms of the series of Notes outstanding at March 31, 2023.
Series | Principal | Payment | Unamortized | Interest Rate | Carrying | Fair Value | Fixed | Effective | Maturity Date | |||||||||||||||
A | $ | 650,000,000 | Semi-Annual | $ | 69,817 | $ | 21,526,922 |
| $ | 628,403,261 | $ | 598,186,005 | 4.10% | 4.55% | March 28, 2027 | |||||||||
A |
| 250,000,000 | Semi-Annual |
| 26,851 |
| 3,229,188 |
|
| 246,743,961 |
| 230,071,540 | 4.10% | 4.16% | March 28, 2027 | |||||||||
B |
| 215,000,000 | Semi-Annual |
| 1,008,042 |
| 3,543,278 |
|
| 210,448,680 |
| 210,746,290 | 5.44% | 5.95% | July 19, 2025 | |||||||||
C |
| 130,000,000 | Semi-Annual |
| 644,892 |
| 2,243,781 |
|
| 127,111,327 |
| 126,926,212 | 5.50% | 6.10% | July 19, 2026 | |||||||||
D |
| 10,000,000 | Semi-Annual |
| 665,584 |
| 166,654 |
|
| 9,167,762 |
| 9,763,555 | 5.50% | 6.42% | July 19, 2026 | |||||||||
E |
| 130,000,000 | Semi-Annual |
| 847,732 |
| 2,389,609 |
|
| 126,762,659 |
| 126,369,758 | 5.61% | 6.28% | July 19, 2027 | |||||||||
F |
| 160,000,000 | Semi-Annual |
| 49,606 |
| 3,397,932 |
|
| 156,552,462 |
| 154,211,006 | 5.72% | 6.45% | July 19, 2029 | |||||||||
G |
| 40,000,000 | Semi-Annual |
| 211,934 |
| 839,809 |
|
| 38,948,257 |
| 38,552,751 | 5.72% | 6.80% | July 19, 2029 | |||||||||
H |
| 34,000,000 | Semi-Annual |
| 283,627 |
| (450,607 | ) |
| 34,166,980 |
| 34,620,492 | 7.06% | 7.52% | December 6, 2025 | |||||||||
I |
| 95,000,000 | Semi-Annual |
| 1,232,667 |
| (2,431,809 | ) |
| 96,199,142 |
| 97,874,699 | 7.10% | 7.84% | December 6, 2027 | |||||||||
I |
| 10,000,000 | Semi-Annual |
| 48,447 |
| (254,327 | ) |
| 10,205,880 |
| 10,302,600 | 7.10% | 7.88% | December 6, 2027 | |||||||||
J |
| 141,000,000 | Semi-Annual |
| 2,052,145 |
| (5,036,856 | ) |
| 143,984,711 |
| 146,724,053 | 7.17% | 7.98% | December 6, 2029 | |||||||||
Total | $ | 1,865,000,000 | $ | 7,141,344 | $ | 29,163,574 |
| $ | 1,828,695,082 | $ | 1,784,348,961 | |||||||||||||
86
Cliffwater Corporate Lending Fund |
Notes to Consolidated Financial Statements March 31, 2023 (Continued) |
2. Significant Accounting Policies (continued)
The Notes are fair valued using an income approach and classified as level 3 in the fair value hierarchy. The discount rates used ranged from 6.30% to 6.43%. In the prior year, the Series A Notes were valued at cost given the fact that they were issued immediately preceding the fiscal year end.
The Fund shall at all times maintain a current rating given by a Nationally Recognized Statistical Rating Organization (an “NRSRO”) of at least Investment Grade with respect to the Notes and shall not at any time have any rating given by a NRSRO of less than Investment Grade with respect to the Notes.
In keeping with the Investment Company Act requirement that the Fund may not issue more than one class of senior securities constituting indebtedness, the Facility and Notes rank pari passu with each other, and the lien on the Fund’s assets securing the Notes is equal and ratable with the lien securing the Facility. The Facility and Notes are senior in all respects to the Fund’s outstanding shares with respect to the payment of dividends and the distribution of assets upon dissolution, liquidation or winding up of the affairs of the Fund.
The Fund complies with Section 8 and Section 18 of the Investment Company Act, governing investment policies and capital structure and leverage, respectively, on an aggregate basis with the Guarantors. The Guarantors also comply with Section 17 of the Investment Company Act relating to affiliated transactions and custody.
3. Principal Risks
Non-Diversified Status
The Fund is a “non-diversified” management investment company. Thus, there are no percentage limitations imposed by the Investment Company Act on the Fund’s assets that may be invested, directly or indirectly, in the securities of any one issuer. Consequently, if one or more securities are allocated a relatively large percentage of the Fund’s assets, losses suffered by such securities could result in a higher reduction in the Fund’s capital than if such capital had been more proportionately allocated among a larger number of securities. The Fund may also be more susceptible to any single economic or regulatory occurrence than a diversified investment company.
Debt Securities
Under normal market conditions, the Fund expects to primarily invest in debt and debt-related securities. One of the fundamental risks associated with such investments is credit risk, which is the risk that an issuer will be unable to make principal and interest payments on its outstanding debt obligations when due. Adverse changes in the financial condition of an issuer or in general economic conditions (or both) may impair the ability of such issuer to make such payments and result in defaults on, and declines in, the value of its debt. The Fund’s return to Shareholders would be adversely impacted if an issuer of debt securities in which the Fund invests becomes unable to make such payments when due. Other risk factors include interest rate risk (a rise in interest rates causes a decline in the value of debt securities) and prepayment risk (the debtor may pay its obligation early, reducing the amount of interest payments). These risks could affect the value of a particular investment, possibly causing the Fund’s share price and total return to be reduced and fluctuate more than other types of investments.
Borrowing, Use of Leverage
The Fund may leverage its investments by “borrowing,” use of swap agreements, options or other derivative instruments, use of short sales or issuing preferred stock or preferred debt. The use of leverage increases both risk and profit potential. The Fund expects that under normal business conditions it will utilize a combination of the leverage methods described above. The Fund is subject to the Investment Company Act requirement that an investment company limit its borrowings to no more than 50% of its total assets for preferred stock or preferred debt and 33 1/3% of its total assets for debt securities, including amounts borrowed, measured at the time the investment company incurs the indebtedness. Although leverage may increase profits, it exposes the Fund to credit risk, greater market risks and higher current expenses. The effect of leverage with respect to any investment in a market that moves adversely to such investment could result in a loss to the investment portfolio of the Fund that would be substantially greater than if the investment were not leveraged. Also, access to leverage and financing could be impaired by many factors, including market forces or regulatory changes, and there can be no assurance that the Fund will be able to secure or maintain adequate leverage or financing. The ability of the Fund to transact business with any one or number of counterparties, the lack of any independent evaluation of such counterparties’ financial capabilities and the absence of a regulated market to facilitate settlement may increase the potential for losses by the Fund.
87
Cliffwater Corporate Lending Fund |
Notes to Consolidated Financial Statements March 31, 2023 (Continued) |
3. Principal Risks (continued)
Margin borrowings and transactions involving forwards, swaps, futures, options and other derivative instruments could result in certain additional risks to the Fund. In such transactions, counterparties and lenders will likely require the Fund to post collateral to support its obligations. Should the securities and other assets pledged as collateral decline in value or should brokers increase their maintenance margin requirements (i.e., reduce the percentage of a position that can be financed), the Fund could be subject to a “margin call,” pursuant to which it must either deposit additional funds with the broker or suffer mandatory liquidation of the pledged assets to compensate for the decline in value. In the event of a precipitous drop in the value of pledged securities, the Fund might not be able to liquidate assets quickly enough to pay off the margin debt or provide additional collateral and may suffer mandatory liquidation of positions in a declining market at relatively low prices, thereby incurring substantial losses.
Economic Downturn or Recession
Many of the Fund’s investments may be issued by companies susceptible to economic slowdowns or recessions. Therefore, the Fund’s non-performing assets are likely to increase, and the value of its portfolio is likely to decrease, during these periods. A prolonged recession may result in losses of value in the Fund’s portfolio and a decrease in the Fund’s revenues, net income and NAV. Unfavorable economic conditions also could increase the Fund’s funding costs, limit the Fund’s access to the capital markets or result in a decision by lenders not to extend credit to it on terms it deems acceptable. These events could prevent the Fund from increasing investments and harm the Fund’s operating results.
LIBOR Risk
LIBOR has been used extensively in the U.S. and globally as a “benchmark” or “reference rate” for various commercial and financial contracts, including corporate and municipal bonds, bank loans, asset-backed and mortgage-related securities, interest rate swaps and other derivatives. Instruments in which the Fund invests may have historically paid interest at floating rates based on LIBOR or may have been subject to interest caps or floors based on LIBOR. The Fund and issuers of instruments in which the Fund invests may have also historically obtained financing at floating rates based on LIBOR. The underlying collateral of CLOs in which the Fund invests have also paid interest at floating rates based on LIBOR. In July of 2017, the head of the UK Financial Conduct Authority (“FCA”) announced a desire to phase out the use of LIBOR by the end of 2021. On March 5, 2021, ICE announced that all LIBOR settings will either cease to be provided by any administrator or no longer be representative: (a) immediately after December 31, 2021, in the case of the 1-week and 2-month U.S. dollar LIBOR settings; and (b) immediately after June 30, 2023, in the case of the remaining U.S. dollar LIBOR settings.
On July 29, 2021, the U.S. Federal Reserve, in connection with the Alternative Reference Rates Committee (“ARRC”), a steering committee comprised of large U.S. financial institutions, formally recommended the forward-looking Secured Overnight Financing Rate (“SOFR”) term rates proposed by CME Group, Inc. as the replacement for U.S. dollar LIBOR, marking the final step in the ARRC’s Paced Transition Plan implemented to encourage the adoption of SOFR. In addition, as of the date of this report the current nominated replacement for GBP-LIBOR is the Sterling Overnight Interbank Average Rate (“SONIA”). In July 2020, Bloomberg began publishing fall-backs that the International Swaps and Derivatives Association (“ISDA”) intends to implement in lieu of LIBOR with respect to swaps and derivatives. Given the inherent differences between LIBOR and SOFR, or any other alternative benchmark rate that may be established, including SONIA, there remains uncertainty regarding the future utilization of LIBOR and the nature of any replacement rate. In many cases, the nominated replacements, as well as other potential replacements, are not complete or ready to implement and require margin adjustments. There is currently no final consensus as to which Benchmark Rate(s) (along with any adjustment and/or permutation thereof) will replace all or any LIBOR tenors after the discontinuation thereof and there can be no assurance that any such replacement Benchmark Rate(s) will attain market acceptance.
Any transition away from LIBOR to one or more alternative Benchmark Rates is complex and could have a material adverse effect on the Fund’s business, financial condition and results of operations, including, without limitation, as a result of any changes in the pricing and/or availability of the Fund’s investments, negotiations and/or changes to the documentation for certain of the Fund’s investments, the pace of such changes, disputes and other actions regarding the interpretation of current and prospective loan documentation, basis risks between investments and hedges, basis risks within investments (e.g., securitizations), costs of modifications to processes and systems, and/or costs of administrative services and operations, including monitoring of recommended conventions and Benchmark Rates, or any component of or adjustment to the foregoing.
88
Cliffwater Corporate Lending Fund |
Notes to Consolidated Financial Statements March 31, 2023 (Continued) |
3. Principal Risks (continued)
It is not possible to predict whether there will be any further changes in the methods pursuant to which the LIBOR rates are determined and any other reforms to LIBOR that will be enacted in the United States, the U.K. or elsewhere, or the effects thereof. Any such changes or further reforms to LIBOR may result in a sudden or prolonged increase or decrease in reported LIBOR rates, which could have a material adverse impact on the value of the Fund’s investments and any payments linked to LIBOR thereunder.
LIBOR is likely to perform differently than in the past until the final phase-outs in 2023 and, ultimately, will cease to exist as a global benchmark going forward. Until an alternative Benchmark Rate(s) becomes generally accepted and regularly implemented in the market, the uncertainty as to the future of LIBOR, its eventual phase-out, the transition to one or more alternate Benchmark Rate(s), and the implementation of such new Benchmark Rate(s) may impact a number of factors, which, either alone or in the aggregate, may cause a material adverse effect on the Fund’s performance and ability to achieve its investment objective. Such factors include, without limitation: (i) the administration and/or management of portfolio of investments, including (a) cost of funding or other operational or administrative costs, (b) costs incurred to transition to and implement a substitute index or Benchmark Rate(s) for purposes of calculating interest, (c) costs of negotiating with counterparties with respect to an acceptable replacement calculation and potential amendments to existing debt instruments or credit facilities currently utilizing LIBOR to determine interest rates, and/or (d) costs of potential disputes and/or litigation regarding interest calculation, loan value, appropriateness or comparability of any new Benchmark Rate(s) or any other dispute over terms relating to or arising from any of the foregoing; (ii) the availability (or lack thereof) of potential investments in the market during the transition period; (iii) the time periods necessary to make investments and deploy capital during the transition period; (iv) the calculation and value of investments and overall cash flows, profitability and performance; (v) the liquidity of investments in the secondary market or otherwise, and the asset-liability management strategies available; (vi) basis risks between investments and hedges and basis risks within investments (e.g., securitizations); or (vii) any mismatch, during a transition period or otherwise, between a Benchmark Rate used for leverage facilities and another used for one or more of the Fund’s investments.
Limited Liquidity
Shares in the Fund provide limited liquidity since shareholders will not be able to redeem Shares on a daily basis. A shareholder may not be able to tender its Shares in the Fund promptly after it has made a decision to do so. In addition, with very limited exceptions, Shares are not transferable, and liquidity will be provided only through repurchase offers made quarterly by the Fund. In addition, the Fund does not expect any trading market to develop for the Shares. As a result, if investors decide to invest in the Fund, they will have very limited opportunity to sell their Shares. Shares in the Fund are therefore suitable only for investors who can bear the risks associated with the limited liquidity of Shares and should be viewed as a long-term investment.
COVID-19
In early 2020, an outbreak of a novel strain of coronavirus (COVID-19) emerged globally. The outbreak of COVID-19 and its variants resulted in closing international borders, enhanced health screenings, healthcare service preparation and delivery, quarantines, cancellations, disruptions to supply chains and customer activity, as well as general public concern and uncertainty. This outbreak negatively affected the worldwide economy, as well as the economies of individual countries, the financial health of individual companies and the market in general in significant and unforeseen ways. On May 5, 2023, the World Health Organization declared the end of the global emergency status for COVID-19. The United States subsequently ended the federal COVID-19 public health emergency declaration effective May 11, 2023. Although vaccines for COVID-19 are more widely available, it is unknown how long certain circumstances related to the pandemic will persist, whether they will reoccur in the future, and what additional implications may follow from the pandemic. The impact of these events and other epidemics or pandemics in the future could adversely affect Fund performance.
4. Investment Advisory and Other Agreements
The Fund has entered into an investment management agreement (the “Investment Management Agreement”) with the Investment Manager. Pursuant to the Investment Management Agreement, the Fund pays the Investment Manager a monthly Investment Management Fee equal to 1.00% on an annualized basis of the Fund’s Net Assets. The Investment Manager has contractually agreed to an expense limitation and reimbursement agreement (the “Expense Limitation and Reimbursement Agreement”) with the Fund, whereby the Investment Manager has agreed to waive fees that it would otherwise have been paid, and/or to assume expenses of the Fund (a “Waiver”), if required to ensure the Total Annual
89
Cliffwater Corporate Lending Fund |
Notes to Consolidated Financial Statements March 31, 2023 (Continued) |
4. Investment Advisory and Other Agreements (continued)
Expenses (excluding any taxes, leverage interest, distribution and servicing fees, brokerage commissions, dividend and interest expenses on short sales, acquired fund fees and expenses (as determined in accordance with SEC Form N-2), expenses incurred in connection with any merger or reorganization, and extraordinary expenses, such as litigation expenses) do not exceed 2.25% of the average daily net assets of Class I Shares (the “Expense Limit”). For a period not to exceed three years from the date on which a Waiver is made, the Investment Manager may recoup amounts waived or assumed, provided it is able to effect such recoupment and remain in compliance with the Expense Limitation and Reimbursement Agreement. The Expense Limitation and Reimbursement Agreement has an initial two-year term, which ends two years from the date of commencement of the Fund’s operations. The Expense Limitation and Reimbursement Agreement automatically renewed for consecutive one-year terms thereafter, and was terminated effective March 6, 2023.
The Fund may, at the discretion of the Investment Manager and subject to Board and shareholder approval, allocate its assets amongst the Investment Manager and one or more sub-advisers in percentages determined at the discretion of the Investment Manager (“allocated portion”). On November 8, 2022, Crescent Capital Group LP was terminated as sub-adviser to the Fund. On November 11, 2022, BlackRock Capital Investment Advisers was terminated as sub-adviser to the Fund. There are currently no sub-advisers managing assets of the Fund. Neither Crescent Capital Group LP nor BlackRock Capital Investment Advisers was allocated assets to manage during the fiscal year ended March 31, 2023.
For a period not to exceed three years from the date on which advisory fees are waived or Fund expenses were absorbed by the Investment Manager, the Investment Manager may recoup amounts waived or absorbed, provided it is able to effect such recoupment and remain in compliance with (a) the limitation on Fund expenses in effect at the time of the relevant reduction in advisory fees or payment of the Fund’s expenses, and (b) the limitation on Fund expenses at the time of the recoupment. For the year ended March 31, 2023, the Investment Manager did not recover any previously waived expenses.
Foreside Fund Services, LLC serves as the Fund’s distributor; UMB Fund Services, Inc. (“UMBFS”) serves as the Fund’s fund accountant, transfer agent and administrator. For the year ended March 31, 2023, the Fund’s allocated UMBFS fees are reported on the Consolidated Statement of Operations.
An officer of the Fund is an employee of UMBFS. The Fund does not compensate officers affiliated with the Fund’s administrator. For the year ended March 31, 2023, the Fund’s allocated fees incurred for trustees who are not affiliated with the Fund’s administrator are reported on the Consolidated Statement of Operations.
Vigilant Compliance, LLC provides Chief Compliance Officer (“CCO”) services to the Fund. The Fund’s allocated fees incurred for CCO services for the year ended March 31, 2023, are reported on the Consolidated Statement of Operations.
5. Fair Value of Investments
Fair value — Definition
The Fund uses a fair value hierarchy that prioritizes the inputs to valuation techniques used to measure fair value. The objective of a fair value measurement is to determine the price that would be received to sell an asset or paid to transfer a liability in an orderly transaction between market participants at the measurement date (an exit price). Accordingly, the fair value hierarchy gives the highest priority to unadjusted quoted prices in active markets for identical assets or liabilities (Level 1 measurements) and the lowest priority to unobservable inputs (Level 3 measurements). The three levels of the fair value hierarchy are as follows:
• Level 1 – Valuations based on unadjusted quoted prices in active markets that are accessible at the measurement date for identical, unrestricted assets or liabilities.
• Level 2 – Valuations based on inputs, other than quoted prices included in Level 1, that are observable either directly or indirectly.
• Level 3 – Valuations based on inputs that are both significant and unobservable to the overall fair value measurement.
Investments in Private Investment Funds measured based upon NAV as a practical expedient to determine fair value are not required to be categorized in the fair value hierarchy.
90
Cliffwater Corporate Lending Fund |
Notes to Consolidated Financial Statements March 31, 2023 (Continued) |
5. Fair Value of Investments (continued)
The availability of valuation techniques and observable inputs can vary from investment to investment and are affected by a wide variety of factors, including type of investment, whether the investment is new and not yet established in the marketplace, the liquidity of markets, and other characteristics particular to the transaction. To the extent that valuation is based on models or inputs that are less observable or unobservable in the market, determining fair value requires more judgment. Because of the inherent uncertainly of valuation, estimated values may be materially higher or lower than the values that would have been used had a ready market for the investments existed. Accordingly, the degree of judgment exercised by the Valuation Designee in determining fair value is greatest for investments categorized in Level 3.
The Fund’s assets recorded at fair value have been categorized based on a fair value hierarchy as described in the Fund’s significant accounting policies. The following table presents information about the Fund’s assets and liabilities measured at fair value as of March 31, 2023:
Assets | Level 1 | Level 2 | Level 3 | Net Asset | Total | ||||||||||
Investments, at fair value |
|
|
|
|
| ||||||||||
Senior Secured Loans | $ | — | $ | 289,892,627 | $ | 9,091,742,653 | $ | — | $ | 9,381,635,280 | |||||
Private Investment |
| — |
| — |
| 35,925,426 |
| 4,983,049,991 |
| 5,018,975,417 | |||||
Collateralized Loan Obligations |
| — |
| 9,469,039 |
| 81,824,551 |
| — |
| 91,293,590 | |||||
Preferred Stocks |
| — |
| — |
| 88,528,773 |
| — |
| 88,528,773 | |||||
Common Stocks |
| — |
| — |
| 8,443,546 |
| — |
| 8,443,546 | |||||
Subordinated Debt |
| — |
| — |
| 162,219,034 |
| — |
| 162,219,034 | |||||
Warrants |
| — |
| — |
| 4,928,283 |
| — |
| 4,928,283 | |||||
Short-Term Investments |
| 78,357,066 |
| — |
| — |
| — |
| 78,357,066 | |||||
Total Investments, at fair value | $ | 78,357,066 | $ | 299,361,666 | $ | 9,473,612,266 | $ | 4,983,049,991 | $ | 14,834,380,989 | |||||
Other Financial Instruments1 |
|
|
|
|
| ||||||||||
Forward Contracts | $ | — | $ | 2,144,662 | $ | — | $ | — | $ | 2,144,662 | |||||
Swap Contracts |
| — |
| 8,173,599 |
| — |
| — |
| 8,173,599 | |||||
Total Assets | $ | 78,357,066 | $ | 309,679,927 | $ | 9,473,612,266 | $ | 4,983,049,991 | $ | 14,844,699,250 | |||||
Liabilities | Level 1 | Level 2 | Level 3 | Net Asset | Total | ||||||||||
Investments, at fair value |
|
|
|
|
| ||||||||||
Reverse Repurchase Agreement | $ | — | $ | 3,870,000 | $ | — | $ | — | $ | 3,870,000 | |||||
Other Financial Instruments1 |
|
|
|
|
| ||||||||||
Forward Contracts |
| — |
| 1,357,388 |
| — |
| — |
| 1,357,388 | |||||
Swap Contracts |
| — |
| 37,337,173 |
| — |
| — |
| 37,337,173 | |||||
Total Liabilities, at fair | $ | — | $ | 42,564,561 | $ | — | $ | — | $ | 42,564,561 | |||||
1 Other financial instruments are derivative instruments such as futures contracts, forward contracts and swap contracts. Futures contracts, forward contracts and swap contracts are valued at the unrealized appreciation (depreciation) on the instrument.
91
Cliffwater Corporate Lending Fund |
Notes to Consolidated Financial Statements March 31, 2023 (Continued) |
5. Fair Value of Investments (continued)
The following table presents the changes in assets and transfers in and out for investments that are classified in Level 3 of the fair value hierarchy for the year ended March 31, 2023:
Senior | Private | Collateralized | Preferred | Subordinated | ||||||||||||||||
Balance as of April 1, 2022 | $ | 6,319,615,266 |
| $ | 6,510,925 |
| $ | 90,396,005 |
| $ | 88,501,915 |
| $ | 5,468,056 |
| |||||
Purchases |
| 6,095,791,667 |
|
| 29,625,000 |
|
| 59,310,000 |
|
| 49,957,629 |
|
| 145,049,000 |
| |||||
Sales/Paydowns |
| (3,187,160,459 | ) |
| — |
|
| (55,193,858 | ) |
| (50,875,000 | ) |
| (2,394,651 | ) | |||||
Realized gains (losses)1 |
| 9,534,046 |
|
| — |
|
| 112,478 |
|
| — |
|
| 60,400 |
| |||||
Original issue discount and amendment fees |
| 4,594,176 |
|
| 278,302 |
|
| — |
|
| (300,000 | ) |
| — |
| |||||
Accretion |
| 10,769,612 |
|
| — |
|
| 147,820 |
|
| — |
|
| 51,756 |
| |||||
Change in Unrealized appreciation (depreciation) |
| (133,435,646 | ) |
| (488,801 | ) |
| (6,313,180 | ) |
| 1,244,229 |
|
| 4,682,019 |
| |||||
Transfers In2 |
| 14,812,500 |
|
| — |
|
| 2,834,325 |
|
| — |
|
| 9,302,454 |
| |||||
Transfers Out3 |
| (42,778,509 | ) |
| — |
|
| (9,469,039 | ) |
| — |
|
| — |
| |||||
Balance as of March 31, 2023 | $ | 9,091,742,653 |
| $ | 35,925,426 |
| $ | 81,824,551 |
| $ | 88,528,773 |
| $ | 162,219,034 |
| |||||
Net change in unrealized appreciation/(depreciation) attributable to Level 3 investments held at March 31, 2023 | $ | (122,620,630 | ) | $ | (488,801 | ) | $ | (5,396,503 | ) | $ | 1,244,229 |
| $ | 4,682,019 |
| |||||
Warrants | Common | Total | ||||||||
Balance as of April 1, 2022 | $ | 1,279,790 | $ | 5,561,463 | $ | 6,517,333,420 |
| |||
Purchases |
| — |
| 1,500,000 |
| 6,381,233,296 |
| |||
Sales/Paydowns |
| — |
| — |
| (3,295,623,968 | ) | |||
Realized gains (losses)1 |
| — |
| — |
| 9,706,924 |
| |||
Original issue discount and amendment fees |
| — |
| — |
| 4,572,478 |
| |||
Accretion |
| — |
| — |
| 10,969,188 |
| |||
Change in Unrealized appreciation (depreciation) |
| 3,648,493 |
| 1,382,083 |
| (129,280,803 | ) | |||
Transfers In2 |
| — |
| — |
| 26,949,279 |
| |||
Transfers Out3 |
| — |
| — |
| (52,247,548 | ) | |||
Balance as of March 31, 2023 | $ | 4,928,283 | $ | 8,443,546 | $ | 9,473,612,266 |
| |||
Net change in unrealized appreciation/(depreciation) attributable to Level 3 investments held at March 31, 2023 | $ | 3,648,493 | $ | 1,382,083 | $ | (117,549,110 | ) | |||
1 Senior Secured Loans includes paydown gains (losses) of $7,316,522.
2 Transferred from Level 2 to Level 3 because observable market data became unavailable for the investments.
3 Transferred from Level 3 to Level 2 because observable market data became available for the investments.
92
Cliffwater Corporate Lending Fund |
Notes to Consolidated Financial Statements March 31, 2023 (Continued) |
5. Fair Value of Investments (continued)
The following table summarizes the valuation techniques and significant unobservable inputs used for the Fund’s investments that are categorized in Level 3 of the fair value hierarchy as of March 31, 2023.
Investments | Fair Value | Valuation | Unobservable | Range of | Weighted | Impact on | |||||||
Collateralized Loan Obligations | $ | 7,200,000 | Market approach | Recent Transaction Price | $96.00 | $96.00 | Increase | ||||||
| 74,624,551 | Income approach | Interest Rate/ Discount Margin | 10.30% – 18.50% | 15.45% | Decrease | |||||||
| Default Rate | 3 CDR | 3 CDR | Decrease | |||||||||
| Recovery Rate | 65% | 65% | Increase | |||||||||
| Term | Maturity, or Reinvestment +24 months | N/A | Decrease | |||||||||
| Prepayment Assumptions | 20 CPR | 20 CPR | Increase | |||||||||
|
|
|
| Reinvestment Assumptions | $99.00 | $99.00 | Decrease | ||||||
Common Stocks |
| 1,500,000 | Market approach | Recent Transaction Price | $1,000 | $1,000 | Increase | ||||||
| 5,844,178 | Market approach | LTM Revenue Multiple | 2.2x | 2.2x | Increase | |||||||
| 968,234 | Market approach | Run Rate Adj. EBITDA Multiple | 8.0x | 8.0x | Increase | |||||||
| 131,134 | Market approach | LTM EBITDA Multiple | 16.0x | 16.0x | Increase | |||||||
Preferred Stocks |
| 35,030,000 | Market approach | Recent Transaction Price | $970 – $980 | $973 | Increase | ||||||
| 53,498,773 | Income approach/Market approach | Discount Rate | 12.57% – 12.79% | 12.79% | Increase | |||||||
| Run Rate Adj. EBITDA Multiple | 8.0x | 8.0x | Increase | |||||||||
| LTM Revenue Multiple | 3.3x – 5.8x | 4.1x | Increase | |||||||||
|
|
|
| LTM EBITDA Multiple | 9.4x – 28.0x | 16.8x | Increase | ||||||
Private Investment Vehicles |
| 29,624,289 | Market approach | Recent Transaction Price | $100 – $25,000 | $120 | Increase | ||||||
| 6,301,137 | Income approach | Weighted Average Cost of Capital | 15.00% – 16.00% | 15.16% | Decrease | |||||||
93
Cliffwater Corporate Lending Fund |
Notes to Consolidated Financial Statements March 31, 2023 (Continued) |
5. Fair Value of Investments (continued)
Investments | Fair Value | Valuation | Unobservable | Range of | Weighted | Impact on | |||||||
Senior Secured Loans | $ | 6,992,226,005 | Income approach | Discount Rate | 3.23% – 19.36% | 9.84% | Decrease | ||||||
| LTM Revenue | $25 – $8,052 | $465 | Increase | |||||||||
| Debt/EBITDA | 0.5x – 11.6x | 5.7x | Decrease | |||||||||
| Interest Coverage | 0.0x – 11.2x | 2.0x | Increase | |||||||||
| 8,284,751 | Market approach | Enterprise value | $19 – $96 | $67 | Increase | |||||||
| 2,091,231,897 | Market approach | Recent Transaction Price | $82.00 – $100.00 | $97.66 | Increase | |||||||
Subordinated Debt |
| 5,468,131 | Market approach | LTM EBITDA Multiple | 9.3x | 9.3x | Increase | ||||||
| 156,750,903 | Income approach | Discount Rate | 10.38% – 13.77% | 11.65% | Decrease | |||||||
| LTM Revenue | $266 – $1,910 | $547 | Increase | |||||||||
| Debt/EBITDA | 8.0x – 9.3x | 8.5x | Decrease | |||||||||
|
|
|
| Interest Coverage | 1.3x – 2.7x | 2.6x | Increase | ||||||
Warrants |
| 1,065,013 | Market approach | Cost of equity | 16.80% | 16.80% | Decrease | ||||||
| Enterprise value | $3,393 – $3,983 | $3,688 | Increase | |||||||||
|
| 3,863,270 | Income approach | Exercise Price | $1.65 – $2.28 | $1.70 | Decrease | ||||||
|
|
|
| Expected Volatility | 60% – 98% | 71% | Increase | ||||||
Total | $ | 9,473,612,266 |
|
|
|
|
| ||||||
6. Capital Stock
The Fund is authorized as a Delaware statutory trust to issue an unlimited number of Shares in one or more classes, with a par value of $0.001. The minimum initial investment in Class I Shares by any investor is $10 million. However, the Fund, in its sole discretion, may accept investments below this minimum with respect to Class I Shares. Shares may be purchased by principals and employees of the Investment Manager or its affiliates and their immediate family members without being subject to the minimum investment requirements.
Class I Shares are not subject to any initial sales charge. Shares will generally be offered for purchase on each business day at NAV per share, except that Shares may be offered more or less frequently as determined by the Board in its sole discretion. The Board may also suspend or terminate offerings of Shares at any time.
A shareholder whose Shares (or a portion thereof) are repurchased by the Fund will not be entitled to a return of any sales charge that was charged in connection with the shareholder’s purchase of the Shares.
Pursuant to Rule 23c-3 under the Investment Company Act, on a quarterly basis, the Fund offers shareholders holding all classes of shares the option of redeeming shares at NAV. The Board determines the quarterly repurchase offer amount (“Repurchase Offer Amount”), which can be no less than 5% and no more than 25% of all shares of all classes outstanding on the repurchase request deadline. If shareholders tender more than the Repurchase Offer Amount, the
94
Cliffwater Corporate Lending Fund |
Notes to Consolidated Financial Statements March 31, 2023 (Continued) |
6. Capital Stock (continued)
Fund may, but is not required to, repurchase an additional amount of shares not to exceed 2% of all outstanding shares of the Fund on the repurchase request deadline If the Fund determines not to repurchase more than the Repurchase Offer Amount, or if shareholders tender Shares in an amount exceeding the Repurchase Offer Amount plus 2% of the outstanding Shares on the Repurchase Request Deadline, the Fund will repurchase the Shares on a pro rata basis. However, the Fund may accept all shares tendered for repurchase by shareholders who own less than $2,500 worth of Shares and who tender all of their Shares, before prorating other amounts tendered. In addition, the Fund may accept the total number of Shares tendered in connection with required minimum distributions from an IRA or other qualified retirement plan. It is the shareholder’s obligation to both notify and provide the Fund supporting documentation of a required minimum distribution from an IRA or other qualified retirement plan. The results of the repurchase offers conducted for the year ended March 31, 2023 are as follows:
Commencement Date |
| April 14, 2022 |
|
| July 14, 2022 |
|
| October 13, 2022 |
|
| January 20, 2023 |
| ||||
Repurchase Request |
| May 16, 2022 |
|
| August 15, 2022 |
|
| November 14, 2022 |
|
| February 21, 2023 |
| ||||
Repurchase Pricing date |
| May 16, 2022 |
|
| August 15, 2022 |
|
| November 14, 2022 |
|
| February 21, 2023 |
| ||||
|
|
|
|
|
|
|
| |||||||||
Net Asset Value as of Repurchase Offer Date |
|
|
|
|
|
|
|
| ||||||||
Class I | $ | 10.66 |
| $ | 10.66 |
| $ | 10.58 |
| $ | 10.61 |
| ||||
|
|
|
|
|
|
|
| |||||||||
Amount Repurchased |
|
|
|
|
|
|
|
| ||||||||
Class I | $ | 225,106,363 |
| $ | 187,676,994 |
| $ | 351,675,872 |
| $ | 283,194,647 |
| ||||
|
|
|
|
|
|
|
| |||||||||
Percentage of Outstanding Shares Repurchased |
|
|
|
|
|
|
|
| ||||||||
Class I |
| 2.94 | % |
| 2.11 | % |
| 3.54 | % |
| 2.61 | % |
7. Federal Income Taxes
Fund Income Tax
At March 31, 2023, gross unrealized appreciation and depreciation on investments, based on cost for federal income tax purposes were as follows:
Cost of investments including proceeds from reverse repurchase agreements | $ | 14,895,057,234 |
| |
Gross unrealized appreciation |
| 169,691,927 |
| |
Gross unrealized depreciation |
| (230,368,172 | ) | |
Net unrealized depreciation on investments | $ | (60,676,245 | ) |
The difference between cost amounts for financial statement and federal income tax purposes is due primarily to timing differences in recognizing certain gains and losses in security transactions.
GAAP requires that certain components of net assets be reclassified between financial and tax reporting. Permanent differences between book and tax basis are attributable to certain investments in partnerships and holdings in Domestic Blockers. These reclassifications have no effect on net assets or net asset value per share. For the year ended December 31, 2022, permanent differences in book and tax accounting have been reclassified to paid-in capital and total distributable earnings.
Increases/(Decrease) | ||||||
Capital | Total | |||||
Cliffwater Corporate Lending Fund | $ | 5,904,925 | $ | (5,904,925) | ||
95
Cliffwater Corporate Lending Fund |
Notes to Consolidated Financial Statements March 31, 2023 (Continued) |
7. Federal Income Taxes (continued)
As of December 31, 2022, the components of distributable earnings on a tax basis were as follows:
Undistributed ordinary income | $ | — |
| |
Undistributed long-term capital gains |
| — |
| |
Accumulated capital and other losses |
| — |
| |
Unrealized appreciation/(depreciation) |
|
| ||
Investments |
| (66,567,767 | ) | |
Foreign Currency |
| — |
| |
Organizational costs |
| (37,916 | ) | |
Total distributable earnings | $ | (66,605,683 | ) |
The tax character of distributions paid during the fiscal years ended December 31, 2022 and December 31, 2021 were as follows:
2022 | 2021 | |||||
Distribution paid from: |
|
| ||||
Ordinary income | $ | 565,713,472 | $ | 165,497,728 | ||
Return of Capital |
| 122,545,406 |
| 28,307,888 | ||
Net long-term capital gains |
| — |
| 7,900,814 | ||
Total distributions paid | $ | 688,258,878 | $ | 201,706,430 | ||
Domestic Blocker Income Tax
CCLF Holdings LLC and CCLF Holdings (D3) LLC (the “Domestic Blockers”) recorded provisions for income tax expense (benefit) for the year ended March 31, 2023, in the amount of $920,607. This provision for income tax expense (benefit) is comprised of the following current and deferred income tax expense (benefit):
Deferred | $ | 920,607 |
As of March 31, 2023, temporary differences between financial and tax reporting that give rise to deferred income taxes totaled $1,421,142, resulting principally from differences in the recognition of income from partnership investments and the treatment of unrealized appreciation/depreciation. The Domestic Blockers have a net deferred tax liability recorded as of March 31, 2023. Should a net deferred tax asset exist in the future, the Domestic Blockers will assess whether a valuation allowance should be booked to reserve against that asset.
The statutory rate and effective federal rate is 21%. The Fund is currently using an estimated tax rate of 3.95% for state and local tax, net of federal tax benefit.
8. Investment Transactions
For the year ended March 31, 2023, purchases and sales of investments, excluding short-term investments, were $9,203,293,359 and $3,303,870,441 respectively
9. Indemnifications
In the normal course of business, the Fund enters into contracts that contain a variety of representations which provide general indemnifications. The Fund’s maximum exposure under these arrangements is unknown, as this would involve future claims that may be made against the Fund that have not yet occurred. However, the Fund expects the risk of loss to be remote.
96
Cliffwater Corporate Lending Fund |
Notes to Consolidated Financial Statements March 31, 2023 (Continued) |
10. Derivatives and Hedging Disclosures
U.S. GAAP requires enhanced disclosures about the Fund’s derivative and hedging activities, including how such activities are accounted for and their effects on the Fund’s financial position, performance and cash flows. The Fund invested in forward foreign exchange currency contracts and swap contracts for the year ended March 31, 2023 in order to hedge overall portfolio currency risk and interest rate risk, respectively. By entering into forward foreign exchange currency contracts, the Fund agrees to exchange different currencies at a specified exchange rate at an agreed-upon future date. The Fund may be susceptible to the risk of changes in the foreign exchange rate underlying the forward contract and of the counterparty’s potential inability to fulfill the terms of the contract. By entering into swap agreements, the Fund agrees to exchange payments at specified dates on the basis of a specified notional amount, with the payments calculated by reference to specified securities, indexes, reference rates, currencies or other instruments. The Fund may be susceptible to losses if interest rate or foreign currency exchange rates or credit quality changes are not correctly anticipated by the Fund or if the reference index, security or investments do not perform as expected, and are subject to counterparty credit, liquidity, valuation, correlation and leverage risk.
The effects of these derivative instruments on the Fund’s financial position and financial performance as reflected in the Consolidated Statement of Assets and Liabilities and Consolidated Statement of Operations are presented in the tables below. Forward contracts are not designated as hedging instruments. Interest rate swap contracts are designated as hedging instruments. The fair values of derivative instruments as of March 31, 2023, and the realized and unrealized gain (loss) during the year ended March 31, 2023 by risk category are as follows:
Derivatives Designated as Hedging Instruments | ||||||||
Consolidated Statement of Asset and | Derivatives Instruments | Asset | Liability | |||||
Value | Value | |||||||
Net unrealized depreciation on swap contracts | Interest Rate Swap Contracts | $ | 8,173,599 | $ | 37,337,173 | |||
Total | $ | 8,173,599 | $ | 37,337,173 | ||||
Derivatives Not Designated as Hedging Instruments | ||||||||
Consolidated Statement of Asset and | Derivatives Instruments | Asset | Liability | |||||
Value | Value | |||||||
Net unrealized appreciation on forward foreign currency exchange contracts | Forward Contracts | $ | 2,144,662 | $ | 1,357,388 | |||
Total | $ | 2,144,662 | $ | 1,357,388 | ||||
Amount of Net Realized Gain or (Loss) on Derivatives Recognized in Income | ||||||
Derivatives Instruments | Forward | Total | ||||
Forward Foreign Currency Exchange Contracts | $ | 4,252,987 | $ | 4,252,987 | ||
Net Change in Unrealized Appreciation/Depreciation on Derivatives Recognized in Income | ||||||
Derivatives Instruments | Forward | Total | ||||
Forward Foreign Currency Exchange Contracts | $ | 169,807 | $ | 169,807 | ||
The quarterly average volumes of derivative instruments as of March 31, 2023 are as follows:
Derivatives Instruments | Short Forward | Long Swap | ||
Forward Foreign Currency Exchange Contracts | 20 | — | ||
Interest Rate Swap Contracts | — | 9 |
97
Cliffwater Corporate Lending Fund |
Notes to Consolidated Financial Statements March 31, 2023 (Continued) |
11. Disclosures about Offsetting Assets and Liabilities
Disclosures about Offsetting Assets and Liabilities requires an entity to disclose information about offsetting and related arrangements to enable users of its financial statements to understand the effect of those arrangements on its financial position. The guidance requires retrospective application for all comparative periods presented.
A fund mitigates credit risk with respect to OTC derivative counterparties through credit support annexes included with International Swaps and Derivatives Association, Inc. (“ISDA”) Master Agreements or other Master Netting Agreements which are the standard contracts governing most derivative transactions between the fund and each of its counterparties. These agreements allow the fund and each counterparty to offset certain derivative financial instruments’ payables and/or receivables against each other and/or with collateral, which is generally held by the fund’s custodian. The amount of collateral moved to/from applicable counterparties is based upon minimum transfer amounts specified in the agreement. To the extent amounts due to the fund from its counterparties are not fully collateralized contractually or otherwise, the fund bears the risk of loss from counterparty non-performance.
It is the Fund’s policy to recognize a net asset or liability equal to the unrealized appreciation (depreciation) of each derivative contract. As of March 31, 2023, the Fund is subject to master netting arrangements for forward foreign currency exchange contracts and swap contracts. The following table shows additional information regarding the offsetting of assets and liabilities, as of March 31, 2023:
Description | Counter | Gross | Gross | Net Amounts |
| ||||||||||||||||||
Financial | Cash | Net | |||||||||||||||||||||
Assets | |||||||||||||||||||||||
Unrealized appreciation on swap contracts | PNC | $ | 8,173,599 |
| $ | (8,173,599 | ) | $ | — |
| $ | — | $ | — | $ | — | |||||||
Total Assets | $ | 8,173,599 |
| $ | (8,173,599 | ) | $ | — |
| $ | — | $ | — | $ | — | ||||||||
|
|
|
|
|
|
|
|
| |||||||||||||||
Liabilities |
|
|
|
|
|
|
|
|
| ||||||||||||||
Unrealized depreciation on swap contracts | PNC |
| (24,756,110 | ) |
| 8,173,599 |
|
| (16,582,511 | ) |
| — |
| 16,582,511 |
| — | |||||||
Unrealized Depreciation on swap contracts | MUFG |
| (12,581,063 | ) |
| — |
|
| (12,581,063 | ) |
| — |
| 12,581,063 |
| — | |||||||
Total Liabilities | $ | (37,337,173 | ) | $ | 8,173,599 |
| $ | (29,163,574 | ) | $ | — | $ | 29,163,574 | $ | — | ||||||||
* Amounts relate to master netting agreements and collateral agreements which have been determined by the Investment Manager to be legally enforceable in the event of default but where certain other criteria are not met in accordance with applicable offsetting accounting guidance. The collateral amounts may exceed the related net amounts of financial assets and liabilities presented in the Consolidated Statement of Assets and Liabilities. Where this is the case, the total amount reported is limited to the net amounts of financial assets and liabilities with that counterparty.
12. Joint Ventures
In accordance with Regulation S-X and GAAP, the Fund is not permitted to consolidate any subsidiary or other entity that is not an investment company, including those in which the Fund has a controlling interest unless the business of the controlled subsidiary consists of providing services to the Fund. In accordance with Regulation S-X Rules 3-09 and 4-08(g), the Fund evaluates its unconsolidated subsidiaries as significant subsidiaries under the respective rules. As
98
Cliffwater Corporate Lending Fund |
Notes to Consolidated Financial Statements March 31, 2023 (Continued) |
12. Joint Ventures (continued)
of March 31, 2023, Middle Market Credit Fund II, LLC and FBLC Senior Loan Fund, LLC were not considered significant subsidiaries under Regulation S-X Rule 1-02(w). Based on the requirements under Regulation S-X Rule 4-08(g), the summarized financial information of these unconsolidated subsidiaries is presented below:
Middle Market Credit Fund II, LLC (“Credit Fund”)
Consolidated Statement of Assets and Liabilities (Unaudited)
(amounts in thousands)
As of | |||
ASSETS |
| ||
Investments, at fair value (amortized cost of $249,244) | $ | 241,769 | |
Cash, cash equivalents and restricted cash1 |
| 6,584 | |
Interest receivable |
| 2,812 | |
Receivable for investments sold/repaid |
| 122 | |
Total assets | $ | 251,287 | |
As of | ||||
LIABILITIES AND MEMBERS’ EQUITY |
|
| ||
Notes payable, net of unamortized debt issuance cost of $759 |
| 156,741 |
| |
Interest and credit facility fees payable |
| 2,417 |
| |
Dividend payable |
| 6,851 |
| |
Other accrued expenses and liabilities |
| 556 |
| |
Total liabilities |
| 166,565 |
| |
Members’ equity |
|
| ||
Members’ contributions |
| 90,805 |
| |
Accumulated income (loss) from operations (net of cumulative dividends) |
| (6,083 | ) | |
Total members’ equity |
| 84,722 |
| |
Total liabilities and members’ equity | $ | 251,287 |
| |
1 As of March 31, 2023, all of cash and cash equivalents was restricted
Consolidated Statements of Operations (Unaudited)
(amounts in thousands)
For the three | ||||
Investment income: |
|
| ||
Interest income | $ | 6,607 |
| |
Other income |
| — |
| |
Total investment income |
| 6,607 |
| |
|
| |||
Expenses: |
|
| ||
Professional fees |
| 166 |
| |
Administrative service fees |
| 21 |
| |
Interest and credit facility expenses |
| 2,944 |
| |
Other general and administrative |
| 88 |
| |
Total expenses |
| 3,219 |
| |
|
| |||
Net investment income (loss) |
| 3,388 |
| |
|
| |||
Net realized gain (loss) on investments |
| — |
| |
Net change in unrealized appreciation (depreciation) on investments |
| (2,080 | ) | |
Net realized gain (loss) and net change in unrealized appreciation (depreciation) on investments |
| (2,080 | ) | |
Net increase (decrease) in net assets resulting from operations | $ | 1,308 |
| |
99
Cliffwater Corporate Lending Fund |
Notes to Consolidated Financial Statements March 31, 2023 (Continued) |
12. Joint Ventures (continued)
FBLC Senior Loan Fund, LLC
Consolidated Statement of Assets, Liabilities and Members’ Equity (Unaudited)
(dollars in thousands)
As of | ||||
ASSETS |
|
| ||
Investments, at fair value (amortized cost of $929,893) | $ | 867,931 |
| |
Cash and cash equivalents |
| 65,791 |
| |
Cash collateral on deposit with custodian |
| 20,920 |
| |
Receivable for unsettled trades |
| 10,461 |
| |
Interest receivable |
| 7,069 |
| |
Prepaid expenses and other assets |
| 2 |
| |
Total assets | $ | 972,174 |
| |
|
| |||
LIABILITIES |
|
| ||
Revolving credit facilities (net of deferred financing costs of $1,235) | $ | 537,815 |
| |
Secured borrowings |
| 62,744 |
| |
Payable for unsettled trades |
| 11,192 |
| |
Distribution payable |
| 8,510 |
| |
Interest and credit facility fees payable |
| 7,183 |
| |
Accounts payable and accrued expenses |
| 1,019 |
| |
Total liabilities | $ | 628,463 |
| |
|
| |||
MEMBERS’ CAPITAL |
|
| ||
Capital contributed |
| 383,496 |
| |
Accumulated loss |
| (39,785 | ) | |
Total members’ capital |
| 343,711 |
| |
Total liabilities and members’ capital | $ | 972,174 |
| |
Consolidated Statement of Operations (Unaudited)
(dollars in thousands)
Investment income: |
|
| ||
Interest from investments | $ | 21,741 |
| |
Interest from cash and cash equivalents |
| 711 |
| |
Total interest income |
| 22,452 |
| |
Fee and other income |
| 120 |
| |
Total investment income |
| 22,572 |
| |
|
| |||
Operating expenses: |
|
| ||
Interest and credit facility financing expenses |
| 9,755 |
| |
Other general and administrative |
| 358 |
| |
Professional fees |
| 218 |
| |
Total expenses |
| 10,331 |
| |
Net investment income |
| 12,241 |
| |
|
| |||
Realized and unrealized loss on investments: |
|
| ||
Net realized loss from investments |
| (1,098 | ) | |
Net change in unrealized depreciation on investments |
| 5,637 |
| |
Net realized and unrealized gain (loss) on investments |
| 4,539 |
| |
Net increase in members’ capital resulting from operations | $ | 16,780 |
|
100
Cliffwater Corporate Lending Fund |
Notes to Consolidated Financial Statements March 31, 2023 (Continued) |
13. Private Investment Vehicles
The following table represents investment strategies, unfunded commitments and redemptive restrictions of investments that are measured at NAV per share (or its equivalent) as a practical expedient as of March 31, 2023:
Security Description | Investment Category | Cost | Fair Value | Unfunded Commitments | Redemption Frequency | Redemption | Fund Term | ||||||||||
17Capital Co-Invest (B) SCSp | NAV loan to a European private equity fund | $ | 25,090,931 | $ | 23,628,267 | $ | 287,500 | None | N/A | Liquidation to commence on the earlier of 5/7/2031 but no later than 180 days following full realization | |||||||
ABPCI Pacific Funding LP | Middle market direct lending |
| 106,770,833 |
| 110,943,440 |
| 98,229,167 | None | Redemptions pursuant to the note purchase and security agreement upon the direction of a majority of the subordinated notes | November 3, 2031 after the payment in full of the obligations of the issuer pursuant to the note purchase agreement | |||||||
AG Direct Lending Fund II (Unlevered), L.P. | Middle market direct lending |
| 23,435,106 |
| 25,385,433 |
| 2,398,584 | None | N/A | Fifth anniversary of the expiration of the commitment period with one one-year extension available | |||||||
AG Direct Lending Fund II, L.P. | Middle market direct lending |
| 18,142,298 |
| 19,819,302 |
| - | None | N/A | December 31, 2024 with one-year extensions available | |||||||
AG Direct Lending Fund III, L.P. | Middle market direct lending |
| 13,843,946 |
| 14,266,184 |
| 1,600,000 | None | N/A | September 30, 2026 with one-year extensions available | |||||||
AG DLI, L.P. | Middle market direct lending |
| 8,138,331 |
| 9,164,202 |
| 1,500,000 | None | N/A | Until the earlier of the dissolution of investments or the partnership | |||||||
AG GTDL Fund II, L.P. | Middle market direct lending |
| 23,603,103 |
| 25,507,913 |
| 2,400,000 | None | N/A | Fifth anniversary of the expiration of the commitment period with one one-year extension available | |||||||
AG GTDL Fund, L.P. | Middle market direct lending |
| 2,956,185 |
| 3,047,916 |
| 820,000 | None | N/A | Fifth anniversary of the expiration of the commitment period with one one-year extension available | |||||||
101
Cliffwater Corporate Lending Fund |
Notes to Consolidated Financial Statements March 31, 2023 (Continued) |
13. Private Investment Vehicles (continued)
Security Description | Investment Category | Cost | Fair Value | Unfunded Commitments | Redemption Frequency | Redemption | Fund Term | ||||||||||
AG KFHDL Fund, L.P. | Middle market direct lending | $ | 2,962,005 | $ | 3,048,185 | $ | 820,000 | None | N/A | Fifth anniversary of the expiration of the commitment period with one one-year extension available | |||||||
AGTB BDC Holdings, L.P. | Middle market direct lending |
| 125,000,000 |
| 126,386,018 |
| - | None | N/A | Six-year anniversary of the initial closing as determined by the board if a merger has not occurred | |||||||
Antares Loan Funding I Ltd. | Middle market direct lending |
| 103,200,000 |
| 105,176,850 |
| - | None | Pursuant to the priority of payments, notes may be redeemed in whole or in part on the applicable quarterly payment date in accordance with the credit agreement | February 17, 2032 | |||||||
Antares Senior Loan Parallel Feeder Fund II (Cayman) LP | Middle market direct lending |
| 25,995,953 |
| 27,578,597 |
| 174,000,000 | None | N/A | Until the dissolution of the partnership in accordance with the limited partnership agreement | |||||||
AG KFHDL Fund, L.P. | Asset-based lending |
| 15,404,552 |
| 17,841,187 |
| 8,985,234 | None | N/A | June 30, 2025 | |||||||
Ares Priority Loan Co-Invest LP | Priority revolvers to middle market companies |
| 24,500,000 |
| 24,854,411 |
| 15,500,000 | None | N/A | Until the end of the fiscal quarter during which occurs the fifth anniversary of the end of the investment period which may be extended for one year | |||||||
Ares Strategic Income Fund | Middle market direct lending |
| 26,673,300 |
| 26,857,892 |
| 73,326,700 | None | N/A | Perpetual unless terminated pursuant to the applicable provisions contained in the Declaration of Trust or the Statutory Trust Act | |||||||
102
Cliffwater Corporate Lending Fund |
Notes to Consolidated Financial Statements March 31, 2023 (Continued) |
13. Private Investment Vehicles (continued)
Security Description | Investment Category | Cost | Fair Value | Unfunded Commitments | Redemption Frequency | Redemption | Fund Term | ||||||||||
Banner Ridge DSCO Fund II (Offshore), LP | Diversified private credit strategies | $ | - | $ | 182,906 | $ | 50,000,000 | None | N/A | Until the tenth anniversary of the initial closing date with two one-year extensions | |||||||
Barings Capital Investment Corporation | Middle market direct lending |
| 95,000,000 |
| 93,556,934 |
| - | None | N/A | Until the earlier of a liquidity event or July 13, 2027 | |||||||
Barings CMS Fund, LP | Middle market direct lending |
| 3,000,000 |
| 3,205,755 |
| 247,000,000 | None | N/A | Until distribution of investment proceeds | |||||||
Barings Private Credit Corporation | Middle market direct lending |
| 900,000,000 |
| 914,090,978 |
| - | Quarterly2 | Redemptions permitted at the discretion of the investment manager | N/A | |||||||
BlackRock Shasta Senior Loan Fund VII, LLC | Middle market direct lending |
| 551,094,951 |
| 552,871,857 |
| 92,000,000 | None | Redemptions pursuant to the Note Purchase and Security Agreement upon the direction of a majority of the subordinated note purchasers with the consent of the collateral manager | Earlier of twelve years from closing date and the amortization date (if any) | |||||||
Carlyle Secured Lending III | Middle market direct lending |
| 3,750,000 |
| 3,797,857 |
| 6,250,000 | None | N/A | Perpetual until the company is sold and/or liquidated and dissolved | |||||||
CCOF Sierra II, LP | Preferred equity co-investment |
| 15,600,000 |
| 16,728,573 |
| 400,000 | None | N/A | Ten-year anniversary of the final closing date with two one-year extensions | |||||||
CDL Tender Fund 2022-1, | Middle market direct lending |
| 50,000,000 |
| 50,299,459 |
| - | None | N/A | Until the dissolution of the partnership in accordance with the limited partnership agreement | |||||||
Chilly HP SCF Investor, LP | Preferred equity co-investment |
| 1,980,197 |
| 2,109,569 |
| - | None | N/A | Until the dissolution of the partnership in accordance with the limited partnership agreement | |||||||
103
Cliffwater Corporate Lending Fund |
Notes to Consolidated Financial Statements March 31, 2023 (Continued) |
13. Private Investment Vehicles (continued)
Security Description | Investment Category | Cost | Fair Value | Unfunded Commitments | Redemption Frequency | Redemption | Fund Term | ||||||||||
Comvest Structured Note Issuer I LLC | Middle market direct lending | $ | 140,005,578 | $ | 140,146,782 | $ | 360,557,769 | None | Optional redemption pursuant to the indenture at the written direction of a majority of the subordinated notes with the consent of the investment manager | November 2034 | |||||||
Crescent Mezzanine Partners VIIC, L.P. | Mezzanine level subordinated debt |
| 5,426,693 |
| 6,264,849 |
| 3,351,705 | None | N/A | December 21, 2025 available | |||||||
Crestline Specialty Lending III (US), L.P. | Middle market direct lending |
| 18,513,545 |
| 18,821,824 |
| 11,918,051 | None | N/A | December 1, 2028 with one-year extensions available | |||||||
Endurance II Co-Invest, L.P. | Direct lending to an international education company |
| 9,754,940 |
| 10,724,514 |
| 300,000 | None | N/A | Until the completion of the liquidation | |||||||
FBLC Senior Loan Fund LLC | Middle market direct lending |
| 78,562,000 |
| 71,110,878 |
| - | None | N/A | Until all investments are amortized, liquidated, transferred or disposed | |||||||
Franklin BSP Lending Corporation | Middle market direct lending |
| 30,483,901 |
| 39,285,287 |
| - | Semi-Annually1 | N/A | N/A | |||||||
Golub Capital BDC 4, Inc. | Middle market direct lending |
| 39,901,821 |
| 40,636,411 |
| 160,098,179 | None | N/A | Perpetual until the company is sold and/or liquidated and dissolved | |||||||
Golub Capital Direct Lending Corporation | Middle market direct lending |
| 32,750,000 |
| 33,206,879 |
| 17,250,000 | None | N/A | July 1, 2027 with extensions upon the approval of shareholders | |||||||
HPS Mezzanine Partners 2019, L.P. | Mezzanine level subordinated debt |
| 8,233,224 |
| 9,057,612 |
| 2,177,766 | None | N/A | April 12, 2029 with one-year extensions available | |||||||
HPS Mint Co-Invest, L.P. | Preferred equity co-investment |
| 20,944,974 |
| 21,392,898 |
| 608,651 | None | N/A | Until all investments are liquidated and all proceeds are distributed or as determined by the general partner | |||||||
104
Cliffwater Corporate Lending Fund |
Notes to Consolidated Financial Statements March 31, 2023 (Continued) |
13. Private Investment Vehicles (continued)
Security Description | Investment Category | Cost | Fair Value | Unfunded Commitments | Redemption Frequency | Redemption | Fund Term | ||||||||||
HPS Specialty Loan Fund V Feeder, L.P. | Middle market direct lending | $ | 42,490,660 | $ | 41,916,380 | $ | 23,750,000 | None | N/A | September 10, 2028 with 1 year extensions available | |||||||
Luther Co-Invest, L.P. | Direct lending to French football league media rights |
| 14,579,288 |
| 15,038,565 |
| 5,422,654 | None | N/A | Until all investments are liquidated and all proceeds are distributed or as determined by the general partner | |||||||
Marlin Credit Opportunities Fund, L.P. | Middle market direct lending |
| 100,408,617 |
| 95,984,920 |
| 24,591,383 | None | N/A | May 19, 2028 with one-year extensions available | |||||||
Middle Market Credit Fund II, LLC | Middle market direct lending |
| 12,708,191 |
| 14,669,248 |
| - | None | N/A | Until all investments are amortized, liquidated, transferred or disposed | |||||||
Minerva Co-Invest, L.P. | Preferred equity co-investment |
| 14,720,019 |
| 14,660,523 |
| 298,500 | None | N/A | Until distribution of investment proceeds | |||||||
Morgan Stanley Direct Lending Fund | Middle market direct lending |
| 39,339,489 |
| 38,375,102 |
| 6,160,511 | Quarterly3 | N/A | N/A | |||||||
New Mountain Guardian III BDC, L.L.C. | Middle market direct lending |
| 100,000,000 |
| 97,536,674 |
| - | None | N/A | July 15, 2025 with one-year extensions available | |||||||
New Mountain Guardian IV BDC, L.L.C. | Middle market direct lending |
| 7,500,000 |
| 7,513,742 |
| 17,500,000 | None | N/A | Six years from the end of the closing period with a one-year extension available | |||||||
NXT Capital Structured Note I LLC | Middle market direct lending |
| 93,695,908 |
| 93,713,602 |
| 88,153,592 | None | Optional redemption pursuant to the indenture upon the direction of the investment manager or at the written direction of a majority of the holders of the subordinated notes | Nine years from the initial closing date | |||||||
Odyssey Co-Investment Partners B, LLC | Common equity co-investment |
| 1,555,423 |
| 1,522,703 |
| 444,577 | None | N/A | Until the dissolution of the partnership in accordance with the limited partnership agreement | |||||||
105
Cliffwater Corporate Lending Fund |
Notes to Consolidated Financial Statements March 31, 2023 (Continued) |
13. Private Investment Vehicles (continued)
Security Description | Investment Category | Cost | Fair Value | Unfunded Commitments | Redemption Frequency | Redemption | Fund Term | ||||||||||
Owl Rock Core Income Corp. | Middle market direct lending | $ | 150,000,000 | $ | 149,951,024 | $ | - | Quarterly2 | N/A | N/A | |||||||
Owl Rock Technology Finance Corp. | Middle market direct lending |
| 35,000,000 |
| 36,125,056 |
| - | None | N/A | Until earliest of an Exchange Listing, the fifth anniversary of the final closing, and August 10, 2025 | |||||||
Owl Rock Technology Finance Corp. II | Middle market direct lending |
| 38,437,905 |
| 39,379,668 |
| 36,562,095 | None | N/A | Earlier of the five year anniversary of the Final Closing and the seven year anniversary of the Initial Closing, with two one-year extensions available | |||||||
Providence Debt Fund III (Non-US) L.P. | Middle market direct lending |
| 7,489,945 |
| 9,068,558 |
| 14,848,433 | None | N/A | October 24, 2021 with one-year extensions available | |||||||
Proxima Co-Invest, L.P. | Direct lending to a renewable energy company |
| 4,759,843 |
| 4,789,096 |
| 5,291,789 | None | N/A | Until the completion of the liquidation | |||||||
Raven Asset-Based Credit Fund II LP | Asset-based lending |
| 18,009,990 |
| 19,451,135 |
| 7,108,574 | None | N/A | January 2029 | |||||||
Raven Senior Loan Fund LLC | Asset-based lending |
| 454,636,092 |
| 475,140,068 |
| 45,363,908 | None | Pursuant to the priority of payments, notes may be redeemed in whole or in part on the applicable quarterly payment date in accordance with the note purchase and security agreement | The earlier of twelve years from closing and the amortization date selected by a majority of the subordinated notes in accordance to the note purchase and security agreement | |||||||
106
Cliffwater Corporate Lending Fund |
Notes to Consolidated Financial Statements March 31, 2023 (Continued) |
13. Private Investment Vehicles (continued)
Security Description | Investment Category | Cost | Fair Value | Unfunded Commitments | Redemption Frequency | Redemption | Fund Term | ||||||||||
Redwood Enhanced Income Corp. | Middle market direct lending | $ | 32,716,582 | $ | 32,355,235 | $ | 19,600,000 | None | 180 calendar days following the pricing of an initial public offering of the shares and/or the first trade of the shares on a securities exchange | Seven-year anniversary of the initial closing with two one-year extensions | |||||||
Silver Point Loan Funding, LLC | Middle market direct lending |
| 552,749,005 |
| 571,918,699 |
| 947,890,069 | None | Optional redemption pursuant to the indenture at the written direction of a majority of the subordinated notes with the consent of the investment manager | November 2034 | |||||||
Silver Point Specialty Credit Fund II, L.P. | Middle market direct lending |
| 41,326,575 |
| 39,409,060 |
| 8,676,338 | None | N/A | September 6, 2023 with one-year extensions available | |||||||
Sixth Street Lending Partners | Middle market direct lending |
| 15,609,630 |
| 15,829,778 |
| 34,390,370 | None | N/A | Ten years from final closing subject to two one-year extensions if approved by majority of the board | |||||||
Stellus Private Credit BDC Feeder LP | Middle market direct lending |
| 13,687,742 |
| 13,787,453 |
| 36,312,258 | None | N/A | Until the partnership is terminated and wound up in accordance to the limited partnership agreement | |||||||
Stone Point Credit Corporation | Middle market direct lending |
| 19,357,939 |
| 19,364,912 |
| 30,642,061 | None | N/A | Until the seven year anniversary of the commencement date, December 21, 2020 | |||||||
107
Cliffwater Corporate Lending Fund |
Notes to Consolidated Financial Statements March 31, 2023 (Continued) |
13. Private Investment Vehicles (continued)
Security Description | Investment Category | Cost | Fair Value | Unfunded Commitments | Redemption Frequency | Redemption | Fund Term | ||||||||||
Summit Partners Credit Offshore Fund II, L.P. | Middle market direct lending | $ | 6,932,335 | $ | 7,956,374 | $ | 2,063,383 | None | N/A | Eight anniversary of the fist draw-down date with two one-year extensions available | |||||||
TCW Direct Lending VIII LLC | Middle market direct lending |
| 22,009,914 |
| 22,182,480 |
| 27,990,086 | None | N/A | Sixth anniversary of the final closing date | |||||||
Thompson Rivers LLC | Investment vehicle |
| 9,128,509 |
| 5,749,959 |
| - | None | Redemptions permitted with the consent of the investment fund’s voting members | Until cancellation of the Certificate of Formation | |||||||
Varagon Capital Corporation | Middle market direct lending |
| 19,296,490 |
| 18,727,043 |
| 5,703,510 | None | N/A | September 2026 with one-year extensions available | |||||||
Varagon Capital Direct Lending Fund, L.P. | Middle market direct lending |
| 22,500,000 |
| 22,096,471 |
| 27,500,000 | None | N/A | Until the fourth anniversary of the end of the reinvestment period with one-year extension available | |||||||
Varagon Structured Notes Issuer I, LLC | Middle market direct lending |
| 415,000,000 |
| 426,257,997 |
| 85,000,000 | None | Redemptions pursuant to the Indenture upon direction of a majority of the subordinated notes with the consent of the investment manager | October 2033 provided that the scheduled reinvestment end date is extended | |||||||
Vista Credit Partners Fund III, L.P. | Middle market direct lending |
| 30,084,511 |
| 31,618,228 |
| 21,714,840 | None | N/A | March 31, 2027 with two one-year extensions available | |||||||
Waccamaw River LLC | Investment vehicle |
| 11,278,065 |
| 9,962,619 |
| 1,240,000 | None | Redemptions permitted with the prior consent of the Board | Until cancellation of the Certificate of Formation | |||||||
Total | $ | 4,897,727,034 | $ | 4,983,049,992 | $ | 2,855,998,237 | |||||||||||
1 Up to 10% at each semi-annual tender offer
2 Up to 5% at each quarterly tender offer
3 Up to 2.5% at each quarterly tender offer
108
Cliffwater Corporate Lending Fund |
Notes to Consolidated Financial Statements March 31, 2023 (Continued) |
14. Subsequent Events
In preparing these consolidated financial statements, management has evaluated subsequent events through the date of issuance of the consolidated financial statements included herein.
The Fund commenced a repurchase offer April 13, 2023 as follows:
Commencement Date | April 13, 2023 | |
Repurchase Request | May 15, 2023 | |
Repurchase Pricing date | May 15, 2023 | |
Net Asset Value as of Repurchase Offer Date | ||
Class I | $10.55 | |
Amount Repurchased | ||
Class I | $426,176,095 | |
Percentage of Outstanding Shares Repurchased | ||
Class I | 3.7% |
On May 25, 2023, the Fund increased the commitment on the Revolving Loan by $125,000,000 to a committed amount of $2,425,000,000. See Note 2 for a discussion of the Fund’s borrowing and use of leverage.
Other than as described above, there have been no other subsequent events that occurred during such period that would require disclosure or would be required to be recognized in the consolidated financial statements.
109
Proxy Voting
The Fund is required to file Form N-PX, with its complete proxy voting record for the twelve-month period ending on June 30, no later than August 31. The Fund’s Form N-PX filing and a description of the Fund’s proxy voting policies and procedures are available: (i) without charge, upon request, by calling the Fund at 1-888-442-4420 or (ii) by visiting the SEC’s website at www.sec.gov.
Availability of Quarterly Portfolio Schedules
The Fund files its complete schedule of portfolio holdings with the SEC for the first and third quarters of each fiscal year as an exhibit to its report on Form N-PORT. The Fund’s Forms N-PORT are or will be available on the SEC’s website at www.sec.gov or by calling the Fund at 1-888-442-4420.
Long-Term Capital Gains Designation
For the year ended March 31, 2023, the Cliffwater Corporate Lending Fund designates $0 as a long-term capital gain distribution.
For the year ended March 31, 2023, 0.0% of the dividends paid from net investment income, including short-term capital gains, are designated as qualified dividend income.
For the year ended March 31, 2023, 0.0% of the dividends paid from net investment income, including short-term capital gains are designated as dividends received deduction available to corporate shareholders.
Approval of Investment Management Agreement
At the regular quarterly meeting of the Board of Trustees of the Fund (the “Board”) held on December 14, 2022 by a unanimous vote, the Board, including a majority of Trustees who are not “interested persons” within the meaning of Section 2(a)(19) of the Investment Company Act (the “Independent Trustees”), approved the Investment Management Agreement between Cliffwater LLC (the “Investment Manager”) and the Fund (the “Investment Management Agreement”).
Pursuant to relief granted by the SEC in light of the COVID-19 pandemic (the “Order”) and a determination by the Board that reliance on the Order was appropriate due to circumstances related to the current or potential effects of COVID-19, the December 14, 2022 regular quarterly meeting was held by videoconference. At the Board meeting and throughout the consideration process, the Board, including a majority of the Independent Trustees, was advised by counsel.
In advance of the Board meeting, the Independent Trustees requested and received materials from the Investment Manager to assist them in considering the approval of the Investment Management Agreement. The Independent Trustees reviewed reports from third parties and management about the below factors. The Board did not identify any particular information as controlling in determining whether or not to approve the Investment Management Agreement, and each Board member may have attributed different weights to the various items considered. Nor are the items described herein all-encompassing of the matters considered by the Board.
The Board engaged in a detailed discussion of the materials with management of the Investment Manager. The Independent Trustees then met separately with independent counsel to the Independent Trustees for a full review of the materials. Following this session, the full Board reconvened and after further discussion determined that the information presented provided a sufficient basis upon which to approve the Investment Management Agreement.
Nature, Extent and Quality of Services
The Board reviewed and considered the nature and extent of the investment advisory services provided by the Investment Manager to the Fund under the Investment Management Agreement, including the selection of Fund investments and oversight of the Fund’s sub-advisers, as relevant. The Board also reviewed and considered the nature and extent of the non-advisory, administrative services provided by the Investment Manager, including, among other things, providing office facilities, equipment, and personnel. The Board also reviewed and considered the qualifications of the key personnel of the Investment Manager who provide the investment advisory and/or administrative services to the Fund. The Board determined that the Investment Manager’s key personnel are well-qualified by education and/or training and experience to perform the services in an efficient and professional manner. The Board also took into account the Investment Manager’s compliance policies and procedures, including the procedures used to determine the value of the Fund’s investments. The Board concluded that the overall quality of the advisory and administrative services provided was satisfactory.
110
Cliffwater Corporate Lending Fund |
Other Information March 31, 2023 (Unaudited) (Continued) |
Performance
The Board considered the investment performance of the Investment Manager with respect to the Fund. The Board considered the performance of the Fund, noting that the Fund had out-performed its benchmark for the period from the Fund’s inception on June 5, 2019 through November 30, 2022.
Fees and Expenses Relative to Comparable Funds Managed by Other Investment Managers
The Board reviewed the advisory fee rates and total expense ratio of the Fund. The Board compared the advisory fee and total expense ratio for the Fund with various comparative data, including a report of other comparable funds.
The Board noted that the Fund’s advisory fee was calculated on net assets and at 1.00% was below the median advisory fee of the peer universe identified in the provided Broadridge report. They further noted that the Investment Manager had implemented an expense cap so that total expenses of the Fund, subject to certain exclusions, do not exceed certain limits. The Board concluded that the advisory fees paid by the Fund and total expense ratio were reasonable and satisfactory in light of the services provided.
Economies of Scale
The Board reviewed the structure of the Fund’s investment management fee under the Investment Management Agreement. The Board considered that the Investment Manager continued to monitor whether the Fund’s current fee level continues to reflect economies of scale and concluded that the fees were reasonable and satisfactory in light of the services provided.
Profitability of Investment Manager and Affiliates
The Board considered and reviewed information concerning the costs incurred and profits realized by the Investment Manager from its relationship with the Fund. The Board also reviewed the Investment Manager’s financial condition. The Board noted that the financial condition of the Investment Manager appeared stable. The Board determined that the advisory fees and the compensation to the Investment Manager were reasonable and its financial condition was adequate.
Ancillary Benefits and Other Factors
The Board also discussed other benefits to be received by the Investment Manager from its management of the Fund, including, without limitation, the ability to market its advisory services for similar products. The Board noted that the Investment Manager did not have affiliations with the Fund’s transfer agent, administrator, custodian or distribution agent and therefore does not derive any benefits from the relationships these parties may have with the Fund. The Board concluded that the advisory fees were reasonable in light of the fall-out benefits.
General Conclusion
Based on its consideration of all factors that it deemed material, and assisted by the advice of its counsel, the Board concluded it would be in the best interest of the Fund and its shareholders to approve the continuance of the Investment Management Agreement.
111
The identity of the members of the Board and the Fund’s officers and brief biographical information is set forth below. The Fund’s Statement of Additional Information the (“SAI”) includes additional information about the membership of the Board. The SAI is available, without charge, by writing to the Fund at c/o UMB Fund Services, Inc., 235 West Galena Street, Milwaukee, WI 53212, or by calling the Fund at 1 (888) 442-4420.
INDEPENDENT TRUSTEES | |||||
Name, | Positions(s) | Length | Principal | Number of | Other |
Paul S. Atkins c/o UMB Fund Services, Inc. 235 W. Galena St. Milwaukee, WI 53212 | Trustee | Since June 2021 | Chief Executive Officer and Founder, Patomak Global Partners, LLC (financial services consulting firm) (2009-Present); Independent Chairman of the Board and Director, BATS Global Markets, Inc. (2012-2015); Member, Congressional Oversight Panel for TARP (2009-2010); Commissioner, U.S. Securities and Exchange Commission (2002-2008); Principal, PricewaterhouseCoopers LLP (1994-2002). | 2 | None |
Dominic Garcia c/o UMB Fund Services, Inc. 235 W. Galena St. Milwaukee, WI 53212 | Trustee | Since June 2021 | Chief Pension Investment Strategist, CBRE Global Investors (June 2021-Present); Advisory Board of Milken Institute for Public Finance (2021-Present); Chief Investment Officer, New Mexico Public Employees Retirement Association (2017-June 2021); Senior Alpha Manager, State of Wisconsin Investment Board (2008-2017); Research Advisory Board Member, University of North Carolina Keenan Institute of Private Markets and the University of Chicago Harris Center for Municipal Finance (2020 to Present); Trustee, United World College-USA the Santa Fe Preparatory School endowment and the Santa Fe Community Foundation impact investment committee (2020-Present). | 2 | None |
Paul J. Williams c/o UMB Fund Services, Inc. 235 W. Galena St. Milwaukee, WI 53212 | Trustee and Board Chairman | Since June 2021 | Investment Consultant, Texas Association of Counties (1995-2020); Chief Investment Officer, Texas County & District Retirement System (1999-2018). | 2 | None |
* The fund complex consists of the Fund and Cliffwater Enhanced Lending Fund.
112
Cliffwater Corporate Lending Fund |
Fund Management March 31, 2023 (unaudited) (Continued) |
INTERESTED TRUSTEES AND OFFICERS | |||||
Name, | Positions(s) | Length | Principal | Number of | Other |
Stephen L. Nesbitt** c/o UMB Fund Services, Inc. 235 W. Galena St. Milwaukee, WI 53212 | Trustee and President | President Since Inception; Trustee since June 2021 | Chief Executive Officer and Chief Investment Officer, Cliffwater LLC (2004-Present). | 2 | None |
Lance J. Johnson c/o UMB Fund Services, Inc. 235 W. Galena St. Milwaukee, WI 53212 | Treasurer | Since Inception | Chief Operations Officer, Cliffwater LLC (2014-Present); Senior Vice President, Brown Brothers Harriman & Co. (financial services firm) (2013-2014). | N/A | None |
Ann Maurer c/o UMB Fund Services, Inc. 235 W. Galena St. Milwaukee, WI 53212 | Secretary | Since Inception | Senior Vice President, Director of Product and Pricing (2023-Present); Senior Vice President, Product and Pricing Manager (2021-2023); Senior Vice President, Senior Client Service Manager (2017-2021), UMB Fund Services, Inc. | N/A | None |
Bernadette Murphy c/o UMB Fund Services, Inc. 235 W. Galena St. Milwaukee, WI 53212 | Chief Compliance Officer | Since April 2021 | Director, Vigilant Compliance, LLC (investment management solutions firm) (2018-Present); Director of Compliance and operations, B. Riley Capital Management, LLC (investment advisory firm) (2017-2018); Chief Compliance Officer, Dialectic Capital Management, LP (investment advisory firm) (2008-2018). | N/A | None |
* The fund complex consists of the Fund and Cliffwater Enhanced Lending Fund.
** Mr. Nesbitt is deemed an interested person of the Fund because he is an officer of the Investment Manager.
113
PRIVACY NOTICE
FACTS | WHAT DOES THE FUND DO WITH YOUR PERSONAL INFORMATION? |
Why? | Financial companies choose how they share your personal information. Federal law gives consumers the right to limit some but not all sharing. Federal law also requires us to tell you how we collect, share, and protect your personal information. Please read this notice carefully to understand what we do. |
What? | The types of personal information we collect and share depend on the product or service you have with us. This information can include: • Social Security number • Account balances • Account transactions • Transaction history • Wire transfer instructions • Checking account information When you are no longer our customer, we continue to share your information as described in this notice. |
How? | All financial companies need to share customers’ personal information to run their everyday business. In the section below, we list the reasons financial companies can share their customers’ personal information; the reasons funds choose to share; and whether you can limit this sharing. |
Reasons we can share your personal information | Does the | Can you limit |
For our everyday business purposes – such as to process your transactions, maintain your account(s), respond to court orders and legal investigations, or report to credit bureaus | Yes | No |
For our marketing purposes – to offer our products and services to you | No | We don’t share |
For joint marketing with other financial companies | No | We don’t share |
For our affiliates’ everyday business purposes – information about your transactions and experiences | Yes | No |
For our affiliates’ everyday business purposes – information about your creditworthiness | No | We don’t share |
For our affiliates to market to you | No | We don’t share |
For nonaffiliates to market to you | No | We don’t share |
Questions? | Call 1-(888)-442-4420 |
114
Cliffwater Corporate Lending Fund |
Privacy Notice March 31, 2023 (unaudited) (Continued) |
What we do | |
How does the Fund protect my personal information? | To protect your personal information from unauthorized access and use, we use security measures that comply with federal law. These measures include computer safeguards and secured files and buildings. |
How does the Fund collect my personal information? | We collect your personal information, for example, when you • Open an account • Provide account information • Give us your contact information • Make a wire transfer • Tell us where to send the money We also collect your information from others, such as credit bureaus, affiliates, or other companies. |
Why can’t I limit all sharing? | Federal law gives you the right to limit only • Sharing for affiliates’ everyday business purposes – information about your creditworthiness • Affiliates from using your information to market to you • Sharing for nonaffiliates to market to you State laws and individual companies may give you additional rights to limit sharing. |
Definitions | |
Affiliates | Companies related by common ownership or control. They can be financial and nonfinancial companies. |
Nonaffiliates | Companies not related by common ownership or control. They can be financial and nonfinancial companies. • The Fund doesn’t share with nonaffiliates so they can market to you. |
Joint marketing | A formal agreement between nonaffiliated financial companies that together market financial products or services to you. • The Fund doesn’t jointly market. |
115
This page intentionally left blank.
Investment Manager
Cliffwater LLC
4640 Admiralty Way, 11th Floor
Marina del Rey, CA 90292
Website: www.cliffwaterfunds.com
Custodian Bank
State Street Bank and Trust Company
1 Iron Street
Boston, MA 02210
Fund Administrator, Transfer Agent and Fund Accountant
UMB Fund Services
235 W. Galena Street
Milwaukee, WI 53212-3949
Phone: (414) 299-2200
Distributor
Foreside Fund Services, LLC
Three Canal Plaza, Suite 100
Portland, Maine 04101
http://www.foreside.com
Independent Registered Public Accounting Firm
Cohen & Company, Ltd.
342 North Water Street, Suite 830
Milwaukee, Wisconsin 53202
Item 2. Code of Ethics.
(a) The registrant, as of the end of the period covered by this report, has adopted a code of ethics that applies to the registrant’s principal executive officer, principal financial officer, principal accounting officer or controller, or persons performing similar functions, regardless of whether these individuals are employed by the registrant or a third party.
(c) There have been no amendments, during the period covered by this report, to a provision of the code of ethics that applies to the registrant’s principal executive officer, principal financial officer, principal accounting officer or controller, or persons performing similar functions, regardless of whether these individuals are employed by the registrant or a third party, and that relates to any element of the code of ethics description.
(d) The registrant has not granted any waivers, during the period covered by this report, including an implicit waiver, from a provision of the code of ethics that applies to the registrant’s principal executive officer, principal financial officer, principal accounting officer or controller, or persons performing similar functions, regardless of whether these individuals are employed by the registrant or a third party, that relates to one or more of the items set forth in paragraph (b) of this item’s instructions.
Item 3. Audit Committee Financial Expert.
As of the end of the period covered by the report, the registrant’s board of trustees has determined that Mr. Paul S. Atkins, Mr. Dominic Garcia, and Mr. Paul J. Williams are qualified to serve as the audit committee financial experts serving on its audit committee and that they are “independent,” as defined by Item 3 of Form N-CSR.
Item 4. Principal Accountant Fees and Services.
The registrant has engaged its principal accountant to perform audit services, audit-related services, tax services and other services during the year ended March 31, 2023. “Audit services” refer to performing an audit of the registrant’s annual financial statements or services that are normally provided by the accountant in connection with statutory and regulatory filings or engagements for those fiscal years. “Audit-related services” refer to the assurance and related services by the principal accountant that are reasonably related to the performance of the audit. “Tax services” refer to professional services rendered by the principal accountant for tax compliance, tax advice, and tax planning. “Other services” refer to professional services rendered by principal accountant for its review of the Fund’s registration statement filed with the SEC and the issuance of consents for such filing. The following table presents fees paid by the Fund for professional services rendered by Cohen & Company, Ltd. for the year ended March 31, 2023, the fiscal period January 1, 2022 through March 31, 2022 and the fiscal year ended December 31, 2021. The Fund changed its fiscal year-end from December 31 to March 31 following the December 31, 2021 fiscal year-end.
Fee Category | 2023 | 2022 | 2021 | ||||||
Audit Fee | $ | 400,000 | $ | 270,000 | $ | 300,000 | |||
Audit-Related Fees |
| — |
| — |
| — | |||
Tax Fees |
| 12,000 |
| 12,000 |
| 12,000 | |||
All Other Fees |
| — |
| — |
| 6,774 | |||
Total Fees | $ | 412,000 | $ | 282,000 | $ | 318,774 | |||
The audit committee has adopted pre-approval policies and procedures that require the audit committee to pre-approve all audit and non-audit services of the registrant, including services provided to any entity affiliated with the registrant.
The percentage of fees billed by Cohen & Company, Ltd. for the year ended March 31, 2023, for the fiscal period January 1, 2022 through March 31, 2022 and for the fiscal year ended December 31, 2021, applicable to non-audit services pursuant to waiver of pre-approval requirement were as follows:
FYE | Fiscal | FYE | |||||||
Audit-Related Fees | 0 | % | 0 | % | 0 | % | |||
Tax Fees | 0 | % | 0 | % | 0 | % | |||
All Other Fees | 0 | % | 0 | % | 0 | % | |||
All of the principal accountant’s hours spent on auditing the registrant’s financial statements were attributed to work performed by full-time permanent employees of the principal accountant.
The following table indicates the non-audit fees billed or expected to be billed by the registrant’s accountant for services to the registrant and to the registrant’s investment adviser (and any other controlling entity, etc.— not sub-adviser) for the last two years. The audit committee of the board of trustees/directors has considered whether the provision of non-audit services that were rendered to the registrant’s investment adviser is compatible with maintaining the principal accountant’s independence and has concluded that the provision of such non-audit services by the accountant has not compromised the accountant’s independence.
Non-Audit Related Fees | FYE | Fiscal | FYE | |||
Registrant | 0 | 0 | 0 | |||
Registrant’s Investment Adviser | 0 | 0 | 0 |
Item 5. Audit Committee of Listed Registrants.
Not applicable.
Item 6. Investments.
See the Annual Report to Shareholders under Item 1 of this Form.
Item 7. Disclosure of Proxy Voting Policies and Procedures for Closed-End Management Investment Companies.
Cliffwater LLC
PROXY POLICY AND PROCEDURE
Rule 206(4)-6 of the Advisers Act requires a registered investment adviser that exercises voting authority with respect to client securities to: (i) adopt written policies reasonably designed to ensure that the investment adviser votes in the best interest of its clients and addresses how the investment adviser will deal with material conflicts of interest that may arise between the investment adviser and its clients; (ii) disclose to its clients information about such policies and procedures; and (iii) upon request, provide information on how proxies were voted.
For its non-discretionary clients, Cliffwater does not have authority to vote client securities. These clients will receive their proxies, corporate actions, consents and other solicitations directly from their custodian or the relevant issuer or investment fund. These clients may contact their client service professionals with questions about a particular solicitation.
For its discretionary clients, Cliffwater generally takes responsibility for ensuring that proxies solicited by, or with respect to, the issuers of securities held in the client’s investment account, and corporate actions and consents sought by such issuers (including tender offers and rights offerings) are voted. In most cases, the managers of the commingled funds and separate accounts holding the assets vote the proxy solicitations. However, Cliffwater will take such action in limited circumstances which may include private partnership amendments and consents and in the event that an individual security is held by the client outside of a commingled fund or separate account where the manager votes the securities. Cliffwater’s discretionary clients may also retain the right to vote any proxies or take action relating to specified securities held in the client’s investment account, provided the client gives timely written notice to Cliffwater.
Cliffwater will not put its own interests ahead of those of any of its client and will resolve any possible conflicts between its interests and those of the client in favor of the client. When voting proxies, Cliffwater follows procedures designed to identify and address material conflicts of interest that may arise between its interests and those of its clients. Accordingly, prior to voting any proxy, Cliffwater will determine whether a material conflict of interest exists. A conflict of interest will be considered material to the extent that it is determined that the conflict has the potential to influence Cliffwater’s decision making in voting the proxy. If Cliffwater determines that there is a material conflict of interest related to the proxy solicitation, Cliffwater will take appropriate action to resolve the conflict which may include abstaining from a particular vote.
Cliffwater will seek to act solely in the best interests of its clients when exercising its voting authority. Cliffwater determines whether and how to vote proxies on a case-by-case basis. In making such determination, Cliffwater: (i) will attempt to consider all aspects of the vote that could affect the value of the issuer or that of the relevant client, (ii) will vote in a manner that it believes is consistent with the relevant client’s stated objectives, (iii) generally will vote in accordance with the recommendation of the issuing company’s management on routine and administrative matters, unless Cliffwater has a particular reason to vote to the contrary, and (iv) may not vote at all to the extent the outcome of the vote or action does not have a material impact on the issuer or value of its securities.
Under Rule 204-2 under the Advisers Act, Cliffwater must retain: (i) its voting policies and procedures; (ii) corporate action and proxy statements received; (iii) records of votes cast; (iv) records of client requests for voting information; and (v) any documents prepared by Cliffwater that were material to making a decision on how to vote. Under the circumstances where Cliffwater votes a proxy, corporate action or consent solicited by an issuer of securities or an investment fund, Cliffwater will document and maintain its voting record.
Cliffwater’s General Counsel and Chief Compliance Officer must approve the engagement of any proxy advisory firm to assist in connection with voting client securities.
For private investment funds, Cliffwater may accept a seat on an advisory board or similar group for a fund in which one or more Cliffwater clients have invested. Cliffwater believes advisory board service benefits its clients by allowing Cliffwater greater insight into the fund and its strategies and that, in general, the interests of its clients as investors will be aligned with the interests of all investors in the fund. However, if the interests of Cliffwater’s clients were to diverge from the interests of each other, the Cliffwater representative will take appropriate action to resolve the conflict which may include abstaining from a particular vote. Please see section III.B.7. for further information regarding Cliffwater’s actions with respect to advisory boards.
Item 8. Portfolio Managers of Closed-End Management Investment Companies.
(a)(1)Identification of Portfolio Manager(s) or Management Team Members and Description of Role of Portfolio Manager(s) or Management Team Members.
The following table provides biographical information about the members of Cliffwater LLC (the “Investment Manager”), who are primarily responsible for the day-to-day portfolio management of the Cliffwater Corporate Lending Fund as of June 9, 2023:
Name of Portfolio | Title | Length of | Business | Role of | ||||
Stephen L. Nesbitt | Chief Executive Officer and Chief Investment Officer | Since Inception | Chief Executive Officer, Chief Investment Officer, Cliffwater LLC (2004-Present) | Portfolio Management | ||||
Caitlin Nemeth | Managing Director | Since 2022 | Managing Director, Cliffwater LLC (since 2021); Senior Vice President, Antares Capital LP (2015-2021) | Portfolio Management | ||||
Frances Beyers | Managing Director | Since 2022 | Managing Director, Cliffwater LLC (since 2020); Head of Middle Market Loan Analysis, Refinitiv (2009-2020) | Portfolio Management |
(a)(2)Other Accounts Managed by Portfolio Manager(s) or Management Team Member and Potential Conflicts of Interest
The following table provides information about portfolios and accounts, other than the Cliffwater Corporate Lending Fund, for which the Fund’s portfolio managers are primarily responsible for the day-to-day portfolio management as of March 31, 2023:
Name of Portfolio Management | Number of Accounts and Total Value | Number of Other Accounts Managed and Total | ||||||||||
Name | Registered investment companies | Other pooled investment vehicles | Other accounts | Registered investment companies | Other pooled investment vehicles | Other accounts | ||||||
Stephen L. Nesbitt | 0 Accounts N/A | 0 Accounts N/A | 0 Accounts N/A | 1 Account $1,478 | 0 Accounts N/A | 15 Accounts $1,495 | ||||||
Caitlin Nemeth | 0 Accounts N/A | 0 Accounts N/A | 0 Accounts N/A | 0 Accounts N/A | 0 Accounts N/A | 0 Accounts N/A | ||||||
Frances Beyers | 0 Accounts N/A | 0 Accounts N/A | 0 Accounts N/A | 0 Accounts N/A | 0 Accounts N/A | 0 Accounts N/A | ||||||
Conflicts of Interest
The Investment Manager and Portfolio Managers may manage multiple funds and/or other accounts, and as a result may be presented with one or more of the following actual or potential conflicts:
The management of multiple funds and/or other accounts may result in the Investment Manager or Portfolio Manager devoting unequal time and attention to the management of each fund and/or other account. The Investment Manager seeks to manage such competing interests for the time and attention of a Portfolio Manager by having the Portfolio Manager focus on a particular investment discipline. Other accounts managed by a Portfolio Manager may not be managed using the same investment models that are used in connection with the management of the Fund. If the Investment Manager, or Portfolio Manager identifies a limited investment opportunity which may be
suitable for more than one fund or other account, a fund may not be able to take full advantage of that opportunity due to an allocation of filled purchase or sale orders across all eligible funds and other accounts. To deal with these situations, the Investment Manager has adopted procedures for allocating portfolio transactions across multiple accounts. The Investment Manager has adopted certain compliance procedures which are designed to address these types of conflicts. However, there is no guarantee that such procedures will detect each and every situation in which a conflict arises.
(a)(3)Compensation Structure of Portfolio Manager
Cliffwater LLC -The Portfolio Managers have ownership and financial interests in, and may receive compensation and/or variable profit distributions from, the Investment Manager based on the Investment Manager’s financial performance, such as its overall revenues and profitability. The Portfolio Managers’ compensation is not tied to the Fund’s performance, except to the extent that the fee paid to the Investment Manager impacts the Investment Manager’s financial performance.
(a)(4)Disclosure of Securities Ownership
Portfolio Management Team’s Ownership of Shares
Name of Portfolio | Dollar Range of Shares | |||||
Stephen L. Nesbitt | Over $1,000,000 | |||||
Caitlin Nemeth | None | |||||
Frances Beyers | None |
____________
1 As of March 31, 2023
(b) Not Applicable
Item 9. Purchases of Equity Securities by Closed-End Management Investment Company and Affiliated Purchasers.
Not applicable.
Item 10. Submission of Matters to a Vote of Security Holders.
There have been no material changes to the procedures by which shareholders may recommend nominees to the Fund’s Board of Trustees since the Fund last provided disclosure in response to this item.
Item 11. Controls and Procedures.
(a) The registrant’s President (Principal Executive Officer) and Treasurer (Principal Financial Officer) have concluded that the registrant’s disclosure controls and procedures (as defined in Rule 30a-3(c) under the Investment Company Act of 1940, as amended (the “1940 Act”)) are effective as of a date within 90 days of the filing date of this report, that includes the disclosure required by this paragraph, based on the evaluation of these controls and procedures required by Rule 30a-3(b) under the 1940 Act and Rule 15d-15(b) under the Exchange Act.
(b) There were no changes in the registrant’s internal control over financial reporting (as defined in Rule 30a-3(d) under the Act) that occurred during the most recent fiscal period covered by this report that has materially affected, or is reasonably likely to materially affect, the registrant’s internal control over financial reporting.
Item 12. Disclosure of Securities Lending Activities for Closed-End Management Investment Companies.
None.
Item 13. Exhibits.
(a)(2)Certifications pursuant to Section 302 of the Sarbanes-Oxley Act of 2002. Filed herewith.
(a)(3)Any written solicitation to purchase securities under Rule 23c-1 under the Act sent or given during the period covered by the report by or on behalf of the registrant to 10 or more persons. Not applicable.
(a)(4)Change in the registrant’s independent public accountant. Not applicable.
(b) Certification pursuant to Section 906 of the Sarbanes-Oxley Act of 2002. Filed herewith.
Pursuant to the requirements of the Securities Exchange Act of 1934 and the Investment Company Act of 1940, the registrant has duly caused this report to be signed on its behalf by the undersigned, thereunto duly authorized.
(registrant) | Cliffwater Corporate Lending Fund | |||
By (Signature and Title)* | /s/ Stephen Nesbitt | |||
Stephen Nesbitt, President | ||||
(Principal Executive Officer) | ||||
Date | June 9, 2023 |
Pursuant to the requirements of the Securities Exchange Act of 1934 and the Investment Company Act of 1940, this report has been signed below by the following persons on behalf of the registrant and in the capacities and on the date indicated.
By (Signature and Title)* | /s/ Stephen Nesbitt | |||
Stephen Nesbitt, President | ||||
(Principal Executive Officer) | ||||
Date | June 9, 2023 | |||
By (Signature and Title)* | /s/ Lance J. Johnson | |||
Lance J. Johnson, Treasurer | ||||
(Principal Financial Officer) | ||||
Date | June 9, 2023 |