UNITED STATES
SECURITIES AND EXCHANGE COMMISSION
Washington, D.C. 20549
FORM N-CSR
CERTIFIED SHAREHOLDER REPORT OF REGISTERED MANAGEMENT
INVESTMENT COMPANIES
Investment Company Act File Number 811- 23334
Symmetry Panoramic Trust
(Exact name of registrant as specified in charter)
151 National Drive
Glastonbury, CT 06033
(Address of principal executive offices) (Zip code)
John A. Mooney
Symmetry Partners, LLC
151 National Drive
Glastonbury, CT 06033
(Name and address of agent for service)
Copy to:
Mark C. Amorosi, Esq.
K&L Gates LLP
1601 K Street NW
Washington, D.C. 20006
Registrant’s telephone number, including area code: (844) 796-3863
Date of fiscal year end: August 31, 2019
Date of reporting period: February 28, 2019
Item 1. Reports to Stockholders.
A copy of the report transmitted to stockholders pursuant to Rule 30e-1 under the Investment Company Act or 1940, as amended (the “1940 Act”) (17 CFR § 270.30e-1), is attached hereto.

Symmetry Panoramic Trust
SEMI-ANNUAL REPORT
FEBRUARY 28, 2019
Symmetry Panoramic US Equity Fund (SPUSX)
Symmetry Panoramic International Equity Fund (SPILX)
Symmetry Panoramic Global Equity Fund (SPGEX)
Symmetry Panoramic Tax-Managed Global Equity Fund (SPGTX)
Symmetry Panoramic US Fixed Income Fund (SPUBX)
Symmetry Panoramic Municipal Fixed Income Fund (SPMFX)
Symmetry Panoramic Global Fixed Income Fund (SPGBX)
Symmetry Panoramic Alternatives Fund (SPATX)
Beginning on January 1, 2021, as permitted by regulations adopted by the Securities and Exchange Commission, paper copies of the Funds’ shareholder reports no longer will be sent by mail, unless you specifically request paper copies of the reports from the Funds or from your financial intermediary, such as a broker-dealer or bank. Instead, the reports will be made available on a website, and you will be notified by mail each time a report is posted and provided with a website link to access the report.
If you already elected to receive shareholder reports electronically, you will not be affected by this change and you need not take any action. You may elect to receive shareholder reports and other communications from the Funds electronically by contacting your financial intermediary, or, if you are a direct investor, by calling 1-844-796-3863.
You may elect to receive all future reports in paper free of charge. If you invest through a financial intermediary, you can follow the instructions included with this disclosure, if applicable, or you can contact your financial intermediary to inform it that you wish to continue receiving paper copies of your shareholder reports. If you invest directly with the Funds, you can inform the Funds that you wish to continue receiving paper copies of your shareholder reports by calling 1-844-796-3863.Your election to receive reports in paper will apply to all funds held with your financial intermediary if you invest through a financial intermediary or all Symmetry Panoramic Funds if you invest directly with the Funds.
SYMMETRY PANORAMIC TRUST
FEBRUARY 28, 2019
TABLE OF CONTENTS
Shareholders’ Letter | 1 |
Schedules of Investments | 3 |
Statements of Assets and Liabilities | 74 |
Statements of Operations | 76 |
Statements of Changes in Net Assets | 79 |
Financial Highlights | 83 |
Notes to Financial Statements | 91 |
Disclosure of Fund Expenses | 128 |
Approval of Investment Advisory Agreement | 130 |
The Funds file their complete schedules of investments with the Securities and Exchange Commission (“SEC”) for the first and third quarters of each fiscal year on Form N-Q within sixty days after period end. The Funds’ Forms N-Q are available on the SEC’s website at http://www.sec.gov, and may be reviewed and copied at the SEC’s Public Reference Room in Washington, DC. Information on the operation of the Public Reference Room may be obtained by calling 1-800-SEC-0330.
A description of the policies and procedures that the Funds use to determine how to vote proxies relating to fund securities, as well as information relating to how the Funds voted proxies relating to fund securities during the most recent 12-month period ended June 30, is available (i) without charge, upon request, by calling 1-844-796-3863; and (ii) on the SEC’s website at http://www.sec.gov.
SYMMETRY PANORAMIC TRUST
FEBRUARY 28, 2019
(Unaudited)
Dear Shareholders,
As is evidenced by this shareholder report, Symmetry Partners is pleased to announce that it successfully launched its family of eight open-end mutual funds, the Symmetry Panoramic Mutual Funds, in November 2018. These funds now boast assets under management nearing $2 billion, sourced from transitioning allocation models and new subscriptions.
We want to thank all of you who have embarked on this journey with us. Symmetry Partners has been managing client assets for nearly 25 years, most of those as a model manager, creating portfolios for thousands of investors grounded in our evidence-based investment philosophy. After a great deal of research and consideration of the market, we determined about two years ago that to continue to deliver on the strategy we promised to our clients, we would need to evolve how we implement that strategy.
The Symmetry investment philosophy rests on a foundational belief that academic research is the best source of insights into how to approach capital markets. We believe that factor investing, the process of looking for characteristics that drive higher potential returns, is one of the most important findings in that academic literature. Symmetry was an early adopter of this method of investing, and over the years, we have watched as much of the market has come around to factor investing. Research in this area has exploded, and the number of products with a factor focus has increased dramatically.
Delivering our solutions via our own set of mutual funds will enable us to be flexible and responsive in this environment. It will also allow us to access the full suite of products available, something we could never do before using just a model mechanism. The funds also allow Symmetry to aggregate its buying power, thereby better harnessing its own scale when working with other providers. It is important to note that nothing core to our philosophy has changed. Symmetry will remain the strategic, disciplined investment manager it always has been, basing its investment decisions on what we believe financial science tells us about what is in the best interests of our clients.
Market Discussion
Our first quarter of operations in the funds saw its share of ups and downs in capital markets. Geopolitical issues drove bouts of volatility during the fourth quarter of 2018. While many of these issues remain unresolved, Q1 2019 has seen global markets enjoy a strong recovery from the turmoil.
1
SYMMETRY PANORAMIC TRUST
FEBRUARY 28, 2019
(Unaudited)
Domestic, International Developed and Emerging Markets equities have all had healthy rebounds for the year to date, posting positive returns.1 Fixed income indices have also posted positive results for 2019 thus far.2
Global factor performance continues to be a mixed bag, demonstrating the importance of factor diversification. Year to date, in both the U.S. and international markets, Quality and Small Cap exposure have provided positive performance, while Value, Momentum, and Minimum Volatility have struggled to keep pace.3
While a pullback in tightening by the Federal Reserve and other central banks has buoyed markets, uncertainty around Brexit looms large as a potential source of short-term volatility in equity and fixed income markets.
Amidst the ever-changing geopolitical landscape and potential return of volatility to global markets, Symmetry Partners believes investors are best served by staying focused on the long-term investment goals that prompted them to invest in the first place—otherwise they risk making decisions based solely on recent or short-term market movements. While the discipline this requires can be difficult during periods of market volatility, we see from the data that there are strong benefits to taking a path of broadly diversified exposures over time, and “staying the course” to fully realize those benefits.
Symmetry Partners, LLC is an investment advisory firm registered with the Securities and Exchange Commission. The firm only transacts business in states where it is properly registered, or excluded or exempted from registration requirements. No one should assume that future performance of any specific investment, investment strategy, product, or non-investment related content made reference to directly or indirectly in this material will be profitable. As with any investment strategy, there is the possibility of profitability as well as loss.
Carefully consider the funds’ investment objectives, risk, and charges and expenses. This and other information can be found in the funds’ prospectus which may be obtained by visiting www.panoramicfunds.com or by calling 1-844-SYM-FUND (844-796-3863). Please read the prospectus carefully before investing.
The funds are distributed by SEI Investment Distribution Company (SIDCO). SIDCO is not affiliated with Symmetry Partners, LLC.
Diversification seeks to improve performance by spreading your investment dollars into various asset classes to add balance to your portfolio. Using this methodology, however, does not guarantee a profit or protection from loss in a declining market. Past performance does not guarantee future results.
© Morningstar 2018. All rights reserved. The information contained herein: (1) is proprietary to Morningstar and/or its content providers; (2) may not be copied, adapted or distributed; and (3) is not warranted to be accurate, complete or timely. Neither Morningstar nor its content providers are responsible for any damages or losses arising from any use of this information, except where such damages or losses cannot be limited or excluded by law in your jurisdiction. Past financial performance is no guarantee of future results.
1 | Morningstar Direct, as of Feb. 28, 2019. |
2 | Morningstar Direct, as of Feb. 28, 2019. |
3 | Morningstar Direct, as of Feb. 28, 2019. |
2
SYMMETRY PANORAMIC US EQUITY FUND
FEBRUARY 28, 2019
(Unaudited)
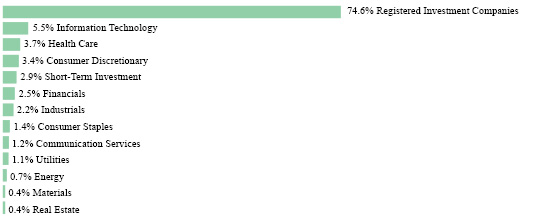
†Percentages are based on total investments.
SCHEDULE OF INVESTMENTS |
REGISTERED INVESTMENT COMPANIES — 74.6% |
| | | Shares | | | Value | |
DFA Real Estate Securities Portfolio, Cl I | | | 912,631 | | | $ | 33,438,815 | |
DFA US Core Equity 2 Portfolio, Cl I | | | 6,895,848 | | | | 148,398,654 | |
DFA US Vector Equity Portfolio, Cl I | | | 8,478,094 | | | | 155,573,016 | |
iShares Edge MSCI Min Vol USA ETF | | | 899,020 | | | | 51,675,669 | |
Total Registered Investment Companies | | | | | | | | |
(Cost $376,911,088) | | | | | | | 389,086,154 | |
| | | | | | | | | |
COMMON STOCK — 22.5% | | | | | | | | |
| | | | | | | | | |
COMMUNICATION SERVICES — 1.2% | | | | | | | | |
AMC Networks, Cl A * | | | 3,449 | | | | 226,634 | |
Cable One | | | 271 | | | | 257,176 | |
CenturyLink | | | 16,224 | | | | 213,995 | |
Cinemark Holdings | | | 2,117 | | | | 79,663 | |
Discovery * | | | 7,483 | | | | 216,259 | |
IAC * | | | 1,686 | | | | 359,202 | |
Interpublic Group | | | 7,517 | | | | 173,116 | |
Match Group | | | 5,655 | | | | 313,174 | |
Omnicom Group | | | 2,491 | | | | 188,569 | |
Telephone & Data Systems | | | 5,678 | | | | 181,980 | |
TripAdvisor * | | | 4,018 | | | | 213,637 | |
Twitter * | | | 4,637 | | | | 142,727 | |
United States Cellular * | | | 2,885 | | | | 134,700 | |
The accompanying notes are an integral part of the financial statements.
3
SYMMETRY PANORAMIC US EQUITY FUND
FEBRUARY 28, 2019
(Unaudited)
COMMON STOCK — continued | | | | | | | | |
| | | Shares | | | Value | |
COMMUNICATION SERVICES — continued | | | | | | | | |
Verizon Communications | | | 31,737 | | | $ | 1,806,470 | |
Viacom, Cl B | | | 9,371 | | | | 273,821 | |
Walt Disney | | | 10,959 | | | | 1,236,613 | |
| | | | | | | | 6,017,736 | |
CONSUMER DISCRETIONARY — 3.4% | | | | | | | | |
Advance Auto Parts | | | 2,151 | | | | 347,989 | |
Amazon.com * | | | 1,133 | | | | 1,857,927 | |
AutoZone * | | | 466 | | | | 437,560 | |
Best Buy | | | 5,002 | | | | 344,338 | |
Bright Horizons Family Solutions * | | | 1,002 | | | | 124,248 | |
Burlington Stores * | | | 2,536 | | | | 430,461 | |
Capri Holdings * | | | 1,657 | | | | 75,559 | |
Chipotle Mexican Grill, Cl A * | | | 684 | | | | 415,550 | |
Columbia Sportswear | | | 2,202 | | | | 226,696 | |
Darden Restaurants | | | 3,614 | | | | 405,166 | |
Dick's Sporting Goods | | | 6,495 | | | | 253,695 | |
Dollar General | | | 3,853 | | | | 456,426 | |
Domino's Pizza | | | 1,019 | | | | 255,708 | |
DR Horton | | | 4,190 | | | | 162,949 | |
Expedia Group | | | 273 | | | | 33,664 | |
Foot Locker | | | 5,493 | | | | 326,943 | |
Gap | | | 4,959 | | | | 125,959 | |
Garmin | | | 3,213 | | | | 269,796 | |
Gentex | | | 8,426 | | | | 171,385 | |
Genuine Parts | | | 2,804 | | | | 305,019 | |
Graham Holdings, Cl B | | | 155 | | | | 105,975 | |
Grand Canyon Education * | | | 1,200 | | | | 138,816 | |
H&R Block | | | 6,011 | | | | 145,166 | |
Hasbro | | | 1,258 | | | | 106,804 | |
Home Depot | | | 2,739 | | | | 507,098 | |
Hyatt Hotels, Cl A | | | 1,779 | | | | 129,458 | |
Kohl's | | | 4,969 | | | | 335,557 | |
Lowe's | | | 6,718 | | | | 705,995 | |
Lululemon Athletica * | | | 3,324 | | | | 499,996 | |
Macy's | | | 9,254 | | | | 229,407 | |
McDonald's | | | 3,468 | | | | 637,557 | |
NIKE, Cl B | | | 12,620 | | | | 1,081,913 | |
Nordstrom | | | 5,108 | | | | 241,506 | |
The accompanying notes are an integral part of the financial statements.
4
SYMMETRY PANORAMIC US EQUITY FUND
FEBRUARY 28, 2019
(Unaudited)
COMMON STOCK — continued | | | | | | | | |
| | | Shares | | | Value | |
CONSUMER DISCRETIONARY — continued | | | | | | | | |
O'Reilly Automotive * | | | 1,464 | | | $ | 544,549 | |
Penske Automotive Group | | | 1,240 | | | | 55,106 | |
Pool | | | 709 | | | | 113,114 | |
Ralph Lauren, Cl A | | | 2,447 | | | | 306,291 | |
Ross Stores | | | 4,934 | | | | 467,891 | |
ServiceMaster Global Holdings * | | | 2,316 | | | | 104,590 | |
Starbucks | | | 11,441 | | | | 803,845 | |
Tapestry | | | 6,629 | | | | 231,617 | |
Target | | | 5,959 | | | | 432,862 | |
Tiffany | | | 2,315 | | | | 220,018 | |
TJX | | | 13,342 | | | | 684,311 | |
Tractor Supply | | | 3,263 | | | | 311,127 | |
Ulta Beauty * | | | 1,311 | | | | 409,674 | |
Under Armour, Cl A * | | | 10,331 | | | | 232,964 | |
Urban Outfitters * | | | 6,011 | | | | 185,439 | |
VF | | | 2,587 | | | | 226,000 | |
Williams-Sonoma | | | 4,589 | | | | 266,896 | |
Yum! Brands | | | 722 | | | | 68,229 | |
| | | | | | | | 17,556,809 | |
CONSUMER STAPLES — 1.4% | | | | | | | | |
Archer-Daniels-Midland | | | 5,631 | | | | 239,318 | |
Casey's General Stores | | | 1,337 | | | | 180,147 | |
Church & Dwight | | | 5,934 | | | | 390,457 | |
Clorox | | | 1,289 | | | | 203,701 | |
Costco Wholesale | | | 3,600 | | | | 787,464 | |
Energizer Holdings | | | 1,253 | | | | 57,488 | |
Estee Lauder, Cl A | | | 2,438 | | | | 382,620 | |
Hershey | | | 958 | | | | 106,031 | |
Hormel Foods | | | 10,899 | | | | 472,581 | |
Kroger | | | 14,524 | | | | 425,989 | |
Lamb Weston Holdings | | | 6,479 | | | | 449,060 | |
McCormick | | | 3,030 | | | | 412,019 | |
Nu Skin Enterprises, Cl A | | | 713 | | | | 42,858 | |
Post Holdings * | | | 1,938 | | | | 197,443 | |
Procter & Gamble | | | 12,580 | | | | 1,239,759 | |
Sprouts Farmers Market * | | | 5,110 | | | | 119,165 | |
Sysco | | | 6,899 | | | | 466,028 | |
TreeHouse Foods * | | | 587 | | | | 35,560 | |
The accompanying notes are an integral part of the financial statements.
5
SYMMETRY PANORAMIC US EQUITY FUND
FEBRUARY 28, 2019
(Unaudited)
COMMON STOCK — continued | | | | | | | | |
| | | Shares | | | Value | |
CONSUMER STAPLES — continued | | | | | | | | |
Walgreens Boots Alliance | | | 7,228 | | | $ | 514,561 | |
Walmart | | | 5,630 | | | | 557,314 | |
| | | | | | | | 7,279,563 | |
ENERGY — 0.7% | | | | | | | | |
Chevron | | | 7,710 | | | | 921,962 | |
ConocoPhillips | | | 10,474 | | | | 710,661 | |
Continental Resources * | | | 1,475 | | | | 65,800 | |
EOG Resources | | | 792 | | | | 74,448 | |
Helmerich & Payne | | | 819 | | | | 44,390 | |
HollyFrontier | | | 4,251 | | | | 217,651 | |
Marathon Oil | | | 2,337 | | | | 38,794 | |
Marathon Petroleum | | | 3,478 | | | | 215,671 | |
Occidental Petroleum | | | 2,419 | | | | 160,017 | |
PBF Energy, Cl A | | | 4,637 | | | | 144,071 | |
Phillips 66 | | | 4,316 | | | | 415,890 | |
Valero Energy | | | 4,673 | | | | 381,130 | |
Whiting Petroleum * | | | 3,253 | | | | 79,275 | |
| | | | | | | | 3,469,760 | |
FINANCIALS — 2.5% | | | | | | | | |
Aflac | | | 8,638 | | | | 424,471 | |
Alleghany | | | 456 | | | | 293,190 | |
Allstate | | | 2,963 | | | | 279,648 | |
American Express | | | 6,212 | | | | 669,281 | |
American Financial Group | | | 1,361 | | | | 135,637 | |
Aon | | | 1,380 | | | | 236,711 | |
Arch Capital Group * | | | 1,114 | | | | 36,394 | |
Assurant | | | 978 | | | | 100,724 | |
Assured Guaranty | | | 5,053 | | | | 211,013 | |
Axis Capital Holdings | | | 4,645 | | | | 265,090 | |
BB&T | | | 8,778 | | | | 447,415 | |
Capital One Financial | | | 2,878 | | | | 240,543 | |
Chubb | | | 1,858 | | | | 248,786 | |
Cincinnati Financial | | | 1,751 | | | | 152,022 | |
Citizens Financial Group | | | 5,086 | | | | 187,877 | |
CME Group, Cl A | | | 4,452 | | | | 809,863 | |
Comerica | | | 3,209 | | | | 279,536 | |
Commerce Bancshares | | | 1,804 | | | | 113,526 | |
Credit Acceptance * | | | 674 | | | | 296,465 | |
The accompanying notes are an integral part of the financial statements.
6
SYMMETRY PANORAMIC US EQUITY FUND
FEBRUARY 28, 2019
(Unaudited)
COMMON STOCK — continued | | | | | | | | |
| | | Shares | | | Value | |
FINANCIALS — continued | | | | | | | | |
Cullen | | | 1,217 | | | $ | 126,178 | |
Discover Financial Services | | | 3,116 | | | | 223,137 | |
E*TRADE Financial | | | 1,146 | | | | 56,143 | |
East West Bancorp | | | 2,288 | | | | 124,948 | |
Erie Indemnity, Cl A | | | 396 | | | | 70,575 | |
Evercore, Cl A | | | 793 | | | | 73,035 | |
Everest Re Group | | | 1,418 | | | | 320,624 | |
Fidelity National Financial | | | 2,058 | | | | 72,215 | |
Fifth Third Bancorp | | | 4,929 | | | | 135,942 | |
First Citizens BancShares, Cl A | | | 116 | | | | 50,643 | |
Hanover Insurance Group | | | 1,940 | | | | 230,298 | |
Huntington Bancshares | | | 19,238 | | | | 277,220 | |
JPMorgan Chase | | | 19,683 | | | | 2,054,118 | |
KeyCorp | | | 15,026 | | | | 265,359 | |
Marsh & McLennan | | | 1,358 | | | | 126,321 | |
Mercury General | | | 2,018 | | | | 106,894 | |
Nasdaq | | | 1,248 | | | | 114,279 | |
Old Republic International | | | 8,930 | | | | 186,280 | |
Popular | | | 2,887 | | | | 162,769 | |
Progressive | | | 10,236 | | | | 746,205 | |
Prosperity Bancshares | | | 663 | | | | 49,360 | |
Regions Financial | | | 19,860 | | | | 325,704 | |
RenaissanceRe Holdings | | | 657 | | | | 96,612 | |
SVB Financial Group * | | | 979 | | | | 241,970 | |
T Rowe Price Group | | | 2,355 | | | | 236,513 | |
TCF Financial | | | 4,070 | | | | 93,203 | |
Torchmark | | | 911 | | | | 75,212 | |
Travelers | | | 4,099 | | | | 544,798 | |
US Bancorp | | | 4,100 | | | | 211,929 | |
Virtu Financial, Cl A | | | 1,810 | | | | 45,504 | |
Webster Financial | | | 1,525 | | | | 87,565 | |
WR Berkley | | | 3,727 | | | | 311,801 | |
| | | | | | | | 13,271,546 | |
HEALTH CARE — 3.7% | | | | | | | | |
Abbott Laboratories | | | 13,219 | | | | 1,026,059 | |
ABIOMED * | | | 907 | | | | 303,392 | |
Acadia Healthcare * | | | 1,754 | | | | 46,113 | |
Align Technology * | | | 525 | | | | 135,959 | |
The accompanying notes are an integral part of the financial statements.
7
SYMMETRY PANORAMIC US EQUITY FUND
FEBRUARY 28, 2019
(Unaudited)
COMMON STOCK — continued | | | | | | | | |
| | | Shares | | | Value | |
HEALTH CARE — continued | | | | | | | | |
Amgen | | | 4,473 | | | $ | 850,228 | |
Anthem | | | 2,662 | | | | 800,543 | |
Biogen * | | | 1,460 | | | | 478,895 | |
Bio-Rad Laboratories, Cl A * | | | 401 | | | | 108,631 | |
Bio-Techne | | | 249 | | | | 48,281 | |
Boston Scientific * | | | 10,063 | | | | 403,728 | |
Centene * | | | 5,152 | | | | 313,705 | |
Charles River Laboratories International * | | | 674 | | | | 95,823 | |
Chemed | | | 570 | | | | 187,815 | |
Cigna | | | 1,813 | | | | 316,260 | |
Covetrus * | | | 512 | | | | 18,319 | |
Danaher | | | 3,128 | | | | 397,319 | |
DaVita * | | | 2,073 | | | | 117,954 | |
DexCom * | | | 1,654 | | | | 230,452 | |
Edwards Lifesciences * | | | 1,343 | | | | 227,356 | |
Eli Lilly | | | 9,919 | | | | 1,252,671 | |
Encompass Health | | | 3,858 | | | | 243,594 | |
HCA Healthcare | | | 4,228 | | | | 587,861 | |
Henry Schein * | | | 1,955 | | | | 115,932 | |
Hill-Rom Holdings | | | 809 | | | | 85,794 | |
Humana | | | 1,636 | | | | 466,325 | |
ICU Medical * | | | 429 | | | | 105,431 | |
IDEXX Laboratories * | | | 953 | | | | 201,112 | |
Illumina * | | | 1,012 | | | | 316,523 | |
Intuitive Surgical * | | | 745 | | | | 407,969 | |
Jazz Pharmaceuticals * | | | 925 | | | | 129,528 | |
Laboratory Corp of America Holdings * | | | 514 | | | | 76,195 | |
Masimo * | | | 1,825 | | | | 239,586 | |
MEDNAX * | | | 1,073 | | | | 35,312 | |
Medtronic | | | 9,730 | | | | 880,565 | |
Merck | | | 19,932 | | | | 1,620,272 | |
Molina Healthcare * | | | 1,623 | | | | 218,504 | |
Nektar Therapeutics, Cl A * | | | 1,385 | | | | 56,148 | |
Pfizer | | | 39,649 | | | | 1,718,784 | |
Premier, Cl A * | | | 2,877 | | | | 105,241 | |
Quest Diagnostics | | | 524 | | | | 45,352 | |
ResMed | | | 2,536 | | | | 259,762 | |
STERIS | | | 1,471 | | | | 177,932 | |
The accompanying notes are an integral part of the financial statements.
8
SYMMETRY PANORAMIC US EQUITY FUND
FEBRUARY 28, 2019
(Unaudited)
COMMON STOCK — continued | | | | | | | | |
| | | Shares | | | Value | |
HEALTH CARE — continued | | | | | | | | |
Thermo Fisher Scientific | | | 2,993 | | | $ | 776,893 | |
UnitedHealth Group | | | 7,130 | | | | 1,727,029 | |
Universal Health Services, Cl B | | | 1,998 | | | | 277,382 | |
Veeva Systems, Cl A * | | | 2,831 | | | | 333,803 | |
WellCare Health Plans * | | | 551 | | | | 139,723 | |
Zimmer Biomet Holdings | | | 899 | | | | 111,584 | |
Zoetis, Cl A | | | 4,941 | | | | 465,590 | |
| | | | | | | | 19,285,229 | |
INDUSTRIALS — 2.2% | | | | | | | | |
Alaska Air Group | | | 1,595 | | | | 98,411 | |
Allison Transmission Holdings | | | 4,200 | | | | 208,740 | |
Armstrong World Industries | | | 1,486 | | | | 108,745 | |
Boeing | | | 2,205 | | | | 970,112 | |
Carlisle | | | 808 | | | | 99,449 | |
CH Robinson Worldwide | | | 2,248 | | | | 203,174 | |
Cintas | | | 1,429 | | | | 295,231 | |
Clean Harbors * | | | 893 | | | | 60,724 | |
Copart * | | | 2,046 | | | | 120,039 | |
CSX | | | 8,197 | | | | 595,676 | |
Curtiss-Wright | | | 535 | | | | 65,960 | |
Delta Air Lines | | | 8,003 | | | | 396,789 | |
Donaldson | | | 931 | | | | 48,030 | |
Dover | | | 3,241 | | | | 293,408 | |
Eaton | | | 3,177 | | | | 253,429 | |
Emerson Electric | | | 7,027 | | | | 478,890 | |
Expeditors International of Washington | | | 3,342 | | | | 250,483 | |
Fastenal | | | 2,915 | | | | 183,470 | |
Harris | | | 1,241 | | | | 204,678 | |
HD Supply Holdings * | | | 2,085 | | | | 89,676 | |
HEICO | | | 1,920 | | | | 179,961 | |
IDEX | | | 853 | | | | 122,917 | |
Ingersoll-Rand | | | 3,417 | | | | 360,699 | |
ITT | | | 2,230 | | | | 128,805 | |
Jacobs Engineering Group | | | 2,629 | | | | 193,968 | |
JB Hunt Transport Services | | | 1,120 | | | | 120,590 | |
Landstar System | | | 522 | | | | 56,731 | |
MSC Industrial Direct, Cl A | | | 509 | | | | 42,965 | |
The accompanying notes are an integral part of the financial statements.
9
SYMMETRY PANORAMIC US EQUITY FUND
FEBRUARY 28, 2019
(Unaudited)
COMMON STOCK — continued | | | | | | | | |
| | | Shares | | | Value | |
INDUSTRIALS — continued | | | | | | | | |
Nordson | | | 554 | | | $ | 75,211 | |
Norfolk Southern | | | 3,043 | | | | 545,610 | |
Old Dominion Freight Line | | | 1,014 | | | | 152,881 | |
Republic Services, Cl A | | | 5,197 | | | | 407,601 | |
Robert Half International | | | 4,007 | | | | 273,237 | |
Rollins | | | 2,765 | | | | 109,660 | |
Snap-on | | | 1,206 | | | | 192,960 | |
Southwest Airlines | | | 1,466 | | | | 82,155 | |
Teledyne Technologies * | | | 698 | | | | 164,756 | |
Textron | | | 3,216 | | | | 174,629 | |
Union Pacific | | | 5,789 | | | | 970,815 | |
United Continental Holdings * | | | 5,458 | | | | 479,267 | |
United Technologies | | | 1,783 | | | | 224,070 | |
Verisk Analytics, Cl A | | | 2,546 | | | | 321,891 | |
Wabtec | | | 1,368 | | | | 100,220 | |
Waste Management | | | 2,430 | | | | 246,037 | |
WW Grainger | | | 1,205 | | | | 367,248 | |
XPO Logistics * | | | 875 | | | | 44,056 | |
Xylem | | | 1,535 | | | | 115,969 | |
| | | | | | | | 11,280,023 | |
INFORMATION TECHNOLOGY — 5.5% | | | | | | | | |
Accenture, Cl A | | | 2,599 | | | | 419,427 | |
Adobe * | | | 3,898 | | | | 1,023,225 | |
Akamai Technologies * | | | 3,721 | | | | 259,205 | |
Analog Devices | | | 701 | | | | 74,979 | |
ANSYS * | | | 684 | | | | 121,246 | |
Apple | | | 29,449 | | | | 5,099,094 | |
Aspen Technology * | | | 1,183 | | | | 119,140 | |
Atlassian, Cl A * | | | 1,387 | | | | 149,075 | |
Autodesk * | | | 843 | | | | 137,417 | |
Automatic Data Processing | | | 2,901 | | | | 443,940 | |
Booz Allen Hamilton Holding, Cl A | | | 5,058 | | | | 267,366 | |
Broadridge Financial Solutions | | | 2,232 | | | | 225,990 | |
CDW | | | 3,429 | | | | 321,949 | |
Cisco Systems | | | 31,832 | | | | 1,647,943 | |
Citrix Systems | | | 3,020 | | | | 318,610 | |
Conduent * | | | 4,312 | | | | 63,041 | |
DXC Technology | | | 2,024 | | | | 133,301 | |
The accompanying notes are an integral part of the financial statements.
10
SYMMETRY PANORAMIC US EQUITY FUND
FEBRUARY 28, 2019
(Unaudited)
COMMON STOCK — continued | | | | | | | | |
| | | Shares | | | Value | |
INFORMATION TECHNOLOGY — continued | | | | | | | | |
EPAM Systems * | | | 1,102 | | | $ | 178,281 | |
Euronet Worldwide * | | | 268 | | | | 35,998 | |
F5 Networks * | | | 1,732 | | | | 291,219 | |
Fair Isaac * | | | 694 | | | | 171,987 | |
FLIR Systems | | | 2,053 | | | | 105,627 | |
Fortinet * | | | 4,226 | | | | 366,775 | |
Hewlett Packard Enterprise | | | 13,038 | | | | 213,563 | |
HP | | | 16,777 | | | | 331,010 | |
Intel | | | 31,886 | | | | 1,688,683 | |
Intuit | | | 3,013 | | | | 744,603 | |
Jack Henry & Associates | | | 1,090 | | | | 144,567 | |
Keysight Technologies * | | | 5,030 | | | | 424,582 | |
Mastercard, Cl A | | | 6,462 | | | | 1,452,464 | |
Maxim Integrated Products | | | 1,401 | | | | 76,256 | |
Micron Technology * | | | 4,325 | | | | 176,806 | |
Microsoft | | | 47,540 | | | | 5,325,906 | |
Motorola Solutions | | | 1,536 | | | | 219,832 | |
National Instruments | | | 996 | | | | 46,553 | |
NetApp | | | 4,406 | | | | 287,271 | |
Okta, Cl A * | | | 3,342 | | | | 283,669 | |
Palo Alto Networks * | | | 1,319 | | | | 324,830 | |
PTC * | | | 1,412 | | | | 131,062 | |
QUALCOMM | | | 1,809 | | | | 96,583 | |
Sabre | | | 8,559 | | | | 191,978 | |
salesforce.com * | | | 1,263 | | | | 206,690 | |
ServiceNow * | | | 286 | | | | 68,480 | |
Splunk * | | | 1,924 | | | | 261,433 | |
Tableau Software, Cl A * | | | 288 | | | | 37,987 | |
Total System Services | | | 1,199 | | | | 113,185 | |
Twilio, Cl A * | | | 615 | | | | 74,839 | |
Ubiquiti Networks | | | 1,865 | | | | 269,287 | |
Ultimate Software Group * | | | 506 | | | | 167,739 | |
VeriSign * | | | 2,126 | | | | 378,513 | |
Visa, Cl A | | | 8,290 | | | | 1,227,915 | |
VMware, Cl A | | | 2,985 | | | | 512,853 | |
Workday, Cl A * | | | 1,000 | | | | 197,930 | |
Xilinx | | | 3,827 | | | | 479,523 | |
The accompanying notes are an integral part of the financial statements.
11
SYMMETRY PANORAMIC US EQUITY FUND
FEBRUARY 28, 2019
(Unaudited)
COMMON STOCK — continued | | | | | | | | |
| | | Shares | | | Value | |
INFORMATION TECHNOLOGY — continued | | | | | | | | |
Zebra Technologies, Cl A * | | | 1,489 | | | $ | 298,559 | |
Zendesk * | | | 2,418 | | | | 191,070 | |
| | | | | | | | 28,621,056 | |
MATERIALS — 0.4% | | | | | | | | |
AptarGroup | | | 827 | | | | 84,130 | |
Ashland Global Holdings | | | 611 | | | | 47,279 | |
Ball | | | 4,332 | | | | 237,307 | |
CF Industries Holdings | | | 4,919 | | | | 207,582 | |
Domtar | | | 905 | | | | 46,074 | |
Eastman Chemical | | | 1,317 | | | | 108,903 | |
Ecolab | | | 2,739 | | | | 462,645 | |
Huntsman | | | 1,698 | | | | 42,093 | |
LyondellBasell Industries, Cl A | | | 2,066 | | | | 176,684 | |
Mosaic | | | 7,148 | | | | 223,518 | |
Nucor | | | 3,214 | | | | 194,672 | |
Reliance Steel & Aluminum | | | 829 | | | | 73,988 | |
RPM International | | | 1,706 | | | | 98,726 | |
Sonoco Products | | | 2,811 | | | | 162,729 | |
Steel Dynamics | | | 3,751 | | | | 139,988 | |
Westlake Chemical | | | 470 | | | | 32,839 | |
| | | | | | | | 2,339,157 | |
REAL ESTATE — 0.4% | | | | | | | | |
Apartment Investment & Management, Cl A ‡ | | | 4,067 | | | | 198,998 | |
CBRE Group, Cl A * | | | 3,266 | | | | 162,516 | |
EPR Properties ‡ | | | 1,835 | | | | 134,836 | |
Equity Commonwealth ‡ | | | 2,165 | | | | 70,687 | |
Equity Residential ‡ | | | 3,662 | | | | 269,853 | |
HCP ‡ | | | 3,653 | | | | 112,403 | |
Jones Lang LaSalle | | | 627 | | | | 103,530 | |
Kimco Realty ‡ | | | 2,594 | | | | 45,629 | |
Life Storage ‡ | | | 594 | | | | 57,974 | |
Medical Properties Trust ‡ | | | 16,743 | | | | 305,225 | |
Omega Healthcare Investors ‡ | | | 7,933 | | | | 284,795 | |
Park Hotels & Resorts ‡ | | | 3,745 | | | | 116,994 | |
Spirit Realty Capital ‡ | | | 871 | | | | 33,655 | |
Ventas ‡ | | | 2,620 | | | | 164,405 | |
Weingarten Realty Investors ‡ | | | 1,170 | | | | 33,708 | |
The accompanying notes are an integral part of the financial statements.
12
SYMMETRY PANORAMIC US EQUITY FUND
FEBRUARY 28, 2019
(Unaudited)
COMMON STOCK — continued | | | | | | | | |
| | | Shares | | | Value | |
REAL ESTATE — continued | | | | | | | | |
Welltower ‡ | | | 2,997 | | | $ | 222,707 | |
| | | | | | | | 2,317,915 | |
UTILITIES — 1.1% | | | | | | | | |
AES | | | 12,768 | | | | 219,992 | |
Ameren | | | 4,995 | | | | 355,844 | |
American Electric Power | | | 4,762 | | | | 386,436 | |
Atmos Energy | | | 2,247 | | | | 222,116 | |
CenterPoint Energy | | | 2,993 | | | | 90,209 | |
CMS Energy | | | 6,285 | | | | 341,904 | |
DTE Energy | | | 4,120 | | | | 509,067 | |
Duke Energy | | | 5,423 | | | | 486,226 | |
Entergy | | | 1,455 | | | | 135,795 | |
Exelon | | | 14,074 | | | | 683,856 | |
Hawaiian Electric Industries | | | 2,157 | | | | 82,570 | |
NextEra Energy | | | 3,232 | | | | 606,711 | |
NRG Energy | | | 3,098 | | | | 129,125 | |
OGE Energy | | | 6,927 | | | | 294,536 | |
Pinnacle West Capital | | | 3,640 | | | | 341,214 | |
Public Service Enterprise Group | | | 2,839 | | | | 166,961 | |
UGI | | | 4,971 | | | | 272,908 | |
Vistra Energy | | | 6,394 | | | | 166,500 | |
Xcel Energy | | | 8,587 | | | | 471,083 | |
| | | | | | | | 5,963,053 | |
| | | | | | | | | |
Total Common Stock | | | | | | | | |
(Cost $111,339,363) | | | | | | | 117,401,847 | |
| | | | �� | | | | | |
SHORT-TERM INVESTMENT — 2.9% | | | | | | | | |
| | | | | | | | | |
Invesco Government & Agency Portfolio, Cl Institutional, 2.300% (A) | | | | | | | | |
(Cost $15,022,412) | | | 15,022,412 | | | | 15,022,412 | |
Total Investments — 100.0% | | | | | | | | |
(Cost $503,272,863) | | | | | | $ | 521,510,413 | |
Percentages are based on Net Assets of $521,454,622.
The accompanying notes are an integral part of the financial statements.
13
SYMMETRY PANORAMIC US EQUITY FUND
FEBRUARY 28, 2019
(Unaudited)
A list of the open futures contracts held by the Fund at February 28, 2019, is as follows:
Type of
Contract | Number of
Contracts
Long | Expiration
Date | | Notional
Amount | | | Value | | | Unrealized
Appreciation | |
S&P 500 Index E-MINI | 32 | Mar-2019 | | $ | 4,213,622 | | | $ | 4,455,520 | | | $ | 241,898 | |
Open total return swap agreements held by the Fund at February 28, 2019 are as follows:
Counterparty | Reference
Entity/
Obligation | Fund Pays | Fund
Receives | Payment
Frequency | Termination
Date | Currency | | Notional
Amount | | | Value | | | Net
Unrealized
Appreciation | |
ReFlow | SPUSX NAV | SOFR +25 bps | SPUSX | Annually | 02/05/2020 | USD | | | 9,700,646 | | | $ | 107,796 | | | $ | 107,796 | |
* | Non-income producing security. |
‡ | Real Estate Investment Trust |
(A) | The rate reported is the 7-day effective yield as of February 28, 2019. |
BPS — Basis Points
Cl — Class
ETF — Exchange-Traded Fund
MIN — Minimum
MSCI — Morgan Stanley Capital International
S&P — Standard & Poor's
SOFR — Secured Overnight Financing Rate
SPUSX — Symmetry Panoramic US Equity Fund
USD — United States Dollar
VOL — Volatility
The accompanying notes are an integral part of the financial statements.
14
SYMMETRY PANORAMIC US EQUITY FUND
FEBRUARY 28, 2019
(Unaudited)
The following table summarizes the inputs used as of February 28, 2019, in valuing the Fund’s investments and other financial instruments carried at value:
Investments in Securities | | Level 1 | | | Level 2 | | | Level 3 | | | Total | |
Registered Investment Companies | | $ | 389,086,154 | | | $ | — | | | $ | — | | | $ | 389,086,154 | |
Common Stock | | | 117,401,847 | | | | — | | | | — | | | | 117,401,847 | |
Short-Term Investment | | | 15,022,412 | | | | — | | | | — | | | | 15,022,412 | |
Total Investments in Securities | | $ | 521,510,413 | | | $ | — | | | $ | — | | | $ | 521,510,413 | |
Other Financial Instruments | | Level 1 | | | Level 2 | | | Level 3 | | | Total | |
Futures Contracts^ | | | | | | | | | | | | | | | | |
Unrealized Appreciation | | $ | 241,898 | | | $ | — | | | $ | — | | | $ | 241,898 | |
Total Return Swap^ | | | | | | | | | | | | | | | | |
Unrealized Appreciation | | | — | | | | 107,796 | | | | — | | | | 107,796 | |
Total Other Financial Instruments | | $ | 241,898 | | | $ | 107,796 | | | $ | — | | | $ | 349,694 | |
^ | Futures contracts and swap contracts are valued at the unrealized appreciation on the instrument |
Amounts designated as “—” are $0.
For the period ended February 28, 2019, there were no transfers between Level 1, Level 2 and/or Level 3 assets and liabilities. Transfers, if any, between levels are considered to have occurred at the end of the period.
For the period ended February 28, 2019, there were no Level 3 securities.
For more information on valuation inputs, see Note 2 – Significant Accounting Policies in the Notes to Financial Statements.
The accompanying notes are an integral part of the financial statements.
15
SYMMETRY PANORAMIC INTERNATIONAL EQUITY FUND
FEBRUARY 28, 2019
(Unaudited)
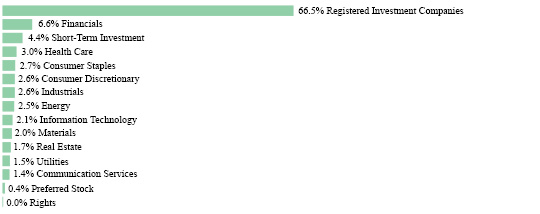
†Percentages are based on total investments.
SCHEDULE OF INVESTMENTS |
REGISTERED INVESTMENT COMPANIES — 66.5% |
| | | Shares | | | Value | |
DFA Emerging Markets Core Equity Portfolio, Cl I | | | 2,728,528 | | | $ | 56,453,252 | |
DFA International Core Equity Portfolio, Cl I.. | | | 1,993,034 | | | | 25,710,139 | |
DFA International Real Estate Securities, Cl I.. | | | 4,257,864 | | | | 21,161,587 | |
DFA International Vector Equity Portfolio, Cl I | | | 4,996,873 | | | | 57,314,133 | |
iShares Edge MSCI Min Vol EAFE ETF | | | 246,049 | | | | 17,435,032 | |
iShares Edge MSCI Min Vol Emerging Markets ETF | | | 177,903 | | | | 10,451,801 | |
Total Registered Investment Companies | | | | | | | | |
(Cost $182,111,249) | | | | | | | 188,525,944 | |
| | | | | | | | | |
COMMON STOCK — 28.7% | | | | | | | | |
| | | | | | | | | |
AUSTRALIA — 1.1% | | | | | | | | |
Alumina | | | 56,735 | | | | 102,776 | |
Aristocrat Leisure | | | 3,135 | | | | 54,687 | |
BlueScope Steel | | | 1,708 | | | | 16,299 | |
Brambles | | | 20,505 | | | | 171,423 | |
CIMIC Group | | | 2,213 | | | | 78,721 | |
Coca-Cola Amatil | | | 14,042 | | | | 79,431 | |
Crown Resorts | | | 8,281 | | | | 67,445 | |
CSL | | | 3,292 | | | | 453,765 | |
Dexus ‡ | | | 22,038 | | | | 188,066 | |
Flight Centre Travel Group | | | 2,942 | | | | 95,413 | |
The accompanying notes are an integral part of the financial statements.
16
SYMMETRY PANORAMIC INTERNATIONAL EQUITY FUND
FEBRUARY 28, 2019
(Unaudited)
COMMON STOCK — continued | | | | | | | | |
| | | Shares | | | Value | |
AUSTRALIA — continued | | | | | | | | |
Goodman Group ‡ | | | 27,644 | | | $ | 251,330 | |
GPT Group ‡ | | | 21,050 | | | | 87,386 | |
Macquarie Group | | | 3,391 | | | | 310,641 | |
Mirvac Group ‡ | | | 49,604 | | | | 90,490 | |
REA Group | | | 683 | | | | 39,654 | |
Santos | | | 14,850 | | | | 72,832 | |
Scentre Group ‡ | | | 44,672 | | | | 122,686 | |
South32 | | | 25,940 | | | | 72,041 | |
Suncorp Group | | | 5,246 | | | | 50,400 | |
Telstra | | | 76,294 | | | | 169,343 | |
Vicinity Centres ‡ | | | 21,714 | | | | 37,936 | |
Washington H Soul Pattinson | | | 1,241 | | | | 25,991 | |
Wesfarmers | | | 9,609 | | | | 226,814 | |
Woodside Petroleum | | | 5,349 | | | | 137,431 | |
Woolworths Group | | | 10,885 | | | | 221,770 | |
| | | | | | | | 3,224,771 | |
BELGIUM — 0.2% | | | | | | | | |
Colruyt | | | 3,009 | | | | 214,281 | |
UCB | | | 3,070 | | | | 257,162 | |
| | | | | | | | 471,443 | |
BRAZIL — 1.2% | | | | | | | | |
Atacadao Distribuicao Comercio e Industria Ltda | | | 12,800 | | | | 67,473 | |
Banco Bradesco ADR | | | 55,512 | | | | 637,278 | |
Banco do Brasil | | | 19,700 | | | | 265,383 | |
Banco Santander Brasil ADR | | | 10,075 | | | | 120,699 | |
Centrais Eletricas Brasileiras * | | | 5,000 | | | | 49,372 | |
Cia de Saneamento Basico do Estado de Sao Paulo ADR | | | 4,880 | | | | 50,752 | |
Cia Siderurgica Nacional | | | 11,500 | | | | 40,322 | |
Engie Brasil Energia | | | 8,000 | | | | 88,261 | |
IRB Brasil Resseguros S | | | 6,600 | | | | 156,788 | |
Itau Unibanco Holding ADR | | | 67,650 | | | | 635,910 | |
Itausa - Investimentos Itau | | | 89,200 | | | | 293,759 | |
JBS | | | 38,900 | | | | 140,121 | |
Natura Cosmeticos | | | 6,600 | | | | 84,658 | |
Petrobras Distribuidora | | | 11,200 | | | | 72,755 | |
Porto Seguro | | | 8,300 | | | | 123,832 | |
Sul America | | | 18,000 | | | | 146,927 | |
The accompanying notes are an integral part of the financial statements.
17
SYMMETRY PANORAMIC INTERNATIONAL EQUITY FUND
FEBRUARY 28, 2019
(Unaudited)
COMMON STOCK — continued | | | | | | | | |
| | | Shares | | | Value | |
BRAZIL — continued | | | | | | | | |
Suzano Papel e Celulose | | | 10,300 | | | $ | 131,624 | |
TIM Participacoes ADR | | | 3,269 | | | | 51,585 | |
Vale ADR, Cl B | | | 26,219 | | | | 327,213 | |
| | | | | | | | 3,484,712 | |
CANADA — 1.3% | | | | | | | | |
Alimentation Couche-Tard, Cl B | | | 5,427 | | | | 305,878 | |
Bank of Montreal | | | 735 | | | | 57,317 | |
Bausch Health * | | | 5,252 | | | | 124,760 | |
CAE | | | 4,894 | | | | 103,202 | |
Cameco | | | 1,586 | | | | 18,404 | |
Canadian Imperial Bank of Commerce | | | 897 | | | | 76,091 | |
Canadian National Railway | | | 2,349 | | | | 201,565 | |
Canadian Pacific Railway | | | 1,192 | | | | 246,308 | |
Canadian Tire, Cl A | | | 340 | | | | 37,515 | |
CGI, Cl A * | | | 3,609 | | | | 241,971 | |
Empire | | | 5,755 | | | | 133,691 | |
Gildan Activewear | | | 2,067 | | | | 73,918 | |
H&R Real Estate Investment Trust ‡ | | | 5,095 | | | | 87,927 | |
Husky Energy | | | 5,822 | | | | 64,726 | |
Imperial Oil | | | 2,664 | | | | 72,129 | |
Magna International | | | 3,065 | | | | 161,734 | |
Methanex | | | 1,288 | | | | 72,497 | |
Metro, Cl A | | | 2,354 | | | | 88,475 | |
National Bank of Canada | | | 1,954 | | | | 92,195 | |
Open Text | | | 2,346 | | | | 88,923 | |
RioCan Real Estate Investment Trust ‡ | | | 3,068 | | | | 58,611 | |
Rogers Communications, Cl B | | | 6,271 | | | | 346,491 | |
Sun Life Financial | | | 3,520 | | | | 133,262 | |
Suncor Energy | | | 1,340 | | | | 46,189 | |
Toronto-Dominion Bank | | | 11,904 | | | | 682,606 | |
| | | | | | | | 3,616,385 | |
CHINA — 0.2% | | | | | | | | |
Kunlun Energy | | | 120,000 | | | | 132,144 | |
PetroChina, Cl H | | | 594,000 | | | | 391,920 | |
| | | | | | | | 524,064 | |
DENMARK — 0.2% | | | | | | | | |
Chr Hansen Holding | | | 294 | | | | 30,037 | |
Coloplast, Cl B | | | 975 | | | | 97,204 | |
The accompanying notes are an integral part of the financial statements.
18
SYMMETRY PANORAMIC INTERNATIONAL EQUITY FUND
FEBRUARY 28, 2019
(Unaudited)
COMMON STOCK — continued | | | | | | | | |
| | | Shares | | | Value | |
DENMARK — continued | | | | | | | | |
DSV | | | 1,126 | | | $ | 93,760 | |
Orsted | | | 1,002 | | | | 72,748 | |
Tryg | | | 2,819 | | | | 76,818 | |
Vestas Wind Systems | | | 1,169 | | | | 97,394 | |
William Demant Holding * | | | 3,225 | | | | 96,883 | |
| | | | | | | | 564,844 | |
FINLAND — 0.3% | | | | | | | | |
Elisa | | | 1,987 | | | | 83,333 | |
Neste | | | 2,048 | | | | 197,304 | |
Nokia | | | 27,512 | | | | 166,292 | |
Orion, Cl B | | | 685 | | | | 24,462 | |
Stora Enso, Cl R | | | 4,107 | | | | 55,115 | |
UPM-Kymmene | | | 8,096 | | | | 244,424 | |
| | | | | | | | 770,930 | |
FRANCE — 0.9% | | | | | | | | |
Air Liquide | | | 231 | | | | 28,816 | |
Dassault Systemes | | | 438 | | | | 64,121 | |
Electricite de France | | | 15,310 | | | | 222,227 | |
EssilorLuxottica | | | 704 | | | | 85,182 | |
Eutelsat Communications | | | 3,847 | | | | 75,988 | |
Hermes International | | | 429 | | | | 271,837 | |
Ipsen | | | 181 | | | | 25,045 | |
Kering | | | 249 | | | | 136,009 | |
L'Oreal | | | 240 | | | | 60,550 | |
LVMH Moet Hennessy Louis Vuitton | | | 1,638 | | | | 562,286 | |
Peugeot | | | 5,664 | | | | 144,102 | |
Sanofi | | | 5,180 | | | | 432,772 | |
SCOR | | | 508 | | | | 22,878 | |
Teleperformance | | | 127 | | | | 22,692 | |
Thales | | | 301 | | | | 37,072 | |
TOTAL | | | 7,470 | | | | 424,914 | |
Ubisoft Entertainment * | | | 258 | | | | 18,630 | |
| | | | | | | | 2,635,121 | |
GERMANY — 1.1% | | | | | | | | |
adidas | | | 1,533 | | | | 372,806 | |
Allianz | | | 2,677 | | | | 596,311 | |
Aroundtown | | | 13,266 | | | | 111,812 | |
Brenntag | | | 1,621 | | | | 80,468 | |
The accompanying notes are an integral part of the financial statements.
19
SYMMETRY PANORAMIC INTERNATIONAL EQUITY FUND
FEBRUARY 28, 2019
(Unaudited)
COMMON STOCK — continued | | | | | | | | |
| | | Shares | | | Value | |
GERMANY — continued | | | | | | | | |
Deutsche Boerse | | | 1,327 | | | $ | 167,913 | |
Deutsche Telekom | | | 16,599 | | | | 273,513 | |
Deutsche Wohnen | | | 5,364 | | | | 250,348 | |
E.ON | | | 12,217 | | | | 134,506 | |
Evonik Industries | | | 3,690 | | | | 103,976 | |
Hannover Rueck | | | 1,586 | | | | 236,160 | |
MTU Aero Engines | | | 746 | | | | 159,876 | |
Puma | | | 194 | | | | 109,427 | |
QIAGEN * | | | 2,228 | | | | 85,330 | |
RWE | | | 3,879 | | | | 94,688 | |
Vonovia | | | 5,481 | | | | 265,993 | |
Wirecard | | | 1,162 | | | | 159,940 | |
| | | | | | | | 3,203,067 | |
HONG KONG — 4.9% | | | | | | | | |
Agile Group Holdings | | | 64,000 | | | | 80,163 | |
Agricultural Bank of China, Cl H | | | 1,445,000 | | | | 692,571 | |
Air China, Cl H | | | 36,000 | | | | 39,025 | |
Angang Steel, Cl H | | | 36,000 | | | | 26,871 | |
Anhui Conch Cement, Cl H | | | 43,500 | | | | 248,679 | |
Bank of China, Cl H | | | 558,000 | | | | 260,324 | |
Bank of Communications, Cl H | | | 342,000 | | | | 287,252 | |
BOC Aviation | | | 10,100 | | | | 87,512 | |
China CITIC Bank, Cl H | | | 175,000 | | | | 113,822 | |
China Communications Services, Cl H | | | 152,000 | | | | 152,778 | |
China Construction Bank, Cl H | | | 1,176,000 | | | | 1,047,216 | |
China Everbright Bank, Cl H | | | 288,000 | | | | 138,110 | |
China Jinmao Holdings Group | | | 128,000 | | | | 62,245 | |
China Longyuan Power Group, Cl H | | | 157,000 | | | | 117,364 | |
China Mengniu Dairy | | | 27,000 | | | | 84,055 | |
China Merchants Bank, Cl H | | | 186,000 | | | | 855,460 | |
China Mobile | | | 75,000 | | | | 789,271 | |
China Oriental Group | | | 172,000 | | | | 115,560 | |
China Overseas Land & Investment | | | 76,000 | | | | 280,324 | |
China Petroleum & Chemical, Cl H | | | 496,000 | | | | 428,366 | |
China Railway Construction, Cl H | | | 121,500 | | | | 175,251 | |
China Railway Group, Cl H | | | 201,000 | | | | 199,567 | |
China Resources Beer Holdings | | | 28,000 | | | | 104,751 | |
China Resources Cement Holdings | | | 134,000 | | | | 143,129 | |
The accompanying notes are an integral part of the financial statements.
20
SYMMETRY PANORAMIC INTERNATIONAL EQUITY FUND
FEBRUARY 28, 2019
(Unaudited)
COMMON STOCK — continued | | | | | | | | |
| | | Shares | | | Value | |
HONG KONG — continued | | | | | | | | |
China Resources Gas Group | | | 32,000 | | | $ | 139,161 | |
China Resources Land | | | 56,000 | | | | 209,555 | |
China Resources Pharmaceutical Group | | | 71,500 | | | | 96,009 | |
China Resources Power Holdings | | | 62,000 | | | | 117,636 | |
China Shenhua Energy, Cl H | | | 32,500 | | | | 80,172 | |
China Telecom, Cl H | | | 382,000 | | | | 206,858 | |
China Unicom Hong Kong | | | 22,000 | | | | 26,084 | |
China Vanke, Cl H | | | 5,900 | | | | 22,428 | |
CITIC | | | 99,000 | | | | 150,895 | |
CK Asset Holdings | | | 2,000 | | | | 16,598 | |
CLP Holdings | | | 19,000 | | | | 225,117 | |
CNOOC | | | 237,000 | | | | 408,248 | |
CRRC | | | 48,000 | | | | 50,397 | |
CSPC Pharmaceutical Group | | | 54,000 | | | | 92,385 | |
ENN Energy Holdings | | | 11,000 | | | | 113,540 | |
Far East Horizon | | | 76,000 | | | | 85,095 | |
Future Land Development Holdings | | | 160,000 | | | | 138,571 | |
Guangdong Investment | | | 86,000 | | | | 165,164 | |
Haier Electronics Group | | | 9,000 | | | | 26,950 | |
Hang Seng Bank | | | 2,300 | | | | 57,009 | |
Henderson Land Development | | | 9,000 | | | | 51,002 | |
Hong Kong & China Gas | | | 94,000 | | | | 217,728 | |
Hua Hong Semiconductor | | | 59,000 | | | | 138,470 | |
Huadian Power International, Cl H | | | 144,000 | | | | 63,224 | |
Hysan Development | | | 17,000 | | | | 89,930 | |
Industrial & Commercial Bank of China, Cl H | | | 1,311,000 | | | | 1,009,651 | |
Jiayuan International Group | | | 90,000 | | | | 43,979 | |
Legend Holdings, Cl H | | | 10,100 | | | | 28,197 | |
Link ‡ | | | 22,000 | | | | 248,784 | |
Logan Property Holdings | | | 96,000 | | | | 137,192 | |
Longfor Group Holdings | | | 50,000 | | | | 149,059 | |
Luye Pharma Group | | | 98,000 | | | | 73,428 | |
Maanshan Iron & Steel, Cl H | | | 224,000 | | | | 106,997 | |
MMG * | | | 64,000 | | | | 30,451 | |
New World Development | | | 34,000 | | | | 54,365 | |
NWS Holdings | | | 48,000 | | | | 116,291 | |
Ping An Insurance Group of China, Cl H | | | 14,500 | | | | 153,092 | |
Postal Savings Bank of China, Cl H | | | 292,000 | | | | 175,164 | |
The accompanying notes are an integral part of the financial statements.
21
SYMMETRY PANORAMIC INTERNATIONAL EQUITY FUND
FEBRUARY 28, 2019
(Unaudited)
COMMON STOCK — continued | | | | | | | | |
| | | Shares | | | Value | |
HONG KONG — continued | | | | | | | | |
Shandong Weigao Group Medical Polymer, Cl H | | | 80,000 | | | $ | 69,698 | |
Shenzhen International Holdings | | | 11,000 | | | | 22,756 | |
Shenzhou International Group Holdings | | | 5,000 | | | | 62,624 | |
Shimao Property Holdings | | | 56,500 | | | | 133,958 | |
Sino Biopharmaceutical | | | 91,000 | | | | 79,142 | |
Sino Land | | | 72,000 | | | | 134,344 | |
Sinopec Engineering Group, Cl H | | | 108,000 | | | | 98,346 | |
Sinopec Shanghai Petrochemical, Cl H | | | 106,000 | | | | 53,911 | |
Sinopharm Group, Cl H | | | 11,200 | | | | 49,897 | |
Sinotruk Hong Kong | | | 83,000 | | | | 151,545 | |
SJM Holdings | | | 103,000 | | | | 116,132 | |
SSY Group | | | 118,000 | | | | 104,949 | |
Sun Art Retail Group | | | 31,000 | | | | 31,537 | |
Sun Hung Kai Properties | | | 7,500 | | | | 124,326 | |
Swire Properties | | | 47,200 | | | | 189,430 | |
Techtronic Industries | | | 7,500 | | | | 50,325 | |
Tingyi Cayman Islands Holding | | | 30,000 | | | | 41,725 | |
Uni-President China Holdings | | | 79,000 | | | | 70,718 | |
Weichai Power, Cl H | | | 143,000 | | | | 199,216 | |
Wharf Real Estate Investment | | | 15,000 | | | | 105,473 | |
Yanzhou Coal Mining, Cl H | | | 28,000 | | | | 27,885 | |
Yihai International Holding | | | 6,000 | | | | 19,018 | |
Yuexiu Property | | | 340,000 | | | | 78,490 | |
Zijin Mining Group, Cl H | | | 244,000 | | | | 104,668 | |
| | | | | | | | 13,964,655 | |
HUNGARY — 0.1% | | | | | | | | |
MOL Hungarian Oil & Gas | | | 16,815 | | | | 196,249 | |
| | | | | | | | | |
INDONESIA — 0.3% | | | | | | | | |
Adaro Energy | | | 314,700 | | | | 29,290 | |
Astra International | | | 146,800 | | | | 74,309 | |
Bank Negara Indonesia Persero | | | 133,600 | | | | 83,072 | |
Bank Rakyat Indonesia Persero | | | 222,400 | | | | 60,780 | |
Bukit Asam | | | 349,100 | | | | 98,907 | |
Charoen Pokphand Indonesia | | | 319,800 | | | | 166,398 | |
Gudang Garam | | | 8,700 | | | | 52,766 | |
Indah Kiat Pulp & Paper | | | 151,100 | | | | 118,642 | |
United Tractors | | | 34,600 | | | | 65,400 | |
| | | | | | | | 749,564 | |
The accompanying notes are an integral part of the financial statements.
22
SYMMETRY PANORAMIC INTERNATIONAL EQUITY FUND
FEBRUARY 28, 2019
(Unaudited)
COMMON STOCK — continued | | | | | | | | |
| | | Shares | | | Value | |
ITALY — 0.4% | | | | | | | | |
Assicurazioni Generali | | | 5,711 | | | $ | 101,933 | |
Davide Campari-Milano | | | 3,992 | | | | 38,073 | |
Enel | | | 23,496 | | | | 142,175 | |
Eni | | | 22,801 | | | | 393,544 | |
Moncler | | | 3,019 | | | | 115,920 | |
Poste Italiane | | | 13,759 | | | | 124,066 | |
Terna Rete Elettrica Nazionale | | | 12,314 | | | | 76,617 | |
| | | | | | | | 992,328 | |
JAPAN — 5.7% | | | | | | | | |
ABC-Mart | | | 1,700 | | | | 97,388 | |
Aeon | | | 6,600 | | | | 139,150 | |
Aeon Mall | | | 1,200 | | | | 19,597 | |
AGC | | | 1,600 | | | | 55,522 | |
Alfresa Holdings | | | 5,000 | | | | 144,950 | |
Alps Alpine | | | 1,000 | | | | 19,672 | |
Asahi Intecc | | | 1,600 | | | | 76,850 | |
Asahi Kasei | | | 6,500 | | | | 71,082 | |
Astellas Pharma | | | 16,900 | | | | 261,496 | |
Bandai Namco Holdings | | | 4,500 | | | | 191,607 | |
Bridgestone | | | 700 | | | | 27,671 | |
Casio Computer | | | 3,500 | | | | 47,613 | |
Central Japan Railway | | | 1,600 | | | | 359,692 | |
Chubu Electric Power | | | 9,100 | | | | 143,564 | |
Chugai Pharmaceutical | | | 3,600 | | | | 245,480 | |
CyberAgent | | | 600 | | | | 18,520 | |
Dai Nippon Printing | | | 3,200 | | | | 74,258 | |
Daicel | | | 6,300 | | | | 66,245 | |
Dai-ichi Life Holdings | | | 1,800 | | | | 27,424 | |
Daiichi Sankyo | | | 5,300 | | | | 198,823 | |
Daikin Industries | | | 600 | | | | 65,334 | |
Dentsu | | | 2,900 | | | | 121,389 | |
East Japan Railway | | | 300 | | | | 28,759 | |
Eisai | | | 2,600 | | | | 215,140 | |
FamilyMart UNY Holdings | | | 2,800 | | | | 79,882 | |
Fast Retailing | | | 400 | | | | 188,081 | |
Fuji Electric | | | 1,300 | | | | 40,996 | |
FUJIFILM Holdings | | | 4,200 | | | | 188,713 | |
Fujitsu | | | 700 | | | | 47,295 | |
The accompanying notes are an integral part of the financial statements.
23
SYMMETRY PANORAMIC INTERNATIONAL EQUITY FUND
FEBRUARY 28, 2019
(Unaudited)
COMMON STOCK — continued | | | | | | | | |
| | | Shares | | | Value | |
JAPAN — continued | | | | | | | | |
Fukuoka Financial Group | | | 1,300 | | | $ | 28,166 | |
Hakuhodo DY Holdings | | | 8,000 | | | | 123,080 | |
Hamamatsu Photonics | | | 700 | | | | 24,681 | |
Hikari Tsushin | | | 600 | | | | 107,539 | |
Hisamitsu Pharmaceutical | | | 600 | | | | 29,651 | |
Hitachi High-Technologies | | | 1,300 | | | | 49,528 | |
Honda Motor | | | 2,000 | | | | 56,757 | |
Hoya | | | 3,400 | | | | 208,293 | |
Idemitsu Kosan | | | 1,800 | | | | 63,723 | |
Isuzu Motors | | | 9,900 | | | | 142,514 | |
ITOCHU | | | 11,900 | | | | 213,757 | |
Japan Airlines | | | 5,500 | | | | 200,699 | |
Japan Airport Terminal | | | 1,200 | | | | 47,810 | |
Japan Post Holdings | | | 22,800 | | | | 277,558 | |
Japan Prime Realty Investment ‡ | | | 21 | | | | 82,435 | |
Japan Real Estate Investment ‡ | | | 19 | | | | 109,998 | |
JSR | | | 1,300 | | | | 21,624 | |
JXTG Holdings | | | 11,700 | | | | 54,659 | |
Kakaku.com | | | 5,200 | | | | 100,118 | |
Kamigumi | | | 2,000 | | | | 46,436 | |
Kaneka | | | 2,200 | | | | 86,291 | |
Kansai Electric Power | | | 8,900 | | | | 133,616 | |
Kao | | | 2,600 | | | | 197,139 | |
KDDI | | | 9,600 | | | | 231,945 | |
Keihan Holdings | | | 2,800 | | | | 115,904 | |
Kikkoman | | | 2,400 | | | | 119,996 | |
Kobayashi Pharmaceutical | | | 400 | | | | 32,309 | |
Konica Minolta | | | 11,700 | | | | 113,993 | |
Kose | | | 300 | | | | 48,681 | |
Kyocera | | | 600 | | | | 33,221 | |
Kyowa Hakko Kirin | | | 1,800 | | | | 34,530 | |
Kyushu Railway | | | 4,000 | | | | 136,725 | |
Lion | | | 1,200 | | | | 24,608 | |
Makita | | | 800 | | | | 28,356 | |
Marubeni | | | 23,400 | | | | 167,542 | |
Marui Group | | | 3,200 | | | | 56,349 | |
Maruichi Steel Tube | | | 1,400 | | | | 42,192 | |
Medipal Holdings | | | 6,300 | | | | 146,992 | |
The accompanying notes are an integral part of the financial statements.
24
SYMMETRY PANORAMIC INTERNATIONAL EQUITY FUND
FEBRUARY 28, 2019
(Unaudited)
COMMON STOCK — continued | | | | | | | | |
| | | Shares | | | Value | |
JAPAN — continued | | | | | | | | |
MEIJI Holdings | | | 200 | | | $ | 15,857 | |
MINEBEA MITSUMI | | | 1,000 | | | | 16,082 | |
Mitsubishi | | | 11,800 | | | | 333,667 | |
Mitsubishi Heavy Industries | | | 1,100 | | | | 44,830 | |
Mitsubishi UFJ Lease & Finance | | | 13,600 | | | | 69,301 | |
Mitsui | | | 15,200 | | | | 239,281 | |
Mitsui Fudosan | | | 3,700 | | | | 87,745 | |
Mizuho Financial Group | | | 157,600 | | | | 248,348 | |
Murata Manufacturing | | | 1,100 | | | | 172,114 | |
NGK Spark Plug | | | 4,000 | | | | 85,302 | |
Nikon | | | 2,600 | | | | 39,535 | |
Nippon Building Fund ‡ | | | 32 | | | | 208,261 | |
Nippon Telegraph & Telephone | | | 6,800 | | | | 293,526 | |
Nissan Chemical | | | 2,400 | | | | 121,184 | |
Nissan Motor | | | 10,700 | | | | 92,567 | |
Nisshin Seifun Group | | | 1,500 | | | | 32,220 | |
Nomura Research Institute | | | 1,100 | | | | 44,811 | |
NTT Data | | | 10,000 | | | | 109,624 | |
Obic | | | 1,400 | | | | 133,967 | |
Oji Holdings | | | 14,100 | | | | 84,096 | |
Ono Pharmaceutical | | | 1,500 | | | | 30,810 | |
Oriental Land | | | 1,000 | | | | 110,087 | |
ORIX | | | 7,800 | | | | 113,151 | |
Otsuka | | | 900 | | | | 32,403 | |
Otsuka Holdings | | | 1,000 | | | | 41,774 | |
Park24 | | | 3,300 | | | | 79,371 | |
Pigeon | | | 400 | | | | 16,346 | |
Recruit Holdings | | | 10,300 | | | | 289,048 | |
Resona Holdings | | | 20,200 | | | | 91,633 | |
Ricoh | | | 5,200 | | | | 52,905 | |
Sankyo | | | 3,300 | | | | 121,611 | |
Santen Pharmaceutical | | | 1,200 | | | | 18,759 | |
Secom | | | 2,000 | | | | 173,049 | |
Sega Sammy Holdings | | | 2,700 | | | | 31,390 | |
Seven & i Holdings | | | 6,400 | | | | 281,513 | |
SG Holdings | | | 4,000 | | | | 117,400 | |
Shimadzu | | | 1,800 | | | | 44,567 | |
Shin-Etsu Chemical | | | 800 | | | | 66,901 | |
The accompanying notes are an integral part of the financial statements.
25
SYMMETRY PANORAMIC INTERNATIONAL EQUITY FUND
FEBRUARY 28, 2019
(Unaudited)
COMMON STOCK — continued | | | | | | | | |
| | | Shares | | | Value | |
JAPAN — continued | | | | | | | | |
Shionogi | | | 3,400 | | | $ | 217,754 | |
Shiseido | | | 3,900 | | | | 258,238 | |
Shizuoka Bank | | | 4,600 | | | | 36,405 | |
Showa Denko | | | 1,400 | | | | 52,588 | |
SoftBank Group | | | 200 | | | | 18,623 | |
Sompo Holdings | | | 2,000 | | | | 74,749 | |
Sony | | | 8,700 | | | | 418,775 | |
Sony Financial Holdings | | | 5,300 | | | | 100,527 | |
Sumitomo | | | 5,400 | | | | 77,784 | |
Sumitomo Dainippon Pharma | | | 4,800 | | | | 118,630 | |
Sumitomo Electric Industries | | | 3,200 | | | | 44,721 | |
Sumitomo Mitsui Financial Group | | | 2,700 | | | | 95,765 | |
Sumitomo Mitsui Trust Holdings | | | 3,800 | | | | 144,431 | |
Suzuken | | | 2,900 | | | | 159,040 | |
Suzuki Motor | | | 4,200 | | | | 215,441 | |
Taisho Pharmaceutical Holdings | | | 1,400 | | | | 141,991 | |
TDK | | | 1,100 | | | | 86,384 | |
Terumo | | | 3,400 | | | | 208,974 | |
Toho | | | 600 | | | | 21,443 | |
Toho Gas | | | 3,600 | | | | 163,746 | |
Tohoku Electric Power | | | 1,400 | | | | 18,361 | |
Tokio Marine Holdings | | | 5,400 | | | | 264,151 | |
Tokyo Electric Power Holdings * | | | 29,900 | | | | 186,582 | |
Tokyo Gas | | | 6,000 | | | | 165,268 | |
Toyo Seikan Group Holdings | | | 5,600 | | | | 118,604 | |
Toyoda Gosei | | | 1,200 | | | | 27,280 | |
Toyota Motor | | | 14,800 | | | | 893,037 | |
Toyota Tsusho | | | 1,000 | | | | 31,865 | |
Trend Micro | | | 1,400 | | | | 69,159 | |
Unicharm | | | 6,300 | | | | 197,207 | |
West Japan Railway | | | 400 | | | | 30,144 | |
Yamaha | | | 3,100 | | | | 152,877 | |
Yamato Holdings | | | 5,500 | | | | 143,589 | |
Yamazaki Baking | | | 1,100 | | | | 18,922 | |
Yokogawa Electric | | | 1,000 | | | | 19,317 | |
Yokohama Rubber | | | 3,900 | | | | 79,744 | |
| | | | | | | | 16,258,760 | |
The accompanying notes are an integral part of the financial statements.
26
SYMMETRY PANORAMIC INTERNATIONAL EQUITY FUND
FEBRUARY 28, 2019
(Unaudited)
COMMON STOCK — continued | | | | | | | | |
| | | Shares | | | Value | |
MALAYSIA — 0.6% | | | | | | | | |
CIMB Group Holdings | | | 26,100 | | | $ | 37,610 | |
Fraser & Neave Holdings | | | 8,300 | | | | 72,038 | |
Hong Leong Bank | | | 28,900 | | | | 151,202 | |
Hong Leong Financial Group | | | 29,500 | | | | 143,216 | |
Malayan Banking | | | 76,200 | | | | 178,334 | |
Malaysia Airports Holdings | | | 25,700 | | | | 51,689 | |
Nestle Malaysia | | | 2,300 | | | | 83,716 | |
Petronas Chemicals Group | | | 89,400 | | | | 202,126 | |
Petronas Dagangan | | | 9,100 | | | | 59,862 | |
Petronas Gas | | | 31,400 | | | | 139,999 | |
PPB Group | | | 24,300 | | | | 109,514 | |
Public Bank | | | 45,400 | | | | 279,227 | |
RHB Bank | | | 94,700 | | | | 131,662 | |
Sime Darby | | | 42,800 | | | | 22,864 | |
Tenaga Nasional | | | 31,800 | | | | 104,761 | |
| | | | | | | | 1,767,820 | |
MEXICO — 0.2% | | | | | | | | |
Alfa, Cl A | | | 98,500 | | | | 111,979 | |
El Puerto de Liverpool | | | 9,600 | | | | 60,235 | |
Grupo Financiero Banorte, Cl O | | | 12,400 | | | | 67,513 | |
Megacable Holdings | | | 18,900 | | | | 86,455 | |
Mexichem | | | 19,600 | | | | 47,665 | |
Promotora y Operadora de Infraestructura | | | 3,530 | | | | 34,737 | |
Wal-Mart de Mexico | | | 46,700 | | | | 120,859 | |
| | | | | | | | 529,443 | |
NETHERLANDS — 0.7% | | | | | | | | |
Aegon | | | 30,608 | | | | 165,009 | |
ArcelorMittal | | | 1,491 | | | | 34,197 | |
ASML Holding | | | 224 | | | | 41,048 | |
Koninklijke Ahold Delhaize | | | 11,008 | | | | 283,751 | |
Koninklijke DSM | | | 2,610 | | | | 280,825 | |
Koninklijke Vopak | | | 3,121 | | | | 152,642 | |
NN Group | | | 5,641 | | | | 245,818 | |
Unilever | | | 8,844 | | | | 478,206 | |
Wolters Kluwer | | | 3,941 | | | | 259,953 | |
| | | | | | | | 1,941,449 | |
The accompanying notes are an integral part of the financial statements.
27
SYMMETRY PANORAMIC INTERNATIONAL EQUITY FUND
FEBRUARY 28, 2019
(Unaudited)
COMMON STOCK — continued | | | | | | | | |
| | | Shares | | | Value | |
NORWAY — 0.2% | | | | | | | | |
Aker BP | | | 1,202 | | | $ | 40,917 | |
DNB | | | 2,116 | | | | 40,573 | |
Equinor | | | 17,319 | | | | 389,399 | |
Mowi | | | 4,189 | | | | 96,772 | |
Schibsted, Cl B | | | 2,529 | | | | 93,688 | |
| | | | | | | | 661,349 | |
PHILIPPINES — 0.1% | | | | | | | | |
Globe Telecom | | | 2,900 | | | | 106,593 | |
Manila Electric | | | 12,980 | | | | 92,296 | |
| | | | | | | | 198,889 | |
POLAND — 0.2% | | | | | | | | |
Bank Millennium * | | | 31,329 | | | | 71,503 | |
Dino Polska * | | | 1,691 | | | | 47,864 | |
Grupa Lotos | | | 6,026 | | | | 151,482 | |
Polski Koncern Naftowy ORLEN | | | 2,456 | | | | 66,153 | |
Polskie Gornictwo Naftowe i Gazownictwo | | | 59,369 | | | | 108,501 | |
Powszechna Kasa Oszczednosci Bank Polski | | | 9,149 | | | | 91,825 | |
| | | | | | | | 537,328 | |
PORTUGAL — 0.1% | | | | | | | | |
Galp Energia SGPS | | | 11,175 | | | | 183,640 | |
| | | | | | | | | |
SINGAPORE — 0.4% | | | | | | | | |
CapitaLand Mall Trust ‡ | | | 79,300 | | | | 140,635 | |
ComfortDelGro | | | 90,200 | | | | 159,594 | |
DBS Group Holdings | | | 17,600 | | | | 322,990 | |
SATS | | | 12,700 | | | | 48,250 | |
Singapore Technologies Engineering | | | 32,700 | | | | 90,357 | |
United Overseas Bank | | | 8,400 | | | | 155,309 | |
Venture | | | 3,800 | | | | 50,007 | |
Yangzijiang Shipbuilding Holdings | | | 61,600 | | | | 65,427 | |
| | | | | | | | 1,032,569 | |
SOUTH AFRICA — 0.6% | | | | | | | | |
Absa Group | | | 10,091 | | | | 129,150 | |
Anglo American Platinum | | | 2,659 | | | | 144,615 | |
AngloGold Ashanti ADR | | | 6,460 | | | | 91,538 | |
Bidvest Group | | | 3,482 | | | | 51,321 | |
Clicks Group | | | 4,385 | | | | 56,188 | |
Exxaro Resources | | | 1,040 | | | | 11,181 | |
The accompanying notes are an integral part of the financial statements.
28
SYMMETRY PANORAMIC INTERNATIONAL EQUITY FUND
FEBRUARY 28, 2019
(Unaudited)
COMMON STOCK — continued | | | | | | | | |
| | | Shares | | | Value | |
SOUTH AFRICA — continued | | | | | | | | |
FirstRand | | | 41,579 | | | $ | 188,957 | |
Foschini Group | | | 6,323 | | | | 76,821 | |
Investec | | | 9,478 | | | | 61,542 | |
Kumba Iron Ore | | | 2,107 | | | | 55,659 | |
Liberty Holdings | | | 3,634 | | | | 26,491 | |
Mondi | | | 4,627 | | | | 108,710 | |
Mr Price Group | | | 4,815 | | | | 73,387 | |
Nedbank Group | | | 4,598 | | | | 92,608 | |
Netcare | | | 27,294 | | | | 49,276 | |
Pick n Pay Stores | | | 13,663 | | | | 67,177 | |
Redefine Properties ‡ | | | 19,805 | | | | 13,642 | |
RMB Holdings | | | 20,023 | | | | 113,729 | |
Sanlam | | | 11,940 | | | | 66,443 | |
Sasol | | | 1,817 | | | | 55,421 | |
SPAR Group | | | 2,176 | | | | 30,837 | |
Standard Bank Group | | | 6,608 | | | | 90,510 | |
Telkom SOC | | | 17,847 | | | | 88,276 | |
Truworths International | | | 8,387 | | | | 43,276 | |
| | | | | | | | 1,786,755 | |
SOUTH KOREA — 0.9% | | | | | | | | |
Cheil Worldwide | | | 5,746 | | | | 128,082 | |
Daelim Industrial | | | 1,388 | | | | 115,647 | |
DB Insurance | | | 2,181 | | | | 140,545 | |
Doosan Bobcat | | | 3,941 | | | | 111,621 | |
Fila Korea | | | 2,785 | | | | 137,627 | |
GS Engineering & Construction | | | 3,280 | | | | 125,319 | |
GS Retail | | | 1,752 | | | | 60,325 | |
Hankook Tire | | | 785 | | | | 29,827 | |
Hanon Systems | | | 2,048 | | | | 22,666 | |
Hyundai Department Store | | | 1,094 | | | | 94,236 | |
Hyundai Engineering & Construction | | | 2,863 | | | | 146,261 | |
Hyundai Glovis | | | 552 | | | | 68,450 | |
Hyundai Marine & Fire Insurance | | | 1,633 | | | | 54,553 | |
Industrial Bank of Korea | | | 3,863 | | | | 47,893 | |
Kangwon Land * | | | 1,460 | | | | 40,147 | |
Kia Motors | | | 5,814 | | | | 188,478 | |
Korea Gas | | | 1,156 | | | | 51,492 | |
Korea Zinc * | | | 231 | | | | 93,395 | |
The accompanying notes are an integral part of the financial statements.
29
SYMMETRY PANORAMIC INTERNATIONAL EQUITY FUND
FEBRUARY 28, 2019
(Unaudited)
COMMON STOCK — continued | | | | | | | | |
| | | Shares | | | Value | |
SOUTH KOREA — continued | | | | | | | | |
Korean Air Lines * | | | 1,454 | | | $ | 47,630 | |
KT&G | | | 1,385 | | | | 129,352 | |
Kumho Petrochemical | | | 252 | | | | 21,428 | |
LG Uplus | | | 11,212 | | | | 149,714 | |
NCSoft | | | 252 | | | | 103,335 | |
Ottogi | | | 36 | | | | 24,458 | |
Samsung Electro-Mechanics | | | 1,747 | | | | 166,964 | |
SK Hynix | | | 2,224 | | | | 138,379 | |
SK Telecom | | | 955 | | | | 220,801 | |
| | | | | | | | 2,658,625 | |
SPAIN — 0.5% | | | | | | | | |
ACS Actividades de Construccion y Servicios | | | 3,792 | | | | 167,981 | |
Amadeus IT Group | | | 2,518 | | | | 189,598 | |
Enagas | | | 4,364 | | | | 124,320 | |
Endesa | | | 9,090 | | | | 229,056 | |
Iberdrola | | | 23,846 | | | | 199,484 | |
International Consolidated Airlines Group | | | 25,274 | | | | 199,939 | |
Mapfre | | | 23,883 | | | | 67,471 | |
Red Electrica | | | 6,987 | | | | 150,977 | |
Telefonica | | | 23,359 | | | | 201,625 | |
| | | | | | | | 1,530,451 | |
SWEDEN — 0.6% | | | | | | | | |
Alfa Laval | | | 4,528 | | | | 98,978 | |
Hexagon, Cl B | | | 1,647 | | | | 86,679 | |
Investor, Cl B | | | 5,844 | | | | 261,088 | |
Lundin Petroleum | | | 4,564 | | | | 149,646 | |
Securitas, Cl B | | | 7,272 | | | | 113,987 | |
Swedbank | | | 7,849 | | | | 144,297 | |
Swedish Match | | | 3,130 | | | | 146,765 | |
Tele2, Cl B | | | 6,590 | | | | 86,773 | |
Telefonaktiebolaget LM Ericsson, Cl B | | | 28,160 | | | | 257,347 | |
Telia | | | 49,931 | | | | 216,789 | |
| | | | | | | | 1,562,349 | |
SWITZERLAND — 1.5% | | | | | | | | |
Baloise Holding | | | 261 | | | | 42,622 | |
Chocoladefabriken Lindt & Spruengli | | | 25 | | | | 162,368 | |
Nestle | | | 6,356 | | | | 574,742 | |
Novartis | | | 12,986 | | | | 1,182,187 | |
The accompanying notes are an integral part of the financial statements.
30
SYMMETRY PANORAMIC INTERNATIONAL EQUITY FUND
FEBRUARY 28, 2019
(Unaudited)
COMMON STOCK — continued | | | | | | | | |
| | | Shares | | | Value | |
SWITZERLAND — continued | | | | | | | | |
Partners Group Holding | | | 411 | | | $ | 297,013 | |
Roche Holding | | | 4,454 | | | | 1,236,832 | |
Sonova Holding | | | 198 | | | | 37,001 | |
Swatch Group | | | 184 | | | | 54,301 | |
Swiss Life Holding | | | 588 | | | | 256,352 | |
Zurich Insurance Group | | | 1,668 | | | | 551,664 | |
| | | | | | | | 4,395,082 | |
TAIWAN — 1.8% | | | | | | | | |
Acer | | | 72,000 | | | | 47,639 | |
ASE Technology Holding | | | 83,000 | | | | 169,268 | |
Asia Cement | | | 92,000 | | | | 116,037 | |
AU Optronics | | | 196,000 | | | | 72,131 | |
Chailease Holding | | | 37,000 | | | | 145,448 | |
Chang Hwa Commercial Bank | | | 171,000 | | | | 102,603 | |
China Life Insurance | | | 49,000 | | | | 45,773 | |
China Steel | | | 199,000 | | | | 164,611 | |
CTBC Financial Holding | | | 145,000 | | | | 98,161 | |
Delta Electronics | | | 9,000 | | | | 44,916 | |
E.Sun Financial Holding | | | 214,000 | | | | 153,433 | |
Eclat Textile | | | 9,000 | | | | 103,199 | |
Eva Airways | | | 164,000 | | | | 82,333 | |
Far Eastern New Century | | | 25,000 | | | | 24,759 | |
Feng TAY Enterprise | | | 19,000 | | | | 119,396 | |
Formosa Chemicals & Fibre | | | 59,000 | | | | 201,926 | |
Formosa Petrochemical | | | 22,000 | | | | 83,140 | |
Formosa Taffeta | | | 65,000 | | | | 74,878 | |
Fubon Financial Holding | | | 31,000 | | | | 45,805 | |
Inventec | | | 55,000 | | | | 42,526 | |
Lite-On Technology | | | 46,000 | | | | 66,535 | |
Mega Financial Holding | | | 186,000 | | | | 164,535 | |
Micro-Star International | | | 5,000 | | | | 13,257 | |
Nan Ya Plastics | | | 18,000 | | | | 44,889 | |
Novatek Microelectronics | | | 30,000 | | | | 166,357 | |
Phison Electronics | | | 6,000 | | | | 54,563 | |
President Chain Store | | | 14,000 | | | | 144,907 | |
Realtek Semiconductor | | | 27,000 | | | | 155,390 | |
Ruentex Industries | | | 37,000 | | | | 97,935 | |
SinoPac Financial Holdings | | | 246,000 | | | | 85,823 | |
The accompanying notes are an integral part of the financial statements.
31
SYMMETRY PANORAMIC INTERNATIONAL EQUITY FUND
FEBRUARY 28, 2019
(Unaudited)
COMMON STOCK — continued | | | | | | | | |
| | | Shares | | | Value | |
TAIWAN — continued | | | | | | | | |
Taiwan Business Bank | | | 329,000 | | | $ | 121,214 | |
Taiwan Cement | | | 128,000 | | | | 159,860 | |
Taiwan Cooperative Financial Holding | | | 132,000 | | | | 81,898 | |
Taiwan Semiconductor Manufacturing ADR | | | 26,468 | | | | 1,033,575 | |
Uni-President Enterprises | | | 95,000 | | | | 231,561 | |
United Microelectronics | | | 52,000 | | | | 19,349 | |
Vanguard International Semiconductor | | | 29,000 | | | | 64,983 | |
Walsin Technology | | | 19,000 | | | | 111,585 | |
WPG Holdings | | | 8,000 | | | | 10,345 | |
Yageo | | | 11,000 | | | | 123,663 | |
Yuanta Financial Holding | | | 304,000 | | | | 172,195 | |
Zhen Ding Technology Holding | | | 50,000 | | | | 145,516 | |
| | | | | | | | 5,207,917 | |
THAILAND — 0.5% | | | | | | | | |
Advanced Info Service NVDR | | | 6,200 | | | | 35,789 | |
Bangkok Bank NVDR | | | 27,000 | | | | 179,078 | |
Bangkok Dusit Medical Services NVDR | | | 197,400 | | | | 147,814 | |
Home Product Center NVDR | | | 263,200 | | | | 125,188 | |
IRPC NVDR | | | 295,400 | | | | 55,164 | |
Krung Thai Bank NVDR | | | 207,200 | | | | 126,663 | |
Land & Houses NVDR | | | 253,100 | | | | 84,288 | |
PTT NVDR | | | 192,500 | | | | 295,010 | |
PTT Exploration & Production NVDR | | | 42,800 | | | | 169,327 | |
PTT Global Chemical NVDR | | | 41,000 | | | | 93,331 | |
Siam Commercial Bank NVDR | | | 34,800 | | | | 147,319 | |
| | | | | | | | 1,458,971 | |
TURKEY — 0.0% | | | | | | | | |
Eregli Demir ve Celik Fabrikalari | | | 6,222 | | | | 10,857 | |
TAV Havalimanlari Holding | | | 4,237 | | | | 22,134 | |
Turk Hava Yollari AO * | | | 10,395 | | | | 27,463 | |
| | | | | | | | 60,454 | |
UNITED KINGDOM — 1.8% | | | | | | | | |
Admiral Group | | | 804 | | | | 23,284 | |
Anglo American | | | 10,087 | | | | 267,953 | |
Auto Trader Group | | | 15,035 | | | | 94,836 | |
Barratt Developments | | | 7,989 | | | | 63,497 | |
BHP Group | | | 22,012 | | | | 510,059 | |
BP | | | 96,783 | | | | 687,132 | |
The accompanying notes are an integral part of the financial statements.
32
SYMMETRY PANORAMIC INTERNATIONAL EQUITY FUND
FEBRUARY 28, 2019
(Unaudited)
COMMON STOCK — continued | | | | | | | | |
| | | Shares | | | Value | |
UNITED KINGDOM — continued | | | | | | | | |
Bunzl | | | 2,289 | | | $ | 72,053 | |
Burberry Group | | | 5,893 | | | | 147,992 | |
Centrica | | | 48,979 | | | | 80,889 | |
Compass Group | | | 6,008 | | | | 132,709 | |
Croda International | | | 741 | | | | 47,296 | |
Diageo | | | 3,834 | | | | 148,439 | |
Experian | | | 5,803 | | | | 151,193 | |
GlaxoSmithKline | | | 8,173 | | | | 162,589 | |
J Sainsbury | | | 26,283 | | | | 79,954 | |
Johnson Matthey | | | 834 | | | | 34,211 | |
Marks & Spencer Group | | | 7,145 | | | | 25,839 | |
Mondi | | | 3,769 | | | | 86,433 | |
National Grid | | | 10,752 | | | | 121,076 | |
Next | | | 1,325 | | | | 89,392 | |
Pearson | | | 9,251 | | | | 103,922 | |
Persimmon | | | 1,875 | | | | 60,501 | |
Rio Tinto | | | 6,334 | | | | 364,516 | |
Royal Dutch Shell, Cl A | | | 34,513 | | | | 1,074,485 | |
Royal Mail | | | 5,486 | | | | 20,557 | |
Segro ‡ | | | 1,769 | | | | 15,509 | |
Smith & Nephew | | | 8,496 | | | | 161,919 | |
Tesco | | | 47,089 | | | | 141,074 | |
United Utilities Group | | | 2,495 | | | | 27,804 | |
Whitbread | | | 2,147 | | | | 138,291 | |
| | | | | | | | 5,135,404 | |
UNITED STATES — 0.1% | | | | | | | | |
FINANCIALS — 0.1% | | | | | | | | |
Credicorp | | | 852 | | | | 207,113 | |
| | | | | | | | | |
Total Common Stock | | | | | | | | |
(Cost $77,995,382) | | | | | | | 81,512,501 | |
| | | | | | | | | |
PREFERRED STOCK — 0.4% | | | | | | | | |
| | | | | | | | | |
BRAZIL — 0.4% (A) | | | | | | | | |
Braskem | | | 4,700 | | | | 67,945 | |
Cia Brasileira de Distribuicao | | | 1,300 | | | | 32,232 | |
Gerdau | | | 21,500 | | | | 86,603 | |
Petroleo Brasileiro | | | 103,900 | | | | 744,919 | |
The accompanying notes are an integral part of the financial statements.
33
SYMMETRY PANORAMIC INTERNATIONAL EQUITY FUND
FEBRUARY 28, 2019
(Unaudited)
PREFERRED STOCK — continued | | | | | | | | |
| | | Shares | | | Value | |
BRAZIL — continued | | | | | | | | |
Telefonica Brasil | | | 12,300 | | | $ | 153,907 | |
Total Preferred Stock | | | | | | | | |
(Cost $1,008,625) | | | | | | | 1,085,606 | |
| | | | | | | | | |
RIGHTS — 0.0% | | | | | | | | |
| | | Number Of
Rights | | | | | |
CTBC Financial Holding ‡‡ | | | 282 | | | | — | |
| | | | | | | | | |
(Cost $–) | | | | | | | — | |
| | | | | | | | | |
SHORT-TERM INVESTMENT — 4.3% | | | | | | | | |
| | | | | | | | | |
Invesco Government & Agency Portfolio, Cl Institutional, 2.300% (B) | | | | | | | | |
(Cost $12,333,739) | | | 12,333,739 | | | | 12,333,739 | |
Total Investments — 99.9% | | | | | | | | |
(Cost $273,448,995) | | | | | | $ | 283,457,790 | |
Percentages are based on Net Assets of $283,707,356
A list of the open futures contracts held by the Fund at February 28, 2019, is as follows:
Type of
Contract | Number of
Contracts
Long | Expiration
Date | | Notional
Amount | | | Value | | | Unrealized
Appreciation | |
MSCI EAFE Index E-MINI | 10 | Mar-2019 | | $ | 925,322 | | | $ | 934,500 | | | $ | 9,178 | |
MSCI Emerging Markets | 22 | Mar-2019 | | | 1,073,904 | | | | 1,151,370 | | | | 77,466 | |
S&P TSX 60 Index | 8 | Mar-2019 | | | 1,073,697 | | | | 1,157,977 | | | | 74,250 | |
SGX Nifty 50 | 143 | Mar-2019 | | | 3,106,315 | | | | 3,108,820 | | | | 2,505 | |
| | | | | $ | 6,179,238 | | | $ | 6,352,667 | | | $ | 163,399 | |
Open total return swap agreements held by the Fund at February 28, 2019 are as follows:
Counterparty | Reference
Entity/
Obligation | Fund Pays | Fund
Receives | Payment
Frequency | Termination
Date | Currency | | Notional
Amount | | | Value | | | Net
Unrealized
Appreciation | |
ReFlow | SPILX NAV | SOFR +35 bps | SPILX | Annually | 02/05/2020 | USD | | | 5,598,698 | | | $ | 27,223 | | | $ | 27,223 | |
The accompanying notes are an integral part of the financial statements.
34
SYMMETRY PANORAMIC INTERNATIONAL EQUITY FUND
FEBRUARY 28, 2019
(Unaudited)
* | Non-income producing security. |
‡ | Real Estate Investment Trust |
‡‡ | Expiration date not available. |
(B) | The rate reported is the 7-day effective yield as of February 28, 2019. |
ADR — American Depositary Receipt
BPS — Basis Points
Cl — Class
EAFE — Europe, Australasia and Far East
ETF — Exchange-Traded Fund
MIN — Minimum
MSCI — Morgan Stanley Capital International
NVDR— Non-Voting Depository Receipt
S&P— Standard & Poor's
SGX — Singapore Exchange
SOFR — Secured Overnight Financing Rate
SPILX — Symmetry Panoramic International Equity Fund
TSX — Toronto Stock Exchange
USD — United States Dollar
VOL — Volatility
The following table summarizes the inputs used as of February 28, 2019, in valuing the Fund’s investments and other financial instruments carried at value:
Investments in Securities | | Level 1 | | | Level 2 | | | Level 3 | | | Total | |
Registered Investment Companies | | $ | 188,525,944 | | | $ | — | | | $ | — | | | $ | 188,525,944 | |
Common Stock | | | | | | | | | | | | | | | | |
Australia | | | — | | | | 3,224,771 | | | | — | | | | 3,224,771 | |
Belgium | | | — | | | | 471,443 | | | | — | | | | 471,443 | |
Brazil | | | 3,484,712 | | | | — | | | | — | | | | 3,484,712 | |
Canada | | | 3,616,385 | | | | — | | | | — | | | | 3,616,385 | |
China | | | — | | | | 524,064 | | | | — | | | | 524,064 | |
Denmark | | | — | | | | 564,844 | | | | — | | | | 564,844 | |
Finland | | | — | | | | 770,930 | | | | — | | | | 770,930 | |
France | | | — | | | | 2,635,121 | | | | — | | | | 2,635,121 | |
Germany | | | — | | | | 3,203,067 | | | | — | | | | 3,203,067 | |
Hong Kong | | | — | | | | 13,964,655 | | | | — | | | | 13,964,655 | |
Hungary | | | — | | | | 196,249 | | | | — | | | | 196,249 | |
Indonesia | | | — | | | | 749,564 | | | | — | | | | 749,564 | |
Italy | | | — | | | | 992,328 | | | | — | | | | 992,328 | |
Japan | | | — | | | | 16,258,760 | | | | — | | | | 16,258,760 | |
Malaysia | | | — | | | | 1,767,820 | | | | — | | | | 1,767,820 | |
Mexico | | | 529,443 | | | | — | | | | — | | | | 529,443 | |
Netherlands | | | — | | | | 1,941,449 | | | | — | | | | 1,941,449 | |
Norway | | | — | | | | 661,349 | | | | — | | | | 661,349 | |
Philippines | | | — | | | | 198,889 | | | | — | | | | 198,889 | |
The accompanying notes are an integral part of the financial statements.
35
SYMMETRY PANORAMIC INTERNATIONAL EQUITY FUND
FEBRUARY 28, 2019
(Unaudited)
Investments in Securities | | Level 1 | | | Level 2 | | | Level 3 | | | Total | |
Poland | | $ | — | | | $ | 537,328 | | | $ | — | | | $ | 537,328 | |
Portugal | | | — | | | | 183,640 | | | | — | | | | 183,640 | |
Singapore | | | — | | | | 1,032,569 | | | | — | | | | 1,032,569 | |
South Africa | | | 91,538 | | | | 1,695,217 | | | | — | | | | 1,786,755 | |
South Korea | | | — | | | | 2,658,625 | | | | — | | | | 2,658,625 | |
Spain | | | — | | | | 1,530,451 | | | | — | | | | 1,530,451 | |
Sweden | | | — | | | | 1,562,349 | | | | — | | | | 1,562,349 | |
Switzerland | | | — | | | | 4,395,082 | | | | — | | | | 4,395,082 | |
Taiwan | | | 1,033,575 | | | | 4,174,342 | | | | — | | | | 5,207,917 | |
Thailand | | | — | | | | 1,458,971 | | | | — | | | | 1,458,971 | |
Turkey | | | — | | | | 60,454 | | | | — | | | | 60,454 | |
United Kingdom | | | — | | | | 5,135,404 | | | | — | | | | 5,135,404 | |
United States | | | 207,113 | | | | — | | | | — | | | | 207,113 | |
Total Common Stock | | | 8,962,766 | | | | 72,549,735 | | | | — | | | | 81,512,501 | |
Preferred Stock | | | | | | | | | | | | | | | | |
Brazil | | | 1,085,606 | | | | — | | | | — | | | | 1,085,606 | |
Rights | | | — | | | | — | | | | — | | | | — | |
Short-Term Investment | | | 12,333,739 | | | | — | | | | — | | | | 12,333,739 | |
Total Investments in Securities | | $ | 210,908,055 | | | $ | 72,549,735 | | | $ | — | | | $ | 283,457,790 | |
Other Financial Instruments | | Level 1 | | | Level 2 | | | Level 3 | | | Total | |
Futures Contracts^ | | | | | | | | | | | | | | | | |
Unrealized Appreciation | | $ | 163,399 | | | $ | — | | | $ | — | | | $ | 163,399 | |
Total Return Swap^ | | | | | | | | | | | | | | | | |
Unrealized Appreciation | | | — | | | | 27,223 | | | | — | | | | 27,223 | |
Total Other Financial Instruments | | $ | 163,399 | | | $ | 27,223 | | | $ | — | | | $ | 190,622 | |
^ | Futures contracts and swap contracts are valued at the unrealized appreciation on the instrument. |
Amounts designated as “— ” are $0.
Transfers between investment levels may occur as markets fluctuate and/or the availability of data used in an investment’s valuation changes. The Fund generally recognizes transfers between the levels as of the end of the reporting period. As of February 28, 2019, securities with a total value of $72,549,735 were classified as Level 2 as a result of fair valuation of foreign securities. For the period ended February 28, 2019, there were no transfers between Levels.
For the period ended February 28, 2019, there were no Level 3 securities.
For more information on valuation inputs, see Note 2 – Significant Accounting Policies in the Notes to Financial Statements.
The accompanying notes are an integral part of the financial statements.
36
SYMMETRY PANORAMIC GLOBAL EQUITY FUND
FEBRUARY 28, 2019
(Unaudited)

†Percentages are based on total investments.
SCHEDULE OF INVESTMENTS |
REGISTERED INVESTMENT COMPANIES — 70.8% |
| | | Shares | | | Value | |
DFA Emerging Markets Core Equity Portfolio, Cl I | | | 2,244,558 | | | $ | 46,439,895 | |
DFA International Core Equity Portfolio, Cl I.. | | | 1,644,870 | | | | 21,218,822 | |
DFA International Real Estate Securities, Cl I.. | | | 2,849,794 | | | | 14,163,477 | |
DFA International Vector Equity Portfolio, Cl I | | | 4,133,253 | | | | 47,408,413 | |
DFA Real Estate Securities Portfolio, Cl I | | | 604,304 | | | | 22,141,699 | |
DFA US Core Equity 2 Portfolio, Cl I | | | 3,966,907 | | | | 85,367,841 | |
DFA US Vector Equity Portfolio, Cl I | | | 4,835,753 | | | | 88,736,074 | |
iShares Edge MSCI Min Vol Global ETF | | | 603,677 | | | | 52,888,142 | |
Total Registered Investment Companies | | | | | | | | |
(Cost $365,961,041) | | | | | | | 378,364,363 | |
| | | | | | | | | |
COMMON STOCK — 25.6% | | | | | | | | |
| | | | | | | | | |
AUSTRALIA — 0.5% | | | | | | | | |
Alumina | | | 49,385 | | | | 89,461 | |
Aristocrat Leisure | | | 2,330 | | | | 40,645 | |
BlueScope Steel | | | 1,345 | | | | 12,835 | |
Brambles | | | 15,789 | | | | 131,997 | |
CIMIC Group | | | 1,734 | | | | 61,682 | |
Coca-Cola Amatil | | | 10,927 | | | | 61,810 | |
Crown Resorts | | | 6,421 | | | | 52,296 | |
CSL | | | 2,554 | | | | 352,040 | |
Dexus ‡ | | | 16,870 | | | | 143,963 | |
Flight Centre Travel Group | | | 2,306 | | | | 74,786 | |
The accompanying notes are an integral part of the financial statements.
37
SYMMETRY PANORAMIC GLOBAL EQUITY FUND
FEBRUARY 28, 2019
(Unaudited)
COMMON STOCK — continued | | | | | | | | |
| | | Shares | | | Value | |
AUSTRALIA — continued | | | | | | | | |
Goodman Group ‡ | | | 21,902 | | | $ | 199,126 | |
GPT Group ‡ | | | 17,282 | | | | 71,744 | |
Macquarie Group | | | 2,570 | | | | 235,431 | |
Mirvac Group ‡ | | | 35,711 | | | | 65,146 | |
REA Group | | | 523 | | | | 30,365 | |
Santos | | | 13,347 | | | | 65,461 | |
Scentre Group ‡ | | | 34,204 | | | | 93,937 | |
South32 | | | 23,505 | | | | 65,278 | |
Suncorp Group | | | 4,119 | | | | 39,572 | |
Telstra | | | 58,547 | | | | 129,952 | |
Vicinity Centres ‡ | | | 16,001 | | | | 27,955 | |
Washington H Soul Pattinson | | | 1,186 | | | | 24,839 | |
Wesfarmers | | | 7,466 | | | | 176,230 | |
Woodside Petroleum | | | 3,573 | | | | 91,800 | |
Woolworths Group | | | 8,486 | | | | 172,893 | |
| | | | | | | | 2,511,244 | |
BELGIUM — 0.1% | | | | | | | | |
Colruyt | | | 2,428 | | | | 172,906 | |
UCB | | | 2,384 | | | | 199,698 | |
| | | | | | | | 372,604 | |
BRAZIL — 0.5% | | | | | | | | |
Atacadao Distribuicao Comercio e Industria Ltda | | | 9,600 | | | | 50,605 | |
Banco Bradesco ADR | | | 43,539 | | | | 499,828 | |
Banco do Brasil | | | 15,200 | | | | 204,763 | |
Banco Santander Brasil ADR | | | 8,035 | | | | 96,259 | |
Centrais Eletricas Brasileiras * | | | 3,700 | | | | 36,536 | |
Cia de Saneamento Basico do Estado de Sao Paulo ADR | | | 3,826 | | | | 39,791 | |
Cia Siderurgica Nacional | | | 8,900 | | | | 31,206 | |
Engie Brasil Energia | | | 5,900 | | | | 65,092 | |
IRB Brasil Resseguros S | | | 5,100 | | | | 121,154 | |
Itau Unibanco Holding ADR | | | 53,257 | | | | 500,616 | |
Itausa - Investimentos Itau | | | 68,800 | | | | 226,577 | |
JBS | | | 30,000 | | | | 108,063 | |
Natura Cosmeticos | | | 5,000 | | | | 64,135 | |
Petrobras Distribuidora | | | 8,600 | | | | 55,866 | |
Porto Seguro | | | 6,400 | | | | 95,485 | |
Sul America | | | 13,800 | | | | 112,644 | |
The accompanying notes are an integral part of the financial statements.
38
SYMMETRY PANORAMIC GLOBAL EQUITY FUND
FEBRUARY 28, 2019
(Unaudited)
COMMON STOCK — continued | | | | | | | | |
| | | Shares | | | Value | |
BRAZIL — continued | | | | | | | | |
Suzano Papel e Celulose | | | 7,700 | | | $ | 98,399 | |
TIM Participacoes ADR | | | 2,602 | | | | 41,059 | |
Vale ADR, Cl B | | | 23,705 | | | | 295,838 | |
| | | | | | | | 2,743,916 | |
CANADA — 0.5% | | | | | | | | |
Alimentation Couche-Tard, Cl B | | | 4,113 | | | | 231,818 | |
Bank of Montreal | | | 1,193 | | | | 93,032 | |
Bausch Health * | | | 3,923 | | | | 93,190 | |
CAE | | | 3,852 | | | | 81,229 | |
Cameco | | | 1,170 | | | | 13,577 | |
Canadian Imperial Bank of Commerce | | | 1,202 | | | | 101,964 | |
Canadian National Railway | | | 1,718 | | | | 147,419 | |
Canadian Pacific Railway | | | 864 | | | | 178,532 | |
Canadian Tire, Cl A | | | 267 | | | | 29,460 | |
CGI, Cl A * | | | 2,796 | | | | 187,462 | |
Empire | | | 4,726 | | | | 109,787 | |
Gildan Activewear | | | 1,615 | | | | 57,754 | |
H&R Real Estate Investment Trust ‡ | | | 3,484 | | | | 60,125 | |
Husky Energy | | | 5,135 | | | | 57,088 | |
Imperial Oil | | | 1,841 | | | | 49,846 | |
Magna International | | | 2,173 | | | | 114,665 | |
Methanex | | | 1,062 | | | | 59,776 | |
Metro, Cl A | | | 1,923 | | | | 72,276 | |
National Bank of Canada | | | 1,858 | | | | 87,665 | |
Open Text | | | 1,635 | | | | 61,973 | |
RioCan Real Estate Investment Trust ‡ | | | 2,250 | | | | 42,984 | |
Rogers Communications, Cl B | | | 4,799 | | | | 265,158 | |
Sun Life Financial | | | 2,483 | | | | 94,003 | |
Suncor Energy | | | 1,380 | | | | 47,568 | |
Toronto-Dominion Bank | | | 9,074 | | | | 520,327 | |
| | | | | | | | 2,858,678 | |
CHINA — 0.1% | | | | | | | | |
Kunlun Energy | | | 96,000 | | | | 105,715 | |
PetroChina, Cl H | | | 464,000 | | | | 306,146 | |
| | | | | | | | 411,861 | |
DENMARK — 0.1% | | | | | | | | |
Chr Hansen Holding | | | 231 | | | | 23,600 | |
Coloplast, Cl B | | | 743 | | | | 74,074 | |
The accompanying notes are an integral part of the financial statements.
39
SYMMETRY PANORAMIC GLOBAL EQUITY FUND
FEBRUARY 28, 2019
(Unaudited)
COMMON STOCK — continued | | | | | | | | |
| | | Shares | | | Value | |
DENMARK — continued | | | | | | | | |
DSV | | | 1,045 | | | $ | 87,015 | |
Orsted | | | 857 | | | | 62,220 | |
Tryg | | | 2,491 | | | | 67,880 | |
Vestas Wind Systems | | | 928 | | | | 77,315 | |
William Demant Holding * | | | 2,497 | | | | 75,013 | |
| | | | | | | | 467,117 | |
FINLAND — 0.1% | | | | | | | | |
Elisa | | | 1,625 | | | | 68,151 | |
Neste | | | 1,447 | | | | 139,404 | |
Nokia | | | 21,393 | | | | 129,307 | |
Orion, Cl B | | | 555 | | | | 19,819 | |
Stora Enso, Cl R | | | 3,925 | | | | 52,672 | |
UPM-Kymmene | | | 6,465 | | | | 195,183 | |
| | | | | | | | 604,536 | |
FRANCE — 0.4% | | | | | | | | |
Air Liquide | | | 300 | | | | 37,424 | |
Dassault Systemes | | | 311 | | | | 45,529 | |
Electricite de France | | | 11,945 | | | | 173,383 | |
EssilorLuxottica | | | 516 | | | | 62,435 | |
Eutelsat Communications | | | 3,117 | | | | 61,569 | |
Hermes International | | | 328 | | | | 207,838 | |
Ipsen | | | 140 | | | | 19,372 | |
Kering | | | 184 | | | | 100,505 | |
L'Oreal | | | 185 | | | | 46,674 | |
LVMH Moet Hennessy Louis Vuitton | | | 1,220 | | | | 418,797 | |
Peugeot | | | 4,351 | | | | 110,697 | |
Sanofi | | | 4,382 | | | | 366,102 | |
SCOR | | | 273 | | | | 12,295 | |
Teleperformance | | | 96 | | | | 17,153 | |
Thales | | | 212 | | | | 26,111 | |
TOTAL | | | 7,007 | | | | 398,578 | |
Ubisoft Entertainment * | | | 195 | | | | 14,081 | |
| | | | | | | | 2,118,543 | |
GERMANY — 0.5% | | | | | | | | |
adidas | | | 1,200 | | | | 291,825 | |
Allianz | | | 2,010 | | | | 447,734 | |
Aroundtown | | | 11,032 | | | | 92,983 | |
Brenntag | | | 1,258 | | | | 62,449 | |
The accompanying notes are an integral part of the financial statements.
40
SYMMETRY PANORAMIC GLOBAL EQUITY FUND
FEBRUARY 28, 2019
(Unaudited)
COMMON STOCK — continued | | | | | | | | |
| | | Shares | | | Value | |
GERMANY — continued | | | | | | | | |
Deutsche Boerse | | | 1,013 | | | $ | 128,180 | |
Deutsche Telekom | | | 12,909 | | | | 212,710 | |
Deutsche Wohnen | | | 4,166 | | | | 194,435 | |
E.ON | | | 9,525 | | | | 104,868 | |
Evonik Industries | | | 2,840 | | | | 80,025 | |
Hannover Rueck | | | 1,261 | | | | 187,766 | |
MTU Aero Engines | | | 573 | | | | 122,800 | |
Puma | | | 155 | | | | 87,428 | |
QIAGEN * | | | 1,696 | | | | 64,955 | |
RWE | | | 3,023 | | | | 73,793 | |
Vonovia | | | 4,172 | | | | 202,467 | |
Wirecard | | | 844 | | | | 116,170 | |
| | | | | | | | 2,470,588 | |
HONG KONG — 2.0% | | | | | | | | |
Agile Group Holdings | | | 50,000 | | | | 62,628 | |
Agricultural Bank of China, Cl H | | | 1,048,000 | | | | 502,294 | |
Air China, Cl H | | | 28,000 | | | | 30,353 | |
Angang Steel, Cl H | | | 28,000 | | | | 20,900 | |
Anhui Conch Cement, Cl H | | | 34,500 | | | | 197,228 | |
Bank of China, Cl H | | | 391,000 | | | | 182,413 | |
Bank of Communications, Cl H | | | 282,000 | | | | 236,857 | |
BOC Aviation | | | 8,300 | | | | 71,916 | |
China CITIC Bank, Cl H | | | 136,000 | | | | 88,456 | |
China Communications Services, Cl H | | | 120,000 | | | | 120,614 | |
China Construction Bank, Cl H | | | 930,000 | | | | 828,155 | |
China Everbright Bank, Cl H | | | 232,000 | | | | 111,255 | |
China Jinmao Holdings Group | | | 102,000 | | | | 49,601 | |
China Longyuan Power Group, Cl H | | | 124,000 | | | | 92,695 | |
China Mengniu Dairy | | | 20,000 | | | | 62,263 | |
China Merchants Bank, Cl H | | | 146,000 | | | | 671,490 | |
China Mobile | | | 59,000 | | | | 620,893 | |
China Oriental Group | | | 132,000 | | | | 88,685 | |
China Overseas Land & Investment | | | 60,000 | | | | 221,309 | |
China Petroleum & Chemical, Cl H | | | 392,000 | | | | 338,547 | |
China Railway Construction, Cl H | | | 97,000 | | | | 139,912 | |
China Railway Group, Cl H | | | 160,000 | | | | 158,859 | |
China Resources Beer Holdings | | | 20,000 | | | | 74,822 | |
China Resources Cement Holdings | | | 106,000 | | | | 113,221 | |
The accompanying notes are an integral part of the financial statements.
41
SYMMETRY PANORAMIC GLOBAL EQUITY FUND
FEBRUARY 28, 2019
(Unaudited)
COMMON STOCK — continued | | | | | | | | |
| | | Shares | | | Value | |
HONG KONG — continued | | | | | | | | |
China Resources Gas Group | | | 24,000 | | | $ | 104,371 | |
China Resources Land | | | 44,000 | | | | 164,650 | |
China Resources Pharmaceutical Group | | | 58,000 | | | | 77,881 | |
China Resources Power Holdings | | | 52,000 | | | | 98,663 | |
China Shenhua Energy, Cl H | | | 24,500 | | | | 60,437 | |
China Telecom, Cl H | | | 300,000 | | | | 162,454 | |
China Unicom Hong Kong | | | 22,000 | | | | 26,084 | |
China Vanke, Cl H | | | 4,400 | | | | 16,726 | |
CITIC | | | 82,000 | | | | 124,983 | |
CK Asset Holdings | | | 1,500 | | | | 12,448 | |
CLP Holdings | | | 15,000 | | | | 177,724 | |
CNOOC | | | 187,000 | | | | 322,120 | |
CRRC | | | 42,000 | | | | 44,097 | |
CSPC Pharmaceutical Group | | | 42,000 | | | | 71,855 | |
ENN Energy Holdings | | | 8,800 | | | | 90,832 | |
Far East Horizon | | | 62,000 | | | | 69,420 | |
Future Land Development Holdings | | | 126,000 | | | | 109,125 | |
Guangdong Investment | | | 70,000 | | | | 134,436 | |
Haier Electronics Group | | | 7,000 | | | | 20,961 | |
Hang Seng Bank | | | 1,600 | | | | 39,659 | |
Henderson Land Development | | | 7,000 | | | | 39,668 | |
Hong Kong & China Gas | | | 70,000 | | | | 162,138 | |
Hua Hong Semiconductor | | | 44,000 | | | | 103,266 | |
Huadian Power International, Cl H | | | 114,000 | | | | 50,052 | |
Hysan Development | | | 13,000 | | | | 68,770 | |
Industrial & Commercial Bank of China, Cl H | | | 953,000 | | | | 733,942 | |
Jiayuan International Group | | | 72,000 | | | | 35,183 | |
Legend Holdings, Cl H | | | 7,600 | | | | 21,218 | |
Link ‡ | | | 17,500 | | | | 197,897 | |
Logan Property Holdings | | | 72,000 | | | | 102,894 | |
Longfor Group Holdings | | | 39,000 | | | | 116,266 | |
Luye Pharma Group | | | 88,500 | | | | 66,310 | |
Maanshan Iron & Steel, Cl H | | | 178,000 | | | | 85,024 | |
MMG * | | | 48,000 | | | | 22,838 | |
New World Development | | | 28,000 | | | | 44,771 | |
NWS Holdings | | | 40,000 | | | | 96,910 | |
Ping An Insurance Group of China, Cl H | | | 11,500 | | | | 121,418 | |
Postal Savings Bank of China, Cl H | | | 204,000 | | | | 122,374 | |
The accompanying notes are an integral part of the financial statements.
42
SYMMETRY PANORAMIC GLOBAL EQUITY FUND
FEBRUARY 28, 2019
(Unaudited)
COMMON STOCK — continued | | | | | | | | |
| | | Shares | | | Value | |
HONG KONG — continued | | | | | | | | |
Shandong Weigao Group Medical Polymer, Cl H | | | 64,000 | | | $ | 55,759 | |
Shenzhen International Holdings | | | 11,000 | | | | 22,755 | |
Shenzhou International Group Holdings | | | 4,000 | | | | 50,099 | |
Shimao Property Holdings | | | 42,000 | | | | 99,579 | |
Sino Biopharmaceutical | | | 71,000 | | | | 61,748 | |
Sino Land | | | 58,000 | | | | 108,222 | |
Sinopec Engineering Group, Cl H | | | 81,500 | | | | 74,215 | |
Sinopec Shanghai Petrochemical, Cl H | | | 80,000 | | | | 40,688 | |
Sinopharm Group, Cl H | | | 7,600 | | | | 33,859 | |
Sinotruk Hong Kong | | | 64,500 | | | | 117,767 | |
SJM Holdings | | | 73,000 | | | | 82,307 | |
SSY Group | | | 94,000 | | | | 83,604 | |
Sun Art Retail Group | | | 23,000 | | | | 23,399 | |
Sun Hung Kai Properties | | | 6,000 | | | | 99,461 | |
Swire Properties | | | 36,000 | | | | 144,480 | |
Techtronic Industries | | | 6,000 | | | | 40,260 | |
Tingyi Cayman Islands Holding | | | 22,000 | | | | 30,599 | |
Uni-President China Holdings | | | 55,000 | | | | 49,234 | |
Weichai Power, Cl H | | | 113,000 | | | | 157,422 | |
Wharf Real Estate Investment | | | 12,000 | | | | 84,378 | |
Yanzhou Coal Mining, Cl H | | | 22,000 | | | | 21,910 | |
Yihai International Holding | | | 4,000 | | | | 12,679 | |
Yuexiu Property | | | 276,000 | | | | 63,715 | |
Zijin Mining Group, Cl H | | | 184,000 | | | | 78,930 | |
| | | | | | | | 10,842,300 | |
HUNGARY — 0.0% | | | | | | | | |
MOL Hungarian Oil & Gas | | | 12,485 | | | | 145,713 | |
| | | | | | | | | |
INDONESIA — 0.1% | | | | | | | | |
Adaro Energy | | | 277,400 | | | | 25,818 | |
Astra International | | | 123,100 | | | | 62,312 | |
Bank Negara Indonesia Persero | | | 98,800 | | | | 61,433 | |
Bank Rakyat Indonesia Persero | | | 208,700 | | | | 57,036 | |
Bukit Asam | | | 262,700 | | | | 74,428 | |
Charoen Pokphand Indonesia | | | 240,500 | | | | 125,137 | |
Gudang Garam | | | 6,500 | | | | 39,423 | |
Indah Kiat Pulp & Paper | | | 113,400 | | | | 89,041 | |
United Tractors | | | 26,000 | | | | 49,144 | |
| | | | | | | | 583,772 | |
The accompanying notes are an integral part of the financial statements.
43
SYMMETRY PANORAMIC GLOBAL EQUITY FUND
FEBRUARY 28, 2019
(Unaudited)
COMMON STOCK — continued | | | | | | | | |
| | | Shares | | | Value | |
ITALY — 0.1% | | | | | | | | |
Assicurazioni Generali | | | 4,474 | | | $ | 79,855 | |
Davide Campari-Milano | | | 3,683 | | | | 35,126 | |
Enel | | | 18,935 | | | | 114,576 | |
Eni | | | 17,358 | | | | 299,598 | |
Moncler | | | 2,315 | | | | 88,889 | |
Poste Italiane | | | 10,895 | | | | 98,241 | |
Terna Rete Elettrica Nazionale | | | 11,577 | | | | 72,032 | |
| | | | | | | | 788,317 | |
JAPAN — 2.4% | | | | | | | | |
ABC-Mart | | | 1,200 | | | | 68,744 | |
Aeon | | | 5,200 | | | | 109,633 | |
Aeon Mall | | | 900 | | | | 14,698 | |
AGC | | | 1,500 | | | | 52,052 | |
Alfresa Holdings | | | 4,000 | | | | 115,960 | |
Alps Alpine | | | 700 | | | | 13,771 | |
Asahi Intecc | | | 1,300 | | | | 62,441 | |
Asahi Kasei | | | 6,400 | | | | 69,988 | |
Astellas Pharma | | | 12,900 | | | | 199,603 | |
Bandai Namco Holdings | | | 3,600 | | | | 153,286 | |
Bridgestone | | | 400 | | | | 15,812 | |
Casio Computer | | | 2,700 | | | | 36,731 | |
Central Japan Railway | | | 1,300 | | | | 292,250 | |
Chubu Electric Power | | | 7,200 | | | | 113,589 | |
Chugai Pharmaceutical | | | 2,600 | | | | 177,291 | |
CyberAgent | | | 700 | | | | 21,606 | |
Dai Nippon Printing | | | 2,600 | | | | 60,335 | |
Daicel | | | 4,600 | | | | 48,369 | |
Dai-ichi Life Holdings | | | 2,500 | | | | 38,089 | |
Daiichi Sankyo | | | 4,000 | | | | 150,055 | |
Daikin Industries | | | 600 | | | | 65,334 | |
Dentsu | | | 2,000 | | | | 83,716 | |
East Japan Railway | | | 200 | | | | 19,173 | |
Eisai | | | 2,100 | | | | 173,767 | |
FamilyMart UNY Holdings | | | 2,400 | | | | 68,470 | |
Fast Retailing | | | 300 | | | | 141,061 | |
Fuji Electric | | | 1,100 | | | | 34,689 | |
FUJIFILM Holdings | | | 3,200 | | | | 143,782 | |
Fujitsu | | | 500 | | | | 33,782 | |
The accompanying notes are an integral part of the financial statements.
44
SYMMETRY PANORAMIC GLOBAL EQUITY FUND
FEBRUARY 28, 2019
(Unaudited)
COMMON STOCK — continued | | | | | | | | |
| | | Shares | | | Value | |
JAPAN — continued | | | | | | | | |
Fukuoka Financial Group | | | 1,200 | | | $ | 25,999 | |
Hakuhodo DY Holdings | | | 6,000 | | | | 92,310 | |
Hamamatsu Photonics | | | 500 | | | | 17,629 | |
Hikari Tsushin | | | 400 | | | | 71,693 | |
Hisamitsu Pharmaceutical | | | 500 | | | | 24,710 | |
Hitachi High-Technologies | | | 800 | | | | 30,479 | |
Honda Motor | | | 2,200 | | | | 62,433 | |
Hoya | | | 2,700 | | | | 165,409 | |
Idemitsu Kosan | | | 1,500 | | | | 53,103 | |
Isuzu Motors | | | 7,600 | | | | 109,405 | |
ITOCHU | | | 9,100 | | | | 163,461 | |
Japan Airlines | | | 4,400 | | | | 160,559 | |
Japan Airport Terminal | | | 900 | | | | 35,858 | |
Japan Post Holdings | | | 16,200 | | | | 197,212 | |
Japan Prime Realty Investment ‡ | | | 18 | | | | 70,658 | |
Japan Real Estate Investment ‡ | | | 17 | | | | 98,420 | |
JFE Holdings | | | 700 | | | | 12,243 | |
JSR | | | 1,000 | | | | 16,634 | |
JTEKT | | | 1,300 | | | | 16,174 | |
JXTG Holdings | | | 10,600 | | | | 49,520 | |
Kakaku.com | | | 3,600 | | | | 69,313 | |
Kamigumi | | | 1,500 | | | | 34,827 | |
Kaneka | | | 1,700 | | | | 66,680 | |
Kansai Electric Power | | | 7,000 | | | | 105,091 | |
Kao | | | 2,000 | | | | 151,645 | |
KDDI | | | 7,100 | | | | 171,543 | |
Keihan Holdings | | | 2,300 | | | | 95,207 | |
Kikkoman | | | 1,900 | | | | 94,997 | |
Kobayashi Pharmaceutical | | | 300 | | | | 24,232 | |
Konica Minolta | | | 9,000 | | | | 87,687 | |
Kose | | | 300 | | | | 48,681 | |
Kyocera | | | 300 | | | | 16,610 | |
Kyowa Hakko Kirin | | | 1,500 | | | | 28,775 | |
Kyushu Railway | | | 3,500 | | | | 119,634 | |
Lion | | | 1,100 | | | | 22,557 | |
Makita | | | 900 | | | | 31,900 | |
Marubeni | | | 17,900 | | | | 128,163 | |
Marui Group | | | 2,400 | | | | 42,262 | |
The accompanying notes are an integral part of the financial statements.
45
SYMMETRY PANORAMIC GLOBAL EQUITY FUND
FEBRUARY 28, 2019
(Unaudited)
COMMON STOCK — continued | | | | | | | | |
| | | Shares | | | Value | |
JAPAN — continued | | | | | | | | |
Maruichi Steel Tube | | | 1,100 | | | $ | 33,151 | |
Medipal Holdings | | | 5,000 | | | | 116,660 | |
MEIJI Holdings | | | 200 | | | | 15,857 | |
MINEBEA MITSUMI | | | 900 | | | | 14,474 | |
Mitsubishi | | | 9,000 | | | | 254,491 | |
Mitsubishi Heavy Industries | | | 600 | | | | 24,453 | |
Mitsubishi UFJ Lease & Finance | | | 10,700 | | | | 54,524 | |
Mitsui | | | 11,600 | | | | 182,609 | |
Mitsui Fudosan | | | 2,400 | | | | 56,916 | |
Mizuho Financial Group | | | 124,500 | | | | 196,189 | |
Murata Manufacturing | | | 900 | | | | 140,820 | |
NGK Spark Plug | | | 3,200 | | | | 68,242 | |
Nikon | | | 2,100 | | | | 31,932 | |
Nippon Building Fund ‡ | | | 26 | | | | 169,212 | |
Nippon Telegraph & Telephone | | | 5,000 | | | | 215,828 | |
Nissan Chemical | | | 1,900 | | | | 95,937 | |
Nissan Motor | | | 10,600 | | | | 91,702 | |
Nisshin Seifun Group | | | 1,500 | | | | 32,220 | |
Nomura Research Institute | | | 800 | | | | 32,590 | |
NTT Data | | | 7,600 | | | | 83,314 | |
Obic | | | 1,000 | | | | 95,691 | |
Oji Holdings | | | 11,800 | | | | 70,378 | |
Ono Pharmaceutical | | | 1,200 | | | | 24,648 | |
Oriental Land | | | 800 | | | | 88,069 | |
ORIX | | | 5,800 | | | | 84,138 | |
Otsuka | | | 700 | | | | 25,202 | |
Otsuka Holdings | | | 700 | | | | 29,242 | |
Park24 | | | 2,500 | | | | 60,129 | |
Recruit Holdings | | | 7,500 | | | | 210,472 | |
Resona Holdings | | | 17,700 | | | | 80,293 | |
Ricoh | | | 3,900 | | | | 39,679 | |
Rohm | | | 200 | | | | 12,637 | |
Sankyo | | | 2,800 | | | | 103,185 | |
Santen Pharmaceutical | | | 1,400 | | | | 21,886 | |
Secom | | | 1,600 | | | | 138,439 | |
Sega Sammy Holdings | | | 2,000 | | | | 23,252 | |
Seven & i Holdings | | | 5,200 | | | | 228,729 | |
SG Holdings | | | 3,500 | | | | 102,725 | |
The accompanying notes are an integral part of the financial statements.
46
SYMMETRY PANORAMIC GLOBAL EQUITY FUND
FEBRUARY 28, 2019
(Unaudited)
COMMON STOCK — continued | | | | | | | | |
| | | Shares | | | Value | |
JAPAN — continued | | | | | | | | |
Shimadzu | | | 1,700 | | | $ | 42,091 | |
Shin-Etsu Chemical | | | 700 | | | | 58,538 | |
Shionogi | | | 2,700 | | | | 172,922 | |
Shiseido | | | 3,000 | | | | 198,645 | |
Shizuoka Bank | | | 3,500 | | | | 27,699 | |
Showa Denko | | | 1,000 | | | | 37,563 | |
SoftBank Group | | | 200 | | | | 18,623 | |
Sompo Holdings | | | 1,500 | | | | 56,062 | |
Sony | | | 6,500 | | | | 312,878 | |
Sony Financial Holdings | | | 4,100 | | | | 77,766 | |
Sumitomo | | | 5,600 | | | | 80,665 | |
Sumitomo Dainippon Pharma | | | 3,900 | | | | 96,387 | |
Sumitomo Electric Industries | | | 2,400 | | | | 33,541 | |
Sumitomo Mitsui Financial Group | | | 2,600 | | | | 92,218 | |
Sumitomo Mitsui Trust Holdings | | | 2,900 | | | | 110,224 | |
Suzuken | | | 2,300 | | | | 126,135 | |
Suzuki Motor | | | 3,200 | | | | 164,145 | |
Taisho Pharmaceutical Holdings | | | 1,100 | | | | 111,565 | |
TDK | | | 900 | | | | 70,678 | |
Terumo | | | 2,600 | | | | 159,803 | |
Toho | | | 500 | | | | 17,869 | |
Toho Gas | | | 2,900 | | | | 131,906 | |
Tohoku Electric Power | | | 1,200 | | | | 15,738 | |
Tokio Marine Holdings | | | 4,100 | | | | 200,559 | |
Tokyo Electric Power Holdings * | | | 22,900 | | | | 142,901 | |
Tokyo Gas | | | 4,800 | | | | 132,214 | |
Toyo Seikan Group Holdings | | | 4,100 | | | | 86,835 | |
Toyoda Gosei | | | 1,000 | | | | 22,733 | |
Toyota Motor | | | 11,000 | | | | 663,744 | |
Toyota Tsusho | | | 1,000 | | | | 31,865 | |
Trend Micro | | | 1,100 | | | | 54,339 | |
Unicharm | | | 4,600 | | | | 143,993 | |
West Japan Railway | | | 300 | | | | 22,608 | |
Yamaha | | | 2,500 | | | | 123,288 | |
Yamato Holdings | | | 4,200 | | | | 109,650 | |
Yamazaki Baking | | | 800 | | | | 13,762 | |
Yokogawa Electric | | | 800 | | | | 15,453 | |
Yokohama Rubber | | | 3,100 | | | | 63,386 | |
| | | | | | | | 12,782,696 | |
The accompanying notes are an integral part of the financial statements.
47
SYMMETRY PANORAMIC GLOBAL EQUITY FUND
FEBRUARY 28, 2019
(Unaudited)
COMMON STOCK — continued | | | | | | | | |
| | | Shares | | | Value | |
MALAYSIA — 0.3% | | | | | | | | |
CIMB Group Holdings | | | 24,900 | | | $ | 35,863 | |
Fraser & Neave Holdings | | | 6,300 | | | | 54,680 | |
Hong Leong Bank | | | 21,400 | | | | 111,963 | |
Hong Leong Financial Group | | | 22,700 | | | | 110,203 | |
Malayan Banking | | | 65,200 | | | | 152,590 | |
Malaysia Airports Holdings | | | 22,400 | | | | 45,052 | |
Nestle Malaysia | | | 1,700 | | | | 61,877 | |
Petronas Chemicals Group | | | 66,500 | | | | 150,351 | |
Petronas Dagangan | | | 6,800 | | | | 44,732 | |
Petronas Gas | | | 23,300 | | | | 103,885 | |
PPB Group | | | 18,100 | | | | 81,572 | |
Public Bank | | | 33,500 | | | | 206,038 | |
RHB Bank | | | 72,300 | | | | 100,519 | |
Sime Darby | | | 38,800 | | | | 20,709 | |
Tenaga Nasional | | | 26,000 | | | | 85,654 | |
| | | | | | | | 1,365,688 | |
MEXICO — 0.1% | | | | | | | | |
Alfa, Cl A | | | 73,500 | | | | 83,558 | |
El Puerto de Liverpool | | | 7,100 | | | | 44,548 | |
Grupo Financiero Banorte, Cl O | | | 10,600 | | | | 57,713 | |
Megacable Holdings | | | 14,100 | | | | 64,498 | |
Mexichem | | | 16,600 | | | | 40,369 | |
Promotora y Operadora de Infraestructura | | | 2,510 | | | | 24,700 | |
Wal-Mart de Mexico | | | 34,100 | | | | 88,250 | |
| | | | | | | | 403,636 | |
NETHERLANDS — 0.3% | | | | | | | | |
Aegon | | | 23,671 | | | | 127,611 | |
ArcelorMittal | | | 1,825 | | | | 41,857 | |
ASML Holding | | | 172 | | | | 31,519 | |
Koninklijke Ahold Delhaize | | | 8,499 | | | | 219,077 | |
Koninklijke DSM | | | 2,179 | | | | 234,451 | |
Koninklijke Vopak | | | 2,424 | | | | 118,553 | |
NN Group | | | 4,343 | | | | 189,255 | |
Unilever | | | 6,837 | | | | 369,685 | |
Wolters Kluwer | | | 3,025 | | | | 199,532 | |
| | | | | | | | 1,531,540 | |
The accompanying notes are an integral part of the financial statements.
48
SYMMETRY PANORAMIC GLOBAL EQUITY FUND
FEBRUARY 28, 2019
(Unaudited)
COMMON STOCK — continued | | | | | | | | |
| | | Shares | | | Value | |
NORWAY — 0.1% | | | | | | | | |
Aker BP | | | 664 | | | $ | 22,603 | |
DNB | | | 1,253 | | | | 24,026 | |
Equinor | | | 13,124 | | | | 295,079 | |
Mowi | | | 3,469 | | | | 80,139 | |
Schibsted, Cl B | | | 2,027 | | | | 75,091 | |
| | | | | | | | 496,938 | |
PHILIPPINES — 0.0% | | | | | | | | |
Globe Telecom | | | 2,180 | | | | 80,129 | |
Manila Electric | | | 9,210 | | | | 65,489 | |
| | | | | | | | 145,618 | |
POLAND — 0.1% | | | | | | | | |
Bank Millennium * | | | 22,672 | | | | 51,745 | |
Dino Polska * | | | 1,428 | | | | 40,419 | |
Grupa Lotos | | | 4,495 | | | | 112,996 | |
Polski Koncern Naftowy ORLEN | | | 1,978 | | | | 53,278 | |
Polskie Gornictwo Naftowe i Gazownictwo | | | 43,759 | | | | 79,973 | |
Powszechna Kasa Oszczednosci Bank Polski | | | 7,676 | | | | 77,041 | |
| | | | | | | | 415,452 | |
PORTUGAL — 0.0% | | | | | | | | |
Galp Energia SGPS | | | 8,157 | | | | 134,045 | |
| | | | | | | | | |
SINGAPORE — 0.2% | | | | | | | | |
CapitaLand Mall Trust ‡ | | | 61,400 | | | | 108,890 | |
ComfortDelGro | | | 70,200 | | | | 124,208 | |
DBS Group Holdings | | | 15,300 | | | | 280,781 | |
SATS | | | 10,000 | | | | 37,992 | |
Singapore Technologies Engineering | | | 25,600 | | | | 70,738 | |
United Overseas Bank | | | 7,600 | | | | 140,518 | |
Venture | | | 2,900 | | | | 38,164 | |
Yangzijiang Shipbuilding Holdings | | | 46,300 | | | | 49,177 | |
| | | | | | | | 850,468 | |
SOUTH AFRICA — 0.3% | | | | | | | | |
Absa Group | | | 7,889 | | | | 100,967 | |
Anglo American Platinum | | | 2,033 | | | | 110,569 | |
AngloGold Ashanti ADR | | | 5,204 | | | | 73,741 | |
Bidvest Group | | | 2,728 | | | | 40,208 | |
Clicks Group | | | 3,506 | | | | 44,925 | |
Exxaro Resources | | | 787 | | | | 8,461 | |
The accompanying notes are an integral part of the financial statements.
49
SYMMETRY PANORAMIC GLOBAL EQUITY FUND
FEBRUARY 28, 2019
(Unaudited)
COMMON STOCK — continued | | | | | | | | |
| | | Shares | | | Value | |
SOUTH AFRICA — continued | | | | | | | | |
FirstRand | | | 32,499 | | | $ | 147,692 | |
Foschini Group | | | 4,958 | | | | 60,237 | |
Investec | | | 7,426 | | | | 48,218 | |
Kumba Iron Ore | | | 1,598 | | | | 42,213 | |
Liberty Holdings | | | 2,853 | | | | 20,798 | |
Mondi | | | 3,621 | | | | 85,074 | |
Mr Price Group | | | 3,770 | | | | 57,459 | |
Nedbank Group | | | 3,699 | | | | 74,501 | |
Netcare | | | 21,432 | | | | 38,693 | |
Pick n Pay Stores | | | 10,721 | | | | 52,712 | |
Redefine Properties ‡ | | | 15,678 | | | | 10,799 | |
RMB Holdings | | | 15,655 | | | | 88,919 | |
Sanlam | | | 9,346 | | | | 52,008 | |
Sasol | | | 1,464 | | | | 44,654 | |
SPAR Group | | | 1,714 | | | | 24,290 | |
Standard Bank Group | | | 5,106 | | | | 69,937 | |
Telkom SOC | | | 13,774 | | | | 68,130 | |
Truworths International | | | 7,003 | | | | 36,135 | |
| | | | | | | | 1,401,340 | |
SOUTH KOREA — 0.4% | | | | | | | | |
Cheil Worldwide | | | 4,469 | | | | 99,617 | |
Daelim Industrial | | | 1,078 | | | | 89,818 | |
DB Insurance | | | 1,718 | | | | 110,709 | |
Doosan Bobcat | | | 3,030 | | | | 85,819 | |
Fila Korea | | | 2,169 | | | | 107,186 | |
GS Engineering & Construction | | | 2,535 | | | | 96,855 | |
GS Retail | | | 1,383 | | | | 47,620 | |
Hankook Tire | | | 637 | | | | 24,204 | |
Hanon Systems | | | 1,628 | | | | 18,018 | |
Hyundai Department Store | | | 854 | | | | 73,563 | |
Hyundai Engineering & Construction | | | 2,217 | | | | 113,258 | |
Hyundai Glovis | | | 429 | | | | 53,197 | |
Hyundai Marine & Fire Insurance | | | 1,315 | | | | 43,930 | |
Industrial Bank of Korea | | | 3,294 | | | | 40,839 | |
Kangwon Land * | | | 1,188 | | | | 32,668 | |
Kia Motors | | | 4,544 | | | | 147,307 | |
Korea Gas | | | 888 | | | | 39,554 | |
Korea Zinc * | | | 173 | | | | 69,946 | |
The accompanying notes are an integral part of the financial statements.
50
SYMMETRY PANORAMIC GLOBAL EQUITY FUND
FEBRUARY 28, 2019
(Unaudited)
COMMON STOCK — continued | | | | | | | | |
| | | Shares | | | Value | |
SOUTH KOREA — continued | | | | | | | | |
Korean Air Lines * | | | 1,142 | | | $ | 37,409 | |
KT&G | | | 1,121 | | | | 104,696 | |
Kumho Petrochemical | | | 199 | | | | 16,921 | |
LG Uplus | | | 8,734 | | | | 116,625 | |
NCSoft | | | 198 | | | | 81,191 | |
Ottogi | | | 30 | | | | 20,381 | |
Samsung Electro-Mechanics | | | 1,358 | | | | 129,786 | |
SK Hynix | | | 1,736 | | | | 108,015 | |
SK Telecom | | | 748 | | | | 172,942 | |
| | | | | | | | 2,082,074 | |
SPAIN — 0.2% | | | | | | | | |
ACS Actividades de Construccion y Servicios | | | 2,931 | | | | 129,840 | |
Amadeus IT Group | | | 2,367 | | | | 178,228 | |
Enagas | | | 3,578 | | | | 101,929 | |
Endesa | | | 6,661 | | | | 167,848 | |
Iberdrola | | | 18,507 | | | | 154,820 | |
International Consolidated Airlines Group | | | 18,442 | | | | 145,892 | |
Mapfre | | | 19,344 | | | | 54,648 | |
Red Electrica | | | 5,422 | | | | 117,160 | |
Telefonica | | | 17,233 | | | | 148,748 | |
| | | | | | | | 1,199,113 | |
SWEDEN — 0.2% | | | | | | | | |
Alfa Laval | | | 3,462 | | | | 75,677 | |
Hexagon, Cl B | | | 1,111 | | | | 58,471 | |
Investor, Cl B | | | 4,453 | | | | 198,943 | |
Lundin Petroleum | | | 3,260 | | | | 106,890 | |
Securitas, Cl B | | | 5,589 | | | | 87,607 | |
Swedbank | | | 6,011 | | | | 110,507 | |
Swedish Match | | | 2,410 | | | | 113,004 | |
Tele2, Cl B | | | 5,420 | | | | 71,367 | |
Telefonaktiebolaget LM Ericsson, Cl B | | | 21,502 | | | | 196,501 | |
Telia | | | 39,378 | | | | 170,970 | |
| | | | | | | | 1,189,937 | |
SWITZERLAND — 0.6% | | | | | | | | |
Baloise Holding | | | 221 | | | | 36,090 | |
Chocoladefabriken Lindt & Spruengli | | | 19 | | | | 123,400 | |
Nestle | | | 5,028 | | | | 454,657 | |
Novartis | | | 10,129 | | | | 922,099 | |
The accompanying notes are an integral part of the financial statements.
51
SYMMETRY PANORAMIC GLOBAL EQUITY FUND
FEBRUARY 28, 2019
(Unaudited)
COMMON STOCK — continued | | | | | | | | |
| | | Shares | | | Value | |
SWITZERLAND — continued | | | | | | | | |
Partners Group Holding | | | 312 | | | $ | 225,470 | |
Roche Holding | | | 3,495 | | | | 970,527 | |
Sonova Holding | | | 159 | | | | 29,713 | |
Swatch Group | | | 210 | | | | 61,973 | |
Swiss Life Holding | | | 443 | | | | 193,136 | |
Zurich Insurance Group | | | 1,259 | | | | 416,394 | |
| | | | | | | | 3,433,459 | |
TAIWAN — 0.8% | | | | | | | | |
Acer | | | 51,000 | | | | 33,744 | |
ASE Technology Holding | | | 64,000 | | | | 130,520 | |
Asia Cement | | | 71,000 | | | | 89,550 | |
AU Optronics | | | 155,000 | | | | 57,043 | |
Chailease Holding | | | 29,000 | | | | 114,000 | |
Chang Hwa Commercial Bank | | | 139,000 | | | | 83,403 | |
China Life Insurance | | | 42,000 | | | | 39,234 | |
China Steel | | | 138,000 | | | | 114,153 | |
CTBC Financial Holding | | | 123,000 | | | | 83,267 | |
Delta Electronics | | | 7,000 | | | | 34,935 | |
E.Sun Financial Holding | | | 174,000 | | | | 124,754 | |
Eclat Textile | | | 7,000 | | | | 80,266 | |
Eva Airways | | | 127,000 | | | | 63,758 | |
Far Eastern New Century | | | 19,000 | | | | 18,817 | |
Feng TAY Enterprise | | | 14,000 | | | | 87,976 | |
Formosa Chemicals & Fibre | | | 46,000 | | | | 157,434 | |
Formosa Petrochemical | | | 17,000 | | | | 64,245 | |
Formosa Taffeta | | | 52,000 | | | | 59,902 | |
Fubon Financial Holding | | | 20,000 | | | | 29,551 | |
Inventec | | | 39,000 | | | | 30,155 | |
Lite-On Technology | | | 36,000 | | | | 52,070 | |
Mega Financial Holding | | | 154,000 | | | | 136,228 | |
Micro-Star International | | | 3,000 | | | | 7,954 | |
Nan Ya Plastics | | | 16,000 | | | | 39,901 | |
Novatek Microelectronics | | | 24,000 | | | | 133,086 | |
Phison Electronics | | | 4,000 | | | | 36,375 | |
President Chain Store | | | 11,000 | | | | 113,855 | |
Realtek Semiconductor | | | 21,000 | | | | 120,859 | |
Ruentex Industries | | | 28,000 | | | | 74,113 | |
SinoPac Financial Holdings | | | 200,000 | | | | 69,775 | |
The accompanying notes are an integral part of the financial statements.
52
SYMMETRY PANORAMIC GLOBAL EQUITY FUND
FEBRUARY 28, 2019
(Unaudited)
COMMON STOCK — continued | | | | | | | | |
| | | Shares | | | Value | |
TAIWAN — continued | | | | | | | | |
Taiwan Business Bank | | | 263,000 | | | $ | 96,898 | |
Taiwan Cement | | | 99,000 | | | | 123,642 | |
Taiwan Cooperative Financial Holding | | | 112,000 | | | | 69,489 | |
Taiwan Semiconductor Manufacturing ADR | | | 20,917 | | | | 816,809 | |
Uni-President Enterprises | | | 75,000 | | | | 182,811 | |
United Microelectronics | | | 37,000 | | | | 13,767 | |
Vanguard International Semiconductor | | | 22,000 | | | | 49,298 | |
Walsin Technology | | | 15,000 | | | | 88,093 | |
Yageo | | | 9,000 | | | | 101,179 | |
Yuanta Financial Holding | | | 236,000 | | | | 133,678 | |
Zhen Ding Technology Holding | | | 39,000 | | | | 113,502 | |
| | | | | | | | 4,070,089 | |
THAILAND — 0.2% | | | | | | | | |
Advanced Info Service NVDR | | | 4,300 | | | | 24,822 | |
Bangkok Bank NVDR | | | 20,200 | | | | 133,977 | |
Bangkok Dusit Medical Services NVDR | | | 148,300 | | | | 111,048 | |
Home Product Center NVDR | | | 195,800 | | | | 93,130 | |
IRPC NVDR | | | 223,100 | | | | 41,663 | |
Krung Thai Bank NVDR | | | 154,500 | | | | 94,447 | |
Land & Houses NVDR | | | 221,900 | | | | 73,898 | |
PTT NVDR | | | 144,700 | | | | 221,756 | |
PTT Exploration & Production NVDR | | | 32,200 | | | | 127,391 | |
PTT Global Chemical NVDR | | | 35,800 | | | | 81,494 | |
Siam Commercial Bank NVDR | | | 25,800 | | | | 109,219 | |
| | | | | | | | 1,112,845 | |
TURKEY — 0.0% | | | | | | | | |
Eregli Demir ve Celik Fabrikalari | | | 4,709 | | | | 8,217 | |
TAV Havalimanlari Holding | | | 3,311 | | | | 17,297 | |
Turk Hava Yollari AO * | | | 7,896 | | | | 20,861 | |
| | | | | | | | 46,375 | |
UNITED KINGDOM — 0.8% | | | | | | | | |
Admiral Group | | | 646 | | | | 18,708 | |
Anglo American | | | 7,720 | | | | 205,075 | |
Auto Trader Group | | | 12,621 | | | | 79,609 | |
Barratt Developments | | | 6,653 | | | | 52,878 | |
BHP Group | | | 16,182 | | | | 374,968 | |
BP | | | 73,734 | | | | 523,490 | |
Bunzl | | | 2,142 | | | | 67,426 | |
The accompanying notes are an integral part of the financial statements.
53
SYMMETRY PANORAMIC GLOBAL EQUITY FUND
FEBRUARY 28, 2019
(Unaudited)
COMMON STOCK — continued | | | | | | | | |
| | | Shares | | | Value | |
UNITED KINGDOM — continued | | | | | | | | |
Burberry Group | | | 4,821 | | | $ | 121,071 | |
Centrica | | | 43,424 | | | | 71,715 | |
Compass Group | | | 5,374 | | | | 118,705 | |
Croda International | | | 555 | | | | 35,424 | |
Diageo | | | 3,647 | | | | 141,199 | |
Experian | | | 5,055 | | | | 131,704 | |
GlaxoSmithKline | | | 7,433 | | | | 147,868 | |
J Sainsbury | | | 20,217 | | | | 61,501 | |
Johnson Matthey | | | 633 | | | | 25,966 | |
Marks & Spencer Group | | | 7,625 | | | | 27,575 | |
Mondi | | | 2,886 | | | | 66,183 | |
National Grid | | | 9,427 | | | | 106,156 | |
Next | | | 1,012 | | | | 68,275 | |
Pearson | | | 7,960 | | | | 89,420 | |
Persimmon | | | 1,614 | | | | 52,079 | |
Rio Tinto | | | 4,819 | | | | 277,329 | |
Royal Dutch Shell, Cl A | | | 26,426 | | | | 822,714 | |
Royal Mail | | | 4,152 | | | | 15,558 | |
Segro ‡ | | | 3,044 | | | | 26,687 | |
Smith & Nephew | | | 7,141 | | | | 136,095 | |
Tesco | | | 36,035 | | | | 107,957 | |
United Utilities Group | | | 2,644 | | | | 29,464 | |
Whitbread | | | 1,811 | | | | 116,649 | |
| | | | | | | | 4,119,448 | |
UNITED STATES — 13.6% | | | | | | | | |
COMMUNICATION SERVICES — 0.7% | | | | | | | | |
AMC Networks, Cl A * | | | 2,189 | | | | 143,839 | |
Cable One | | | 173 | | | | 164,175 | |
CenturyLink | | | 9,751 | | | | 128,616 | |
Cinemark Holdings | | | 1,569 | | | | 59,042 | |
Discovery * | | | 4,972 | | | | 143,691 | |
IAC * | | | 1,040 | | | | 221,572 | |
Interpublic Group | | | 4,704 | | | | 108,333 | |
Match Group | | | 3,459 | | | | 191,559 | |
Omnicom Group | | | 1,508 | | | | 114,156 | |
Telephone & Data Systems | | | 3,624 | | | | 116,149 | |
TripAdvisor * | | | 2,498 | | | | 132,819 | |
Twitter * | | | 2,860 | | | | 88,031 | |
The accompanying notes are an integral part of the financial statements.
54
SYMMETRY PANORAMIC GLOBAL EQUITY FUND
FEBRUARY 28, 2019
(Unaudited)
COMMON STOCK — continued | | | | | | | | |
| | | Shares | | | Value | |
COMMUNICATION SERVICES — continued | | | | | | | | |
United States Cellular * | | | 1,885 | | | $ | 88,011 | |
Verizon Communications | | | 19,722 | | | | 1,122,576 | |
Viacom, Cl B | | | 5,697 | | | | 166,466 | |
Walt Disney | | | 6,752 | | | | 761,896 | |
| | | | | | | | 3,750,931 | |
CONSUMER DISCRETIONARY — 2.0% | | | | | | | | |
Advance Auto Parts | | | 1,349 | | | | 218,241 | |
Amazon.com * | | | 703 | | | | 1,152,800 | |
AutoZone * | | | 285 | | | | 267,606 | |
Best Buy | | | 3,057 | | | | 210,444 | |
Bright Horizons Family Solutions * | | | 620 | | | | 76,880 | |
Burlington Stores * | | | 1,573 | | | | 267,001 | |
Capri Holdings * | | | 795 | | | | 36,252 | |
Chipotle Mexican Grill, Cl A * | | | 420 | | | | 255,163 | |
Columbia Sportswear | | | 1,416 | | | | 145,777 | |
Darden Restaurants | | | 2,241 | | | | 251,238 | |
Dick's Sporting Goods | | | 4,314 | | | | 168,505 | |
Dollar General | | | 2,353 | | | | 278,736 | |
Domino's Pizza | | | 641 | | | | 160,853 | |
DR Horton | | | 2,680 | | | | 104,225 | |
Expedia Group | | | 170 | | | | 20,963 | |
Foot Locker | | | 3,376 | | | | 200,939 | |
Gap | | | 3,077 | | | | 78,156 | |
Garmin | | | 2,133 | | | | 179,108 | |
Gentex | | | 5,203 | | | | 105,829 | |
Genuine Parts | | | 1,715 | | | | 186,558 | |
Graham Holdings, Cl B | | | 101 | | | | 69,055 | |
Grand Canyon Education * | | | 737 | | | | 85,256 | |
H&R Block | | | 3,812 | | | | 92,060 | |
Hasbro | | | 799 | | | | 67,835 | |
Home Depot | | | 1,721 | | | | 318,626 | |
Hyatt Hotels, Cl A | | | 1,087 | | | | 79,101 | |
Kohl's | | | 3,086 | | | | 208,398 | |
Lowe's | | | 4,168 | | | | 438,015 | |
Lululemon Athletica * | | | 2,052 | | | | 308,662 | |
Macy's | | | 6,026 | | | | 149,385 | |
McDonald's | | | 2,226 | | | | 409,228 | |
NIKE, Cl B | | | 7,830 | | | | 671,266 | |
The accompanying notes are an integral part of the financial statements.
55
SYMMETRY PANORAMIC GLOBAL EQUITY FUND
FEBRUARY 28, 2019
(Unaudited)
COMMON STOCK — continued | | | | | | | | |
| | | Shares | | | Value | |
CONSUMER DISCRETIONARY — continued | | | | | | | | |
Nordstrom | | | 3,087 | | | $ | 145,953 | |
O'Reilly Automotive * | | | 910 | | | | 338,484 | |
Penske Automotive Group | | | 766 | | | | 34,041 | |
Pool | | | 436 | | | | 69,559 | |
Ralph Lauren, Cl A | | | 1,502 | | | | 188,005 | |
Ross Stores | | | 3,012 | | | | 285,628 | |
ServiceMaster Global Holdings * | | | 1,390 | | | | 62,772 | |
Starbucks | | | 7,169 | | | | 503,694 | |
Tapestry | | | 4,074 | | | | 142,346 | |
Target | | | 3,626 | | | | 263,393 | |
Tiffany | | | 1,485 | | | | 141,134 | |
TJX | | | 8,206 | | | | 420,886 | |
Tractor Supply | | | 2,119 | | | | 202,047 | |
Ulta Beauty * | | | 804 | | | | 251,242 | |
Under Armour, Cl A * | | | 6,360 | | | | 143,418 | |
Urban Outfitters * | | | 4,034 | | | | 124,449 | |
VF | | | 1,576 | | | | 137,679 | |
Williams-Sonoma | | | 2,819 | | | | 163,953 | |
Yum! Brands | | | 447 | | | | 42,241 | |
| | | | | | | | 10,923,085 | |
CONSUMER STAPLES — 0.8% | | | | | | | | |
Archer-Daniels-Midland | | | 3,707 | | | | 157,547 | |
Casey's General Stores | | | 855 | | | | 115,203 | |
Church & Dwight | | | 3,677 | | | | 241,946 | |
Clorox | | | 794 | | | | 125,476 | |
Costco Wholesale | | | 2,175 | | | | 475,760 | |
Energizer Holdings | | | 740 | | | | 33,951 | |
Estee Lauder, Cl A | | | 1,470 | | | | 230,702 | |
Hershey | | | 608 | | | | 67,293 | |
Hormel Foods | | | 6,806 | | | | 295,108 | |
Kroger | | | 8,755 | | | | 256,784 | |
Lamb Weston Holdings | | | 3,999 | | | | 277,171 | |
McCormick | | | 1,873 | | | | 254,690 | |
Nu Skin Enterprises, Cl A | | | 468 | | | | 28,131 | |
Post Holdings * | | | 1,212 | | | | 123,478 | |
Procter & Gamble | | | 8,056 | | | | 793,919 | |
Sprouts Farmers Market * | | | 3,167 | | | | 73,854 | |
Sysco | | | 4,301 | | | | 290,533 | |
The accompanying notes are an integral part of the financial statements.
56
SYMMETRY PANORAMIC GLOBAL EQUITY FUND
FEBRUARY 28, 2019
(Unaudited)
COMMON STOCK — continued | | | | | | | | |
| | | Shares | | | Value | |
CONSUMER STAPLES — continued | | | | | | | | |
TreeHouse Foods * | | | 365 | | | $ | 22,112 | |
Walgreens Boots Alliance | | | 4,573 | | | | 325,552 | |
Walmart | | | 3,610 | | | | 357,354 | |
| | | | | | | | 4,546,564 | |
ENERGY — 0.4% | | | | | | | | |
Chevron | | | 3,854 | | | | 460,861 | |
ConocoPhillips | | | 6,098 | | | | 413,749 | |
Continental Resources * | | | 1,235 | | | | 55,093 | |
EOG Resources | | | 741 | | | | 69,654 | |
Helmerich & Payne | | | 692 | | | | 37,506 | |
HollyFrontier | | | 2,539 | | | | 129,997 | |
Marathon Oil | | | 2,247 | | | | 37,300 | |
Marathon Petroleum | | | 2,460 | | | | 152,545 | |
Occidental Petroleum | | | 1,836 | | | | 121,451 | |
PBF Energy, Cl A | | | 2,769 | | | | 86,033 | |
Phillips 66 | | | 2,565 | | | | 247,163 | |
Valero Energy | | | 2,748 | | | | 224,127 | |
Whiting Petroleum * | | | 2,470 | | | | 60,194 | |
| | | | | | | | 2,095,673 | |
FINANCIALS — 1.6% | | | | | | | | |
Aflac | | | 5,206 | | | | 255,823 | |
Alleghany | | | 291 | | | | 187,101 | |
Allstate | | | 1,821 | | | | 171,866 | |
American Express | | | 3,827 | | | | 412,321 | |
American Financial Group | | | 803 | | | | 80,027 | |
Aon | | | 903 | | | | 154,892 | |
Arch Capital Group * | | | 692 | | | | 22,608 | |
Assurant | | | 601 | | | | 61,897 | |
Assured Guaranty | | | 3,218 | | | | 134,384 | |
Axis Capital Holdings | | | 2,939 | | | | 167,729 | |
BB&T | | | 5,399 | | | | 275,187 | |
Capital One Financial | | | 1,973 | | | | 164,903 | |
Chubb | | | 1,243 | | | | 166,438 | |
Cincinnati Financial | | | 1,095 | | | | 95,068 | |
Citizens Financial Group | | | 3,512 | | | | 129,733 | |
CME Group, Cl A | | | 2,795 | | | | 508,439 | |
Comerica | | | 1,992 | | | | 173,523 | |
Commerce Bancshares | | | 1,083 | | | | 68,153 | |
The accompanying notes are an integral part of the financial statements.
57
SYMMETRY PANORAMIC GLOBAL EQUITY FUND
FEBRUARY 28, 2019
(Unaudited)
COMMON STOCK — continued | | | | | | | | |
| | | Shares | | | Value | |
FINANCIALS — continued | | | | | | | | |
Credicorp | | | 658 | | | $ | 159,953 | |
Credit Acceptance * | | | 421 | | | | 185,181 | |
Cullen | | | 726 | | | | 75,272 | |
Discover Financial Services | | | 1,947 | | | | 139,425 | |
E*TRADE Financial | | | 687 | | | | 33,656 | |
East West Bancorp | | | 1,394 | | | | 76,126 | |
Erie Indemnity, Cl A | | | 261 | | | | 46,515 | |
Evercore, Cl A | | | 481 | | | | 44,300 | |
Everest Re Group | | | 892 | | | | 201,690 | |
Fidelity National Financial | | | 1,240 | | | | 43,512 | |
Fifth Third Bancorp | | | 3,016 | | | | 83,181 | |
First Citizens BancShares, Cl A | | | 71 | | | | 30,997 | |
Hanover Insurance Group | | | 1,225 | | | | 145,420 | |
Huntington Bancshares | | | 11,567 | | | | 166,680 | |
JPMorgan Chase | | | 11,828 | | | | 1,234,370 | |
KeyCorp | | | 10,022 | | | | 176,989 | |
Marsh & McLennan | | | 1,012 | | | | 94,136 | |
Mercury General | | | 1,283 | | | | 67,960 | |
Nasdaq | | | 752 | | | | 68,861 | |
Old Republic International | | | 5,609 | | | | 117,004 | |
Popular | | | 1,760 | | | | 99,229 | |
Progressive | | | 6,403 | | | | 466,779 | |
Prosperity Bancshares | | | 356 | | | | 26,504 | |
Regions Financial | | | 13,097 | | | | 214,791 | |
RenaissanceRe Holdings | | | 421 | | | | 61,908 | |
SVB Financial Group * | | | 667 | | | | 164,856 | |
T Rowe Price Group | | | 1,440 | | | | 144,619 | |
TCF Financial | | | 2,423 | | | | 55,487 | |
Torchmark | | | 536 | | | | 44,252 | |
Travelers | | | 2,521 | | | | 335,066 | |
US Bancorp | | | 2,270 | | | | 117,336 | |
Virtu Financial, Cl A | | | 1,134 | | | | 28,509 | |
Webster Financial | | | 910 | | | | 52,252 | |
WR Berkley | | | 2,403 | | | | 201,035 | |
| | | | | | | | 8,433,943 | |
HEALTH CARE — 2.2% | | | | | | | | |
Abbott Laboratories | | | 8,188 | | | | 635,553 | |
ABIOMED * | | | 555 | | | | 185,648 | |
The accompanying notes are an integral part of the financial statements.
58
SYMMETRY PANORAMIC GLOBAL EQUITY FUND
FEBRUARY 28, 2019
(Unaudited)
COMMON STOCK — continued | | | | | | | | |
| | | Shares | | | Value | |
HEALTH CARE — continued | | | | | | | | |
Acadia Healthcare * | | | 1,087 | | | $ | 28,577 | |
Align Technology * | | | 320 | | | | 82,870 | |
Amgen | | | 2,809 | | | | 533,935 | |
Anthem | | | 1,653 | | | | 497,107 | |
Biogen * | | | 911 | | | | 298,817 | |
Bio-Rad Laboratories, Cl A * | | | 243 | | | | 65,829 | |
Bio-Techne | | | 146 | | | | 28,309 | |
Boston Scientific * | | | 6,382 | | | | 256,046 | |
Centene * | | | 3,144 | | | | 191,438 | |
Charles River Laboratories International * | | | 408 | | | | 58,005 | |
Chemed | | | 363 | | | | 119,608 | |
Cigna | | | 1,068 | | | | 186,302 | |
Covetrus * | | | 303 | | | | 10,841 | |
Danaher | | | 1,915 | | | | 243,243 | |
DaVita * | | | 1,252 | | | | 71,239 | |
DexCom * | | | 1,028 | | �� | | 143,231 | |
Edwards Lifesciences * | | | 843 | | | | 142,711 | |
Eli Lilly | | | 6,188 | | | | 781,483 | |
Encompass Health | | | 2,455 | | | | 155,009 | |
HCA Healthcare | | | 2,687 | | | | 373,600 | |
Henry Schein * | | | 1,185 | | | | 70,270 | |
Hill-Rom Holdings | | | 465 | | | | 49,313 | |
Humana | | | 994 | | | | 283,330 | |
ICU Medical * | | | 270 | | | | 66,355 | |
IDEXX Laboratories * | | | 588 | | | | 124,086 | |
Illumina * | | | 636 | | | | 198,922 | |
Intuitive Surgical * | | | 455 | | | | 249,163 | |
Jazz Pharmaceuticals * | | | 546 | | | | 76,456 | |
Laboratory Corp of America Holdings * | | | 297 | | | | 44,027 | |
Masimo * | | | 1,147 | | | | 150,578 | |
MEDNAX * | | | 642 | | | | 21,128 | |
Medtronic | | | 6,016 | | | | 544,448 | |
Merck | | | 12,473 | | | | 1,013,930 | |
Molina Healthcare * | | | 1,008 | | | | 135,707 | |
Nektar Therapeutics, Cl A * | | | 848 | | | | 34,378 | |
Pfizer | | | 24,718 | | | | 1,071,525 | |
Premier, Cl A * | | | 1,782 | | | | 65,186 | |
ResMed | | | 1,598 | | | | 163,683 | |
The accompanying notes are an integral part of the financial statements.
59
SYMMETRY PANORAMIC GLOBAL EQUITY FUND
FEBRUARY 28, 2019
(Unaudited)
COMMON STOCK — continued | | | | | | | | |
| | | Shares | | | Value | |
HEALTH CARE — continued | | | | | | | | |
STERIS | | | 933 | | | $ | 112,856 | |
Thermo Fisher Scientific | | | 1,881 | | | | 488,251 | |
UnitedHealth Group | | | 4,448 | | | | 1,077,395 | |
Universal Health Services, Cl B | | | 1,308 | | | | 181,590 | |
Veeva Systems, Cl A * | | | 1,753 | | | | 206,696 | |
WellCare Health Plans * | | | 331 | | | | 83,935 | |
Zimmer Biomet Holdings | | | 540 | | | | 67,025 | |
Zoetis, Cl A | | | 3,098 | | | | 291,925 | |
| | | | | | | | 11,961,559 | |
INDUSTRIALS — 1.3% | | | | | | | | |
Alaska Air Group | | | 971 | | | | 59,911 | |
Allison Transmission Holdings | | | 2,579 | | | | 128,176 | |
Armstrong World Industries | | | 894 | | | | 65,423 | |
Boeing | | | 1,406 | | | | 618,584 | |
Carlisle | | | 491 | | | | 60,432 | |
CH Robinson Worldwide | | | 1,389 | | | | 125,538 | |
Cintas | | | 886 | | | | 183,048 | |
Clean Harbors * | | | 547 | | | | 37,196 | |
Copart * | | | 1,247 | | | | 73,161 | |
CSX | | | 4,972 | | | | 361,315 | |
Curtiss-Wright | | | 312 | | | | 38,466 | |
Delta Air Lines | | | 4,937 | | | | 244,777 | |
Donaldson | | | 573 | | | | 29,561 | |
Dover | | | 1,943 | | | | 175,900 | |
Eaton | | | 1,860 | | | | 148,372 | |
Emerson Electric | | | 4,306 | | | | 293,454 | |
Expeditors International of Washington | | | 2,046 | | | | 153,348 | |
Fastenal | | | 1,835 | | | | 115,495 | |
Harris | | | 676 | | | | 111,493 | |
HD Supply Holdings * | | | 1,308 | | | | 56,257 | |
HEICO | | | 1,225 | | | | 114,819 | |
IDEX | | | 511 | | | | 73,635 | |
Ingersoll-Rand | | | 2,010 | | | | 212,176 | |
ITT | | | 1,371 | | | | 79,189 | |
Jacobs Engineering Group | | | 1,637 | | | | 120,778 | |
JB Hunt Transport Services | | | 649 | | | | 69,878 | |
Landstar System | | | 300 | | | | 32,604 | |
MSC Industrial Direct, Cl A | | | 325 | | | | 27,433 | |
The accompanying notes are an integral part of the financial statements.
60
SYMMETRY PANORAMIC GLOBAL EQUITY FUND
FEBRUARY 28, 2019
(Unaudited)
COMMON STOCK — continued | | | | | | | | |
| | | Shares | | | Value | |
INDUSTRIALS — continued | | | | | | | | |
Nordson | | | 327 | | | $ | 44,393 | |
Norfolk Southern | | | 1,853 | | | | 332,243 | |
Old Dominion Freight Line | | | 619 | | | | 93,327 | |
Republic Services, Cl A | | | 3,355 | | | | 263,133 | |
Robert Half International | | | 2,470 | | | | 168,430 | |
Rollins | | | 1,752 | | | | 69,484 | |
Snap-on | | | 733 | | | | 117,280 | |
Southwest Airlines | | | 931 | | | | 52,173 | |
Teledyne Technologies * | | | 447 | | | | 105,510 | |
Textron | | | 1,921 | | | | 104,310 | |
Union Pacific | | | 3,525 | | | | 591,142 | |
United Continental Holdings * | | | 3,432 | | | | 301,364 | |
United Technologies | | | 1,167 | | | | 146,657 | |
Verisk Analytics, Cl A | | | 1,635 | | | | 206,713 | |
Wabtec | | | 829 | | | | 60,733 | |
Waste Management | | | 1,536 | | | | 155,520 | |
WW Grainger | | | 733 | | | | 223,396 | |
XPO Logistics * | | | 555 | | | | 27,944 | |
Xylem | | | 922 | | | | 69,657 | |
| | | | | | | | 6,943,828 | |
INFORMATION TECHNOLOGY — 3.3% | | | | | | | | |
Accenture, Cl A | | | 1,603 | | | | 258,692 | |
Adobe * | | | 2,494 | | | | 654,675 | |
Akamai Technologies * | | | 2,294 | | | | 159,800 | |
Analog Devices | | | 391 | | | | 41,821 | |
ANSYS * | | | 425 | | | | 75,336 | |
Apple | | | 18,342 | | | | 3,175,917 | |
Aspen Technology * | | | 716 | | | | 72,108 | |
Atlassian, Cl A * | | | 871 | | | | 93,615 | |
Autodesk * | | | 521 | | | | 84,928 | |
Automatic Data Processing | | | 1,789 | | | | 273,771 | |
Booz Allen Hamilton Holding, Cl A | | | 3,161 | | | | 167,091 | |
Broadridge Financial Solutions | | | 1,486 | | | | 150,458 | |
CDW | | | 2,105 | | | | 197,639 | |
Cisco Systems | | | 19,754 | | | | 1,022,665 | |
Citrix Systems | | | 1,846 | | | | 194,753 | |
Conduent * | | | 2,588 | | | | 37,837 | |
DXC Technology | | | 1,265 | | | | 83,313 | |
The accompanying notes are an integral part of the financial statements.
61
SYMMETRY PANORAMIC GLOBAL EQUITY FUND
FEBRUARY 28, 2019
(Unaudited)
COMMON STOCK — continued | | | | | | | | |
| | | Shares | | | Value | |
INFORMATION TECHNOLOGY — continued | | | | | | | | |
EPAM Systems * | | | 681 | | | $ | 110,172 | |
Euronet Worldwide * | | | 166 | | | | 22,297 | |
F5 Networks * | | | 1,065 | | | | 179,069 | |
Fair Isaac * | | | 423 | | | | 104,828 | |
FLIR Systems | | | 1,240 | | | | 63,798 | |
Fortinet * | | | 2,584 | | | | 224,265 | |
Hewlett Packard Enterprise | | | 7,913 | | | | 129,615 | |
HP | | | 10,371 | | | | 204,620 | |
Intel | | | 19,726 | | | | 1,044,689 | |
Intuit | | | 1,847 | | | | 456,449 | |
Jack Henry & Associates | | | 665 | | | | 88,199 | |
Keysight Technologies * | | | 3,093 | | | | 261,080 | |
Mastercard, Cl A | | | 3,969 | | | | 892,112 | |
Maxim Integrated Products | | | 835 | | | | 45,449 | |
Micron Technology * | | | 3,180 | | | | 129,998 | |
Microsoft | | | 29,614 | | | | 3,317,656 | |
Motorola Solutions | | | 874 | | | | 125,087 | |
National Instruments | | | 585 | | | | 27,343 | |
NetApp | | | 2,736 | | | | 178,387 | |
Okta, Cl A * | | | 2,082 | | | | 176,720 | |
Palo Alto Networks * | | | 810 | | | | 199,479 | |
PTC * | | | 850 | | | | 78,897 | |
QUALCOMM | | | 1,179 | | | | 62,947 | |
Sabre | | | 5,242 | | | | 117,578 | |
salesforce.com * | | | 777 | | | | 127,156 | |
ServiceNow * | | | 168 | | | | 40,226 | |
Splunk * | | | 1,198 | | | | 162,784 | |
Tableau Software, Cl A * | | | 166 | | | | 21,895 | |
Total System Services | | | 753 | | | | 71,083 | |
Twilio, Cl A * | | | 380 | | | | 46,242 | |
Ubiquiti Networks | | | 1,186 | | | | 171,246 | |
Ultimate Software Group * | | | 313 | | | | 103,760 | |
VeriSign * | | | 1,307 | | | | 232,698 | |
Visa, Cl A | | | 5,236 | | | | 775,556 | |
VMware, Cl A | | | 1,928 | | | | 331,250 | |
Workday, Cl A * | | | 630 | | | | 124,696 | |
Xilinx | | | 2,378 | | | | 297,963 | |
Zebra Technologies, Cl A * | | | 944 | | | | 189,281 | |
The accompanying notes are an integral part of the financial statements.
62
SYMMETRY PANORAMIC GLOBAL EQUITY FUND
FEBRUARY 28, 2019
(Unaudited)
COMMON STOCK — continued | | | | | | | | |
| | | Shares | | | Value | |
INFORMATION TECHNOLOGY — continued | | | | | | | | |
Zendesk * | | | 1,445 | | | $ | 114,184 | |
| | | | | | | | 17,795,173 | |
MATERIALS — 0.3% | | | | | | | | |
AptarGroup | | | 500 | | | | 50,865 | |
Ashland Global Holdings | | | 353 | | | | 27,315 | |
Ball | | | 2,709 | | | | 148,399 | |
CF Industries Holdings | | | 2,994 | | | | 126,347 | |
Domtar | | | 515 | | | | 26,219 | |
Eastman Chemical | | | 791 | | | | 65,408 | |
Ecolab | | | 1,779 | | | | 300,491 | |
Huntsman | | | 1,050 | | | | 26,030 | |
LyondellBasell Industries, Cl A | | | 1,431 | | | | 122,379 | |
Mosaic | | | 4,359 | | | | 136,306 | |
Nucor | | | 1,951 | | | | 118,172 | |
Reliance Steel & Aluminum | | | 487 | | | | 43,465 | |
RPM International | | | 1,035 | | | | 59,895 | |
Sonoco Products | | | 1,802 | | | | 104,318 | |
Steel Dynamics | | | 2,283 | | | | 85,202 | |
Westlake Chemical | | | 303 | | | | 21,171 | |
| | | | | | | | 1,461,982 | |
REAL ESTATE — 0.3% | | | | | | | | |
Apartment Investment & Management, Cl A ‡ | | | 2,416 | | | | 118,215 | |
CBRE Group, Cl A * | | | 2,020 | | | | 100,515 | |
EPR Properties ‡ | | | 1,206 | | | | 88,617 | |
Equity Commonwealth ‡ | | | 1,326 | | | | 43,294 | |
Equity Residential ‡ | | | 2,378 | | | | 175,235 | |
HCP ‡ | | | 2,290 | | | | 70,463 | |
Jones Lang LaSalle | | | 385 | | | | 63,571 | |
Kimco Realty ‡ | | | 1,432 | | | | 25,189 | |
Life Storage ‡ | | | 373 | | | | 36,405 | |
Medical Properties Trust ‡ | | | 10,375 | | | | 189,136 | |
Omega Healthcare Investors ‡ | | | 4,919 | | | | 176,592 | |
Park Hotels & Resorts ‡ | | | 2,165 | | | | 67,635 | |
Spirit Realty Capital ‡ | | | 541 | | | | 20,904 | |
Ventas ‡ | | | 1,664 | | | | 104,416 | |
Welltower ‡ | | | 1,917 | | | | 142,452 | |
| | | | | | | | 1,422,639 | |
The accompanying notes are an integral part of the financial statements.
63
SYMMETRY PANORAMIC GLOBAL EQUITY FUND
FEBRUARY 28, 2019
(Unaudited)
COMMON STOCK — continued | | | | | | | | |
| | | Shares | | | Value | |
UTILITIES — 0.7% | | | | | | | | |
AES | | | 7,812 | | | $ | 134,601 | |
Ameren | | | 3,117 | | | | 222,055 | |
American Electric Power | | | 3,026 | | | | 245,560 | |
Atmos Energy | | | 1,441 | | | | 142,443 | |
CenterPoint Energy | | | 1,717 | | | | 51,750 | |
CMS Energy | | | 3,941 | | | | 214,390 | |
DTE Energy | | | 2,605 | | | | 321,874 | |
Duke Energy | | | 3,483 | | | | 312,286 | |
Entergy | | | 864 | | | | 80,637 | |
Exelon | | | 8,733 | | | | 424,336 | |
Hawaiian Electric Industries | | | 1,325 | | | | 50,721 | |
NextEra Energy | | | 2,017 | | | | 378,631 | |
NRG Energy | | | 2,200 | | | | 91,696 | |
OGE Energy | | | 4,295 | | | | 182,623 | |
Pinnacle West Capital | | | 2,248 | | | | 210,728 | |
Public Service Enterprise Group | | | 1,691 | | | | 99,448 | |
UGI | | | 3,204 | | | | 175,900 | |
Vistra Energy | | | 3,849 | | | | 100,228 | |
Xcel Energy | | | 5,393 | | | | 295,860 | |
| | | | | | | | 3,735,767 | |
| | | | | | | | 73,071,144 | |
Total Common Stock | | | | | | | | |
(Cost $130,452,610) | | | | | | | 136,771,094 | |
| | | | | | | | | |
PREFERRED STOCK — 0.2% | | | | | | | | |
| | | | | | | | | |
BRAZIL — 0.2% (A) | | | | | | | | |
Braskem | | | 3,400 | | | | 49,151 | |
Cia Brasileira de Distribuicao | | | 1,000 | | | | 24,794 | |
Gerdau | | | 15,600 | | | | 62,838 | |
Petroleo Brasileiro | | | 80,600 | | | | 577,868 | |
Telefonica Brasil | | | 9,300 | | | | 116,369 | |
Total Preferred Stock | | | | | | | | |
(Cost $775,689) | | | | | | | 831,020 | |
The accompanying notes are an integral part of the financial statements.
64
SYMMETRY PANORAMIC GLOBAL EQUITY FUND
FEBRUARY 28, 2019
(Unaudited)
RIGHTS — 0.0% | | | | | | | | |
| | | Number Of
Rights | | | Values | |
CTBC Financial Holding ‡‡ | | | 155 | | | $ | — | |
| | | | | | | | | |
(Cost $–) | | | | | | | — | |
| | | | | | | | | |
SHORT-TERM INVESTMENT — 3.4% | | | | | | | | |
| | | Shares | | | | | |
Invesco Government & Agency Portfolio, Cl Institutional, 2.300% (B) | | | | | | | | |
(Cost $18,411,427) | | | 18,411,427 | | | | 18,411,427 | |
Total Investments — 100.0% | | | | | | | | |
(Cost $515,600,767) | | | | | | $ | 534,377,904 | |
Percentages are based on Net Assets of $534,595,964.
A list of the open futures contracts held by the Fund at February 28, 2019, is as follows:
Type of
Contract | Number of
Contracts
Long | Expiration
Date | | Notional
Amount | | | Value | | | Unrealized
Appreciation | |
MSCI EAFE Index E-MINI | 2 | Mar-2019 | | $ | 170,179 | | | $ | 186,900 | | | $ | 16,721 | |
MSCI Emerging Markets | 8 | Mar-2019 | | | 385,590 | | | | 418,680 | | | | 33,090 | |
S&P 500 Index E-MINI | 27 | Mar-2019 | | | 3,739,222 | | | | 3,759,345 | | | | 20,123 | |
S&P TSX 60 Index | 6 | Mar-2019 | | | 775,387 | | | | 868,483 | | | | 84,522 | |
SGX Nifty 50 | 110 | Mar-2019 | | | 2,389,473 | | | | 2,391,400 | | | | 1,927 | |
| | | | | $ | 7,459,851 | | | $ | 7,624,808 | | | $ | 156,383 | |
Open total return swap agreements held by the Fund at February 28, 2019 are as follows:
Counterparty | Reference
Entity/
Obligation | Fund Pays | Fund
Receives | Payment
Frequency | Termination
Date | Currency | | Notional
Amount | | | Value | | | Net
Unrealized
Appreciation | |
ReFlow | SPGEX NAV | SOFR +35 bps | SPGEX | Annually | 02/05/2020 | USD | | | 9,905,434 | | | $ | 79,238 | | | $ | 79,238 | |
* | Non-income producing security. |
‡ | Real Estate Investment Trust |
‡‡ | Expiration date not available. |
(B) | The rate reported is the 7-day effective yield as of February 28, 2019. |
The accompanying notes are an integral part of the financial statements.
65
SYMMETRY PANORAMIC GLOBAL EQUITY FUND
FEBRUARY 28, 2019
(Unaudited)
ADR — American Depositary Receipt
BPS — Basis Points
Cl — Class
EAFE — Europe, Australasia and Far East
ETF — Exchange-Traded Fund
MIN — Minimun
MSCI — Morgan Stanley Capital International
NVDR— Non-Voting Depository Receipt
S&P— Standard & Poor's
SGX — Singapore Exchange
SOFR — Secured Overnight Financing Rate
SPGEX — Symmetry Panoramic Global Equity Fund
TSX — Toronto Stock Exchange
USD — United States Dollar
VOL — Volatility
The following table summarizes the inputs used as of February 28, 2019, in valuing the Fund’s investments and other financial instruments carried at value:
Investments in Securities | | Level 1 | | | Level 2 | | | Level 3 | | | Total | |
Registered Investment Companies | | $ | 378,364,363 | | | $ | — | | | $ | — | | | $ | 378,364,363 | |
Common Stock | | | | | | | | | | | | | | | | |
Australia | | | — | | | | 2,511,244 | | | | — | | | | 2,511,244 | |
Belgium | | | — | | | | 372,604 | | | | — | | | | 372,604 | |
Brazil | | | 2,743,916 | | | | — | | | | — | | | | 2,743,916 | |
Canada | | | 2,858,678 | | | | — | | | | — | | | | 2,858,678 | |
China | | | — | | | | 411,861 | | | | — | | | | 411,861 | |
Denmark | | | — | | | | 467,117 | | | | — | | | | 467,117 | |
Finland | | | — | | | | 604,536 | | | | — | | | | 604,536 | |
France | | | — | | | | 2,118,543 | | | | — | | | | 2,118,543 | |
Germany | | | — | | | | 2,470,588 | | | | — | | | | 2,470,588 | |
Hong Kong | | | — | | | | 10,842,300 | | | | — | | | | 10,842,300 | |
Hungary | | | — | | | | 145,713 | | | | — | | | | 145,713 | |
Indonesia | | | — | | | | 583,772 | | | | — | | | | 583,772 | |
Italy | | | — | | | | 788,317 | | | | — | | | | 788,317 | |
Japan | | | — | | | | 12,782,696 | | | | — | | | | 12,782,696 | |
Malaysia | | | — | | | | 1,365,688 | | | | — | | | | 1,365,688 | |
Mexico | | | 403,636 | | | | — | | | | — | | | | 403,636 | |
Netherlands | | | — | | | | 1,531,540 | | | | — | | | | 1,531,540 | |
Norway | | | — | | | | 496,938 | | | | — | | | | 496,938 | |
Philippines | | | — | | | | 145,618 | | | | — | | | | 145,618 | |
Poland | | | — | | | | 415,452 | | | | — | | | | 415,452 | |
Portugal | | | — | | | | 134,045 | | | | — | | | | 134,045 | |
Singapore | | | — | | | | 850,468 | | | | — | | | | 850,468 | |
South Africa | | | 73,741 | | | | 1,327,599 | | | | — | | | | 1,401,340 | |
The accompanying notes are an integral part of the financial statements.
66
SYMMETRY PANORAMIC GLOBAL EQUITY FUND
FEBRUARY 28, 2019
(Unaudited)
Investments in Securities | | Level 1 | | | Level 2 | | | Level 3 | | | Total | |
South Korea | | $ | — | | | $ | 2,082,074 | | | $ | — | | | $ | 2,082,074 | |
Spain | | | — | | | | 1,199,113 | | | | — | | | | 1,199,113 | |
Sweden | | | — | | | | 1,189,937 | | | | — | | | | 1,189,937 | |
Switzerland | | | — | | | | 3,433,459 | | | | — | | | | 3,433,459 | |
Taiwan | | | 816,809 | | | | 3,253,280 | | | | — | | | | 4,070,089 | |
Thailand | | | — | | | | 1,112,845 | | | | — | | | | 1,112,845 | |
Turkey | | | — | | | | 46,375 | | | | — | | | | 46,375 | |
United Kingdom | | | — | | | | 4,119,448 | | | | — | | | | 4,119,448 | |
United States | | | 73,071,144 | | | | — | | | | — | | | | 73,071,144 | |
Total Common Stock | | | 79,967,924 | | | | 56,803,170 | | | | — | | | | 136,771,094 | |
Preferred Stock | | | | | | | | | | | | | | | | |
Brazil | | | 831,020 | | | | — | | | | — | | | | 831,020 | |
Rights | | | — | | | | — | | | | — | | | | — | |
Short-Term Investment | | | 18,411,427 | | | | — | | | | — | | | | 18,411,427 | |
Total Investments in Securities | | $ | 477,574,734 | | | $ | 56,803,170 | | | $ | — | | | $ | 534,377,904 | |
Other Financial Instruments | | Level 1 | | | Level 2 | | | Level 3 | | | Total | |
Futures Contracts^ | | | | | | | | | | | | | | | | |
Unrealized Appreciation | | $ | 156,383 | | | $ | | | | $ | | | | $ | 156,383 | |
Total Return Swap^ | | | | | | | | | | | | | | | | |
Unrealized Appreciation | | | — | | | | 79,238 | | | | — | | | | 79,238 | |
Total Other Financial Instruments | | $ | 156,383 | | | $ | 79,238 | | | $ | — | | | $ | 235,621 | |
^ | Futures and swap contracts are valued at the unrealized appreciation on the instrument. |
Amounts designated as “— ” are $0.
Transfers between investment levels may occur as markets fluctuate and/or the availability of data used in an investment’s valuation changes. The Fund generally recognizes transfers between the levels as of the end of the reporting period. As of February 28, 2019, securities with a total value of $56,803,170 were classified as Level 2 as a result of fair valuation of foreign securities. For the period ended February 28, 2019, there were no transfers between Levels.
For the period ended February 28, 2019, there were no Level 3 securities.
For more information on valuation inputs, see Note 2 – Significant Accounting Policies in the Notes to Financial Statements.
The accompanying notes are an integral part of the financial statements.
67
SYMMETRY PANORAMIC TAX-MANAGED GLOBAL EQUITY FUND
FEBRUARY 28, 2019
(Unaudited)

†Percentages are based on total investments.
SCHEDULE OF INVESTMENTS |
REGISTERED INVESTMENT COMPANIES — 98.3% |
| | | Shares | | | Value | |
AQR TM Emerging Multi-Style Fund | | | 47,903 | | | $ | 493,402 | |
AQR TM International Multi-Style Fund | | | 80,458 | | | | 831,935 | |
AQR TM Large Capital Multi-Style Fund | | | 96,478 | | | | 1,220,442 | |
DFA Emerging Markets Core Equity Portfolio, Cl I | | | 37,235 | | | | 770,402 | |
DFA International Vector Equity Portfolio | | | 92,934 | | | | 1,065,952 | |
DFA Real Estate Securities Portfolio, Cl I | | | 11,647 | | | | 426,736 | |
DFA TA US Core Equity 2 Portfolio | | | 96,602 | | | | 1,759,120 | |
DFA TA World ex US Core Equity Portfolio | | | 58,579 | | | | 617,418 | |
DFA US Vector Equity Portfolio, Cl I | | | 98,504 | | | | 1,807,546 | |
iShares Edge MSCI Min Vol Global ETF | | | 8,541 | | | | 748,277 | |
Total Registered Investment Companies | | | | | | | | |
(Cost $8,927,719) | | | | | | | 9,741,230 | |
| | | | | | | | | |
SHORT-TERM INVESTMENT — 3.6% | | | | | | | | |
| | | | | | | | | |
Invesco Government & Agency Portfolio, Cl Institutional, 2.300% (A) | | | | | | | | |
(Cost $359,210) | | | 359,210 | | | | 359,210 | |
Total Investments — 101.9% | | | | | | | | |
(Cost $9,286,929) | | | | | | $ | 10,100,440 | |
Percentages are based on Net Assets of $9,916,782.
Open total return swap agreements held by the Fund at February 28, 2019 are as follows:
Counterparty | Reference
Entity/
Obligation | Fund Pays | Fund
Receives | Payment
Frequency | Termination
Date | Currency | | Notional
Amount | | | Value | | | Net
Unrealized
Appreciation | |
ReFlow | SPGTX NAV | SOFR +35 bps | SPGTX | Annually | 02/05/2020 | USD | | | 201,839 | | | $ | 5,673 | | | $ | 5,673 | |
(A) | The rate reported is the 7-day effective yield as of February 28, 2019. |
The accompanying notes are an integral part of the financial statements.
68
SYMMETRY PANORAMIC TAX-MANAGED GLOBAL EQUITY FUND
FEBRUARY 28, 2019
(Unaudited)
BPS — Basis Points
Cl — Class
ETF — Exchange Traded Fund
MIN — Minimum
MSCI — Morgan Stanly Capital International
SPGTX — Symmetry Panoramic Tax-Managed Global Equity Fund
SOFR — Secured Overnight Financing Rate
USD — United States Dollar
VOL — Volatility
The following table summarizes the inputs used as of, in valuing the Fund’s investments and other financial instruments carried at value:
Investments in Securities | | Level 1 | | | Level 2 | | | Level 3 | | | Total | |
Registered Investment Companies | | $ | 9,741,230 | | | $ | — | | | $ | — | | | $ | 9,741,230 | |
Short-Term Investment | | | 359,210 | | | | — | | | | — | | | | 359,210 | |
Total Investments in Securities | | $ | 10,100,440 | | | $ | — | | | $ | — | | | $ | 10,100,440 | |
Other Financial Instruments | | Level 1 | | | Level 2 | | | Level 3 | | | Total | |
Total Return Swap^ | | | | | | | | | | | | | | | | |
Unrealized Appreciation | | $ | — | | | $ | 5,673 | | | $ | — | | | $ | 5,673 | |
Total Other Financial Instruments | | $ | — | | | $ | 5,673 | | | $ | — | | | $ | 5,673 | |
^ | Swap contracts are valued at the unrealized appreciation on the instrument. |
Amounts designated as “— ” are $0.
For the period ended February 28, 2019, there were no transfers between Level 1, Level 2 and/or Level 3 assets and liabilities. Transfers, if any, between levels are considered to have occurred at the end of the period.
For the period ended February 28, 2019, there were no Level 3 securities.
For more information on valuation inputs, see Note 2 – Significant Accounting Policies in the Notes to Financial Statements.
The accompanying notes are an integral part of the financial statements.
69
SYMMETRY PANORAMIC US FIXED INCOME FUND
FEBRUARY 28, 2019
(Unaudited)

†Percentages are based on total investments.
SCHEDULE OF INVESTMENTS |
REGISTERED INVESTMENT COMPANIES — 98.1% |
| | | Shares | | | Value | |
DFA One-Year Fixed Income Portfolio, Cl I | | | 2,332,177 | | | $ | 23,974,776 | |
Vanguard Short-Term Bond Index Fund, Cl Admiral Shares | | | 7,840,696 | | | | 81,072,799 | |
Vanguard Total Bond Market Index Fund, Cl Admiral Shares | | | 8,658,016 | | | | 90,909,168 | |
Total Registered Investment Companies | | | | | | | | |
(Cost $194,160,223) | | | | | | | 195,956,743 | |
| | | | | | | | | |
SHORT-TERM INVESTMENT — 1.9% | | | | | | | | |
| | | | | | | | | |
Invesco Government & Agency Portfolio, Cl Institutional, 2.300% (A) | | | | | | | | |
(Cost $3,810,286) | | | 3,810,286 | | | | 3,810,286 | |
Total Investments — 100.0% | | | | | | | | |
(Cost $197,970,509) | | | | | | $ | 199,767,029 | |
Percentages are based on Net Assets of $199,699,713.
(A) | The rate reported is the 7-day effective yield as of February 28, 2019. |
Cl — Class
As of February 28, 2019, all of the Fund’s investments in securities were considered Level 1, in accordance with the authoritative guidance on fair value measurement and disclosure under U.S. generally accepted accounting principles.
For the period ended February 28, 2019, there were no transfers between Level 1, Level 2 and/or Level 3 assets and liabilities. Transfers, if any, between levels are considered to have occurred at the end of the period. For the period ended February 28, 2019, there were no Level 3 securities.
For more information on valuation inputs, see Note 2 – Significant Accounting Policies in the Notes to Financial Statements.
The accompanying notes are an integral part of the financial statements.
70
SYMMETRY PANORAMIC MUNICIPAL FIXED INCOME FUND
FEBRUARY 28, 2019
(Unaudited)

†Percentages are based on total investments.
SCHEDULE OF INVESTMENTS |
REGISTERED INVESTMENT COMPANIES — 98.9% |
| | | Shares | | | Value | |
DFA Intermediate-Term Municipal Bond Portfolio, Cl I | | | 83,151 | | | $ | 846,474 | |
DFA Short-Term Municipal Bond Portfolio, Cl I | | | 188,846 | | | | 1,918,676 | |
Total Registered Investment Companies | | | | | | | | |
(Cost $2,758,210) | | | | | | | 2,765,150 | |
| | | | | | | | | |
SHORT-TERM INVESTMENT — 6.3% | | | | | | | | |
| | | | | | | | | |
Invesco Government & Agency Portfolio, Cl Institutional, 2.300% (A) | | | | | | | | |
(Cost $176,204) | | | 176,204 | | | | 176,204 | |
Total Investments — 105.2% | | | | | | | | |
(Cost $2,934,414) | | | | | | $ | 2,941,354 | |
Percentages are based on Net Assets of $2,795,169.
(A) | The rate reported is the 7-day effective yield as of February 28, 2019. |
Cl — Class
As of February 28, 2019, all of the Fund’s investments in securities were considered Level 1, in accordance with the authoritative guidance on fair value measurement and disclosure under U.S. generally accepted accounting principles.
For the period ended February 28, 2019, there were no transfers between Level 1, Level 2 and/or Level 3 assets and liabilities. Transfers, if any, between levels are considered to have occurred at the end of the period. For the period ended February 28, 2019, there were no Level 3 securities.
For more information on valuation inputs, see Note 2 – Significant Accounting Policies in the Notes to Financial Statements.
The accompanying notes are an integral part of the financial statements.
71
SYMMETRY PANORAMIC GLOBAL FIXED INCOME FUND
FEBRUARY 28, 2019
(Unaudited)

†Percentages are based on total investments.
SCHEDULE OF INVESTMENTS |
REGISTERED INVESTMENT COMPANIES — 98.0% |
| | | Shares | | | Value | |
DFA Five-Year Global Fixed Income Portfolio, Cl I | | | 2,368,886 | | | $ | 25,204,946 | |
Vanguard Total Bond Market ETF | | | 7,001 | | | | 558,820 | |
Vanguard Total Bond Market Index Fund, Cl Admiral Shares | | | 16,303,459 | | | | 171,186,323 | |
Vanguard Total International Bond ETF | | | 40,001 | | | | 2,194,055 | |
Vanguard Total International Bond Index Fund, Cl Admiral Shares | | | 6,909,421 | | | | 151,454,515 | |
Total Registered Investment Companies | | | | | | | | |
(Cost $349,667,696) | | | | | | | 350,598,659 | |
| | | | | | | | | |
SHORT-TERM INVESTMENT — 1.9% | | | | | | | | |
| | | | | | | | | |
Invesco Government & Agency Portfolio, Cl Institutional, 2.300% (A) | | | | | | | | |
(Cost $6,711,640) | | | 6,711,640 | | | | 6,711,640 | |
Total Investments — 99.9% | | | | | | | | |
(Cost $356,379,336) | | | | | | $ | 357,310,299 | |
Percentages are based on Net Assets of $357,502,019.
(A) | The rate reported is the 7-day effective yield as of February 28, 2019. |
Cl — Class
ETF — Exchange Traded Fund
As of February 28, 2019, all of the Fund’s investments in securities were considered Level 1, in accordance with the authoritative guidance on fair value measurement and disclosure under U.S. generally accepted accounting principles.
For the period ended February 28, 2019, there were no transfers between Level 1, Level 2 and/or Level 3 assets and liabilities. Transfers, if any, between levels are considered to have occurred at the end of the period. For the period ended February 28, 2019, there were no Level 3 securities.
For more information on valuation inputs, see Note 2 – Significant Accounting Policies in the Notes to Financial Statements.
The accompanying notes are an integral part of the financial statements.
72
SYMMETRY PANORAMIC ALTERNATIVES FUND
FEBRUARY 28, 2019
(Unaudited)

†Percentages are based on total investments.
SCHEDULE OF INVESTMENTS |
REGISTERED INVESTMENT COMPANIES — 113.8% |
| | | Shares | | | Value | |
AQR Alternative Risk Premia Fund, Cl I | | | 4,067 | | | $ | 38,227 | |
AQR Diversified Arbitrage Fund, Cl I | | | 8,304 | | | | 74,399 | |
AQR Managed Futures Strategy Fund, Cl I | | | 4,638 | | | | 37,987 | |
JPMorgan Systematic Alpha Fund, Cl R6 | | | 4,310 | | | | 62,587 | |
Total Registered Investment Companies | | | | | | | | |
(Cost $215,306) | | | | | | | 213,200 | |
| | | | | | | | | |
SHORT-TERM INVESTMENT — 1.2% | | | | | | | | |
| | | | | | | | | |
Invesco Government & Agency Portfolio, Cl Institutional, 2.300% (A) | | | | | | | | |
(Cost $2,186) | | | 2,186 | | | | 2,186 | |
Total Investments — 115.0% | | | | | | | | |
(Cost $217,492) | | | | | | $ | 215,386 | |
Percentages are based on Net Assets of $187,271.
(A) | The rate reported is the 7-day effective yield as of February 28, 2019. |
Cl — Class
As of February 28, 2019, all of the Fund’s investments in securities were considered Level 1, in accordance with the authoritative guidance on fair value measurement and disclosure under U.S. generally accepted accounting principles.
For the period ended February 28, 2019, there were no transfers between Level 1, Level 2 and/or Level 3 assets and liabilities. Transfers, if any, between levels are considered to have occurred at the end of the period. For the period ended February 28, 2019, there were no Level 3 securities.
For more information on valuation inputs, see Note 2 – Significant Accounting Policies in the Notes to Financial Statements.
The accompanying notes are an integral part of the financial statements.
73
SYMMETRY PANORAMIC TRUST
FEBRUARY 28, 2019
(Unaudited)
STATEMENTS OF ASSETS AND LIABILITIES |
| | | US Equity
Fund | | | International
Equity Fund | | | Global Equity
Fund | | | Tax-Managed
Global Equity
Fund | |
Assets: | | | | | | | | | | | | | | | | |
Investments, at Value (Cost $503,272,863, $273,448,995, $515,600,767 and $9,286,929) | | $ | 521,510,413 | | | $ | 283,457,790 | | | $ | 534,377,904 | | | $ | 10,100,440 | |
Foreign Currency, at Value (Cost $—, $874,099, $710,643 and $—) | | | — | | | | 874,742 | | | | 711,198 | | | | — | |
Receivable for Capital Shares Sold | | | 334,389 | | | | 183,692 | | | | 345,649 | | | | — | |
Dividends and Interest Receivable | | | 210,946 | | | | 198,017 | | | | 282,479 | | | | 517 | |
Cash Collateral on Futures Contracts | | | 194,845 | | | | 49,202 | | | | 36,768 | | | | — | |
Unrealized Appreciation on Swap Contracts | | | 107,796 | | | | 27,223 | | | | 79,238 | | | | 5,673 | |
Deferred Offering Costs | | | 66,676 | | | | 34,751 | | | | 69,231 | | | | 812 | |
Reclaim Receivable | | | — | | | | 3,962 | | | | 2,990 | | | | — | |
Receivable Due from Adviser | | | — | | | | — | | | | — | | | | 249 | |
Prepaid Expenses | | | 7,598 | | | | 4,869 | | | | 7,801 | | | | 3,933 | |
Total Assets | | | 522,432,663 | | | | 284,834,248 | | | | 535,913,258 | | | | 10,111,624 | |
| | | | | | | | | | | | | | | | | |
Liabilities: | | | | | | | | | | | | | | | | |
Payable for Capital Shares Redeemed | | | 682,068 | | | | 348,996 | | | | 672,277 | | | | — | |
Payable Due to Adviser | | | 75,609 | | | | 62,304 | | | | 80,415 | | | | — | |
Transfer Agent Fees Payable | | | 46,540 | | | | 27,341 | | | | 50,597 | | | | 3,661 | |
Offering Costs Payable | | | 86,151 | | | | 47,989 | | | | 89,316 | | | | 1,153 | |
Payable Due to Administrator | | | 14,021 | | | | 7,667 | | | | 14,402 | | | | 267 | |
Insurance Fees Payable | | | 10,746 | | | | 7,304 | | | | 11,082 | | | | 2,936 | |
Legal Fees Payable | | | 9,749 | | | | 6,534 | | | | 10,060 | | | | 2,465 | |
Chief Compliance Officer Fees Payable | | | 7,488 | | | | 5,018 | | | | 7,726 | | | | 1,893 | |
Audit Fees Payable | | | 6,935 | | | | 6,935 | | | | 6,935 | | | | 6,935 | |
Payable for Investment Securities Purchased | | | — | | | | — | | | | — | | | | 157,371 | |
Due to Broker | | | — | | | | 554,619 | | | | 307,621 | | | | — | |
Trustees Fees Payable | | | — | | | | 2,153 | | | | — | | | | 8,076 | |
Other Accrued Expenses | | | 38,734 | | | | 50,032 | | | | 66,863 | | | | 10,085 | |
Total Liabilities | | | 978,041 | | | | 1,126,892 | | | | 1,317,294 | | | | 194,842 | |
| | | | | | | | | | | | | | | | | |
Net Assets | | $ | 521,454,622 | | | $ | 283,707,356 | | | $ | 534,595,964 | | | $ | 9,916,782 | |
| | | | | | | | | | | | | | | | | |
Net Assets Consist of: | | | | | | | | | | | | | | | | |
Paid-in Capital | | $ | 498,250,747 | | | $ | 271,907,794 | | | $ | 511,424,519 | | | $ | 9,101,355 | |
Total Distributable Earnings | | | 23,203,875 | | | | 11,799,562 | | | | 23,171,445 | | | | 815,427 | |
Net Assets | | $ | 521,454,622 | | | $ | 283,707,356 | | | $ | 534,595,964 | | | $ | 9,916,782 | |
| | | | | | | | | | | | | | | | | |
Outstanding Shares of Beneficial Interest (unlimited authorization - no par value) | | | 50,716,350 | | | | 27,098,200 | | | | 51,575,513 | | | | 942,588 | |
Net Asset Value, Offering and Redemption Price Per Share | | $ | 10.28 | | | $ | 10.47 | | | $ | 10.37 | | | $ | 10.52 | |
The accompanying notes are an integral part of the financial statements.
74
SYMMETRY PANORAMIC TRUST
FEBRUARY 28, 2019
(Unaudited)
STATEMENTS OF ASSETS AND LIABILITIES |
| | | US Fixed
Income Fund | | | Municipal
Fixed Income
Fund | | | Global Fixed
Income Fund | | | Alternatives
Fund | |
Assets: | | | | | | | | | | | | | | | | |
Investments, at Value (Cost $197,970,509, $2,934,414, $356,379,336 and $217,492) | | $ | 199,767,029 | | | $ | 2,941,354 | | | $ | 357,310,299 | | | $ | 215,386 | |
Receivable for Capital Shares Sold | | | 43,827 | | | | — | | | | 207,744 | | | | — | |
Dividends and Interest Receivable | | | 324,765 | | | | 147 | | | | 496,565 | | | | 10 | |
Receivable for Investment Securities Sold | | | — | | | | — | | | | — | | | | 3,183 | |
Deferred Offering Costs | | | 22,971 | | | | 212 | | | | 43,325 | | | | 18 | |
Receivable Due from Adviser | | | — | | | | 1,238 | | | | — | | | | 1,631 | |
Prepaid Expenses | | | 2,402 | | | | 1,953 | | | | 6,955 | | | | 1,953 | |
Total Assets | | | 200,160,994 | | | | 2,944,904 | | | | 358,064,888 | | | | 222,181 | |
| | | | | | | | | | | | | | | | | |
Liabilities: | | | | | | | | | | | | | | | | |
Payable for Capital Shares Redeemed | | | 337,055 | | | | 605 | | | | 355,768 | | | | — | |
Payable Due to Adviser | | | 10,309 | | | | — | | | | 29,687 | | | | — | |
Transfer Agent Fees Payable | | | 20,324 | | | | 3,220 | | | | 36,505 | | | | 3,143 | |
Custodian Fees Payable | | | 20,690 | | | | 4,623 | | | | 31,707 | | | | 4,623 | |
Offering Costs Payable | | | 33,692 | | | | 301 | | | | 58,536 | | | | 25 | |
Payable Due to Administrator | | | 5,283 | | | | 71 | | | | 9,510 | | | | 4 | |
Insurance Fees Payable | | | 5,881 | | | | 2,829 | | | | 8,393 | | | | 2,752 | |
Legal Fees Payable | | | 5,209 | | | | 2,367 | | | | 7,550 | | | | 2,298 | |
Chief Compliance Officer Fees Payable | | | 4,001 | | | | 1,818 | | | | 5,798 | | | | 1,765 | |
Audit Fees Payable | | | 6,935 | | | | 6,935 | | | | 6,935 | | | | 6,935 | |
Payable for Investment Securities Purchased | | | — | | | | 113,546 | | | | — | | | | — | |
Trustees Fees Payable | | | 3,595 | | | | 8,084 | | | | 1,236 | | | | 8,087 | |
Other Accrued Expenses | | | 8,307 | | | | 5,336 | | | | 11,244 | | | | 5,278 | |
Total Liabilities | | | 461,281 | | | | 149,735 | | | | 562,869 | | | | 34,910 | |
| | | | | | | | | | | | | | | | | |
Net Assets | | $ | 199,699,713 | | | $ | 2,795,169 | | | $ | 357,502,019 | | | $ | 187,271 | |
| | | | | | | | | | | | | | | | | |
Net Assets Consist of: | | | | | | | | | | | | | | | | |
Paid-in Capital | | $ | 197,892,520 | | | $ | 2,788,219 | | | $ | 356,579,897 | | | $ | 189,674 | |
Total Distributable Earnings (Loss) | | | 1,807,193 | | | | 6,950 | | | | 922,122 | | | | (2,403 | ) |
Net Assets | | $ | 199,699,713 | | | $ | 2,795,169 | | | $ | 357,502,019 | | | $ | 187,271 | |
| | | | | | | | | | | | | | | | | |
Outstanding Shares of Beneficial Interest (unlimited authorization - no par value) | | | 19,617,205 | | | | 276,398 | | | | 35,293,042 | | | | 19,275 | |
Net Asset Value, Offering and Redemption Price Per Share | | $ | 10.18 | | | $ | 10.11 | | | $ | 10.13 | | | $ | 9.72 | |
The accompanying notes are an integral part of the financial statements.
75
SYMMETRY PANORAMIC TRUST
PERIOD ENDED FEBRUARY 28, 2019(1)
(Unaudited)
STATEMENTS OF OPERATIONS |
| | | US Equity
Fund | | | International
Equity Fund | | | Global Equity
Fund | | | Tax-Managed
Global Equity
Fund | |
Investment Income: | | | | | | | | | | | | | | | | |
Dividend Income | | $ | 2,147,493 | | | $ | 2,504,785 | | | $ | 3,185,227 | | | $ | 4,343 | |
Less: Foreign Taxes Withheld | | | — | | | | (17,036 | ) | | | (12,966 | ) | | | — | |
Total Investment Income | | | 2,147,493 | | | | 2,487,749 | | | | 3,172,261 | | | | 4,343 | |
| | | | | | | | | | | | | | | | | |
Expenses: | | | | | | | | | | | | | | | | |
Investment Advisory Fees | | | 574,139 | | | | 434,945 | | | | 702,056 | | | | 8,067 | |
Administration Fees | | | 35,502 | | | | 23,085 | | | | 36,440 | | | | 8,117 | |
Trustees’ Fees | | | 8,091 | | | | 8,091 | | | | 8,091 | | | | 8,091 | |
Chief Compliance Officer Fees | | | 7,488 | | | | 5,018 | | | | 7,726 | | | | 1,893 | |
Transfer Agent Fees | | | 81,375 | | | | 49,190 | | | | 86,572 | | | | 8,947 | |
Custodian Fees | | | 26,106 | | | | 29,793 | | | | 45,023 | | | | 4,623 | |
Offering Costs | | | 19,475 | | | | 13,238 | | | | 20,085 | | | | 341 | |
Legal Fees | | | 9,749 | | | | 6,534 | | | | 10,060 | | | | 2,465 | |
Registration Fees | | | 9,325 | | | | 5,210 | | | | 9,584 | | | | 488 | |
Audit Fees | | | 6,935 | | | | 6,935 | | | | 6,935 | | | | 6,935 | |
Printing Fees | | | 3,743 | | | | 2,510 | | | | 3,863 | | | | 945 | |
Insurance and Other Expenses | | | 17,886 | | | | 23,228 | | | | 27,746 | | | | 8,144 | |
| | | | | | | | | | | | | | | | | |
Total Expenses | | | 799,814 | | | | 607,777 | | | | 964,181 | | | | 59,056 | |
Less: | | | | | | | | | | | | | | | | |
Waiver of Investment Advisory Fees | | | (353,739 | ) | | | (271,166 | ) | | | (463,098 | ) | | | (8,067 | ) |
Reimbursement by Investment Adviser | | | — | | | | — | | | | — | | | | (45,776 | ) |
Net Expenses | | | 446,075 | | | | 336,611 | | | | 501,083 | | | | 5,213 | |
| | | | | | | | | | | | | | | | | |
Net Investment Income (Loss) | | | 1,701,418 | | | | 2,151,138 | | | | 2,671,178 | | | | (870 | ) |
(1) | The Funds commenced operations on November 12, 2018. |
The accompanying notes are an integral part of the financial statements.
76
SYMMETRY PANORAMIC TRUST
PERIOD ENDED FEBRUARY 28, 2019(1)
(Unaudited)
STATEMENTS OF OPERATIONS - continued |
| | US Equity
Fund | International
Equity Fund | Global Equity
Fund | Tax-Managed
Global Equity
Fund |
Net Realized and Unrealized Gain (Loss) on Investments | | | | |
Net Realized Gain on Investments Sold | $ 4,706,253 | $ 1,366,787 | $ 3,851,300 | $ 409 |
Net Realized Gain (Loss) on Futures Contracts | (115,567) | 255,348 | 282,291 | — |
Net Realized Gain on Foreign Currency Transactions | — | 9,086 | 13,476 | — |
Net Change in Unrealized Appreciation on Investments | 18,237,550 | 10,008,795 | 18,777,137 | 813,511 |
Net Change in Unrealized Appreciation on Futures Contracts | 241,898 | 163,399 | 156,383 | — |
Net Change in Unrealized Appreciation on Swap Contracts | 107,796 | 27,223 | 79,238 | 5,673 |
Net Change in Unrealized Appreciation on Foreign Currency Transactions and Translation of other Assets and Liabilities Denominated in Foreign Currencies | — | 1,174 | 939 | — |
Net Realized and Unrealized Gain on Investments, Swap Contracts, Futures Contracts, Foreign Currency Transactions and Translation of other Assets and Liabilities Denominated in Foreign Currencies | 23,177,930 | 11,831,812 | 23,160,764 | 819,593 |
Net Increase in Net Assets Resulting from Operations | $ 24,879,348 | $ 13,982,950 | $ 25,831,942 | $ 818,723 |
(1) | The Funds commenced operations on November 12, 2018. |
The accompanying notes are an integral part of the financial statements.
77
SYMMETRY PANORAMIC TRUST
PERIOD ENDED FEBRUARY 28, 2019(1)
(Unaudited)
STATEMENTS OF OPERATIONS |
| | | US Fixed
Income Fund | | | Municipal
Fixed Income
Fund | | | Global Fixed
Income Fund | | | Alternatives
Fund | |
Investment Income: | | | | | | | | | | | | | | | | |
Dividend Income | | $ | 970,224 | | | $ | 5,631 | | | $ | 4,376,446 | | | $ | 2,369 | |
Total Investment Income | | | 970,224 | | | | 5,631 | | | | 4,376,446 | | | | 2,369 | |
| | | | | | | | | | | | | | | | | |
Expenses: | | | | | | | | | | | | | | | | |
Investment Advisory Fees | | | 163,628 | | | | 1,541 | | | | 328,317 | | | | 421 | |
Administration Fees | | | 18,212 | | | | 7,765 | | | | 26,787 | | | | 7,652 | |
Trustees' Fees | | | 8,091 | | | | 8,091 | | | | 8,091 | | | | 8,091 | |
Chief Compliance Officer Fees | | | 4,001 | | | | 1,818 | | | | 5,798 | | | | 1,765 | |
Transfer Agent Fees | | | 37,426 | | | | 8,134 | | | | 60,838 | | | | 7,832 | |
Custodian Fees | | | 20,690 | | | | 4,623 | | | | 31,707 | | | | 4,623 | |
Offering Costs | | | 10,721 | | | | 89 | | | | 15,211 | | | | 7 | |
Audit Fees | | | 6,935 | | | | 6,935 | | | | 6,935 | | | | 6,935 | |
Legal Fees | | | 5,209 | | | | 2,367 | | | | 7,550 | | | | 2,298 | |
Registration Fees | | | 3,566 | | | | 303 | | | | 6,461 | | | | 269 | |
Printing Fees | | | 2,004 | | | | 908 | | | | 2,897 | | | | 883 | |
Insurance and Other Expenses | | | 11,378 | | | | 8,038 | | | | 14,072 | | | | 7,960 | |
| | | | | | | | | | | | | | | | | |
Total Expenses | | | 291,861 | | | | 50,612 | | | | 514,664 | | | | 48,736 | |
Less: | | | | | | | | | | | | | | | | |
Waiver of Investment Advisory Fees | | | (142,780 | ) | | | (1,541 | ) | | | (243,172 | ) | | | (421 | ) |
Reimbursement by Investment Adviser | | | — | | | | (47,727 | ) | | | — | | | | (48,151 | ) |
Net Expenses | | | 149,081 | | | | 1,344 | | | | 271,492 | | | | 164 | |
| | | | | | | | | | | | | | | | | |
Net Investment Income | | | 821,143 | | | | 4,287 | | | | 4,104,954 | | | | 2,205 | |
| | | | | | | | | | | | | | | | | |
Net Realized and Unrealized Gain (Loss) on Investments | | | | | | | | | | | | | | | | |
Net Realized Gain (Loss) on Investments Sold | | | 11,558 | | | | — | | | | (9,406 | ) | | | (220 | ) |
Net Realized Gain Received on Distributions from Registered Investment Companies | | | — | | | | — | | | | — | | | | 9 | |
Net Change in Unrealized Appreciation (Depreciation) on Investments | | | 1,796,520 | | | | 6,940 | | | | 930,963 | | | | (2,106 | ) |
Net Realized and Unrealized Gain (Loss) on Investments | | | 1,808,078 | | | | 6,940 | | | | 921,557 | | | | (2,317 | ) |
Net Increase (Decrease) in Net Assets Resulting from Operations | | $ | 2,629,221 | | | $ | 11,227 | | | $ | 5,026,511 | | | $ | (112 | ) |
(1) | The Funds commenced operations on November 12, 2018. |
The accompanying notes are an integral part of the financial statements.
78
SYMMETRY PANORAMIC TRUST
STATEMENTS OF CHANGES IN NET ASSETS |
| | | US Equity
Fund | | | International
Equity Fund | |
| | | Period Ended
February 28,
2019*
(Unaudited) | | | Period Ended
February 28,
2019*
(Unaudited) | |
Operations: | | | | | | | | |
Net Investment Income | | $ | 1,701,418 | | | $ | 2,151,138 | |
Net Realized Gain on Investments, Futures Contracts, and Foreign Currency Transactions | | | 4,590,686 | | | | 1,631,221 | |
Net Change in Unrealized Appreciation on Investments, Futures Contracts, Swap Contacts, and Foreign Currency Transactions and Translation of other Assets and Liabilities Denominated in Foreign Currencies | | | 18,587,244 | | | | 10,200,591 | |
Net Increase in Net Assets Resulting from Operations | | | 24,879,348 | | | | 13,982,950 | |
| | | | | | | | | |
Distributions | | | (1,675,473 | ) | | | (2,183,388 | ) |
| | | | | | | | | |
Capital Share Transactions: | | | | | | | | |
Class I Shares: | | | | | | | | |
Issued | | | 527,873,599 | | | | 287,512,994 | |
Reinvestment of Distributions | | | 1,675,473 | | | | 2,183,388 | |
Redeemed | | | (31,298,325 | ) | | | (17,788,588 | ) |
Net Class I Share Transactions | | | 498,250,747 | | | | 271,907,794 | |
Net Increase in Net Assets from Share Transactions | | | 498,250,747 | | | | 271,907,794 | |
Total Increase in Net Assets | | | 521,454,622 | | | | 283,707,356 | |
| | | | | | | | | |
Net Assets: | | | | | | | | |
Beginning of Period | | | — | | | | — | |
End of Period | | $ | 521,454,622 | | | $ | 283,707,356 | |
| | | | | | | | | |
Share Transactions: | | | | | | | | |
Class I Shares: | | | | | | | | |
Issued | | | 53,757,694 | | | | 28,634,471 | |
Reinvestment of Distributions | | | 184,118 | | | | 226,024 | |
Redeemed | | | (3,225,462 | ) | | | (1,762,295 | ) |
Net Increase in Shares Outstanding from Share Transactions | | | 50,716,350 | | | | 27,098,200 | |
* | The Funds commenced operations on November 12, 2018. |
Amounts designated as “—” are $0.
The accompanying notes are an integral part of the financial statements.
79
SYMMETRY PANORAMIC TRUST
STATEMENTS OF CHANGES IN NET ASSETS |
| | | Global Equity
Fund | | | Tax-Managed
Global Equity
Fund | |
| | | Period Ended
February 28,
2019*
(Unaudited) | | | Period Ended
February 28,
2019*
(Unaudited) | |
Operations: | | | | | | | | |
Net Investment Income (Loss) | | $ | 2,671,178 | | | $ | (870 | ) |
Net Realized Gain on Investments, Futures Contracts, and Foreign Currency Transactions | | | 4,147,067 | | | | 409 | |
Net Change in Unrealized Appreciation on Investments, Futures Contracts, Swap Contacts, and Foreign Currency Transactions and Translation of other Assets and Liabilities Denominated in Foreign Currencies. | | | 19,013,697 | | | | 819,184 | |
Net Increase in Net Assets Resulting from Operations | | | 25,831,942 | | | | 818,723 | |
| | | | | | | | | |
Distributions | | | (2,660,497 | ) | | | (3,296 | ) |
| | | | | | | | | |
Capital Share Transactions: | | | | | | | | |
Class I Shares: | | | | | | | | |
Issued | | | 541,910,258 | | | | 9,254,631 | |
Reinvestment of Distributions | | | 2,660,497 | | | | 3,296 | |
Redeemed | | | (33,146,236 | ) | | | (156,572 | ) |
Net Class I Share Transactions | | | 511,424,519 | | | | 9,101,355 | |
Net Increase in Net Assets from Share Transactions | | | 511,424,519 | | | | 9,101,355 | |
Total Increase in Net Assets | | | 534,595,964 | | | | 9,916,782 | |
| | | | | | | | | |
Net Assets: | | | | | | | | |
Beginning of Period | | | — | | | | — | |
End of Period | | $ | 534,595,964 | | | $ | 9,916,782 | |
| | | | | | | | | |
Share Transactions: | | | | | | | | |
Class I Shares: | | | | | | | | |
Issued | | | 54,649,823 | | | | 957,593 | |
Reinvestment of Distributions | | | 285,155 | | | | 353 | |
Redeemed | | | (3,359,465 | ) | | | (15,358 | ) |
Net Increase in Shares Outstanding from Share Transactions | | | 51,575,513 | | | | 942,588 | |
* | The Funds commenced operations on November 12, 2018. |
Amounts designated as “—” are $0.
The accompanying notes are an integral part of the financial statements.
80
SYMMETRY PANORAMIC TRUST
STATEMENTS OF CHANGES IN NET ASSETS |
| | | US Fixed
Income Fund | | | Municipal
Fixed Income
Fund | |
| | | Period Ended
February 28,
2019*
(Unaudited) | | | Period Ended
February 28,
2019*
(Unaudited) | |
Operations: | | | | | | | | |
Net Investment Income | | $ | 821,143 | | | $ | 4,287 | |
Net Realized Gain on Investments | | | 11,558 | | | | — | |
Net Change in Unrealized Appreciation on Investments | | | 1,796,520 | | | | 6,940 | |
Net Increase in Net Assets Resulting from Operations | | | 2,629,221 | | | | 11,227 | |
| | | | | | | | | |
Distributions | | | (822,028 | ) | | | (4,277 | ) |
| | | | | | | | | |
Capital Share Transactions: | | | | | | | | |
Class I Shares: | | | | | | | | |
Issued | | | 214,978,867 | | | | 2,832,885 | |
Reinvestment of Distributions | | | 822,028 | | | | 4,277 | |
Redeemed | | | (17,908,375 | ) | | | (48,943 | ) |
Net Class I Share Transactions | | | 197,892,520 | | | | 2,788,219 | |
Net Increase in Net Assets from Share Transactions | | | 197,892,520 | | | | 2,788,219 | |
Total Increase in Net Assets | | | 199,699,713 | | | | 2,795,169 | |
| | | | | | | | | |
Net Assets: | | | | | | | | |
Beginning of Period | | | — | | | | — | |
End of Period | | $ | 199,699,713 | | | $ | 2,795,169 | |
| | | | | | | | | |
Share Transactions: | | | | | | | | |
Class I Shares: | | | | | | | | |
Issued | | | 21,301,883 | | | | 280,821 | |
Reinvestment of Distributions | | | 80,818 | | | | 423 | |
Redeemed | | | (1,765,496 | ) | | | (4,846 | ) |
Net Increase in Shares Outstanding from Share Transactions | | | 19,617,205 | | | | 276,398 | |
* | The Funds commenced operations on November 12, 2018. |
Amounts designated as “—” are $0.
The accompanying notes are an integral part of the financial statements.
81
SYMMETRY PANORAMIC TRUST
STATEMENTS OF CHANGES IN NET ASSETS |
| | | Global Fixed
Income Fund | | | Alternatives
Fund | |
| | | Period Ended
February 28,
2019*
(Unaudited) | | | Period Ended
February 28,
2019*
(Unaudited) | |
Operations: | | | | | | | | |
Net Investment Income | | $ | 4,104,954 | | | $ | 2,205 | |
Net Realized Loss on Investments and Realized Gain on Distributions from Registered Investments Companies | | | (9,406 | ) | | | (211 | ) |
Net Change in Unrealized Appreciation
(Depreciation) on Investments | | | 930,963 | | | | (2,106 | ) |
Net Increase (Decrease) in Net Assets Resulting from Operations | | | 5,026,511 | | | | (112 | ) |
| | | | | | | | | |
Distributions | | | (4,104,389 | ) | | | (2,291 | ) |
| | | | | | | | | |
Capital Share Transactions: | | | | | | | | |
Class I Shares: | | | | | | | | |
Issued | | | 374,654,418 | | | | 87,468 | |
Reinvestment of Distributions | | | 4,104,389 | | | | 2,291 | |
Redeemed | | | (22,178,910 | ) | | | (85 | ) |
Net Class I Share Transactions | | | 356,579,897 | | | | 89,674 | |
Net Increase in Net Assets from Share Transactions | | | 356,579,897 | | | | 89,674 | |
Total Increase in Net Assets | | | 357,502,019 | | | | 87,271 | |
| | | | | | | | | |
Net Assets: | | | | | | | | |
Beginning of Period | | | — | | | | 100,000 | |
End of Period | | $ | 357,502,019 | | | $ | 187,271 | |
| | | | | | | | | |
Share Transactions: | | | | | | | | |
Class I Shares: | | | | | | | | |
Issued (*including 10,000 seed shares) | | | 37,076,840 | | | | 19,045 | * |
Reinvestment of Distributions | | | 407,810 | | | | 239 | |
Redeemed | | | (2,191,608 | ) | | | (9 | ) |
Net Increase in Shares Outstanding from Share Transactions | | | 35,293,042 | | | | 19,275 | |
* | The Funds commenced operations on November 12, 2018. |
Amounts designated as “—” are $0.
The accompanying notes are an integral part of the financial statements.
82
SYMMETRY PANORAMIC US EQUITY FUND
FINANCIAL HIGHLIGHTS |
Selected Per Share Date & Ratios For a Share Outstanding Throughout the Period |
Class I Shares | | Period
Ended
February 28,
2019*
(Unaudited) | |
Net Asset Value, Beginning of Period | | $ | 10.00 | |
Income from Operations: | | | | |
Net Investment Income(1) | | | 0.05 | |
Net Realized and Unrealized Gain | | | 0.27 | |
Total from Operations | | | 0.32 | |
Dividends and Distributions: | | | | |
Net Investment Income | | | (0.04 | ) |
Total Dividends and Distributions | | | (0.04 | ) |
Net Asset Value, End of Period | | $ | 10.28 | |
Total Return† | | | 3.25 | % |
Ratios and Supplemental Data | | | | |
Net Assets, End of Period (Thousands) | | $ | 521,455 | |
Ratio of Expenses to Average Net Assets(3) | | | 0.48 | %** |
Ratio of Expenses to Average Net Assets (Excluding Waivers)(3) | | | 0.86 | %** |
Ratio of Net Investment Income to Average Net Assets(2) (3) | | | 1.83 | %** |
Portfolio Turnover Rate | | | 4 | %*** |
(1) | Calculated using average shares. |
(2) | Recognition of net investment income (loss) by the Fund is affected by the timing and declaration of dividends by the underlying investment companies in which the Fund invests. |
(3) | The ratios of expenses to average net assets and net investment income (loss) to average net assets do not reflect the expenses of the underlying investment companies in which the Fund invests. |
* | Commenced operations on November 12, 2018. |
† | Return is for the period indicated and has not been annualized. Total return would have been lower had certain expenses not been waived and assumed by the Adviser during the period. Returns shown do not reflect the deduction of taxes that a shareholder would pay on Fund distributions or the redemption of Fund shares. |
The accompanying notes are an integral part of the financial statements.
83
SYMMETRY PANORAMIC INTERNATIONAL EQUITY FUND
FINANCIAL HIGHLIGHTS |
Selected Per Share Date & Ratios For a Share Outstanding Throughout the Period |
Class I Shares | | Period
Ended
February 28,
2019*
(Unaudited) | |
Net Asset Value, Beginning of Period | | $ | 10.00 | |
Income from Operations: | | | | |
Net Investment Income(1) | | | 0.12 | |
Net Realized and Unrealized Gain | | | 0.45 | |
Total from Operations | | | 0.57 | |
Dividends and Distributions: | | | | |
Net Investment Income | | | (0.10 | ) |
Total Dividends and Distributions | | | (0.10 | ) |
Net Asset Value, End of Period | | $ | 10.47 | |
Total Return† | | | 5.76 | % |
Ratios and Supplemental Data | | | | |
Net Assets, End of Period (Thousands) | | $ | 283,707 | |
Ratio of Expenses to Average Net Assets(3) | | | 0.65 | %** |
Ratio of Expenses to Average Net Assets (Excluding Waivers)(3) | | | 1.17 | %** |
Ratio of Net Investment Income to Average Net Assets(2) (3) | | | 4.15 | %** |
Portfolio Turnover Rate | | | 7 | %*** |
(1) | Calculated using average shares. |
(2) | Recognition of net investment income (loss) by the Fund is affected by the timing and declaration of dividends by the underlying investment companies in which the Fund invests. |
(3) | The ratios of expenses to average net assets and net investment income (loss) to average net assets do not reflect the expenses of the underlying investment companies in which the Fund invests. |
* | Commenced operations on November 12, 2018. |
† | Return is for the period indicated and has not been annualized. Total return would have been lower had certain expenses not been waived and assumed by the Adviser during the period. Returns shown do not reflect the deduction of taxes that a shareholder would pay on Fund distributions or the redemption of Fund shares. |
The accompanying notes are an integral part of the financial statements.
84
SYMMETRY PANORAMIC GLOBAL EQUITY FUND
FINANCIAL HIGHLIGHTS |
Selected Per Share Date & Ratios For a Share Outstanding Throughout the Period |
Class I Shares | | Period
Ended
February 28,
2019*
(Unaudited) | |
Net Asset Value, Beginning of Period | | $ | 10.00 | |
Income from Operations: | | | | |
Net Investment Income(1) | | | 0.08 | |
Net Realized and Unrealized Gain | | | 0.35 | |
Total from Operations | | | 0.43 | |
Dividends and Distributions: | | | | |
Net Investment Loss | | | (0.06 | ) |
Total Dividends and Distributions | | | (0.06 | ) |
Net Asset Value, End of Period | | $ | 10.37 | |
Total Return† | | | 4.39 | % |
Ratios and Supplemental Data | | | | |
Net Assets, End of Period (Thousands) | | $ | 534,596 | |
Ratio of Expenses to Average Net Assets(3) | | | 0.52 | %** |
Ratio of Expenses to Average Net Assets (Excluding Waivers)(3) | | | 1.00 | %** |
Ratio of Net Investment Income to Average Net Assets(2) (3) | | | 2.77 | %** |
Portfolio Turnover Rate | | | 5 | %*** |
(1) | Calculated using average shares. |
(2) | Recognition of net investment income (loss) by the Fund is affected by the timing and declaration of dividends by the underlying investment companies in which the Fund invests. |
(3) | The ratios of expenses to average net assets and net investment income (loss) to average net assets do not reflect the expenses of the underlying investment companies in which the Fund invests. |
* | Commenced operations on November 12, 2018. |
† | Return is for the period indicated and has not been annualized. Total return would have been lower had certain expenses not been waived and assumed by the Adviser during the period. Returns shown do not reflect the deduction of taxes that a shareholder would pay on Fund distributions or the redemption of Fund shares. |
The accompanying notes are an integral part of the financial statements.
85
SYMMETRY PANORAMIC TAX-MANAGED GLOBAL EQUITY FUND
FINANCIAL HIGHLIGHTS |
Selected Per Share Date & Ratios For a Share Outstanding Throughout the Period |
Class I Shares | | Period
Ended
February 28,
2019*
(Unaudited) | |
Net Asset Value, Beginning of Period | | $ | 10.00 | |
Income from Operations: | | | | |
Net Investment Loss(1) | | | — | |
Net Realized and Unrealized Gain | | | 0.55 | |
Total from Operations | | | 0.55 | |
Dividends and Distributions: | | | | |
Net Investment Income | | | (0.03 | ) |
Total Dividends and Distributions | | | (0.03 | ) |
Net Asset Value, End of Period | | $ | 10.52 | |
Total Return† | | | 5.50 | % |
Ratios and Supplemental Data | | | | |
Net Assets, End of Period (Thousands) | | $ | 9,917 | |
Ratio of Expenses to Average Net Assets(3) | | | 0.42 | %** |
Ratio of Expenses to Average Net Assets (Excluding Waivers)(3) | | | 4.76 | %** |
Ratio of Net Investment Loss to Average Net Assets(2) (3) | | | (0.07 | )%** |
Portfolio Turnover Rate | | | 2 | %*** |
(1) | Calculated using average shares. |
(2) | Recognition of net investment income (loss) by the Fund is affected by the timing and declaration of dividends by the underlying investment companies in which the Fund invests. |
(3) | The ratios of expenses to average net assets and net investment income (loss) to average net assets do not reflect the expenses of the underlying investment companies in which the Fund invests. |
* | Commenced operations on November 12, 2018. |
† | Return is for the period indicated and has not been annualized. Total return would have been lower had certain expenses not been waived and assumed by the Adviser during the period. Returns shown do not reflect the deduction of taxes that a shareholder would pay on Fund distributions or the redemption of Fund shares. |
Amounts designated as “—” are either $0 or have been rounded to $0.
The accompanying notes are an integral part of the financial statements.
86
SYMMETRY PANORAMIC US FIXED INCOME FUND
FINANCIAL HIGHLIGHTS |
Selected Per Share Date & Ratios For a Share Outstanding Throughout the Period |
Class I Shares | | Period
Ended
February 28,
2019*
(Unaudited) | |
Net Asset Value, Beginning of Period | | $ | 10.00 | |
Income from Operations: | | | | |
Net Investment Income(1) | | | 0.07 | |
Net Realized and Unrealized Gain | | | 0.16 | |
Total from Operations | | | 0.23 | |
Dividends and Distributions: | | | | |
Net Investment Income | | | (0.05 | ) |
Total Dividends and Distributions | | | (0.05 | ) |
Net Asset Value, End of Period | | $ | 10.18 | |
Total Return† | | | 2.29 | % |
Ratios and Supplemental Data | | | | |
Net Assets, End of Period (Thousands) | | $ | 199,700 | |
Ratio of Expenses to Average Net Assets(3) | | | 0.41 | %** |
Ratio of Expenses to Average Net Assets (Excluding Waivers)(3) | | | 0.80 | %** |
Ratio of Net Investment Income to Average Net Assets(2) (3) | | | 2.26 | %** |
Portfolio Turnover Rate | | | 6 | %*** |
(1) | Calculated using average shares. |
(2) | Recognition of net investment income (loss) by the Fund is affected by the timing and declaration of dividends by the underlying investment companies in which the Fund invests. |
(3) | The ratios of expenses to average net assets and net investment income (loss) to average net assets do not reflect the expenses of the underlying investment companies in which the Fund invests. |
* | Commenced operations on November 12, 2018. |
† | Return is for the period indicated and has not been annualized. Total return would have been lower had certain expenses not been waived and assumed by the Adviser during the period. Returns shown do not reflect the deduction of taxes that a shareholder would pay on Fund distributions or the redemption of Fund shares. |
The accompanying notes are an integral part of the financial statements.
87
SYMMETRY PANORAMIC MUNICIPAL FIXED INCOME FUND
FINANCIAL HIGHLIGHTS |
Selected Per Share Date & Ratios For a Share Outstanding Throughout the Period |
Class I Shares | | Period
Ended
February 28,
2019*
(Unaudited) | |
Net Asset Value, Beginning of Period | | $ | 10.00 | |
Income from Operations: | | | | |
Net Investment Income(1) | | | 0.04 | |
Net Realized and Unrealized Gain | | | 0.10 | |
Total from Operations | | | 0.14 | |
Dividends and Distributions: | | | | |
Net Investment Income | | | (0.03 | ) |
Total Dividends and Distributions | | | (0.03 | ) |
Net Asset Value, End of Period | | $ | 10.11 | |
Total Return† | | | 1.37 | % |
Ratios and Supplemental Data | | | | |
Net Assets, End of Period (Thousands) | | $ | 2,795 | |
Ratio of Expenses to Average Net Assets(3) | | | 0.41 | %** |
Ratio of Expenses to Average Net Assets (Excluding Waivers)(3) | | | 15.44 | %** |
Ratio of Net Investment Income to Average Net Assets(2) (3) | | | 1.31 | %** |
Portfolio Turnover Rate | | | 3 | %*** |
(1) | Calculated using average shares. |
(2) | Recognition of net investment income (loss) by the Fund is affected by the timing and declaration of dividends by the underlying investment companies in which the Fund invests. |
(3) | The ratios of expenses to average net assets and net investment income (loss) to average net assets do not reflect the expenses of the underlying investment companies in which the Fund invests. |
* | Commenced operations on November 12, 2018. |
† | Return is for the period indicated and has not been annualized. Total return would have been lower had certain expenses not been waived and assumed by the Adviser during the period. Returns shown do not reflect the deduction of taxes that a shareholder would pay on Fund distributions or the redemption of Fund shares. |
The accompanying notes are an integral part of the financial statements.
88
SYMMETRY PANORAMIC GLOBAL FIXED INCOME FUND
FINANCIAL HIGHLIGHTS |
Selected Per Share Date & Ratios For a Share Outstanding Throughout the Period |
Class I Shares | | Period
Ended
February 28,
2019*
(Unaudited) | |
Net Asset Value, Beginning of Period | | $ | 10.00 | |
Income from Operations: | | | | |
Net Investment Income(1) | | | 0.19 | |
Net Realized and Unrealized Gain | | | 0.09 | |
Total from Operations | | | 0.28 | |
Dividends and Distributions: | | | | |
Net Investment Income | | | (0.15 | ) |
Total Dividends and Distributions | | | (0.15 | ) |
Net Asset Value, End of Period | | $ | 10.13 | |
Total Return† | | | 2.77 | % |
Ratios and Supplemental Data | | | | |
Net Assets, End of Period (Thousands) | | $ | 357,502 | |
Ratio of Expenses to Average Net Assets(3) | | | 0.43 | %** |
Ratio of Expenses to Average Net Assets (Excluding Waivers)(3) | | | 0.82 | %** |
Ratio of Net Investment Income to Average Net Assets(2) (3) | | | 6.50 | %** |
Portfolio Turnover Rate | | | 2 | %*** |
(1) | Calculated using average shares. |
(2) | Recognition of net investment income (loss) by the Fund is affected by the timing and declaration of dividends by the underlying investment companies in which the Fund invests. |
(3) | The ratios of expenses to average net assets and net investment income (loss) to average net assets do not reflect the expenses of the underlying investment companies in which the Fund invests. |
* | Commenced operations on November 12, 2018. |
† | Return is for the period indicated and has not been annualized. Total return would have been lower had certain expenses not been waived and assumed by the Adviser during the period. Returns shown do not reflect the deduction of taxes that a shareholder would pay on Fund distributions or the redemption of Fund shares. |
The accompanying notes are an integral part of the financial statements.
89
SYMMETRY PANORAMIC ALTERNATIVES FUND
FINANCIAL HIGHLIGHTS |
Selected Per Share Date & Ratios For a Share Outstanding Throughout the Period |
Class I Shares | | Period
Ended
February 28,
2019*
(Unaudited) | |
Net Asset Value, Beginning of Period | | $ | 10.00 | |
Income (Loss) from Operations: | | | | |
Net Investment Income(1) | | | 0.20 | |
Net Realized and Unrealized Loss | | | (0.25 | ) |
Total from Operations | | | (0.05 | ) |
Dividends and Distributions: | | | | |
Net Investment Income | | | (0.23 | ) |
Total Dividends and Distributions | | | (0.23 | ) |
Net Asset Value, End of Period | | $ | 9.72 | |
Total Return† | | | (0.48 | )% |
Ratios and Supplemental Data | | | | |
Net Assets, End of Period (Thousands) | | $ | 187 | |
Ratio of Expenses to Average Net Assets(3) | | | 0.50 | %** |
Ratio of Expenses to Average Net Assets (Excluding Waivers)(3) | | | 149.49 | %** |
Ratio of Net Investment Income to Average Net Assets(2) (3) | | | 6.76 | %** |
Portfolio Turnover Rate | | | 8 | %*** |
(1) | Calculated using average shares. |
(2) | Recognition of net investment income (loss) by the Fund is affected by the timing and declaration of dividends by the underlying investment companies in which the Fund invests. |
(3) | The ratios of expenses to average net assets and net investment income (loss) to average net assets do not reflect the expenses of the underlying investment companies in which the Fund invests. |
* | Commenced operations on November 12, 2018. |
† | Return is for the period indicated and has not been annualized. Total return would have been lower had certain expenses not been waived and assumed by the Adviser during the period. Returns shown do not reflect the deduction of taxes that a shareholder would pay on Fund distributions or the redemption of Fund shares. |
The accompanying notes are an integral part of the financial statements.
90
SYMMETRY PANORAMIC TRUST
FEBRUARY 28, 2019
NOTES TO FINANCIAL STATEMENTS (Unaudited) |
1. Organization:
The Symmetry Panoramic Trust (the “Trust”) is organized as a Delaware statutory trust under an Agreement and Declaration of Trust dated April 3, 2018. The Trust is registered under the Investment Company Act of 1940, as amended, as an open-end management investment company currently consisting of eight separate portfolios. The financial statements herein are those of the Symmetry Panoramic US Equity Fund, Symmetry Panoramic International Equity Fund, Symmetry Panoramic Global Equity Fund, Symmetry Panoramic Tax-Managed Global Equity Fund, Symmetry Panoramic US Fixed Income Fund, Symmetry Panoramic Municipal Fixed Income Fund, Symmetry Panoramic Global Fixed Income Fund and Symmetry Panoramic Alternatives Fund (each a “Fund” and collectively, the “Funds”). The investment objective of each of Symmetry Panoramic US Equity Fund, Symmetry Panoramic International Equity Fund, Symmetry Panoramic Global Equity Fund, and Symmetry Panoramic Tax-Managed Global Equity Fund is to seek long-term capital appreciation. The investment objective of Symmetry Panoramic US Fixed Income Fund is to seek total return through exposure to US fixed income securities. The investment objective of Symmetry Panoramic Municipal Fixed Income Fund is to provide current income that is exempt from federal personal income tax. The investment objective of Symmetry Panoramic Global Fixed Income Fund is to seek total return through exposure to global fixed income securities. The investment objective of Symmetry Panoramic Alternatives Fund is to seek positive long-term absolute returns. An “absolute return” seeks to earn a positive total return over the long-term, regardless of market conditions or general market direction. The Funds are classified as diversified investment companies. Symmetry Partners, LLC serves as the Funds’ investment adviser (the “Adviser”). The Funds currently offer Class I Shares. The Funds commenced operations on November 12, 2018. The assets of each fund are segregated, and a shareholder’s interest is limited to the fund in which shares are held.
2. Significant Accounting Policies:
The following are significant accounting policies, which are consistently followed in the preparation of the financial statements of the Funds. The Funds are investment companies that apply the accounting and reporting guidance issued in Topic 946 by the U.S. Financial Accounting Standards Board (“FASB”).
Use of Estimates — The preparation of financial statements in conformity with United States generally accepted accounting principles (“U.S. GAAP”) requires management to make estimates and assumptions that affect the fair value of assets and liabilities and disclosure of contingent assets and liabilities at the date of the financial statements and the reported amounts of revenues and expenses during the reporting period. Actual results could differ from those estimates and such differences could be material.
91
SYMMETRY PANORAMIC TRUST
FEBRUARY 28, 2019
Security Valuation — Securities listed on a securities exchange, market or automated quotation system for which quotations are readily available (except for securities traded on NASDAQ, including securities traded over the counter, are either fair valued or valued at the last quoted sale price on an exchange or market (foreign or domestic) on which they are traded on valuation date (or at approximately 4:00 pm Eastern Standard Time if a security’s primary exchange is normally open at that time), or, if there is no such reported sale on the valuation date, at the most recent quoted bid price. For securities traded on NASDAQ, the NASDAQ Official Closing Price will be used. If available, debt securities are priced based upon valuations provided by independent, third-party pricing agents. Such values generally reflect the last reported sales price if the security is actively traded. The third-party pricing agents may also value debt securities at an evaluated bid price by employing methodologies that utilize actual market transactions, broker supplied valuations, or other methodologies designed to identify the market value for such securities. Such methodologies generally consider such factors as security prices, yields, maturities, call features, ratings and developments relating to specific securities in arriving at valuations. On the first day a new debt security purchase is recorded, if a price is not available on the automated pricing feeds from our primary and secondary pricing vendors nor is it available from an independent broker, the security may be valued at its purchase price. Each day thereafter, the debt security will be valued according to the Trust’s fair value procedures until an independent source can be secured. Debt obligations with remaining maturities of sixty days or less may be valued at their amortized cost, which approximates market value provided that it is determined the amortized cost continues to approximate fair value. Should existing credit, liquidity or interest rate conditions in the relevant markets and issuer specific circumstances suggest that amortized cost does not approximate fair value, then the amortized cost method may not be used. The prices for foreign securities are reported in local currency and converted to U.S. dollars using currency exchange rates.
Investments in open-end and closed-end registered investment companies that do not trade on an exchange are valued at the end of day net asset value per share. Investments in open-end and closed-end registered investment companies that trade on an exchange are valued at the last sales price or official closing price as of the close of the customary trading session on the exchange where the security is principally traded.
Securities for which market prices are not readily available are valued in accordance with fair value procedures established by the Funds’ Board of Trustees (the “Board”). The Funds’ fair value procedures are implemented through a Fair Value Committee (the “Committee”) designated by the Board. Some of the more common reasons that may necessitate that a security be valued using fair value procedures include: the security’s trading has been halted or suspended; the security has been de-listed from a national exchange; the security’s primary trading market is temporarily closed at a time when under normal conditions it would be open; the security has not been traded for an extended period of time; the security’s primary pricing source is not able or
92
SYMMETRY PANORAMIC TRUST
FEBRUARY 28, 2019
willing to provide a price; or trading of the security is subject to local government imposed restrictions. When a security is valued in accordance with the fair value procedures, the Committee will determine the value after taking into consideration relevant information reasonably available to the Committee.
Futures contracts that are traded on an exchange are valued at their last reported sales price as of the valuation date.
Swaps are marked-to-market daily based upon the outstanding value by contract and the resulting changes in market values, if any, are recorded as an unrealized gain or loss in the Statements of Operations.
For securities that principally trade on a foreign market or exchange, a significant gap in time can exist between the time of a particular security’s last trade and the time at which the Fund calculates its net asset value. The closing prices of such securities may no longer reflect their market value at the time the Fund calculates its net asset value if an event that could materially affect the value of those securities (a “Significant Event”) has occurred between the time of the security’s last close and the time that the Fund calculates net asset value. A Significant Event may relate to a single issuer or to an entire market sector. If the Adviser becomes aware of a Significant Event that has occurred with respect to a security or group of securities after the closing of the exchange or market on which the security or securities principally trade, but before the time at which the Fund calculates its net asset value, it may request that a Committee meeting be called.
The Funds use MarkIt Fair Value (“MarkIt”) as a third party fair valuation vendor. MarkIt provides a fair value for foreign securities held by the Funds based on certain factors and methodologies (involving, generally, tracking valuation correlations between the U.S. market and each non-U.S. security) applied by MarkIt in the event that there is a movement in the U.S. market that exceeds a specific threshold established by the Committee. The Committee has established a “confidence interval” which is used to determine the level of correlation between the value of a foreign security and movements in the U.S. market before a particular security is fair valued when the threshold is exceeded. In the event that the threshold established by the Committee is exceeded on a specific day, the Funds value the non-U.S. securities that exceed the applicable “confidence interval” based upon the fair values provided by MarkIt. In such event, it is not necessary to hold a Committee meeting. In the event that the Adviser believes that the fair values provided by MarkIt are not reliable, the Adviser contacts SEI Investments Global Funds Services (the “Administrator”) and can request that a meeting of the Committee be held.
If a local market in which the Funds own securities is closed for one or more days, the Funds shall value all securities held in that corresponding currency based on the fair value prices provided by MarkIt using the predetermined confidence interval discussed above.
93
SYMMETRY PANORAMIC TRUST
FEBRUARY 28, 2019
In accordance with U.S. GAAP, the Funds disclose fair value of their investments in a hierarchy that prioritizes the inputs to valuation techniques used to measure the fair value. The objective of a fair value measurement is to determine the price that would be received to sell an asset or paid to transfer a liability in an orderly transaction between market participants at the measurement date (an exit price). Accordingly, the fair value hierarchy gives the highest priority to quoted prices (unadjusted) in active markets for identical assets or liabilities (Level 1) and the lowest priority to unobservable inputs (Level 3). The three levels of the fair value hierarchy are described below:
| | ● | Level 1 — Unadjusted quoted prices in active markets for identical, unrestricted assets or liabilities that the Funds have the ability to access at the measurement date; |
| | ● | Level 2 — Other significant observable inputs (includes quoted prices for similar securities, interest rates, prepayment speeds, credit risk, referenced indices, quoted prices in inactive markets, adjusted quoted prices in active markets, adjusted quoted prices on foreign equity securities that were adjusted in accordance with pricing procedures approved by the Board, etc.); and |
| | ● | Level 3 — Prices, inputs or exotic modeling techniques which are both significant to the fair value measurement and unobservable (supported by little or no market activity). |
Investments are classified within the level of the lowest significant input considered in determining fair value. Investments classified within Level 3 whose fair value measurement considers several inputs may include Level 1 or Level 2 inputs as components of the overall fair value measurement.
Industry classifications are summarized in the Funds’ Schedules of Investments.
Federal Income Taxes — It is each Fund’s intention to qualify as a regulated investment company for Federal income tax purposes by complying with the appropriate provisions of Subchapter M of the Internal Revenue Code of 1986 (the “Code”), as amended. Accordingly, no provisions for Federal income taxes have been made in the financial statements.
The Funds evaluate tax positions taken or expected to be taken in the course of preparing the Funds’ tax returns to determine whether it is “more-likely-than-not” (i.e., greater than 50 percent) that each tax position will be sustained upon examination by a taxing authority based on the technical merits of the position. Tax positions not deemed to meet the more-likely-than-not threshold are recorded as a tax benefit or expense in the current period. The Funds did not record any tax provision in the current period. However, management’s conclusions regarding tax positions taken may be subject to review and adjustment at a later date based on factors including,
94
SYMMETRY PANORAMIC TRUST
FEBRUARY 28, 2019
but not limited to, examination by tax authorities (i.e., from commencement of operations, as applicable), on-going analysis of and changes to tax laws, regulations and interpretations thereof.
As of and during the period ended February 28, 2019, the Funds did not have a liability for any unrecognized tax benefits. The Funds recognize interest and penalties, if any, related to unrecognized tax benefits as income tax expense in the Statements of Operations. During the period ended February 28, 2019, the Funds did not incur any significant interest or penalties.
Security Transactions and Investment Income — Security transactions are accounted for on trade date for financial reporting purposes. Costs used in determining realized gains and losses on the sale of investment securities are based on the specific identification method. Dividend income is recorded on the ex-dividend date. Certain dividends from foreign securities will be recorded as soon as the Funds are informed of the dividend if such information is obtained subsequent to the ex-dividend date.
Foreign Taxes — The Symmetry Panoramic International Equity Fund, the Symmetry Panoramic Global Equity Fund, the Symmetry Panoramic Tax-Managed Global Equity Fund and the Symmetry Panoramic Global Fixed Income Fund may be subject to foreign withholding or other foreign income taxes with respect to dividends or interest received from (and, in some cases, gains recognized on shares of stock of) non-U.S. companies. The Funds accrue and apply such taxes to net investment income, net realized gains and net unrealized gains as income and/or capital gains are earned.
Foreign Currency Translation — The books and records of the Funds are maintained in U.S. dollars. Investment securities and other assets and liabilities denominated in a foreign currency are translated into U.S. dollars on the date of valuation. The Funds do not isolate that portion of realized or unrealized gains and losses resulting from changes in the foreign exchange rate from fluctuations arising from changes in the market prices of the securities. These gains and losses are included in net realized and gains and losses on investments and net change in unrealized appreciation (depreciation) on investments on the Statements of Operations. Net realized and unrealized gains and losses on foreign currency transactions represent net foreign exchange gains or losses from foreign currency exchange contracts, disposition of foreign currencies, currency gains or losses realized between trade and settlement dates on securities transactions and the difference between the amount of the investment income and foreign withholding taxes recorded on the Funds’ books and the U.S. dollar equivalent amounts actually received or paid.
Futures Contracts — Symmetry Panoramic US Equity Fund, Symmetry Panoramic International Equity Fund, and Symmetry Panoramic Global Equity Fund all utilized futures contracts during the period ended February 28, 2019. To the extent consistent with its investment objective and strategies, the Funds may use futures contracts for tactical hedging purposes as well as to enhance the Fund’s returns. Initial margin
95
SYMMETRY PANORAMIC TRUST
FEBRUARY 28, 2019
deposits of cash or securities are made upon entering into futures contracts. The futures contracts are valued at the settlement price established each day by the board of exchange on which they are traded. The futures contracts are marked-to-market daily and the resulting changes in value are accounted for as unrealized gains and losses. Variation margin payments are paid or received, depending upon whether unrealized gains or losses are incurred. When the futures contract is closed, the Funds record a realized gain or loss equal to the difference between the proceeds from (or cost of) the closing transaction and the amount invested in the futures contract.
Risks of entering into futures contracts include the possibility that there will be an imperfect price correlation between the futures and the underlying securities. Second, it is possible that a lack of liquidity for futures contracts could exist in the secondary market, resulting in an inability to close a position prior to its maturity date. Third, the futures contract involves the risk that a Fund could lose more than the original margin deposit required to initiate a futures transaction.
Finally, the risk exists that losses could exceed amounts disclosed on the Statements of Assets and Liabilities. Refer to the Fund’s Schedule of Investments for details regarding open futures contracts as of February 28, 2019.
For the period ended February 28, 2019, the average monthly notional amount of futures contracts held were as follows:
| | Symmetry
Panoramic US
Equity Fund | | | Symmetry
Panoramic
International
Equity Fund | | | Symmetry
Panoramic Global
Equity Fund | |
Average Monthly Notional Balance Long | | $ | 1,113,880 | | | $ | 1,977,616 | | | $ | 3,885,119 | |
Average Monthly Notional Balance Short | | | — | | | | — | | | | — | |
Swap Contracts— Symmetry Panoramic US Equity Fund, Symmetry Panoramic International Equity Fund, Symmetry Panoramic Global Equity Fund, and Symmetry Panoramic Tax-Managed Global Equity Fund are authorized to enter into swap agreements, including total return swaps. Swaps are a two-party contract in which the seller (buyer) will pay to the buyer (seller) the difference between the current value of a security and its value at the time the contract was entered.
Total return swap agreements are contracts in which one party agrees to make periodic payments based on the change in market value of underlying assets, which may include a specified security, futures contract, basket of securities or futures contracts, defined portfolios of bonds, loans and mortgages, or securities indices during the specified period, in return for periodic payments based on a fixed or variable interest rate or the total return from other underlying assets. Total return
96
SYMMETRY PANORAMIC TRUST
FEBRUARY 28, 2019
swap agreements may be used to obtain exposure to a security, commodity or market without owning or taking physical custody of such security, commodity or market. The total return includes appreciation or depreciation on the underlying asset, plus any interest or dividend payments. Payments under the swap are based upon an agreed upon principal amount but, since the principal amount is not exchanged, it represents neither an asset nor a liability to either counterparty, and is referred to as notional. Total return swaps are marked-to-market daily using different sources, including quotations from counterparties, pricing services, brokers or market makers. The unrealized appreciation or depreciation related to the change in the valuation of the notional amount of the swap is combined with the amount due to the Fund at termination or settlement. The primary risks associated with total return swaps are credit risks (if the counterparty fails to meet its obligations) and market risk (if there is no liquid market for the swap or unfavorable changes occur to the underlying reference instrument).
Periodic payments made or received are recorded as realized gains or losses. At period end, the Statements of Assets and Liabilities reflect, if any, unrealized appreciation or depreciation and accrued periodic payments for swap contracts the Fund may have open at period end. Entering into swap contracts involves, to varying degrees, elements of credit, interest rate and market risk in excess of the amounts recognized on the Statements of Assets and Liabilities. Such risks involve the possibility that there will be no liquid market for these contracts, that the counterparty to the contract may default on its obligation to perform and that there may be unfavorable changes in market conditions or fluctuations in interest rates. Swap contracts outstanding at period end, if any, are listed on the Schedules of Investments. In connection with swap contracts, cash or securities may be segregated as collateral by the Funds’ custodian.
There is the risk that the counterparty refuses to continue to enter into swap agreements with the Funds in the future, or requires increased fees, which could impair the Funds’ ability to achieve its investment objective. A counterparty may also increase its collateral requirements, which may limit the Funds’ ability to use leverage and reduce investment returns. In addition, if the Funds cannot locate a counterparty willing to enter into transactions with the Funds, it will not be able to implement its investment strategy. As of February 28, 2019, Symmetry Panoramic US Equity Fund, Symmetry Panoramic International Equity Fund, Symmetry Panoramic Global Equity Fund, and Symmetry Panoramic Tax-Managed Global Equity Fund have swap agreements with one counterparty, ReFlow Fund, LLC (“ReFlow”).
The Funds may participate in a variety of liquidity programs offered by ReFlow. These include the ReFlow Redemption Service and ReFlow NAVswap, both of which are designed to provide alternative sources of liquidity to funds experiencing net redemptions of their shares. The ReFlow Redemption Service provides participating funds with a source of cash to meet net shareholder redemptions by standing ready each business day to purchase fund shares up to the value of the net shares redeemed
97
SYMMETRY PANORAMIC TRUST
FEBRUARY 28, 2019
from the fund, subject to certain limitations. Following purchases of fund shares, ReFlow then generally redeems those shares when the fund experiences net sales, at the end of a maximum holding period determined by ReFlow, or at other times at ReFlow’s discretion. In the event a Fund uses the ReFlow Redemption Service, the Fund will pay a fee to ReFlow each time ReFlow purchases Fund shares, calculated by multiplying the value of shares ReFlow purchases by a rate determined through an automated daily auction. In accordance with federal securities laws, ReFlow is prohibited from acquiring more than 3% of the outstanding voting securities of the Fund.
ReFlow NAVswap provides participating funds with a source of cash to meet net shareholder redemptions. ReFlow NAVswap is an International Swaps and Derivatives Association governed total return swap in which a fund receives a return that corresponds to the daily change in the reference fund’s net asset value. In return, the fund pays Secured Overnight Financing Rate (SOFR) plus a spread. By participating in the ReFlow programs, a fund may maintain a lower cash balance than might otherwise be required. In an environment of declining market values, a fund participating in the ReFlow programs may experience a greater decrease in value than it would if it did not participate in the programs and instead maintained a higher cash balance.
For the period ended February 28, 2019, the monthly average balances of swap contracts held by the Funds was as follows:
| | Symmetry
Panoramic US
Equity Fund | | | Symmetry
Panoramic
International
Equity Fund | | | Symmetry
Panoramic
Global Equity
Fund | | | Symmetry
Panoramic
Tax-Managed
Global Equity
Fund | |
Average Monthly Notional Balance Long | | $ | 2,425,162 | | | $ | 1,399,675 | | | $ | 2,476,359 | | | $ | 50,406 | |
Average Monthly Notional Balance Short | | | — | | | | — | | | | — | | | | — | |
Offsetting Assets and Liabilities — The Funds may be subject to various Master Netting Arrangements with various netting arrangements with select counterparties (“Master Agreements”). Master Agreements govern the terms of certain transactions, and reduce the counterparty risk associated with relevant transactions by specifying credit protection mechanisms and providing standardization that improves legal certainty.
98
SYMMETRY PANORAMIC TRUST
FEBRUARY 28, 2019
Since different types of transactions have different mechanics and are sometimes traded out of different legal entities of a particular counterparty organization, each type of transaction may be covered by a different Master Agreement, resulting in the need for multiple agreements with a single counterparty. As the Master Agreements are specific to unique operations of different asset types, they allow a Fund to close out and net its total exposure to a specific counterparty entity in the event of a default with respect to all the transactions governed under a single agreement with a specific counterparty entity.
Master Agreements can also help limit counterparty risk by specifying collateral posting arrangements at pre-arranged exposure levels. Under the Master Agreements, collateral is routinely transferred if the total net exposure to certain transactions (net of existing collateral already in place) governed under the relevant Master Agreement with a counterparty in a given account exceeds a specified threshold, which typically ranges from zero to $250,000 depending on the counterparty and the type of Master Agreement. United States Treasury Securities and U.S. dollar cash are generally the preferred forms of collateral. Securities and cash pledged as collateral are reflected as assets on the Statements of Assets and Liabilities as either a component of investments at value (securities) or cash pledged as collateral for futures contracts and swap contracts (cash). The market value of any securities received as collateral is not reflected as a component of net asset value. A Fund’s overall exposure to counterparty risk can change substantially within a short period, as it is affected by each transaction subject to the relevant Master Agreement.
As of February 28, 2019, there are no derivative liabilities (unrealized depreciation) to present within the netting arrangement. For presentation purposes, the Master Netting tables have been omitted.
Investments in Real Estate Investment Trusts (“REITs”) — Dividend income from REITs is recorded based on the income included in distributions received from the REIT investments using published REIT reclassifications, including some management estimates when actual amounts are not available. Distributions received in excess of this estimated amount are recorded as a reduction of the cost of investments or reclassified to capital gains. The actual amounts of income, return of capital, and capital gains are only determined by each REIT after its fiscal year-end, and may differ from the estimated amounts.
Expenses — Most expenses of the Trust can be directly attributed to a particular Fund. Expenses which cannot be directly attributed to a particular fund are apportioned among the Funds based on the number of Funds and/or relative net assets.
Cash Equivalents — Idle cash and currency balances may be swept into various overnight sweep accounts and is classified as cash on the Statements of Assets and Liabilities. Funds maintain cash in bank deposit accounts which, at times, may exceed United States federally insured limits. Amounts swept are available on the next business day.
99
SYMMETRY PANORAMIC TRUST
FEBRUARY 28, 2019
Dividends and Distributions to Shareholders — Income dividends are derived from net investment income (i.e., interest and other income, less any related expenses) a Fund earns from its portfolio securities and other investments. Capital gain distributions are derived from gains realized when a Fund sells a portfolio security. Long-term capital gains are derived from gains realized when a Fund sells a portfolio security it has owned for more than one year, and short-term capital gains are derived from gains realized when a portfolio security was owned for one year or less.
The Symmetry Panoramic US Equity Fund, the Symmetry Panoramic International Equity Fund, the Symmetry Panoramic Global Equity Fund, the Symmetry Panoramic Tax-Managed Global Equity Fund, and the Symmetry Panoramic Alternatives Fund each intend to distribute substantially all of their net investment income and net capital gains, if any, at least annually, or more frequently as determined to be appropriate by the Adviser. The Symmetry Panoramic US Fixed Income Fund, the Symmetry Panoramic Municipal Fixed Income Fund, and the Symmetry Panoramic Global Fixed Income Fund each intend to distribute substantially all of their net investment income and net capital gains, if any, monthly.
Organization and Offering Costs — Organization costs are expensed as incurred. Offering costs are amortized for a period of twelve months upon commencement of operations of a Fund. Organization and offering costs are subject to recoupment by the Adviser, within twelve months of commencement of operations subject to the Organizational Expense Agreement and Expense Limitation Agreement. The Adviser will reimburse the Funds for any organization and offering costs incurred by the Funds. The Trust incurred offering costs of $317,163 which are being amortized to expense over a twelve month period. As of February 28, 2019, the Trust had $237,996 remaining to be amortized.
3. Transactions with Affiliates:
Certain officers of the Trust are also employees of the Administrator, a wholly owned subsidiary of SEI Investments Company, and/or SEI Investments Distribution Co. (the “Distributor”). Such officers are paid no fees by the Trust, other than the Chief Compliance Officer (“CCO”) as described below, for serving as officers of the Trust.
The services provided by the CCO and the CCO’s staff are paid for by the Trust as incurred. The services include regulatory oversight of the Trust’s Adviser and other service providers as required by SEC regulations. The CCO’s services and fees have been approved by and are reviewed by the Board.
100
SYMMETRY PANORAMIC TRUST
FEBRUARY 28, 2019
4. Administration, Distribution, Shareholder Servicing, Custodian and Transfer Agent Agreements:
The Funds and the Administrator are parties to an Administration Agreement under which the Administrator provides administration services to the Funds. For these services, the Administrator is paid an asset based fee, which will vary depending on the number of share classes and the average daily net assets of the Funds. For the period ended February 28, 2019, the Funds were charged as follows for these services:
Fund | | Administration
Fee | |
Symmetry Panoramic US Equity Fund | | $ | 35,502 | |
Symmetry Panoramic International Equity Fund | | | 23,085 | |
Symmetry Panoramic Global Equity Fund | | | 36,440 | |
Symmetry Panoramic Tax-Managed Global Equity Fund | | | 8,117 | |
Symmetry Panoramic US Fixed Income Fund | | | 18,212 | |
Symmetry Panoramic Municipal Fixed Income Fund | | | 7,765 | |
Symmetry Panoramic Global Fixed Income Fund | | | 26,787 | |
Symmetry Panoramic Alternatives Fund | | | 7,652 | |
The Distributor serves as each Fund’s Distributor pursuant to a Distribution Agreement with the Trust.
The Bank of New York Mellon acts as custodian (the “Custodian”) for the Funds. The Custodian plays no role in determining the investment policies of the Funds or which securities are to be purchased or sold by the Funds.
Atlantic Fund Services, LLC (now part of the Apex Group) serves as the transfer agent and dividend disbursing agent for the Funds under a transfer agency agreement with the Trust.
5. Investment Advisory Agreement:
The Adviser has entered into an investment advisory agreement with each Fund. For its services to the Funds, the Adviser is entitled to a fee, which is calculated daily and paid monthly, at an annual rate disclosed below based on the average daily net assets of each of the Funds. Subject to general oversight by the Board of Trustees, the Adviser manages and supervises the investment operations and business affairs of the Funds. The Adviser may select, contract with and compensate one or more sub-advisers to manage all or a portion of a Fund’s portfolio assets, subject to oversight by the Adviser. In this role, the Adviser has supervisory responsibility for managing the investment and reinvestment of each Fund’s portfolio assets through proactive oversight and monitoring of each sub-adviser and the Fund, as described in further detail below. The Adviser is responsible for developing overall investment strategies for the Funds and overseeing and implementing each Fund’s continuous investment programs and provides a variety of advisory oversight and investment research services. The Adviser also provides management and transition
101
SYMMETRY PANORAMIC TRUST
FEBRUARY 28, 2019
services associated with certain fund events (e.g., strategy, portfolio manager or sub-adviser changes) and coordinates and oversees services provided under other agreements. The Adviser has ultimate responsibility to oversee a sub-adviser and recommend to the Board of Trustees its hiring, termination, and replacement. In this capacity, the Adviser, among other things: (i) monitors on a daily basis the compliance of the sub-adviser with the investment objectives and related policies of the Fund; (ii) monitors significant changes that may impact the sub-adviser’s overall business and regularly performs due diligence reviews of the sub-adviser; (iii) reviews the performance of the sub-adviser; and (iv) reports periodically on such performance to the Board of Trustees. The Adviser employs a team of investment professionals who provide these ongoing research and monitoring services.
In addition to investment advisory fees, each Fund pays other expenses including costs incurred in connection with the maintenance of its securities law registration, printing and mailing prospectuses and statements of additional information to shareholders, certain financial accounting services, taxes or governmental fees, custodial, transfer and shareholder servicing agent costs, expenses of outside counsel and independent accountants, preparation of shareholder reports and expenses of trustee and shareholders meetings.
The Adviser has agreed to limit each Fund’s current Operating Expenses to an annual rate, expressed as a percentage of the Fund’s average daily net assets for the month, to the amounts listed in the below table until at least October 31, 2019 (the "Expense Limitation"). For purposes of the Expense Limitation, the term “Operating Expenses” with respect to the Funds is defined to include all expenses necessary or appropriate for the operation of a Fund and including the Adviser’s investment advisory or management fee detailed in the advisory agreement, any Rule 12b-l fees and/or shareholder services fees and other expenses described in the advisory agreement, but does not include: (i) any front-end or contingent deferred loads; (ii) brokerage fees and commissions, (iii) acquired fund fees and expenses; (iii) borrowing costs (such as interest and dividend expense on securities sold short); (iv) taxes; and (v) extraordinary expenses, such as litigation expenses (which may include indemnification of a Fund’s officers and Trustees, and contractual indemnification of an affected Fund’s service providers (other than the Adviser)).
| Advisory
Fee Before
Expense
Limitation | Expense
Limitation |
Symmetry Panoramic US Equity Fund | 0.55% | 0.48% |
Symmetry Panoramic International Equity Fund | 0.70% | 0.65% |
Symmetry Panoramic Global Equity Fund | 0.63% | 0.52% |
Symmetry Panoramic Tax-Managed Global Equity Fund | 0.65% | 0.42% |
Symmetry Panoramic US Fixed Income Fund | 0.45% | 0.41% |
Symmetry Panoramic Municipal Fixed Income Fund | 0.47% | 0.41% |
Symmetry Panoramic Global Fixed Income Fund | 0.52% | 0.43% |
Symmetry Panoramic Alternatives Fund | 1.29% | 0.50% |
102
SYMMETRY PANORAMIC TRUST
FEBRUARY 28, 2019
The Adviser also has contractually agreed to waive its management fee for each of the Funds until at least October 31, 2019 (“Fee Waiver”) so that the aggregate management fee retained by the Adviser with respect to each of the Funds after payment of sub-advisory fees does not exceed the following:
Symmetry Panoramic US Equity Fund | 0.25% |
Symmetry Panoramic International Equity Fund | 0.25% |
Symmetry Panoramic Global Equity Fund | 0.25% |
Symmetry Panoramic Tax-Managed Global Equity Fund | 0.26% |
Symmetry Panoramic US Fixed Income Fund | 0.25% |
Symmetry Panoramic Municipal Fixed Income Fund | 0.25% |
Symmetry Panoramic Global Fixed Income Fund | 0.25% |
Symmetry Panoramic Alternatives Fund | 0.30% |
The Adviser may recover all or a portion of the Expense Limitation within a three-year rolling period from the year in which it reduced its fee or reimbursed expenses if a Fund’s total annual operating expenses are below the Expense Limitation that was in place at the time of such fee reductions or expense reimbursements. The Expense Limitation and Fee Waiver agreements may be terminated by the Board of Trustees without penalty on 60 days’ written notice to the Adviser. The Expense Limitation and Fee Waiver agreements shall terminate automatically in the event of assignment of the investment advisory agreement.
The Adviser has engaged AQR Capital Management, LLC (“AQR”), to provide sub-advisory services to each of the Symmetry Panoramic US Equity Fund, Symmetry Panoramic International Equity Fund and Symmetry Panoramic Global Equity Fund (together, the “Sub-Advised Funds”). The Adviser pays AQR a portion of its fee, calculated daily and paid monthly. The Sub-Advised Funds are not responsible for the payment of the sub-advisory fees.
A Trustee and certain Officers are also employees/officers of the Adviser.
6. Investment Transactions:
The cost of security purchases and the proceeds from security sales other than short-term securities, for the period ended February 28, 2019, were as follows:
| | Purchases | | | Sales and
Maturities | |
Symmetry Panoramic US Equity Fund | | $ | 501,877,005 | | | $ | 13,426,859 | |
Symmetry Panoramic International Equity Fund | | | 273,531,592 | | | | 12,123,611 | |
Symmetry Panoramic Global Equity Fund | | | 514,760,648 | | | | 17,142,004 | |
Symmetry Panoramic Tax-Managed Global Equity Fund | | | 9,033,154 | | | | 102,797 | |
Symmetry Panoramic US Fixed Income Fund | | | 201,640,637 | | | | 7,491,973 | |
103
SYMMETRY PANORAMIC TRUST
FEBRUARY 28, 2019
| | Purchases | | | Sales and
Maturities | |
Symmetry Panoramic Municipal Fixed Income Fund | | $ | 2,794,082 | | | $ | 35,871 | |
Symmetry Panoramic Global Fixed Income Fund | | | 354,316,406 | | | | 4,639,304 | |
Symmetry Panoramic Alternatives Fund | | | 226,430 | | | | 10,904 | |
7. Federal Tax Information:
The amount and character of income and capital gain distributions to be paid, if any, are determined in accordance with Federal income tax regulations, which may differ from U.S. GAAP. These book/tax differences may be temporary or permanent. To the extent these differences are permanent in nature, they are charged or credited to paid-in capital or distributable earnings, as appropriate, in the period that the differences arise.
The Federal tax cost and aggregate gross unrealized appreciation and depreciation for the investments held by the Funds at February 28, 2019, were as follows:
| | Federal
Tax Cost | | | Aggregate
Gross
Unrealized
Appreciation | | | Aggregate
Gross
Unrealized
Depreciation | | | Net
Unrealized
Appreciation
(Depreciation) | |
Symmetry Panoramic US Equity Fund | | $ | 503,266,863 | | | $ | 19,478,539 | | | $ | (1,240,989 | ) | | $ | 18,237,550 | |
Symmetry Panoramic International Equity Fund | | $ | 273,465,995 | | | $ | 10,848,418 | | | $ | (839,623 | ) | | $ | 10,008,795 | |
Symmetry Panoramic Global Equity Fund | | $ | 515,603,767 | | | $ | 20,241,376 | | | $ | (1,464,239 | ) | | $ | 18,777,137 | |
Symmetry Panoramic Tax-Managed Global Equity Fund | | $ | 9,286,929 | | | $ | 813,511 | | | $ | 0 | | | $ | 813,511 | |
Symmetry Panoramic US Fixed Income Fund | | $ | 197,970,509 | | | $ | 1,796,520 | | | $ | 0 | | | $ | 1,796,520 | |
Symmetry Panoramic Municipal Fixed Income Fund | | $ | 2,934,414 | | | $ | 6,940 | | | $ | 0 | | | $ | 6,940 | |
Symmetry Panoramic Global Fixed Income Fund | | $ | 356,379,336 | | | $ | 1,907,760 | | | $ | (976,797 | ) | | $ | 930,963 | |
Symmetry Panoramic Alternatives Fund | | $ | 217,492 | | | $ | 567 | | | $ | (2,673 | ) | | $ | (2,106 | ) |
104
SYMMETRY PANORAMIC TRUST
FEBRUARY 28, 2019
8. Concentration of Risks:
As with all mutual funds, there is no guarantee that any of the Funds will achieve the Fund’s investment objective. You could lose money by investing in the Funds. A Fund share is not a bank deposit and is not insured or guaranteed by the Federal Deposit Insurance Corporation (the “FDIC”) or any other government agency. The principal risk factors affecting shareholder investments in the Funds are described below.
Please note that each of the Funds primarily will invest in shares of registered, open-end investment companies and exchange-traded funds (“ETFs”) (collectively, “Underlying Funds”). Because the Funds invest primarily in Underlying Funds, the risks described below for each Fund are in reference to the Underlying Funds, and, to the extent that a Fund invests directly in securities and other instruments, the risks described below also are directly applicable to the Fund.
The table below and the paragraphs that follow show additional information about the principal (marked with an “✔”) and certain non-principal (marked with an “●”) investment strategies and techniques that a Fund may employ in pursuing the Fund’s investment objective and related risks.
✔ = principal
● = non-principal
| US Equity | International
Equity | Global
Equity | Tax-
Managed
Global
Equity | US Fixed
Income | Municipal
Fixed
Income | Global
Fixed
Income | Alternatives |
Investing in Underlying Funds | ✔ | ✔ | ✔ | ✔ | ✔ | ✔ | ✔ | ✔ |
Investments of Underlying Funds | ✔ | ✔ | ✔ | ✔ | ✔ | ✔ | ✔ | ✔ |
Arbitrage Risk | | | | | | | | ✔ |
Asset Allocation Risk | ✔ | ✔ | ✔ | ✔ | ✔ | ✔ | ✔ | ✔ |
Cash Management Strategies | ● | ● | ● | ● | ● | ● | ● | ● |
Commodities Risk | | | | | | | | ✔ |
Convertible Securities Risk | | | | | | | | ✔ |
Credit Default Swaps Risk | | | | | | | | ✔ |
Currency Risk | | ✔ | ✔ | ✔ | | | | ✔ |
Cybersecurity Risk | ✔ | ✔ | ✔ | ✔ | ✔ | ✔ | ✔ | ✔ |
Derivatives Risk | ✔ | ✔ | ✔ | ✔ | ✔ | ✔ | ✔ | ✔ |
Distressed Investments Risk | | | | | | | | ✔ |
105
SYMMETRY PANORAMIC TRUST
FEBRUARY 28, 2019
| US Equity | International
Equity | Global
Equity | Tax-
Managed
Global
Equity | US Fixed
Income | Municipal
Fixed
Income | Global
Fixed
Income | Alternatives |
Emerging Markets Risk | | ✔ | ✔ | ✔ | | | ● | ✔ |
Equity Risk | ✔ | ✔ | ✔ | ✔ | | | | |
Exchange-Traded Notes Risk | | | | | | | | ● |
Financial Sector Risk | ✔ | ✔ | ✔ | ✔ | | | | |
Fixed Income Securities | | | | | ✔ | ✔ | ✔ | ✔ |
Foreign (Non-U.S.) Investment Risk | | ✔ | ✔ | ✔ | | | ✔ | ✔ |
Forward and Futures Contract Risk | | ✔ | ✔ | ✔ | | | ✔ | ✔ |
Geographic and Sector Risk | ✔ | ✔ | ✔ | ✔ | ✔ | ✔ | ✔ | ✔ |
High Portfolio Turnover Risk | ✔ | ✔ | ✔ | ✔ | ✔ | ✔ | ✔ | ✔ |
High Yield Risk | | | | | ✔ | ✔ | ✔ | ✔ |
Index Tracking Error Risk | ✔ | ✔ | ✔ | ✔ | ✔ | ✔ | ✔ | ✔ |
Investment Companies and ETFs Risk | ✔ | ✔ | ✔ | ✔ | ✔ | ✔ | ✔ | ✔ |
Investment Style Risk | ✔ | ✔ | ✔ | ✔ | | | | ✔ |
IPO and SEO Risk | | | | | | | | ✔ |
Leveraging Risk | ● | ● | ● | ● | ● | ● | ● | ✔ |
Litigation and Enforcement Risk | | | | | | | | ✔ |
Liquidity Risk | ✔ | ✔ | ✔ | ✔ | ✔ | ✔ | ✔ | ✔ |
Management Risk | ✔ | ✔ | ✔ | ✔ | ✔ | ✔ | ✔ | ✔ |
Market Capitalization Risk | ✔ | ✔ | ✔ | ✔ | | | | ✔ |
Market Events Risk | ✔ | ✔ | ✔ | ✔ | ✔ | ✔ | ✔ | ✔ |
Market Risk | ✔ | ✔ | ✔ | ✔ | ✔ | ✔ | ✔ | ✔ |
Money Market Instrument Risk | | | | | ● | ● | ● | |
Municipal Bond Risk | | | | | ✔ | | | ● |
New Fund Risk | ✔ | ✔ | ✔ | ✔ | ✔ | ✔ | ✔ | ✔ |
106
SYMMETRY PANORAMIC TRUST
FEBRUARY 28, 2019
| US Equity | International
Equity | Global
Equity | Tax-
Managed
Global
Equity | US Fixed
Income | Municipal
Fixed
Income | Global
Fixed
Income | Alternatives |
ReFlow Liquidity Program | ● | ● | ● | ● | ● | ● | ● | ● |
REIT Risk | ✔ | ✔ | ● | ● | | | | |
Restricted Securities | | | | | | | | ✔ |
Securities Issued in PIPE Transactions | | | | | | | | ✔ |
Securities Lending Risk | ✔ | ✔ | ✔ | ✔ | | | | |
Short Sales Risk | | | | | | | | ✔ |
SPACs Risk | | | | | | | | ✔ |
Subsidiary Risk | | | | | | | | ● |
Swap Risk | | | | | | | | ✔ |
Taxability Risk | | | | | | ✔ | | |
Tax Risk | | | | | | | | ✔ |
Tax-Managed Investing Risk | | | | ✔ | | | | |
Temporary Defensive Positioning | ● | ● | ● | ● | ● | ● | ● | ● |
U.S. Government Securities Risk | ● | ● | ● | ● | ✔ | ✔ | ✔ | ✔ |
Valuation Risk | ✔ | ✔ | ✔ | ✔ | ✔ | ✔ | ✔ | ✔ |
Volatility Risk | ✔ | ✔ | ✔ | ✔ | | | | ✔ |
General — Because each Fund invests in the Underlying Funds, a Fund’s shareholders will be affected by the investment policies of the Underlying Funds in direct proportion to the amount of assets a Fund allocates to those Underlying Funds. Certain of the Funds also may invest in Underlying Funds that in turn invest in foreign issuers and thus are subject to additional risks, including changes in foreign currency exchange rates and country risk. Foreign investments of the Underlying Funds may include securities of issuers located in emerging countries in Asia, Latin America, Eastern Europe and Africa. The Funds also may invest in Underlying Funds that invest in mid-, small-, and micro-capitalization stocks, which may be riskier than investing in larger, more established companies.
A Fund’s investment in Underlying Funds that invest in fixed-income securities will be subject to, among other things, credit (or default) risk and interest rate/maturity risk. Credit (or default) risk is the risk that an issuer or guarantor of a security or a counterparty to a transaction may default on its payment obligations or experience a decline in credit quality. Interest rate/maturity risk is the risk that increases in prevailing interest rates will
107
SYMMETRY PANORAMIC TRUST
FEBRUARY 28, 2019
cause fixed-income securities held by a Fund to decline in value. The magnitude of this decline will often be greater for longer-term fixed-income securities than shorter-term fixed-income securities.
The Underlying Funds will also be subject to prepayment (or call) risk (the risk that an issuer will exercise its right to pay principal on an obligation held by a Fund earlier than expected) and debt extension risk (the risk that an issuer will exercise its right to pay principal on an obligation held by a Fund later than expected).
The Funds may invest in Underlying Funds that invest in asset-backed and structured investment securities, which may involve a greater chance of default during periods of economic downturn than other securities, and may be less liquid and more difficult to value and liquidate. Underlying Funds also may invest in real estate securities, commodity-related securities and money market investments. The risks of the Underlying Funds’ investments and a Fund to the extent a Fund invested in those investments directly are discussed in more detail below.
Arbitrage Risk — The risk incurred when a Fund invests in securities purchased pursuant to an arbitrage strategy in order to take advantage of a perceived relationship between the value of two securities presents certain risks. Securities purchased or sold short pursuant to an arbitrage strategy may not perform as intended, which may result in a loss to a Fund. Additionally, issuers of a security purchased pursuant to an arbitrage strategy are often engaged in significant corporate events, such as restructurings, acquisitions, mergers, takeovers, tender offers or exchanges, or liquidations. Such corporate events may not be completed as initially planned or may fail.
Asset Allocation Risk — The risk that the selection by the Adviser of the Underlying Funds and the allocation of a Fund’s assets among the Underlying Funds and the Sub-Adviser will cause a Fund to underperform other funds with similar investment objectives. In this regard, a Fund also may temporarily deviate from its factor exposures for the purpose of managing distributions. In addition, the Adviser may invest Fund assets in Underlying Funds managed by a limited number of investment managers. In such circumstances, a Fund’s performance could be substantially dependent on the performance of such managers. Similarly, the Adviser’s allocation of a Fund’s assets to a limited number of Underlying Funds may adversely affect the performance of a Fund, and, in such circumstances, it will be more sensitive to the performance and risks associated with those Underlying Funds and any investments in which such Underlying Funds focus.
Currency Risk — The risk that foreign currencies will decline in value relative to the U.S. dollar and adversely affect the value of a Fund’s or Underlying Fund’s investments in foreign (non-U.S.) currencies or in securities that trade in, and receive revenues in, or in derivatives that provide exposure to, foreign (non-U.S.) currencies. Currency risk may be particularly high to the extent that a Fund or Underlying Fund invests in foreign (non-U.S.) currencies or engages in foreign currency transactions that are economically tied to
108
SYMMETRY PANORAMIC TRUST
FEBRUARY 28, 2019
emerging market countries. Conversely, in strategies where currency risk is hedged, the risk is that an increase in the value of the local currency relative to the U.S. dollar will not be earned by a Fund investor.
Commodities Risk — Exposure to commodities markets may subject a Fund to greater volatility than investments in traditional securities. The value of commodity-linked derivative instruments may be affected by changes in overall market movements, commodity index volatility, changes in interest rates, or factors affecting a particular industry or commodity, such drought, floods, weather, livestock disease, embargoes, tariffs and international economic, political and regulatory developments. The prices of energy, industrial metals, precious metals, agriculture and livestock sector commodities may fluctuate widely due to factors such as changes in value, supply and demand and governmental regulatory policies.
The energy sector can be significantly affected by changes in the prices and supplies of oil and other energy fuels, energy conservation, the success of exploration projects, and tax and other government regulations, policies of the Organization of Petroleum Exporting Countries (“OPEC”) and relationships among OPEC members and between OPEC and oil importing nations. The metals sector can be affected by sharp price volatility over short periods caused by global economic, financial and political factors, resource availability, government regulation, economic cycles, changes in inflation or expectations about inflation in various countries, interest rates, currency fluctuations, metal sales by governments, central banks or international agencies, investment speculation and fluctuations in industrial and commercial supply and demand. The commodity-linked securities in which a Fund may invest may be issued by companies in the financial services sector, including the banking, brokerage and insurance sectors. As a result, events affecting issuers in the financial services sector may cause a Fund’s share value to fluctuate.
Convertible Securities — Convertible securities include fixed income securities that may be exchanged or converted into a predetermined number of shares of the issuer’s underlying common stock at the option of the holder during a specified period. Convertible securities may take the form of convertible preferred stock, convertible bonds or debentures, units consisting of “usable” bonds and warrants or a combination of the features of several of these securities. Convertible securities are senior to common stocks in an issuer’s capital structure, but are usually subordinated to similar non-convertible securities. While providing a fixed-income stream (generally higher in yield than the income derivable from common stock but lower than that afforded by a similar nonconvertible security), a convertible security also gives an investor the opportunity, through its conversion feature, to participate in the capital appreciation of the issuing company depending upon a market price advance in the convertible security’s underlying common stock.
Credit Default Swaps Risk — A credit default swap enables an investor to buy or sell protection against a credit event with respect to an issuer. Credit default swaps may have as reference obligations one or more securities that are not currently held by a Fund. The protection "buyer" may be obligated to pay the protection "seller" an up-front payment
109
SYMMETRY PANORAMIC TRUST
FEBRUARY 28, 2019
or a periodic stream of payments over the term of the contract, provided generally that no credit event on a reference obligation has occurred. Credit default swaps involve risks because they are difficult to value, are highly susceptible to liquidity and credit risk, and generally pay a return to the party that has paid the premium only in the event of an actual default by the issuer of the underlying obligation (as opposed to a credit downgrade or other indication of financial difficulty).
Cybersecurity Risk — With the increased use of the Internet and because information technology (“IT”) systems and digital data underlie most of a Fund’s operations, a Fund and its Adviser, any Sub-Advisers, custodian, transfer agent, distributor and other service providers and the financial intermediaries (collectively “Service Providers”) are exposed to the risk that their operations and data may be compromised as a result of internal and external cyber-failures, breaches or attacks (“Cyber Risk”). This could occur as a result of malicious or criminal cyber-attacks. Cyber-attacks include actions taken to: (i) steal or corrupt data maintained online or digitally, (ii) gain unauthorized access to or release confidential information, (iii) shut down a Fund or Service Provider website through denial-of-service attacks, or (iv) otherwise disrupt normal business operations. However, events arising from human error, faulty or inadequately implemented policies and procedures or other systems failures unrelated to any external cyber-threat may have effects similar to those caused by deliberate cyber-attacks.
Derivatives Risk — A Fund (or an Underlying Fund) may invest in derivatives, which are financial instruments whose value is typically based on the value of a security, commodity or index, in order to better track the Index. These instruments include options, futures contracts, swap agreements, including total return swap agreements, and similar instruments. A Fund’s (or an Underlying Fund’s) use of derivative instruments involves risks different from, and possibly greater than, the risks associated with investing directly in securities and other more traditional investments, and certain derivatives may create a risk of loss greater than the amount invested.
The market value of derivative instruments and securities may be more volatile than that of other instruments, and each type of derivative instrument may have its own special risks, including the risk of mispricing or improper valuation of derivatives and the inability of derivatives to correlate perfectly with underlying assets, rates, and indices. Many derivatives, in particular privately negotiated derivatives, are complex and often valued subjectively. Improper valuations can result in increased cash payment requirements to counterparties or a loss of value to a Fund. The value of derivatives may not correlate perfectly, or at all, with the value of the assets, reference rates or indices they are designed to closely track.
Derivatives are subject to a number of other risks, including liquidity risk (the possibility that the derivative may be difficult to purchase or sell and the Adviser may be unable to initiate a transaction or liquidate a position at an advantageous time or price), leverage risk (the possibility that adverse changes in the value or level of the underlying asset, reference rate or index can result in loss of an amount substantially greater than the
110
SYMMETRY PANORAMIC TRUST
FEBRUARY 28, 2019
amount invested in the derivative), interest rate risk (some derivatives are more sensitive to interest rate changes and market price fluctuations), and counterparty risk (the risk that a counterparty may be unable to perform according to a contract, and that any deterioration in a counterparty’s creditworthiness could adversely affect the instrument). In addition, because derivative products are highly specialized, investment techniques and risk analyses employed with respect to investments in derivatives are different from those associated with stocks and bonds. Finally, a Fund’s use of derivatives may cause a Fund to realize higher amounts of short-term capital gains (generally taxed at ordinary income tax rates) than if a Fund had not used such instruments.
Derivative instruments also are subject to the risk that the market value of an instrument will change to the detriment of a Fund. If the Adviser inaccurately forecast the values of securities, interest rates or other economic factors in using derivatives, a Fund might have been in a better position if it had not entered into the transaction at all. Some strategies involving derivative instruments can reduce the risk of loss, but they can also reduce the opportunity for gain or result in losses by offsetting favorable price movements in other investments held by a Fund. A Fund may also have to buy or sell a security at a disadvantageous time or price because regulations require funds to maintain offsetting positions or asset coverage in connection with certain derivatives transactions.
If the derivative is linked to the performance of an index, it will be subject to the risks associated with changes in that index. If the index changes, a Fund could receive lower interest payments or experience a reduction in the value of the derivative to below what a Fund paid. Certain indexed securities, including inverse securities (which move in an opposite direction to the index), may create leverage, to the extent that they increase or decrease in value at a rate that is a multiple of the changes in the applicable index.
Distressed Investments Risk — Distressed investments include loans, loan participations, bonds, notes, and non-performing and sub-performing mortgage loans, many of which are not publicly traded and may involve a substantial degree of risk. In certain periods, there may be little or no liquidity in the markets for these securities or instruments. In addition, the prices of such securities or instruments may be subject to periods of abrupt and erratic market movements and above-average price volatility. It may be more difficult to value such securities, and the spread between the bid and asked prices of such securities may be greater than normally expected. If a Fund’s evaluation of the risks and anticipated outcome of an investment in a distressed security should prove incorrect, a Fund may lose a substantial portion or all of its investment or it may be required to accept cash or securities with a value less than the original investment.
Emerging Markets Risk — A Fund’s investments in emerging market countries are subject to all of the risks of foreign investing generally, and have additional heightened risks due to a lack of established legal, political, business and social frameworks to support securities markets. These risks include less social, political and economic stability; smaller securities markets with low or nonexistent trading volume and greater illiquidity and price volatility; more restrictive national policies on foreign investment, including
111
SYMMETRY PANORAMIC TRUST
FEBRUARY 28, 2019
restrictions on investment in issuers or industries deemed sensitive to national interests; less transparent and established taxation policies; less developed regulatory or legal structures governing private and foreign investment; more pervasiveness of corruption and crime; less financial sophistication, creditworthiness and/or resources possessed by, and less government regulation of, the financial institutions and issuers with which a Fund transacts; less government supervision and regulation of business and industry practices, stock exchanges, brokers and listed companies than in the U.S.; greater concentration in a few industries resulting in greater vulnerability to regional and global trade conditions; higher rates of inflation and more rapid and extreme fluctuations in inflation rates; greater sensitivity to interest rate changes; increased volatility in currency exchange rates and potential for currency devaluations and/or currency controls; greater debt burdens relative to the size of the economy; more delays in settling portfolio transactions and heightened risk of loss from share registration and custody practices; and less assurance that recent favorable economic developments will not be slowed or reversed by unanticipated economic, political or social events in such countries.
Because of these risk factors, a Fund’s investments in developing market countries are subject to greater price volatility and illiquidity than investments in developed markets. Governments of emerging market and frontier market countries may own or control parts of the private sector. Accordingly, government actions could have a significant impact on economic conditions. Certain emerging market and frontier market countries require governmental approval prior to investments by foreign persons, limit the amount of investment by foreign persons in a particular sector and/or company, limit the investment by foreign persons to a specific class of securities of an issuer that may have less advantageous rights than a domestically available class, require foreign investors to maintain a trading account with only one licensed securities company in the relevant market and/or impose additional taxes on foreign investors. These may contribute to the illiquidity of the relevant securities market, as well as create inflexibility and uncertainty as to the trading environment.
Equity Risk — Equity securities are susceptible to general market fluctuations and volatile increases and decreases in value as market confidence in and perceptions of their issuers change.
Exchange-Traded Notes Risk — Exchange-traded notes are subject to credit risk, counterparty risk, and the risk that the value of the exchange-traded note may drop due to a downgrade in the issuer’s credit rating. The value of an exchange-traded note may also be influenced by time to maturity, level of supply and demand for the exchange-traded note, volatility and lack of liquidity in the underlying market, changes in the applicable interest rates, and economic, legal, political, or geographic events that affect the referenced underlying market or assets. An Underlying Fund will bear its proportionate share of any fees and expenses borne by an exchange-traded note in which it invests. For certain exchange-traded notes, there may be restrictions on an Underlying Fund’s right to redeem its investment in an exchange-traded note, which is meant to be held until maturity.
112
SYMMETRY PANORAMIC TRUST
FEBRUARY 28, 2019
Financial Sector Risk — The financial sector can be significantly affected by changes in interest rates, government regulation, the rate of defaults on corporate, consumer and government debt, the availability and cost of capital, and the impact of more stringent capital requirements. A Fund may be adversely affected by events or developments negatively impacting the financial sector.
Fixed Income Securities Risk — Fixed income securities held by a Fund are subject to interest rate risk, call risk, prepayment and extension risk, credit risk, and liquidity risk, which are more fully described below. In addition, current market conditions may pose heightened risks for fixed income securities. Current interest rates are at or near historic lows, and as the Federal Reserve Board has begun tapering its quantitative easing program and in December of 2015 began raising the federal funds rate, there is a risk that interest rates will rise. Future increases in interest rates could result in less liquidity and greater volatility of fixed income securities. A fund may lose money if short-term or long-term interest rates rise sharply. Moreover, new regulations applicable to and changing business practices of financial intermediaries restricting their market marking activities for certain fixed income securities, which may reduce the liquidity and increase the volatility for such fixed income securities.
| | ● | Call Risk. During periods of declining interest rates, a bond issuer may “call,” or repay, its high yielding bonds before their maturity dates. A Fund would then be forced to invest the unanticipated proceeds at lower interest rates, resulting in a decline in its income. |
| | ● | Credit Risk. Fixed income securities are generally subject to the risk that the issuer may be unable to make principal and interest payments when they are due. There is also the risk that the securities could lose value because of a loss of confidence in the ability of the borrower to pay back debt. Lower rated fixed income securities involve greater credit risk, including the possibility of default or bankruptcy. |
| | ● | Interest Rate Risk. Fixed income securities are subject to the risk that the securities could lose value because of interest rate changes. For example, bonds tend to decrease in value if interest rates rise. Fixed income securities with longer maturities sometimes offer higher yields, but are subject to greater price shifts as a result of interest rate changes than fixed income securities with shorter maturities. |
| | ● | Liquidity Risk. Trading opportunities are more limited for fixed income securities that have not received any credit ratings, have received ratings below investment grade or are not widely held. These features make it more difficult to sell or buy a security at a favorable price or time. Consequently, a Fund may have to accept a lower price to sell a security, sell other securities to raise cash or give up an investment opportunity, any of which could have a negative effect on its performance. Infrequent trading of securities may also lead to an increase in their price volatility. Liquidity risk also refers to the possibility that a Fund may |
113
SYMMETRY PANORAMIC TRUST
FEBRUARY 28, 2019
not be able to sell a security or close out an investment contract when it wants to. If this happens, a Fund will be required to hold the security or keep the position open, and it could incur losses.
| | ● | Prepayment and Extension Risk. Many types of fixed income securities are subject to prepayment risk. Prepayment occurs when the issuer of a fixed income security can repay principal prior to the security’s maturity. Fixed income securities subject to prepayment can offer less potential for gains during a declining interest rate environment and similar or greater potential for loss in a rising interest rate environment. In addition, the potential impact of prepayment features on the price of a fixed income security can be difficult to predict and result in greater volatility. On the other hand, rising interest rates could cause prepayments of the obligations to decrease, extending the life of mortgage- and asset-backed securities with lower payment rates. This is known as extension risk and may increase a Fund’s sensitivity to rising rates and its potential for price declines. |
| | ● | Variable and Floating Rate Securities. Variable and floating rate securities generally are less sensitive to interest changes but may decline in value if their interest rates do not rise as much, or as quickly, as interest rates in general. Floating rate securities will not generally increase in value if interest rates decline. |
Foreign (Non-U.S.) Investment Risk — Foreign securities include direct investments in non-U.S. dollar-denominated securities traded primarily outside of the United States and dollar-denominated securities of foreign issuers. Foreign securities also include indirect investments such as American Depositary Receipts (“ADRs”), European Depositary Receipts (“EDRs”) and Global Depositary Receipts (“GDRs”). ADRs are U.S. dollar-denominated receipts representing shares of foreign-based corporations. ADRs are receipts that are traded in the United States, and entitle the holder to all dividend and capital gain distributions that are paid out on the underlying foreign shares. EDRs and GDRs are receipts that often trade on foreign exchanges. They represent ownership in an underlying foreign or U.S. security and generally are denominated in a foreign currency. Foreign government obligations may include debt obligations of supranational entities, including international organizations (such as The International Bank for Reconstruction and Development, also known as the World Bank) and international banking institutions and related government agencies.
Special Risks of Foreign Securities: Foreign securities involve special risks and costs, which are considered by the investment adviser in evaluating the creditworthiness of issuers and making investment decisions for a Fund. Foreign securities fluctuate in price because of political, financial, social and economic events in foreign countries (including, for example, military confrontations, war and terrorism). A foreign security could also lose value because of more or less stringent foreign securities regulations and less stringent
114
SYMMETRY PANORAMIC TRUST
FEBRUARY 28, 2019
accounting and disclosure standards. In addition, foreign markets may have greater volatility than domestic markets and foreign securities may be less liquid and harder to value than domestic securities.
Foreign securities, and in particular foreign debt securities, are sensitive to changes in interest rates. In addition, investment in the securities of foreign governments involves the risk that foreign governments may default on their obligations or may otherwise not respect the integrity of their obligations. The performance of investments in securities denominated in a foreign currency also will depend, in part, on the strength of the foreign currency against the U.S. dollar and the interest rate environment in the country issuing the currency. Absent other events which otherwise could affect the value of a foreign security (such as a change in the political climate or an issuer’s credit quality), appreciation in the value of the foreign currency generally results in an increase in value of a foreign currency-denominated security in terms of U.S. dollars. A decline in the value of the foreign currency relative to the U.S. dollar generally results in a decrease in value of a foreign currency-denominated security. Additionally, many countries throughout the world are dependent on a healthy U.S. economy and are adversely affected when the U.S. economy weakens or its markets decline.
Investment in foreign securities may involve higher costs than investment in U.S. securities, including higher transaction and custody costs as well as the imposition of additional taxes by foreign governments. Foreign investments also may involve risks associated with the level of currency exchange rates, less complete financial information about the issuers, less market liquidity, more market volatility and political instability. Future political and economic developments, the possible imposition of withholding taxes on dividend income, the possible seizure or nationalization of foreign holdings, the possible establishment of exchange controls or freezes on the convertibility of currency, trade restrictions (including tariffs) or the adoption of other governmental restrictions might adversely affect an investment in foreign securities. Additionally, foreign banks and foreign branches of domestic banks may be subject to less stringent reserve requirements and to different accounting, auditing and recordkeeping requirements.
While the Funds’ or Underlying Funds’ investments may, if permitted, be denominated in foreign currencies, the portfolio securities and other assets held by the Funds or Underlying Funds are valued in U.S. dollars. Price fluctuations may occur in the dollar value of foreign securities because of changing currency exchange rates or, in the case of hedged positions, because the U.S. dollar declines in value relative to the currency hedged. Currency exchange rates may fluctuate significantly over short periods of time causing a Fund’s or Underlying Fund’s NAV to fluctuate as well. Currency exchange rates can be affected unpredictably by the intervention or the failure to intervene by U.S. or foreign governments or central banks, or by currency controls or political developments in the United States or abroad. To the extent that a Fund or Underlying Fund is invested in foreign securities while also maintaining currency positions, it may be exposed to greater combined risk. The net currency positions of the Funds or Underlying Funds may expose them to risks independent of their securities positions.
115
SYMMETRY PANORAMIC TRUST
FEBRUARY 28, 2019
The Funds or Underlying Funds may operate in euros and/or may hold euros and/or euro-denominated bonds and other obligations. The euro requires participation of multiple sovereign states forming the Euro zone and is therefore sensitive to the credit and general economic and political positions of each such state, including, each state’s actual and intended ongoing engagement with and/or support for the other sovereign states then forming the European Union (“EU”), in particular those within the Euro zone. Changes in these factors might materially and adversely impact the value of securities in which a Fund or Underlying Fund has invested.
In addition, voters in the United Kingdom (“UK”) have approved withdrawal from the European Union. Securities issued by companies domiciled in the UK could be subject to changing regulatory and tax regimes. Banking and financial services companies that operate in the UK or EU could be disproportionately impacted by those actions. Other countries may seek to withdraw from the EU and/or abandon the euro, the common currency of the EU, which could exacerbate market and currency volatility and negatively impact the Funds’ investments in securities issued by companies located in EU countries. A number of countries in Europe have suffered terror attacks, and additional attacks may occur in the future. Ukraine has experienced ongoing military conflict; this conflict may expand and military attacks could occur in Europe. Europe has also been struggling with mass migration from the Middle East and Africa. Recent and upcoming European elections could, depending on the outcomes, further call into question the future direction of the EU. The ultimate effects of these events and other socio-political or geopolitical issues are not known but could profoundly affect global economies and markets. The impact of these actions, especially if they occur in a disorderly fashion, is not clear, but could be significant and far-reaching. Whether or not a Fund invests in securities of issuers located in Europe or with significant exposure to European issuers or countries, these events could negatively affect the value and liquidity of a Fund’s investments.
Forward and Futures Contract Risk — The successful use of forward and futures contracts draws upon the Adviser’s skill and experience with respect to such instruments and is subject to special risk considerations. The primary risks associated with the use of futures contracts are (a) the imperfect correlation between the change in market value of the instruments held by a Fund and the price of the forward or futures contract; (b) possible lack of a liquid secondary market for a forward or futures contract and the resulting inability to close a forward or futures contract when desired; (c) losses caused by unanticipated market movements, which are potentially unlimited; (d) the Adviser’s inability to predict correctly the direction of securities prices, interest rates, currency exchange rates and other economic factors; (e) the possibility that the counterparty will default in the performance of its obligations; and (f) if a Fund has insufficient cash, it may have to sell securities from its portfolio to meet daily variation margin requirements, and a Fund may have to sell securities at a time when it may be disadvantageous to do so. A Fund could be unable to recover assets held at the futures clearing broker, even assets directly traceable to a Fund from the futures clearing broker in the event of a bankruptcy of the broker. A futures clearing broker is required to segregate customer funds pursuant to the Commodities Exchange Act and the regulations of the U.S. Commodity Futures Trading
116
SYMMETRY PANORAMIC TRUST
FEBRUARY 28, 2019
Commission (“CFTC”). However, in the unlikely event of the broker’s bankruptcy, there is no equivalent of the Securities Investors Protection Corporation insurance as is applicable in the case of securities broker dealers’ bankruptcies.
Geographic and Sector Risk — The risk that if a Fund (or an Underlying Fund) invests a significant portion of its total assets in certain issuers within the same geographic region or economic sector, an adverse economic, business or political development affecting that region or sector may affect the value of a Fund’s investments more than if a Fund’s investments were not so focused. While the Funds may not concentrate in any one industry, a Fund may invest without limitation in a particular country or market sector.
High Portfolio Turnover Risk — A Fund’s Sub-Adviser and/or the Underlying Funds, as applicable, may engage in active trading, including investments made on a shorter-term basis, which may lead to increased expenses that may result in lower investment returns.
High Yield Risk — Exposure to high yield (lower rated) debt instruments (also known as “junk bonds”) may involve greater levels of credit, liquidity and valuation risk than for higher rated instruments. High yield debt instruments may be more sensitive to economic changes, political changes, or adverse developments specific to a government or company than other fixed income instruments. These securities are subject to greater risk of loss, greater sensitivity to economic changes, valuation difficulties, and a potential lack of a secondary or public market for securities. High yield debt instruments are considered speculative with respect to the issuer’s continuing ability to make principal and interest payments and, therefore, such instruments generally involve greater risk of default or price changes than higher rated debt instruments. An economic downturn or period of rising interest rates could adversely affect the market for these securities and reduce market liquidity (liquidity risk). Less active markets may diminish the Fund’s ability to obtain accurate market quotations when valuing the portfolio securities and thereby give rise to valuation risk. If the issuer of a security is in default with respect to interest or principal payments, the issuer’s security could lose its entire value. Furthermore, the transaction costs associated with the purchase and sale of high yield debt instruments may vary greatly depending upon a number of factors and may adversely affect a Fund’s performance.
Index Tracking Error Risk — The performance of an Underlying Fund and its index may differ from each other for a variety of reasons. For example, an Underlying Fund that is index-based in which a Fund invests incurs operating expenses and portfolio transaction costs not incurred by the Underlying Fund's index. In addition, the Underlying Fund may not be fully invested in the securities of the index that it tracks at all times or may hold securities not included in its index.
Investment Companies and Exchange-Traded Funds Risk — When a Fund invests in other investment companies, including ETFs, it will bear additional expenses based on its pro rata share of the other investment company’s or ETF’s operating expenses, including the management fees of the Underlying Fund in addition to those paid by a Fund. The
117
SYMMETRY PANORAMIC TRUST
FEBRUARY 28, 2019
risk of owning an Underlying Fund generally reflects the risks of owning the underlying investments the Underlying Fund holds. A Fund also will incur brokerage costs when it purchases and sells ETFs.
Investment Style Risk — The risk that different investment styles (e.g., “growth,” “value,” or “quantitative”) tend to shift in and out of favor, depending on market and economic conditions as well as investor sentiment. A Fund may outperform or underperform other funds that employ a different investment style.
| | o | Momentum Style Risk. Investing in or having exposure to securities with positive momentum entails investing in securities that have had above-average recent returns. These securities may be more volatile than a broad cross-section of securities. In addition, there may be periods when the momentum style is out of favor, and during which the investment performance of a Fund using a momentum strategy may suffer. |
| | o | Value Investing Risk is the risk that the market will not recognize a security’s inherent value for a long time, or that a stock judged to be undervalued by a Fund’s adviser may actually be appropriately priced or overvalued. Value oriented funds will typically underperform when growth investing is in favor. |
| | o | Quantitative Investing Risk the risk that the value of securities or other investments selected using quantitative analysis can perform differently from the market as a whole or from their expected performance. This may be as a result of the factors used in building the multifactor quantitative model, the weights placed on each factor, the accuracy of historical data supplied by third parties, and changing sources of market returns. |
Certain Sub-Advisers may rely heavily on quantitative models and information and data supplied by third parties (“Models and Data”). Models and Data are used to construct sets of transactions and investments, to provide risk management insights, and to assist in hedging investments.
When Models and Data prove to be incorrect or incomplete, any decisions made in reliance thereon expose a Fund to potential risks. Similarly, any hedging based on faulty Models and Data may prove to be unsuccessful. Some of the models used for a Fund are predictive in nature. The use of predictive models has inherent risks. Because predictive models are usually constructed based on historical data supplied by third parties, the success of relying on such models may depend heavily on the accuracy and reliability of the supplied historical data. A Fund bears the risk that the quantitative models used will not be successful in selecting companies for investment or in determining the weighting of investment positions that will enable a Fund to achieve its investment objective.
118
SYMMETRY PANORAMIC TRUST
FEBRUARY 28, 2019
All models rely on correct market data inputs. If incorrect market data is entered into even a well-founded model, the resulting information will be incorrect. However, even if market data is input correctly, “model prices” will often differ substantially from market prices, especially for instruments with complex characteristics, such as derivative instruments.
IPO and SEO Risk — The market value of shares sold in an initial public offering (an “IPO”) will fluctuate considerably due to factors such as the absence of a prior public market, unseasoned trading, the small number of shares available for trading and limited information about the issuer. “SEOs” are seasoned (i.e., secondary) equity offerings of U.S. equity securities. The purchase of IPO shares may involve high transaction costs. IPO and SEO shares are subject to market risk and liquidity risk. In addition, the prices of securities sold in IPOs or SEOs may be highly volatile or may decline shortly after the initial public offering or seasoned equity offering.
Leveraging Risk — Financial leverage refers to the use of debt to acquire assets. The Fund may use leverage through a line of credit offered by a bank or may purchase derivatives that have the effect of creating leverage. The use of leverage may exaggerate any increase or decrease in a Fund’s net asset value, causing a Fund to be more volatile. The use of leverage may increase expenses and increase the impact of a Fund’s other risks. The use of leverage may cause a Fund or Underlying Fund to liquidate portfolio positions when it may not be advantageous to do so to satisfy its obligations or to meet regulatory requirements resulting in increased volatility of returns. Leverage, including borrowing, may cause a Fund to be more volatile than if a Fund had not been leveraged. Additionally, for certain derivatives, such as futures, adverse changes in the value or level of the reference asset, rate, or index may result in a loss substantially greater than the amount paid for the derivative.
Liquidity Risk — There is risk that a Fund may not be able to pay redemption proceeds within the time periods described in this Prospectus because of unusual market conditions, an unusually high volume of redemption requests, legal restrictions impairing its ability to sell particular securities or close derivative positions at an advantageous market price or other reasons. Certain portfolio securities may be less liquid than others, which may make them difficult or impossible to sell at the time and the price that a Fund would like or difficult to value. A Fund may have to lower the price, sell other securities instead or forgo an investment opportunity. Any of these events could have a negative effect on fund management or performance. Funds with principal investment strategies that involve investments in securities of companies with smaller market capitalizations, foreign securities, Rule 144A securities, derivatives or securities with substantial market and/or credit risk tend to have the greatest exposure to liquidity risk.
Litigation and Enforcement Risk — Companies involved in significant restructuring tend to involve increased litigation risk, including for investors in these companies. This risk may be greater in the event an Underlying Fund takes a large position or is otherwise prominently involved. The expense of defending against (or asserting) claims and paying
119
SYMMETRY PANORAMIC TRUST
FEBRUARY 28, 2019
any amounts pursuant to settlements or judgments would be borne by the Underlying Fund (directly if it were directly involved or indirectly in the case of claims by or against an underlying company or settlements or judgments paid by an underlying company). Further, ownership of companies over certain threshold levels involves additional filing requirements and substantive regulation on such owners, and if a Fund fails to comply with all of these requirements, the Underlying Fund may be forced to disgorge profits, pay fines or otherwise bear losses or other costs from such failure to comply.
In addition, there have been a number of widely reported instances of violations of securities laws through the misuse of confidential information. Such violations may result in substantial liabilities for damages caused to others, for the disgorgement of profits realized and for penalties. Investigations and enforcement proceedings may be charged with involvement in such violations. Furthermore, if persons associated with a company in which a Fund invested engages in such violations, that fund could be exposed to losses.
Management Risk — The net asset value of a Fund changes daily based on the performance of the securities and derivatives in which it invests. The Adviser’s judgments about the attractiveness, value and potential appreciation of particular securities or derivatives in which a Fund invests may prove to be incorrect and may not produce the desired results. Additionally, the Adviser may have conflicts of interest that could interfere with its management of a Fund’s portfolio. For example, the Adviser or its affiliates may manage other investment funds or have other clients that may be similar to, or overlap with, the investment objective and strategy of a Fund, creating potential conflicts of interest when making decisions regarding which investments may be appropriate for a Fund and other clients. Further information regarding conflicts of interest is available in the SAI.
Market Capitalization Risk — Stocks fall into the following broad market capitalization categories—large, medium, small and micro. A Fund or an Underlying Fund that invests primarily in one of these categories carries the risk that due to current market conditions that category may be out of favor with investors. If valuations of large capitalization companies appear to be greatly out of proportion to the valuations of micro, small or medium capitalization companies, investors may migrate to the stocks of micro, small and medium-sized companies. Larger, more established companies may also be unable to respond quickly to new competitive challenges such as changes in technology and consumer tastes. Many larger companies also may not be able to attain the high growth rate of successful smaller companies, especially during extended periods of economic expansion.
Investing in medium, small, and micro capitalization companies may be subject to special risks associated with narrower product lines, more limited financial resources, fewer experienced managers, dependence on a few key employees, and a more limited trading market for their stocks, as compared with larger companies. In addition, securities of these companies are subject to the risk that, during certain periods, the liquidity of particular issuers or industries will shrink or disappear with little forewarning as a result of adverse economic or market conditions, or adverse investor perceptions, whether or not accurate.
120
SYMMETRY PANORAMIC TRUST
FEBRUARY 28, 2019
Securities of medium, small and micro capitalization issuers may therefore be subject to greater price volatility and may decline more significantly in market downturns than securities of larger companies.
Micro, small and medium capitalization issuers also may require substantial additional capital to support their operations, to finance expansion or to maintain their competitive position; and may have substantial borrowings or may otherwise have a weak financial condition, and may be susceptible to bankruptcy. Transaction costs for these investments are often higher than those of larger capitalization companies. There is typically less publicly available information about small and micro capitalization companies. Generally, the smaller the company size, the greater the risk.
Some micro, small, and medium capitalization companies also may be relatively new issuers, which carries risks in addition to the risks of other medium, small and micro capitalization companies. New issuers may be more speculative because such companies are relatively unseasoned. These companies will often be involved in the development or marketing of a new product with no established market, which could lead to significant losses.
Market Risk — Overall capital market risk may affect the value of individual instruments in which a Fund invests. Factors such as domestic and foreign economic growth and market conditions, interest rate levels, and political events affect the securities markets. When the value of a Fund’s investments goes down, your investment in a Fund decreases in value and you could lose money.
Market Events Risk — Financial markets are subject to periods of volatility, depressed valuations, decreased liquidity and heightened uncertainty, such as what was experienced in and around 2008. These conditions are an inevitable part of investing in capital markets and may continue, recur, worsen or spread. The U.S. government and the Federal Reserve, as well as certain foreign governments and central banks, may take steps to support financial markets, including by keeping interest rates at historically low levels. This and other government intervention may not work as intended, particularly if the efforts are perceived by investors as being unlikely to achieve the desired results. The U.S. government and the Federal Reserve may also reduce market support activities. Such reduction, including interest rate increases, could negatively affect financial markets generally, increase market volatility and reduce the value and liquidity of securities in which a Fund invests. Policy and legislative changes in the United States and in other countries may also contribute to decreased liquidity and increased volatility in the financial markets. The impact of these influences on the markets, and the practical implications for market participants, may not be fully known for some time.
Money Market Instrument Risk — The value of money market instruments may be affected by changing interest rates and by changes in the credit ratings of the investments. An investment in a money market fund is not insured or guaranteed by the FDIC or any other government agency. It is possible to lose money by investing in a money market fund. Recently, the SEC adopted money market fund reform intended to address potential
121
SYMMETRY PANORAMIC TRUST
FEBRUARY 28, 2019
systemic risks associated with money market funds and to improve transparency for money market fund investors. The money market fund reforms may impact the structure, operations and return potential of the money market funds in which a Fund invests.
Municipal Bond Risk — The underlying funds that invest in municipal bonds may be affected significantly by the economic, regulatory or political developments affecting the ability of issuers of municipal bonds to pay interest or repay principal. In addition, the ability of an issuer to make payments or repay interest may be affected by litigation or bankruptcy. In the event of bankruptcy of such an issuer, an underlying fund investing in the issuer’s securities could experience delays in collecting principal and interest, and the underlying fund may not, in all circumstances, be able to collect all principal and interest to which it is entitled. To enforce its rights in the event of a default in the payment of interest or repayment of principal, or both, an underlying fund may, in some instances, take possession of, and manage, the assets securing the issuer’s obligations on such securities, which may increase the underlying fund’s operating expenses. Any income derived from the underlying fund’s ownership or operation of such assets may not be tax-exempt. Municipal bonds are generally subject to interest rate, credit and market risk.
Because many municipal bonds are issued to finance similar projects (such as those relating to education, health care, housing, transportation, and utilities), conditions in those sectors may affect the overall municipal securities market. In addition, changes in the financial condition of an individual municipal issuer can affect the overall municipal market. Municipal bonds backed by current or anticipated revenues from a specific project or specific assets can be negatively affected by the discontinuance of the supporting taxation or the inability to collect revenues for the specific project or specific assets. Municipal bonds are subject to the risk that the Internal Revenue Service (the “IRS”) may determine that an issuer has not complied with applicable tax requirements and that interest from the municipal bond is taxable, which may result in a significant decline in the value of the security.
Municipal bonds may be less liquid than taxable bonds and there may be less publicly available information on the financial condition of municipal bond issuers than for issuers of other securities, and the investment performance of an underlying fund investing in municipal bonds may therefore be more dependent on the analytical abilities of the Adviser than if the underlying fund held other types of investments such as stocks or taxable bonds. The secondary market for municipal bonds also tends to be less well-developed or liquid than many other securities markets, a by-product of lower capital commitments to the asset class by the dealer community, which may adversely affect an underlying fund’s ability to sell municipal bonds it holds at attractive prices or value municipal bonds.
New Fund Risk — A Fund is newly-formed. Investors bear the risk that a Fund may not grow to or maintain economically viable size, not be successful in implementing its investment strategy, and may not employ a successful investment strategy, any of which could result in a Fund being liquidated at any time without shareholder approval and/or at
122
SYMMETRY PANORAMIC TRUST
FEBRUARY 28, 2019
a time that may not be favorable for certain shareholders. Such a liquidation could have negative tax consequences for shareholders. In addition, the Adviser, which was founded in 1994, has not previously managed a mutual fund.
ReFlow Liquidity Program — The Fund may participate in a variety of liquidity programs offered by ReFlow Fund, LLC (“ReFlow”). These include the ReFlow Redemption Service and ReFlow NAVswap, both of which are designed to provide alternative sources of liquidity to funds experiencing net redemptions of their shares. The ReFlow Redemption Service provides participating funds with a source of cash to meet net shareholder redemptions by standing ready each business day to purchase fund shares up to the value of the net shares redeemed from the fund and settling the next business day, subject to certain limitations. Following purchases of fund shares, ReFlow then generally redeems those shares when the fund experiences net sales, at the end of a maximum holding period determined by ReFlow, or at other times at ReFlow’s discretion. In the event the Fund uses the ReFlow Redemption Service, the Fund will pay a fee to ReFlow each time ReFlow purchases Fund shares, calculated by multiplying the value of shares ReFlow purchases by a rate determined through an automated daily auction. In accordance with federal securities laws, ReFlow is prohibited from acquiring more than 3% of the outstanding voting securities of the Fund. ReFlow NAVswap also provides participating funds with a source of cash to meet net shareholder redemptions. ReFlow NAVswap is an International Swaps and Derivatives Association governed total return swap in which a fund receives a return that corresponds to the daily change in the fund’s net asset value. In return, the fund pays one-month SOFR plus a spread. By participating in the ReFlow programs, the Fund may maintain a lower cash balance than might otherwise be required. In an environment of declining market values, a fund participating in the ReFlow programs may experience a greater decrease in value than it would if it did not participate in the programs and instead maintained a higher cash balance.
REIT Risk — There is risk that investments in real estate investment trusts (REITs) will make an Underlying Fund more susceptible to risks associated with the ownership of real estate and with the real estate industry in general. REITs may be less diversified than other pools of securities, may have lower trading volumes and may be subject to more abrupt or erratic price movements than the overall securities markets.
Restricted Securities — A Fund may invest securities in which the disposition would be subject to legal restrictions (so called “restricted securities”). Restricted securities may be sold only in privately negotiated transactions or in a public offering with respect to which a registration statement is in effect under the Securities Act of 1933, as amended (the “Securities Act”). Where registration is required, a Fund may be obligated to pay all or part of the registration expenses and a considerable period may elapse between the time of the decision to sell and the time a Fund may be permitted to sell a security under an effective registration statement. If, during such a period, adverse market conditions were to develop, a Fund might obtain a less favorable price than that which prevailed when it decided to sell. Restricted securities issued pursuant to Rule 144A under the Securities Act that have a readily available market usually are not deemed illiquid for purposes of this limitation
123
SYMMETRY PANORAMIC TRUST
FEBRUARY 28, 2019
by a Fund. However, investing in Rule 144A securities could result in increasing the level of a Fund’s illiquidity if qualified institutional buyers become, for a time, uninterested in purchasing these securities.
Securities Issued In PIPE Transactions — A Fund may invest in securities that are purchased in private investment in public equity (“PIPE”) transactions. Securities acquired by a Fund in such transactions are subject to resale restrictions under securities laws. While issuers in PIPE transactions typically agree that they will register the securities for resale by a Fund after the transaction closes (thereby removing resale restrictions), there is no guarantee that the securities will in fact be registered. In addition, a PIPE issuer may require a Fund to agree to other resale restrictions as a condition to the sale of such securities. Thus, a Fund’s ability to resell securities acquired in PIPE transactions may be limited, and even though a public market may exist for such securities, the securities held by a Fund may be deemed illiquid.
Securities Lending Risk — To realize additional income, a Fund or its Underlying Fund may lend portfolio securities with a value of up to 33⅓% of a Fund’s or Underlying Fund’s total assets, including any collateral received from the loans. A Fund (or Underlying Fund) receives collateral equal to at least 102% of the market value for loans secured by government securities or cash in the same currency as the loaned shares and 105% for all other loaned securities at each loan’s inception. The collateral a Fund receives will generally take the form of cash, U.S. Government securities, letters of credit, or other collateral as deemed appropriate by the Adviser. A Fund (or the Underlying Fund) may use any cash collateral it receives to invest in short-term investments, including money market funds. It is the Trust’s policy to obtain additional collateral from or return excess collateral to the borrower by the end of the next business day. Therefore, from time to time the value of the collateral received by a Fund may be less than the value of the securities on loan. A Fund will receive income earned on the securities loaned during the lending period and a portion of the interest or rebate earned on the collateral received. The risks associated with lending portfolio securities, as with other extensions of secured credit, include, but are not limited to, possible delays in receiving additional collateral or in the recovery of the securities loaned, possible loss of rights in the collateral should the borrower fail financially, as well as risk of loss in the value of the collateral or the value of the investments made with the collateral.
Short Sales Risk — A Fund may attempt to limit its exposure to a possible market decline in the value of its portfolio securities through short sales of securities that its portfolio manager believes possess volatility characteristics similar to those being hedged. A Fund may also use short sales for non-hedging purposes to pursue its investment objectives if, in the portfolio manager’s view, the security is over-valued. Short selling is speculative in nature and, in certain circumstances, can substantially increase the effect of adverse price movements on a Fund’s portfolio. A short sale of a security involves the risk of an unlimited increase in the market price of the security that can in turn result in an inability to cover the short position and a theoretically unlimited loss. No assurance can be given that securities necessary to cover a Fund’s short position will be available for purchase.
124
SYMMETRY PANORAMIC TRUST
FEBRUARY 28, 2019
The SEC and other U.S. and non-U.S. regulatory authorities have imposed, and may impose in the future, restrictions on short selling, either on a temporary or permanent basis. Such restrictions may include placing limitations on specific companies and/or industries with respect to which a Fund may enter into short positions, and may hinder a Fund in, or prevent it from, implementing its investment strategies, and may negatively affect performance.
SPACs Risk — An Underlying Fund may invest in stock, warrants, and other securities of special purpose acquisition companies (“SPACs”) or similar special purpose entities that pool funds to seek potential acquisition opportunities. Unless and until an acquisition is completed, a SPAC generally invests its assets (less a portion retained to cover expenses) in U.S. Government securities, money market fund securities and cash; if an acquisition that meets the requirements for the SPAC is not completed within a pre-established period of time, the invested funds are returned to the entity’s shareholders. Because SPACs and similar entities are in essence blank check companies without an operating history or ongoing business other than seeking acquisitions, the value of their securities is particularly dependent on the ability of the entity’s management to identify and complete a profitable acquisition. Some SPACs may pursue acquisitions only within certain industries or regions, which may increase the Volatility of their prices. In addition, these securities, which are typically traded in the over-the-counter market, may be considered illiquid and/or be subject to restrictions on resale.
Subsidiary Risk — By investing in a Subsidiary, an Underlying Fund is indirectly exposed to the risks associated with the Subsidiary’s investments. The commodity-related instruments held by the Subsidiary are generally similar to those that are permitted to be held by the Underlying Fund and are subject to the same risks that apply to similar investments if held directly by the Underlying Fund. There can be no assurance that the investment objective of the Subsidiary will be achieved. A Subsidiary is not registered under the 1940 Act and generally is not subject to all the investor protections of the 1940 Act. However, the Underlying Fund wholly owns and controls the Subsidiary, and the Underlying Fund and the Subsidiary are both managed by the same adviser, making it unlikely that the Subsidiary will take action contrary to the interests of the Underlying Fund and its shareholders. Changes in the laws of the United States and/or the Cayman Islands could result in the inability of the Underlying Fund and/or the Subsidiary to operate as described in its prospectus and statement of additional information and could adversely affect a Fund.
Taxability Risk — Some or all of an Underlying Funds’ income may be subject to the federal alternative minimum tax, which could reduce a Fund’s after-tax returns from the Underlying Funds. In addition, there is no guarantee that all of a Fund’s income will remain exempt from federal or state or local income taxes. Income from municipal bonds held by a Fund or an Underlying Fund could be declared taxable because of unfavorable changes in tax laws, adverse interpretations by the Internal Revenue Service or state tax
125
SYMMETRY PANORAMIC TRUST
FEBRUARY 28, 2019
authorities, or non-compliant conduct of a bond issuer. A Fund or an Underlying Fund may sell securities that lose their tax-exempt statuses at inopportune times, which may cause tax consequences or a decrease in a Fund’s value.
Tax Risk — The federal income tax treatment of the complex securities in which Underlying Funds may invest may not be clear or may be subject to recharacterization by the IRS. It could be more difficult to comply with the tax requirements applicable to regulated investment companies if the tax characterization of investments or the tax treatment of the income from such investments were successfully challenged by the IRS. Any such failure to comply with the rules applicable to regulated investment companies could make it more difficult for an Underlying Fund itself to comply with such rules. Furthermore, the ability of the Underlying Fund to gain commodity exposure as contemplated may be adversely affected by future legislation, regulatory developments, interpretive guidance or other actions by the IRS or the Treasury Department. In addition, the Underlying Fund’s use of derivatives may cause a Fund to realize higher amounts of short-term capital gains (generally taxed at ordinary income tax rates) than if a Fund had not used such instruments.
Tax-Managed Investing Risk — Market conditions may limit a Fund’s ability to generate tax losses or to generate dividend income taxed at favorable tax rates. A Fund’s tax-managed strategy may cause a Fund to hold a security in order to achieve more favorable tax-treatment or to sell a security in order to create tax losses. A Fund’s ability to utilize various tax-management techniques may be curtailed or eliminated in the future by tax legislation or regulation. Although a Fund can generally be expected to distribute a smaller percentage of returns each year than an equity mutual fund that is managed without regard to tax considerations, there can be no assurance about the size of taxable distributions to shareholders.
U.S. Government Securities Risk — Treasury obligations may differ in their interest rates, maturities, times of issuance and other characteristics. Obligations of U.S. Government agencies and authorities are supported by varying degrees of credit but generally are not backed by the full faith and credit of the U.S. Government. No assurance can be given that the U.S. Government will provide financial support to its agencies and authorities if it is not obligated by law to do so. In addition, the value of U.S. Government securities may be affected by changes in the credit rating of the U.S. Government.
Valuation Risk — The sale price a Fund could receive for a security may differ from a Fund’s valuation of the security, particularly for securities that trade in low volume or volatile markets, or that are valued using a fair value methodology. Because portfolio securities of a Fund may be traded on non-U.S. exchanges, and non-U.S. exchanges may be open on days when a Fund does not price its shares, the value of the securities in a Fund’s portfolio may change on days when shareholders will not be able to purchase or sell a Fund’s shares.
Volatility Risk — A Fund may have investments that appreciate or decrease significantly in value over short periods of time. This may cause a Fund’s net asset value per share to experience significant increases or declines in value over short periods of time.
126
SYMMETRY PANORAMIC TRUST
FEBRUARY 28, 2019
9. Other:
As of February 28, 2019, the percentage of total shares outstanding held by shareholders for the Funds, which are comprised of individual shareholders and omnibus accounts that are held on behalf of various individual shareholders were as follows:
| No. of
Shareholders | %
Ownership |
Symmetry Panoramic US Equity Fund | 1 | 95.99% |
Symmetry Panoramic International Equity Fund | 1 | 96.12% |
Symmetry Panoramic Global Equity Fund | 1 | 96.30% |
Symmetry Panoramic Tax-Managed Global Equity Fund | 3 | 98.94% |
Symmetry Panoramic US Fixed Income Fund | 1 | 95.67% |
Symmetry Panoramic Municipal Fixed Income Fund | 3 | 96.37% |
Symmetry Panoramic Global Fixed Income Fund | 1 | 96.02% |
Symmetry Panoramic Alternatives Fund | 2 | 99.99% |
In the normal course of business, the Funds enter into contracts that provide general indemnifications. The Funds’ maximum exposure under these arrangements is dependent on future claims that may be made against the Funds and, therefore, cannot be established; however, based on experience, the risk of loss from such claim is considered remote.
10. Regulatory Matters:
On August 17, 2018, the SEC adopted amendments to Regulation S-X. These changes are effective for periods after November 5, 2018. The updates to Registered Investment Companies were mainly focused on simplifying the presentation of distributable earnings by eliminating the need to present the components of distributable earning on a book basis in the Statement of Assets & Liabilities. The update also impacted the presentation of undistributed net investment income and distribution to shareholders on the Statement of Changes in Net Assets.
11. New Accounting Pronouncement:
In August 2018, the FASB issued Accounting Standards Update 2018-13, Fair Value Measurement (Topic 820). The new guidance includes additions and modifications to disclosures requirements for fair value measurements. For public entities, the amendments are effective for financial statements issued for fiscal years beginning after December 15, 2019, and interim periods within those fiscal years. At this time, management is currently evaluating the impact of this new guidance on the financial statements and disclosures.
12. Subsequent Events:
The Funds have evaluated the need for additional disclosures and/or adjustments resulting from subsequent events through the date the financial statements were issued. Based on this evaluation, no additional disclosures and/or adjustments were required to the financial statements as of February 28, 2019.
127
SYMMETRY PANORAMIC TRUST
FEBRUARY 28, 2019
DISCLOSURE OF FUND EXPENSES (Unaudited) |
All mutual funds have operating expenses. As a shareholder of a mutual fund, your investment is affected by these ongoing costs, which include (among others) costs for Fund management, administrative services, and shareholder reports like this one. It is important for you to understand the impact of these costs on your investment returns.
Operating expenses such as these are deducted from the mutual fund’s gross income and directly reduce your final investment return. These expenses are expressed as a percentage of the mutual fund’s average net assets; this percentage is known as the mutual fund’s expense ratio.
The following examples use the expense ratio and are intended to help you understand the ongoing costs (in dollars) of investing in your Fund and to compare these costs with those of other mutual funds. The examples are based on an investment of $1,000 made at the beginning of the period shown and held for the entire period from September 1, 2018 to February 28, 2019.
The table on the next page illustrates your Fund’s costs in two ways:
□ Actual Fund Return. This section helps you to estimate the actual expenses after fee waivers that your Fund incurred over the period. The “Expenses Paid During Period” column shows the actual dollar expense cost incurred by a $1,000 investment in the Fund, and the “Ending Account Value” number is derived from deducting that expense cost from the Fund’s gross investment return.
You can use this information, together with the actual amount you invested in the Fund, to estimate the expenses you paid over that period. Simply divide your ending starting account value by $1,000 to arrive at a ratio (for example, an $8,600 account value divided by $1,000 = 8.6), then multiply that ratio by the number shown for your Fund under “Expenses Paid During Period.”
□ Hypothetical 5% Return. This section helps you compare your Fund’s costs with those of other mutual funds. It assumes that the Fund had an annual 5% return before expenses during the year, but that the expense ratio (Column 3) for the period is unchanged. This example is useful in making comparisons because the Securities and Exchange Commission requires all mutual funds to make this 5% calculation. You can assess your Fund’s comparative cost by comparing the hypothetical result for your Fund in the “Expense Paid During Period” column with those that appear in the same charts in the shareholder reports for other mutual funds.
128
SYMMETRY PANORAMIC TRUST
FEBRUARY 28, 2019
DISCLOSURE OF FUND EXPENSES (Unaudited) – concluded |
Note: Because the return is set at 5% for comparison purposes — NOT your Fund’s actual return — the account values shown may not apply to your specific investment.
| Beginning
Account
Value
9/1/18 | Ending
Account
Value
2/28/19 | Annualized
Expense
Ratios | Expenses
Paid
During
Period |
Symmetry Panoramic US Equity Fund | | | | |
Class I Shares | | | | |
Actual Fund Return | $ 1,000.00 | $ 1,032.50 | 0.48% | $ 1.44* |
Hypothetical 5% Return | $ 1,000.00 | $ 1,022.41 | 0.48% | $ 2.41** |
Symmetry Panoramic International Equity Fund | | | | |
Class I Shares | | | | |
Actual Fund Return | $ 1,000.00 | $ 1,057.60 | 0.65% | $ 1.98* |
Hypothetical 5% Return | $ 1,000.00 | $ 1,021.57 | 0.65% | $ 3.26** |
Symmetry Panoramic Global Equity Fund | | | | |
Class I Shares | | | | |
Actual Fund Return | $ 1,000.00 | $ 1,043.90 | 0.52% | $ 1.57* |
Hypothetical 5% Return | $ 1,000.00 | $ 1,022.22 | 0.52% | $ 2.61** |
Symmetry Panoramic Tax-Managed Global Equity Fund | | | | |
Class I Shares | | | | |
Actual Fund Return | $ 1,000.00 | $ 1,055.00 | 0.42% | $ 1.28* |
Hypothetical 5% Return | $ 1,000.00 | $ 1,022.71 | 0.42% | $ 2.11** |
Symmetry Panoramic US Fixed Income Fund | | | | |
Class I Shares | | | | |
Actual Fund Return | $ 1,000.00 | $ 1,022.90 | 0.41% | $ 1.23* |
Hypothetical 5% Return | $ 1,000.00 | $ 1,022.76 | 0.41% | $ 2.06** |
Symmetry Panoramic Municipal Fixed Income Fund | | | | |
Class I Shares | | | | |
Actual Fund Return | $ 1,000.00 | $ 1,013.70 | 0.41% | $ 1.22* |
Hypothetical 5% Return | $ 1,000.00 | $ 1,022.76 | 0.41% | $ 2.06** |
Symmetry Panoramic Global Fixed Income Fund | | | | |
Class I Shares | | | | |
Actual Fund Return | $ 1,000.00 | $ 1,027.70 | 0.43% | $ 1.29* |
Hypothetical 5% Return | $ 1,000.00 | $ 1,022.66 | 0.43% | $ 2.16** |
Symmetry Panoramic Alternatives Fund | | | | |
Class I Shares | | | | |
Actual Fund Return | $ 1,000.00 | $ 995.20 | 0.50% | $ 1.48* |
Hypothetical 5% Return | $ 1,000.00 | $ 1,022.32 | 0.50% | $ 2.51** |
* | Expenses are equal to the Funds’ annualized expense ratio multiplied by the average account value over the period, multiplied by 108/365 (to reflect the period since inception on November 12, 2018 to the period ended February 28, 2019.) |
** | Expenses are equal to the Funds’ annualized expense ratio multiplied by the average account value over the period, multiplied by 181/365 (to reflect the one-half period.) |
129
SYMMETRY PANORAMIC TRUST
FEBRUARY 28, 2019
APPROVAL OF INVESTMENT ADVISORY AGREEMENT (Unaudited) |
At a meeting of the Board of Trustees (the “Trustees” or the “Board”) of Symmetry Panoramic Trust (the “Trust”) held on July 17, 2018, the Trustees, including those Trustees who are not “interested persons” (as defined in the Investment Company Act of 1940) of the Trust (the “Independent Trustees”), approved:
(1) | an investment advisory agreement (the “Advisory Agreement”) between Symmetry Partners, LLC (“Symmetry”) and the Trust, on behalf of the Symmetry Panoramic U.S. Equity Fund, Symmetry Panoramic International Equity Fund, Symmetry Panoramic Global Equity Fund, Symmetry Panoramic Tax-Managed Global Equity Fund, Symmetry Panoramic US Fixed Income Fund, Symmetry Panoramic Municipal Fixed Income Fund, Symmetry Panoramic Global Fixed Income Fund, and Symmetry Panoramic Alternatives Fund (each, a “Fund” and together, the “Funds”), pursuant to which Symmetry would provide the Funds with investment advisory services; and |
(2) | an investment sub-advisory agreement (the “Sub-Advisory Agreement” and, together with the Advisory Agreement, the “Agreements”) between AQR Capital Management, LLC (“AQR”) and Symmetry, pursuant to which AQR would provide investment sub-advisory services to the Symmetry Panoramic U.S. Equity Fund, Symmetry Panoramic International Equity Fund, and Symmetry Panoramic Global Equity Fund (the “Sub-Advised Funds”). |
In considering whether to approve the Agreements, the Trustees considered and discussed information and analyses provided in advance of the meeting by Symmetry, AQR, and Broadridge Financial Solutions, Inc. (“Broadridge”), an independent provider of investment company data. The Trustees were assisted in their review by counsel to the Trust and independent legal counsel, and met with counsel in executive session separate from representatives of Symmetry and AQR. The Trustees evaluated a number of considerations they believed, in light of the legal advice furnished to them by counsel, and their own business judgment, to be relevant, and then made decisions in their business judgment. In considering the approval of the Agreements for an initial two-year period, the Board evaluated all factors it believed to be relevant, including those discussed below. The Board did not identify any one factor as dispositive, and each Trustee may have attributed different weights to the factors considered.
The nature, extent, and quality of the advisory services to be provided, including investment performance. The Board considered the nature, extent, and quality of the services to be provided by Symmetry to the Funds and by AQR to the Sub-Advised Funds. The Board considered the proposed investment strategies for each Fund and Symmetry and AQR’s expertise with respect to such strategies; the experience, capability, and integrity of Symmetry and AQR’s respective senior management; the financial resources of Symmetry and AQR; the continuous and regular management and services to be provided by Symmetry and AQR and the risks assumed and borne; and the professional qualifications of the portfolio management teams of Symmetry and AQR.
130
SYMMETRY PANORAMIC TRUST
FEBRUARY 28, 2019
The Board considered that each Fund would be managed as a multi-factor fund providing exposure to different managers that, in Symmetry’s view, are best able to deliver certain factor exposures as identified by Symmetry, and that Symmetry would access these investment managers on behalf of the Funds either through investment in other registered investment companies or by entering into a sub-advisory relationship with one or more investment managers pursuant to which the sub-adviser would be responsible for advising an allocated portion of a Fund’s assets. The Board noted that, in implementing each Fund’s investment strategy, Symmetry would combine the Fund’s investments in other registered investment companies with any sub-advised positions to gain a more complete set of market and factor exposures for the Fund and would manage investment and sub-adviser rebalances and transitions within the Fund’s portfolio. The Board noted that Symmetry’s advisory fee would serve as compensation for these services as well as other services it would provide to the Funds, including: development, implementation and monitoring of each Fund’s investment program, assessing each Fund’s investment objectives and policies, composition, investment style and investment process, and development and evaluation of strategic initiatives with respect to the Funds; as a “manager of managers,” selecting sub-advisers for the Funds and monitoring such sub-advisers’ implementation of and adherence to each Fund’s investment objectives, policies, and restrictions; providing a continuous investment program for each Fund and making determinations with respect to the investment of a Fund’s assets, including day-to-day management of the Fund or portions thereof; reviewing brokerage matters; generally overseeing compliance by the Trust; carrying out directives of the Board as they relate to each Fund; and making its employees available to serve as trustees and officers of the Trust. The Board further noted the services Symmetry would provide the Funds in the form of oversight of the services provided by the Funds’ custodian, administrator, transfer agent, independent accountant and legal counsel and supervision of the performance of recordkeeping and shareholder relations functions of the Funds. The Board considered that Symmetry’s management services also would include, among other things, the provision of supervisory, compliance, and administrative services to each Fund.
With respect to its consideration of AQR as the sub-adviser to the Sub-Advised Funds, the Board considered Symmetry’s reasons for recommending that AQR be appointed as the sub-adviser to the Funds, including Symmetry’s due diligence concerning and previous experience with AQR. The Board noted that under the Sub-Advisory Agreement, AQR, subject to the oversight of the Trustees and the supervision of Symmetry, will be responsible for, among other things: making investment decisions on behalf of each Sub-Advised Fund or its allocated portion of such Sub-Advised Fund; placing with brokers or dealers all orders for the purchase and sale of investments for each Sub-Advised Fund or allocated portion it advises; and performing limited related functions.
As the Funds had not yet commenced operations, the Board had no historical performance to review. However, the Board was provided composite and model performance results of Symmetry’s similarly managed portfolios, which, subject to a number of limitations, was designed to aid the Board in understanding how each Fund may have performed if it had been operating in the past. The Board discussed with
131
SYMMETRY PANORAMIC TRUST
FEBRUARY 28, 2019
representatives of Symmetry and AQR the portfolio managers’ experience and the investment strategies to be employed in the management of each Fund’s assets. The Board noted the reputation and experience of Symmetry and AQR.
On the basis of this information and the Board’s assessment of the nature, extent, and quality of advisory services to be provided by Symmetry to the Fund and sub-advisory services to be provided by AQR to the Sub-Advised Funds, the Board concluded that Symmetry and AQR were capable of generating a level of investment performance that is appropriate in light of the Funds’ proposed investment objectives, policies, and strategies. The Board also determined that Symmetry and AQR could provide investment and related services that are appropriate in scope and extent in light of the Funds’ operations, the competitive landscape of the investment company business, and investor needs.
Advisory fees, sub-advisory fees, and total expense ratios. The Board considered the proposed advisory and sub-advisory fees and anticipated total expense ratios of each Fund, including information comparing the advisory fee and total expense ratio of each Fund to the advisory fees and total expense ratios of comparable investment companies. The Board observed, among other things, that each Fund’s proposed contractual advisory fee was within the range of contractual advisory fees paid by funds in the peer group determined by Broadridge. The Board also was provided with information concerning fees charged by Symmetry to clients accessing investment strategies similar to those of the Funds. The Board took note of the differences in advisory services to be provided to the Funds and those provided to Symmetry’s other accounts. The Board accorded less weight to such comparisons due to the different legal, regulatory, compliance and operating features of mutual funds as compared to Symmetry’s other accounts, and differences in the nature and scope of services Symmetry provides to these other accounts, as well as differences in the market for these types of accounts. The Board further observed that, consistent with their investment strategies, the Funds would make significant investments in other registered investment companies and, as a result, would bear their pro rata share of the fees and expenses of such other companies. The Board noted that, with respect to each Fund, Symmetry would contractually agree to waive its management fee so as to cap the aggregate management fee retained by Symmetry with respect to each Fund after payment of sub-advisory fees and, separately, would contractually agree to reduce each Fund’s fees and absorb expenses of each Fund so as to limit total annual Fund operating expenses, in each case through at least October 31, 2019. The Board considered that the net advisory fees for the Symmetry Panoramic Tax-Managed Global Equity Fund and Symmetry Panoramic Alternatives Fund would be higher than the net advisory fees of the other Funds, and that such difference was in recognition of the additional tax management services and additional due diligence and monitoring services, respectively, to be provided to those Funds. The Board considered the entrepreneurial and expense risk to be borne by Symmetry that is associated with entering into such contractual arrangements. In considering the sub-advisory fees to be paid to AQR, the Board noted the breakpoint structure for each Fund’s sub-advisory fee. The Board noted that AQR’s fee will be paid by Symmetry (out of its fee paid by the Fund) and not by the Fund. The Board considered the sub-advisory fees to be paid to AQR in relation to the fees to be paid to Symmetry by
132
SYMMETRY PANORAMIC TRUST
FEBRUARY 28, 2019
the Funds and the respective services to be provided by AQR and Symmetry. The Board considered the meaningful differences in the services that Symmetry will provide to the Funds as compared to the services to be provided by AQR. Based on this review, the Board concluded that the fees to be paid to Symmetry and AQR supported the Board’s approval of the Agreements.
On the basis of these and other considerations, together with the other information it considered, the Board determined that the advisory and sub-advisory fees to be received by Symmetry and AQR under the Agreements were reasonable in light of the services to be provided and the risks to be borne by Symmetry and AQR, respectively.
The cost of advisory services provided and the level of profitability. The Board noted that the Funds were not yet operational and therefore no revenue, cost, or profitability data was available for the Board to review. However, the Board reviewed projected profitability information regarding Symmetry’s costs of providing advisory services to the Funds. The Board also noted that the sub-advisory fees are the product of arm’s-length negotiation between Symmetry and AQR. Based on this information, the Board determined that the profitability of Symmetry from its relationship with each Fund was not anticipated to be excessive.
Whether fee levels reflect economies of scale and the extent to which economies of scale would be realized as the Funds grow. The Board evaluated the extent to which the advisory and sub-advisory fees payable under the Agreements reflect economies of scale or will permit economies of scale to be realized in the future. The Board considered Symmetry’s willingness to limit each Fund’s expenses and cap its advisory fee. The Board noted that, in the future, it would have the opportunity to periodically reexamine the appropriateness of advisory fees payable to Symmetry and sub-advisory fees payable by Symmetry to AQR.
Benefits to Symmetry, AQR, and their affiliates from their relationships with the Funds. The Board considered other benefits derived by Symmetry, AQR, and their affiliates from their relationships with the Funds. The Board noted that, although both Symmetry and AQR have the ability to realize soft dollar benefits from their relationship with the Funds, neither currently intends to do so. The Board also considered the potential benefits flowing to Symmetry from sponsoring its own family of mutual funds and how the Funds may be used in delivering investment advisory services to Symmetry’s other clients. The Board noted that it would have the opportunity to review the appropriateness of these benefits over time.
Other considerations. The Board considered the investment objective and strategy of each Fund and noted that Symmetry believed the Funds would enhance Symmetry’s product offerings. The Board noted that Symmetry had made a substantial commitment to the development of the strategy represented by each Fund and to the recruitment and retention of high quality personnel, and maintained the financial, compliance, and operational resources reasonably necessary to manage each Fund in a professional manner that is consistent with the best interests of each Fund and its respective shareholders. In
133
SYMMETRY PANORAMIC TRUST
FEBRUARY 28, 2019
this regard, the Board favorably considered Symmetry’s procedures and policies to enforce compliance with applicable laws and regulations and, with respect to the Sub-Advised Funds, oversee the sub-advisory activities of AQR. The Board also noted that Symmetry had made a significant entrepreneurial commitment to the development, management and success of the Funds and assumed commensurate risk.
Conclusion. After consideration of the factors described above, as well as other factors, the Board, including all of the Independent Trustees, concluded that the terms of the Agreements evidenced substantial due diligence, arm’s length negotiation, and were consistent with the interests of the Funds and investors.
134
(This Page Intentionally Left Blank.)
(This Page Intentionally Left Blank.)
(This Page Intentionally Left Blank.)
Symmetry Panoramic Funds
P.O. Box 588
Portland, ME 04112
1-844-796-3863
Investment Adviser:
Symmetry Partners, LLC
151 National Drive
Glastonbury, CT 06033
Administrator:
SEI Investments Global Funds Services
One Freedom Valley Drive
Oaks, PA 19456
Distributor:
SEI Investments Distribution Co.
One Freedom Valley Drive
Oaks, PA 19456
Legal Counsel:
K&L Gates LLP
1601 K Street, NW
Washington, DC 20006-1600
Independent Registered Public Accounting Firm:
Cohen & Company, Ltd.
1350 Euclid Avenue, Suite 800
Cleveland, OH 44115
This information must be preceded or accompanied by a current prospectus for the Fund described.
Item 2. Code of Ethics.
Not applicable for semi-annual report.
Item 3. Audit Committee Financial Expert.
Not applicable for semi-annual report.
Item 4. Principal Accountant Fees and Services.
Not applicable for semi-annual report.
Item 5. Audit Committee of Listed Registrants.
Not applicable for semi-annual report.
Item 6. Investments
The Schedules of Investments are included as part of the report to shareholders filed under Item 1 of this form.
Item 7. Disclosure of Proxy Voting Policies and Procedures for Closed-End Management Investment Companies.
Not applicable to open-end management investment companies.
Item 8. Portfolio Managers of Closed-End Management Investment Companies
Not applicable to open-end management investment companies.
Item 9. Purchases of Equity Securities by Closed-End Management Company and Affiliated Purchasers.
Not applicable to open-end management investment companies.
Item 10. Submission of Matters to a Vote of Security Holders.
There have been no material changes to the procedures by which shareholders may recommend nominees to the Registrant’s Board of Trustees (the “Board”).
Item 11. Controls and Procedures.
(a) The Registrant’s principal executive and principal financial officers, or persons performing similar functions, have concluded that the Registrant’s disclosure controls and procedures (as defined in Rule 30a-3(c) under the 1940 Act (17 CFR 270.30a-3(c)) are effective, based on the evaluation of these controls and procedures required by Rule 30a-3(b) under the 1940 Act and Rules 13a-15(b) or 15d-15(b) under the Securities Exchange Act of 1934, as of a date within 90 days of the filing date of this report.
(b) There were no changes in the Registrant’s internal control over financial reporting (as defined in Rule 30a-3(d) under the 1940 Act (17 CFR 270.30a-3(d)) that occurred during the second fiscal quarter of the period covered by this report that have materially affected, or are reasonably likely to materially affect, the Registrant’s internal control over financial reporting.
Item 12. Disclosure of Securities Lending Activities for Closed-End Management Investment Companies.
Not applicable to open-end management investment companies.
Item 13. Exhibits.
(a)(1) Not applicable for semi-annual report.
(a)(2) A separate certification of each principal executive officer and principal financial officer of the Registrant, as required by Rule 30a-2(a) under the 1940 Act (17 CFR 270.30a-2(a)), are filed herewith.
(b) Officer certifications as required by Rule 30a-2(b) under the 1940 Act (17 CFR 270.30a-2(b)) also accompany this filing as an exhibit.
SIGNATURES
Pursuant to the requirements of the Securities Exchange Act of 1934 and the Investment Company Act of 1940, the Registrant has duly caused this report to be signed on its behalf by the undersigned, thereunto duly authorized.
| | Symmetry Panoramic Trust | |
| | | |
| By | /s/ Dana D'Auria | |
| | Dana D'Auria | |
| | President | |
| | | |
| Date: May 8, 2019 | | |
| | | |
| Pursuant to the requirements of the Securities Exchange Act of 1934 and the Investment Company Act of 1940, this report has been signed below by the following persons on behalf of the Registrant and in the capacities and on the dates indicated. |
| | | |
| By | /s/ Dana D'Auria | |
| | Dana D'Auria | |
| | President | |
| | | |
| Date: May 8, 2019 | | |
| | | |
| By | /s/ Stephen Connors | |
| | Stephen Connors | |
| | Treasurer & Principal Financial Officer | |
| | | |
| Date: May 8, 2019 | | |