Exhibit 99.2

1 1 New Frontier Health Q1 2020 Results May 27, 2020
2 2 Disclaimer Forward - Looking Statements This presentation includes “forward - looking statements” within the meaning of the “safe harbor” provisions of the Private Securi ties Litigation Reform Act of 1995. The actual results of New Frontier Health Corporation (the “Company”) may differ from the Company’s expectations, estimates and projections and consequently, you should not rely on the se forward - looking statements as predictions of future events. Words such as “expect”, “estimate”, “project”, “budget”, “forecast”, “anticipate”, “intend”, “plan”, “may”, “will”, “could”, “should”, “believes”, “predicts”, “p ote ntial”, “continue”, and similar expressions are intended to identify such forward - looking statements. These forward - looking statements involve significant risks and uncertainties that could cause the actual results to differ materially from the expected results, including, but not limited to, the Company’s ability to manage growth; the Company’s ability to execute its business plan, including its planned expansions, and meet its projections; rising costs adve rse ly affecting the Company’s profitability; potential litigation involving the Company; general economic and market conditions impacting demand for the Company’s services, and in particular economic and market conditions in the Chines e h ealthcare industry and changes in the rules and regulations that apply to such business, including as it relates to foreign investments in such businesses; and other risks and uncertainties indicated from time to time in the Co mpany’s filings with the U.S. Securities and Exchange Commission (the “SEC”). Most of these factors are outside of the Company’s control and are difficult to predict. The Company cautions readers not to place undue reliance upon any forward - looking statements, which speak only as of the date made. The Company does not undertake or accept any obligation or undertaking to release publicly any updates or revisions to any forward - looking statements to reflect any change in its expectations or any change in events, conditions or circumstances on which any such statement is based, except as required by law. Financial Information The Company acquired UFH in a business combination that closed on December 18, 2019. The financial results for the years ende d D ecember 31, 2018 and 2019, and for the quarter ended March 31, 2019 presented herein are those of the Company’s wholly owned subsidiary, Healthy Harmony Holdings, L.P. (the “Predecessor”), while the financial resul ts for the quarter ended March 31, 2020, presented herein are those of the combined Company (the “Successor”). Industry and Market Data In this presentation, we rely on and refer to information and statistics regarding market participants in the sectors in whic h t he Company competes and other industry data. The Company obtained this information and statistics from third - party sources, including reports by market research firms and company filings. Use of Non - IFRS Financial Matters The discussion and analysis includes certain measures, including Adjusted EBITDA (before IFRS 16 adoption), Adjusted EBITDA M arg in, Free Cash Flow and Pro - forma Adjusted EBITDA, and Pro - forma Adjusted EBITDA Margin, which have not been prepared in accordance with IFRS. These measures do not have any standardized meaning prescribed by IFRS and are therefore unlikely to be comparable to similar measures presented by other companies. These measures should be considered as supplemental in nature and not as a substitute for the related financial information p rep ared in accordance with IFRS. We use these measures to evaluate our operating results and for financial and operational decision - making purposes. We believe that Adjusted EBITDA and Pro - forma Adjusted EBITDA helps compare our performance over various reporting periods on a consistent basis by removing from operating results the impact of items that do not reflect core operating performance and helps identify underlying operating res ults and trends. Adjusted EBITDA (before IFRS 16 adoption), is calculated as net loss plus ( i ) depreciation and amortization, (ii) finance expense/(income), (iii) other gains or losses, (iv) other expenses (such as sha re based compensation), (v) provision for income taxes, as further adjusted for (vi) certain monitoring fees paid to certain shareholders prior to the Bu sin ess Combination, (vii) lease expense adjustments as a result of adoption of IFRS 16, and (viii) transaction related costs. UFH adopted IFRS 16 on January 1, 2019, and recognized lease liabilities and corresponding “right - of - use” assets for all applicable leases, and recognized interest expense accrued on the outstanding balance of the lease liabilities and depreciation of right - of - use assets. As a result, the adoption of IFRS 16 caused depreciation and amortiza tion and finance costs to increase in 2019 and excluded all applicable lease expenses in Adjusted EBITDA . For ease of comparison to prior periods, the Company eliminated the impact of IFRS 16 on Adjusted EBITDA. Pro - forma Adjusted EBITDA, is calculated as net loss plus ( i ) depreciation and amortization, (ii) finance expense/(income), (iii) other gains or losses, (iv) other expenses (such as sha re based compensation), (v) provision for income taxes, as further adjusted for (vi) certain monitoring fees paid to certain shareholders prior to the Business Combination, ( vii ) lease expense adjustment as a result of adoption of IFRS 16, (viii) transaction related costs, and (ix) Pro - forma adjustments in PXU. See slide 42 for further information on these pro - forma adjustments. Adjusted EBITDA margin is calculated by dividing Adjusted EBITDA (before IFRS 16 adoption), by total revenue and Pro - forma Adjus ted EBITDA margin is calculated by dividing Pro - forma Adjusted EBITDA by total revenue. Free cash flow is calculated as 1) operating cash flow 2) minus capital lease payments, 3) add interest expense paid, 4) add one - off transaction expense related to the business combination, 5) minus capital expenditure on existing operations of the facilities A reconciliation of non - IFRS forward looking information to their corresponding IFRS measures are not included in this presentat ion as they cannot be provided without unreasonable effort because of the inherent difficulty of accurately forecasting the occurrence and financial impact of the various adjusting items necessary for such reconciliation t hat have not yet occurred, are out of our control, or cannot be reasonably predicted.

3 3 Overview Q1 2020 Business Highlights Q1 2020 Financial R esults Growth Initiatives Appendix A - I ndustry Overview Appendix B - Additional Materials Table of Contents

4 4 Beijing United Family Hospital North ( 2020 ) OVERVIEW
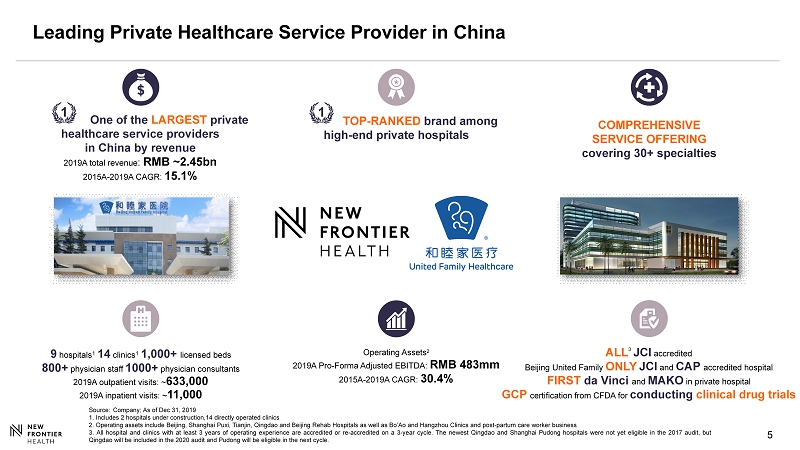
5 5 Leading Private Healthcare Service Provider in China COMPREHENSIVE SERVICE OFFERING covering 30+ specialties 9 hospitals 1 14 clinics 1 1,000+ licensed beds 800+ physician staff 1000+ physician consultants 2019 A outpatient visits: ~ 6 33 ,000 2019 A inpatient visits: ~ 11, 000 Operating Assets 2 2019A Pro - Forma Adjusted EBITDA: RMB 483mm 2015A - 201 9 A CAGR: 30 .4 % Source: Company; As of Dec 31, 2019 1 . I ncludes 2 hospitals under construction, 14 directly operated clinics 2 . Operating assets include Beijing, Shanghai Puxi , Tianjin, Qingdao and Beijing Rehab Hospitals as well as B o’Ao and Hangzhou Clinics and post - partum care worker business 3 . All hospital and clinics with at least 3 years of operating experience are accredited or re - accredited on a 3 - year cycle . The newest Qingdao and Shanghai Pudong hospitals were not yet eligible in the 2017 audit, but Qingdao will be included in the 2020 audit and Pudong will be eligible in the next cycle . One of the LARGEST private healthcare service providers in China by revenue 2019 A total revenue : RMB ~ 2. 45 bn 2015A - 201 9 A CAGR: 1 5.1 % 1 1 TOP - RANKED brand among high - end private hospitals ALL 3 JCI accredited Beijing United Family ONLY JCI and CAP accredited hospital FIRST da Vinci and MAKO in private hospital GCP certification from CFDA for conducting clinical drug trials

6 6 5 Hospitals Hub Spoke 8 Clinics Hub - and - Spoke Model 2 Hospitals Hub Spoke 4 Clinics Hub - and - Spoke Model 2 Hospitals Hub Spoke 2 Clinics Hub - and - Spoke Model Beijing Tianjin Qingdao Guangzhou Hangzhou Hainan Shenzhen 2 Shanghai Source: Company ; As of Dec 31, 2019 1. 5 hospitals in Beijing Cluster including Qingdao United Family and Tianjin United Family 2. UFH is expected to be given the exclusive right to manage New Frontier Group’s 64,000 sq. meter flagship Shenzhen city cen ter hospital as part of the transaction Broad geographic coverage across all four Tier 1 cities Strategic opportunity for expansion into Tier 2 cities GREATER BAY CLUSTER SHANGHAI CLUSTER + EAST CHINA BEIJING CLUSTER + NORTH CHINA 1 Nationwide Geographic Footprint
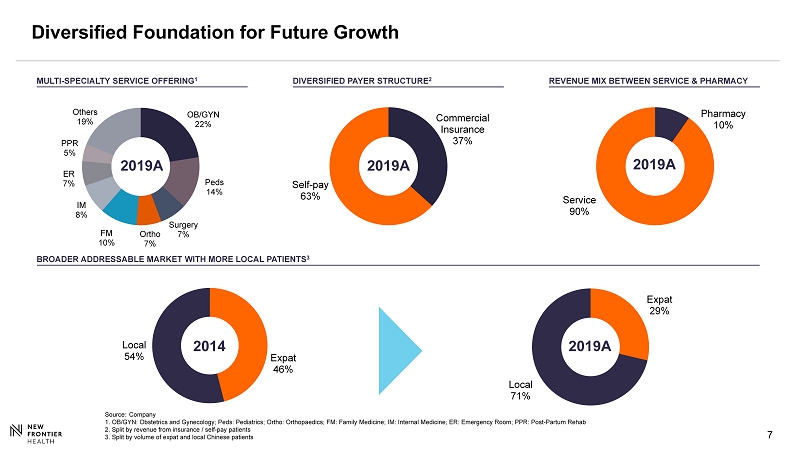
7 7 Expat 46% Local 54% BROADER ADDRESSABLE MARKET WITH MORE LOCAL PATIENTS 3 Commercial Insurance 37% Self - pay 63% Diversified Foundation for Future Growth Expat 29% Local 71% MULTI - SPECIALTY SERVICE OFFERING 1 2019A Source: Company 1. OB/GYN: Obstetrics and Gynecology; Peds: Pediatrics; Ortho: Orthopaedics; FM: Family Medicine; IM: Internal Medicine; ER: Eme rgency Room; PPR: Post - Partum Rehab 2. Split by revenue from insurance / self - pay patients 3. Split by volume of expat and local Chinese patients REVENUE MIX BETWEEN SERVICE & PHARMACY 2019A OB/GYN 22% Peds 14% Surgery 7% Ortho 7% FM 10% IM 8% ER 7% PPR 5% Others 19% 2014 2019A DIVERSIFIED PAYER STRUCTURE 2 Pharmacy 10% Service 90% 2019A
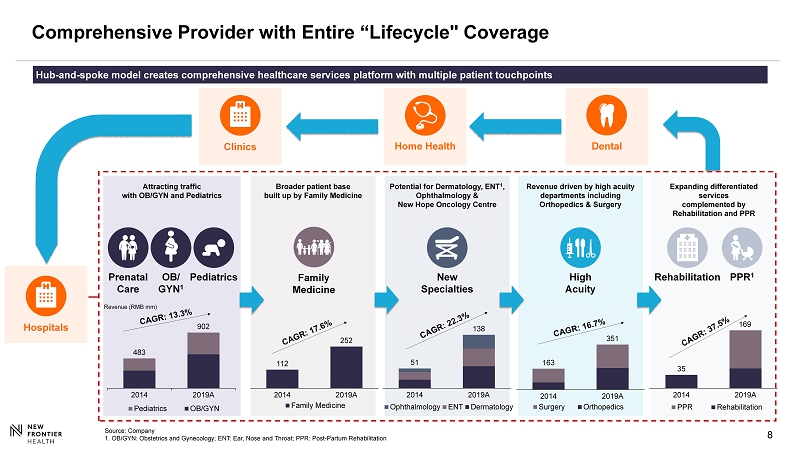
8 8 Revenue driven by high acuity departments including Orthopedics & Surgery High Acuity 163 351 2014 2019A Surgery Orthopedics Potential for Dermatology, ENT 1 , Ophthalmology & New Hope Oncology Centre New Specialties 51 138 2014 2019A Ophthalmology ENT Dermatology Comprehensive Provider with Entire “Lifecycle" Coverage Hub - and - spoke model creates comprehensive healthcare services platform with multiple patient touchpoints Clinics Home Health Attracting traffic with OB/GYN and Pediatrics 483 902 2014 2019A Pediatrics OB/GYN Revenue (RMB mm) Prenatal Care Pediatrics OB/ GYN 1 Expanding differentiated services complemented by Rehabilitation and PPR PPR 1 Rehabilitation 35 2014 2019A PPR Rehabilitation Broader patient base built up by Family Medicine 112 252 2014 2019A Family Medicine Family Medicine Dental Source: Company 1. OB/GYN: Obstetrics and Gynecology; ENT: Ear, Nose and Throat; PPR: Post - Partum Rehabilitation Hospitals 169
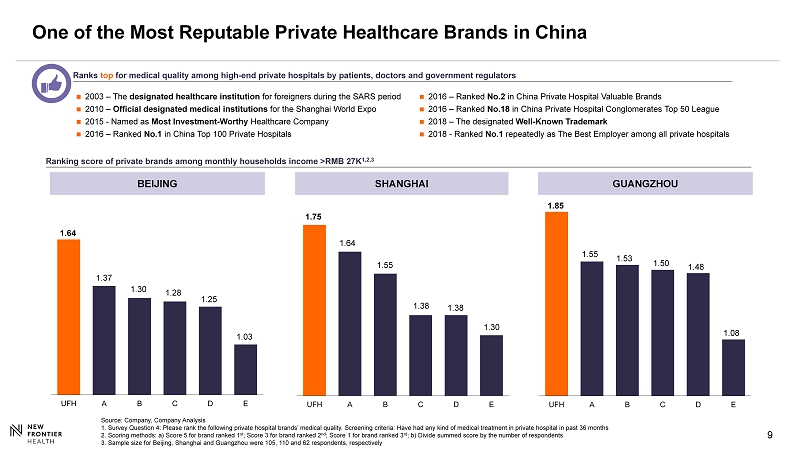
9 9 UFH A B C D E 1.85 1.55 1.53 1.50 1.08 1.48 UFH A B C D E 1.75 1.64 1.55 1.38 1.30 1.38 One of the Most Reputable Private Healthcare Brands in China Ranks top for medical quality among high - end private hospitals by patients, doctors and government regulators Source: Company, Company Analysis 1. Survey Question 4: Please rank the following private hospital brands’ medical quality. Screening criteria: Have had any ki nd of medical treatment in private hospital in past 36 months 2. Scoring methods: a) Score 5 for brand ranked 1 st ; Score 3 for brand ranked 2 nd ; Score 1 for brand ranked 3 rd ; b) Divide summed score by the number of respondents 3. Sample size for Beijing, Shanghai and Guangzhou were 105, 110 and 62 respondents, respectively Ranking score of private brands among monthly households income >RMB 27K 1,2,3 BEIJING UFH A B C D E SHANGHAI GUANGZHOU 1.64 1.37 1.30 1.28 1.03 1.25 2003 – The designated healthcare institution for foreigners during the SARS period 2010 – Official designated medical institutions for the Shanghai World Expo 2015 - Named as Most Investment - Worthy Healthcare Company 2016 – Ranked No.1 in China Top 100 Private Hospitals 2016 – Ranked No.2 in China Private Hospital Valuable Brands 2016 – Ranked No.18 in China Private Hospital Conglomerates Top 50 League 2018 – The designated Well - Known Trademark 2018 - Ranked No.1 repeatedly as The Best Employer among all private hospitals
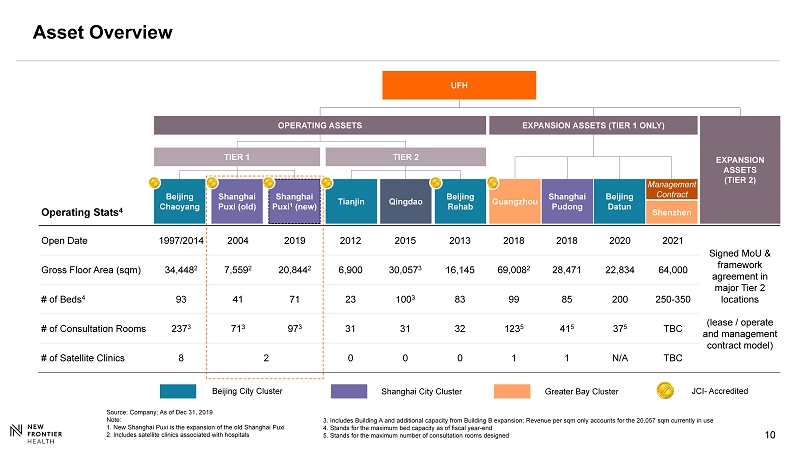
10 10 Operating Stats 4 Open Date 1997/2014 2004 2019 2012 2015 2013 2018 2018 2020 2021 Signed MoU & framework agreement in major Tier 2 locations (lease / operate and management contract model) Gross Floor Area (sqm) 34,448 2 7,559 2 20,844 2 6,900 30,057 3 16,145 69,008 2 28,471 22,834 64,000 # of Beds 4 93 41 71 23 100 3 83 99 85 200 250 - 350 # of Consultation Rooms 237 3 71 3 97 3 31 31 32 123 5 41 5 37 5 TBC # of Satellite Clinics 8 2 0 0 0 1 1 N/A TBC TIER 1 Shanghai Puxi 1 (new) Shanghai Puxi (old) Asset Overview Source: Company ; As of Dec 31, 2019 Note: 1. New Shanghai Puxi is the expansion of the old Shanghai Puxi 2. Includes satellite clinics associated with hospitals UFH Beijing City Cluster Shanghai City Cluster Greater Bay Cluster OPERATING ASSETS EXPANSION ASSETS (TIER 1 ONLY) JCI - Accredited Beijing Chaoyang Shanghai Pudong Beijing Datun Shenzhen Management Contract Guangzhou Qingdao Beijing Rehab Tianjin TIER 2 EXPANSION ASSETS (TIER 2) 3. Includes Building A and additional capacity from Building B expansion; Revenue per sqm only accounts for the 20,057 sqm cu rre ntly in use 4. Stands for the maximum bed capacity as of fiscal year - end 5. Stands for the maximum number of consultation rooms designed
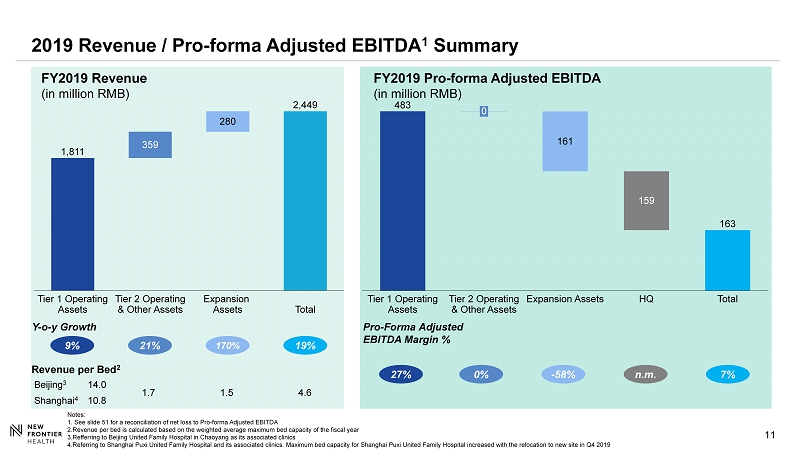
11 FY2019 Revenue (in million RMB) FY2019 Pro - forma Adjusted EBITDA (in million RMB) 2019 Revenue / Pro - forma Adjusted EBITDA 1 Summary 483 163 161 159 Tier 1 Operating Assets Total 0 HQ Tier 2 Operating & Other Assets Expansion Assets 1,811 359 280 Tier 1 Operating Assets Total Tier 2 Operating & Other Assets Expansion Assets 2,449 9% Y - o - y Growth 19% 21% 170% Pro - Forma Adjusted EBITDA Margin % 27% n.m. 0% - 58% 7% Revenue per Bed 2 Notes: 1. See slide 51 for a reconciliation of net loss to Pro - forma Adjusted EBITDA 2.Revenue per bed is calculated based on the weighted average maximum bed capacity of the fiscal year 3.Refferring to Beijing United Family Hospital in Chaoyang as its associated clinics 4.Referring to Shanghai Puxi United Family Hospital and its associated clinics. Maximum bed capacity for Shanghai Puxi United Family Hospital increased with the relocation to new site in Q4 2019 Beijing 3 14.0 1.7 1.5 4.6 Shanghai 4 10.8
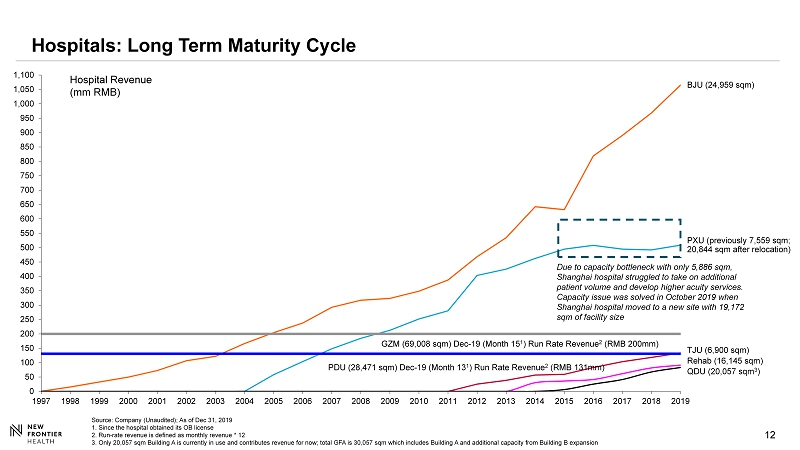
12 12 Hospitals: Long Term Maturity Cycle 0 50 100 150 200 250 300 350 400 450 500 550 600 650 700 750 800 850 900 950 1,000 1,050 1,100 1997 1998 1999 2000 2001 2002 2003 2004 2005 2006 2007 2008 2009 2010 2011 2012 2013 2014 2015 2016 2017 2018 2019 QDU (20,057 sqm 3 ) BJU (24,959 sqm) PXU (previously 7,559 sqm; 20,844 sqm after relocation) TJU (6,900 sqm) Rehab (16,145 sqm) Hospital Revenue (mm RMB) Due to capacity bottleneck with only 5,886 sqm, Shanghai hospital struggled to take on additional patient volume and develop higher acuity services. Capacity issue was solved in October 2019 when Shanghai hospital moved to a new site with 19,172 sqm of facility size GZM (69,008 sqm) Dec - 19 (Month 15 1 ) Run Rate Revenue 2 (RMB 200mm) PDU (28,471 sqm) Dec - 19 (Month 13 1 ) Run Rate Revenue 2 (RMB 131mm) Source: Company ( Unaudited); As of Dec 31, 2019 1. Since the hospital obtained its OB license 2. Run - rate revenue is defined as monthly revenue * 12 3. Only 20,057 sqm Building A is currently in use and contributes revenue for now; total GFA is 30,057 sqm which includes Bui ldi ng A and additional capacity from Building B expansion
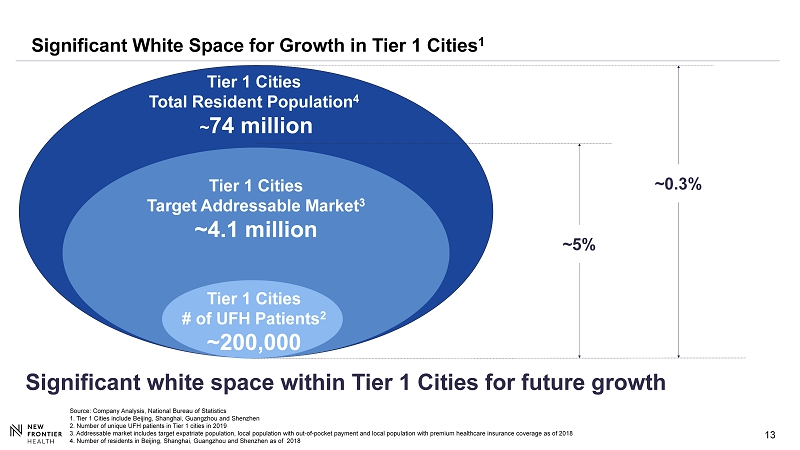
13 Significant White Space for Growth in Tier 1 Cities 1 Tier 1 Cities # of UFH Patients 2 ~200,000 Tier 1 Cities Target Addressable Market 3 ~4.1 million Tier 1 Cities Total Resident Population 4 ~ 74 million ~5% ~0.3% Significant white space within Tier 1 Cities for future growth Source: Company Analysis, National Bureau of Statistics 1. Tier 1 Cities include Beijing, Shanghai, Guangzhou and Shenzhen 2. Number of unique UFH patients in Tier 1 cities in 2019 3. Addressable market includes target expatriate population, local population with out - of - pocket payment and local population with premium hea lthcare insurance coverage as of 2018 4. Number of residents in Beijing, Shanghai, Guangzhou and Shenzhen as of 2018
14 14 Shanghai United Family Pudong Hospital Q1 2020 BUSINESS HIGHLIGHTS
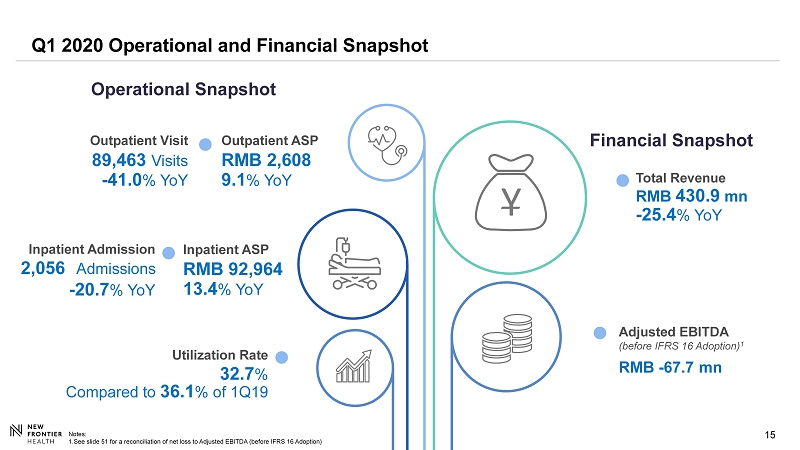
15 15 Financial Snapshot Outpatient Visit - 41.0 % YoY 89,463 Visits Inpatient Admission - 20.7 % YoY Utilization Rate Compared to 36.1 % of 1Q19 32.7 % Operational Snapshot Adjusted EBITDA (before IFRS 16 Adoption) 1 RMB - 67.7 mn Total Revenue - 25.4 % YoY RMB 430.9 mn 2,056 Admissions Q1 2020 Operational and Financial Snapshot Notes: 1.See slide 51 for a reconciliation of net loss to Adjusted EBITDA (before IFRS 16 Adoption) Outpatient ASP 9.1 % YoY RMB 2,608 Inpatient ASP 13.4 % YoY RMB 92,964
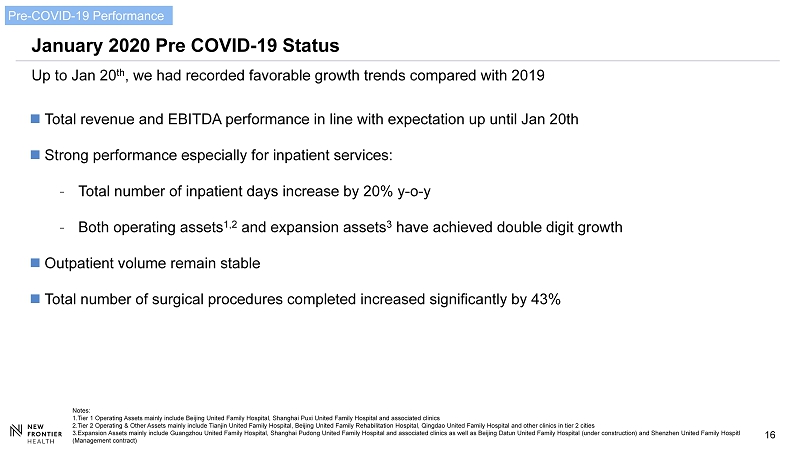
16 January 2020 Pre COVID - 19 Status Up to Jan 20 th , we had recorded favorable growth trends compared with 2019 Notes: 1.Tier 1 Operating Assets mainly include Beijing United Family Hospital, Shanghai Puxi United Family Hospital and associated clinics 2.Tier 2 Operating & Other Assets mainly include Tianjin United Family Hospital, Beijing United Family Rehabilitation Hospita l, Qingdao United Family Hospital and other clinics in tier 2 cities 3.Expansion Assets mainly include Guangzhou United Family Hospital, Shanghai Pudong United Family Hospital and associated cli nic s as well as Beijing Datun United Family Hospital (under construction) and Shenzhen United Family Hospitl (Management contract) Pre - COVID - 19 Performance Total revenue and EBITDA performance in line with expectation up until Jan 20 th Strong performance especially for inpatient services : - Total number of inpatient days increase by 20 % y - o - y - Both operating assets 1 , 2 and expansion assets 3 have achieved double digit growth Outpatient volume remain stable Total number of surgical procedures completed increased significantly by 43 %

17 Top Priority Is to Ensure the Health and Safety of Our Staff and Patients Specially approved fever clinics separating patient flows in major UFH hospitals Levered on global supply chain network to source adequate PPE inventory Temperature check stations at all entry points Restricted non - patient foot traffic and social distancing policies Epidemic control training for all staff Confirmed Case of COVID - 19 among staff or patients 1 Note: 1. As of the date of earning release COVID - 19 Actions
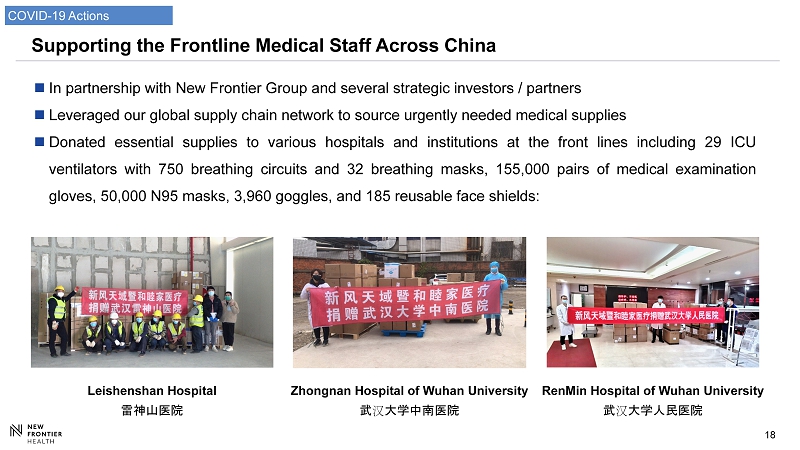
18 Zhongnan Hospital of Wuhan University 武汉大学中南医院 Supporting the Frontline Medical Staff Across China In partnership with New Frontier Group and several strategic investors / partners Leveraged our global supply chain network to source urgently needed medical supplies Donated essential supplies to various hospitals and institutions at the front lines including 29 ICU ventilators with 750 breathing circuits and 32 breathing masks, 155 , 000 pairs of medical examination gloves, 50 , 000 N 95 masks, 3 , 960 goggles, and 185 reusable face shields : Leishenshan Hospital 雷神山医院 RenMin Hospital of Wuhan University 武汉大学人民医院 COVID - 19 Actions
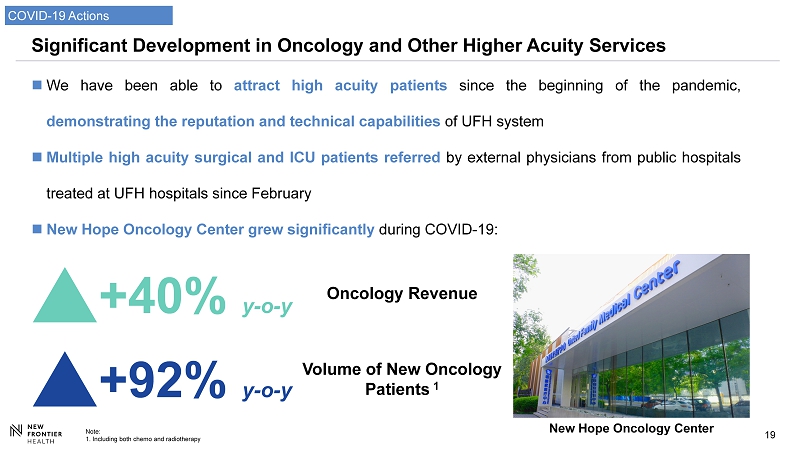
19 Significant Development in Oncology and Other Higher Acuity Services We have been able to attract high acuity patients since the beginning of the pandemic, demonstrating the reputation and technical capabilities of UFH system Multiple high acuity surgical and ICU patients referred by external physicians from public hospitals treated at UFH hospitals since February New Hope Oncology Center grew significantly during COVID - 19 : COVID - 19 Actions New Hope Oncology Center +40% y - o - y +92% y - o - y Oncology Revenue Volume of New Oncology Patients 1 Note: 1. Including both chemo and radiotherapy
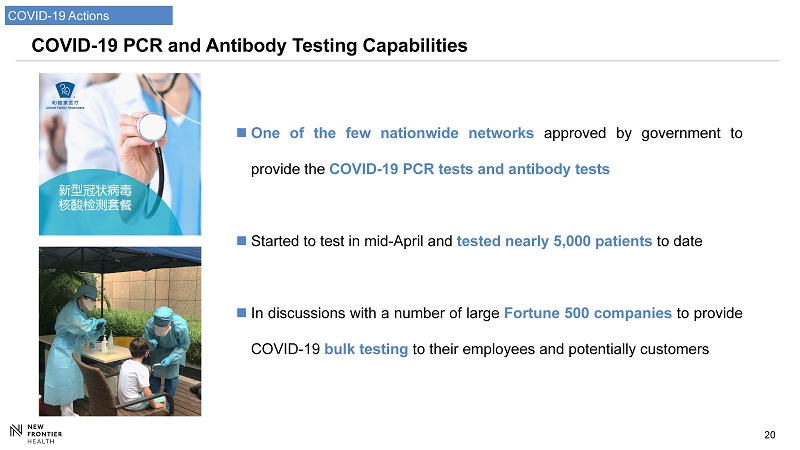
20 COVID - 19 PCR and Antibody Testing Capabilities One of the few nationwide networks approved by government to provide the COVID - 19 PCR tests and antibody tests Started to test in mid - April and tested nearly 5 , 000 patients to date In discussions with a number of large Fortune 500 companies to provide COVID - 19 bulk testing to their employees and potentially customers COVID - 19 Actions

21 Launched Online Consultation Service during the Pandemic Launched online consultations in February and covered more than 30 specialties In total ~5,000 online consultation s to date 1 - ~30% patients are new to UFH, and ~8% patients covert from online to offline - Existing patient offline re - visit rate over ~185% in May Online appointment increase by 265% in 2019 Number of Wechat followers has increased from 379.3K in 2019 to 639.6K by Q1 2020 Physician Selection Consultation Interface COVID - 19 Actions Note: 1. As of the date of earning release Aim to provide seamless online - offline medical experiences

22 22 Revenue is Recovering and Has Reached >93% of 2019 By Last Week in May 2019 2020 Q1 Wuhan Lift lock down 4 / 8 Chinese New Year 2019 Chinese New Year & Wuhan Lock down 1/23 B eijing lowered COVID - 19 emergency response to 2 nd level 4/30 - 42% - 25% - 7 % - 51% Post COVID - 19 Recovery Stage 1: COVID - 19 Impact Stage 2: Markets Recovery (except for Beijing) Stage 3: All Markets Recovery Turning Point Weekly Revenue (Y - o - y%) 1/18 1/25 2/1 2/8 2/15 2/22 2/29 3/7 3/14 3/21 3/28 4/4 4/11 4/18 4/25 5/2 5/9 5/16 5/24 Last Day of the Week
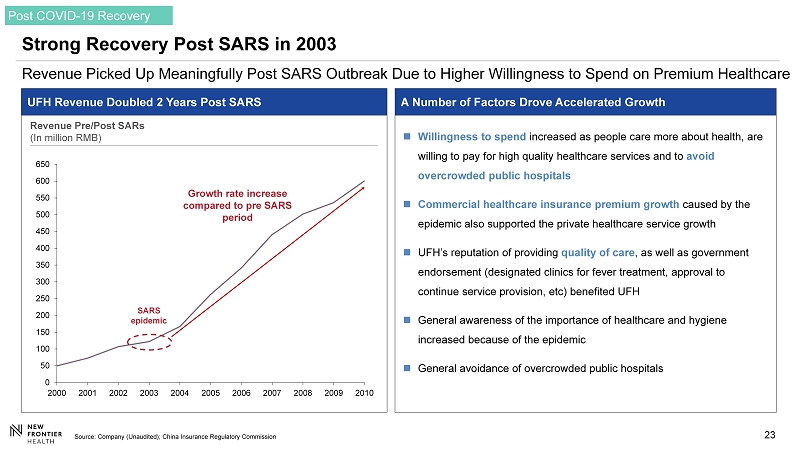
23 23 0 50 100 150 200 250 300 350 400 450 500 550 600 650 2000 2001 2002 2003 2004 2005 2006 2007 2008 2009 2010 Strong Recovery Post SARS in 2003 R evenue Picked Up Meaningfully Post SARS Outbreak Due to Higher Willingness to Spend on Premium Healthcare SARS epidemic Willingness to spend increased as people care more about health, are willing to pay for high quality healthcare services and to avoid overcrowded public hospitals Commercial healthcare insurance premium growth caused by the epidemic also supported the private healthcare service growth UFH’s reputation of providing quality of care , as well as government endorsement (designated clinics for fever treatment, approval to continue service provision, etc ) benefited UFH General awareness of the importance of healthcare and hygiene increased because of the epidemic General avoidance of overcrowded public hospitals Growth rate increase compared to pre SARS period A Number of Factors Drove Accelerated Growth UFH Revenue Doubled 2 Years Post SARS Revenue Pre/Post SARs (In million RMB ) Source: Company (Unaudited); China Insurance Regulatory Commission Post COVID - 19 Recovery
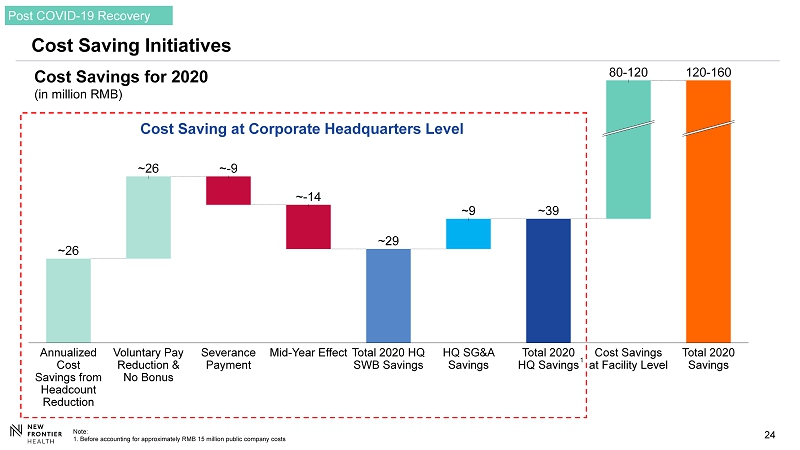
24 24 C ost Saving Initiatives Note: 1. Before accounting for approximately RMB 15 million public company costs Post COVID - 19 Recovery Cost Savings at Facility Level Total 2020 HQ SWB Savings ~ - 14 Voluntary Pay Reduction & No Bonus Annualized Cost Savings from Headcount Reduction 120 - 160 ~ - 9 80 - 120 ~ 29 Total 2020 HQ Savings HQ SG&A Savings Mid - Year Effect Total 2020 Savings Severance Payment ~ 9 ~ 26 ~ 26 ~ 39 Cost Savings for 2020 (in million RMB) Cost Saving at Corporate Headquarters Level 1

25 25 C ost Saving Initiatives (Cont’d) Note: 1. Excluding relocation of CCC from headquarter to Beijing market Corporate Headquarters Facility - Level Reduced HQ headcount by ~ 50 or ~ 28 % of total headcount 1 from April through June Estimated to achieve run - rate cost savings of ~ 26 million RMB going forward Additional voluntary salary reductions ranging between 20 - 30 % for senior management Went through “Zero - based budgeting” process and reduced SG&A by ~ 9 million RMB or by ~ 24 % comparing to 2019 Went through austerity drive process to review cost structure and SG&A spending Estimated to achieve cost savings of approximately RMB 80 - 120 million from social benefits waiver, rent reduction, vendor fee savings, as well as SG&A savings for 2020 Minimal headcount reduction at the UFH facilities considering the volume recovery trend and future growth roadmap Post COVID - 19 Recovery
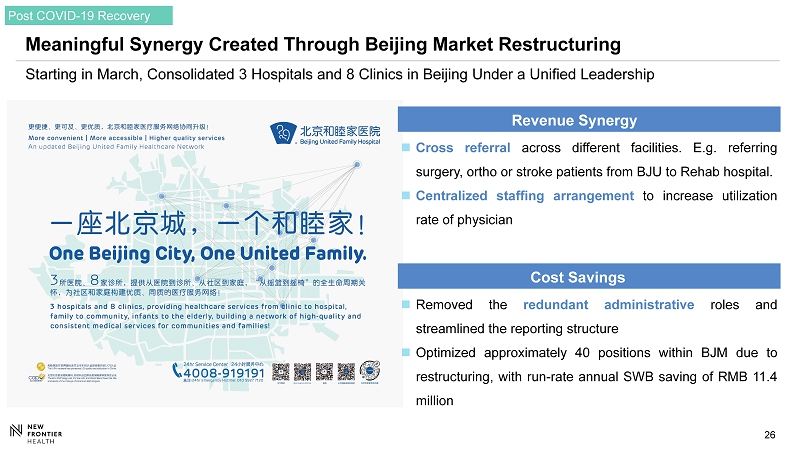
26 26 Meaningful Synergy Created Through Beijing Market Restructuring Starting in March, Consolidated 3 Hospitals and 8 Clinics in Beijing Under a Unified Leadership Revenue Synergy Cost Savings Removed the redundant administrative roles and streamlined the reporting structure Optimized approximately 40 positions within BJM due to restructuring, with run - rate annual SWB saving of RMB 11 . 4 million Cross referral across different facilities . E . g . referring surgery, ortho or stroke patients from BJU to Rehab hospital . Centralized staffing arrangement to increase utilization rate of physician Post COVID - 19 Recovery

27 New Member of the Board and Chairman of Audit Committee The board of directors has appointed Lawrence Chia as an independent director and the chairman of audit committee, effective March 31, 2020 CEO of the Samling Group of Companies , which has businesses in automobiles, properties, timber, infrastructure, oil palm, oil, and gas, with operations in a number of countries globally Former CEO of Deloitte China : - Deloitte Touche Tohmatsu Limited (DTTL) Executive Committee based in New York - DTTL Asia Pacific Executive Committee based in Hong Kong Independent Non - Executive Director of BC Technology Group Limited, a publicly listed company on the Hong Kong Stock Exchange Chartered Accountant of the Institute of Chartered Accountants in England and Wales Member of the Hong Kong Institute of Certified Public Accountants Mr. Lawrence Chia Chairman of Audit Committee
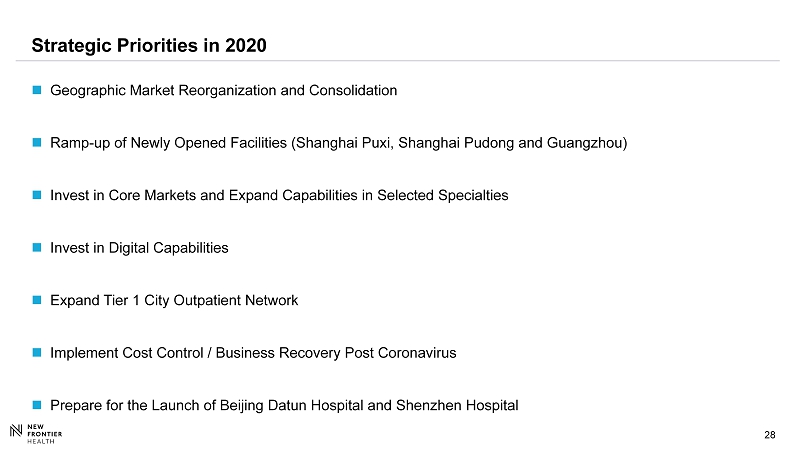
28 Strategic Priorities in 2020 Geographic Market Reorganization and Consolidation Ramp - up of Newly Opened Facilities (Shanghai Puxi , Shanghai Pudong and Guangzhou) Invest in Core Markets and Expand Capabilities in Selected Specialties Invest in Digital Capabilities Expand Tier 1 City Outpatient Network Implement Cost Control / Business Recovery Post Coronavirus Prepare for the Launch of Beijing Datun Hospital and Shenzhen Hospital

29 29 Shanghai United Family Hospital Q1 2020 FINANCIAL RESULTS
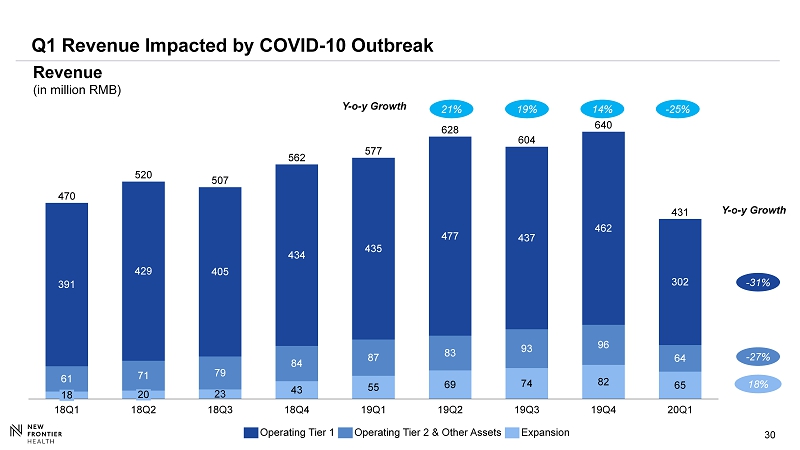
30 Q1 Revenue Impacted by COVID - 10 Outbreak 23 43 55 69 74 82 65 61 71 79 84 87 83 93 96 64 391 429 405 434 435 477 437 462 302 18Q3 577 470 20Q1 18Q1 640 18 18Q2 18Q4 19Q1 562 19Q2 628 19Q3 19Q4 520 507 604 431 20 Operating Tier 1 Operating Tier 2 & Other Assets Expansion Revenue (in million RMB) - 25% 21% 19% 14% Y - o - y Growth - 31% - 27% 18% Y - o - y Growth
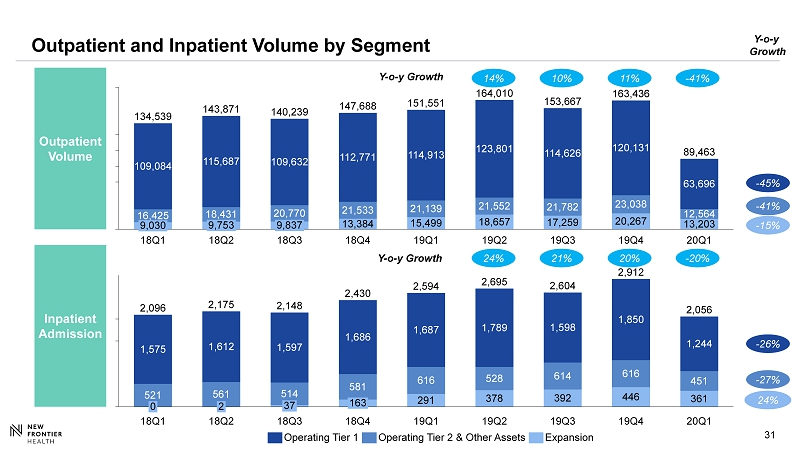
31 Outpatient and Inpatient Volume by Segment Outpatient Volume Inpatient Admission 521 291 378 392 446 361 1,575 561 514 581 616 528 614 616 451 1,612 1,597 1,686 1,687 1,789 1,598 1,850 1,244 2,096 37 2,175 18Q3 2,604 18Q1 2,912 18Q2 0 2 18Q4 19Q1 2,695 19Q2 19Q3 19Q4 2,148 2,430 2,594 20Q1 2,056 163 13,384 15,499 18,657 17,259 20,267 13,203 16,425 18,431 20,770 21,533 21,139 21,552 21,782 23,038 12,564 109,084 115,687 109,632 112,771 114,913 123,801 114,626 120,131 63,696 134,539 19Q2 140,239 18Q3 18Q4 164,010 18Q1 18Q2 19Q1 143,871 19Q3 19Q4 20Q1 147,688 151,551 153,667 163,436 89,463 9,030 9,753 9,837 - 41% 14% 10% 11% - 20% 24% 21% 20% - 45% - 41% - 15% Y - o - y Growth - 26% - 27% 24% Y - o - y Growth Y - o - y Growth Operating Tier 2 & Other Assets Operating Tier 1 Expansion
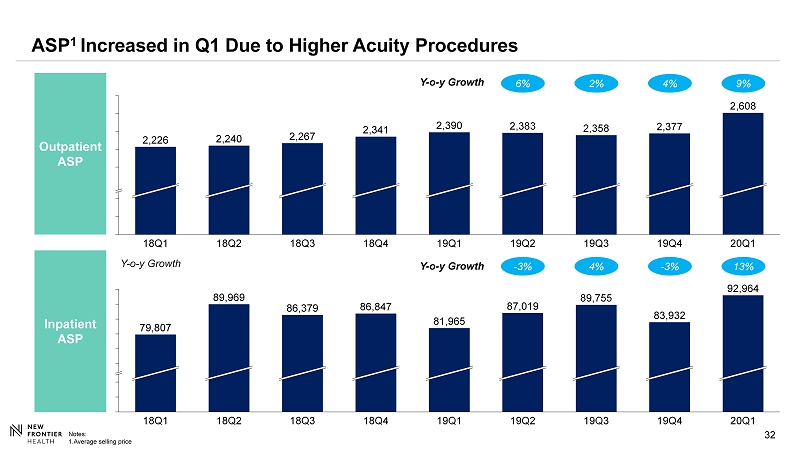
32 ASP 1 Increased in Q1 Due to Higher Acuity Procedures Outpatient ASP Inpatient ASP 83,932 89,969 19Q1 19Q3 20Q1 79,807 18Q3 19Q2 86,379 81,965 18Q1 89,755 92,964 19Q4 86,847 18Q4 18Q2 87,019 2,240 2,226 19Q2 2,608 18Q3 18Q2 2,358 18Q1 19Q1 2,267 19Q3 2,341 2,390 18Q4 2,383 20Q1 2,377 19Q4 9% 6% 4% 2% Y - o - y Growth 13% - 3% 4% - 3% Y - o - y Growth Y - o - y Growth Notes: 1.Average selling price

33 Adjusted and Pro - forma Adjusted EBITDA 1 Tier 1 Operating Assets Tier 2 Operating and Other Assets Expansion Assets Total (incl. HQ Expenses which are not shown above) 52.8 34.2 5.8 5.8 5.8 1.9 - 67.7 18Q2 18Q1 18Q3 18Q4 30.9 19Q1 19Q2 27.6 19Q3 25.7 19Q4 20Q1 35.9 50.5 - 10.9 8.8 36.7 58.6 40.0 - 24.1 - 37.5 - 60.6 - 63.8 - 43.6 - 40.8 - 40.0 - 37.0 - 42.6 18Q1 18Q2 19Q4 18Q3 18Q4 19Q3 19Q1 19Q2 20Q1 - 4.2 - 1.4 - 0.7 - 3.7 0.4 - 3.5 2.3 0.6 - 11.5 19Q4 18Q1 18Q2 19Q3 18Q4 18Q3 19Q1 19Q2 20Q1 116.3 19Q3 141.6 19Q4 18Q4 97.3 119.4 18Q3 18Q1 18Q2 109.5 5.8 19Q1 110.5 22.9 5.8 135.8 19Q2 5.8 1.9 109.9 107.6 20Q1 88.0 116.3 115.7 - 79% n/a n/a n/a Y - o - y Growth Pro - forma Adjustments 1 Notes: 1. See slide 51 for a reconciliation of net loss to Adjusted EBITDA (before IFRS 16 Adoption) and Pro - forma Adjusted EBITDA.

34 34 Operating Expenses L owered Cost Structure Due to Cost Saving Initiatives 19Q1 326.6 20Q1 304.2 SWB 57% As % of Revenue 71% Salary, Wages & Benefits (in million RMB) 71.6 65.1 83.6 108.1 93.0 75.5 19Q1 2.3 255.0 4.0 3.4 4.6 256.2 20Q1 Impairment of Trade Receivable Supplies & Purchased Medical Service Lease & Rental 1 Depreciation and Amortization 1 Others 44% As % of Revenue 59% Other SG&A (in million RMB) Notes: 1. Significant amount of rental payment are re - categorized from lease & rental expenses to depreciation and amortization according to newly adopted IFRS 16 in 2019

35 Strong Balance Sheet and Limited Cash Outflow in Q1 2020 Notes: 1. Adjusted cash spent for operating activities is defined as cash spent for operating activities less capital lease payments, a ddi ng back interest expense and one - off transaction related costs. See slide 50 for detailed reconciliation 2. Free cash flow is defined as operating cash flow less maintenance CAPEX Adj. Cash Spent for Operating Activities 1 Jan to Mar, 2020 - 61 RMB million Cash and Cash Equivalents As of Mar 31 st , 2020 1,438 RMB million Free Cash Flow 2 Jan to Mar, 2020 - 71 RMB million

36 36 Qingdao United Family Hospital GROWTH INITIATIVES
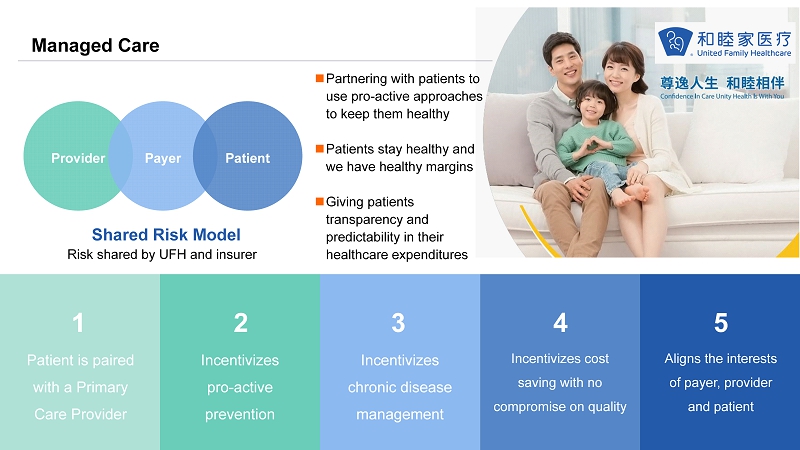
37 37 Managed Care Patient is paired with a Primary Care Provider Incentivizes pro - active prevention Aligns the interests of payer, provider and patient I ncentivizes chronic disease management I ncentivizes cost saving with no compromise on quality 1 2 3 4 5 Provider Patient Payer Shared Risk Model Partnering with patients to use pro - active approaches to keep them healthy Patients stay healthy and we have healthy margins Giving patients transparency and predictability in their healthcare expenditures Risk shared by UFH and insurer
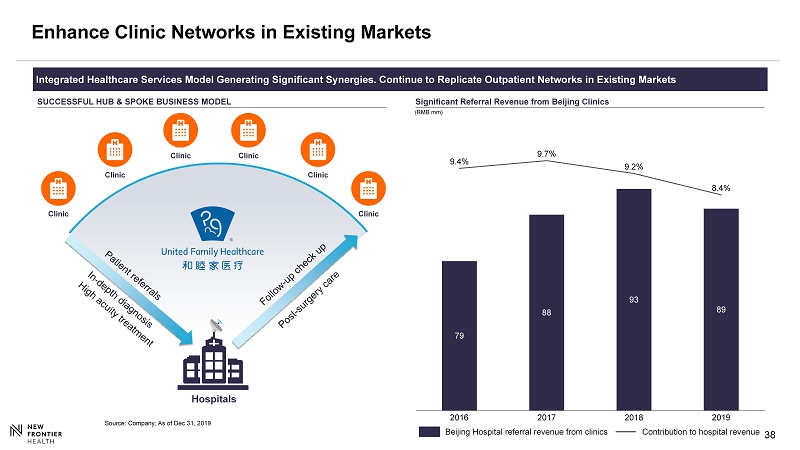
38 38 Enhance Clinic Networks in Existing Markets Integrated Healthcare Services Model Generating Significant Synergies. Continue to Replicate Outpatient Networks in Existing Mar kets Significant Referral Revenue from Beijing Clinics (RMB mm) SUCCESSFUL HUB & SPOKE BUSINESS MODEL Source: Company; As of Dec 31, 2019 Hospitals Clinic Clinic Clinic Clinic Clinic Clinic 79 88 93 89 9.4% 9.7% 9.2% 8.4% 2019 2016 2017 2018 Beijing Hospital referral revenue from clinics C ontribution to hospital revenue
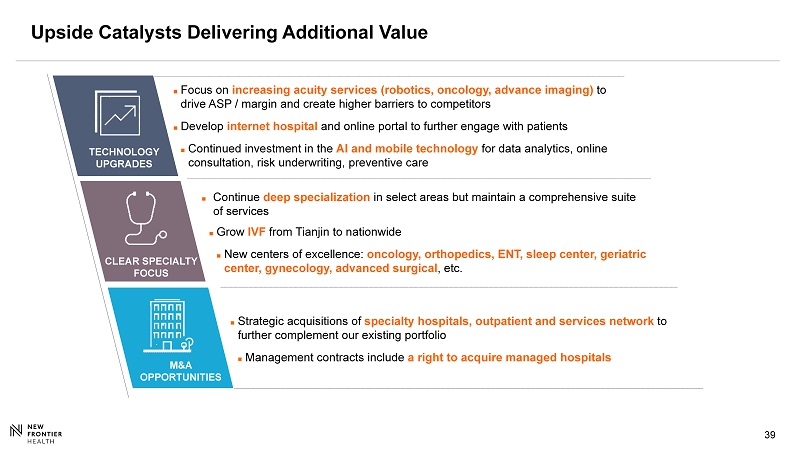
39 39 Upside Catalysts Delivering Additional Value CLEAR SPECIALTY FOCUS Continue deep specialization in select areas but maintain a comprehensive suite of services Grow IVF from Tianjin to nationwide New centers of excellence: oncology, orthopedics, ENT, sleep center, geriatric center, gynecology, advanced surgical , etc. TECHNOLOGY UPGRADES M&A OPPORTUNITIES Strategic acquisitions of specialty hospitals, outpatient and services network to further complement our existing portfolio Management contracts include a right to acquire managed hospitals Focus on increasing acuity services (robotics, oncology, advance imaging) to drive ASP / margin and create higher barriers to competitors Develop internet hospital and online portal to further engage with patients Continued investment in the AI and mobile technology for data analytics, online consultation, risk underwriting, preventive care
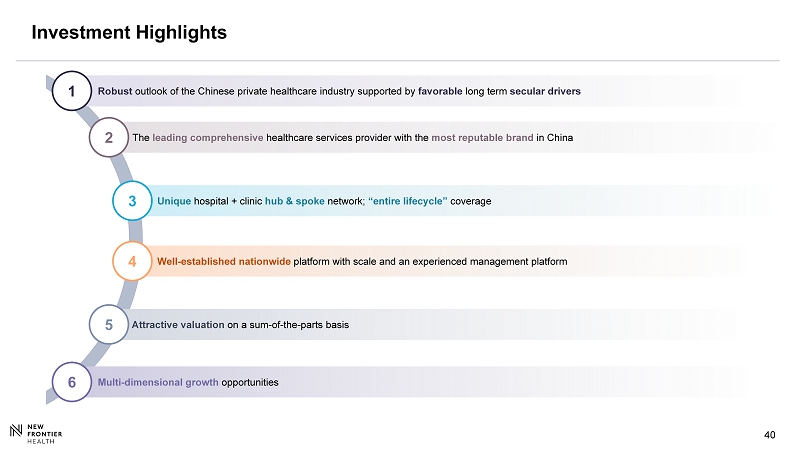
40 40 Investment Highlights Well - established nationwide platform with scale and an experienced management platform 4 Attractive valuation on a sum - of - the - parts basis 5 Multi - dimensional growth opportunities 6 The leading comprehensive healthcare services provider with the most reputable brand in China 2 Robust outlook of the Chinese private healthcare industry supported by favorable long term secular drivers 1 Unique hospital + clinic hub & spoke network; “entire lifecycle” coverage 3

41 APPENDIX A - INDUSTRY OVERVIEW
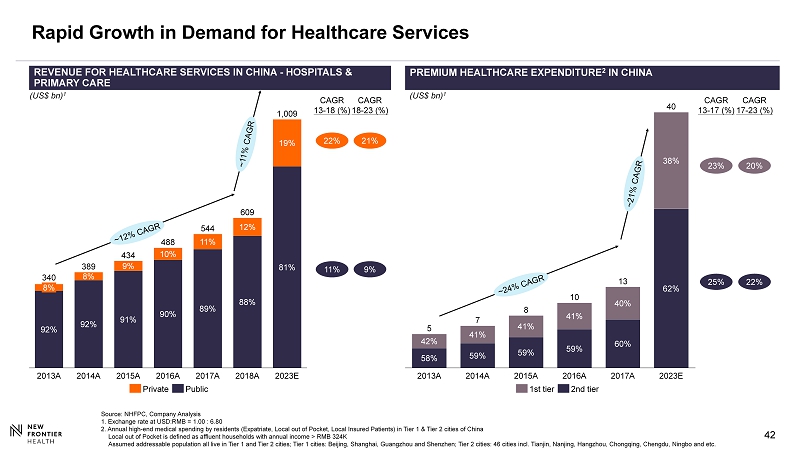
42 42 REVENUE FOR HEALTHCARE SERVICES IN CHINA - HOSPITALS & PRIMARY CARE (US$ bn) 1 CAGR 13 - 18 (%) CAGR 18 - 23 (%) 22% 11% 21% 9% (US$ bn) 1 42% 58% 59% 59% 59% 60% 62% 41% 41% 41% 40% 38% Rapid Growth in Demand for Healthcare Services 23% 25% CAGR 17 - 23 (%) 20% 22% CAGR 13 - 17 (%) Source: NHFPC, Company Analysis 1. Exchange rate at USD:RMB = 1.00 : 6.80 2. Annual high - end medical spending by residents (Expatriate, Local out of Pocket, Local Insured Patients) in Tier 1 & Tier 2 ci ties of China Local out of Pocket is defined as affluent households with annual income > RMB 324K Assumed addressable population all live in Tier 1 and Tier 2 cities; Tier 1 cities: Beijing, Shanghai, Guangzhou and Shenzhen ; Tier 2 cities: 46 cities incl. Tianjin, Nanjing, Hangzhou, Chongqing, Chengdu, Ningbo and etc. PREMIUM HEALTHCARE EXPENDITURE 2 IN CHINA 2023E 488 2013A 8% 389 340 2014A 92% 2015A 91% 2016A 88% 434 1,009 90% 2017A 89% 12% 544 2018A 609 10% 8% 9% 19% 11% 92% 81% Private Public 41% 59% 42% 58% 41% 2013A 2014A 59% 62% 2015A 41% 59% 2016A 40% 60% 2017A 38% 2023E 5 7 8 10 13 40 1st tier 2nd tier
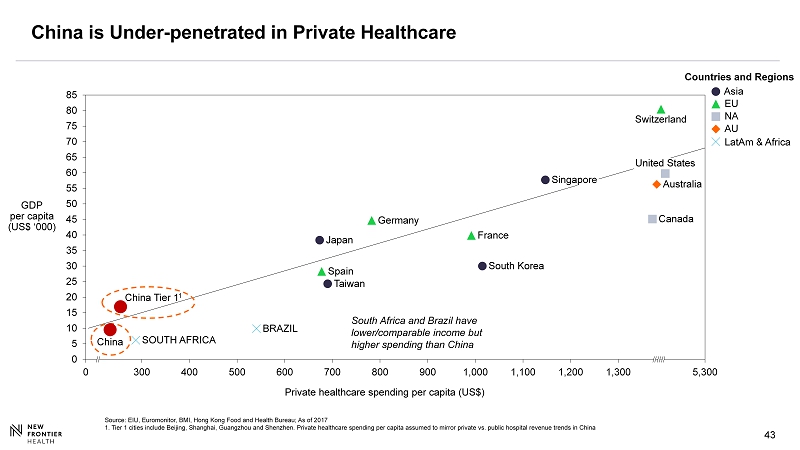
43 43 China is Under - penetrated in Private Healthcare 0 5 10 15 20 25 30 35 40 45 50 55 60 65 70 75 80 85 300 700 500 600 900 1,000 1,100 400 1,300 1,200 800 5,300 0 Germany SOUTH AFRICA Spain Private healthcare spending per capita (US$) Taiwan South Korea GDP per capita (US$ ‘000) Canada Japan United States Singapore China France Switzerland BRAZIL Australia Asia NA EU LatAm & Africa AU South Africa and Brazil have lower/comparable income but higher spending than China China Tier 1 1 Source: EIU, Euromonitor, BMI, Hong Kong Food and Health Bureau; A s of 2017 1. Tier 1 cities include Beijing, Shanghai, Guangzhou and Shenzhen. Private healthcare spending per capita assumed to mirror pri vate vs. public hospital revenue trends in China Countries and Regions
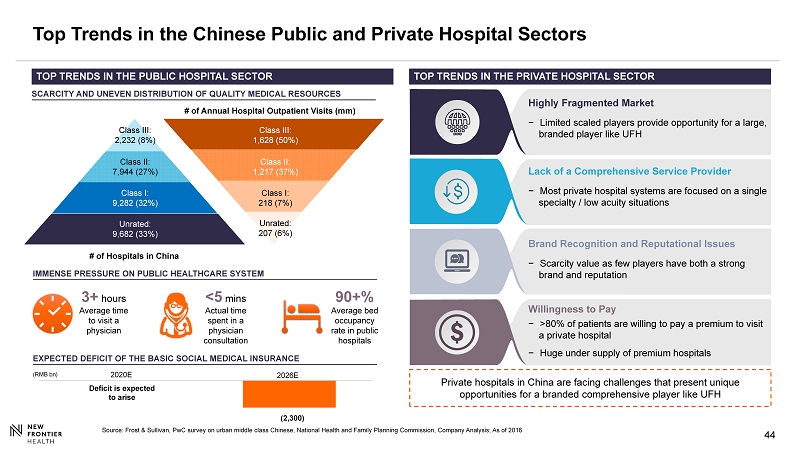
44 44 (2,300) ( RMB bn ) Top Trends in the Chinese Public and Private Hospital Sectors Source: Frost & Sullivan, PwC survey on urban middle class Chinese, National Health and Family Planning Commission, Company A nal ysis; As of 2016 SCARCITY AND UNEVEN DISTRIBUTION OF QUALITY MEDICAL RESOURCES IMMENSE PRESSURE ON PUBLIC HEALTHCARE SYSTEM 3+ hours Average time to visit a physician 90+% Average bed occupancy rate in public hospitals <5 mins Actual time spent in a physician consultation Class III: 2,232 (8%) Class II: 7,944 (27%) Class I: 9,282 (32%) Unrated: 9,682 (33%) # of Annual Hospital Outpatient Visits (mm) Class III: 1,628 (50%) Class II: 1,217 (37%) Class I: 218 (7%) Unrated: 207 (6%) # of Hospitals in China EXPECTED DEFICIT OF THE BASIC SOCIAL MEDICAL INSURANCE 2020E 2026E Deficit is expected to arise TOP TRENDS IN THE PRIVATE HOSPITAL SECTOR Private hospitals in China are facing challenges that present unique opportunities for a branded comprehensive player like UFH Lack of a Comprehensive Service Provider − Most private hospital systems are focused on a single specialty / low acuity situations Highly Fragmented Market − Limited scaled players provide opportunity for a large, branded player like UFH Willingness to Pay − >80% of patients are willing to pay a premium to visit a private hospital − Huge under supply of premium hospitals Brand Recognition and Reputational Issues − Scarcity value as few players have both a strong brand and reputation TOP TRENDS IN THE PUBLIC HOSPITAL SECTOR
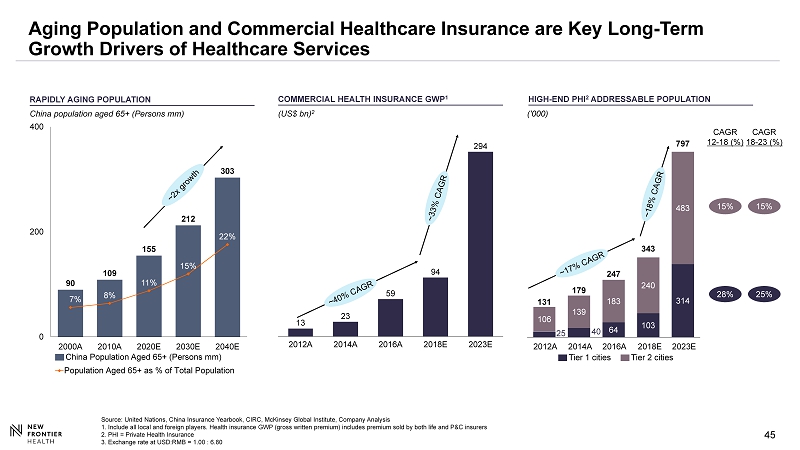
45 45 25 40 64 103 314 106 139 183 240 483 131 179 247 343 797 90 109 155 212 303 7% 8% 11% 15% 22% 0 200 400 2000A 2010A 2020E 2030E 2040E Population Aged 65+ as % of Total Population Aging Population and Commercial Healthcare Insurance are Key Long - Term Growth Drivers of Healthcare Services 15% 28% CAGR 18 - 23 (%) 15% 25% CAGR 12 - 18 (%) RAPIDLY AGING POPULATION China population aged 65+ (Persons mm) HIGH - END PHI 2 ADDRESSABLE POPULATION ('000) COMMERCIAL HEALTH INSURANCE GWP 1 (US$ bn) 2 China Population Aged 65+ (Persons mm) 2012A 2014A 2016A 2018E 2023E Source: United Nations, China Insurance Yearbook, CIRC, McKinsey Global Institute, Company Analysis 1. Include all local and foreign players. Health insurance GWP (gross written premium) includes premium sold by both life and P& C insurers 2. PHI = Private Health Insurance 3. Exchange rate at USD:RMB = 1.00 : 6.80 Tier 1 cities Tier 2 cities 2023E 2012A 13 2016A 2014A 2018E 23 59 94 294
46 46 APPENDIX B – ADDITIONAL MATERIALS

47 47 Summary Shareholder Structure 1,2 of NFH 7% 11% 7% 4% 10% 61% New Frontier Group Other Public Investors Vivo Capital Capital Group Fosun UFH Management Free Float (%) ~90 Note : 1 . 131 mm s hares outstanding before accounting for roll - over NFH ESOP from UFH management and SPAC warrants (currently out - of - the - money) 2 . As a result of the execution of the Fosun Director Nomination Agreement, Vivo Director Nomination Agreement, Irrevocable Proxies, and Director Support Letter Agreements, each Reporting Person may be deemed to be members of a “group” within the meaning of Section 13 (d)( 3 ) of the Exchange Act with NFPH, Vivo LP and Fosun with respect to the election of directors of the Issuer as described in Item 4 of this Amendment No . 1 . As a result, the group may be deemed to have acquired beneficial ownership of all the Ordinary Shares beneficially owned by each member of the “group” and each Reporting Person may be deemed to beneficially own all of the Ordinary Shares beneficially owned by the group . As such, the group may be deemed to beneficially own in the aggregate 81 , 096 , 625 Ordinary Shares, which represents approximately 55 . 5 % of the total outstanding Ordinary Shares .
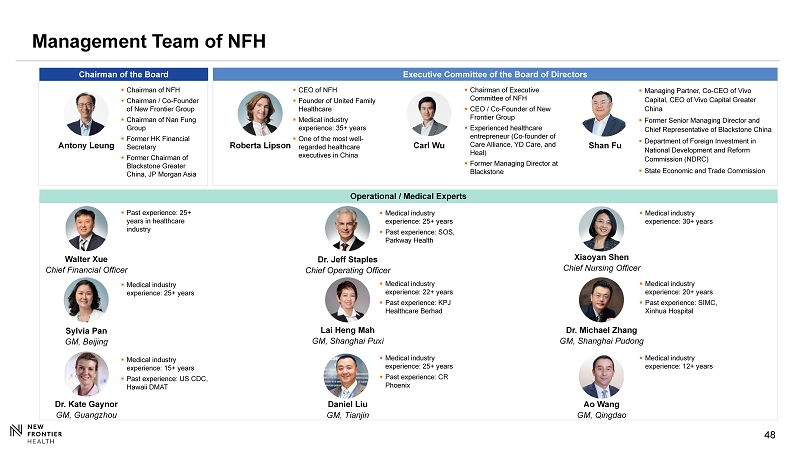
48 48 Management Team of NFH Roberta Lipson Antony Leung Carl Wu Executive Committee of the Board of Directors ▪ CEO of NFH ▪ Founder of United Family Healthcare ▪ Medical industry experience: 35+ years ▪ One of the most well - regarded healthcare executives in China ▪ Chairman of NFH ▪ Chairman / Co - Founder of New Frontier Group ▪ Chairman of Nan Fung Group ▪ Former HK Financial Secretary ▪ Former Chairman of Blackstone Greater China, JP Morgan Asia ▪ C hairman of Executive Committee of NFH ▪ CEO / Co - Founder of New Frontier Group ▪ Experienced healthcare entrepreneur (Co - founder of Care Alliance, YD Care, and Heal) ▪ Former Managing Director at Blackstone Operational / Medical Experts Sylvia Pan GM, Beijing ▪ Medical industry experience: 25+ years ▪ Medical industry experience: 15+ years ▪ Past experience: US CDC, Hawaii DMAT Dr. Kate Gaynor GM, Guangzhou ▪ Past experience: 25+ years in healthcare industry Walter Xue Chief Financial Officer Dr. Jeff Staples Chief Operating Officer ▪ Medical industry experience: 25+ years ▪ Past experience: SOS, Parkway Health ▪ Medical industry experience: 22+ years ▪ Past experience: KPJ Healthcare Berhad Lai Heng Mah GM, Shanghai Puxi Daniel Liu GM, Tianjin ▪ Medical industry experience: 25+ years ▪ Past experience: CR Phoenix ▪ Medical industry experience: 20+ years ▪ Past experience: SIMC, Xinhua Hospital Dr. Michael Zhang GM, Shanghai Pudong Xiaoyan Shen Chief Nursing Officer ▪ Medical industry experience: 30+ years ▪ Medical industry experience: 12+ years Ao Wang GM, Qingdao Chairman of the Board Shan Fu ▪ Managing Partner, Co - CEO of Vivo Capital, CEO of Vivo Capital Greater China ▪ Former Senior Managing Director and Chief Representative of Blackstone China ▪ Department of Foreign Investment in National Development and Reform Commission (NDRC) ▪ State Economic and Trade Commission
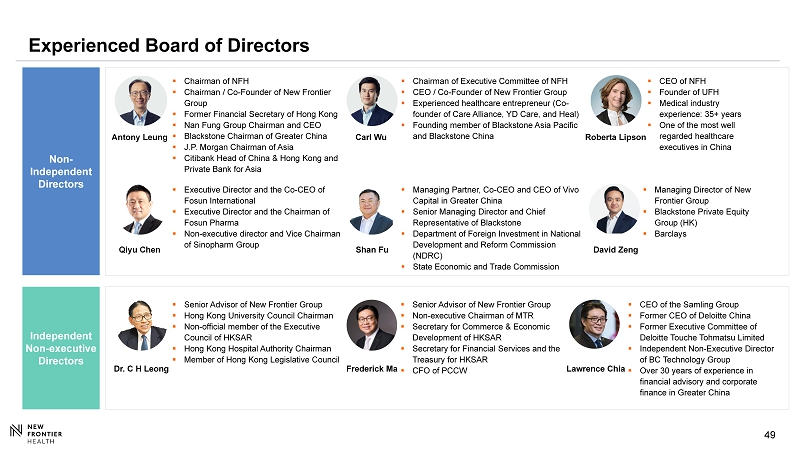
49 49 Experienced Board of Directors Independent Non - executive Directors Antony Leung Carl Wu Non - Independent Directors ▪ Managing Director of New Frontier Group ▪ Blackstone Private Equity Group (HK) ▪ Barclays David Zeng ▪ Chairman of NFH ▪ Chairman / Co - Founder of New Frontier Group ▪ Former Financial Secretary of Hong Kong ▪ Nan Fung Group Chairman and CEO ▪ Blackstone Chairman of Greater China ▪ J.P. Morgan Chairman of Asia ▪ Citibank Head of China & Hong Kong and Private Bank for Asia ▪ Chairman of Executive Committee of NFH ▪ CEO / Co - Founder of New Frontier Group ▪ Experienced healthcare entrepreneur (Co - founder of Care Alliance, YD Care, and Heal) ▪ Founding member of Blackstone Asia Pacific and Blackstone China Roberta Lipson Shan Fu Qiyu Chen ▪ CEO of NFH ▪ Founder of UFH ▪ Medical industry experience: 35+ years ▪ One of the most well regarded healthcare executives in China ▪ Managing Partner, Co - CEO and CEO of Vivo Capital in Greater China ▪ Senior Managing Director and Chief Representative of Blackstone ▪ Department of Foreign Investment in National Development and Reform Commission (NDRC) ▪ State Economic and Trade Commission ▪ Executive Director and the Co - CEO of Fosun International ▪ Executive Director and the Chairman of Fosun Pharma ▪ Non - executive director and Vice Chairman of Sinopharm Group Dr. C H Leong Frederick Ma ▪ Senior Advisor of New Frontier Group ▪ Hong Kong University Council Chairman ▪ Non - official member of the Executive Council of HKSAR ▪ Hong Kong Hospital Authority Chairman ▪ Member of Hong Kong Legislative Council ▪ Senior Advisor of New Frontier Group ▪ Non - executive Chairman of MTR ▪ Secretary for Commerce & Economic Development of HKSAR ▪ Secretary for Financial Services and the Treasury for HKSAR ▪ CFO of PCCW ▪ CEO of the Samling Group ▪ Former CEO of Deloitte China ▪ Former Executive Committee of Deloitte Touche Tohmatsu Limited ▪ Independent Non - Executive Director of BC Technology Group ▪ Over 30 years of experience in financial advisory and corporate finance in Greater China Lawrence Chia
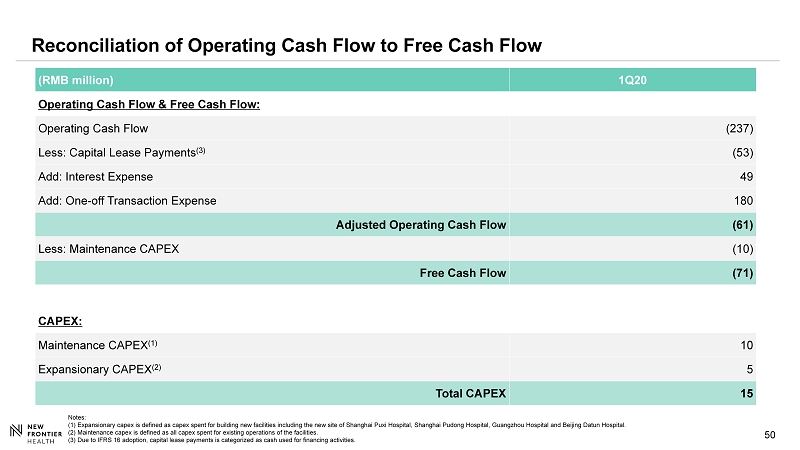
50 Reconciliation of Operating Cash Flow to Free Cash Flow (RMB million) 1Q20 Operating Cash Flow & Free Cash Flow: Operating Cash Flow (237) Less: Capital Lease Payments (3) (53) Add: Interest Expense 49 Add: One - off Transaction Expense 180 Adjusted Operating Cash Flow (61) Less: Maintenance CAPEX (10) Free Cash Flow (71) CAPEX: Maintenance CAPEX (1) 10 Expansionary CAPEX (2) 5 Total CAPEX 15 Notes: (1) Expansionary capex is defined as capex spent for building new facilities including the new site of Shanghai Puxi Hospital, Shanghai Pudong Hospital, Guangzhou Hospital and Beijing Datun Hospital. (2) Maintenance capex is defined as all capex spent for existing operations of the facilities. (3) Due to IFRS 16 adoption, capital lease payments is categorized as cash used for financing activities.
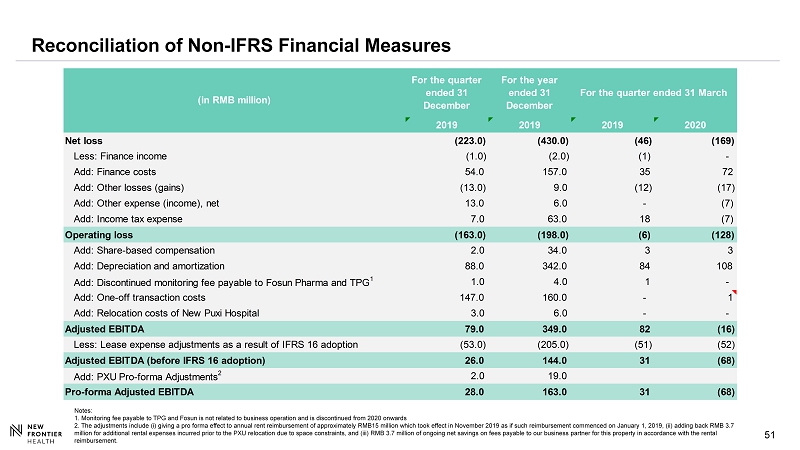
51 51 Reconciliation of Non - IFRS Financial Measures Notes: 1. Monitoring fee payable to TPG and Fosun is not related to business operation and is discontinued from 2020 onwards 2. The adjustments include ( i ) giving a pro forma effect to annual rent reimbursement of approximately RMB15 million which took effect in November 2019 as if such reimbursement commenced on January 1, 2019, (ii) adding back RMB 3.7 million for additional rental expenses incurred prior to the PXU relocation due to space constraints, and (iii) RMB 3.7 milli on of ongoing net savings on fees payable to our business partner for this property in accordance with the rental reimbursement. For the quarter ended 31 December For the year ended 31 December For the quarter ended 31 March 2019 2019 2019 2020 Net loss (223.0) (430.0) (46) (169) Less: Finance income (1.0) (2.0) (1) - Add: Finance costs 54.0 157.0 35 72 Add: Other losses (gains) (13.0) 9.0 (12) (17) Add: Other expense (income), net 13.0 6.0 - (7) Add: Income tax expense 7.0 63.0 18 (7) Operating loss (163.0) (198.0) (6) (128) Add: Share-based compensation 2.0 34.0 3 3 Add: Depreciation and amortization 88.0 342.0 84 108 Add: Discontinued monitoring fee payable to Fosun Pharma and TPG 1 1.0 4.0 1 - Add: One-off transaction costs 147.0 160.0 - 1 Add: Relocation costs of New Puxi Hospital 3.0 6.0 - - Adjusted EBITDA 79.0 349.0 82 (16) Less: Lease expense adjustments as a result of IFRS 16 adoption (53.0) (205.0) (51) (52) Adjusted EBITDA (before IFRS 16 adoption) 26.0 144.0 31 (68) Add: PXU Pro-forma Adjustments 2 2.0 19.0 Pro-forma Adjusted EBITDA 28.0 163.0 31 (68) (in RMB million)