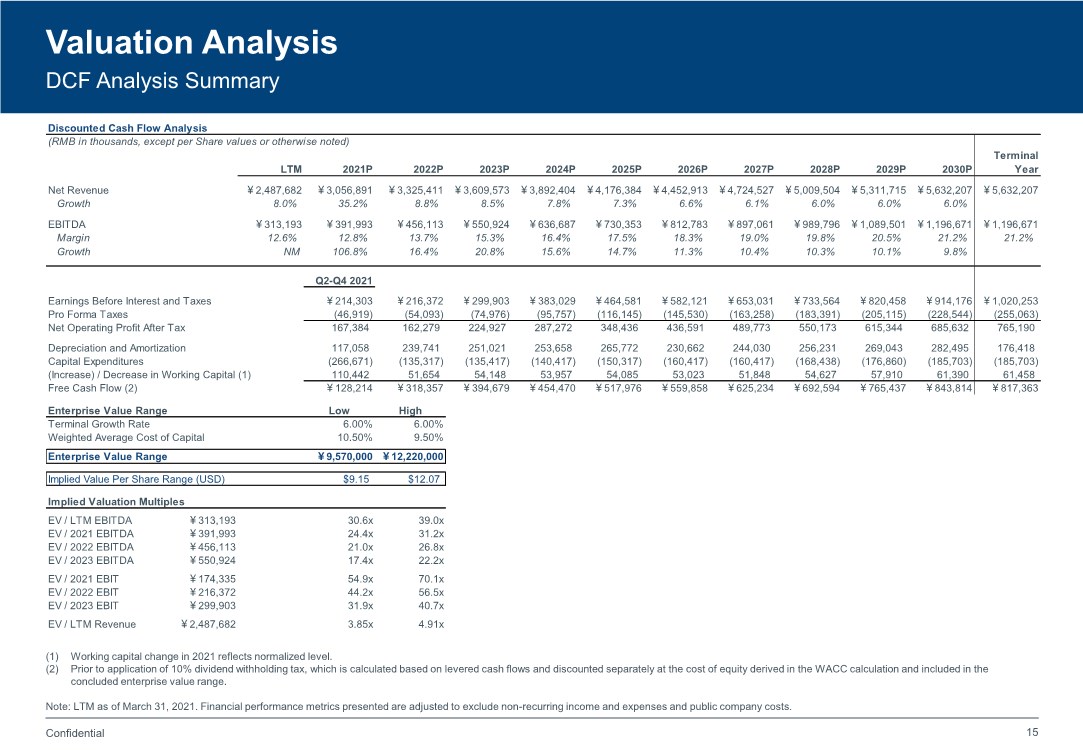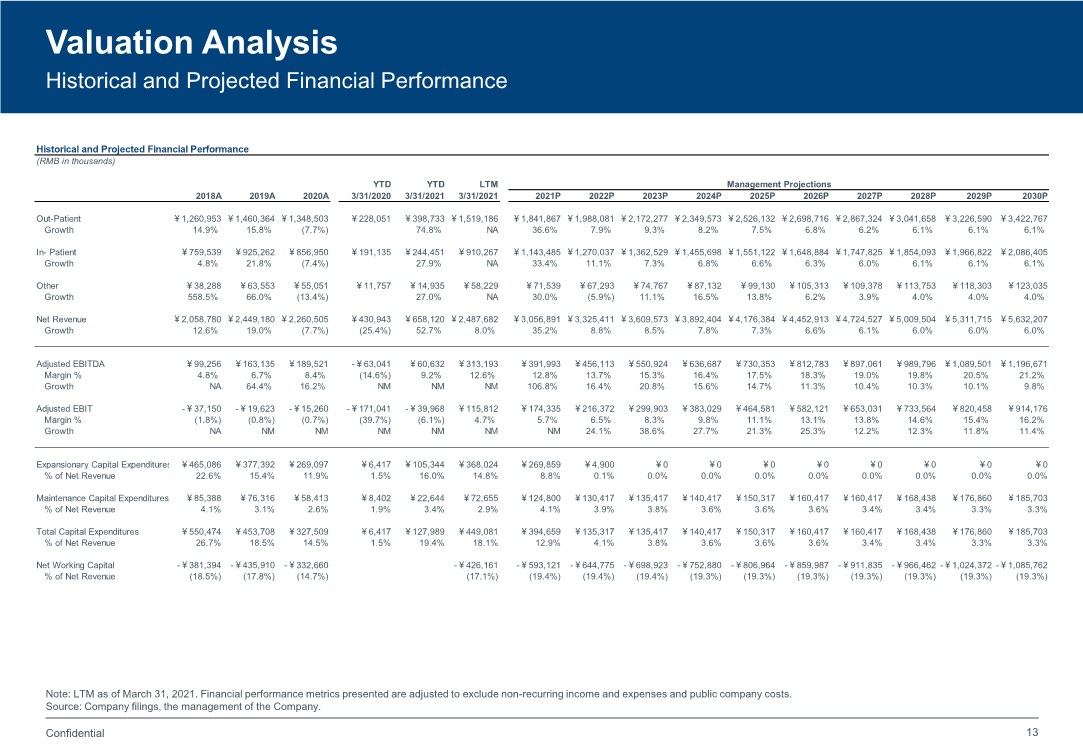
| Confidential 13 Valuation Analysis Historical and Projected Financial Performance Note: LTM as of March 31, 2021. Financial performance metrics presented are adjusted to exclude non-recurring income and expenses and public company costs. Source: Company filings, the management of the Company. Historical and Projected Financial Performance (RMB in thousands) YTD YTD LTM Management Projections 2018A 2019A 2020A 3/31/2020 3/31/2021 3/31/2021 2021P 2022P 2023P 2024P 2025P 2026P 2027P 2028P 2029P 2030P Out-Patient ¥1,260,953 ¥1,460,364 ¥1,348,503 ¥228,051 ¥398,733 ¥1,519,186 ¥1,841,867 ¥1,988,081 ¥2,172,277 ¥2,349,573 ¥2,526,132 ¥2,698,716 ¥2,867,324 ¥3,041,658 ¥3,226,590 ¥3,422,767 Growth 14.9% 15.8% (7.7%) 74.8% NA 36.6% 7.9% 9.3% 8.2% 7.5% 6.8% 6.2% 6.1% 6.1% 6.1% In- Patient ¥759,539 ¥925,262 ¥856,950 ¥191,135 ¥244,451 ¥910,267 ¥1,143,485 ¥1,270,037 ¥1,362,529 ¥1,455,698 ¥1,551,122 ¥1,648,884 ¥1,747,825 ¥1,854,093 ¥1,966,822 ¥2,086,405 Growth 4.8% 21.8% (7.4%) 27.9% NA 33.4% 11.1% 7.3% 6.8% 6.6% 6.3% 6.0% 6.1% 6.1% 6.1% Other ¥38,288 ¥63,553 ¥55,051 ¥11,757 ¥14,935 ¥58,229 ¥71,539 ¥67,293 ¥74,767 ¥87,132 ¥99,130 ¥105,313 ¥109,378 ¥113,753 ¥118,303 ¥123,035 Growth 558.5% 66.0% (13.4%) 27.0% NA 30.0% (5.9%) 11.1% 16.5% 13.8% 6.2% 3.9% 4.0% 4.0% 4.0% Net Revenue ¥2,058,780 ¥2,449,180 ¥2,260,505 ¥430,943 ¥658,120 ¥2,487,682 ¥3,056,891 ¥3,325,411 ¥3,609,573 ¥3,892,404 ¥4,176,384 ¥4,452,913 ¥4,724,527 ¥5,009,504 ¥5,311,715 ¥5,632,207 Growth 12.6% 19.0% (7.7%) (25.4%) 52.7% 8.0% 35.2% 8.8% 8.5% 7.8% 7.3% 6.6% 6.1% 6.0% 6.0% 6.0% Adjusted EBITDA ¥99,256 ¥163,135 ¥189,521 -¥63,041 ¥60,632 ¥313,193 ¥391,993 ¥456,113 ¥550,924 ¥636,687 ¥730,353 ¥812,783 ¥897,061 ¥989,796 ¥1,089,501 ¥1,196,671 Margin % 4.8% 6.7% 8.4% (14.6%) 9.2% 12.6% 12.8% 13.7% 15.3% 16.4% 17.5% 18.3% 19.0% 19.8% 20.5% 21.2% Growth NA 64.4% 16.2% NM NM NM 106.8% 16.4% 20.8% 15.6% 14.7% 11.3% 10.4% 10.3% 10.1% 9.8% Adjusted EBIT -¥37,150 -¥19,623 -¥15,260 -¥171,041 -¥39,968 ¥115,812 ¥174,335 ¥216,372 ¥299,903 ¥383,029 ¥464,581 ¥582,121 ¥653,031 ¥733,564 ¥820,458 ¥914,176 Margin % (1.8%) (0.8%) (0.7%) (39.7%) (6.1%) 4.7% 5.7% 6.5% 8.3% 9.8% 11.1% 13.1% 13.8% 14.6% 15.4% 16.2% Growth NA NM NM NM NM NM NM 24.1% 38.6% 27.7% 21.3% 25.3% 12.2% 12.3% 11.8% 11.4% Expansionary Capital Expenditures ¥465,086 ¥377,392 ¥269,097 ¥6,417 ¥105,344 ¥368,024 ¥269,859 ¥4,900 ¥0 ¥0 ¥0 ¥0 ¥0 ¥0 ¥0 ¥0 % of Net Revenue 22.6% 15.4% 11.9% 1.5% 16.0% 14.8% 8.8% 0.1% 0.0% 0.0% 0.0% 0.0% 0.0% 0.0% 0.0% 0.0% Maintenance Capital Expenditures ¥85,388 ¥76,316 ¥58,413 ¥8,402 ¥22,644 ¥72,655 ¥124,800 ¥130,417 ¥135,417 ¥140,417 ¥150,317 ¥160,417 ¥160,417 ¥168,438 ¥176,860 ¥185,703 % of Net Revenue 4.1% 3.1% 2.6% 1.9% 3.4% 2.9% 4.1% 3.9% 3.8% 3.6% 3.6% 3.6% 3.4% 3.4% 3.3% 3.3% Total Capital Expenditures ¥550,474 ¥453,708 ¥327,509 ¥6,417 ¥127,989 ¥449,081 ¥394,659 ¥135,317 ¥135,417 ¥140,417 ¥150,317 ¥160,417 ¥160,417 ¥168,438 ¥176,860 ¥185,703 % of Net Revenue 26.7% 18.5% 14.5% 1.5% 19.4% 18.1% 12.9% 4.1% 3.8% 3.6% 3.6% 3.6% 3.4% 3.4% 3.3% 3.3% Net Working Capital -¥381,394 -¥435,910 -¥332,660 -¥426,161 -¥593,121 -¥644,775 -¥698,923 -¥752,880 -¥806,964 -¥859,987 -¥911,835 -¥966,462 -¥1,024,372 -¥1,085,762 % of Net Revenue (18.5%) (17.8%) (14.7%) (17.1%) (19.4%) (19.4%) (19.4%) (19.3%) (19.3%) (19.3%) (19.3%) (19.3%) (19.3%) (19.3%) |