UNITED STATES
SECURITIES AND EXCHANGE COMMISSION
Washington, D.C. 20549
FORMN-CSR
CERTIFIED SHAREHOLDER REPORT OF REGISTERED MANAGEMENT
INVESTMENT COMPANIES
Investment Company Act file number:811-23345
Name of Fund: BlackRock Series Fund II, Inc.
BlackRock High Yield Portfolio
BlackRock U.S. Government Bond Portfolio
Fund Address: 100 Bellevue Parkway, Wilmington, DE 19809
Name and address of agent for service: John M. Perlowski, Chief Executive Officer, BlackRock Series Fund II, Inc., 55 East 52nd Street, New York, NY 10055
Registrant’s telephone number, including area code: (800)441-7762
Date of fiscal year end: 12/31/2019
Date of reporting period: 12/31/2019
Item 1 – Report to Stockholders
| | |
 | | DECEMBER 31, 2019 |
BlackRock Series Fund, Inc.
| · | | BlackRock Advantage Large Cap Core Portfolio |
| · | | BlackRock Balanced Capital Portfolio |
| · | | BlackRock Capital Appreciation Portfolio |
| · | | BlackRock Global Allocation Portfolio |
| · | | BlackRock Government Money Market Portfolio |
BlackRock Series Fund II, Inc.
| · | | BlackRock High Yield Portfolio |
| · | | BlackRock U.S. Government Bond Portfolio |
|
| Not FDIC Insured - May Lose Value - No Bank Guarantee |
The Markets in Review
Dear Shareholder,
U.S. equities and bonds finished the last year of the decade with impressive returns, putting an exclamation point on a decade of strong performance despite the fears and doubts about the economy that were ultimately laid to rest with unprecedented monetary stimulus and a sluggish yet resolute performance from the U.S. economy. In many ways, it was fitting that the themes of 2019 — geopolitical uncertainty, fears of recession, and decisive monetary stimulus — put the capstone on a decade that was defined by grappling with these competing forces.
Equity and bond markets posted solid returns, particularly in the second half of the year, as investors began to realize that the U.S. economy was maintaining the modest yet steady growth that has characterized this economic cycle. U.S. large cap equities advanced the most, while equities at the high end of the risk spectrum — emerging markets and U.S. small cap — lagged while still posting solid returns.
Fixed-income securities played an important role in diversified portfolios by delivering strong returns amid economic uncertainty, as interest rates declined (and bond prices rose). Long-term bonds, particularly long-term Treasuries, generally posted the strongest returns, as inflation remained low. Investment-grade and high-yield corporate bonds also posted solid returns, as the credit fundamentals in corporate markets remained relatively solid.
As equity performance faltered in late 2018 and global economic growth slowed, the U.S. Federal Reserve (the “Fed”) shifted away from policies designed to decrease inflation in favor of renewed efforts to stimulate economic activity. The Fed left interest rates unchanged in January 2019, then reduced interest rates three times thereafter, starting in July 2019. Similarly, the Fed took measures to support liquidity in short-term lending markets. Following in the Fed’s footsteps, the European Central Bank announced aggressive economic stimulus measures, including lower interest rates and the return of its bond purchasing program. The Bank of Japan signaled a continuation of accommodative monetary policy, while China committed to looser credit conditions and an increase in fiscal spending.
The outpouring of global economic stimulus led to a sharp rally in risk assets throughout the world despite the headwind of rising geopolitical and trade tensions. Hopes continued to remain high as the current economic expansion became the longest in U.S. history.
Looking ahead, we believe U.S. economic growth will stabilize and gradually improve in 2020. The primary drivers of recent market performance — trade and monetary policies — could take a back seat to a nascent expansion in manufacturing and a recent uptick in global growth. The headwinds of policy uncertainty in 2019 could become tailwinds in 2020 due topro-cyclical policy shifts.
Overall, we favor increasing investment risk to benefit from the brighter outlook. In addition to having a positive view for equities overall, we favor emerging market equities over developed market equities. Increasing cyclical exposure through value-style investing and maintaining a meaningful emphasis on high-quality companies through quality factors also makes sense for diversified investors. In fixed income, government bonds continue to be important portfolio stabilizers, while emerging market bonds, particularly local currency bonds, offer relatively attractive income opportunities.
In this environment, investors need to think globally, extend their scope across a broad array of asset classes, and be nimble as market conditions change. We encourage you to talk with your financial advisor and visitblackrock.comfor further insight about investing in today’s markets.
Sincerely,

Rob Kapito
President, BlackRock Advisors, LLC

Rob Kapito
President, BlackRock Advisors, LLC
| | | | |
| Total Returns as of December 31, 2019 |
| | | 6-Month | | 12-Month |
U.S. large cap equities
(S&P 500®Index) | | 10.92% | | 31.49% |
U.S. small cap equities
(Russell 2000®Index) | | 7.30 | | 25.52 |
International equities
(MSCI Europe, Australasia, Far East Index) | | 7.01 | | 22.01 |
Emerging market equities
(MSCI Emerging Markets Index) | | 7.09 | | 18.42 |
3-month Treasury bills
(ICE BofAML3-Month U.S. Treasury Bill Index) | | 1.03 | | 2.28 |
U.S. Treasury securities
(ICE BofAML10-Year U.S. Treasury Index) | | 1.36 | | 8.91 |
U.S. investment grade bonds
(Bloomberg Barclays U.S. Aggregate Bond Index) | | 2.45 | | 8.72 |
Tax-exempt municipal bonds
(S&P Municipal Bond Index) | | 2.21 | | 7.26 |
U.S. high yield bonds (Bloomberg Barclays U.S. Corporate High Yield 2% Issuer Capped Index) | | 3.98 | | 14.32 |
|
| Past performance is no guarantee of future results. Index performance is shown for illustrative purposes only. You cannot invest directly in an index. |
| | |
| 2 | | THIS PAGEISNOT PARTOF YOUR FUND REPORT |
Table of Contents
| | |
| Fund Summary as of December 31, 2019 | | BlackRock Advantage Large Cap Core Portfolio |
Investment Objective
BlackRock Advantage Large Cap Core Portfolio’s (the “Fund”)investment objective is to seek long-term capital appreciation.
Portfolio Management Commentary
How did the Fund perform?
For the12-month period ended December 31, 2019, the Fund underperformed its benchmark, the Russell 1000® Index.
What factors influenced performance?
The Fund’s relative return was challenged during the latter half of the year, with underperformance driven primarily by the sentiment-based group of insights, which struggled significantly amid increased market volatility. A series of inflection points, largely motivated by shifts in global trade conversations and central bank policy, created a difficult environment for the portfolio’s trend-based insights. Cross-market sentiment insights also struggled throughout much of the period. Of note, identifying the sentiment of informed bond investors was the top individual detractor for the period. The signal’s more defensive properties went unrewarded through much of the year, and a steady decline in interest rates, most pronounced in the third quarter, created a challenging environment for the insight. Broadly speaking, the Fund’s sentiment-based insights were least effective in select cyclical sectors, specifically financials and communication services. Among the fundamental group of insights, signals seeking to identify relative value opportunities were very challenged early in the year as investors sought out speculative growth opportunities at the expense of company fundamentals. Macro thematic insights further detracted from relative returns throughout the period, caused by weakness across several industry timing insights. Of note, while the Fund targets a generally sector- and industry-neutral approach, maintaining a modest overweight in the biotechnology industry was a drag on relative performance, as the industry struggled early in the year and underperformed the broader market in 2019.
Despite detracting modestly in aggregate, insights evaluating company fundamentals provided some ballast to relative performance toward the end of the year. As the market mentality shifted toward the end of the third quarter, insights seeking to identify relative value opportunities were supportive of results. Also, among insights evaluating company fundamentals, quality signals were mixed throughout the year, contributing modestly in aggregate. Of note, alternative measures of company quality were particularly beneficial, including a signal evaluating companies on a series of longer-term sustainability measures and a signal conducting machine- learned text analysis of company news filings. Finally, sentiment insights were successful early in the year, with more trend-based sentiment insights strengthening relative performance during the first quarter and much of the second.
Describe recent portfolio activity.
Over the course of the period, the portfolio maintained a balanced allocation of risk across all major return drivers. However, a number of new stock selection insights were added to the portfolio. Among these is a machine-learned signal that pulls from several alternative data sources in seeking to more accurately gauge consumer transactions. In addition, an insight that evaluates trade volumes to determine broker concentration and identify overcrowded trades was introduced to the portfolio. Finally, the investment adviser improved upon an existing signal, expanding the data sources used to identify trends in company hiring as an indication of future company growth.
Describe portfolio positioning at period end.
Relative to the Russell 1000® Index, the Fund was positioned essentially neutrally from a sector perspective. The Fund had slight overweight positions in the financials and industrials sectors and slight underweight positions in the real estate and consumer discretionary sectors.
The views expressed reflect the opinions of BlackRock as of the date of this report and are subject to change based on changes in market, economic or other conditions. These views are not intended to be a forecast of future events and are no guarantee of future results.
| | |
| 4 | | 2019 BLACKROCK ANNUAL REPORTTO SHAREHOLDERS |
| | |
| Fund Summary as of December 31, 2019 (continued) | | BlackRock Advantage Large Cap Core Portfolio |
TOTAL RETURN BASED ON A $10,000 INVESTMENT
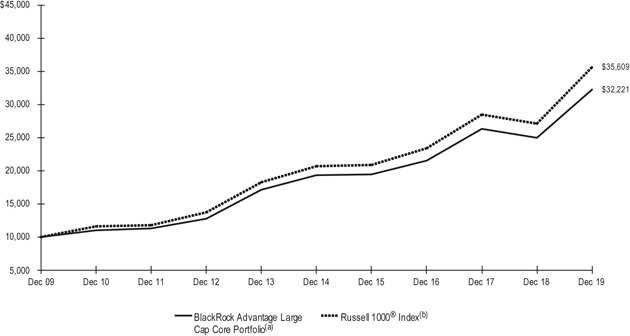
| (a) | Assuming transaction costs and other operating expenses, including investment advisory fees, if any. Does not include insurance-related fees and expenses. Under normal circumstances, the Fund seeks to invest at least 80% of its net assets, plus the amount of any borrowings for investment purposes, in large cap equity securities and derivatives that have similar economic characteristics to such securities. The Fund’s total returns prior to June 12, 2017 are the returns of the Fund when it followed different investment strategies under the name BlackRock Large Cap Core Portfolio. |
| (b) | An index that measures the performance of the large cap segment of the U.S. equity universe. It is a subset of the Russell 3000® Index and includes approximately 1,000 of the largest securities based on a combination of their market capitalization and current index membership. The index represents approximately 92% of the total market capitalization of the Russell 3000® Index. |
Performance Summary for the Period Ended December 31, 2019
| | | | | | | | | | | | | | | | | | | | | | | | | | | | |
| | | | | | Average Annual Total Returns(a) | |
| | | 6-Month
Total Returns (a) | | | | | | 1 Year | | | | | | 5 Years | | | | | | 10 Years | |
BlackRock Advantage Large Cap Core Portfolio | | | 8.87 | % | | | | | | | 29.09 | % | | | | | | | 10.76 | % | | | | | | | 12.41 | % |
Russell 1000®Index | | | 10.59 | | | | | | | | 31.43 | | | | | | | | 11.48 | | | | | | | | 13.54 | |
| (a) | Cumulative and average annual total returns are based on changes in net asset value for the periods shown and assume reinvestment of all distributions at net asset value on theex-dividend date. Insurance-related fees and expenses are not reflected in these returns. The Fund’s total returns prior to June 12, 2017 are the returns of the Fund when it followed different investment strategies under the name BlackRock Large Cap Core Portfolio. |
Past performance is not indicative of future results. Performance results do not reflect the deduction of taxes that a shareholder would pay on Fund distributions or the redemption of Fund shares.
Performance results may include adjustments made for financial reporting purposes in accordance with U.S. generally accepted accounting principles.
| | |
| Fund Summary as of December 31, 2019 (continued) | | BlackRock Advantage Large Cap Core Portfolio |
Expense Example
| | | | | | | | | | | | | | | | | | | | | | | | | | | | | | | | |
| | | Actual | | | | | | Hypothetical(a) | | | | |
| | | Beginning
Account Value
(07/01/19) | | | Ending
Account Value
(12/31/19) | | | Expenses
Paid During
the Period (b) | | | | | | Beginning
Account Value
(07/01/19) | | | Ending
Account Value
(12/31/19) | | | Expenses
Paid During
the Period (b) | | | Annualized
Expense
Ratio | |
BlackRock Advantage
Large Cap Core Portfolio | | $ | 1,000.00 | | | $ | 1,088.70 | | | $ | 2.63 | | | | | | | $ | 1,000.00 | | | $ | 1,022.68 | | | $ | 2.55 | | | | 0.50 | % |
| (a) | Hypothetical 5% annual return before expenses is calculated by prorating the number of days in the most recent fiscal half year divided by 365. |
| (b) | Expenses are equal to the Fund’s annualized expense ratio, multiplied by the average account value over the period, multiplied by 184/365 (to reflect theone-half year period shown). |
See “Disclosure of Expenses” on page 24 for further information on how expenses were calculated.
Portfolio Information
| | | | |
| SECTOR ALLOCATION | | | | |
| Sector | | Percent of
Net Assets | |
Information Technology | | | 23 | % |
Health Care | | | 14 | |
Financials | | | 14 | |
Communication Services | | | 10 | |
Industrials | | | 10 | |
Consumer Discretionary | | | 9 | |
Consumer Staples | | | 7 | |
Energy | | | 4 | |
Utilities | | | 3 | |
Real Estate | | | 3 | |
Materials | | | 2 | |
Short-Term Securities | | | 5 | |
Liabilities in Excess of Other Assets | | | (4 | ) |
For Fund compliance purposes, the Fund’s sector classifications refer to one or more of the sectorsub-classifications used by one or more widely recognized market indexes or ratings group indexes, and/or as defined by the investment adviser. These definitions may not apply for purposes of this report, which may combine such sectorsub-classifications for reporting ease.
| | |
| 6 | | 2019 BLACKROCK ANNUAL REPORTTO SHAREHOLDERS |
| | |
| Fund Summary as of December 31, 2019 | | BlackRock Balanced Capital Portfolio |
Investment Objective
BlackRock Balanced Capital Portfolio’s (the “Fund”)investment objective is to seek high total investment return.
Portfolio Management Commentary
How did the Fund perform?
For the12-month period ended December 31, 2019, the Fund returned 22.06%, underperforming its blended benchmark (60% Russell 1000® Index/40% Bloomberg Barclays U.S. Aggregate Bond Index), which returned 22.16% for the period. The Russell 1000® Index returned 31.43%, while the Bloomberg Barclays U.S. Aggregate Bond Index returned 8.72%.
What factors influenced performance?
From an asset allocation perspective, an overweight position to the euro detracted from performance as the currency weakened throughout the year and lagged the U.S. dollar on the back of weaker manufacturing data and trade tensions.
Within the equity allocation, underperformance was primarily driven by the portfolio’s sentiment-based group of insights, which struggled significantly in the second half of the year amid increased market volatility. A series of inflection points, largely motivated by shifts in global trade conversations and central bank policy, created a difficult environment for the portfolio’s trend-based insights. Cross-market sentiment insights also struggled throughout much of the period. Of note, identifying the sentiment of informed bond investors was the top individual detractor for the period. Meanwhile, in the fixed income allocation, the portfolio’s overweight to agency mortgage-backed securities (“MBS”) and macro-oriented strategies detracted from performance for the period.
From an asset allocation perspective, the investment adviser’s positive view on U.S. equities was the main contributor to Fund performance. The rally was driven by market perceptions of a more dovish Fed and an abatement in concerns over a deceleration in global growth on the back of more positive consumer and growth data. Additionally, the Fund’s tactical overweight to U.S. duration (duration is a measure of interest rate sensitivity) in early 2019 boosted returns as bond prices rebounded from December 2018’s lows.
The portfolio’s quality signals within the Fund’s equity allocation had mixed results and contributed modestly in aggregate. Of note, alternative measures of company quality were particularly beneficial, including a signal evaluating companies on a series of longer-term sustainability measures and a signal conducting machine-learned text analysis of company news filings. In the fixed income allocation, overweight positions to investment grade corporate credit, municipal bonds, collateralized loan obligations and non-agency MBS contributed positively to performance.
Describe recent portfolio activity.
During the first half of the period, the Fund removed its overweight to Japanese equities and trimmed its overweight to U.S. equities and U.S. duration as global growth and inflation data continued to moderate and asset prices moved more in line with expectations. During the second half of the period, the Fund further trimmed its overweight to U.S. equities and moved from an overweight to an underweight position in U.S. duration given favorable moves in pricing and the expectation that market pricing of the Fed was overly dovish amid positive growth data and stable inflationary pressures.
In the equity allocation of the Fund, the portfolio maintained a balanced allocation of risk across all major return drivers. However, a number of new stock selection insights were added to the portfolio. Among these is a machine-learned signal that pulls from several alternative data sources to try to more accurately gauge consumer transactions. In addition, an insight that evaluates trade volumes to determine broker concentration and identify overcrowded trades was introduced to the portfolio. Finally, the portfolio improved upon an existing signal, expanding the data sources used to identify trends in company hiring as an indication of future company growth.
Within the fixed income allocation of the Fund, the portfolio modestly increased its overweight to duration while slightly rotating exposure out on the curve during the first half of the year. The portfolio also added tactically in emerging markets on the view that a dovish Fed would take upward pressure off the dollar and allow for easier local monetary policy. During the third quarter of 2019, the portfolio slightly increased its duration, maintaining a small overweight in duration versus thefixed-income benchmark. During the fourth quarter of 2019, the portfolio reduced its overweight to investment grade corporate credit in favor of adding to agency MBS and inflation-protected bonds given favorable moves in market pricing.
Describe portfolio positioning at period end.
The Fund ended the period with a preference for stocks over bonds given modest improvements in global growth and inflation data. Within equities, the Fund was overweight to the U.S. market on the view that the Fed’s policy shift supports the outlook for further gains. Within fixed income, the Fund ended the period with an underweight duration stance given the scope for yields to move higher from the current low levels.
The views expressed reflect the opinions of BlackRock as of the date of this report and are subject to change based on changes in market, economic or other conditions. These views are not intended to be a forecast of future events and are no guarantee of future results.
| | |
| Fund Summary as of December 31, 2019 (continued) | | BlackRock Balanced Capital Portfolio |
TOTAL RETURN BASED ON A $10,000 INVESTMENT
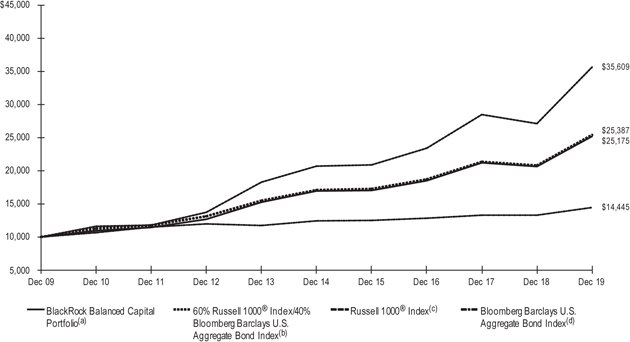
| (a) | Assuming transaction costs and other operating expenses, including investment advisory fees, if any. Does not include insurance-related fees and expenses. The Fund invests in U.S. and foreign equity securities andfixed-income securities of any maturity. |
| (b) | A customized weighted index comprised of the returns of the Russell 1000® Index (60%) and Bloomberg Barclays U.S. Aggregate Bond Index (40%). |
| (c) | An index that measures the performance of the large cap segment of the U.S. equity universe. It is a subset of the Russell 3000® Index and includes approximately 1,000 of the largest securities based on a combination of their market capitalization and current index membership. The index represents approximately 92% of the total market capitalization of the Russell 3000® Index. |
| (d) | A widely recognized unmanaged market-weighted index comprised of investment-grade corporate bonds rated BBB or better, mortgages and U.S. Treasury and U.S. Government agency issues with at least one year to maturity. |
Performance Summary for the Period Ended December 31, 2019
| | | | | | | | | | | | | | | | | | | | | | | | | | | | |
| | | | | | Average Annual Total Returns(a) | |
| | | 6-Month
Total Returns (a) | | | | | | 1 Year | | | | | | 5 Years | | | | | | 10 Years | |
BlackRock Balanced Capital Portfolio | | | 6.37 | % | | | | | | | 22.06 | % | | | | | | | 8.26 | % | | | | | | | 9.67 | % |
60% Russell 1000®Index/40% Bloomberg Barclays U.S. Aggregate Bond Index | | | 7.33 | | | | | | | | 22.16 | | | | | | | | 8.25 | | | | | | | | 9.76 | |
Russell 1000®Index | | | 10.59 | | | | | | | | 31.43 | | | | | | | | 11.48 | | | | | | | | 13.54 | |
Bloomberg Barclays U.S. Aggregate Bond Index | | | 2.45 | | | | | | | | 8.72 | | | | | | | | 3.05 | | | | | | | | 3.75 | |
| (a) | Cumulative and average annual total returns are based on changes in net asset value for the periods shown and assume reinvestment of all distributions at net asset value on theex-dividend date. Insurance-related fees and expenses are not reflected in these returns. |
Past performance is not indicative of future results. Performance results do not reflect the deduction of taxes that a shareholder would pay on Fund distributions or the redemption of Fund shares.
Performance results may include adjustments made for financial reporting purposes in accordance with U.S. generally accepted accounting principles.
| | |
| 8 | | 2019 BLACKROCK ANNUAL REPORTTO SHAREHOLDERS |
| | |
| Fund Summary as of December 31, 2019 (continued) | | BlackRock Balanced Capital Portfolio |
Expense Example
| | | | | | | | | | | | | | | | | | | | | | | | | | | | | | | | | | | | | | | | |
| | | Actual | | | | | | Hypothetical (a) | |
| | | | | | | | | Including
Interest
Expense | | | Excluding
Interest
Expense | | | | | | | | | Including Interest Expense | | | Excluding Interest Expense | |
| | | Beginning
Account Value
(07/01/19) | | | Ending
Account Value
(12/31/19) | | | Expenses
Paid During
the Period (b) | | | Expenses
Paid During
the Period (c) | | | | | | Beginning
Account Value
(07/01/19) | | | Ending
Account Value
(12/31/19) | | | Expenses
Paid During
the Period (b) | | | Ending
Account Value
(12/31/19) | | | Expenses
Paid During
the Period (c) | |
BlackRock Balanced Capital Portfolio | | $ | 1,000.00 | | | $ | 1,063.70 | | | $ | 2.65 | | | $ | 2.55 | | | | | | | $ | 1,000.00 | | | $ | 1,022.63 | | | $ | 2.60 | | | $ | 1,022.74 | | | $ | 2.50 | |
| (a) | Hypothetical 5% annual return before expenses is calculated by prorating the number of days in the most recent fiscal half year divided by 365. |
| (b) | Expenses are equal to the annualized expense ratio (0.51%), multiplied by the average account value over the period, multiplied by 184/365 (to reflect theone-half year period shown). |
| (c) | Expenses are equal to the annualized expense ratio (0.49%), multiplied by the average account value over the period, multiplied by 184/365 (to reflect theone-half year period shown). |
| | See “Disclosure of Expenses” on page 24 for further information on how expenses were calculated. |
Portfolio Information
| | | | |
| PORTFOLIO COMPOSITION | |
| Asset Type | |
| Percent of
Total Investments |
(a) |
Common Stocks | | | 56 | % |
U.S. Government Sponsored Agency Securities | | | 17 | |
Corporate Bonds | | | 11 | |
U.S. Treasury Obligations | | | 7 | |
Asset-Backed Securities | | | 3 | |
Municipal Bonds | | | 2 | |
Non-Agency Mortgage-Backed Securities | | | 2 | |
Foreign Government Obligations | | | 1 | |
Investment Companies | | | 1 | |
Foreign Agency Obligations | | | — | (b) |
Capital Trusts | | | — | (b) |
Rights | | | — | (b) |
Other Interests | | | — | (b) |
| (a) | Total Investments exclude short-term securities, options purchased, options written, borrowed bonds and TBA sale commitments. |
| (b) | Represents less than 1% of the Fund’s total investments. |
| | |
| Fund Summary as of December 31, 2019 | | BlackRock Capital Appreciation Portfolio |
Investment Objective
BlackRock Capital Appreciation Portfolio’s (the “Fund”)investment objective is to seek long term growth of capital.
Portfolio Management Commentary
How did the Fund perform?
For the12-month period ended December 31, 2019, the Fund underperformed its benchmark, the Russell 1000® Growth Index, and outperformed the broad market S&P 500® Index. The following discussion of relative performance pertains to the Russell 1000® Growth Index.
What factors influenced performance?
Stock selection within the information technology (“IT”) and communication services sectors along with an overweight to health care were the largest detractors from relative performance for the period. In IT, an underweight to the technology hardware, storage and peripherals subsector, specifically to Apple Inc., hurt performance. Within communication services, selection among interactive media & services companies weighed on the Fund’s return, most notably anout-of-benchmark position in Chinese gaming and social media conglomerate Tencent Holdings Ltd. In the health care sector, overweight positions in managed care companies Centene Corp. and UnitedHealth Group, Inc. detracted.
Positive contributions to relative performance were led by stock selection within industrials, real estate and consumer discretionary. In industrials, selection in the professional services industry with an overweight to CoStar Group, Inc. drove Fund performance. In real estate, selection in REITs added to relative performance, highlighted by an overweight position in SBA Communications Corp. In consumer discretionary, selection in the internet & direct marketing retail industry proved advantageous, most notably anout-of-benchmark position in Argentinee-commerce company Mercado Libre, Inc.
Describe recent portfolio activity.
Due to a combination of portfolio trading activity, market movement and sector reclassifications during the12-month period, the Fund’s weighting in the IT sector increased, particularly within the IT services and the technology hardware, storage & peripherals industries. The Fund’s industrials exposure also increased, namely within professional services and aerospace & defense. Exposure to health care decreased, largely with respect to the health care providers & services segment. The Fund’s communication services exposure also decreased, namely holdings within the entertainment segment.
Describe portfolio positioning at period end.
As of period end, the Fund’s largest overweight relative to the Russell 1000® Growth Index was to the consumer discretionary sector, followed by materials. Consumer staples was the largest sector underweight, followed by IT.
The views expressed reflect the opinions of BlackRock as of the date of this report and are subject to change based on changes in market, economic or other conditions. These views are not intended to be a forecast of future events and are no guarantee of future results.
| | |
| 10 | | 2019 BLACKROCK ANNUAL REPORTTO SHAREHOLDERS |
| | |
| Fund Summary as of December 31, 2019 (continued) | | BlackRock Capital Appreciation Portfolio |
TOTAL RETURN BASED ON $10,000 INVESTMENT
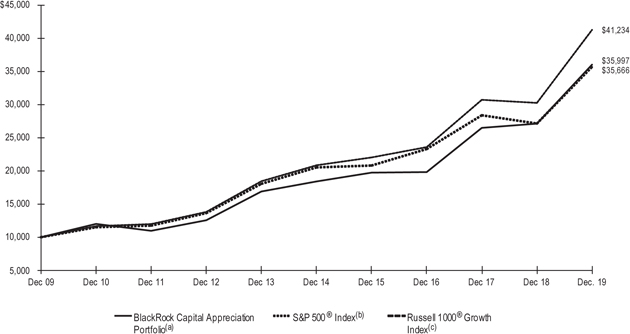
| (a) | Assuming transaction costs and other operating expenses, including investment advisory fees, if any. Does not include insurance-related fees and expenses. The Fund invests primarily in a diversified portfolio consisting primarily of common stock of U.S. companies that the investment adviser believes have exhibited above-average growth rates in earnings over the long term. |
| (b) | This unmanaged index covers 500 leading companies and captures approximately 80% coverage of available market capitalization. |
| (c) | This unmanaged index measures the performance of the large cap growth segment of the U.S. equity universe and consists of those Russell 1000® securities with higherprice-to-book ratios and higher forecasted growth values. |
Performance Summary for the Period Ended December 31, 2019
| | | | | | | | | | | | | | | | | | | | | | | | | | | | |
| | | | | | Average Annual Total Returns(a) | |
| | | 6-Month
Total Returns (a) | | | | | | 1 Year | | | | | | 5 Years | | | | | | 10 Years | |
BlackRock Capital Appreciation Portfolio | | | 6.97 | % | | | | | | | 32.79 | % | | | | | | | 14.37 | % | | | | | | | 13.66 | % |
S&P 500®Index | | | 10.92 | | | | | | | | 31.49 | | | | | | | | 11.70 | | | | | | | | 13.56 | |
Russell 1000®Growth Index | | | 12.27 | | | | | | | | 36.39 | | | | | | | | 14.63 | | | | | | | | 15.22 | |
| (a) | Cumulative and average annual total returns are based on changes in net asset value for the periods shown and assume reinvestment of all distributions at net asset value on theex-dividend date. Insurance-related fees and expenses are not reflected in these returns. |
Past performance is not indicative of future results. Performance results do not reflect the deduction of taxes that a shareholder would pay on Fund distributions or the redemption of Fund shares.
Performance results may include adjustments made for financial reporting purposes in accordance with U.S. generally accepted accounting principles.
| | |
| Fund Summary as of December 31, 2019 (continued) | | BlackRock Capital Appreciation Portfolio |
Expense Example
| | | | | | | | | | | | | | | | | | | | | | | | | | | | | | | | |
| | | Actual | | | | | | Hypothetical (a) | | | | |
| | | Beginning
Account Value
(07/01/19) | | | Ending
Account Value
(12/31/19) | | | Expenses
Paid During
the Period (b) | | | | | | Beginning
Account Value
(07/01/19) | | | Ending
Account Value
(12/31/19) | | | Expenses
Paid During
the Period (b) | | | Annualized
Expense
Ratio | |
BlackRock Capital Appreciation Portfolio | | $ | 1,000.00 | | | $ | 1,069.70 | | | $ | 2.45 | | | | | | | $ | 1,000.00 | | | $ | 1,022.84 | | | $ | 2.40 | | | | 0.47 | % |
| (a) | Hypothetical 5% annual return before expenses is calculated by prorating the number of days in the most recent fiscal half year divided by 365. |
| (b) | Expenses are equal to the Fund’s annualized expense ratio, multiplied by the average account value over the period, multiplied by 184/365 (to reflect theone-half year period shown). |
| | See “Disclosure of Expenses” on page 24 for further information on how expenses were calculated. |
Portfolio Information
| | | | |
| SECTOR ALLOCATION | |
| Sector | |
| Percent of
Net Assets |
|
Information Technology | | | 37 | % |
Consumer Discretionary | | | 17 | |
Health Care | | | 14 | |
Communication Services | | | 13 | |
Industrials | | | 8 | |
Financials | | | 4 | |
Materials | | | 3 | |
Real Estate | | | 2 | |
Consumer Staples | | | 1 | |
Short-Term Securities | | | 3 | |
Liabilities in Excess of Other Assets | | | (2 | ) |
For Fund compliance purposes, the Fund’s sector classifications refer to one or more of the sectorsub-classifications used by one or more widely recognized market indexes or ratings group indexes, and/or as defined by the investment adviser. These definitions may not apply for purposes of this report, which may combine such sectorsub-classifications for reporting ease.
| | |
| 12 | | 2019 BLACKROCK ANNUAL REPORTTO SHAREHOLDERS |
| | |
Fund Summary as of December 31, 2019 | | BlackRock Global Allocation Portfolio |
Investment Objective
BlackRock Global Allocation Portfolio’s (the “Fund”)investment objective is to seek high total investment return.
Portfolio Management Commentary
How did the Fund perform?
For the12-month period ended December 31, 2019, the Fund underperformed both its Reference Benchmark and the broad-basedall-equity benchmark, the FTSE World Index. The Reference Benchmark is comprised as follows: 36% S&P 500® Index; 24% FTSE World (ex U.S.) Index; 24% ICE BofAML Current5-Year U.S. Treasury Index; and 16% FTSENon-U.S. Dollar World Government Bond Index. The Fund invests in both equities and bonds, and therefore, Fund management believes that the Reference Benchmark provides a more accurate representation of the Fund’s composition and is a more comparable means for measurement. The following discussion of relative performance pertains to the Reference Benchmark. The following commentary (and referenced allocation percentages) are based on the economic exposures of the Fund, which reflect adjustments for futures, options and swaps, (except with respect to fixed income securities), and convertible bonds, and may vary relative to the market value.
What factors influenced performance?
Within equities, an underweight to and security selection within information technology (“IT”) weighed on the Fund’s return, as did security selection within and an overweight to industrials. Stock selection within consumer discretionary and health care also detracted. From a regional perspective, an overweight to Japan weighed on Fund performance. Within fixed income, exposure to select emerging market sovereign bonds negatively impacted the Fund. Exposure to cash and cash equivalents and exposure to gold-related securities also constrained performance.
Within equities, security selection within the communication services and materials sectors, as well as security selection within and underweights to financials and consumer staples, contributed to Fund performance. Stock selection within energy was also additive, although this was largely offset by an overweight to the sector. Portfolio positioning within fixed income, specifically management of duration (and corresponding interest rate sensitivity), positively impacted performance. An underweight to Japanese government bonds was also additive. Exposure to U.S. corporate credit, notably investment grade, also contributed to performance.
Describe recent portfolio activity.
During the period, the Fund’s overall equity allocation increased from 58% to 67% of net assets. Within equities, the Fund increased exposure to the United States and Europe, notably Germany, Italy and France, and decreased exposure to Japan. From a sector perspective, the Fund increased exposure to IT, industrials, consumer discretionary and financials, and decreased exposure to energy, communication services and consumer staples. The Fund’s allocation to fixed income decreased from 33% to 27% of net assets. Within fixed income, the Fund decreased exposure to government bonds and corporate credit. From a duration perspective, the Fund increased total portfolio duration from 1.2 years to 1.7 years. The Fund’s allocation to commodity-related securities remained unchanged at 2% of net assets.
Reflecting the changes in the Fund’s overall allocations to the equity, fixed income and commodity-related asset classes during the period, the Fund’s cash equivalents decreased from 7% to 4% of net assets. During the12-month period, cash helped mitigate portfolio volatility and served as a source of funds for new investments and redemptions.
Describe portfolio positioning at period end.
Relative to its Reference Benchmark, the Fund was overweight in equities and underweight in fixed income, with modest exposure to commodity-related securities and cash and cash equivalents. Within equities, the Fund was overweight in the United States and Asia, primarily China, and underweight in Europe, specifically the United Kingdom and Switzerland. From a sector perspective, the Fund was overweight in health care, communication services and consumer discretionary, and underweight in consumer staples, financials and real estate. Within fixed income, the Fund was underweight in developed market government bonds and overweight in corporate bonds. With respect to currency exposure, the Fund was overweight in the Hong Kong dollar and Indian rupee, and underweight in the U.S. dollar and British pound sterling.
The views expressed reflect the opinions of BlackRock as of the date of this report and are subject to change based on changes in market, economic or other conditions. These views are not intended to be a forecast of future events and are no guarantee of future results.
| | |
| Fund Summary as of December 31, 2019 (continued) | | BlackRock Global Allocation Portfolio |
TOTAL RETURN BASED ON A $10,000 INVESTMENT
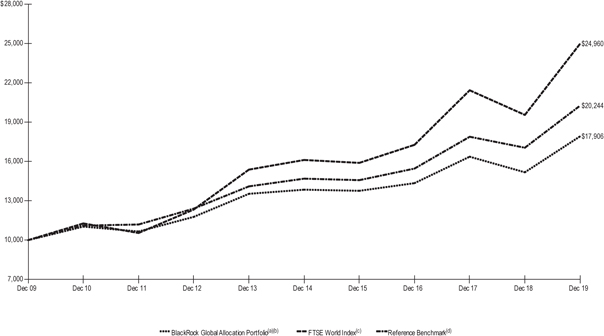
| (a) | Assuming transaction costs, if any, and other operating expenses, including investment advisory fees. Does not include insurance-related fees and expenses. |
| (b) | The Fund invests in a portfolio of U.S. and foreign equity securities, debt and money market securities, the combination of which will be varied from time to time with respect to types of securities and markets in response to changing markets and economic trends. |
| (c) | A market cap weighted index representing the performance of the large andmid-cap stocks from the developed and advanced emerging countries within the FTSE Global Equity Index Series. |
| (d) | An unmanaged weighted index comprised as follows: 36% S&P 500® Index; 24% FTSE World (ex U.S.) Index; 24% ICE BofAML Current5-Year U.S. Treasury Index; and 16% FTSENon-U.S. Dollar World Government Bond Index. |
Performance Summary for the Period Ended December 31, 2019
| | | | | | | | | | | | | | | | | | | | | | | | | | | | |
| | | | | | | | | | | | Average Annual Total Returns(a) | |
| | | 6-Month
Total Returns (a) | | | | | | | | | 1 Year | | | | | | 5 Years | | | 10 Years | |
BlackRock Global Allocation Portfolio | | | 6.50 | % | | | | | | | | | | | 18.05 | % | | | | | | | 5.28 | % | | | 6.00 | % |
FTSE World Index | | | 9.52 | | | | | | | | | | | | 27.74 | | | | | | | | 9.16 | | | | 9.58 | |
Reference Benchmark | | | 5.98 | | | | | | | | | | | | 18.79 | | | | | | | | 6.63 | | | | 7.31 | |
U.S. Stocks: S&P 500 Index(b) | | | 10.92 | | | | | | | | | | | | 31.49 | | | | | | | | 11.70 | | | | 13.56 | |
Non U.S. Stocks: FTSE World(ex-U.S.) Index(c) | | | 7.60 | | | | | | | | | | | | 22.63 | | | | | | | | 6.09 | | | | 5.61 | |
U.S. Bonds: ICE BofAML Current5-Year U.S. Treasury Index(d) | | | 1.12 | | | | | | | | | | | | 5.91 | | | | | | | | 2.00 | | | | 2.83 | |
Non U.S. Bonds: FTSE Non U.S. Dollar World Government Bond Index(e) | | | (0.18 | ) | | | | | | | | | | | 5.32 | | | | | | | | 1.87 | | | | 1.36 | |
| (a) | Cumulative and average annual total returns are based on changes in net asset value for the periods shown and assume reinvestment of all distributions at net asset value on theex-dividend date. Insurance-related fees and expenses are not reflected in these returns. |
| (b) | An unmanaged index that covers 500 leading companies and captures approximately 80% coverage of available market capitalization. |
| (c) | A market cap weighted index representing the performance of the large andmid-cap stocks from the developed and advanced emerging countries excluding the U.S. within the FTSE Global Equity Index Series. |
| (d) | An unmanaged index designed to track the total return of the current couponfive-year U.S. Treasury bond. |
| (e) | An unmanaged market capitalization-weighted index that tracks 22 government bond indexes, excluding the United States. |
| | Past performance is not indicative of future results. Performance results do not reflect the deduction of taxes that a shareholder would pay on Fund distributions or the redemption of Fund shares. |
| | Performance results may include adjustments made for financial reporting purposes in accordance with U.S. generally accepted accounting principles. |
| | |
| 14 | | 2019 BLACKROCK ANNUAL REPORTTO SHAREHOLDERS |
| | |
| Fund Summary as of December 31, 2019 (continued) | | BlackRock Global Allocation Portfolio |
Expense Example
| | | | | | | | | | | | | | | | | | | | | | | | | | | | | | | | | | | | | | | | |
| | | Actual | | | | | | Hypothetical (a) | |
| | | | | | | | | Including
dividend
expense | | | Excluding
dividend
expense | | | | | | | | | Including dividend expense | | | Excluding dividend expense | |
| | | Beginning
Account Value
(07/01/19) | | | Ending
Account Value
(12/31/19) | | | Expenses
Paid During
the Period (b) | | | Expenses
Paid During
the Period (c) | | | | | | Beginning
Account Value
(07/01/19) | | | Ending
Account Value
(12/31/19) | | | Expenses
Paid During
the Period (b) | | | Ending
Account Value
(12/31/19) | | | Expenses
Paid During
the Period (c) | |
BlackRock Global Allocation Portfolio | | $ | 1,000.00 | | | $ | 1,065.00 | | | $ | 2.97 | | | $ | 2.97 | | | | | | | $ | 1,000.00 | | | $ | 1,022.33 | | | $ | 2.91 | | | $ | 1,022.33 | | | $ | 2.91 | |
| (a) | Hypothetical 5% annual return before expenses is calculated by prorating the number of days in the most recent fiscal half year divided by 365. |
| (b) | Expenses are equal to the annualized expense ratio (0.57%), multiplied by the average account value over the period, multiplied by 184/365 (to reflect theone-half year period shown). |
| (c) | Expenses are equal to the annualized expense ratio (0.57%), multiplied by the average account value over the period, multiplied by 184/365 (to reflect theone-half year period shown). |
| | See “Disclosure of Expenses” on page 24 for further information on how expenses were calculated. |
Overall Asset Exposure
| | | | | | | | | | | | |
| | | Percent of Fund’s
Net Assets (a) | | | Reference
Benchmark (b)
Percentages | |
| | | 12/31/2019 | | | 12/31/2018 | |
U.S. Equities | | | 43 | % | | | 31 | % | | | 35 | % |
European Equities | | | 12 | | | | 9 | | | | 12 | |
Asia Pacific Equities | | | 11 | | | | 15 | | | | 10 | |
Other Equities | | | 1 | | | | 3 | | | | 3 | |
| | | | | | | | | | | | |
Total Equities | | | 67 | | | | 58 | | | | 60 | |
| | | | | | | | | | | | |
U.S. Dollar Denominated Fixed Income Securities | | | 19 | | | | 31 | | | | 24 | |
U.S. Issuers | | | 18 | | | | 29 | | | | — | |
Non-U.S. Issuers | | | 1 | | | | 2 | | | | — | |
Non-U.S. Dollar Denominated Fixed Income Securities | | | 8 | | | | 2 | | | | 16 | |
| | | | | | | | | | | | |
Total Fixed Income Securities | | | 27 | | | | 33 | | | | 40 | |
| | | | | | | | | | | | |
Commodity-Related | | | 2 | | | | 2 | | | | — | |
| | | | | | | | | | | | |
Cash & Short-Term Securities | | | 4 | | | | 7 | | | | — | |
| | | | | | | | | | | | |
| (a) | Exposure based on market value and adjusted for the economic value of futures, swaps, and options (except with respect to fixed income securities), and convertible bonds. |
| (b) | The Reference Benchmark is an unmanaged weighted index comprised as follows: 36% S&P 500 Index®; 24% FTSE World (ex U.S.) Index; 24% ICE BofAML Current5-Year U.S. Treasury Index; and 16% FTSENon-U.S. Dollar World Government Bond Index. Descriptions of these indexes are found on page 13 of this report to shareholders in the “Performance Summary” section. |
| | |
| Money Market Overview For the 12-Month Period Ended December 31, 2019 | | BlackRock Government Money Market Portfolio |
2019 is officially in the books-as the year progressed, investors witnessed a pivot from the Fed hiking rates in 2018 to delivering 0.25% cuts in July, September and October to the Federal Funds target rate, which ended the year in a range of 1.50% — 1.75%. Prompting these cuts, in our view, were concerns about slowing global growth amid uncertainties associated with geopolitical events, including U.S.-China trade tensions, and muted inflation. We believe such concerns were also reflected in the slope of the U.S. Treasury yield curve between three months and 10 years, which was periodically inverted during 2019. However, even as the U.S. economy began to exhibit signs of softness, a strong labor market and rising consumer spending helped keep the economic expansion intact, with the support of the Fed’s more accommodative policy. The future path for the Federal Funds rate looks to be stable for the foreseeable future as the Fed has acknowledged, in our opinion, a relatively high bar for further policy action.
Another notable event this year was the bout of temporary excessive volatility in the repurchase agreement (“repo”) market in mid-September, which was due in part to a prior contraction in excess reserves in the banking system and outsized deposit flow activity related to corporate tax payments and the settlement of Treasury obligations. This situation prompted the Fed to inject a substantial amount of liquidity into the financial system during the balance of the year. Specifically, the Fed conducted regular overnight and term repo operations (known as temporary open market operations), and also began purchasing Treasury bills beginning at a rate of $60 billion per month in order to support the flow of funds and help maintain control over short-term interest rates. The dislocations in the repo market highlighted, in our opinion, the need for the Fed to determine the appropriate level of excess reserves in the post financial crisis regulatory environment.
In July, the U.S. debt ceiling was again suspended, and net new Treasury bill issuance exceeded $250 billion in 2019. That said, the expanded footprint by the Fed in the Treasury bill market, in our view, contributed to a reduction in investable supply available to the public and, in part, caused a contraction in the relative value of such instruments during the latter part of the year.
Another important development in 2019 included the government-sponsored agencies, having been guided by regulatory agencies, issuing floating rate notes indexed to the Secured Overnight Financing Rate (“SOFR”), a broad measure of the cost of borrowing cash overnight collateralized by Treasury securities, and the reference rate generally expected to replace the London Interbank Offered Rate (“LIBOR”). In addition to the agency notes referenced to SOFR, some large financial institutions also issued certificates of deposit and commercial paper linked to this index, and demand for such obligations was generally strong. Sticking on the topic of demand, asset flows into money market mutual funds and short duration bond funds were strong while primary market investment grade issuance was reportedly down rather markedly. This technical backdrop supported spreads in credit instruments during the year, and we believe this dynamic should continue to play out in 2020. Similar to 2018, we witnessed seasonal spread widening of the three-month LIBOR overnight-indexed swap spread, a general proxy for bank funding stress. In our opinion, issuers appeared willing to pay up in terms of additional yield spread to secure their funding needs over stress periods such as corporate tax payment days and balance sheet reporting dates, including most importantly year end, as investors paid close attention to the funding markets for clues to monetary system pressures.
With the market pricing in little action for further interest rate cuts, the Fed providing liquidity to the market during stress periods, assets continuing to flow into money market funds, and tentative optimism over the near-term outlook for global trade, we consider 2019 historic in many ways.
Looking ahead, as of the end of December, futures contracts were priced for less than one rate cut during 2020, with recent Fed comments reinforcing that policy is in a good place. We believe this market pricing to be slightly overdone, and we do not expect a further cut to the federal funds rate at this time–barring any adverse economic events.
In our opinion, we expect publicly available investable Treasury bill supply will remain negative into the first few months of 2020 as the Fed is expected to remain an active buyer of Treasury bills and potentially Treasury coupons in 2020. We also expect that investment grade corporate bond issuance will be flat to down for the year ahead as issuers may have already taken advantage of a flat-to-inverted yield curve in 2019. Finally, we look for the three-month LIBOR overnight-indexed swap spread to return to the historical average range of around 0.19% — 0.25% as credit instruments, in our view, appear more attractive relative to short-dated Treasuries. Furthermore, we expect LIBOR to reset lower over the turn of the new year.
Past performance is no guarantee of future results. Index performance is shown for illustrative purposes only. You cannot invest directly in an index.
| | |
| 16 | | 2019 BLACKROCK ANNUAL REPORTTO SHAREHOLDERS |
| | |
| Fund Summary as of December 31, 2019 | | BlackRock Government Money Market Portfolio |
Investment Objective
BlackRock Government Money Market Portfolio’s (the “Fund”)investment objective is to seek to preserve capital, to maintain liquidity and achieve the highest possible current income consistent with the foregoing.
Portfolio Information
PORTFOLIO COMPOSITION
| | | | |
| Asset Type | | Percent of
Net Assets | |
U.S. Government Sponsored Agency Obligations | | | 49 | % |
Repurchase Agreements | | | 31 | |
U.S. Treasury Obligations | | | 17 | |
Other Assets Less Liabilities | | | 3 | |
CURRENT SEVEN-DAY YIELDS
| | | | | | | | |
| | | 7-Day
SEC Yield | | | 7-Day
Yield | |
BlackRock Government
Money Market Portfolio | | | 1.21 | % | | | 1.21 | % |
The7-Day SEC Yield may differ from the7-Day Yield shown above due to the fact that the7-Day SEC Yield excludes distributed capital gains.
Past performance is not indicative of future results.
Expense Example
| | | | | | | | | | | | | | | | | | | | | | | | | | | | | | | | |
| | | Actual | | | | | | Hypothetical (a) | |
| | | Beginning
Account Value
(07/01/19) | | | Ending
Account Value
(12/31/19) | | | Expenses
Paid During
the Period (b) | | | | | | Beginning
Account Value
(07/01/19) | | | Ending
Account Value
(12/31/19) | | | Expenses
Paid During
the Period (b) | | | Annualized
Expense
Ratio | |
BlackRock Government Money Market Portfolio | | $ | 1,000.00 | | | $ | 1,007.90 | | | $ | 2.48 | | | | | | | $ | 1,000.00 | | | $ | 1,022.74 | | | $ | 2.50 | | | | 0.49 | % |
| (a) | Hypothetical 5% annual return before expenses is calculated by prorating the number of days in the most recent fiscal half year divided by 365. |
| (b) | Expenses are equal to the Fund’s annualized expense ratio, multiplied by the average account value over the period, multiplied by 184/365 (to reflect theone-half year period shown). |
| | See “Disclosure of Expenses” on page 24 for further information on how expenses were calculated. |
| | |
| Fund Summary as of December 31, 2019 | | BlackRock High Yield Portfolio |
Investment Objective
BlackRock High Yield Portfolio’s (the “Fund”)investment objective is to seek to maximize total return, consistent with income generation and prudent investment management.
Portfolio Management Commentary
How did the Fund perform?
For the12-month period ended December 31, 2019, the Fund outperformed the benchmark, the Bloomberg Barclays U.S. Corporate High Yield 2% Issuer Capped Index.
What factors influenced performance?
High yield bonds performed very well in 2019, as steady economic growth and supportive Fed policy boosted investors’ willingness to search for income in the higher-risk segments of the bond market.
Security selection, particularly in the technology, independent energy, and pharmaceutical industries, was a key contributor to the Fund’s relative performance. Credits rated B were the largest contributors by rating, followed by strong security selection within the CCC rated segment.
The Fund’s underweight positions in the retail, consumer products, and home construction industries were the largest detractors at the sector level. An underweight in BB rated securities also detracted, as this high-quality market segment outperformed in 2019. From an asset allocation perspective, an out-of-benchmark position in floating rate loan interests (“bank loans”)—which underperformed high yield bonds—detracted from relative performance.
The Fund may invest in credit default swaps (“CDS”), index credit default swaps (“CDX”) and currency forward contracts. The Fund intermittently employs currency forwards to manage the currency risk ofnon-dollar denominated bonds, and it uses CDS and CDX to manage risk, express credit views and put capital to work in moving markets. On occasion, the Fund may use equity index futures to manage the risk of financial-market volatility. In combination, these positions had a positive impact on performance for the Fund’s annual period.
Describe recent portfolio activity.
While the Fund’s key investment themes remained broadly consistent, the investment adviser sought to adjust sector- and issuer-level positioning to take advantage of market opportunities. Overall, the Fund continued to favor a measured approach to risk taking.
The Fund maintained an allocation to bank loans, although the investment adviser reduced this position to capitalize on more compelling relative value opportunities in high yield. At the sector level, the Fund decreased its allocation to energy issues during the year.
Describe portfolio positioning at period end.
The Fund was overweight in B rated issues, while underweight in BBs and overweight in select CCCs. The investment adviser’s criteria for owning CCC bonds included the potential for near-term rating upgrade and a specific catalyst for price appreciation.
In addition to holding a core position in high yield bonds and a tactical allocation to loans, the Fund maintained a smaller weighting in common stocks. The Fund’s leading sector overweights were in technology, aerospace & defense, and banking, while midstream energy and consumer cyclicals (primarily retail and home construction) were the largest underweights.
The views expressed reflect the opinions of BlackRock as of the date of this report and are subject to change based on changes in market, economic or other conditions. These views are not intended to be a forecast of future events and are no guarantee of future results.
| | |
| 18 | | 2019 BLACKROCK ANNUAL REPORTTO SHAREHOLDERS |
| | |
| Fund Summary as of December 31, 2019 (continued) | | BlackRock High Yield Portfolio |
TOTAL RETURN BASED ON A $10,000 INVESTMENT
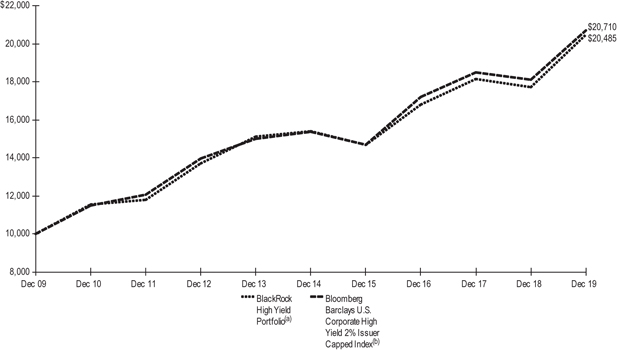
| (a) | Assuming transaction costs and other operating expenses, including investment advisory fees, if any. Does not include insurance-related fees and expenses. The Fund invests primarily innon-investment grade bonds with maturities of ten years or less. On September 17, 2018, the Fund acquired all of the assets, subject to the liabilities, of BlackRock High Yield Portfolio (the “Predecessor Fund”), a series of BlackRock Series Fund, Inc., through a tax-free reorganization (the “Reorganization”). The Predecessor Fund is the performance and accounting survivor of the Reorganization. The Fund’s total returns prior to October 1, 2011 are the returns of the Predecessor Fund when it followed a different investment objective and different investment strategies under the name “BlackRock High Income Portfolio”. |
| (b) | This unmanaged index is comprised of issues that meet the following criteria: at least $150 million par value outstanding; maximum credit rating of Ba1; at least one year to maturity; and no issuer represents more than 2% of the index. |
Performance Summary for the Period Ended December 31, 2019
| | | | | | | | | | | | | | | | | | | | | | | | | | | | |
| | | | | | | | | | | | | | | Average Annual Total Returns(a) | |
| | | Standardized
30-Day Yield (b)
| | | Unsubsidized
30-Day Yield (b) | | | 6-Month
Total Returns (a) | | | | | | 1 Year | | | 5 Years | | | 10 Years | |
BlackRock High Yield Portfolio | | | 4.89 | % | | | 4.46 | % | | | 4.59 | % | | | | | | | 15.04 | % | | | 5.77 | % | | | 7.43 | % |
Bloomberg Barclays U.S. Corporate High Yield 2% Issuer Capped Index | | | — | | | | — | | | | 3.98 | | | | | | | | 14.32 | | | | 6.14 | | | | 7.55 | |
| (a) | Cumulative and average annual total returns are based on changes in net asset value for the periods shown and assume reinvestment of all distributions at net asset value on theex-dividend/ payable date. Insurance-related fees and expenses are not reflected in these returns. On September 17, 2018, the Fund acquired all of the assets, subject to the liabilities, of BlackRock High Yield Portfolio (the “Predecessor Fund”), a series of BlackRock Series Fund, Inc., through a tax-free reorganization (the “Reorganization”). The Predecessor Fund is the performance and accounting survivor of the Reorganization. The Fund’s total returns prior to October 1, 2011 are the returns of the Predecessor Fund when it followed a different investment objective and different investment strategies under the name “BlackRock High Income Portfolio”. |
| (b) | The standardized30-day yield includes the effects of any waivers and/or reimbursements. The unsubsidized30-day yield excludes the effects of any waivers and/or reimbursements. |
| | Past performance is not indicative of future results. Performance results do not reflect the deduction of taxes that a shareholder would pay on Fund distributions or the redemption of Fund shares. |
| | Performance results may include adjustments made for financial reporting purposes in accordance with U.S. generally accepted accounting principles. |
| | |
| Fund Summary as of December 31, 2019 (continued) | | BlackRock High Yield Portfolio |
Expense Example
| | | | | | | | | | | | | | | | | | | | | | | | | | | | | | | | |
| | | Actual | | | | | | Hypothetical(a) | | | | |
| | | Beginning
Account Value
(07/01/19) | | | Ending
Account Value
(12/31/19) | | | Expenses
Paid During
the Period (b) | | | | | | Beginning
Account Value
(07/01/19) | | | Ending
Account Value
(12/31/19) | | | Expenses
Paid During
the Period (b) | | | Annualized
Expense
Ratio | |
BlackRock High Yield Portfolio | | $ | 1,000.00 | | | $ | 1,045.90 | | | $ | 2.58 | | | | | | | $ | 1,000.00 | | | $ | 1,022.68 | | | $ | 2.55 | | | | 0.50 | % |
| (a) | Hypothetical 5% annual return before expenses is calculated by prorating the number of days in the most recent fiscal half year divided by 365. |
| (b) | Expenses are equal to the Fund’s annualized expense ratio, multiplied by the average account value over the period, multiplied by 184/365 (to reflect theone-half year period shown). |
| | See “Disclosure of Expenses” on page 24 for further information on how expenses were calculated. |
Portfolio Information
CREDIT QUALITY ALLOCATION
| | | | |
| Credit Rating (a) | |
| Percent of
Total Investments |
(b) |
BBB/Baa | | | 7 | % |
BB/Ba | | | 41 | |
B | | | 41 | |
CCC/Caa | | | 10 | |
NR | | | 1 | |
| (a) | For financial reporting purposes, credit quality ratings shown above reflect the highest rating assigned by either S&P Global Ratings or Moody’s Investors Service if ratings differ. These rating agencies are independent, nationally recognized statistical rating organizations and are widely used. Investment grade ratings are credit ratings of BBB/ Baa or higher. Below investment grade ratings are credit ratings of BB/Ba or lower. Investments designated NR are not rated by either rating agency. Unrated investments do not necessarily indicate low credit quality. Credit quality ratings are subject to change. |
| (b) | Total Investments exclude short-term securities, options purchased and options written. |
| | |
| 20 | | 2019 BLACKROCK ANNUAL REPORTTO SHAREHOLDERS |
| | |
| Fund Summary as of December 31, 2019 | | BlackRock U.S. Government Bond Portfolio |
Investment Objective
BlackRock U.S. Government Bond Portfolio’s (the “Fund”)investment objective is to seek to maximize total return, consistent with income generation and prudent investment management.
Portfolio Management Commentary
How did the Fund perform?
For the12-month period ended December 31, 2019, the Fund outperformed its benchmark, the Bloomberg Barclays U.S. Government/Mortgage Index.
What factors influenced performance?
Positive contributors to performance relative to the benchmark included the Fund’s stance with respect to U.S. interest rates. Specifically, an above-benchmark stance with respect to duration (and corresponding interest rate sensitivity) aided the Fund’s return as Treasury yields declined. Within securitized sectors, an allocation to commercial mortgage-backed securities (“CMBS”) contributed positively to performance, as the segment continued to benefit from favorable fundamentals. In addition, the Fund’s exposure to inflation-protected securities and security selection with30-year agency mortgage-backed securities (“MBS”) proved beneficial.
Detractors from the Fund’s performance relative to the benchmark included the use of swap and swaption strategies to gain tactical interest rate exposures. Positioning with respect to global interest rates and currencies also weighed on the Fund’s return.
Describe recent portfolio activity.
During the reporting period, the Fund’s underweight position to agency MBS was shifted to an overweight as valuations became attractive and the investment adviser’s fundamental outlook remained positive. The Fund maintained an overweight allocation to CMBS overall while trimming exposure to agency CMBS. The Fund shifted from an underweight stance with respect to duration to a duration overweight relative to the benchmark.
The Fund had a modestly elevated cash position at period end due to the investment adviser increasing a preference for using forward contracts to gain MBS exposure as opposed to holding cash bonds. The Fund’s cash position did not have a material impact on performance over the 12 months.
Describe portfolio positioning at period end.
The Fund was overweight in agency MBS relative to the benchmark, with exposures continuing to favor higher coupons relative to lower coupons, given valuations that appeared attractive relative to the underlying fundamentals. The Fund continued to hold a core allocation to CMBS and agency collateralized mortgage obligations for carry (incremental income). The Fund was slightly overweight in duration at the headline level, favoring the front end of the yield curve. The Fund had meaningful exposure to U.S. inflation on the view that the market is underpricing a potential pickup in realized inflation data. Outside the United States, the Fund was marginally positioned on the long end of the yield curve in German, Italian and Canadian interest rates, and positioned short to U.K. rates. Additionally, the Fund had an allocation to local currency emerging market sovereign debt in Asia, Latin America and Central Europe.
The views expressed reflect the opinions of BlackRock as of the date of this report and are subject to change based on changes in market, economic or other conditions. These views are not intended to be a forecast of future events and are no guarantee of future results.
Portfolio Information
PORTFOLIO COMPOSITION
| | | | |
Asset Type | |
| Percent of
Total Investments |
(a) |
U.S. Government Sponsored Agency Securities | | | 51 | % |
U.S. Treasury Obligations | | | 42 | |
Non-Agency Mortgage-Backed Securities | | | 5 | |
Asset-Backed Securities | | | 2 | |
Foreign Government Obligations | | | — (b) | |
| (a) | Total Investments exclude short-term securities, options purchased, options written and TBA sale commitments. |
| (b) | Represents less than 1% of the Fund’s total investments. |
| | |
| Fund Summary as of December 31, 2019 (continued) | | BlackRock U.S. Government Bond Portfolio |
TOTAL RETURN BASED ON A $10,000 INVESTMENT
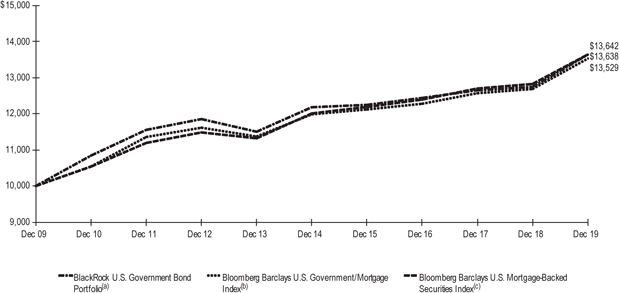
| (a) | Assuming transaction costs and other operating expenses, including investment advisory fees, if any. Does not include insurance-related fees and expenses. The Fund, under normal circumstances, will invest at least 80% of its assets in bonds that are issued or guaranteed by the U.S. Government and its agencies. On September 17, 2018, the Fund acquired all of the assets, subject to the liabilities, of BlackRock U.S. Government Bond Portfolio (the “Predecessor Fund”), a series of BlackRock Series Fund, Inc., through a tax-free reorganization (the “Reorganization”). The Predecessor Fund is the performance and accounting survivor of the Reorganization. The Predecessor Fund’s total returns prior to October 1, 2011 are the returns of the Fund when it followed a different investment objective and different investment strategies under the name “BlackRock Government Income Portfolio.” |
| (b) | This index measures debt issued by the U.S. Government, and its agencies, as well as mortgage-backed pass-through securities of Ginnie Mae, Fannie Mae and Freddie Mac. |
| (c) | This unmanaged index includes the mortgage-backed pass-through securities of Ginnie Mae, Fannie Mae and Freddie Mac that meet certain maturity and liquidity criteria. |
Performance Summary for the Period Ended December 31, 2019
| | | | | | | | | | | | | | | | | | | | | | | | | | | | | | | | | | | | |
| | | | | | | | | | | | | | | Average Annual Total Returns (a) | |
| | | Standardized
30-Day Yield (b) | | | Unsubsidized
30-Day Yield (b) | | | 6-Month
Total Returns (a) | | | | | | 1 Year | | | | | | 5 Years | | | | | | 10 Years | |
BlackRock U.S. Government Bond Portfolio | | | 2.26 | % | | | 1.70 | % | | | 1.74 | % | | | | | | | 6.78 | % | | | | | | | 2.25 | % | | | | | | | 3.15 | % |
Bloomberg Barclays U.S. Government/Mortgage Index | | | — | | | | — | | | | 1.79 | | | | | | | | 6.63 | | | | | | | | 2.45 | | | | | | | | 3.07 | |
Bloomberg Barclays U.S. Mortgage-Backed Securities Index | | | — | | | | — | | | | 2.09 | | | | | | | | 6.35 | | | | | | | | 2.58 | | | | | | | | 3.15 | |
| (a) | Cumulative and average annual total returns are based on changes in net asset value for the periods shown and assume reinvestment of all distributions at net asset value on theex-dividend/ payable date. Insurance-related fees and expenses are not reflected in these returns. On September 17, 2018, the Fund acquired all of the assets, subject to the liabilities, of BlackRock U.S. Government Bond Portfolio (the “Predecessor Fund”), a series of BlackRock Series Fund, Inc., through a tax-free reorganization (the “Reorganization”). The Predecessor Fund is the performance and accounting survivor of the Reorganization. The Predecessor Fund’s total returns prior to October 1, 2011 are the returns of the Fund when it followed a different investment objective and different investment strategies under the name “BlackRock Government Income Portfolio.” |
| (b) | The standardized30-day yield includes the effects of any waivers and/or reimbursements. The unsubsidized30-day yield excludes the effects of any waivers and/or reimbursements. |
| | Past performance is not indicative of future results. Performance results do not reflect the deduction of taxes that a shareholder would pay on Fund distributions or the redemption of Fund shares. |
| | Performance results may include adjustments made for financial reporting purposes in accordance with U.S. generally accepted accounting principles. |
| | |
| 22 | | 2019 BLACKROCK ANNUAL REPORTTO SHAREHOLDERS |
| | |
| Fund Summary as of December 31, 2019 (continued) | | BlackRock U.S. Government Bond Portfolio |
Expense Example
| | | | | | | | | | | | | | | | | | | | | | | | | | | | | | | | | | | | | | | | | | | | |
| | | Actual | | | | | | Hypothetical(a) | |
| | | | | | | | | Including
Interest
Expense | | | Excluding
Interest
Expense | | | | | | | | | | | | Including Interest Expense | | | Excluding Interest Expense | |
| | | Beginning
Account Value
(07/01/19) | | | Ending
Account Value
(12/31/19) | | | Expenses
Paid During
the Period (b) | | | Expenses
Paid During
the Period (c) | | | | | | Beginning
Account Value
(07/01/19) | | | | | | Ending
Account Value
(12/31/19) | | | Expenses
Paid During
the Period (b) | | | Ending
Account Value
(12/31/19) | | | Expenses
Paid During
the Period (c) | |
BlackRock U.S. Government Bond Portfolio | | $ | 1,000.00 | | | $ | 1,017.40 | | | $ | 4.73 | | | $ | 2.54 | | | | | | | $ | 1,000.00 | | | | | | | $ | 1,020.52 | | | $ | 4.74 | | | $ | 1,022.68 | | | $ | 2.55 | |
| (a) | Hypothetical 5% annual return before expenses is calculated by prorating the number of days in the most recent fiscal half year divided by 365. |
| (b) | Expenses are equal to the annualized expense ratio (0.93%), multiplied by the average account value over the period, multiplied by 184/365 (to reflect theone-half year period shown). |
| (c) | Expenses are equal to the annualized expense ratio (0.50%), multiplied by the average account value over the period, multiplied by 184/365 (to reflect theone-half year period shown). |
See “Disclosure of Expenses” on page 24 for further information on how expenses were calculated.
The Benefits and Risks of Leveraging
The Funds may utilize leverage to seek to enhance returns and net asset value (“NAV”). However, there is no guarantee that these objectives can be achieved in all interest rate environments.
The Funds may utilize leverage by entering into reverse repurchase agreements.
In general, the concept of leveraging is based on the premise that the financing cost of leverage, which is based on short-term interest rates, is normally lower than the income earned by each Fund on its longer-term portfolio investments purchased with the proceeds from leverage. To the extent that the total assets of each Fund (including the assets obtained from leverage) are invested in higher-yielding portfolio investments, the Funds’ shareholders benefit from the incremental net income.
The interest earned on securities purchased with the proceeds from leverage is distributed to the Funds’ shareholders, and the value of these portfolio holdings is reflected in the Funds’ per share NAV. However, in order to benefit shareholders, the return on assets purchased with leverage proceeds must exceed the ongoing costs associated with the leverage. If interest and other ongoing costs of leverage exceed a Fund’s return on assets purchased with leverage proceeds, income to shareholders is lower than if the Funds had not used leverage.
Furthermore, the value of each Fund’s portfolio investments generally varies inversely with the direction of long-term interest rates, although other factors can also influence the value of portfolio investments. As a result, changes in interest rates can influence each Fund’s NAV positively or negatively in addition to the impact on each Fund’s performance from leverage. Changes in the direction of interest rates are difficult to predict accurately, and there is no assurance that a Fund’s leveraging strategy will be successful.
The use of leverage also generally causes greater changes in each Fund’s NAV and dividend rates than comparable portfolios without leverage. In a declining market, leverage is likely to cause a greater decline in the NAV of a Fund’s shares than if the Fund were not leveraged. In addition, each Fund may be required to sell portfolio securities at inopportune times or at distressed values in order to comply with regulatory requirements applicable to the use of leverage or as required by the terms of the leverage instruments, which may cause the Fund to incur losses. The use of leverage may limit a Fund’s ability to invest in certain types of securities or use certain types of hedging strategies. Each Fund incurs expenses in connection with the use of leverage, all of which are borne by each Fund’s shareholders and may reduce income.
Disclosure of Expenses
Shareholders of the Funds may incur the following charges: (a) transactional expenses; and (b) operating expenses, including investment advisory fees, service and distribution fees, including12b-1 fees, acquired fund fees and expenses, and other fund expenses. The expense examples on the previous pages (which are based on a hypothetical investment of $1,000 invested on July 1, 2019 and held through December 31, 2019) are intended to assist shareholders both in calculating expenses based on an investment in each Fund and in comparing these expenses with similar costs of investing in other mutual funds.
The expense examples provide information about actual account values and actual expenses. In order to estimate the expenses a shareholder paid during the period covered by this report, shareholders can divide their account value by $1,000 and then multiply the result by the number corresponding to their Fund under the heading entitled “Expenses Paid During the Period.”
The expense examples also provide information about hypothetical account values and hypothetical expenses based on a Fund’s actual expense ratio and an assumed rate of return of 5% per year before expenses. In order to assist shareholders in comparing the ongoing expenses of investing in these Funds and other funds, compare the 5% hypothetical examples with the 5% hypothetical examples that appear in shareholder reports of other funds.
The expenses shown in the expense examples are intended to highlight shareholders’ ongoing costs only and do not reflect transactional expenses, such as sales charges, if any. Therefore, the hypothetical examples are useful in comparing ongoing expenses only, and will not help shareholders determine the relative total expenses of owning different funds. If these transactional expenses were included, shareholder expenses would have been higher.
Derivative Financial Instruments
The Funds may invest in various derivative financial instruments. These instruments are used to obtain exposure to a security, commodity, index, market, and/or other assets without owning or taking physical custody of securities, commodities and/or other referenced assets or to manage market, equity, credit, interest rate, foreign currency exchange rate, commodity and/or other risks. Derivative financial instruments may give rise to a form of economic leverage and involve risks, including the imperfect correlation between the value of a derivative financial instrument and the underlying asset, possible default of the counterparty to the transaction or illiquidity of the instrument. The Funds’ successful use of a derivative financial instrument depends on the investment adviser’s ability to predict pertinent market movements accurately, which cannot be assured. The use of these instruments may result in losses greater than if they had not been used, may limit the amount of appreciation a Fund can realize on an investment and/or may result in lower distributions paid to shareholders. The Funds’ investments in these instruments, if any, are discussed in detail in the Notes to Financial Statements.
| | |
| 24 | | 2019 BLACKROCK ANNUAL REPORTTO SHAREHOLDERS |
| | |
Schedule of Investments December 31, 2019 | | BlackRock Advantage Large Cap Core Portfolio (Percentages shown are based on Net Assets) |
| | | | | | | | |
| Security | | Shares | | | Value | |
|
Common Stocks— 99.2% | |
|
| Aerospace & Defense— 2.9% | |
Boeing Co. (The) | | | 288 | | | $ | 93,819 | |
Curtiss-Wright Corp. | | | 407 | | | | 57,342 | |
HEICO Corp.(a) | | | 1,013 | | | | 115,634 | |
HEICO Corp., Class A | | | 446 | | | | 39,931 | |
Hexcel Corp.(a) | | | 2,194 | | | | 160,842 | |
Lockheed Martin Corp. | | | 6,816 | | | | 2,654,014 | |
Northrop Grumman Corp. | | | 1,629 | | | | 560,327 | |
Raytheon Co. | | | 3,580 | | | | 786,669 | |
Teledyne Technologies, Inc.(b) | | | 2,803 | | | | 971,352 | |
| | | | | | | | |
| | | | | | | 5,439,930 | |
|
| Air Freight & Logistics— 0.1% | |
Expeditors International of Washington, Inc. | | | 1,731 | | | | 135,053 | |
United Parcel Service, Inc., Class B | | | 236 | | | | 27,626 | |
| | | | | | | | |
| | | | | | | 162,679 | |
|
| Airlines— 0.5% | |
Alaska Air Group, Inc. | | | 4,284 | | | | 290,241 | |
Delta Air Lines, Inc. | | | 1,286 | | | | 75,205 | |
United Airlines Holdings, Inc.(b) | | | 6,007 | | | | 529,157 | |
| | | | | | | | |
| | | | | | | 894,603 | |
|
| Auto Components— 0.1% | |
Dana, Inc. | | | 5,659 | | | | 102,994 | |
Goodyear Tire & Rubber Co. (The) | | | 11,562 | | | | 179,847 | |
| | | | | | | | |
| | | | | | | 282,841 | |
|
| Automobiles— 0.6% | |
Ford Motor Co. | | | 38,701 | | | | 359,919 | |
General Motors Co. | | | 11,028 | | | | 403,625 | |
Harley-Davidson, Inc.(a) | | | 789 | | | | 29,343 | |
Tesla, Inc.(a)(b) | | | 689 | | | | 288,229 | |
| | | | | | | | |
| | | | | | | 1,081,116 | |
| | |
| Banks— 3.7% | | | | | | |
Bank of America Corp.(a) | | | 43,660 | | | | 1,537,705 | |
Bank OZK | | | 2,855 | | | | 87,092 | |
CIT Group, Inc. | | | 12,253 | | | | 559,104 | |
Citizens Financial Group, Inc. | | | 7,645 | | | | 310,464 | |
Cullen/Frost Bankers, Inc.(a) | | | 3,179 | | | | 310,843 | |
East West Bancorp, Inc. | | | 6,429 | | | | 313,092 | |
First Horizon National Corp. | | | 4,343 | | | | 71,920 | |
JPMorgan Chase & Co. | | | 15,980 | | | | 2,227,612 | |
PacWest Bancorp | | | 1,180 | | | | 45,159 | |
PNC Financial Services Group, Inc. (The) | | | 476 | | | | 75,984 | |
Truist Financial Corp. | | | 2,737 | | | | 154,148 | |
US Bancorp | | | 3,621 | | | | 214,689 | |
Wells Fargo & Co. | | | 19,693 | | | | 1,059,483 | |
Zions Bancorp NA | | | 521 | | | | 27,050 | |
| | | | | | | | |
| | | | | | | 6,994,345 | |
|
| Beverages— 1.2% | |
Coca-Cola Co. (The) | | | 3,559 | | | | 196,991 | |
Coca-Cola European Partners plc | | | 3,420 | | | | 174,010 | |
Molson Coors Brewing Co., Class B(a) | | | 2,178 | | | | 117,394 | |
Monster Beverage Corp.(b) | | | 6,870 | | | | 436,588 | |
PepsiCo, Inc. | | | 9,911 | | | | 1,354,536 | |
| | | | | | | | |
| | | | | | | 2,279,519 | |
|
| Biotechnology— 3.8% | |
AbbVie, Inc. | | | 13,610 | | | | 1,205,029 | |
Alexion Pharmaceuticals, Inc.(b) | | | 1,367 | | | | 147,841 | |
Amgen, Inc. | | | 3,534 | | | | 851,941 | |
Biogen, Inc.(b) | | | 1,493 | | | | 443,018 | |
Gilead Sciences, Inc. | | | 39,604 | | | | 2,573,468 | |
Incyte Corp.(b) | | | 1,685 | | | | 147,134 | |
| | | | | | | | |
| Security | | Shares | | | Value | |
|
| Biotechnology (continued) | |
Ionis Pharmaceuticals, Inc.(b) | | | 323 | | | $ | 19,513 | |
Regeneron Pharmaceuticals, Inc.(a)(b) | | | 1,936 | | | | 726,929 | |
United Therapeutics Corp.(b) | | | 2,553 | | | | 224,868 | |
Vertex Pharmaceuticals, Inc.(b) | | | 3,969 | | | | 869,013 | |
| | | | | | | | |
| | | | | | | 7,208,754 | |
|
| Building Products— 0.9% | |
Allegion plc | | | 13,272 | | | | 1,652,895 | |
Resideo Technologies, Inc.(b) | | | 5,229 | | | | 62,382 | |
| | | | | | | | |
| | | | | | | 1,715,277 | |
|
| Capital Markets— 4.0% | |
Affiliated Managers Group, Inc.(a) | | | 2,380 | | | | 201,681 | |
Bank of New York Mellon Corp. (The) | | | 5,053 | | | | 254,317 | |
Charles Schwab Corp. (The) | | | 14,098 | | | | 670,501 | |
CME Group, Inc. | | | 3,229 | | | | 648,125 | |
Evercore, Inc., Class A | | | 1,847 | | | | 138,082 | |
FactSet Research Systems, Inc. | | | 2,858 | | | | 766,801 | |
Intercontinental Exchange, Inc. | | | 12,436 | | | | 1,150,952 | |
Moody’s Corp. | | | 2,145 | | | | 509,244 | |
Morgan Stanley | | | 25,892 | | | | 1,323,599 | |
Nasdaq, Inc. | | | 210 | | | | 22,491 | |
S&P Global, Inc.(a) | | | 5,634 | | | | 1,538,364 | |
SEI Investments Co. | | | 604 | | | | 39,550 | |
Stifel Financial Corp. | | | 349 | | | | 21,167 | |
TD Ameritrade Holding Corp. | | | 5,865 | | | | 291,491 | |
| | | | | | | | |
| | | | | | | 7,576,365 | |
|
| Chemicals— 1.4% | |
Air Products & Chemicals, Inc. | | | 2,234 | | | | 524,968 | |
CF Industries Holdings, Inc. | | | 3,558 | | | | 169,859 | |
Ecolab, Inc. | | | 4,132 | | | | 797,435 | |
LyondellBasell Industries NV, Class A | | | 2,977 | | | | 281,267 | |
Mosaic Co. (The) | | | 11,715 | | | | 253,512 | |
ScottsMiracle-Gro Co. (The) | | | 348 | | | | 36,950 | |
Sherwin-Williams Co. (The) | | | 1,063 | | | | 620,303 | |
| | | | | | | | |
| | | | | | | 2,684,294 | |
|
| Commercial Services & Supplies— 0.2% | |
ADT, Inc. | | | 3,393 | | | | 26,907 | |
Cintas Corp. | | | 716 | | | | 192,661 | |
Copart, Inc.(b) | | | 1,000 | | | | 90,940 | |
| | | | | | | | |
| | | | | | | 310,508 | |
|
| Communications Equipment— 0.6% | |
Ciena Corp.(b) | | | 5,737 | | | | 244,912 | |
Cisco Systems, Inc. | | | 20,461 | | | | 981,310 | |
| | | | | | | | |
| | | | | | | 1,226,222 | |
|
| Construction & Engineering— 0.3% | |
AECOM(b) | | | 855 | | | | 36,876 | |
EMCOR Group, Inc. | | | 529 | | | | 45,653 | |
Fluor Corp. | | | 8,830 | | | | 166,710 | |
MasTec, Inc.(b) | | | 5,924 | | | | 380,084 | |
| | | | | | | | |
| | | | | | | 629,323 | |
|
| Consumer Finance— 1.1% | |
Ally Financial, Inc. | | | 15,908 | | | | 486,148 | |
American Express Co. | | | 7,517 | | | | 935,791 | |
Capital One Financial Corp. | | | 7,093 | | | | 729,941 | |
| | | | | | | | |
| | | | | | | 2,151,880 | |
|
| Containers & Packaging— 0.2% | |
Westrock Co. | | | 7,842 | | | | 336,500 | |
| | | | | | | | |
|
| Distributors— 0.0% | |
Pool Corp. | | | 345 | | | | 73,271 | |
| | | | | | | | |
| | | | |
| SCHEDULES OF INVESTMENTS | | | 25 | |
| | |
Schedule of Investments (continued) December 31, 2019 | | BlackRock Advantage Large Cap Core Portfolio (Percentages shown are based on Net Assets) |
| | | | | | | | |
| Security | | Shares | | | Value | |
|
| Diversified Consumer Services— 0.2% | |
H&R Block, Inc. | | | 14,398 | | | $ | 338,065 | |
| | | | | | | | |
|
| Diversified Financial Services— 1.7% | |
AXA Equitable Holdings, Inc. | | | 3,124 | | | | 77,413 | |
Berkshire Hathaway, Inc., Class B(b) | | | 14,081 | | | | 3,189,346 | |
| | | | | | | | |
| | | | | | | 3,266,759 | |
|
| Diversified Telecommunication Services— 1.9% | |
AT&T, Inc.(a) | | | 33,866 | | | | 1,323,483 | |
CenturyLink, Inc. | | | 14,838 | | | | 196,010 | |
Verizon Communications, Inc. | | | 33,129 | | | | 2,034,121 | |
| | | | | | | | |
| | | | | | | 3,553,614 | |
|
| Electric Utilities— 1.2% | |
Alliant Energy Corp. | | | 2,901 | | | | 158,743 | |
IDACORP, Inc. | | | 1,578 | | | | 168,530 | |
Pinnacle West Capital Corp. | | | 3,030 | | | | 272,488 | |
Xcel Energy,Inc. | | | 26,048 | | | | 1,653,788 | |
| | | | | | | | |
| | | | | | | 2,253,549 | |
|
| Electrical Equipment— 0.9% | |
AMETEK, Inc. | | | 10,448 | | | | 1,042,083 | |
Hubbell, Inc.(a) | | | 4,435 | | | | 655,582 | |
| | | | | | | | |
| | | | | | | 1,697,665 | |
|
| Electronic Equipment, Instruments & Components— 0.9% | |
Avnet, Inc. | | | 2,753 | | | | 116,837 | |
CDW Corp. | | | 7,171 | | | | 1,024,306 | |
National Instruments Corp.(a) | | | 13,576 | | | | 574,808 | |
| | | | | | | | |
| | | | | | | 1,715,951 | |
|
| Energy Equipment & Services— 0.2% | |
Patterson-UTI Energy,Inc. | | | 9,016 | | | | 94,668 | |
TechnipFMC plc | | | 1,693 | | | | 36,298 | |
Transocean Ltd.(b) | | | 42,016 | | | | 289,070 | |
| | | | | | | | |
| | | | | | | 420,036 | |
|
| Entertainment— 1.4% | |
Activision Blizzard, Inc. | | | 585 | | | | 34,761 | |
Cinemark Holdings, Inc. | | | 6,891 | | | | 233,260 | |
Electronic Arts, Inc.(b) | | | 2,270 | | | | 244,048 | |
Live Nation Entertainment, Inc.(b) | | | 5,244 | | | | 374,789 | |
Netflix, Inc.(a)(b) | | | 590 | | | | 190,906 | |
Spotify Technology SA(b) | | | 1,230 | | | | 183,946 | |
Take-Two Interactive Software, Inc.(b) | | | 3,268 | | | | 400,101 | |
Walt Disney Co. (The) | | | 4,751 | | | | 687,137 | |
Zynga, Inc., Class A(b) | | | 47,721 | | | | 292,053 | |
| | | | | | | | |
| | | | | | | 2,641,001 | |
|
| Equity Real Estate Investment Trusts (REITs)— 2.9% | |
Boston Properties, Inc. | | | 2,666 | | | | 367,535 | |
Brandywine Realty Trust | | | 1,306 | | | | 20,569 | |
Equity Residential | | | 2,911 | | | | 235,558 | |
Essex Property Trust, Inc. | | | 68 | | | | 20,458 | |
Host Hotels & Resorts, Inc.(a) | | | 6,685 | | | | 124,007 | |
Invitation Homes, Inc. | | | 17,870 | | | | 535,564 | |
Lamar Advertising Co., Class A | | | 8,772 | | | | 782,989 | |
National Retail Properties, Inc. | | | 2,102 | | | | 112,709 | |
Outfront Media, Inc. | | | 1,495 | | | | 40,096 | |
Park Hotels & Resorts, Inc.(a) | | | 34,810 | | | | 900,535 | |
Prologis, Inc. | | | 4,078 | | | | 363,513 | |
Regency Centers Corp. | | | 509 | | | | 32,113 | |
RLJ Lodging Trust | | | 28,537 | | | | 505,676 | |
Simon Property Group, Inc. | | | 9,487 | | | | 1,413,183 | |
UDR, Inc. | | | 1,398 | | | | 65,287 | |
| | | | | | | | |
| | | | | | | 5,519,792 | |
| | | | | | | | |
| Security | | Shares | | | Value | |
|
| Food & Staples Retailing— 1.7% | |
Costco Wholesale Corp. | | | 8,048 | | | $ | 2,365,468 | |
Performance Food Group Co.(b) | | | 10,255 | | | | 527,928 | |
Walmart, Inc. | | | 3,175 | | | | 377,317 | |
| | | | | | | | |
| | | | | | | 3,270,713 | |
|
| Food Products— 0.9% | |
Hershey Co. (The) | | | 10,343 | | | | 1,520,214 | |
Hormel Foods Corp.(a) | | | 2,888 | | | | 130,278 | |
| | | | | | | | |
| | | | | | | 1,650,492 | |
|
| Gas Utilities— 0.2% | |
Atmos Energy Corp. | | | 393 | | | | 43,961 | |
Southwest Gas Holdings, Inc. | | | 4,082 | | | | 310,110 | |
| | | | | | | | |
| | | | | | | 354,071 | |
|
| Health Care Equipment & Supplies— 2.6% | |
Danaher Corp. | | | 763 | | | | 117,105 | |
DexCom, Inc.(b) | | | 1,460 | | | | 319,360 | |
Edwards Lifesciences Corp.(b) | | | 3,998 | | | | 932,694 | |
Hologic, Inc.(b) | | | 8,081 | | | | 421,909 | |
IDEXX Laboratories, Inc.(b) | | | 1,783 | | | | 465,595 | |
Medtronic plc | | | 4,340 | | | | 492,373 | |
Stryker Corp. | | | 9,898 | | | | 2,077,986 | |
| | | | | | | | |
| | | | | | | 4,827,022 | |
|
| Health Care Providers & Services— 2.5% | |
AmerisourceBergen Corp. | | | 5,008 | | | | 425,780 | |
Anthem, Inc. | | | 4,862 | | | | 1,468,470 | |
Cigna Corp. | | | 1,271 | | | | 259,907 | |
CVS Health Corp. | | | 15,269 | | | | 1,134,334 | |
Humana, Inc. | | | 619 | | | | 226,876 | |
McKesson Corp. | | | 608 | | | | 84,099 | |
UnitedHealth Group, Inc. | | | 3,436 | | | | 1,010,115 | |
WellCare Health Plans, Inc.(b) | | | 320 | | | | 105,667 | |
| | | | | | | | |
| | | | | | | 4,715,248 | |
|
| Health Care Technology— 0.3% | |
Veeva Systems, Inc., Class A(b) | | | 3,363 | | | | 473,040 | |
| | | | | | | | |
|
| Hotels, Restaurants & Leisure— 2.3% | |
Boyd Gaming Corp. | | | 5,727 | | | | 171,466 | |
Carnival Corp. | | | 3,362 | | | | 170,890 | |
Chipotle Mexican Grill, Inc.(b) | | | 88 | | | | 73,666 | |
Choice Hotels International, Inc.(a) | | | 8,764 | | | | 906,461 | |
Darden Restaurants, Inc. | | | 9,642 | | | | 1,051,074 | |
Dunkin’ Brands Group, Inc. | | | 579 | | | | 43,738 | |
Extended Stay America, Inc. | | | 30,970 | | | | 460,214 | |
International Game Technology plc(a) | | | 3,217 | | | | 48,158 | |
McDonald’s Corp. | | | 4,593 | | | | 907,623 | |
Penn National Gaming, Inc.(b) | | | 6,996 | | | | 178,818 | |
Texas Roadhouse, Inc. | | | 4,443 | | | | 250,230 | |
| | | | | | | | |
| | | | | | | 4,262,338 | |
|
| Household Durables— 0.3% | |
DR Horton, Inc. | | | 8,808 | | | | 464,622 | |
Helen of Troy Ltd.(b) | | | 229 | | | | 41,172 | |
| | | | | | | | |
| | | | | | | 505,794 | |
|
| Household Products— 1.5% | |
Church & Dwight Co., Inc. | | | 12,567 | | | | 883,963 | |
Procter & Gamble Co. (The) | | | 15,118 | | | | 1,888,238 | |
| | | | | | | | |
| | | | | | | 2,772,201 | |
|
| Industrial Conglomerates— 0.8% | |
Carlisle Cos., Inc. | | | 536 | | | | 86,746 | |
Honeywell International, Inc. | | | 4,381 | | | | 775,437 | |
| | |
| 26 | | 2019 BLACKROCK ANNUAL REPORTTO SHAREHOLDERS |
| | |
Schedule of Investments (continued) December 31, 2019 | | BlackRock Advantage Large Cap Core Portfolio (Percentages shown are based on Net Assets) |
| | | | | | | | |
| Security | | Shares | | | Value | |
|
| Industrial Conglomerates (continued) | |
Roper Technologies, Inc. | | | 1,764 | | | $ | 624,862 | |
| | | | | | | | |
| | | | | | | 1,487,045 | |
|
| Insurance— 3.2% | |
Aflac, Inc. | | | 1,158 | | | | 61,258 | |
Allstate Corp. (The) | | | 9,518 | | | | 1,070,299 | |
Arthur J Gallagher & Co. | | | 5,844 | | | | 556,524 | |
Brown & Brown, Inc. | | | 2,914 | | | | 115,045 | |
Cincinnati Financial Corp. | | | 3,783 | | | | 397,782 | |
First American Financial Corp. | | | 12,933 | | | | 754,253 | |
Globe Life, Inc. | | | 4,952 | | | | 521,198 | |
Lincoln National Corp. | | | 3,427 | | | | 202,227 | |
Marsh & McLennan Cos., Inc. | | | 2,458 | | | | 273,846 | |
MetLife, Inc. | | | 4,567 | | | | 232,780 | |
Progressive Corp. (The) | | | 3,088 | | | | 223,540 | |
Prudential Financial, Inc. | | | 7,886 | | | | 739,234 | |
Travelers Cos., Inc. (The) | | | 2,145 | | | | 293,758 | |
Unum Group | | | 6,936 | | | | 202,254 | |
Willis Towers Watson plc | | | 818 | | | | 165,187 | |
WR Berkley Corp. | | | 2,173 | | | | 150,154 | |
| | | | | | | | |
| | | | | | | 5,959,339 | |
|
| Interactive Media & Services— 4.7%(b) | |
Alphabet, Inc., Class A | | | 1,733 | | | | 2,321,163 | |
Alphabet, Inc., Class C | | | 1,912 | | | | 2,556,382 | |
Facebook, Inc., Class A | | | 15,876 | | | | 3,258,549 | |
Pinterest, Inc., Class A | | | 7,830 | | | | 145,951 | |
TripAdvisor, Inc. | | | 6,003 | | | | 182,371 | |
Twitter,Inc. | | | 6,081 | | | | 194,896 | |
Yelp, Inc. | | | 3,720 | | | | 129,568 | |
| | | | | | | | |
| | | | | | | 8,788,880 | |
|
| Internet & Direct Marketing Retail— 3.0%(b) | |
Amazon.com, Inc. | | | 3,084 | | | | 5,698,739 | |
Qurate Retail, Inc. | | | 2,719 | | | | 22,921 | |
| | | | | | | | |
| | | | | | | 5,721,660 | |
|
| IT Services— 5.3% | |
Accenture plc, Class A | | | 93 | | | | 19,583 | |
Amdocs Ltd. | | | 1,993 | | | | 143,875 | |
Automatic Data Processing, Inc. | | | 10,247 | | | | 1,747,113 | |
Booz Allen Hamilton Holding Corp. | | | 1,200 | | | | 85,356 | |
Broadridge Financial Solutions, Inc. | | | 3,872 | | | | 478,347 | |
DXC Technology Co. | | | 3,537 | | | | 132,956 | |
GoDaddy, Inc., Class A(b) | | | 6,160 | | | | 418,387 | |
International Business Machines Corp. | | | 143 | | | | 19,168 | |
Jack Henry & Associates, Inc. | | | 1,694 | | | | 246,765 | |
Mastercard, Inc., Class A | | | 12,957 | | | | 3,868,831 | |
Paychex, Inc. | | | 17,607 | | | | 1,497,651 | |
PayPal Holdings, Inc.(b) | | | 253 | | | | 27,367 | |
Visa, Inc., Class A | | | 7,028 | | | | 1,320,561 | |
| | | | | | | | |
| | | | | | | 10,005,960 | |
|
| Life Sciences Tools & Services— 0.1% | |
Thermo Fisher Scientific, Inc. | | | 461 | | | | 149,765 | |
| | | | | | | | |
|
| Machinery— 2.3% | |
AGCO Corp. | | | 3,453 | | | | 266,744 | |
IDEX Corp. | | | 3,300 | | | | 567,600 | |
Ingersoll-Rand plc | | | 481 | | | | 63,935 | |
Oshkosh Corp. | | | 10,110 | | | | 956,912 | |
PACCAR, Inc. | | | 27,194 | | | | 2,151,045 | |
Snap-on, Inc. | | | 2,281 | | | | 386,401 | |
Xylem, Inc. | | | 184 | | | | 14,497 | |
| | | | | | | | |
| | | | | | | 4,407,134 | |
| | | | | | | | |
| Security | | Shares | | | Value | |
|
| Media— 1.9% | |
AMC Networks, Inc., Class A(b) | | | 9,116 | | | $ | 360,082 | |
Comcast Corp., Class A | | | 15,859 | | | | 713,179 | |
Discovery, Inc., Class A(b) | | | 14,247 | | | | 466,447 | |
Interpublic Group of Cos., Inc. (The) | | | 46,691 | | | | 1,078,562 | |
Liberty Media Corp.-Liberty SiriusXM, Class A(b) | | | 530 | | | | 25,620 | |
Sirius XM Holdings, Inc. | | | 139,571 | | | | 997,933 | |
| | | | | | | | |
| | | | | | | 3,641,823 | |
|
| Metals & Mining— 0.3% | |
Alcoa Corp.(b) | | | 14,535 | | | | 312,648 | |
Reliance Steel & Aluminum Co. | | | 2,455 | | | | 294,011 | |
Steel Dynamics, Inc. | | | 655 | | | | 22,296 | |
| | | | | | | | |
| | | | | | | 628,955 | |
|
| Multiline Retail— 0.7% | |
Dollar General Corp. | | | 6,334 | | | | 987,977 | |
Target Corp. | | | 2,516 | | | | 322,577 | |
| | | | | | | | |
| | | | | | | 1,310,554 | |
|
| Multi-Utilities— 1.2% | |
Ameren Corp. | | | 9,383 | | | | 720,614 | |
Consolidated Edison, Inc. | | | 7,766 | | | | 702,590 | |
DTE Energy Co. | | | 6,462 | | | | 839,220 | |
| | | | | | | | |
| | | | | | | 2,262,424 | |
|
| Oil, Gas & Consumable Fuels— 3.4% | |
ConocoPhillips | | | 7,785 | | | | 506,259 | |
Continental Resources, Inc.(b) | | | 7,891 | | | | 270,661 | |
Devon Energy Corp. | | | 2,443 | | | | 63,445 | |
EOG Resources, Inc. | | | 9,802 | | | | 821,015 | |
Exxon Mobil Corp. | | | 40,178 | | | | 2,803,621 | |
Marathon Oil Corp. | | | 3,468 | | | | 47,095 | |
Marathon Petroleum Corp. | | | 11,556 | | | | 696,249 | |
Phillips 66 | | | 522 | | | | 58,156 | |
Suncor Energy,Inc. | | | 10,884 | | | | 356,995 | |
Valero Energy Corp. | | | 4,241 | | | | 397,170 | |
Williams Cos., Inc. (The) | | | 17,998 | | | | 426,913 | |
| | | | | | | | |
| | | | | | | 6,447,579 | |
|
| Paper & Forest Products— 0.3% | |
Domtar Corp. | | | 13,428 | | | | 513,487 | |
| | | | | | | | |
|
| Personal Products— 0.7% | |
Estee Lauder Cos., Inc. (The), Class A | | | 6,330 | | | | 1,307,398 | |
| | | | | | | | |
|
| Pharmaceuticals— 4.8% | |
Bristol-Myers Squibb Co. | | | 24,328 | | | | 1,561,614 | |
Johnson & Johnson | | | 22,008 | | | | 3,210,307 | |
Merck & Co., Inc. | | | 20,872 | | | | 1,898,308 | |
Mylan NV(b) | | | 13,086 | | | | 263,029 | |
Pfizer, Inc. | | | 23,253 | | | | 911,053 | |
Zoetis, Inc. | | | 9,532 | | | | 1,261,560 | |
| | | | | | | | |
| | | | | | | 9,105,871 | |
|
| Professional Services— 0.3% | |
CoStar Group, Inc.(b) | | | 131 | | | | 78,377 | |
IHS Markit Ltd.(b) | | | 1,247 | | | | 93,962 | |
Robert Half International, Inc. | | | 7,169 | | | | 452,722 | |
| | | | | | | | |
| | | | | | | 625,061 | |
|
| Road & Rail — 0.5% | |
CSX Corp. | | | 1,323 | | | | 95,732 | |
Landstar System, Inc. | | | 4,430 | | | | 504,444 | |
Lyft, Inc., Class A(b) | | | 1,343 | | | | 57,776 | |
Old Dominion Freight Line, Inc. | | | 807 | | | | 153,152 | |
Ryder System, Inc. | | | 1,805 | | | | 98,030 | |
| | | | | | | | |
| | | | | | | 909,134 | |
| | | | |
| SCHEDULES OF INVESTMENTS | | | 27 | |
| | |
Schedule of Investments (continued) December 31, 2019 | | BlackRock Advantage Large Cap Core Portfolio (Percentages shown are based on Net Assets) |
| | | | | | | | |
| Security | | Shares | | | Value | |
|
| Semiconductors & Semiconductor Equipment— 3.8% | |
Applied Materials, Inc. | | | 17,706 | | | $ | 1,080,774 | |
Cirrus Logic, Inc.(b) | | | 7,831 | | | | 645,353 | |
Cypress Semiconductor Corp. | | | 2,315 | | | | 54,009 | |
Intel Corp. | | | 30,317 | | | | 1,814,472 | |
Lam Research Corp. | | | 2,838 | | | | 829,831 | |
Micron Technology, Inc.(b) | | | 4,369 | | | | 234,965 | |
NVIDIA Corp. | | | 5,216 | | | | 1,227,325 | |
QUALCOMM, Inc. | | | 4,163 | | | | 367,301 | |
Skyworks Solutions, Inc. | | | 2,379 | | | | 287,574 | |
Texas Instruments, Inc. | | | 5,233 | | | | 671,342 | |
| | | | | | | | |
| | | | | | | 7,212,946 | |
|
| Software— 7.7% | |
ACI Worldwide, Inc.(b) | | | 2 | | | | 76 | |
Adobe, Inc.(b) | | | 4,265 | | | | 1,406,640 | |
Dropbox, Inc., Class A(b) | | | 5,143 | | | | 92,111 | |
Intuit, Inc. | | | 5,603 | | | | 1,467,594 | |
Manhattan Associates, Inc.(b) | | | 2,142 | | | | 170,825 | |
Microsoft Corp. | | | 50,026 | | | | 7,889,100 | |
Paylocity Holding Corp.(b) | | | 2,648 | | | | 319,931 | |
salesforce. com, Inc.(b) | | | 9,788 | | | | 1,591,920 | �� |
ServiceNow, Inc.(b) | | | 4,039 | | | | 1,140,290 | |
Workday, Inc., Class A(b) | | | 2,764 | | | | 454,540 | |
| | | | | | | | |
| | | | | | | 14,533,027 | |
|
| Specialty Retail— 1.2% | |
AutoNation, Inc.(b) | | | 679 | | | | 33,020 | |
AutoZone, Inc.(b) | | | 50 | | | | 59,565 | |
Home Depot, Inc. (The) | | | 8,679 | | | | 1,895,320 | |
O’Reilly Automotive, Inc.(b) | | | 261 | | | | 114,386 | |
Ross Stores, Inc. | | | 1,141 | | | | 132,835 | |
Tractor Supply Co. | | | 675 | | | | 63,072 | |
| | | | | | | | |
| | | | | | | 2,298,198 | |
|
| Technology Hardware, Storage & Peripherals— 4.7% | |
Apple, Inc. | | | 29,510 | | | | 8,665,610 | |
HP, Inc. | | | 10,676 | | | | 219,392 | |
| | | | | | | | |
| | | | | | | 8,885,002 | |
|
| Textiles, Apparel & Luxury Goods— 1.0% | |
Lululemon Athletica, Inc.(b) | | | 1,088 | | | | 252,057 | |
NIKE, Inc., Class B | | | 13,215 | | | | 1,338,812 | |
Ralph Lauren Corp.(a) | | | 1,760 | | | | 206,307 | |
| | | | | | | | |
| | | | | | | 1,797,176 | |
|
| Thrifts & Mortgage Finance— 0.1% | |
Essent Group Ltd.(b) | | | 3,335 | | | | 173,387 | |
MGIC Investment Corp. | | | 6,294 | | | | 89,186 | |
| | | | | | | | |
| | | | | | | 262,573 | |
|
| Tobacco— 0.5% | |
Altria Group, Inc. | | | 13,267 | | | | 662,156 | |
Philip Morris International, Inc. | | | 3,517 | | | | 299,261 | |
| | | | | | | | |
| | | | | | | 961,417 | |
|
| Trading Companies & Distributors— 0.3% | |
GATX Corp.(a) | | | 7,549 | | | | 625,434 | |
Watsco, Inc. | | | 145 | | | | 26,122 | |
| | | | | | | | |
| | | | | | | 651,556 | |
|
| Water Utilities— 0.8% | |
American Water Works Co., Inc. | | | 11,872 | | | | 1,458,475 | |
| | | | | | | | |
| | | | | | | | |
| Security | | Shares | | | Value | |
|
| Wireless Telecommunication Services— 0.4% | |
Telephone & Data Systems, Inc. | | | 16,514 | | | $ | 419,951 | |
United States Cellular Corp.(b) | | | 9,518 | | | | 344,837 | |
| | | | | | | | |
| | | | | | | 764,788 | |
| | | | | | | | |
| | |
Total Common Stocks— 99.2%
(Cost: $165,992,244) | | | | | | | 187,382,005 | |
| | | | | | | | |
| | |
Rights— 0.0% | | | | | | | | |
| | |
Pharmaceuticals— 0.0%(a)(b) | | | | | | | | |
Bristol-Myers Squibb Co. | | | 4,480 | | | | 13,485 | |
| | | | | | | | |
| | |
Total Rights— 0.0%
(Cost: $9,542) | | | | | | | 13,485 | |
| | | | | | | | |
| |
Total Long-Term Investments— 99.2%
(Cost: $166,001,786) | | | | 187,395,490 | |
| | | | | | | | |
|
Short-Term Securities— 5.0%(c)* | |
BlackRock Liquidity Funds,T-Fund, Institutional Class, 1.51% | | | 1,471,977 | | | | 1,471,977 | |
SL Liquidity Series, LLC, Money Market Series, 1.80%(d) | | | 7,954,703 | | | | 7,956,293 | |
| | | | | | | | |
| |
Total Short-Term Securities— 5.0%
(Cost: $9,428,270) | | | | 9,428,270 | |
| | | | | | | | |
| |
Total Investments— 104.2%
(Cost: $175,430,056) | | | | 196,823,760 | |
| |
Liabilities in Excess of Other Assets— (4.2)% | | | | (7,916,815 | ) |
| | | | | | | | |
| |
Net Assets— 100.0% | | | $ | 188,906,945 | |
| | | | | |
| | |
| 28 | | 2019 BLACKROCK ANNUAL REPORTTO SHAREHOLDERS |
| | |
Schedule of Investments (continued) December 31, 2019 | | BlackRock Advantage Large Cap Core Portfolio |
| (a) | Security, or a portion of the security, is on loan. |
| (b) | Non-income producing security. |
| (c) | Annualized7-day yield as of period end. |
| (d) | Security was purchased with the cash collateral from loaned securities. |
| * | During the year ended December 31, 2019, investments in issuers considered to be an affiliate/affiliates of the Fund for purposes of Section 2(a)(3) of the Investment Company Act of 1940, as amended, were as follows: |
| | | | | | | | | | | | | | | | | | | | | | | | | | | | |
| Affiliate | | Shares
Held at
12/31/18 | | | Net
Activity | | | Shares
Held at
12/31/19 | | | Value at
12/31/19 | | | Income | | | Net
Realized
Gain (Loss) (a) | | | Change in
Unrealized
Appreciation
(Depreciation) | |
BlackRock Liquidity Funds,T-Fund, Institutional Class | | | 1,878,651 | | | | (406,674 | ) | | | 1,471,977 | | | $ | 1,471,977 | | | $ | 34,097 | | | $ | 4 | | | $ | — | |
SL Liquidity Series, LLC, Money Market Series | | | 4,227,706 | | | | 3,726,997 | | | | 7,954,703 | | | | 7,956,293 | | | | 25,203 | (b) | | | 810 | | | | 257 | |
| | | | | | | | | | | | | | | | | | | | | | | | | | | | |
| | | | | | | | | | | | | | $ | 9,428,270 | | | $ | 59,300 | | | $ | 814 | | | $ | 257 | |
| | | | | | | | | | | | | | | | | | | | | | | | | | | | |
| (a) | Includes net capital gain distributions, if applicable. |
| (b) | Represents securities lending income earned from the reinvestment of cash collateral from loaned securities, net of fees and collateral investment expenses, and other payments to and from borrowers of securities. |
For Fund compliance purposes, the Fund’s industry classifications refer to one or more of the industrysub-classifications used by one or more widely recognized market indexes or rating group indexes, and/or as defined by the investment adviser. These definitions may not apply for purposes of this report, which may combine such industrysub-classifications for reporting ease.
| | | | |
| SCHEDULES OF INVESTMENTS | | | 29 | |
| | |
Schedule of Investments (continued) December 31, 2019 | | BlackRock Advantage Large Cap Core Portfolio |
Derivative Financial Instruments Outstanding as of Period End
Futures Contracts
| | | | | | | | | | | | | | | | |
| Description | | Number of
Contracts | | | Expiration
Date | | | Notional
Amount (000) | | | Value/
Unrealized
Appreciation
(Depreciation) | |
Long Contracts | | | | | | | | | | | | | | | | |
S&P 500E-Mini Index | | | 10 | | | | 03/20/20 | | | $ | 1,616 | | | $ | 22,558 | |
| | | | | | | | | | | | | | | | |
Derivative Financial Instruments Categorized by Risk Exposure
As of period end, the fair values of derivative financial instruments located in the Statements of Assets and Liabilities were as follows:
| | | | | | | | | | | | | | | | | | | | | | | | | | | | |
| | | Commodity
Contracts | | | Credit
Contracts | | | Equity
Contracts | | | Foreign
Currency
Exchange
Contracts | | | Interest
Rate
Contracts | | | Other
Contracts | | | Total | |
Assets — Derivative Financial Instruments | | | | | | | | | | | | | | | | | | | | | | | | | |
Futures contracts | | | | | | | | | | | | | | | | | | | | | | | | | | | | |
Unrealized appreciation on futures contracts(a) | | $ | — | | | $ | — | | | $ | 22,558 | | | $ | — | | | $ | — | | | $ | — | | | $ | 22,558 | |
| | | | | | | | | | | | | | | | | | | | | | | | | | | | |
| (a) | | Net cumulative unrealized appreciation (depreciation) on futures contracts, if any,are reported in the Schedule of Investments. In the Statements of Assets and Liabilities, only current day’s variation margin is reported in receivables or payables and the net cumulative unrealized appreciation (depreciation) is included in accumulated earnings (loss). |
For the year ended December 31, 2019, the effect of derivative financial instruments in the Statements of Operations was as follows:
| | | | | | | | | | | | | | | | | | | | | | | | | | | | |
| | | Commodity
Contracts | | | Credit
Contracts | | | Equity
Contracts | | | Foreign
Currency
Exchange
Contracts | | | Interest
Rate
Contracts | | | Other
Contracts | | | Total | |
Net Realized Gain (Loss) from: | | | | | | | | | | | | | | | | | | | | | | | | | | | | |
Futures contracts | | $ | — | | | $ | — | | | $ | 437,768 | | | $ | — | | | $ | — | | | $ | — | | | $ | 437,768 | |
| | | | | | | | | | | | | | | | | | | | | | | | | | | | |
| | | | | | | |
| Net Change in Unrealized Appreciation (Depreciation) on: | | | | | | | | | | | | | | | | | | | | | |
Futures contracts | | | — | | | | — | | | | 48,472 | | | | — | | | | — | | | | — | | | | 48,472 | |
| | | | | | | | | | | | | | | | | | | | | | | | | | | | |
Average Quarterly Balances of Outstanding Derivative Financial Instruments
| | | | |
Futures contracts: | | | | |
Average notional value of contracts — long | | $ | 2,046,954 | |
For more information about the Fund’s investment risks regarding derivative financial instruments, refer to the Notes to Financial Statements.
Fair Value Hierarchy as of Period End
Various inputs are used in determining the fair value of investments and derivative financial instruments. For information about the Fund’s policy regarding valuation of investments and derivative financial instruments, refer to the Notes to Financial Statements.
The following tables summarize the Fund’s investments and derivative financial instruments categorized in the disclosure hierarchy:
| | | | | | | | | | | | | | | | |
| | | Level 1 | | | Level 2 | | | Level 3 | | | Total | |
Assets: | | | | | | | | | | | | | | | | |
Investments: | | | | | | | | | | | | | | | | |
Long-Term Investments(a) | | $ | 187,395,490 | | | $ | — | | | $ | — | | | $ | 187,395,490 | |
Short-Term Securities(a) | | | 1,471,977 | | | | — | | | | — | | | | 1,471,977 | |
| | | | | | | | | | | | | | | | |
Subtotal | | $ | 188,867,467 | | | $ | — | | | $ | — | | | $ | 188,867,467 | |
| | | | | | | | | | | | | | | | |
| | |
| 30 | | 2019 BLACKROCK ANNUAL REPORTTO SHAREHOLDERS |
| | |
Schedule of Investments (continued) December 31, 2019 | | BlackRock Advantage Large Cap Core Portfolio |
| | | | | | | | | | | | | | | | |
| | | Level 1 | | | Level 2 | | | Level 3 | | | Total | |
Investments valued at NAV(b) | | | | | | | | | | | | | | | 7,956,293 | |
| | | | | | | | | | | | | | | | |
Total Investments | | | | | | | | | | | | | | $ | 196,823,760 | |
| | | | | | | | | | | | | | | | |
Derivative Financial Instruments(c) | | | | | | | | | | | | | | | | |
Assets: | | | | | | | | | | | | | | | | |
Equity contracts | | $ | 22,558 | | | $ | — | | | $ | — | | | $ | 22,558 | |
| | | | | | | | | | | | | | | | |
| (a) | See above Schedule of Investments for values in each security type. |
| (b) | Certain investments of the Fund were fair valued using NAV per share as no quoted market value is available and therefore have been excluded from the fair value hierarchy. |
| (c) | Derivative financial instruments are futures contracts. Futures contracts are valued at the unrealized appreciation (depreciation) on the instrument. |
See notes to financial statements.
| | | | |
| SCHEDULES OF INVESTMENTS | | | 31 | |
| | |
Schedule of Investments December 31, 2019 | | BlackRock Balanced Capital Portfolio (Percentages shown are based on Net Assets) |
| | | | | | | | |
| Security | | Par (000) | | | Value | |
| | |
| Asset-Backed Securities — 3.2% | | | | | | |
ACE Securities Corp. Home Equity Loan Trust, Series2007-HE4, Class A2A, (LIBOR USD 1 Month + 0.13%), 1.92%, 05/25/37(a) | | | USD 49 | | | $ | 12,970 | |
Ajax Mortgage Loan Trust(b): | | | | | | | | |
Series2017-D, Class A,
3.75%, 12/25/57 | | | 137 | | | | 141,065 | |
Series2018-B, Class A,
3.75%, 02/26/57(c) | | | 110 | | | | 109,777 | |
Series2018-D, Class A,
3.75%, 08/25/58(c)(d) | | | 151 | | | | 152,451 | |
Series2018-E, Class A,
4.38%, 06/25/58(d) | | | 94 | | | | 94,776 | |
Series2018-F,Class A,
4.38%, 11/25/58(c)(d) | | | 341 | | | | 343,703 | |
Series2018-G, Class A,
4.38%, 06/25/57(c)(d) | | | 197 | | | | 197,413 | |
Series2018-G, Class B,
5.25%, 06/25/57(c)(d) | | | 100 | | | | 98,370 | |
Series2018-G, Class C,
5.25%, 06/25/57(c) | | | 99 | | | | 93,566 | |
Series2019-A, Class A,
3.75%, 08/25/57(d) | | | 197 | | | | 197,880 | |
Series2019-B, Class A,
3.75%, 01/25/59(d) | | | 345 | | | | 345,598 | |
Allegro CLOII-S Ltd., Series2014-1RA, Class A1, (LIBOR USD 3 Month + 1.08%),
3.05%, 10/21/28(a)(b) | | | 250 | | | | 249,091 | |
Anchorage Capital CLO5-R Ltd.(a)(b): | | | | | | | | |
Series2014-5RA, Class B, (LIBOR USD 3 Month + 1.45%), 3.45%, 01/15/30 | | | 250 | | | | 246,648 | |
Series2014-5RA, Class C, (LIBOR USD 3 Month + 1.85%), 3.85%, 01/15/30 | | | 250 | | | | 242,687 | |
Anchorage Capital CLO 6 Ltd., Series2015-6A, Class AR, (LIBOR USD 3 Month + 1.27%),
3.27%, 07/15/30(a)(b) | | | 250 | | | | 249,331 | |
Apidos CLO XII, Series2013-12A, Class AR, (LIBOR USD 3 Month + 1.08%),
3.08%, 04/15/31(a)(b) | | | 500 | | | | 496,680 | |
Arbor Realty CLO Ltd., Series2017-FL3, Class A, (LIBOR USD 1 Month + 0.99%),
2.73%, 12/15/27(a)(b) | | | 100 | | | | 100,014 | |
Arbor Realty Commercial Real Estate Notes Ltd., Series2017-FL2, Class A, (LIBOR USD 1 Month + 0.99%),
2.73%, 08/15/27(a)(b) | | | 250 | | | | 250,023 | |
Argent Mortgage Loan Trust, Series2005-W1, Class A2, (LIBOR USD 1 Month + 0.48%), 2.27%, 05/25/35(a) | | | 78 | | | | 73,933 | |
Avery Point V CLO Ltd., Series2014-5A, Class AR, (LIBOR USD 3 Month + 0.98%),
2.98%, 07/17/26(a)(b) | | | 152 | | | | 151,720 | |
Avery Point VI CLO Ltd., Series2015-6A, Class AR, (LIBOR USD 3 Month + 1.05%),
2.94%, 08/05/27(a)(b) | | | 250 | | | | 249,407 | |
B2R Mortgage Trust, Series2015-2, Class A,
3.34%, 11/15/48(b) | | | 23 | | | | 22,868 | |
Barings CLO Ltd., Series2018-3A, Class A1, (LIBOR USD 3 Month + 0.95%),
2.92%, 07/20/29(a)(b) | | | 250 | | | | 248,083 | |
Battalion CLO X Ltd., Series2016-10A, Class A1R, (LIBOR USD 3 Month + 1.25%), 3.19%, 01/24/29(a)(b) | | | 300 | | | | 300,088 | |
BCMSC Trust(d): | | | | | | | | |
Series2000-A, Class A2, 7.58%, 06/15/30 | | | 53 | | | | 16,976 | |
Series2000-A, Class A3, 7.83%, 06/15/30 | | | 49 | | | | 16,282 | |
Series2000-A, Class A4, 8.29%, 06/15/30 | | | 35 | | | | 12,408 | |
BDS Ltd., Series2019-FL3, Class A, (LIBOR USD 1 Month + 1.40%),
3.14%, 12/15/35(a)(b) | | | 100 | | | | 100,078 | |
Bear Stearns Asset-Backed Securities I Trust(a): | | | | | |
Series2004-HE7, Class M2, (LIBOR USD 1 Month + 1.73%), 3.52%, 08/25/34 | | | 3 | | | | 3,083 | |
Series2006-HE7,Class 1A2, (LIBOR USD 1 Month + 0.17%), 1.96%, 09/25/36 | | | 151 | | | | 182,234 | |
Series2007-HE1, Class 21A2, (LIBOR USD 1 Month + 0.16%), 1.95%, 01/25/37 | | | 41 | | | | 40,302 | |
| | | | | | | | |
| Security | | Par (000) | | | Value | |
|
| Asset-Backed Securities (continued) | |
Series2007-HE2, Class 22A, (LIBOR USD 1 Month + 0.14%), 1.93%, 03/25/37 | | | USD 25 | | | $ | 24,903 | |
Series2007-HE2, Class 23A, (LIBOR USD 1 Month + 0.14%), 1.93%, 03/25/37 | | | 48 | | | | 51,018 | |
Series2007-HE3, Class 1A3, (LIBOR USD 1 Month + 0.25%), 2.04%, 04/25/37 | | | 85 | | | | 92,834 | |
Bear Stearns Asset-Backed Securities Trust, Series2005-4, Class M2, (LIBOR USD 1 Month + 1.20%), 2.99%, 01/25/36(a) | | | 4 | | | | 3,821 | |
Benefit Street Partners CLO VI Ltd., Series2015-VIA, Class A1R, (LIBOR USD 3 Month + 1.24%), 3.24%, 10/18/29(a)(b) | | | 250 | | | | 250,003 | |
California Street CLO XII Ltd., Series2013-12A, Class AR, (LIBOR USD 3 Month + 1.03%), 3.03%, 10/15/25(a)(b) | | | 221 | | | | 221,161 | |
Carlyle Global Market Strategies CLO Ltd.(a)(b): | | | | | | | | |
Series2014-1A, Class A1R2, (LIBOR USD 3 Month + 0.97%), 2.97%, 04/17/31 | | | 250 | | | | 248,341 | |
Series2015-3A, Class A2R, (LIBOR USD 3 Month + 1.60%), 3.54%, 07/28/28 | | | 250 | | | | 249,298 | |
Carlyle US CLO Ltd., Series2017-4A, Class A1, (LIBOR USD 3 Month + 1.18%),
3.18%, 01/15/30(a)(b) | | | 250 | | | | 249,630 | |
Carrington Mortgage Loan Trust, Series 2006- NC4, Class A3, (LIBOR USD 1 Month + 0.16%), 1.95%, 10/25/36(a) | | | 76 | | | | 70,881 | |
Cedar Funding VI CLO Ltd., Series2016-6A, Class AR, (LIBOR USD 3 Month + 1.09%),
3.06%, 10/20/28(a)(b) | | | 250 | | | | 249,823 | |
Cedar Funding VIII CLO Ltd., Series2017-8A, Class A1, (LIBOR USD 3 Month + 1.25%),
3.25%, 10/17/30(a)(b) | | | 250 | | | | 250,126 | |
Cent CLO 24 Ltd., Series2015-24A, Class A1R, (LIBOR USD 3 Month +1.07%),
3.07%, 10/15/26(a)(b) | | | 250 | | | | 249,448 | |
CIFC Funding Ltd.(a)(b):
Series2013-1A, Class A2R, (LIBOR USD 3 Month + 1.75%), 3.75%, 07/16/30 | | | 250 | | | | 248,719 | |
Series2014-4RA, Class A1A, (LIBOR USD 3 Month + 1.13%), 3.13%, 10/17/30 | | | 250 | | | | 249,178 | |
Citigroup Mortgage Loan Trust(a): | | | | | | | | |
Series 2007-AHL2, Class A3B, (LIBOR USD 1 Month + 0.20%), 1.99%, 05/25/37 | | | 201 | | | | 146,308 | |
Series 2007-AHL2, Class A3C, (LIBOR USD 1 Month + 0.27%), 2.06%, 05/25/37 | | | 91 | | | | 66,962 | |
Conseco Finance Corp.: | | | | | | | | |
Series1998-8, Class A1, 6.28%, 09/01/30 | | | 19 | | | | 19,898 | |
Series1998-8, Class M1, 6.98%, 09/01/30(d) | | | 57 | | | | 51,082 | |
Series2001-D, Class B1, (LIBOR USD 1 Month + 2.50%), 4.24%, 11/15/32(a) | | | 108 | | | | 105,025 | |
Conseco Finance Securitizations Corp.: | | | | | | | | |
Series2000-1, Class A5,
8.06%, 09/01/29(d) | | | 31 | | | | 12,562 | |
Series2000-4, Class A5,
7.97%, 05/01/32 | | | 94 | | | | 37,366 | |
Series2000-4, Class A6,
8.31%, 05/01/32(d) | | | 42 | | | | 17,474 | |
Series2000-5, Class A6,
7.96%, 05/01/31 | | | 39 | | | | 20,491 | |
Countrywide Asset-Backed Certificates: | | | | | | | | |
Series2006-8, Class 2A3, (LIBOR USD 1 Month + 0.16%), 1.95%, 12/25/35(a) | | | 40 | | | | 39,766 | |
Series2006-S3, Class A4,
6.59%, 01/25/29(e) | | | 13 | | | | 14,880 | |
Series 2006-SPS1, Class A, (LIBOR USD 1 Month + 0.22%), 2.01%, 12/25/25(a) | | | 2 | | | | 2,657 | |
Credit Suisse First Boston Mortgage Securities Corp., Series 2001-MH29, Class B1,
8.10%, 09/25/31(d) | | | 30 | | | | 31,704 | |
| | |
| 32 | | 2019 BLACKROCK ANNUAL REPORTTO SHAREHOLDERS |
| | |
Schedule of Investments (continued) December 31, 2019 | | BlackRock Balanced Capital Portfolio (Percentages shown are based on Net Assets) |
| | | | | | | | |
| Security | | Par (000) | | | Value | |
| |
| Asset-Backed Securities (continued) | | | | |
Credit-Based Asset Servicing & Securitization LLC, Series2006-MH1, Class B1, 6.25%, 10/25/36(b)(e) | | | USD 100 | | | $ | 102,357 | |
CWABS Asset-Backed Certificates Trust, Series2005-17, Class 1AF4,
6.05%, 05/25/36(e) | | | 39 | | | | 38,815 | |
CWHEQ Home Equity Loan Trust, Series 2006-S5, Class A5, 6.16%, 06/25/35 | | | 14 | | | | 14,902 | |
CWHEQ Revolving Home Equity Loan Resuritization Trust(a)(b): | | | | | | | | |
Series2006-RES, Class 4Q1B, (LIBOR USD 1 Month + 0.30%),
2.04%, 12/15/33 | | | 24 | | | | 22,374 | |
Series2006-RES, Class 5B1A, (LIBOR USD 1 Month + 0.19%),
1.93%, 05/15/35 | | | 104 | | | | 98,824 | |
CWHEQ Revolving Home Equity Loan Trust(a): | | | | | | | | |
Series2005-B, Class 2A, (LIBOR USD 1 Month + 0.18%), 1.92%, 05/15/35 | | | 13 | | | | 12,954 | |
Series2006-H, Class 1A, (LIBOR USD 1 Month + 0.15%), 1.89%, 11/15/36 | | | 25 | | | | 21,390 | |
Dryden 53 CLO Ltd., Series2017-53A, Class A, (LIBOR USD 3 Month + 1.12%), 3.12%, 01/15/31(a)(b) | | | 280 | | | | 278,821 | |
First Franklin Mortgage Loan Trust, Series 2006-FFH1, Class M2, (LIBOR USD 1 Month + 0.40%), 2.19%, 01/25/36(a) | | | 40 | | | | 26,775 | |
Flatiron CLO Ltd., Series2015-1A, Class AR, (LIBOR USD 3 Month + 0.89%), 2.89%, 04/15/27(a)(b) | | | 216 | | | | 215,960 | |
GSAMP Trust(a): | | | | | | | | |
Series2007-H1, Class A1B, (LIBOR USD 1 Month + 0.20%),
1.99%, 01/25/47 | | | 28 | | | | 16,773 | |
Series2007-HS1, Class M6, (LIBOR USD 1 Month + 2.25%),
4.04%, 02/25/47 | | | 25 | | | | 25,899 | |
Halcyon Loan Advisors Funding Ltd., Series2015-2A, Class AR, (LIBOR USD 3 Month + 1.08%),
3.02%, 07/25/27(a)(b) | | | 218 | | | | 218,086 | |
Home Equity Asset Trust, Series2007-1, Class 2A3, (LIBOR USD 1 Month + 0.15%), 1.94%, 05/25/37(a) | | | 40 | | | | 33,395 | |
Home Equity Mortgage Trust, Series2006-2, Class 1A1, 5.87%, 07/25/36(e) | | | 155 | | | | 44,329 | |
Home Loan Mortgage Loan Trust, Series 2005- 1, Class A3, (LIBOR USD 1 Month + 0.72%), 2.46%, 04/15/36(a) | | | 34 | | | | 31,332 | |
ICG US CLO Ltd., Series2015-1A, Class A1R, (LIBOR USD 3 Month + 1.14%), 3.11%, 10/19/28(a)(b) | | | 250 | | | | 249,109 | |
Invitation Homes Trust, Series 2018-SFR3, Class E, (LIBOR USD 1 Month + 2.00%), 3.74%, 07/17/37(a)(b) | | | 100 | | | | 100,313 | |
IXIS Real Estate Capital Trust, Series 2007- HE1, Class A4, (LIBOR USD 1 Month + 0.23%), 2.02%, 05/25/37(a) | | | 686 | | | | 244,999 | |
Legacy Mortgage Asset Trust(b): | | | | | | | | |
Series2019-GS2, Class A1,
3.75%, 01/25/59(e) | | | 35 | | | | 35,720 | |
Series2019-SL1, Class A,
4.00%, 12/28/54(d) | | | 128 | | | | 128,992 | |
Lehman ABS Manufactured Housing Contract Trust: | | | | | | | | |
Series2001-B, Class M1,
6.63%, 04/15/40(d) | | | 112 | | | | 120,099 | |
Series2002-A, Class C,
0.00%, 06/15/33 | | | 7 | | | | 6,093 | |
Litigation Fee Residual Funding LLC, Series2015-1, Class A,
4.00%, 10/30/27(c) | | | 89 | | | | 88,437 | |
| | | | | | | | |
| Security | | Par
(000) | | | Value | |
| |
| Asset-Backed Securities (continued) | | | | |
Long Beach Mortgage Loan Trust(a): | | | | | | | | |
Series2006-2, Class 1A, (LIBOR USD 1 Month + 0.18%), 1.97%, 03/25/46 | | | USD 91 | | | $ | 73,270 | |
Series2006-5, Class 2A3, (LIBOR USD 1 Month + 0.15%), 1.94%, 06/25/36 | | | 26 | | | | 14,078 | |
Series2006-7, Class 2A3, (LIBOR USD 1 Month + 0.16%), 1.95%, 08/25/36 | | | 17 | | | | 9,195 | |
Series2006-9, Class 2A2, (LIBOR USD 1 Month + 0.11%), 1.90%, 10/25/36 | | | 21 | | | | 8,767 | |
Series2006-10, Class 2A4, (LIBOR USD 1 Month + 0.22%), 2.01%, 11/25/36 | | | 15 | | | | 7,015 | |
Madison Park Funding XVIII Ltd., Series 2015- 18A, Class A1R, (LIBOR USD 3 Month + 1.19%), 3.16%, 10/21/30(a)(b) | | | 250 | | | | 250,157 | |
Merrill Lynch First Franklin Mortgage Loan Trust, Series2007-2, Class A2C, (LIBOR USD 1 Month + 0.24%), 2.03%, 05/25/37(a) | | | 23 | | | | 17,349 | |
Morgan Stanley ABS Capital I, Inc. Trust(a): | | | | | | | | |
Series2005-HE1, Class A2MZ, (LIBOR USD 1 Month + 0.60%), 2.39%, 12/25/34 | | | 78 | | | | 77,803 | |
Series2007-NC1, Class A1, (LIBOR USD 1 Month + 0.13%), 1.92%, 11/25/36 | | | 190 | | | | 112,839 | |
Morgan Stanley Mortgage Loan Trust, Series2007-9SL, Class A, (LIBOR USD 1 Month + 0.32%), 2.35%, 07/25/37(a) | | | 17 | | | | 16,362 | |
MP CLO VIII Ltd., Series2015-2A, Class AR, (LIBOR USD 3 Month + 0.91%),
2.85%, 10/28/27(a)(b) | | | 250 | | | | 249,518 | |
Oakwood Mortgage Investors, Inc., Series2001-D, Class A4, 6.93%, 09/15/31(d) | | | 12 | | | | 9,725 | |
OCP CLO Ltd., Series2016-12A, Class A1R, (LIBOR USD 3 Month + 1.12%),
3.12%, 10/18/28(a)(b) | | | 100 | | | | 100,152 | |
Octagon Investment Partners 33 Ltd., Series2017-1A, Class A1, (LIBOR USD 3 Month + 1.19%), 3.16%, 01/20/31(a)(b) | | | 250 | | | | 250,152 | |
Octagon Investment Partners XVI Ltd., Series2013-1A, Class A1R, (LIBOR USD 3 Month + 1.02%), 3.02%, 07/17/30(a)(b) | | | 305 | | | | 302,202 | |
OFSI Fund VI Ltd., Series2014-6A, Class A2R, (LIBOR USD 3 Month + 1.13%), 3.13%, 03/20/25(a)(b) | | | 193 | | | | 192,565 | |
OHA Loan Funding Ltd., Series2013-2A, Class AR, (LIBOR USD 3 Month + 1.04%),
2.95%, 05/23/31(a)(b) | | | 285 | | | | 283,812 | |
Option One Mortgage Loan Trust: | | | | | | | | |
Series2007-CP1, Class 2A3, (LIBOR USD 1 Month + 0.21%), 2.00%, 03/25/37(a) | | | 40 | | | | 27,974 | |
Series 2007-FXD1, Class 1A1,
5.87%, 01/25/37(e) | | | 38 | | | | 36,865 | |
Series 2007-FXD1, Class 2A1,
5.87%, 01/25/37(e) | | | 46 | | | | 45,688 | |
Series 2007-FXD2, Class 1A1,
5.82%, 03/25/37(e) | | | 173 | | | | 174,493 | |
Origen Manufactured Housing Contract Trust, Series2007-B, Class A1, (LIBOR USD 1 Month + 1.20%), 2.94%, 10/15/37(a)(b)(c) | | | 30 | | | | 29,584 | |
Ownit Mortgage Loan Trust, Series2006-2, Class A2C, 6.00%, 01/25/37(e) | | | 30 | | | | 28,782 | |
OZLM Funding IV Ltd., Series2013-4A, Class A1R, (LIBOR USD 3 Month + 1.25%),
3.20%, 10/22/30(a)(b) | | | 495 | | | | 492,141 | |
OZLM XXI Ltd., Series2017-21A, Class B, (LIBOR USD 3 Month + 1.90%),
3.87%, 01/20/31(a)(b) | | | 250 | | | | 240,987 | |
| | | | |
| SCHEDULES OF INVESTMENTS | | | 33 | |
| | |
Schedule of Investments (continued) December 31, 2019 | | BlackRock Balanced Capital Portfolio (Percentages shown are based on Net Assets) |
| | | | | | | | |
| Security | | Par
(000) | | | Value | |
| |
| Asset-Backed Securities (continued) | | | | |
Parallel Ltd., Series2015-1A, Class AR, (LIBOR USD 3 Month + 0.85%),
2.82%, 07/20/27(a)(b) | | | USD 250 | | | $ | 249,548 | |
Regatta VI Funding Ltd., Series2016-1A, Class AR, (LIBOR USD 3 Month + 1.08%), 3.05%, 07/20/28(a)(b) | | | 250 | | | | 249,938 | |
Rockford Tower CLO Ltd., Series2017-1A, Class B, (LIBOR USD 3 Month + 1.80%), 3.80%, 04/15/29(a)(b) | | | 250 | | | | 250,106 | |
Scholar Funding Trust, Series2013-A, Class A, (LIBOR USD 1 Month + 0.65%), 2.45%, 01/30/45(a)(b) | | | 187 | | | | 182,661 | |
Securitized Asset-Backed Receivables LLC Trust, Series2006-WM4, Class A1, (LIBOR USD 1 Month + 0.19%),
1.98%, 11/25/36(a)(b) | | | 41 | | | | 23,883 | |
SG Mortgage Securities Trust, Series 2006- FRE2, Class A2C, (LIBOR USD 1 Month + 0.16%), 1.95%, 07/25/36(a) | | | 17 | | | | 5,161 | |
Silver Creek CLO Ltd., Series2014-1A, Class AR, (LIBOR USD 3 Month + 1.24%), 3.21%, 07/20/30(a)(b) | | | 250 | | | | 250,601 | |
SLM Private Credit Student Loan Trust(a): | | | | | | | | |
Series2004-B, Class A3, (LIBOR USD 3 Month + 0.33%), 2.22%, 03/15/24 | | | 95 | | | | 94,685 | |
Series2005-A, Class A3, (LIBOR USD 3 Month + 0.20%), 2.09%, 06/15/23 | | | 19 | | | | 19,264 | |
Sound Point CLO XIV Ltd., Series2016-3A, Class C, (LIBOR USD 3 Month + 2.65%), 4.58%, 01/23/29(a)(b) | | | 250 | | | | 246,684 | |
Structured Asset Investment Loan Trust, Series2004-8, Class M4, (LIBOR USD 1 Month + 1.50%), 3.29%, 09/25/34(a) | | | 39 | | | | 38,861 | |
Structured Asset Securities Corp. Mortgage Pass-Through Certificates, Series 2004-23XS, Class 2A1, (LIBOR USD 1 Month + 0.30%),
2.09%, 01/25/35(a) | | | 42 | | | | 41,453 | |
Symphony CLO XVII Ltd., Series2016-17A, Class AR, (LIBOR USD 3 Month + 0.88%), 2.88%, 04/15/28(a)(b) | | | 250 | | | | 249,522 | |
TCI-Flatiron CLO Ltd., Series2017-1A, Class A, (LIBOR USD 3 Month + 1.20%), 3.10%, 11/18/30(a)(b) | | | 250 | | | | 250,129 | |
Venture 35 CLO Ltd., Series2018-35A, Class AS, (LIBOR USD 3 Month + 1.15%), 3.10%, 10/22/31(a)(b) | | | 250 | | | | 249,146 | |
Voya CLO Ltd., Series2019-1A, Class A, (LIBOR USD 3 Month + 1.17%),
3.17%, 04/15/29(a)(b) | | | 225 | | | | 224,670 | |
Wachovia Asset Securitization Issuance II LLC Trust, Series 2007-HE2A, Class A, (LIBOR USD 1 Month + 0.13%),
1.92%, 07/25/37(a)(b) | | | 56 | | | | 53,053 | |
| | | | | | | | |
| | |
Total Asset-Backed Securities — 3.2%
(Cost: $16,295,263) | | | | | | | 16,222,452 | |
| | | | | | | | |
| | |
| | | Shares | | | | |
| | |
Common Stocks — 60.1% | | | | | | | | |
| | |
Aerospace & Defense — 1.7% | | | | | | | | |
Boeing Co. (The) | | | 477 | | | | 155,387 | |
Curtiss-Wright Corp. | | | 629 | | | | 88,620 | |
HEICO Corp. | | | 1,678 | | | | 191,544 | |
HEICO Corp., Class A | | | 408 | | | | 36,528 | |
Hexcel Corp.(f) | | | 3,382 | | | | 247,934 | |
Lockheed Martin Corp. | | | 10,816 | | | | 4,211,534 | |
Northrop Grumman Corp. | | | 2,648 | | | | 910,833 | |
| | | | | | | | |
| Security | | Shares | | | Value | |
| |
| Aerospace & Defense (continued) | | | | |
Raytheon Co. | | | 5,682 | | | $ | 1,248,563 | |
Teledyne Technologies, Inc.(g) | | | 4,689 | | | | 1,624,926 | |
United Technologies Corp. | | | 1 | | | | 150 | |
| | | | | | | | |
| | | | | | | 8,716,019 | |
| | |
| Air Freight & Logistics — 0.0% | | | | | | |
Expeditors International of Washington, Inc. | | | 2,388 | | | | 186,312 | |
United Parcel Service, Inc., Class B | | | 461 | | | | 53,964 | |
| | | | | | | | |
| | | | | | | 240,276 | |
| | |
| Airlines — 0.3% | | | | | | |
Alaska Air Group, Inc. | | | 6,346 | | | | 429,942 | |
Delta Air Lines, Inc. | | | 2,093 | | | | 122,399 | |
United Airlines Holdings, Inc.(g) | | | 10,416 | | | | 917,545 | |
| | | | | | | | |
| | | | | | | 1,469,886 | |
| | |
| Auto Components — 0.1% | | | | | | |
Dana, Inc. | | | 10,115 | | | | 184,093 | |
Gentex Corp. | | | 1,928 | | | | 55,874 | |
Goodyear Tire & Rubber Co. (The) | | | 18,626 | | | | 289,727 | |
| | | | | | | | |
| | | | | | | 529,694 | |
| | |
| Automobiles — 0.3% | | | | | | |
Ford Motor Co.(f) | | | 62,804 | | | | 584,077 | |
General Motors Co. | | | 17,448 | | | | 638,597 | |
Harley-Davidson, Inc.(f) | | | 1,163 | | | | 43,252 | |
Tesla, Inc.(g) | | | 1,076 | | | | 450,123 | |
| | | | | | | | |
| | | | | | | 1,716,049 | |
| | |
| Banks — 2.2% | | | | | | |
Bank of America Corp. | | | 69,386 | | | | 2,443,775 | |
Bank OZK | | | 2,581 | | | | 78,733 | |
CIT Group, Inc. | | | 20,927 | | | | 954,899 | |
Citizens Financial Group, Inc. | | �� | 13,162 | | | | 534,509 | |
Cullen/Frost Bankers, Inc.(f) | | | 5,571 | | | | 544,732 | |
East West Bancorp, Inc. | | | 9,738 | | | | 474,241 | |
First Citizens BancShares, Inc., Class A | | | 74 | | | | 39,384 | |
First Horizon National Corp. | | | 8,312 | | | | 137,647 | |
JPMorgan Chase & Co. | | | 25,123 | | | | 3,502,146 | |
PacWest Bancorp | | | 1,575 | | | | 60,275 | |
Truist Financial Corp. | | | 5,315 | | | | 299,341 | |
US Bancorp(f) | | | 6,224 | | | | 369,021 | |
Wells Fargo & Co. | | | 30,581 | | | | 1,645,258 | |
Zions Bancorp NA | | | 1,033 | | | | 53,633 | |
| | | | | | | | |
| | | | | | | 11,137,594 | |
| | |
| Beverages — 0.7% | | | | | | |
Coca-Cola Co. (The) | | | 5,798 | | | | 320,919 | |
Coca-Cola European Partners plc | | | 6,232 | | | | 317,084 | |
Molson Coors Brewing Co., Class B(f) | | | 3,307 | | | | 178,247 | |
Monster Beverage Corp.(g) | | | 11,448 | | | | 727,521 | |
PepsiCo, Inc.(f) | | | 16,123 | | | | 2,203,531 | |
| | | | | | | | |
| | | | | | | 3,747,302 | |
| | |
| Biotechnology — 2.3% | | | | | | |
AbbVie, Inc. | | | 22,158 | | | | 1,961,869 | |
Alexion Pharmaceuticals, Inc.(g) | | | 2,183 | | | | 236,092 | |
Amgen, Inc. | | | 5,652 | | | | 1,362,528 | |
Biogen, Inc.(g) | | | 2,388 | | | | 708,591 | |
Gilead Sciences,Inc.(f) | | | 63,529 | | | | 4,128,114 | |
Incyte Corp.(g) | | | 2,806 | | | | 245,020 | |
Regeneron Pharmaceuticals, Inc.(g) | | | 3,092 | | | | 1,160,984 | |
United Therapeutics Corp.(g) | | | 4,286 | | | | 377,511 | |
Vertex Pharmaceuticals, Inc.(g) | | | 6,405 | | | | 1,402,375 | |
| | | | | | | | |
| | | | | | | 11,583,084 | |
| | |
| 34 | | 2019 BLACKROCK ANNUAL REPORTTO SHAREHOLDERS |
| | |
Schedule of Investments (continued) December 31, 2019 | | BlackRock Balanced Capital Portfolio (Percentages shown are based on Net Assets) |
| | | | | | | | |
| Security | | Shares | | | Value | |
|
| Building Products— 0.6% | |
Allegion plc | | | 21,403 | | | $ | 2,665,530 | |
Resideo Technologies, Inc.(g) | | | 8,764 | | | | 104,554 | |
| | | | | | | | |
| | | | | | | 2,770,084 | |
|
| Capital Markets— 2.4% | |
Affiliated Managers Group, Inc.(f) | | | 3,982 | | | | 337,435 | |
Bank of New York Mellon Corp. (The) | | | 8,748 | | | | 440,287 | |
Charles Schwab Corp. (The) | | | 22,606 | | | | 1,075,141 | |
CME Group, Inc. | | | 4,987 | | | | 1,000,991 | |
Evercore, Inc., Class A | | | 2,830 | | | | 211,571 | |
FactSet Research Systems, Inc.(f) | | | 4,648 | | | | 1,247,059 | |
Intercontinental Exchange, Inc. | | | 20,603 | | | | 1,906,808 | |
Moody’s Corp. | | | 3,349 | | | | 795,086 | |
Morgan Stanley | | | 41,505 | | | | 2,121,736 | |
Nasdaq, Inc. | | | 424 | | | | 45,410 | |
S&P Global, Inc. | | | 9,168 | | | | 2,503,322 | |
SEI Investments Co. | | | 905 | | | | 59,259 | |
Stifel Financial Corp. | | | 519 | | | | 31,477 | |
TD Ameritrade Holding Corp. | | | 9,540 | | | | 474,138 | |
| | | | | | | | |
| | | | | | | 12,249,720 | |
|
| Chemicals— 0.9% | |
Air Products & Chemicals, Inc. | | | 3,374 | | | | 792,856 | |
CF Industries Holdings, Inc. | | | 6,898 | | | | 329,310 | |
Ecolab, Inc. | | | 6,517 | | | | 1,257,716 | |
LyondellBasell Industries NV, Class A | | | 5,248 | | | | 495,831 | |
Mosaic Co. (The) | | | 17,983 | | | | 389,152 | |
ScottsMiracle-Gro Co. (The) | | | 305 | | | | 32,385 | |
Sherwin-Williams Co. (The) | | | 1,744 | | | | 1,017,694 | |
| | | | | | | | |
| | | | | | | 4,314,944 | |
|
| Commercial Services & Supplies— 0.1% | |
ADT, Inc. | | | 11,984 | | | | 95,033 | |
Cintas Corp. | | | 1,057 | | | | 284,418 | |
Copart, Inc.(g) | | | 2,050 | | | | 186,427 | |
| | | | | | | | |
| | | | | | | 565,878 | |
|
| Communications Equipment— 0.4% | |
Ciena Corp.(g) | | | 8,112 | | | | 346,301 | |
Cisco Systems, Inc. | | | 32,930 | | | | 1,579,323 | |
| | | | | | | | |
| | | | | | | 1,925,624 | |
|
| Construction & Engineering— 0.2% | |
AECOM(g) | | | 1,457 | | | | 62,840 | |
EMCOR Group, Inc. | | | 483 | | | | 41,683 | |
Fluor Corp. | | | 15,915 | | | | 300,475 | |
MasTec, Inc.(g) | | | 9,431 | | | | 605,093 | |
| | | | | | | | |
| | | | | | | 1,010,091 | |
|
| Consumer Finance— 0.7% | |
Ally Financial, Inc. | | | 25,305 | | | | 773,321 | |
American Express Co. | | | 12,061 | | | | 1,501,474 | |
Capital One Financial Corp. | | | 11,642 | | | | 1,198,078 | |
| | | | | | | | |
| | | | | | | 3,472,873 | |
|
| Containers & Packaging— 0.1% | |
Westrock Co. | | | 12,476 | | | | 535,345 | |
| | | | | | | | |
|
| Distributors— 0.0% | |
Pool Corp. | | | 573 | | | | 121,694 | |
| | | | | | | | |
|
| Diversified Consumer Services— 0.1% | |
H&R Block, Inc. | | | 22,611 | | | | 530,906 | |
| | | | | | | | |
|
| Diversified Financial Services— 1.1% | |
AXA Equitable Holdings, Inc. | | | 5,281 | | | | 130,863 | |
Berkshire Hathaway, Inc., Class B(f)(g) | | | 22,678 | | | | 5,136,567 | |
| | | | | | | | |
| | | | | | | 5,267,430 | |
| | | | | | | | |
| Security | | Shares | | | Value | |
|
| Diversified Telecommunication Services— 1.1% | |
AT&T, Inc.(f) | | | 53,494 | | | $ | 2,090,545 | |
CenturyLink, Inc. | | | 22,587 | | | | 298,374 | |
Verizon Communications, Inc. | | | 53,414 | | | | 3,279,620 | |
| | | | | | | | |
| | | | | | | 5,668,539 | |
|
| Electric Utilities— 0.7% | |
Alliant Energy Corp. | | | 1,411 | | | | 77,210 | |
IDACORP, Inc. | | | 2,442 | | | | 260,806 | |
Pinnacle West Capital Corp. | | | 6,058 | | | | 544,796 | |
Xcel Energy,Inc. | | | 41,401 | | | | 2,628,549 | |
| | | | | | | | |
| | | | | | | 3,511,361 | |
|
| Electrical Equipment— 0.5% | |
AMETEK, Inc. | | | 14,937 | | | | 1,489,817 | |
Hubbell, Inc.(f) | | | 7,210 | | | | 1,065,782 | |
| | | | | | | | |
| | | | | | | 2,555,599 | |
|
| Electronic Equipment, Instruments & Components— 0.6% | |
Avnet, Inc. | | | 4,619 | | | | 196,030 | |
CDW Corp. | | | 11,740 | | | | 1,676,942 | |
National Instruments Corp. | | | 21,199 | | | | 897,566 | |
| | | | | | | | |
| | | | | | | 2,770,538 | |
|
| Energy Equipment & Services— 0.1% | |
Patterson-UTI Energy,Inc. | | | 15,327 | | | | 160,934 | |
TechnipFMC plc | | | 3,041 | | | | 65,199 | |
Transocean Ltd.(g) | | | 66,332 | | | | 456,364 | |
| | | | | | | | |
| | | | | | | 682,497 | |
|
| Entertainment— 0.9% | |
Activision Blizzard, Inc. | | | 1,335 | | | | 79,326 | |
Cinemark Holdings, Inc. | | | 10,391 | | | | 351,735 | |
Electronic Arts, Inc.(g) | | | 3,611 | | | | 388,219 | |
Live Nation Entertainment, Inc.(g) | | | 8,670 | | | | 619,645 | |
Netflix, Inc.(f)(g) | | | 945 | | | | 305,774 | |
Spotify Technology SA(g) | | | 2,017 | | | | 301,642 | |
Take-Two Interactive Software, Inc.(g) | | | 5,140 | | | | 629,290 | |
Walt Disney Co. (The) | | | 8,071 | | | | 1,167,309 | |
Zynga, Inc., Class A(g) | | | 75,652 | | | | 462,990 | |
| | | | | | | | |
| | | | | | | 4,305,930 | |
|
| Equity Real Estate Investment Trusts (REITs)— 1.8% | |
Boston Properties, Inc. | | | 4,262 | | | | 587,559 | |
Equity Residential | | | 5,993 | | | | 484,954 | |
Essex Property Trust, Inc. | | | 88 | | | | 26,476 | |
Host Hotels &Resorts, Inc.(f) | | | 13,359 | | | | 247,810 | |
Invitation Homes, Inc. | | | 26,454 | | | | 792,826 | |
Lamar Advertising Co., Class A | | | 13,828 | | | | 1,234,287 | |
National Retail Properties, Inc. | | | 2,665 | | | | 142,897 | |
Outfront Media, Inc. | | | 5,160 | | | | 138,391 | |
Park Hotels & Resorts, Inc.(f) | | | 54,731 | | | | 1,415,891 | |
Prologis, Inc. | | | 7,126 | | | | 635,212 | |
Regency Centers Corp. | | | 1,070 | | | | 67,506 | |
RLJ Lodging Trust | | | 45,629 | | | | 808,546 | |
Simon Property Group, Inc. | | | 15,195 | | | | 2,263,447 | |
| | | | | | | | |
| | | | | | | 8,845,802 | |
|
| Food & Staples Retailing— 1.0% | |
Costco Wholesale Corp. | | | 12,903 | | | | 3,792,449 | |
Performance Food Group Co.(g) | | | 16,481 | | | | 848,442 | |
Walmart, Inc. | | | 5,170 | | | | 614,403 | |
| | | | | | | | |
| | | | | | | 5,255,294 | |
|
| Food Products— 0.5% | |
Hershey Co. (The) | | | 16,495 | | | | 2,424,435 | |
Hormel Foods Corp.(f) | | | 4,809 | | | | 216,934 | |
| | | | | | | | |
| | | | | | | 2,641,369 | |
| | | | |
| SCHEDULES OF INVESTMENTS | | | 35 | |
| | |
Schedule of Investments (continued) December 31, 2019 | | BlackRock Balanced Capital Portfolio (Percentages shown are based on Net Assets) |
| | | | | | | | |
| Security | | Shares | | | Value | |
|
Gas Utilities— 0.1% | |
Atmos Energy Corp. | | | 868 | | | $ | 97,094 | |
Southwest Gas Holdings, Inc. | | | 6,583 | | | | 500,111 | |
| | | | | | | | |
| | | | | | | 597,205 | |
|
| Health Care Equipment & Supplies— 1.6% | |
Danaher Corp. | | | 1,858 | | | | 285,166 | |
DexCom, Inc.(g) | | | 2,372 | | | | 518,851 | |
Edwards Lifesciences Corp.(g) | | | 6,357 | | | | 1,483,024 | |
Hologic, Inc.(g) | | | 13,257 | | | | 692,148 | |
IDEXX Laboratories, Inc.(g) | | | 2,633 | | | | 687,555 | |
Medtronic plc | | | 7,729 | | | | 876,855 | |
Stryker Corp. | | | 15,924 | | | | 3,343,085 | |
| | | | | | | | |
| | | | | | | 7,886,684 | |
|
| Health Care Providers & Services— 1.5% | |
AmerisourceBergen Corp. | | | 8,221 | | | | 698,949 | |
Anthem, Inc. | | | 7,786 | | | | 2,351,606 | |
Cigna Corp. | | | 2,042 | | | | 417,569 | |
CVS Health Corp. | | | 24,462 | | | | 1,817,282 | |
Humana, Inc. | | | 1,066 | | | | 390,710 | |
McKesson Corp. | | | 839 | | | | 116,050 | |
UnitedHealth Group, Inc. | | | 5,488 | | | | 1,613,362 | |
WellCare Health Plans, Inc.(g) | | | 517 | | | | 170,719 | |
| | | | | | | | |
| | | | | | | 7,576,247 | |
|
| Health Care Technology— 0.2% | |
Veeva Systems, Inc., Class A(g) | | | 5,442 | | | | 765,472 | |
| | | | | | | | |
|
| Hotels, Restaurants & Leisure— 1.4% | |
Boyd Gaming Corp.(f) | | | 9,416 | | | | 281,915 | |
Carnival Corp. | | | 6,259 | | | | 318,145 | |
Chipotle Mexican Grill, Inc.(g) | | | 103 | | | | 86,222 | |
Choice Hotels International, Inc.(f) | | | 14,230 | | | | 1,471,809 | |
Darden Restaurants, Inc. | | | 15,466 | | | | 1,685,949 | |
Dunkin’ Brands Group, Inc. | | | 767 | | | | 57,939 | |
Extended Stay America, Inc. | | | 49,193 | | | | 731,008 | |
International Game Technology plc(f) | | | 4,730 | | | | 70,808 | |
McDonald’s Corp.(f) | | | 7,445 | | | | 1,471,207 | |
Penn National Gaming, Inc.(g) | | | 10,565 | | | | 270,041 | |
Texas Roadhouse, Inc. | | | 7,485 | | | | 421,555 | |
| | | | | | | | |
| | | | | | | 6,866,598 | |
|
| Household Durables— 0.2% | |
DR Horton, Inc. | | | 14,733 | | | | 777,166 | |
Helen of Troy Ltd.(g) | | | 349 | | | | 62,746 | |
| | | | | | | | |
| | | | | | | 839,912 | |
|
| Household Products— 0.9% | |
Church & Dwight Co., Inc. | | | 19,371 | | | | 1,362,556 | |
Procter & Gamble Co. (The) | | | 24,045 | | | | 3,003,221 | |
| | | | | | | | |
| | | | | | | 4,365,777 | |
|
| Industrial Conglomerates— 0.5% | |
3M Co. | | | 163 | | | | 28,756 | |
Carlisle Cos., Inc. | | | 850 | | | | 137,564 | |
Honeywell International, Inc. | | | 7,643 | | | | 1,352,811 | |
Roper Technologies, Inc. | | | 2,803 | | | | 992,907 | |
| | | | | | | | |
| | | | | | | 2,512,038 | |
|
| Insurance— 1.9% | |
Aflac, Inc. | | | 2,096 | | | | 110,878 | |
Allstate Corp. (The) | | | 15,613 | | | | 1,755,682 | |
Aon plc | | | 155 | | | | 32,285 | |
Arthur J Gallagher & Co. | | | 9,225 | | | | 878,497 | |
Brown & Brown, Inc. | | | 4,995 | | | | 197,203 | |
Cincinnati Financial Corp. | | | 6,085 | | | | 639,838 | |
First American Financial Corp. | | | 20,633 | | | | 1,203,316 | |
Globe Life, Inc. | | | 7,766 | | | | 817,371 | |
| | | | | | | | |
| Security | | Shares | | | Value | |
|
Insurance (continued) | |
Lincoln National Corp. | | | 5,681 | | | $ | 335,236 | |
Marsh & McLennan Cos., Inc. | | | 3,992 | | | | 444,749 | |
MetLife, Inc. | | | 6,890 | | | | 351,183 | |
Progressive Corp. (The) | | | 5,222 | | | | 378,021 | |
Prudential Financial, Inc. | | | 11,370 | | | | 1,065,824 | |
Travelers Cos., Inc. (The) | | | 3,430 | | | | 469,738 | |
Unum Group | | | 11,246 | | | | 327,933 | |
Willis Towers Watson plc | | | 1,324 | | | | 267,369 | |
WR Berkley Corp. | | | 4,206 | | | | 290,635 | |
| | | | | | | | |
| | | | | | | 9,565,758 | |
|
| Interactive Media & Services— 2.9%(g) | |
Alphabet, Inc., Class A | | | 2,840 | | | | 3,803,868 | |
Alphabet, Inc., Class C | | | 3,072 | | | | 4,107,325 | |
Facebook, Inc., Class A | | | 25,632 | | | | 5,260,968 | |
Pinterest, Inc., Class A | | | 13,434 | | | | 250,410 | |
TripAdvisor, Inc. | | | 9,843 | | | | 299,030 | |
Twitter,Inc. | | | 10,472 | | | | 335,628 | |
Yelp, Inc. | | | 6,769 | | | | 235,764 | |
| | | | | | | | |
| | | | | | | 14,292,993 | |
|
| Internet & Direct Marketing Retail— 1.8%(g) | |
Amazon.com, Inc. | | | 4,826 | | | | 8,917,676 | |
Qurate Retail, Inc. | | | 4,425 | | | | 37,303 | |
| | | | | | | | |
| | | | | | | 8,954,979 | |
|
| IT Services— 3.2% | |
Amdocs Ltd. | | | 3,714 | | | | 268,114 | |
Automatic Data Processing, Inc. | | | 16,793 | | | | 2,863,207 | |
Booz Allen Hamilton Holding Corp. | | | 1,464 | | | | 104,134 | |
Broadridge Financial Solutions, Inc. | | | 5,890 | | | | 727,651 | |
DXC Technology Co. | | | 5,664 | | | | 212,910 | |
GoDaddy, Inc., Class A(g) | | | 10,261 | | | | 696,927 | |
International Business Machines Corp. | | | 511 | | | | 68,494 | |
Jack Henry & Associates, Inc. | | | 4,311 | | | | 627,983 | |
Mastercard, Inc., Class A | | | 20,464 | | | | 6,110,346 | |
Paychex, Inc. | | | 27,467 | | | | 2,336,343 | |
PayPal Holdings, Inc.(g) | | | 658 | | | | 71,176 | |
Visa, Inc., Class A | | | 10,546 | | | | 1,981,593 | |
| | | | | | | | |
| | | | | | | 16,068,878 | |
|
| Life Sciences Tools & Services— 0.1% | |
Thermo Fisher Scientific, Inc. | | | 776 | | | | 252,099 | |
| | | | | | | | |
|
| Machinery— 1.4% | |
AGCO Corp. | | | 4,754 | | | | 367,247 | |
IDEX Corp. | | | 5,257 | | | | 904,204 | |
Ingersoll-Rand plc | | | 457 | | | | 60,744 | |
Oshkosh Corp. | | | 16,315 | | | | 1,544,215 | |
PACCAR, Inc. | | | 44,663 | | | | 3,532,843 | |
Snap-on, Inc. | | | 3,810 | | | | 645,414 | |
Xylem, Inc. | | | 351 | | | | 27,655 | |
| | | | | | | | |
| | | | | | | 7,082,322 | |
|
| Media— 1.2% | |
AMC Networks, Inc., Class A(g) | | | 14,601 | | | | 576,739 | |
Comcast Corp., Class A | | | 26,147 | | | | 1,175,831 | |
Discovery, Inc., Class A(g) | | | 21,995 | | | | 720,116 | |
Interpublic Group of Cos., Inc. (The) | | | 72,139 | | | | 1,666,411 | |
Liberty Media Corp.-Liberty SiriusXM, Class A(g) | | | 865 | | | | 41,814 | |
Sinclair Broadcast Group, Inc., Class A(f) | | | 1,781 | | | | 59,379 | |
Sirius XM Holdings, Inc.(f) | | | 223,433 | | | | 1,597,546 | |
| | | | | | | | |
| | | | | | | 5,837,836 | |
|
| Metals & Mining— 0.2% | |
Alcoa Corp.(g) | | | 23,049 | | | | 495,784 | |
Reliance Steel & Aluminum Co. | | | 3,978 | | | | 476,405 | |
| | |
| 36 | | 2019 BLACKROCK ANNUAL REPORTTO SHAREHOLDERS |
| | |
Schedule of Investments (continued) December 31, 2019 | | BlackRock Balanced Capital Portfolio (Percentages shown are based on Net Assets) |
| | | | | | | | |
| Security | | Shares | | | Value | |
|
Metals & Mining (continued) | |
Steel Dynamics, Inc. | | | 950 | | | $ | 32,338 | |
| | | | | | | | |
| | | | | | | 1,004,527 | |
|
| Multiline Retail— 0.4% | |
Dollar General Corp. | | | 10,038 | | | | 1,565,727 | |
Target Corp. | | | 4,130 | | | | 529,508 | |
| | | | | | | | |
| | | | | | | 2,095,235 | |
|
| Multi-Utilities— 0.7% | |
Ameren Corp. | | | 14,266 | | | | 1,095,629 | |
Consolidated Edison, Inc. | | | 12,163 | | | | 1,100,387 | |
DTE Energy Co. | | | 10,550 | | | | 1,370,128 | |
| | | | | | | | |
| | | | | | | 3,566,144 | |
|
| Oil, Gas & Consumable Fuels— 2.1% | |
ConocoPhillips | | | 11,768 | | | | 765,273 | |
Continental Resources, Inc.(g) | | | 12,443 | | | | 426,795 | |
Devon Energy Corp. | | | 4,368 | | | | 113,437 | |
EOG Resources, Inc. | | | 15,436 | | | | 1,292,919 | |
Exxon Mobil Corp. | | | 64,821 | | | | 4,523,209 | |
Marathon Oil Corp. | | | 7,145 | | | | 97,029 | |
Marathon Petroleum Corp.(f) | | | 18,814 | | | | 1,133,544 | |
Phillips 66 | | | 1,127 | | | | 125,559 | |
Suncor Energy,Inc.(f) | | | 18,471 | | | | 605,849 | |
Valero Energy Corp. | | | 6,568 | | | | 615,093 | |
Williams Cos., Inc. (The) | | | 29,641 | | | | 703,085 | |
| | | | | | | | |
| | | | | | | 10,401,792 | |
|
| Paper & Forest Products— 0.2% | |
Domtar Corp. | | | 20,581 | | | | 787,017 | |
| | | | | | | | |
|
| Personal Products— 0.4% | |
Estee Lauder Cos., Inc. (The), Class A(f) | | | 10,213 | | | | 2,109,393 | |
| | | | | | | | |
|
| Pharmaceuticals— 2.9% | |
Bristol-Myers Squibb Co. | | | 38,703 | | | | 2,484,346 | |
Johnson & Johnson | | | 35,158 | | | | 5,128,497 | |
Merck & Co., Inc. | | | 33,840 | | | | 3,077,748 | |
Mylan NV(g) | | | 20,357 | | | | 409,176 | |
Pfizer, Inc. | | | 36,870 | | | | 1,444,567 | |
Zoetis, Inc. | | | 15,412 | | | | 2,039,778 | |
| | | | | | | | |
| | | | | | | 14,584,112 | |
|
| Professional Services— 0.2% | |
CoStar Group, Inc.(g) | | | 202 | | | | 120,857 | |
IHS Markit Ltd.(g) | | | 2,514 | | | | 189,430 | |
Robert Half International, Inc. | | | 11,482 | | | | 725,088 | |
| | | | | | | | |
| | | | | | | 1,035,375 | |
|
| Road & Rail— 0.3% | |
CSX Corp. | | | 2,407 | | | | 174,170 | |
Landstar System, Inc. | | | 6,931 | | | | 789,233 | |
Lyft, Inc., Class A(g) | | | 2,255 | | | | 97,010 | |
Old Dominion Freight Line, Inc. | | | 1,386 | | | | 263,035 | |
Ryder System, Inc. | | | 2,564 | | | | 139,251 | |
| | | | | | | | |
| | | | | | | 1,462,699 | |
|
| Semiconductors & Semiconductor Equipment— 2.3% | |
Applied Materials, Inc. | | | 27,815 | | | | 1,697,828 | |
Cirrus Logic, Inc.(f)(g) | | | 12,466 | | | | 1,027,323 | |
Cypress Semiconductor Corp. | | | 3,757 | | | | 87,651 | |
Intel Corp. | | | 48,744 | | | | 2,917,328 | |
Lam Research Corp. | | | 4,572 | | | | 1,336,853 | |
Micron Technology, Inc.(g) | | | 6,788 | | | | 365,059 | |
NVIDIA Corp. | | | 8,194 | | | | 1,928,048 | |
QUALCOMM, Inc. | | | 7,181 | | | | 633,580 | |
Skyworks Solutions, Inc. | | | 3,797 | | | | 458,981 | |
| | | | | | | | |
| Security | | Shares | | | Value | |
|
Semiconductors & Semiconductor Equipment (continued) | |
Texas Instruments, Inc. | | | 8,960 | | | $ | 1,149,478 | |
| | | | | | | | |
| | | | | | | 11,602,129 | |
|
| Software— 4.7% | |
Adobe, Inc.(g) | | | 7,002 | | | | 2,309,330 | |
Dropbox, Inc., Class A(g) | | | 7,941 | | | | 142,223 | |
Intuit, Inc. | | | 9,133 | | | | 2,392,207 | |
Manhattan Associates, Inc.(g) | | | 3,302 | | | | 263,334 | |
Microsoft Corp. | | | 79,601 | | | | 12,553,078 | |
Paylocity Holding Corp.(g) | | | 4,160 | | | | 502,611 | |
salesforce.com, Inc.(g) | | | 15,647 | | | | 2,544,828 | |
ServiceNow, Inc.(g) | | | 6,586 | | | | 1,859,360 | |
Workday, Inc., Class A(g) | | | 4,472 | | | | 735,420 | |
| | | | | | | | |
| | | | | | | 23,302,391 | |
|
| Specialty Retail— 0.7% | |
AutoNation, Inc.(g) | | | 966 | | | | 46,977 | |
AutoZone, Inc.(g) | | | 96 | | | | 114,366 | |
Home Depot, Inc. (The) | | | 13,619 | | | | 2,974,117 | |
O’Reilly Automotive, Inc.(g) | | | 451 | | | | 197,655 | |
Ross Stores, Inc. | | | 1,987 | | | | 231,327 | |
Tractor Supply Co. | | | 1,194 | | | | 111,567 | |
| | | | | | | | |
| | | | | | | 3,676,009 | |
|
| Technology Hardware, Storage & Peripherals— 2.8% | |
Apple, Inc. | | | 47,266 | | | | 13,879,661 | |
HP, Inc. | | | 16,775 | | | | 344,726 | |
| | | | | | | | |
| | | | | | | 14,224,387 | |
|
| Textiles, Apparel & Luxury Goods— 0.6% | |
Lululemon Athletica, Inc.(g) | | | 1,310 | | | | 303,488 | |
NIKE, Inc., Class B | | | 22,115 | | | | 2,240,470 | |
Ralph Lauren Corp.(f) | | | 2,881 | | | | 337,711 | |
| | | | | | | | |
| | | | | | | 2,881,669 | |
|
| Thrifts & Mortgage Finance— 0.1% | |
Essent Group Ltd.(g) | | | 5,799 | | | | 301,490 | |
LendingTree, Inc.(f)(g) | | | 215 | | | | 65,239 | |
MGIC Investment Corp. | | | 10,834 | | | | 153,518 | |
| | | | | | | | |
| | | | | | | 520,247 | |
|
| Tobacco— 0.3% | |
Altria Group, Inc. | | | 20,941 | | | | 1,045,165 | |
British American Tobacco plc, ADR | | | 1 | | | | 42 | |
Philip Morris International, Inc. | | | 5,785 | | | | 492,246 | |
| | | | | | | | |
| | | | | | | 1,537,453 | |
|
| Trading Companies & Distributors— 0.2% | |
GATX Corp.(f) | | | 11,722 | | | | 971,168 | |
Watsco, Inc. | | | 262 | | | | 47,199 | |
| | | | | | | | |
| | | | | | | 1,018,367 | |
|
| Water Utilities— 0.5% | |
American Water Works Co., Inc. | | | 19,373 | | | | 2,379,973 | |
| | | | | | | | |
|
| Wireless Telecommunication Services— 0.2% | |
Telephone & Data Systems, Inc. | | | 28,316 | | | | 720,076 | |
United States Cellular Corp.(g) | | | 14,334 | | | | 519,321 | |
| | | | | | | | |
| | | | | | | 1,239,397 | |
| | | | | | | | |
| | |
Total Common Stocks— 60.1%
(Cost: $268,517,480) | | | | | | | 301,034,536 | |
| | | | | | | | |
| | | | |
| SCHEDULES OF INVESTMENTS | | | 37 | |
| | |
Schedule of Investments (continued) December 31, 2019 | | BlackRock Balanced Capital Portfolio (Percentages shown are based on Net Assets) |
| | | | | | | | |
| Security | | Par (000) | | | Value | |
|
Corporate Bonds— 11.7% | |
| |
Aerospace & Defense— 0.5% | | | | | |
BAE Systems Holdings, Inc.(b): | | | | | | | | |
2.85%, 12/15/20 | | USD | 18 | | | $ | 18,121 | |
3.80%, 10/07/24 | | | 27 | | | | 28,551 | |
3.85%, 12/15/25 | | | 100 | | | | 106,153 | |
4.75%, 10/07/44 | | | 8 | | | | 9,106 | |
Boeing Co. (The): | | | | | | | | |
3.25%, 02/01/35 | | | 29 | | | | 29,680 | |
3.38%, 06/15/46 | | | 7 | | | | 6,841 | |
3.83%, 03/01/59 | | | 10 | | | | 10,456 | |
General Dynamics Corp., 3.75%, 05/15/28 | | | 42 | | | | 46,246 | |
L3Harris Technologies, Inc.: | | | | | | | | |
3.85%, 06/15/23(b) | | | 210 | | | | 221,097 | |
3.85%, 12/15/26(b) | | | 125 | | | | 134,142 | |
4.40%, 06/15/28 | | | 160 | | | | 178,385 | |
4.40%, 06/15/28(b) | | | 25 | | | | 27,873 | |
4.85%, 04/27/35 | | | 2 | | | | 2,361 | |
5.05%, 04/27/45 | | | 10 | | | | 12,338 | |
Lockheed Martin Corp., 3.60%, 03/01/35 | | | 165 | | | | 180,433 | |
Northrop Grumman Corp.: | | | | | | | | |
2.93%, 01/15/25 | | | 130 | | | | 134,056 | |
3.25%, 01/15/28 | | | 179 | | | | 186,817 | |
Raytheon Co.: | | | | | | | | |
7.20%, 08/15/27 | | | 20 | | | | 26,262 | |
7.00%, 11/01/28 | | | 89 | | | | 117,890 | |
4.20%, 12/15/44 | | | 20 | | | | 23,303 | |
Textron, Inc.: | | | | | | | | |
3.65%, 03/15/27 | | | 35 | | | | 36,396 | |
3.90%, 09/17/29 | | | 72 | | | | 76,935 | |
TransDigm, Inc.: | | | | | | | | |
6.25%, 03/15/26(b) | | | 134 | | | | 145,070 | |
6.38%, 06/15/26 | | | 32 | | | | 33,940 | |
7.50%, 03/15/27 | | | 18 | | | | 19,688 | |
5.50%, 11/15/27(b) | | | 83 | | | | 83,932 | |
United Technologies Corp.: | | | | | | | | |
1.95%, 11/01/21 | | | 200 | | | | 200,436 | |
4.13%, 11/16/28 | | | 166 | | | | 186,766 | |
5.40%, 05/01/35 | | | 22 | | | | 28,272 | |
6.13%, 07/15/38 | | | 6 | | | | 8,333 | |
| | | | | | | | |
| | | | | | | 2,319,879 | |
| | |
| Air Freight & Logistics— 0.0% | | | | | | |
FedEx Corp.: | | | | | | | | |
3.90%, 02/01/35 | | | 20 | | | | 20,389 | |
3.88%, 08/01/42 | | | 68 | | | | 65,601 | |
4.40%, 01/15/47 | | | 4 | | | | 4,018 | |
United Parcel Service, Inc.: | | | | | | | | |
3.40%, 03/15/29 | | | 59 | | | | 63,385 | |
2.50%, 09/01/29 | | | 57 | | | | 56,873 | |
6.20%, 01/15/38 | | | 2 | | | | 2,786 | |
| | | | | | | | |
| | | | | | | 213,052 | |
| | |
| Airlines— 0.3% | | | | | | |
Air Canada Pass-Through Trust(b): | | | | | | | | |
Series2015-2, Class B, 5.00%, 12/15/23 | | | 20 | | | | 21,007 | |
Series2017-1, Class AA, 3.30%, 01/15/30 | | | 19 | | | | 19,343 | |
American Airlines Group, Inc.,
4.63%, 03/01/20(b) | | | 91 | | | | 91,143 | |
American Airlines Pass-Through Trust: | | | | | | | | |
Series2014-1, Class B, 4.38%, 10/01/22 | | | 1 | | | | 1,148 | |
Series2015-1, Class B, 3.70%, 05/01/23 | | | 12 | | | | 12,042 | |
Series2015-2, Class B, 4.40%, 09/22/23 | | | 91 | | | | 94,574 | |
Series2016-1, Class B, 5.25%, 01/15/24 | | | 59 | | | | 62,872 | |
Series2017-1, Class B, 4.95%, 02/15/25 | | | 22 | | | | 23,267 | |
Series2017-2, Class B, 3.70%, 10/15/25 | | | 21 | | | | 21,439 | |
| | | | | | | | |
| Security | | Par (000) | | | Value | |
| | |
Airlines (continued) | | | | | | | | |
Series2016-3, Class B, 3.75%, 10/15/25 | | USD | 1 | | | $ | 833 | |
Series2015-2, Class AA, 3.60%, 09/22/27 | | | 14 | | | | 14,962 | |
Series2019-1, Class B, 3.85%, 02/15/28 | | | 75 | | | | 76,215 | |
Series2016-2, Class AA, 3.20%, 06/15/28 | | | 31 | | | | 31,636 | |
Series2016-3, Class AA, 3.00%, 10/15/28 | | | 48 | | | | 48,881 | |
Series2017-1, Class AA, 3.65%, 02/15/29 | | | 23 | | | | 24,012 | |
Series2017-2, Class AA, 3.35%, 10/15/29 | | | 22 | | | | 22,504 | |
Series2019-1, Class AA, 3.15%, 02/15/32 | | | 70 | | | | 71,975 | |
Delta Air Lines Pass-Through Trust,
Series2019-1, Class AA, 3.20%, 04/25/24 | | | 70 | | | | 72,818 | |
Delta Air Lines, Inc., 2.88%, 03/13/20 | | | 338 | | | | 338,053 | |
Gol Finance, Inc., 7.00%, 01/31/25(b) | | | 22 | | | | 22,660 | |
Turkish Airlines Pass-Through Trust,
Series2015-1, Class A, 4.20%, 03/15/27(b) | | | 47 | | | | 44,488 | |
United Airlines Pass-Through Trust: | | | | | | | | |
Series2014-1, Class B, 4.75%, 04/11/22 | | | 11 | | | | 11,567 | |
Series2014-2, Class B, 4.63%, 09/03/22 | | | 7 | | | | 7,107 | |
Series2016-2, Class B, 3.65%, 10/07/25 | | | 5 | | | | 5,042 | |
Series2016-1, Class B, 3.65%, 01/07/26 | | | 2 | | | | 1,684 | |
Series2018-1, Class B, 4.60%, 03/01/26 | | | 23 | | | | 23,755 | |
Series2015-1, Class AA, 3.45%, 12/01/27 | | | 13 | | | | 13,895 | |
Series2019-2, Class B, 3.50%, 05/01/28 | | | 44 | | | | 44,442 | |
Series2016-1, Class AA, 3.10%, 07/07/28 | | | 4 | | | | 4,448 | |
Series2016-2, Class AA, 2.88%, 10/07/28 | | | 27 | | | | 27,170 | |
Series2018-1, Class AA, 3.50%, 03/01/30 | | | 10 | | | | 9,867 | |
Series2019-2, Class AA, 2.70%, 05/01/32 | | | 35 | | | | 35,136 | |
US Airways Pass-Through Trust: | | | | | | | | |
Series2012-2, Class B, 6.75%, 06/03/21 | | | 3 | | | | 3,538 | |
Series2013-1, Class B, 5.38%, 11/15/21 | | | 8 | | | | 8,220 | |
| | | | | | | | |
| | | | | | | 1,311,743 | |
| | |
| Auto Components— 0.0% | | | | | | |
American Axle & Manufacturing, Inc.,
6.25%, 04/01/25 | | | 21 | | | | 21,866 | |
Aptiv plc, 5.40%, 03/15/49 | | | 9 | | | | 10,225 | |
Lear Corp., 5.25%, 05/15/49 | | | 7 | | | | 7,268 | |
| | | | | | | | |
| | | | | | | 39,359 | |
| | |
| Automobiles— 0.2% | | | | | | |
Daimler Finance North America LLC(b): | | | | | | | | |
3.10%, 05/04/20 | | | 150 | | | | 150,494 | |
3.75%, 11/05/21 | | | 170 | | | | 174,750 | |
General Motors Co.: | | | | | | | | |
6.60%, 04/01/36 | | | 60 | | | | 70,818 | |
6.25%, 10/02/43 | | | 31 | | | | 34,830 | |
Hyundai Capital America(b): | | | | | | | | |
2.55%, 04/03/20 | | | 402 | | | | 402,125 | |
3.95%, 02/01/22 | | | 120 | | | | 123,186 | |
| | | | | | | | |
| | | | | | | 956,203 | |
| | |
| Banks— 2.8% | | | | | | |
ABN AMRO Bank NV, 2.65%, 01/19/21(b) | | | 235 | | | | 236,410 | |
Banco Santander SA, 2.71%, 06/27/24 | | | 200 | | | | 202,848 | |
Bank of America Corp.: | | | | | | | | |
2.63%, 10/19/20 | | | 15 | | | | 15,086 | |
(LIBOR USD 3 Month + 0.66%),
2.37%, 07/21/21(a) | | | 230 | | | | 230,472 | |
(LIBOR USD 3 Month + 0.63%),
2.33%, 10/01/21(a) | | | 450 | | | | 451,282 | |
(LIBOR USD 3 Month + 0.63%),
3.50%, 05/17/22(a) | | | 78 | | | | 79,567 | |
3.30%, 01/11/23 | | | 20 | | | | 20,678 | |
(LIBOR USD 3 Month + 1.16%),
3.12%, 01/20/23(a) | | | 3 | | | | 3,059 | |
(LIBOR USD 3 Month + 0.93%),
2.82%, 07/21/23(a) | | | 65 | | | | 66,040 | |
| | |
| 38 | | 2019 BLACKROCK ANNUAL REPORTTO SHAREHOLDERS |
| | |
Schedule of Investments (continued) December 31, 2019 | | BlackRock Balanced Capital Portfolio (Percentages shown are based on Net Assets) |
| | | | | | | | |
| Security | | Par
(000) | | | Value | |
|
| Banks (continued) | |
4.13%, 01/22/24 | | USD | 5 | | | $ | 5,375 | |
4.00%, 04/01/24 | | | 8 | | | | 8,569 | |
4.20%, 08/26/24 | | | 95 | | | | 102,012 | |
4.00%, 01/22/25 | | | 10 | | | | 10,667 | |
(LIBOR USD 3 Month + 0.97%),
3.46%, 03/15/25(a) | | | 72 | | | | 75,189 | |
Series L, 3.95%, 04/21/25 | | | 12 | | | | 12,815 | |
4.45%, 03/03/26 | | | 139 | | | | 152,665 | |
(LIBOR USD 3 Month + 1.06%),
3.56%, 04/23/27(a) | | | 6 | | | | 6,342 | |
(LIBOR USD 3 Month + 1.58%),
3.82%, 01/20/28(a) | | | 207 | | | | 222,256 | |
Series FF, (LIBOR USD 3 Month + 2.93%), 5.87%(a)(h) | | | 85 | | | | 94,248 | |
(LIBOR USD 3 Month + 1.51%),
3.71%, 04/24/28(a) | | | 337 | | | | 360,339 | |
(LIBOR USD 3 Month + 1.04%),
3.42%, 12/20/28(a) | | | 465 | | | | 488,317 | |
(LIBOR USD 3 Month + 1.07%),
3.97%, 03/05/29(a) | | | 102 | | | | 111,157 | |
(LIBOR USD 3 Month + 1.21%),
3.97%, 02/07/30(a) | | | 36 | | | | 39,523 | |
Bank of Montreal: | | | | | | | | |
3.10%, 07/13/20 | | | 2 | | | | 2,014 | |
Series D, 3.10%, 04/13/21 | | | 16 | | | | 16,261 | |
1.90%, 08/27/21 | | | 3 | | | | 3,006 | |
2.90%, 03/26/22 | | | 24 | | | | 24,470 | |
Series E, 3.30%, 02/05/24 | | | 5 | | | | 5,212 | |
2.50%, 06/28/24 | | | 17 | | | | 17,211 | |
BNP Paribas SA(b): | | | | | | | | |
3.50%, 03/01/23 | | | 200 | | | | 206,975 | |
3.80%, 01/10/24 | | | 200 | | | | 210,161 | |
Citibank NA: | | | | | | | | |
3.40%, 07/23/21 | | | 270 | | | | 275,798 | |
3.65%, 01/23/24 | | | 500 | | | | 529,319 | |
Citigroup, Inc.: | | | | | | | | |
(LIBOR USD 3 Month + 0.90%),
3.35%, 04/24/25(a) | | | 14 | | | | 14,571 | |
4.40%, 06/10/25 | | | 54 | | | | 58,703 | |
4.45%, 09/29/27 | | | 74 | | | | 81,532 | |
(LIBOR USD 3 Month + 1.56%),
3.89%, 01/10/28(a) | | | 118 | | | | 127,170 | |
(LIBOR USD 3 Month + 1.39%),
3.67%, 07/24/28(a) | | | 305 | | | | 325,173 | |
(LIBOR USD 3 Month + 1.15%),
3.52%, 10/27/28(a) | | | 27 | | | | 28,428 | |
8.13%, 07/15/39 | | | 1 | | | | 1,670 | |
4.65%, 07/23/48 | | | 1 | | | | 1,251 | |
Citizens Bank NA, 2.25%, 03/02/20 | | | 277 | | | | 277,021 | |
Credit Agricole SA, (USD Swap Semi 5 Year + 6.19%), 8.12%(a)(b)(h) | | | 200 | | | | 242,500 | |
Danske Bank A/S(b): | | | | | | | | |
5.00%, 01/12/22 | | | 200 | | | | 210,079 | |
3.88%, 09/12/23 | | | 220 | | | | 228,465 | |
Fifth Third Bancorp, 3.65%, 01/25/24 | | | 40 | | | | 42,221 | |
Fifth Third Bank, 2.25%, 06/14/21 | | | 210 | | | | 211,137 | |
HSBC Holdings plc, (LIBOR USD 3 Month + 1.55%), 4.04%, 03/13/28(a) | | | 220 | | | | 235,393 | |
HSBC USA, Inc., 2.35%, 03/05/20 | | | 270 | | | | 270,138 | |
ING Groep NV, 4.10%, 10/02/23 | | | 400 | | | | 425,321 | |
JPMorgan Chase & Co.: | | | | | | | | |
4.25%, 10/15/20 | | | 22 | | | | 22,391 | |
2.55%, 03/01/21 | | | 116 | | | | 116,897 | |
4.63%, 05/10/21 | | | 63 | | | | 65,202 | |
4.35%, 08/15/21 | | | 67 | | | | 69,581 | |
| | | | | | | | |
| Security | | Par
(000) | | | Value | |
|
| Banks (continued) | |
(LIBOR USD 3 Month + 0.61%),
3.51%, 06/18/22(a) | | USD | 15 | | | $ | 15,325 | |
2.97%, 01/15/23 | | | 75 | | | | 76,420 | |
3.20%, 01/25/23 | | | 25 | | | | 25,801 | |
(LIBOR USD 3 Month + 0.70%),
3.21%, 04/01/23(a) | | | 320 | | | | 327,631 | |
(LIBOR USD 3 Month + 0.94%),
2.78%, 04/25/23(a) | | | 17 | | | | 17,268 | |
2.70%, 05/18/23 | | | 104 | | | | 105,892 | |
(LIBOR USD 3 Month + 0.73%),
3.56%, 04/23/24(a) | | | 30 | | | | 31,263 | |
(LIBOR USD 3 Month + 0.89%),
3.80%, 07/23/24(a) | | | 127 | | | | 133,864 | |
3.88%, 09/10/24 | | | 23 | | | | 24,623 | |
(LIBOR USD 3 Month + 1.00%),
4.02%, 12/05/24(a) | | | 390 | | | | 415,924 | |
3.13%, 01/23/25 | | | 10 | | | | 10,436 | |
(LIBOR USD 3 Month + 1.16%),
3.22%, 03/01/25(a) | | | 87 | | | | 90,200 | |
(SOFR + 1.16%), 2.30%, 10/15/25(a) | | | 18 | | | | 17,980 | |
3.20%, 06/15/26 | | | 10 | | | | 10,448 | |
(LIBOR USD 3 Month + 1.25%),
3.96%, 01/29/27(a) | | | 50 | | | | 54,267 | |
4.25%, 10/01/27 | | | 9 | | | | 9,965 | |
(LIBOR USD 3 Month + 1.34%),
3.78%, 02/01/28(a) | | | 235 | | | | 253,421 | |
(LIBOR USD 3 Month + 1.38%),
3.54%, 05/01/28(a) | | | 383 | | | | 406,947 | |
(LIBOR USD 3 Month + 1.26%),
4.20%, 07/23/29(a) | | | 77 | | | | 85,954 | |
(LIBOR USD 3 Month + 1.16%),
3.70%, 05/06/30(a) | | | 105 | | | | 113,125 | |
(LIBOR USD 3 Month + 1.36%),
3.88%, 07/24/38(a) | | | 32 | | | | 35,422 | |
KeyBank NA, 3.30%, 02/01/22 | | | 330 | | | | 339,020 | |
KeyCorp, 2.55%, 10/01/29 | | | 4 | | | | 3,912 | |
Lloyds Banking Group plc, 4.45%, 05/08/25 | | | 200 | | | | 218,504 | |
Mitsubishi UFJ Financial Group, Inc.: | | | | | | | | |
3.54%, 07/26/21 | | | 60 | | | | 61,412 | |
2.67%, 07/25/22 | | | 4 | | | | 4,059 | |
3.46%, 03/02/23 | | | 360 | | | | 372,590 | |
3.76%, 07/26/23 | | | 99 | | | | 104,295 | |
3.41%, 03/07/24 | | | 6 | | | | 6,257 | |
Mizuho Financial Group, Inc.: | | | | | | | | |
2.63%, 04/12/21(b) | | | 200 | | | | 201,677 | |
2.95%, 02/28/22 | | | 272 | | | | 276,984 | |
(LIBOR USD 3 Month + 1.10%),
2.55%, 09/13/25(a) | | | 325 | | | | 325,094 | |
Nordea Bank Abp, 2.13%, 05/29/20(b) | | | 205 | | | | 205,071 | |
Santander UK Group Holdings plc,
3.13%, 01/08/21 | | | 30 | | | | 30,256 | |
Santander UK plc, 5.00%, 11/07/23(b) | | | 200 | | | | 215,053 | |
Sumitomo Mitsui Financial Group, Inc.: | | | | | | | | |
2.78%, 07/12/22 | | | 30 | | | | 30,519 | |
3.75%, 07/19/23 | | | 29 | | | | 30,426 | |
Toronto-Dominion Bank (The): | | | | | | | | |
3.50%, 07/19/23 | | | 33 | | | | 34,736 | |
2.65%, 06/12/24 | | | 30 | | | | 30,732 | |
Truist Bank, 2.80%, 05/17/22 | | | 60 | | | | 61,142 | |
US Bancorp: | | | | | | | | |
2.95%, 07/15/22 | | | 55 | | | | 56,284 | |
2.40%, 07/30/24 | | | 95 | | | | 96,323 | |
Series X, 3.15%, 04/27/27 | | | 2 | | | | 2,102 | |
Washington Mutual Escrow Bonds(c)(g)(i): | | | | | | | | |
0.00%, 11/06/09 | | | 100 | | | | — | |
| | | | |
| SCHEDULES OF INVESTMENTS | | | 39 | |
| | |
Schedule of Investments (continued) December 31, 2019 | | BlackRock Balanced Capital Portfolio (Percentages shown are based on Net Assets) |
| | | | | | | | |
| Security | | Par
(000) | | | Value | |
|
| Banks (continued) | |
0.00%, 09/29/17 | | USD | 400 | | | $ | — | |
Wells Fargo & Co.: | | | | | | | | |
2.60%, 07/22/20 | | | 42 | | | | 42,160 | |
2.55%, 12/07/20 | | | 100 | | | | 100,609 | |
2.50%, 03/04/21 | | | 214 | | | | 215,538 | |
4.60%, 04/01/21 | | | 59 | | | | 60,915 | |
2.10%, 07/26/21 | | | 1 | | | | 1,001 | |
3.50%, 03/08/22 | | | 47 | | | | 48,538 | |
2.63%, 07/22/22 | | | 222 | | | | 225,318 | |
3.75%, 01/24/24 | | | 261 | | | | 275,962 | |
3.55%, 09/29/25 | | | 76 | | | | 80,477 | |
(LIBOR USD 3 Month + 0.83%),
2.41%, 10/30/25(a) | | | 4 | | | | 4,004 | |
3.00%, 04/22/26 | | | 186 | | | | 191,335 | |
3.00%, 10/23/26 | | | 21 | | | | 21,523 | |
(LIBOR USD 3 Month + 1.17%),
3.20%, 06/17/27(a) | | | 11 | | | | 11,414 | |
(LIBOR USD 3 Month + 1.31%),
3.58%, 05/22/28(a) | | | 229 | | | | 243,442 | |
(LIBOR USD 3 Month + 1.17%),
2.88%, 10/30/30(a) | | | 30 | | | | 30,209 | |
| | | | | | | | |
| | | | | | | 13,861,256 | |
|
| Beverages — 0.2% | |
Anheuser-Busch Cos. LLC: | | | | | | | | |
4.70%, 02/01/36 | | | 387 | | | | 448,438 | |
4.90%, 02/01/46 | | | 34 | | | | 40,328 | |
Anheuser-Busch InBev Worldwide, Inc.: | | | | | | | | |
4.75%, 01/23/29 | | | 310 | | | | 359,343 | |
5.45%, 01/23/39 | | | 12 | | | | 15,101 | |
Coca-Cola Co. (The): | | | | | | | | |
2.20%, 05/25/22 | | | 4 | | | | 4,041 | |
2.88%, 10/27/25 | | | 21 | | | | 21,898 | |
2.13%, 09/06/29 | | | 32 | | | | 31,196 | |
Keurig Dr Pepper,Inc., 3.55%, 05/25/21 | | | 38 | | | | 38,812 | |
Molson Coors Brewing Co.: | | | | | | | | |
5.00%, 05/01/42 | | | 10 | | | | 10,935 | |
4.20%, 07/15/46 | | | 15 | | | | 14,972 | |
PepsiCo, Inc.: | | | | | | | | |
4.45%, 04/14/46 | | | 6 | | | | 7,371 | |
3.45%, 10/06/46 | | | 21 | | | | 22,293 | |
4.00%, 05/02/47 | | | 26 | | | | 30,079 | |
3.38%, 07/29/49 | | | 3 | | | | 3,147 | |
| | | | | | | | |
| | | | | | | 1,047,954 | |
|
| Biotechnology — 0.1% | |
AbbVie, Inc.: | | | | | | | | |
2.95%, 11/21/26(b) | | | 50 | | | | 50,908 | |
4.50%, 05/14/35 | | | 175 | | | | 197,374 | |
4.05%, 11/21/39(b) | | | 49 | | | | 51,502 | |
Amgen, Inc.: | | | | | | | | |
4.40%, 05/01/45 | | | 101 | | | | 113,175 | |
4.66%, 06/15/51 | | | 5 | | | | 5,891 | |
Gilead Sciences, Inc.: | | | | | | | | |
3.50%, 02/01/25 | | | 106 | | | | 112,516 | |
3.65%, 03/01/26 | | | 2 | | | | 2,154 | |
4.60%, 09/01/35 | | | 38 | | | | 45,377 | |
4.80%, 04/01/44 | | | 33 | | | | 39,659 | |
4.75%, 03/01/46 | | | 13 | | | | 15,633 | |
| | | | | | | | |
| | | | | | | 634,189 | |
|
| Building Products — 0.0% | |
Johnson Controls International plc,
4.63%, 07/02/44(e) | | | 25 | | | | 27,481 | |
Owens Corning: | | | | | | | | |
3.95%, 08/15/29 | | | 30 | | | | 31,228 | |
| | | | | | | | |
| Security | | Par
(000) | | | Value | |
|
| Building Products (continued) | |
4.30%, 07/15/47 | | USD | 3 | | | $ | 2,848 | |
| | | | | | | | |
| | | | | | | 61,557 | |
|
| Capital Markets — 0.6% | |
Bank of New York Mellon Corp. (The)(a): | | | | | | | | |
Series E, (LIBOR USD 3 Month +
3.42%), 4.95%(h) | | | 65 | | | | 65,650 | |
(LIBOR USD 3 Month + 1.07%),
3.44%, 02/07/28 | | | 90 | | | | 95,499 | |
Charles Schwab Corp. (The),
3.20%, 03/02/27 | | | 45 | | | | 47,103 | |
CME Group, Inc., 3.75%, 06/15/28 | | | 14 | | | | 15,468 | |
Credit Suisse Group AG, (LIBOR USD 3 Month + 1.20%), 3.00%, 12/14/23(a)(b) | | | 250 | | | | 254,683 | |
Deutsche Bank AG: | | | | | | | | |
2.70%, 07/13/20 | | | 102 | | | | 102,072 | |
3.15%, 01/22/21 | | | 100 | | | | 100,455 | |
E*TRADE Financial Corp., 3.80%, 08/24/27 | | | 10 | | | | 10,399 | |
Goldman Sachs Group, Inc. (The): | | | | | | | | |
2.75%, 09/15/20 | | | 71 | | | | 71,335 | |
2.35%, 11/15/21 | | | 186 | | | | 186,739 | |
3.63%, 02/20/24 | | | 40 | | | | 41,990 | |
4.00%, 03/03/24 | | | 40 | | | | 42,625 | |
3.50%, 01/23/25 | | | 10 | | | | 10,498 | |
3.75%, 02/25/26 | | | 17 | | | | 17,995 | |
(LIBOR USD 3 Month + 1.17%),
3.08%, 05/15/26(a) | | | 40 | | | | 40,416 | |
3.85%, 01/26/27 | | | 50 | | | | 53,227 | |
(LIBOR USD 3 Month + 1.51%),
3.69%, 06/05/28(a) | | | 230 | | | | 244,717 | |
(LIBOR USD 3 Month + 1.37%),
4.02%, 10/31/38(a) | | | 55 | | | | 59,773 | |
(LIBOR USD 3 Month + 1.43%),
4.41%, 04/23/39(a) | | | 8 | | | | 9,116 | |
Intercontinental Exchange, Inc.: | | | | | | | | |
3.75%, 12/01/25 | | | 92 | | | | 99,077 | |
3.10%, 09/15/27 | | | 4 | | | | 4,191 | |
3.75%, 09/21/28 | | | 80 | | | | 87,355 | |
Moody’s Corp., 4.88%, 02/15/24 | | | 13 | | | | 14,297 | |
Morgan Stanley: | | | | | | | | |
3.13%, 01/23/23 | | | 2 | | | | 2,056 | |
3.75%, 02/25/23 | | | 156 | | | | 163,365 | |
(SOFR + 1.15%), 2.72%, 07/22/25(a) | | | 1 | | | | 1,013 | |
3.63%, 01/20/27 | | | 280 | | | | 298,148 | |
(LIBOR USD 3 Month + 1.34%),
3.59%, 07/22/28(a) | | | 130 | | | | 138,231 | |
(LIBOR USD 3 Month + 1.14%),
3.77%, 01/24/29(a) | | | 100 | | | | 107,645 | |
Northern Trust Corp., 3.15%, 05/03/29 | | | 10 | | | | 10,506 | |
Nuveen LLC, 4.00%, 11/01/28(b) | | | 5 | | | | 5,568 | |
State Street Corp.: | | | | | | | | |
2.65%, 05/19/26 | | | 38 | | | | 38,681 | |
(LIBOR USD 3 Month + 1.03%),
4.14%, 12/03/29(a) | | | 5 | | | | 5,580 | |
UBS Group AG(b): | | | | | | | | |
2.95%, 09/24/20 | | | 335 | | | | 337,343 | |
(LIBOR USD 3 Month + 0.95%),
2.86%, 08/15/23(a) | | | 200 | | | | 203,207 | |
4.13%, 04/15/26 | | | 200 | | | | 217,517 | |
| | | | | | | | |
| | | | | | | 3,203,540 | |
|
| Chemicals — 0.1% | |
Dow Chemical Co. (The): | | | | | | | | |
9.00%, 04/01/21 | | | 55 | | | | 59,783 | |
4.55%, 11/30/25 | | | 25 | | | | 27,626 | |
3.63%, 05/15/26 | | | 87 | | | | 91,557 | |
4.38%, 11/15/42 | | | 82 | | | | 87,590 | |
| | |
| 40 | | 2019 BLACKROCK ANNUAL REPORTTO SHAREHOLDERS |
| | |
Schedule of Investments (continued) December 31, 2019 | | BlackRock Balanced Capital Portfolio (Percentages shown are based on Net Assets) |
| | | | | | | | |
| Security | | Par
(000) | | | Value | |
|
| Chemicals (continued) | |
DuPont de Nemours, Inc.: | | | | | | | | |
4.49%, 11/15/25 | | USD | 178 | | | $ | 196,047 | |
4.73%, 11/15/28 | | | 10 | | | | 11,355 | |
5.42%, 11/15/48 | | | 40 | | | | 49,355 | |
LYB International Finance III LLC,
4.20%, 10/15/49 | | | 35 | | | | 36,531 | |
Methanex Corp., 5.25%, 12/15/29 | | | 20 | | | | 20,667 | |
Sherwin-Williams Co. (The): | | | | | | | | |
4.00%, 12/15/42 | | | 16 | | | | 16,507 | |
4.50%, 06/01/47 | | | 15 | | | | 17,050 | |
| | | | | | | | |
| | | | | | | 614,068 | |
|
| Commercial Services &Supplies — 0.1% | |
KAR Auction Services, Inc.,
5.13%, 06/01/25(b) | | | 32 | | | | 33,280 | |
Nielsen Co. Luxembourg SARL (The),
5.00%, 02/01/25(b) | | | 16 | | | | 16,480 | |
RELX Capital, Inc.: | | | | | | | | |
3.50%, 03/16/23 | | | 115 | | | | 119,415 | |
4.00%, 03/18/29 | | | 80 | | | | 86,894 | |
Republic Services, Inc.: | | | | | | | | |
3.55%, 06/01/22 | | | 24 | | | | 24,796 | |
4.75%, 05/15/23 | | | 75 | | | | 80,769 | |
2.90%, 07/01/26 | | | 42 | | | | 43,031 | |
3.95%, 05/15/28 | | | 93 | | | | 102,486 | |
Waste Management, Inc.: | | | | | | | | |
3.13%, 03/01/25 | | | 10 | | | | 10,450 | |
3.90%, 03/01/35 | | | 24 | | | | 26,457 | |
4.00%, 07/15/39 | | | 81 | | | | 90,761 | |
Waste Pro USA, Inc., 5.50%, 02/15/26(b) | | | 16 | | | | 16,680 | |
| | | | | | | | |
| | | | | | | 651,499 | |
|
| Communications Equipment — 0.0% | |
Motorola Solutions, Inc.: | | | | | | | | |
4.60%, 05/23/29 | | | 119 | | | | 129,906 | |
5.50%, 09/01/44 | | | 8 | | | | 8,923 | |
| | | | | | | | |
| | | | | | | 138,829 | |
|
| Construction Materials — 0.0% | |
Cemex SAB de CV, 3.72%, 03/15/20(j) | | | 7 | | | | 7,011 | |
| | | | | | | | |
|
| Consumer Finance — 0.3% | |
American Express Co.: | | | | | | | | |
2.75%, 05/20/22 | | | 5 | | | | 5,092 | |
2.50%, 08/01/22 | | | 25 | | | | 25,299 | |
3.70%, 08/03/23 | | | 70 | | | | 73,598 | |
3.40%, 02/22/24 | | | 14 | | | | 14,645 | |
2.50%, 07/30/24 | | | 38 | | | | 38,444 | |
4.20%, 11/06/25 | | | 65 | | | | 71,664 | |
3.13%, 05/20/26 | | | 100 | | | | 104,013 | |
American Express Credit Corp.: | | | | | | | | |
2.25%, 05/05/21 | | | 63 | | | | 63,304 | |
2.70%, 03/03/22 | | | 2 | | | | 2,033 | |
American Honda Finance Corp.,
2.15%, 09/10/24 | | | 55 | | | | 55,043 | |
Capital One Financial Corp.: | | | | | | | | |
4.75%, 07/15/21 | | | 15 | | | | 15,622 | |
3.90%, 01/29/24 | | | 176 | | | | 186,681 | |
3.75%, 04/24/24 | | | 95 | | | | 100,056 | |
3.30%, 10/30/24 | | | 60 | | | | 62,489 | |
Discover Financial Services,
4.10%, 02/09/27 | | | 17 | | | | 18,319 | |
Ford Motor Credit Co. LLC,
5.11%, 05/03/29 | | | 200 | | | | 206,119 | |
General Motors Financial Co., Inc.: | | | | | | | | |
4.20%, 11/06/21 | | | 29 | | | | 30,067 | |
3.55%, 07/08/22 | | | 5 | | | | 5,147 | |
4.00%, 01/15/25 | | | 140 | | | | 147,172 | |
Navient Corp.: | | | | | | | | |
5.88%, 03/25/21 | | | 18 | | | | 18,594 | |
| | | | | | | | |
| Security | | Par
(000) | | | Value | |
|
| Consumer Finance (continued) | |
6.63%, 07/26/21 | | USD | 22 | | | $ | 23,265 | |
6.50%, 06/15/22 | | | 30 | | | | 32,513 | |
7.25%, 09/25/23 | | | 16 | | | | 18,080 | |
5.88%, 10/25/24 | | | 16 | | | | 17,120 | |
6.75%, 06/25/25 | | | 16 | | | | 17,664 | |
6.75%, 06/15/26 | | | 16 | | | | 17,586 | |
Synchrony Financial: | | | | | | | | |
2.70%, 02/03/20 | | | 52 | | | | 52,018 | |
4.38%, 03/19/24 | | | 40 | | | | 42,680 | |
4.25%, 08/15/24 | | | 20 | | | | 21,347 | |
Toyota Motor Credit Corp.: | | | | | | | | |
3.05%, 01/11/28 | | | 50 | | | | 52,733 | |
3.65%, 01/08/29 | | | 20 | | | | 21,896 | |
| | | | | | | | |
| | | | | | | 1,560,303 | |
|
| Containers & Packaging — 0.0% | |
International Paper Co.: | | | | | | | | |
6.00%, 11/15/41 | | | 32 | | | | 39,945 | |
4.80%, 06/15/44 | | | 18 | | | | 19,783 | |
Owens-Brockway Glass Container, Inc.(b): | | | | | | | | |
5.00%, 01/15/22 | | | 16 | | | | 16,608 | |
5.88%, 08/15/23 | | | 23 | | | | 24,552 | |
| | | | | | | | |
| | | | | | | 100,888 | |
|
| Distributors — 0.0%(b) | |
American Builders &Contractors Supply Co., Inc.: | | | | | | | | |
5.88%, 05/15/26 | | | 21 | | | | 22,313 | |
4.00%, 01/15/28 | | | 21 | | | | 21,315 | |
Performance Food Group, Inc., 5.50%, 10/15/27 | | | 35 | | | | 37,406 | |
| | | | | | | | |
| | | | | | | 81,034 | |
|
| Diversified Consumer Services — 0.1% | |
American University (The), 3.67%, 04/01/49 | | | 82 | | | | 87,950 | |
Claremont Mckenna College,
3.38%, 01/01/50 | | | 56 | | | | 55,619 | |
George Washington University (The), Series 2018, 4.13%, 09/15/48 | | | 31 | | | | 35,786 | |
University of Southern California,
3.03%, 10/01/39 | | | 21 | | | | 21,112 | |
Wesleyan University, 4.78%, 07/01/2116 | | | 45 | | | | 50,484 | |
| | | | | | | | |
| | | | | | | 250,951 | |
|
| Diversified Financial Services — 0.1% | |
AXA Equitable Holdings, Inc.: | | | | | | | | |
3.90%, 04/20/23 | | | 10 | | | | 10,480 | |
5.00%, 04/20/48 | | | 20 | | | | 21,526 | |
Shell International Finance BV: | | | | | | | | |
3.50%, 11/13/23 | | | 50 | | | | 52,691 | |
3.25%, 05/11/25 | | | 12 | | | | 12,720 | |
2.88%, 05/10/26 | | | 15 | | | | 15,565 | |
2.50%, 09/12/26 | | | 6 | | | | 6,100 | |
4.13%, 05/11/35 | | | 103 | | | | 120,521 | |
6.38%, 12/15/38 | | | 14 | | | | 20,434 | |
3.63%, 08/21/42 | | | 20 | | | | 21,396 | |
4.55%, 08/12/43 | | | 5 | | | | 6,098 | |
4.38%, 05/11/45 | | | 20 | | | | 23,876 | |
4.00%, 05/10/46 | | | 6 | | | | 6,838 | |
| | | | | | | | |
| | | | | | | 318,245 | |
|
| Diversified Telecommunication Services — 0.5% | |
AT&T, Inc.: | | | | | | | | |
3.00%, 02/15/22 | | | 10 | | | | 10,201 | |
3.20%, 03/01/22 | | | 13 | | | | 13,309 | |
3.80%, 03/15/22 | | | 89 | | | | 92,383 | |
3.00%, 06/30/22 | | | 130 | | | | 132,801 | |
3.55%, 06/01/24 | | | 53 | | | | 55,741 | |
3.60%, 07/15/25 | | | 64 | | | | 67,747 | |
| | | | |
| SCHEDULES OF INVESTMENTS | | | 41 | |
| | |
Schedule of Investments (continued) December 31, 2019 | | BlackRock Balanced Capital Portfolio (Percentages shown are based on Net Assets) |
| | | | | | | | |
| Security | | Par
(000) | | | Value | |
|
| Diversified Telecommunication Services (continued) | |
4.13%, 02/17/26 | | USD | 18 | | | $ | 19,511 | |
4.25%, 03/01/27 | | | 46 | | | | 50,526 | |
4.30%, 02/15/30 | | | 85 | | | | 94,451 | |
4.50%, 05/15/35 | | | 300 | | | | 334,298 | |
5.25%, 03/01/37 | | | 10 | | | | 11,948 | |
4.90%, 08/15/37 | | | 15 | | | | 17,271 | |
6.35%, 03/15/40 | | | 18 | | | | 23,380 | |
6.00%, 08/15/40 | | | 57 | | | | 73,008 | |
5.35%, 09/01/40 | | | 2 | | | | 2,414 | |
5.15%, 03/15/42 | | | 23 | | | | 26,875 | |
4.80%, 06/15/44 | | | 100 | | | | 114,099 | |
4.85%, 07/15/45 | | | 8 | | | | 9,137 | |
4.75%, 05/15/46 | | | 2 | | | | 2,263 | |
5.15%, 11/15/46 | | | 5 | | | | 5,987 | |
5.45%, 03/01/47 | | | 2 | | | | 2,485 | |
CCO Holdings LLC(b): | | | | | | | | |
5.75%, 02/15/26 | | | 67 | | | | 70,686 | |
5.50%, 05/01/26 | | | 39 | | | | 41,096 | |
5.13%, 05/01/27 | | | 85 | | | | 89,675 | |
5.88%, 05/01/27 | | | 21 | | | | 22,208 | |
5.00%, 02/01/28 | | | 67 | | | | 70,305 | |
5.38%, 06/01/29 | | | 41 | | | | 43,870 | |
4.75%, 03/01/30 | | | 46 | | | | 46,829 | |
Frontier Communications Corp.,
8.00%, 04/01/27(b) | | | 53 | | | | 55,385 | |
Oi SA, 10.00%, (10.00% Cash or
4.00% PIK), 07/27/25(k) | | | 20 | | | | 18,013 | |
Verizon Communications, Inc.: | | | | | | | | |
(LIBOR USD 3 Month + 0.55%),
2.45%, 05/22/20(a) | | | 75 | | | | 75,130 | |
4.13%, 03/16/27 | | | 403 | | | | 447,426 | |
4.50%, 08/10/33 | | | 23 | | | | 26,848 | |
4.40%, 11/01/34 | | | 15 | | | | 17,389 | |
4.27%, 01/15/36 | | | 305 | | | | 345,429 | |
| | | | | | | | |
| | | | | | | 2,530,124 | |
|
| Electric Utilities — 0.8% | |
AEP Texas, Inc.: | | | | | | | | |
3.95%, 06/01/28 | | | 130 | | | | 141,368 | |
Series H, 3.45%, 01/15/50 | | | 5 | | | | 5,005 | |
AEP Transmission Co. LLC: | | | | | | | | |
4.25%, 09/15/48 | | | 24 | | | | 27,572 | |
3.80%, 06/15/49 | | | 45 | | | | 48,157 | |
3.15%, 09/15/49 | | | 45 | | | | 43,542 | |
Alabama Power Co.: | | | | | | | | |
Series13-A, 3.55%, 12/01/23 | | | 10 | | | | 10,554 | |
4.15%, 08/15/44 | | | 10 | | | | 11,150 | |
3.75%, 03/01/45 | | | 75 | | | | 79,510 | |
Series B, 3.70%, 12/01/47 | | | 10 | | | | 10,565 | |
Series A, 4.30%, 07/15/48 | | | 12 | | | | 13,908 | |
3.45%, 10/01/49 | | | 35 | | | | 35,910 | |
Baltimore Gas & Electric Co.: | | | | | | | | |
3.50%, 08/15/46 | | | 50 | | | | 50,923 | |
3.75%, 08/15/47 | | | 30 | | | | 32,029 | |
4.25%, 09/15/48 | | | 10 | | | | 11,440 | |
3.20%, 09/15/49 | | | 30 | | | | 29,404 | |
CenterPoint Energy Houston Electric LLC: | | | | | | | | |
4.50%, 04/01/44 | | | 5 | | | | 5,977 | |
3.95%, 03/01/48 | | | 20 | | | | 22,468 | |
Series AC, 4.25%, 02/01/49 | | | 2 | | | | 2,354 | |
Commonwealth Edison Co.: | | | | | | | | |
Series 122, 2.95%, 08/15/27 | | | 11 | | | | 11,399 | |
4.60%, 08/15/43 | | | 10 | | | | 11,957 | |
Dayton Power & Light Co. (The),
3.95%, 06/15/49(b) | | | 51 | | | | 52,272 | |
| | | | | | | | |
| Security | | Par
(000) | | | Value | |
|
| Electric Utilities (continued) | |
DTE Electric Co., Series A, 4.05%, 05/15/48 | | USD | 75 | | | $ | 87,078 | |
Duke Energy Carolinas LLC: | | | | | | | | |
3.05%, 03/15/23 | | | 15 | | | | 15,462 | |
3.95%, 11/15/28 | | | 12 | | | | 13,330 | |
2.45%, 08/15/29 | | | 79 | | | | 78,469 | |
3.88%, 03/15/46 | | | 25 | | | | 27,752 | |
3.70%, 12/01/47 | | | 20 | | | | 21,524 | |
3.20%, 08/15/49 | | | 55 | | | | 54,817 | |
Duke Energy Corp., 4.80%, 12/15/45 | | | 5 | | | | 5,930 | |
Duke Energy Florida LLC: | | | | | | | | |
3.80%, 07/15/28 | | | 15 | | | | 16,432 | |
2.50%, 12/01/29 | | | 137 | | | | 136,637 | |
6.40%, 06/15/38 | | | 43 | | | | 62,050 | |
3.40%, 10/01/46 | | | 25 | | | | 25,474 | |
Duke Energy Ohio, Inc., 3.65%, 02/01/29 | | | 130 | | | | 141,290 | |
Duke Energy Progress LLC: | | | | | | | | |
3.00%, 09/15/21 | | | 25 | | | | 25,459 | |
3.25%, 08/15/25 | | | 59 | | | | 61,981 | |
3.70%, 09/01/28 | | | 135 | | | | 147,309 | |
3.45%, 03/15/29 | | | 20 | | | | 21,439 | |
4.10%, 05/15/42 | | | 5 | | | | 5,659 | |
4.10%, 03/15/43 | | | 30 | | | | 33,614 | |
4.20%, 08/15/45 | | | 15 | | | | 17,086 | |
3.70%, 10/15/46 | | | 10 | | | | 10,707 | |
Edison International: | | | | | | | | |
2.40%, 09/15/22 | | | 11 | | | | 10,973 | |
3.13%, 11/15/22 | | | 1 | | | | 1,016 | |
3.55%, 11/15/24 | | | 14 | | | | 14,341 | |
Entergy Louisiana LLC: | | | | | | | | |
5.40%, 11/01/24 | | | 20 | | | | 22,907 | |
4.20%, 09/01/48 | | | 65 | | | | 75,240 | |
Eversource Energy, Series L, 2.90%, 10/01/24 | | | 35 | | | | 35,780 | |
Exelon Corp., 4.45%, 04/15/46 | | | 25 | | | | 28,107 | |
FirstEnergy Transmission LLC(b): | | | | | | | | |
4.35%, 01/15/25 | | | 175 | | | | 188,063 | |
4.55%, 04/01/49 | | | 50 | | | | 57,321 | |
Florida Power & Light Co.: | | | | | | | | |
(LIBOR USD 3 Month + 0.40%),
2.31%, 05/06/22(a) | | | 355 | | | | 355,011 | |
3.95%, 03/01/48 | | | 76 | | | | 86,734 | |
3.15%, 10/01/49 | | | 60 | | | | 60,691 | |
MidAmerican Energy Co.: | | | | | | | | |
3.65%, 04/15/29 | | | 20 | | | | 21,871 | |
4.25%, 07/15/49 | | | 42 | | | | 50,422 | |
3.15%, 04/15/50 | | | 30 | | | | 29,635 | |
Mid-Atlantic Interstate Transmission LLC,
4.10%, 05/15/28(b) | | | 19 | | | | 20,795 | |
Northern States Power Co.: | | | | | | | | |
3.40%, 08/15/42 | | | 65 | | | | 68,058 | |
4.00%, 08/15/45 | | | 25 | | | | 28,383 | |
2.90%, 03/01/50 | | | 20 | | | | 19,107 | |
NSTAR Electric Co.: | | | | | | | | |
3.20%, 05/15/27 | | | 15 | | | | 15,731 | |
3.25%, 05/15/29 | | | 10 | | | | 10,560 | |
Ohio Power Co.: | | | | | | | | |
Series G, 6.60%, 02/15/33 | | | 50 | | | | 67,837 | |
4.00%, 06/01/49 | | | 29 | | | | 32,573 | |
Oncor Electric Delivery Co. LLC: | | | | | | | | |
3.70%, 11/15/28 | | | 65 | | | | 71,154 | |
4.55%, 12/01/41 | | | 20 | | | | 23,964 | |
4.10%, 11/15/48 | | | 2 | | | | 2,290 | |
3.80%, 06/01/49 | | | 33 | | | | 35,887 | |
3.10%, 09/15/49 | | | 25 | | | | 24,436 | |
Public Service Electric & Gas Co.: | | | | | | | | |
2.38%, 05/15/23 | | | 10 | | | | 10,135 | |
| | |
| 42 | | 2019 BLACKROCK ANNUAL REPORTTO SHAREHOLDERS |
| | |
Schedule of Investments (continued) December 31, 2019 | | BlackRock Balanced Capital Portfolio (Percentages shown are based on Net Assets) |
| | | | | | | | |
| Security | | Par (000) | | | Value | |
|
| Electric Utilities (continued) | |
3.00%, 05/15/25 | | | USD 4 | | | $ | 4,155 | |
3.00%, 05/15/27 | | | 8 | | | | 8,278 | |
3.65%, 09/01/28 | | | 80 | | | | 87,263 | |
3.20%, 05/15/29 | | | 5 | | | | 5,276 | |
Tampa Electric Co.: | | | | | | | | |
4.30%, 06/15/48 | | | 19 | | | | 22,147 | |
4.45%, 06/15/49 | | | 44 | | | | 52,174 | |
Trans-Allegheny Interstate Line Co.,
3.85%, 06/01/25(b) | | | 159 | | | | 168,736 | |
Virginia Electric & Power Co.: | | | | | | | | |
Series C, 2.75%, 03/15/23 | | | 97 | | | | 98,786 | |
Series A, 3.50%, 03/15/27 | | | 66 | | | | 70,606 | |
4.00%, 01/15/43 | | | 39 | | | | 43,124 | |
Series C, 4.00%, 11/15/46 | | | 40 | | | | 44,148 | |
3.30%, 12/01/49 | | | 3 | | | | 3,029 | |
Vistra Operations Co. LLC,
4.30%, 07/15/29(b) | | | 110 | | | | 112,221 | |
| | | | | | | | |
| | | | | | | 3,855,928 | |
|
| Electronic Equipment, Instruments & Components— 0.0% | |
Amphenol Corp., 3.20%, 04/01/24 | | | 20 | | | | 20,753 | |
Corning, Inc.: | | | | | | | | |
3.70%, 11/15/23 | | | 10 | | | | 10,423 | |
4.38%, 11/15/57 | | | 35 | | | | 35,917 | |
Tyco Electronics Group SA: | | | | | | | | |
3.45%, 08/01/24 | | | 15 | | | | 15,719 | |
3.13%, 08/15/27 | | | 14 | | | | 14,421 | |
| | | | | | | | |
| | | | | | | 97,233 | |
|
| Energy Equipment & Services— 0.0%(b) | |
Odebrecht Drilling Norbe VIII/IX Ltd.,
6.35%, 12/01/21 | | | 10 | | | | 9,822 | |
Odebrecht Offshore Drilling Finance Ltd.,
6.72%, 12/01/22 | | | 10 | | | | 9,619 | |
| | | | | | | | |
| | | | | | | 19,441 | |
|
| Entertainment— 0.0% | |
NBCUniversal Media LLC, 5.95%, 04/01/41 | | | 60 | | | | 82,561 | |
Walt Disney Co. (The): | | | | | | | | |
6.40%, 12/15/35 | | | 62 | | | | 88,123 | |
4.75%, 09/15/44 | | | 5 | | | | 6,246 | |
2.75%, 09/01/49 | | | 19 | | | | 17,937 | |
| | | | | | | | |
| | | | | | | 194,867 | |
|
| Equity Real Estate Investment Trusts (REITs)— 0.2% | |
American Tower Corp.: | | | | | | | | |
2.25%, 01/15/22 | | | 10 | | | | 10,033 | |
3.00%, 06/15/23 | | | 45 | | | | 45,995 | |
2.95%, 01/15/25 | | | 10 | | | | 10,219 | |
4.00%, 06/01/25 | | | 20 | | | | 21,404 | |
2.75%, 01/15/27 | | | 12 | | | | 11,987 | |
3.13%, 01/15/27 | | | 14 | | | | 14,331 | |
3.95%, 03/15/29 | | | 21 | | | | 22,588 | |
Boston Properties LP, 3.85%, 02/01/23 | | | 10 | | | | 10,479 | |
CC Holdings GS V LLC, 3.85%, 04/15/23 | | | 32 | | | | 33,544 | |
Crown Castle International Corp.: | | | | | | | | |
4.88%, 04/15/22 | | | 4 | | | | 4,238 | |
5.25%, 01/15/23 | | | 10 | | | | 10,863 | |
3.20%, 09/01/24 | | | 120 | | | | 124,135 | |
4.45%, 02/15/26 | | | 6 | | | | 6,574 | |
3.70%, 06/15/26 | | | 96 | | | | 101,486 | |
3.65%, 09/01/27 | | | 13 | | | | 13,758 | |
3.10%, 11/15/29 | | | 87 | | | | 88,115 | |
5.20%, 02/15/49 | | | 35 | | | | 42,585 | |
Equinix, Inc., 2.63%, 11/18/24 | | | 52 | | | | 52,097 | |
MGM Growth Properties Operating Partnership LP: | | | | | | | | |
5.63%, 05/01/24 | | | 37 | | | | 40,468 | |
| | | | | | | | |
| Security | | Par (000) | | | Value | |
|
| Equity Real Estate Investment Trusts (REITs) (continued) | |
4.50%, 09/01/26 | | | USD 16 | | | $ | 16,840 | |
5.75%, 02/01/27(b) | | | 28 | | | | 31,220 | |
Realty Income Corp.: | | | | | | | | |
4.13%, 10/15/26 | | | 40 | | | | 43,896 | |
3.00%, 01/15/27 | | | 5 | | | | 5,145 | |
Ryman Hospitality Properties, Inc.,
4.75%, 10/15/27(b) | | | 23 | | | | 23,747 | |
| | | | | | | | |
| | | | | | | 785,747 | |
|
| Food & Staples Retailing— 0.1% | |
Albertsons Cos., Inc.: | | | | | | | | |
5.75%, 03/15/25 | | | 41 | | | | 42,435 | |
7.50%, 03/15/26(b) | | | 21 | | | | 23,572 | |
5.88%, 02/15/28(b) | | | 25 | | | | 26,563 | |
Alimentation Couche-Tard, Inc., 3.55%, 07/26/27(b) | | | 135 | | | | 138,865 | |
Walmart, Inc.: | | | | | | | | |
3.55%, 06/26/25 | | | 60 | | | | 64,455 | |
3.70%, 06/26/28 | | | 16 | | | | 17,629 | |
3.25%, 07/08/29 | | | 94 | | | | 100,892 | |
3.95%, 06/28/38 | | | 43 | | | | 49,813 | |
3.63%, 12/15/47 | | | 8 | | | | 8,904 | |
| | | | | | | | |
| | | | | | | 473,128 | |
|
| Food Products— 0.1% | |
Marfrig Holdings Europe BV,
8.00%, 06/08/23(b) | | | 200 | | | | 208,375 | |
Pilgrim’s Pride Corp., 5.88%, 09/30/27(b) | | | 28 | | | | 30,275 | |
Post Holdings, Inc.(b): | | | | | | | | |
5.00%, 08/15/26 | | | 48 | | | | 50,700 | |
5.75%, 03/01/27 | | | 44 | | | | 47,190 | |
5.63%, 01/15/28 | | | 32 | | | | 34,480 | |
5.50%, 12/15/29 | | | 25 | | | | 26,658 | |
Simmons Foods, Inc., 5.75%, 11/01/24(b) | | | 16 | | | | 16,080 | |
Tyson Foods, Inc.: | | | | | | | | |
3.95%, 08/15/24 | | | 5 | | | | 5,362 | |
3.55%, 06/02/27 | | | 67 | | | | 71,240 | |
4.55%, 06/02/47 | | | 10 | | | | 11,449 | |
5.10%, 09/28/48 | | | 10 | | | | 12,592 | |
| | | | | | | | |
| | | | | | | 514,401 | |
|
| Gas Utilities— 0.0% | |
Atmos Energy Corp., 3.38%, 09/15/49 | | | 30 | | | | 30,466 | |
Dominion Energy Gas Holdings LLC,
4.80%, 11/01/43 | | | 15 | | | | 17,153 | |
Piedmont Natural Gas Co., Inc.,
3.64%, 11/01/46 | | | 7 | | | | 6,965 | |
| | | | | | | | |
| | | | | | | 54,584 | |
|
| Health Care Equipment & Supplies— 0.1% | |
Abbott Laboratories: | | | | | | | | |
3.40%, 11/30/23 | | | 14 | | | | 14,719 | |
3.75%, 11/30/26 | | | 207 | | | | 226,179 | |
Covidien International Finance SA,
2.95%, 06/15/23 | | | 35 | | | | 36,003 | |
Medtronic, Inc., 3.50%, 03/15/25 | | | 16 | | | | 17,152 | |
| | | | | | | | |
| | | | | | | 294,053 | |
|
| Health Care Providers & Services— 0.5% | |
Aetna, Inc.: | | | | | | | | |
4.50%, 05/15/42 | | | 27 | | | | 29,125 | |
4.13%, 11/15/42 | | | 3 | | | | 3,074 | |
4.75%, 03/15/44 | | | 20 | | | | 22,342 | |
Anthem, Inc.: | | | | | | | | |
3.70%, 08/15/21 | | | 7 | | | | 7,164 | |
3.50%, 08/15/24 | | | 7 | | | | 7,339 | |
2.38%, 01/15/25 | | | 16 | | | | 15,981 | |
3.65%, 12/01/27 | | | 4 | | | | 4,236 | |
4.10%, 03/01/28 | | | 12 | | | | 13,039 | |
| | | | |
| SCHEDULES OF INVESTMENTS | | | 43 | |
| | |
Schedule of Investments (continued) December 31, 2019 | | BlackRock Balanced Capital Portfolio (Percentages shown are based on Net Assets) |
| | | | | | | | |
| Security | | Par (000) | | | Value | |
|
| Health Care Providers & Services (continued) | |
Baylor Scott & White Holdings,
4.19%, 11/15/45 | | | USD 35 | | | $ | 39,144 | |
CHRISTUS Health, Series C,
4.34%, 07/01/28 | | | 47 | | | | 51,925 | |
Cigna Corp.: | | | | | | | | |
3.30%, 02/25/21(b) | | | 19 | | | | 19,243 | |
3.90%, 02/15/22(b) | | | 30 | | | | 31,071 | |
3.75%, 07/15/23 | | | 35 | | | | 36,708 | |
3.50%, 06/15/24(b) | | | 30 | | | | 31,335 | |
3.25%, 04/15/25(b) | | | 50 | | | | 51,856 | |
3.05%, 10/15/27(b) | | | 12 | | | | 12,171 | |
4.38%, 10/15/28 | | | 82 | | | | 90,847 | |
CommonSpirit Health: | | | | | | | | |
3.35%, 10/01/29 | | | 31 | | | | 31,190 | |
4.35%, 11/01/42 | | | 30 | | | | 30,814 | |
4.19%, 10/01/49 | | | 32 | | | | 31,995 | |
CVS Health Corp.: | | | | | | | | |
3.70%, 03/09/23 | | | 8 | | | | 8,339 | |
4.10%, 03/25/25 | | | 87 | | | | 93,409 | |
4.88%, 07/20/35 | | | 7 | | | | 8,051 | |
4.78%, 03/25/38 | | | 84 | | | | 95,497 | |
5.13%, 07/20/45 | | | 152 | | | | 180,320 | |
Encompass Health Corp.: | | | | | | | | |
4.50%, 02/01/28 | | | 16 | | | | 16,580 | |
4.75%, 02/01/30 | | | 16 | | | | 16,600 | |
HCA, Inc.: | | | | | | | | |
4.75%, 05/01/23 | | | 80 | | | | 85,705 | |
5.00%, 03/15/24 | | | 20 | | | | 21,863 | |
5.25%, 04/15/25 | | | 167 | | | | 186,858 | |
4.50%, 02/15/27 | | | 7 | | | | 7,550 | |
4.13%, 06/15/29 | | | 99 | | | | 105,047 | |
Montefiore Obligated Group, Series18-C,
5.25%, 11/01/48 | | | 37 | | | | 41,685 | |
Ochsner Clinic Foundation,
5.90%, 05/15/45 | | | 21 | | | | 27,793 | |
PeaceHealth Obligated Group, Series 2018,
4.79%, 11/15/48 | | | 7 | | | | 8,619 | |
RWJ Barnabas Health, Inc.,
3.48%, 07/01/49 | | | 17 | | | | 16,801 | |
Select Medical Corp.,
6.25%, 08/15/26(b) | | | 18 | | | | 19,485 | |
Spectrum Health System Obligated Group, | | | | | | | | |
Series 19A, 3.49%, 07/15/49 | | | 28 | | | | 28,039 | |
SSM Health Care Corp., Series 2018,
3.69%, 06/01/23 | | | 49 | | | | 51,126 | |
Sutter Health, Series 2018,
3.70%, 08/15/28 | | | 40 | | | | 42,868 | |
Tenet Healthcare Corp.: | | | | | | | | |
5.13%, 05/01/25 | | | 44 | | | | 45,320 | |
6.25%, 02/01/27(b) | | | 51 | | | | 54,889 | |
Toledo Hospital (The),
5.75%, 11/15/38 | | | 13 | | | | 14,861 | |
UnitedHealth Group, Inc.: | | | | | | | | |
3.75%, 07/15/25 | | | 212 | | | | 229,015 | |
3.70%, 12/15/25 | | | 65 | | | | 70,354 | |
3.10%, 03/15/26 | | | 22 | | | | 23,045 | |
3.85%, 06/15/28 | | | 51 | | | | 56,278 | |
2.88%, 08/15/29 | | | 7 | | | | 7,205 | |
5.80%, 03/15/36 | | | 13 | | | | 17,264 | |
3.50%, 08/15/39 | | | 50 | | | | 52,510 | |
5.70%, 10/15/40 | | | 5 | | | | 6,603 | |
4.63%, 11/15/41 | | | 24 | | | | 28,629 | |
4.75%, 07/15/45 | | | 5 | | | | 6,157 | |
3.75%, 10/15/47 | | | 24 | | | | 25,833 | |
| | | | | | | | |
| | | | | | | 2,260,797 | |
|
| Hotels, Restaurants & Leisure— 0.2% | |
1011778 BC ULC, 5.00%, 10/15/25(b) | | | 90 | | | | 92,925 | |
Boyd Gaming Corp.: | | | | | | | | |
6.38%, 04/01/26 | | | 22 | | | | 23,671 | |
6.00%, 08/15/26 | | | 20 | | | | 21,450 | |
| | | | | | | | |
| Security | | Par
(000) | | | Value | |
|
| Hotels, Restaurants & Leisure (continued) | |
Caesars Resort Collection LLC,
5.25%, 10/15/25(b) | | | USD 53 | | | $ | 54,855 | |
Cedar Fair LP: | | | | | | | | |
5.38%, 04/15/27 | | | 16 | | | | 17,217 | |
5.25%, 07/15/29(b) | | | 16 | | | | 17,240 | |
Churchill Downs, Inc.(b): | | | | | | | | |
5.50%, 04/01/27 | | | 21 | | | | 22,260 | |
4.75%, 01/15/28 | | | 16 | | | | 16,520 | |
Eldorado Resorts, Inc., 6.00%, 09/15/26 | | | 18 | | | | 19,822 | |
McDonald’s Corp.: | | | | | | | | |
3.70%, 01/30/26 | | | 70 | | | | 75,533 | |
6.30%, 03/01/38 | | | 23 | | | | 31,156 | |
3.70%, 02/15/42 | | | 19 | | | | 19,298 | |
3.63%, 05/01/43 | | | 41 | | | | 40,854 | |
4.88%, 12/09/45 | | | 12 | | | | 14,467 | |
4.45%, 03/01/47 | | | 12 | | | | 13,645 | |
4.45%, 09/01/48 | | | 20 | | | | 22,923 | |
3.63%, 09/01/49 | | | 113 | | | | 114,946 | |
Scientific Games International, Inc.,
5.00%, 10/15/25(b) | | | 34 | | | | 35,572 | |
Six Flags Entertainment Corp.,
5.50%, 04/15/27(b) | | | 16 | | | | 17,060 | |
Station Casinos LLC,
5.00%, 10/01/25(b) | | | 18 | | | | 18,315 | |
Viking Cruises Ltd.,
5.88%, 09/15/27(b) | | | 28 | | | | 29,925 | |
Wynn Las Vegas LLC(b): | | | | | | | | |
5.50%, 03/01/25 | | | 60 | | | | 64,200 | |
5.25%, 05/15/27 | | | 30 | | | | 31,875 | |
Wynn Resorts Finance LLC,
5.13%, 10/01/29(b) | | | 25 | | | | 26,813 | |
| | | | | | | | |
| | | | | | | 842,542 | |
|
| Household Durables— 0.0% | |
Brookfield Residential Properties, Inc.,
6.25%, 09/15/27(b) | | | 19 | | | | 20,045 | |
Century Communities, Inc.,
6.75%, 06/01/27(b)(e) | | | 16 | | | | 17,155 | |
Mattamy Group Corp., 6.50%, 10/01/25(b) | | | 16 | | | | 17,080 | |
Tempur Sealy International, Inc., 5.50%, 06/15/26 | | | 21 | | | | 22,129 | |
| | | | | | | | |
| | | | | | | 76,409 | |
|
| Household Products— 0.0% | |
Spectrum Brands, Inc., 5.75%, 07/15/25 | | | 28 | | | | 29,225 | |
| | | | | | | | |
|
| Independent Power and Renewable Electricity Producers— 0.0% | |
Calpine Corp., 5.50%, 02/01/24 | | | 16 | | | | 16,240 | |
NRG Energy, Inc., 4.45%, 06/15/29(b) | | | 25 | | | | 26,190 | |
| | | | | | | | |
| | | | | | | 42,430 | |
|
| Industrial Conglomerates— 0.1% | |
3M Co.: | | | | | | | | |
2.00%, 02/14/25 | | | 32 | | | | 31,828 | |
3.00%, 08/07/25 | | | 40 | | | | 42,060 | |
2.38%, 08/26/29 | | | 76 | | | | 74,990 | |
General Electric Co.: | | | | | | | | |
5.88%, 01/14/38 | | | 33 | | | | 40,114 | |
6.88%, 01/10/39 | | | 54 | | | | 72,173 | |
4.13%, 10/09/42 | | | 8 | | | | 8,253 | |
Honeywell International, Inc.,
2.70%, 08/15/29 | | | 45 | | | | 46,059 | |
| | | | | | | | |
| | | | | | | 315,477 | |
|
| Insurance— 0.1% | |
Ambac Assurance Corp., 5.10%, 06/07/20(b) | | | 5 | | | | 7,155 | |
Ambac LSNI LLC, (LIBOR USD 3 Month + 5.00%), 6.94%, 02/12/23(a)(b) | | | 27 | | | | 27,541 | |
Aon Corp.: | | | | | | | | |
4.50%, 12/15/28 | | | 122 | | | | 137,450 | |
3.75%, 05/02/29 | | | 104 | | | | 111,288 | |
Aon plc: | | | | | | | | |
3.88%, 12/15/25 | | | 4 | | | | 4,306 | |
| | |
| 44 | | 2019 BLACKROCK ANNUAL REPORTTO SHAREHOLDERS |
| | |
Schedule of Investments (continued) December 31, 2019 | | BlackRock Balanced Capital Portfolio (Percentages shown are based on Net Assets) |
| | | | | | | | |
| Security | | Par (000) | | | Value | |
|
| Insurance (continued) | |
4.75%, 05/15/45 | | | USD 20 | | | $ | 23,588 | |
Hartford Financial Services Group, Inc. (The): | | | | | | | | |
4.30%, 04/15/43 | | | 15 | | | | 16,700 | |
3.60%, 08/19/49 | | | 5 | | | | 5,131 | |
Marsh & McLennan Cos., Inc.: | | | | | | | | |
3.30%, 03/14/23 | | | 10 | | | | 10,347 | |
4.05%, 10/15/23 | | | 35 | | | | 37,237 | |
3.50%, 06/03/24 | | | 138 | | | | 144,975 | |
4.38%, 03/15/29 | | | 67 | | | | 76,389 | |
4.20%, 03/01/48 | | | 15 | | | | 17,074 | |
Principal Financial Group, Inc.,
3.70%, 05/15/29 | | | 30 | | | | 32,718 | |
Travelers Cos., Inc. (The),
6.75%, 06/20/36 | | | 5 | | | | 7,240 | |
Trinity Acquisition plc,
4.40%, 03/15/26 | | | 20 | | | | 21,748 | |
Willis North America, Inc.: | | | | | | | | |
3.60%, 05/15/24 | | | 16 | | | | 16,718 | |
3.88%, 09/15/49 | | | 5 | | | | 4,988 | |
| | | | | | | | |
| | | | | | | 702,593 | |
|
| Internet & Direct Marketing Retail— 0.1% | |
Amazon.com, Inc., 3.88%, 08/22/37 | | | 75 | | | | 85,244 | |
Expedia Group, Inc.: | | | | | | | | |
3.80%, 02/15/28 | | | 30 | | | | 30,686 | |
3.25%, 02/15/30(b) | | | 110 | | | | 105,871 | |
| | | | | | | | |
| | | | | | | 221,801 | |
|
| IT Services— 0.4% | |
Fidelity National Information Services, Inc.,
3.00%, 08/15/26 | | | 177 | | | | 183,159 | |
Fiserv, Inc.: | | | | | | | | |
3.85%, 06/01/25 | | | 20 | | | | 21,342 | |
3.20%, 07/01/26 | | | 217 | | | | 224,735 | |
4.20%, 10/01/28 | | | 120 | | | | 133,109 | |
3.50%, 07/01/29 | | | 60 | | | | 63,065 | |
Global Payments, Inc.: | | | | | | | | |
3.80%, 04/01/21 | | | 20 | | | | 20,393 | |
3.75%, 06/01/23 | | | 25 | | | | 26,041 | |
4.00%, 06/01/23 | | | 4 | | | | 4,209 | |
2.65%, 02/15/25 | | | 30 | | | | 30,137 | |
4.80%, 04/01/26 | | | 117 | | | | 130,234 | |
3.20%, 08/15/29 | | | 87 | | | | 88,671 | |
IBM Credit LLC, 3.45%, 11/30/20 | | | 100 | | | | 101,544 | |
International Business Machines Corp.: | | | | | | | | |
3.00%, 05/15/24 | | | 100 | | | | 103,772 | |
3.30%, 05/15/26 | | | 350 | | | | 369,480 | |
5.60%, 11/30/39 | | | 5 | | | | 6,608 | |
Mastercard, Inc.: | | | | | | | | |
2.95%, 11/21/26 | | | 20 | | | | 20,809 | |
2.95%, 06/01/29 | | | 100 | | | | 104,360 | |
3.65%, 06/01/49 | | | 20 | | | | 22,218 | |
PayPal Holdings, Inc.: | | | | | | | | |
2.40%, 10/01/24 | | | 40 | | | | 40,394 | |
2.65%, 10/01/26 | | | 35 | | | | 35,492 | |
2.85%, 10/01/29 | | | 70 | | | | 70,650 | |
Visa, Inc., 4.30%, 12/14/45 | | | 13 | | | | 15,981 | |
Zayo Group LLC: | | | | | | | | |
6.38%, 05/15/25 | | | 30 | | | | 30,925 | |
5.75%, 01/15/27(b) | | | 53 | | | | 53,861 | |
| | | | | | | | |
| | | | | | | 1,901,189 | |
|
| Leisure Products— 0.0% | |
Hasbro, Inc.: | | | | | | | | |
2.60%, 11/19/22 | | | 40 | | | | 40,245 | |
3.90%, 11/19/29 | | | 15 | | | | 15,109 | |
| | | | | | | | |
| | | | | | | 55,354 | |
| | | | | | | | |
| Security | | Par (000) | | | Value | |
|
| Life Sciences Tools & Services— 0.1% | |
Agilent Technologies, Inc.: | | | | | | | | |
3.88%, 07/15/23 | | | USD 9 | | | $ | 9,445 | |
3.05%, 09/22/26 | | | 115 | | | | 117,628 | |
2.75%, 09/15/29 | | | 20 | | | | 19,858 | |
Thermo Fisher Scientific, Inc.: | | | | | | | | |
2.95%, 09/19/26 | | | 137 | | | | 140,890 | |
2.60%, 10/01/29 | | | 80 | | | | 79,139 | |
| | | | | | | | |
| | | | | | | 366,960 | |
|
| Machinery— 0.0% | |
Parker-Hannifin Corp.: | | | | | | | | |
2.70%, 06/14/24 | | | 30 | | | | 30,650 | |
3.25%, 06/14/29 | | | 27 | | | | 28,208 | |
Terex Corp., 5.63%, 02/01/25(b) | | | 18 | | | | 18,585 | |
| | | | | | | | |
| | | | | | | 77,443 | |
|
| Media— 0.4% | |
Charter Communications Operating LLC: | | | | | | | | |
4.50%, 02/01/24 | | | 89 | | | | 95,784 | |
4.91%, 07/23/25 | | | 81 | | | | 89,195 | |
4.20%, 03/15/28 | | | 9 | | | | 9,595 | |
6.38%, 10/23/35 | | | 139 | | | | 174,952 | |
6.48%, 10/23/45 | | | 112 | | | | 138,849 | |
5.75%, 04/01/48 | | | 25 | | | | 29,198 | |
5.13%, 07/01/49 | | | 20 | | | | 21,767 | |
4.80%, 03/01/50 | | | 47 | | | | 49,562 | |
Clear Channel Worldwide Holdings, Inc.,
5.13%, 08/15/27(b) | | | 41 | | | | 42,693 | |
Comcast Corp.: | | | | | | | | |
3.15%, 03/01/26 | | | 82 | | | | 85,969 | |
2.35%, 01/15/27 | | | 15 | | | | 14,988 | |
3.15%, 02/15/28 | | | 36 | | | | 37,742 | |
4.25%, 01/15/33 | | | 34 | | | | 39,409 | |
4.20%, 08/15/34 | | | 18 | | | | 20,543 | |
6.50%, 11/15/35 | | | 40 | | | | 56,728 | |
3.20%, 07/15/36 | | | 205 | | | | 209,881 | |
4.60%, 10/15/38 | | | 38 | | | | 45,306 | |
3.40%, 07/15/46 | | | 83 | | | | 84,243 | |
3.97%, 11/01/47 | | | 9 | | | | 9,916 | |
4.95%, 10/15/58 | | | 2 | | | | 2,606 | |
Cox Communications, Inc.(b): | | | | | | | | |
3.15%, 08/15/24 | | | 198 | | | | 203,611 | |
3.35%, 09/15/26 | | | 2 | | | | 2,064 | |
Diamond Sports Group LLC,
6.63%, 08/15/27(b) | | | 60 | | | | 58,350 | |
Discovery Communications LLC: | | | | | | | | |
5.00%, 09/20/37 | | | 47 | | | | 53,119 | |
4.95%, 05/15/42 | | | 15 | | | | 16,639 | |
5.20%, 09/20/47 | | | 39 | | | | 45,462 | |
Fox Corp., 4.03%, 01/25/24(b) | | | 20 | | | | 21,313 | |
Gray Television, Inc.(b): | | | | | | | | |
5.88%, 07/15/26 | | | 23 | | | | 24,467 | |
7.00%, 05/15/27 | | | 25 | | | | 27,781 | |
Meredith Corp., 6.88%, 02/01/26 | | | 41 | | | | 42,628 | |
Nexstar Broadcasting, Inc.,
5.63%, 07/15/27(b) | | | 37 | | | | 38,991 | |
Outfront Media Capital LLC,
5.00%, 08/15/27(b) | | | 21 | | | | 21,998 | |
Time Warner Cable LLC: | | | | | | | | |
5.00%, 02/01/20 | | | 89 | | | | 89,167 | |
4.13%, 02/15/21 | | | 80 | | | | 81,295 | |
6.55%, 05/01/37 | | | 20 | | | | 24,535 | |
5.50%, 09/01/41 | | | 29 | | | | 32,396 | |
4.50%, 09/15/42 | | | 9 | | | | 9,201 | |
ViacomCBS, Inc.: | | | | | | | | |
6.88%, 04/30/36 | | | 35 | | | | 46,866 | |
4.38%, 03/15/43 | | | 45 | | | | 47,712 | |
| | | | | | | | |
| | | | | | | 2,146,521 | |
| | | | |
| SCHEDULES OF INVESTMENTS | | | 45 | |
| | |
Schedule of Investments (continued) December 31, 2019 | | BlackRock Balanced Capital Portfolio (Percentages shown are based on Net Assets) |
| | | | | | | | |
| Security | | Par
(000) | | | Value | |
|
| Metals & Mining — 0.1% | |
Anglo American Capital plc,
3.63%, 09/11/24(b) | | | USD 200 | | | $ | 207,490 | |
ArcelorMittal SA: | | | | | | | | |
3.60%, 07/16/24 | | | 8 | | | | 8,204 | |
6.13%, 06/01/25 | | | 2 | | | | 2,298 | |
4.55%, 03/11/26 | | | 29 | | | | 30,796 | |
Barrick Gold Corp., 5.25%, 04/01/42 | | | 29 | | | | 34,610 | |
Newmont Goldcorp Corp.,
2.80%, 10/01/29 | | | 55 | | | | 54,492 | |
Nucor Corp., 5.20%, 08/01/43 | | | 16 | | | | 19,763 | |
Steel Dynamics, Inc., 5.13%, 10/01/21 | | | 38 | | | | 38,023 | |
Teck Resources Ltd., 6.13%, 10/01/35 | | | 27 | | | | 31,751 | |
| | | | | | | | |
| | | | | | | 427,427 | |
| | |
| Multiline Retail — 0.0% | | | | | | |
Dollar General Corp.: | | | | | | | | |
3.88%, 04/15/27 | | | 10 | | | | 10,708 | |
4.13%, 05/01/28 | | | 2 | | | | 2,185 | |
| | | | | | | | |
| | | | | | | 12,893 | |
| | |
| Multi-Utilities — 0.0% | | | | | | |
Ameren Illinois Co.: | | | | | | | | |
3.80%, 05/15/28 | | | 50 | | | | 54,520 | |
3.25%, 03/15/50 | | | 40 | | | | 40,508 | |
Consumers Energy Co.: | | | | | | | | |
3.80%, 11/15/28 | | | 3 | | | | 3,318 | |
3.95%, 07/15/47 | | | 8 | | | | 8,966 | |
4.05%, 05/15/48 | | | 15 | | | | 17,309 | |
4.35%, 04/15/49 | | | 2 | | | | 2,428 | |
3.75%, 02/15/50 | | | 50 | | | | 55,273 | |
3.10%, 08/15/50 | | | 20 | | | | 19,965 | |
| | | | | | | | |
| | | | | | | 202,287 | |
|
| Oil, Gas & Consumable Fuels — 1.0% | |
Boardwalk Pipelines LP, 4.80%, 05/03/29 | | | 15 | | | | 16,080 | |
BP Capital Markets America, Inc.: | | | | | | | | |
3.79%, 02/06/24 | | | 56 | | | | 59,600 | |
3.80%, 09/21/25 | | | 57 | | | | 61,690 | |
3.41%, 02/11/26 | | | 18 | | | | 19,179 | |
3.12%, 05/04/26 | | | 35 | | | | 36,575 | |
3.94%, 09/21/28 | | | 11 | | | | 12,158 | |
BP Capital Markets plc: | | | | | | | | |
3.81%, 02/10/24 | | | 3 | | | | 3,205 | |
3.28%, 09/19/27 | | | 16 | | | | 16,837 | |
Cameron LNG LLC(b): | | | | | | | | |
3.30%, 01/15/35 | | | 70 | | | | 70,699 | |
3.40%, 01/15/38 | | | 75 | | | | 75,274 | |
Cheniere Corpus Christi Holdings LLC: | | | | | | | | |
5.88%, 03/31/25 | | | 99 | | | | 111,321 | |
5.13%, 06/30/27 | | | 126 | | | | 139,253 | |
Chevron Corp., 2.90%, 03/03/24 | | | 80 | | | | 82,926 | |
Citgo Holding, Inc., 9.25%, 08/01/24(b) | | | 34 | | | | 36,465 | |
Concho Resources, Inc., 3.75%,10/01/27 | | | 55 | | | | 57,851 | |
Diamondback Energy,Inc.,
3.50%, 12/01/29 | | | 130 | | �� | | 132,288 | |
Enbridge Energy Partners LP,
7.38%, 10/15/45 | | | 7 | | | | 10,458 | |
Enbridge, Inc.: | | | | | | | | |
2.90%, 07/15/22 | | | 28 | | | | 28,525 | |
3.70%, 07/15/27 | | | 5 | | | | 5,296 | |
(LIBOR USD 3 Month + 3.42%),
5.50%, 07/15/77(a) | | | 70 | | | | 72,220 | |
Energy Transfer Operating LP: | | | | | | | | |
3.60%, 02/01/23 | | | 19 | | | | 19,463 | |
5.88%, 01/15/24 | | | 33 | | | | 36,536 | |
4.20%, 04/15/27 | | | 6 | | | | 6,284 | |
5.50%, 06/01/27 | | | 24 | | | | 26,982 | |
6.50%, 02/01/42 | | | 138 | | | | 164,151 | |
6.13%, 12/15/45 | | | 5 | | | | 5,799 | |
5.30%, 04/15/47 | | | 9 | | | | 9,608 | |
| | | | | | | | |
| Security | | Par
(000) | | | Value | |
|
| Oil, Gas & Consumable Fuels (continued) | |
Enterprise Products Operating LLC: | | | | | | | | |
3.75%, 02/15/25 | | | USD 10 | | | $ | 10,658 | |
3.13%, 07/31/29 | | | 6 | | | | 6,174 | |
Series D, 6.88%, 03/01/33 | | | 9 | | | | 12,273 | |
Series H, 6.65%, 10/15/34 | | | 5 | | | | 6,798 | |
5.95%, 02/01/41 | | | 10 | | | | 12,906 | |
4.45%, 02/15/43 | | | 67 | | | | 73,738 | |
4.85%, 03/15/44 | | | 19 | | | | 21,985 | |
5.10%, 02/15/45 | | | 25 | | | | 29,972 | |
4.90%, 05/15/46 | | | 5 | | | | 5,864 | |
4.25%, 02/15/48 | | | 4 | | | | 4,298 | |
EOG Resources, Inc., 4.15%, 01/15/26 | | | 10 | | | | 10,993 | |
Exxon Mobil Corp.: | | | | | | | | |
2.73%, 03/01/23 | | | 20 | | | | 20,486 | |
2.02%, 08/16/24 | | | 11 | | | | 11,040 | |
2.71%, 03/06/25 | | | 94 | | | | 97,185 | |
3.04%, 03/01/26 | | | 6 | | | | 6,295 | |
2.28%, 08/16/26 | | | 87 | | | | 87,587 | |
3.00%, 08/16/39 | | | 13 | | | | 13,035 | |
4.11%, 03/01/46 | | | 10 | | | | 11,740 | |
Hess Corp., 6.00%, 01/15/40 | | | 37 | | | | 43,721 | |
Kinder Morgan Energy Partners LP: | | | | | | | | |
6.50%, 02/01/37 | | | 36 | | | | 44,905 | |
6.95%, 01/15/38 | | | 23 | | | | 30,472 | |
6.38%, 03/01/41 | | | 13 | | | | 16,326 | |
5.00%, 03/01/43 | | | 15 | | | | 16,452 | |
Kinder Morgan, Inc.: | | | | | | | | |
4.30%, 03/01/28 | | | 73 | | | | 79,600 | |
5.55%, 06/01/45 | | | 18 | | | | 21,422 | |
Marathon Petroleum Corp.: | | | | | | | | |
3.63%, 09/15/24 | | | 35 | | | | 36,765 | |
5.85%, 12/15/45 | | | 25 | | | | 28,710 | |
MPLX LP: | | | | | | | | |
4.50%, 07/15/23 | | | 2 | | | | 2,126 | |
5.25%, 01/15/25(b) | | | 20 | | | | 21,007 | |
4.13%, 03/01/27 | | | 215 | | | | 225,844 | |
4.25%, 12/01/27(b) | | | 52 | | | | 54,751 | |
4.50%, 04/15/38 | | | 7 | | | | 7,123 | |
NGPL PipeCo LLC, 4.38%, 08/15/22(b) | | | 18 | | | | 18,697 | |
Northwest Pipeline LLC, 4.00%, 04/01/27 | | | 135 | | | | 143,770 | |
Occidental Petroleum Corp.: | | | | | | | | |
2.60%, 08/13/21 | | | 53 | | | | 53,392 | |
3.20%, 08/15/26 | | | 10 | | | | 10,120 | |
6.45%, 09/15/36 | | | 45 | | | | 55,279 | |
0.00%, 10/10/36(l) | | | 180 | | | | 90,421 | |
4.30%, 08/15/39 | | | 5 | | | | 5,098 | |
Petrobras Global Finance BV: | | | | | | | | |
7.38%, 01/17/27 | | | 43 | | | | 52,374 | |
6.00%, 01/27/28 | | | 16 | | | | 18,220 | |
7.25%, 03/17/44 | | | 219 | | | | 265,606 | |
Plains All American Pipeline LP,
3.65%, 06/01/22 | | | 2 | | | | 2,052 | |
Sabine Pass Liquefaction LLC: | | | | | | | | |
6.25%, 03/15/22 | | | 115 | | | | 123,561 | |
5.63%, 04/15/23(e) | | | 100 | | | | 108,842 | |
5.63%, 03/01/25 | | | 282 | | | | 317,619 | |
5.88%, 06/30/26 | | | 74 | | | | 85,065 | |
Spectra Energy Partners LP, 4.50%, 03/15/45 | | | 48 | | | | 52,964 | |
Suncor Energy, Inc.: | | | | | | | | |
3.60%, 12/01/24 | | | 18 | | | | 19,104 | |
6.80%, 05/15/38 | | | 20 | | | | 28,494 | |
6.50%, 06/15/38 | | | 13 | | | | 18,097 | |
Sunoco Logistics Partners Operations LP: | | | | | | | | |
6.10%, 02/15/42 | | | 5 | | | | 5,606 | |
5.30%, 04/01/44 | | | 5 | | | | 5,322 | |
| | |
| 46 | | 2019 BLACKROCK ANNUAL REPORTTO SHAREHOLDERS |
| | |
Schedule of Investments (continued) December 31, 2019 | | BlackRock Balanced Capital Portfolio (Percentages shown are based on Net Assets) |
| | | | | | | | |
| Security | | Par
(000) | | | Value | |
|
| Oil, Gas & Consumable Fuels (continued) | |
5.35%, 05/15/45 | | | USD 48 | | | $ | 51,621 | |
Texas Eastern Transmission LP(b): | | | | | | | | |
3.50%, 01/15/28 | | | 60 | | | | 61,643 | |
4.15%, 01/15/48 | | | 30 | | | | 31,908 | |
Total Capital International SA: | | | | | | | | |
2.75%, 06/19/21 | | | 10 | | | | 10,135 | |
3.75%, 04/10/24 | | | 20 | | | | 21,423 | |
2.43%, 01/10/25 | | | 50 | | | | 50,635 | |
TransCanada PipeLines Ltd.: | | | | | | | | |
3.75%, 10/16/23 | | | 2 | | | | 2,108 | |
4.88%, 01/15/26 | | | 117 | | | | 130,999 | |
4.25%, 05/15/28 | | | 39 | | | | 43,321 | |
4.63%, 03/01/34 | | | 34 | | | | 38,783 | |
5.85%, 03/15/36 | | | 12 | | | | 14,842 | |
6.20%, 10/15/37 | | | 2 | | | | 2,610 | |
4.75%, 05/15/38 | | | 15 | | | | 17,137 | |
6.10%, 06/01/40 | | | 28 | | | | 37,071 | |
Transcontinental Gas Pipe Line Co. LLC: | | | | | | | | |
7.85%, 02/01/26 | | | 41 | | | | 52,109 | |
4.00%, 03/15/28 | | | 80 | | | | 85,118 | |
4.60%, 03/15/48 | | | 20 | | | | 21,933 | |
Valero Energy Corp.: | | | | | | | | |
3.65%, 03/15/25 | | | 31 | | | | 32,977 | |
3.40%, 09/15/26 | | | 86 | | | | 90,147 | |
Western Midstream Operating LP: | | | | | | | | |
4.00%, 07/01/22 | | | 83 | | | | 85,080 | |
4.65%, 07/01/26 | | | 9 | | | | 9,216 | |
4.50%, 03/01/28 | | | 20 | | | | 19,746 | |
Williams Cos., Inc. (The): | | | | | | | | |
4.55%, 06/24/24 | | | 16 | | | | 17,275 | |
4.00%, 09/15/25 | | | 22 | | | | 23,343 | |
3.75%, 06/15/27 | | | 37 | | | | 38,593 | |
Series A, 7.50%, 01/15/31 | | | 20 | | | | 26,102 | |
5.75%, 06/24/44 | | | 35 | | | | 41,480 | |
| | | | | | | | |
| | | | | | | 4,926,032 | |
| | |
| Paper & Forest Products — 0.0% | | | | | | |
Georgia-Pacific LLC: | | | | | | | | |
5.40%, 11/01/20(b) | | | 50 | | | | 51,388 | |
3.73%, 07/15/23(b) | | | 60 | | | | 62,819 | |
3.60%, 03/01/25(b) | | | 10 | | | | 10,567 | |
7.38%, 12/01/25 | | | 37 | | | | 46,829 | |
7.75%, 11/15/29 | | | 20 | | | | 28,314 | |
| | | | | | | | |
| | | | | | | 199,917 | |
| | |
| Pharmaceuticals — 0.3% | | | | | | |
Allergan Funding SCS: | | | | | | | | |
3.80%, 03/15/25 | | | 136 | | | | 142,923 | |
4.55%, 03/15/35 | | | 77 | | | | 84,178 | |
Bausch Health Americas, Inc.(b): | | | | | | | | |
9.25%, 04/01/26 | | | 46 | | | | 52,836 | |
8.50%, 01/31/27 | | | 53 | | | | 60,356 | |
Bausch Health Cos., Inc.(b): | | | | | | | | |
5.88%, 05/15/23 | | | 29 | | | | 29,254 | |
9.00%, 12/15/25 | | | 46 | | | | 52,311 | |
7.00%, 01/15/28 | | | 23 | | | | 25,387 | |
7.25%, 05/30/29 | | | 23 | | | | 26,278 | |
Bristol-Myers Squibb Co.: | | | | | | | | |
3.95%, 10/15/20(b) | | | 10 | | | | 10,163 | |
2.25%, 08/15/21(b) | | | 5 | | | | 5,031 | |
3.25%, 08/15/22(b) | | | 60 | | | | 62,000 | |
3.55%, 08/15/22(b) | | | 60 | | | | 62,358 | |
2.75%, 02/15/23(b) | | | 170 | | | | 173,262 | |
3.25%, 11/01/23 | | | 3 | | | | 3,141 | |
3.20%, 06/15/26(b) | | | 222 | | | | 233,238 | |
4.13%, 06/15/39(b) | | | 5 | | | | 5,771 | |
| | | | | | | | |
| Security | | Par
(000) | | | Value | |
|
| Pharmaceuticals (continued) | |
GlaxoSmithKline Capital plc,
3.38%, 06/01/29 | | | USD 15 | | | $ | 16,100 | |
GlaxoSmithKline Capital, Inc.,
3.88%, 05/15/28 | | | 105 | | | | 115,982 | |
Merck & Co., Inc., 3.90%, 03/07/39 | | | 2 | | | | 2,288 | |
Pfizer, Inc.: | | | | | | | | |
3.00%, 06/15/23 | | | 5 | | | | 5,199 | |
5.80%, 08/12/23 | | | 13 | | | | 14,693 | |
Shire Acquisitions Investments Ireland DAC: | | | | | | | | |
2.88%, 09/23/23 | | | 27 | | | | 27,514 | |
3.20%, 09/23/26 | | | 91 | | | | 93,784 | |
Takeda Pharmaceutical Co. Ltd.,
5.00%, 11/26/28 | | | 200 | | | | 233,018 | |
Wyeth LLC, 5.95%, 04/01/37 | | | 100 | | | | 136,598 | |
| | | | | | | | |
| | | | | | | 1,673,663 | |
| | |
| Road & Rail — 0.2% | | | | | | |
Burlington Northern Santa Fe LLC: | | | | | | | | |
3.00%, 04/01/25 | | | 10 | | | | 10,411 | |
6.15%, 05/01/37 | | | 8 | | | | 11,214 | |
5.75%, 05/01/40 | | | 38 | | | | 51,309 | |
5.05%, 03/01/41 | | | 10 | | | | 12,396 | |
5.40%, 06/01/41 | | | 10 | | | | 12,940 | |
4.95%, 09/15/41 | | | 4 | | | | 4,900 | |
4.40%, 03/15/42 | | | 2 | | | | 2,317 | |
CSX Corp.: | | | | | | | | |
4.25%, 03/15/29 | | | 25 | | | | 28,163 | |
4.30%, 03/01/48 | | | 31 | | | | 35,218 | |
4.75%, 11/15/48 | | | 19 | | | | 23,057 | |
4.50%, 03/15/49 | | | 20 | | | | 23,441 | |
3.35%, 09/15/49 | | | 71 | | | | 70,031 | |
4.25%, 11/01/66 | | | 38 | | | | 40,653 | |
Norfolk Southern Corp.: | | | | | | | | |
3.65%, 08/01/25 | | | 20 | | | | 21,406 | |
2.90%, 06/15/26 | | | 80 | | | | 82,501 | |
4.84%, 10/01/41 | | | 10 | | | | 11,851 | |
4.10%, 05/15/49 | | | 18 | | | | 19,894 | |
3.40%, 11/01/49 | | | 5 | | | | 4,968 | |
4.05%, 08/15/52 | | | 41 | | | | 45,138 | |
Penske Truck Leasing Co. LP(b): | | | | | | | | |
4.45%, 01/29/26 | | | 20 | | | | 21,564 | |
3.40%, 11/15/26 | | | 20 | | | | 20,419 | |
Ryder System, Inc.: | | | | | | | | |
3.45%, 11/15/21 | | | 6 | | | | 6,135 | |
3.40%, 03/01/23 | | | 35 | | | | 36,099 | |
3.75%, 06/09/23 | | | 6 | | | | 6,269 | |
Union Pacific Corp.: | | | | | | | | |
3.15%, 03/01/24 | | | 26 | | | | 27,068 | |
2.75%, 03/01/26 | | | 58 | | | | 59,444 | |
3.38%, 02/01/35 | | | 1 | | | | 1,036 | |
3.60%, 09/15/37 | | | 96 | | | | 100,159 | |
3.55%, 08/15/39 | | | 4 | | | | 4,157 | |
3.84%, 03/20/60(b) | | | 20 | | | | 20,293 | |
| | | | | | | | |
| | | | | | | 814,451 | |
|
| Semiconductors & Semiconductor Equipment — 0.3% | |
Analog Devices, Inc., 3.50%, 12/05/26 | | | 29 | | | | 30,428 | |
Applied Materials, Inc.: | | | | | | | | |
5.10%, 10/01/35 | | | 8 | | | | 10,115 | |
4.35%, 04/01/47 | | | 67 | | | | 80,971 | |
Broadcom Corp.: | | | | | | | | |
2.38%, 01/15/20 | | | 115 | | | | 115,005 | |
3.13%, 01/15/25 | | | 16 | | | | 16,195 | |
3.88%, 01/15/27 | | | 199 | | | | 206,713 | |
Broadcom, Inc., 4.25%, 04/15/26(b) | | | 89 | | | | 94,533 | |
Intel Corp., 4.10%, 05/11/47 | | | 2 | | | | 2,324 | |
KLA Corp.: | | | | | | | | |
4.10%, 03/15/29 | | | 65 | | | | 71,218 | |
| | | | |
| SCHEDULES OF INVESTMENTS | | | 47 | |
| | |
Schedule of Investments (continued) December 31, 2019 | | BlackRock Balanced Capital Portfolio (Percentages shown are based on Net Assets) |
| | | | | | | | |
| Security | | Par
(000) | | | Value | |
|
| Semiconductors & Semiconductor Equipment (continued) | |
5.00%, 03/15/49 | | | USD 30 | | | $ | 36,903 | |
Lam Research Corp.: | | | | | | | | |
2.75%, 03/15/20 | | | 60 | | | | 60,030 | |
3.75%, 03/15/26 | | | 70 | | | | 75,050 | |
4.88%, 03/15/49 | | | 35 | | | | 43,831 | |
NVIDIA Corp., 3.20%, 09/16/26 | | | 159 | | | | 166,975 | |
NXP BV(b): | | | | | | | | |
4.63%, 06/01/23 | | | 255 | | | | 272,621 | |
4.88%, 03/01/24 | | | 3 | | | | 3,272 | |
5.55%, 12/01/28 | | | 25 | | | | 29,222 | |
QUALCOMM, Inc.: | | | | | | | | |
4.80%, 05/20/45 | | | 20 | | | | 24,506 | |
4.30%, 05/20/47 | | | 30 | | | | 34,418 | |
Texas Instruments, Inc.: | | | | | | | | |
2.25%, 09/04/29 | | | 47 | | | | 46,408 | |
3.88%, 03/15/39 | | | 15 | | | | 16,958 | |
| | | | | | | | |
| | | | | | | 1,437,696 | |
| | |
| Software — 0.2% | | | | | | |
Autodesk, Inc., 3.50%, 06/15/27 | | | 138 | | | | 144,689 | |
Microsoft Corp.: | | | | | | | | |
3.50%, 02/12/35 | | | 139 | | | | 153,160 | |
4.20%, 11/03/35 | | | 39 | | | | 46,401 | |
3.45%, 08/08/36 | | | 125 | | | | 137,002 | |
4.10%, 02/06/37 | | | 5 | | | | 5,915 | |
3.70%, 08/08/46 | | | 57 | | | | 64,453 | |
Oracle Corp.: | | | | | | | | |
2.50%, 05/15/22 | | | 5 | | | | 5,066 | |
2.65%, 07/15/26 | | | 109 | | | | 111,505 | |
3.90%, 05/15/35 | | | 90 | | | | 100,383 | |
3.85%, 07/15/36 | | | 29 | | | | 31,798 | |
3.80%, 11/15/37 | | | 5 | | | | 5,465 | |
5.38%, 07/15/40 | | | 11 | | | | 14,298 | |
4.00%, 07/15/46 | | | 20 | | | | 22,263 | |
| | | | | | | | |
| | | | | | | 842,398 | |
| | |
| Specialty Retail — 0.0% | | | | | | |
Home Depot, Inc. (The): | | | | | | | | |
2.80%, 09/14/27 | | | 9 | | | | 9,362 | |
3.90%, 12/06/28 | | | 20 | | | | 22,462 | |
2.95%, 06/15/29 | | | 30 | | | | 31,215 | |
Lowe’s Cos., Inc.: | | | | | | | | |
4.38%, 09/15/45 | | | 55 | | | | 61,394 | |
3.70%, 04/15/46 | | | 18 | | | | 18,362 | |
| | | | | | | | |
| | | | | | | 142,795 | |
|
| Technology Hardware, Storage & Peripherals — 0.1% | |
Apple, Inc.: | | | | | | | | |
3.00%, 02/09/24 | | | 62 | | | | 64,391 | |
3.35%, 02/09/27 | | | 7 | | | | 7,456 | |
3.85%, 05/04/43 | | | 223 | | | | 250,012 | |
4.25%, 02/09/47 | | | 2 | | | | 2,395 | |
Dell International LLC, 8.10%, 07/15/36(b) | | | 85 | | | | 111,769 | |
Hewlett Packard Enterprise Co.,
6.35%, 10/15/45(e) | | | 30 | | | | 36,124 | |
HP, Inc., 6.00%, 09/15/41 | | | 15 | | | | 16,632 | |
Seagate HDD Cayman: | | | | | | | | |
4.25%, 03/01/22 | | | 8 | | | | 8,281 | |
5.75%, 12/01/34 | | | 13 | | | | 13,620 | |
| | | | | | | | |
| | | | | | | 510,680 | |
|
| Thrifts & Mortgage Finance — 0.1%(b) | |
BPCE SA, 2.70%, 10/01/29 | | | 250 | | | | 248,180 | |
Nationstar Mortgage Holdings, Inc.: | | | | | | | | |
8.13%, 07/15/23 | | | 32 | | | | 33,873 | |
| | | | | | | | |
| Security | | Par
(000) | | | Value | |
|
| Thrifts & Mortgage Finance (continued) | |
9.13%, 07/15/26 | | | USD 25 | | | $ | 27,687 | |
| | | | | | | | |
| | | | | | | 309,740 | |
| | |
| Tobacco — 0.2% | | | | | | |
Altria Group, Inc.: | | | | | | | | |
2.85%, 08/09/22 | | | 4 | | | | 4,077 | |
4.40%, 02/14/26 | | | 111 | | | | 120,673 | |
4.80%, 02/14/29 | | | 82 | | | | 91,403 | |
5.80%, 02/14/39 | | | 165 | | | | 194,125 | |
BAT Capital Corp.: | | | | | | | | |
3.22%, 08/15/24 | | | 30 | | | | 30,686 | |
3.22%, 09/06/26 | | | 10 | | | | 10,077 | |
3.56%, 08/15/27 | | | 42 | | | | 42,883 | |
4.54%, 08/15/47 | | | 44 | | | | 44,252 | |
BAT International Finance plc,
3.95%, 06/15/25(b) | | | 20 | | | | 21,158 | |
Philip Morris International, Inc.: | | | | | | | | |
2.88%, 05/01/24 | | | 51 | | | | 52,499 | |
4.50%, 03/20/42 | | | 3 | | | | 3,409 | |
3.88%, 08/21/42 | | | 2 | | | | 2,083 | |
Reynolds American, Inc.: | | | | | | | | |
4.45%, 06/12/25 | | | 205 | | | | 220,761 | |
5.70%, 08/15/35 | | | 12 | | | | 13,952 | |
5.85%, 08/15/45 | | | 70 | | | | 80,339 | |
| | | | | | | | |
| | | | | | | 932,377 | |
|
| Trading Companies & Distributors — 0.0% | |
Beacon Roofing Supply,Inc.,
4.88%, 11/01/25(b) | | | 39 | | | | 39,195 | |
GATX Corp., 2.60%, 03/30/20 | | | 67 | | | | 67,040 | |
H&E Equipment Services, Inc.,
5.63%, 09/01/25 | | | 32 | | | | 33,520 | |
Herc Holdings, Inc., 5.50%, 07/15/27(b) | | | 39 | | | | 41,048 | |
| | | | | | | | |
| | | | | | | 180,803 | |
|
| Wireless Telecommunication Services — 0.1% | |
Sprint Corp.: | | | | | | | | |
7.63%, 02/15/25 | | | 53 | | | | 58,160 | |
7.63%, 03/01/26 | | | 53 | | | | 58,448 | |
Sprint Spectrum Co. LLC,
3.36%, 09/20/21(b)(e) | | | 123 | | | | 124,031 | |
Vodafone Group plc: | | | | | | | | |
3.75%, 01/16/24 | | | 56 | | | | 59,237 | |
4.13%, 05/30/25 | | | 45 | | | | 48,882 | |
4.38%, 05/30/28 | | | 7 | | | | 7,762 | |
4.38%, 02/19/43 | | | 43 | | | | 46,181 | |
5.25%, 05/30/48 | | | 99 | | | | 118,921 | |
5.13%, 06/19/59 | | | 1 | | | | 1,176 | |
| | | | | | | | |
| | | | | | | 522,798 | |
| | | | | | | | |
| | |
Total Corporate Bonds — 11.7%
(Cost: $55,999,524) | | | | | | | 58,365,764 | |
| | | | | | | | |
|
Foreign Agency Obligations — 0.3% | |
| | |
Argentina — 0.0% | | | | | | | | |
YPF SA, 8.50%, 07/28/25(b) | | | 7 | | | | 6,586 | |
| | | | | | | | |
| | |
| Mexico — 0.3% | | | | | | |
Petroleos Mexicanos: | | | | | | | | |
6.38%, 02/04/21 | | | 70 | | | | 72,669 | |
(LIBOR USD 3 Month + 3.65%),
5.54%, 03/11/22(a) | | | 14 | | | | 14,586 | |
4.50%, 01/23/26 | | | 20 | | | | 19,878 | |
6.88%, 08/04/26 | | | 33 | | | | 36,234 | |
6.49%, 01/23/27(b) | | | 77 | | | | 82,005 | |
6.50%, 03/13/27 | | | 568 | | | | 601,782 | |
5.35%, 02/12/28 | | | 445 | | | | 440,550 | |
6.63%, 06/15/35 | | | 45 | | | | 46,035 | |
| | |
| 48 | | 2019 BLACKROCK ANNUAL REPORTTO SHAREHOLDERS |
| | |
Schedule of Investments (continued) December 31, 2019 | | BlackRock Balanced Capital Portfolio (Percentages shown are based on Net Assets) |
| | | | | | | | | | | | |
| Security | | | | | Par
(000) | | | Value | |
|
| Mexico (continued) | |
7.69%, 01/23/50(b) | | | USD | | | | 60 | | | $ | 65,743 | |
| | | | | | | | | | | | |
| | | | | | | | | | | 1,379,482 | |
| | | | | | | | | | | | |
| | |
Total Foreign Agency Obligations— 0.3%
(Cost: $1,334,506) | | | | | | | | 1,386,068 | |
| | | | | | | | | | | | |
|
Foreign Government Obligations— 0.9% | |
| | | |
Argentina— 0.0% | | | | | | | | | | | | |
Republic of Argentina: | | | | | | | | | | | | |
5.88%, 01/11/28 | | | | | | | 62 | | | | 29,121 | |
7.13%, 07/06/36 | | | | | | | 150 | | | | 71,766 | |
6.88%, 01/11/48 | | | | | | | 70 | | | | 33,512 | |
| | | | | | | | | | | | |
| | | | | | | | | | | 134,399 | |
| | | |
| Colombia— 0.1% | | | | | | | | | |
Republic of Colombia,
3.88%, 04/25/27 | | | | | | | 340 | | | | 360,400 | |
| | | | | | | | | | | | |
| | | |
| Egypt— 0.0% | | | | | | | | | |
Arab Republic of Egypt: | | | | | | | | | | | | |
15.90%, 07/02/24 | | | EGP | | | | 170 | | | | 11,389 | |
16.10%, 05/07/29 | | | | | | | 1,492 | | | | 104,266 | |
| | | | | | | | | | | | |
| | | | | | | | | | | 115,655 | |
| | | |
Hungary— 0.0% | | | | | | | | | | | | |
Republic of Hungary, 5.38%, 03/25/24 | | | USD | | | | 140 | | | | 157,456 | |
| | | | | | | | | | | | |
| | | |
Indonesia— 0.2% | | | | | | | | | | | | |
Republic of Indonesia: | | | | | | | | | | | | |
4.45%, 02/11/24 | | | | | | | 200 | | | | 215,250 | |
8.25%, 05/15/29 | | | IDR | | | | 2,881,000 | | | | 225,582 | |
6.63%, 05/15/33 | | | | | | | 328,000 | | | | 21,985 | |
8.38%, 03/15/34 | | | | | | | 1,506,000 | | | | 116,835 | |
7.50%, 06/15/35 | | | | | | | 1,831,000 | | | | 131,563 | |
8.38%, 04/15/39 | | | | | | | 2,544,000 | | | | 196,767 | |
| | | | | | | | | | | | |
| | | | | | | | | | | 907,982 | |
| | | |
Mexico— 0.3% | | | | | | | | | | | | |
United Mexican States: | | | | | | | | | | | | |
6.50%, 06/09/22 | | | MXN | | | | 27 | | | | 142,623 | |
8.00%, 12/07/23 | | | | | | | 24 | | | | 134,081 | |
8.00%, 09/05/24 | | | | | | | 19 | | | | 106,012 | |
10.00%, 12/05/24 | | | | | | | 57 | | | | 343,965 | |
4.15%, 03/28/27 | | | USD | | | | 602 | | | | 644,704 | |
| | | | | | | | | | | | |
| | | | | | | | | | | 1,371,385 | |
| | | |
Nigeria— 0.0% | | | | | | | | | | | | |
Federal Republic of Nigeria,
13.98%, 02/23/28 | | | NGN | | | | 6,230 | | | | 19,214 | |
| | | | | | | | | | | | |
| | | |
Panama— 0.1% | | | | | | | | | | | | |
Republic of Panama, 3.88%, 03/17/28 | | | USD | | | | 200 | | | | 218,188 | |
| | | | | | | | | | | | |
| | | |
Peru— 0.0% | | | | | | | | | | | | |
Republic of Peru, 4.13%, 08/25/27 | | | | | | | 179 | | | | 200,480 | |
| | | | | | | | | | | | |
| | | |
Philippines— 0.1% | | | | | | | | | | | | |
Republic of the Philippines,
3.00%, 02/01/28 | | | | | | | 260 | | | | 270,067 | |
| | | | | | | | | | | | |
| | | |
Russia— 0.1% | | | | | | | | | | | | |
Russian Federation: | | | | | | | | | | | | |
7.10%, 10/16/24 | | | RUB | | | | 13,957 | | | | 235,430 | |
8.50%, 09/17/31 | | | | | | | 20,543 | | | | 390,331 | |
| | | | | | | | | | | | |
| | | | | | | | | | | 625,761 | |
| | | |
Uruguay— 0.0% | | | | | | | | | | | | |
Oriental Republic of Uruguay,
4.38%, 10/27/27 | | | USD | | | | 190 | | | | 209,831 | |
| | | | | | | | | | | | |
| | |
Total Foreign Government Obligations — 0.9%
(Cost: $4,432,042) | | | | | | | | 4,590,818 | |
| | | | | | | | | | | | |
| | | | | | | | |
| Security | |
Shares | | | Value | |
| | |
Investment Companies— 0.6% | | | | | | | | |
BlackRock Allocation Target Shares- BATS Series A* | | | 312,190 | | | $ | 3,137,512 | |
| | | | | | | | |
| | |
Total Investment Companies— 0.6%
(Cost: $3,150,000) | | | | | | | 3,137,512 | |
| | | | | | | | |
| | |
| | | Par
(000) | | | | |
| | |
Municipal Bonds— 1.9% | | | | | | | | |
American Municipal Power, Inc. (Combined Hydroelectric Project): | | | | | | | | |
Series 2010B, RB, 7.83%, 02/15/41 | | | 20 | | | | 31,272 | |
Series 2009B, RB, 6.45%, 02/15/44 | | | 15 | | | | 20,797 | |
Arizona Health Facilities Authority (Banner Health), Series 2007B, RB, VRDN,
2.22%, 01/01/20(m) | | | 40 | | | | 39,681 | |
Bay Area Toll Authority: | | | | | | | | |
Series2010S-1, RB, 6.92%, 04/01/40 | | | 80 | | | | 117,195 | |
Series2010S-1, RB, 7.04%, 04/01/50 | | | 175 | | | | 280,375 | |
Berks County Industrial Development Authority (Tower Health Project), Series 2017, RB,
5.00%, 11/01/47 | | | 20 | | | | 22,703 | |
Buckeye Tobacco Settlement Financing Authority, Series2007A-2, RB,
5.88%, 06/01/47 | | | 90 | | | | 90,313 | |
California Health Facilities Financing Authority (Cedars- Sinai Medical Center): | | | | | | | | |
Series 2019, RB, 2.93%, 06/01/32 | | | 10 | | | | 9,920 | |
Series 2016A, RB, 5.00%, 08/15/33 | | | 20 | | | | 24,347 | |
Series 2017A, RB, 5.00%, 08/15/47 | | | 20 | | | | 23,345 | |
California State Public Works Board (Various Capital Projects), Series 2009G,Sub-SeriesG-2, RB, 8.36%, 10/01/34 | | | 40 | | | | 61,234 | |
Canaveral Port Authority: | | | | | | | | |
Series 2018A, RB, 5.00%, 06/01/45 | | | 30 | | | | 35,037 | |
Series 2018B, RB, 5.00%, 06/01/48 | | | 30 | | | | 35,584 | |
Central Puget Sound Regional Transit Authority, Series2015S-1, RB, 5.00%, 11/01/50 | | | 20 | | | | 23,214 | |
Central Texas Regional Mobility Authority: | | | | | | | | |
Series 2015A, RB, 5.00%, 01/01/45 | | | 20 | | | | 22,899 | |
Series 2016, RB, 5.00%, 01/01/46 | | | 20 | | | | 23,012 | |
Chesapeake Bay Bridge & Tunnel District (Parallel Thimble Shoal Tunnel Project): | | | | | | | | |
Series 2016, RB, 5.00%, 07/01/41 | | | 20 | | | | 23,259 | |
Series 2016, RB, 5.00%, 07/01/51 | | | 10 | | | | 11,528 | |
City of Atlanta, Series 2015, RB,
5.00%, 11/01/40 | | | 10 | | | | 11,663 | |
City of New York: | | | | | | | | |
Series 2019A,Sub-SeriesA-3, GO,
2.85%, 08/01/31 | | | 70 | | | | 70,348 | |
Series 2019A,Sub-SeriesA-3, GO,
2.90%, 08/01/32 | | | 115 | | | | 115,523 | |
Series2010F-1, GO, 6.27%, 12/01/37 | | | 25 | | | | 34,667 | |
City of Riverside, Series 2010A, RB,
7.61%, 10/01/40 | | | 25 | | | | 38,828 | |
City of San Antonio Electric &Gas Systems, Series 2010A, RB, 5.81%, 02/01/41 | | | 45 | | | | 61,847 | |
Colorado Health Facilities Authority (Catholic Health Initiatives): | | | | | | | | |
Series 2011A, RB, 5.25%, 02/01/31(n) | | | 10 | | | | 10,442 | |
Series2019A-2, RB, 5.00%, 08/01/44 | | | 170 | | | | 200,537 | |
Commonwealth Financing Authority: | | | | | | | | |
Series 2018A, RB, 3.86%, 06/01/38 | | | 15 | | | | 16,077 | |
Series 2016A, RB, 4.14%, 06/01/38 | | | 30 | | | | 32,878 | |
| | | | |
| SCHEDULES OF INVESTMENTS | | | 49 | |
| | |
Schedule of Investments (continued) December 31, 2019 | | BlackRock Balanced Capital Portfolio (Percentages shown are based on Net Assets) |
| | | | | | | | |
| Security | | Par
(000) | | | Value | |
|
| Municipal Bonds (continued) | |
Series 2019A, RB, 3.81%, 06/01/41 | | | USD 145 | | | $ | 154,656 | |
Connecticut State Health & Educational Facilities Authority (Hartford Healthcare Corp.): | | | | | | | | |
Series 2015F, RB, 5.00%, 07/01/45 | | | 30 | | | | 33,524 | |
Series 2015L, RB, 5.00%, 07/01/45 | | | 40 | | | | 45,431 | |
Contra Costa Community College District,
Series 2010B, GO, 6.50%, 08/01/34 | | | 25 | | | | 33,129 | |
County of Broward Airport System: | | | | | | | | |
Series 2019C, RB, 2.81%, 10/01/31 | | | 20 | | | | 19,730 | |
Series 2019C, RB, 2.91%, 10/01/32 | | | 15 | | | | 14,827 | |
County of Miami-Dade: | | | | | | | | |
Series 2017D, RB, 3.35%, 10/01/29 | | | 10 | | | | 10,344 | |
Series 2019E, RB, 2.53%, 10/01/30 | | | 70 | | | | 67,526 | |
Series 2017D, RB, 3.45%, 10/01/30 | | | 15 | | | | 15,581 | |
Series 2017D, RB, 3.50%, 10/01/31 | | | 15 | | | | 15,588 | |
Series 2018C, RB, 4.06%, 10/01/31 | | | 20 | | | | 21,716 | |
Series 2015A, RB, 5.00%, 10/01/38 | | | 45 | | | | 51,780 | |
Series 2017B, RB, 5.00%, 10/01/40 | | | 20 | | | | 23,569 | |
Dallas Area Rapid Transit: | | | | | | | | |
Series 2016A, RB, 5.00%, 12/01/41 | | | 30 | | | | 35,222 | |
Series 2016A, RB, 5.00%, 12/01/46 | | | 40 | | | | 46,876 | |
Dallas/Fort Worth International Airport, Series2019A-2, RB, 3.14%, 11/01/45 | | | 30 | | | | 29,800 | |
DuBois Hospital Authority (Penn Highlands Healthcare), Series 2018, RB, 5.00%, 07/15/43 | | | 20 | | | | 23,196 | |
Dutchess County Local Development Corp. (Health Quest Systems, Inc. Project), Series 2016B, RB,
5.00%, 07/01/46 | | | 50 | | | | 57,599 | |
Foothill-Eastern Transportation Corridor Agency, Series 2019A, RB, 4.09%, 01/15/49 | | | 25 | | | | 25,017 | |
Grant County Public Utility District No. 2 (The Priest Rapids Project), Series 2015M, RB, 4.58%, 01/01/40 | | | 15 | | | | 17,494 | |
Great Lakes Water Authority Water Supply System, Series 2016C, RB, 5.25%, 07/01/33 | | | 5 | | | | 6,004 | |
Health & Educational Facilities Authority of the State of Missouri (Saint Luke’s Health System, Inc.): | | | | | | | | |
Series 2016, RB, 5.00%, 11/15/29 | | | 15 | | | | 17,926 | |
Series 2016A, RB, 3.65%, 01/15/46 | | | 95 | | | | 101,958 | |
Idaho Health Facilities Authority (Trinity Health Credit Group), Series 2017A, RB,
5.00%, 12/01/47 | | | 20 | | | | 23,616 | |
Indiana Finance Authority (CWA Authority Project), Series 2015A, RB, 5.00%, 10/01/45 | | | 40 | | | | 45,480 | |
Indiana Housing & Community Development Authority, Series 2018A, RB, 3.80%, 07/01/38 | | | 10 | | | | 10,736 | |
Lexington County Health Services District, Inc., Series 2016, RB, 5.00%, 11/01/41 | | | 20 | | | | 23,209 | |
Los Angeles Community College District, Series 2010E, GO, 6.60%, 08/01/42 | | | 55 | | | | 83,856 | |
Los Angeles Department of Water & Power System, Series 2010D, RB, 6.57%, 07/01/45 | | | 15 | | | | 23,471 | |
Los Angeles Unified School District, Series 2010I, GO, 6.76%, 07/01/34 | | | 60 | | | | 82,184 | |
Louisiana Public Facilities Authority, Series 2018E, RB, 5.00%, 07/01/48 | | | 20 | | | | 23,535 | |
Maryland Health &Higher Educational Facilities Authority: | | | | | | | | |
Series 2015, RB, 5.00%, 08/15/25 | | | 20 | | | | 23,557 | |
Series 2015, RB, 5.00%, 08/15/27 | | | 20 | | | | 23,446 | |
| | | | | | | | |
| Security | | Par
(000) | | | Value | |
|
| Municipal Bonds (continued) | |
Massachusetts Development Finance Agency (Partners Healthcare System Issue): | | | | | | | | |
Series2018J-2, RB, 5.00%, 07/01/43 | | | USD 30 | | | $ | 35,581 | |
Series 2016Q, RB, 5.00%, 07/01/47 | | | 20 | | | | 23,273 | |
Series2018J-2, RB, 5.00%, 07/01/48 | | | 30 | | | | 35,279 | |
Massachusetts Housing Finance Agency: | | | | | | | | |
Series 2014B, RB, 4.50%, 12/01/39 | | | 10 | | | | 10,485 | |
Series 2014B, RB, 4.60%, 12/01/44 | | | 10 | | | | 10,698 | |
Series 2015A, RB, 4.50%, 12/01/48 | | | 10 | | | | 10,518 | |
Massachusetts School Building Authority: | | | | | | | | |
Series 2019B, RB, 2.87%, 10/15/31 | | | 80 | | | | 79,508 | |
Series 2019B, RB, 2.97%, 10/15/32 | | | 45 | | | | 44,892 | |
Massachusetts Water Resources Authority, Series 2016C, RB, 5.00%, 08/01/40 | | | 10 | | | | 11,948 | |
Metropolitan Atlanta Rapid Transit Authority, Series 2015A, RB, 5.00%, 07/01/41 | | | 40 | | | | 46,594 | |
Metropolitan Government Nashville & Davidson County Health & Educational Facilities Board (Vanderbilt University Medical Center): | | | | | | | | |
Series 2016A, RB, 5.00%, 07/01/40 | | | 10 | | | | 11,664 | |
Series 2016A, RB, 5.00%, 07/01/46 | | | 30 | | | | 34,697 | |
Metropolitan Transportation Authority: | | | | | | | | |
Series 2009C, RB, 7.34%, 11/15/39 | | | 170 | | | | 265,710 | |
Series 2019C, RB, 5.00%, 11/15/41 | | | 20 | | | | 24,702 | |
Metropolitan Washington Airports Authority Dulles Toll Road (Dulles Metrorail and Capital Improvement Project), Series 2009D, RB,
7.46%, 10/01/46 | | | 30 | | | | 47,798 | |
Michigan Finance Authority (Henry Ford Health System): | | | | | | | | |
Series 2016, RB, 5.00%, 11/15/28 | | | 20 | | | | 24,331 | |
Series 2019T, RB, 3.38%, 12/01/40 | | | 55 | | | | 55,014 | |
Series 2016, RB, 5.00%, 11/15/41 | | | 20 | | | | 23,490 | |
Series2017A-MI, RB, 5.00%, 12/01/47(n) | | | 60 | | | | 66,666 | |
Michigan State Housing Development Authority: | | | | | | | | |
Series 2018B, RB, 3.55%, 10/01/33 | | | 10 | | | | 10,647 | |
Series 2018A, RB, 4.00%, 10/01/43 | | | 10 | | | | 10,696 | |
Series 2018A, RB, 4.05%, 10/01/48 | | | 10 | | | | 10,643 | |
Series 2018A, RB, 4.15%, 10/01/53 | | | 30 | | | | 31,730 | |
Mississippi Hospital Equipment & Facilities Authority (Baptist Memorial Health Corp.), Series 2016A, RB,
5.00%, 09/01/46 | | | 30 | | | | 33,219 | |
Municipal Electric Authority of Georgia (Plant Vogtle Units 3&4 Units Project), Series 2010A, RB,
6.64%, 04/01/57 | | | 45 | | | | 60,523 | |
New Hope Cultural Education Facilities Finance Corp. (Children’s Health System of Texas Project), Series 2017A, RB, 5.00%, 08/15/47 | | | 20 | | | | 23,632 | |
New Jersey Transportation Trust Fund Authority: | | | | | | | | |
Series 2010C, RB, 5.75%, 12/15/28 | | | 45 | | | | 51,845 | |
Series 2016A,Sub-SeriesA-1, RB,
5.00%, 06/15/29 | | | 20 | | | | 23,365 | |
Series 2019B, RB, 4.13%, 06/15/42 | | | 30 | | | | 29,669 | |
New Jersey Turnpike Authority, Series 2009F, RB,
7.41%, 01/01/40 | | | 66 | | | | 103,562 | |
New Orleans Aviation Board (North Terminal Project), Series 2015B, RB, 5.00%, 01/01/40 | | | 20 | | | | 22,514 | |
New York City Housing Development Corp.: | | | | | | | | |
Series2018C-1-A, RB, 3.70%, 11/01/38 | | | 10 | | | | 10,545 | |
Series2018C-1-B, RB, 3.85%, 11/01/43 | | | 40 | | | | 42,220 | |
Series2018C-1-A, RB, 4.00%, 11/01/53 | | | 40 | | | | 41,788 | |
New York City Transitional Finance Authority Building Aid, Series2015S-2, RB, 5.00%, 07/15/40 | | | 20 | | | | 23,353 | |
| | |
| 50 | | 2019 BLACKROCK ANNUAL REPORTTO SHAREHOLDERS |
| | |
Schedule of Investments (continued) December 31, 2019 | | BlackRock Balanced Capital Portfolio (Percentages shown are based on Net Assets) |
| | | | | | | | |
| Security | | Par
(000) | | | Value | |
|
| Municipal Bonds (continued) | |
New York City Transitional Finance Authority Future Tax Secured: | | | | | | | | |
Series 2014A,Sub-SeriesA-2, RB,
3.65%, 11/01/24 | | | USD 50 | | | $ | 52,847 | |
Series 2018,Sub-SeriesC-4, RB,
3.55%, 05/01/25 | | | 65 | | | | 69,431 | |
Series 2014A,Sub-SeriesA-2, RB,
3.75%, 11/01/25 | | | 50 | | | | 52,857 | |
Series 2017F,Sub-SeriesF-2, RB,
3.05%, 05/01/27 | | | 70 | | | | 72,738 | |
Series 2019C,Sub-SeriesC-3, RB,
3.35%, 11/01/30 | | | 80 | | | | 83,432 | |
Series 2019B,Sub-SeriesB-3, RB,
3.90%, 08/01/31 | | | 70 | | | | 75,594 | |
New York City Water & Sewer System: | | | | | | | | |
Series 2010AA, RB, 5.75%, 06/15/41 | | | 35 | | | | 48,685 | |
Series 2020AA, RB, 5.38%, 06/15/43(n) | | | 145 | | | | 150,941 | |
Series 2020AA, RB, 5.38%, 06/15/43 | | | 70 | | | | 72,530 | |
Series 2011AA, RB, 5.44%, 06/15/43 | | | 25 | | | | 34,008 | |
Series 2011EE, RB, 5.50%, 06/15/43(n) | | | 255 | | | | 265,677 | |
Series 2011CC, RB, 5.88%, 06/15/44 | | | 50 | | | | 71,831 | |
New York Convention Center Development Corp., Series 2015, RB, 5.00%, 11/15/40 | | | 20 | | | | 23,540 | |
New York State Dormitory Authority: | | | | | | | | |
Series 2010H, RB, 5.39%, 03/15/40 | | | 50 | | | | 63,460 | |
Series 2019F, RB, 3.19%, 02/15/43(o) | | | 50 | | | | 50,074 | |
Series 2019B, RB, 3.14%, 07/01/43 | | | 35 | | | | 34,696 | |
New York State Urban Development Corp.: | | | | | | | | |
Series 2017B, RB, 3.12%, 03/15/25 | | | 25 | | | | 26,125 | |
Series 2019B, RB, 2.35%, 03/15/27 | | | 70 | | | | 69,628 | |
Series 2017D, RB, 3.32%, 03/15/29 | | | 55 | | | | 57,307 | |
New York Transportation Development Corp. (LaGuardia Airport Terminal B Redevelopment Project): | | | | | | | | |
Series 2016A, RB, 5.00%, 07/01/46 | | | 20 | | | | 22,111 | |
Series 2016A, RB, 5.25%, 01/01/50 | | | 130 | | | | 145,742 | |
North Carolina Turnpike Authority, Series 2018, RB, 5.00%, 01/01/35 | | | 20 | | | | 24,561 | |
Orange County Local Transportation Authority, Series 2010A, RB, 6.91%, 02/15/41 | | | 75 | | | | 106,109 | |
Oregon School Boards Association: | | | | | | | | |
Series 2005A, GO, 4.76%, 06/30/28 | | | 90 | | | | 100,591 | |
Series 2002B, GO, 5.55%, 06/30/28 | | | 95 | | | | 112,274 | |
Series 2003B, GO, 5.68%, 06/30/28 | | | 70 | | | | 83,922 | |
Pennsylvania Economic Development Financing Authority (Pennsylvania Rapid Bridge Replacement Project (The)): | | | | | | | | |
Series 2015, RB, 5.00%, 06/30/23 | | | 100 | | | | 111,385 | |
Series 2015, RB, 5.00%, 12/31/38 | | | 25 | | | | 28,241 | |
Pennsylvania Turnpike Commission, Series2016A-1, RB, 5.00%, 12/01/46 | | | 20 | | | | 23,281 | |
Port Authority of New York & New Jersey: | | | | | | | | |
Series 181, RB, 4.96%, 08/01/46 | | | 35 | | | | 44,401 | |
Series 174, RB, 4.46%, 10/01/62 | | | 55 | | | | 67,531 | |
Port of Seattle, Series 2018A, RB, 5.00%, 05/01/43 | | | 10 | | | | 11,694 | |
Regents of the University of California Medical Center Pooled, Series 2009F, RB,
6.58%, 05/15/49 | | | 75 | | | | 106,755 | |
Royal Oak Hospital Finance Authority (William Beaumont Hospital Obligated Group), Series 2014D, RB, 5.00%, 09/01/39 | | | 20 | | | | 22,380 | |
Rutgers The State University of New Jersey, Series 2019R, RB, 3.27%, 05/01/43 | | | 25 | | | | 24,577 | |
| | | | | | | | |
| Security | | Par
(000) | | | Value | |
|
| Municipal Bonds (continued) | |
Sacramento County Sanitation Districts Financing Authority, Series 2035B, RB, VRDN, 1.81%, 03/02/20(m) | | | USD 110 | | | $ | 106,196 | |
Salt River Project Agricultural Improvement & Power District, Series 2015A, RB,
5.00%, 12/01/45 | | | 80 | | | | 93,374 | |
San Antonio Water System, Series 2015B, RB,
5.00%, 05/15/39 | | | 20 | | | | 23,199 | |
San Diego Public Facilities Financing Authority, Series 2016A, RB, 5.00%, 05/15/39 | | | 25 | | | | 30,114 | |
San Jose Redevelopment Agency Successor Agency: | | | | | | | | |
Series2017A-T, 2.96%, 08/01/24 | | | 50 | | | | 51,795 | |
Series2017A-T, 3.18%, 08/01/26 | | | 25 | | | | 26,179 | |
South Carolina Public Service Authority, Series 2016D, RB, 2.39%, 12/01/23 | | | 66 | | | | 65,705 | |
State of California: | | | | | | | | |
Series 2019, GO, 2.65%, 04/01/26 | | | 135 | | | | 137,855 | |
Series 2009, GO, 7.50%, 04/01/34 | | | 60 | | | | 90,554 | |
Series 2018, GO, 4.60%, 04/01/38 | | | 265 | | | | 295,202 | |
Series 2009, GO, 7.55%, 04/01/39 | | | 30 | | | | 48,001 | |
Series 2009, GO, 7.30%, 10/01/39 | | | 40 | | | | 61,106 | |
Series 2009, GO, 7.35%, 11/01/39 | | | 120 | | | | 182,770 | |
State of Connecticut: | | | | | | | | |
Series 2017A, GO, 3.31%, 01/15/26 | | | 65 | | | | 67,711 | |
Series 2008A, GO, 5.85%, 03/15/32 | | | 70 | | | | 89,062 | |
State of Illinois, Series 2003, GO, 5.10%, 06/01/33 | | | 175 | | | | 188,493 | |
State of New York, Series 2019B, GO, 2.80%, 02/15/32 | | | 60 | | | | 60,192 | |
State of Ohio: | | | | | | | | |
Series 2017A, GO, 5.00%, 05/01/36 | | | 40 | | | | 46,795 | |
Series 2017A, GO, 5.00%, 05/01/37 | | | 30 | | | | 35,073 | |
State of Oregon, Series 2003, GO, 5.89%, 06/01/27 | | | 105 | | | | 125,252 | |
State of Washington: | | | | | | | | |
Series2016A-1, GO, 5.00%, 08/01/40 | | | 40 | | | | 46,734 | |
Series 2018B, GO, 5.00%, 08/01/40 | | | 20 | | | | 24,176 | |
Series 2018B, GO, 5.00%, 08/01/41 | | | 20 | | | | 24,143 | |
State of Wisconsin: | | | | | | | | |
Series 2017C, RB, 3.15%, 05/01/27 | | | 30 | | | | 31,284 | |
Series 2017B, GO, 5.00%, 05/01/36 | | | 20 | | | | 23,452 | |
Series 2017B, GO, 5.00%, 05/01/38 | | | 20 | | | | 23,382 | |
Tennessee Housing Development Agency | | | | | | | | |
(Residential Finance Program): | | | | | | | | |
Series2018-3, RB, 3.75%, 07/01/38 | | | 10 | | | | 10,620 | |
Series2018-3, RB, 3.85%, 07/01/43 | | | 10 | | | | 10,580 | |
Series2018-3, RB, 3.95%, 01/01/49 | | | 5 | | | | 5,288 | |
Texas A&M University,Series 2017B, RB,
2.84%, 05/15/27 | | | 30 | | | | 30,891 | |
Texas Municipal Gas Acquisition & Supply Corp. I, Series 2008D, RB, 6.25%, 12/15/26 | | | 5 | | | | 5,911 | |
Texas Private Activity Bond Surface Transportation Corp. (Blueridge Transportation Group, LLC Share 288 Toll Lanes Project): | | | | | | | | |
Series 2016, RB, 5.00%, 12/31/55 | | | 25 | | | | 27,814 | |
Series 2019, RB, 5.00%, 06/30/58 | | | 90 | | | | 104,783 | |
Tobacco Settlement Finance Authority, Series 2007A, RB,
7.47%, 06/01/47 | | | 55 | | | | 57,025 | |
TSASC, Inc., Series 2017A, RB, 5.00%, 06/01/41 | | | 20 | | | | 22,438 | |
University of California: | | | | | | | | |
Series 2017AX, RB, 3.06%, 07/01/25 | | | 25 | | | | 26,114 | |
| | | | |
| SCHEDULES OF INVESTMENTS | | | 51 | |
| | |
Schedule of Investments (continued) December 31, 2019 | | BlackRock Balanced Capital Portfolio (Percentages shown are based on Net Assets) |
| | | | | | | | |
| Security | | Par
(000) | | | Value | |
|
| Municipal Bonds (continued) | |
Series 2019BD, RB, 3.35%, 07/01/29 | | | USD 75 | | | $ | 80,251 | |
Series 2013AJ, RB, 4.60%, 05/15/31 | | | 50 | | | | 57,547 | |
Series 2015AO, RB, 5.00%, 05/15/32 | | | 20 | | | | 23,805 | |
Series 2009R, RB, 5.77%, 05/15/43 | | | 50 | | | | 66,164 | |
Series 2012AD, RB, 4.86%, 05/15/12 | | | 50 | | | | 61,845 | |
Virginia Small Business Financing Authority (Transform 66 P3 Project): | | | | | | | | |
Series 2017, RB, 5.00%, 12/31/52 | | | 30 | | | | 34,339 | |
Series 2017, RB, 5.00%, 12/31/56 | | | 30 | | | | 34,126 | |
West Virginia Hospital Finance Authority (West Virginia United Health System Obligated Group): | | | | | | | | |
Series 2016A, RB, 5.00%, 06/01/20 | | | 20 | | | | 20,305 | |
Series 2016A, RB, 5.00%, 06/01/21 | | | 20 | | | | 21,033 | |
Series 2016A, RB, 5.00%, 06/01/22 | | | 20 | | | | 21,735 | |
Series 2016A, RB, 5.00%, 06/01/23 | | | 20 | | | | 22,400 | |
Series 2016A, RB, 5.00%, 06/01/24 | | | 20 | | | | 23,020 | |
| | | | | | | | |
| | |
Total Municipal Bonds— 1.9%
(Cost: $8,786,662) | | | | | | | 9,289,696 | |
| | | | | | | | |
|
Non-Agency Mortgage-Backed Securities— 1.8% | |
|
| Collateralized Mortgage Obligations— 0.7% | |
Alternative Loan Trust: | | | | | | | | |
Series 2005-22T1, Class A1,
2.14%, 06/25/35(d) | | | 58 | | | | 50,285 | |
Series2005-72, Class A3,
2.39%, 01/25/36(d) | | | 23 | | | | 21,183 | |
Series 2006-11CB, Class 3A1,
6.50%, 05/25/36 | | | 25 | | | | 19,256 | |
Series 2006-OA21, Class A1,
1.95%, 03/20/47(d) | | | 841 | | | | 723,136 | |
Series2006-OA9, Class 2A1B,
1.96%, 07/20/46(d) | | | 129 | | | | 94,942 | |
Series 2006-OC10, Class 2A3,
2.02%, 11/25/36(d) | | | 24 | | | | 19,443 | |
Series2007-OA3, Class 1A1,
1.93%, 04/25/47(d) | | | 36 | | | | 33,489 | |
Series2007-OA3, Class 2A2,
1.97%, 04/25/47(d) | | | 26 | | | | 5,952 | |
Series2007-OA8, Class 2A1,
1.97%, 06/25/47(d) | | | 24 | | | | 19,523 | |
Series2007-OH2, Class A2A,
2.03%, 08/25/47(d) | | | 12 | | | | 9,488 | |
American Home Mortgage Assets Trust, Series2006-3, Class 2A11,
3.18%, 10/25/46(d) | | | 64 | | | | 57,038 | |
APS Resecuritization Trust(b)(d): | | | | | | | | |
Series2016-1, Class 1MZ,
4.33%, 07/31/57 | | | 123 | | | | 46,260 | |
Series2016-3, Class 3A,
4.64%, 09/27/46 | | | 98 | | | | 100,348 | |
Series2016-3, Class 4A,
4.39%, 04/27/47(c) | | | 38 | | | | 38,052 | |
Banc of America Funding Trust(b)(d): | | | | | | | | |
Series2014-R2, Class 1C,
0.00%, 11/26/36 | | | 60 | | | | 14,945 | |
Series2016-R2, Class 1A1,
4.70%, 05/01/33(c) | | | 149 | | | | 154,759 | |
Bear Stearns Mortgage Funding Trust, Series2006-SL1, Class A1,
2.07%, 08/25/36(d) | | | 44 | | | | 44,145 | |
Chase Mortgage Finance Trust, Series 2007-S6, Class 1A1,
6.00%, 12/25/37 | | | 357 | | | | 258,170 | |
CHL Mortgage Pass-Through Trust: | | | | | | | | |
Series2006-OA4, Class A1,
3.20%, 04/25/46(d) | | | 63 | | | | 29,504 | |
Series2007-15, Class 2A2,
6.50%, 09/25/37 | | | 95 | | | | 65,057 | |
Citicorp Mortgage Securities Trust, Series 2008-2, Class 1A1, 6.50%, 06/25/38 | | | 39 | | | | 34,148 | |
| | | | | | | | |
| Security | | Par
(000) | | | Value | |
| |
| Collateralized Mortgage Obligations (continued) | | | | |
Credit Suisse Mortgage Capital Certificates(b): | | | | | | | | |
Series2009-12R, Class 3A1, 6.50%, 10/27/37 | | | USD 109 | | | $ | 60,203 | |
Series 2019-RPL4, Class A1, 3.83%, 08/26/58 | | | 114 | | | | 114,900 | |
CSFB Mortgage-Backed Pass-Through | | | | | | | | |
Certificates, Series2005-10, Class 10A1,
3.14%, 11/25/35(d) | | | 20 | | | | 5,712 | |
CSMC Mortgage-Backed Trust, Series2007-5, | | | | | | | | |
Class 1A11, 7.00%, 08/25/37(d) | | | 28 | | | | 22,489 | |
CSMC Trust(b)(d): | | | | | | | | |
Series2009-5R, Class 4A4,
4.16%, 06/25/36 | | | 29 | | | | 26,159 | |
Series 2018-RPL8, Class A1,
4.12%, 07/25/58 | | | 138 | | | | 138,423 | |
Series2019-JR1, Class A1,
4.10%, 09/27/66 | | | 510 | | | | 510,147 | |
DeutscheAlt-A Securities Mortgage Loan Trust,
Series2007-OA4, Class A2A,
1.96%, 08/25/47(d) | | | 130 | | | | 91,519 | |
DeutscheAlt-A Securities, Inc., Series 2007-
RS1, Class A2, 2.20%, 01/27/37(b)(d) | | | 2 | | | | 2,383 | |
GreenPoint Mortgage Funding Trust, Series2006-AR2, Class 4A1, 4.24%, 03/25/36(d) | | | 9 | | | | 9,457 | |
GSR Mortgage Loan Trust, Series2007-1F, Class 2A4, 5.50%, 01/25/37 | | | 4 | | | | 4,499 | |
IndyMac INDX Mortgage Loan Trust, Series 2007-AR19, Class 3A1, 3.61%, 09/25/37(d). | | | 35 | | | | 24,487 | |
JPMorgan Alternative Loan Trust, Series 2007- A1, Class 1A4, 2.00%, 03/25/37(d) | | | 53 | | | | 50,707 | |
JPMorgan Mortgage Trust, Series2017-3, Class 1A6, 3.00%, 08/25/47(b)(d) | | | 209 | | | | 210,598 | |
LSTAR Securities Investment Trust, Series2019-2, Class A1, 3.21%, 04/01/24(b)(d) | | | 107 | | | | 106,713 | |
MCM Trust(b): | | | | | | | | |
Series 2018-NPL1, Class A, 4.00%, 05/28/58 | | | 145 | | | | 145,997 | |
Series 2018-NPL2, Class A,
4.00%, 10/25/28(c)(e) | | | 79 | | | | 79,308 | |
New Residential Mortgage Loan Trust(b): | | | | | | | | |
Series2019-2A, Class A1, 4.25%, 12/25/57(d) | | | 85 | | | | 88,706 | |
Series 2019-RPL1, Class A1,
4.33%, 02/26/24(e) | | | 92 | | | | 92,581 | |
Nomura Asset Acceptance Corp. Alternative | | | | | | | | |
Loan Trust, Series2007-2, Class A4,
2.21%, 06/25/37(d) | | | 7 | | | | 5,581 | |
Seasoned Credit Risk Transfer Trust, Series
2017-3, Class M2, 4.75%, 07/25/56(b)(d) | | | 30 | | | | 30,539 | |
Structured Adjustable Rate Mortgage Loan Trust, Series2006-3, Class 4A, 4.02%, 04/25/36(d) | | | 13 | | | | 10,666 | |
Structured Asset Mortgage Investments II Trust, Series2006-AR4, Class 3A1,
1.98%, 06/25/36(d) | | | 18 | | | | 17,951 | |
Washington Mutual Mortgage Pass-Through Certificates WMALT Trust: | | | | | | | | |
Series2006-4, Class 1A1, 6.00%, 04/25/36 | | | 78 | | | | 76,158 | |
Series2006-4, Class 3A5, 6.35%, 05/25/36(e) | | | 71 | | | | 65,850 | |
| | | | | | | | |
| | | | | | | 3,830,856 | |
| | |
| 52 | | 2019 BLACKROCK ANNUAL REPORTTO SHAREHOLDERS |
| | |
Schedule of Investments (continued) December 31, 2019 | | BlackRock Balanced Capital Portfolio (Percentages shown are based on Net Assets) |
| | | | | | | | |
| Security | | Par
(000) | | | Value | |
| |
| Commercial Mortgage-Backed Securities— 1.0% | | | | |
280 Park Avenue Mortgage Trust, Series 2017-280P, Class E, 3.86%, 09/15/34(b)(d) | | | USD 100 | | | $ | 100,191 | |
BAMLL Commercial Mortgage Securities Trust(b)(d): | | | | | | | | |
Series 2015-200P, Class F,
3.60%, 04/14/33 | | | 100 | | | | 98,881 | |
Series 2018-DSNY, Class D,
3.44%, 09/15/34 | | | 100 | | | | 100,175 | |
Bayview Commercial Asset Trust(b)(d): | | | | | | | | |
Series2005-4A, Class A1, 2.09%, 01/25/36 | | | 25 | | | | 23,661 | |
Series2005-4A, Class M1, 2.24%, 01/25/36 | | | 18 | | | | 17,795 | |
Series2006-1A, Class A2, 2.15%, 04/25/36 | | | 12 | | | | 11,120 | |
Series2006-3A, Class A1, 2.04%, 10/25/36 | | | 17 | | | | 16,541 | |
Series2006-3A, Class A2, 2.09%, 10/25/36 | | | 17 | | | | 16,578 | |
Series2006-4A, Class A1, 2.02%, 12/25/36 | | | 202 | | | | 195,198 | |
BBCMS Mortgage Trust, Series 2018-TALL, Class A, 2.46%, 03/15/37(b)(d) | | | 15 | | | | 14,925 | |
BBCMS Trust, Series 2015-SRCH, Class A1,
3.31%, 08/10/35(b) | | | 100 | | | | 103,117 | |
Bear Stearns Commercial Mortgage Securities Trust, Series2007-T26, Class AM,
5.45%, 01/12/45(d) | | | 12 | | | | 11,445 | |
Benchmark Mortgage Trust,
Series2019-B10, Class 3CCA, 3.90%, 03/15/62(b)(d) | | | 60 | | | | 61,216 | |
BHMS, Series 2018-ATLS, Class A,
2.99%, 07/15/35(b)(d) | | | 100 | | | | 99,912 | |
BWAY Mortgage Trust, Series 2013-1515, Class C, 3.45%, 03/10/33(b) | | | 100 | | | | 102,151 | |
BX Commercial Mortgage Trust, Series 2018-IND, Class H, 4.74%, 11/15/35(b)(d) | | | 154 | | | | 154,144 | |
BXP Trust(b)(d): | | | | | | | | |
Series2017-CC, Class D,
3.55%, 08/13/37 | | | 25 | | | | 25,355 | |
Series2017-CC, Class E,
3.55%, 08/13/37 | | | 40 | | | | 39,258 | |
CAMB Commercial Mortgage Trust, Series 2019-LIFE, Class D, 3.49%, 12/15/37(b)(d) | | | 100 | | | | 100,281 | |
CCRESG Commercial Mortgage Trust, Series 2016-HEAT, Class D, 5.49%, 04/10/29(b)(d) | | | 10 | | | | 10,178 | |
CD Mortgage Trust: | | | | | | | | |
Series2006-CD3, Class AM,
5.65%, 10/15/48 | | | 129 | | | | 132,044 | |
Series2017-CD3, Class A4, 3.63%, 02/10/50 | | | 10 | | | | 10,704 | |
CFCRE Commercial Mortgage Trust, Series2016-C3, Class A3, 3.87%, 01/10/48 | | | 10 | | | | 10,709 | |
CFK Trust, Series2019-FAX, Class D,
4.64%, 01/15/39(b)(d) | | | 100 | | | | 110,854 | |
CGDBB Commercial Mortgage Trust(b)(d): | | | | | | | | |
Series 2017-BIOC, Class A, 2.53%, 07/15/32 | | | 91 | | | | 91,269 | |
Series 2017-BIOC, Class D, 3.34%, 07/15/32 | | | 91 | | | | 91,410 | |
Series 2017-BIOC, Class E, 3.89%, 07/15/32 | | | 91 | | | | 91,126 | |
Citigroup Commercial Mortgage Trust: | | | | | | | | |
Series2016-C1, Class D,
4.95%, 05/10/49(b)(d) | | | 10 | | | | 10,204 | |
Series2017-C4, Class A4, 3.47%, 10/12/50 | | | 20 | | | | 21,269 | |
Commercial Mortgage Trust: | | | | | | | | |
Series 2014-CR16, Class A4,
4.05%, 04/10/47 | | | 87 | | | | 92,335 | |
Series 2014-CR17, Class A5,
3.98%, 05/10/47 | | | 43 | | | | 45,751 | |
Series 2014-CR18, Class A4,
3.55%, 07/15/47 | | | 10 | | | | 10,371 | |
Series 2014-CR19, Class A5,
3.80%, 08/10/47 | | | 30 | | | | 31,801 | |
| | | | | | | | |
| Security | | Par
(000) | | | Value | |
| |
| Commercial Mortgage-Backed Securities (continued) | | | | |
Series 2014-LC15, Class A4, 4.01%, 04/10/47 | | | USD 20 | | | $ | 21,272 | |
Series 2014-UBS4, Class C, 4.61%, 08/10/47(d) | | | 20 | | | | 20,684 | |
Series 2015-CR23, Class CMD,
3.68%, 05/10/48(b)(d) | | | 110 | | | | 110,049 | |
Series 2015-CR25, Class A4, 3.76%, 08/10/48 | | | 40 | | | | 42,657 | |
Series 2015-CR25, Class C, 4.54%, 08/10/48(d) | | | 60 | | | | 62,363 | |
Series 2015-LC19, Class A4, 3.18%, 02/10/48 | | | 23 | | | | 23,847 | |
Series 2017-COR2, Class D, 3.00%, 09/10/50(b) | | | 100 | | | | 92,923 | |
CSAIL Commercial Mortgage Trust: | | | | | | | | |
Series2015-C2, Class A4, 3.50%, 06/15/57 | | | 10 | | | | 10,455 | |
Series2019-C15, Class A4, 4.05%, 03/15/52 | | | 52 | | | | 57,200 | |
Series2019-C15, Class C, 4.98%, 03/15/52(d) | | | 39 | | | | 42,682 | |
Series2019-C15, Class D, 3.00%, 03/15/52(b) | | | 28 | | | | 25,153 | |
DBGS Mortgage Trust, Series 2019-1735, Class F,
4.19%, 04/10/37(b)(d) | | | 100 | | | | 96,595 | |
DBUBS Mortgage Trust(b): | | | | | | | | |
Series 2017-BRBK, Class A, 3.45%, 10/10/34 | | | 40 | | | | 41,673 | |
Series 2017-BRBK, Class E, 3.53%, 10/10/34(d) | | | 170 | | | | 169,129 | |
Series 2017-BRBK, Class F, 3.53%, 10/10/34(d) | | | 40 | | | | 39,453 | |
Exantas Capital Corp. Ltd., Series 2019-RSO7, Class AS, 3.24%, 04/15/36(b)(d) | | | 100 | | | | 100,000 | |
GPMT Ltd., Series2018-FL1, Class A,
2.66%, 11/21/35(b)(d) | | | 40 | | | | 39,729 | |
GS Mortgage Securities Corp. Trust(b)(d): | | | | | | | | |
Series 2017-500K, Class D, 3.04%, 07/15/32 | | | 10 | | | | 9,988 | |
Series 2017-500K, Class E, 3.24%, 07/15/32 | | | 20 | | | | 19,968 | |
Series 2017-500K, Class F, 3.54%, 07/15/32 | | | 10 | | | | 10,000 | |
GS Mortgage Securities Trust: | | | | | | | | |
Series 2014-GC24, Class A5, 3.93%, 09/10/47 | | | 20 | | | | 21,335 | |
Series2015-GS1, Class A3, 3.73%, 11/10/48 | | | 10 | | | | 10,684 | |
Series2017-GS7, Class A4, 3.43%, 08/10/50 | | | 44 | | | | 46,564 | |
Series2017-GS7, Class D, 3.00%, 08/10/50(b) | | | 10 | | | | 9,399 | |
HMH Trust, Series2017-NSS, Class A,
3.06%, 07/05/31(b) | | | 100 | | | | 101,076 | |
IMT Trust, Series 2017-APTS, Class AFX,
3.48%, 06/15/34(b) | | | 100 | | | | 103,762 | |
JPMBB Commercial Mortgage Securities Trust: | | | | | |
Series2014-C21, Class A5, 3.77%, 08/15/47 | | | 30 | | | | 31,798 | |
Series2014-C22, Class A4, 3.80%, 09/15/47 | | | 10 | | | | 10,620 | |
JPMorgan Chase Commercial Mortgage Securities Trust(b): | | | | | | | | |
Series2015-UES, Class D, 3.62%, 09/05/32(d) | | | 110 | | | | 110,269 | |
Series 2016-NINE, Class A, 2.85%, 09/06/38(d) | | | 100 | | | | 101,519 | |
Series2018-WPT, Class FFX, 5.54%, 07/05/33 | | | 10 | | | | 10,290 | |
| | | | |
| SCHEDULES OF INVESTMENTS | | | 53 | |
| | |
Schedule of Investments (continued) December 31, 2019 | | BlackRock Balanced Capital Portfolio (Percentages shown are based on Net Assets) |
| | | | | | | | |
| Security | | Par
(000) | | | Value | |
| |
| Commercial Mortgage-Backed Securities (continued) | | | | |
Lehman Brothers Small Balance Commercial Mortgage Trust,
Series2007-1A, Class 1A, 2.04%, 03/25/37(b)(d) | | | USD 16 | | | $ | 15,257 | |
MAD Mortgage Trust, Series 2017-330M, Class E,
4.03%, 08/15/34(b)(d) | | | 100 | | | | 99,485 | |
Madison Avenue Trust, Series 2013-650M, Class D,
4.03%, 10/12/32(b)(d) | | | 120 | | | | 120,331 | |
Morgan Stanley Bank of America Merrill Lynch Trust: | | | | | | | | |
Series2014-C16, Class A5, 3.89%, 06/15/47 | | | 70 | | | | 74,063 | |
Series2015-C26, Class D, 3.06%, 10/15/48(b) | | | 16 | | | | 15,177 | |
Morgan Stanley Capital I Trust: | | | | | | | | |
Series 2006-IQ11, Class C, 6.07%, 10/15/42(d) | | | 100 | | | | 102,228 | |
Series2007-T27, Class AJ, 5.95%, 06/11/42(d) | | | 38 | | | | 40,339 | |
Series2017-CLS, Class F, 4.34%, 11/15/34(b)(d) | | | 84 | | | | 84,000 | |
Series2017-HR2, Class D, 2.73%, 12/15/50 | | | 10 | | | | 8,983 | |
Series 2019-AGLN, Class D,
3.49%, 03/15/34(b)(d) | | | 100 | | | | 100,000 | |
Series 2019-AGLN, Class F,
4.34%, 03/15/34(b)(d) | | | 100 | | | | 100,438 | |
Series2019-L2, Class A4, 4.07%, 03/15/52 | | | 13 | | | | 14,438 | |
PFP Ltd.(b)(d): | | | | | | | | |
Series2019-5, Class A, 2.71%, 04/14/36 | | | 19 | | | | 18,998 | |
Series2019-5, Class AS, 3.16%, 04/14/36 | | | 10 | | | | 10,000 | |
Wells Fargo Commercial Mortgage Trust: | | | | | | | | |
Series2015-C27, Class C, 3.89%, 02/15/48 | | | 27 | | | | 26,692 | |
Series2015-C31, Class A4, 3.70%, 11/15/48 | | | 10 | | | | 10,667 | |
Series2015-P2, Class A4, 3.81%, 12/15/48 | | | 30 | | | | 32,190 | |
Series2015-P2, Class D, 3.24%, 12/15/48(b) | | | 25 | | | | 22,350 | |
Series2017-C39, Class D,
4.35%, 09/15/50(b)(d) | | | 63 | | | | 63,156 | |
Series2017-C41, Class D,
2.60%, 11/15/50(b)(d) | | | 25 | | | | 21,872 | |
Series 2017-HSDB, Class A,
2.59%, 12/13/31(b)(d) | | | 100 | | | | 99,699 | |
WFRBS Commercial Mortgage Trust: | | | | | | | | |
Series2014-C21, Class A5, 3.68%, 08/15/47 | | | 30 | | | | 31,655 | |
Series2014-C22, Class C, 3.76%, 09/15/57(d) | | | 120 | | | | 116,278 | |
| | | | | | | | |
| | | | | | | 4,873,401 | |
|
| Interest Only Commercial Mortgage-Backed Securities— 0.1%(d) | |
Banc of America Commercial Mortgage Trust, Series 2017-BNK3, Class XB, 0.63%, 02/15/50 | | | 1,000 | | | | 41,244 | |
BBCMS Trust, Series 2015-SRCH, Class XA,
0.96%, 08/10/35(b) | | | 1,000 | | | | 56,940 | |
BB-UBS Trust, Series 2012-SHOW,Class XA,
0.60%, 11/05/36(b) | | | 4,250 | | | | 119,748 | |
Benchmark Mortgage Trust, Series2019-B9, Class XA, 1.05%, 03/15/52 | | | 998 | | | | 78,438 | |
CFCRE Commercial Mortgage Trust, Series2016-C4, Class XB, 0.73%, 05/10/58 | | | 120 | | | | 5,129 | |
Commercial Mortgage Trust, Series2015-3BP, Class XA,
0.06%, 02/10/35(b) | | | 2,522 | | | | 12,055 | |
JPMDB Commercial Mortgage Securities Trust, Series2016-C4, Class XC,
0.75%, 12/15/49(b) | | | 1,800 | | | | 80,057 | |
LSTAR Commercial Mortgage Trust, Series2017-5, Class X, 1.08%, 03/10/50(b) | | | 864 | | | | 34,258 | |
| | | | | | | | |
| Security | | Par
(000) | | | Value | |
|
| Interest Only Commercial Mortgage-Backed Securities (continued) | |
Morgan Stanley Bank of America Merrill | | | | | | | | |
Lynch Trust, Series2014-C19, Class XF, 1.21%, 12/15/47(b) | | | USD 100 | | | $ | 4,918 | |
One Market Plaza Trust(b): | | | | | | | | |
Series 2017-1MKT,Class XCP,
0.09%, 02/10/32 | | | 1,000 | | | | 3,030 | |
Series 2017-1MKT,Class XNCP,
0.00%, 02/10/32(c) | | | 200 | | | | 2 | |
| | | | | | | | |
| | | | | | | 435,819 | |
|
| Principal Only Collateralized Mortgage Obligations— 0.0% | |
Seasoned Credit Risk Transfer Trust, Series
2017-3, Class B,
0.00%, 07/25/56(b)(l) | | | 39 | | | | 4,372 | |
| | | | | | | | |
| |
TotalNon-Agency Mortgage-Backed Securities— 1.8%
(Cost: $8,902,745) | | | | 9,144,448 | |
| | | | | | | | |
| | |
| | | Beneficial Interest
(000) | | | | |
| | |
Other Interests— 0.0%(p) | | | | | | | | |
| | |
| Capital Markets— 0.0% | | | | | | |
Lehman Brothers Holdings, Inc.(c)(g)(i) | | | 620 | | | | — | |
| | | | | | | | |
| | |
Total Other Interests— 0.0% | | | | | | | — | |
| | | | | | | | |
| | |
| | | Par
(000) | | | | |
| | |
Capital Trusts— 0.2% | | | | | | | | |
| Banks— 0.0% | | | | | | |
JPMorgan Chase & Co.,
Series FF, 5.00%(h)(q) | | | 125 | | | | 130,000 | |
| | | | | | | | |
| | |
| Capital Markets— 0.1%(h)(q) | | | | | | |
Bank of New York Mellon Corp. (The),
Series F, 4.62% | | | 97 | | | | 102,031 | |
State Street Corp.: | | | | | | | | |
Series F, 5.25% | | | 90 | | | | 92,293 | |
Series H, 5.63% | | | 140 | | | | 148,577 | |
| | | | | | | | |
| | | | | | | 342,901 | |
| | |
| Entertainment— 0.1% | | | | | | |
NBCUniversal Enterprise, Inc., 5.25%(b)(h) | | | 265 | | | | 273,613 | |
| | | | | | | | |
| | |
Total Capital Trusts— 0.2%
(Cost: $723,814) | | | | | | | 746,514 | |
| | | | | | | | |
| | | | | | | |
| | |
| | | Shares | | | | |
| | |
Rights— 0.0% | | | | | | | | |
| | |
| Pharmaceuticals— 0.0%(f)(g) | | | | | | |
Bristol-Myers Squibb Co | | | 7,280 | | | | 21,913 | |
| | | | | | | | |
| | |
Total Rights— 0.0% (Cost: $15,506) | | | | | | | 21,913 | |
| | | | | | | | |
| | |
| | | Par
(000) | | | | |
|
U.S. Government Sponsored Agency Securities— 18.5% | |
|
| Commercial Mortgage-Backed Securities— 0.0% | |
Federal Home Loan Mortgage Corp. Multifamily Structured Pass-Through Certificates, Series K072, Class A2,
3.44%, 12/25/27 | | | 10 | | | | 10,740 | |
Federal Home Loan Mortgage Corp. Multifamily Structured Pass-Through Certificates Variable Rate Notes(q): | | | | | | | | |
Series K034, Class A2,
3.53%, 07/25/23 | | | 20 | | | | 20,979 | |
| | |
| 54 | | 2019 BLACKROCK ANNUAL REPORTTO SHAREHOLDERS |
| | |
Schedule of Investments (continued) December 31, 2019 | | BlackRock Balanced Capital Portfolio (Percentages shown are based on Net Assets) |
| | | | | | | | |
Security | | Par
(000) | | | Value | |
| |
| Commercial Mortgage-Backed Securities (continued) | | | | |
Series K061, Class A2, 3.35%, 11/25/26 | | | USD 20 | | | $ | 21,305 | |
Federal Home Loan Mortgage Corp. Variable Rate Notes, Series 2018-SB52, Class A10F,
3.48%, 06/25/28(q) | | | 29 | | | | 30,285 | |
Government National Mortgage Association: | | | | | | | | |
Series2015-97, Class VA, 2.25%,12/16/38 | | | 16 | | | | 15,576 | |
Series2016-158, Class VA, 2.00%, 03/16/35 | | | 86 | | | | 81,447 | |
| | | | | | | | |
| | | | | | | 180,332 | |
|
| Interest Only Commercial Mortgage-Backed Securities — 0.0% | |
Government National Mortgage Association: | | | | | | | | |
Series2014-40, Class AI, 1.00%, 02/16/39 | | | 49 | | | | 311 | |
Series2014-52, Class AI, 0.83%, 08/16/41 | | | 125 | | | | 2,435 | |
Government National Mortgage Association Variable Rate Notes: | | | | | | | | |
Series2013-63, 0.79%, 09/16/51(q) | | | 807 | | | | 39,879 | |
Series2016-26, 0.94%, 02/16/58(q) | | | 436 | | | | 28,833 | |
Series2016-92, 1.00%, 04/16/58(q) | | | 104 | | | | 7,035 | |
Series2016-110, 1.03%, 05/16/58(q) | | | 114 | | | | 8,115 | |
Series2016-113, (LIBOR USD 1 Month + 0.00%), 1.18%, 02/16/58(a) | | | 102 | | | | 8,353 | |
| | | | | | | | |
| | | | | | | 94,961 | |
| | |
| Mortgage-Backed Securities — 18.5% | | | | | | |
Federal Home Loan Mortgage Corp.: | | | | | | | | |
2.50%, 01/01/29- 04/01/31 | | | 362 | | | | 367,456 | |
3.00%, 09/01/27- 02/01/47 | | | 1,444 | | | | 1,487,700 | |
3.50%, 04/01/31- 01/01/48 | | | 2,716 | | | | 2,885,348 | |
4.00%, 08/01/40- 02/01/47 | | | 327 | | | | 350,359 | |
4.50%, 02/01/39- 04/01/49 | | | 2,254 | | | | 2,449,016 | |
5.00%, 10/01/41- 11/01/41 | | | 223 | | | | 243,825 | |
5.50%, 06/01/41 | | | 91 | | | | 101,725 | |
6.00%, 01/01/34 | | | 54 | | | | 60,118 | |
Federal National Mortgage Association, | | | | | | | | |
4.00%, 01/01/41 | | | 17 | | | | 18,249 | |
Government National Mortgage Association: | | | | | | | | |
2.50%, 01/15/50(r) | | | 180 | | | | 180,766 | |
3.00%, 02/15/45-12/20/46 | | | 2,070 | | | | 2,138,063 | |
3.00%, 01/15/50(r) | | | 1,581 | | | | 1,623,779 | |
3.50%, 01/15/42- 10/20/46 | | | 5,455 | | | | 5,689,168 | |
4.00%, 04/20/39- 12/20/47 | | | 641 | | | | 674,562 | |
4.00%, 01/15/50- 02/15/50(r) | | | 2,887 | | | | 2,988,607 | |
4.50%, 12/20/39- 03/20/49 | | | 949 | | | | 1,010,093 | |
4.50%, 01/15/50(r) | | | 942 | | | | 984,832 | |
5.00%, 12/15/38- 07/20/42 | | | 145 | | | | 161,323 | |
5.00%, 01/15/50(r) | | | 228 | | | | 240,041 | |
5.50%, 01/15/50(r) | | | 295 | | | | 316,157 | |
7.50%, 03/15/32 | | | 2 | | | | 2,801 | |
Uniform Mortgage-Backed Securities: | | | | | | | | |
2.00%, 10/01/31- 03/01/32 | | | 214 | | | | 212,276 | |
2.50%, 09/01/27- 02/01/33 | | | 1,047 | | | | 1,062,355 | |
2.50%, 01/25/35- 01/25/50(r) | | | 1,826 | | | | 1,814,829 | |
3.00%, 04/01/29- 03/01/47 | | | 4,120 | | | | 4,251,991 | |
3.00%, 01/25/35- 01/25/50(r) | | | 4,574 | | | | 4,645,104 | |
3.50%, 04/01/29- 01/01/48 | | | 4,920 | | | | 5,212,862 | |
3.50%, 01/25/35- 02/25/50(r) | | | 7,629 | | | | 7,846,780 | |
4.00%, 10/01/33- 08/01/48 | | | 3,037 | | | | 3,255,406 | |
4.00%, 01/25/50- 02/25/50(r) | | | 27,322 | | | | 28,420,019 | |
4.50%, 02/01/25- 05/01/49 | | | 5,548 | | | | 6,061,807 | |
4.50%, 01/25/50-02/25/50(r) | | | 3,525 | | | | 3,711,911 | |
5.00%, 09/01/35- 06/01/45 | | | 280 | | | | 308,206 | |
5.00%, 01/25/50(r) | | | 471 | | | | 503,528 | |
5.50%, 02/01/35- 04/01/41 | | | 571 | | | | 638,765 | |
6.00%, 12/01/27- 06/01/41 | | | 331 | | | | 378,987 | |
| | | | | | | | |
Security | | Par
(000) | | | Value | |
|
| Mortgage-Backed Securities (continued) | |
6.50%, 05/01/40 | | | USD 93 | | | $ | 105,162 | |
| | | | | | | | |
| | | | | | | 92,403,976 | |
| | | | | | | | |
| |
Total U.S. Government Sponsored Agency
Securities — 18.5%
(Cost: $91,426,186) | | | | 92,679,269 | |
| | | | | | | | |
| |
U.S. Treasury Obligations — 7.5% | | | | | |
U.S. Treasury Bonds: | | | | | | | | |
4.25%, 05/15/39 | | | 68 | | | | 89,627 | |
4.50%, 08/15/39 | | | 68 | | | | 92,430 | |
4.38%, 11/15/39 | | | 68 | | | | 91,149 | |
3.13%, 02/15/43 | | | 277 | | | | 314,795 | |
2.88%, 05/15/43- 11/15/46 | | | 531 | | | | 581,718 | |
3.63%, 08/15/43 | | | 277 | | | | 340,385 | |
3.75%, 11/15/43 | | | 277 | | | | 347,105 | |
3.00%, 02/15/48 | | | 254 | | | | 286,266 | |
2.25%, 08/15/49(s) | | | 1,272 | | | | 1,237,418 | |
2.38%, 11/15/49 | | | 976 | | | | 975,504 | |
U.S. Treasury Inflation Linked Notes: | | | | | | | | |
0.50%, 04/15/24 | | | 14,937 | | | | 15,178,060 | |
0.13%, 10/15/24 | | | 1,470 | | | | 1,478,921 | |
0.25%, 01/15/25 | | | 2,603 | | | | 2,626,209 | |
U.S. Treasury Notes: | | | | | | | | |
2.00%, 07/31/20(s) | | | 1,035 | | | | 1,037,143 | |
2.50%, 12/31/20 | | | 771 | | | | 777,445 | |
1.13%, 07/31/21(t) | | | 1,166 | | | | 1,157,300 | |
1.75%, 07/31/21- 11/15/29 | | | 3,622 | | | | 3,625,218 | |
1.50%, 01/31/22- 08/15/26 | | | 2,648 | | | | 2,626,575 | |
2.13%, 12/31/22- 05/15/25 | | | 1,611 | | | | 1,640,827 | |
2.75%, 05/31/23 | | | 518 | | | | 537,101 | |
2.00%, 02/15/25 | | | 650 | | | | 659,395 | |
2.25%, 08/15/27 | | | 518 | | | | 532,791 | |
2.88%, 08/15/28 | | | 157 | | | | 169,327 | |
3.13%, 11/15/28 | | | 157 | | | | 172,743 | |
1.63%, 08/15/29 | | | 730 | | | | 711,722 | |
| | | | | | | | |
| | |
Total U.S. Treasury Obligations — 7.5%
(Cost: $36,951,315) | | | | | | | 37,287,174 | |
| | | | | | | | |
| | |
Total Long-Term Investments — 106.7%
(Cost: $496,535,049) | | | | | | | 533,906,164 | |
| | | | | | | | |
|
Short-Term Securities — 5.9% | |
| |
| Borrowed Bond Agreements — 0.6%(u) | | | | |
Bank of America Securities, Inc., 0.75%, 01/02/20 (Purchased on 12/31/19 to be repurchased at USD 43,055, collateralized by U.S. Treasury Notes, 1.50%, due at 10/31/21, par and fair value of USD 43,000 and $42,941, respectively) | | | 43 | | | | 43,054 | |
Bank of America Securities, Inc., 1.20%, 01/02/20 (Purchased on 12/31/19 to be repurchased at USD 1,280,828, collateralized by U.S. Treasury Notes, 1.50%, due at 08/15/22, par and fair value of USD 1,276,000 and $1,273,209, respectively) | | | 1,281 | | | | 1,280,785 | |
Bank of America Securities, Inc., 1.25%, 01/02/20 (Purchased on 12/31/19 to be repurchased at USD 110,449, collateralized by U.S. Treasury Notes, 1.50%, due at 10/31/24, par and fair value of USD 111,000 and $110,076, respectively) | | | 110 | | | | 110,445 | |
| | | | |
| SCHEDULES OF INVESTMENTS | | | 55 | |
| | |
Schedule of Investments (continued) December 31, 2019 | | BlackRock Balanced Capital Portfolio (Percentages shown are based on Net Assets) |
| | | | | | | | |
Security | | Par
(000) | | | Value | |
|
| Borrowed Bond Agreements (continued) | |
Bank of America Securities, Inc., 1.40%, 01/02/20 (Purchased on 12/31/19 to be repurchased at USD 216,818, collateralized by U.S. Treasury Notes, 1.75%, due at 12/31/24, par and fair value of USD 216,000 and $216,683, respectively) | | | USD 217 | | | $ | 216,810 | |
Bank of America Securities, Inc., 1.48%, 01/02/20 (Purchased on 12/31/19 to be repurchased at USD 134,341, collateralized by U.S. Treasury Notes, 1.63%, due at 11/15/22, par and fair value of USD 134,000 and $134,100, respectively) | | | 134 | | | | 134,335 | |
Bank of America Securities, Inc., 1.50%, 01/02/20 (Purchased on 12/31/19 to be repurchased at USD 294,380, collateralized by U.S. Treasury Notes, 1.63%, due at 12/15/22, par and fair value of USD 294,000 and $294,287, respectively) | | | 294 | | | | 294,367 | |
Bank of America Securities, Inc., 1.50%, 01/02/20 (Purchased on 12/31/19 to be repurchased at USD 119,555, collateralized by U.S. Treasury Notes, 1.38%, due at 10/15/22, par and fair value of USD 120,000 and $119,269, respectively) | | | 120 | | | | 119,550 | |
Bank of America Securities, Inc., 1.50%, 01/02/20 (Purchased on 12/31/19 to be repurchased at USD 635,351, collateralized by U.S. Treasury Notes, 1.25%, due at 08/31/24, par and fair value of USD 645,000 and $632,679, respectively) | | | 635 | | | | 635,325 | |
Bank of America Securities, Inc., 1.55%, 01/02/20 (Purchased on 12/31/19 to be repurchased at USD 26,424, collateralized by U.S. Treasury Notes, 2.00%, due at 05/31/24, par and fair value of USD 26,000 and $26,361, respectively) | | | 26 | | | | 26,423 | |
| | | | | | | | |
| |
Total Borrowed Bond Agreements — 0.6%
(Cost: $2,861,094) | | | | 2,861,094 | |
| | | | | | | | |
|
Foreign Government Obligations — 0.7% | |
Egypt — 0.0% | |
Arab Republic of Egypt Treasury Bills(v): | | | | | |
16.61%, 05/05/20 | | | EGP 750 | | | | 44,421 | |
15.75%, 07/28/20 | | | 1,700 | | | | 97,605 | |
| | | | | | | | |
| | | | | | | 142,026 | |
| | | | | | | | |
|
| Japan — 0.7% | |
Japan Treasury Bills(v): | | | | | |
(0.14)%, 03/09/20 | | | JPY 204,050 | | | | 1,878,495 | |
(0.11)%, 03/16/20 | | | 203,200 | | | | 1,870,716 | |
| | | | | | | | |
| | | | | | | 3,749,211 | |
| | | | | | | | |
|
| Nigeria ��� 0.0% | |
Nigeria OMO Bills(v): | | | | | |
14.62%, 01/16/20 | | | NGN 3,560 | | | | 9,769 | |
11.12%, 01/30/20 | | | 5,340 | | | | 14,432 | |
13.49%, 05/28/20 | | | 3,560 | | | | 9,311 | |
12.33%, 07/30/20 | | | 1,780 | | | | 4,615 | |
| | | | | | | | |
| | | | | | $ | 38,127 | |
| | | | | | | | |
| | | | | | | | |
Security | | Par
(000) | | | Value | |
| |
Total Foreign Government Obligations — 0.7%
(Cost: $3,923,993) | | | $ | 3,929,364 | |
| | | | | | | | |
| | |
| | | Shares | | | | |
|
Money Market Funds — 4.6%(w)* | |
BlackRock Liquidity Funds,T-Fund, Institutional Class, 1.51% | | | 7,564,319 | | | | 7,564,319 | |
SL Liquidity Series, LLC, Money Market Series, 1.80%(x) | | | 15,395,189 | | | | 15,398,268 | |
| | | | | | | | |
| |
Total Money Market Funds — 4.6%
(Cost: $22,962,215) | | | | 22,962,587 | |
| | | | | | | | |
| |
Total Short-Term Securities — 5.9%
(Cost: $29,747,302) | | | | 29,753,045 | |
| | | | | | | | |
| |
Total Options Purchased — 0.0%
(Cost: $136,004) | | | | 98,214 | |
| | | | | | | | |
| |
Total Investments Before Options Written, Borrowed Bonds and TBA Sale Commitments — 112.6%
(Cost: $526,418,355) | | | | 563,757,423 | |
| | | | | | | | |
| |
Total Options Written — (0.0)%
(Premium Received — $64,142) | | | | (17,756 | ) |
| | | | | | | | |
| | | Par (000) | | | | |
|
| Borrowed Bonds — (0.6)% | |
|
| U.S. Treasury Obligations — (0.6)% | |
U.S. Treasury Notes: | | | | | | | | |
1.25%, 08/31/24 | | | USD 645 | | | | (632,679 | ) |
1.38%, 10/15/22 | | | 120 | | | | (119,269 | ) |
1.50%, 10/31/21- 10/31/24 | | | 1,430 | | | | (1,426,226 | ) |
1.63%, 11/15/22- 12/15/22 | | | 428 | | | | (428,387 | ) |
1.75%, 12/31/24 | | | 216 | | | | (216,683 | ) |
2.00%, 05/31/24 | | | 26 | | | | (26,361 | ) |
| | | | | | | | |
| | | | | | | (2,849,605 | ) |
| | | | | | | | |
| |
Total U.S. Treasury Obligations — (0.6)%
(Proceeds: $2,858,390) | | | | (2,849,605 | ) |
| | | | | | | | |
| |
Total Borrowed Bonds — (0.6)%
(Proceeds: $2,858,390) | | | | (2,849,605 | ) |
| | | | | | | | |
|
TBA Sale Commitments — (1.4)%(r) | |
|
| Mortgage-Backed Securities — (1.4)% | |
Government National Mortgage Association: | | | | | | | | |
3.50%, 01/15/50 | | | 418 | | | | (430,785 | ) |
4.00%, 01/15/50 | | | 620 | | | | (641,700 | ) |
4.50%, 01/15/50 | | | 500 | | | | (531,718 | ) |
Uniform Mortgage-Backed Securities: | | | | | | | | |
2.50%, 01/25/35- 02/25/35 | | | 776 | | | | (783,012 | ) |
3.50%, 01/25/35- 01/25/50 | | | 1,314 | | | | (1,351,868 | ) |
4.00%, 01/25/35- 01/25/50 | | | 1,468 | | | | (1,527,767 | ) |
3.00%, 01/25/50 | | | 827 | | | | (838,759 | ) |
4.50%, 01/25/50 | | | 130 | | | | (136,871 | ) |
5.50%, 01/25/50 | | | 455 | | | | (489,978 | ) |
| | |
| 56 | | 2019 BLACKROCK ANNUAL REPORTTO SHAREHOLDERS |
| | |
Schedule of Investments (continued) December 31, 2019 | | BlackRock Balanced Capital Portfolio (Percentages shown are based on Net Assets) |
| | | | | | | | | | | | |
| Security | | | | | Par (000) | | | Value | |
|
| Mortgage-Backed Securities (continued) | |
6.00%, 01/25/50 | | | | | | | USD 280 | | | $ | (308,525 | ) |
| | | | | | | | |
| |
Total TBA Sale Commitments — (1.4)%
(Proceeds: $7,040,284) | | | | (7,040,983 | ) |
| | | | | | | | |
| |
Total Investments Net of Options Written, Borrowed Bonds and TBA Sale Commitments — 110.6%
(Cost: $516,455,539) | | | | 553,849,079 | |
| |
Liabilities in Excess of Other Assets — (10.6)% | | | | (53,226,823 | ) |
| | | | | | | | |
| |
Net Assets — 100.0% | | | $ | 500,622,256 | |
| | | | | | | | |
| (a) | Variable rate security. Security may be issued at a fixed coupon rate, which converts to a variable rate at a specified date. Rate shown is the rate in effect as of period end. |
| (b) | Security exempt from registration pursuant to Rule 144A under the Securities Act of 1933, as amended. These securities may be resold in transactions exempt from registration to qualified institutional investors. |
| (c) | Security is valued using significant unobservable inputs and is classified as Level 3 in the fair value hierarchy. |
| (d) | Variable or floating rate security, which interest rate adjusts periodically based on changes in current interest rates and prepayments on the underlying pool of assets. Rate shown is the rate in effect as of period end. |
| (e) | Step-up bond that pays an initial coupon rate for the first period and then a higher coupon rate for the following periods. Rate as of period end. |
| (f) | Security, or a portion of the security, is on loan. |
| (g) | Non-income producing security. |
| (h) | Perpetual security with no stated maturity date. |
| (i) | Issuer filed for bankruptcy and/or is in default. |
| (k) | Payment-in-kind security which may pay interest/dividends in additional par/shares and/or in cash. Rates shown are the current rate and possible payment rates. |
| (m) | Variable rate security.Rate as of period end and maturity is the date the principal owed can be recovered through demand. |
| (n) | U.S. Government securities, held in escrow, are used to pay interest on this security, as well as to retire the bond in full at the date indicated, typically at a premium to par. |
| (p) | Other interests represent beneficial interests in liquidation trusts and other reorganization or private entities. |
| (q) | Variable rate security.Rate shown is the rate in effect as of period end. |
| (r) | Represents or includes a TBA transaction. |
| (s) | All or a portion of the security has been pledged in connection with outstanding futures contracts. |
| (t) | All or a portion of the security has been pledged as collateral in connection with outstanding reverse repurchase agreements. |
| (u) | Certain agreements have no stated maturity and can be terminated by either party at any time. |
| (v) | Rates are discount rates or a range of discount rates as of period end. |
| (w) | Annualized7-day yield as of period end. |
| (x) | Security was purchased with the cash collateral from loaned securities. |
| * | During the year ended December 31, 2019, investments in issuers considered to be an affiliate/affiliates of the Fund for purposes of Section 2(a)(3) of the Investment Company Act of 1940, as amended, and/or related parties of the Fund were as follows: |
| | | | | | | | | | | | | | | | | | | | | | | | | | | | | | | | |
Affiliated Persons and/or Related
Parties | | Shares
Held at
12/31/18 | | | Shares
Purchased | | | Shares Sold | | | Shares
Held at
12/31/19 | | | Value at
12/31/19 | | | Income | | | Net Realized Gain (Loss) (a) | | | Change in
Unrealized
Appreciation (Depreciation) | |
BlackRock Liquidity Funds,T-Fund, Institutional Class(b) | | | 5,808,467 | | | | 1,755,852 | | | | — | | | | 7,564,319 | | | $ | 7,564,319 | | | $ | 249,769 | | | $ | — | | | $ | — | |
SL Liquidity Series, LLC, Money Market Series(b) | | | 5,719,066 | | | | 9,676,123 | | | | — | | | | 15,395,189 | | | | 15,398,268 | | | | 44,708 | (c) | | | 2,789 | | | | 632 | |
BlackRock Allocation Target Shares- BATS Series A | | | — | | | | 312,190 | | | | — | | | | 312,190 | | | | 3,137,512 | | | | 43,956 | | | | — | | | | (12,488 | ) |
iShares Edge MSCI Multifactor USA ETF(d) | | | 12,018 | | | | — | | | | (12,018 | ) | | | — | | | | — | | | | — | | | | (12,135 | ) | | | 52,879 | |
iShares iBoxx $ High Yield Corporate Bond ETF(d) | | | 11,100 | | | | — | | | | (11,100 | ) | | | — | | | | — | | | | — | | | | (12,573 | ) | | | 10,012 | |
iShares J.P.Morgan USD Emerging Markets Bond ETF(d) | | | 5,333 | | | | — | | | | (5,333 | ) | | | — | | | | — | | | | — | | | | (220 | ) | | | 54 | |
| | | | | | | | | | | | | | | | | | | | | | | | | | | | | | | | |
| | | | | | | | | | | | | | | | | | $ | 26,100,099 | | | $ | 338,433 | | | $ | (22,139 | ) | | $ | 51,089 | |
| | | | | | | | | | | | | | | | | | | | | | | | | | | | | | | | |
| (a) | Includes net capital gain distributions, if applicable. |
| (b) | Represents net shares purchased (sold). |
| | | | |
| SCHEDULES OF INVESTMENTS | | | 57 | |
| | |
Schedule of Investments (continued) December 31, 2019 | | BlackRock Balanced Capital Portfolio |
| (c) | Represents securities lending income earned from the reinvestment of cash collateral from loaned securities, net of fees and collateral investment expenses, and other payments to and from borrowers of securities. | |
| (d) | As of period end, the entity is no longer held by the Fund. | |
For Fund compliance purposes, the Fund’s industry classifications refer to one or more of the industrysub-classifications used by one or more widely recognized market indexes or rating group indexes, and/or as defined by the investment adviser. These definitions may not apply for purposes of this report, which may combine such industrysub-classifications for reporting ease.
Reverse Repurchase Agreements
| | | | | | | | | | | | | | | | | | | | | | | | |
| Counterparty | | Interest
Rate | | | Trade
Date | | | Maturity
Date | | | Face Value | | | Face Value
Including
Accrued Interest | | | Type ofNon-Cash
Underlying Collateral | | Remaining Contractual
Maturity of the Agreements |
BNP Paribas SA | | | 1.75 | % | | | 12/31/19 | | | | 01/02/20 | | | $ | 997,500 | | | $ | 997,548 | | | U.S. Treasury Obligations | | Overnight |
| | |
| 58 | | 2019 BLACKROCK ANNUAL REPORTTO SHAREHOLDERS |
| | |
Schedule of Investments (continued) December 31, 2019 | | BlackRock Balanced Capital Portfolio |
Derivative Financial Instruments Outstanding as of Period End
Futures Contracts
| | | | | | | | | | | | | | | | |
| Description | | Number of
Contracts | | | Expiration
Date | | | Notional
Amount (000) | | | Value/
Unrealized
Appreciation
(Depreciation) | |
| Long Contracts | | | | | | | | | | | | |
Euro-BTP | | | 7 | | | | 03/06/20 | | | $ | 1,119 | | | $ | (2,557 | ) |
Euro-Schatz | | | 68 | | | | 03/06/20 | | | | 8,536 | | | | (7,587 | ) |
S&P 500E-Mini Index | | | 23 | | | | 03/20/20 | | | | 3,716 | | | | 58,796 | |
U.S. Treasury Ultra Bond | | | 18 | | | | 03/20/20 | | | | 3,270 | | | | (86,220 | ) |
U.S. Treasury 2 Year Note | | | 107 | | | | 03/31/20 | | | | 23,059 | | | | (16,144 | ) |
U.S. Treasury 5 Year Note | | | 2 | | | | 03/31/20 | | | | 237 | | | | (19 | ) |
| | | | | | | | | | | | | | | | |
| | | | | | | | | | | | | | | (53,731 | ) |
| | | | | | | | | | | | | | | | |
| Short Contracts | | | | | | | | | | | | |
Euro-Bund | | | 6 | | | | 03/06/20 | | | | 1,147 | | | | 11,822 | |
U.S. Treasury 10 Year Note | | | 82 | | | | 03/20/20 | | | | 10,531 | | | | 75,589 | |
U.S. Treasury 10 Year Ultra Note | | | 27 | | | | 03/20/20 | | | | 3,799 | | | | 46,287 | |
U.S. Treasury Long Bond | | | 3 | | | | 03/20/20 | | | | 468 | | | | 2,523 | |
Long Gilt | | | 6 | | | | 03/27/20 | | | | 1,044 | | | | 4,055 | |
| | | | | | | | | | | | | | | | |
| | | | | | | | | | | | | | | 140,276 | |
| | | | | | | | | | | | | | | | |
| | | | | | | | | | | | | | $ | 86,545 | |
| | | | | | | | | | | | | | | | |
Forward Foreign Currency Exchange Contracts
| | | | | | | | | | | | | | | | | | | | |
Currency
Purchased | | | Currency
Sold | | | Counterparty | | Settlement Date | | | Unrealized
Appreciation
(Depreciation) | |
| BRL | | | 497,175 | | | USD | | | 119,000 | | | Citibank NA | | | 01/03/20 | | | $ | 4,591 | |
| BRL | | | 694,647 | | | USD | | | 169,000 | | | Deutsche Bank AG | | | 01/03/20 | | | | 3,682 | |
| MXN | | | 722,044 | | | USD | | | 37,000 | | | Citibank NA | | | 01/03/20 | | | | 1,188 | |
| MXN | | | 724,303 | | | USD | | | 37,000 | | | HSBC Bank plc | | | 01/03/20 | | | | 1,308 | |
| ZAR | | | 1,055,063 | | | USD | | | 75,000 | | | JPMorgan Chase Bank NA | | | 01/06/20 | | | | 301 | |
| CNY | | | 395,310 | | | USD | | | 56,000 | | | Bank of America NA | | | 01/08/20 | | | | 784 | |
| EUR | | | 33,000 | | | USD | | | 36,581 | | | HSBC Bank plc | | | 01/08/20 | | | | 446 | |
| KRW | | | 49,345,800 | | | USD | | | 42,000 | | | BNP Paribas SA | | | 01/08/20 | | | | 707 | |
| KRW | | | 33,306,000 | | | USD | | | 28,000 | | | Deutsche Bank AG | | | 01/08/20 | | | | 825 | |
| KRW | | | 43,933,800 | | | USD | | | 37,000 | | | JPMorgan Chase Bank NA | | | 01/08/20 | | | | 1,023 | |
| RUB | | | 2,386,000 | | | USD | | | 37,000 | | | BNP Paribas SA | | | 01/09/20 | | | | 1,415 | |
| RUB | | | 900,466 | | | USD | | | 14,000 | | | Citibank NA | | | 01/09/20 | | | | 498 | |
| USD | | | 1,880,029 | | | JPY | | | 204,111,000 | | | Citibank NA | | | 01/09/20 | | | | 837 | |
| USD | | | 1,876,538 | | | JPY | | | 203,261,000 | | | UBS AG | | | 01/14/20 | | | | 4,643 | |
| AUD | | | 112,000 | | | JPY | | | 8,463,846 | | | Morgan Stanley &Co. International plc | | | 01/17/20 | | | | 665 | |
| COP | | | 655,429,560 | | | USD | | | 189,771 | | | JPMorgan Chase Bank NA | | | 01/22/20 | | | | 9,470 | |
| COP | | | 231,060,740 | | | USD | | | 66,742 | | | Natwest Markets plc | | | 01/22/20 | | | | 3,497 | |
| RUB | | | 3,134,241 | | | USD | | | 48,542 | | | HSBC Bank plc | | | 01/22/20 | | | | 1,835 | |
| RUB | | | 4,639,759 | | | USD | | | 72,040 | | | JPMorgan Chase Bank NA | | | 01/22/20 | | | | 2,535 | |
| MXN | | | 703,895 | | | USD | | | 37,000 | | | Bank of America NA | | | 01/23/20 | | | | 114 | |
| BRL | | | 797,142 | | | USD | | | 196,000 | | | Credit Suisse International | | | 02/04/20 | | | | 1,971 | |
| BRL | | | 190,745 | | | USD | | | 47,000 | | | Morgan Stanley & Co. International plc | | | 02/04/20 | | | | 372 | |
| JPY | | | 3,259,758 | | | USD | | | 30,000 | | | Morgan Stanley & Co. International plc | | | 02/05/20 | | | | 57 | |
| MXN | | | 4,010,000 | | | USD | | | 207,082 | | | Bank of America NA | | | 02/05/20 | | | | 3,910 | |
| MXN | | | 1,223,000 | | | USD | | | 62,392 | | | HSBC Bank plc | | | 02/05/20 | | | | 1,958 | |
| JPY | | | 10,138,850 | | | USD | | | 93,000 | | | UBS AG | | | 02/06/20 | | | | 492 | |
| RUB | | | 5,931,870 | | | USD | | | 94,000 | | | Bank of America NA | | | 02/18/20 | | | | 1,028 | |
| USD | | | 574,376 | | | EUR | | | 440,000 | | | Deutsche Bank AG | | | 02/25/20 | | | | 79,192 | |
| USD | | | 594,031 | | | JPY | | | 59,510,000 | | | HSBC Bank plc | | | 03/16/20 | | | | 44,048 | |
| BRL | | | 1,855,171 | | | USD | | | 453,000 | | | Bank of America NA | | | 03/18/20 | | | | 6,750 | |
| BRL | | | 1,940,630 | | | USD | | | 470,000 | | | Deutsche Bank AG | | | 03/18/20 | | | | 10,929 | |
| MXN | | | 3,288,310 | | | USD | | | 170,000 | | | BNP Paribas SA | | | 03/18/20 | | | | 1,980 | |
| MXN | | | 12,391,767 | | | USD | | | 635,000 | | | Citibank NA | | | 03/18/20 | | | | 13,096 | |
| MXN | | | 2,610,495 | | | USD | | | 135,000 | | | Deutsche Bank AG | | | 03/18/20 | | | | 1,530 | |
| | | | |
| SCHEDULES OF INVESTMENTS | | | 59 | |
| | |
Schedule of Investments (continued) December 31, 2019 | | BlackRock Balanced Capital Portfolio |
Forward Foreign Currency Exchange Contracts (continued)
| | | | | | | | | | | | | | | | | | | | |
Currency
Purchased | | | Currency
Sold | | | Counterparty | | Settlement
Date | | | Unrealized
Appreciation
(Depreciation) | |
| RUB | | | 59,721,320 | | | USD | | | 932,000 | | | Bank of America NA | | | 03/18/20 | | | $ | 21,485 | |
| | | | | | | | | | | | | | | | | | | | |
| | | | | | | | | | | | | | | | | | | 229,162 | |
| | | | | | | | | | | | | | | | | | | | |
| USD | | | 92,000 | | | BRL | | | 391,938 | | | Citibank NA | | | 01/03/20 | | | | (5,432 | ) |
| USD | | | 196,000 | | | BRL | | | 796,152 | | | Credit Suisse International | | | 01/03/20 | | | | (1,915 | ) |
| USD | | | 38,000 | | | MXN | | | 727,586 | | | BNP Paribas SA | | | 01/03/20 | | | | (481 | ) |
| USD | | | 36,000 | | | MXN | | | 687,456 | | | Citibank NA | | | 01/03/20 | | | | (359 | ) |
| JPY | | | 3,036,222 | | | USD | | | 28,000 | | | Bank of America NA | | | 01/06/20 | | | | (51 | ) |
| JPY | | | 4,009,709 | | | USD | | | 37,000 | | | Morgan Stanley &Co. International plc | | | 01/06/20 | | | | (90 | ) |
| USD | | | 65,000 | | | JPY | | | 7,082,420 | | | Morgan Stanley &Co. International plc | | | 01/06/20 | | | | (195 | ) |
| USD | | | 38,000 | | | ZAR | | | 548,854 | | | Bank of America NA | | | 01/06/20 | | | | (1,172 | ) |
| USD | | | 37,000 | | | ZAR | | | 545,343 | | | BNP Paribas SA | | | 01/06/20 | | | | (1,922 | ) |
| USD | | | 56,000 | | | CNY | | | 394,391 | | | Bank of America NA | | | 01/08/20 | | | | (652 | ) |
| USD | | | 36,770 | | | EUR | | | 33,000 | | | Bank of America NA | | | 01/08/20 | | | | (258 | ) |
| USD | | | 107,000 | | | KRW | | | 127,289,340 | | | Deutsche Bank AG | | | 01/08/20 | | | | (3,164 | ) |
| USD | | | 51,000 | | | RUB | | | 3,204,330 | | | Citibank NA | | | 01/09/20 | | | | (590 | ) |
| JPY | | | 5,541,726 | | | AUD | | | 73,920 | | | Morgan Stanley &Co. International plc | | | 01/17/20 | | | | (848 | ) |
| USD | | | 38,000 | | | KRW | | | 44,197,800 | | | BNP Paribas SA | | | 01/21/20 | | | | (266 | ) |
| USD | | | 255,753 | | | COP | | | 886,490,300 | | | Credit Suisse International | | | 01/22/20 | | | | (13,727 | ) |
| USD | | | 216,192 | | | RUB | | | 14,000,001 | | | Morgan Stanley &Co. International plc | | | 01/22/20 | | | | (8,832 | ) |
| COP | | | 121,138,000 | | | USD | | | 37,000 | | | JPMorgan Chase Bank NA | | | 01/24/20 | | | | (178 | ) |
| USD | | | 37,000 | | | COP | | | 123,228,500 | | | Citibank NA | | | 01/24/20 | | | | (457 | ) |
| USD | | | 281,272 | | | IDR | | | 3,987,036,607 | | | Barclays Bank plc | | | 02/05/20 | | | | (6,145 | ) |
| USD | | | 201,824 | | | IDR | | | 2,857,127,553 | | | BNP Paribas SA | | | 02/05/20 | | | | (4,141 | ) |
| USD | | | 140,487 | | | IDR | | | 1,993,516,606 | | | Citibank NA | | | 02/05/20 | | | | (3,221 | ) |
| USD | | | 42,783 | | | IDR | | | 606,835,000 | | | HSBC Bank plc | | | 02/05/20 | | | | (962 | ) |
| USD | | | 995,721 | | | MXN | | | 19,268,403 | | | HSBC Bank plc | | | 02/05/20 | | | | (18,115 | ) |
| USD | | | 492,228 | | | RUB | | | 31,632,029 | | | JPMorgan Chase Bank NA | | | 02/05/20 | | | | (15,290 | ) |
| USD | | | 75,000 | | | ZAR | | | 1,059,330 | | | JPMorgan Chase Bank NA | | | 02/05/20 | | | | (295 | ) |
| EUR | | | 440,000 | | | USD | | | 542,232 | | | JPMorgan Chase Bank NA | | | 02/25/20 | | | | (47,047 | ) |
| JPY | | | 59,510,000 | | | USD | | | 551,427 | | | JPMorgan Chase Bank NA | | | 03/16/20 | | | | (1,444 | ) |
| USD | | | 383,000 | | | CAD | | | 497,785 | | | Bank of America NA | | | 03/18/20 | | | | (442 | ) |
| USD | | | 383,000 | | | CHF | | | 368,705 | | | Morgan Stanley &Co. International plc | | | 03/18/20 | | | | (15 | ) |
| | | | | | | | | | | | | | | | | | | | |
| | | | | | | | | | | | | | | | | | | (137,706 | ) |
| | | | | | | | | | | | | | | | | | | | |
| Net Unrealized Appreciation | | | $ | 91,456 | |
| | | | | | | | | | | | | | | | | | | | |
Exchange-Traded Options Purchased
| | | | | | | | | | | | | | | | | | | | | | | | |
| Description | | Number of
Contracts | | Expiration
Date | | | | | Exercise
Price | | | Notional
Amount (000) | | | Value | |
Call | | | | | | | | | | | | | | | | | | | | | | | | |
90-day Eurodollar March 2020 Futures | | 76 | | 03/13/20 | | | USD | | | | 99.00 | | | | USD | | | | 19,000 | | | $ | 1,900 | |
90-day Eurodollar March 2020 Futures | | 152 | | 03/13/20 | | | USD | | | | 99.13 | | | | USD | | | | 38,000 | | | | 2,850 | |
| | | | | | | | | | | | | | | | | | | | | | | | |
| | | | | | | | | | | | | | | | | | | | | | $ | 4,750 | |
| | | | | | | | | | | | | | | | | | | | | | | | |
OTC Barrier Options Purchased
| | | | | | | | | | | | | | | | | | | | | | | | | | | | | | | | |
| Description | | Type of Option | | Counterparty | | Expiration
Date | | | | | Exercise
Price | | | Barrier
Price/Range | | | Notional
Amount (000) | | | Value | |
| Put | | | | | | | | | | | | | | | | | | | | | | | | | | |
USD Currency | | One-Touch | | BNP Paribas SA | | | 01/06/20 | | | TRY | | | 5.60 | | | TRY | | | 5.60 | | | | USD | | | | 1 | | | $ | — | |
USD Currency | | One-Touch | | Bank of America NA | | | 01/06/20 | | | TRY | | | 5.60 | | | TRY | | | 5.60 | | | | USD | | | | 5 | | | | — | |
USD Currency | | One-Touch | | BNP Paribas SA | | | 01/10/20 | | | TRY | | | 5.67 | | | TRY | | | 5.67 | | | | USD | | | | 6 | | | | 31 | |
USD Currency | | One-Touch | | BNP Paribas SA | | | 01/10/20 | | | TRY | | | 5.67 | | | TRY | | | 5.67 | | | | USD | | | | 9 | | | | 47 | |
USD Currency | | One-Touch | | HSBC Bank plc | | | 01/23/20 | | | CNH | | | 6.90 | | | CNH | | | 6.90 | | | | USD | | | | 6 | | | | 1,077 | |
EUR Currency | | One-Touch | | Deutsche Bank AG | | | 02/06/20 | | | NOK | | | 9.85 | | | NOK | | | 9.85 | | | | EUR | | | | 3 | | | | 1,350 | |
USD Currency | | One-Touch | | Deutsche Bank AG | | | 02/06/20 | | | BRL | | | 3.98 | | | BRL | | | 3.98 | | | | USD | | | | 7 | | | | 2,610 | |
USD Currency | | One-Touch | | Citibank NA | | | 02/06/20 | | | BRL | | | 3.98 | | | BRL | | | 3.98 | | | | USD | | | | 8 | | | | 2,983 | |
USD Currency | | One-Touch | | Bank of America NA | | | 02/07/20 | | | RUB | | | 62.10 | | | RUB | | | 62.10 | | | | USD | | | | 6 | | | $ | 2,949 | |
USD Currency | | One-Touch | | Bank of America NA | | | 02/14/20 | | | RUB | | | 61.10 | | | RUB | | | 61.10 | | | | USD | | | | 8 | | | | 1,788 | |
| | | | | | | | | | | | | | | | | | | | | | | | | | | | | | | | |
| | | | | | | | | | | | | | | | | | | | | | | | | | | | | | $ | 12,835 | |
| | | | | | | | | | | | | | | | | | | | | | | | | | | | | | | | |
| | |
| 60 | | 2019 BLACKROCK ANNUAL REPORTTO SHAREHOLDERS |
| | |
Schedule of Investments (continued) December 31, 2019 | | BlackRock Balanced Capital Portfolio |
OTC Currency Options Purchased
| | | | | | | | | | | | | | | | | | | | | | | | |
| Description | | Counterparty | | Expiration
Date | | | | | Exercise
Price | | | Notional Amount (000) | | | Value | |
Call | | | | | | | | | | | | | | | | | | | | | | | | |
USD Currency | | Deutsche Bank AG | | 01/09/20 | | | ZAR | | | | 15.30 | | | | USD | | | | 47 | | | $ | — | |
USD Currency | | Bank of America NA | | 01/21/20 | | | TWD | | | | 30.60 | | | | USD | | | | 93 | | | | 6 | |
USD Currency | | Bank of America NA | | 03/24/20 | | | ZAR | | | | 15.50 | | | | USD | | | | 147 | | | | 663 | |
USD Currency | | Citibank NA | | 03/24/20 | | | ZAR | | | | 17.00 | | | | USD | | | | 73 | | | | 35 | |
USD Currency | | Deutsche Bank AG | | 03/31/20 | | | ZAR | | | | 14.65 | | | | USD | | | | 70 | | | | 1,049 | |
USD Currency | | Citibank NA | | 04/08/20 | | | ZAR | | | | 15.60 | | | | USD | | | | 140 | | | | 764 | |
| | | | | | | | | | | | | | | | | | | | | | | | |
| | | | | | | | | | | | | | | | | | | | | | | 2,517 | |
| | | | | | | | | | | | | | | | | | | | | | | | |
Put | | | | | | | | | | | | | | | | | | | | | | | | |
USD Currency | | Deutsche Bank AG | | 01/14/20 | | | KRW | | | | 1,178.00 | | | | USD | | | | 94 | | | | 1,949 | |
USD Currency | | Deutsche Bank AG | | 01/17/20 | | | BRL | | | | 3.96 | | | | USD | | | | 56 | | | | 114 | |
USD Currency | | Morgan Stanley & Co. International plc | | 01/17/20 | | | BRL | | | | 4.10 | | | | USD | | | | 74 | | | | 1,514 | |
USD Currency | | Citibank NA | | 02/06/20 | | | BRL | | | | 4.14 | | | | USD | | | | 89 | | | | 2,851 | |
USD Currency | | Credit Suisse International | | 02/06/20 | | | BRL | | | | 4.18 | | | | USD | | | | 75 | | | | 3,036 | |
USD Currency | | Deutsche Bank AG | | 02/14/20 | | | BRL | | | | 4.10 | | | | USD | | | | 141 | | | | 3,519 | |
USD Currency | | Citibank NA | | 02/19/20 | | | BRL | | | | 4.16 | | | | USD | | | | 46 | | | | 1,719 | |
USD Currency | | Bank of America NA | | 03/06/20 | | | RUB | | | | 64.30 | | | | USD | | | | 89 | | | | 2,934 | |
USD Currency | | Citibank NA | | 03/06/20 | | | BRL | | | | 4.14 | | | | USD | | | | 89 | | | | 3,067 | |
USD Currency | | Deutsche Bank AG | | 04/02/20 | | | JPY | | | | 107.00 | | | | USD | | | | 280 | | | | 2,124 | |
USD Currency | | Citibank NA | | 05/01/20 | | | JPY | | | | 107.00 | | | | USD | | | | 93 | | | | 933 | |
| | | | | | | | | | | | | | | | | | | | | | | | |
| | | | | | | | | | | | | | | | | | | | | | | 23,760 | |
| | | | | | | | | | | | | | | | | | | | | | | | |
| | | | | | | | | | | | | | | | | | | | | | $ | 26,277 | |
| | | | | | | | | | | | | | | | | | | | | | | | |
OTC Interest Rate Swaptions Purchased
| | | | | | | | | | | | | | | | | | | | | | | | | | | | | | | | | | | | |
| | | | | | | | | |
Description | | Paid by the Fund | | | | Received by the Fund | | Counterparty | | Expiration
Date | | | Exercise
Rate | | | Notional Amount (000) | | | Value | |
| | Rate | | | Frequency | | | | Rate | | | Frequency |
Call | | | | | | | | | | | | | | | | | | | | | | | | | | | | | | | | | | | | |
10-Year Interest Rate Swap | | | 3 month LIBOR | | | Quarterly | | | | | 1.71% | | | Semi-Annual | | Citibank NA | | | 06/03/20 | | | | 1.71 | % | | | USD | | | | 1,270 | | | $ | 10,220 | |
| | | | | | | | | | | | | | | | | | | | | | | | | | | | | | | | | | | | |
Put | | | | | | | | | | | | | | | | | | | | | | | | | | | | | | | | | | | | |
10-Year Interest Rate Swap | | | 2.00% | | | Semi-Annual | | | | | 3 month LIBOR | | | Quarterly | | Morgan Stanley &Co. International plc | | | 01/29/20 | | | | 2.00 | % | | | USD | | | | 1,994 | | | | 6,242 | |
10-Year Interest Rate Swap | | | 2.30% | | | Semi-Annual | | | | | 3 month LIBOR | | | Quarterly | | Bank of America NA | | | 03/30/20 | | | | 2.30 | % | | | USD | | | | 548 | | | | 981 | |
10-Year Interest Rate Swap | | | 2.30% | | | Semi-Annual | | | | | 3 month LIBOR | | | Quarterly | | Citibank NA | | | 03/30/20 | | | | 2.30 | % | | | USD | | | | 1,644 | | | | 2,943 | |
10-Year Interest Rate Swap | | | 1.71% | | | Semi-Annual | | | | | 3 month LIBOR | | | Quarterly | | Citibank NA | | | 06/03/20 | | | | 1.71 | % | | | USD | | | | 1,270 | | | | 33,966 | |
| | | | | | | | | | | | | | | | | | | | | | | | | | | | | | | | | | | | |
| | | | | | | | | | | | | | | | | | | | | | | | | | | | | | | | | | | 44,132 | |
| | | | | | | | | | | | | | | | | | | | | | | | | | | | | | | | | | | | |
| | | | | | | | | | | | | | | | | | | | | | | | | | | | | | | | | | $ | 54,352 | |
| | | | | | | | | | | | | | | | | | | | | | | | | | | | | | | | | | | | |
Exchange-Traded Options Written
| | | | | | | | | | | | | | | | | | | | | | | | | | | | |
| Description | | Number of
Contracts | | | Expiration
Date | | | Exercise
Price | | | Notional
Amount (000) | | | Value | |
| Call | | | | | | | | | | | | | | | | | | | | | |
90-day Eurodollar March 2020 Futures | | | 76 | | | | 03/13/20 | | | | USD | | | | 98.88 | | | | USD | | | | 19,000 | | | $ | (2,375) | |
90-day Eurodollar March 2020 Futures | | | 152 | | | | 03/13/20 | | | | USD | | | | 99.00 | | | | USD | | | | 38,000 | | | | (2,849) | |
| | | | | | | | | | | | | | | | | | | | | | | | | | | | |
| | | | | | | | | | | | | | | | | | | | | | | | | | $ | (5,224 | ) |
| | | | | | | | | | | | | | | | | | | | | | | | | | | | |
| | | | |
| SCHEDULES OF INVESTMENTS | | | 61 | |
| | |
Schedule of Investments (continued) December 31, 2019 | | BlackRock Balanced Capital Portfolio |
OTC Currency Options Written
| | | | | | | | | | | | | | | | | | | | |
| Description | | Counterparty | | Expiration
Date | | Exercise
Price | | | Notional Amount (000) | | | Value | |
| Call | | | | | | | | | | | | | | | | | |
USD Currency | | Citibank NA | | 01/09/20 | | ZAR | | | 15.30 | | | USD | | | 47 | | | $ | — | |
USD Currency | | Morgan Stanley &
Co. International plc | | 01/17/20 | | BRL | | | 4.35 | | | USD | | | 28 | | | | — | |
USD Currency | | Citibank NA | | 01/20/20 | | RUB | | | 62.60 | | | USD | | | 66 | | | | (285 | ) |
USD Currency | | Citibank NA | | 02/05/20 | | JPY | | | 109.00 | | | USD | | | 28 | | | | (120 | ) |
USD Currency | | Credit Suisse
International | | 02/06/20 | | BRL | | | 4.35 | | | USD | | | 37 | | | | (22 | ) |
EUR Currency | | Bank of America
NA | | 02/14/20 | | CNH | | | 7.85 | | | EUR | | | 67 | | | | (529 | ) |
USD Currency | | Citibank NA | | 02/19/20 | | BRL | | | 4.35 | | | USD | | | 28 | | | | (35 | ) |
USD Currency | | Bank of America
NA | | 03/24/20 | | ZAR | | | 17.00 | | | USD | | | 147 | | | | (71 | ) |
USD Currency | | Deutsche Bank AG | | 03/31/20 | | ZAR | | | 15.35 | | | USD | | | 140 | | | | (901 | ) |
USD Currency | | Citibank NA | | 04/08/20 | | ZAR | | | 17.00 | | | USD | | | 140 | | | | (128 | ) |
| | | | | | | | | | | | | | | | | | | | |
| | | | | | | | | | | | | | | | | | | (2,091 | ) |
| | | | | | | | | | | | | | | | | | | | |
| Put | | | | | | | | | | | | | | | | | |
USD Currency | | Citibank NA | | 01/09/20 | | ZAR | | | 14.45 | | | USD | | | 47 | | | | (1,484 | ) |
USD Currency | | Morgan Stanley &
Co. International plc | | 01/17/20 | | BRL | | | 3.99 | | | USD | | | 56 | | | | (221 | ) |
USD Currency | | Citibank NA | | 02/05/20 | | JPY | | | 108.00 | | | USD | | | 28 | | | | (143 | ) |
USD Currency | | Credit Suisse
International | | 02/06/20 | | BRL | | | 4.06 | | | USD | | | 112 | | | | (1,950 | ) |
USD Currency | | Citibank NA | | 02/06/20 | | BRL | | | 3.98 | | | USD | | | 134 | | | | (1,001 | ) |
USD Currency | | Deutsche Bank AG | | 02/14/20 | | BRL | | | 3.98 | | | USD | | | 188 | | | | (1,566 | ) |
USD Currency | | Citibank NA | | 03/06/20 | | BRL | | | 3.98 | | | USD | | | 134 | | | | (1,461 | ) |
USD Currency | | Bank of America
NA | | 03/06/20 | | RUB | | | 62.50 | | | USD | | | 134 | | | | (1,721 | ) |
USD Currency | | Citibank NA | | 05/01/20 | | JPY | | | 104.00 | | | USD | | | 93 | | | | (393 | ) |
| | | | | | | | | | | | | | | | | | | | |
| | | | | | | | | | | | | | | | | | | (9,940 | ) |
| | | | | | | | | | | | | | | | | | | | |
| | | | | | | | | | | | | | | | | | $ | (12,031) | |
| | | | | | | | | | | | | | | | | | | | |
OTC Interest Rate Swaptions Written
| | | | | | | | | | | | | | | | | | | | | | | | | | | | | | | | |
| Description | | Paid by the Fund | | Received by the Fund | | Counterparty | | Expiration
Date | | | Exercise
Rate | | | Notional
Amount (000) | | | Value | |
| | Rate | | Frequency | | Rate | | | Frequency |
Put | | | | | | | | | | | | | | | | | | | | | | | | | | | | | | | | |
2-Year Interest Rate Swap | | 1.86% | | Semi-Annual | |
| 3
month LIBOR |
| | Quarterly | | Morgan Stanley & Co. International plc | | | 01/29/20 | | | | 1.86 | % | | | USD | | | | 9,968 | | | $ | (501) | |
| | | | | | | | | | | | | | | | | | | | | | | | | | | | | | | | |
Centrally Cleared Credit Default Swaps — Buy Protection
| | | | | | | | | | | | | | | | | | | | | | | | | | | | | | | | |
| Reference Obligation/Index | | Financing
Rate Paid
by the Fund | | | Payment
Frequency | | | Termination
Date | | | Notional
Amount (000) | | | Value | | | Upfront
Premium
Paid
(Received) | | | Unrealized
Appreciation
(Depreciation) | |
CDX.NA.IG.33.V1 | | | 1.00 | % | | | Quarterly | | | | 12/20/24 | | | | USD | | | | 3,289 | | | $ | (86,366 | ) | | $ | (70,665 | ) | | $ | (15,701 | ) |
| | | | | | | | | | | | | | | | | | | | | | | | | | | | | | | | |
| | |
| 62 | | 2019 BLACKROCK ANNUAL REPORTTO SHAREHOLDERS |
| | |
Schedule of Investments (continued) December 31, 2019 | | BlackRock Balanced Capital Portfolio |
Centrally Cleared Interest Rate Swaps
| | | | | | | | | | | | | | | | | | | | | | | | | | | | | | | | | | |
Paid by the Fund | | Received by the Fund | | | | | | | | | | | | | | | | | | | | | |
| | | | | Effective
Date | | | Termination
Date | | | Notional
Amount (000) | | | Value | | | Upfront
Premium
Paid
(Received) | | | Unrealized
Appreciation
(Depreciation) | |
| Rate | | Frequency | | Rate | | Frequency |
| 28 day MXIBTIIE | | Monthly | | 6.88% | | Monthly | | | N/A | | | | 12/15/20 | | | | MXN | | | | 6,899 | | | $ | (596 | ) | | $ | — | | | $ | (596 | ) |
| 28 day MXIBTIIE | | Monthly | | 6.88% | | Monthly | | | N/A | | | | 12/16/20 | | | | MXN | | | | 13,347 | | | | (1,164 | ) | | | — | | | | (1,164 | ) |
| 6.86% | | Monthly | | 28 day MXIBTIIE | | Monthly | |
| 07/24/20
| (a)
| | | 07/23/21 | | | | MXN | | | | 1,720 | | | | (324 | ) | | | — | | | | (324 | ) |
| 6.90% | | Monthly | | 28 day MXIBTIIE | | Monthly | | | 07/27/20 | (a) | | | 07/26/21 | | | | MXN | | | | 2,401 | | | | (506 | ) | | | — | | | | (506 | ) |
| 6.78% | | Monthly | | 28 day MXIBTIIE | | Monthly | | | 08/07/20 | (a) | | | 08/06/21 | | | | MXN | | | | 7,597 | | | | (1,202 | ) | | | — | | | | (1,202 | ) |
| 3 month BA | | Semi-Annual | | 1.94% | | Semi-Annual | | | N/A | | | | 12/06/21 | | | | CAD | | | | 3,525 | | | | (2,332 | ) | | | — | | | | (2,332 | ) |
| 28 day MXIBTIIE | | Monthly | | 6.52% | | Monthly | | | N/A | | | | 12/14/21 | | | | MXN | | | | 10,473 | | | | (1,949 | ) | | | — | | | | (1,949 | ) |
| 28 day MXIBTIIE | | Monthly | | 6.51% | | Monthly | | | N/A | | | | 12/15/21 | | | | MXN | | | | 8,922 | | | | (1,722 | ) | | | — | | | | (1,722 | ) |
| 3 month BA | | Semi-Annual | | 2.02% | | Semi-Annual | | | N/A | | | | 12/17/21 | | | | CAD | | | | 3,625 | | | | 1,573 | | | | — | | | | 1,573 | |
| 7.23% | | Monthly | | 28 day MXIBTIIE | | Monthly | | | N/A | | | | 07/18/22 | | | | MXN | | | | 1,865 | | | | (1,414 | ) | | | — | | | | (1,414 | ) |
| 7.23% | | Monthly | | 28 day MXIBTIIE | | Monthly | | | N/A | | | | 07/19/22 | | | | MXN | | | | 932 | | | | (708 | ) | | | — | | | | (708 | ) |
| 7.22% | | Monthly | | 28 day MXIBTIIE | | Monthly | | | N/A | | | | 07/20/22 | | | | MXN | | | | 359 | | | | (269 | ) | | | — | | | | (269 | ) |
| 7.21% | | Monthly | | 28 day MXIBTIIE | | Monthly | | | N/A | | | | 07/25/22 | | | | MXN | | | | 502 | | | | (373 | ) | | | — | | | | (373 | ) |
| 7.20% | | Monthly | | 28 day MXIBTIIE | | Monthly | | | N/A | | | | 08/03/22 | | | | MXN | | | | 2,325 | | | | (1,749 | ) | | | — | | | | (1,749 | ) |
| 28 day MXIBTIIE | | Monthly | | 7.00% | | Monthly | | | N/A | | | | 08/11/22 | | | | MXN | | | | 4,331 | | | | 2,063 | | | | — | | | | 2,063 | |
| 7.11% | | Monthly | | 28 day MXIBTIIE | | Monthly | | | N/A | | | | 10/14/22 | | | | MXN | | | | 1,575 | | | | (1,075 | ) | | | — | | | | (1,075 | ) |
| 7.11% | | Monthly | | 28 day MXIBTIIE | | Monthly | | | N/A | | | | 10/14/22 | | | | MXN | | | | 2,077 | | | | (1,402 | ) | | | — | | | | (1,402 | ) |
| 28 day MXIBTIIE | | Monthly | | 6.73% | | Monthly | | | N/A | | | | 08/09/24 | | | | MXN | | | | 1,462 | | | | 378 | | | | — | | | | 378 | |
| 28 day MXIBTIIE | | Monthly | | 6.67% | | Monthly | | | N/A | | | | 08/12/24 | | | | MXN | | | | 3,217 | | | | 420 | | | | — | | | | 420 | |
| 28 day MXIBTIIE | | Monthly | | 6.72% | | Monthly | | | N/A | | | | 08/13/24 | | | | MXN | | | | 2,768 | | | | 636 | | | | — | | | | 636 | |
| 28 day MXIBTIIE | | Monthly | | 6.59% | | Monthly | | | N/A | | | | 11/08/24 | | | | MXN | | | | 4,041 | | | | (232 | ) | | | — | | | | (232 | ) |
| 28 day MXIBTIIE | | Monthly | | 6.32% | | Monthly | | | N/A | | | | 07/17/25 | | | | MXN | | | | 2,027 | | | | (1,748 | ) | | | — | | | | (1,748 | ) |
| 3 month LIBOR | | Quarterly | | 2.13% | | Semi-Annual | | | N/A | | | | 08/25/25 | | | | USD | | | | 65 | | | | 1,658 | | | | — | | | | 1,658 | |
| | | | | | | | | | | | | | | | | | | | | | | | | | | | | | | | | | |
| | | | | | | | | | | | | | | | | | | | | | | | $ | (12,037) | | | $ | — | | | $ | (12,037) | |
| | | | | | | | | | | | | | | | | | | | | | | | | | | | | | | | | | |
OTC Credit Default Swaps — Buy Protection
| | | | | | | | | | | | | | | | | | | | | | | | | | | | | | | | | | | | |
| Reference Obligation/Index | | Financing
Rate Paid
by the Fund | | | Payment
Frequency | | | Counterparty | | | Termination
Date | | | Notional
Amount (000) | | | Value | | | Upfront
Premium Paid (Received) | | | Unrealized
Appreciation
(Depreciation) | |
United Mexican States | | | 1.00 | % | | | Quarterly | | | | JPMorgan Chase Bank NA | | | | 06/20/20 | | | | USD | | | | 209 | | | $ | (904) | | | $ | 178 | | | $ | (1,082) | |
United Mexican States | | | 1.00 | % | | | Quarterly | | | | Bank of America NA | | | | 09/20/20 | | | | USD | | | | 209 | | | | (1,302 | ) | | | 387 | | | | (1,689 | ) |
Federative Republic of Brazil | | | 1.00 | % | | | Quarterly | | | | Citibank NA | | | | 12/20/24 | | | | USD | | | | 555 | | | | (419 | ) | | | 9,169 | | | | (9,588 | ) |
Federative Republic of Brazil | | | 1.00 | % | | | Quarterly | | | | Citibank NA | | | | 12/20/24 | | | | USD | | | | 19 | | | | (14 | ) | | | 314 | | | | (328 | ) |
Federative Republic of Brazil | | | 1.00 | % | | | Quarterly | | | | Goldman Sachs International | | | | 12/20/24 | | | | USD | | | | 363 | | | | (274 | ) | | | 6,546 | | | | (6,820 | ) |
Federative Republic of Brazil | | | 1.00 | % | | | Quarterly | | | | Goldman Sachs International | | | | 12/20/24 | | | | USD | | | | 61 | | | | (47 | ) | | | 1,104 | | | | (1,151 | ) |
Republic of Chile | | | 1.00 | % | | | Quarterly | | | | Citibank NA | | | | 12/20/24 | | | | USD | | | | 60 | | | | (1,679 | ) | | | (1,451 | ) | | | (228 | ) |
Republic of Colombia | | | 1.00 | % | | | Quarterly | | | | Citibank NA | | | | 12/20/24 | | | | USD | | | | 206 | | | | (2,742 | ) | | | (744 | ) | | | (1,998 | ) |
Republic of Colombia | | | 1.00 | % | | | Quarterly | | | | Citibank NA | | | | 12/20/24 | | | | USD | | | | 12 | | | | (160 | ) | | | (43 | ) | | | (117 | ) |
Republic of Colombia | | | 1.00 | % | | | Quarterly | | |
| Morgan Stanley & Co.
International plc |
| | | 12/20/24 | | | | USD | | | | 110 | | | | (1,464 | ) | | | (417 | ) | | | (1,047 | ) |
Republic of Colombia | | | 1.00 | % | | | Quarterly | | |
| Morgan Stanley & Co.
International plc |
| | | 12/20/24 | | | | USD | | | | 10 | | | | (133 | ) | | | (38 | ) | | | (95 | ) |
Republic of South Africa | | | 1.00 | % | | | Quarterly | | | | Goldman Sachs International | | | | 12/20/24 | | | | USD | | | | 224 | | | | 6,419 | | | | 8,602 | | | | (2,183 | ) |
Republic of Turkey | | | 1.00 | % | | | Quarterly | | | | Goldman Sachs International | | | | 12/20/24 | | | | USD | | | | 145 | | | | 11,595 | | | | 17,912 | | | | (6,317 | ) |
State of Qatar | | | 1.00 | % | | | Quarterly | | | | JPMorgan Chase Bank NA | | | | 12/20/24 | | | | USD | | | | 55 | | | | (1,691 | ) | | | (1,359 | ) | | | (332 | ) |
United Mexican States | | | 1.00 | % | | | Quarterly | | | | Citibank NA | | | | 12/20/24 | | | | USD | | | | 290 | | | | (3,064 | ) | | | 1,750 | | | | (4,814 | ) |
United Mexican States | | | 1.00 | % | | | Quarterly | | | | Citibank NA | | | | 12/20/24 | | | | USD | | | | 509 | | | | (5,380 | ) | | | 3,824 | | | | (9,204 | ) |
United Mexican States | | | 1.00 | % | | | Quarterly | | | | Citibank NA | | | | 12/20/24 | | | | USD | | | | 102 | | | | (1,077 | ) | | | 766 | | | | (1,843 | ) |
CMBX.NA.9.AAA- | | | 0.50 | % | | | Monthly | | | | Credit Suisse International | | | | 09/17/58 | | | | USD | | | | 60 | | | | (784 | ) | | | 690 | | | | (1,474 | ) |
CMBX.NA.9.AAA- | | | 0.50 | % | | | Monthly | | | | Deutsche Bank AG | | | | 09/17/58 | | | | USD | | | | 50 | | | | (653 | ) | | | 585 | | | | (1,238 | ) |
CMBX.NA.9.AAA- | | | 0.50 | % | | | Monthly | | |
| Morgan Stanley &
Co. International plc |
| | | 09/17/58 | | | | USD | | | | 110 | | | | (1,437 | ) | | | 1,364 | | | | (2,801 | ) |
CMBX.NA.9.AAA- | | | 0.50 | % | | | Monthly | | |
| Morgan Stanley & Co.
International plc |
| | | 09/17/58 | | | | USD | | | | 40 | | | | (522 | ) | | | 463 | | | | (985 | ) |
CMBX.NA.9.AAA- | | | 0.50 | % | | | Monthly | | |
| Morgan Stanley & Co.
International plc |
| | | 09/17/58 | | | | USD | | | | 50 | | | | (653 | ) | | | 577 | | | | (1,230 | ) |
CMBX.NA.9.BBB- | | | 3.00 | % | | | Monthly | | |
| Morgan Stanley & Co.
International plc |
| | | 09/17/58 | | | | USD | | | | 2 | | | | 11 | | | | 112 | | | | (101 | ) |
CMBX.NA.6.AAA- | | | 0.50 | % | | | Monthly | | | | Deutsche Bank AG | | | | 05/11/63 | | | | USD | | | | 94 | | | | (802 | ) | | | (70 | ) | | | (732 | ) |
CMBX.NA.6.AAA- | | | 0.50 | % | | | Monthly | | | | Deutsche Bank AG | | | | 05/11/63 | | | | USD | | | | 42 | | | | (361 | ) | | | (6 | ) | | | (355 | ) |
CMBX.NA.6.BBB- | | | 3.00 | % | | | Monthly | | | | JPMorgan Securities LLC | | | | 05/11/63 | | | | USD | | | | 20 | | | $ | 1,012 | | | $ | 1,852 | | | $ | (840) | |
| | | | | | | | | | | | | | | | | | | | | | | | | | | | | | | | | | | | |
| | | | | | | | | | | | | | | | | | | | | | | | | | $ | (6,525 | ) | | $ | 52,067 | | | $ | (58,592) | |
| | | | | | | | | | | | | | | | | | | | | | | | | | | | | | | | | | | | |
| | | | |
| SCHEDULES OF INVESTMENTS | | | 63 | |
| | |
Schedule of Investments (continued) December 31, 2019 | | BlackRock Balanced Capital Portfolio |
OTC Credit Default Swaps — Sell Protection
| | | | | | | | | | | | | | | | | | | | | | | | | | | | | | | | | | | | |
| Reference Obligation/Index | | Financing
Rate Received
by the Fund | | | Payment
Frequency | | | Counterparty | | | Termination
Date | | | Credit
Rating (a) | | Notional
Amount
(000) (b) | | | Value | | | Upfront
Premium
Paid
(Received) | | | Unrealized
Appreciation
(Depreciation) | |
United Mexican States | | | 1.00 | % | | | Quarterly | | | | Bank of America NA | | | | 06/20/20 | | | BBB+ | | USD | | | 209 | | | $ | 904 | | | $ | (205 | ) | | $ | 1,109 | |
United Mexican States | | | 1.00 | % | | | Quarterly | | | | JPMorgan Chase Bank NA | | | | 09/20/20 | | | BBB+ | | USD | | | 209 | | | | 1,302 | | | | (338 | ) | | | 1,640 | |
Republic of Turkey | | | 1.00 | % | | | Quarterly | | | | Goldman Sachs International | | | | 12/20/24 | | | B+ | | USD | | | 36 | | | | (2,899 | ) | | | (4,478 | ) | | | 1,579 | |
CMBX.NA.3.AM | | | 0.50 | % | | | Monthly | | | | Credit Suisse International | | | | 12/13/49 | | | NR | | USD | | | — | | | | — | | | | (9 | ) | | | 9 | |
CMBX.NA.3.AM | | | 0.50 | % | | | Monthly | | | | Goldman Sachs International | | | | 12/13/49 | | | NR | | USD | | | — | | | | — | | | | (18 | ) | | | 18 | |
CMBX.NA.9.BBB- | | | 3.00 | % | | | Monthly | | | | Deutsche Bank AG | | | | 09/17/58 | | | NR | | USD | | | 7 | | | | (38 | ) | | | (816 | ) | | | 778 | |
CMBX.NA.10.BBB- | | | 3.00 | % | | | Monthly | | | | JPMorgan Securities LLC | | | | 11/17/59 | | | BBB- | | USD | | | 5 | | | | (10 | ) | | | (415 | ) | | | 405 | |
CMBX.NA.6.BBB- | | | 3.00 | % | | | Monthly | | | | Credit Suisse International | | | | 05/11/63 | | | BBB | | USD | | | 20 | | | | (1,012 | ) | | | (1,532 | ) | | | 520 | |
| | | | | | | | | | | | | | | | | | | | | | | | | | | | | | | | | | | | |
| | | | | | | | | | | | | | | | | | | | | | | | | | $ | (1,753 | ) | | $ | (7,811 | ) | | $ | 6,058 | |
| | | | | | | | | | | | | | | | | | | | | | | | | | | | | | | | | | | | |
| (a) | Using the rating of the issuer or the underlying securities of the index, as applicable, provided by S&P Global Ratings. |
| (b) | The maximum potential amount the Fund may pay should a negative credit event take place as defined under the terms of the agreement. |
OTC Interest Rate Swaps
| | | | | | | | | | | | | | | | | | | | | | | | | | | | | | |
Paid by the Fund | | Received by the Fund | | | | | | | | | | | | | | | | | | | |
| | | | | Counterparty | | Termination
Date | | | Notional
Amount
(000) | | | Value | | | Upfront
Premium
Paid
(Received) | | | Unrealized
Appreciation
(Depreciation) | |
| Rate | | Frequency | | Rate | | Frequency |
| 4.45% | | At Termination | | 1 day BZDIOVER | | At Termination | | JPMorgan
Chase
Bank NA | | | 01/04/21 | | | BRL | | | 2,492 | | | $ | 1,038 | | | $ | — | | | $ | 1,038 | |
| 4.46% | | At Termination | | 1 day BZDIOVER | | At Termination | | Citibank
NA | | | 01/04/21 | | | BRL | | | 1,671 | | | | 647 | | | | — | | | | 647 | |
| 4.49% | | At Termination | | 1 day BZDIOVER | | At Termination | | Citibank
NA | | | 01/04/21 | | | BRL | | | 2,452 | | | | 772 | | | | — | | | | 772 | |
| 3.27% | | Semi-Annual | | 3 month LIBOR | | Quarterly | | Deutsche
Bank AG | | | 05/16/21 | | | USD | | | 550 | | | | (12,424 | ) | | | — | | | | (12,424 | ) |
| 1 day BZDIOVER | | At Termination | | 5.32% | | At Termination | | JPMorgan
Chase
Bank NA | | | 01/03/22 | | | BRL | | | 1,955 | | | | 764 | | | | — | | | | 764 | |
| 1 day BZDIOVER | | At Termination | | 6.35% | | At Termination | | JPMorgan
Chase
Bank NA | | | 01/02/23 | | | BRL | | | 1,286 | | | | 7,140 | | | | — | | | | 7,140 | |
| 1 day BZDIOVER | | At Termination | | 8.27% | | At Termination | | JPMorgan
Chase
Bank NA | | | 01/02/23 | | | BRL | | | 850 | | | | 20,970 | | | | — | | | | 20,970 | |
| 1 day BZDIOVER | | At Termination | | 5.98% | | At Termination | | JPMorgan
Chase
Bank NA | | | 01/02/25 | | | BRL | | | 793 | | | | (2,629 | ) | | | — | | | | (2,629 | ) |
| 1 day BZDIOVER | | At Termination | | 5.99% | | At Termination | | Citibank
NA | | | 01/02/25 | | | BRL | | | 561 | | | | (1,753 | ) | | | — | | | | (1,753 | ) |
| 1 day BZDIOVER | | At Termination | | 6.03% | | At Termination | | JPMorgan
Chase
Bank NA | | | 01/02/25 | | | BRL | | | 561 | | | | (1,505 | ) | | | — | | | | (1,505 | ) |
| 1 day BZDIOVER | | At Termination | | 6.05% | | At Termination | | Citibank
NA | | | 01/02/25 | | | BRL | | | 550 | | | | (1,336 | ) | | | — | | | | (1,336 | ) |
| | |
| 64 | | 2019 BLACKROCK ANNUAL REPORTTO SHAREHOLDERS |
| | |
Schedule of Investments (continued) December 31, 2019 | | BlackRock Balanced Capital Portfolio |
OTC Interest Rate Swaps (continued)
| | | | | | | | | | | | | | | | | | | | | | | | | | | | | | | | | | |
Paid by the Fund | | Received by the Fund | | | | | | | | | | | | | | | | | | | | | |
| | | | | Counterparty | | | Termination
Date | | | Notional
Amount
(000) | | | Value | | | Upfront
Premium
Paid
(Received) | | | Unrealized
Appreciation
(Depreciation) | |
| Rate | | Frequency | | Rate | | Frequency |
1 day BZDIOVER | | At Termination | | 6.26% 28 day | | At Termination | | | Citibank NA | | | | 01/02/25 | | | | BRL | | | | 839 | | | $ | (35 | ) | | $ | — | | | $ | (35 | ) |
5.73% | | Monthly | | MXIBTIIE | | Monthly | | | Bank of America NA | | | | 01/03/25 | | �� | | MXN | | | | 940 | | | | 1,966 | | | | — | | | | 1,966 | |
28 day MXIBTIIE | | Monthly | | 6.43% | | Monthly | | | Bank of America NA | | | | 06/06/25 | | | | MXN | | | | 836 | | | | (448 | ) | | | — | | | | (448 | ) |
28 day MXIBTIIE | | Monthly | | 6.33% 28 day | | Monthly | | | Citibank NA | | | | 07/17/25 | | | | MXN | | | | 1,010 | | | | (858 | ) | | | — | | | | (858 | ) |
6.31% | | Monthly | | MXIBTIIE | | Monthly | | | Deutsche Bank AG | | | | 08/11/25 | | | | MXN | | | | 3,807 | | | | 3,515 | | | | — | | | | 3,515 | |
28 day MXIBTIIE | | Monthly | | 6.27% | | Monthly | | | Bank of America NA | | | | 12/05/25 | | | | MXN | | | | 116 | | | | (128 | ) | | | — | | | | (128 | ) |
| | | | | | | | | | | | | | | | | | | | | | | | | | | | | | | | | | |
| | | | | | | | | | | | | | | | | | | | | | | | $ | 15,696 | | | $ | — | | | $ | 15,696 | |
| | | | | | | | | | | | | | | | | | | | | | | | | | | | | | | | | | |
The following reference rates, and their values as of period end, are used for security descriptions:
| | | | |
Reference Index | | | | Reference Rate |
1 day BZDIOVER | | Overnight Brazil CETIP — Interbank Rate | | 0.02% |
28 day MXIBTIIE | | Mexico Interbank TIIE28-Day | | 7.55% |
3 month BA | | Canadian Bankers Acceptances | | 2.08% |
3 month LIBOR | | London Interbank Offered Rate | | 1.91% |
Balances Reported in the Statements of Assets and Liabilities for Centrally Cleared Swaps, OTC Swaps and Options Written
| | | | | | | | | | | | | | | | | | | | |
| | | Swap
Premiums
Paid | | | Swap Premiums
Received | | | Unrealized
Appreciation | | | Unrealized
Depreciation | | | Value | |
Centrally Cleared Swaps(a) | | $ | — | | | $ | (70,665) | | | $ | 6,728 | | | $ | (34,466) | | | $ | — | |
OTC Swaps | | | 56,195 | | | | (11,939 | ) | | | 42,870 | | | | (79,708 | ) | | | — | |
Options Written | | | N/A | | | | N/A | | | | 52,439 | | | | (6,053 | ) | | | (17,756 | ) |
| (a) | | Includes cumulative appreciation (depreciation) on centrally cleared swaps, as reported in the Schedule of Investments. Only current day’s variation margin is reported within the Statements of Assets and Liabilities and is net of any previously paid (received) swap premium amounts. |
| | | | |
| SCHEDULES OF INVESTMENTS | | | 65 | |
| | |
Schedule of Investments (continued) December 31, 2019 | | BlackRock Balanced Capital Portfolio |
Derivative Financial Instruments Categorized by Risk Exposure
As of period end, the fair values of derivative financial instruments located in the Statements of Assets and Liabilities were as follows:
| | | | | | | | | | | | | | | | | | | | | | | | | | | | |
| | | Commodity
Contracts | | | Credit
Contracts | | | Equity
Contracts | | | Foreign
Currency
Exchange
Contracts | | | Interest
Rate
Contracts | | | Other
Contracts | | | Total | |
Assets — Derivative Financial Instruments | | | | | | | | | | | | | | | | | | | | | | | | | |
Futures contracts | | | | | | | | | | | | | | | | | | | | | | | | | | | | |
Unrealized appreciation on futures contracts(a) | | $ | — | | | $ | — | | | $ | 58,796 | | | $ | — | | | $ | 140,276 | | | $ | — | | | $ | 199,072 | |
Forward foreign currency exchange contracts | | | | | | | | | | | | | | | | | | | | | | | | | | | | |
Unrealized appreciation on forward foreign currency exchange contracts | | | — | | | | — | | | | — | | | | 229,162 | | | | — | | | | — | | | | 229,162 | |
Options purchased | | | | | | | | | | | | | | | | | | | | | | | | | | | | |
Investments at value — unaffiliated(b) | | | — | | | | — | | | | — | | | | 39,112 | | | | 59,102 | | | | — | | | | 98,214 | |
Swaps — centrally cleared | | | | | | | | | | | | | | | | | | | | | | | | | | | | |
Unrealized appreciation on centrally cleared swaps(a) | | | — | | | | — | | | | — | | | | — | | | | 6,728 | | | | — | | | | 6,728 | |
Swaps — OTC | | | | | | | | | | | | | | | | | | | | | | | | | | | | |
Unrealized appreciation on OTC swaps; Swap premiums paid | | | — | | | | 62,253 | | | | — | | | | — | | | | 36,812 | | | | — | | | | 99,065 | |
| | | | |
| | | $ — | | | $ 62,253 | | | $ 58,796 | | | $ 268,274 | | | $ 242,918 | | | $ — | | | $ 632,241 | |
| | | | |
| | | | | | |
| Liabilities — Derivative Financial Instruments | | | | | | | | | | | | | | | | | | | |
Futures contracts | | | | | | | | | | | | | | | | | | | | | | | | | | | | |
Unrealized depreciation on futures contracts(a) | | | — | | | | — | | | | — | | | | — | | | | 112,527 | | | | — | | | | 112,527 | |
Forward foreign currency exchange contracts | | | | | | | | | | | | | | | | | | | | | | | | | | | | |
Unrealized depreciation on forward foreign currency exchange contracts | | | — | | | | — | | | | — | | | | 137,706 | | | | — | | | | — | | | | 137,706 | |
Options written | | | | | | | | | | | | | | | | | | | | | | | | | | | | |
Options written at value | | | — | | | | — | | | | — | | | | 12,031 | | | | 5,725 | | | | — | | | | 17,756 | |
Swaps — centrally cleared | | | | | | | | | | | | | | | | | | | | | | | | | | | | |
Unrealized depreciation on centrally cleared swaps(a) | | | — | | | | 15,701 | | | | — | | | | — | | | | 18,765 | | | | — | | | | 34,466 | |
Swaps — OTC | | | | | | | | | | | | | | | | | | | | | | | | | | | | |
Unrealized depreciation on OTC swaps; Swap premiums received | | | — | | | | 70,531 | | | | — | | | | — | | | | 21,116 | | | | — | | | | 91,647 | |
| | | | |
| | | $ — | | | $ 86,232 | | | $ — | | | $ 149,737 | | | $ 158,133 | | | $ — | | | $ 394,102 | |
| | | | |
| (a) | | Net cumulative unrealized appreciation (depreciation) on futures contracts and centrally cleared swaps, if any,are reported in the Schedule of Investments. In the Statements of Assets and Liabilities, only current day’s variation margin is reported in receivables or payables and the net cumulative unrealized appreciation (depreciation) is included in accumulated earnings (loss). |
| (b) | | Includes options purchased at value as reported in the Schedule of Investments. |
For the year ended December 31, 2019, the effect of derivative financial instruments in the Statements of Operations was as follows:
| | | | | | | | | | | | | | | | | | | | | | | | | | | | |
| | | Commodity
Contracts | | | Credit
Contracts | | | Equity
Contracts | | | Foreign
Currency
Exchange
Contracts | | | Interest Rate
Contracts | | | Other
Contracts | | | Total | |
Net Realized Gain (Loss) from: | | | | | | | | | | | | | | | | | | | | | | | | | |
Futures contracts | | $ | — | | | $ | — | | | $ | 3,355,011 | | | $ | — | | | $ | 3,221,249 | | | $ | — | | | $ | 6,576,260 | |
Forward foreign currency exchange contracts | | | — | | | | — | | | | — | | | | (1,021,129 | ) | | | — | | | | — | | | | (1,021,129 | ) |
Options purchased(a) | | | — | | | | — | | | | — | | | | (298,718 | ) | | | (48,027 | ) | | | — | | | | (346,745 | ) |
Options written | | | — | | | | — | | | | — | | | | 169,493 | | | | 31,482 | | | | — | | | | 200,975 | |
Swaps | | | — | | | | (141,874 | ) | | | — | | | | 1,171 | | | | 48,371 | | | | (100,234 | ) | | | (192,566 | ) |
| | | | |
| | $ | — | | | $ | (141,874 | ) | | $ | 3,355,011 | | | $ | (1,149,183 | ) | | $ | 3,253,075 | | | $ | (100,234 | ) | | $ | 5,216,795 | |
| | | | |
| |
| Net Change in Unrealized Appreciation (Depreciation) on: | | | | |
Futures contracts | | | — | | | | — | | | | 1,185,927 | | | | — | | | | (850,068 | ) | | | — | | | | 335,859 | |
Forward foreign currency exchange contracts | | | — | | | | — | | | | — | | | | 308,819 | | | | — | | | | — | | | | 308,819 | |
Options purchased(b) | | | — | | | | — | | | | — | | | | 24,569 | | | | (82,781 | ) | | | — | | | | (58,212 | ) |
Options written | | | — | | | | — | | | | — | | | | (2,049 | ) | | | 76,030 | | | | — | | | | 73,981 | |
Swaps | | | — | | | | (72,041 | ) | | | — | | | | 1,060 | | | | 1,429 | | | | (2,891 | ) | | | (72,443 | ) |
| | | | |
| | $ | — | | | $ | (72,041 | ) | | $
| 1,185,927
|
| | $
| 332,399
|
| | $ | (855,390 | ) | | $ | (2,891 | ) | | $ | 588,004 | |
| | | | |
| (a) | Options purchased are included in net realized gain (loss) from investments — unaffiliated. |
| (b) | Options purchased are included in net change in unrealized appreciation (depreciation) on investments — unaffiliated. |
| | |
| 66 | | 2019 BLACKROCK ANNUAL REPORTTO SHAREHOLDERS |
| | |
Schedule of Investments (continued) December 31, 2019 | | BlackRock Balanced Capital Portfolio |
Average Quarterly Balances of Outstanding Derivative Financial Instruments
| | | | |
Futures contracts: | | | | |
Average notional value of contracts — long | | $ | 67,904,544 | |
Average notional value of contracts — short | | | 26,914,553 | |
Forward foreign currency exchange contracts: | | | | |
Average amounts purchased — in USD | | | 9,610,371 | |
Average amounts sold — in USD | | | 16,414,064 | |
Options: | | | | |
Average value of option contracts purchased | | | 46,335 | |
Average value of option contracts written | | | 22,943 | |
Average notional value of swaption contracts purchased | | | 2,166,750 | |
Average notional value of swaption contracts written | | | 2,492,000 | |
Credit default swaps: | | | | |
Average notional value — buy protection | | | 6,229,925 | |
Average notional value — sell protection | | | 518,175 | |
Interest rate swaps: | | | | |
Average notional value — pays fixed rate | | | 6,414,669 | |
Average notional value — receives fixed rate | | | 12,603,343 | |
Currency swaps: | | | | |
Average notional value — pays | | | — | (a) |
Average notional value — receives | | | — | (a) |
Inflation swaps: | | | | |
Average notional value — pays fixed rate | | | 2,247,203 | |
Average notional value — receives fixed rate | | | 2,911,447 | |
| (a) | Derivative not held at anyquarter-end. The risk exposure table serves as an indicator of activity during the period. |
For more information about the Fund’s investment risks regarding derivative financial instruments, refer to the Notes to Financial Statements.
Derivative Financial Instruments — Offsetting as of Period End
The Fund’s derivative assets and liabilities (by type) were as follows:
| | | | | | | | |
| | | Assets | | | Liabilities | |
Derivative Financial Instruments: | | | | | | | | |
Futures contracts | | $ | 62,580 | | | $ | 56,343 | |
Forward foreign currency exchange contracts | | | 229,162 | | | | 137,706 | |
Options(a) | | | 98,214 | | | | 17,756 | |
Swaps — Centrally cleared | | | 13 | | | | — | |
Swaps — OTC(b) | | | 99,065 | | | | 91,647 | |
| | | | |
Total derivative assets and liabilities in the Statements of Assets and Liabilities | | $ | 489,034 | | | $ | 303,452 | |
Derivatives not subject to a Master Netting Agreement or similar agreement (“MNA”) | | | (67,343 | ) | | | (61,567 | ) |
| | | | |
Total derivative assets and liabilities subject to an MNA | | $ | 421,691 | | | $ | 241,885 | |
| | | | |
| (a) | Includes options purchased at value which is included in Investments at value – unaffiliated in the Statements of Assets and Liabilities and reported in the Schedule of Investments. |
| (b) | Includes unrealized appreciation (depreciation) on OTC swaps and swap premiums paid/received in the Statements of Assets and Liabilities. |
| | | | |
| SCHEDULES OF INVESTMENTS | | | 67 | |
| | |
Schedule of Investments (continued) December 31, 2019 | | BlackRock Balanced Capital Portfolio |
The following tables present the Fund’s derivative assets and liabilities by counterparty net of amounts available for offset under an MNA and net of the related collateral received and pledged by the Fund:
| | | | | | | | | | | | | | | | | | | | |
| Counterparty | | Derivative Assets
Subject to
an MNA by
Counterparty | | | Derivatives
Available for Offset (a) | | | Non-cash
Collateral
Received | | | Cash
Collateral
Received | | | Net Amount
of Derivative
Assets(b) | |
Bank of America NA | | $ | 46,854 | | | $ | (7,366 | ) | | $ | — | | | $ | — | | | $ | 39,488 | |
BNP Paribas SA | | | 4,180 | | | | (4,180 | ) | | | — | | | | — | | | | — | |
Citibank NA | | | 96,933 | | | | (49,449 | ) | | | — | | | | — | | | | 47,484 | |
Credit Suisse International | | | 6,226 | | | | (6,226 | ) | | | — | | | | — | | | | — | |
Deutsche Bank AG | | | 113,751 | | | | (21,272 | ) | | | — | | | | — | | | | 92,479 | |
Goldman Sachs International | | | 35,761 | | | | (20,967 | ) | | | — | | | | — | | | | 14,794 | |
HSBC Bank plc | | | 50,672 | | | | (19,077 | ) | | | — | | | | — | | | | 31,595 | |
JPMorgan Chase Bank NA | | | 45,059 | | | | (45,059 | ) | | | — | | | | — | | | | — | |
JPMorgan Securities LLC | | | 2,257 | | | | (1,255 | ) | | | — | | | | — | | | | 1,002 | |
Morgan Stanley & Co. International plc | | | 11,366 | | | | (11,366 | ) | | | — | | | | — | | | | — | |
Natwest Markets plc | | | 3,497 | | | | — | | | | — | | | | — | | | | 3,497 | |
UBS AG | | | 5,135 | | | | — | | | | — | | | | — | | | | 5,135 | |
| | | | | | | | | | | | | | | | | | | | |
| | $ | 421,691 | | | $ | (186,217 | ) | | $ | — | | | $ | — | | | $ | 235,474 | |
| | | | | | | | | | | | | | | | | | | | |
| | | | | | | | | | | | | | | | | | | | |
| Counterparty | | Derivative
Liabilities
Subject to
an MNA by
Counterparty | | | Derivatives
Available for Offset (a) | | | Non-cash
Collateral
Pledged | | | Cash
Collateral
Pledged | | | Net Amount of Derivative
Liabilities(c) | |
Bank of America NA | | $ | 7,366 | | | $ | (7,366 | ) | | $ | — | | | $ | — | | | $ | — | |
Barclays Bank plc | | | 6,145 | | | | — | | | | — | | | | — | | | | 6,145 | |
BNP Paribas SA | | | 6,810 | | | | (4,180 | ) | | | — | | | | — | | | | 2,630 | |
Citibank NA | | | 49,449 | | | | (49,449 | ) | | | — | | | | — | | | | — | |
Credit Suisse International | | | 20,629 | | | | (6,226 | ) | | | — | | | | — | | | | 14,403 | |
Deutsche Bank AG | | | 21,272 | | | | (21,272 | ) | | | — | | | | — | | | | — | |
Goldman Sachs International | | | 20,967 | | | | (20,967 | ) | | | — | | | | — | | | | — | |
HSBC Bank plc | | | 19,077 | | | | (19,077 | ) | | | — | | | | — | | | | — | |
JPMorgan Chase Bank NA | | | 71,499 | | | | (45,059 | ) | | | — | | | | — | | | | 26,440 | |
JPMorgan Securities LLC | | | 1,255 | | | | (1,255 | ) | | | — | | | | — | | | | — | |
Morgan Stanley & Co. International plc | | | 17,416 | | | | (11,366 | ) | | | — | | | | — | | | | 6,050 | |
| | | | | | | | | | | | | | | | | | | | |
| | $ | 241,885 | | | $ | (186,217 | ) | | $ | — | | | $ | — | | | $ | 55,668 | |
| | | | | | | | | | | | | | | | | | | | |
| (a) | The amount of derivatives available for offset is limited to the amount of derivative assets and/or liabilities that are subject to an MNA. |
| (b) | Net amount represents the net amount receivable from the counterparty in the event of default. |
| (c) | Net amount represents the net amount payable due to the counterparty in the event of default. |
| | |
| 68 | | 2019 BLACKROCK ANNUAL REPORTTO SHAREHOLDERS |
| | |
Schedule of Investments (continued) December 31, 2019 | | BlackRock Balanced Capital Portfolio |
Fair Value Hierarchy as of Period End
Various inputs are used in determining the fair value of investments and derivative financial instruments. For information about the Fund’s policy regarding valuation of investments and derivative financial instruments, refer to the Notes to Financial Statements.
The following tables summarize the Fund’s investments and derivative financial instruments categorized in the disclosure hierarchy:
| | | | | | | | | | | | | | | | |
| | | Level 1 | | | Level 2 | | | Level 3 | | | Total | |
Assets: | | | | | | | | | | | | | | | | |
Investments: | | | | | | | | | | | | | | | | |
Long-Term Investments: | | | | | | | | | | | | | | | | |
Asset-Backed Securities | | $ | — | | | $ | 15,109,151 | | | $ | 1,113,301 | | | $ | 16,222,452 | |
Common Stocks(a) | | | 301,034,536 | | | | — | | | | — | | | | 301,034,536 | |
Corporate Bonds(a) | | | — | | | | 58,365,764 | | | | — | | | | 58,365,764 | |
Foreign Agency Obligations(a) | | | — | | | | 1,386,068 | | | | — | | | | 1,386,068 | |
Foreign Government Obligations(a) | | | — | | | | 4,590,818 | | | | — | | | | 4,590,818 | |
Investment Companies | | | 3,137,512 | | | | — | | | | — | | | | 3,137,512 | |
Municipal Bonds | | | — | | | | 9,289,696 | | | | — | | | | 9,289,696 | |
Non-Agency Mortgage-Backed Securities | | | — | | | | 8,872,327 | | | | 272,121 | | | | 9,144,448 | |
Capital Trusts(a) | | | — | | | | 746,514 | | | | — | | | | 746,514 | |
Rights(a) | | | 21,913 | | | | — | | | | — | | | | 21,913 | |
U.S. Government Sponsored Agency Securities | | | — | | | | 92,679,269 | | | | — | | | | 92,679,269 | |
U.S. Treasury Obligations | | | — | | | | 37,287,174 | | | | — | | | | 37,287,174 | |
Short-Term Securities: | | | | | | | | | | | | | | | | |
Borrowed Bond Agreements | | | — | | | | 2,861,094 | | | | — | | | | 2,861,094 | |
Foreign Government Obligations(a) | | | — | | | | 3,929,364 | | | | — | | | | 3,929,364 | |
Money Market Funds | | | 7,564,319 | | | | — | | | | — | | | | 7,564,319 | |
Options Purchased: | | | | | | | | | | | | | | | | |
Foreign currency exchange contracts | | | — | | | | 39,112 | | | | — | | | | 39,112 | |
Interest rate contracts | | | 4,750 | | | | 54,352 | | | | — | | | | 59,102 | |
Liabilities: | | | | | | | | | | | | | | | | |
Investments: | | | | | | | | | | | | | | | | |
Borrowed Bonds | | | — | | | | (2,849,605 | ) | | | — | | | | (2,849,605 | ) |
TBA Sale Commitments | | | — | | | | (7,040,983 | ) | | | — | | | | (7,040,983 | ) |
| | | | | | | | | | | | | | | | |
Subtotal | | $ | 311,763,030 | | | $ | 225,320,115 | | | $ | 1,385,422 | | | $ | 538,468,567 | |
| | | | | | | | | | | | | | | | |
Investments valued at NAV(b) | | | | | | | | | | | | | | | 15,398,268 | |
| | | | | | | | | | | | | | | | |
Total Investments | | | | | | | | | | | | | | $ | 553,866,835 | |
| | | | | | | | | | | | | | | | |
Derivative Financial Instruments(c) | | | | | | | | | | | | | | | | |
Assets: | | | | | | | | | | | | | | | | |
Credit contracts | | $ | — | | | $ | 6,058 | | | $ | — | | | $ | 6,058 | |
Equity contracts | | | 58,796 | | | | — | | | | — | | | | 58,796 | |
Foreign currency exchange contracts | | | — | | | | 229,162 | | | | — | | | | 229,162 | |
Interest rate contracts | | | 140,276 | | | | 43,540 | | | | — | | | | 183,816 | |
Liabilities: | | | | | | | | | | | | | | | | |
Credit contracts | | | — | | | | (74,293 | ) | | | — | | | | (74,293 | ) |
Foreign currency exchange contracts | | | — | | | | (149,737 | ) | | | — | | | | (149,737 | ) |
Interest rate contracts | | | (117,751 | ) | | | (40,382 | ) | | | — | | | | (158,133 | ) |
| | | | | | | | | | | | | | | | |
| | $ | 81,321 | | | $ | 14,348 | | | $ | — | | | $ | 95,669 | |
| | | | | | | | | | | | | | | | |
| (a) | See above Schedule of Investments for values in each industry or country. |
| (b) | Certain investments of the Fund were fair valued using NAV per share as no quoted market value is available and therefore have been excluded from the fair value hierarchy. |
| (c) | Derivative financial instruments are swaps, futures contracts, forward foreign currency exchange contracts and options written. Swaps, futures contracts and forward foreign currency exchange contracts are valued at the unrealized appreciation (depreciation) on the instrument and options written are shown at value. |
The Fund may hold assets and/or liabilities in which the fair value approximates the carrying amount or face value, including accrued interest, for financial statement purposes. As of period end, Reverse Repurchase Agreements of $997,548 are categorized as Level 2 within the disclosure hierarchy.
See notes to financial statements.
| | | | |
| SCHEDULES OF INVESTMENTS | | | 69 | |
| | |
Schedule of Investments December 31, 2019 | | BlackRock Capital Appreciation Portfolio (Percentages shown are based on Net Assets) |
| | | | | | | | |
| Security | | Shares | | | Value | |
|
Common Stocks— 99.4% | |
|
| Aerospace & Defense— 1.1% | |
Boeing Co. (The) | | | 6,710 | | | $ | 2,185,850 | |
| | | | | | | | |
|
| Automobiles— 0.5% | |
Ferrari NV | | | 5,466 | | | | 904,842 | |
| | | | | | | | |
|
| Beverages— 1.4% | |
Constellation Brands, Inc., Class A | | | 14,123 | | | | 2,679,839 | |
| | | | | | | | |
|
| Biotechnology— 1.3% | |
Vertex Pharmaceuticals, Inc.(a) | | | 11,532 | | | | 2,524,931 | |
| | | | | | | | |
|
| Capital Markets— 4.0% | |
CME Group, Inc. | | | 15,951 | | | | 3,201,685 | |
S&P Global, Inc. | | | 16,985 | | | | 4,637,754 | |
| | | | | | | | |
| | | | | | | 7,839,439 | |
|
| Chemicals— 1.7% | |
Sherwin-Williams Co. (The) | | | 5,703 | | | | 3,327,929 | |
| | | | | | | | |
|
| Commercial Services & Supplies— 0.8% | |
Waste Management, Inc. | | | 14,319 | | | | 1,631,793 | |
| | | | | | | | |
|
| Containers & Packaging— 1.3% | |
Ball Corp. | | | 38,364 | | | | 2,481,000 | |
| | | | | | | | |
|
| Electronic Equipment, Instruments & Components— 1.1% | |
Keysight Technologies, Inc.(a) | | | 21,204 | | | | 2,176,166 | |
| | | | | | | | |
|
| Entertainment— 2.8% | |
Netflix, Inc.(a) | | | 16,829 | | | | 5,445,359 | |
| | | | | | | | |
|
| Equity Real Estate Investment Trusts (REITs)— 2.3% | |
Prologis, Inc. | | | 12,431 | | | | 1,108,100 | |
SBA Communications Corp.(a) | | | 14,174 | | | | 3,415,792 | |
| | | | | | | | |
| | | | | | | 4,523,892 | |
|
| Health Care Equipment & Supplies— 5.1%(a) | |
Align Technology, Inc. | | | 11,417 | | | | 3,185,800 | |
Boston Scientific Corp. | | | 61,128 | | | | 2,764,208 | |
Intuitive Surgical, Inc. | | | 6,902 | | | | 4,080,117 | |
| | | | | | | | |
| | | | | | | 10,030,125 | |
|
| Health Care Providers & Services— 2.7% | |
Humana, Inc. | | | 3,058 | | | | 1,120,818 | |
UnitedHealth Group, Inc.(b) | | | 13,967 | | | | 4,106,019 | |
| | | | | | | | |
| | | | | | | 5,226,837 | |
|
| Hotels, Restaurants & Leisure— 0.5% | |
Domino’s Pizza, Inc. | | | 3,673 | | | | 1,079,054 | |
| | | | | | | | |
|
| Industrial Conglomerates— 1.7% | |
Honeywell International, Inc. | | | 5,973 | | | | 1,057,221 | |
Roper Technologies, Inc. | | | 6,417 | | | | 2,273,094 | |
| | | | | | | | |
| | | | | | | 3,330,315 | |
|
| Interactive Media & Services— 9.8%(a) | |
Alphabet, Inc., Class A | | | 4,838 | | | | 6,479,969 | |
Facebook, Inc., Class A | | | 36,081 | | | | 7,405,625 | |
IAC/InterActiveCorp. | | | 21,013 | | | | 5,234,548 | |
| | | | | | | | |
| | | | | | | 19,120,142 | |
|
| Internet & DirectMarketing Retail— 11.6% | |
Alibaba Group Holding Ltd., ADR(a) | | | 20,744 | | | | 4,399,803 | |
Amazon.com, Inc.(a) | | | 8,255 | | | | 15,253,919 | |
MercadoLibre, Inc. | | | 5,362 | | | | 3,066,742 | |
| | | | | | | | |
| | | | | | | 22,720,464 | |
| | | | | | | | |
| Security | | Shares | | | Value | |
|
| IT Services— 11.7% | |
GoDaddy, Inc., Class A(a) | | | 21,420 | | | $ | 1,454,846 | |
Mastercard, Inc., Class A(b) | | | 29,879 | | | | 8,921,571 | |
PayPal Holdings, Inc.(a) | | | 16,497 | | | | 1,784,480 | |
Shopify, Inc., Class A(a)(b) | | | 2,546 | | | | 1,012,239 | |
Visa, Inc., Class A | | | 52,260 | | | | 9,819,654 | |
| | | | | | | | |
| | | | | | | 22,992,790 | |
|
| Life Sciences Tools & Services— 2.3%(a) | |
Illumina, Inc. | | | 4,290 | | | | 1,423,165 | |
IQVIA Holdings, Inc. | | | 19,632 | | | | 3,033,340 | |
| | | | | | | | |
| | | | | | | 4,456,505 | |
|
| Pharmaceuticals— 2.8% | |
Novartis AG, ADR(b) | | | 27,123 | | | | 2,568,277 | |
Zoetis, Inc. | | | 22,500 | | | | 2,977,875 | |
| | | | | | | | |
| | | | | | | 5,546,152 | |
|
| Professional Services— 3.7% | |
CoStar Group, Inc.(a) | | | 7,735 | | | | 4,627,851 | |
TransUnion | | | 29,530 | | | | 2,528,063 | |
| | | | | | | | |
| | | | | | | 7,155,914 | |
|
| Road &Rail— 1.0% | |
Union Pacific Corp. | | | 10,390 | | | | 1,878,408 | |
| | | | | | | | |
|
| Semiconductors & Semiconductor Equipment— 3.4% | |
ASML Holding NV (Registered), NYRS | | | 15,345 | | | | 4,541,199 | |
Xilinx, Inc. | | | 22,057 | | | | 2,156,513 | |
| | | | | | | | |
| | | | | | | 6,697,712 | |
|
| Software— 18.3% | |
Adobe, Inc.(a) | | | 16,222 | | | | 5,350,178 | |
Autodesk, Inc.(a) | | | 18,124 | | | | 3,325,029 | |
Coupa Software, Inc.(a) | | | 7,873 | | | | 1,151,426 | |
Intuit, Inc. | | | 16,509 | | | | 4,324,202 | |
Microsoft Corp. | | | 72,348 | | | | 11,409,280 | |
salesforce.com, Inc.(a) | | | 33,700 | | | | 5,480,968 | |
ServiceNow, Inc.(a) | | | 17,358 | | | | 4,900,511 | |
| | | | | | | | |
| | | | | | | 35,941,594 | |
|
| Specialty Retail— 2.7% | |
Burlington Stores, Inc.(a) | | | 11,262 | | | | 2,568,074 | |
Lowe’s Cos., Inc. | | | 22,637 | | | | 2,711,007 | |
| | | | | | | | |
| | | | | | | 5,279,081 | |
|
| Technology Hardware, Storage & Peripherals— 2.1% | |
Apple, Inc. | | | 14,244 | | | | 4,182,751 | |
| | | | | | | | |
|
| Textiles, Apparel & Luxury Goods— 1.7% | |
NIKE, Inc., Class B | | | 33,210 | | | | 3,364,505 | |
| | | | | | | | |
| | |
Total Common Stocks— 99.4%
(Cost: $129,769,805) | | | | | | | 194,723,389 | |
| | | | | | | | |
| |
Preferred Stocks— 0.6% | | | | | |
| | |
| Software— 0.6% | | | | | | |
Palantir Technologies, Inc., Series I (Acquired
02/11/14, cost $1,152,906)(a)(c)(d) | | | 188,076 | | | | 1,113,410 | |
| | | | | | | | |
| | |
Total Preferred Stocks— 0.6%
(Cost: $1,152,906) | | | | | | | 1,113,410 | |
| | | | | | | | |
| | |
Total Long-Term Investments— 100.0%
(Cost: $130,922,711) | | | | | | | 195,836,799 | |
| | | | | | | | |
| | |
| 70 | | 2019 BLACKROCK ANNUAL REPORTTO SHAREHOLDERS |
| | |
Schedule of Investments (continued) December 31, 2019 | | BlackRock Capital Appreciation Portfolio (Percentages shown are based on Net Assets) |
| | | | | | | | |
| Security | | Shares | | | Value | |
| |
Short-Term Securities — 2.5%(e)* | | | | | |
BlackRock Liquidity Funds,T-Fund, Institutional Class, 1.51% | | | 232,078 | | | $ | 232,078 | |
SL Liquidity Series, LLC, Money Market Series, 1.80%(f) | | | 4,710,170 | | | | 4,711,112 | |
| | | | | | | | |
| | |
Total Short-Term Securities — 2.5%
(Cost: $4,943,170) | | | | | | | 4,943,190 | |
| | | | | | | | |
| | |
Total Investments — 102.5%
(Cost: $135,865,881) | | | | | | | 200,779,989 | |
| |
Liabilities in Excess of Other Assets — (2.5)% | | | | (4,842,058 | ) |
| | | | | | | | |
| | |
Net Assets — 100.0% | | | | | | $ | 195,937,931 | |
| | | | | | | | |
| (a) | Non-income producing security. |
| (b) | Security, or a portion of the security, is on loan. |
| (c) | Restricted security as to resale, excluding 144A securities. The Fund held restricted securities with a current value of $1,113,410, representing 0.57% of its net assets as of period end, and an original cost of $1,152,906. |
| (d) | Security is valued using significant unobservable inputs and is classified as Level 3 in the fair value hierarchy. |
| (e) | Annualized7-day yield as of period end. |
| (f) | Security was purchased with the cash collateral from loaned securities. |
| * | During the year ended December 31, 2019, investments in issuers considered to be an affiliate/affiliates of the Fund for purposes of Section 2(a)(3) of the Investment Company Act of 1940, as amended, were as follows: |
| | | | | | | | | | | | | | | | | | | | | | | | | | | | |
| Affiliate | | Shares Held at
12/31/18 | | | Net Activity | | | Shares Held at
12/31/19 | | | Value at
12/31/19 | | | Income | | | Net Realized
Gain (Loss) (a) | | | Change in
Unrealized
Appreciation
(Depreciation) | |
BlackRock Liquidity Funds,T-Fund, Institutional Class | | | 3,749,583 | | | | (3,517,505 | ) | | | 232,078 | | | $ | 232,078 | | | $ | 21,595 | | | $ | — | | | $ | — | |
SL Liquidity Series, LLC, Money Market Series | | | 4,608,561 | | | | 101,609 | | | | 4,710,170 | | | | 4,711,112 | | | | 14,830 | (b) | | | (328 | ) | | | 119 | |
| | | | | | | | | | | | | | | | | | | | | | | | | | | | |
| | | | | | | | | | | | | | $ | 4,943,190 | | | $ | 36,425 | | | $ | (328 | ) | | $ | 119 | |
| | | | | | | | | | | | | | | | | | | | | | | | | | | | |
| (a) | Includes net capital gain distributions, if applicable. |
| (b) | Represents securities lending income earned from the reinvestment of cash collateral from loaned securities, net of fees and collateral investment expenses, and other payments to and from borrowers of securities. |
For Fund compliance purposes, the Fund’s industry classifications refer to one or more of the industrysub-classifications used by one or more widely recognized market indexes or rating group indexes, and/or as defined by the investment adviser. These definitions may not apply for purposes of this report, which may combine such industrysub-classifications for reporting ease.
| | | | |
| SCHEDULES OF INVESTMENTS | | | 71 | |
| | |
Schedule of Investments (continued) December 31, 2019 | | BlackRock Capital Appreciation Portfolio |
Fair Value Hierarchy as of Period End
Various inputs are used in determining the fair value of investments and derivative financial instruments. For information about the Fund’s policy regarding valuation of investments and derivative financial instruments, refer to the Notes to Financial Statements.
The following tables summarize the Fund’s investments and derivative financial instruments categorized in the disclosure hierarchy:
| | | | | | | | | | | | | | | | |
| | | Level 1 | | | Level 2 | | | Level 3 | | | Total | |
Assets: | | | | | | | | | | | | | | | | |
Investments: | | | | | | | | | | | | | | | | |
Long-Term Investments: | | | | | | | | | | | | | | | | |
Common Stocks(a) | | $ | 194,723,389 | | | $ | — | | | $ | — | | | $ | 194,723,389 | |
Preferred Stocks(a) | | | — | | | | — | | | | 1,113,410 | | | | 1,113,410 | |
Short-Term Securities | | | 232,078 | | | | — | | | | — | | | | 232,078 | |
| | | �� | | | | | | | | | | | | | |
Subtotal | | $ | 194,955,467 | | | $ | — | | | $ | 1,113,410 | | | $ | 196,068,877 | |
| | | | | | | | | | | | | | | | |
Investments valued at NAV(b) | | | | | | | | | | | | | | | 4,711,112 | |
| | | | | | | | | | | | | | | | |
Total Investments | | | | | | | | | | | | | | $ | 200,779,989 | |
| | | | | | | | | | | | | | | | |
| (a) | See above Schedule of Investments for values in each industry. |
| (b) | Certain investments of the Fund were fair valued using NAV per share as no quoted market value is available and therefore have been excluded from the fair value hierarchy. |
See notes to financial statements.
| | |
| 72 | | 2019 BLACKROCK ANNUAL REPORTTO SHAREHOLDERS |
| | |
Consolidated Schedule of Investments December 31, 2019 | | BlackRock Global Allocation Portfolio (Percentages shown are based on Net Assets) |
| | | | | | | | |
| Security | | Shares | | | Value | |
|
Common Stocks — 59.1% | |
|
Argentina — 0.0% | |
YPF SA, ADR(a) | | | 366 | | | $ | 4,238 | |
| | | | | | | | |
|
| Australia — 0.1% | |
AGL Energy Ltd. | | | 914 | | | | 13,156 | |
BHP Group Ltd. | | | 198 | | | | 5,422 | |
Coles Group Ltd.(b) | | | 64 | | | | 666 | |
Newcrest Mining Ltd. | | | 3,702 | | | | 78,182 | |
Quintis HoldCo Pty. Ltd. (Acquired 10/22/18, cost $115,835)(b)(c)(d) | | | 218,994 | | | | 147,532 | |
Rio Tinto plc | | | 3 | | | | 178 | |
South32 Ltd. | | | 3,183 | | | | 6,010 | |
Wesfarmers Ltd. | | | 40 | | | | 1,162 | |
Woolworths Group Ltd. | | | 120 | | | | 3,044 | |
| | | | | | | | |
| | | | | | | 255,352 | |
|
| Austria — 0.1% | |
Erste Group Bank AG(b) | | | 2,509 | | | | 94,244 | |
| | | | | | | | |
|
| Belgium — 0.1% | |
KBC Group NV | | | 1,830 | | | | 137,972 | |
| | | | | | | | |
|
| Brazil — 0.5% | |
Azul SA, ADR(a)(b) | | | 18,251 | | | | 781,143 | |
B3 SA - Brasil Bolsa Balcao(b) | | | 100 | | | | 1,069 | |
Banco do Brasil SA(b) | | | 695 | | | | 9,133 | |
Banco Santander Brasil SA | | | 400 | | | | 4,917 | |
Engie Brasil Energia SA | | | 200 | | | | 2,545 | |
Notre Dame Intermedica Participacoes SA | | | 10,588 | | | | 180,612 | |
Petrobras Distribuidora SA | | | 2,239 | | | | 16,648 | |
| | | | | | | | |
| | | | | | | 996,067 | |
|
| Canada — 0.6% | |
Barrick Gold Corp. | | | 4,719 | | | | 87,653 | |
Constellation Software, Inc. | | | 1 | | | | 971 | |
Enbridge, Inc. | | | 22,096 | | | | 878,531 | |
Fairfax Financial Holdings Ltd. | | | 20 | | | | 9,391 | |
Imperial Oil Ltd. | | | 74 | | | | 1,958 | |
Nutrien Ltd. | | | 55 | | | | 2,633 | |
Thomson Reuters Corp. | | | 120 | | | | 8,584 | |
Wheaton Precious Metals Corp. | | | 3,374 | | | | 100,398 | |
| | | | | | | | |
| | | | | | | 1,090,119 | |
|
| Chile — 0.0% | |
Cia Cervecerias Unidas SA, ADR(a) | | | 1,822 | | | | 34,563 | |
| | | | | | | | |
|
| China — 2.4% | |
Agile Group Holdings Ltd. | | | 4,000 | | | | 6,011 | |
Agricultural Bank of China Ltd., Class H | | | 5,000 | | | | 2,201 | |
Aier Eye Hospital Group Co. Ltd., Class A | | | 5,700 | | | | 32,443 | |
Air China Ltd., Class H | | | 2,000 | | | | 2,029 | |
Alibaba Group Holding Ltd.(b) | | | 9,500 | | | | 252,608 | |
Alibaba Group Holding Ltd., ADR(b) | | | 4,977 | | | | 1,055,622 | |
Anhui Conch Cement Co. Ltd., Class A | | | 900 | | | | 7,091 | |
Anhui Conch Cement Co. Ltd., Class H | | | 1,500 | | | | 10,929 | |
ANTA Sports Products Ltd. | | | 7,000 | | | | 62,672 | |
Asymchem Laboratories Tianjin Co. Ltd., Class A | | | 1,693 | | | | 31,517 | |
Autobio Diagnostics Co. Ltd., Class A | | | 2,283 | | | | 31,658 | |
Beijing Capital International Airport Co. Ltd., Class H | | | 10,000 | | | | 9,686 | |
Beijing Enterprises Holdings Ltd. | | | 1,500 | | | | 6,883 | |
Brilliance China Automotive Holdings Ltd. | | | 22,000 | | | | 22,833 | |
CGN Power Co. Ltd., Class H(e) | | | 1,000 | | | | 267 | |
| | | | | | | | |
| Security | | Shares | | | Value | |
| | |
| China (continued) | | | | | | |
China CITIC Bank Corp. Ltd., Class H | | | 12,000 | | | $ | 7,195 | |
China Hongqiao Group Ltd. | | | 500 | | | | 302 | |
China International Travel Service Corp. Ltd., Class A | | | 2,300 | | | | 29,431 | |
China Longyuan Power Group Corp. Ltd., Class H | | | 4,000 | | | | 2,530 | |
China Mengniu Dairy Co. Ltd.(b) | | | 6,000 | | | | 24,271 | |
China Merchants Bank Co. Ltd., Class H | | | 5,500 | | | | 28,276 | |
China Mobile Ltd. | | | 1,500 | | | | 12,675 | |
China Overseas Land & Investment Ltd. | | | 22,000 | | | | 85,681 | |
China Petroleum & Chemical Corp., Class H | | | 16,000 | | | | 9,634 | |
China Resources Cement Holdings Ltd. | | | 10,000 | | | | 12,730 | |
China Resources Pharmaceutical Group Ltd.(e) | | | 2,500 | | | | 2,318 | |
China Resources Power Holdings Co. Ltd. | | | 4,000 | | | | 5,616 | |
China Taiping Insurance Holdings Co. Ltd. | | | 400 | | | | 992 | |
China Telecom Corp. Ltd., Class H | | | 2,000 | | | | 824 | |
China Unicom Hong Kong Ltd. | | | 2,000 | | | | 1,883 | |
CITIC Ltd. | | | 3,000 | | | | 4,004 | |
CNOOC Ltd. | | | 8,000 | | | | 13,303 | |
Country Garden Services Holdings Co. Ltd.(b) | | | 1,114 | | | | 3,751 | |
Dali Foods Group Co. Ltd.(e) | | | 5,500 | | | | 4,075 | |
Daqin Railway Co. Ltd., Class A | | | 500 | | | | 590 | |
Foshan Haitian Flavouring & Food Co. Ltd., Class A | | | 1,800 | | | | 27,847 | |
Fosun International Ltd. | | | 11,000 | | | | 16,045 | |
GF Securities Co. Ltd., Class H | | | 200 | | | | 244 | |
Glodon Co. Ltd., Class A | | | 5,400 | | | | 26,396 | |
Great Wall Motor Co. Ltd., Class A | | | 15,300 | | | | 19,485 | |
Gree Electric Appliances, Inc. of Zhuhai, Class A | | | 2,300 | | | | 21,704 | |
Guangzhou Automobile Group Co. Ltd., Class A | | | 11,200 | | | | 18,823 | |
Guangzhou Automobile Group Co. Ltd., Class H | | | 24,000 | | | | 29,880 | |
Guangzhou Baiyun International Airport Co. Ltd., Class A | | | 11,500 | | | | 28,892 | |
Guotai Junan Securities Co. Ltd., Class H(e) | | | 1,200 | | | | 2,126 | |
Haier Smart Home Co. Ltd., Class A | | | 8,200 | | | | 23,009 | |
Haitong Securities Co. Ltd., Class H | | | 3,600 | | | | 4,253 | |
Hangzhou Hikvision Digital Technology Co. Ltd., Class A | | | 25,700 | | | | 121,224 | |
Hangzhou Robam Appliances Co. Ltd., Class A | | | 5,000 | | | | 24,327 | |
Hangzhou Tigermed Consulting Co. Ltd., Class A | | | 3,200 | | | | 29,064 | |
Han’s Laser Technology Industry Group Co. Ltd., Class A | | | 6,200 | | | | 35,711 | |
Hengan International Group Co. Ltd. | | | 4,000 | | | | 28,492 | |
Huadian Power International Corp. Ltd., Class H | | | 2,000 | | | | 760 | |
Huazhu Group Ltd., ADR(a) | | | 836 | | | | 33,498 | |
Hundsun Technologies, Inc., Class A | | | 2,800 | | | | 31,340 | |
HUYA, Inc., ADR(b) | | | 84 | | | | 1,508 | |
Industrial & Commercial Bank of China Ltd., Class H | | | 41,000 | | | | 31,633 | |
Inner Mongolia Yili Industrial Group Co. Ltd., Class A | | | 6,699 | | | | 29,821 | |
| | | | |
CONSOLIDATED SCHEDULES OF INVESTMENTS | | | 73 | |
| | |
Consolidated Schedule of Investments (continued) December 31, 2019 | | BlackRock Global Allocation Portfolio (Percentages shown are based on Net Assets) |
| | | | | | | | |
| Security | | Shares | | | Value | |
| | |
| China (continued) | | | | | | |
Inspur Electronic Information Industry Co. Ltd., Class A | | | 7,500 | | | $ | 32,478 | |
JD.com, Inc., ADR(b) | | | 427 | | | | 15,043 | |
Jiangsu Hengrui Medicine Co. Ltd., Class A | | | 2,500 | | | | 31,471 | |
Kingdee International Software Group Co. Ltd. | | | 70,000 | | | | 70,031 | |
Kingsoft Corp. Ltd.(b) | | | 12,000 | | | | 31,121 | |
Kunlun Energy Co. Ltd. | | | 4,000 | | | | 3,534 | |
Laobaixing Pharmacy Chain JSC, Class A | | | 2,600 | | | | 23,954 | |
Lenovo Group Ltd. | | | 46,000 | | | | 30,891 | |
Li Ning Co. Ltd. | | | 11,000 | | | | 32,992 | |
Momo, Inc., ADR | | | 215 | | | | 7,202 | |
New Oriental Education & Technology Group, Inc., ADR(b) | | | 364 | | | | 44,135 | |
Ping An Insurance Group Co. of China Ltd., Class A | | | 2,300 | | | | 28,282 | |
Shanghai International Airport Co. Ltd., Class A | | | 2,200 | | | | 24,938 | |
Shanghai Jahwa United Co. Ltd., Class A | | | 5,600 | | | | 24,903 | |
Shenzhen Goodix Technology Co. Ltd., Class A | | | 100 | | | | 2,968 | |
Shenzhen Inovance Technology Co. Ltd., Class A | | | 7,300 | | | | 32,182 | |
Shenzhen MindrayBio-Medical Electronics Co. Ltd., Class A | | | 1,000 | | | | 26,174 | |
Sinopec Engineering Group Co. Ltd., Class H | | | 4,000 | | | | 2,394 | |
Sinopec Shanghai Petrochemical Co. Ltd., Class H | | | 28,000 | | | | 8,453 | |
TAL Education Group, ADR(b) | | | 775 | | | | 37,355 | |
Tencent Holdings Ltd. | | | 23,800 | | | | 1,146,593 | |
Tencent Music Entertainment Group, ADR(b) | | | 342 | | | | 4,015 | |
Tsingtao Brewery Co. Ltd., Class A | | | 300 | | | | 2,201 | |
Tsingtao Brewery Co. Ltd., Class H | | | 2,000 | | | | 13,436 | |
Venustech Group, Inc., Class A | | | 6,399 | | | | 31,108 | |
Vipshop Holdings Ltd., ADR(b) | | | 442 | | | | 6,263 | |
Want Want China Holdings Ltd. | | | 81,000 | | | | 75,659 | |
Weichai Power Co. Ltd., Class H | | | 2,000 | | | | 4,221 | |
Wuhan Raycus Fiber Laser Technologies Co. Ltd., Class A | | | 2,093 | | | | 35,462 | |
WuXi AppTec Co. Ltd., Class A | | | 2,300 | | | | 30,459 | |
Wuxi Biologics Cayman, Inc.(b)(e) | | | 2,500 | | | | 31,664 | |
Yanzhou Coal Mining Co. Ltd., Class H | | | 4,000 | | | | 3,594 | |
Yifeng Pharmacy Chain Co. Ltd., Class A | | | 2,500 | | | | 26,320 | |
Yonyou Network Technology Co. Ltd., Class A | | | 5,800 | | | | 23,725 | |
Yum China Holdings, Inc | | | 1,602 | | | | 76,912 | |
Zhejiang Expressway Co. Ltd., Class H | | | 4,000 | | | | 3,647 | |
Zhuzhou CRRC Times Electric Co. Ltd., Class H | | | 600 | | | | 2,171 | |
Zijin Mining Group Co. Ltd., Class H | | | 8,000 | | | | 3,973 | |
Zoomlion Heavy Industry Science and Technology Co. Ltd., Class H | | | 1,000 | | | | 838 | |
| | | | | | | | |
| | | | | | | 4,403,375 | |
|
| Czech Republic — 0.0% | |
CEZ A/S | | | 2,418 | | | | 54,344 | |
| | | | | | | | |
|
| Denmark — 0.1% | |
AP Moller - Maersk A/S, Class A | | | 12 | | | | 16,266 | |
AP Moller - Maersk A/S, Class B | | | 10 | | | | 14,422 | |
| | | | | | | | |
| Security | | Shares | | | Value | |
| | |
| Denmark (continued) | | | | | | |
Novo Nordisk A/S, Class B | | | 810 | | | $ | 46,939 | |
| | | | | | | | |
| | | | | | | 77,627 | |
|
| Finland — 0.0% | |
Nokia OYJ | | | 1,233 | | | | 4,561 | |
| | | | | | | | |
|
| France — 2.2% | |
BNP Paribas SA | | | 2,436 | | | | 144,791 | |
Cie de Saint-Gobain | | | 2,519 | | | | 103,193 | |
Credit Agricole SA | | | 8,174 | | | | 118,943 | |
Danone SA | | | 15,937 | | | | 1,323,503 | |
Dassault Aviation SA | | | 180 | | | | 236,230 | |
Eiffage SA | | | 642 | | | | 73,655 | |
Electricite de France SA | | | 193 | | | | 2,154 | |
EssilorLuxottica SA | | | 1,415 | | | | 216,327 | |
Kering SA | | | 15 | | | | 9,884 | |
L’Oreal SA | | | 3 | | | | 887 | |
Renault SA | | | 152 | | | | 7,218 | |
Safran SA | | | 4,953 | | | | 765,037 | |
Sanofi | | | 4,697 | | | | 471,708 | |
Schneider Electric SE | | | 6 | | | | 616 | |
Societe Generale SA | | | 3,619 | | | | 126,296 | |
Sodexo SA | | | 3,881 | | | | 459,928 | |
Vivendi SA | | | 51 | | | | 1,477 | |
| | | | | | | | |
| | | | | | | 4,061,847 | |
|
| Germany — 1.6% | |
adidas AG | | | 38 | | | | 12,353 | |
Fresenius SE & Co. KGaA | | | 7,317 | | | | 411,753 | |
HeidelbergCement AG | | | 21 | | | | 1,526 | |
Infineon Technologies AG | | | 12,930 | | | | 292,145 | |
Knorr-Bremse AG(b) | | | 5,448 | | | | 554,575 | |
SAP SE | | | 34 | | | | 4,576 | |
Siemens AG (Registered) | | | 12,062 | | | | 1,575,196 | |
Vonovia SE | | | 1,585 | | | | 85,129 | |
Wirecard AG | | | 56 | | | | 6,753 | |
| | | | | | | | |
| | | | | | | 2,944,006 | |
|
| Hong Kong — 0.6% | |
CK Infrastructure Holdings Ltd. | | | 8,500 | | | | 60,492 | |
CLP Holdings Ltd. | | | 6,000 | | | | 62,984 | |
Hang Lung Properties Ltd. | | | 33,000 | | | | 72,459 | |
HKT Trust & HKT Ltd.(f) | | | 38,000 | | | | 53,553 | |
Hongkong Land Holdings Ltd. | | | 300 | | | | 1,726 | |
Hysan Development Co. Ltd. | | | 8,000 | | | | 31,370 | |
Jardine Matheson Holdings Ltd. | | | 1,700 | | | | 94,601 | |
Link REIT | | | 5,000 | | | | 52,970 | |
Power Assets Holdings Ltd. | | | 3,500 | | | | 25,605 | |
Sun Art Retail Group Ltd. | | | 4,000 | | | | 4,854 | |
Sun Hung Kai Properties Ltd. | | | 38,166 | | | | 584,508 | |
WH Group Ltd.(e) | | | 34,000 | | | | 35,155 | |
Wharf Real Estate Investment Co. Ltd. | | | 5,000 | | | | 30,508 | |
| | | | | | | | |
| | | | | | | 1,110,785 | |
|
| India — 1.0% | |
Asian Paints Ltd. | | | 2,180 | | | | 54,527 | |
Hero MotoCorp Ltd. | | | 1,638 | | | | 56,077 | |
Hindustan Petroleum Corp. Ltd. | | | 760 | | | | 2,811 | |
Hindustan Unilever Ltd. | | | 4,210 | | | | 113,455 | |
Housing Development Finance Corp. Ltd. | | | 15,439 | | | | 522,031 | |
ICICI Bank Ltd. | | | 11,034 | | | | 83,679 | |
Infosys Ltd. | | | 127 | | | | 1,308 | |
InterGlobe Aviation Ltd.(e) | | | 12 | | | | 224 | |
Larsen & Toubro Ltd. | | | 2,681 | | | | 48,769 | |
Oil & Natural Gas Corp. Ltd. | | | 15,574 | | | | 28,123 | |
Reliance Industries Ltd. | | | 41,161 | | | | 873,112 | |
| | |
| 74 | | 2019 BLACKROCK ANNUAL REPORTTO SHAREHOLDERS |
| | |
Consolidated Schedule of Investments (continued) December 31, 2019 | | BlackRock Global Allocation Portfolio (Percentages shown are based on Net Assets) |
| | | | | | | | |
| Security | | Shares | | | Value | |
| | |
| India (continued) | | | | | | |
Vedanta Ltd. | | | 4,808 | | | $ | 10,284 | |
Wipro Ltd. | | | 925 | | | | 3,185 | |
Zee Entertainment Enterprises Ltd. | | | 12,831 | | | | 52,526 | |
| | | | | | | | |
| | | | | | | 1,850,111 | |
|
| Indonesia — 0.1% | |
Bank Central Asia Tbk. PT | | | 37,200 | | | | 89,466 | |
| | | | | | | | |
|
Italy — 1.3% | |
Enel SpA | | | 120,584 | | | | 957,898 | |
Intesa Sanpaolo SpA | | | 34,925 | | | | 91,999 | |
RAI WaySpA(e) | | | 33,659 | | | | 231,486 | |
Snam SpA | | | 10,460 | | | | 54,997 | |
UniCredit SpA | | | 77,110 | | | | 1,127,115 | |
| | | | | | | | |
| | | | | | | 2,463,495 | |
|
| Japan — 3.9% | |
Aeon Co. Ltd. | | | 100 | | | | 2,064 | |
AGC, Inc. | | | 300 | | | | 10,727 | |
Ajinomoto Co., Inc. | | | 35,100 | | | | 584,321 | |
Alfresa Holdings Corp. | | | 1,700 | | | | 34,536 | |
Astellas Pharma, Inc. | | | 28,650 | | | | 489,055 | |
Canon Marketing Japan, Inc. | | | 1,500 | | | | 34,708 | |
Daikin Industries Ltd. | | | 2,100 | | | | 296,289 | |
Daiwa House Industry Co. Ltd. | | | 100 | | | | 3,096 | |
Denso Corp. | | | 5,930 | | | | 267,813 | |
Dowa Holdings Co. Ltd. | | | 800 | | | | 29,697 | |
East Japan Railway Co. | | | 7,127 | | | | 643,297 | |
FamilyMart Co. Ltd. | | | 200 | | | | 4,790 | |
FUJIFILM Holdings Corp. | | | 200 | | | | 9,551 | |
Hitachi Ltd. | | | 200 | | | | 8,439 | |
Hoya Corp. | | | 5,901 | | | | 563,322 | |
Japan Airlines Co. Ltd. | | | 24,200 | | | | 753,488 | |
Japan Aviation Electronics Industry Ltd. | | | 1,900 | | | | 38,332 | |
Kamigumi Co. Ltd. | | | 1,500 | | | | 32,973 | |
KDDI Corp. | | | 3,100 | | | | 92,493 | |
Keyence Corp. | | | 200 | | | | 70,228 | |
Kinden Corp. | | | 6,200 | | | | 96,332 | |
Kyowa Kirin Co. Ltd. | | | 100 | | | | 2,356 | |
Mabuchi Motor Co. Ltd. | | | 1,100 | | | | 41,531 | |
Maeda Road Construction Co. Ltd. | | | 1,600 | | | | 39,062 | |
Medipal Holdings Corp. | | | 2,000 | | | | 44,141 | |
Mitsubishi Estate Co. Ltd. | | | 5,300 | | | | 101,415 | |
Mitsubishi Heavy Industries Ltd. | | | 400 | | | | 15,511 | |
Murata Manufacturing Co. Ltd. | | | 7,620 | | | | 469,000 | |
NEC Corp. | | | 200 | | | | 8,277 | |
Nippo Corp. | | | 1,400 | | | | 30,083 | |
Nippon Telegraph & Telephone Corp. | | | 3,240 | | | | 81,887 | |
Nissan Motor Co. Ltd. | | | 100 | | | | 580 | |
NTT Data Corp. | | | 100 | | | | 1,337 | |
Okumura Corp. | | | 1,854 | | | | 50,970 | |
Olympus Corp. | | | 100 | | | | 1,541 | |
Otsuka Holdings Co. Ltd. | | | 300 | | | | 13,372 | |
Recruit Holdings Co. Ltd. | | | 100 | | | | 3,746 | |
Seino Holdings Co. Ltd. | | | 2,100 | | | | 28,372 | |
Sekisui House Ltd. | | | 300 | | | | 6,406 | |
Seven & i Holdings Co. Ltd. | | | 800 | | | | 29,324 | |
Shin-Etsu Chemical Co. Ltd. | | | 5,320 | | | | 585,057 | |
Sompo Holdings, Inc. | | | 100 | | | | 3,927 | |
Stanley Electric Co. Ltd. | | | 1,000 | | | | 28,881 | |
Subaru Corp. | | | 14,760 | | | | 365,603 | |
Suzuken Co. Ltd. | | | 800 | | | | 32,606 | |
Suzuki Motor Corp. | | | 11,861 | | | | 495,101 | |
Toagosei Co. Ltd. | | | 5,700 | | | | 65,716 | |
Toda Corp. | | | 7,900 | | | | 52,146 | |
Tokyo Gas Co. Ltd. | | | 7,016 | | | | 170,481 | |
| | | | | | | | |
| Security | | Shares | | | Value | |
| | |
| Japan (continued) | | | | | | |
Tokyo Steel Manufacturing Co. Ltd. | | | 7,500 | | | $ | 54,200 | |
Toyota Industries Corp. | | | 5,514 | | | | 317,276 | |
TV Asahi Holdings Corp. | | | 2,500 | | | | 46,162 | |
Yamato Kogyo Co. Ltd. | | | 900 | | | | 22,535 | |
Z Holdings Corp. | | | 1,000 | | | | 4,222 | |
| | | | | | | | |
| | | | | | | 7,278,375 | |
|
| Malaysia — 0.0% | |
Malaysia Airports Holdings Bhd | | | 12,900 | | | | 23,975 | |
| | | | | | | | |
|
| Mexico — 0.0% | |
America Movil SAB de CV | | | 9,439 | | | | 7,598 | |
| | | | | | | | |
|
| Netherlands — 2.0% | |
ABN AMRO Group NV, CVA(e) | | | 25,818 | | | | 470,568 | |
Adyen NV(b)(e) | | | 157 | | | | 129,148 | |
ASML Holding NV | | | 1,495 | | | | 442,605 | |
ING Groep NV | | | 68,998 | | | | 829,522 | |
Koninklijke Ahold Delhaize NV | | | 381 | | | | 9,553 | |
Koninklijke Philips NV | | | 23,902 | | | | 1,168,418 | |
NXP Semiconductors NV | | | 2,059 | | | | 262,028 | |
Royal Dutch Shell plc, Class A | | | 4,444 | | | | 131,100 | |
Royal Dutch Shell plc, Class B | | | 368 | | | | 10,924 | |
Royal Dutch Shell plc, ADR, Class A(a) | | | 3,626 | | | | 213,861 | |
| | | | | | | | |
| | | | | | | 3,667,727 | |
|
| Poland — 0.0% | |
Polski Koncern Naftowy ORLEN SA | | | 25 | | | | 566 | |
| | | | | | | | |
|
| Portugal — 0.0% | |
Jeronimo Martins SGPS SA | | | 3,305 | | | | 54,464 | |
| | | | | | | | |
|
| Singapore — 0.5% | |
CapitaLand Ltd. | | | 247,200 | | | | 689,816 | |
ComfortDelGro Corp. Ltd. | | | 32,100 | | | | 56,798 | |
DBS Group Holdings Ltd. | | | 1,500 | | | | 28,922 | |
Singapore Telecommunications Ltd. | | | 22,700 | | | | 56,912 | |
United Overseas Bank Ltd. | | | 5,900 | | | | 116,033 | |
| | | | | | | | |
| | | | | | | 948,481 | |
|
| South Africa — 0.0% | |
Aspen Pharmacare Holdings Ltd. | | | 993 | | | | 8,469 | |
Discovery Ltd. | | | 56 | | | | 482 | |
Kumba Iron Ore Ltd. | | | 222 | | | | 6,605 | |
MTN Group Ltd. | | | 198 | | | | 1,167 | |
Old Mutual Ltd. | | | 5,609 | | | | 7,873 | |
| | | | | | | | |
| | | | | | | 24,596 | |
|
| South Korea — 0.3% | |
Hana Financial Group, Inc. | | | 335 | | | | 10,656 | |
Hyundai Mobis Co. Ltd. | | | 24 | | | | 5,310 | |
Industrial Bank of Korea | | | 47 | | | | 479 | |
Kakao Corp. | | | 252 | | | | 33,376 | |
KB Financial Group, Inc. | | | 213 | | | | 8,775 | |
Kia Motors Corp. | | | 44 | | | | 1,680 | |
KT&G Corp. | | | 1,958 | | | | 158,417 | |
LG Chem Ltd. | | | 219 | | | | 60,018 | |
LG Electronics, Inc. | | | 266 | | | | 16,523 | |
LG Uplus Corp. | | | 844 | | | | 10,352 | |
NCSoft Corp. | | | 153 | | | | 71,391 | |
POSCO | | | 311 | | | | 63,215 | |
Samsung SDI Co. Ltd. | | | 8 | | | | 1,630 | |
Shinhan Financial Group Co. Ltd. | | | 422 | | | | 15,822 | |
SK Telecom Co. Ltd. | | | 216 | | | | 44,506 | |
S-Oil Corp. | | | 363 | | | | 29,814 | |
Woongjin Coway Co. Ltd. | | | 603 | | | | 48,544 | |
| | | | | | | | |
| | | | | | | 580,508 | |
| | | | |
CONSOLIDATED SCHEDULES OF INVESTMENTS | | | 75 | |
| | |
Consolidated Schedule of Investments (continued) December 31, 2019 | | BlackRock Global Allocation Portfolio (Percentages shown are based on Net Assets) |
| | | | | | | | |
| Security | | Shares | | | Value | |
| | |
| Spain— 0.4% | | | | | | |
Cellnex Telecom SA(b)(e) | | | 18,085 | | | $ | 780,108 | |
Repsol SA | | | 725 | | | | 11,390 | |
Telefonica SA | | | 1,429 | | | | 9,993 | |
| | | | | | | | |
| | | | | | | 801,491 | |
| | |
| Sweden— 0.0% | | | | | | |
Assa Abloy AB, Class B | | | 257 | | | | 6,008 | |
Atlas Copco AB, Class B | | | 157 | | | | 5,451 | |
Hennes & Mauritz AB, Class B | | | 554 | | | | 11,300 | |
Telefonaktiebolaget LM Ericsson, Class B | | | 1,051 | | | | 9,183 | |
| | | | | | | | |
| | | | | | | 31,942 | |
| | |
| Switzerland— 1.1% | | | | | | |
Cie Financiere Richemont SA (Registered) | | | 658 | | | | 51,423 | |
Glencore plc(b) | | | 115 | | | | 358 | |
LafargeHolcim Ltd. (Registered)(b) | | | 286 | | | | 15,867 | |
Nestle SA (Registered) | | | 10,607 | | | | 1,148,370 | |
Novartis AG (Registered) | | | 52 | | | | 4,924 | |
Roche Holding AG | | | 2,295 | | | | 745,881 | |
| | | | | | | | |
| | | | | | | 1,966,823 | |
| | |
| Taiwan— 1.1% | | | | | | |
Cathay Financial Holding Co. Ltd. | | | 42,000 | | | | 59,634 | |
Chunghwa Telecom Co. Ltd. | | | 14,000 | | | | 51,358 | |
Far EasTone Telecommunications Co. Ltd. | | | 16,000 | | | | 38,482 | |
Formosa Chemicals & Fibre Corp. | | | 14,000 | | | | 40,902 | |
Formosa Petrochemical Corp. | | | 11,000 | | | | 35,777 | |
Formosa Plastics Corp. | | | 15,000 | | | | 49,956 | |
Fubon Financial Holding Co. Ltd. | | | 50,000 | | | | 77,432 | |
Hon Hai Precision Industry Co. Ltd.(b) | | | 30,760 | | | | 93,311 | |
MediaTek, Inc. | | | 1,000 | | | | 14,817 | |
Nan Ya Plastics Corp. | | | 18,000 | | | | 43,743 | |
Taiwan Mobile Co. Ltd. | | | 15,000 | | | | 56,043 | |
Taiwan Semiconductor Manufacturing Co. Ltd. | | | 131,000 | | | | 1,449,886 | |
Uni-President Enterprises Corp. | | | 30,000 | | | | 74,395 | |
Yageo Corp. | | | 2,000 | | | | 29,138 | |
| | | | | | | | |
| | | | | | | 2,114,874 | |
| | |
| Thailand— 0.2% | | | | | | |
Advanced Info Service PCL | | | 11,500 | | | | 81,660 | |
Intouch Holdings PCL, Class F | | | 34,500 | | | | 65,871 | |
PTT Global Chemical PCL | | | 30,500 | | | | 57,953 | |
Siam Cement PCL (The) | | | 4,000 | | | | 52,281 | |
Thai Beverage PCL | | | 41,200 | | | | 27,280 | |
Thai Oil PCL | | | 18,200 | | | | 42,305 | |
| | | | | | | | |
| | | | | | | 327,350 | |
| | |
| Turkey— 0.0% | | | | | | |
BIM Birlesik Magazalar A/S | | | 212 | | | | 1,663 | |
Tupras Turkiye Petrol Rafinerileri A/S | | | 158 | | | | 3,366 | |
| | | | | | | | |
| | | | | | | 5,029 | |
| | |
| United Arab Emirates— 0.1% | | | | | | |
NMC Health plc | | | 8,466 | | | | 198,353 | |
| | | | | | | | |
| | |
| United Kingdom— 1.4% | | | | | | |
AstraZeneca plc | | | 3,669 | | | | 367,237 | |
Berkeley Group Holdings plc | | | 1,487 | | | | 95,707 | |
Coca-Cola European Partners plc | | | 147 | | | | 7,479 | |
Fiat Chrysler Automobiles NV(b) | | | 990 | | | | 14,678 | |
GlaxoSmithKline plc | | | 229 | | | | 5,381 | |
HSBC Holdings plc | | | 68,303 | | | | 534,706 | |
| | | | | | | | |
| Security | | Shares | | | Value | |
| | |
| United Kingdom (continued) | | | | | | |
Hut Group (The) (Acquired 12/03/19,
cost $187,164)(b)(c)(d) | | | 288 | | | $ | 190,743 | |
RELX plc | | | 393 | | | | 9,921 | |
Rolls-Royce Holdings plc(b) | | | 765 | | | | 6,914 | |
Vodafone Group plc | | | 649,647 | | | | 1,261,208 | |
| | | | | | | | |
| | | | | | | 2,493,974 | |
| | |
| United States— 37.4% | | | | | | |
Abbott Laboratories | | | 3,674 | | | | 319,124 | |
AbbVie, Inc. | | | 7,547 | | | | 668,211 | |
Accenture plc, Class A | | | 886 | | | | 186,565 | |
Adobe, Inc.(b) | | | 1,093 | | | | 360,482 | |
AES Corp. | | | 733 | | | | 14,587 | |
Agilent Technologies, Inc. | | | 8,660 | | | | 738,785 | |
Air Products & Chemicals, Inc. | | | 5,147 | | | | 1,209,494 | |
Alexion Pharmaceuticals, Inc.(b) | | | 47 | | | | 5,083 | |
Ally Financial, Inc. | | | 336 | | | | 10,268 | |
Alphabet, Inc., Class C(b) | | | 2,182 | | | | 2,917,378 | |
Altria Group, Inc. | | | 333 | | | | 16,620 | |
Amazon.com, Inc.(b) | | | 1,466 | | | | 2,708,933 | |
American Tower Corp. | | | 463 | | | | 106,407 | |
Ameriprise Financial, Inc. | | | 124 | | | | 20,656 | |
Amgen, Inc. | | | 149 | | | | 35,919 | |
Anthem, Inc. | | | 5,201 | | | | 1,570,858 | |
Apple, Inc. | | | 9,563 | | | | 2,808,175 | |
Applied Materials, Inc. | | | 6,355 | | | | 387,909 | |
Autodesk, Inc.(b) | | | 4,783 | | | | 877,489 | |
AutoZone, Inc.(b) | | | 22 | | | | 26,209 | |
Bank of America Corp. | | | 43,921 | | | | 1,546,898 | |
Bank of New York Mellon Corp. (The) | | | 23 | | | | 1,158 | |
Baxter International, Inc. | | | 835 | | | | 69,823 | |
Becton Dickinson and Co. | | | 3,639 | | | | 989,699 | |
Berkshire Hathaway,Inc., Class B(b) | | | 973 | | | | 220,385 | |
Biogen, Inc.(b) | | | 35 | | | | 10,386 | |
Booking Holdings, Inc.(b) | | | 8 | | | | 16,430 | |
Bristol-Myers Squibb Co. | | | 10,276 | | | | 659,616 | |
Broadcom, Inc. | | | 1 | | | | 316 | |
Capital One Financial Corp. | | | 128 | | | | 13,173 | |
Cardinal Health, Inc. | | | 91 | | | | 4,603 | |
Centene Corp.(b) | | | 12 | | | | 754 | |
Cerner Corp. | | | 155 | | | | 11,375 | |
CH Robinson Worldwide, Inc. | | | 1,034 | | | | 80,859 | |
Charles Schwab Corp. (The) | | | 9,511 | | | | 452,343 | |
Charter Communications, Inc., Class A(b) | | | 2,263 | | | | 1,097,736 | |
Chevron Corp. | | | 136 | | | | 16,389 | |
Chubb Ltd. | | | 4,095 | | | | 637,428 | |
Cigna Corp. | | | 40 | | | | 8,180 | |
Cintas Corp. | | | 58 | | | | 15,607 | |
Cisco Systems, Inc. | | | 5,026 | | | | 241,047 | |
Citigroup, Inc. | | | 9,743 | | | | 778,368 | |
Citrix Systems, Inc. | | | 4,218 | | | | 467,776 | |
Colgate-Palmolive Co. | | | 15,693 | | | | 1,080,306 | |
Comcast Corp., Class A(g) | | | 41,938 | | | | 1,885,952 | |
ConocoPhillips | | | 202 | | | | 13,136 | |
Corning, Inc. | | | 2,743 | | | | 79,849 | |
Costco Wholesale Corp. | | | 77 | | | | 22,632 | |
CSX Corp. | | | 312 | | | | 22,576 | |
Cummins, Inc. | | | 87 | | | | 15,570 | |
Dell Technologies, Inc., Class C(b) | | | 159 | | | | 8,171 | |
Delta Air Lines, Inc. | | | 341 | | | | 19,942 | |
Discover Financial Services | | | 212 | | | | 17,982 | |
Dollar Tree, Inc.(b) | | | 2,662 | | | | 250,361 | |
Dover Corp. | | | 3,254 | | | | 375,056 | |
Dow, Inc. | | | 3,380 | | | | 184,987 | |
| | |
| 76 | | 2019 BLACKROCK ANNUAL REPORTTO SHAREHOLDERS |
| | |
Consolidated Schedule of Investments (continued) December 31, 2019 | | BlackRock Global Allocation Portfolio (Percentages shown are based on Net Assets) |
| | | | | | | | |
| Security | | Shares | | | Value | |
| | |
| United States (continued) | | | | | | |
DR Horton, Inc. | | | 12,548 | | | $ | 661,907 | |
Dropbox, Inc., Class A(b) | | | 15,289 | | | | 273,826 | |
DuPont de Nemours, Inc. | | | 9,211 | | | | 591,346 | |
Eaton Corp. plc | | | 58 | | | | 5,494 | |
eBay,Inc. | | | 481 | | | | 17,369 | |
Edwards Lifesciences Corp.(b) | | | 139 | | | | 32,427 | |
Emerson Electric Co. | | | 16,886 | | | | 1,287,726 | |
EOG Resources, Inc. | | | 31 | | | | 2,597 | |
Estee Lauder Cos., Inc. (The), Class A | | | 45 | | | | 9,294 | |
Exelon Corp. | | | 1,791 | | | | 81,652 | |
Expedia Group, Inc. | | | 151 | | | | 16,329 | |
Exxon Mobil Corp. | | | 877 | | | | 61,197 | |
Facebook, Inc., Class A(b) | | | 5,377 | | | | 1,103,629 | |
Ferguson plc | | | 5,460 | | | | 496,898 | |
Fieldwood Energy,Inc.(b) | | | 2,201 | | | | 39,986 | |
Fifth Third BanCorp. | | | 620 | | | | 19,059 | |
FleetCor Technologies, Inc.(b) | | | 3,605 | | | | 1,037,231 | |
Ford Motor Co. | | | 489 | | | | 4,548 | |
Fortune Brands Home &Security,Inc. | | | 893 | | | | 58,349 | |
Franklin Resources, Inc.(a) | | | 330 | | | | 8,573 | |
General Electric Co. | | | 695 | | | | 7,756 | |
General Motors Co. | | | 289 | | | | 10,577 | |
Gilead Sciences, Inc. | | | 9,437 | | | | 613,216 | |
Global Payments, Inc. | | | 431 | | | | 78,683 | |
Goldman Sachs Group, Inc. (The) | | | 57 | | | | 13,106 | |
Hartford Financial Services Group, Inc. (The) | | | 1,864 | | | | 113,275 | |
HCA Healthcare, Inc. | | | 5,199 | | | | 768,464 | |
Hess Corp. | | | 2,360 | | | | 157,672 | |
Hewlett Packard Enterprise Co. | | | 851 | | | | 13,497 | |
Home Depot, Inc. (The) | | | 3,795 | | | | 828,752 | |
Honeywell International, Inc. | | | 112 | | | | 19,824 | |
HP, Inc. | | | 390 | | | | 8,015 | |
Humana, Inc. | | | 5 | | | | 1,833 | |
Huntsman Corp. | | | 372 | | | | 8,988 | |
iHeartMedia, Inc., Class B(b) | | | 74 | | | | 1,251 | |
Incyte Corp.(b) | | | 35 | | | | 3,056 | |
Intel Corp. | | | 634 | | | | 37,945 | |
Intuit, Inc. | | | 798 | | | | 209,020 | |
Intuitive Surgical, Inc.(b) | | | 28 | | | | 16,552 | |
Jawbone Health Hub, Inc. (Acquired 01/24/17,
cost $0)(b)(c)(d) | | | 6,968 | | | | — | |
JBS SA | | | 6,831 | | | | 43,811 | |
Johnson & Johnson(a) | | | 8,815 | | | | 1,285,844 | |
JPMorgan Chase &Co.(g) | | | 12,237 | | | | 1,705,838 | |
KLA Corp. | | | 157 | | | | 27,973 | |
Kroger Co. (The) | | | 567 | | | | 16,437 | |
L3Harris Technologies, Inc. | | | 25 | | | | 4,947 | |
Lam Research Corp. | | | 51 | | | | 14,912 | |
Lear Corp. | | | 69 | | | | 9,467 | |
Lennar Corp., Class A(a) | | | 10,294 | | | | 574,302 | |
Liberty Broadband Corp., Class C(b) | | | 2,831 | | | | 355,998 | |
Liberty Media Corp.-Liberty SiriusXM, Class A(b) | | | 3,751 | | | | 181,323 | |
Liberty Media Corp.-Liberty SiriusXM, Class C(b) | | | 6,286 | | | | 302,608 | |
Lockheed Martin Corp. | | | 18 | | | | 7,009 | |
Lookout, Inc. (Acquired 03/04/15,
cost $16,643)(b)(c)(d) | | | 1,457 | | | | 889 | |
Lowe’s Cos., Inc. | | | 6,144 | | | | 735,805 | |
LyondellBasell Industries NV, Class A | | | 2,741 | | | | 258,970 | |
Marathon Petroleum Corp. | |
| 4,151
|
| |
| 250,098
|
|
Marsh & McLennan Cos., Inc. | | | 9,645 | | | | 1,074,549 | |
Marvell Technology Group Ltd.(a) | | | 5,235 | | | | 139,042 | |
Masco Corp. | | | 2,393 | | | | 114,840 | |
| | | | | | | | |
| Security | | Shares | | | Value | |
| | |
| United States (continued) | | | | | | |
Mastercard, Inc., Class A | | | 1,063 | | | $ | 317,401 | |
McDonald’s Corp. | | | 4,261 | | | | 842,016 | |
McKesson Corp. | | | 112 | | | | 15,492 | |
Medtronic plc | | | 631 | | | | 71,587 | |
Merck & Co., Inc.(a) | | | 12,015 | | | | 1,092,764 | |
Micron Technology, Inc.(b) | | | 4,458 | | | | 239,751 | |
Microsoft Corp. | | | 20,038 | | | | 3,159,993 | |
Mondelez International, Inc., Class A. | | | 1,454 | | | | 80,086 | |
Monster Beverage Corp.(b) | | | 139 | | | | 8,833 | |
Morgan Stanley | | | 19,671 | | | | 1,005,582 | |
Motorola Solutions, Inc. | | | 880 | | | | 141,803 | |
Newmont GoldCorp Corp. | | | 13,327 | | | | 579,058 | |
NextEra Energy,Inc. | | | 4,837 | | | | 1,171,328 | |
NIKE, Inc., Class B | | | 197 | | | | 19,958 | |
Northrop Grumman Corp. | | | 33 | | | | 11,351 | |
NVIDIA Corp. | | | 1,596 | | | | 375,539 | |
Omnicom Group, Inc. | | | 653 | | | | 52,906 | |
ONEOK, Inc. | | | 15,405 | | | | 1,165,696 | |
Oracle Corp. | | | 8,238 | | | | 436,449 | |
Packaging Corp. of America | | | 107 | | | | 11,983 | |
PayPal Holdings, Inc.(b) | | | 2,002 | | | | 216,556 | |
Peloton Interactive, Inc., Class A(a)(b) | | | 2,568 | | | | 72,931 | |
PepsiCo, Inc. | | | 994 | | | | 135,850 | |
Pfizer, Inc. | | | 23,725 | | | | 929,546 | |
Philip Morris International, Inc. | | | 509 | | | | 43,311 | |
Phillips 66 | | | 151 | | | | 16,823 | |
Pioneer Natural Resources Co. | | | 1,054 | | | | 159,544 | |
PPG Industries, Inc. | | | 4,228 | | | | 564,396 | |
Procter &Gamble Co. (The) | | | 424 | | | | 52,958 | |
Progressive Corp. (The) | | | 16 | | | | 1,158 | |
Prudential Financial, Inc. | | | 134 | | | | 12,561 | |
PTC, Inc.(b) | | | 829 | | | | 62,084 | |
QUALCOMM, Inc. | | | 2,869 | | | | 253,132 | |
Raytheon Co. | | | 7,726 | | | | 1,697,711 | |
Regeneron Pharmaceuticals, Inc.(b) | | | 10 | | | | 3,755 | |
Regions Financial Corp. | | | 19,158 | | | | 328,751 | |
Reinsurance Group of America, Inc. | | | 124 | | | | 20,219 | |
Rockwell Automation, Inc. | | | 66 | | | | 13,376 | |
Ross Stores, Inc. | | | 183 | | | | 21,305 | |
Royal Caribbean Cruises Ltd. | | | 2,524 | | | | 336,979 | |
salesforce.com, Inc.(b) | | | 4,817 | | | | 783,437 | |
Schlumberger Ltd | | | 1,217 | | | | 48,923 | |
ServiceNow,Inc.(b) | | | 1,176 | | | | 332,008 | |
Simply Good Foods Co. (The)(b) | | | 1,887 | | | | 53,855 | |
Square, Inc., Class A(b) | | | 26 | | | | 1,627 | |
Starbucks Corp. | | | 227 | | | | 19,958 | |
Stryker Corp. | | | 468 | | | | 98,252 | |
Sysco Corp. | | | 149 | | | | 12,745 | |
Target Corp. | | | 3,527 | | | | 452,197 | |
Tesla, Inc.(b) | | | 257 | | | | 107,511 | |
Texas Instruments, Inc. | | | 2,653 | | | | 340,353 | |
Thermo Fisher Scientific, Inc. | | | 1,578 | | | | 512,645 | |
TJX Cos., Inc. (The) | | | 11,023 | | | | 673,064 | |
Travelers Cos., Inc. (The) | | | 654 | | | | 89,565 | |
Truist Financial Corp. | | | 13,657 | | | | 769,162 | |
Uber Technologies, Inc.(b) | | | 24,997 | | | | 743,411 | |
Union Pacific Corp. | | | 4,682 | | | | 846,459 | |
United Airlines Holdings, Inc.(b) | | | 232 | | | | 20,437 | |
United Parcel Service, Inc., Class B | | | 56 | | | | 6,555 | |
United Rentals, Inc.(b) | | | 47 | | | | 7,838 | |
United Technologies Corp. | | | 7,270 | | | | 1,088,755 | |
UnitedHealth Group, Inc.(a) | | | 5,829 | | | | 1,713,609 | |
US BanCorp. | | | 2,435 | | | | 144,371 | |
Valero Energy Corp. | | | 158 | | | | 14,797 | |
VeriSign, Inc.(b) | | | 126 | | | | 24,278 | |
| | | | |
| CONSOLIDATED SCHEDULES OF INVESTMENTS | | | 77 | |
| | |
Consolidated Schedule of Investments (continued) December 31, 2019 | | BlackRock Global Allocation Portfolio (Percentages shown are based on Net Assets) |
| | | | | | | | |
Security | | Shares | | | Value | |
| | |
| United States (continued) | | | | | | |
Verizon Communications, Inc. | | | 1,625 | | | $ | 99,775 | |
Visa, Inc., Class A | | | 1,776 | | | | 333,710 | |
Vistra Energy Corp. | | | 3,816 | | | | 87,730 | |
VMware, Inc., Class A | | | 103 | | | | 15,634 | |
Walmart, Inc. | | | 7,753 | | | | 921,367 | |
Walt Disney Co. (The) | | | 176 | | | | 25,455 | |
Wells Fargo &Co. | | | 1,789 | | | | 96,248 | |
Western Digital Corp. | | | 201 | | | | 12,757 | |
Weyerhaeuser Co. | | | 4,222 | | | | 127,504 | |
Williams Cos., Inc. (The) | | | 26,185 | | | | 621,108 | |
Willis Towers Watson plc | | | 23 | | | | 4,645 | |
Workday, Inc., Class A(b) | | | 1 | | | | 164 | |
Wyndham Destinations, Inc. | | | 288 | | | | 14,887 | |
Xcel Energy,Inc. | | | 170 | | | | 10,793 | |
Xilinx, Inc. | | | 2,849 | | | | 278,547 | |
Yum! Brands, Inc. | | | 171 | | | | 17,225 | |
Zoetis, Inc. | | | 139 | | | | 18,397 | |
| | | | | | | | |
| | | | | | | 69,465,882 | |
| | | | | | | | |
| |
Total Common Stocks — 59.1%
(Cost: $92,313,214) | | | | 109,664,180 | |
| | | | | | | | |
| | | Par
(000) | | | | |
|
Corporate Bonds — 3.7% | |
|
| Australia — 0.4% | |
Quintis Australia Pty. Ltd.(d)(e)(h): | | | | | | | | |
7.50%, (7.50% Cash or 8.00% PIK), 10/01/26 | | USD | 380 | | | | 372,571 | |
12.00%, (0.00% Cash or 0.00% PIK), 10/01/28 | | | 414 | | | | 414,143 | |
| | | | | | | | |
| | | | | | | 786,714 | |
|
| Chile — 0.0% | |
Inversiones Alsacia SA,
8.00%, 12/31/18(b)(e)(i) | | | 2 | | | | 72 | |
| | | | | | | | |
|
| China — 0.0% | |
China Milk Products Group Ltd., 0.00%, 01/05/12(b)(i)(j)(k) | | | 300 | | | | 300 | |
| | | | | | | | |
|
| France — 0.1% | |
Danone SA, 2.59%, 11/02/23(e) | | | 200 | | | | 203,171 | |
| | | | | | | | |
|
| Greece — 0.1% | |
Ellaktor Value plc, 6.38%, 12/15/24(e) | | EUR | 135 | | | | 156,760 | |
| | | | | | | | |
|
| India — 0.0% | |
REI Agro Ltd.(b)(i)(j): | | | | | | | | |
5.50%, 11/13/14(e) | | USD | 220 | | | | 2 | |
5.50%, 11/13/14(d) | | | 152 | | | | — | |
| | | | | | | | |
| | | | | | | 2 | |
|
| Japan — 0.2% | |
Mitsubishi UFJ Financial Group, Inc., 3.78%, 03/02/25 | | | 53 | | | | 56,624 | |
Sumitomo Mitsui Financial Group, Inc., 3.94%, 10/16/23 | | | 273 | | | | 289,649 | |
| | | | | | | | |
| | | | | | | 346,273 | |
|
| Luxembourg — 0.0% | |
Intelsat Jackson Holdings SA, 8.00%, 02/15/24(e) | | | 37 | | | | 37,971 | |
| | | | | | | | |
|
| Netherlands — 0.1% | |
ING Groep NV,4.10%, 10/02/23 | | | 200 | | | | 212,661 | |
| | | | | | | | |
| | | | | | | | |
Security | | Par (000) | | | Value | |
|
| Turkey — 0.1% | |
Bio City Development Co. BV, 8.00%, 07/06/20(b)(d)(e)(i)(j) | | USD | 800 | | | $ | 106,000 | |
| | | | | | | | |
|
| United States — 2.7% | |
Allergan Funding SCS, 3.45%, 03/15/22 | | | 123 | | | | 125,825 | |
Allergan Sales LLC, 5.00%, 12/15/21(e) | | | 63 | | | | 65,894 | |
Apple, Inc.: | | | | | | | | |
3.35%, 02/09/27 | | | 218 | | | | 232,210 | |
3.20%, 05/11/27 | | | 174 | | | | 183,607 | |
AvalonBay Communities, Inc., 3.50%, 11/15/24 | | | 22 | | | | 23,250 | |
Bank of America Corp.: | | | | | | | | |
4.13%, 01/22/24 | | | 157 | | | | 168,765 | |
4.00%, 01/22/25 | | | 63 | | | | 67,202 | |
Becton Dickinson and Co.: | | | | | | | | |
3.13%, 11/08/21 | | | 115 | | | | 117,234 | |
2.89%, 06/06/22 | | | 136 | | | | 138,265 | |
BP Capital Markets America, Inc., 3.79%, 02/06/24 | | | 104 | | | | 110,686 | |
Broadcom, Inc., 3.13%, 04/15/21(e) | | | 200 | | | | 202,428 | |
Capital One Financial Corp.: | | | | | | | | |
3.20%, 01/30/23 | | | 85 | | | | 87,396 | |
3.30%, 10/30/24 | | | 61 | | | | 63,531 | |
Cigna Corp.: | | | | | | | | |
3.40%, 09/17/21 | | | 161 | | | | 164,809 | |
3.75%, 07/15/23 | | | 137 | | | | 143,685 | |
Citigroup, Inc., (LIBOR USD 3 Month + 0.90%), 3.35%, 04/24/25(l) | | | 204 | | | | 212,324 | |
Comcast Corp., 3.70%, 04/15/24 | | | 248 | | | | 264,515 | |
CVS Health Corp., 3.70%, 03/09/23 | | | 274 | | | | 285,600 | |
Energy Transfer Operating LP, 4.05%, 03/15/25 | | | 40 | | | | 42,055 | |
Enterprise Products Operating LLC: | | | | | |
3.35%, 03/15/23 | | | 107 | | | | 110,707 | |
3.90%, 02/15/24 | | | 25 | | | | 26,530 | |
Frontier Communications Corp., 8.00%, 04/01/27(e) | | | 33 | | | | 34,485 | |
Goldman Sachs Group, Inc. (The): | | | | | | | | |
(LIBOR USD 3 Month + 1.05%), 2.91%, 06/05/23(l) | | | 119 | | | | 120,962 | |
3.63%, 02/20/24 | | | 138 | | | | 144,865 | |
Home Depot, Inc. (The), 2.95%, 06/15/29 | | | 23 | | | | 23,932 | |
Hughes Satellite Systems Corp., 7.63%, 06/15/21 | | | 21 | | | | 22,437 | |
iHeartCommunications, Inc.: | | | | | | | | |
6.38%, 05/01/26 | | | 106 | | | | 115,441 | |
8.38%, 05/01/27 | | | 38 | | | | 41,720 | |
JPMorgan Chase & Co., (LIBOR USD 3 Month + 1.00%), 4.02%, 12/05/24(l) | | | 158 | | | | 168,503 | |
Marsh &McLennan Cos., Inc., 4.38%, 03/15/29 | | | 30 | | | | 34,204 | |
McDonald’s Corp., 3.35%, 04/01/23 | | | 74 | | | | 77,079 | |
Morgan Stanley: | | | | | | | | |
Series F, 3.88%, 04/29/24 | | | 92 | | | | 97,803 | |
(SOFR +1.15%), 2.72%, 07/22/25(l) | | | 110 | | | | 111,391 | |
NextEra Energy Capital Holdings, Inc., 2.90%, 04/01/22 | | | 81 | | | | 82,670 | |
ONEOK Partners LP, 4.90%, 03/15/25 | | | 87 | | | | 95,824 | |
ONEOK, Inc., 2.75%, 09/01/24 | | | 52 | | | | 52,494 | |
PayPal Holdings, Inc., 2.65%, 10/01/26 | | | 30 | | | | 30,421 | |
QUALCOMM, Inc., 2.90%, 05/20/24 | | | 154 | | | | 159,258 | |
TransDigm, Inc., 6.25%, 03/15/26(e) | | | 321 | | | | 347,518 | |
Verizon Communications, Inc., 3.50%, 11/01/24 132 | | | | 139,982 | |
| | |
| 78 | | 2019 BLACKROCK ANNUAL REPORTTO SHAREHOLDERS |
| | |
Consolidated Schedule of Investments (continued) December 31, 2019 | | BlackRock Global Allocation Portfolio (Percentages shown are based on Net Assets) |
| | | | | | | | |
| Security | | Par
(000) | | | Value | |
| | |
| United States (continued) | | | | | | |
Vistra Operations Co. LLC, 5.63%, 02/15/27(e) | | USD | 110 | | | $ | 115,913 | |
Walgreen Co., 3.10%, 09/15/22 | | | 63 | | | | 64,316 | |
Wells Fargo & Co.: | | | | | | | | |
3.07%, 01/24/23 | | | 25 | | | | 25,516 | |
3.75%, 01/24/24 | | | 80 | | | | 84,586 | |
Williams Cos., Inc. (The), 3.70%, 01/15/23 | | | 71 | | | | 73,539 | |
| | | | | | | | |
| | | | | | | 5,101,377 | |
| | | | | | | | |
| | |
Total Corporate Bonds — 3.7%
(Cost: $8,096,817) | | | | | | | 6,951,301 | |
| | | | | | | | |
|
Floating Rate Loan Interests — 0.5%(m) | |
| | |
| France — 0.1% | | | | | | |
Casino, Guichard-Perrachon SA,
Term Loan B, (EURIBOR 3 Month + 5.50%),
5.50%, 01/31/24 | | EUR | 185 | | | | 209,253 | |
| | | | | | | | |
| | |
| Netherlands — 0.2% | | | | | | |
Ziggo BV,Term Loan, (EURIBOR 6 Month +3.00%), 3.00%, 01/31/29 | | | 325 | | | | 364,443 | |
| | | | | | | | |
| | |
| United States — 0.2% | | | | | | |
Fieldwood Energy LLC, 2nd Lien Term Loan, (LIBOR USD 3 Month + 7.25%), 9.18%, 04/11/23 | | USD | 75 | | | | 41,716 | |
Fieldwood Energy LLC, Term Loan, (LIBOR USD 3 Month + 5.25%), 7.18%, 04/11/22 | | | 56 | | | | 46,336 | |
Hilton Worldwide Finance LLC, Term Loan B2, (LIBOR USD 1 Month + 1.75%), 3.54%, 06/22/26 | | | 166 | | | | 166,914 | |
iHeartCommunications, Inc., 1st Lien Term Loan, (LIBOR USD 1 Month + 4.00%), 5.69%, 05/01/26 | | | 59 | | | | 59,242 | |
| | | | | | | | |
| | | | | | | 314,208 | |
| | | | | | | | |
| | |
Total Floating Rate Loan Interests — 0.5%
(Cost: $870,414) | | | | | | | 887,904 | |
| | | | | | | | |
|
Foreign Government Obligations — 7.4% | |
| | |
| Argentina — 0.2% | | | | | | |
Republic of Argentina: | | | | | | | | |
3.38%, 01/15/23 | | EUR | 100 | | | | 50,477 | |
6.88%, 01/26/27 | | USD | 284 | | | | 141,556 | |
5.88%, 01/11/28 | | | 290 | | | | 136,209 | |
7.82%, 12/31/33 | | EUR | 110 | | | | 71,131 | |
| | | | | | | | |
| | | | | | | 399,373 | |
| | |
| Australia — 0.2% | | | | | | |
Commonwealth of Australia, 3.00%, 03/21/47 | | AUD | 505 | | | | 429,309 | |
| | | | | | | | |
| | |
| Brazil — 0.5% | | | | | | |
Federative Republic of Brazil, 10.00%, 01/01/23 | | BRL | 3 | | | | 899,931 | |
| | | | | | | | |
| | |
| Canada — 1.4% | | | | | | |
Canadian Government Bond: | | | | | | | | |
0.75%, 03/01/21 | | CAD | 397 | | | | 302,237 | |
1.50%, 09/01/24 | | | 2,976 | | | | 2,272,949 | |
| | | | | | | | |
| | | | | | | 2,575,186 | |
| | | | | | | | |
| Security | | Par
(000) | | | Value | |
| | |
| China — 1.7% | | | | | | |
People’s Republic of China: | | | | | | | | |
3.29%, 05/23/29 | | CNY | 22,060 | | | $ | 3,183,120 | |
| | | | | | | | |
| | |
| Indonesia — 0.2% | | | | | | |
Republic of Indonesia, 8.25%, 05/15/29 | | IDR | 4,854,000 | | | | 380,068 | |
| | | | | | | | |
| | |
| Italy — 1.3% | | | | | | |
Republic of Italy: | | | | | | | | |
3.00%, 08/01/29 | | EUR | 1,188 | | | | 1,534,732 | |
3.85%, 09/01/49(e) | | | 543 | | | | 788,218 | |
| | | | | | | | |
| | | | | | | 2,322,950 | |
| | |
| Japan — 0.4% | | | | | | |
Japan Government Thirty Year Bond, 0.40%, 09/20/49 | | JPY | 70,500 | | | | 645,657 | |
| | | | | | | | |
| | |
| Mexico — 0.2% | | | | | | |
United Mexican States: | | | | | | | | |
8.00%, 09/05/24 | | MXN | 40 | | | | 219,090 | |
10.00%, 12/05/24 | | | 37 | | | | 222,837 | |
| | | | | | | | |
| | | | | | | 441,927 | |
| | |
| Russia — 0.1% | | | | | | |
Russian Federation, 6.90%, 05/23/29 | | RUB | 11,969 | | | | 203,200 | |
| | | | | | | | |
| | |
| South Africa — 0.2% | | | | | | |
Republic of South Africa, 8.00%, 01/31/30 | | ZAR | 6,445 | | | | 429,066 | |
| | | | | | | | |
| | |
| Spain — 1.0% | | | | | | |
Kingdom of Spain(e): | | | | | | | | |
0.60%, 10/31/29 | | EUR | 1,145 | | | | 1,300,930 | |
2.70%, 10/31/48 | | | 411 | | | | 611,749 | |
| | | | | | | | |
| | | | | | | 1,912,679 | |
| | | | | | | | |
| |
Total Foreign Government Obligations — 7.4%
(Cost: $13,956,759) | | | | 13,822,466 | |
| | | | | | | | |
| | |
| | | Shares | | | | |
|
Investment Companies — 1.9% | |
Financial Select Sector SPDR Fund(a) | | | 7,554 | | | | 232,512 | |
Industrial Select Sector SPDR Fund | | | 2,761 | | | | 224,939 | |
iShares ChinaLarge-Cap ETF(a)* | | | 4,323 | | | | 188,612 | |
iShares MSCI Emerging Markets ETF(a)* | | | 10,388 | | | | 466,110 | |
iShares Russell 2000 ETF* | | | 1,800 | | | | 298,206 | |
iShares S&P 500 Value ETF* | | | 1,778 | | | | 231,300 | |
SPDR Gold Shares(n) | | | 8,555 | | | | 1,222,509 | |
SPDR S&P 500 ETF Trust | | | 1,835 | | | | 590,613 | |
| | | | | | | | |
| | |
Total Investment Companies — 1.9%
(Cost: $3,394,443) | | | | | | | 3,454,801 | |
| | | | | | | | |
| | | Par
(000) | | | | |
|
Non-Agency Mortgage-Backed Securities — 0.1% | |
| |
| Commercial Mortgage-Backed Securities — 0.1% | | | | |
|
| United States — 0.1% | |
BX Trust(e): | | | | | | | | |
Series 2019-OC11, Class D, 4.08%, 12/09/41 | | USD | 64 | | | | 65,109 | |
| | | | |
| CONSOLIDATED SCHEDULES OF INVESTMENTS | | | 79 | |
| | |
Consolidated Schedule of Investments (continued) December 31, 2019 | | BlackRock Global Allocation Portfolio (Percentages shown are based on Net Assets) |
| | | | | | | | |
| Security | | Par
(000) | | | Value | |
| | |
| United States (continued) | | | | | | |
Series 2019-OC11, Class E, 4.08%, 12/09/41 | | USD | 89 | | | $ | 86,062 | |
| | | | | | | | |
| |
TotalNon-Agency Mortgage-Backed Securities — 0.1%
(Cost: $151,317) | | | | 151,171 | |
| | | | | | | | |
|
Preferred Securities — 1.9% | |
|
Capital Trusts — 0.8% | |
|
| United Kingdom — 0.4%(m)(o) | |
HSBC Holdings plc, 6.37% | | | 235 | | | | 252,919 | |
Lloyds Bank plc, 13.00% | | GBP | 155 | | | | 371,241 | |
| | | | | | | | |
| | | | | | | 624,160 | |
|
| United States — 0.4% | |
American Express Co., Series C, 4.90%(m)(o) | | USD | 80 | | | | 80,300 | |
Citigroup, Inc.(m)(o): | | | | | | | | |
Series O, 5.87% | | | 266 | | | | 267,330 | |
Series Q, 5.95% | | | 114 | | | | 116,648 | |
Goldman Sachs Group, Inc. (The), Series M, 5.38%(m)(o) | | | 126 | | | | 127,559 | |
Morgan Stanley,Series H, 5.61%(m)(o) | | | 94 | | | | 94,827 | |
NBCUniversal Enterprise, Inc., 5.25%(e)(o) | | | 100 | | | | 103,250 | |
Prudential Financial, Inc.(m): | | | | | | | | |
5.63%, 06/15/43 | | | 47 | | | | 50,525 | |
5.87%, 09/15/42 | | | 71 | | | | 76,325 | |
USB Capital IX, 3.50%(m)(o) | | | 37 | | | | 32,375 | |
| | | | | | | | |
| | | | | | | 949,139 | |
| | | | | | | | |
| |
Total Capital Trusts — 0.8%
(Cost: $1,494,952) | | | | 1,573,299 | |
| | | | | | | | |
| | | | | | | |
| | | Shares | | | | |
|
Preferred Stocks — 0.9% | |
| | |
| Brazil — 0.1% | | | | | | |
Itau Unibanco Holding SA (Preference) | | | 10,829 | | | | 99,468 | |
| | | | | | | | |
|
| Germany — 0.3% | |
Henkel AG & Co. KGaA (Preference) | | | 5,213 | | | | 538,506 | |
| | | | | | | | |
|
| United Kingdom — 0.0% | |
Rolls-Royce International Ltd. (Preference)(b)(d) | | | 75,900 | | | | 101 | |
| | | | | | | | |
|
| United States — 0.5% | |
C3.ai, Inc., Series D (Acquired 10/07/19,
cost $157,869)(b)(c)(d) | | | 35,605 | | | | 179,449 | |
C3.ai, Inc., Series E (Acquired 10/07/19,
cost $18,130)(b)(c)(d) | | | 4,089 | | | | 20,609 | |
Databricks, Inc., Series F (Acquired 10/22/19,
cost $88,431)(b)(c)(d) | | | 2,059 | | | | 88,434 | |
Grand Rounds, Inc., Series C (Acquired 03/31/15,
cost $127,944)(b)(c)(d) | | | 46,081 | | | | 120,732 | |
Grand Rounds, Inc., Series D (Acquired 05/01/18,
cost $51,112)(b)(c)(d) | | | 21,089 | | | | 54,621 | |
Lookout, Inc., Series F (Acquired09/19/14-10/22/14,
cost $243,061)(b)(c)(d) | | | 21,278 | | | | 160,436 | |
Palantir Technologies, Inc., Series I (Acquired 02/11/14,
cost $272,246)(b)(c)(d) | | | 44,412 | | | | 262,919 | |
| | | | | | | | |
Security | | Shares | | | Value | |
| | |
| United States (continued) | | | | | | |
Wells Fargo & Co., Series L, 7.50%(j)(o) | | | 57 | | | $ | 82,650 | |
| | | | | | | | |
| | | | | | | 969,850 | |
| | | | | | | | |
| |
Total Preferred Stocks — 0.9%
(Cost: $1,624,080) | | | | 1,607,925 | |
| | | | | | | | |
|
Trust Preferreds — 0.2% | |
|
| United States — 0.2%(m) | |
Citigroup Capital XIII, 8.31%, 10/30/40 | | | 5,519 | | | | 153,428 | |
GMAC Capital Trust I, Series 2,
7.69%, 02/15/40 | | | 6,062 | | | | 157,915 | |
| | | | | | | | |
| | | | | | | 311,343 | |
| | | | | | | | |
| |
Total Trust Preferreds — 0.2%
(Cost: $303,160) | | | | 311,343 | |
| | | | | | | | |
| |
Total Preferred Securities — 1.9%
(Cost: $3,422,192) | | | | 3,492,567 | |
| | | | | | | | |
|
Rights — 0.0% | |
| | |
Spain — 0.0%(b) | | | | | | | | |
Repsol SA | | | 725 | | | | 344 | |
| | | | | | | | |
| |
Total Rights — 0.0%
(Cost: $343) | | | | 344 | |
| | | | | | | | |
| | | Par
(000) | | | | |
|
U.S. Government Sponsored Agency Securities — 3.2% | |
| | |
Mortgage-Backed Securities — 3.2% | | | | | | | | |
Uniform Mortgage-Backed Securities,
3.00%, 01/25/50(p) | | | 5,833 | | | | 5,916,234 | |
| | | | | | | | |
| |
Total U.S. Government Sponsored Agency Securities — 3.2%
(Cost: $5,907,119) | | | | 5,916,234 | |
| | | | | | | | |
|
U.S. Treasury Obligations — 11.0% | |
U.S. Treasury Bonds: | | | | | | | | |
2.25%, 08/15/49 | | | 247 | | | | 240,479 | |
2.38%, 11/15/49 | | | 816 | | | | 815,586 | |
U.S. Treasury Inflation Linked Notes: | | | | | | | | |
0.63%, 04/15/23 | | | 784 | | | | 795,691 | |
0.50%, 04/15/24 | | | 7,853 | | | | 7,979,721 | |
0.13%, 10/15/24 | | | 990 | | | | 995,497 | |
U.S. Treasury Notes: | | | | | | | | |
1.75%, 11/15/20-11/15/29(n) | | | 3,337 | | | | 3,322,392 | |
1.63%, 10/31/26 | | | 3,063 | | | | 3,024,931 | |
2.38%, 05/15/29(n) | | | 962 | | | | 1,000,905 | |
1.75%, 11/15/29 | | | 2,258 | | | | 2,225,718 | |
| | | | | | | | |
| |
Total U.S. Treasury Obligations — 11.0%
(Cost: $20,406,672) | | | | 20,400,920 | |
| | | | | | | | |
| |
Total Long-Term Investments — 88.8%
(Cost: $148,519,290) | | | | 164,741,888 | |
| | | | | | | | |
| | |
| 80 | | 2019 BLACKROCK ANNUAL REPORTTO SHAREHOLDERS |
| | |
Consolidated Schedule of Investments (continued) December 31, 2019 | | BlackRock Global Allocation Portfolio (Percentages shown are based on Net Assets) |
| | | | | | | | |
| Security | | Par
(000) | | | Value | |
| |
Short-Term Securities — 14.6% | | | | | |
| |
Foreign Government Obligations — 3.0%(q) | | | | | |
| | |
| Japan — 3.0% | | | | | | |
Japan Treasury Bills: | | | | | | | | |
(0.29)%, 01/08/20 | | JPY | 170,150 | | | $ | 1,566,001 | |
(0.22)%, 01/20/20 | | | 157,850 | | | | 1,452,870 | |
(0.19)%, 02/03/20 | | | 127,450 | | | | 1,173,153 | |
(0.24)%, 02/10/20 | | | 144,000 | | | | 1,325,529 | |
| | | | | | | | |
| | | | | | | 5,517,553 | |
| | | | | | | | |
| |
Total Foreign Government Obligations — 3.0%
(Cost: $5,526,651) | | | | 5,517,553 | |
| | | | | | | | |
| | | Shares | | | | |
|
Money Market Funds — 1.7%(r)* | |
BlackRock Liquidity Funds,T-Fund, Institutional Class, 1.51% | | | 557,532 | | | | 557,532 | |
SL Liquidity Series, LLC, Money Market Series, 1.80%(s) | | | 2,543,737 | | | | 2,544,246 | |
| | | | | | | | |
| |
Total Money Market Funds — 1.7%
(Cost: $3,101,770) | | | | 3,101,778 | |
| | | | | | | | |
| | | Par
(000) | | | | |
|
Time Deposits — 0.0% | |
|
| Australia — 0.0% | |
Brown Brothers Harriman & Co., 0.32%, 01/02/20 | | AUD | — | (t) | | | 74 | |
| | | | | | | | |
|
| Canada — 0.0% | |
Brown Brothers Harriman & Co., 0.82%, 01/02/20 | | CAD | 6 | | | | 4,938 | |
| | | | | | | | |
|
| Europe — 0.0% | |
Brown Brothers Harriman & Co., (0.68)%, 01/02/20 | | EUR | 13 | | | | 14,707 | |
| | | | | | | | |
|
| Hong Kong — 0.0% | |
Brown Brothers Harriman & Co., 1.66%, 01/02/20 | | HKD | 4 | | | | 533 | |
| | | | | | | | |
|
| Japan — 0.0% | |
Sumitomo Mitsui Financial Group, Inc., (0.24)%, 01/06/20 | | JPY | 2,283 | | | | 21,016 | |
| | | | | | | | |
|
| United Kingdom — 0.0% | |
Brown Brothers Harriman & Co., 0.36%, 01/02/20 | | GBP | — | (t) | | | 23 | |
| | | | | | | | |
| | |
Total Time Deposits — 0.0%
(Cost: $41,291) | | | | | | | 41,291 | |
| | | | | | | | |
| | | | | | | | |
| Security | | Par
(000) | | | Value | |
|
U.S. Treasury Obligations — 10.0% | |
U.S. Treasury Bills(q): | | | | | | | | |
1.47%, 01/21/20 | | USD | 1,250 | | | $ | 1,249,030 | |
1.50%, 03/26/20 | | | 1,000 | | | | 996,482 | |
1.52%, 04/23/20 | | | 1,500 | | | | 1,492,847 | |
1.53%, 05/07/20 | | | 3,000 | | | | 2,984,001 | |
1.54%, 02/04/20 | | | 1,000 | | | | 998,565 | |
1.54%, 05/14/20 | | | 3,000 | | | | 2,983,067 | |
1.55%, 01/02/20 | | | 320 | | | | 320,000 | |
1.55%, 05/21/20 | | | 750 | | | | 745,549 | |
1.55%, 05/28/20 | | | 750 | | | | 745,298 | |
1.59%, 04/16/20 | | | 3,000 | | | | 2,986,720 | |
1.62%, 01/16/20 | | | 2,000 | | | | 1,998,913 | |
1.85%, 03/05/20 | | | 1,000 | | | | 997,371 | |
| | | | | | | | |
| |
Total U.S. Treasury Obligations — 10.0%
(Cost: $18,495,886) | | | | 18,497,843 | |
| | | | | | | | |
| |
Total Short-Term Securities — 14.6%
(Cost: $27,165,598) | | | | 27,158,465 | |
| | | | | | | | |
| |
Total Options Purchased — 0.4%
(Cost: $805,068) | | | | 725,340 | |
| | | | | | | | |
| |
Total Investments Before Options Written and
Investments Sold Short — 103.8%
(Cost: 176,489,956) | | | | 192,625,693 | |
| | | | | | | | |
| |
Total Options Written — (0.2)%
(Premiums Received — $490,394) | | | | (350,997 | ) |
| | | | | | | | |
|
Investments Sold Short — (0.2)% | |
| | | Shares | | | | |
|
Common Stocks — (0.2)% | |
| | |
| Germany — (0.1)% | | | | | | |
TUI AG | | | 8,330 | | | | (105,127) | |
| | | | | | | | |
| | |
| United States — (0.1)% | | | | | | |
3M Co. | | | 1,084 | | | | (191,239 | ) |
Netflix, Inc.(b) | | | 293 | | | | (94,806 | ) |
| | | | | | | | |
| | | | | | | (286,045 | ) |
| | | | | | | | |
| |
Total Common Stocks — (0.2)%
(Proceeds: $385,233) | | | | (391,172) | |
| | | | | | | | |
| | |
Total Investments Sold Short — (0.2)%
(Proceeds: $385,233) | | | | | | | (391,172 | ) |
| | | | | | | | |
| |
Total Investments Net of Options Written and Investments Sold Short — 103.4%
(Cost: $175,614,329) | | | | 191,883,524 | |
| |
Liabilities in Excess of Other Assets — (3.4)% | | | | (6,301,210 | ) |
| | | | | | | | |
| | |
Net Assets — 100.0% | | | | | | $ | 185,582,314 | |
| | | | | | | | |
| (a) | Security, or a portion of the security, is on loan. |
| (b) | Non-income producing security. |
| (c) | Restricted security as to resale, excluding 144A securities. The Fund held restricted securities with a current value of $1,226,364, representing 0.66% of its net assets as of period end, and an original cost of $1,278,435. |
| (d) | Security is valued using significant unobservable inputs and is classified as Level 3 in the fair value hierarchy. |
| (e) | Security exempt from registration pursuant to Rule 144A under the Securities Act of 1933, as amended. These securities may be resold in transactions exempt from registration to qualified institutional investors. |
| | | | |
| CONSOLIDATED SCHEDULES OF INVESTMENTS | | | 81 | |
| | |
Consolidated Schedule of Investments (continued) December 31, 2019 | | BlackRock Global Allocation Portfolio |
| (f) | A security contractually bound to one or more other securities to form a single saleable unit which cannot be sold separately. |
| (g) | All or a portion of the security has been pledged and/or segregated as collateral in connection with outstanding exchange-traded options written. |
| (h) | Payment-in-kind security which may pay interest/dividends in additional par/shares and/or in cash. Rates shown are the current rate and possible payment rates. |
| (i) | Issuer filed for bankruptcy and/or is in default. |
| (j) | Convertible security. |
| (l) | Variable rate security. Security may be issued at a fixed coupon rate, which converts to a variable rate at a specified date. Rate shown is the rate in effect as of period end. |
| (m) | Variable rate security.Rate shown is the rate in effect as of period end. |
| (n) | All or a portion of the security is held by a wholly-owned subsidiary. See Note 1 of the Notes to Financial Statements for details on the wholly-owned subsidiary. |
| (o) | Perpetual security with no stated maturity date. |
| (p) | Represents or includes a TBA transaction. |
| (q) | Rates are discount rates or a range of discount rates as of period end. |
| (r) | Annualized7-day yield as of period end. |
| (s) | Security was purchased with the cash collateral from loaned securities. |
| (t) | Amount is less than 500. |
| * | During the year ended December 31, 2019, investments in issuers considered to be an affiliate/affiliates of the Fund for purposes of Section 2(a)(3) of the Investment Company Act of 1940, as amended, and/or related parties of the Fund were as follows: |
| | | | | | | | | | | | | | | | | | | | | | | | | | | | | | | | |
| Affiliated Persons and/or Related Parties | | Shares
Held at
12/31/18 | | | Shares
Purchased | | | Shares
Sold | | | Shares
Held at
12/31/19 | | | Value at
12/31/19 | | | Income | | | Net
Realized
Gain (Loss) (a) | | | Change in
Unrealized
Appreciation
(Depreciation) | |
BlackRock Liquidity Funds,T-Fund, Institutional Class(b) | | | 572,384 | | | | — | | | | (14,852 | ) | | | 557,532 | | | $ | 557,532 | | | $ | 20,826 | | | $ | — | | | $ | — | |
SL Liquidity Series, LLC, Money Market Series(b) | | | 2,217,730 | | | | 326,007 | | | | — | | | | 2,543,737 | | | | 2,544,246 | | | | 9,790 | (c) | | | 282 | | | | 68 | |
iShares ChinaLarge-Cap ETF | | | — | | | | 4,323 | | | | — | | | | 4,323 | | | | 188,612 | | | | 3,408 | | | | — | | | | 4,542 | |
iShares Gold Trust(d) | | | 126,072 | | | | 46,766 | | | | (172,838 | ) | | | — | | | | — | | | | — | | | | (139,179 | ) | | | 129,113 | |
iShares MSCI Emerging Markets ETF | | | — | | | | 10,388 | | | | — | | | | 10,388 | | | | 466,110 | | | | — | | | | — | | | | 2,431 | |
iShares Russell 2000 ETF | | | — | | | | 1,800 | | | | — | | | | 1,800 | | | | 298,206 | | | | — | | | | — | | | | 4,802 | |
iShares S&P 500 Value ETF | | | — | | | | 1,778 | | | | — | | | | 1,778 | | | | 231,300 | | | | 1,314 | | | | — | | | | 9,747 | |
| | | | | | | | | | | | | | | | | | | | | | | | | | | | | | | | |
| | | | | | | | | | | | | | | | | | $ | 4,286,006 | | | $ | 35,338 | | | $ | (138,897 | ) | | $ | 150,703 | |
| | | | | | | | | | | | | | | | | | | | | | | | | | | | | | | | |
| (a) | Includes net capital gain distributions, if applicable. | |
| (b) | Represents net shares purchased (sold). | |
| (c) | Represents securities lending income earned from the reinvestment of cash collateral from loaned securities, net of fees and collateral investment expenses, and other payments to and from borrowers of securities. | |
| (d) | As of period end, the entity is no longer held by the Fund. | |
| | |
| 82 | | 2019 BLACKROCK ANNUAL REPORTTO SHAREHOLDERS |
| | |
Consolidated Schedule of Investments (continued) December 31, 2019 | | BlackRock Global Allocation Portfolio |
Derivative Financial Instruments Outstanding as of Period End
Futures Contracts
| | | | | | | | | | | | | | | | |
| Description | | Number of
Contracts | | | Expiration
Date | | | Notional
Amount (000) | | | Value/
Unrealized
Appreciation
(Depreciation) | |
Long Contracts | | | | | | | | | | | | | | | | |
Euro-BTP | | | 4 | | | | 03/06/20 | | | $ | 639 | | | $ | 898 | |
MSCI Emerging MarketsE-Mini Index | | | 5 | | | | 03/20/20 | | | | 280 | | | | 2,009 | |
NASDAQ 100E-Mini Index | | | 6 | | | | 03/20/20 | | | | 1,050 | | | | 5,499 | |
U.S. Treasury 10 Year Note | | | 5 | | | | 03/20/20 | | | | 642 | | | | (6,621 | ) |
U.S. Treasury 10 Year Ultra Note | | | 3 | | | | 03/20/20 | | | | 422 | | | | 511 | |
U.S. Treasury Ultra Bond | | | 1 | | | | 03/20/20 | | | | 182 | | | | 468 | |
U.S. Treasury 2 Year Note | | | 135 | | | | 03/31/20 | | | | 29,093 | | | | (7,364 | ) |
| | | | | | | | | | | | | | | | |
| | | | | | | | | | | | | | | (4,600 | ) |
| | | | | | | | | | | | | | | | |
Short Contracts | | | | | | | | | | | | | | | | |
Euro-Bund | | | 7 | | | | 03/06/20 | | | | 1,339 | | | | 7,948 | |
Yen Denominated Nikkei 225 Index | | | 5 | | | | 03/12/20 | | | | 539 | | | | (106 | ) |
EURO STOXX 50 Index | | | 6 | | | | 03/20/20 | | | | 251 | | | | (450 | ) |
S&P 500E-Mini Index | | | 9 | | | | 03/20/20 | | | | 1,454 | | | | (1,908 | ) |
U.S. Treasury 5 Year Note | | | 21 | | | | 03/31/20 | | | | 2,491 | | | | (1,071 | ) |
| | | | | | | | | | | | | | | | |
| | | | | | | | | | | | | | | 4,413 | |
| | | | | | | | | | | | | | | | |
| | | | | | | | | | | | | | $ | (187) | |
| | | | | | | | | | | | | | | | |
Forward Foreign Currency Exchange Contracts
| | | | | | | | | | | | | | | | | | | | |
Currency
Purchased | | | Currency
Sold | | | Counterparty | | Settlement
Date | | | Unrealized
Appreciation
(Depreciation) | |
| BRL | | | 388,500 | | | USD | | | 93,829 | | | BNP Paribas SA | | | 01/15/20 | | | $ | 2,708 | |
| BRL | | | 777,000 | | | USD | | | 188,158 | | | Citibank NA | | | 01/15/20 | | | | 4,914 | |
| BRL | | | 388,500 | | | USD | | | 94,088 | | | Deutsche Bank AG | | | 01/15/20 | | | | 2,448 | |
| GBP | | | 3,001,000 | | | USD | | | 3,680,261 | | | JPMorgan Chase Bank NA | | | 01/16/20 | | | | 296,386 | |
| EUR | | | 813,000 | | | USD | | | 908,389 | | | UBS AG | | | 01/24/20 | | | | 4,778 | |
| USD | | | 326,878 | | | JPY | | | 35,320,853 | | | Deutsche Bank AG | | | 01/24/20 | | | | 1,415 | |
| USD | | | 147,352 | | | JPY | | | 15,899,266 | | | JPMorgan Chase Bank NA | | | 01/24/20 | | | | 849 | |
| USD | | | 178,919 | | | JPY | | | 19,368,263 | | | Morgan Stanley & Co. International plc | | | 01/24/20 | | | | 451 | |
| ZAR | | | 3,745,000 | | | USD | | | 253,276 | | | JPMorgan Chase Bank NA | | | 01/30/20 | | | | 13,124 | |
| AUD | | | 661,000 | | | USD | | | 454,963 | | | Bank of America NA | | | 02/07/20 | | | | 9,308 | |
| AUD | | | 661,000 | | | USD | | | 456,806 | | | Morgan Stanley & Co. International plc | | | 02/07/20 | | | | 7,465 | |
| CHF | | | 416,000 | | | USD | | | 422,362 | | | Deutsche Bank AG | | | 02/14/20 | | | | 8,771 | |
| GBP | | | 636,000 | | | USD | | | 824,298 | | | Barclays Bank plc | | | 02/27/20 | | | | 19,439 | |
| EUR | | | 879,000 | | | USD | | | 973,576 | | | BNP Paribas SA | | | 03/05/20 | | | | 16,215 | |
| CHF | | | 418,000 | | | USD | | | 425,367 | | | Deutsche Bank AG | | | 03/06/20 | | | | 8,465 | |
| EUR | | | 312,000 | | | USD | | | 347,846 | | | Deutsche Bank AG | | | 03/06/20 | | | | 3,502 | |
| AUD | | | 1,070,000 | | | USD | | | 732,651 | | | Morgan Stanley & Co. International plc | | | 03/11/20 | | | | 19,487 | |
| EUR | | | 618,000 | | | USD | | | 689,400 | | | UBS AG | | | 03/12/20 | | | | 6,813 | |
| NZD | | | 276,000 | | | USD | | | 180,139 | | | Morgan Stanley & Co. International plc | | | 03/12/20 | | | | 5,850 | |
| EUR | | | 1,103,000 | | | USD | | | 1,226,421 | | | Morgan Stanley & Co. International plc | | | 03/13/20 | | | | 16,253 | |
| NOK | | | 2,658,000 | | | USD | | | 289,986 | | | Morgan Stanley & Co. International plc | | | 03/13/20 | | | | 12,838 | |
| NZD | | | 553,000 | | | USD | | | 361,603 | | | Morgan Stanley & Co. International plc | | | 03/13/20 | | | | 11,055 | |
| AUD | | | 538,000 | | | USD | | | 372,119 | | | Morgan Stanley & Co. International plc | | | 03/19/20 | | | | 6,136 | |
| EUR | | | 557,000 | | | USD | | | 621,795 | | | Morgan Stanley & Co. International plc | | | 03/19/20 | | | | 5,985 | |
| AUD | | | 534,000 | | | USD | | | 368,909 | | | Morgan Stanley & Co. International plc | | | 03/20/20 | | | | 6,542 | |
| EUR | | | 395,000 | | | USD | | | 441,062 | | | Morgan Stanley & Co. International plc | | | 03/20/20 | | | | 4,162 | |
| AUD | | | 539,000 | | | USD | | | 370,291 | | | Morgan Stanley & Co. International plc | | | 03/26/20 | | | | 8,734 | |
| EUR | | | 1,074,140 | | | USD | | | 1,204,932 | | | Goldman Sachs International | | | 03/26/20 | | | | 6,257 | |
| AUD | | | 534,000 | | | USD | | | 369,440 | | | Bank of America NA | | | 03/27/20 | | | | 6,078 | |
| AUD | | | 134,000 | | | USD | | | 92,605 | | | Morgan Stanley & Co. International plc | | | 03/27/20 | | | | 1,626 | |
| NOK | | | 134,597 | | | CAD | | | 19,646 | | | Bank of America NA | | | 03/27/20 | | | | 201 | |
| NOK | | | 3,208,009 | | | CAD | | | 468,354 | | | HSBC Bank plc | | | 03/27/20 | | | | 4,712 | |
| ZAR | | | 7,087,003 | | | USD | | | 487,981 | | | HSBC Bank plc | | | 04/03/20 | | | | 11,942 | |
| RUB | | | 10,363,500 | | | USD | | | 158,949 | | | BNP Paribas SA | | | 04/30/20 | | | | 5,680 | |
| | | | |
| CONSOLIDATED SCHEDULES OF INVESTMENTS | | | 83 | |
| | |
Consolidated Schedule of Investments (continued) December 31, 2019 | | BlackRock Global Allocation Portfolio |
Forward Foreign Currency Exchange Contracts (continued)
| | | | | | | | | | | | | | | | | | | | |
Currency
Purchased | | | Currency
Sold | | | Counterparty | | Settlement Date | | | Unrealized
Appreciation
(Depreciation) | |
| RUB | | | 19,246,500 | | | USD | | | 296,100 | | | JPMorgan Chase Bank NA | | | 04/30/20 | | | $ | 9,641 | |
| BRL | | | 1,842,000 | | | USD | | | 448,830 | | | Credit Suisse International | | | 05/04/20 | | | | 6,559 | |
| IDR | | | 6,515,681,000 | | | USD | | | 455,483 | | | JPMorgan Chase Bank NA | | | 05/04/20 | | | | 10,265 | |
| MXN | | | 8,992,000 | | | USD | | | 457,422 | | | Goldman Sachs International | | | 05/04/20 | | | | 9,621 | |
| | | | | | | | | | | | | | | | | | | | |
| | | | | | | | | | | | | | | | | | | 576,675 | |
| | | | | | | | | | | | | | | | | | | | |
| JPY | | | 92,694,000 | | | USD | | | 861,558 | | | Morgan Stanley & Co. International plc | | | 01/09/20 | | | | (8,150 | ) |
| USD | | | 864,646 | | | GBP | | | 700,000 | | | JPMorgan Chase Bank NA | | | 01/10/20 | | | | (62,763 | ) |
| USD | | | 384,892 | | | BRL | | | 1,554,000 | | | Credit Suisse International | | | 01/15/20 | | | | (1,253 | ) |
| USD | | | 93,101 | | | GBP | | | 76,000 | | | Deutsche Bank AG | | | 01/16/20 | | | | (7,608 | ) |
| USD | | | 146,179 | | | GBP | | | 117,000 | | | Morgan Stanley & Co. International plc | | | 01/16/20 | | | | (8,858 | ) |
| JPY | | | 106,515,000 | | | USD | | | 987,529 | | | JPMorgan Chase Bank NA | | | 01/24/20 | | | | (6,052 | ) |
| USD | | | 561,452 | | | BRL | | | 2,335,000 | | | Credit Suisse International | | | 01/24/20 | | | | (18,629 | ) |
| USD | | | 136,604 | | | BRL | | | 569,215 | | | Credit Suisse International | | | 02/14/20 | | | | (4,696 | ) |
| JPY | | | 190,450 | | | USD | | | 1,765 | | | Bank of America NA | | | 02/28/20 | | | | (7 | ) |
| JPY | | | 140,055,549 | | | USD | | | 1,298,137 | | | Barclays Bank plc | | | 02/28/20 | | | | (5,049 | ) |
| USD | | | 422,127 | | | INR | | | 30,676,000 | | | Citibank NA | | | 02/28/20 | | | | (6,267 | ) |
| JPY | | | 46,332,000 | | | USD | | | 429,356 | | | Deutsche Bank AG | | | 03/05/20 | | | | (1,440 | ) |
| USD | | | 386,474 | | | CLP | | | 310,339,000 | | | Morgan Stanley & Co. International plc | | | 03/05/20 | | | | (26,521 | ) |
| USD | | | 442,877 | | | SGD | | | 604,000 | | | Citibank NA | | | 03/05/20 | | | | (6,451 | ) |
| USD | | | 182,784 | | | ZAR | | | 2,735,000 | | | BNP Paribas SA | | | 03/05/20 | | | | (10,900 | ) |
| USD | | | 477,571 | | | BRL | | | 2,010,000 | | | Deutsche Bank AG | | | 03/06/20 | | | | (20,888 | ) |
| USD | | | 181,154 | | | NZD | | | 276,000 | | | Morgan Stanley & Co. International plc | | | 03/12/20 | | | | (4,835 | ) |
| JPY | | | 82,554,000 | | | USD | | | 763,990 | | | Morgan Stanley & Co. International plc | | | 03/13/20 | | | | (1,173 | ) |
| USD | | | 362,969 | | | NZD | | | 553,000 | | | Morgan Stanley & Co. International plc | | | 03/13/20 | | | | (9,689 | ) |
| USD | | | 866,334 | | | JPY | | | 94,371,000 | | | Goldman Sachs International | | | 03/26/20 | | | | (6,343 | ) |
| CAD | | | 488,000 | | | NOK | | | 3,338,408 | | | Bank of America NA | | | 03/27/20 | | | | (4,435 | ) |
| USD | | | 452,268 | | | RUB | | | 29,610,000 | | | Bank of America NA | | | 04/30/20 | | | | (18,102 | ) |
| USD | | | 436,959 | | | BRL | | | 1,842,000 | | | Credit Suisse International | | | 05/04/20 | | | | (18,430 | ) |
| USD | | | 452,164 | | | IDR | | | 6,515,681,000 | | | JPMorgan Chase Bank NA | | | 05/04/20 | | | | (13,584 | ) |
| USD | | | 450,235 | | | MXN | | | 8,992,000 | | | Citibank NA | | | 05/04/20 | | | | (16,808 | ) |
| | | | | | | | | | | | | | | | | | | | |
| | | | | | | | | | | | | | | | | | | (288,931 | ) |
| | | | | | | | | | | | | | | | | | | | |
Net Unrealized Appreciation | | | | | | | | | $ | 287,744 | |
| | | | | | | | | | | | | | | | | | | | |
Interest Rate Caps Purchased
| | | | | | | | | | | | | | | | | | | | | | | | | | | | | | |
| Description | | Exercise
Rate | | | Counterparty | | Expiration
Date | | | Notional Amount (000) | | | Value | | | Premiums
Paid (Received) | | | Unrealized
Appreciation
(Depreciation) | |
2Y-10Y CMS Index Cap | | | 0.50 | % | | Goldman Sachs International | | | 02/27/20 | | | | USD | | | | 14,713 | | | $ | 786 | | | $ | 19,127 | | | $ | (18,341 | ) |
2Y-10Y CMS Index Cap | | | 0.50 | % | | Goldman Sachs International | | | 08/27/20 | | | | USD | | | | 14,948 | | | | 11,803 | | | | 38,117 | | | | (26,314 | ) |
| | | | | | | | | | | | | | | | | | | | | | | | | | | | | | |
| | | | | | | | | | | | | | | | | | | | $ | 12,589 | | | $ | 57,244 | | | $ | (44,655 | ) |
| | | | | | | | | | | | | | | | | | | | | | | | | | | | | | |
Exchange-Traded Options Purchased
| | | | | | | | | | | | | | | | | | | | | | | | |
| Description | | Number of
Contracts | | | Expiration
Date | | | | | Exercise
Price | | | Notional Amount (000) | | | Value | |
| Call | | | | | | | | | | | | | | | | | | | |
Consumer Discretionary Select Sector SPDR Fund | | | 196 | | | | 01/17/20 | | | USD | | | 126.00 | | | USD | | | 2,458 | | | $ | 27,440 | |
iShares Russell 2000 ETF | | | 23 | | | | 01/17/20 | | | USD | | | 167.00 | | | USD | | | 381 | | | | 3,404 | |
Johnson & Johnson | | | 7 | | | | 01/17/20 | | | USD | | | 135.00 | | | USD | | | 102 | | | | 7,858 | |
SPDR S&P 500 ETF Trust | | | 48 | | �� | | 01/17/20 | | | USD | | | 310.00 | | | USD | | | 1,545 | | | | 64,440 | |
SPDR S&P 500 ETF Trust | | | 140 | | | | 01/17/20 | | | USD | | | 323.00 | | | USD | | | 4,506 | | | | 38,150 | |
SPDR S&P 500 ETF Trust | | | 150 | | | | 01/17/20 | | | USD | | | 330.00 | | | USD | | | 4,828 | | | | 5,025 | |
SPDR S&P 500 ETF Trust | | | 156 | | | | 01/17/20 | | | USD | | | 321.00 | | | USD | | | 5,021 | | | | 63,024 | |
Halliburton Co. | | | 40 | | | | 02/21/20 | | | USD | | | 23.00 | | | USD | | | 98 | | | | 8,540 | |
Halliburton Co. | | | 43 | | | | 02/21/20 | | | USD | | | 22.00 | | | USD | | | 105 | | | | 12,341 | |
Schlumberger Ltd. | | | 50 | | | | 02/21/20 | | | USD | | | 37.50 | | | USD | | | 201 | | | | 17,625 | |
| | |
| 84 | | 2019 BLACKROCK ANNUAL REPORTTO SHAREHOLDERS |
| | |
Consolidated Schedule of Investments (continued) December 31, 2019 | | BlackRock Global Allocation Portfolio |
Exchange-Traded Options Purchased (continued)
| | | | | | | | | | | | | | | | | | | | | | | | |
| Description | | Number of
Contracts | | | Expiration
Date | | | Exercise
Price | | | Notional Amount (000) | | | Value | |
Williams Cos., Inc. (The) | | | 40 | | | | 02/21/20 | | | USD | | | 23.00 | | | USD | | | 95 | | | $ | 5,080 | |
Valero Energy Corp. | | | 19 | | | | 03/20/20 | | | USD | | | 100.00 | | | USD | | | 178 | | | | 3,192 | |
BP plc | | | 49 | | | | 04/17/20 | | | USD | | | 39.00 | | | USD | | | 185 | | | | 3,749 | |
Marathon Petroleum Corp. | | | 30 | | | | 04/17/20 | | | USD | | | 62.50 | | | USD | | | 181 | | | | 9,225 | |
| | | | | | | | | | | | | | | | | | | | | | | | |
| | | | | | | | | | | | | | | | | | | | | | | 269,093 | |
| | | | | | | | | | | | | | | | | | | | | | | | |
| Put | | | | | | | | | | | | | | | | | | | |
FedEx Corp. | | | 15 | | | | 01/17/20 | | | USD | | | 130.00 | | | USD | | | 227 | | | | 165 | |
SPDR S&P 500 ETF Trust | | | 26 | | | | 01/17/20 | | | USD | | | 303.00 | | | USD | | | 837 | | | | 1,079 | |
SPDR S&P 500 ETF Trust | | | 90 | | | | 01/17/20 | | | USD | | | 302.00 | | | USD | | | 2,897 | | | | 3,465 | |
| | | | | | | | | | | | | | | | | | | | | | | | |
| | | | | | | | | | | | | | | | | | | | | | | 4,709 | |
| | | | | | | | | | | | | | | | | | | | | | | | |
| | | | | | | | | | | | | | | | | | | | | | $ | 273,802 | |
| | | | | | | | | | | | | | | | | | | | | | | | |
OTC Barrier Options Purchased
| | | | | | | | | | | | | | | | | | | | | | | | | | | | | | | | | | | | |
| Description | | Type of Option | | Counterparty | | Expiration
Date | | | Exercise
Price | | | Barrier Price/Range | | | Notional
Amount (000) | | | Value | |
Call | | | | | | | | | | | | | | | | | | | | | | | | | | | | | | | | | | | | |
EUR Currency | | Up and In | | Bank of America NA | | | 05/25/20 | | | | CHF | | | | 1.16 | | | | CHF | | | | 1.16 | | | | EUR | | | | 10 | | | $ | 482 | |
EUR Currency | | Up and In | | Bank of America NA | | | 05/25/20 | | | | CHF | | | | 1.16 | | | | CHF | | | | 1.16 | | | | EUR | | | | 14 | | | | 675 | |
USD Currency | | Down and In | | Standard Chartered Bank | | | 06/16/20 | | | | CNH | | | | 6.70 | | | | CNH | | | | 6.70 | | | | USD | | | | 36 | | | | 5,806 | |
EUR Currency | | Up and In | | Bank of America NA | | | 08/25/20 | | | | CHF | | | | 1.17 | | | | CHF | | | | 1.17 | | | | EUR | | | | 10 | | | | 576 | |
EUR Currency | | Up and In | | Bank of America NA | | | 08/25/20 | | | | CHF | | | | 1.17 | | | | CHF | | | | 1.17 | | | | EUR | | | | 14 | | | | 806 | |
| | | | | | | | | | | | | | | | | | | | | | | | | | | | | | | | | | | | |
| | | | | | | | | | | | | | | | | | | | | | | | | | | | | | | | | | $ | 8,345 | |
| | | | | | | | | | | | | | | | | | | | | | | | | | | | | | | | | | | | |
OTC Options Purchased
| | | | | | | | | | | | | | | | | | | | | | | | | | |
| Description | | Counterparty | | Number of
Contracts | | | Expiration
Date | | | Exercise
Price | | | Notional
Amount (000) | | | Value | |
| Call | | | | | | | | | | | | | | | | | | | | | |
Alphabet, Inc. | | JPMorgan Chase Bank NA | | | 357 | | | | 01/17/20 | | | USD | | | 1,315.00 | | | USD | | | 477 | | | $ | 11,317 | |
DAX Index | | Goldman Sachs International | | | 25 | | | | 01/17/20 | | | EUR | | | 13,400.00 | | | EUR | | | 331 | | | | 2,797 | |
EURO STOXX 50 Index | | Credit Suisse International | | | 675 | | | | 01/17/20 | | | EUR | | | 3,775.00 | | | EUR | | | 2,528 | | | | 28,393 | |
EURO STOXX 50 Index | | Goldman Sachs International | | | 115 | | | | 01/17/20 | | | EUR | | | 3,775.00 | | | EUR | | | 431 | | | | 4,837 | |
FedEx Corp. | | Credit Suisse International | | | 2,633 | | | | 01/17/20 | | | USD | | | 162.00 | | | USD | | | 398 | | | | 1,011 | |
JPMorgan Chase & Co. | | Citibank NA | | | 2,577 | | | | 01/17/20 | | | USD | | | 136.00 | | | USD | | | 359 | | | | 10,168 | |
QUALCOMM, Inc. | | Citibank NA | | | 3,545 | | | | 01/17/20 | | | USD | | | 82.00 | | | USD | | | 313 | | | | 23,548 | |
SPDR Gold Shares(a) | | Morgan Stanley & Co. International plc | | | 2,977 | | | | 01/17/20 | | | USD | | | 142.00 | | | USD | | | 425 | | | | 5,463 | |
SPDR Gold Shares(a) | | Morgan Stanley & Co. International plc | | | 5,649 | | | | 01/17/20 | | | USD | | | 145.00 | | | USD | | | 807 | | | | 4,011 | |
SPDR Gold Shares(a) | | Societe Generale SA | | | 3,533 | | | | 01/17/20 | | | USD | | | 143.50 | | | USD | | | 505 | | | | 4,137 | |
Agilent Technologies, Inc. | | Nomura International plc | | | 2,706 | | | | 02/21/20 | | | USD | | | 82.50 | | | USD | | | 231 | | | | 13,665 | |
Alibaba Group Holding Ltd. | | Citibank NA | | | 1,373 | | | | 02/21/20 | | | USD | | | 190.00 | | | USD | | | 291 | | | | 33,604 | |
Alibaba Group Holding Ltd. | | Societe Generale SA | | | 1,081 | | | | 02/21/20 | | | USD | | | 215.00 | | | USD | | | 229 | | | | 7,999 | |
Facebook, Inc. | | UBS AG | | | 2,734 | | | | 02/21/20 | | | USD | | | 208.00 | | | USD | | | 561 | | | | 21,340 | |
Lowe’s Cos., Inc. | | Nomura International plc | | | 3,217 | | | | 02/21/20 | | | USD | | | 123.00 | | | USD | | | 385 | | | | 5,425 | |
QUALCOMM, Inc. | | Citibank NA | | | 2,902 | | | | 02/21/20 | | | USD | | | 90.00 | | | USD | | | 256 | | | | 8,901 | |
SPDR Gold Shares(a) | | Societe Generale SA | | | 6,477 | | | | 02/21/20 | | | USD | | | 141.50 | | | USD | | | 926 | | | | 22,148 | |
SPDR Gold Shares(a) | | Societe Generale SA | | | 8,155 | | | | 02/21/20 | | | USD | | | 143.00 | | | USD | | | 1,165 | | | | 21,774 | |
USD Currency | | Deutsche Bank AG | | | — | | | | 02/26/20 | | | JPY | | | 110.00 | | | USD | | | 1,460 | | | | 4,012 | |
BP plc | | Credit Suisse International | | | 8,680 | | | | 03/20/20 | | | USD | | | 40.00 | | | USD | | | 328 | | | | 2,751 | |
DAX Index | | Credit Suisse International | | | 25 | | | | 03/20/20 | | | EUR | | | 14,000.00 | | | EUR | | | 331 | | | | 1,781 | |
DAX Index | | Goldman Sachs International | | | 19 | | | | 03/20/20 | | | EUR | | | 13,600.00 | | | EUR | | | 252 | | | | 4,065 | |
Emerson Electric Co. | | Citibank NA | | | 6,393 | | | | 03/20/20 | | | USD | | | 78.00 | | | USD | | | 488 | | | | 13,394 | |
EURO STOXX 50 Index | | Credit Suisse International | | | 51 | | | | 03/20/20 | | | EUR | | | 3,600.00 | | | EUR | | | 191 | | | | 12,062 | |
EURO STOXX 50 Index | | Credit Suisse International | | | 112 | | | | 03/20/20 | | | EUR | | | 3,900.00 | | | EUR | | | 419 | | | | 3,593 | |
EURO STOXX 50 Index | | Goldman Sachs International | | | 69 | | | | 03/20/20 | | | EUR | | | 3,800.00 | | | EUR | | | 258 | | | | 5,445 | |
Home Depot, Inc. (The) | | Nomura International plc | | | 1,785 | | | | 03/20/20 | | | USD | | | 225.00 | | | USD | | | 390 | | | | 8,363 | |
SPDR Gold Shares(a) | | Morgan Stanley & Co. International plc | | | 9,684 | | | | 03/20/20 | | | USD | | | 146.00 | | | USD | | | 1,384 | | | | 24,113 | |
| | | | |
| CONSOLIDATED SCHEDULES OF INVESTMENTS | | | 85 | |
| | |
Consolidated Schedule of Investments (continued) December 31, 2019 | | BlackRock Global Allocation Portfolio |
OTC Options Purchased (continued)
| | | | | | | | | | | | | | | | | | | | | | | | | | | | | | |
| Description | | Counterparty | | Number of
Contracts | | | Expiration
Date | | | Exercise
Price | | | Notional
Amount (000) | | | Value | |
Lowe’s Cos., Inc. | | Nomura International plc | | | 1,939 | | | | 04/17/20 | | | | USD | | | | 125.00 | | | | USD | | | | 232 | | | $ | 7,029 | |
| | | | | | | | | | | | | | | | | | | | | | | | | | | | | | |
| | | | | | | | | | | | | | | | | | | | | | | | | | | | | 317,146 | |
| | | | | | | | | | | | | | | | | | | | | | | | | | | | | | |
| Put | | | | | | | | | | | | | | | | | | | | | | | |
USD Currency | | Morgan Stanley & Co. International plc | | | — | | | | 01/08/20 | | | | JPY | | | | 108.00 | | | | USD | | | | 2,076 | | | | 2,679 | |
USD Currency | | Bank of America NA | | | — | | | | 03/11/20 | | | | JPY | | | | 99.00 | | | | USD | | | | 1,083 | | | | 128 | |
USD Currency | | UBS AG | | | — | | | | 03/11/20 | | | | JPY | | | | 102.00 | | | | USD | | | | 2,165 | | | | 1,620 | |
EUR Currency | | Morgan Stanley & Co. International plc | | | — | | | | 03/17/20 | | | | USD | | | | 1.08 | | | | EUR | | | | 2,387 | | | | 1,323 | |
USD Currency | | Bank of America NA | | | — | | | | 04/06/20 | | | | JPY | | | | 103.50 | | | | USD | | | | 760 | | | | 1,958 | |
USD Currency | | Bank of America NA | | | — | | | | 04/30/20 | | | | RUB | | | | 63.00 | | | | USD | | | | 436 | | | | 8,655 | |
USD Currency | | Bank of America NA | | | — | | | | 05/04/20 | | | | IDR | | | | 14,000.00 | | | | USD | | | | 436 | | | | 5,224 | |
USD Currency | | Citibank NA | | | — | | | | 05/04/20 | | | | MXN | | | | 19.00 | | | | USD | | | | 436 | | | | 5,127 | |
USD Currency | | Citibank NA | | | — | | | | 05/04/20 | | | | ZAR | | | | 14.40 | | | | USD | | | | 873 | | | | 33,992 | |
USD Currency | | Citibank NA | | | — | | | | 05/04/20 | | | | TRY | | | | 5.70 | | | | USD | | | | 873 | | | | 4,635 | |
USD Currency | | JPMorgan Chase Bank NA | | | — | | | | 05/04/20 | | | | BRL | | | | 3.93 | | | | USD | | | | 436 | | | | 5,094 | |
EUR Currency | | Bank of America NA | | | — | | | | 07/23/20 | | | | USD | | | | 1.12 | | | | EUR | | | | 259 | | | | 2,374 | |
| | | | | | | | | | | | | | | | | | | | | | | | | | | | | | |
| | | | | | | | | | | | | | | | | | | | | | | | | | | | | 72,809 | |
| | | | | | | | | | | | | | | | | | | | | | | | | | | | | | |
| | | | | | | | | | | | | | | | | | | | | | | | | | | | $ | 389,955 | |
| | | | | | | | | | | | | | | | | | | | | | | | | | | | | | |
| (a) | All or a portion of the security is held by a wholly-owned subsidiary. See Note 1 of the Notes to Financial Statements for details on the wholly-owned subsidiary. | |
OTC Interest Rate Swaptions Purchased
| | | | | | | | | | | | | | | | | | | | | | | | | | | | | | | | | | |
Description | | Paid by the Fund | | Received by the Fund | | Counterparty | | Expiration
Date | | | Exercise
Rate | | | Notional
Amount (000) | | | Value | |
| | Rate | | | Frequency | | Rate | | | Frequency |
Call | | | | | | | | | | | | | | | | | | | | | | | | | | | | | | | | | | |
5-Year Interest Rate Swap | | | 3 month LIBOR | | | Quarterly | | | 1.30% | | | Semi-Annual | | Goldman Sachs International | | | 01/02/20 | | | | 1.30 | % | | | USD | | | | 9,582 | | | $ | 1 | |
10-Year Interest Rate Swap | | | 3 month LIBOR | | | Quarterly | | | 1.08% | | | Semi-Annual | | Bank of America NA | | | 08/13/20 | | | | 1.08 | % | | | USD | | | | 1,025 | | | | 2,019 | |
| | | | | | | | | | | | | | | | | | | | | | | | | | | | | | | | | | |
| | | | | | | | | | | | | | | | | | | | | | | | | | | | | | | | | 2,020 | |
| | | | | | | | | | | | | | | | | | | | | | | | | | | | | | | | | | |
| Put | | | | | | | | | | | | | | | | | | | | | | | | | | | |
10-Year Interest Rate Swap | | | 1.86% | | | Semi-Annual | | | 3 month LIBOR | | | Quarterly | | Morgan Stanley & Co. International plc | | | 01/06/20 | | | | 1.86 | % | | | USD | | | | 5,291 | | | | 26,448 | |
10-Year Interest Rate Swap | | | 2.08% | | | Semi-Annual | | | 3 month LIBOR | | | Quarterly | | Bank of America NA | | | 08/13/20 | | | | 2.08 | % | | | USD | | | | 1,025 | | | | 12,181 | |
| | | | | | | | | | | | | | | | | | | | | | | | | | | | | | | | | | |
| | | | | | | | | | | | | | | | | | | | | | | | | | | | | | | | | 38,629 | |
| | | | | | | | | | | | | | | | | | | | | | | | | | | | | | | | | | |
| | | | | | | | | | | | | | | | | | | | | | | | | | | | | | | | $ | 40,649 | |
| | | | | | | | | | | | | | | | | | | | | | | | | | | | | | | | | | |
Exchange-Traded Options Written
| | | | | | | | | | | | | | | | | | | | | | | | |
| Description | | Number of
Contracts | | | Expiration
Date | | | Exercise
Price | | | Notional
Amount (000) | | | Value | |
| Call | | | | | | | | | | | | | | | | | | | |
Agilent Technologies, Inc. | | | 9 | | | | 01/17/20 | | | USD | | | 82.50 | | | USD | | | 77 | | | $ | (3,038 | ) |
Charles Schwab Corp. (The) | | | 10 | | | | 01/17/20 | | | USD | | | 47.00 | | | USD | | | 48 | | | | (1,450 | ) |
HCA Healthcare, Inc. | | | 5 | | | | 01/17/20 | | | USD | | | 145.00 | | | USD | | | 74 | | | | (2,125 | ) |
Halliburton Co. | | | 40 | | | | 02/21/20 | | | USD | | | 25.00 | | | USD | | | 98 | | | | (3,980 | ) |
Halliburton Co. | | | 43 | | | | 02/21/20 | | | USD | | | 24.00 | | | USD | | | 105 | | | | (6,429 | ) |
Schlumberger Ltd. | | | 50 | | | | 02/21/20 | | | USD | | | 42.50 | | | USD | | | 201 | | | | (4,500 | ) |
Williams Cos., Inc. (The) | | | 40 | | | | 02/21/20 | | | USD | | | 25.00 | | | USD | | | 95 | | | | (1,180 | ) |
Bristol-Myers Squibb Co. | | | 15 | | | | 03/20/20 | | | USD | | | 65.00 | | | USD | | | 96 | | | | (3,248 | ) |
Valero Energy Corp. | | | 19 | | | | 03/20/20 | | | USD | | | 110.00 | | | USD | | | 178 | | | | (494 | ) |
BP plc | | | 49 | | | | 04/17/20 | | | USD | | | 43.00 | | | USD | | | 185 | | | | (417 | ) |
Marathon Petroleum Corp. | | | 30 | | | | 04/17/20 | | | USD | | | 70.00 | | | USD | | | 181 | | | | (2,880 | ) |
| | | | | | | | | | | | | | | | | | | | | | | | |
| | | | | | | | | | | | | | | | | | | | | | | (29,741 | ) |
| | | | | | | | | | | | | | | | | | | | | | | | |
| | |
| 86 | | 2019 BLACKROCK ANNUAL REPORTTO SHAREHOLDERS |
| | |
Consolidated Schedule of Investments (continued) December 31, 2019 | | BlackRock Global Allocation Portfolio |
Exchange-Traded Options Written (continued)
| | | | | | | | | | | | | | | | | | | | | | | | |
| Description | | Number of
Contracts | | | Expiration
Date | | | Exercise
Price | | | Notional
Amount (000) | | | Value | |
| Put | | | | | | | | | | | | | | | | | | | |
Home Depot, Inc. (The) | | | 7 | | | | 01/17/20 | | | USD | | | 210.00 | | | USD | | | 153 | | | $ | (462 | ) |
McDonald’s Corp. | | | 25 | | | | 01/17/20 | | | USD | | | 190.00 | | | USD | | | 494 | | | | (938 | ) |
United Rentals, Inc. | | | 6 | | | | 01/17/20 | | | USD | | | 140.00 | | | USD | | | 100 | | | | (60 | ) |
United Rentals, Inc. | | | 8 | | | | 01/17/20 | | | USD | | | 135.00 | | | USD | | | 133 | | | | (60 | ) |
| | | | | | | | | | | | | | | | | | | | | | | | |
| | | | | | | | | | | | | | | | | | | | | | | (1,520 | ) |
| | | | | | | | | | | | | | | | | | | | | | | | |
| | | | | | | | | | | | | | | | | | | | | | $ | (31,261 | ) |
| | | | | | | | | | | | | | | | | | | | | | | | |
OTC Barrier Options Written
| | | | | | | | | | | | | | | | | | | | | | | | | | | | | | | | | | | | |
| Description | | Type of Option | | Counterparty | | Expiration
Date | | | Exercise
Price | | | Barrier
Price/Range | | | Notional
Amount (000) | | | Value | |
Put | | | | | | | | | | | | | | | | | | | | | | | | | | | | | | | | | | | | |
USD Currency | | Down and In | | Bank of America NA | | | 04/06/20 | | | | JPY | | | | 100.00 | | | | JPY | | | | 96.50 | | | | USD | | | | 760 | | | $ | (659 | ) |
| | | | | | | | | | | | | | | | | | | | | | | | | | | | | | | | | | | | |
OTC Options Written
| | | | | | | | | | | | | | | | | | | | | | | | | | | | | | |
Description | | Counterparty | | Number of
Contracts | | | Expiration
Date | | | Exercise
Price | | | Notional
Amount (000) | | | Value | |
| Call | | | | | | | | | | | | | | | | | | | | | | | |
FedEx Corp. | | Credit Suisse International | | | 2,633 | | | | 01/17/20 | | | | USD | | | | 190.00 | | | | USD | | | | 398 | | | $ | (55 | ) |
JPMorgan Chase &Co. | | Citibank NA | | | 2,577 | | | | 01/17/20 | | | | USD | | | | 146.00 | | | | USD | | | | 359 | | | | (696 | ) |
QUALCOMM, Inc. | | Citibank NA | | | 3,312 | | | | 01/17/20 | | | | USD | | | | 86.00 | | | | USD | | | | 292 | | | | (11,172 | ) |
Raytheon Co. | | Nomura International plc | | | 782 | | | | 01/17/20 | | | | USD | | | | 235.00 | | | | USD | | | | 172 | | | | (23 | ) |
SPDR Gold Shares(a) | | Morgan Stanley & Co. International plc | | | 3,228 | | | | 01/17/20 | | | | USD | | | | 155.00 | | | | USD | | | | 461 | | | | (178 | ) |
UnitedHealth Group, Inc. | | Morgan Stanley & Co. International plc | | | 588 | | | | 01/17/20 | | | | USD | | | | 275.00 | | | | USD | | | | 173 | | | | (11,803 | ) |
Agilent Technologies, Inc. | | Nomura International plc | | | 2,706 | | | | 02/21/20 | | | | USD | | | | 88.50 | | | | USD | | | | 231 | | | | (4,630 | ) |
Alibaba Group Holding Ltd. | | Citibank NA | | | 1,373 | | | | 02/21/20 | | | | USD | | | | 205.00 | | | | USD | | | | 291 | | | | (17,883 | ) |
Alibaba Group Holding Ltd. | | Societe Generale SA | | | 1,081 | | | | 02/21/20 | | | | USD | | | | 235.00 | | | | USD | | | | 229 | | | | (1,681 | ) |
Facebook, Inc. | | UBS AG | | | 2,734 | | | | 02/21/20 | | | | USD | | | | 223.00 | | | | USD | | | | 561 | | | | (7,334 | ) |
Lowe’s Cos., Inc. | | Nomura International plc | | | 3,217 | | | | 02/21/20 | | | | USD | | | | 130.00 | | | | USD | | | | 385 | | | | (934 | ) |
QUALCOMM, Inc. | | Citibank NA | | | 2,902 | | | | 02/21/20 | | | | USD | | | | 100.00 | | | | USD | | | | 256 | | | | (1,492 | ) |
USD Currency | | Morgan Stanley & Co. International plc | | | — | | | | 03/05/20 | | | | ZAR | | | | 15.65 | | | | USD | | | | 455 | | | | (947 | ) |
EUR Currency | | Morgan Stanley & Co. International plc | | | — | | | | 03/17/20 | | | | USD | | | | 1.15 | | | | EUR | | | | 2,387 | | | | (7,742 | ) |
BP plc | | Credit Suisse International | | | 8,680 | | | | 03/20/20 | | | | USD | | | | 43.00 | | | | USD | | | | 328 | | | | (307 | ) |
Emerson Electric Co. | | Citibank NA | | | 6,393 | | | | 03/20/20 | | | | USD | | | | 88.00 | | | | USD | | | | 488 | | | | (666 | ) |
Home Depot, Inc. (The) | | Nomura International plc | | | 1,785 | | | | 03/20/20 | | | | USD | | | | 240.00 | | | | USD | | | | 390 | | | | (2,151 | ) |
SPDR Gold Shares(a) | | Morgan Stanley & Co. International plc | | | 3,228 | | | | 03/20/20 | | | | USD | | | | 158.00 | | | | USD | | | | 461 | | | | (2,228 | ) |
Lowe’s Cos., Inc. | | Nomura International plc | | | 1,939 | | | | 04/17/20 | | | | USD | | | | 135.00 | | | | USD | | | | 232 | | | | (2,172 | ) |
Comcast Corp.. | | Citibank NA | | | 8,555 | | | | 06/19/20 | | | | USD | | | | 40.00 | | | | USD | | | | 385 | | | | (50,688 | ) |
| | | | | | | | | | | | | | | | | | | | | | | | | | | | | | |
| | | | | | | | | | | | | | | | | | | | | | | | | | | | | (124,782 | ) |
| | | | | | | | | | | | | | | | | | | | | | | | | | | | | | |
| Put | | | | | | | | | | | | | | | | | | | | | | | |
FedEx Corp | | Credit Suisse International | | | 1,487 | | | | 01/17/20 | | | | USD | | | | 130.00 | | | | USD | | | | 225 | | | | (163 | ) |
JPMorgan Chase & Co. | | Citibank NA | | | 1,933 | | | | 01/17/20 | | | | USD | | | | 120.00 | | | | USD | | | | 269 | | | | (222 | ) |
Agilent Technologies, Inc. | | Nomura International plc | | | 1,353 | | | | 02/21/20 | | | | USD | | | | 75.00 | | | | USD | | | | 115 | | | | (580 | ) |
Alibaba Group Holding Ltd. | | Societe Generale SA | | | 1,081 | | | | 02/21/20 | | | | USD | | | | 190.00 | | | | USD | | | | 229 | | | | (1,944 | ) |
QUALCOMM, Inc. | | Citibank NA | | | 1,451 | | | | 02/21/20 | | | | USD | | | | 76.00 | | | | USD | | | | 128 | | | | (781 | ) |
SPDR Gold Shares(a) | | Societe Generale SA | | | 3,238 | | | | 02/21/20 | | | | USD | | | | 133.50 | | | | USD | | | | 463 | | | | (345 | ) |
USD Currency | | Morgan Stanley & Co. International plc | | | — | | | | 03/05/20 | | | | ZAR | | | | 14.20 | | | | USD | | | | 455 | | | | (11,421 | ) |
USD Currency | | UBS AG | | | — | | | | 03/11/20 | | | | JPY | | | | 99.00 | | | | USD | | | | 2,165 | | | | (255 | ) |
Sumitomo Mitsui Financial Group, Inc. | | Morgan Stanley & Co. International plc | | | 6,991 | | | | 03/13/20 | | | | JPY | | | | 3,832.77 | | | | JPY | | | | 28,230 | | | | (3,446 | ) |
TOPIX Banks Index | | BNPParibas SA | | | 181,254 | | | | 03/13/20 | | | | JPY | | | | 155.80 | | | | JPY | | | | 27,643 | | | | (11,114 | ) |
Emerson Electric Co. | | Citibank NA | | | 3,196 | | | | 03/20/20 | | | | USD | | | | 65.00 | | | | USD | | | | 244 | | | | (1,353 | ) |
Home Depot, Inc. (The) | | Nomura International plc | | | 892 | | | | 03/20/20 | | | | USD | | | | 205.00 | | | | USD | | | | 195 | | | | (2,911 | ) |
SPDR Gold Shares(a) | | Morgan Stanley & Co. International plc | | | 3,228 | | | | 03/20/20 | | | | USD | | | | 134.00 | | | | USD | | | | 461 | | | | (1,014 | ) |
TOPIX Banks Index | | Morgan Stanley & Co. International plc | | | 161,095 | | | | 04/10/20 | | | | JPY | | | | 157.82 | | | | JPY | | | | 24,569 | | | | (13,846 | ) |
BP plc | | Nomura International plc | | | 15,543 | | | | 04/17/20 | | | | USD | | | | 34.50 | | | | USD | | | | 587 | | | | (7,762 | ) |
| | | | |
| CONSOLIDATED SCHEDULES OF INVESTMENTS | | | 87 | |
| | |
Consolidated Schedule of Investments (continued) December 31, 2019 | | BlackRock Global Allocation Portfolio |
OTC Options Written (continued)
| | | | | | | | | | | | | | | | | | | | | | | | | | | | | | |
| Description | | Counterparty | | Number of
Contracts | | | Expiration
Date | | | Exercise
Price | | | Notional
Amount (000) | | | Value | |
Sumitomo Mitsui Financial Group, Inc. | | Morgan Stanley & Co. International plc | | | 3,762 | | | | 09/11/20 | | | | JPY | | | | 3,820.96 | | | | JPY | | | | 15,191 | | | $ | (5,112 | ) |
Sumitomo Mitsui Financial Group, Inc. | | Morgan Stanley & Co. International plc | | | 3,764 | | | | 12/11/20 | | | | JPY | | | | 3,786.60 | | | | JPY | | | | 15,199 | | | | (8,450 | ) |
EURO STOXX Banks Index | | Barclays Bank plc | | | 2,482 | | | | 06/18/21 | | | | EUR | | | | 103.00 | | | | EUR | | | | 240 | | | | (54,662 | ) |
EURO STOXX Banks Index | | UBS AG | | | 2,527 | | | | 09/17/21 | | | | EUR | | | | 103.00 | | | | EUR | | | | 244 | | | | (58,500 | ) |
| | | | | | | | | | | | | | | | | | | | | | | | | | | | | | |
| | | | | | | | | | | | | | | | | | | | | | | | | | | | | (183,881 | ) |
| | | | | | | | | | | | | | | | | | | | | | | | | | | | | | |
| | | | | | | | | | | | | | | | | | | | | | | | | | | | $ | (308,663 | ) |
| | | | | | | | | | | | | | | | | | | | | | | | | | | | | | |
| (a) | All or a portion of the security is held by a wholly-owned subsidiary. See Note 1 of the Notes to Financial Statements for details on the wholly-owned subsidiary. | |
OTC Interest Rate Swaptions Written
| | | | | | | | | | | | | | | | | | | | | | | | | | | | | | | | | | |
Description | | Paid by the Fund | | Received by the Fund | | Counterparty | | Expiration
Date | | | Exercise
Rate | | | Notional
Amount (000) | | | Value | |
| | Rate | | | Frequency | | Rate | | | Frequency |
Call | | | | | | | | | | | | | | | | | | | | | | | | | | | | | | | | | | |
5-Year Interest Rate Swap | | | 3 month LIBOR | | | Quarterly | | | 1.10% | | | Semi-Annual | | Goldman Sachs International | | | 01/02/20 | | | | 1.10 | % | | | USD | | | | 9,582 | | | $ | — | |
2-Year Interest Rate Swap | | | 3 month LIBOR | | | Quarterly | | | 0.88% | | | Semi-Annual | | Bank of America NA | | | 08/13/20 | | | | 0.88 | % | | | USD | | | | 5,127 | | | | (2,002 | ) |
| | | | | | | | | | | | | | | | | | | | | | | | | | | | | | | | | | |
| | | | | | | | | | | | | | | | | | | | | | | | | | | | | | | | | (2,002 | ) |
| | | | | | | | | | | | | | | | | | | | | | | | | | | | | | | | | | |
| Put | | | | | | | | | | | | | | | | | | | | | | | | | | | |
10-Year Interest Rate Swap | | | 2.01% | | | Semi-Annual | | | 3 month LIBOR | | | Quarterly | | Morgan Stanley & Co. International plc | | | 01/06/20 | | | | 2.01 | % | | | USD | | | | 5,291 | | | | (1,649 | ) |
2-Year Interest Rate Swap | | | 1.88% | | | Semi-Annual | | | 3 month LIBOR | | | Quarterly | | Bank of America NA | | | 08/13/20 | | | | 1.88 | % | | | USD | | | | 5,127 | | | | (6,763 | ) |
| | | | | | | | | | | | | | | | | | | | | | | | | | | | | | | | | | |
| | | | | | | | | | | | | | | | | | | | | | | | | | | | | | | | | (8,412 | ) |
| | | | | | | | | | | | | | | | | | | | | | | | | | | | | | | | | | |
| | | | | | | | | | | | | | | | | | | | | | | | | | | | | | | | $ | (10,414 | ) |
| | | | | | | | | | | | | | | | | | | | | | | | | | | | | | | | | | |
Centrally Cleared Credit Default Swaps — Buy Protection
| | | | | | | | | | | | | | | | | | | | | | | | | | | | | | | | |
| Reference Obligation/Index | | Financing
Rate Paid
by the Fund | | | Payment
Frequency | | | Termination
Date | | | Notional
Amount (000) | | | Value | | | Upfront
Premium
Paid
(Received) | | | Unrealized
Appreciation
(Depreciation) | |
CDX.NA.HY33.V1 | | | 5.00 | % | | | Quarterly | | | | 12/20/24 | | | | USD | | | | 432 | | | $ | (42,314 | ) | | $ | (28,812 | ) | | $ | (13,502 | ) |
CDX.NA.IG.33.V1 | | | 1.00 | % | | | Quarterly | | | | 12/20/24 | | | | USD | | | | 7,052 | | | | (185,192) | | | | (163,006 | ) | | | (22,186 | ) |
| | | | | | | | | | | | | | | | | | | | | | | | | | | | | | | | |
| | | | | | | | | | | | | | | | | | | | | | $ | (227,506 | ) | | $ | (191,818 | ) | | $ | (35,688 | ) |
| | | | | | | | | | | | | | | | | | | | | | | | | | | | | | | | |
Centrally Cleared Credit Default Swaps — Sell Protection
| | | | | | | | | | | | | | | | | | | | | | | | | | | | | | | | | | | | |
| Reference Obligation/Index | | Financing
Rate Received
by the Fund | | | Payment
Frequency | | | Termination
Date | | | Credit
Rating (a)
| | | Notional
Amount
(000)(b) | | | Value | | | Upfront
Premium
Paid
(Received) | | | Unrealized
Appreciation
(Depreciation) | |
ITRAXX.EUR.
CROSSOVER.32.V1 | | | 5.00 | % | | | Quarterly | | | | 12/20/24 | | | | CCC+ | | | | EUR | | | | 333 | | | $ | 51,529 | | | $ | 49,873 | | | $ | 1,656 | |
| | | | | | | | | | | | | | | | | | | | | | | | | | | | | | | | | | | | |
| (a) | Using the rating of the issuer or the underlying securities of the index, as applicable, provided by S&P Global Ratings. | |
| (b) | The maximum potential amount the Fund may pay should a negative credit event take place as defined under the terms of the agreement. | |
| | |
| 88 | | 2019 BLACKROCK ANNUAL REPORTTO SHAREHOLDERS |
| | |
Consolidated Schedule of Investments (continued) December 31, 2019 | | BlackRock Global Allocation Portfolio |
Centrally Cleared Interest Rate Swaps
| | | | | | | | | | | | | | | | | | | | | | | | | | | | | | |
Paid by the Fund | | Received by the Fund | | | | | | | | | | | | | | | | | | |
| Rate | | Frequency | | Rate | | Frequency | | Termination
Date | | | Notional Amount (000) | | | Value | | | Upfront
Premium
Paid
(Received) | | | Unrealized
Appreciation
(Depreciation) | |
| 3 month BA | | Semi-Annual | | 1.91% | | Semi-Annual | | | 07/09/21 | | | | CAD | | | | 352 | | | $ | (458 | ) | | $ | — | | | $ | (458 | ) |
| 3 month BA | | Semi-Annual | | 1.91% | | Semi-Annual | | | 07/09/21 | | | | CAD | | | | 5,597 | | | | (7,067 | ) | | | — | | | | (7,067 | ) |
| 1.55% | | Semi-Annual | | 3 month LIBOR | | Quarterly | | | 09/27/24 | | | | USD | | | | 1,693 | | | | 7,153 | | | | — | | | | 7,153 | |
| 1.56% | | Semi-Annual | | 3 month LIBOR | | Quarterly | | | 11/08/24 | | | | USD | | | | 2,579 | | | | 22,941 | | | | — | | | | 22,941 | |
| 3 month LIBOR | | Quarterly | | 1.28% | | Semi-Annual | | | 11/29/24 | | | | USD | | | | 1,240 | | | | (27,371 | ) | | | — | | | | (27,371 | ) |
| 1.53% | | Semi-Annual | | 3 month LIBOR | | Quarterly | | | 12/02/24 | | | | USD | | | | 2,480 | | | | 24,957 | | | | — | | | | 24,957 | |
| 3 month LIBOR | | Quarterly | | 1.75% | | Semi-Annual | | | 11/08/29 | | | | USD | | | | 595 | | | | (8,497 | ) | | | — | | | | (8,497 | ) |
| | | | | | | | | | | | | | | | | | | | | | | | | | | | | | |
| | | | | | | | | | | | | | | | | | | | $ | 11,658 | | | $ | — | | | $ | 11,658 | |
| | | | | | | | | | | | | | | | | | | | | | | | | | | | | | |
OTC Credit Default Swaps — Buy Protection
| | | | | | | | | | | | | | | | | | | | | | | | | | | | | | | | | | |
Reference Obligation/
Index | | Financing
Rate Paid
by the Fund | | | Payment
Frequency | | | Counterparty | | Termination
Date | | | Notional Amount (000) | | | Value | | | Upfront
Premium
Paid
(Received) | | | Unrealized
Appreciation
(Depreciation) | |
TUI AG | | | 5.00 | % | | | Quarterly | | | Credit Suisse International | | | 12/20/24 | | | | EUR | | | | 80 | | | $ | (9,793 | ) | | $ | (7,721 | ) | | $ | (2,072 | ) |
| | | | | | | | | | | | | | | | | | | | | | | | | | | | | | | | | | |
OTC Total Return Swaps
| | | | | | | | | | | | | | | | | | | | | | | | | | | | | | | | | | | | |
| Reference Entity | | Fixed Amount Paid
/ (Received) by the Fund (a) | | | Counterparty | | | Termination
Date | | | Notional
Amount
(000) | | | Value | | | Upfront
Premium
Paid
(Received) | | | Unrealized
Appreciation
(Depreciation) | |
EURO STOXX Banks Index Futures March 2020 | | | EUR | | | | 167,445 | | |
| Morgan Stanley &Co.
International plc |
| | | 03/20/20 | | | | EUR | | | | 167 | | | $ | (3,045 | ) | | $ | — | | | $ | (3,045 | ) |
S&P 500 Index Annual Dividend Future December 2020 | | | USD | | | | 35,981 | | | | Goldman Sachs International | | | | 12/18/20 | | | | USD | | | | 36 | | | | 9,619 | | | | — | | | | 9,619 | |
S&P 500 Index Annual Dividend Future December 2021 | | | USD | | | | 48,550 | | | | BNP Paribas SA | | | | 12/17/21 | | | | USD | | | | 49 | | | | 13,800 | | | | — | | | | 13,800 | |
| | | | | | | | | | | | | | | | | | | | | | | | | | | | | | | | | | | | |
| | | | | | | | | | | | | | | | | | | | | | | | | | $ | 20,374 | | | $ | — | | | $ | 20,374 | |
| | | | | | | | | | | | | | | | | | | | | | | | | | | | | | | | | | | | |
| (a) | At termination, the fixed amount paid (received) will be exchanged for the total return of the reference entity. |
| | | | |
| CONSOLIDATED SCHEDULES OF INVESTMENTS | | | 89 | |
| | |
Consolidated Schedule of Investments (continued) December 31, 2019 | | BlackRock Global Allocation Portfolio |
OTC Total Return Swaps (a)
| | | | | | | | | | | | | | | | | | | | | | |
| Reference Entity | | Counterparty | | Termination Date | | | Net Notional | | | Unrealized
Appreciation
(Depreciation) | | | Net Value of
Reference
Entity | | | Gross
Notional
Amount
Net Asset
Percentage | |
Equity Securities Long/Short | | Citibank NA | | | 02/24/23 | | | | $(186,288 | ) | | $ | (2,946 | )(b) | | $ | (189,017 | ) | | | 0.1 | % |
| | JPMorgan Chase Bank NA | | | 02/08/23 | | | | (233,910 | ) | | | (103,606 | )(c) | | | (250,122 | ) | | | 0.1 | % |
| | | | | | | | | | | | | | | | | | | | | | |
| | | | | | | | | | | | $ | (106,552 | ) | | $ | (439,139 | ) | | | | |
| | | | | | | | | | | | | | | | | | | | | | |
| (a) | The Fund receives or pays the total return on a portfolio of long and short positions underlying the total return swap. In addition, the Fund pays or receives a variable rate of interest, based on a specified benchmark, plus or minus a spread in a range of0-152 basis points. The benchmark and spread are determined based upon the country and/or currency of the individual underlying positions. The following are the specified benchmarks used in determining the variable rate of interest: |
Intercontinental Exchange LIBOR:
USD 1 Week
USD 1 Month
USD Overnight Bank Funding Rate
| (b) | Amount includes $(217) of net dividends and financing fees. |
| (c) | Amount includes $(87,394) of net dividends and financing fees. |
The following table represents the individual short positions and related values of equity securities underlying the total return swap with Citibank NA, as of December 31, 2019, expiration date 02/24/2023:
| | | | | | | | | | | | |
| | | Shares | | | Value | | | % of Basket
Value | |
| | | |
Reference Entity — Short | | | | | | | | | | | | |
| | | |
| China | | | | | | | | | |
China Communications Services Corp. Ltd., Class H | | | (2,000 | ) | | $ | (1,458 | ) | | | 0.8 | % |
China Everbright International Ltd. | | | (9,000 | ) | | | (7,217 | ) | | | 3.8 | |
China International Capital Corp. Ltd., Class H | | | (800 | ) | | | (1,542 | ) | | | 0.8 | |
China Molybdenum Co. Ltd., Class H | | | (15,000 | ) | | | (6,436 | ) | | | 3.4 | |
China Vanke Co. Ltd., Class H | | | (700 | ) | | | (2,986 | ) | | | 1.6 | |
Haidilao International Holding Ltd. | | | (1,000 | ) | | | (4,016 | ) | | | 2.1 | |
Longfor Group Holdings Ltd. | | | (1,000 | ) | | | (4,683 | ) | | | 2.5 | |
Meituan Dianping, Class B | | | (600 | ) | | | (7,840 | ) | | | 4.1 | |
Pinduoduo, Inc., ADR | | | (240 | ) | | | (9,077 | ) | | | 4.8 | |
Shanghai Fosun Pharmaceutical Group Co. Ltd., Class H | | | (1,000 | ) | | | (3,018 | ) | | | 1.6 | |
Xiaomi Corp., Class B | | | (11,600 | ) | | | (16,064 | ) | | | 8.5 | |
ZTE Corp., Class H | | | (1,000 | ) | | | (3,061 | ) | | | 1.6 | |
ZTO Express Cayman, Inc., ADR | | | (385 | ) | | | (8,990 | ) | | | 4.8 | |
| | | | | | | | | | | | |
| | | | | | | (76,388 | ) | | | | |
| | | |
| Germany | | | | | | | | | |
Volkswagen AG | | | (13 | ) | | | (2,518 | ) | | | 1.3 | |
| | | | | | | | | | | | |
| | | |
| Hong Kong | | | | | | | | | |
Sino Biopharmaceutical Ltd. | | | (8,000 | ) | | | (11,192 | ) | | | 5.9 | |
| | | | | | | | | | | | |
| | | |
| Macau | | | | | | | | | |
Galaxy Entertainment Group Ltd. | | | (2,000 | ) | | | (14,723 | ) | | | 7.8 | |
| | | | | | | | | | | | |
| | | |
| Poland | | | | | | | | | |
Polskie Gornictwo Naftowe i | | | | | | | | | | | | |
Gazownictwo SA | | | (2,239 | ) | | | (2,554 | ) | | | 1.4 | |
| | | | | | | | | | | | |
| | | | | | | | | | | | |
| | | Shares | | | Value | | | % of Basket
Value | |
| | | |
| South Korea | | | | | | | | | |
Celltrion Healthcare Co. Ltd. | | | (165 | ) | | $ | (7,518 | ) | | | 4.0 | % |
Korea Shipbuilding &Offshore Engineering Co. Ltd. | | | (47 | ) | | | (5,114 | ) | | | 2.7 | |
LG Display Co. Ltd. | | | (694 | ) | | | (9,709 | ) | | | 5.1 | |
Lotte Corp. | | | (167 | ) | | | (5,613 | ) | | | 3.0 | |
| | | | | | | | | | | | |
| | | | | | | (27,954 | ) | | | | |
| | | |
| Spain | | | | | | | | | |
Ferrovial SA | | | (150 | ) | | | (4,545 | ) | | | 2.4 | |
| | | | | | | | | | | | |
| | | |
| Taiwan | | | | | | | | | |
China Steel Corp. | | | (1,000 | ) | | | (798 | ) | | | 0.4 | |
| | | | | | | | | | | | |
| | | |
| United States | | | | | | | | | |
Aptiv plc | | | (88 | ) | | | (8,357 | ) | | | 4.4 | |
Archer-Daniels-Midland Co. | | | (16 | ) | | | (742 | ) | | | 0.4 | |
Corteva, Inc. | | | (107 | ) | | | (3,163 | ) | | | 1.7 | |
Equinix, Inc. | | | (2 | ) | | | (1,167 | ) | | | 0.6 | |
Freeport-McMoRan, Inc. | | | (613 | ) | | | (8,043 | ) | | | 4.3 | |
Hormel Foods Corp. | | | (279 | ) | | | (12,586 | ) | | | 6.7 | |
Marriott International, Inc., Class A | | | (26 | ) | | | (3,937 | ) | | | 2.1 | |
Nucor Corp. | | | (87 | ) | | | (4,896 | ) | | | 2.6 | |
Occidental Petroleum Corp. | | | (28 | ) | | | (1,154 | ) | | | 0.6 | |
T-Mobile US, Inc. | | | (20 | ) | | | (1,569 | ) | | | 0.8 | |
| | |
| 90 | | 2019 BLACKROCK ANNUAL REPORTTO SHAREHOLDERS |
| | |
Consolidated Schedule of Investments (continued) December 31, 2019 | | BlackRock Global Allocation Portfolio |
| | | | | | | | | | | | |
| | | Shares | | | Value | | | % of Basket
Value | |
|
| United States (continued) | |
Tyson Foods, Inc., Class A | | | (30 | ) | | $ | (2,731 | ) | | | 1.4 | % |
| | | | | | | | | | | | |
| | | | | | | (48,345 | ) | | | | |
| | | | | | | | | | | | |
| | | |
Total Reference Entity — Short | | | | | | | (189,017 | ) | | | | |
| | | | | | | | | | | | |
| | |
Net Value of Reference Entity — Citibank NA | | | $ | (189,017) | | | | | |
| | | | | | | | | | | | |
The following table represents the individual short positions and related values of equity securities underlying the total return swap with JPMorgan Chase Bank NA, as of December 31, 2019, expiration date 02/08/2023:
| | | | | | | | | | | | |
|
Reference Entity — Short | |
| | | |
| Australia | | | | | | | | | |
Australia & New Zealand Banking Group Ltd. | | | (27 | ) | | | (466 | ) | | | 0.2 | |
Origin Energy Ltd. | | | (820 | ) | | | (4,862 | ) | | | 1.9 | |
Transurban Group | | | (780 | ) | | | (8,164 | ) | | | 3.3 | |
| | | | | | | | | | | | |
| | | | | | | (13,492 | ) | | | | |
| | | |
| Brazil | | | | | | | | | |
Centrais Eletricas Brasileiras SA | | | (127 | ) | | | (1,193 | ) | | | 0.5 | |
Hapvida Participacoes e Investimentos SA | | | (346 | ) | | | (5,505 | ) | | | 2.2 | |
Lojas Americanas SA | | | (1 | ) | | | (2 | ) | | | (0.0 | ) |
Lojas Americanas SA (Preference) | | | (172 | ) | | | (1,111 | ) | | | 0.4 | |
Magazine Luiza SA | | | (399 | ) | | | (4,716 | ) | | | 1.9 | |
Suzano SA | | | (1,647 | ) | | | (16,349 | ) | | | 6.5 | |
TIM Participacoes SA | | | (100 | ) | | | (386 | ) | | | 0.2 | |
| | | | | | | | | | | | |
| | | | | | | (29,262 | ) | | | | |
| | | |
| Canada | | | | | | | | | |
Cenovus Energy, Inc. | | | (170 | ) | | | (1,728 | ) | | | 0.7 | |
Franco-Nevada Corp. | | | (20 | ) | | | (2,065 | ) | | | 0.8 | |
Saputo, Inc. | | | (68 | ) | | | (2,105 | ) | | | 0.9 | |
| | | | | | | | | | | | |
| | | | | | | (5,898 | ) | | | | |
| | | |
| China | | | | | | | | | |
Autohome, Inc., ADR | | | (33 | ) | | | (2,640 | ) | | | 1.0 | |
China Everbright International Ltd. | | | (4,000 | ) | | | (3,208 | ) | | | 1.3 | |
China Gas Holdings Ltd. | | | (1,000 | ) | | | (3,744 | ) | | | 1.5 | |
China Jinmao Holdings Group Ltd. | | | (6,000 | ) | | | (4,671 | ) | | | 1.9 | |
China Southern Airlines Co. Ltd., Class H | | | (24,000 | ) | | | (16,137 | ) | | | 6.4 | |
China State Construction | | | | | | | | | | | | |
International Holdings Ltd. | | | (14,000 | ) | | | (12,711 | ) | | | 5.1 | |
Geely Automobile Holdings Ltd. | | | (7,000 | ) | | | (13,705 | ) | | | 5.5 | |
iQIYI, Inc., ADR | | | (754 | ) | | | (15,917 | ) | | | 6.4 | |
Shenzhou International Group Holdings Ltd. | | | (100 | ) | | | (1,462 | ) | | | 0.6 | |
Shimao Property Holdings Ltd. | | | (500 | ) | | | (1,938 | ) | | | 0.8 | |
Sunny Optical Technology Group Co. Ltd. | | | (200 | ) | | | (3,465 | ) | | | 1.4 | |
Trip.com Group Ltd., ADR | | | (18 | ) | | | (604 | ) | | | 0.2 | |
| | | | | | | | | | | | |
| | | | | | | (80,202 | ) | | | | |
| | | | | | | | | | | | |
| | | Shares | | | Value | | | % of Basket
Value | |
| | | |
| Finland | | | | | | | | | |
Neste OYJ | | | (338 | ) | | $ | (11,761 | ) | | | 4.7 | % |
| | | | | | | | | | | | |
| | | |
| Germany | | | | | | | | | |
Daimler AG (Registered) | | | (28 | ) | | | (1,548 | ) | | | 0.6 | |
Volkswagen AG (Preference) | | | (19 | ) | | | (3,740 | ) | | | 1.5 | |
| | | | | | | | | | | | |
| | | | | | | (5,288 | ) | | | | |
| | | |
| Hong Kong | | | | | | | | | |
Nine Dragons Paper Holdings Ltd. | | | (1,000 | ) | | | (1,040 | ) | | | 0.4 | |
| | | | | | | | | | | | |
| | | |
| Japan | | | | | | | | | |
LINE Corp. | | | (100 | ) | | | (4,913 | ) | | | 2.0 | |
M3, Inc. | | | (100 | ) | | | (3,016 | ) | | | 1.2 | |
Renesas Electronics Corp. | | | (500 | ) | | | (3,416 | ) | | | 1.4 | |
Sony Financial Holdings, Inc. | | | (100 | ) | | | (2,400 | ) | | | 0.9 | |
| | | | | | | | | | | | |
| | | | | | | (13,745 | ) | | | | |
| | | |
| Poland | | | | | | | | | |
mBank SA | | | (3 | ) | | | (308 | ) | | | 0.1 | |
Santander Bank Polska SA | | | (19 | ) | | | (1,539 | ) | | | 0.6 | |
| | | | | | | | | | | | |
| | | | | | | (1,847 | ) | | | | |
| | | |
| Singapore | | | | | | | | | |
Jardine Cycle & Carriage Ltd. | | | (100 | ) | | | (2,236 | ) | | | 0.9 | |
| | | | | | | | | | | | |
| | | |
| South Africa | | | | | | | | | |
Capitec Bank Holdings Ltd. | | | (21 | ) | | | (2,168 | ) | | | 0.9 | |
Shoprite Holdings Ltd. | | | (898 | ) | | | (8,077 | ) | | | 3.2 | |
| | | | | | | | | | | | |
| | | | | | | (10,245 | ) | | | | |
| | | |
| South Korea | | | | | | | | | |
Amorepacific Corp. | | | (87 | ) | | | (6,046 | ) | | | 2.4 | |
Hyundai Steel Co. | | | (187 | ) | | | (5,070 | ) | | | 2.0 | |
LG Display Co. Ltd. | | | (422 | ) | | | (5,904 | ) | | | 2.4 | |
Lotte Corp. | | | (37 | ) | | | (1,244 | ) | | | 0.5 | |
Samsung C&T Corp. | | | (8 | ) | | | (749 | ) | | | 0.3 | |
SK Hynix, Inc. | | | (58 | ) | | | (4,717 | ) | | | 1.9 | |
| | | | | | | | | | | | |
| | | | | | | (23,730 | ) | | | | |
| | | |
| United Kingdom | | | | | | | | | |
British American Tobacco plc | | | (112 | ) | | | (4,760 | ) | | | 1.9 | |
Royal Bank of Scotland Group plc | | | (1,549 | ) | | | (4,969 | ) | | | 2.0 | |
| | | | | | | | | | | | |
| | | | | | | (9,729 | ) | | | | |
| | | |
| United States | | | | | | | | | |
Advanced Micro Devices, Inc. | | | (259 | ) | | | (11,878 | ) | | | 4.7 | |
Conagra Brands, Inc. | | | (315 | ) | | | (10,786 | ) | | | 4.3 | |
Dominion Energy,Inc. | | | (58 | ) | | | (4,804 | ) | | | 1.9 | |
Edison International | | | (68 | ) | | | (5,128 | ) | | | 2.1 | |
Fox Corp., Class A | | | (205 | ) | | | (7,558 | ) | | | 3.0 | |
PPL Corp. | | | (4 | ) | | | (143 | ) | | | 0.1 | |
Southwest Airlines Co. | | | (6 | ) | | | (324 | ) | | | 0.1 | |
Sprint Corp. | | | (197 | ) | | | (1,026 | ) | | | 0.4 | |
| | | | | | | | | | | | |
| | | | | | | (41,647 | ) | | | | |
| | | | | | | | | | | | |
| | | |
Total Reference Entity — Short | | | | | | | (250,122 | ) | | | | |
| | | | | | | | | | | | |
| | |
Net Value of Reference Entity — JPMorgan Chase Bank NA | | | $ | (250,122) | | | | | |
| | | | | | | | | | | | |
| | | | |
| CONSOLIDATED SCHEDULESOF INVESTMENTS | | | 91 | |
| | |
Consolidated Schedule of Investments (continued) December 31, 2019 | | BlackRock Global Allocation Portfolio |
The following reference rates, and their values as of period end, are used for security descriptions:
| | | | | | | | |
| Reference Index | | | | | Reference Rate | |
3 month BA | | | Canadian Bankers Acceptances | | | | 2.08 | % |
3 month LIBOR | | | London Interbank Offered Rate | | | | 1.91 | % |
Balances Reported in the Statements of Assets and Liabilities for Centrally Cleared Swaps, OTC Swaps and Options Written
| | | | | | | | | | | | | | | | | | | | |
| | | Swap
Premiums
Paid | | | Swap
Premiums
Received | | | Unrealized
Appreciation | | | Unrealized
Depreciation | | | Value | |
Centrally Cleared Swaps (a) | | $ | 49,873 | | | $ | (191,818 | ) | | $ | 56,707 | | | $ | (79,081) | | | $ | — | |
OTC Swaps | | | — | | | | (7,721 | ) | | | 23,419 | | | | (111,669 | ) | | | — | |
Options Written | | | N/A | | | | N/A | | | | 196,614 | | | | (57,217 | ) | | | (350,997 | ) |
| (a) | | Includes cumulative appreciation (depreciation) on centrally cleared swaps, as reported in the Consolidated Schedule of Investments. Only current day’s variation margin is reported within the Statements of Assets and Liabilities and is net of any previously paid (received) swap premium amounts. |
Derivative Financial Instruments Categorized by Risk Exposure
As of period end, the fair values of derivative financial instruments located in the Statements of Assets and Liabilities were as follows:
| | | | | | | | | | | | | | | | | | | | | | | | | | | | |
| | | Commodity
Contracts | | | Credit
Contracts | | | Equity
Contracts | | | Foreign
Currency
Exchange
Contracts | | | Interest
Rate
Contracts | | | Other
Contracts | | | Total | |
Assets — Derivative Financial Instruments | | | | | | | | | | | | | | | | | | | | | | | | | |
Futures contracts | | | | | | | | | | | | | | | | | | | | | | | | | | | | |
Unrealized appreciation on futures contracts (a) | | $ | — | | | $ | — | | | $ | 7,508 | | | $ | — | | | $ | 9,825 | | | $ | — | | | $ | 17,333 | |
Forward foreign currency exchange contracts | | | | | | | | | | | | | | | | | | | | | | | | | | | | |
Unrealized appreciation on forward foreign currency exchange contracts | | | — | | | | — | | | | — | | | | 576,675 | | | | — | | | | — | | | | 576,675 | |
Options purchased | | | | | | | | | | | | | | | | | | | | | | | | | | | | |
Investments at value — unaffiliated (b) | | | — | | | | — | | | | 586,936 | | | | 85,166 | | | | 53,238 | | | | — | | | | 725,340 | |
Swaps — centrally cleared | | | | | | | | | | | | | | | | | | | | | | | | | | | | |
Unrealized appreciation on centrally
cleared swaps (a) | | | — | | | | 1,656 | | | | — | | | | — | | | | 55,051 | | | | — | | | | 56,707 | |
Swaps — OTC | | | | | | | | | | | | | | | | | | | | | | | | | | | | |
Unrealized appreciation on OTC swaps; Swap premiums paid | | | — | | | | — | | | | 23,419 | | | | — | | | | — | | | | — | | | | 23,419 | |
| | | | |
| | $ | — | | | $ | 1,656 | | | $ | 617,863 | | | $ | 661,841 | | | $ | 118,114 | | | $ | — | | | $ | 1,399,474 | |
| | | | |
| | | | | | |
| Liabilities — Derivative Financial Instruments | | | | | | | | | | | | | | | | | | | |
Futures contracts | | | | | | | | | | | | | | | | | | | | | | | | | | | | |
Unrealized depreciation on futures contracts (a) | | | — | | | | — | | | | 2,464 | | | | — | | | | 15,056 | | | | — | | | | 17,520 | |
Forward foreign currency exchange contracts | | | | | | | | | | | | | | | | | | | | | | | | | | | | |
Unrealized depreciation on forward foreign currency exchange contracts | | | — | | | | — | | | | — | | | | 288,931 | | | | — | | | | — | | | | 288,931 | |
Options written | | | | | | | | | | | | | | | | | | | | | | | | | | | | |
Options written at value | | | — | | | | — | | | | 319,559 | | | | 21,024 | | | | 10,414 | | | | — | | | | 350,997 | |
Swaps — centrally cleared | | | | | | | | | | | | | | | | | | | | | | | | | | | | |
Unrealized depreciation on centrally
cleared swaps (a) | | | — | | | | 35,688 | | | | — | | | | — | | | | 43,393 | | | | — | | | | 79,081 | |
Swaps — OTC | | | | | | | | | | | | | | | | | | | | | | | | | | | | |
Unrealized depreciation on OTC swaps; Swap premiums received | | | — | | | | 9,793 | | | | 109,597 | | | | — | | | | — | | | | — | | | | 119,390 | |
| | | | |
| | $ | — | | | $ | 45,481 | | | $ | 431,620 | | | $ | 309,955 | | | $ | 68,863 | | | $ | — | | | $ | 855,919 | |
| | | | |
| (a) | | Net cumulative unrealized appreciation (depreciation) on futures contracts and centrally cleared swaps, if any,are reported in the Consolidated Schedule of Investments.In the Statements of Assets and Liabilities, only current day’s variation margin is reported in receivables or payables and the net cumulative unrealized appreciation (depreciation) is included in accumulated earnings (loss). |
| (b) | | Includes options purchased at value as reported in the Consolidated Schedule of Investments. |
| | |
| 92 | | 2019 BLACKROCK ANNUAL REPORTTO SHAREHOLDERS |
| | |
Consolidated Schedule of Investments (continued) December 31, 2019 | | BlackRock Global Allocation Portfolio |
For the year ended December 31, 2019, the effect of derivative financial instruments in the Statements of Operations was as follows:
| | | | | | | | | | | | | | | | | | | | | | | | | | | | |
| | | Commodity
Contracts | | | Credit
Contracts | | | Equity
Contracts | | | Foreign
Currency
Exchange
Contracts | | | Interest
Rate
Contracts | | | Other
Contracts | | | Total | |
Net Realized Gain (Loss) from: | | | | | | | | | | | | | | | | | | | | | | | | | | | | |
Futures contracts | | $ | — | | | $ | — | | | $ | (857,334 | ) | | $ | — | | | $ | (204,892 | ) | | $ | — | | | $ | (1,062,226 | ) |
Forward foreign currency exchange contracts | | | — | | | | — | | | | — | | | | (70,029 | ) | | | — | | | | — | | | | (70,029 | ) |
Options purchased (a) | | | — | | | | — | | | | (242,679 | ) | | | (216,895 | ) | | | 192,350 | | | | — | | | | (267,224 | ) |
Options written | | | — | | | | — | | | | 478,375 | | | | 129,482 | | | | (39,049 | ) | | | — | | | | 568,808 | |
Swaps | | | — | | | | (19,563 | ) | | | (121,297 | ) | | | — | | | | 71,426 | | | | — | | | | (69,434 | ) |
| | | | |
| | $ | — | | | $ | (19,563 | ) | | $ | (742,935 | ) | | $ | (157,442 | ) | | $ | 19,835 | | | $ | — | | | $ | (900,105 | ) |
| | | | |
| | | | | | | |
| Net Change in Unrealized Appreciation (Depreciation) on: | | | | | | | | | | | | | | | | | | | | | |
Futures contracts | | | — | | | | — | | | | (129,986 | ) | | | — | | | | 12,862 | | | | — | | | | (117,124 | ) |
Forward foreign currency exchange contracts | | | — | | | | — | | | | — | | | | 306,140 | | | | — | | | | — | | | | 306,140 | |
Options purchased (b) | | | — | | | | — | | | | 567,643 | | | | (11,264 | ) | | | (99,803 | ) | | | — | | | | 456,576 | |
Options written | | | — | | | | — | | | | 502,750 | | | | 11,651 | | | | 100,150 | | | | — | | | | 614,551 | |
Swaps | | | — | | | | (41,932 | ) | | | (173,399 | ) | | | — | | | | (156,848 | ) | | | — | | | | (372,179 | ) |
| | | | |
| | $ | — | | | $ | (41,932 | ) | | $ | 767,008 | | | $ | 306,527 | | | $ | (143,639 | ) | | $ | — | | | $ | 887,964 | |
| | | | |
| (a) | Options purchased are included in net realized gain (loss) from investments — unaffiliated. |
| (b) | Options purchased are included in net change in unrealized appreciation (depreciation) on investments — unaffiliated. |
Average Quarterly Balances of Outstanding Derivative Financial Instruments
| | | | |
Futures contracts: | | | | |
Average notional value of contracts — long | | $ | 12,680,287 | |
Average notional value of contracts — short | | | 5,853,740 | |
Forward foreign currency exchange contracts: | | | | |
Average amounts purchased — in USD | | | 8,086,789 | |
Average amounts sold — in USD | | | 16,765,184 | |
Options: | | | | |
Average value of option contracts purchased | | | 633,046 | |
Average value of option contracts written | | | 592,951 | |
Average notional value of swaption contracts purchased | | | 10,658,278 | |
Average notional value of swaption contracts written | | | 16,615,539 | |
Credit default swaps: | | | | |
Average notional value — buy protection | | | 2,021,423 | |
Average notional value — sell protection | | | 93,397 | |
Interest rate swaps: | | | | |
Average notional value — pays fixed rate | | | 3,519,286 | |
Average notional value — receives fixed rate | | | 4,239,917 | |
Total return swaps: | | | | |
Average notional value | | | 330,061 | |
For more information about the Fund’s investment risks regarding derivative financial instruments, refer to the Notes to Financial Statements.
| | | | |
| CONSOLIDATED SCHEDULES OF INVESTMENTS | | | 93 | |
| | |
Consolidated Schedule of Investments (continued) December 31, 2019 | | BlackRock Global Allocation Portfolio |
Derivative Financial Instruments — Offsetting as of Period End
The Fund’s derivative assets and liabilities (by type) were as follows:
| | | | | | | | |
| | | Assets | | | Liabilities | |
Derivative Financial Instruments: | | | | | | | | |
Futures contracts | | $ | 33,800 | | | $ | 6,589 | |
Forward foreign currency exchange contracts | | | 576,675 | | | | 288,931 | |
Options (a) | | | 725,340 | | | | 350,997 | |
Swaps — Centrally cleared | | | 10,314 | | | | — | |
Swaps — OTC(b) | | | 23,419 | | | | 119,390 | |
| | | | |
Total derivative assets and liabilities in the Statements of Assets and Liabilities | | $ | 1,369,548 | | | $ | 765,907 | |
Derivatives not subject to a Master Netting Agreement or similar agreement (“MNA”) | | | (317,916 | ) | | | (37,850 | ) |
| | | | |
Total derivative assets and liabilities subject to an MNA | | $ | 1,051,632 | | | $ | 728,057 | |
| | | | |
| (a) | Includes options purchased at value which is included in Investments at value – unaffiliated in the Statements of Assets and Liabilities and reported in the Consolidated Schedule of Investments. | |
| (b) | Includes unrealized appreciation (depreciation) on OTC swaps and swap premiums (paid/received) in the Statements of Assets and Liabilities. | |
The following tables present the Fund’s derivative assets and liabilities by counterparty net of amounts available for offset under an MNA and net of the related collateral received and pledged by the Fund:
| | | | | | | | | | | | | | | | | | | | |
| Counterparty | | Derivative
Assets
Subject to
an MNA by
Counterparty | | | Derivatives
Available
for Offset (a) | | | Non-cash
Collateral
Received | | | Cash
Collateral
Received | | | Net Amount
of Derivative
Assets (b) | |
Bank of America NA | | $ | 50,665 | | | $ | (31,968 | ) | | $ | — | | | $ | — | | | $ | 18,697 | |
Barclays Bank plc | | | 19,439 | | | | (19,439 | ) | | | — | | | | — | | | | — | |
BNPParibas SA | | | 38,403 | | | | (22,014 | ) | | | — | | | | — | | | | 16,389 | |
Citibank NA | | | 138,283 | | | | (117,425 | ) | | | — | | | | — | | | | 20,858 | |
Credit Suisse International | | | 56,150 | | | | (53,326 | ) | | | — | | | | — | | | | 2,824 | |
Deutsche Bank AG | | | 28,613 | | | | (28,613 | ) | | | — | | | | — | | | | — | |
Goldman Sachs International | | | 55,231 | | | | (6,343 | ) | | | — | | | | — | | | | 48,888 | |
HSBC Bank plc | | | 16,654 | | | | — | | | | — | | | | — | | | | 16,654 | |
JPMorgan Chase Bank NA | | | 346,676 | | | | (186,005 | ) | | | — | | | | — | | | | 160,671 | |
Morgan Stanley &Co. International plc | | | 137,034 | | | | (126,687 | ) | | | — | | | | — | | | | 10,347 | |
Morgan Stanley &Co. International plc(c) | | | 33,587 | | | | (3,420 | ) | | | — | | | | — | | | | 30,167 | |
Nomura International plc | | | 34,482 | | | | (21,163 | ) | | | — | | | | — | | | | 13,319 | |
Societe Generale SA | | | 7,999 | | | | (3,625 | ) | | | — | | | | — | | | | 4,374 | |
Societe Generale SA(c) | | | 48,059 | | | | (345 | ) | | | — | | | | — | | | | 47,714 | |
Standard Chartered Bank | | | 5,806 | | | | — | | | | — | | | | — | | | | 5,806 | |
UBS AG | | | 34,551 | | | | (34,551 | ) | | | — | | | | — | | | | — | |
| | | | | | | | | | | | | | | | | | | | |
| | $ | 1,051,632 | | | $ | (654,924 | ) | | $ | — | | | $ | — | | | $ | 396,708 | |
| | | | | | | | | | | | | | | | | | | | |
| | |
| 94 | | 2019 BLACKROCK ANNUAL REPORTTO SHAREHOLDERS |
| | |
Consolidated Schedule of Investments (continued) December 31, 2019 | | BlackRock Global Allocation Portfolio |
| | | | | | | | | | | | | | | | | | | | |
| Counterparty | | Derivative
Liabilities
Subject to
an MNA by
Counterparty | | | Derivatives
Available for Offset (a) | | | Non-cash
Collateral
Pledged | | | Cash
Collateral
Pledged | | | Net Amount
of Derivative
Liabilities (d) | |
Bank of America NA | | $ | 31,968 | | | $ | (31,968 | ) | | $ | — | | | $ | — | | | $ | — | |
Barclays Bank plc | | | 59,711 | | | | (19,439 | ) | | | — | | | | — | | | | 40,272 | |
BNP Paribas SA | | | 22,014 | | | | (22,014 | ) | | | — | | | | — | | | | — | |
Citibank NA | | | 117,425 | | | | (117,425 | ) | | | — | | | | — | | | | — | |
Credit Suisse International | | | 53,326 | | | | (53,326 | ) | | | — | | | | — | | | | — | |
Deutsche Bank AG | | | 29,936 | | | | (28,613 | ) | | | — | | | | — | | | | 1,323 | |
Goldman Sachs International | | | 6,343 | | | | (6,343 | ) | | | — | | | | — | | | | — | |
JPMorgan Chase Bank NA | | | 186,005 | | | | (186,005 | ) | | | — | | | | — | | | | — | |
Morgan Stanley &Co. International plc | | | 126,687 | | | | (126,687 | ) | | | — | | | | — | | | | — | |
Morgan Stanley &Co. International plc(c) | | | 3,420 | | | | (3,420 | ) | | | — | | | | — | | | | — | |
Nomura International plc | | | 21,163 | | | | (21,163 | ) | | | — | | | | — | | | | — | |
Societe Generale SA | | | 3,625 | | | | (3,625 | ) | | | — | | | | — | | | | — | |
Societe Generale SA(c) | | | 345 | | | | (345 | ) | | | — | | | | — | | | | — | |
UBS AG | | | 66,089 | | | | (34,551 | ) | | | — | | | | — | | | | 31,538 | |
| | | | | | | | | | | | | | | | | | | | |
| | $ | 728,057 | | | $ | (654,924 | ) | | $ | — | | | $ | — | | | $ | 73,133 | |
| | | | | | | | | | | | | | | | | | | | |
| (a) | The amount of derivatives available for offset is limited to the amount of derivative assets and/or liabilities that are subject to an MNA. |
| (b) | Net amount represents the net amount receivable from the counterparty in the event of default. |
| (c) | Represents derivatives owned by the BlackRock Cayman Global Allocation Portfolio I, Ltd., a wholly-owned subsidiary of the Fund. See Note 1 of the Notes to Financial Statements. |
| (d) | Net amount represents the net amount payable due to the counterparty in the event of default. |
Fair Value Hierarchy as of Period End
Various inputs are used in determining the fair value of investments and derivative financial instruments. For information about the Fund’s policy regarding valuation of investments and derivative financial instruments, refer to the Notes to Financial Statements.
The following tables summarize the Fund’s investments and derivative financial instruments categorized in the disclosure hierarchy:
| | | | | | | | | | | | | | | | |
| | | Level 1 | | | Level 2 | | | Level 3 | | | Total | |
Assets: | | | | | | | | | | | | | | | | |
Investments: | | | | | | | | | | | | | | | | |
Long-Term Investments: | | | | | | | | | | | | | | | | |
Common Stocks: | | | | | | | | | | | | | | | | |
Argentina | | $ | 4,238 | | | $ | — | | | $ | — | | | $ | 4,238 | |
Australia | | | — | | | | 107,820 | | | | 147,532 | | | | 255,352 | |
Austria | | | — | | | | 94,244 | | | | — | | | | 94,244 | |
Belgium | | | — | | | | 137,972 | | | | — | | | | 137,972 | |
Brazil | | | 996,067 | | | | — | | | | — | | | | 996,067 | |
Canada | | | 1,090,119 | | | | — | | | | — | | | | 1,090,119 | |
Chile | | | 34,563 | | | | — | | | | — | | | | 34,563 | |
China | | | 1,534,161 | | | | 2,869,214 | | | | — | | | | 4,403,375 | |
Czech Republic | | | 54,344 | | | | — | | | | — | | | | 54,344 | |
Denmark | | | 30,688 | | | | 46,939 | | | | — | | | | 77,627 | |
Finland | | | — | | | | 4,561 | | | | — | | | | 4,561 | |
France | | | 696,158 | | | | 3,365,689 | | | | — | | | | 4,061,847 | |
Germany | | | 573,681 | | | | 2,370,325 | | | | — | | | | 2,944,006 | |
Hong Kong | | | — | | | | 1,110,785 | | | | — | | | | 1,110,785 | |
India | | | 52,750 | | | | 1,797,361 | | | | — | | | | 1,850,111 | |
Indonesia | | | — | | | | 89,466 | | | | — | | | | 89,466 | |
Italy | | | — | | | | 2,463,495 | | | | — | | | | 2,463,495 | |
Japan | | | — | | | | 7,278,375 | | | | — | | | | 7,278,375 | |
Malaysia | | | — | | | | 23,975 | | | | — | | | | 23,975 | |
Mexico | | | 7,598 | | | | — | | | | — | | | | 7,598 | |
Netherlands | | | 475,889 | | | | 3,191,838 | | | | — | | | | 3,667,727 | |
Poland | | | — | | | | 566 | | | | — | | | | 566 | |
Portugal | | | — | | | | 54,464 | | | | — | | | | 54,464 | |
Singapore | | | — | | | | 948,481 | | | | — | | | | 948,481 | |
South Africa | | | 8,355 | | | | 16,241 | | | | — | | | | 24,596 | |
South Korea | | | 48,544 | | | | 531,964 | | | | — | | | | 580,508 | |
Spain | | | — | | | | 801,491 | | | | — | | | | 801,491 | |
| | | | |
| CONSOLIDATED SCHEDULES OF INVESTMENTS | | | 95 | |
| | |
Consolidated Schedule of Investments (continued) December 31, 2019 | | BlackRock Global Allocation Portfolio |
| | | | | | | | | | | | | | | | |
| | | Level 1 | | | Level 2 | | | Level 3 | | | Total | |
Sweden | | $ | — | | | $ | 31,942 | | | $ | — | | | $ | 31,942 | |
Switzerland | | | — | | | | 1,966,823 | | | | — | | | | 1,966,823 | |
Taiwan | | | 56,043 | | | | 2,058,831 | | | | — | | | | 2,114,874 | |
Thailand | | | — | | | | 327,350 | | | | — | | | | 327,350 | |
Turkey | | | 1,663 | | | | 3,366 | | | | — | | | | 5,029 | |
United Arab Emirates | | | — | | | | 198,353 | | | | — | | | | 198,353 | |
United Kingdom | | | 103,186 | | | | 2,200,045 | | | | 190,743 | | | | 2,493,974 | |
United States | | | 68,926,858 | | | | 538,135 | | | | 889 | | | | 69,465,882 | |
Corporate Bonds | | | | | | | | | | | | | | | | |
Australia | | | — | | | | — | | | | 786,714 | | | | 786,714 | |
Chile | | | — | | | | 72 | | | | — | | | | 72 | |
China | | | — | | | | 300 | | | | — | | | | 300 | |
France | | | — | | | | 203,171 | | | | — | | | | 203,171 | |
Greece | | | — | | | | 156,760 | | | | — | | | | 156,760 | |
India | | | — | | | | 2 | | | | — | | | | 2 | |
Japan | | | — | | | | 346,273 | | | | — | | | | 346,273 | |
Luxembourg | | | — | | | | 37,971 | | | | — | | | | 37,971 | |
Netherlands | | | — | | | | 212,661 | | | | — | | | | 212,661 | |
Turkey | | | — | | | | — | | | | 106,000 | | | | 106,000 | |
United States | | | — | | | | 5,101,377 | | | | — | | | | 5,101,377 | |
Floating Rate Loan Interests(a) | | | — | | | | 887,904 | | | | — | | | | 887,904 | |
Foreign Government Obligations | | | — | | | | 13,822,466 | | | | — | | | | 13,822,466 | |
Investment Companies | | | 3,454,801 | | | | — | | | | — | | | | 3,454,801 | |
Non-Agency Mortgage-Backed Securities(a) | | | — | | | | 151,171 | | | | — | | | | 151,171 | |
Preferred Securities: | | | | | | | | | | | | | | | | |
Brazil | | | 99,468 | | | | — | | | | — | | | | 99,468 | |
Germany | | | — | | | | 538,506 | | | | — | | | | 538,506 | |
United Kingdom | | | — | | | | 624,160 | | | | 101 | | | | 624,261 | |
United States | | | 393,993 | | | | 949,139 | | | | 887,200 | | | | 2,230,332 | |
Rights(a) | | | 344 | | | | — | | | | — | | | | 344 | |
U.S. Government Sponsored Agency Securities | | | — | | | | 5,916,234 | | | | — | | | | 5,916,234 | |
U.S. Treasury Obligations | | | — | | | | 20,400,920 | | | | — | | | | 20,400,920 | |
Short-Term Securities: | | | | | | | | | | | | | | | | |
Foreign Government Obligations | | | — | | | | 5,517,553 | | | | — | | | | 5,517,553 | |
Money Market Funds | | | 557,532 | | | | — | | | | — | | | | 557,532 | |
Time Deposits(a) | | | — | | | | 41,291 | | | | — | | | | 41,291 | |
U.S. Treasury Obligations | | | — | | | | 18,497,843 | | | | — | | | | 18,497,843 | |
Options Purchased: | | | | | | | | | | | | | | | | |
Equity contracts | | | 273,802 | | | | 313,134 | | | | — | | | | 586,936 | |
Foreign currency exchange contracts | | | — | | | | 85,166 | | | | — | | | | 85,166 | |
Interest rate contracts | | | — | | | | 53,238 | | | | — | | | | 53,238 | |
Liabilities: | | | | | | | | | | | | | | | | |
Investment Sold Short | | | | | | | | | | | | | | | | |
Common Stocks: | | | | | | | | | | | | | | | | |
Germany | | | — | | | | (105,127 | ) | | | — | | | | (105,127 | ) |
United States | | | (286,045 | ) | | | — | | | | — | | | | (286,045 | ) |
| | | | | | | | | | | | | | | | |
Subtotal | | $ | 79,188,800 | | | $ | 108,382,296 | | | $ | 2,119,179 | | | $ | 189,690,275 | |
| | | | | | | | | | | | | | | | |
Investments valued at NAV(b) | | | | | | | | | | | | | | | 2,544,246 | |
| | | | | | | | | | | | | | | | |
Total Investments | | | | | | | | | | | | | | $ | 192,234,521 | |
| | | | | | | | | | | | | | | | |
Derivative Financial Instruments(c) | | | | | | | | | | | | | | | | |
Assets: | | | | | | | | | | | | | | | | |
Credit contracts | | $ | — | | | $ | 1,656 | | | $ | — | | | $ | 1,656 | |
Equity contracts | | | 7,508 | | | | 23,419 | | | | — | | | | 30,927 | |
Foreign currency exchange contracts | | | — | | | | 576,675 | | | | — | | | | 576,675 | |
Interest rate contracts | | | 9,825 | | | | 55,051 | | | | — | | | | 64,876 | |
Liabilities: | | | | | | | | | | | | | | | | |
Credit contracts | | | — | | | | (37,760 | ) | | | — | | | | (37,760 | ) |
Equity contracts | | | (33,725 | ) | | | (397,895 | ) | | | — | | | | (431,620 | ) |
Foreign currency exchange contracts | | | — | | | | (309,955 | ) | | | — | | | | (309,955 | ) |
Interest rate contracts | | | (15,056 | ) | | | (53,807 | ) | | | — | | | | (68,863 | ) |
| | | | | | | | | | | | | | | | |
| | $ | (31,448 | ) | | $ | (142,616 | ) | | $ | — | | | $ | (174,064 | ) |
| | | | | | | | | | | | | | | | |
| (a) | See above Consolidated Schedule of Investments for values in each country. |
| (b) | Certain investments of the Fund were fair valued using NAV per share as no quoted market value is available and therefore have been excluded from the fair value hierarchy. |
| | |
| 96 | | 2019 BLACKROCK ANNUAL REPORTTO SHAREHOLDERS |
| | |
Consolidated Schedule of Investments (continued) December 31, 2019 | | BlackRock Global Allocation Portfolio |
| (c) | Derivative financial instruments are swaps, futures contracts, forward foreign currency exchange contracts and options written. Swaps, futures contracts and forward foreign currency exchange contracts are valued at the unrealized appreciation (depreciation) on the instrument and options written are shown at value. |
A reconciliation of Level 3 investments is presented when the Fund had a significant amount of Level 3 investments at the beginning and/or end of the year in relation to net assets. The following table is a reconciliation of Level 3 investments for which significant unobservable inputs were used in determining fair value:
| | | | | | | | | | | | | | | | |
| | | Common
Stocks | | | Corporate
Bonds | | | Preferred
Securities | | | Total | |
Investments: | | | | | | | | | | | | | | | | |
Assets: | | | | | | | | | | | | | | | | |
Opening balance, as of December 31, 2018 | | $ | 200,896 | | | $ | 905,347 | | | $ | 1,746,553 | | | $ | 2,852,796 | |
Transfers into level 3 | | | — | | | | — | | | | — | | | | — | |
Transfers out of level 3 | | | (83,638 | ) | | | — | | | | (795,102 | ) | | | (878,740 | ) |
Accrued discounts/premiums | | | — | | | | (1,039 | ) | | | — | | | | (1,039 | ) |
Net realized loss | | | — | | | | (1,623 | ) | | | — | | | | (1,623 | ) |
Net change in unrealized appreciation (depreciation)(a)(b) | | | 34,742 | | | | (17,433 | ) | | | 90,050 | | | | 107,359 | |
Purchases | | | 187,164 | | | | 27,349 | | | | 264,528 | | | | 479,041 | |
Sales | | | — | | | | (19,887 | ) | | | (418,728 | ) | | | (438,615 | ) |
| | | | |
Closing balance, as of December 31, 2019 | | $ | 339,164 | | | $ | 892,714 | | | $ | 887,301 | | | $ | 2,119,179 | |
| | | | |
Net change in unrealized appreciation (depreciation) on investments still held at December 31, 2019(b) | | $ | 34,742 | | | $ | (28,795 | ) | | $ | 90,054 | | | $ | 96,001 | |
| | | | |
| (a) | Included in the related net change in unrealized appreciation (depreciation) in the Statements of Operations. |
| (b) | Any difference between net change in unrealized appreciation (depreciation) and net change in unrealized appreciation (depreciation) on investments still held at December 31, 2019 is generally due to investments no longer held or categorized as Level 3 at period end. |
The following table summarizes the valuation approaches used and unobservable inputs utilized by the BlackRock Global Valuation Methodologies Committee (the “Global Valuation Committee”) to determine the value of certain of the Fund’s Level 3 investments as of period end. The table does not include Level 3 investments with values based upon unadjusted third party pricing information in the amount of $101. A significant change in the third party information could result in a significantly lower or higher value of such Level 3 investments.
| | | | | | | | | | | | | | | | | | | | |
| | | Value | | | Valuation
Approach | | | Unobservable Inputs | | | Range of
Unobservable
Inputs Utilized (a) | | | Weighted Average
of Unobservable
Inputs Based on Fair
Value | |
Common Stocks | | $ | 339,164 | | | | Income | | | | Discount Rate | | | | 15 | % | | | — | |
| | | | | | | Market | | | | Revenue Multiple | | | | 5.25x | | | | — | |
| | | | | | | | | | | Volatility | | | | 38 | % | | | — | |
| | | | | | | | | | | Time to Exit | | | | 2.4 | | | | — | |
| | | | | | | | | | | Recent Transactions | | | | — | | | | — | |
Corporate Bonds | | | 892,714 | | | | Income | | | | Discount Rate | | | | 15% — 30 | % | | | 17 | % |
Preferred Stocks(b) | | | 887,200 | | | | Market | | | | Revenue Multiple | | | | 5.25x —15.00x | | | | 10.01x | |
| | | | | | | | | | | Discount Rate | | | | 20 | % | | | — | |
| | | | | | | | | | | Time to Exit | | | | 0.5 — 2.4 | | | | 1.5 | |
| | | | | | | | | | | Volatility | | | | 38 | % | | | — | |
| | | | | | | | | | | Recent Transactions | | | | — | | | | — | |
| | | | | | | | | | | | | | | | | | | | |
| | $ | 2,119,078 | | | | | | | | | | | | | | | | | |
| | | | | | | | | | | | | | | | | | | | |
| (a) | A significant change in unobservable input would have resulted in a correlated (inverse) significant change to value. |
| (b) | For the period ended December 31, 2019, the valuation technique for investments classified as Preferred Stocks amounting to $175,352 changed to a Probability Weighted Expected Return Model. The investments were previously valued utilizing a Transaction Price approach. The change was due to consideration of the information that was available at the time the investments were valued. |
See notes to financial statements.
| | | | |
| CONSOLIDATED SCHEDULES OF INVESTMENTS | | | 97 | |
| | |
Schedule of Investments December 31, 2019 | | BlackRock Government Money Market Portfolio (Percentages shown are based on Net Assets) |
| | | | | | | | |
| Security | | Par
(000) | | | Value | |
|
| U.S. Government Sponsored Agency Obligations — 49.5% | |
Federal Farm Credit Bank Discount Notes(a): | | | | | |
1.35%, 01/17/20 | | | USD 890 | | | $ | 889,043 | |
1.46%, 02/04/20 | | | 545 | | | | 543,780 | |
1.49%, 02/21/20 | | | 515 | | | | 513,286 | |
1.54%, 03/03/20 | | | 470 | | | | 468,365 | |
1.54%, 03/10/20 | | | 970 | | | | 965,743 | |
1.55%, 03/24/20 | | | 805 | | | | 800,713 | |
1.58%, 05/14/20 | | | 25 | | | | 24,833 | |
1.59%, 06/12/20 | | | 35 | | | | 34,718 | |
1.60%, 06/26/20 | | | 1,220 | | | | 1,208,963 | |
1.60%, 06/30/20 | | | 405 | | | | 401,314 | |
1.59%, 07/07/20 | | | 25 | | | | 24,770 | |
1.57%, 09/28/20 | | | 260 | | | | 256,868 | |
Federal Farm Credit Bank Variable Rate Notes(b): | |
(LIBOR USD 1 Month- 0.05%), 1.66%, 02/07/20 | | | 1,545 | | | | 1,544,998 | |
(LIBOR USD 1 Month- 0.01%), 1.74%, 06/18/20 | | | 150 | | | | 149,999 | |
(LIBOR USD 1 Month + 0.00%), 1.76%, 06/19/20 | | | 1,000 | | | | 1,000,217 | |
(LIBOR USD 1 Month- 0.05%), 1.69%, 08/17/20 | | | 455 | | | | 455,000 | |
(LIBOR USD 1 Month- 0.04%), 1.68%, 09/11/20 | | | 545 | | | | 544,989 | |
(LIBOR USD 1 Month + 0.03%), 1.76%, 12/14/20 | | | 685 | | | | 684,973 | |
(LIBOR USD 1 Month + 0.05%), 1.78%, 04/16/21 | | | 700 | | | | 700,000 | |
(US Treasury 3Month Bill Money Market
Yield + 0.26%), 1.79%, 06/17/21 | | | 470 | | | | 469,932 | |
(LIBOR USD 1 Month + 0.16%), 1.87%, 07/01/21 | | | 380 | | | | 380,000 | |
(US Treasury 3 Month Bill Money Market
Yield + 0.23%), 1.75%, 07/08/21 | | | 275 | | | | 275,000 | |
(LIBOR USD 1 Month + 0.11%), 1.85%, 11/12/21 | | | 130 | | | | 130,000 | |
(SOFR +0.19%), 1.73%, 11/18/21 | | | 215 | | | | 215,000 | |
Federal Home Loan Bank Bonds: | | | | | | | | |
1.56%, 05/01/20 | | | 680 | | | | 679,880 | |
1.60%, 05/13/20 | | | 435 | | | | 434,988 | |
1.59%, 05/14/20 | | | 305 | | | | 304,975 | |
2.63%, 10/01/20 | | | 285 | | | | 287,055 | |
Federal Home Loan Bank Discount Notes(a): | | | | | |
0.51%, 01/03/20 | | | 870 | | | | 869,918 | |
1.15%, 01/08/20 | | | 1,540 | | | | 1,539,429 | |
1.23%, 01/10/20 | | | 510 | | | | 509,786 | |
1.33%, 01/15/20 | | | 915 | | | | 914,402 | |
1.35%, 01/17/20 | | | 100 | | | | 99,930 | |
1.39%, 01/21/20 | | | 810 | | | | 809,255 | |
1.39%, 01/22/20 | | | 1,575 | | | | 1,573,502 | |
1.41%, 01/24/20 | | | 300 | | | | 299,684 | |
1.43%, 01/31/20 | | | 610 | | | | 609,205 | |
1.46%, 02/05/20 | | | 835 | | | | 833,748 | |
1.46%, 02/06/20 | | | 600 | | | | 599,052 | |
1.46%, 02/07/20 | | | 1,505 | | | | 1,502,412 | |
1.47%, 02/13/20 | | | 215 | | | | 214,531 | |
1.48%, 02/19/20 | | | 365 | | | | 364,221 | |
1.49%, 02/21/20 | | | 135 | | | | 134,700 | |
1.54%, 03/11/20 | | | 2,125 | | | | 2,118,470 | |
1.55%, 03/18/20 | | | 900 | | | | 896,876 | |
1.55%, 03/20/20 | | | 1,380 | | | | 1,374,277 | |
1.55%, 03/25/20 | | | 575 | | | | 572,480 | |
1.56%, 04/03/20 | | | 200 | | | | 199,186 | |
1.57%, 04/06/20 | | | 340 | | | | 338,558 | |
| | | | | | | | |
| Security | | Par
(000) | | | Value | |
|
| U.S. Government Sponsored Agency Obligations (continued) | |
1.57%, 04/08/20 | | | USD 790 | | | $ | 786,376 | |
1.57%, 04/15/20 | | | 700 | | | | 696,656 | |
1.57%, 04/24/20 | | | 355 | | | | 353,181 | |
1.58%, 05/06/20 | | | 2,040 | | | | 2,028,797 | |
1.58%, 05/13/20 | | | 1,025 | | | | 1,019,081 | |
1.59%, 06/05/20 | | | 615 | | | | 610,845 | |
1.60%, 06/25/20 | | | 450 | | | | 446,546 | |
1.60%, 06/26/20 | | | 100 | | | | 99,216 | |
1.59%, 07/06/20 | | | 200 | | | | 198,353 | |
1.58%, 08/14/20 | | | 685 | | | | 678,163 | |
Federal Home Loan Bank Variable Rate Notes(b): | | | | | |
(SOFR + 0.01%), 1.55%, 01/17/20 | | | 485 | | | | 485,000 | |
(SOFR + 0.05%),1.59% - 1.59%, 01/17/20 | | | 540 | | | | 540,000 | |
(SOFR + 0.01%), 1.55%, 02/21/20 | | | 280 | | | | 280,000 | |
(LIBOR USD 1 Month- 0.06%), 1.72%, 02/24/20 | | | 1,180 | | | | 1,180,000 | |
(LIBOR USD 1 Month- 0.04%), 1.75%, 02/25/20 | | | 550 | | | | 550,000 | |
(LIBOR USD 1 Month- 0.04%), 1.70%, 04/17/20 | | | 2,750 | | | | 2,749,867 | |
(LIBOR USD 3 Month- 0.14%), 1.83%, 04/20/20 | | | 2,000 | | | | 2,000,000 | |
(LIBOR USD 1 Month + 0.05%), 1.76%, 05/08/20 | | | 485 | | | | 485,000 | |
(SOFR + 0.02%), 1.56%, 05/22/20 | | | 270 | | | | 270,000 | |
(SOFR + 0.04%), 1.58%, 06/19/20 | | | 255 | | | | 255,000 | |
(LIBOR USD 1 Month + 0.01%), 1.72%, 07/10/20 | | | 1,005 | | | | 1,005,000 | |
(SOFR + 0.08%), 1.62%, 07/24/20 | | | 170 | | | | 170,000 | |
(SOFR + 0.03%), 1.57%, 08/21/20 | | | 145 | | | | 145,000 | |
(SOFR + 0.11%), 1.64%, 10/01/20 | | | 600 | | | | 600,000 | |
(SOFR + 0.12%), 1.66%, 10/07/20 | | | 290 | | | | 290,000 | |
(SOFR + 0.13%), 1.67%, 10/16/20 | | | 2,455 | | | | 2,455,000 | |
(SOFR + 0.05%), 1.59%, 01/22/21 | | | 190 | | | | 190,000 | |
(SOFR + 0.04%), 1.58%, 02/09/21 | | | 185 | | | | 185,000 | |
(SOFR + 0.12%), 1.65%, 03/12/21 | | | 545 | | | | 545,000 | |
(SOFR + 0.08%), 1.62%, 07/08/21 | | | 400 | | | | 400,000 | |
(SOFR + 0.09%), 1.63%, 09/10/21 | | | 950 | | | | 950,000 | |
Federal Home Loan Mortgage Corp. Discount Notes(a): | |
1.35%, 01/17/20 | | | 190 | | | | 189,842 | |
1.55%, 03/18/20 | | | 1,670 | | | | 1,664,142 | |
1.58%, 05/19/20 | | | 375 | | | | 372,770 | |
| | | | | | | | |
| |
Total U.S. Government Sponsored Agency
Obligations — 49.5%
(Cost: $55,636,859) | | | | 55,636,859 | |
| | | | | | | | |
|
| U.S. Treasury Obligations — 17.1% | |
U.S. Treasury Bills(a): | | | | | | | | |
2.04%, 01/02/20 | | | 1,500 | | | | 1,499,915 | |
1.36%, 01/23/20 | | | 145 | | | | 144,856 | |
1.38%, 01/28/20 | | | 3,000 | | | | 2,996,468 | |
1.44%, 02/13/20 | | | 1,295 | | | | 1,292,579 | |
1.48%, 02/27/20 | | | 1,560 | | | | 1,555,455 | |
1.52%, 04/09/20 | | | 810 | | | | 806,249 | |
1.53%, 04/23/20 | | | 1,920 | | | | 1,905,777 | |
1.53%, 05/07/20 | | | 815 | | | | 810,587 | |
1.55%, 05/28/20 | | | 645 | | | | 640,829 | |
1.54%, 09/10/20 | | | 265 | | | | 261,759 | |
U.S. Treasury Notes: | | | | | | | | |
2.25%, 03/31/20 | | | 240 | | | | 240,116 | |
1.38%, 04/30/20 | | | 820 | | | | 819,428 | |
2.38%, 04/30/20 | | | 475 | | | | 475,799 | |
| | |
| 98 | | 2019 BLACKROCK ANNUAL REPORTTO SHAREHOLDERS |
| | |
Schedule of Investments (continued) December 31, 2019 | | BlackRock Government Money Market Portfolio (Percentages shown are based on Net Assets) |
| | | | | | | | |
| Security | | Par
(000) | | | Value | |
|
| U.S. Treasury Obligations (continued) | |
1.50%, 05/15/20 | | | USD 240 | | | $ | 239,536 | |
3.50%, 05/15/20 | | | 720 | | | | 724,412 | |
1.50%, 05/31/20 | | | 220 | | | | 219,684 | |
1.63%, 06/30/20 | | | 25 | | | | 24,971 | |
(US Treasury 3 Month Bill Money Market
Yield + 0.04%), 1.57%, 07/31/20(b) | | | 305 | | | | 304,814 | |
(US Treasury 3 Month Bill Money Market
Yield + 0.05%), 1.57%, 10/31/20(b) | | | 1,300 | | | | 1,298,873 | |
2.63%, 11/15/20 | | | 300 | | | | 302,532 | |
1.63%, 11/30/20 | | | 120 | | | | 119,956 | |
2.00%, 11/30/20 | | | 70 | | | | 70,214 | |
(US Treasury 3 Month Bill Money Market
Yield + 0.12%), 1.64%, 01/31/21(b) | | | 1,000 | | | | 1,000,000 | |
| | | | | | | | |
| Security | | Par
(000) | | | Value | |
|
| U.S. Treasury Obligations (continued) | |
(US Treasury 3 Month Bill Money Market Yield + 0.14%), 1.66%, 04/30/21(b) | | | USD 100 | | | $ | 99,892 | |
(US Treasury 3 Month Bill Money Market Yield + 0.22%), 1.75%, 07/31/21(b) | | | 1,000 | | | | 1,000,000 | |
(US Treasury 3 Month Bill Money Market Yield + 0.30%), 1.83%, 10/31/21(b) | | | 335 | | | | 335,365 | |
| | | | | | | | |
| |
Total U.S. Treasury Obligations — 17.1%
(Cost: $19,190,066) | | | | 19,190,066 | |
| | | | | | | | |
| |
Total Repurchase Agreements — 30.8%
(Cost: $34,650,000) | | | | 34,650,000 | |
| | | | | | | | |
| |
Total Investments — 97.4%
(Cost: $109,476,925)(c) | | | | 109,476,925 | |
| |
Other Assets Less Liabilities — 2.6% | | | | 2,977,337 | |
| | | | | | | | |
| |
Net Assets — 100.0% | | | $ | 112,454,262 | |
| | | | | | | | |
| (a) | Rates are the current rate or a range of current rates as of period end. |
| (b) | Variable rate security. Rate shown is the rate in effect as of period end. |
| (c) | Cost for U.S. federal income tax purposes. |
Repurchase Agreements
| | | | | | | | | | | | | | | | | | | | | | | | | | | | | | |
| | | Repurchase Agreements | | | | Collateral |
| Counterparty | | Coupon
Rate | | | Purchase
Date | | | Maturity
Date | | | Par
(000) | | | At Value
(000) | | | Proceeds
Including
Interest | | | | Position | | Original Par | | Position
Received,
At Value |
Bank of America
Securities, Inc. | | | 1.57 | % | | | 12/31/19 | | | | 01/02/20 | | | $ | 4,000 | | | $ | 4,000 | | | $ 4,000,349 | | | | U.S. Government Sponsored Agency
Obligation, 3.59%, due 11/20/69 | | $ 3,764,504 | | $ 4,080,001 |
| | | | | | | | | | | | | | | | | | | | | | | | | | | | | | |
BNP Paribas SA | | | 1.58 | | | | 12/31/19 | | | | 01/02/20 | | | | 1,250 | | | | 1,250 | | | 1,250,110 | | | | U.S. Government Sponsored Agency
Obligations and U.S. Treasury Obligations, 1.38% to 5.57%, due 02/29/20 to 11/20/49 | | 2,599,582 | | 1,275,116 |
| | | | | | | | | | | | | | | | | | | | | | | | | | | | | | |
Goldman Sachs & Co. LLC | | | 1.58 | | | | 12/31/19 | | | | 01/02/20 | | | | 3,900 | | | | 3,900 | | | 3,900,342 | | | | U.S. Government Sponsored Agency Obligations, 1.64% to 6.00%, due 01/20/30 to 09/20/49 | | 35,791,477 | | 4,069,647 |
| | | | | | | | | | | | | | | | | | | | | | | | | | | | | | |
JP Morgan Securities LLC | | | 1.55 | | | | 12/31/19 | | | | 01/02/20 | | | | 5,000 | | | | 5,000 | | | 5,000,430 | | | | U.S. Treasury Obligations, 0.00% to 1.63%, due 10/31/23 to 02/15/48 | | 5,091,164 | | 5,100,001 |
| |
| 1.93
|
(a) | | | 12/31/19 | | | | 02/06/20 | | | | 2,500 | | | | 2,500 | | | 2,504,965 | | | | U.S. Government Sponsored Agency Obligations, 0.19% to 4.00%, due 09/25/24 to 03/16/60 | | 1,144,688,133 | | 2,625,000 |
| | | | | | | | | | | | | | | | | | | | | | | | | | | | | | |
Total JP Morgan
Securities LLC | | | $ | 7,500 | | | | | | | | | | | $ 7,725,001 |
| | | | | | | | | | | | | | | | | | | | | | | | | | | | | | |
Mizuho Securities USA LLC | | | 1.57 | | | | 12/31/19 | | | | 01/02/20 | | | | 4,000 | | | | 4,000 | | | 4,000,349 | | | | U.S. Government Sponsored Agency Obligation, 3.00%, due 07/25/49 | | 4,207,369 | | 4,200,000 |
| | | | | | | | | | | | | | | | | | | | | | | | | | | | | | |
| | | | |
| SCHEDULES OF INVESTMENTS | | | 99 | |
| | |
Schedule of Investments (continued) December 31, 2019 | | BlackRock Government Money Market Portfolio |
| | | | | | | | | | | | | | | | | | | | | | | | | | | | | | |
| | | Repurchase Agreements | | | | Collateral |
| Counterparty | | Coupon
Rate | | | Purchase
Date | | | Maturity
Date | | | Par (000) | | | At Value
(000) | | | Proceeds
Including
Interest | | | | Position | | Original Par | | Position
Received,
At Value |
TD Securities USA LLC | | | 1.55 | % | | | 12/31/19 | | | | 01/02/20 | | | $ | 9,000 | | | $ | 9,000 | | | $ 9,000,775 | | | | U.S. Treasury Obligations, 1.13% to 2.38%, due 02/28/21 to 03/15/22 | | $ 9,076,500 | | $ 9,180,000 |
| | | | | | | | | | | | | | | | | | | | | | | | | | | | | | |
Wells Fargo Securities LLC | | | 1.55 | | | | 12/31/19 | | | | 01/02/20 | | | | 5,000 | | | | 5,000 | | | 5,000,431 | | | | U.S. Treasury Obligation, 2.25%, due 02/15/27 | | 4,915,200 | | 5,100,004 |
| | | | | | | | | | | | | | | | | | | | | | | | | | | | | | |
| | | | | | | | | | | | | | | | | | $ | 34,650 | | | | | | | | | | | $ 35,629,769 |
| | | | | | | | | | | | | | | | | | | | | | | | | | | | | | |
| (a) | Variable rate security. Rate as of period end and maturity is the date the principal owed can be recovered through demand. |
Fair Value Hierarchy as of Period End
Various inputs are used in determining the fair value of investments. For information about the Fund’s policy regarding valuation of investments, refer to the Notes to Financial Statements.
The following table summarizes the Fund’s investments categorized in the disclosure hierarchy:
| | | | | | | | | | | | | | | | |
| | | Level 1 | | | Level 2 | | | Level 3 | | | Total | |
Assets: | | | | | | | | | | | | | | | | |
Investments: | | | | | | | | | | | | | | | | |
Short-Term Securities(a) | | $ | — | | | $ | 109,476,925 | | | $ | — | | | $ | 109,476,925 | |
| | | | | | | | | | | | | | | | |
| (a) | See above Schedule of Investments for values in each security type. |
See notes to financial statements.
| | |
| 100 | | 2019 BLACKROCK ANNUAL REPORTTO SHAREHOLDERS |
| | |
Schedule of Investments December 31, 2019 | | BlackRock High Yield Portfolio (Percentages shown are based on Net Assets) |
| | | | | | | | |
| Security | | Shares | | | Value | |
|
Common Stocks — 1.0% | |
|
| Aerospace & Defense — 0.1% | |
Bombardier, Inc., Class B(a) | | | 11,959 | | | $ | 17,774 | |
| | | | | | | | |
| |
| Chemicals — 0.3% | | | | |
Element Solutions, Inc.(a) | | | 9,095 | | | | 106,230 | |
| | | | | | | | |
|
| Equity Real Estate Investment Trusts (REITs) — 0.1% | |
Gaming and Leisure Properties, Inc. | | | 880 | | | | 37,884 | |
| | | | | | | | |
| | |
| Media — 0.1% | | | | | | |
Clear Channel Outdoor Holdings, Inc.(a) | | | 8,587 | | | | 24,559 | |
| | | | | | | | |
| | |
| Metals & Mining — 0.2% | | | | | | |
Constellium SE, Class A(a) | | | 5,016 | | | | 67,214 | |
| | | | | | | | |
| | |
| Pharmaceuticals — 0.2% | | | | | | |
Bausch Health Cos., Inc.(a) | | | 1,732 | | | | 51,822 | |
| | | | | | | | |
| | |
Total Common Stocks — 1.0%
(Cost: $283,614) | | | | | | | 305,483 | |
| | | | | | | | |
| | | Par
(000) | | | | |
|
Corporate Bonds — 86.5% | |
| |
| Aerospace & Defense — 4.4% | | | | |
Arconic, Inc.: | | | | | | | | |
5.40%, 04/15/21 | | USD | 2 | | | | 2,062 | |
5.13%, 10/01/24 | | | 118 | | | | 128,620 | |
Bombardier, Inc.(b): | | | | | | | | |
8.75%, 12/01/21 | | | 39 | | | | 42,729 | |
5.75%, 03/15/22 | | | 8 | | | | 8,263 | |
6.13%, 01/15/23 | | | 26 | | | | 26,663 | |
7.50%, 12/01/24 | | | 42 | | | | 44,126 | |
7.50%, 03/15/25 | | | 24 | | | | 24,750 | |
7.88%, 04/15/27 | | | 140 | | | | 144,025 | |
BWX Technologies, Inc., 5.38%, 07/15/26(b) | | | 64 | | | | 67,840 | |
Kratos Defense & Security Solutions, Inc., 6.50%, 11/30/25(b) | | | 38 | | | | 40,660 | |
Moog, Inc., 4.25%, 12/15/27(b) | | | 14 | | | | 14,246 | |
Signature Aviation US Holdings, Inc.(b): | | | | | | | | |
5.38%, 05/01/26 | | | 27 | | | | 28,420 | |
4.00%, 03/01/28 | | | 46 | | | | 45,370 | |
SSL Robotics LLC, 9.75%, 12/31/23(b) | | | 14 | | | | 15,225 | |
TransDigm, Inc.(b): | | | | | | | | |
6.25%, 03/15/26 | | | 594 | | | | 643,071 | |
5.50%, 11/15/27 | | | 49 | | | | 49,550 | |
Triumph Group, Inc., 6.25%, 09/15/24(b) | | | 32 | | | | 33,640 | |
| | | | | | | | |
| | | | | | | 1,359,260 | |
| |
| Air Freight & Logistics — 0.0% | | | | |
XPO Logistics, Inc., 6.75%, 08/15/24(b) | | | 2 | | | | 2,173 | |
| | | | | | | | |
| |
| Auto Components — 1.5% | | | | |
Allison Transmission, Inc., 5.88%, 06/01/29(b) | | | 35 | | | | 38,325 | |
Icahn Enterprises LP: | | | | | | | | |
6.75%, 02/01/24 | | | 39 | | | | 40,463 | |
4.75%, 09/15/24(b) | | | 7 | | | | 7,193 | |
6.38%, 12/15/25 | | | 15 | | | | 15,731 | |
6.25%, 05/15/26 | | | 34 | | | | 36,210 | |
5.25%, 05/15/27(b) | | | 34 | | | | 34,769 | |
Panther BF Aggregator 2 LP(b): | | | | | | | | |
6.25%, 05/15/26 | | | 119 | | | | 128,222 | |
8.50%, 05/15/27 | | | 163 | | | | 173,188 | |
| | | | | | | | |
| | | | | | | 474,101 | |
| |
| Automobiles — 0.1% | | | | |
Tesla, Inc., 5.30%, 08/15/25(b) | | | 20 | | | | 19,400 | |
| | | | | | | | |
| | | | | | | | |
| Security | | Par
(000) | | | Value | |
| | |
| Banks — 0.3% | | | | | | |
Banco Espirito Santo SA,
4.75%, 01/15/18(a)(c) | | EUR | 100 | | | $ | 19,069 | |
CIT Group, Inc.: | | | | | | | | |
5.00%, 08/01/23 | | USD | 54 | | | | 58,185 | |
5.25%, 03/07/25 | | | 24 | | | | 26,400 | |
| | | | | | | | |
| | | | | | | 103,654 | |
| | |
| Building Products — 0.7%(b) | | | | | | |
Advanced Drainage Systems, Inc., 5.00%, 09/30/27 | | | 24 | | | | 24,750 | |
CPG Merger Sub LLC, 8.00%, 10/01/21 | | | 52 | | | | 52,130 | |
JELD-WEN, Inc., 4.63%, 12/15/25 | | | 14 | | | | 14,413 | |
Masonite International Corp.: | | | | | | | | |
5.75%, 09/15/26 | | | 9 | | | | 9,562 | |
5.38%, 02/01/28 | | | 14 | | | | 14,788 | |
Standard Industries, Inc.: | | | | | | | | |
5.38%, 11/15/24 | | | 39 | | | | 40,073 | |
6.00%, 10/15/25 | | | 57 | | | | 59,921 | |
| | | | | | | | |
| | | | | | | 215,637 | |
| | |
| Capital Markets — 0.2% | | | | | | |
Goldman Sachs Group, Inc. (The), Series R, (US Treasury Yield Curve Rate T Note Constant Maturity 5 Year + 3.22%), 4.95%(d)(e) | | | 20 | | | | 20,720 | |
MSCI, Inc.(b): | | | | | | | | |
4.75%, 08/01/26 | | | 4 | | | | 4,190 | |
4.00%, 11/15/29 | | | 8 | | | | 8,110 | |
Owl Rock Capital Corp.: | | | | | | | | |
5.25%, 04/15/24 | | | 6 | | | | 6,367 | |
4.00%, 03/30/25 | | | 15 | | | | 15,060 | |
| | | | | | | | |
| | | | | | | 54,447 | |
| | |
| Chemicals — 1.4% | | | | | | |
Blue Cube Spinco LLC: | | | | | | | | |
9.75%, 10/15/23 | | | 44 | | | | 47,314 | |
10.00%, 10/15/25 | | | 62 | | | | 68,558 | |
Chemours Co. (The): | | | | | | | | |
6.63%, 05/15/23 | | | 34 | | | | 34,130 | |
5.38%, 05/15/27 | | | 10 | | | | 8,850 | |
Element Solutions, Inc., 5.88%, 12/01/25(b) | | | 132 | | | | 138,105 | |
Gates Global LLC, 6.25%, 01/15/26(b) | | | 32 | | | | 32,551 | |
GCP Applied Technologies, Inc., 5.50%, 04/15/26(b) | | | 19 | | | | 19,950 | |
NOVA Chemicals Corp., 4.88%, 06/01/24(b) | | | 4 | | | | 4,130 | |
PQ Corp., 5.75%, 12/15/25(b) | | | 51 | | | | 53,295 | |
TPC Group, Inc., 10.50%, 08/01/24(b) | | | 24 | | | | 24,180 | |
W.R. Grace & Co., 5.63%, 10/01/24(b) | | | 12 | | | | 13,260 | |
| | | | | | | | |
| | | | | | | 444,323 | |
| | |
| Commercial Services & Supplies — 2.2% | | | | | | |
ADT Security Corp. (The): | | | | | | | | |
3.50%, 07/15/22 | | | 6 | | | | 6,109 | |
4.88%, 07/15/32(b) | | | 70 | | | | 64,225 | |
Aramark Services, Inc.(b): | | | | | | | | |
5.00%, 04/01/25 | | | 13 | | | | 13,553 | |
5.00%, 02/01/28 | | | 67 | | | | 70,601 | |
Clean Harbors, Inc.(b): | | | | | | | | |
4.88%, 07/15/27 | | | 25 | | | | 26,312 | |
5.13%, 07/15/29 | | | 13 | | | | 13,944 | |
GFL Environmental, Inc.(b): | | | | | | | | |
5.38%, 03/01/23 | | | 4 | | | | 4,120 | |
7.00%, 06/01/26 | | | 99 | | | | 104,584 | |
5.13%, 12/15/26 | | | 45 | | | | 47,312 | |
8.50%, 05/01/27 | | | 54 | | | | 59,400 | |
GWB-CR Security Corp.,
9.50%, 11/01/27(b) | | | 6 | | | | 6,405 | |
Harland Clarke Holdings Corp., 8.38%, 08/15/22(b) | | | 12 | | | | 9,780 | |
IAA, Inc., 5.50%, 06/15/27(b) | | | 36 | | | | 38,250 | |
| | | | |
| SCHEDULES OF INVESTMENTS | | | 101 | |
| | |
Schedule of Investments (continued) December 31, 2019 | | BlackRock High Yield Portfolio (Percentages shown are based on Net Assets) |
| | | | | | | | |
| Security | | Par
(000) | | | Value | |
| | |
| Commercial Services & Supplies (continued) | | | | | | |
KARAuction Services, Inc., 5.13%, 06/01/25(b) | | USD | 22 | | | $ | 22,880 | |
Mobile Mini, Inc., 5.88%, 07/01/24 | | | 50 | | | | 52,000 | |
Nielsen Co. Luxembourg SARL (The), 5.00%, 02/01/25(b) | | | 6 | | | | 6,180 | |
Prime Security Services Borrower LLC(b): | | | | | | | | |
5.25%, 04/15/24 | | | 26 | | | | 27,508 | |
5.75%, 04/15/26 | | | 43 | | | | 46,736 | |
Ritchie Bros Auctioneers, Inc., 5.38%, 01/15/25(b) | | | 9 | | | | 9,382 | |
Waste Pro USA, Inc., 5.50%, 02/15/26(b) | | | 32 | | | | 33,360 | |
| | | | | | | | |
| | | | | | | 662,641 | |
| | |
| Communications Equipment — 0.8% | | | | | | |
CommScope, Inc.(b): | | | | | | | | |
5.50%, 03/01/24 | | | 69 | | | | 71,932 | |
6.00%, 03/01/26 | | | 21 | | | | 22,339 | |
Nokia OYJ, 6.63%, 05/15/39 | | | 60 | | | | 69,482 | |
ViaSat, Inc., 5.63%, 04/15/27(b) | | | 67 | | | | 71,690 | |
| | | | | | | | |
| | | | | | | 235,443 | |
| | |
| Construction &Engineering — 0.2%(b) | | | | | | |
Brand Industrial Services, Inc., 8.50%, 07/15/25 | | | 34 | | | | 34,850 | |
New Enterprise Stone & Lime Co., Inc.: | | | | | | | | |
10.13%, 04/01/22 | | | 17 | | | | 17,999 | |
6.25%, 03/15/26 | | | 7 | | | | 7,332 | |
| | | | | | | | |
| | | | | | | 60,181 | |
| | |
| Consumer Finance — 1.5% | | | | | | |
Ally Financial, Inc., 8.00%, 11/01/31 | | | 125 | | | | 173,513 | |
Global Aircraft Leasing Co. Ltd., 6.50%, (6.50% Cash or 7.25% PIK), 09/15/24(b)(f) | | | 78 | | | | 81,668 | |
Navient Corp.: | | | | | | | | |
6.63%, 07/26/21 | | | 26 | | | | 27,495 | |
7.25%, 09/25/23 | | | 8 | | | | 9,040 | |
6.13%, 03/25/24 | | | 6 | | | | 6,510 | |
5.88%, 10/25/24 | | | 21 | | | | 22,470 | |
6.75%, 06/25/25 | | | 2 | | | | 2,208 | |
6.75%, 06/15/26 | | | 2 | | | | 2,198 | |
Springleaf Finance Corp.: | | | | | | | | |
6.88%, 03/15/25 | | | 38 | | | | 43,225 | |
7.13%, 03/15/26 | | | 35 | | | | 40,467 | |
6.63%, 01/15/28 | | | 19 | | | | 21,447 | |
5.38%, 11/15/29 | | | 15 | | | | 15,657 | |
| | | | | | | | |
| | | | | | | 445,898 | |
| | |
| Containers & Packaging — 2.9% | | | | | | |
Berry Global, Inc., 4.88%, 07/15/26(b) | | | 38 | | | | 40,079 | |
Crown Americas LLC: | | | | | | | | |
4.75%, 02/01/26 | | | 21 | | | | 22,181 | |
4.25%, 09/30/26 | | | 52 | | | | 54,535 | |
Graphic Packaging International LLC, 4.75%, 07/15/27(b) | | | 9 | | | | 9,630 | |
Greif, Inc., 6.50%, 03/01/27(b) | | | 5 | | | | 5,400 | |
Intertape Polymer Group, Inc., 7.00%, 10/15/26(b) | | | 15 | | | | 15,863 | |
LABL Escrow Issuer LLC, 6.75%, 07/15/26(b) | | | 54 | | | | 57,375 | |
Mauser Packaging Solutions Holding Co., 5.50%, 04/15/24(b) | | | 144 | | | | 148,334 | |
Reynolds Group Issuer, Inc.(b): | | | | | | | | |
5.13%, 07/15/23 | | | 22 | | | | 22,522 | |
7.00%, 07/15/24 | | | 29 | | | | 29,979 | |
Sealed Air Corp., 6.88%, 07/15/33(b) | | | 9 | | | | 10,620 | |
Silgan Holdings, Inc., 4.13%, 02/01/28(b) | | | 21 | | | | 21,006 | |
Trivium Packaging Finance BV, 8.50%, 08/15/27(b)(g) | | | 400 | | | | 445,000 | |
| | | | | | | | |
| | | | | | | 882,524 | |
| | | | | | | | |
| Security | | Par
(000) | | | Value | |
| | |
| Distributors — 1.1%(b) | | | | | | |
American Builders & Contractors Supply Co., Inc.: | | | | | | | | |
5.88%, 05/15/26 | | USD | 47 | | | $ | 49,937 | |
4.00%, 01/15/28 | | | 43 | | | | 43,645 | |
Core & Main Holdings LP, 8.63%, (8.63% Cash or 9.38% PIK), 09/15/24(f) | | | 45 | | | | 46,800 | |
Core & Main LP, 6.13%, 08/15/25 | | | 104 | | | | 108,420 | |
Performance Food Group, Inc., 5.50%, 10/15/27 | | | 26 | | | | 27,788 | |
Wolverine Escrow LLC: | | | | | | | | |
8.50%, 11/15/24 | | | 20 | | | | 20,700 | |
9.00%, 11/15/26 | | | 38 | | | | 39,805 | |
| | | | | | | | |
| | | | | | | 337,095 | |
| | |
| Diversified Consumer Services — 0.5% | | | | | | |
frontdoor, Inc., 6.75%, 08/15/26(b) | | | 37 | | | | 40,330 | |
Graham Holdings Co., 5.75%, 06/01/26(b) | | | 15 | | | | 16,012 | |
Laureate Education, Inc., 8.25%, 05/01/25(b) | | | 11 | | | | 11,839 | |
Service Corp. International, 5.13%, 06/01/29 | | | 35 | | | | 37,187 | |
ServiceMaster Co. LLC (The), 5.13%, 11/15/24(b) | | | 53 | | | | 54,988 | |
| | | | | | | | |
| | | | | | | 160,356 | |
| | |
| Diversified Financial Services — 2.0%(b) | | | | | | |
Allied Universal Holdco LLC: | | | | | | | | |
6.63%, 07/15/26 | | | 145 | | | | 155,832 | |
9.75%, 07/15/27 | | | 16 | | | | 17,092 | |
Fairstone Financial, Inc., 7.88%, 07/15/24 | | | 16 | | | | 17,200 | |
MPH Acquisition Holdings LLC, 7.13%, 06/01/24. | | | 64 | | | | 61,920 | |
Refinitiv US Holdings, Inc.: | | | | | | | | |
4.50%, 05/15/26 | | EUR | 100 | | | | 122,069 | |
6.25%, 05/15/26 | | USD | 4 | | | | 4,365 | |
8.25%, 11/15/26 | | | 79 | | | | 88,974 | |
Verscend Escrow Corp., 9.75%, 08/15/26 | | | 142 | | | | 155,312 | |
| | | | | | | | |
| | | | | | | 622,764 | |
| | |
| Diversified Telecommunication Services — 6.0% | | | | | | |
Altice France SA, 8.13%, 02/01/27(b) | | | 248 | | | | 279,310 | |
CCO Holdings LLC(b): | | | | | | | | |
4.00%, 03/01/23 | | | 27 | | | | 27,371 | |
5.75%, 02/15/26 | | | 19 | | | | 20,045 | |
5.13%, 05/01/27 | | | 131 | | | | 138,205 | |
5.00%, 02/01/28 | | | 12 | | | | 12,592 | |
5.38%, 06/01/29 | | | 114 | | | | 121,980 | |
4.75%, 03/01/30 | | | 51 | | | | 51,920 | |
CenturyLink, Inc.: | | | | | | | | |
Series W, 6.75%, 12/01/23 | | | 33 | | | | 36,836 | |
Series Y, 7.50%, 04/01/24 | | | 58 | | | | 65,395 | |
5.63%, 04/01/25 | | | 36 | | | | 38,252 | |
5.13%, 12/15/26(b) | | | 70 | | | | 71,234 | |
Series P, 7.60%, 09/15/39 | | | 15 | | | | 15,675 | |
Series U, 7.65%, 03/15/42 | | | 32 | | | | 33,520 | |
Cincinnati Bell, Inc.(b): | | | | | | | | |
7.00%, 07/15/24 | | | 30 | | | | 31,462 | |
8.00%, 10/15/25 | | | 15 | | | | 15,900 | |
Frontier Communications Corp., 8.00%, 04/01/27(b) | | | 167 | | | | 174,515 | |
Intelsat Jackson Holdings SA: | | | | | | | | |
5.50%, 08/01/23 | | | 30 | | | | 25,771 | |
9.75%, 07/15/25(b) | | | 103 | | | | 95,275 | |
Level 3 Financing, Inc.: | | | | | | | | |
5.38%, 05/01/25 | | | 6 | | | | 6,210 | |
5.25%, 03/15/26 | | | 21 | | | | 21,840 | |
4.63%, 09/15/27(b) | | | 21 | | | | 21,500 | |
Qualitytech LP, 4.75%, 11/15/25(b) | | | 18 | | | | 18,653 | |
| | |
| 102 | | 2019 BLACKROCK ANNUAL REPORTTO SHAREHOLDERS |
| | |
Schedule of Investments (continued) December 31, 2019 | | BlackRock High Yield Portfolio (Percentages shown are based on Net Assets) |
| | | | | | | | |
| Security | | Par
(000) | | | Value | |
|
| Diversified Telecommunication Services (continued) | |
Qwest Corp., 6.75%, 12/01/21 | | USD | 10 | | | $ | 10,767 | |
Sprint Capital Corp.: | | | | | | | | |
6.88%, 11/15/28 | | | 92 | | | | 99,130 | |
8.75%, 03/15/32 | | | 58 | | | | 70,397 | |
Telecom Italia Capital SA: | | | | | | | | |
6.38%, 11/15/33 | | | 37 | | | | 41,070 | |
6.00%, 09/30/34 | | | 50 | | | | 53,625 | |
7.20%, 07/18/36 | | | 2 | | | | 2,370 | |
7.72%, 06/04/38 | | | 5 | | | | 6,150 | |
Telesat Canada(b): | | | | | | | | |
4.88%, 06/01/27 | | | 38 | | | | 38,665 | |
6.50%, 10/15/27 | | | 2 | | | | 2,085 | |
Virgin Media Finance plc, 5.75%, 01/15/25(b) | | | 200 | | | | 205,750 | |
| | | | | | | | |
| | | | | | | 1,853,470 | |
| | |
| Electric Utilities — 0.5%(b) | | | | | | |
NextEra Energy Operating Partners LP: | | | | | | | | |
4.25%, 07/15/24 | | | 49 | | | | 51,021 | |
4.25%, 09/15/24 | | | 14 | | | | 14,560 | |
4.50%, 09/15/27 | | | 17 | | | | 17,723 | |
Vistra Operations Co. LLC: | | | | | | | | |
3.55%, 07/15/24 | | | 25 | | | | 25,325 | |
4.30%, 07/15/29 | | | 47 | | | | 47,949 | |
| | | | | | | | |
| | | | | | | 156,578 | |
| | |
| Electrical Equipment — 0.3%(b) | | | | | | |
Sensata Technologies BV: | | | | | | | | |
5.63%, 11/01/24 | | | 13 | | | | 14,462 | |
5.00%, 10/01/25 | | | 40 | | | | 43,450 | |
Vertiv Group Corp., 9.25%, 10/15/24 | | | 42 | | | | 45,150 | |
| | | | | | | | |
| | | | | | | 103,062 | |
|
| Electronic Equipment, Instruments & Components — 0.5% | |
APX Group, Inc.: | | | | | | | | |
8.75%, 12/01/20 | | | 23 | | | | 23,000 | |
7.88%, 12/01/22 | | | 25 | | | | 25,219 | |
8.50%, 11/01/24(b) | | | 4 | | | | 4,120 | |
CDW LLC: | | | | | | | | |
5.50%, 12/01/24 | | | 20 | | | | 22,200 | |
5.00%, 09/01/25 | | | 60 | | | | 62,700 | |
4.25%, 04/01/28 | | | 7 | | | | 7,341 | |
Sensata Technologies, Inc., 4.38%, 02/15/30(b) | | | 16 | | | | 16,311 | |
| | | | | | | | |
| | | | | | | 160,891 | |
| |
| Energy Equipment & Services — 1.2% | | | | |
Apergy Corp., 6.38%, 05/01/26 | | | 22 | | | | 23,210 | |
Archrock Partners LP,
6.88%, 04/01/27(b) | | | 21 | | | | 22,208 | |
Nabors Industries, Inc.: | | | | | | | | |
4.63%, 09/15/21 | | | 19 | | | | 18,881 | |
5.50%, 01/15/23 | | | 5 | | | | 4,800 | |
Noble Holding International Ltd., 7.88%, 02/01/26(b) | | | 13 | | | | 9,425 | |
Pacific Drilling SA, 8.38%, 10/01/23(b) | | | 54 | | | | 49,275 | |
Rowan Cos., Inc., 4.88%, 06/01/22 | | | 56 | | | | 40,880 | |
Tervita Corp., 7.63%, 12/01/21(b) | | | 32 | | | | 32,200 | |
Transocean, Inc.: | | | | | | | | |
6.50%, 11/15/20 | | | 3 | | | | 3,060 | |
9.00%, 07/15/23(b) | | | 73 | | | | 77,106 | |
USA Compression Partners LP: | | | | | | | | |
6.88%, 04/01/26 | | | 49 | | | | 51,450 | |
6.88%, 09/01/27 | | | 29 | | | | 30,206 | |
Valaris plc, 4.70%, 03/15/21 | | | 2 | | | | 1,683 | |
| | | | | | | | |
| | | | | | | 364,384 | |
| | |
| Entertainment — 0.7% | | | | | | |
Lions Gate Capital Holdings LLC(b): | | | | | | | | |
6.38%, 02/01/24 | | | 3 | | | | 3,135 | |
| | | | | | | | |
| Security | | Par
(000) | | | Value | |
| | |
| Entertainment (continued) | | | | | | |
5.88%, 11/01/24 | | USD | 14 | | | $ | 14,070 | |
Live Nation Entertainment, Inc.(b): | | | | | | | | |
4.88%, 11/01/24 | | | 3 | | | | 3,105 | |
4.75%, 10/15/27 | | | 18 | | | | 18,630 | |
Netflix, Inc.: | | | | | | | | |
4.88%, 04/15/28 | | | 7 | | | | 7,271 | |
5.88%, 11/15/28 | | | 67 | | | | 74,274 | |
5.38%, 11/15/29(b) | | | 41 | | | | 43,664 | |
4.88%, 06/15/30(b) | | | 44 | | | | 44,687 | |
| | | | | | | | |
| | | | | | | 208,836 | |
|
| Equity Real Estate Investment Trusts (REITs) — 3.3% | |
Brookfield Property REIT,Inc., 5.75%, 05/15/26(b) | | | 26 | | | | 27,430 | |
GLP Capital LP: | | | | | | | | |
3.35%, 09/01/24 | | | 15 | | | | 15,311 | |
5.25%, 06/01/25 | | | 13 | | | | 14,269 | |
5.38%, 04/15/26 | | | 11 | | | | 12,159 | |
4.00%, 01/15/30 | | | 50 | | | | 51,035 | |
Iron Mountain, Inc.(b): | | | | | | | | |
4.88%, 09/15/27 | | | 22 | | | | 22,715 | |
4.88%, 09/15/29 | | | 27 | | | | 27,427 | |
iStar,Inc., 5.25%, 09/15/22 | | | 11 | | | | 11,289 | |
MGM Growth Properties Operating Partnership LP: | | | | | | | | |
5.63%, 05/01/24 | | | 83 | | | | 90,780 | |
4.50%, 09/01/26 | | | 67 | | | | 70,517 | |
5.75%, 02/01/27(b) | | | 27 | | | | 30,105 | |
4.50%, 01/15/28 | | | 37 | | | | 38,573 | |
MPT Operating Partnership LP: | | | | | | | | |
5.00%, 10/15/27 | | | 103 | | | | 109,180 | |
4.63%, 08/01/29 | | | 50 | | | | 51,500 | |
Ryman Hospitality Properties, Inc.,
4.75%, 10/15/27(b) | | | 62 | | | | 64,015 | |
SBA Communications Corp.: | | | | | | | | |
4.00%, 10/01/22 | | | 32 | | | | 32,600 | |
4.88%, 09/01/24 | | | 120 | | | | 124,500 | |
VICI Properties 1 LLC, 8.00%, 10/15/23 | | | 17 | | | | 18,837 | |
VICI Properties LP(b): | | | | | | | | |
4.25%, 12/01/26 | | | 116 | | | | 119,480 | |
4.63%, 12/01/29 | | | 83 | | | | 86,527 | |
| | | | | | | | |
| | | | | | | 1,018,249 | |
| |
| Food & Staples Retailing — 0.3% | | | | |
Albertsons Cos., Inc.: | | | | | | | | |
5.75%, 03/15/25 | | | 30 | | | | 31,050 | |
4.63%, 01/15/27(b) | | | 37 | | | | 36,956 | |
5.88%, 02/15/28(b) | | | 36 | | | | 38,250 | |
| | | | | | | | |
| | | | | | | 106,256 | |
| | |
| Food Products — 1.6%(b) | | | | | | |
Chobani LLC, 7.50%, 04/15/25 | | | 57 | | | | 57,285 | |
Darling Ingredients, Inc., 5.25%, 04/15/27 | | | 11 | | | | 11,701 | |
JBS USA LUX SA: | | | | | | | | |
5.88%, 07/15/24 | | | 32 | | | | 32,910 | |
5.75%, 06/15/25 | | | 89 | | | | 92,226 | |
6.75%, 02/15/28 | | | 58 | | | | 64,145 | |
6.50%, 04/15/29 | | | 62 | | | | 68,899 | |
5.50%, 01/15/30 | | | 48 | | | | 51,557 | |
Post Holdings, Inc.: | | | | | | | | |
5.50%, 03/01/25 | | | 19 | | | | 19,902 | |
5.75%, 03/01/27 | | | 26 | | | | 27,885 | |
5.63%, 01/15/28 | | | 16 | | | | 17,240 | |
5.50%, 12/15/29 | | | 19 | | | | 20,260 | |
Simmons Foods, Inc., 7.75%, 01/15/24 | | | 25 | | | | 26,938 | |
| | | | | | | | |
| | | | | | | 490,948 | |
| | | | |
| SCHEDULES OF INVESTMENTS | | | 103 | |
| | |
Schedule of Investments (continued) December 31, 2019 | | BlackRock High Yield Portfolio (Percentages shown are based on Net Assets) |
| | | | | | | | |
| Security | | Par
(000) | | | Value | |
| | |
| Gas Utilities— 0.1% | | | | | | |
Superior Plus LP, 7.00%, 07/15/26(b) | | | USD 31 | | | $ | 33,286 | |
| | | | | | | | |
| | |
| Health Care Equipment & Supplies— 0.9% | | | | | | |
Hill-Rom Holdings, Inc., 4.38%, 09/15/27(b) | | | 9 | | | | 9,259 | |
Hologic, Inc.(b): | | | | | | | | |
4.38%, 10/15/25 | | | 18 | | | | 18,585 | |
4.63%, 02/01/28 | | | 12 | | | | 12,720 | |
Immucor, Inc., 11.13%, 02/15/22(b) | | | 8 | | | | 7,980 | |
Ortho-Clinical Diagnostics, Inc.,
6.63%, 05/15/22(b) | | | 199 | | | | 197,756 | |
Teleflex, Inc.: | | | | | | | | |
4.88%, 06/01/26 | | | 25 | | | | 26,125 | |
4.63%, 11/15/27 | | | 2 | | | | 2,120 | |
| | | | | | | | |
| | | | | | | 274,545 | |
|
| Health Care Providers & Services— 5.0% | |
Acadia Healthcare Co., Inc., 5.13%, 07/01/22 | | | 21 | | | | 21,157 | |
AHP Health Partners, Inc., 9.75%, 07/15/26(b) | | | 26 | | | | 28,567 | |
Centene Corp.(b): | | | | | | | | |
5.38%, 06/01/26 | | | 32 | | | | 33,960 | |
4.25%, 12/15/27 | | | 61 | | | | 62,754 | |
4.63%, 12/15/29 | | | 154 | | | | 161,908 | |
Community Health Systems, Inc.(b): | | | | | | | | |
8.63%, 01/15/24 | | | 60 | | | | 63,600 | |
8.00%, 03/15/26 | | | 65 | | | | 66,950 | |
Eagle Holding Co. II LLC(b)(f): | | | | | | | | |
7.63%, (7.63% Cash or 8.38% PIK), 05/15/22 | | | 10 | | | | 10,157 | |
7.75%, (7.75% Cash or 8.50% PIK), 05/15/22 | | | 33 | | | | 33,508 | |
Envision Healthcare Corp., 8.75%, 10/15/26(b) | | | 20 | | | | 12,400 | |
HCA, Inc.: | | | | | | | | |
5.38%, 02/01/25 | | | 68 | | | | 75,196 | |
5.38%, 09/01/26 | | | 20 | | | | 22,275 | |
5.63%, 09/01/28 | | | 76 | | | | 86,610 | |
5.88%, 02/01/29 | | | 74 | | | | 85,563 | |
MEDNAX, Inc.(b): | | | | | | | | |
5.25%, 12/01/23 | | | 15 | | | | 15,337 | |
6.25%, 01/15/27 | | | 51 | | | | 52,275 | |
Molina Healthcare, Inc.: | | | | | | | | |
5.38%, 11/15/22(g) | | | 20 | | | | 21,260 | |
4.88%, 06/15/25(b) | | | 9 | | | | 9,247 | |
NVA Holdings, Inc., 6.88%, 04/01/26(b) | | | 14 | | | | 15,138 | |
Polaris Intermediate Corp., 8.50%, (8.50% Cash or 9.25% PIK), 12/01/22(b)(f) | | | 40 | | | | 36,940 | |
Surgery Center Holdings, Inc.(b): | | | | | | | | |
6.75%, 07/01/25 | | | 44 | | | | 44,000 | |
10.00%, 04/15/27 | | | 26 | | | | 28,535 | |
Team Health Holdings, Inc., 6.38%, 02/01/25(b) | | | 9 | | | | 6,008 | |
Tenet Healthcare Corp.: | | | | | | | | |
8.13%, 04/01/22 | | | 60 | | | | 66,375 | |
4.63%, 07/15/24 | | | 54 | | | | 55,283 | |
4.63%, 09/01/24(b) | | | 34 | | | | 35,448 | |
4.88%, 01/01/26(b) | | | 132 | | | | 138,257 | |
6.25%, 02/01/27(b) | | | 30 | | | | 32,287 | |
5.13%, 11/01/27(b) | | | 87 | | | | 91,894 | |
Vizient, Inc., 6.25%, 05/15/27(b) | | | 36 | | | | 38,520 | |
WellCare Health Plans, Inc.: | | | | | | | | |
5.25%, 04/01/25 | | | 29 | | | | 30,160 | |
5.38%, 08/15/26(b) | | | 45 | | | | 47,925 | |
| | | | | | | | |
| | | | | | | 1,529,494 | |
| | |
| Hotels, Restaurants & Leisure— 4.8% | | | | | | |
1011778 BC ULC(b): | | | | | | | | |
5.00%, 10/15/25 | | | 123 | | | | 126,997 | |
3.88%, 01/15/28 | | | 42 | | | | 42,105 | |
| | | | | | | | |
| Security | | Par
(000) | | | Value | |
|
| Hotels, Restaurants & Leisure (continued) | |
4.38%, 01/15/28 | | | USD 44 | | | $ | 44,110 | |
Boyne USA, Inc., 7.25%, 05/01/25(b) | | | 13 | | | | 14,137 | |
Cedar Fair LP, 5.25%, 07/15/29(b) | | | 44 | | | | 47,410 | |
Churchill Downs, Inc.(b): | | | | | | | | |
5.50%, 04/01/27 | | | 76 | | | | 80,560 | |
4.75%, 01/15/28 | | | 36 | | | | 37,170 | |
Eldorado Resorts, Inc., 6.00%, 09/15/26 | | | 12 | | | | 13,215 | |
Golden Nugget, Inc., 6.75%, 10/15/24(b) | | | 112 | | | | 115,920 | |
Hilton Domestic Operating Co., Inc.: | | | | | | | | |
5.13%, 05/01/26 | | | 31 | | | | 32,628 | |
4.88%, 01/15/30 | | | 119 | | | | 126,069 | |
Hilton Worldwide Finance LLC, 4.88%, 04/01/27 | | | 20 | | | | 21,250 | |
IRB Holding Corp., 6.75%, 02/15/26(b) | | | 6 | | | | 6,285 | |
KFC Holding Co.(b): | | | | | | | | |
5.25%, 06/01/26 | | | 32 | | | | 33,760 | |
4.75%, 06/01/27 | | | 2 | | | | 2,105 | |
Marriott Ownership Resorts, Inc., 6.50%, 09/15/26 | | | 2 | | | | 2,177 | |
MGM Resorts International: | | | | | | | | |
7.75%, 03/15/22 | | | 42 | | | | 46,987 | |
6.00%, 03/15/23 | | | 25 | | | | 27,438 | |
5.75%, 06/15/25 | | | 5 | | | | 5,600 | |
4.63%, 09/01/26 | | | 2 | | | | 2,120 | |
Sabre GLBL, Inc.(b): | | | | | | | | |
5.38%, 04/15/23 | | | 11 | | | | 11,269 | |
5.25%, 11/15/23 | | | 19 | | | | 19,499 | |
Scientific Games International, Inc.(b): | | | | | | | | |
5.00%, 10/15/25 | | | 124 | | | | 129,735 | |
8.25%, 03/15/26 | | | 71 | | | | 78,278 | |
7.00%, 05/15/28 | | | 26 | | | | 27,885 | |
7.25%, 11/15/29 | | | 34 | | | | 36,890 | |
Six Flags Entertainment Corp., 5.50%, 04/15/27(b) | | | 51 | | | | 54,379 | |
Station Casinos LLC, 5.00%, 10/01/25(b) | | | 35 | | | | 35,613 | |
Viking Cruises Ltd., 5.88%, 09/15/27(b) | | | 84 | | | | 89,775 | |
Wyndham Destinations,Inc., 5.75%, 04/01/27(g) | | | 8 | | | | 8,680 | |
Wyndham Hotels &Resorts, Inc.,
5.38%, 04/15/26(b) | | | 19 | | | | 20,045 | |
Wynn Las Vegas LLC, 5.25%, 05/15/27(b) | | | 26 | | | | 27,625 | |
Wynn Resorts Finance LLC, 5.13%, 10/01/29(b) | | | 47 | | | | 50,408 | |
Yum! Brands, Inc.: | | | | | | | | |
3.88%, 11/01/23 | | | 2 | | | | 2,060 | |
4.75%, 01/15/30(b) | | | 37 | | | | 38,757 | |
5.35%, 11/01/43 | | | 2 | | | | 1,980 | |
| | | | | | | | |
| | | | | | | 1,460,921 | |
| | |
| Household Durables— 0.9% | | | | | | |
Brookfield Residential Properties, Inc.,
6.25%, 09/15/27(b) | | | 26 | | | | 27,430 | |
Installed Building Products, Inc., 5.75%, 02/01/28(b) | | | 13 | | | | 13,894 | |
Lennar Corp.: | | | | | | | | |
6.63%, 05/01/20 | | | 6 | | | | 6,083 | |
5.25%, 06/01/26 | | | 14 | | | | 15,330 | |
4.75%, 11/29/27 | | | 47 | | | | 50,642 | |
Mattamy Group Corp., 5.25%, 12/15/27(b) | | | 14 | | | | 14,560 | |
MDC Holdings, Inc., 6.00%, 01/15/43 | | | 10 | | | | 10,400 | |
Meritage Homes Corp., 5.13%, 06/06/27 | | | 4 | | | | 4,270 | |
PulteGroup, Inc.: | | | | | | | | |
6.38%, 05/15/33 | | | 30 | | | | 35,025 | |
6.00%, 02/15/35 | | | 6 | | | | 6,690 | |
Taylor Morrison Communities, Inc.,
5.88%, 06/15/27(b) | | | 25 | | | | 27,500 | |
| | |
| 104 | | 2019 BLACKROCK ANNUAL REPORTTO SHAREHOLDERS |
| | |
Schedule of Investments (continued) December 31, 2019 | | BlackRock High Yield Portfolio (Percentages shown are based on Net Assets) |
| | | | | | | | |
| Security | | Par
(000) | | | Value | |
| | |
| Household Durables (continued) | | | | | | |
Tempur Sealy International, Inc., 5.50%, 06/15/26 | | | USD 2 | | | $ | 2,107 | |
TRI Pointe Group, Inc., 4.88%, 07/01/21 | | | 13 | | | | 13,325 | |
Williams Scotsman International, Inc.(b): | | | | | | | | |
7.88%, 12/15/22 | | | 12 | | | | 12,510 | |
6.88%, 08/15/23 | | | 36 | | | | 37,890 | |
| | | | | | | | |
| | | | | | | 277,656 | |
| | |
| Household Products— 0.2%(b) | | | | | | |
Energizer Holdings, Inc.: | | | | | | | | |
6.38%, 07/15/26 | | | 6 | | | | 6,390 | |
7.75%, 01/15/27 | | | 26 | | | | 29,056 | |
Spectrum Brands, Inc., 5.00%, 10/01/29 | | | 19 | | | | 19,618 | |
| | | | | | | | |
| | | | | | | 55,064 | |
|
| Independent Power and Renewable Electricity Producers— 1.8% | |
Calpine Corp.: | | | | | | | | |
5.50%, 02/01/24 | | | 9 | | | | 9,135 | |
5.75%, 01/15/25 | | | 45 | | | | 46,181 | |
5.25%, 06/01/26(b) | | | 54 | | | | 56,228 | |
4.50%, 02/15/28(b) | | | 54 | | | | 54,479 | |
5.13%, 03/15/28(b) | | | 122 | | | | 124,525 | |
Clearway Energy Operating LLC: | | | | | | | | |
5.75%, 10/15/25 | | | 12 | | | | 12,630 | |
4.75%, 03/15/28(b) | | | 29 | | | | 29,399 | |
NRG Energy,Inc.: | | | | | | | | |
3.75%, 06/15/24(b) | | | 13 | | | | 13,443 | |
6.63%, 01/15/27 | | | 55 | | | | 59,675 | |
5.75%, 01/15/28 | | | 3 | | | | 3,255 | |
4.45%, 06/15/29(b) | | | 46 | | | | 48,189 | |
5.25%, 06/15/29(b) | | | 63 | | | | 68,119 | |
Pattern Energy Group, Inc., 5.88%, 02/01/24(b) | | | 24 | | | | 24,690 | |
Talen Energy Supply LLC: | | | | | | | | |
6.50%, 06/01/25 | | | 4 | | | | 3,414 | |
10.50%, 01/15/26(b) | | | 4 | | | | 3,805 | |
| | | | | | | | |
| | | | | | | 557,167 | |
| | |
| Insurance— 1.1%(b) | | | | | | |
Acrisure LLC, 8.13%, 02/15/24 | | | 28 | | | | 30,450 | |
Alliant Holdings Intermediate LLC, 6.75%, 10/15/27 | | | 96 | | | | 102,811 | |
AmWINS Group, Inc., 7.75%, 07/01/26 | | | 34 | | | | 37,574 | |
GTCR AP Finance, Inc., 8.00%, 05/15/27 | | | 23 | | | | 23,920 | |
HUB International Ltd., 7.00%, 05/01/26 | | | 119 | | | | 125,843 | |
NFP Corp., 8.00%, 07/15/25 | | | 9 | | | | 9,180 | |
| | | | | | | | |
| | | | | | | 329,778 | |
| | |
| Interactive Media & Services— 0.1%(b) | | | | | | |
Rackspace Hosting, Inc., 8.63%, 11/15/24 | | | 17 | | | | 16,617 | |
Twitter,Inc., 3.88%, 12/15/27 | | | 12 | | | | 11,994 | |
| | | | | | | | |
| | | | | | | 28,611 | |
| | |
| Internet & Direct Marketing Retail— 0.1% | | | | | | |
Go Daddy Operating Co. LLC, 5.25%, 12/01/27(b) | | | 21 | | | | 22,102 | |
| | | | | | | | |
| | |
| IT Services— 1.9% | | | | | | |
Banff Merger Sub, Inc., 9.75%, 09/01/26(b) | | | 162 | | | | 164,025 | |
Booz Allen Hamilton, Inc., 5.13%, 05/01/25(b) | | | 67 | | | | 68,842 | |
Gartner,Inc., 5.13%, 04/01/25(b) | | | 22 | | | | 22,907 | |
Tempo Acquisition LLC, 6.75%, 06/01/25(b) | | | 83 | | | | 85,698 | |
WEX, Inc., 4.75%, 02/01/23(b) | | | 16 | | | | 16,120 | |
Zayo Group LLC: | | | | | | | | |
6.00%, 04/01/23 | | | 35 | | | | 35,787 | |
6.38%, 05/15/25 | | | 25 | | | | 25,771 | |
5.75%, 01/15/27(b) | | | 150 | | | | 152,438 | |
| | | | | | | | |
| | | | | | | 571,588 | |
| | | | | | | | |
| Security | | Par
(000) | | | Value | |
| | |
| Leisure Products— 0.4% | | | | | | |
Mattel, Inc.(b): | | | | | | | | |
6.75%, 12/31/25 | | | USD 80 | | | $ | 85,984 | |
5.88%, 12/15/27 | | | 30 | | | | 31,613 | |
| | | | | | | | |
| | | | | | | 117,597 | |
| | |
| Life Sciences Tools & Services— 1.2%(b) | | | | | | |
Avantor,Inc.: | | | | | | | | |
6.00%, 10/01/24 | | | 178 | | | | 189,789 | |
9.00%, 10/01/25 | | | 92 | | | | 102,813 | |
Charles River Laboratories International, Inc.: | | | | | | | | |
5.50%, 04/01/26 | | | 36 | | | | 38,700 | |
4.25%, 05/01/28 | | | 28 | | | | 28,525 | |
| | | | | | | | |
| | | | | | | 359,827 | |
| | |
| Machinery— 1.4%(b) | | | | | | |
Amsted Industries, Inc., 5.63%, 07/01/27 | | | 15 | | | | 15,900 | |
Colfax Corp.: | | | | | | | | |
6.00%, 02/15/24 | | | 43 | | | | 45,687 | |
6.38%, 02/15/26 | | | 23 | | | | 25,070 | |
Grinding Media, Inc., 7.38%, 12/15/23 | | | 28 | | | | 28,525 | |
Manitowoc Co., Inc. (The), 9.00%, 04/01/26 | | | 12 | | | | 12,570 | |
Mueller Water Products, Inc., 5.50%, 06/15/26 | | | 38 | | | | 40,043 | |
Navistar International Corp., 6.63%, 11/01/25 | | | 35 | | | | 35,656 | |
RBS Global, Inc., 4.88%, 12/15/25 | | | 74 | | | | 76,405 | |
SPX FLOW, Inc., 5.63%, 08/15/24 | | | 29 | | | | 30,196 | |
Stevens Holding Co., Inc., 6.13%, 10/01/26 | | | 20 | | | | 21,850 | |
Terex Corp., 5.63%, 02/01/25 | | | 18 | | | | 18,585 | |
Titan Acquisition Ltd., 7.75%, 04/15/26 | | | 62 | | | | 61,380 | |
Wabash National Corp., 5.50%, 10/01/25 | | | 23 | | | | 23,000 | |
| | | | | | | | |
| | | | | | | 434,867 | |
| | |
| Media— 7.8% | | | | | | |
Altice Financing SA, 7.50%, 05/15/26(b) | | | 200 | | | | 215,000 | |
Altice Luxembourg SA(b): | | | | | | | | |
7.63%, 02/15/25 | | | 200 | | | | 207,750 | |
10.50%, 05/15/27 | | | 200 | | | | 228,010 | |
AMC Networks, Inc.: | | | | | | | | |
5.00%, 04/01/24 | | | 2 | | | | 2,040 | |
4.75%, 08/01/25 | | | 30 | | | | 30,112 | |
Clear Channel Worldwide Holdings, Inc.(b): | | | | | | | | |
9.25%, 02/15/24 | | | 94 | | | | 104,105 | |
5.13%, 08/15/27 | | | 167 | | | | 173,897 | |
CSC Holdings LLC: | | | | | | | | |
6.75%, 11/15/21 | | | 164 | | | | 176,505 | |
5.25%, 06/01/24 | | | 9 | | | | 9,697 | |
5.38%, 02/01/28(b) | | | 200 | | | | 213,250 | |
6.50%, 02/01/29(b) | | | 200 | | | | 223,000 | |
Diamond Sports Group LLC, 5.38%, 08/15/26(b) | | | 60 | | | | 60,693 | |
DISH DBS Corp.: | | | | | | | | |
6.75%, 06/01/21 | | | 11 | | | | 11,577 | |
5.88%, 07/15/22 | | | 160 | | | | 169,600 | |
5.00%, 03/15/23 | | | 23 | | | | 23,595 | |
5.88%, 11/15/24 | | | 6 | | | | 6,131 | |
Entercom Media Corp., 6.50%, 05/01/27(b) | | | 30 | | | | 32,100 | |
GCI LLC, 6.63%, 06/15/24(b) | | | 15 | | | | 16,238 | |
iHeartCommunications, Inc.: | | | | | | | | |
6.38%, 05/01/26 | | | 34 | | | | 37,379 | |
5.25%, 08/15/27(b) | | | 9 | | | | 9,417 | |
4.75%, 01/15/28(b) | | | 12 | | | | 12,300 | |
Meredith Corp., 6.88%, 02/01/26 | | | 4 | | | | 4,159 | |
Midcontinent Communications, 5.38%, 08/15/27(b) | | | 16 | | | | 16,920 | |
Outfront Media Capital LLC(b): | | | | | | | | |
5.00%, 08/15/27 | | | 50 | | | | 52,375 | |
4.63%, 03/15/30 | | | 27 | | | | 27,473 | |
| | | | |
| SCHEDULES OF INVESTMENTS | | | 105 | |
| | |
Schedule of Investments (continued) December 31, 2019 | | BlackRock High Yield Portfolio (Percentages shown are based on Net Assets) |
| | | | | | | | |
| Security | | Par
(000) | | | Value | |
| | |
| Media (continued) | | | | | | |
Radiate Holdco LLC(b): | | | | | | | | |
6.88%, 02/15/23 | | | USD 6 | | | $ | 6,105 | |
6.63%, 02/15/25 | | | 16 | | | | 16,160 | |
Sirius XM Radio, Inc.(b): | | | | | | | | |
4.63%, 07/15/24 | | | 14 | | | | 14,700 | |
5.00%, 08/01/27 | | | 74 | | | | 78,070 | |
5.50%, 07/01/29 | | | 54 | | | | 58,387 | |
TEGNA, Inc., 5.50%, 09/15/24(b) | | | 8 | | | | 8,280 | |
Terrier Media Buyer,Inc., 8.88%, 12/15/27(b) | | | 45 | | | | 47,588 | |
Univision Communications, Inc.(b): | | | | | | | | |
6.75%, 09/15/22 | | | 1 | | | | 1,014 | |
5.13%, 05/15/23 | | | 21 | | | | 20,947 | |
5.13%, 02/15/25 | | | 25 | | | | 24,719 | |
Videotron Ltd., 5.13%, 04/15/27(b) | | | 44 | | | | 47,080 | |
WMG Acquisition Corp., 5.50%, 04/15/26(b) | | | 12 | | | | 12,630 | |
| | | | | | | | |
| | | | | | | 2,399,003 | |
| | |
| Metals & Mining— 3.0% | | | | | | |
Allegheny Technologies, Inc., 5.88%, 12/01/27 | | | 29 | | | | 30,450 | |
Big River Steel LLC, 7.25%, 09/01/25(b) | | | 26 | | | | 27,430 | |
Constellium SE, 5.88%, 02/15/26(b) | | | 250 | | | | 264,375 | |
Freeport-McMoRan, Inc.: | | | | | | | | |
3.55%, 03/01/22 | | | 50 | | | | 50,625 | |
3.88%, 03/15/23 | | | 118 | | | | 120,151 | |
5.00%, 09/01/27 | | | 9 | | | | 9,450 | |
5.25%, 09/01/29 | | | 15 | | | | 16,070 | |
5.45%, 03/15/43 | | | 153 | | | | 158,355 | |
Kaiser Aluminum Corp., 4.63%, 03/01/28(b) | | | 14 | | | | 14,364 | |
New Gold, Inc., 6.25%, 11/15/22(b) | | | 39 | | | | 38,817 | |
Novelis Corp.(b): | | | | | | | | |
6.25%, 08/15/24 | | | 100 | | | | 104,875 | |
5.88%, 09/30/26 | | | 83 | | | | 88,321 | |
| | | | | | | | |
| | | | | | | 923,283 | |
| |
| Mortgage Real Estate Investment Trusts (REITs)— 0.0% | | | | |
Starwood Property Trust, Inc., 5.00%, 12/15/21 | | | 12 | | | | 12,450 | |
| | | | | | | | |
| | |
| Oil, Gas & Consumable Fuels— 7.2% | | | | | | |
Antero Midstream Partners LP, 5.38%, 09/15/24 | | | 5 | | | | 4,637 | |
Antero Resources Corp., 5.38%, 11/01/21 | | | 15 | | | | 14,283 | |
Ascent Resources Utica Holdings LLC,
10.00%, 04/01/22(b) | | | 30 | | | | 29,839 | |
Berry Petroleum Co. LLC, 7.00%, 02/15/26(b) | | | 12 | | | | 11,115 | |
Callon Petroleum Co.: | | | | | | | | |
6.13%, 10/01/24 | | | 23 | | | | 23,436 | |
6.38%, 07/01/26 | | | 29 | | | | 29,423 | |
Carrizo Oil & Gas, Inc.: | | | | | | | | |
6.25%, 04/15/23 | | | 24 | | | | 24,356 | |
8.25%, 07/15/25 | | | 23 | | | | 23,518 | |
Centennial Resource Production LLC,
6.88%, 04/01/27(b) | | | 22 | | | | 22,880 | |
Cheniere Energy Partners LP: | | | | | | | | |
5.63%, 10/01/26 | | | 51 | | | | 53,932 | |
4.50%, 10/01/29(b) | | | 60 | | | | 61,656 | |
Chesapeake Energy Corp.: | | | | | | | | |
6.63%, 08/15/20 | | | 28 | | | | 27,720 | |
4.88%, 04/15/22 | | | 58 | | | | 45,820 | |
5.75%, 03/15/23 | | | 24 | | | | 16,245 | |
11.50%, 01/01/25(b) | | | 50 | | | | 47,250 | |
CNX Resources Corp., 5.88%, 04/15/22 | | | 81 | | | | 81,057 | |
Comstock Resources, Inc., 9.75%, 08/15/26 | | | 20 | | | | 18,150 | |
CONSOL Energy, Inc., 11.00%, 11/15/25(b) | | | 66 | | | | 56,224 | |
Covey Park Energy LLC, 7.50%, 05/15/25(b) | | | 27 | | | | 23,220 | |
Crestwood Midstream Partners LP,
5.63%, 05/01/27(b) | | | 42 | | | | 42,577 | |
CrownRock LP, 5.63%, 10/15/25(b) | | | 90 | | | | 91,800 | |
| | | | | | | | |
| Security | | Par
(000) | | | Value | |
|
| Oil, Gas & Consumable Fuels (continued) | |
DCP Midstream Operating LP: | | | | | | | | |
5.38%, 07/15/25 | | | USD 10 | | | $ | 10,875 | |
5.13%, 05/15/29 | | | 11 | | | | 11,412 | |
6.45%, 11/03/36(b) | | | 17 | | | | 17,850 | |
6.75%, 09/15/37(b) | | | 29 | | | | 30,450 | |
Denbury Resources, Inc.(b): | | | | | | | | |
9.00%, 05/15/21 | | | 37 | | | | 35,797 | |
9.25%, 03/31/22 | | | 5 | | | | 4,713 | |
Endeavor Energy Resources LP(b): | | | | | | | | |
5.50%, 01/30/26 | | | 56 | | | | 57,820 | |
5.75%, 01/30/28 | | | 44 | | | | 46,255 | |
EnLink Midstream LLC, 5.38%, 06/01/29 | | | 8 | | | | 7,520 | |
EnLink Midstream Partners LP: | | | | | | | | |
4.40%, 04/01/24 | | | 22 | | | | 21,342 | |
4.85%, 07/15/26 | | | 2 | | | | 1,875 | |
5.60%, 04/01/44 | | | 18 | | | | 14,580 | |
5.05%, 04/01/45 | | | 3 | | | | 2,370 | |
Extraction Oil & Gas, Inc.(b): | | | | | | | | |
7.38%, 05/15/24 | | | 46 | | | | 28,750 | |
5.63%, 02/01/26 | | | 38 | | | | 22,800 | |
Genesis Energy LP: | | | | | | | | |
6.00%, 05/15/23 | | | 8 | | | | 7,920 | |
5.63%, 06/15/24 | | | 5 | | | | 4,825 | |
6.50%, 10/01/25 | | | 11 | | | | 10,643 | |
6.25%, 05/15/26 | | | 9 | | | | 8,595 | |
Great Western Petroleum LLC, 9.00%, 09/30/21(b) | | | 49 | | | | 43,794 | |
Hess Midstream Operations LP(b): | | | | | | | | |
5.63%, 02/15/26 | | | 19 | | | | 19,777 | |
5.13%, 06/15/28 | | | 14 | | | | 14,175 | |
Indigo Natural Resources LLC, 6.88%, 02/15/26(b) | | | 29 | | | | 27,260 | |
Matador Resources Co., 5.88%, 09/15/26 | | | 36 | | | | 36,090 | |
MEG Energy Corp.(b): | | | | | | | | |
6.38%, 01/30/23 | | | 25 | | | | 25,062 | |
7.00%, 03/31/24 | | | 7 | | | | 7,044 | |
6.50%, 01/15/25 | | | 70 | | | | 72,807 | |
Murphy Oil Corp.: | | | | | | | | |
5.75%, 08/15/25 | | | 12 | | | | 12,551 | |
5.88%, 12/01/27 | | | 15 | | | | 15,750 | |
5.87%, 12/01/42(g) | | | 9 | | | | 8,280 | |
NGPL PipeCo LLC, 7.77%, 12/15/37(b) | | | 25 | | | | 32,280 | |
NuStar Logistics LP, 6.00%, 06/01/26 | | | 18 | | | | 19,035 | |
Parkland Fuel Corp., 5.88%, 07/15/27(b) | | | 23 | | | | 24,733 | |
Parsley Energy LLC(b): | | | | | | | | |
6.25%, 06/01/24 | | | 15 | | | | 15,600 | |
5.38%, 01/15/25 | | | 42 | | | | 43,260 | |
5.25%, 08/15/25 | | | 6 | | | | 6,165 | |
5.63%, 10/15/27 | | | 15 | | | | 15,863 | |
PBF Holding Co. LLC, 7.25%, 06/15/25 | | | 11 | | | | 11,743 | |
PDC Energy, Inc.: | | | | | | | | |
1.13%, 09/15/21(h) | | | 2 | | | | 1,878 | |
6.13%, 09/15/24 | | | 2 | | | | 2,025 | |
5.75%, 05/15/26 | | | 17 | | | | 16,957 | |
QEP Resources, Inc.: | | | | | | | | |
6.88%, 03/01/21 | | | 5 | | | | 5,175 | |
5.38%, 10/01/22 | | | 41 | | | | 41,205 | |
5.25%, 05/01/23 | | | 7 | | | | 6,930 | |
5.63%, 03/01/26 | | | 23 | | | | 22,431 | |
Range Resources Corp.: | | | | | | | | |
5.75%, 06/01/21 | | | 34 | | | | 33,915 | |
5.88%, 07/01/22 | | | 6 | | | | 5,955 | |
5.00%, 08/15/22 | | | 8 | | | | 7,840 | |
SM Energy Co.: | | | | | | | | |
1.50%, 07/01/21(h) | | | 23 | | | | 21,774 | |
| | |
| 106 | | 2019 BLACKROCK ANNUAL REPORTTO SHAREHOLDERS |
| | |
Schedule of Investments (continued) December 31, 2019 | | BlackRock High Yield Portfolio (Percentages shown are based on Net Assets) |
| | | | | | | | |
| Security | | Par
(000) | | | Value | |
| | |
| Oil, Gas & Consumable Fuels (continued) | | | | | | |
6.13%, 11/15/22 | | USD | 41 | | | $ | 41,410 | |
5.63%, 06/01/25 | | | 4 | | | | 3,797 | |
6.75%, 09/15/26 | | | 10 | | | | 9,800 | |
6.63%, 01/15/27 | | | 4 | | | | 3,931 | |
Southwestern Energy Co.: | | | | | | | | |
6.20%, 01/23/25(g) | | | 3 | | | | 2,752 | |
7.75%, 10/01/27 | | | 2 | | | | 1,852 | |
SRC Energy,Inc., 6.25%, 12/01/25 | | | 4 | | | | 4,030 | |
Sunoco LP: | | | | | | | | |
5.50%, 02/15/26 | | | 3 | | | | 3,112 | |
6.00%, 04/15/27 | | | 13 | | | | 13,878 | |
5.88%, 03/15/28 | | | 2 | | | | 2,124 | |
Tallgrass Energy Partners LP(b): | | | | | | | | |
4.75%, 10/01/23 | | | 14 | | | | 13,965 | |
5.50%, 09/15/24 | | | 38 | | | | 38,190 | |
5.50%, 01/15/28 | | | 9 | | | | 8,820 | |
Targa Resources Partners LP: | | | | | | | | |
5.13%, 02/01/25 | | | 27 | | | | 28,012 | |
5.88%, 04/15/26 | | | 23 | | | | 24,438 | |
6.50%, 07/15/27(b) | | | 38 | | | | 41,610 | |
5.00%, 01/15/28 | | | 9 | | | | 9,180 | |
6.88%, 01/15/29(b) | | | 79 | | | | 87,690 | |
5.50%, 03/01/30(b) | | | 34 | | | | 34,935 | |
TerraForm Power Operating LLC(b): | | | | | | | | |
4.25%, 01/31/23 | | | 19 | | | | 19,560 | |
5.00%, 01/31/28 | | | 28 | | | | 29,605 | |
4.75%, 01/15/30 | | | 30 | | | | 30,525 | |
Viper Energy Partners LP, 5.38%, 11/01/27(b) | | | 11 | | | | 11,440 | |
WPX Energy,Inc.: | | | | | | | | |
8.25%, 08/01/23 | | | 9 | | | | 10,350 | |
5.25%, 09/15/24 | | | 9 | | | | 9,562 | |
5.75%, 06/01/26 | | | 11 | | | | 11,743 | |
5.25%, 10/15/27 | | | 7 | | | | 7,385 | |
| | | | | | | | |
| | | | | | | 2,216,580 | |
|
| Paper & Forest Products— 0.1% | |
Norbord, Inc., 6.25%, 04/15/23(b) | | | 22 | | | | 23,540 | |
| | | | | | | | |
|
| Pharmaceuticals— 2.5% | |
Bausch Health Americas, Inc.(b): | | | | | | | | |
9.25%, 04/01/26 | | | 23 | | | | 26,418 | |
8.50%, 01/31/27 | | | 63 | | | | 71,744 | |
Bausch Health Cos., Inc.(b): | | | | | | | | |
5.88%, 05/15/23 | | | 13 | | | | 13,114 | |
7.00%, 03/15/24 | | | 13 | | | | 13,520 | |
6.13%, 04/15/25 | | | 48 | | | | 49,595 | |
5.50%, 11/01/25 | | | 108 | | | | 112,860 | |
9.00%, 12/15/25 | | | 31 | | | | 35,253 | |
5.75%, 08/15/27 | | | 33 | | | | 35,805 | |
7.00%, 01/15/28 | | | 38 | | | | 41,945 | |
5.00%, 01/30/28 | | | 57 | | | | 58,504 | |
7.25%, 05/30/29 | | | 44 | | | | 50,270 | |
5.25%, 01/30/30 | | | 56 | | | | 58,072 | |
Catalent Pharma Solutions, Inc.(b): | | | | | | | | |
4.88%, 01/15/26 | | | 35 | | | | 36,225 | |
5.00%, 07/15/27 | | | 46 | | | | 48,185 | |
Elanco Animal Health, Inc., 4.90%, 08/28/28 | | | 25 | | | | 27,205 | |
Par Pharmaceutical, Inc., 7.50%, 04/01/27(b) | | | 76 | | | | 75,620 | |
| | | | | | | | |
| | | | | | | 754,335 | |
|
| Professional Services— 1.1%(b) | |
ASGN, Inc., 4.63%, 05/15/28 | | | 25 | | | | 25,697 | |
Dun & Bradstreet Corp. (The): | | | | | | | | |
6.88%, 08/15/26 | | | 79 | | | | 87,196 | |
10.25%, 02/15/27 | | | 65 | | | | 74,750 | |
| | | | | | | | |
| Security | | Par
(000) | | | Value | |
|
| Professional Services (continued) | |
Jaguar Holding Co. II, 6.38%, 08/01/23 | | USD | 153 | | | $ | 157,925 | |
| | | | | | | | |
| | | | | | | 345,568 | |
|
| Real Estate Management & Development— 0.3% | |
Five Point Operating Co. LP, 7.88%, 11/15/25(b) | | | 23 | | | | 23,168 | |
Greystar Real Estate Partners LLC, 5.75%, 12/01/25(b) | | | 26 | | | | 26,975 | |
Howard Hughes Corp. (The), 5.38%, 03/15/25(b) | | | 25 | | | | 26,063 | |
Newmark Group, Inc., 6.13%, 11/15/23 | | | 10 | | | | 11,028 | |
| | | | | | | | |
| | | | | | | 87,234 | |
| | |
| Road & Rail— 0.4%(b) | | | | | | |
Capitol Investment Merger Sub 2 LLC, 10.00%, 08/01/24 | | | 25 | | | | 25,937 | |
Hertz Corp. (The): | | | | | | | | |
7.63%, 06/01/22 | | | 14 | | | | 14,560 | |
6.00%, 01/15/28 | | | 30 | | | | 30,000 | |
Uber Technologies, Inc.: | | | | | | | | |
7.50%, 11/01/23 | | | 25 | | | | 26,125 | |
8.00%, 11/01/26 | | | 17 | | | | 17,723 | |
7.50%, 09/15/27 | | | 14 | | | | 14,363 | |
| | | | | | | | |
| | | | | | | 128,708 | |
|
| Semiconductors & Semiconductor Equipment— 0.2% | |
Advanced Micro Devices, Inc., 7.50%, 08/15/22 | | | 10 | | | | 11,262 | |
Entegris, Inc., 4.63%, 02/10/26(b) | | | 20 | | | | 20,700 | |
Qorvo, Inc.: | | | | | | | | |
5.50%, 07/15/26 | | | 19 | | | | 20,235 | |
4.38%, 10/15/29(b) | | | 8 | | | | 8,380 | |
| | | | | | | | |
| | | | | | | 60,577 | |
| | |
| Software— 4.6% | | | | | | |
ACI Worldwide, Inc., 5.75%, 08/15/26(b) | | | 76 | | | | 81,890 | |
Ascend Learning LLC: | | | | | | | | |
6.88%, 08/01/25(b) | | | 79 | | | | 82,950 | |
Camelot Finance SA, 4.50%, 11/01/26(b) | | | 63 | | | | 64,732 | |
CDK Global, Inc.: | | | | | | | | |
4.88%, 06/01/27 | | | 65 | | | | 68,656 | |
5.25%, 05/15/29(b) | | | 21 | | | | 22,523 | |
Change Healthcare Holdings LLC, 5.75%, 03/01/25(b) | | | 79 | | | | 81,172 | |
Fair Isaac Corp., 4.00%, 06/15/28(b) | | | 15 | | | | 15,113 | |
Genesys Telecommunications Laboratories, Inc., 10.00%, 11/30/24(b) | | | 96 | | | | 103,800 | |
Infor US, Inc., 6.50%, 05/15/22 | | | 218 | | | | 221,270 | |
Informatica LLC, 7.13%, 07/15/23(b) | | | 98 | | | | 99,470 | |
Nuance Communications, Inc., 5.63%, 12/15/26 | | | 29 | | | | 30,906 | |
PTC, Inc., 6.00%, 05/15/24 | | | 6 | | | | 6,263 | |
RP Crown Parent LLC, 7.38%, 10/15/24(b) | | | 62 | | | | 64,403 | |
Solera LLC, 10.50%, 03/01/24(b) | | | 204 | | | | 216,456 | |
Sophia LP, 9.00%, 09/30/23(b) | | | 26 | | | | 26,715 | |
SS&C Technologies, Inc., 5.50%, 09/30/27(b) | | | 116 | | | | 123,830 | |
TIBCO Software, Inc., 11.38%, 12/01/21(b) | | | 94 | | | | 97,412 | |
| | | | | | | | |
| | | | | | | 1,407,561 | |
| | |
| Specialty Retail— 0.9% | | | | | | |
Asbury Automotive Group, Inc., 6.00%, 12/15/24 | | | 23 | | | | 23,747 | |
Group 1 Automotive, Inc.: | | | | | | | | |
5.00%, 06/01/22(g) | | | 5 | | | | 5,069 | |
5.25%, 12/15/23(b) | | | 4 | | | | 4,110 | |
L Brands, Inc.: | | | | | | | | |
6.88%, 11/01/35 | | | 43 | | | | 38,485 | |
6.75%, 07/01/36 | | | 5 | | | | 4,387 | |
Murphy Oil USA, Inc., 4.75%, 09/15/29 | | | 15 | | | | 15,841 | |
Penske Automotive Group, Inc., 5.50%, 05/15/26 | | | 12 | | | | 12,570 | |
| | | | |
| SCHEDULES OF INVESTMENTS | | | 107 | |
| | |
Schedule of Investments (continued) December 31, 2019 | | BlackRock High Yield Portfolio (Percentages shown are based on Net Assets) |
| | | | | | | | |
| Security | | Par
(000) | | | Value | |
|
| Specialty Retail (continued) | |
PetSmart, Inc.(b): | | | | | | | | |
7.13%, 03/15/23 | | USD | 5 | | | $ | 4,900 | |
5.88%, 06/01/25 | | | 36 | | | | 36,675 | |
SRS Distribution, Inc., 8.25%, 07/01/26(b) | | | 39 | | | | 40,268 | |
Staples, Inc., 7.50%, 04/15/26(b) | | | 94 | | | | 97,525 | |
| | | | | | | | |
| | | | | | | 283,577 | |
|
| Technology Hardware, Storage & Peripherals— 0.6% | |
Dell International LLC, 7.13%, 06/15/24(b) | | | 53 | | | | 55,915 | |
NCR Corp.(b): | | | | | | | | |
5.75%, 09/01/27 | | | 20 | | | | 21,300 | |
6.13%, 09/01/29 | | | 28 | | | | 30,383 | |
Western Digital Corp., 4.75%, 02/15/26 | | | 57 | | | | 59,423 | |
Xerox Corp., 4.80%, 03/01/35 | | | 18 | | | | 16,607 | |
| | | | | | | | |
| | | | | | | 183,628 | |
|
| Textiles, Apparel & Luxury Goods— 0.1% | |
William Carter Co. (The), 5.63%, 03/15/27(b) | | | 15 | | | | 16,125 | |
| | | | | | | | |
|
| Thrifts & Mortgage Finance— 0.3%(b) | |
Ladder Capital Finance Holdings LLLP, 5.25%, 10/01/25 | | | 27 | | | | 28,012 | |
Nationstar Mortgage Holdings, Inc.: | | | | | | | | |
8.13%, 07/15/23 | | | 25 | | | | 26,463 | |
9.13%, 07/15/26 | | | 38 | | | | 42,085 | |
| | | | | | | | |
| | | | | | | 96,560 | |
|
| Trading Companies & Distributors— 1.4% | |
Beacon Roofing Supply,Inc.(b): | | | | | | | | |
4.88%, 11/01/25 | | | 5 | | | | 5,025 | |
4.50%, 11/15/26 | | | 8 | | | | 8,240 | |
Flexi-Van Leasing, Inc., 10.00%, 02/15/23(b) | | | 15 | | | | 14,212 | |
Fortress Transportation & Infrastructure | | | | | | | | |
Investors LLC(b): | | | | | | | | |
6.75%, 03/15/22 | | | 8 | | | | 8,340 | |
6.50%, 10/01/25 | | | 8 | | | | 8,444 | |
HD Supply,Inc., 5.38%, 10/15/26(b) | | | 208 | | | | 220,480 | |
Herc Holdings, Inc., 5.50%, 07/15/27(b) | | | 37 | | | | 38,943 | |
United Rentals North America, Inc.: | | | | | | | | |
5.50%, 07/15/25 | | | 8 | | | | 8,312 | |
4.63%, 10/15/25 | | | 43 | | | | 44,208 | |
5.88%, 09/15/26 | | | 4 | | | | 4,291 | |
5.50%, 05/15/27 | | | 25 | | | | 26,782 | |
3.88%, 11/15/27 | | | 22 | | | | 22,461 | |
4.88%, 01/15/28 | | | 15 | | | | 15,619 | |
| | | | | | | | |
| | | | | | | 425,357 | |
|
| Wireless Telecommunication Services— 1.9% | |
Connect Finco SARL, 6.75%, 10/01/26(b) | | | 209 | | | | 222,585 | |
Gogo Intermediate Holdings LLC, 9.88%, 05/01/24(b) | | | 53 | | | | 55,981 | |
Hughes Satellite Systems Corp., 5.25%, 08/01/26 | | | 15 | | | | 16,462 | |
Sprint Corp.: | | | | | | | | |
7.88%, 09/15/23 | | | 35 | | | | 38,617 | |
7.13%, 06/15/24 | | | 36 | | | | 38,835 | |
7.63%, 02/15/25 | | | 35 | | | | 38,407 | |
7.63%, 03/01/26 | | | 36 | | | | 39,701 | |
T-Mobile USA, Inc.: | | | | | | | | |
4.00%, 04/15/22 | | | 10 | | | | 10,237 | |
6.50%, 01/15/26 | | | 18 | | | | 19,300 | |
4.50%, 02/01/26 | | | 57 | | | | 58,425 | |
4.75%, 02/01/28 | | | 33 | | | | 34,578 | |
| | | | | | | | |
| Security | | Par
(000) | | | Value | |
|
| Wireless Telecommunication Services (continued) | |
Xplornet Communications, Inc., 9.63%, (9.63% Cash or 10.63% PIK), 06/01/22(b)(f) | | USD | 14 | | | $ | 13,622 | |
| | | | | | | | |
| | | | | | | 586,750 | |
| | | | | | | | |
| | |
Total Corporate Bonds— 86.5%
(Cost: $25,568,110) | | | | | | | 26,545,910 | |
| | | | | | | | |
|
Floating Rate Loan Interests— 9.0%(i) | |
| | |
| Aerospace & Defense— 0.1% | | | | | | |
Atlantic Aviation FBO, Inc., Term Loan B, (LIBOR USD 1 Month +3.75%), 5.55%, 12/06/25 | | | 5 | | | | 5,003 | |
Sequa Mezzanine Holdings LLC, 1st Lien Term Loan, (LIBOR USD 3 Month + 5.00%), 6.90%, 11/28/21 | | | 20 | | | | 19,494 | |
| | | | | | | | |
| | | | | | | 24,497 | |
|
| Auto Components— 0.1% | |
Panther BF Aggregator 2 LP, Term Loan B, (LIBOR USD 1 Month + 3.50%), 5.30%, 04/30/26 | | | 30 | | | | 30,202 | |
| | | | | | | | |
|
| Building Products— 0.0% | |
CPG International, Inc., Term Loan, (LIBOR USD 3 Month + 3.75%), 5.93%, 05/05/24 | | | 10 | | | | 10,475 | |
| | | | | | | | |
|
| Capital Markets— 0.1% | |
Jefferies Finance LLC, Term Loan,
(LIBOR USD 1 Month +3.75%), 5.50%, 06/03/26 | | | 18 | | | | 17,850 | |
| | | | | | | | |
|
| Chemicals— 0.3% | |
Alpha 3 BV, Term Loan,
(LIBOR USD 3 Month + 3.00%), 4.94%, 01/31/24 | | | 52 | | | | 52,280 | |
Ascend Performance Materials LLC, Term Loan B, (LIBOR USD 1 Month + 5.25%), 7.19%, 08/14/26(j) | | | 39 | | | | 39,194 | |
Invictus Co., Term Loan B26, (LIBOR USD 3 Month + 6.75%), 8.68%, 03/30/26 | | | 5 | | | | 4,869 | |
Momentive Performance Materials, Inc., Term Loan B, (LIBOR USD 1 Month + 3.25%), 5.05%, 05/15/24 | | | 8 | | | | 7,523 | |
| | | | | | | | |
| | | | | | | 103,866 | |
|
| Commercial Services & Supplies— 0.7% | |
Brand Energy &Infrastructure Services, Inc., Term Loan, 06/21/24(k) | | | 154 | | | | 152,984 | |
Diamond (BC) BV,Term Loan, (LIBOR USD 3 Month + 3.00%), 4.93%, 09/06/24 | | | 19 | | | | 18,469 | |
GFL Environmental, Inc., Term Loan B, (LIBOR USD 1 Month + 3.00%), 4.80%, 05/30/25 | | | 28 | | | | 27,604 | |
| | | | | | | | |
| | | | | | | 199,057 | |
|
| Construction & Engineering— 0.1% | |
SRS Distribution, Inc., Term Loan B, (LIBOR USD 1 Month + 3.25%), 5.05%, 05/23/25 | | | 30 | | | | 29,453 | |
| | | | | | | | |
|
| Containers & Packaging— 0.1% | |
BWAY Holding Co., Term Loan, (LIBOR USD 3 Month + 3.25%), 5.23%, 04/03/24 | | | 16 | | | | 15,808 | |
Charter NEX US, Inc., 1st Lien Term Loan, (LIBOR USD 1 Month +3.50%), 5.30%, 05/16/24 | | | 8 | | | | 8,000 | |
| | | | | | | | |
| | | | | | | 23,808 | |
|
| Diversified Consumer Services— 0.1% | |
TierPoint LLC, Term Loan, (LIBOR USD 1 Month + 3.75%), 5.55%, 05/06/24 | | | 14 | | | | 13,369 | |
| | | | | | | | |
| | |
| 108 | | 2019 BLACKROCK ANNUAL REPORTTO SHAREHOLDERS |
| | |
Schedule of Investments (continued) December 31, 2019 | | BlackRock High Yield Portfolio (Percentages shown are based on Net Assets) |
| | | | | | | | |
| Security | | Par
(000) | | | Value | |
| | |
| Diversified Financial Services— 0.1% | | | | | | |
Sotheby’s, Inc.,Term Loan B, (LIBOR USD 1 Month + 5.50%), 7.24%, 01/15/27 | | USD | 11 | | | $ | 11,077 | |
Triton Bidco, Term Loan B, (LIBOR USD 6 Month + 4.50%), 0.00%, 09/23/26 | | | 23 | | | | 22,994 | |
WP CPP Holdings, Term Loan B, (LIBOR USD 3 Month + 3.75%), 5.46%- 5.68%, 03/16/25 | | | 6 | | | | 5,888 | |
| | | | | | | | |
| | | | | | | 39,959 | |
| | |
| Diversified Telecommunication Services— 0.4% | | | | | | |
Altice France SA, Term Loan, (LIBOR USD 1 Month + 4.00%), 5.74%, 08/14/26 | | | 23 | | | | 23,377 | |
CenturyLink, Inc., Term Loan, (LIBOR USD 1 Month + 2.75%), 4.55%, 01/31/25 | | | 74 | | | | 74,165 | |
Iridium Satellite LLC, Term Loan, (LIBOR USD 1 Month +3.75%), 5.55%, 11/04/26 | | | 12 | | | | 12,142 | |
Telesat Canada, Term Loan, (LIBOR USD 6 Month + 2.75%), 4.63%, 12/07/26 | | | 5 | | | | 5,015 | |
| | | | | | | | |
| | | | | | | 114,699 | |
| | |
| Energy Equipment & Services— 0.3% | | | | | | |
McDermott International, Inc., Term Loan,
10/21/21(k) | | | 23 | | | | 23,329 | |
Pioneer Energy Services Corp., Term Loan, (LIBOR USD 1 Month + 7.75%), 9.55%, 11/08/22(j) | | | 80 | | | | 76,800 | |
| | | | | | | | |
| | | | | | | 100,129 | |
| | |
| Entertainment— 0.0% | | | | | | |
Renaissance Learning, Inc., Term Loan, (LIBOR USD 1 Month + 3.25%), 5.05%, 05/24/25 | | | 7 | | | | 7,020 | |
| | | | | | | | |
| | |
| Food & Staples Retailing— 0.0% | | | | | | |
US Foods, Inc., Term Loan B, (LIBOR USD 1 Month + 2.00%), 3.80%, 08/14/26 | | | 6 | | | | 6,006 | |
| | | | | | | | |
| | |
| Food Products— 0.0% | | | | | | |
Aramark Services, Inc., Term Loan, 01/27/27(k) | | | 5 | | | | 5,023 | |
| | | | | | | | |
| | |
| Health Care Equipment & Supplies— 0.3% | | | | | | |
Immucor, Inc., 1st Lien Term Loan, (LIBOR USD 3 Month + 5.00%), 6.94%, 06/15/21 | | | 76 | | | | 76,123 | |
| | |
| Health Care Providers & Services— 0.6% | | | | | | |
AHP Health Partners, Inc., Term Loan, (LIBOR USD 1 Month + 4.50%), 6.30%, 06/30/25 | | | 14 | | | | 13,880 | |
Azalea TopCo, Inc., Term Loan, (LIBOR USD 1 Month + 3.50%), 5.30%, 07/24/26 | | | 33 | | | | 33,072 | |
Envision Healthcare Corp., Term Loan, (LIBOR USD 1 Month + 3.75%), 5.55%, 10/10/25 | | | 91 | | | | 77,263 | |
Gentiva Health Services, Inc., Term Loan U, (LIBOR USD 1 Month + 3.75%), 5.56%, 07/02/25 | | | 25 | | | | 25,075 | |
Quorum Health Corp., 1st Lien Term Loan, (LIBOR USD 3 Month + 6.75%), 8.68%, 04/29/22 | | | 19 | | | | 18,257 | |
WIRB-Copernicus Group, Inc., Term Loan,
12/11/26(k) | | | 18 | | | | 18,000 | |
| | | | | | | | |
| | | | | | | 185,547 | |
| | |
| Health Care Technology— 0.2% | | | | | | |
Athenahealth, Inc., Term Loan B, (LIBOR USD 3 Month + 4.50%), 6.40%, 02/05/26 | | | 73 | | | | 72,805 | |
| | | | | | | | |
| | |
| Hotels, Restaurants & Leisure— 0.2% | | | | | | |
Stars Group Holdings BV,Term Loan, (LIBOR USD 3 Month + 3.50%), 5.44%, 07/10/25 | | | 44 | | | | 44,479 | |
| | | | | | | | |
| | | | | | | | |
| Security | | Par
(000) | | | Value | |
|
| Independent Power and Renewable Electricity Producers— 0.0% | |
Calpine Corp., Term Loan, (LIBOR USD 1 Month + 2.50%), 4.30%, 08/12/26 | | USD | 7 | | | $ | 7,351 | |
| | |
| Industrial Conglomerates— 0.3% | | | | | | |
PSAV Holdings LLC, 2nd Lien Term Loan, 09/01/25(j)(k) | | | 13 | | | | 12,316 | |
Vertiv Co., Term Loan B, (LIBOR USD 3 Month + 4.00%), 5.93%, 11/30/23 | | | 77 | | | | 76,372 | |
| | | | | | | | |
| | | | | | | 88,688 | |
| | |
| Insurance— 0.4% | | | | | | |
Asurion LLC, 2nd Lien Term Loan B2, (LIBOR USD 1 Month + 6.50%), 8.30%, 08/04/25 | | | 46 | | | | 46,529 | |
Hub International, Inc., Term Loan B, (LIBOR USD 6 Month + 4.00%), 5.90%, 04/25/25 | | | 23 | | | | 23,211 | |
Sedgwick, 1st Lien Term Loan, (LIBOR USD 1 Month + 3.25%), 5.05%, 12/31/25 | | | 37 | | | | 36,626 | |
Sedgwick, Inc., 1st Lien Term Loan B, (LIBOR USD 1 Month + 4.00%), 5.80%, 09/03/26 | | | 23 | | | | 23,071 | |
| | | | | | | | |
| | | | | | | 129,437 | |
| | |
| IT Services— 0.6% | | | | | | |
Camelot US Acquisition 1 Co., Term Loan B, (LIBOR USD 1 Month + 3.25%), 5.05%, 10/30/26 | | | 16 | | | | 16,088 | |
CCC Information Services, Inc., 2nd Lien Term Loan, (LIBOR USD 1 Month + 6.75%), 8.55%, 04/28/25 | | | 4 | | | | 4,007 | |
Mitchell International, Inc., 1st Lien Term Loan, (LIBOR USD 1 Month + 3.25%), 5.05%, 11/29/24 | | | 20 | | | | 20,215 | |
Mitchell International, Inc., 2nd Lien Term Loan, (LIBOR USD 1 Month + 7.25%), 9.05%, 12/01/25(j) | | | 10 | | | | 9,575 | |
Peak 10 Holding Corp., 2nd Lien Term Loan, (LIBOR USD 3 Month + 7.25%), 9.16%, 08/01/25 | | | 7 | | | | 4,300 | |
SS&C Technologies Holdings, Inc., Term Loan B, (LIBOR USD 1 Month + 2.25%), 4.05%, 04/16/25 | | | 15 | | | | 15,597 | |
Verscend Holding Corp., Term Loan B, (LIBOR USD 1 Month + 4.50%), 6.30%, 08/27/25 | | | 125 | | | | 125,566 | |
| | | | | | | | |
| | | | | | | 195,348 | |
|
| Life Sciences Tools & Services— 0.2% | |
Sotera Health Holdings LLC, Term Loan, (LIBOR USD 6 Month + 4.50%), 6.29%, 11/20/26 | | | 65 | | | | 65,142 | |
|
| Machinery— 0.3% | |
MHI Holdings LLC, Term Loan B, (LIBOR USD 1 Month + 5.00%), 6.80%, 09/21/26 | | | 20 | | | | 19,975 | |
Titan Acquisition Ltd., Term Loan, (LIBOR USD 1 Month + 3.00%), 4.80%, 03/28/25 | | | 72 | | | | 70,522 | |
| | | | | | | | |
| | | | | | | 90,497 | |
|
| Media— 1.2% | |
Ascend Learning LLC, Term Loan B, (LIBOR USD 1 Month + 3.00%), 4.80%, 07/12/24 | | | 7 | | | | 6,881 | |
Clear Channel Outdoor Holdings, Inc., Term Loan, (LIBOR USD 1 Month +3.50%), 5.30%, 08/21/26 | | | 77 | | | | 77,164 | |
Intelsat Jackson Holdings SA, Term Loan: | | | | | | | | |
(LIBOR USD 3 Month + 3.75%), 5.68%, 11/27/23 | | | 8 | | | | 8,407 | |
(LIBOR USD 6 Month + 4.50%), 6.43%, 01/02/24 | | | 31 | | | | 31,401 | |
6.63%, 01/02/24(l) | | | 164 | | | | 166,149 | |
| | | | |
| SCHEDULES OF INVESTMENTS | | | 109 | |
| | |
Schedule of Investments (continued) December 31, 2019 | | BlackRock High Yield Portfolio (Percentages shown are based on Net Assets) |
| | | | | | | | |
| Security | | Par
(000) | | | Value | |
| | |
| Media (continued) | | | | | | |
Terrier Media Buyer,Inc., Term Loan, (LIBOR USD 6 Month + 4.25%), 6.15%, 12/17/26 | | | USD 68 | | | $ | 68,638 | |
Xplornet Communications, Inc., Term Loan, (LIBOR USD 3 Month + 4.00%), 5.94%, 09/09/21(j) | | | 17 | | | | 17,228 | |
| | | | | | | | |
| | | | | | | 375,868 | |
| | |
| Oil, Gas & Consumable Fuels — 0.6% | | | | | | |
California Resources Corp., Term Loan, (LIBOR USD 1 Month + 10.38%), 12.18%, 12/31/21 | | | 45 | | | | 33,697 | |
Chesapeake Energy Corp., Term Loan, 06/24/24(k) | | | 129 | | | | 132,655 | |
CNX Resources Corp., Term Loan, (LIBOR USD 1 Month + 4.50%), 6.30%, 11/28/22 | | | 20 | | | | 17,518 | |
| | | | | | | | |
| | | | | | | 183,870 | |
| | |
| Pharmaceuticals — 0.2% | | | | | | |
Bausch Health Cos., Inc., Term Loan, (LIBOR USD 1 Month + 3.00%), 4.74%, 06/02/25 | | | 31 | | | | 31,453 | |
Endo Pharmaceuticals, Inc., Term Loan B, (LIBOR USD 1 Month + 4.25%), 6.06%, 04/29/24 | | | 20 | | | | 19,326 | |
Jaguar Holding Co. I, Term Loan, (LIBOR USD 1 Month + 2.50%), 4.30%, 08/18/22 | | | 6 | | | | 5,997 | |
| | | | | | | | |
| | | | | | | 56,776 | |
| | |
| Professional Services — 0.1% | | | | | | |
Dun & Bradstreet Corp. (The), 1st Lien Term Loan B, (LIBOR USD 1 Month + 5.00%), 6.79%, 02/06/26 | | | 27 | | | | 27,214 | |
| | | | | | | | |
| | |
| Road & Rail — 0.2% | | | | | | |
Genesee & Wyoming, Inc., Term Loan, 11/06/26(k) | | | 14 | | | | 14,120 | |
Uber Technologies, Inc., Term Loan, (LIBOR USD 1 Month + 4.00%), 5.74%, 03/14/25 | | | 43 | | | | 43,216 | |
| | | | | | | | |
| | | | | | | 57,336 | |
|
| Semiconductors & Semiconductor Equipment — 0.0% | |
ON Semiconductor Corp., Term Loan B, (LIBOR USD 1 Month +2.00%), 3.80%, 09/19/26 | | | 10 | | | | 10,493 | |
| | | | | | | | |
| | |
| Software — 0.8% | | | | | | |
Infor US, Inc., Term Loan, (LIBOR USD 3 Month + 2.75%), 4.69%, 02/01/22 | | | 12 | | | | 11,842 | |
Kronos, Inc., 2nd Lien Term Loan B, (LIBOR USD 3 Month + 8.25%), 10.16%, 11/01/24 | | | 63 | | | | 63,645 | |
PowerSchool Group LLC, 1st Lien Term Loan, (LIBOR USD 3 Month + 3.25%), 5.14%, 07/31/25 | | | 9 | | | | 8,846 | |
Refinitiv US Holdings, Inc., Term Loan, (LIBOR USD 1 Month +3.25%), 5.05%, 10/01/25 | | | 120 | | | | 121,202 | |
SS&C Technologies Holdings, Inc., Term Loan, (LIBOR USD 1 Month + 2.25%), 4.05%, 04/16/25 | | | 10 | | | | 10,416 | |
TIBCO Software, Inc., Term Loan, (LIBOR USD 1 Month + 4.00%), 5.71%, 06/30/26 | | | 19 | | | | 19,018 | |
Ultimate Software Group, Inc. (The), 1st Lien Term Loan, (LIBOR USD 1 Month + 3.75%), 5.55%, 05/04/26 | | | 8 | | | | 8,470 | |
| | | | | | | | |
| | | | | | | 243,439 | |
| | |
| Specialty Retail — 0.2% | | | | | | |
PetSmart, Inc., Term Loan, 03/11/22(k) | | | 54 | | | | 53,565 | |
| | | | | | | | |
| | | | | | | | |
| Security | | Par
(000) | | | Value | |
|
| Wireless Telecommunication Services — 0.2% | |
Ligado Networks LLC, Term Loan, 14.39%, 12/07/20(l) | | | USD 86 | | | $ | 16,282 | |
New LightSquared LLC, 1st Lien Term Loan, (LIBOR USD 3 Month + 0.00%), 0.00%, 12/07/20 | | | 83 | | | | 52,219 | |
| | | | | | | | |
| | | | | | | 68,501 | |
| | | | | | | | |
| |
Total Floating Rate Loan Interests — 9.0%
(Cost: $2,844,886) | | | | 2,757,892 | |
| | | | | | | | |
| | |
| | | Beneficial Interest
(000) | | | | |
| | |
Other Interests — 0.0%(m) | | | | | | | | |
| | |
Auto Components — 0.0% | | | | | | | | |
Lear Corp., Escrow(a)(c)(j) | | | 250 | | | | — | |
| | | | | | | | |
| | |
| Capital Markets — 0.0% | | | | | | |
Lehman Brothers Holdings Capital Trust Escrow Bonds(a)(c) | | | 140 | | | | 1,750 | |
| | | | | | | | |
| | |
Total Other Interests — 0.0% | | | | | | | 1,750 | |
| | | | | | | | |
| | |
Preferred Securities — 2.6% | | | | | | | | |
| | |
| | | Par
(000) | | | | |
Capital Trusts — 2.5%(d)(i) | | | | | | | | |
| | |
| Banks — 2.3% | | | | | | |
Bank of America Corp.: | | | | | | | | |
Series X, 6.25% | | | 66 | | | | 73,342 | |
Series Z, 6.50% | | | 45 | | | | 51,075 | |
Series AA, 6.10% | | | 116 | | | | 129,201 | |
Series DD, 6.30% | | | 10 | | | | 11,550 | |
CIT Group, Inc., Series A, 5.80% | | | 26 | | | | 26,715 | |
JPMorgan Chase &Co.: | | | | | | | | |
Series V, 5.42% | | | 65 | | | | 65,488 | |
Series Q, 5.15% | | | 20 | | | | 20,900 | |
Series R, 6.00% | | | 5 | | | | 5,369 | |
Series S, 6.75% | | | 15 | | | | 16,939 | |
Series U, 6.13% | | | 7 | | | | 7,647 | |
Series FF,5.00% | | | 110 | | | | 114,400 | |
Series X, 6.10% | | | 78 | | | | 85,121 | |
Wells Fargo &Co., Series U, 5.87% | | | 92 | | | | 102,350 | |
| | | | | | | | |
| | | | | | | 710,097 | |
| | |
| Capital Markets — 0.2% | | | | | | |
Goldman Sachs Group, Inc. (The),
Series P, 5.00% | | | 13 | | | | 13,097 | |
Morgan Stanley,Series H, 5.61% | | | 27 | | | | 27,238 | |
| | | | | | | | |
| | | | | | | 40,335 | |
| | | | | | | | |
| | |
Total Capital Trusts — 2.5%
(Cost: $712,590) | | | | | | | 750,432 | |
| | | | | | | | |
| | |
| 110 | | 2019 BLACKROCK ANNUAL REPORTTO SHAREHOLDERS |
| | |
Schedule of Investments (continued) December 31, 2019 | | BlackRock High Yield Portfolio (Percentages shown are based on Net Assets) |
| | | | | | | | |
| Security | | Shares | | | Value | |
| | |
Trust Preferreds — 0.1% | | | | | | | | |
| | |
| Banks — 0.1% | | | | | | |
GMAC Capital Trust I, Series 2, 7.69%, 02/15/40(i) | | | 1,611 | | | $ | 41,967 | |
| | | | | | | | |
| | |
Total Trust Preferreds — 0.1%
(Cost: $42,337) | | | | | | | 41,967 | |
| | | | | | | | |
| | |
Total Preferred Securities — 2.6%
(Cost: $754,927) | | | | | | | 792,399 | |
| | | | | | | | |
| | |
Total Long-Term Investments — 99.1%
(Cost: $29,451,537) | | | | | | | 30,403,434 | |
| | | | | | | | |
| | | | | | | | |
| Security | | Shares | | | Value | |
| | |
Short-Term Securities — 0.8%(n) | | | | | | | | |
BlackRock Liquidity Funds,T-Fund, Institutional Class, 1.51%* | | | 226,951 | | | $ | 226,951 | |
JPMorgan U.S. Treasury Plus Money Market Fund, Agency Class, 1.41% | | | 16,796 | | | | 16,796 | |
| | | | | | | | |
| | |
Total Short-Term Securities — 0.8%
(Cost: $243,747) | | | | | | | 243,747 | |
| | | | | | | | |
| | |
Total Options Purchased — 0.0%
(Cost: $9,609) | | | | | | | 9,315 | |
| | | | | | | | |
| |
Total Investments Before Options Written — 99.9%
(Cost: $29,704,893) | | | | 30,656,496 | |
| | | | | | | | |
| | |
Total Options Written — (0.0)%
(Premium Received — $1,090) | | | | | | | (1,117 | ) |
| | | | | | | | |
| |
Total Investments Net of Options Written — 99.9%
(Cost: $29,703,803) | | | | 30,655,379 | |
| | |
Other Assets Less Liabilities — 0.1% | | | | | | | 17,351 | |
| | | | | | | | |
| | |
Net Assets — 100.0% | | | | | | $ | 30,672,730 | |
| | | | | | | | |
| (a) | Non-income producing security. |
| (b) | Security exempt from registration pursuant to Rule 144A under the Securities Act of 1933, as amended. These securities may be resold in transactions exempt from registration to qualified institutional investors. |
| (c) | Issuer filed for bankruptcy and/or is in default. |
| (d) | Perpetual security with no stated maturity date. |
| (e) | Variable rate security. Security may be issued at a fixed coupon rate, which converts to a variable rate at a specified date. Rate shown is the rate in effect as of period end. |
| (f) | Payment-in-kind security which may pay interest/dividends in additional par/shares and/or in cash. Rates shown are the current rate and possible payment rates. |
| (g) | Step-up bond that pays an initial coupon rate for the first period and then a higher coupon rate for the following periods. Rate as of period end. |
| (h) | Convertible security. |
| (i) | Variable rate security.Rate shown is the rate in effect as of period end. |
| (j) | Security is valued using significant unobservable inputs and is classified as Level 3 in the fair value hierarchy. |
| (k) | Represents an unsettled loan commitment at period end. Certain details associated with this purchase are not known prior to the settlement date, including coupon rate. |
| (m) | Other interests represent beneficial interests in liquidation trusts and other reorganization or private entities. |
| (n) | Annualized 7-day yield as of period end. |
| * | During the year ended December 31, 2019, investments in issuers considered to be an affiliate/affiliates of the Fund for purposes of Section 2(a)(3) of the Investment Company Act of 1940, as amended, were as follows: |
| | | | | | | | | | | | | | | | | | | | | | | | | | | | |
| Affiliate | | Shares
Held at
12/31/18 | | | Net
Activity | | | Shares
Held at
12/31/19 | | | Value at
12/31/19 | | | Income | | | Net
Realized
Gain (Loss) (a) | | | Change in
Unrealized
Appreciation
(Depreciation) | |
BlackRock Liquidity Funds,T-Fund, Institutional Class | | | 1,355,813 | | | | (1,128,862 | ) | | | 226,951 | | | $ | 226,951 | | | $ | 11,529 | | | $ | — | | | $ | — | |
| | | | | | | | | | | | | | | | | | | | | | | | | | | | |
| (a) | Includes net capital gain distributions, if applicable. |
| | | | |
| SCHEDULES OF INVESTMENTS | | | 111 | |
| | |
Schedule of Investments (continued) December 31, 2019 | | BlackRock High Yield Portfolio |
Derivative Financial Instruments Outstanding as of Period End
Forward Foreign Currency Exchange Contracts
| | | | | | | | | | | | | | | | | | | | |
Currency
Purchased | | | Currency
Sold | | | Counterparty | | Settlement
Date | | | Unrealized
Appreciation
(Depreciation) | |
| EUR | | | 10,730 | | | USD | | | 12,000 | �� | | State Street Bank and Trust Co. | | | 02/05/20 | | | $ | 61 | |
| | | | | | | | | | | | | | | | | | | | |
| EUR | | | 277,000 | | | USD | | | 311,728 | | | UBS AG | | | 02/05/20 | | | | (362 | ) |
| USD | | | 2,256 | | | CAD | | | 3,000 | | | BNP Paribas SA | | | 02/05/20 | | | | (54 | ) |
| USD | | | 1,514 | | | CAD | | | 2,000 | | | HSBC Bank plc | | | 02/05/20 | | | | (27 | ) |
| USD | | | 1,510 | | | CAD | | | 2,000 | | | State Street Bank and Trust Co. | | | 02/05/20 | | | | (30 | ) |
| | | | | | | | | | | | | | | | | | | | |
| | | | | | | | | | | | | | | | | | | (473 | ) |
| | | | | | | | | | | | | | | | | | | | |
| | | Net Unrealized Depreciation | | | $ | (412 | ) |
| | | | | | | | | | | | | | | | | | | | |
OTC Interest Rate Swaptions Purchased
| | | | | | | | | | | | | | | | | | | | | | | | | | | | | | | | | | |
Description | | Paid by the Fund | | Received by the Fund | | Counterparty | | Expiration Date | | | Exercise Rate | | | Notional Amount (000) | | | Value | |
| | Rate | | | Frequency | | Rate | | | Frequency |
Put | | | | | | | | | | | | | | | | | | | | | | | | | | | | | | | | | | |
10-Year Interest Rate Swap | | | 2.20 | % | | Semi-Annual | | | 3 month LIBOR | | | Quarterly | | Barclays Bank plc | | | 03/20/20 | | | | 2.20 | % | | | USD | | | | 940 | | | $ | 2,427 | |
10-Year Interest Rate Swap | | | 2.20 | % | | Semi-Annual | | | 3 month LIBOR | | | Quarterly | | Bank of America NA | | | 06/22/20 | | | | 2.20 | % | | | USD | | | | 1,090 | | | | 6,888 | |
| | | | | | | | | | | | | | | | | | | | | | | | | | | | | | | | | | |
| | | | | | | | | | | | | | | | | | | | | | | | | | | | | | | | $ | 9,315 | |
| | | | | | | | | | | | | | | | | | | | | | | | | | | | | | | | | | |
OTC Interest Rate Swaptions Written
| | | | | | | | | | | | | | | | | | | | | | | | | | | | | | | | | | |
Description | | Paid by the Fund | | Received by the Fund | | Counterparty | | Expiration Date | | | Exercise Rate | | | Notional Amount (000) | | | Value | |
| | Rate | | | Frequency | | Rate | | | Frequency |
Put | | | | | | | | | | | | | | | | | | | | | | | | | | | | | | | | | | |
10-Year Interest Rate Swap | | | 2.70 | % | | Semi-Annual | | | 3 month LIBOR | | | Quarterly | | Bank of America NA | | | 06/22/20 | | | | 2.70 | % | | | USD | | | | 1,090 | | | $ | (1,117 | ) |
| | | | | | | | | | | | | | | | | | | | | | | | | | | | | | | | | | |
OTC Credit Default Swaps — Sell Protection
| | | | | | | | | | | | | | | | | | | | | | | | | | | | | | | | | | | | | | | | |
Reference Obligation/Index | | Financing
Rate Received
by the Fund | | | Payment
Frequency | | | Counterparty | | | Termination
Date | | | Credit
Rating (a) | | | Notional
Amount
(000) (b) | | | Value | | | Upfront
Premium
Paid
(Received) | | | Unrealized
Appreciation
(Depreciation) | |
CenturyLink, Inc. | | | 1.00 | % | | | Quarterly | | | | Barclays Bank plc | | | | 12/20/23 | | | | NR | | | | USD | | | | 8 | | | $ | (148 | ) | | $ | (487 | ) | | $ | 339 | |
Chesapeake Energy Corp. | | | 5.00 | % | | | Quarterly | | | | Barclays Bank plc | | | | 12/20/23 | | | | B+ | | | | USD | | | | 8 | | | | (3,076 | ) | | | 12 | | | | (3,088 | ) |
Chesapeake Energy Corp. | | | 5.00 | % | | | Quarterly | | | | Barclays Bank plc | | | | 12/20/23 | | | | B+ | | | | USD | | | | 16 | | | | (6,149 | ) | | | 119 | | | | (6,268 | ) |
CenturyLink, Inc. | | | 1.00 | % | | | Quarterly | | | | Barclays Bank plc | | | | 06/20/25 | | | | NR | | | | USD | | | | 6 | | | | (399 | ) | | | (871 | ) | | | 472 | |
| | | | | | | | | | | | | | | | | | | | | | | | | | | | | | | | | | | | | | | | |
| | | | | | | | | | | | | | | | | | | | | | | | | | | | | | $ | (9,772) | | | $ | (1,227) | | | $ | (8,545 | ) |
| | | | | | | | | | | | | | | | | | | | | | | | | | | | | | | | | | | | | | | | |
| (a) | Using the rating of the issuer or the underlying securities of the index, as applicable, provided by S&P Global Ratings. |
| (b) | The maximum potential amount the Fund may pay should a negative credit event take place as defined under the terms of the agreement. |
Balances Reported in the Statements of Assets and Liabilities for OTC Swaps and Options Written
| | | | | | | | | | | | | | | | | | | | |
| | | Swap
Premiums
Paid | | | Swap
Premiums
Received | | | Unrealized
Appreciation | | | Unrealized
Depreciation | | | Value | |
OTC Swaps | | $ | 131 | | | $ | (1,358 | ) | | $ | 811 | | | $ | (9,356 | ) | | $ | — | |
Options Written | | | N/A | | | | N/A | | | | — | | | | (27 | ) | | | (1,117 | ) |
| | |
| 112 | | 2019 BLACKROCK ANNUAL REPORTTO SHAREHOLDERS |
| | |
Schedule of Investments (continued) December 31, 2019 | | BlackRock High Yield Portfolio |
Derivative Financial Instruments Categorized by Risk Exposure
As of period end, the fair values of derivative financial instruments located in the Statements of Assets and Liabilities were as follows:
| | | | | | | | | | | | | | | | | | | | | | | | | | | | |
| | | Commodity
Contracts | | | Credit
Contracts | | | Equity
Contracts | | | Foreign
Currency
Exchange
Contracts | | | Interest
Rate
Contracts | | | Other
Contracts | | | Total | |
Assets — Derivative Financial Instruments | | | | | | | | | | | | | | | | | | | | | | | | | | | | |
Forward foreign currency exchange contracts | | | | | | | | | | | | | | | | | | | | | | | | | | | | |
Unrealized appreciation on forward foreign currency exchange contracts | | $ | — | | | $ | — | | | $ | — | | | $ | 61 | | | $ | — | | | $ | — | | | $ | 61 | |
Options purchased | | | | | | | | | | | | | | | | | | | | | | | | | | | | |
Investments at value — unaffiliated(a) | | | — | | | | — | | | | — | | | | — | | | | 9,315 | | | | — | | | | 9,315 | |
Swaps — OTC | | | | | | | | | | | | | | | | | | | | | | | | | | | | |
Unrealized appreciation on OTC swaps; Swap premiums paid | | | — | | | | 942 | | | | — | | | | — | | | | — | | | | — | | | | 942 | |
| | | | |
| | $ | — | | | $ | 942 | | | $ | — | | | $ | 61 | | | $ | 9,315 | | | $ | — | | | $ | 10,318 | |
| | | | |
Liabilities — Derivative Financial Instruments | | | | | | | | | | | | | | | | | | | | | | | | | | | | |
Forward foreign currency exchange contracts | | | | | | | | | | | | | | | | | | | | | | | | | | | | |
Unrealized depreciation on forward foreign currency exchange contracts | | | — | | | | — | | | | — | | | | 473 | | | | — | | | | — | | | | 473 | |
Options written | | | | | | | | | | | | | | | | | | | | | | | | | | | | |
Options written at value | | | — | | | | — | | | | — | | | | — | | | | 1,117 | | | | — | | | | 1,117 | |
Swaps — OTC | | | | | | | | | | | | | | | | | | | | | | | | | | | | |
Unrealized depreciation on OTC swaps; Swap premiums received | | | — | | | | 10,714 | | | | — | | | | — | | | | — | | | | — | | | | 10,714 | |
| | | | |
| | $ | — | | | $ | 10,714 | | | $ | — | | | $ | 473 | | | $ | 1,117 | | | $ | — | | | $ | 12,304 | |
| | | | |
| (a) | Includes options purchased at value as reported in the Schedule of Investments. | |
For the year ended December 31, 2019, the effect of derivative financial instruments in the Statements of Operations was as follows:
| | | | | | | | | | | | | | | | | | | | | | | | | | | | |
| | | Commodity
Contracts | | | Credit
Contracts | | | Equity
Contracts | | | Foreign
Currency
Exchange
Contracts | | | Interest
Rate
Contracts | | | Other
Contracts | | | Total | |
Net Realized Gain (Loss) from: | | | | | | | | | | | | | | | | | | | | | | | | | | | | |
Futures contracts | | $ | — | | | $ | — | | | $ | (21,857 | ) | | $ | — | | | $ | 3,486 | | | $ | — | | | $ | (18,371) | |
Forward foreign currency exchange contracts | | | — | | | | — | | | | — | | | | (6,084 | ) | | | — | | | | — | | | | (6,084) | |
Options purchased(a) | | | — | | | | — | | | | (22,820 | ) | | | — | | | | — | | | | — | | | | (22,820) | |
Options written | | | — | | | | — | | | | 12,309 | | | | — | | | | — | | | | — | | | | 12,309 | |
Swaps | | | — | | | | 3,927 | | | | — | | | | — | | | | — | | | | — | | | | 3,927 | |
| | | | |
| | $ | — | | | $ | 3,927 | | | $ | (32,368 | ) | | $ | (6,084 | ) | | $ | 3,486 | | | $ | — | | | $ | (31,039) | |
| | | | |
Net Change in Unrealized Appreciation (Depreciation) on: | | | | | | | | | | | | | | | | | | | | | | | | | | | | |
Futures contracts | | | — | | | | — | | | | — | | | | — | | | | (7,936 | ) | | | — | | | | (7,936) | |
Forward foreign currency exchange contracts | | | — | | | | — | | | | — | | | | (2,080 | ) | | | — | | | | — | | | | (2,080) | |
Options purchased(b) | | | — | | | | — | | | | — | | | | — | | | | (294 | ) | | | — | | | | (294) | |
Options written | | | — | | | | — | | | | — | | | | — | | | | (27 | ) | | | — | | | | (27) | |
Swaps | | | — | | | | 494 | | | | — | | | | — | | | | — | | | | — | | | | 494 | |
| | | | |
| | $ | — | | | $ | 494 | | | $ | — | | | $ | (2,080 | ) | | $ | (8,257 | ) | | $ | — | | | $ | (9,843) | |
| | | | |
| (a) | Options purchased are included in net realized gain (loss) from investments — unaffiliated. | |
| (b) | Options purchased are included in net change in unrealized appreciation (depreciation) on investments — unaffiliated. | |
| | | | |
| SCHEDULES OF INVESTMENTS | | | 113 | |
| | |
Schedule of Investments (continued) December 31, 2019 | | BlackRock High Yield Portfolio |
| | | | |
Average Quarterly Balances of Outstanding Derivative Financial Instruments | | | | |
Futures contracts: | | | | |
Average notional value of contracts — long | | $ | —(a) | |
Average notional value of contracts — short | | | —(a) | |
Forward foreign currency exchange contracts: | | | | |
Average amounts purchased — in USD | | | 1,320 | |
Average amounts sold — in USD | | | 319,372 | |
Options: | | | | |
Average notional value of swaption contracts purchased | | | 507,500 | |
Average notional value of swaption contracts written | | | 272,500 | |
Credit default swaps: | | | | |
Average notional value — sell protection | | | 38,000 | |
| | | | | |
| (a) | Derivative not held at anyquarter-end. The risk exposure table serves as an indicator of activity during the period. |
For more information about the Fund’s investment risks regarding derivative financial instruments, refer to the Notes to Financial Statements.
Derivative Financial Instruments — Offsetting as of Period End
The Fund’s derivative assets and liabilities (by type) were as follows:
| | | | | | | | |
| | | | Assets | | | | Liabilities | |
Derivative Financial Instruments: | | | | | | | | |
Forward foreign currency exchange contracts | | $ | 61 | | | $ | 473 | |
Options(a) | | | 9,315 | | | | 1,117 | |
Swaps — OTC(b) | | | 942 | | | | 10,714 | |
| | | | |
Total derivative assets and liabilities in the Statements of Assets and Liabilities | | $ | 10,318 | | | $ | 12,304 | |
Derivatives not subject to a Master Netting Agreement or similar agreement (“MNA”) | | | — | | | | — | |
| | | | |
Total derivative assets and liabilities subject to an MNA | | $ | 10,318 | | | $ | 12,304 | |
| | | | |
| (a) | Includes options purchased at value which is included in Investments at value – unaffiliated in the Statements of Assets and Liabilities and reported in the Schedule of Investments. |
| (b) | Includes unrealized appreciation (depreciation) on OTC swaps and swap premiums paid/received in the Statements of Assets and Liabilities. |
The following tables present the Fund’s derivative assets and liabilities by counterparty net of amounts available for offset under an MNA and net of the related collateral received and pledged by the Fund:
| | | | | | | | | | | | | | | | | | | | |
| Counterparty | | Derivative
Assets
Subject to
an MNA by
Counterparty | | | Derivatives
Available
for Offset (a) | | | Non-cash
Collateral
Received | | | Cash
Collateral
Received | | | Net Amount
of Derivative
Assets(b) | |
Bank of America NA | | $ | 6,888 | | | $ | (1,117 | ) | | $ | — | | | $ | — | | | $ | 5,771 | |
Barclays Bank plc | | | 3,369 | | | | (3,369 | ) | | | — | | | | — | | | | — | |
State Street Bank and Trust Co. | | | 61 | | | | (30 | ) | | | — | | | | — | | | | 31 | |
| | | | | | | | | | | | | | | | | | | | |
| | $ | 10,318 | | | $ | (4,516 | ) | | $ | — | | | $ | — | | | $ | 5,802 | |
| | | | | | | | | | | | | | | | | | | | |
| | | | | | | | | | | | | | | | | | | | |
| Counterparty | | Derivative
Liabilities
Subject to
an MNA by
Counterparty | | | Derivatives
Available
for Offset (a) | | | Non-cash
Collateral
Pledged | | | Cash
Collateral
Pledged | | | Net Amount of
Derivative
Liabilities(c) | |
Bank of America NA | | $ | 1,117 | | | $ | (1,117 | ) | | $ | — | | | $ | — | | | $ | — | |
Barclays Bank plc | | | 10,714 | | | | (3,369 | ) | | | — | | | | — | | | | 7,345 | |
BNP Paribas SA | | | 54 | | | | — | | | | — | | | | — | | | | 54 | |
HSBC Bank plc | | | 27 | | | | — | | | | — | | | | — | | | | 27 | |
State Street Bank and Trust Co. | | | 30 | | | | (30 | ) | | | — | | | | — | | | | — | |
UBS AG | | | 362 | | | | — | | | | — | | | | — | | | | 362 | |
| | | | | | | | | | | | | | | | | | | | |
| | $ | 12,304 | | | $ | (4,516 | ) | | $ | — | | | $ | — | | | $ | 7,788 | |
| | | | | | | | | | | | | | | | | | | | |
| (a) | The amount of derivatives available for offset is limited to the amount of derivative assets and/or liabilities that are subject to an MNA. |
| (b) | Net amount represents the net amount receivable from the counterparty in the event of default. |
| (c) | Net amount represents the net amount payable due to the counterparty in the event of default. |
| | |
| 114 | | 2019 BLACKROCK ANNUAL REPORTTO SHAREHOLDERS |
| | |
Schedule of Investments (continued) December 31, 2019 | | BlackRock High Yield Portfolio |
Fair Value Hierarchy as of Period End
Various inputs are used in determining the fair value of investments and derivative financial instruments. For information about the Fund’s policy regarding valuation of investments and derivative financial instruments, refer to the Notes to Financial Statements.
The following tables summarize the Fund’s investments and derivative financial instruments categorized in the disclosure hierarchy:
| | | | | | | | | | | | | | | | |
| | | Level 1 | | | Level 2 | | | Level 3 | | | Total | |
Assets: | | | | | | | | | | | | | | | | |
Investments: | | | | | | | | | | | | | | | | |
Long-Term Investments: | | | | | | | | | | | | | | | | |
Common Stocks(a) | | $ | 305,483 | | | $ | — | | | $ | — | | | $ | 305,483 | |
Corporate Bonds(a) | | | — | | | | 26,545,910 | | | | — | | | | 26,545,910 | |
Floating Rate Loan Interests: | | | | | | | | | | | | | | | | |
Aerospace & Defense | | | — | | | | 24,497 | | | | — | | | | 24,497 | |
Auto Components | | | — | | | | 30,202 | | | | — | | | | 30,202 | |
Building Products | | | — | | | | 10,475 | | | | — | | | | 10,475 | |
Capital Markets | | | — | | | | 17,850 | | | | — | | | | 17,850 | |
Chemicals | | | — | | | | 64,672 | | | | 39,194 | | | | 103,866 | |
Commercial Services & Supplies | | | — | | | | 199,057 | | | | — | | | | 199,057 | |
Construction & Engineering | | | — | | | | 29,453 | | | | — | | | | 29,453 | |
Containers & Packaging | | | — | | | | 23,808 | | | | — | | | | 23,808 | |
Diversified Consumer Services | | | — | | | | 13,369 | | | | — | | | | 13,369 | |
Diversified Financial Services | | | — | | | | 39,959 | | | | — | | | | 39,959 | |
Diversified Telecommunication Services | | | — | | | | 114,699 | | | | — | | | | 114,699 | |
Energy Equipment & Services | | | — | | | | 23,329 | | | | 76,800 | | | | 100,129 | |
Entertainment | | | — | | | | 7,020 | | | | — | | | | 7,020 | |
Food & Staples Retailing | | | — | | | | 6,006 | | | | — | | | | 6,006 | |
Food Products | | | — | | | | 5,023 | | | | — | | | | 5,023 | |
Health Care Equipment & Supplies | | | — | | | | 76,123 | | | | — | | | | 76,123 | |
Health Care Providers & Services | | | — | | | | 185,547 | | | | — | | | | 185,547 | |
Health Care Technology | | | — | | | | 72,805 | | | | — | | | | 72,805 | |
Hotels, Restaurants & Leisure | | | — | | | | 44,479 | | | | — | | | | 44,479 | |
Independent Power and Renewable Electricity Producers | | | — | | | | 7,351 | | | | — | | | | 7,351 | |
Industrial Conglomerates | | | — | | | | 76,372 | | | | 12,316 | | | | 88,688 | |
Insurance | | | — | | | | 129,437 | | | | — | | | | 129,437 | |
IT Services | | | — | | | | 185,773 | | | | 9,575 | | | | 195,348 | |
Life Sciences Tools & Services | | | — | | | | 65,142 | | | | — | | | | 65,142 | |
Machinery | | | — | | | | 90,497 | | | | — | | | | 90,497 | |
Media | | | — | | | | 358,640 | | | | 17,228 | | | | 375,868 | |
Oil, Gas & Consumable Fuels | | | — | | | | 183,870 | | | | — | | | | 183,870 | |
Pharmaceuticals | | | — | | | | 56,776 | | | | — | | | | 56,776 | |
Professional Services | | | — | | | | 27,214 | | | | — | | | | 27,214 | |
Road & Rail | | | — | | | | 57,336 | | | | — | | | | 57,336 | |
Semiconductors & Semiconductor Equipment | | | — | | | | 10,493 | | | | — | | | | 10,493 | |
Software | | | — | | | | 243,439 | | | | — | | | | 243,439 | |
Specialty Retail | | | — | | | | 53,565 | | | | — | | | | 53,565 | |
Wireless Telecommunication Services | | | — | | | | 68,501 | | | | — | | | | 68,501 | |
Other Interests | | | — | | | | 1,750 | | | | — | | | | 1,750 | |
Preferred Securities: | | | | | | | | | | | | | | | | |
Banks | | | 41,967 | | | | 710,097 | | | | — | | | | 752,064 | |
Capital Markets | | | — | | | | 40,335 | | | | — | | | | 40,335 | |
Short-Term Securities | | | 243,747 | | | | — | | | | — | | | | 243,747 | |
Options Purchased: | | | | | | | | | | | | | | | | |
Interest rate contracts | | | — | | | | 9,315 | | | | — | | | | 9,315 | |
Unfunded Floating Rate Loan Interests(b) | | | — | | | | 1,628 | | | | — | | | | 1,628 | |
| | | | | | | | | | | | | | | | |
| | $ | 591,197 | | | $ | 29,911,814 | | | $ | 155,113 | | | $ | 30,658,124 | |
| | | | | | | | | | | | | | | | |
| Derivative Financial Instruments(c) | | | | | | | | | | | | |
Assets: | | | | | | | | | | | | | | | | |
Credit contracts | | $ | — | | | $ | 811 | | | $ | — | | | $ | 811 | |
Foreign currency exchange contracts | | | — | | | | 61 | | | | — | | | | 61 | |
Liabilities: | | | | | | | | | | | | | | | | |
Credit contracts | | | — | | | | (9,356 | ) | | | — | | | | (9,356 | ) |
Foreign currency exchange contracts | | | — | | | | (473 | ) | | | — | | | | (473 | ) |
| | | | |
| SCHEDULES OF INVESTMENTS | | | 115 | |
| | |
Schedule of Investments (continued) December 31, 2019 | | BlackRock High Yield Portfolio |
| | | | | | | | | | | | | | | | |
| | | Level 1 | | | Level 2 | | | Level 3 | | | Total | |
Interest rate contracts | | $ | — | | | $ | (1,117 | ) | | $ | — | | | $ | (1,117 | ) |
| | | | | | | | | | | | | | | | |
| | $ | — | | | $ | (10,074 | ) | | $ | — | | | $ | (10,074 | ) |
| | | | | | | | | | | | | | | | |
| (a) | | See above Schedule of Investments for values in each industry. |
| (b) | | Unfunded floating rate loan interests are valued at the unrealized appreciation (depreciation) on the commitment. |
| (c) | | Derivative financial instruments are swaps, forward foreign currency exchange contracts and options written. Swaps and forward foreign currency exchange contracts are valued at the unrealized appreciation (depreciation) on the instrument and options written are shown at value. |
The Fund’s investments that are categorized as Level 3 were valued utilizing third party pricing information without adjustment. Such valuations are based on unobservable inputs. A significant change in third party information could result in a significantly lower or higher value of such Level 3 investments.
A reconciliation of Level 3 investments is presented when the Fund had a significant amount of Level 3 investments at the beginning and/or end of the year in relation to net assets. The following table is a reconciliation of Level 3 investments for which significant unobservable inputs were used in determining fair value:
| | | | | | | | | | | | |
| | | Floating
Rate
Loan
Interests | | | Unfunded
Floating
Rate
Loan
Interests | | | Total | |
Investments: | | | | | | | | | | | | |
Assets/Liabilities: | | | | | | | | | | | | |
Opening balance, as of December 31, 2018 | | $ | 568,189 | | | $ | (32 | ) | | $ | 568,157 | |
Transfers into level 3 | | | 9,694 | | | | — | | | | 9,694 | |
Transfers out of level 3 | | | (101,895 | ) | | | — | | | | (101,895 | ) |
Accrued discounts/premiums | | | 1,035 | | | | — | | | | 1,035 | |
Net realized gain (loss) | | | (1,959 | ) | | | 32 | | | | (1,927 | ) |
Net change in unrealized appreciation(a)(b) | | | 14,009 | | | | — | | | | 14,009 | |
Purchases | | | 59,283 | | | | — | | | | 59,283 | |
Sales | | | (393,243 | ) | | | — | | | | (393,243 | ) |
| | | | |
Closing balance, as of December 31, 2019 | | $ | 155,113 | | | $ | — | | | $ | 155,113 | |
| | | | |
Net change in unrealized depreciation on investments still held at December 31, 2019(b) | | $ | (3,395 | ) | | $ | — | | | $ | (3,395 | ) |
| | | | |
| (a) | Included in the related net change in unrealized appreciation (depreciation) in the Statements of Operations. |
| (b) | Any difference between net change in unrealized appreciation (depreciation) and net change in unrealized appreciation (depreciation) on investments still held at December 31, 2019 is generally due to investments no longer held or categorized as Level 3 at period end. |
The Fund’s investments that are categorized as Level 3 were valued utilizing third party pricing information without adjustment. Such valuations are based on unobservable inputs. A significant change in third party information could result in a significantly lower or higher value of such Level 3 investments.
See notes to financial statements.
| | |
| 116 | | 2019 BLACKROCK ANNUAL REPORTTO SHAREHOLDERS |
| | |
Schedule of Investments December 31, 2019 | | BlackRock U.S. Government Bond Portfolio (Percentages shown are based on Net Assets) |
| | | | | | | | |
| Security | | Par
(000) | | | Value | |
|
Asset-Backed Securities — 1.9%(a) | |
Dryden XXVIII Senior Loan Fund, Series 2013 - 28A, Class A1LR, (LIBOR USD 3 Month + 1.20%), 3.11%, 08/15/30(b) | | | USD 500 | | | $ | 499,248 | |
LMREC, Inc., Series 2016-CRE2, Class A, (LIBOR USD 1 Month + 1.70%), 3.48%, 11/24/31(b) | | | 13 | | | | 12,699 | |
Progress Residential Trust, Series 2017-SFR1, Class A, 2.77%, 08/17/34 | | | 100 | | | | 99,753 | |
RomarkWM-R Ltd., Series2018-1A, Class A1, (LIBOR USD 3 Month + 1.03%), 3.00%, 04/20/31(b) | | | 400 | | | | 395,303 | |
| | | | | | | | |
| |
Total Asset-Backed Securities — 1.9%
(Cost: $1,012,286) | | | | 1,007,003 | |
| | | | | |
|
| Foreign Government Obligations — 0.4% | |
| | |
Mexico — 0.2% | | | | | | | | |
United Mexican States: | | | | | | | | |
6.50%, 06/09/22 | | | MXN 4 | | | | 20,084 | |
8.00%, 12/07/23 | | | 4 | | | | 19,400 | |
8.00%, 09/05/24 | | | 3 | | | | 15,517 | |
10.00%, 12/05/24 | | | 8 | �� | | | 50,345 | |
| | | | | | | | |
| | | | | | | 105,346 | |
| | |
| Russia — 0.2% | | | | | | |
Russian Federation: | | | | | | | | |
7.10%, 10/16/24 | | | RUB 2,126 | | | | 35,862 | |
8.50%, 09/17/31 | | | 2,881 | | | | 54,741 | |
| | | | | | | | |
| | | | | | | 90,603 | |
| | | | | | | | |
| |
Total Foreign Government Obligations — 0.4%
(Cost: $184,481) | | | | 195,949 | |
| | | | | | | | |
|
| Non-Agency Mortgage-Backed Securities — 6.7% | |
|
Collateralized Mortgage Obligations — 0.6% | |
Seasoned Credit Risk Transfer Trust: | | | | | | | | |
Series2018-2, Class MA, 3.50%, 11/25/57 | | | USD 108 | | | | 111,560 | |
Series2018-3, Class MA, 3.50%, 08/25/57 | | | 137 | | | | 142,211 | |
Series2019-2, Class MA, 3.50%, 08/25/58 | | | 79 | | | | 81,863 | |
| | | | | | | | |
| | | | | | | 335,634 | |
|
| Commercial Mortgage-Backed Securities — 5.6% | |
BX Commercial Mortgage Trust, Series 2019 - XL, Class D, 3.19%, 10/15/36(a)(c) | | | 300 | | | | 300,375 | |
BX Trust, Series 2019-OC11, Class A, 3.20%, 12/09/41(a) | | | 275 | | | | 282,847 | |
Cantor Commercial Real Estate Lending, Series2019-CF3, Class A4, 3.01%, 01/15/53 | | | 219 | | | | 224,661 | |
Commercial Mortgage Trust, Series 2017- PANW, Class A, 3.24%, 10/10/29(a) | | | 350 | | | | 360,593 | |
CSAIL Commercial Mortgage Trust, Series2019-C17, Class C, 3.93%, 09/15/52 | | | 80 | | | | 81,499 | |
Hudson Yards Mortgage Trust, Series 2019- 30HY, Class D, 3.44%, 07/10/39(a)(c) | | | 101 | | | | 101,317 | |
JPMCC Commercial Mortgage Securities Trust, Series 2019-COR5, Class A4, 3.39%, 06/13/52 | | | 77 | | | | 81,396 | |
JPMDB Commercial Mortgage Securities Trust, Series 2019-COR6, Class A4, 3.06%, 11/13/52 | | | 155 | | | | 159,715 | |
Morgan Stanley Capital I Trust: | | | | | | | | |
Series2018-SUN, Class A, 2.64%, 07/15/35(a)(c) | | | 130 | | | | 129,592 | |
Series2019-H6, Class A4, 3.42%, 06/15/52 | | | 127 | | | | 134,697 | |
| | | | | | | | |
| Security | | Par
(000) | | | Value | |
|
| Commercial Mortgage-Backed Securities (continued) | |
Series2019-H7, Class A4, 3.26%, 07/15/52 | | USD | 153 | | | $ | 159,582 | |
Series2019-L3, Class A4, 3.13%, 11/15/29 | | | 244 | | | | 251,801 | |
One Bryant Park Trust, Series2019-OBP, Class A, 2.52%, 09/15/54(a) | | | 270 | | | | 262,858 | |
UBS Commercial Mortgage Trust: | | | | | | | | |
Series2019-C17, Class A4, 2.92%, 10/15/52 | | | 273 | | | | 277,433 | |
Series2019-C18, Class A4, 3.04%, 12/15/52 | | | 95 | | | | 97,368 | |
Wells Fargo Commercial Mortgage Trust, Series2019-C54, Class A4, 3.15%, 12/15/52 | | | 121 | | | | 125,486 | |
| | | | | | | | |
| | | | | | | 3,031,220 | |
|
| Interest Only Commercial Mortgage-Backed Securities — 0.5%(c) | |
CSAIL Commercial Mortgage Trust, Series2019-C16, Class XA, 1.57%, 06/15/52 | | | 1,552 | | | | 184,768 | |
UBS Commercial Mortgage Trust, Series 2019- C17, Class XA, 1.64%, 10/15/52 | | | 999 | | | | 112,521 | |
| | | | | | | | |
| | | | | | | 297,289 | |
| | | | | | | | |
| |
TotalNon-Agency Mortgage-Backed Securities — 6.7%
(Cost: $3,648,823) | | | | 3,664,143 | |
| | | | | | | | |
|
| U.S. Government Sponsored Agency Securities — 65.3% | |
| | |
Agency Obligations — 0.8% | | | | | | | | |
Federal Home Loan Bank, 4.00%, 04/10/28 | | | 400 | | | | 459,491 | |
| | | | | |
|
| Collateralized Mortgage Obligations — 2.5% | |
Federal Home Loan Mortgage Corp. Variable Rate Notes, Series 4901, Class BF, ( LIBOR USD 1 Month +0.40%), 2.14%, 07/25/49(b) | | | 218 | | | | 216,973 | |
Federal National Mortgage Association, Series2011-8, Class ZA, 4.00%, 02/25/41 | | | 218 | | | | 229,474 | |
Federal National Mortgage Association Variable Rate Notes, Series2019-39, Class LF, ( LIBOR USD 1 Month +0.45%), 2.24%, 08/25/49(b) | | | 192 | | | | 191,773 | |
Government National Mortgage Association Variable Rate Notes: | | | | | | | | |
Series2014-107, Class WX, 6.83%, 07/20/39(d) | | | 99 | | | | 112,042 | |
Series2019-21, Class FL, (LIBOR USD 1 Month +0.45%), 2.21%, 02/20/49(b) | | | 294 | | | | 294,546 | |
Series2019-89, Class FH, (LIBOR USD 1 Month +0.40%), 2.16%, 07/20/49(b) | | | 308 | | | | 308,055 | |
| | | | | | | | |
| | | | | | | 1,352,863 | |
|
| Commercial Mortgage-Backed Securities — 1.1% | |
Federal Home Loan Mortgage Corp. Variable Rate Notes(d): | | | | | | | | |
Series 2019-SB60, Class A10F, 3.31%, 01/25/29 | | | 206 | | | | 213,290 | |
Series 2019-SB61, Class A10F, 3.17%, 01/25/29 | | | 169 | | | | 174,571 | |
Federal National Mortgage Association ACES Variable Rate Notes, Series2019-M1, Class A2, 3.56%, 09/25/28(d) | | | 110 | | | | 118,946 | |
Government National Mortgage Association: | | | | | | | | |
Series2019-7, Class V, 3.00%, 05/16/35 | | | 22 | | | | 22,668 | |
Series2019-53, Class V, 2.75%, 08/16/31 | | | 55 | | | | 56,206 | |
| | | | | | | | |
| | | | | | | 585,681 | |
| | | | |
| SCHEDULES OF INVESTMENTS | | | 117 | |
| | |
Schedule of Investments (continued) December 31, 2019 | | BlackRock U.S. Government Bond Portfolio (Percentages shown are based on Net Assets) |
| | | | | | | | |
| Security | | Par
(000) | | | Value | |
|
| Interest Only Commercial Mortgage-Backed Securities — 1.8% | |
Federal Home Loan Mortgage Corp., Series 2015-K718, Class X2A,
0.10%, 02/25/48(a) | | | USD 17,008 | | | $ | 26,238 | |
Federal National Mortgage Association ACES Variable Rate Notes, Series2015-M1, Class X2, 0.54%, 09/25/24(d) | | | 5,161 | | | | 110,474 | |
Government National Mortgage Association Variable Rate Notes: | | | | | | | | |
Series2002-83, 0.00%, 10/16/42(d) | | | 434 | | | | 1 | |
Series2003-17, 0.00%, 03/16/43(d) | | | 848 | | | | — | |
Series2003-109, 0.00%, 11/16/43(d) | | | 842 | | | | 33 | |
Series2016-22, 0.77%, 11/16/55(d) | | | 2,092 | | | | 105,194 | |
Series2016-45, 0.99%, 02/16/58(d) | | | 1,680 | | | | 112,846 | |
Series2016-92, 1.00%, 04/16/58(d) | | | 587 | | | | 39,777 | |
Series2016-113, (LIBOR USD 1 Month + 0.00%), 1.18%, 02/16/58(b) | | | 1,280 | | | | 104,410 | |
Series2016-151, 1.09%, 06/16/58(d) | | | 919 | | | | 69,204 | |
Series2017-30, 0.71%, 08/16/58(d) | | | 562 | | | | 30,839 | |
Series2017-44, 0.70%, 04/17/51(d) | | | 606 | | | | 32,766 | |
Series2017-53, 0.69%, 11/16/56(d) | | | 3,810 | | | | 204,024 | |
Series2017-61, 0.77%, 05/16/59(d) | | | 415 | | | | 27,385 | |
Series2017-64, 0.72%, 11/16/57(d) | | | 721 | | | | 43,314 | |
Series2017-72, 0.68%, 04/16/57(d) | | | 1,071 | | | | 62,104 | |
| | | | | | | | |
| | | | | | | 968,609 | |
| | |
| Mortgage-Backed Securities — 59.1% | | | | | | |
Federal Home Loan Mortgage Corp.: | | | | | | | | |
2.50%, 03/01/30- 04/01/31 | | | 173 | | | | 175,793 | |
3.00%, 09/01/27- 02/01/47 | | | 483 | | | | 498,249 | |
3.50%, 04/01/31-01/01/48 | | | 2,387 | | | | 2,530,288 | |
4.00%, 08/01/40- 02/01/47 | | | 224 | | | | 241,088 | |
4.50%, 02/01/39- 07/01/47 | | | 232 | | | | 252,368 | |
5.00%, 11/01/41 | | | 97 | | | | 105,876 | |
5.50%, 06/01/41 | | | 91 | | | | 101,725 | |
8.00%, 03/01/30-06/01/31 | | | 12 | | | | 12,664 | |
Federal National Mortgage Association: | | | | | | | | |
3.00%, 02/01/44 | | | 56 | | | | 57,738 | |
3.13%, 09/01/27 | | | 112 | | | | 117,819 | |
3.16%, 03/01/27 | | | 172 | | | | 180,194 | |
3.50%, 11/01/46 | | | 189 | | | | 198,511 | |
4.00%, 01/01/41 | | | 8 | | | | 8,618 | |
Government National Mortgage Association: | | | | | | | | |
2.50%, 01/15/50(e) | | | 77 | | | | 77,328 | |
3.00%, 02/15/45-12/20/46 | | | 1,402 | | | | 1,447,568 | |
3.00%, 01/15/50(e) | | | 33 | | | | 33,904 | |
3.50%, 01/15/42-10/20/46 | | | 2,369 | | | | 2,469,975 | |
4.00%, 10/20/40- 01/15/48 | | | 712 | | | | 748,047 | |
4.00%, 01/15/50- 02/15/50(e) | | | 702 | | | | 726,715 | |
4.50%, 12/20/39- 11/20/49 | | | 1,273 | | | | 1,357,154 | |
4.50%, 01/15/50(e) | | | 1,463 | | | | 1,529,521 | |
5.00%, 07/15/39- 07/20/44 | | | 69 | | | | 76,487 | |
5.00%, 01/15/50(e) | | | 229 | | | | 241,094 | |
Uniform Mortgage-Backed Securities: | | | | | | | | |
2.00%, 10/01/31- 03/01/32 | | | 109 | | | | 108,749 | |
2.50%, 04/01/30- 02/01/33 | | | 607 | | | | 615,607 | |
2.50%, 01/25/35- 01/25/50(e) | | | 781 | | | | 780,629 | |
3.00%, 04/01/29- 03/01/47 | | | 3,080 | | | | 3,175,469 | |
3.00%, 01/25/35- 01/25/50(e) | | | 285 | | | | 290,129 | |
3.50%, 04/01/29- 01/01/48 | | | 2,314 | | | | 2,453,897 | |
3.50%, 01/25/35- 02/25/50(e) | | | 1,205 | | | | 1,239,479 | |
4.00%, 09/01/33- 08/01/49 | | | 2,764 | | | | 2,960,936 | |
4.00%, 01/25/50- 02/25/50(e) | | | 5,051 | | | | 5,253,929 | |
4.50%, 06/01/26- 07/01/48 | | | 755 | | | | 822,684 | |
4.50%, 01/25/50- 02/25/50(e) | | | 438 | | | | 461,173 | |
5.00%, 02/01/35- 12/01/43 | | | 205 | | | | 225,296 | |
5.00%, 01/25/50(e) | | | 4 | | | | 4,276 | |
| | | | | | | | |
| Security | | Par
(000) | | | Value | |
| | |
| Mortgage-Backed Securities (continued) | | | | | | |
5.50%, 11/01/21- 09/01/39 | | | USD 262 | | | $ | 291,199 | |
6.00%, 04/01/35- 09/01/40 | | | 189 | | | | 216,176 | |
6.50%, 05/01/40 | | | 40 | | | | 45,152 | |
| | | | | | | | |
| | | | | | | 32,133,504 | |
| | | | | | | | |
| |
Total U.S. Government Sponsored Agency Securities — 65.3%
(Cost: $34,962,169) | | | | 35,500,148 | |
| | | | | |
|
| U.S. Treasury Obligations — 53.6% | |
U.S. Treasury Bonds: | | | | | | | | |
4.25%, 05/15/39 | | | 160 | | | | 210,888 | |
4.50%, 08/15/39 | | | 160 | | | | 217,481 | |
4.38%, 11/15/39 | | | 160 | | | | 214,469 | |
3.13%, 02/15/43 | | | 610 | | | | 693,232 | |
2.88%, 05/15/43-11/15/46 | | | 1,200 | | | | 1,314,742 | |
3.63%, 08/15/43 | | | 610 | | | | 749,585 | |
3.75%, 11/15/43 | | | 610 | | | | 764,382 | |
3.00%, 02/15/48 | | | 590 | | | | 664,948 | |
2.25%, 08/15/49(f) | | | 825 | | | | 802,570 | |
U.S. Treasury Inflation Linked Notes: | | | | | | | | |
0.50%, 04/15/24(f) | | | 4,851 | | | | 4,929,261 | |
0.25%, 07/15/29 | | | 302 | | | | 304,750 | |
U.S. Treasury Notes: | | | | | | | | |
2.00%, 07/31/20(f) | | | 2,350 | | | | 2,354,865 | |
2.50%, 12/31/20(f) | | | 1,760 | | | | 1,774,713 | |
1.13%, 07/31/21 | | | 250 | | | | 248,135 | |
1.75%, 07/31/21- 07/31/24(f) | | | 3,695 | | | | 3,705,726 | |
2.13%, 12/31/22- 07/31/24 | | | 2,360 | | | | 2,400,932 | |
2.75%, 05/31/23 | | | 1,180 | | | | 1,223,512 | |
2.00%, 02/15/25 | | | 1,470 | | | | 1,491,246 | |
2.13%, 05/15/25(f) | | | 1,290 | | | | 1,316,606 | |
1.50%, 08/15/26 | | | 1,700 | | | | 1,667,129 | |
2.25%, 08/15/27 | | | 1,180 | | | | 1,213,695 | |
2.88%, 08/15/28 | | | 350 | | | | 377,480 | |
3.13%, 11/15/28 | | | 350 | | | | 385,096 | |
1.63%, 08/15/29(f) | | | 125 | | | | 121,870 | |
| | | | | | | | |
| |
Total U.S. Treasury Obligations — 53.6%
(Cost: $28,425,373) | | | | 29,147,313 | |
| | | | | | | | |
| |
Total Long-Term Investments — 127.9%
(Cost: $68,233,132) | | | | 69,514,556 | |
| | | | | | | | |
|
| Short-Term Securities — 17.2% | |
|
| Foreign Government Obligations — 2.0% | |
| | |
| Japan — 2.0% | | | | | | |
Japan Treasury Bills(g): | | | | | | | | |
(0.14)%, 03/09/20 | | | JPY 60,550 | | | | 557,427 | |
(0.11)%, 03/16/20 | | | 60,050 | | | | 552,837 | |
| | | | | | | | |
| | | | | | | 1,110,264 | |
| | | | | | | | |
| |
Total Foreign Government Obligations — 2.0%
(Cost: $1,109,103) | | | | 1,110,264 | |
| | | | | |
| | |
| 118 | | 2019 BLACKROCK ANNUAL REPORTTO SHAREHOLDERS |
| | |
Schedule of Investments (continued) December 31, 2019 | | BlackRock U.S. Government Bond Portfolio (Percentages shown are based on Net Assets) |
| | | | | | | | |
| Security | | Shares | | | Value | |
|
| Money Market Funds — 2.3%(h) | |
BlackRock Liquidity Funds,T-Fund, Institutional Class, 1.51%* | | | 1,217,840 | | | $ | 1,217,840 | |
JPMorgan U.S. Treasury Plus Money Market Fund, Agency Class, 1.41% | | | 34,538 | | | | 34,538 | |
| | | | | | | | |
| |
Total Money Market Funds — 2.3%
(Cost: $1,252,378) | | | | 1,252,378 | |
| | | | | | | | |
| | |
| | | Par
(000) | | | | |
|
U.S. Government Sponsored Agency
Securities — 12.9% | |
Federal Home Loan Bank Discount Notes, 1.57%, 02/12/20(g) | | | USD 7,000 | | | | 6,987,882 | |
| | | | | | | | |
| |
Total U.S. Government Sponsored Agency Securities — 12.9%
(Cost: $6,987,187) | | | | 6,987,882 | |
| | | | | |
| |
Total Short-Term Securities — 17.2%
(Cost: $9,348,668) | | | | 9,350,524 | |
| | | | | |
| |
Total Options Purchased — 0.0%
(Cost: $67,029) | | | | 36,545 | |
| | | | | | | | |
| |
Total Investments Before Options Written and TBA Sale Commitments — 145.1%
(Cost: $77,648,829) | | | | 78,901,625 | |
| | | | | | | | |
| |
Total Options Written — (0.0)%
(Premium Received — $42,511) | | | | (29,847 | ) |
| | | | | |
| |
| TBA Sale Commitments — (8.1)%(e) | | | | |
| |
Mortgage-Backed Securities — (8.1)% | | | | | |
Government National Mortgage Association: | | | | | | | | |
3.00%, 01/15/50 | | | 83 | | | | (84,759 | ) |
3.50%, 01/15/50 | | | 1,372 | | | | (1,413,564 | ) |
4.00%, 01/15/50 | | | 160 | | | | (165,600 | ) |
4.50%, 01/15/50 | | | 51 | | | | (53,319 | ) |
5.00%, 01/15/50 | | | 23 | | | | (24,215 | ) |
Uniform Mortgage-Backed Securities: | | | | | | | | |
2.50%, 01/25/35-02/25/35 | | | 841 | | | | (848,288 | ) |
3.50%, 01/25/35-01/25/50 | | | 313 | | | | (322,456 | ) |
4.00%, 01/25/35-01/25/50 | | | 449 | | | | (467,438 | ) |
3.00%, 01/25/50 | | | 799 | | | | (810,820 | ) |
4.50%, 01/25/50 | | | 39 | | | | (41,061 | ) |
5.50%, 01/25/50 | | | 109 | | | | (117,379 | ) |
6.00%, 01/25/50 | | | 69 | | | | (76,029 | ) |
| | | | | | | | |
| |
Total TBA Sale Commitments — (8.1)%
(Proceeds: $4,426,412) | | | | (4,424,928 | ) |
| | | | | |
| |
Total Investments Net of Options Written and TBA Sale Commitments — 137.0%
(Cost: $73,179,906) | | | | 74,446,850 | |
| |
Liabilities in Excess of Other Assets — (37.0)% | | | | (20,113,763 | ) |
| | | | | | | | |
| |
Net Assets — 100.0% | | | $ | 54,333,087 | |
| | | | | | | | |
| (a) | Security exempt from registration pursuant to Rule 144A under the Securities Act of 1933, as amended. These securities may be resold in transactions exempt from registration to qualified institutional investors. |
| (b) | Variable rate security. Security may be issued at a fixed coupon rate, which converts to a variable rate at a specified date. Rate shown is the rate in effect as of period end. |
| (c) | Variable or floating rate security, which interest rate adjusts periodically based on changes in current interest rates and prepayments on the underlying pool of assets. Rate shown is the rate in effect as of period end. |
| (d) | Variable rate security.Rate shown is the rate in effect as of period end. |
| (e) | Represents or includes a TBA transaction. |
| (f) | All or a portion of the security has been pledged as collateral in connection with outstanding reverse repurchase agreements. |
| (g) | Rates are discount rates or a range of discount rates as of period end. |
| | | | |
| SCHEDULES OF INVESTMENTS | | | 119 | |
| | |
Schedule of Investments (continued) December 31, 2019 | | BlackRock U.S. Government Bond Portfolio |
| (h) | Annualized7-day yield as of period end. |
| * | During the year ended December 31, 2019, investments in issuers considered to be an affiliate/affiliates of the Fund for purposes of Section 2(a)(3) of the Investment Company Act of 1940, as amended, were as follows: |
| | | | | | | | | | | | | | | | | | | | | | | | | | | | |
| Affiliate | | Shares
Held at
12/31/18 | | | Net
Activity | | | Shares
Held at
12/31/19 | | | Value at
12/31/19 | | | Income | | | Net
Realized
Gain (Loss) (a) | | | Change in
Unrealized
Appreciation
(Depreciation) | |
BlackRock Liquidity Funds,T-Fund, Institutional Class | | | 1,608,196 | | | | (390,356 | ) | | | 1,217,840 | | | $ | 1,217,840 | | | $ | 34,081 | | | $ | — | | | $ | — | |
| | | | | | | | | | | | | | | | | | | | | | | | | | | | |
| (a) | Includes net capital gain distributions, if applicable. | |
Reverse Repurchase Agreements
| | | | | | | | | | | | | | | | | | | | | | | | |
| Counterparty | | Interest
Rate | | | Trade
Date | | | Maturity
Date | | | Face Value | | | Face Value
Including
Accrued Interest | | | Type ofNon-Cash
Underlying Collateral | | Remaining Contractual
Maturity of the Agreements |
J.P.Morgan Securities LLC | | | 1.75 | % | | | 12/30/19 | | | | 01/02/20 | | | $ | 4,932,275 | | | $ | 4,932,515 | | | U.S. Treasury Obligations | | Overnight |
Bank of America Securities, Inc. | | | 0.05 | | | | 12/31/19 | | | | 01/02/20 | | | | 814,688 | | | | 814,689 | | | U.S. Treasury Obligations | | Overnight |
Bank of America Securities, Inc. | | | 1.20 | | | | 12/31/19 | | | | 01/02/20 | | | | 122,812 | | | | 122,816 | | | U.S. Treasury Obligations | | Overnight |
Bank of America Securities, Inc. | | | 1.85 | | | | 12/31/19 | | | | 01/02/20 | | | | 1,320,637 | | | | 1,320,705 | | | U.S. Treasury Obligations | | Overnight |
Bank of America Securities, Inc. | | | 1.85 | | | | 12/31/19 | | | | 01/02/20 | | | | 1,775,400 | | | | 1,775,491 | | | U.S. Treasury Obligations | | Overnight |
Bank of America Securities, Inc. | | | 1.85 | | | | 12/31/19 | | | | 01/02/20 | | | | 2,373,500 | | | | 2,373,622 | | | U.S. Treasury Obligations | | Overnight |
Bank of America Securities, Inc. | | | 1.85 | | | | 12/31/19 | | | | 01/02/20 | | | | 2,300,594 | | | | 2,300,712 | | | U.S. Treasury Obligations | | Overnight |
Bank of America Securities, Inc. | | | 1.85 | | | | 12/31/19 | | | | 01/02/20 | | | | 1,434,200 | | | | 1,434,274 | | | U.S. Treasury Obligations | | Overnight |
| | | | | | | | | | | | | | | | | | | | | | | | |
| | | | | | | | | | | | | | $ | 15,074,106 | | | $ | 15,074,824 | | | | | |
| | | | | | | | | | | | | | | | | | | | | | | | |
| | |
| 120 | | 2019 BLACKROCK ANNUAL REPORTTO SHAREHOLDERS |
| | |
Schedule of Investments (continued) December 31, 2019 | | BlackRock U.S. Government Bond Portfolio |
Derivative Financial Instruments Outstanding as of Period End
Futures Contracts
| | | | | | | | | | | | | | | | |
| Description | | Number of
Contracts | | | Expiration
Date | | | Notional
Amount (000) | | | Value/
Unrealized
Appreciation
(Depreciation) | |
Long Contracts | | | | | | | | | | | | | | | | |
Euro-BTP | | | 2 | | | | 03/06/20 | | | $ | 320 | | | $ | (621 | ) |
Euro-Schatz | | | 21 | | | | 03/06/20 | | | | 2,636 | | | | (2,343 | ) |
U.S. Treasury 2 Year Note | | | 72 | | | | 03/31/20 | | | | 15,516 | | | | 2,367 | |
90-day Eurodollar | | | 12 | | | | 09/14/20 | | | | 2,951 | | | | 733 | |
| | | | | | | | | | | | | | | | |
| | | | | | | | | | | | | | | 136 | |
| | | | | | | | | | | | | | | | |
Short Contracts | | | | | | | | | | | | | | | | |
Euro-Bund | | | 2 | | | | 03/06/20 | | | | 382 | | | | 3,729 | |
U.S. Treasury 10 Year Note | | | 24 | | | | 03/20/20 | | | | 3,082 | | | | 3,859 | |
U.S. Treasury 10 Year Ultra Note | | | 2 | | | | 03/20/20 | | | | 281 | | | | 2,452 | |
U.S. Treasury Long Bond | | | 1 | | | | 03/20/20 | | | | 156 | | | | 936 | |
U.S. Treasury Ultra Bond | | | 2 | | | | 03/20/20 | | | | 363 | | | | 6,587 | |
Long Gilt | | | 2 | | | | 03/27/20 | | | | 348 | | | | 1,244 | |
U.S. Treasury 5 Year Note | | | 13 | | | | 03/31/20 | | | | 1,542 | | | | 5,417 | |
| | | | | | | | | | | | | | | | |
| | | | | | | | | | | | | | | 24,224 | |
| | | | | | | | | | | | | | | | |
| | | | | | | | | | | | | | $ | 24,360 | |
| | | | | | | | | | | | | | | | |
Forward Foreign Currency Exchange Contracts
| | | | | | | | | | | | | | | | | | | | |
Currency Purchased | | | Currency
Sold | | | Counterparty | | Settlement
Date | | | Unrealized Appreciation (Depreciation) | |
| BRL | | | 79,395 | | | USD | | | 19,000 | | | Citibank NA | | | 01/03/20 | | | $ | 736 | |
| BRL | | | 102,736 | | | USD | | | 25,000 | | | Deutsche Bank AG | | | 01/03/20 | | | | 539 | |
| MXN | | | 117,088 | | | USD | | | 6,000 | | | Citibank NA | | | 01/03/20 | | | | 193 | |
| MXN | | | 117,455 | | | USD | | | 6,000 | | | HSBC Bank plc | | | 01/03/20 | | | | 212 | |
| ZAR | | | 154,743 | | | USD | | | 11,000 | | | JPMorgan Chase Bank NA | | | 01/06/20 | | | | 44 | |
| CNY | | | 56,473 | | | USD | | | 8,000 | | | Bank of America NA | | | 01/08/20 | | | | 112 | |
| EUR | | | 5,000 | | | USD | | | 5,543 | | | HSBC Bank plc | | | 01/08/20 | | | | 68 | |
| KRW | | | 7,636,850 | | | USD | | | 6,500 | | | BNP Paribas SA | | | 01/08/20 | | | | 109 | |
| KRW | | | 4,758,000 | | | USD | | | 4,000 | | | Deutsche Bank AG | | | 01/08/20 | | | | 118 | |
| KRW | | | 7,124,400 | | | USD | | | 6,000 | | | JPMorgan Chase Bank NA | | | 01/08/20 | | | | 166 | |
| RUB | | | 386,919 | | | USD | | | 6,000 | | | BNP Paribas SA | | | 01/09/20 | | | | 229 | |
| USD | | | 557,881 | | | JPY | | | 60,568,000 | | | Citibank NA | | | 01/09/20 | | | | 248 | |
| USD | | | 554,557 | | | JPY | | | 60,068,000 | | | UBS AG | | | 01/14/20 | | | | 1,372 | |
| AUD | | | 17,000 | | | JPY | | | 1,284,718 | | | Morgan Stanley & Co. International plc | | | 01/17/20 | | | | 101 | |
| COP | | | 101,521,080 | | | USD | | | 29,393 | | | JPMorgan Chase Bank NA | | | 01/22/20 | | | | 1,467 | |
| COP | | | 36,147,270 | | | USD | | | 10,441 | | | Natwest Markets plc | | | 01/22/20 | | | | 547 | |
| RUB | | | 471,709 | | | USD | | | 7,306 | | | HSBC Bank plc | | | 01/22/20 | | | | 276 | |
| RUB | | | 698,291 | | | USD | | | 10,842 | | | JPMorgan Chase Bank NA | | | 01/22/20 | | | | 382 | |
| MXN | | | 95,121 | | | USD | | | 5,000 | | | Bank of America NA | | | 01/23/20 | | | | 15 | |
| BRL | | | 122,011 | | | USD | | | 30,000 | | | Credit Suisse International | | | 02/04/20 | | | | 302 | |
| BRL | | | 28,409 | | | USD | | | 7,000 | | | Morgan Stanley & Co. International plc | | | 02/04/20 | | | | 55 | |
| JPY | | | 543,293 | | | USD | | | 5,000 | | | Morgan Stanley & Co. International plc | | | 02/05/20 | | | | 10 | |
| MXN | | | 565,000 | | | USD | | | 29,177 | | | Bank of America NA | | | 02/05/20 | | | | 551 | |
| MXN | | | 173,000 | | | USD | | | 8,826 | | | HSBC Bank plc | | | 02/05/20 | | | | 277 | |
| JPY | | | 1,526,278 | | | USD | | | 14,000 | | | UBS AG | | | 02/06/20 | | | | 74 | |
| RUB | | | 883,470 | | | USD | | | 14,000 | | | Bank of America NA | | | 02/18/20 | | | | 153 | |
| USD | | | 195,810 | | | EUR | | | 150,000 | | | Deutsche Bank AG | | | 02/25/20 | | | | 26,998 | |
| USD | | | 194,749 | | | JPY | | | 19,510,000 | | | HSBC Bank plc | | | 03/16/20 | | | | 14,441 | |
| BRL | | | 577,437 | | | USD | | | 141,000 | | | Bank of America NA | | | 03/18/20 | | | | 2,101 | |
| BRL | | | 578,060 | | | USD | | | 140,000 | | | Deutsche Bank AG | | | 03/18/20 | | | | 3,255 | |
| MXN | | | 967,150 | | | USD | | | 50,000 | | | BNP Paribas SA | | | 03/18/20 | | | | 583 | |
| MXN | | | 3,707,635 | | | USD | | | 190,000 | | | Citibank NA | | | 03/18/20 | | | | 3,911 | |
| MXN | | | 773,480 | | | USD | | | 40,000 | | | Deutsche Bank AG | | | 03/18/20 | | | | 453 | |
| | | | |
| SCHEDULES OF INVESTMENTS | | | 121 | |
| | |
Schedule of Investments (continued) December 31, 2019 | | BlackRock U.S. Government Bond Portfolio |
Forward Foreign Currency Exchange Contracts (continued)
| | | | | | | | | | | | | | | | | | | | |
Currency
Purchased | | | Currency
Sold | | | Counterparty | | Settlement
Date | | | Unrealized
Appreciation
(Depreciation) | |
| RUB | | | 17,622,310 | | | USD | | | 275,000 | | | Bank of America NA | | | 03/18/20 | | | $ | 6,350 | |
| | | | | | | | | | | | | | | | | | | | |
| | | | | | | | | | | | | | | | | | | 66,448 | |
| | | | | | | | | | | | | | | | | | | | |
| USD | | | 14,000 | | | BRL | | | 59,643 | | | Citibank NA | | | 01/03/20 | | | | (827 | ) |
| USD | | | 30,000 | | | BRL | | | 121,860 | | | Credit Suisse International | | | 01/03/20 | | | | (293 | ) |
| USD | | | 5,000 | | | MXN | | | 95,735 | | | BNP Paribas SA | | | 01/03/20 | | | | (63 | ) |
| USD | | | 7,000 | | | MXN | | | 133,672 | | | Citibank NA | | | 01/03/20 | | | | (70 | ) |
| JPY | | | 433,746 | | | USD | | | 4,000 | | | Bank of America NA | | | 01/06/20 | | | | (7 | ) |
| JPY | | | 650,223 | | | USD | | | 6,000 | | | Morgan Stanley & Co. International plc | | | 01/06/20 | | | | (15 | ) |
| USD | | | 10,000 | | | JPY | | | 1,089,516 | | | Morgan Stanley & Co. International plc | | | 01/06/20 | | | | (29 | ) |
| USD | | | 5,000 | | | ZAR | | | 72,218 | | | Bank of America NA | | | 01/06/20 | | | | (154 | ) |
| USD | | | 6,000 | | | ZAR | | | 88,434 | | | BNP Paribas SA | | | 01/06/20 | | | | (312 | ) |
| USD | | | 8,000 | | | CNY | | | 56,342 | | | Bank of America NA | | | 01/08/20 | | | | (93 | ) |
| USD | | | 5,571 | | | EUR | | | 5,000 | | | Bank of America NA | | | 01/08/20 | | | | (39 | ) |
| USD | | | 16,500 | | | KRW | | | 19,628,730 | | | Deutsche Bank AG | | | 01/08/20 | | | | (488 | ) |
| USD | | | 6,000 | | | RUB | | | 376,980 | | | Citibank NA | | | 01/09/20 | | | | (69 | ) |
| JPY | | | 841,154 | | | AUD | | | 11,220 | | | Morgan Stanley & Co. International plc | | | 01/17/20 | | | | (129 | ) |
| USD | | | 5,000 | | | KRW | | | 5,815,500 | | | BNP Paribas SA | | | 01/21/20 | | | | (35 | ) |
| USD | | | 39,717 | | | COP | | | 137,668,350 | | | Credit Suisse International | | | 01/22/20 | | | | (2,132 | ) |
| USD | | | 46,326 | | | RUB | | | 3,000,000 | | | Morgan Stanley &Co. International plc | | | 01/22/20 | | | | (1,892 | ) |
| COP | | | 16,370,000 | | | USD | | | 5,000 | | | JPMorgan Chase Bank NA | | | 01/24/20 | | | | (24 | ) |
| USD | | | 5,000 | | | COP | | | 16,652,500 | | | Citibank NA | | | 01/24/20 | | | | (62 | ) |
| USD | | | 139,630 | | | MXN | | | 2,702,000 | | | HSBC Bank plc | | | 02/05/20 | | | | (2,540 | ) |
| USD | | | 70,436 | | | RUB | | | 4,526,420 | | | JPMorgan Chase Bank NA | | | 02/05/20 | | | | (2,188 | ) |
| USD | | | 11,000 | | | ZAR | | | 155,368 | | | JPMorgan Chase Bank NA | | | 02/05/20 | | | | (43 | ) |
| EUR | | | 150,000 | | | USD | | | 184,852 | | | JPMorgan Chase Bank NA | | | 02/25/20 | | | | (16,039 | ) |
| JPY | | | 19,510,000 | | | USD | | | 180,782 | | | JPMorgan Chase Bank NA | | | 03/16/20 | | | | (474 | ) |
| | | | | | | | | | | | | | | | | | | | |
| | | | | | | | | | | | | | | | | | | (28,017 | ) |
| | | | | | | | | | | | | | | | | | | | |
| Net Unrealized Appreciation | | | $ | 38,431 | |
| | | | | | | | | | | | | | | | | | | | |
Exchange-Traded Options Purchased
| | | | | | | | | | | | | | | | | | | | | | | | |
Description | | Number of
Contracts | | | Expiration
Date | | | Exercise
Price | | | Notional
Amount (000) | | | Value | |
| Call | | | | | | | | | | | | | | | | | | | |
90-day Eurodollar March 2020 Futures | | | 23 | | | | 03/13/20 | | | USD | | | 99.00 | | | USD | | | 5,750 | | | $ | 575 | |
90-day Eurodollar March 2020 Futures | | | 46 | | | | 03/13/20 | | | USD | | | 99.13 | | | USD | | | 11,500 | | | | 862 | |
| | | | | | | | | | | | | | | | | | | | | | | | |
| | | | | | | | | | | | | | | | | | | | | | $ | 1,437 | |
| | | | | | | | | | | | | | | | | | | | | | | | |
OTC Barrier Options Purchased
| | | | | | | | | | | | | | | | | | | | | | | | | | | | | | | | | | | | |
| Description | | Type of Option | | Counterparty | | Expiration
Date | | | Exercise
Price | | | | | | Barrier
Price/Range | | | | | | Notional
Amount (000) | | | Value | |
Put | | | | | | | | | | | | | | | | | | | | | | | | | | | | | | | | | | | | |
USD Currency | | One-Touch | | Bank of America NA | | | 01/06/20 | | | | TRY | | | | 5.60 | | | | TRY | | | | 5.60 | | | | USD | | | | 1 | | | $ | — | |
USD Currency | | One-Touch | | BNP Paribas SA | | | 01/10/20 | | | | TRY | | | | 5.67 | | | | TRY | | | | 5.67 | | | | USD | | | | 1 | | | | 5 | |
USD Currency | | One-Touch | | BNP Paribas SA | | | 01/10/20 | | | | TRY | | | | 5.67 | | | | TRY | | | | 5.67 | | | | USD | | | | 1 | | | | 5 | |
USD Currency | | One-Touch | | Deutsche Bank AG | | | 02/06/20 | | | | BRL | | | | 3.98 | | | | BRL | | | | 3.98 | | | | USD | | | | 1 | | | | 373 | |
USD Currency | | One-Touch | | Citibank NA | | | 02/06/20 | | | | BRL | | | | 3.98 | | | | BRL | | | | 3.98 | | | | USD | | | | 1 | | | | 373 | |
USD Currency | | One-Touch | | Bank of America NA | | | 02/07/20 | | | | RUB | | | | 62.10 | | | | RUB | | | | 62.10 | | | | USD | | | | 1 | | | | 491 | |
USD Currency | | One-Touch | | Bank of America NA | | | 02/14/20 | | | | RUB | | | | 61.10 | | | | RUB | | | | 61.10 | | | | USD | | | | 1 | | | | 224 | |
| | | | | | | | | | | | | | | | | | | | | | | | | | | | | | | | | | | | |
| | | | | | | | | | | | | | | | | | | | | | | | | | | | | | | | | | $ | 1,471 | |
| | | | | | | | | | | | | | | | | | | | | | | | | | | | | | | | | | | | |
| | |
| 122 | | 2019 BLACKROCK ANNUAL REPORTTO SHAREHOLDERS |
| | |
Schedule of Investments (continued) December 31, 2019 | | BlackRock U.S. Government Bond Portfolio |
OTC Currency Options Purchased
| | | | | | | | | | | | | | | | | | | | | | | | | | |
| Description | | Counterparty | | Expiration
Date | | | Exercise
Price | | | Notional
Amount (000) | | | Value | |
| Call | | | | | | | | | | | | | | | | | | | | |
USD Currency | | Deutsche Bank AG | | | 01/09/20 | | | | ZAR | | | | 15.30 | | | | USD | | | | 7 | | | $ | — | |
USD Currency | | Bank of America NA | | | 01/21/20 | | | | TWD | | | | 30.60 | | | | USD | | | | 14 | | | | 1 | |
USD Currency | | Bank of America NA | | | 03/24/20 | | | | ZAR | | | | 15.50 | | | | USD | | | | 22 | | | | 101 | |
USD Currency | | Citibank NA | | | 03/24/20 | | | | ZAR | | | | 17.00 | | | | USD | | | | 11 | | | | 5 | |
USD Currency | | Deutsche Bank AG | | | 03/31/20 | | | | ZAR | | | | 14.65 | | | | USD | | | | 11 | | | | 157 | |
USD Currency | | Citibank NA | | | 04/08/20 | | | | ZAR | | | | 15.60 | | | | USD | | | | 21 | | | | 115 | |
| | | | | | | | | | | | | | | | | | | | | | | | | | |
| | | | | | | | | | | | | | | | | | | | | | | | | 379 | |
| | | | | | | | | | | | | | | | | | | | | | | | | | |
| Put | | | | | | | | | | | | | | | | | | | | |
USD Currency | | Deutsche Bank AG | | | 01/14/20 | | | | KRW | | | | 1,178.00 | | | | USD | | | | 14 | | | | 290 | |
USD Currency | | Deutsche Bank AG | | | 01/17/20 | | | | BRL | | | | 3.96 | | | | USD | | | | 9 | | | | 18 | |
USD Currency | | Morgan Stanley &Co. International plc | | | 01/17/20 | | | | BRL | | | | 4.10 | | | | USD | | | | 11 | | | | 225 | |
USD Currency | | Citibank NA | | | 02/06/20 | | | | BRL | | | | 4.14 | | | | USD | | | | 13 | | | | 416 | |
USD Currency | | Credit Suisse International | | | 02/06/20 | | | | BRL | | | | 4.18 | | | | USD | | | | 11 | | | | 445 | |
USD Currency | | Deutsche Bank AG | | | 02/14/20 | | | | BRL | | | | 4.10 | | | | USD | | | | 21 | | | | 524 | |
USD Currency | | Citibank NA | | | 02/19/20 | | | | BRL | | | | 4.16 | | | | USD | | | | 7 | | | | 262 | |
USD Currency | | Bank of America NA | | | 03/06/20 | | | | RUB | | | | 64.30 | | | | USD | | | | 13 | | | | 429 | |
USD Currency | | Citibank NA | | | 03/06/20 | | | | BRL | | | | 4.14 | | | | USD | | | | 13 | | | | 448 | |
USD Currency | | Deutsche Bank AG | | | 04/02/20 | | | | JPY | | | | 107.00 | | | | USD | | | | 42 | | | | 319 | |
USD Currency | | Citibank NA | | | 05/01/20 | | | | JPY | | | | 107.00 | | | | USD | | | | 14 | | | | 140 | |
| | | | | | | | | | | | | | | | | | | | | | | | | | |
| | | | | | | | | | | | | | | | | | | | | | | | | 3,516 | |
| | | | | | | | | | | | | | | | | | | | | | | | | | |
| | | | | | | | | | | | | | | | | | | | | | | | $ | 3,895 | |
| | | | | | | | | | | | | | | | | | | | | | | | | | |
OTC Interest Rate Swaptions Purchased
| | | | | | | | | | | | | | | | | | | | | | | | | | | | | | | | | | |
| | | Paid by the Fund | | Received by the Fund | | | | | | | | | | | | | | |
| Description | | Rate | | | Frequency | | Rate | | | Frequency | | Counterparty | | Expiration
Date | | | Exercise
Rate | | | Notional
Amount (000) | | | Value | |
Call | | | | | | | | | | | | | | | | | | | | | | | | | | | | | | | | | | |
10-Year Interest Rate Swap | |
| 3 month
LIBOR |
| | Quarterly | | | 1.71% | | | Semi-Annual | | Citibank NA | | | 06/03/20 | | | | 1.71 | % | | | USD | | | | 210 | | | $ | 1,690 | |
| | | | | | | | | | | | | | | | | | | | | | | | | | | | | | | | | | |
| Put | | | | | | | | | | | | | | | | | | | | | | | | | | | |
2-Year Interest Rate Swap | | | 2.00% | | | Semi-Annual | | | 3 month LIBOR | | | Quarterly | | JPMorgan Chase Bank NA Morgan Stanley & Co. | | | 01/22/20 | | | | 2.00 | % | | | USD | | | | 4,400 | | | | 2 | |
10-Year Interest Rate Swap | | | 2.00% | | | Semi-Annual | | | 3 month LIBOR | | | Quarterly | | International plc | | | 01/29/20 | | | | 2.00 | % | | | USD | | | | 603 | | | | 1,888 | |
5-Year Interest Rate Swap | | | 2.72% | | | Semi-Annual | | | 3 month LIBOR | | | Quarterly | | Barclays Bank plc | | | 02/03/20 | | | | 2.72 | % | | | USD | | | | 650 | | | | — | |
10-Year Interest Rate Swap | | | 3.20% | | | Semi-Annual | | | 3 month LIBOR | | | Quarterly | | Citibank NA | | | 02/20/20 | | | | 3.20 | % | | | USD | | | | 1,600 | | | | 2 | |
10-Year Interest Rate Swap | | | 2.30% | | | Semi-Annual | | | 3 month LIBOR | | | Quarterly | | Bank of America NA | | | 03/30/20 | | | | 2.30 | % | | | USD | | | | 90 | | | | 161 | |
10-Year Interest Rate Swap | | | 2.30% | | | Semi-Annual | | | 3 month LIBOR | | | Quarterly | | Citibank NA | | | 03/30/20 | | | | 2.30 | % | | | USD | | | | 269 | | | | 481 | |
10-Year Interest Rate Swap | | | 1.71% | | | Semi-Annual | | | 3 month LIBOR | | | Quarterly | | Citibank NA | | | 06/03/20 | | | | 1.71 | % | | | USD | | | | 210 | | | | 5,617 | |
10-Year Interest Rate Swap | | | 2.11% | | | Semi-Annual | | | 3 month LIBOR | | | Quarterly | | Citibank NA | | | 08/17/20 | | | | 2.11 | % | | | USD | | | | 1,800 | | | | 19,901 | |
| | | | | | | | | | | | | | | | | | | | | | | | | | | | | | | | | | |
| | | | | | | | | | | | | | | | | | | | | | | | | | | | | | | | | 28,052 | |
| | | | | | | | | | | | | | | | | | | | | | | | | | | | | | | | | | |
| | | | | | | | | | | | | | | | | | | | | | | | | | | $ 29,742 | |
| | | | | | | | | | | | | | | | | | | | | | | | | | | | | | | | | | |
Exchange-Traded Options Written
| | | | | | | | | | | | | | | | | | | | | | | | |
| Description | | Number of
Contracts | | | Expiration
Date | | | Exercise
Price | | | Notional
Amount (000) | | | Value | |
| Call | | | | | | | | | | | | | | | | | | | |
90-day Eurodollar March 2020 Futures | | | 23 | | | | 03/13/20 | | | USD | | | 98.88 | | | USD | | | 5,750 | | | $ | (719 | ) |
90-day Eurodollar March 2020 Futures | | | 46 | | | | 03/13/20 | | | USD | | | 99.00 | | | USD | | | 11,500 | | | | (863 | ) |
| | | | | | | | | | | | | | | | | | | | | | | | |
| | | | | | | | | | | | | | | | | | | | | | $ | (1,582 | ) |
| | | | | | | | | | | | | | | | | | | | | | | | |
| | | | |
| SCHEDULES OF INVESTMENTS | | | 123 | |
| | |
Schedule of Investments (continued) December 31, 2019 | | BlackRock U.S. Government Bond Portfolio |
OTC Currency Options Written
| | | | | | | | | | | | | | | | | | | | | | | | |
| Description | | Counterparty | | Expiration
Date | | Exercise
Price | | | Notional
Amount (000) | | | Value | |
Call | | | | | | | | | | | | | | | | | | | | | | | | |
USD Currency | | Citibank NA | | 01/09/20 | | | ZAR | | | | 15.30 | | | | USD | | | | 7 | | | $ | — | |
USD Currency | | Morgan Stanley &Co. International plc | | 01/17/20 | | | BRL | | | | 4.35 | | | | USD | | | | 4 | | | | — | |
USD Currency | | Citibank NA | | 01/20/20 | | | RUB | | | | 62.60 | | | | USD | | | | 10 | | | | (43 | ) |
USD Currency | | Citibank NA | | 02/05/20 | | | JPY | | | | 109.00 | | | | USD | | | | 4 | | | | (17 | ) |
USD Currency | | Credit Suisse International | | 02/06/20 | | | BRL | | | | 4.35 | | | | USD | | | | 6 | | | | (3 | ) |
EUR Currency | | Bank of America NA | | 02/14/20 | | | CNH | | | | 7.85 | | | | EUR | | | | 10 | | | | (79 | ) |
USD Currency | | Citibank NA | | 02/19/20 | | | BRL | | | | 4.35 | | | | USD | | | | 4 | | | | (5 | ) |
USD Currency | | Bank of America NA | | 03/24/20 | | | ZAR | | | | 17.00 | | | | USD | | | | 22 | | | | (11 | ) |
USD Currency | | Deutsche Bank AG | | 03/31/20 | | | ZAR | | | | 15.35 | | | | USD | | | | 21 | | | | (135 | ) |
USD Currency | | Citibank NA | | 04/08/20 | | | ZAR | | | | 17.00 | | | | USD | | | | 21 | | | | (19 | ) |
| | | | | | | | | | | | | | | | | | | | | | | | |
| | | | | | | | | | | | | | | | | | | | | | | (312 | ) |
| | | | | | | | | | | | | | | | | | | | | | | | |
Put | | | | | | | | | | | | | | | | | | | | | | | | |
USD Currency | | Citibank NA | | 01/09/20 | | | ZAR | | | | 14.45 | | | | USD | | | | 7 | | | | (221 | ) |
USD Currency | | Morgan Stanley &Co. International plc | | 01/17/20 | | | BRL | | | | 3.99 | | | | USD | | | | 9 | | | | (34 | ) |
USD Currency | | Citibank NA | | 02/05/20 | | | JPY | | | | 108.00 | | | | USD | | | | 4 | | | | (20 | ) |
USD Currency | | Credit Suisse International | | 02/06/20 | | | BRL | | | | 4.06 | | | | USD | | | | 17 | | | | (296 | ) |
USD Currency | | Citibank NA | | 02/06/20 | | | BRL | | | | 3.98 | | | | USD | | | | 19 | | | | (142 | ) |
USD Currency | | Deutsche Bank AG | | 02/14/20 | | | BRL | | | | 3.98 | | | | USD | | | | 27 | | | | (225 | ) |
USD Currency | | Citibank NA | | 03/06/20 | | | BRL | | | | 3.98 | | | | USD | | | | 19 | | | | (207 | ) |
USD Currency | | Bank of America NA | | 03/06/20 | | | RUB | | | | 62.50 | | | | USD | | | | 19 | | | | (244 | ) |
USD Currency | | Citibank NA | | 05/01/20 | | | JPY | | | | 104.00 | | | | USD | | | | 14 | | | | (59 | ) |
| | | | | | | | | | | | | | | | | | | | | | | | |
| | | | | | | | | | | | | | | | | | | | | | | (1,448 | ) |
| | | | | | | | | | | | | | | | | | | | | | | | |
| | | | | | | | | | | | | | | | | | | | | | $ | (1,760) | |
| | | | | | | | | | | | | | | | | | | | | | | | |
OTC Interest Rate Swaptions Written
| | | | | | | | | | | | | | | | | | | | | | | | | | | | | | | | | | |
| | | Paid by the Fund | | Received by the Fund | | | | | | | Exercise
Rate | | | | | | | | | | |
| Description | | Rate | | | Frequency | | Rate | | | Frequency | | Counterparty | | Expiration
Date | | | Notional
Amount (000) | | | Value | |
Call | | | | | | | | | | | | | | | | | | | | | | | | | | | | | | | | | | |
10-Year Interest Rate Swap | |
| 3 month
LIBOR |
| | Quarterly | | | 1.45% | | | Semi-Annual | | Deutsche Bank AG | | | 01/16/20 | | | | 1.45 | % | | | USD | | | | 800 | | | $ | (8 | ) |
10-Year Interest Rate Swap | |
| 3 month
LIBOR |
| | Quarterly | | | 1.66% | | | Semi-Annual | | Citibank NA | | | 03/12/20 | | | | 1.66 | % | | | USD | | | | 1,400 | | | | (4,755 | ) |
2-Year Interest Rate Swap | |
| 3 month
LIBOR |
| | Quarterly | | | 1.89% | | | Semi-Annual | | Citibank NA | | | 05/01/20 | | | | 1.89 | % | | | USD | | | | 4,000 | | | | (21,590 | ) |
| | | | | | | | | | | | | | | | | | | | | | | | | | | | | | | | | | |
| | | | | | | | | | | | | | | | | | | | | | | | | | | | | | | | | (26,353 | ) |
| | | | | | | | | | | | | | | | | | | | | | | | | | | | | | | | | | |
| Put | | | | | | | | | | | | | | | | | | | | | | | | | | | |
2-Year Interest Rate Swap | | | 1.86% | | | Semi-Annual | | | 3 month LIBOR | | | Quarterly | | Morgan Stanley & Co. International plc | | | 01/29/20 | | | | 1.86 | % | | | USD | | | | 3,017 | | | | (152 | ) |
| | | | | | | | | | | | | | | | | | | | | | | | | | | | | | | | | | |
| | | | | | | | | | | | | | | | | | | | | | | | | | | | | | | | $ | (26,505 | ) |
| | | | | | | | | | | | | | | | | | | | | | | | | | | | | | | | | | |
Centrally Cleared Interest Rate Swaps
| | | | | | | | | | | | | | | | | | | | | | | | | | | | | | | | |
Paid by the Fund | | Received by the Fund | | | | | | | | | | | | | | | | | | | | |
| Rate | | Frequency | | Rate | | Frequency | | Effective
Date | | | Termination
Date | | | Notional
Amount (000) | | | Value | | | Upfront
Premium
Paid
(Received) | | | Unrealized
Appreciation
(Depreciation) | |
| 3 month LIBOR | | Quarterly | | 1.37% | | Semi-Annual | | | N/A | | | | 11/30/20 | | | USD | | | 470 | | | $ | (1,969 | ) | | $ | (1,366 | ) | | $ | (603 | ) |
| 1.37% | | Semi-Annual | | 3 month LIBOR | | Quarterly | | | N/A | | | | 11/30/20 | | | USD | | | 1,400 | | | | 5,865 | | | | — | | | | 5,865 | |
| 28 day MXIBTIIE | | Monthly | | 6.88% | | Monthly | | | N/A | | | | 12/15/20 | | | MXN | | | 1,010 | | | | (87 | ) | | | — | | | | (87 | ) |
| 28 day MXIBTIIE | | Monthly | | 6.88% | | Monthly | | | N/A | | | | 12/16/20 | | | MXN | | | 1,955 | | | | (170 | ) | | | — | | | | (170 | ) |
| 3 month LIBOR | | Quarterly | | 2.38% | | Semi-Annual | | | N/A | | | | 05/03/21 | | | USD | | | 1,360 | | | | 12,712 | | | | — | | | | 12,712 | |
| 6.86% | | Monthly | | 28 day MXIBTIIE | | Monthly | | | 07/24/20 | (a) | | | 07/23/21 | | | MXN | | | 249 | | | | (47 | ) | | | — | | | | (47 | ) |
| 6.90% | | Monthly | | 28 day MXIBTIIE | | Monthly | | | 07/27/20 | (a) | | | 07/26/21 | | | MXN | | | 347 | | | | (73 | ) | | | — | | | | (73 | ) |
| 6.78% | | Monthly | | 28 day MXIBTIIE | | Monthly | | | 08/07/20 | (a) | | | 08/06/21 | | | MXN | | | 1,098 | | | | (174 | ) | | | — | | | | (174 | ) |
| | |
| 124 | | 2019 BLACKROCK ANNUAL REPORTTO SHAREHOLDERS |
| | |
Schedule of Investments (continued) December 31, 2019 | | BlackRock U.S. Government Bond Portfolio |
Centrally Cleared Interest Rate Swaps (continued)
| | | | | | | | | | | | | | | | | | | | | | | | | | | | | | | | | | |
Paid by the Fund | | Received by the Fund | | | | | | | | | | | | | | | | | | | | | |
| Rate | | Frequency | | Rate | | Frequency | | Effective
Date | | | Termination
Date | | | Notional
Amount (000) | | | Value | | | Upfront
Premium
Paid
(Received) | | | Unrealized
Appreciation
(Depreciation) | |
| 3 month BA | | Semi-Annual | | 1.94% | | Semi-Annual | | | N/A | | | | 12/06/21 | | | | CAD | | | | 1,045 | | | $ | (691 | ) | | $ | — | | | $ | (691 | ) |
| 28 day MXIBTIIE | | Monthly | | 6.52% | | Monthly | | | N/A | | | | 12/14/21 | | | | MXN | | | | 1,534 | | | | (286 | ) | | | — | | | | (286 | ) |
| 28 day MXIBTIIE | | Monthly | | 6.51% | | Monthly | | | N/A | | | | 12/15/21 | | | | MXN | | | | 1,307 | | | | (252 | ) | | | — | | | | (252 | ) |
| 3 month BA | | Semi-Annual | | 2.02% | | Semi-Annual | | | N/A | | | | 12/17/21 | | | | CAD | | | | 1,060 | | | | 460 | | | | — | | | | 460 | |
| 7.23% | | Monthly | | 28 day MXIBTIIE | | Monthly | | | N/A | | | | 07/18/22 | | | | MXN | | | | 273 | | | | (207 | ) | | | — | | | | (207 | ) |
| 7.23% | | Monthly | | 28 day MXIBTIIE | | Monthly | | | N/A | | | | 07/19/22 | | | | MXN | | | | 136 | | | | (104 | ) | | | — | | | | (104 | ) |
| 7.22% | | Monthly | | 28 day MXIBTIIE | | Monthly | | | N/A | | | | 07/20/22 | | | | MXN | | | | 52 | | | | (39 | ) | | | — | | | | (39 | ) |
| 7.21% | | Monthly | | 28 day MXIBTIIE | | Monthly | | | N/A | | | | 07/25/22 | | | | MXN | | | | 73 | | | | (55 | ) | | | — | | | | (55 | ) |
| 7.20% | | Monthly | | 28 day MXIBTIIE | | Monthly | | | N/A | | | | 08/03/22 | | | | MXN | | | | 340 | | | | (256 | ) | | | — | | | | (256 | ) |
| 28 day MXIBTIIE | | Monthly | | 7.00% | | Monthly | | | N/A | | | | 08/11/22 | | | | MXN | | | | 628 | | | | 299 | | | | — | | | | 299 | |
| 7.11% | | Monthly | | 28 day MXIBTIIE | | Monthly | | | N/A | | | | 10/14/22 | | | | MXN | | | | 265 | | | | (180 | ) | | | — | | | | (180 | ) |
| 7.11% | | Monthly | | 28 day MXIBTIIE | | Monthly | | | N/A | | | | 10/14/22 | | | | MXN | | | | 350 | | | | (236 | ) | | | — | | | | (236 | ) |
| 2.50% | | Semi-Annual | | 3 month LIBOR | | Quarterly | | | N/A | | | | 01/29/23 | | | | USD | | | | 841 | | | | (26,687 | ) | | | — | | | | (26,687 | ) |
| 3 month LIBOR | | Quarterly | | 2.61% | | Semi-Annual | | | N/A | | | | 02/07/24 | | | | USD | | | | 600 | | | | 26,026 | | | | — | | | | 26,026 | |
| 2.71% | | Semi-Annual | | 3 month LIBOR | | Quarterly | | | N/A | | | | 03/18/24 | | | | USD | | | | 1,600 | | | | (76,296 | ) | | | — | | | | (76,296 | ) |
| 28 day MXIBTIIE | | Monthly | | 6.73% | | Monthly | | | N/A | | | | 08/09/24 | | | | MXN | | | | 213 | | | | 55 | | | | — | | | | 55 | |
| 28 day MXIBTIIE | | Monthly | | 6.67% | | Monthly | | | N/A | | | | 08/12/24 | | | | MXN | | | | 470 | | | | 61 | | | | — | | | | 61 | |
| 28 day MXIBTIIE | | Monthly | | 6.72% | | Monthly | | | N/A | | | | 08/13/24 | | | | MXN | | | | 404 | | | | 93 | | | | — | | | | 93 | |
| 28 day MXIBTIIE | | Monthly | | 6.59% | | Monthly | | | N/A | | | | 11/08/24 | | | | MXN | | | | 607 | | | | (35 | ) | | | — | | | | (35 | ) |
| 3 month LIBOR | | Quarterly | | 2.13% | | Semi-Annual | | | N/A | | | | 08/25/25 | | | | USD | | | | 10 | | | | 255 | | | | — | | | | 255 | |
| 3.07% | | Semi-Annual | | 3 month LIBOR | | Quarterly | | | N/A | | | | 08/31/25 | | | | USD | | | | 970 | | | | (77,630 | ) | | | — | | | | (77,630 | ) |
| 2.85% | | Semi-Annual | | 3 month LIBOR | | Quarterly | | | N/A | | | | 12/21/28 | | | | USD | | | | 200 | | | | (16,265 | ) | | | — | | | | (16,265 | ) |
| 3 month LIBOR | | Quarterly | | 1.45% | | Semi-Annual | | | N/A | | | | 08/19/29 | | | | USD | | | | 200 | | | | (7,437 | ) | | | — | | | | (7,437 | ) |
| 3 month LIBOR | | Quarterly | | 1.47% | | Semi-Annual | | | N/A | | | | 09/09/29 | | | | USD | | | | 200 | | | | (6,996 | ) | | | — | | | | (6,996 | ) |
| 1.59% | | Semi-Annual | | 3 month LIBOR | | Quarterly | | | N/A | | | | 09/12/29 | | | | USD | | | | 150 | | | | 3,588 | | | | — | | | | 3,588 | |
| 1.61% | | Semi-Annual | | 3 month LIBOR | | Quarterly | | | N/A | | | | 10/01/29 | | | | USD | | | | 400 | | | | 11,129 | | | | — | | | | 11,129 | |
| | | | | | | | | | | | | | | | | | | | | | | | | | | | | | | | | | |
| | | | | | | | | | | | | | | | | | | | | | | | $ | (155,629 | ) | | $ | (1,366 | ) | | $ | (154,263 | ) |
| | | | | | | | | | | | | | | | | | | | | | | | | | | | | | | | | | |
OTC Credit Default Swaps — Buy Protection
| | | | | | | | | | | | | | | | | | | | | | | | | | | | | | | | | | | | |
| Reference Obligation/Index | | Financing
Rate Paid
by the Fund | | | Payment
Frequency | | | Counterparty | | | Termination
Date | | | Notional
Amount (000) | | | Value | | | Upfront
Premium
Paid
(Received) | | | Unrealized
Appreciation
(Depreciation) | |
Republic of Colombia | | | 1.00 | % | | | Quarterly | | | | Citibank NA | | | | 12/20/24 | | | | USD | | | | 28 | | | $ | (379) | | | $ | (103 | ) | | $ | (276) | |
Republic of Colombia | | | 1.00 | % | | | Quarterly | | |
| Morgan Stanley & Co.
International plc |
| | | 12/20/24 | | | | USD | | | | 18 | | | | (234) | | | | (66 | ) | | | (168) | |
United Mexican States | | | 1.00 | % | | | Quarterly | | | | Citibank NA | | | | 12/20/24 | | | | USD | | | | 10 | | | | (105) | | | | 60 | | | | (165) | |
United Mexican States | | | 1.00 | % | | | Quarterly | | | | Citibank NA | | | | 12/20/24 | | | | USD | | | | 21 | | | | (222) | | | | 158 | | | | (380) | |
| | | | | | | | | | | | | | | | | | | | | | | | | | | | | | | | | | | | |
| | | | | | | | | | | | | | | | | | | | | | | | | | $ | (940 | ) | | $ | 49 | | | $ | (989) | |
| | | | | | | | | | | | | | | | | | | | | | | | | | | | | | | | | | | | |
OTC Interest Rate Swaps
| | | | | | | | | | | | | | | | | | | | | | | | | | | | | | |
| Paid by the Fund | | Received by the Fund | | Counterparty | | Termination
Date | | | Notional
Amount
(000) | | | | | Value | | | | | | Unrealized
Appreciation
(Depreciation) | |
| Rate | | Frequency | | Rate | | Frequency | | Upfront
Premium
Paid
(Received) | |
| 4.45% | | At Termination | | 1 day
BZDIOVER | | At Termination | | JPMorgan Chase Bank NA | | | 01/04/21 | | | BRL | | | 381 | | | $ | 159 | | | $ | — | | | $ | 159 | |
| 4.46% | | At Termination | | 1 day
BZDIOVER | | At Termination | | Citibank NA | | | 01/04/21 | | | BRL | | | 255 | | | | 99 | | | | — | | | | 99 | |
| | | | |
| SCHEDULES OF INVESTMENTS | | | 125 | |
| | |
Schedule of Investments (continued) December 31, 2019 | | BlackRock U.S. Government Bond Portfolio |
OTC Interest Rate Swaps (continued)
| | | | | | | | | | | | | | | | | | | | | | | | | | | | | | | | | | | | | | | | |
Paid by the Fund | | | Received by the Fund | | | | | | | | | | | | | | | | | | | | | | |
| Rate | | Frequency | | | Rate | | | Frequency | | | Counterparty | | | Termination
Date | | | | | | Notional
Amount
(000) | | | Value | | | Upfront
Premium
Paid
(Received) | | | Unrealized
Appreciation
(Depreciation) | |
| 4.49% | | | At Termination | | |
| 1 day
BZDIOVER |
| | | At Termination | | | | Citibank NA | | | | 01/04/21 | | | | BRL | | | | 375 | | | | $ 118 | | | | $ — | | | | $ 118 | |
| 1 day BZDIOVER | | | At Termination | | | | 5.32% | | | | At Termination | | | | JPMorgan Chase Bank NA | | | | 01/03/22 | | | | BRL | | | | 286 | | | | 112 | | | | — | | | | 112 | |
| 1 day BZDIOVER | | | At Termination | | | | 6.35% | | | | At Termination | | | | JPMorgan Chase Bank NA | | | | 01/02/23 | | | | BRL | | | | 200 | | | | 1,109 | | | | — | | | | 1,109 | |
| 1 day BZDIOVER | | | At Termination | | | | 8.27% | | | | At Termination | | | | JPMorgan Chase Bank NA | | | | 01/02/23 | | | | BRL | | | | 125 | | | | 3,073 | | | | — | | | | 3,073 | |
| 1 day BZDIOVER | | | At Termination | | | | 5.98% | | | | At Termination | | | | JPMorgan Chase Bank NA | | | | 01/02/25 | | | | BRL | | | | 121 | | | | (401) | | | | — | | | | (401) | |
| 1 day BZDIOVER | | | At Termination | | | | 5.99% | | | | At Termination | | | | Citibank NA | | | | 01/02/25 | | | | BRL | | | | 86 | | | | (268) | | | | — | | | | (268) | |
| 1 day BZDIOVER | | | At Termination | | | | 6.03% | | | | At Termination | | | | JPMorgan Chase Bank NA | | | | 01/02/25 | | | | BRL | | | | 86 | | | | (230) | | | | — | | | | (230) | |
| 1 day BZDIOVER | | | At Termination | | | | 6.05% | | | | At Termination | | | | Citibank NA | | | | 01/02/25 | | | | BRL | | | | 84 | | | | (205) | | | | — | | | | (205) | |
| 1 day BZDIOVER | | | At Termination | | | | 6.26% | | | | At Termination | | | | Citibank NA | | | | 01/02/25 | | | | BRL | | | | 126 | | | | (5) | | | | — | | | | (5) | |
| 28 day MXIBTIIE | | | Monthly | | | | 6.32% | | | | Monthly | | | | Goldman Sachs International | | | | 08/06/25 | | | | MXN | | | | 511 | | | | (456) | | | | — | | | | (456) | |
| 6.31% | | | Monthly | | |
| 28 day
MXIBTIIE |
| | | Monthly | | | | Deutsche Bank AG | | | | 08/11/25 | | | | MXN | | | | 640 | | | | 590 | | | | — | | | | 590 | |
| | | | | | | | | | | | | | | | | | | | | | | | | | | | | | | | | | | | | | | | |
| | | | | | | | | | | | | | | | | | | | | | | | | | | | | | | $ 3,695 | | | | $ — | | | | $ 3,695 | |
| | | | | | | | | | | | | | | | | | | | | | | | | | | | | | | | | | | | | | | | |
The following reference rates, and their values as of period end, are used for security descriptions:
| | | | |
Reference Index | | | | Reference Rate |
1 day BZDIOVER | | Overnight Brazil CETIP — Interbank Rate | | 0.02% |
28 day MXIBTIIE | | Mexico Interbank TIIE28-Day | | 7.55% |
3 month BA | | Canadian Bankers Acceptances | | 2.08% |
3 month LIBOR | | London Interbank Offered Rate | | 1.91% |
Balances Reported in the Statements of Assets and Liabilities for Centrally Cleared Swaps, OTC Swaps and Options Written
| | | | | | | | | | | | | | | | | | | | |
| | | Swap
Premiums
Paid | | | Swap Premiums
Received | | | Unrealized
Appreciation | | | Unrealized
Depreciation | | | Value | |
Centrally Cleared Swaps(a) | | $ | — | | | $ | (1,366) | | | $ | 60,543 | | | $ | (214,806) | | | $ | — | |
OTC Swaps | | | 218 | | | | (169 | ) | | | 5,260 | | | | (2,554 | ) | | | — | |
Options Written | | | N/A | | | | N/A | | | | 23,639 | | | | (10,975 | ) | | | (29,847 | ) |
| (a) | | Includes cumulative appreciation (depreciation) on centrally cleared swaps, as reported in the Schedule of Investments. Only current day’s variation margin is reported within the Statements of Assets and Liabilities and is net of any previously paid (received) swap premium amounts. |
| | |
| 126 | | 2019 BLACKROCK ANNUAL REPORTTO SHAREHOLDERS |
| | |
Schedule of Investments (continued) December 31, 2019 | | BlackRock U.S. Government Bond Portfolio |
Derivative Financial Instruments Categorized by Risk Exposure
As of period end, the fair values of derivative financial instruments located in the Statements of Assets and Liabilities were as follows:
| | | | | | | | | | | | | | | | | | | | | | | | | | | | |
| | | Commodity
Contracts | | | Credit
Contracts | | | Equity
Contracts | | | Foreign
Currency
Exchange
Contracts | | | Interest
Rate
Contracts | | | Other
Contracts | | | Total | |
Assets — Derivative Financial Instruments | | | | | | | | | | | | | | | | | | | | | | | | | |
Futures contracts | | | | | | | | | | | | | | | | | | | | | | | | | | | | |
Unrealized appreciation on futures contracts (a) | | $ | — | | | $ | — | | | $ | — | | | $ | — | | | $ | 27,324 | | | $ | — | | | $ | 27,324 | |
Forward foreign currency exchange contracts | | | | | | | | | | | | | | | | | | | | | | | | | | | | |
Unrealized appreciation on forward foreign currency exchange contracts | | | — | | | | — | | | | — | | | | 66,448 | | | | — | | | | — | | | | 66,448 | |
Options purchased | | | | | | | | | | | | | | | | | | | | | | | | | | | | |
Investments at value — unaffiliated(b) | | | — | | | | — | | | | — | | | | 5,366 | | | | 31,179 | | | | — | | | | 36,545 | |
Swaps — centrally cleared | | | | | | | | | | | | | | | | | | | | | | | | | | | | |
Unrealized appreciation on centrally cleared swaps(a) | | | — | | | | — | | | | — | | | | — | | | | 60,543 | | | | — | | | | 60,543 | |
Swaps — OTC | | | | | | | | | | | | | | | | | | | | | | | | | | | | |
Unrealized appreciation on OTC swaps; Swap premiums paid | | | — | | | | 218 | | | | — | | | | — | | | | 5,260 | | | | — | | | | 5,478 | |
| | | | |
| | $ | — | | | $ | 218 | | | $ | — | | | $ | 71,814 | | | $ | 124,306 | | | $ | — | | | $ | 196,338 | |
| | | | |
| | | | | | |
| Liabilities — Derivative Financial Instruments | | | | | | | | | | | | | | | | | | | |
Futures contracts | | | | | | | | | | | | | | | | | | | | | | | | | | | | |
Unrealized depreciation on futures contracts(a) | | | — | | | | — | | | | — | | | | — | | | | 2,964 | | | | — | | | | 2,964 | |
Forward foreign currency exchange contracts | | | | | | | | | | | | | | | | | | | | | | | | | | | | |
Unrealized depreciation on forward foreign currency exchange contracts | | | — | | | | — | | | | — | | | | 28,017 | | | | — | | | | — | | | | 28,017 | |
Options written | | | | | | | | | | | | | | | | | | | | | | | | | | | | |
Options written at value | | | — | | | | — | | | | — | | | | 1,760 | | | | 28,087 | | | | — | | | | 29,847 | |
Swaps — centrally cleared | | | | | | | | | | | | | | | | | | | | | | | | | | | | |
Unrealized depreciation on centrally cleared swaps(a) | | | — | | | | — | | | | — | | | | — | | | | 214,806 | | | | — | | | | 214,806 | |
Swaps — OTC | | | | | | | | | | | | | | | | | | | | | | | | | | | | |
Unrealized depreciation on OTC swaps; Swap premiums received | | | — | | | | 1,158 | | | | — | | | | — | | | | 1,565 | | | | — | | | | 2,723 | |
| | | | |
| | $ | — | | | $ | 1,158 | | | $ | — | | | $ | 29,777 | | | $ | 247,422 | | | $ | — | | | $ | 278,357 | |
| | | | |
| (a) | | Net cumulative unrealized appreciation (depreciation) on futures contracts and centrally cleared swaps, if any,are reported in the Schedule of Investments.In the Statements of Assets and Liabilities, only current day’s variation margin is reported in receivables or payables and the net cumulative unrealized appreciation (depreciation) is included in accumulated earnings (loss). |
| (b) | | Includes options purchased at value as reported in the Schedule of Investments. |
For the year ended December 31, 2019, the effect of derivative financial instruments in the Statements of Operations was as follows:
| | | | | | | | | | | | | | | | | | | | | | | | | | | | |
| | | Commodity
Contracts | | | Credit
Contracts | | | Equity
Contracts | | | Foreign
Currency
Exchange
Contracts | | | Interest
Rate
Contracts | | | Other
Contracts | | | Total | |
Net Realized Gain (Loss) from: | | | | | | | | | | | | | | | | | | | | | | | | | | | | |
Futures contracts | | $ | — | | | $ | — | | | $ | — | | | $ | — | | | $ | 86,608 | | | $ | — | | | $ | 86,608 | |
Forward foreign currency exchange contracts | | | — | | | | — | | | | — | | | | (27,677 | ) | | | — | | | | — | | | | (27,677 | ) |
Options purchased(a) | | | — | | | | — | | | | — | | | | (29,471 | ) | | | (8,201 | ) | | | — | | | | (37,672 | ) |
Options written | | | — | | | | — | | | | — | | | | 8,643 | | | | 69,393 | | | | — | | | | 78,036 | |
Swaps | | | — | | | | (5,910 | ) | | | — | | | | — | | | | (128,057 | ) | | | (25,126 | ) | | | (159,093 | ) |
| | | | |
| | $ | — | | | $ | (5,910 | ) | | $ | — | | | $ | (48,505 | ) | | $ | 19,743 | | | $ | (25,126 | ) | | $ | (59,798 | ) |
| | | | |
| | | | | | | |
| Net Change in Unrealized Appreciation | | | | | | | | | | | | | | | | | | | | | |
(Depreciation) on: | | | | | | | | | | | | | | | | | | | | | | | | | | | | |
Futures contracts | | | — | | | | — | | | | — | | | | — | | | | (60,259 | ) | | | — | | | | (60,259 | ) |
Forward foreign currency exchange contracts | | | — | | | | — | | | | — | | | | 1,160 | | | | — | | | | — | | | | 1,160 | |
Options purchased(b) | | | — | | | | — | | | | — | | | | 1,501 | | | | (75,175 | ) | | | — | | | | (73,674 | ) |
Options written | | | — | | | | — | | | | — | | | | (487 | ) | | | 79,350 | | | | — | | | | 78,863 | |
Swaps | | | — | | | | (3,765 | ) | | | — | | | | — | | | | (82,279 | ) | | | (891 | ) | | | (86,935 | ) |
| | | | |
| | $ | — | | | $ | (3,765 | ) | | $ | — | | | $ | 2,174 | | | $ | (138,363 | ) | | $ | (891 | ) | | $ | (140,845 | ) |
| | | | |
(a) Options purchased are included in net realized gain (loss) from investments — unaffiliated.
(b) Options purchased are included in net change in unrealized appreciation (depreciation) on investments — unaffiliated.
| | | | |
| SCHEDULES OF INVESTMENTS | | | 127 | |
| | |
Schedule of Investments (continued) December 31, 2019 | | BlackRock U.S. Government Bond Portfolio |
Average Quarterly Balances of Outstanding Derivative Financial Instruments
| | | | |
Futures contracts: | | | | |
Average notional value of contracts — long | | $ | 18,914,586 | |
Average notional value of contracts — short | | | 4,654,753 | |
Forward foreign currency exchange contracts: | | | | |
Average amounts purchased — in USD | | | 1,670,555 | |
Average amounts sold — in USD | | | 1,563,757 | |
Options: | | | | |
Average value of option contracts purchased | | | 6,841 | |
Average value of option contracts written | | | 14,265 | |
Average notional value of swaption contracts purchased | | | 6,214,750 | |
Average notional value of swaption contracts written | | | 7,904,250 | |
Credit default swaps: | | | | |
Average notional value — buy protection | | | 99,162 | |
Interest rate swaps: | | | | |
Average notional value — pays fixed rate | | | 8,190,437 | |
Average notional value — receives fixed rate | | | 6,480,579 | |
Inflation swaps: | | | | |
Average notional value — pays fixed rate | | | 1,304,341 | |
Average notional value — receives fixed rate | | | 1,227,763 | |
For more information about the Fund’s investment risks regarding derivative financial instruments, refer to the Notes to Financial Statements.
Derivative Financial Instruments — Offsetting as of Period End
The Fund’s derivative assets and liabilities (by type) were as follows:
| | | | | | | | |
| | | Assets | | | Liabilities | |
Derivative Financial Instruments: | | | | | | | | |
Futures contracts | | $ | 9,293 | | | $ | 1,599 | |
Forward foreign currency exchange contracts | | | 66,448 | | | | 28,017 | |
Options(a) | | | 36,545 | | | | 29,847 | |
Swaps — Centrally cleared | | | 5,995 | | | | — | |
Swaps — OTC(b) | | | 5,478 | | | | 2,723 | |
| | | | |
Total derivative assets and liabilities in the Statements of Assets and Liabilities | | $ | 123,759 | | | $ | 62,186 | |
Derivatives not subject to a Master Netting Agreement or similar agreement (“MNA”) | | | (16,725 | ) | | | (3,181 | ) |
| | | | |
Total derivative assets and liabilities subject to an MNA | | $ | 107,034 | | | $ | 59,005 | |
| | | | |
| (a) | Includes options purchased at value which is included in Investments at value –unaffiliated in the Statements of Assets and Liabilities and reported in the Schedule of Investments. |
| (b) | Includes unrealized appreciation (depreciation) on OTC swaps and swap premiums paid/received in the Statements of Assets and Liabilities. |
The following tables present the Fund’s derivative assets and liabilities by counterparty net of amounts available for offset under an MNA and net of the related collateral received and pledged by the Fund:
| | | | | | | | | | | | | | | | | | | | |
| Counterparty | | Derivative
Assets
Subject to
an MNA by
Counterparty | | | Derivatives
Available
for Offset (a) | | | Non-cash
Collateral
Received | | | Cash
Collateral
Received | | | Net Amount
of Derivative
Assets (b) | |
Bank of America NA | | $ | 10,689 | | | $ | (627 | ) | | $ | — | | | $ | — | | | $ | 10,062 | |
BNP Paribas SA | | | 931 | | | | (410 | ) | | | — | | | | — | | | | 521 | |
Citibank NA | | | 34,973 | | | | (29,508 | ) | | | — | | | | — | | | | 5,465 | |
Credit Suisse International | | | 747 | | | | (747 | ) | | | — | | | | — | | | | — | |
Deutsche Bank AG | | | 33,634 | | | | (856 | ) | | | — | | | | — | | | | 32,778 | |
HSBC Bank plc | | | 15,274 | | | | (2,540 | ) | | | — | | | | — | | | | 12,734 | |
JPMorgan Chase Bank NA | | | 6,514 | | | | (6,514 | ) | | | — | | | | — | | | | — | |
Morgan Stanley & Co. International plc | | | 2,279 | | | | (2,279 | ) | | | — | | | | — | | | | — | |
Natwest Markets plc | | | 547 | | | | — | | | | — | | | | — | | | | 547 | |
UBS AG | | | 1,446 | | | | — | | | | — | | | | — | | | | 1,446 | |
| | | | | | | | | | | | | | | | | | | | |
| | $ | 107,034 | | | $ | (43,481 | ) | | $ | — | | | $ | — | | | $ | 63,553 | |
| | | | | | | | | | | | | | | | | | | | |
| | |
| 128 | | 2019 BLACKROCK ANNUAL REPORTTO SHAREHOLDERS |
| | |
Schedule of Investments (continued) December 31, 2019 | | BlackRock U.S. Government Bond Portfolio |
| | | | | | | | | | | | | | | | | | | | |
| Counterparty | | Derivative
Liabilities
Subject to
an MNA by
Counterparty | | | Derivatives
Available
for Offset (a) | | | Non-cash
Collateral
Pledged | | | Cash
Collateral
Pledged | | | Net Amount of
Derivative
Liabilities (c) | |
Bank of America NA | | $ | 627 | | | $ | (627 | ) | | $ | — | | | $ | — | | | $ | — | |
BNP Paribas SA | | | 410 | | | | (410 | ) | | | — | | | | — | | | | — | |
Citibank NA | | | 29,508 | | | | (29,508 | ) | | | — | | | | — | | | | — | |
Credit Suisse International | | | 2,724 | | �� | | (747 | ) | | | — | | | | — | | | | 1,977 | |
Deutsche Bank AG | | | 856 | | | | (856 | ) | | | — | | | | — | | | | — | |
Goldman Sachs International | | | 456 | | | | — | | | | — | | | | — | | | | 456 | |
HSBC Bank plc | | | 2,540 | | | | (2,540 | ) | | | — | | | | — | | | | — | |
JPMorgan Chase Bank NA | | | 19,399 | | | | (6,514 | ) | | | — | | | | — | | | | 12,885 | |
Morgan Stanley & Co. International plc | | | 2,485 | | | | (2,279 | ) | | | — | | | | — | | | | 206 | |
| | | | | | | | | | | | | | | | | | | | |
| | $ | 59,005 | | | $ | (43,481 | ) | | $ | — | | | $ | — | | | $ | 15,524 | |
| | | | | | | | | | | | | | | | | | | | |
| (a) | The amount of derivatives available for offset is limited to the amount of derivative assets and/or liabilities that are subject to an MNA. |
| (b) | Net amount represents the net amount receivable from the counterparty in the event of default. |
| (c) | Net amount represents the net amount payable due to the counterparty in the event of default. |
Fair Value Hierarchy as of Period End
Various inputs are used in determining the fair value of investments and derivative financial instruments. For information about the Fund’s policy regarding valuation of investments and derivative financial instruments, refer to the Notes to Financial Statements.
The following tables summarize the Fund’s investments and derivative financial instruments categorized in the disclosure hierarchy:
| | | | | | | | | | | | | | | | |
| | | Level 1 | | | Level 2 | | | Level 3 | | | Total | |
Assets: | | | | | | | | | | | | | | | | |
Investments: | | | | | | | | | | | | | | | | |
Long-Term Investments(a) | | $ | — | | | $ | 69,514,556 | | | $ | — | | | $ | 69,514,556 | |
Short-Term Securities: | | | | | | | | | | | | | | | | |
Foreign Government Obligations(a) | | | — | | | | 1,110,264 | | | | — | | | | 1,110,264 | |
Money Market Funds | | | 1,252,378 | | | | — | | | | — | | | | 1,252,378 | |
U.S. Government Sponsored Agency Securities | | | — | | | | 6,987,882 | | | | — | | | | 6,987,882 | |
Options Purchased: | | | | | | | | | | | | | | | | |
Foreign currency exchange contracts | | | — | | | | 5,366 | | | | — | | | | 5,366 | |
Interest rate contracts | | | 1,437 | | | | 29,742 | | | | — | | | | 31,179 | |
Liabilities: | | | | | | | | | | | | | | | | |
Investments: | | | | | | | | | | | | | | | | |
TBA Sale Commitments | | | — | | | | (4,424,928 | ) | | | — | | | | (4,424,928 | ) |
| | | | | | | | | | | | | | | | |
| | $ | 1,253,815 | | | $ | 73,222,882 | | | $ | — | | | $ | 74,476,697 | |
| | | | | | | | | | | | | | | | |
Derivative Financial Instruments(b) | | | | | | | | | | | | | | | | |
Assets: | | | | | | | | | | | | | | | | |
Foreign currency exchange contracts | | $ | — | | | $ | 66,448 | | | $ | — | | | $ | 66,448 | |
Interest rate contracts | | | 27,324 | | | | 65,803 | | | | — | | | | 93,127 | |
Liabilities: | | | | | | | | | | | | | | | | |
Credit contracts | | | — | | | | (989 | ) | | | — | | | | (989 | ) |
Foreign currency exchange contracts | | | — | | | | (29,777 | ) | | | — | | | | (29,777 | ) |
Interest rate contracts | | | (4,546 | ) | | | (242,876 | ) | | | — | | | | (247,422 | ) |
| | | | | | | | | | | | | | | | |
| | $ | 22,778 | | | $ | (141,391 | ) | | $ | — | | | $ | (118,613 | ) |
| | | | | | | | | | | | | | | | |
| (a) | See above Schedule of Investments for values in each security type or country. |
| (b) | Derivative financial instruments are swaps, futures contracts, forward foreign currency exchange contracts and options written. Swaps, futures contracts and forward foreign currency exchange contracts are valued at the unrealized appreciation (depreciation) on the instrument and options written are shown at value. |
The Fund may hold assets and/or liabilities in which the fair value approximates the carrying amount or face value, including accrued interest, for financial statement purposes. As of period end, Reverse Repurchase Agreements of $15,074,824 are categorized as Level 2 within the disclosure hierarchy.
See notes to financial statements.
| | | | |
| SCHEDULES OF INVESTMENTS | | | 129 | |
Statements of Assets and Liabilities
December 31, 2019
| | | | | | | | | | | | | | | | |
| | | BlackRock
Advantage
Large Cap Core
Portfolio | | | BlackRock
Balanced
Capital Portfolio | | | BlackRock
Capital
Appreciation
Portfolio | | | BlackRock
Global
Allocation
Portfolio (a) | |
| | | | |
ASSETS | | | | | | | | | | | | | | | | |
Investments at value — unaffiliated(b)(c) | | $ | 187,395,490 | | | $ | 537,657,324 | | | $ | 195,836,799 | | | $ | 188,339,687 | |
Investments at value — affiliated(d) | | | 9,428,270 | | | | 26,100,099 | | | | 4,943,190 | | | | 4,286,006 | |
Cash | | | — | | | | — | | | | 31 | | | | 505,541 | |
Cash pledged: | | | | | | | | | | | | | | | | |
Futures contracts | | | 70,000 | | | | 382,000 | | | | — | | | | 179,000 | |
Centrally cleared swaps | | | — | | | | 99,182 | | | | — | | | | 160,000 | |
Foreign currency at value(e) | | | — | | | | 1,070,198 | | | | 5 | | | | 26,827 | |
Receivables: | | | | | | | | | | | | | | | | |
Investments sold | | | — | | | | 16,608,404 | | | | — | | | | 1,187,689 | |
Securities lending income — affiliated | | | 2,464 | | | | 3,875 | | | | 1,119 | | | | 925 | |
TBA sale commitments | | | — | | | | 7,040,284 | | | | — | | | | — | |
Capital shares sold | | | — | | | | 242 | | | | 90 | | | | — | |
Dividends — affiliated | | | 2,007 | | | | 14,720 | | | | 1,332 | | | | 888 | |
Dividends — unaffiliated | | | 220,297 | | | | 383,852 | | | | 48,846 | | | | 140,779 | |
Interest — unaffiliated | | | — | | | | 1,195,575 | | | | — | | | | 289,660 | |
From the Manager | | | — | | | | — | | | | 1,608 | | | | 316 | |
Variation margin on futures contracts | | | 4,065 | | | | 62,580 | | | | — | | | | 33,800 | |
Variation margin on centrally cleared swaps | | | — | | | | 13 | | | | — | | | | 10,314 | |
Swap premiums paid | | | — | | | | 56,195 | | | | — | | | | — | |
Unrealized appreciation on: | | | | | | | | | | | | | | | | |
Forward foreign currency exchange contracts | | | — | | | | 229,162 | | | | — | | | | 576,675 | |
OTC swaps | | | — | | | | 42,870 | | | | — | | | | 23,419 | |
Prepaid expenses | | | 1,780 | | | | 4,870 | | | | 1,821 | | | | 1,832 | |
Other assets | | | — | | | | 2,845 | | | | — | | | | — | |
| | | | |
Total assets | | | 197,124,373 | | | | 590,954,290 | | | | 200,834,841 | | | | 195,763,358 | |
| | | | |
| | | | |
LIABILITIES | | | | | | | | | | | | | | | | |
Investments sold short, at value(f) | | | — | | | | — | | | | — | | | | 391,172 | |
Borrowed bonds at value(g) | | | — | | | | 2,849,605 | | | | — | | | | — | |
Cash collateral on securities loaned at value | | | 7,956,954 | | | | 15,393,766 | | | | 4,711,900 | | | | 2,541,311 | |
Options written at value(h) | | | — | | | | 17,756 | | | | — | | | | 350,997 | |
TBA sale commitments at value(i) | | | — | | | | 7,040,983 | | | | — | | | | — | |
Reverse repurchase agreements at value | | | — | | | | 997,548 | | | | — | | | | — | |
Payables: | | | | | | | | | | | | | | | | |
Investments purchased | | | — | | | | 63,233,570 | | | | — | | | | 5,958,022 | |
Swaps | | | — | | | | — | | | | — | | | | 1,709 | |
Accounting services fees | | | 13,227 | | | | 29,411 | | | | 13,280 | | | | 29,510 | |
Capital shares redeemed | | | 3,675 | | | | 6,825 | | | | 5,826 | | | | 71,032 | |
Custodian fees | | | 18,863 | | | | 47,573 | | | | 4,325 | | | | 149,533 | |
Deferred foreign capital gain tax | | | — | | | | — | | | | — | | | | 46,140 | |
Interest expense | | | — | | | | 11,258 | | | | — | | | | — | |
Investment advisory fees | | | 58,507 | | | | 155,302 | | | | 60,581 | | | | 47,773 | |
Directors’ and Officer’s fees | | | 596 | | | | 243 | | | | 628 | | | | 604 | |
Other affiliates | | | 1,103 | | | | 3,000 | | | | 1,128 | | | | 1,131 | |
Printing fees | | | 27,312 | | | | 14,875 | | | | 12,807 | | | | 12,352 | |
Professional fees | | | 35,627 | | | | 41,683 | | | | 22,911 | | | | 61,721 | |
Transfer agent fees | | | 60,658 | | | | 168,920 | | | | 63,071 | | | | 60,982 | |
Other accrued expenses | | | 40,906 | | | | 34,020 | | | | 453 | | | | 42,145 | |
Variation margin on futures contracts | | | — | | | | 56,343 | | | | — | | | | 6,589 | |
Swap premiums received | | | — | | | | 11,939 | | | | — | | | | 7,721 | |
Unrealized depreciation on: | | | | | | | | | | | | | | | | |
Forward foreign currency exchange contracts | | | — | | | | 137,706 | | | | — | | | | 288,931 | |
OTC swaps | | | — | | | | 79,708 | | | | — | | | | 111,669 | |
| | | | |
Total liabilities | | | 8,217,428 | | | | 90,332,034 | | | | 4,896,910 | | | | 10,181,044 | |
| | | | |
NET ASSETS | | $ | 188,906,945 | | | $ | 500,622,256 | | | $ | 195,937,931 | | | $ | 185,582,314 | |
| | | | |
See notes to financial statements.
| | |
| 130 | | 2019 BLACKROCK ANNUAL REPORTTO SHAREHOLDERS |
Statements of Assets and Liabilities (continued)
December 31, 2019
| | | | | | | | | | | | | | | | |
| | | BlackRock
Advantage Large Cap Core
Portfolio | | | BlackRock
Balanced Capital Portfolio | | | BlackRock Capital
Appreciation
Portfolio | | | BlackRock Global Allocation Portfolio(a) | |
NET ASSETS CONSIST OF | | | | | | | | | | | | | | | | |
Paid-in capital | | $ | 165,829,336 | | | $ | 461,527,736 | | | $ | 129,249,739 | | | $ | 168,345,410 | |
Accumulated earnings | | | 23,077,609 | | | | 39,094,520 | | | | 66,688,192 | | | | 17,236,904 | |
| | | | |
NET ASSETS | | $ | 188,906,945 | | | $ | 500,622,256 | | | $ | 195,937,931 | | | $ | 185,582,314 | |
| | | | |
| | | | |
Share outstanding, $0.10 par value(j) | | | 7,904,510 | | | | 31,559,108 | | | | 4,515,688 | | | | 11,574,095 | |
| | | | |
| | | | |
Net asset value, offering and redemption price per share | | $ | 23.90 | | | $ | 15.86 | | | $ | 43.39 | | | $ | 16.03 | |
| | | | |
| | | | |
(a) Consolidated Statement of Assets and Liabilities | | | | | | | | | | | | | | | | |
(b) Investments at cost — unaffiliated | | $ | 166,001,786 | | | $ | 500,306,140 | | | $ | 130,922,711 | | | $ | 172,225,480 | |
(c) Securities loaned at value | | $ | 7,576,163 | | | $ | 14,848,795 | | | $ | 4,621,707 | | | $ | 2,516,471 | |
(d) Investments at cost — affiliated | | $ | 9,428,270 | | | $ | 26,112,215 | | | $ | 4,943,170 | | | $ | 4,264,476 | |
(e) Foreign currency at cost | | $ | — | | | $ | 1,064,928 | | | $ | 5 | | | $ | 26,493 | |
(f) Proceeds received from investments sold short at value — unaffiliated | | $ | — | | | $ | — | | | $ | — | | | $ | 385,233 | |
(g) Proceeds received from borrowed bonds | | $ | — | | | $ | 2,858,390 | | | $ | — | | | $ | — | |
(h) Premiums received | | $ | — | | | $ | 64,142 | | | $ | — | | | $ | 490,394 | |
(i) Proceeds from TBA sale commitments | | $ | — | | | $ | 7,040,284 | | | $ | — | | | $ | — | |
(j) Authorized shares | | | 100 million | | | | 300 million | | | | 100 million | | | | 100 million | |
See notes to financial statements.
Statements of Assets and Liabilities (continued)
December 31, 2019
| | | | | | | | | | | | |
| | | BlackRock
Government Money
Market Portfolio | | | BlackRock High
Yield Portfolio | | | BlackRock U.S.
Government
Bond Portfolio | |
| | | |
ASSETS | | | | | | | | | | | | |
Investments at value — unaffiliated(a) | | $ | 74,826,925 | | | $ | 30,429,545 | | | $ | 77,683,785 | |
Investments at value — affiliated(b) | | | — | | | | 226,951 | | | | 1,217,840 | |
Cash | | | 3,061,319 | | | | — | | | | — | |
Cash pledged: | | | | | | | | | | | | |
Futures contracts | | | — | | | | — | | | | 58,540 | |
Centrally cleared swaps | | | — | | | | — | | | | 77,000 | |
Foreign currency at value(c) | | | — | | | | 693 | | | | 132,467 | |
Repurchase agreements at value — unaffiliated(d) | | | 34,650,000 | | | | — | | | | — | |
Receivables: | | | | | | | | | | | | |
Investments sold | | | — | | | | 55,844 | | | | 2,385,917 | |
TBA sale commitments | | | — | | | | — | | | | 4,426,412 | |
Capital shares sold | | | 7,294 | | | | — | | | | 1,720 | |
Dividends — affiliated | | | — | | | | 672 | | | | 1,452 | |
Dividends — unaffiliated | | | — | | | | 1,052 | | | | 29,521 | |
Interest — unaffiliated | | | 69,220 | | | | 443,756 | | | | 269,235 | |
From the Manager | | | — | | | | — | | | | 3,609 | |
Investment adviser | | | — | | | | — | | | | 2,818 | |
Variation margin on futures contracts | | | — | | | | — | | | | 9,293 | |
Variation margin on centrally cleared swaps | | | — | | | | — | | | | 5,995 | |
Swap premiums paid | | | — | | | | 131 | | | | 218 | |
Unrealized appreciation on: | | | | | | | | | | | | |
Forward foreign currency exchange contracts | | | — | | | | 61 | | | | 66,448 | |
OTC swaps | | | — | | | | 811 | | | | 5,260 | |
Unfunded floating rate loan interests | | | — | | | | 1,628 | | | | — | |
Prepaid expenses | | | 1,222 | | | | 541 | | | | 986 | |
Other assets | | | 256 | | | | 351 | | | | 7,944 | |
| | | | |
Total assets | | | 112,616,236 | | | | 31,162,036 | | | | 86,386,460 | |
| | | | |
| | | |
LIABILITIES | | | | | | | | | | | | |
Bank overdraft | | | — | | | | 2,516 | | | | 3,772 | |
Options written at value(e) | | | — | | | | 1,117 | | | | 29,847 | |
TBA sale commitments at value(f) | | | — | | | | — | | | | 4,424,928 | |
Reverse repurchase agreements at value | | | — | | | | — | | | | 15,074,824 | |
Payables: | | | | | | | | | | | | |
Investments purchased | | | — | | | | 238,495 | | | | 12,261,187 | |
Accounting services fees | | | 17,841 | | | | 25,084 | | | | 21,728 | |
Capital shares redeemed | | | 15,878 | | | | 344 | | | | 680 | |
Custodian fees | | | 4,968 | | | | 9,556 | | | | 15,410 | |
Income dividend distributions | | | — | | | | 133,495 | | | | 107,889 | |
Investment advisory fees | | | 33,360 | | | | 819 | | | | — | |
Directors’ and Officer’s fees | | | 565 | | | | 5,410 | | | | 4,838 | |
Other affiliates | | | 775 | | | | 188 | | | | 335 | |
Printing fees | | | 12,688 | | | | 7,539 | | | | 8,310 | |
Professional fees | | | 36,065 | | | | 34,241 | | | | 46,233 | |
Registration fees | | | 2,933 | | | | — | | | | 229 | |
To the Manager | | | — | | | | 6,037 | | | | — | |
Transfer agent fees | | | 36,901 | | | | 7,360 | | | | 12,405 | |
Other accrued expenses | | | — | | | | 5,918 | | | | 8,419 | |
Variation margin on futures contracts | | | — | | | | — | | | | 1,599 | |
Swap premiums received | | | — | | | | 1,358 | | | | 169 | |
Unrealized depreciation on: | | | | | | | | | | | | |
Forward foreign currency exchange contracts | | | — | | | | 473 | | | | 28,017 | |
OTC swaps | | | — | | | | 9,356 | | | | 2,554 | |
| | | | |
Total liabilities | | | 161,974 | | | | 489,306 | | | | 32,053,373 | |
| | | | |
NET ASSETS | | $ | 112,454,262 | | | $ | 30,672,730 | | | $ | 54,333,087 | |
| | | | |
See notes to financial statements.
| | |
| 132 | | 2019 BLACKROCK ANNUAL REPORTTO SHAREHOLDERS |
Statements of Assets and Liabilities (continued)
December 31, 2019
| | | | | | | | | | | | |
| | | BlackRock
Government Money Market
Portfolio | | | BlackRock High
Yield Portfolio | | | BlackRock U.S. Government
Bond Portfolio | |
NET ASSETS CONSIST OF | | | | | | | | | | | | |
Paid-in capital | | $ | 112,450,944 | | | $ | 32,106,022 | | | $ | 55,869,904 | |
Accumulated earnings (loss) | | | 3,318 | | | | (1,433,292) | | | | (1,536,817) | |
| | | | |
NET ASSETS | | $ | 112,454,262 | | | $ | 30,672,730 | | | $ | 54,333,087 | |
| | | | |
| | | |
Share outstanding, $0.10 par value(g) | | | 112,450,950 | | | | 5,645,656 | | | | 4,934,611 | |
| | | | |
| | | |
Net asset value | | $ | 1.00 | | | $ | 5.43 | | | $ | 11.01 | |
| | | | |
| | | |
(a) Investments at cost — unaffiliated | | $ | 74,826,925 | | | $ | 29,477,942 | | | $ | 76,430,989 | |
(b) Investments at cost — affiliated | | $ | — | | | $ | 226,951 | | | $ | 1,217,840 | |
(c) Foreign currency at cost | | $ | — | | | $ | 682 | | | $ | 131,856 | |
(d) Repurchase agreements at cost — unaffiliated | | $ | 34,650,000 | | | $ | — | | | $ | — | |
(e) Premiums received | | $ | — | | | $ | 1,090 | | | $ | 42,511 | |
(f) Proceeds from TBA sale commitments | | $ | — | | | $ | — | | | $ | 4,426,412 | |
(g) Authorized shares | | | 2 billion | | | | 100 million | | | | 100 million | |
See notes to financial statements.
Statements of Operations
Year Ended December 31, 2019
| | | | | | | | | | | | | | | | |
| | | BlackRock
Advantage Large
Cap Core Portfolio | | | BlackRock
Balanced Capital Portfolio | | | BlackRock
Capital
Appreciation
Portfolio | | | BlackRock
Global Allocation
Portfolio(a) | |
| | | | |
INVESTMENT INCOME | | | | | | | | | | | | | | | | |
Dividends — affiliated | | $ | 34,097 | | | $ | 293,725 | | | $ | 21,595 | | | $ | 25,548 | |
Dividends — unaffiliated | | | 3,561,283 | | | | 5,798,659 | | | | 1,094,109 | | | | 2,531,878 | |
Interest — unaffiliated | | | 8,037 | | | | 6,555,485 | | | | 443 | | | | 1,729,251 | |
Securities lending income — affiliated — net | | | 25,203 | | | | 44,708 | | | | 14,830 | | | | 9,790 | |
Foreign taxes withheld | | | — | | | | (18,186 | ) | | | (179 | ) | | | (145,195) | |
| | | | |
Total investment income | | | 3,628,620 | | | | 12,674,391 | | | | 1,130,798 | | | | 4,151,272 | |
| | | | |
| | | | |
EXPENSES | | | | | | | | | | | | | | | | |
Investment advisory | | | 665,362 | | | | 1,802,009 | | | | 687,779 | | | | 671,215 | |
Transfer agent | | | 243,938 | | | | 683,894 | | | | 256,007 | | | | 265,511 | |
Accounting services | | | 52,592 | | | | 114,314 | | | | 53,202 | | | | 104,578 | |
Professional | | | 47,691 | | | | 64,069 | | | | 42,962 | | | | 69,963 | |
Custodian | | | 44,443 | | | | 111,097 | | | | 11,127 | | | | 275,271 | |
Directors and Officer | | | 9,723 | | | | 12,987 | | | | 9,750 | | | | 9,749 | |
Printing | | | 8,249 | | | | 66 | | | | 1,896 | | | | 2,303 | |
Pricing | | | 861 | | | | 65,484 | | | | 884 | | | | 19,569 | |
Registration | | | 496 | | | | 496 | | | | 496 | | | | 496 | |
Board realignment and consolidation | | | 191 | | | | 223 | | | | 190 | | | | 194 | |
Miscellaneous | | | 6,940 | | | | 24,616 | | | | 5,217 | | | | 13,278 | |
| | | | |
Total expenses excluding dividend expense and interest expense | | | 1,080,486 | | | | 2,879,255 | | | | 1,069,510 | | | | 1,432,127 | |
Dividend expense — unaffiliated | | | — | | | | — | | | | — | | | | 4,356 | |
Interest expense | | | — | | | | 172,114 | | | | — | | | | — | |
| | | | |
Total expenses | | | 1,080,486 | | | | 3,051,369 | | | | 1,069,510 | | | | 1,436,483 | |
| | | | |
Less: | | | | | | | | | | | | | | | | |
Transfer agent fees waived and/or reimbursed | | | (182,684 | ) | | | (492,092 | ) | | | (176,617 | ) | | | (260,375) | |
Fees waived and/or reimbursed by the Manager | | | (1,290 | ) | | | (9,068 | ) | | | (744 | ) | | | (139,423) | |
| | | | |
Total expenses after fees waived and/or reimbursed | | | 896,512 | | | | 2,550,209 | | | | 892,149 | | | | 1,036,685 | |
| | | | |
Net investment income | | | 2,732,108 | | | | 10,124,182 | | | | 238,649 | | | | 3,114,587 | |
| | | | |
| | |
| 134 | | 2019 BLACKROCK ANNUAL REPORTTO SHAREHOLDERS |
Statements of Operations (continued)
Year Ended December 31, 2019
| | | | | | | | | | | | | | | | |
| | | BlackRock
Advantage
Large Cap Core Portfolio | | | BlackRock
Balanced
Capital Portfolio | | | BlackRock
Capital
Appreciation
Portfolio | | | BlackRock
Global Allocation
Portfolio(a) | |
| | | | |
REALIZED AND UNREALIZED GAIN (LOSS) | | | | | | | | | | | | | | | | |
Net realized gain (loss) from: | | | | | | | | | | | | | | | | |
Investments — affiliated | | $ | 810 | | | $ | (22,139 | ) | | $ | (328 | ) | | $ | (138,897) | |
Investments — unaffiliated(b) | | | 12,341,674 | | | | 25,248,918 | | | | 21,359,204 | | | | 6,469,176 | |
Borrowed bonds | | | — | | | | 7,367 | | | | — | | | | — | |
Capital gain distributions from investment companies — affiliated | | | 4 | | | | — | | | | — | | | | — | |
Forward foreign currency exchange contracts | | | — | | | | (1,021,129 | ) | | | — | | | | (70,029) | |
Foreign currency transactions | | | — | | | | 32,760 | | | | (88 | ) | | | (121,783) | |
Futures contracts | | | 437,768 | | | | 6,576,260 | | | | — | | | | (1,062,226) | |
Options written | | | — | | | | 200,975 | | | | — | | | | 568,808 | |
Short sales — unaffiliated | | | — | | | | (459,007 | ) | | | — | | | | 48,802 | |
Swaps | | | — | | | | (192,566 | ) | | | — | | | | (69,434) | |
| | | | |
| | | 12,780,256 | | | | 30,371,439 | | | | 21,358,788 | | | | 5,624,417 | |
| | | | |
Net change in unrealized appreciation (depreciation) on: | | | | | | | | | | | | | | | | |
Investments — affiliated | | | 257 | | | | 51,089 | | | | 119 | | | | 150,703 | |
Investments — unaffiliated(c) | | | 29,548,124 | | | | 54,820,520 | | | | 29,740,764 | | | | 20,722,612 | |
Borrowed bonds | | | — | | | | 92,700 | | | | — | | | | — | |
Forward foreign currency exchange contracts | | | — | | | | 308,819 | | | | — | | | | 306,140 | |
Foreign currency translations | | | — | | | | 8,397 | | | | — | | | | 4,182 | |
Futures contracts | | | 48,472 | | | | 335,859 | | | | — | | | | (117,124) | |
Options written | | | — | | | | 73,981 | | | | — | | | | 614,551 | |
Short sales — unaffiliated | | | — | | | | — | | | | — | | | | (111,503) | |
Swaps | | | — | | | | (72,443 | ) | | | — | | | | (372,179) | |
| | | | |
| | | 29,596,853 | | | | 55,618,922 | | | | 29,740,883 | | | | 21,197,382 | |
| | | | |
Net realized and unrealized gain | | | 42,377,109 | | | | 85,990,361 | | | | 51,099,671 | | | | 26,821,799 | |
| | | | |
NET INCREASE IN NET ASSETS RESULTING FROM OPERATIONS | | $ | 45,109,217 | | | $ | 96,114,543 | | | $ | 51,338,320 | | | $ | 29,936,386 | |
| | | | |
| | | | |
(a) Consolidated Statement of Operations. | | | | | | | | | | | | | | | | |
| | | | |
(b) Net of foreign capital gain tax | | $ | — | | | $ | — | | | $ | — | | | $ | (496) | |
| | | | |
(c) Net of foreign capital gain tax | | $ | — | | | $ | — | | | $ | — | | | $ | (31,381) | |
See notes to financial statements.
Statements of Operations (continued)
Year Ended December 31, 2019
| | | | | | | | | | | | |
| | | BlackRock
Government Money Market Portfolio | | | BlackRock High Yield Portfolio | | | BlackRock U.S.
Government Bond Portfolio | |
| | | |
INVESTMENT INCOME | | | | | | | | | | | | |
Dividends — affiliated | | $ | — | | | $ | 11,529 | | | $ | 34,081 | |
Dividends — unaffiliated | | | — | | | | 19,267 | | | | 556 | |
Interest — unaffiliated | | | 2,716,883 | | | | 1,855,545 | | | | 1,877,297 | |
Foreign taxes withheld | | | — | | | | — | | | | (83) | |
| | | | |
Total investment income | | | 2,716,883 | | | | 1,886,341 | | | | 1,911,851 | |
| | | | |
| | | |
EXPENSES | | | | | | | | | | | | |
Investment advisory | | | 443,639 | | | | 111,619 | | | | 204,150 | |
Transfer agent | | | 171,898 | | | | 47,191 | | | | 83,714 | |
Professional | | | 56,295 | | | | 45,557 | | | | 75,269 | |
Accounting services | | | 37,618 | | | | 102,098 | | | | 87,939 | |
Custodian | | | 11,339 | | | | 24,562 | | | | 37,093 | |
Directors and Officer | | | 9,174 | | | | 4,002 | | | | 4,079 | |
Pricing | | | 1,894 | | | | 9,686 | | | | 25,336 | |
Printing | | | 1,653 | | | | 1,761 | | | | 1,316 | |
Registration | | | 594 | | | | 496 | | | | 8 | |
Board realignment and consolidation | | | 184 | | | | — | | | | — | |
Miscellaneous | | | 7,167 | | | | 319 | | | | 1,190 | |
| | | | |
Total expenses excluding interest expense | | | 741,455 | | | | 347,291 | | | | 520,094 | |
Interest expense | | | — | | | | — | | | | 286,985 | |
| | | | |
Total expenses | | | 741,455 | | | | 347,291 | | | | 807,079 | |
| | | | |
Less: | | | | | | | | | | | | |
Transfer agent fees waived and/or reimbursed | | | (146,275) | | | | (42,182) | | | | (78,714) | |
Fees waived and/or reimbursed by the Manager | | | (1,961) | | | | (154,564) | | | | (166,074) | |
| | | | |
Total expenses after fees waived and/or reimbursed | | | 593,219 | | | | 150,545 | | | | 562,291 | |
| | | | |
Net investment income | | | 2,123,664 | | | | 1,735,796 | | | | 1,349,560 | |
| | | | |
| | | |
REALIZED AND UNREALIZED GAIN (LOSS) | | | | | | | | | | | | |
Net realized gain (loss) from: | | | | | | | | | | | | |
Investments — unaffiliated | | $ | 2,436 | | | $ | (366,076) | | | $ | 607,930 | |
Forward foreign currency exchange contracts | | | — | | | | (6,084) | | | | (27,677) | |
Foreign currency transactions | | | — | | | | (2,563) | | | | (695) | |
Futures contracts | | | — | | | | (18,371) | | | | 86,608 | |
Options written | | | — | | | | 12,309 | | | | 78,036 | |
Swaps | | | — | | | | 3,927 | | | | (159,093) | |
Unfunded floating rate loan interests | | | — | | | | (59) | | | | — | |
| | | | |
| | | 2,436 | | | | (376,917) | | | | 585,109 | |
| | | | |
Net change in unrealized appreciation (depreciation) on: | | | | |
Investments — unaffiliated | | | — | | | | 2,830,544 | | | | 1,706,465 | |
Forward foreign currency exchange contracts | | | — | | | | (2,080) | | | | 1,160 | |
Foreign currency translations | | | — | | | | 107 | | | | 1,047 | |
Futures contracts | | | — | | | | (7,936) | | | | (60,259) | |
Options written | | | — | | | | (27) | | | | 78,863 | |
Swaps | | | — | | | | 494 | | | | (86,935) | |
Unfunded floating rate loan interests | | | — | | | | 1,702 | | | | — | |
| | | | |
| | | — | | | | 2,822,804 | | | | 1,640,341 | |
| | | | |
Net realized and unrealized gain | | | 2,436 | | | | 2,445,887 | | | | 2,225,450 | |
| | | | |
NET INCREASE IN NET ASSETS RESULTING FROM OPERATIONS | | $ | 2,126,100 | | | $ | 4,181,683 | | | $ | 3,575,010 | |
| | | | |
See notes to financial statements.
| | |
| 136 | | 2019 BLACKROCK ANNUAL REPORT TO SHAREHOLDERS |
Statements of Changes in Net Assets
| | | | | | | | | | | | | | | | |
| | | BlackRock Advantage Large Cap Core
Portfolio | | | BlackRock Balanced Capital Portfolio | |
| | | Year Ended December 31, | | | Year Ended December 31, | |
| | | 2019 | | | 2018 | | | 2019 | | | 2018 | |
| | | | |
INCREASE (DECREASE) IN NET ASSETS | | | | | | | | | | | | | | | | |
| | | | |
OPERATIONS | | | | | | | | | | | | | | | | |
Net investment income | | $ | 2,732,108 | | | $ | 2,822,846 | | | $ | 10,124,182 | | | $ | 9,965,998 | |
Net realized gain | | | 12,780,256 | | | | 16,137,962 | | | | 30,371,439 | | | | 22,772,515 | |
Net change in unrealized appreciation (depreciation) | | | 29,596,853 | | | | (26,786,954 | ) | | | 55,618,922 | | | | (44,159,263) | |
| | | | |
Net increase (decrease) in net assets resulting from operations | | | 45,109,217 | | | | (7,826,146 | ) | | | 96,114,543 | | | | (11,420,750) | |
| | | | |
| | | | |
DISTRIBUTIONS TO SHAREHOLDERS(a) | | | | | | | | | | | | | | | | |
Decrease in net assets resulting from distributions to shareholders | | | (11,852,191 | ) | | | (23,736,716 | ) | | | (34,979,827 | ) | | | (42,865,047) | |
| | | | |
| | | | |
CAPITAL SHARE TRANSACTIONS | | | | | | | | | | | | | | | | |
Net increase (decrease) in net assets derived from capital share transactions | | | (5,763,171 | ) | | | 5,438,391 | | | | (13,542,103 | ) | | | (3,877,300) | |
| | | | |
| | | | |
NET ASSETS | | | | | | | | | | | | | | | | |
Total increase (decrease) in net assets | | | 27,493,855 | | | | (26,124,471 | ) | | | 47,592,613 | | | | (58,163,097) | |
Beginning of year | | | 161,413,090 | | | | 187,537,561 | | | | 453,029,643 | | | | 511,192,740 | |
| | | | |
End of year | | $ | 188,906,945 | | | $ | 161,413,090 | | | $ | 500,622,256 | | | $ | 453,029,643 | |
| | | | |
| (a) | Distributions for annual periods determined in accordance with U.S. federal income tax regulations. |
See notes to financial statements.
Statements of Changes in Net Assets (continued)
| | | | | | | | | | | | | | | | |
| | | BlackRock Capital Appreciation Portfolio | | | BlackRock Global Allocation Portfolio (a) | |
| | | Year Ended December 31, | | | Year Ended December 31, | |
| | | 2019 | | | 2018 | | | 2019 | | | 2018 | |
| | | | |
INCREASE (DECREASE) IN NET ASSETS | | | | | | | | | | | | | | | | |
| | | | |
OPERATIONS | | | | | | | | | | | | | | | | |
Net investment income | | $ | 238,649 | | | $ | 600,639 | | | $ | 3,114,587 | | | $ | 3,316,506 | |
Net realized gain | | | 21,358,788 | | | | 17,304,152 | | | | 5,624,417 | | | | 7,208,688 | |
Net change in unrealized appreciation (depreciation) | | | 29,740,883 | | | | (12,615,210 | ) | | | 21,197,382 | | | | (24,402,580) | |
| | | | |
Net increase (decrease) in net assets resulting from operations | | | 51,338,320 | | | | 5,289,581 | | | | 29,936,386 | | | | (13,877,386) | |
| | | | |
| | | | |
DISTRIBUTIONS TO SHAREHOLDERS(b) | | | | | | | | | | | | | | | | |
Decrease in net assets resulting from distributions to shareholders | | | (21,012,661 | ) | | | (19,636,188 | ) | | | (8,154,274 | ) | | | (12,321,000) | |
| | | | |
| | | | |
CAPITAL SHARE TRANSACTIONS | | | | | | | | | | | | | | | | |
Net increase (decrease) in net assets derived from capital share transactions | | | 2,746,206 | | | | 6,382,954 | | | | (10,182,860 | ) | | | (11,373,660) | |
| | | | |
| | | | |
NET ASSETS | | | | | | | | | | | | | | | | |
Total increase (decrease) in net assets | | | 33,071,865 | | | | (7,963,653 | ) | | | 11,599,252 | | | | (37,572,046) | |
Beginning of year | | | 162,866,066 | | | | 170,829,719 | | | | 173,983,062 | | | | 211,555,108 | |
| | | | |
End of year | | $ | 195,937,931 | | | $ | 162,866,066 | | | $ | 185,582,314 | | | $ | 173,983,062 | |
| | | | |
| (a) | Consolidated Statements of Changes in Net Assets. |
| (b) | Distributions for annual periods determined in accordance with U.S. federal income tax regulations. |
See notes to financial statements.
| | |
| 138 | | 2019 BLACKROCK ANNUAL REPORTTO SHAREHOLDERS |
Statements of Changes in Net Assets (continued)
| | | | | | | | | | | | | | | | |
| | | BlackRock Government Money Market
Portfolio | | | BlackRock High Yield Portfolio | |
| | | Year Ended December 31, | | | Year Ended December 31, | |
| | | 2019 | | | 2018 | | | 2019 | | | 2018 | |
| | | | |
INCREASE (DECREASE) IN NET ASSETS | | | | | | | | | | | | | | | | |
| | | | |
OPERATIONS | | | | | | | | | | | | | | | | |
Net investment income | | $ | 2,123,664 | | | $ | 1,777,250 | | | $ | 1,735,796 | | | $ | 1,689,719 | |
Net realized gain (loss) | | | 2,436 | | | | 715 | | | | (376,917 | ) | | | (54,903) | |
Net change in unrealized appreciation (depreciation) | | | — | | | | — | | | | 2,822,804 | | | | (2,321,215) | |
| | | | |
Net increase (decrease) in net assets resulting from operations | | | 2,126,100 | | | | 1,777,965 | | | | 4,181,683 | | | | (686,399) | |
| | | | |
| | | | |
DISTRIBUTIONS TO SHAREHOLDERS(a) | | | | | | | | | | | | | | | | |
From net investment income | | | (2,123,664 | ) | | | (1,777,250 | ) | | | (1,741,887 | ) | | | (1,697,206) | |
From return of capital | | | — | | | | — | | | | — | | | | (8,797) | |
| | | | |
Decrease in net assets resulting from distributions to shareholders | | | (2,123,664 | ) | | | (1,777,250 | ) | | | (1,741,887 | ) | | | (1,706,003) | |
| | | | |
| | | | |
CAPITAL SHARE TRANSACTIONS | | | | | | | | | | | | | | | | |
Net increase (decrease) in net assets derived from capital share transactions | | | (18,908,774 | ) | | | 24,060,474 | | | | 1,165,075 | | | | (2,544,915) | |
| | | | |
| | | | |
NET ASSETS | | | | | | | | | | | | | | | | |
Total increase (decrease) in net assets | | | (18,906,338 | ) | | | 24,061,189 | | | | 3,604,871 | | | | (4,937,317) | |
Beginning of year | | | 131,360,600 | | | | 107,299,411 | | | | 27,067,859 | | | | 32,005,176 | |
| | | | |
End of year | | $ | 112,454,262 | | | $ | 131,360,600 | | | $ | 30,672,730 | | | $ | 27,067,859 | |
| | | | |
| (a) | Distributions for annual periods determined in accordance with U.S. federal income tax regulations. |
See notes to financial statements.
Statements of Changes in Net Assets (continued)
| | | | | | | | |
| | | BlackRock U.S. Government Bond Portfolio | |
| | | Year Ended December 31, | |
| | | 2019 | | | 2018 | |
| | |
INCREASE (DECREASE) IN NET ASSETS | | | | | | | | |
| | |
OPERATIONS | | | | | | | | |
Net investment income | | $ | 1,349,560 | | | $ | 1,327,765 | |
Net realized gain (loss) | | | 585,109 | | | | (594,270) | |
Net change in unrealized appreciation (depreciation) | | | 1,640,341 | | | | (279,489) | |
| | | | |
Net increase in net assets resulting from operations | | | 3,575,010 | | | | 454,006 | |
| | | | |
| | |
DISTRIBUTIONS TO SHAREHOLDERS(a) | | | | | | | | |
Decrease in net assets resulting from distributions to shareholders | | | (1,423,246) | | | | (1,565,228) | |
| | | | |
| | |
CAPITAL SHARE TRANSACTIONS | | | | | | | | |
Net increase (decrease) in net assets derived from capital share transactions | | | (1,759,775) | | | | 472,083 | |
| | | | |
| | |
NET ASSETS | | | | | | | | |
Total increase (decrease) in net assets | | | 391,989 | | | | (639,139) | |
Beginning of year | | | 53,941,098 | | | | 54,580,237 | |
| | | | |
End of year | | $ | 54,333,087 | | | $ | 53,941,098 | |
| | | | |
| (a) | Distributions for annual periods determined in accordance with U.S. federal income tax regulations. |
See notes to financial statements.
| | |
| 140 | | 2019 BLACKROCK ANNUAL REPORTTO SHAREHOLDERS |
Statement of Cash Flows
Year Ended December 31, 2019
| | | | |
| | | BlackRock U.S.
Government Bond
Portfolio | |
| |
CASH PROVIDED BY OPERATING ACTIVITIES | | | | |
Net increase in net assets resulting from operations | | $ | 3,575,010 | |
Adjustments to reconcile net increase in net assets resulting from operations to net cash provided by operating activities: | | | | |
Proceeds from sales of long-term investments and principal paydowns | | | 429,906,518 | |
Purchases of long-term investments | | | (422,872,970 | ) |
Net purchases of short-term securities | | | (7,252,971 | ) |
Amortization of premium and accretion of discount on investments | | | (73,245) | |
Premiums received from options written | | | 210,412 | |
Premiums paid on closing options written | | | (137,680) | |
Net realized (gain) loss on investments and options written | | | (685,966) | |
Net unrealized (appreciation) depreciation on investments, options written, forward foreign currency exchange contracts, foreign currency translations and swaps | | | (1,785,420) | |
| |
(Increase) Decrease in Assets: | | | | |
Receivables: | | | | |
Dividends — affiliated | | | 179 | |
Dividends — unaffiliated | | | (4,517 | ) |
Interest — unaffiliated | | | 36,792 | |
From the Manager | | | 176,457 | |
Investment adviser | | | 1,383 | |
Variation margin on futures contracts | | | 12,965 | |
Variation margin on centrally cleared swaps | | | (5,995 | ) |
Swap premiums paid | | | 3,020 | |
Prepaid expenses | | | (930) | |
Other assets | | | 2,857 | |
| |
Increase (Decrease) in Liabilities: | | | | |
Payables: | | | | |
Accounting services fees | | | 10,890 | |
Board realignment and consolidation | | | (178,843) | |
Custodian fees | | | 3,067 | |
Interest expense and fees | | | (400) | |
Directors’ and Officer’s fees | | | 1,398 | |
Other affiliates | | | 193 | |
Printing fees | | | (9,826) | |
Professional fees | | | 35,894 | |
Registration fees | | | 229 | |
Transfer agent fees | | | (19,026) | |
Variation margin on futures contracts | | | (5,192) | |
Variation margin on centrally cleared swaps | | | (7,462) | |
Other accrued expenses | | | (18,637) | |
Swap premiums received | | | (19) | |
| | | | |
Net cash provided by operating activities | | | 918,165 | |
| | | | |
| |
CASH USED FOR FINANCING ACTIVITIES | | | | |
Cash dividends paid to shareholders | | | (1) | |
Payments on redemption of capital shares | | | (8,498,391) | |
Proceeds from issuance of capital shares | | | 5,046,794 | |
Net borrowing of reverse repurchase agreements | | | 2,427,930 | |
Increase in bank overdraft | | | 2,666 | |
| | | | |
Net cash used for financing activities | | | (1,021,002) | |
| | | | |
| |
CASH IMPACT FROM FOREIGN EXCHANGE FLUCTUATIONS | | | | |
Cash impact from foreign exchange fluctuations | | | 963 | |
| | | | |
| |
CASH AND FOREIGN CURRENCY | | | | |
Net decrease in restricted and unrestricted cash and foreign currency | | | (101,874) | |
Restricted and unrestricted cash and foreign currency at beginning of year | | | 369,881 | |
| | | | |
Restricted and unrestricted cash and foreign currency at end of year | | $ | 268,007 | |
| | | | |
| |
SUPPLEMENTAL DISCLOSURE OF CASH FLOW INFORMATION | | | | |
Cash paid during the year for interest expense | | $ | 287,385 | |
| | | | |
| |
NON-CASH FINANCING ACTIVITIES | | | | |
Capital shares issued in reinvestment of dividends and distributions paid to shareholders | | $ | 1,430,787 | |
| | | | |
Statement of Cash Flows (continued)
Year Ended December 31, 2019
| | | | | | | | |
| | | Year Ended December 31, | |
| | | 2019 | | | 2018 | |
| | |
RECONCILIATION OF RESTRICTED AND UNRESTRICTED CASH AND FOREIGN CURRENCY TO THE STATEMENTS OF ASSETS AND LIABILITIES: | | | | | | | | |
Cash pledged: | | | | | | | | |
Futures contracts | | | 58,540 | | | | 84,540 | |
Centrally cleared swaps | | | 77,000 | | | | 145,000 | |
Foreign currency at value | | | 132,467 | | | | 140,341 | |
| | | | | | | | |
| | $ | 268,007 | | | $ | 369,881 | |
| | | | | | | | |
See notes to financial statements.
| | |
| 142 | | 2019 BLACKROCK ANNUAL REPORTTO SHAREHOLDERS |
Financial Highlights
(For a share outstanding throughout each period)
| | | | | | | | | | | | | | | | | | | | |
| | | BlackRock Advantage Large Cap Core Portfolio | |
| | | Year Ended December 31, | |
| | | 2019 | | | 2018 | | | 2017 | | | 2016 | | | 2015 | |
| |
| | | | | |
Net asset value, beginning of year | | $ | 19.76 | | | $ | 24.31 | | | $ | 27.15 | | | $ | 26.53 | | | $ | 28.11 | |
| | | | |
Net investment income(a) | | | 0.35 | | | | 0.38 | (b) | | | 0.40 | | | | 0.36 | | | | 0.32 | |
Net realized and unrealized gain (loss) | | | 5.38 | | | | (1.62 | ) | | | 5.58 | | | | 2.47 | | | | (0.15) | |
| | | | |
Net increase (decrease) from investment operations | | | 5.73 | | | | (1.24 | ) | | | 5.98 | | | | 2.83 | | | | 0.17 | |
| | | | |
Distributions(c) | | | | | | | | | | | | | | | | | | | | |
From net investment income | | | (0.34 | ) | | | (0.39 | ) | | | (0.41 | ) | | | (0.37 | ) | | | (0.33) | |
From net realized gain | | | (1.25 | ) | | | (2.92 | ) | | | (8.41 | ) | | | (1.84 | ) | | | (1.42) | |
| | | | |
Total distributions | | | (1.59 | ) | | | (3.31 | ) | | | (8.82 | ) | | | (2.21 | ) | | | (1.75) | |
| | | | |
| | | | | |
Net asset value, end of year | | $ | 23.90 | | | $ | 19.76 | | | $ | 24.31 | | | $ | 27.15 | | | $ | 26.53 | |
| | | | |
| | | | | |
Total Return(d) | | | | | | | | | | | | | | | | | | | | |
Based on net asset value | | | 29.09 | % | | | (5.11 | )% | | | 22.24 | % | | | 10.69 | % | | | 0.60% | |
| | | | |
| | | | | |
Ratios to Average Net Assets | | | | | | | | | | | | | | | | | | | | |
Total expenses | | | 0.60 | % | | | 0.63 | % | | | 0.63 | % | | | 0.60 | % | | | 0.60% | |
| | | | |
Total expenses after fees waived and/or reimbursed | | | 0.50 | % | | | 0.50 | % | | | 0.50 | % | | | 0.50 | % | | | 0.50% | |
| | | | |
Net investment income | | | 1.52 | % | | | 1.51 | %(b) | | | 1.35 | % | | | 1.36 | % | | | 1.14% | |
| | | | |
| | | | | |
Supplemental Data | | | | | | | | | | | | | | | | | | | | |
Net assets, end of year (000) | | $ | 188,907 | | | $ | 161,413 | | | $ | 187,538 | | | $ | 167,987 | | | $ | 169,173 | |
| | | | |
Portfolio turnover rate | | | 131 | % | | | 151 | % | | | 154 | % | | | 48 | % | | | 31% | |
| | | | |
| (a) | Based on average shares outstanding. |
| (b) | Net investment income per share and the ratio of net investment income to average net assets includes $0.01 per share and 0.06%, respectively, resulting from a non-recurring dividend. |
| (c) | Distributions for annual periods determined in accordance with U.S. federal income tax regulations. |
| (d) | Where applicable, excludes insurance-related fees and expenses and assumes the reinvestment of distributions. |
See notes to financial statements.
Financial Highlights
(For a share outstanding throughout each period)
| | | | | | | | | | | | | | | | | | | | |
| | | BlackRock Balanced Capital Portfolio | |
| | | Year Ended December 31, | |
| | | 2019 | | | 2018 | | | 2017 | | | 2016 | | | 2015 | |
| |
| | | | | |
Net asset value, beginning of year | | $ | 13.97 | | | $ | 15.81 | | | $ | 16.87 | | | $ | 16.74 | | | $ | 17.81 | |
| | | | |
Net investment income(a) | | | 0.33 | | | | 0.32 | | | | 0.31 | | | | 0.29 | | | | 0.28 | |
Net realized and unrealized gain (loss) | | | 2.75 | | | | (0.73 | ) | | | 2.14 | | | | 1.16 | | | | (0.19) | |
| | | | |
Net increase (decrease) from investment operations | | | 3.08 | | | | (0.41 | ) | | | 2.45 | | | | 1.45 | | | | 0.09 | |
| | | | |
Distributions(b) | | | | | | | | | | | | | | | | | | | | |
From net investment income | | | (0.33 | ) | | | (0.31 | ) | | | (0.34 | ) | | | (0.30 | ) | | | (0.30) | |
From net realized gain | | | (0.86 | ) | | | (1.12 | ) | | | (3.17 | ) | | | (1.02 | ) | | | (0.86) | |
| | | | |
Total distributions | | | (1.19 | ) | | | (1.43 | ) | | | (3.51 | ) | | | (1.32 | ) | | | (1.16) | |
| | | | |
| | | | | |
Net asset value, end of year | | $ | 15.86 | | | $ | 13.97 | | | $ | 15.81 | | | $ | 16.87 | | | $ | 16.74 | |
| | | | |
| | | | | |
Total Return(c) | | | | | | | | | | | | | | | | | | | | |
Based on net asset value | | | 22.06 | % | | | (2.66 | )% | | | 14.59 | % | | | 8.65 | % | | | 0.52% | |
| | | | |
| | | | | |
Ratios to Average Net Assets(d) | | | | | | | | | | | | | | | | | | | | |
Total expenses | | | 0.63 | % | | | 0.64 | % | | | 0.66 | % | | | 0.62 | % | | | 0.61% | |
| | | | |
Total expenses after fees waived and/or reimbursed | | | 0.52 | % | | | 0.52 | % | | | 0.53 | % | | | 0.52 | % | | | 0.50% | |
| | | | |
Total expenses after fees waived and/or reimbursed and excluding interest expense | | | 0.49 | % | | | 0.49 | % | | | 0.49 | % | | | 0.49 | % | | | 0.49% | |
| | | | |
Net investment income | | | 2.08 | % | | | 1.98 | % | | | 1.75 | % | | | 1.72 | % | | | 1.54% | |
| | | | |
| | | | | |
Supplemental Data | | | | | | | | | | | | | | | | | | | | |
Net assets, end of year (000) | | $ | 500,622 | | | $ | 453,030 | | | $ | 511,193 | | | $ | 490,442 | | | $ | 499,439 | |
| | | | |
Portfolio turnover rate(e) | | | 320 | % | | | 280 | % | | | 332 | % | | | 264 | % | | | 340% | |
| | | | |
|
(a) Based on average shares outstanding. (b) Distributions for annual periods determined in accordance with U.S. federal income tax regulations. (c) Where applicable, excludes insurance-related fees and expenses and assumes the reinvestment of distributions. (d) Excludes expenses incurred indirectly as a result of investments in underlying funds as follows: | |
| | | Year Ended December 31, | |
| | | 2019 | | | 2018 | | | 2017 | | | 2016 | | | 2015 | |
| |
Investments in underlying funds | | | — | % | | | 0.02 | % | | | 0.01 | % | | | 0.01 | % | | | —% | |
| | | | |
|
(e) Includes mortgage dollar roll transactions (“MDRs”). Additional information regarding portfolio turnover rate is as follows: | |
| | | Year Ended December 31, | |
| | | 2019 | | | 2018 | | | 2017 | | | 2016 | | | 2015 | |
| |
Portfolio turnover rate (excluding MDRs) | | | 228 | % | | | 211 | % | | | 248 | % | | | 188 | % | | | 240% | |
| | | | |
See notes to financial statements.
| | |
| 144 | | 2019 BLACKROCK ANNUAL REPORTTO SHAREHOLDERS |
Financial Highlights
(For a share outstanding throughout each period)
| | | | | | | | | | | | | | | | | | | | |
| | | BlackRock Capital Appreciation Portfolio | |
| |
| | | Year Ended December 31, | |
| | | 2019 | | | 2018 | | | 2017 | | | 2016 | | | 2015 | |
| |
| | | | | |
Net asset value, beginning of year | | $ | 36.63 | | | $ | 40.56 | | | $ | 33.61 | | | $ | 34.32 | | | $ | 34.75 | |
| | | | |
Net investment income(a) | | | 0.06 | | | | 0.15 | (b) | | | 0.12 | (c) | | | 0.07 | (d) | | | 0.05 | |
Net realized and unrealized gain | | | 11.86 | | | | 0.83 | | | | 11.11 | | | | 0.07 | | | | 2.45 | |
| | | | |
Net increase from investment operations | | | 11.92 | | | | 0.98 | | | | 11.23 | | | | 0.14 | | | | 2.50 | |
| | | | |
| | | | | |
Distributions(e) | | | | | | | | | | | | | | | | | | | | |
From net investment income | | | (0.05 | ) | | | (0.14 | ) | | | (0.12 | ) | | | (0.08 | ) | | | (0.05) | |
From net realized gain | | | (5.11 | ) | | | (4.77 | ) | | | (4.16 | ) | | | (0.77 | ) | | | (2.88) | |
| | | | |
Total distributions | | | (5.16 | ) | | | (4.91 | ) | | | (4.28 | ) | | | (0.85 | ) | | | (2.93) | |
| | | | |
| | | | | |
Net asset value, end of year | | $ | 43.39 | | | $ | 36.63 | | | $ | 40.56 | | | $ | 33.61 | | | $ | 34.32 | |
| | | | |
| | | | | |
Total Return(f) | | | | | | | | | | | | | | | | | | | | |
Based on net asset value | | | 32.79 | % | | | 2.42 | % | | | 33.62 | % | | | 0.40 | % | | | 7.09% | |
| | | | |
| | | | | |
Ratios to Average Net Assets | | | | | | | | | | | | | | | | | | | | |
Total expenses | | | 0.58 | % | | | 0.59 | %(g) | | | 0.60 | % | | | 0.62 | % | | | 0.61% | |
| | | | |
Total expenses after fees waived and/or reimbursed | | | 0.48 | % | | | 0.49 | %(g) | | | 0.51 | % | | | 0.53 | % | | | 0.51% | |
| | | | |
Net investment income | | | 0.13 | % | | | 0.33 | %(b)(g) | | | 0.29 | %(c) | | | 0.21 | %(d) | | | 0.14% | |
| | | | |
| | | | | |
Supplemental Data | | | | | | | | | | | | | | | | | | | | |
Net assets, end of year (000) | | $ | 195,938 | | | $ | 162,866 | | | $ | 170,830 | | | $ | 139,019 | | | $ | 156,722 | |
| | | | |
Portfolio turnover rate | | | 42 | % | | | 45 | % | | | 48 | % | | | 86 | % | | | 71% | |
| | | | |
| (a) | Based on average shares outstanding. |
| (b) | Net investment income per share and the ratio of net investment income to average net assets includes $0.10 per share and 0.22%, respectively, resulting from a non-recurring dividend. |
| (c) | Net investment income per share and the ratio of net investment income to average net assets includes $0.04 per share and 0.09%, respectively, resulting from a non-recurring dividend. |
| (d) | Net investment income per share and the ratio of net investment income to average net assets includes $0.03 per share and 0.08%, respectively, resulting from a non-recurring dividend. |
| (e) | Distributions for annual periods determined in accordance with U.S. federal income tax regulations. |
| (f) | Where applicable, excludes insurance-related fees and expenses and assumes the reinvestment of distributions. |
| (g) | Excludes expenses incurred indirectly as a result of investments in underlying funds of 0.01%. |
See notes to financial statements.
Financial Highlights
(For a share outstanding throughout each period)
| | | | | | | | | | | | | | | | | | | | |
| | | BlackRock Global Allocation Portfolio(a) | |
| |
| | | Year Ended December 31, | |
| | | 2019 | | | 2018 | | | 2017 | | | 2016 | | | 2015 | |
| |
| | | | | |
Net asset value, beginning of year | | $ | 14.20 | | | $ | 16.42 | | | $ | 14.60 | | | $ | 14.25 | | | $ | 15.55 | |
| | | | |
Net investment income(b) | | | 0.27 | | | | 0.27 | | | | 0.25 | | | | 0.23 | | | | 0.24 | |
Net realized and unrealized gain (loss) | | | 2.28 | | | | (1.44) | | | | 1.80 | | | | 0.37 | | | | (0.35) | |
| | | | |
Net increase (decrease) from investment operations | | | 2.55 | | | | (1.17) | | | | 2.05 | | | | 0.60 | | | | (0.11) | |
| | | | |
| | | | | |
Distributions(c) | | | | | | | | | | | | | | | | | | | | |
From net investment income | | | (0.24) | | | | (0.24) | | | | (0.23) | | | | (0.25) | | | | (0.30) | |
From net realized gain | | | (0.48) | | | | (0.81) | | | | — | | | | — | | | | (0.89) | |
From return of capital | | | — | | | | — | | | | — | | | | — | | | | (0.00)(d) | |
| | | | |
Total distributions | | | (0.72) | | | | (1.05) | | | | (0.23) | | | | (0.25) | | | | (1.19) | |
| | | | |
| | | | | |
Net asset value, end of year | | $ | 16.03 | | | $ | 14.20 | | | $ | 16.42 | | | $ | 14.60 | | | $ | 14.25 | |
| | | | |
| | | | | |
Total Return(e) | | | | | | | | | | | | | | | | | | | | |
Based on net asset value | | | 18.05% | | | | (7.27)% | | | | 14.05% | | | | 4.17% | | | | (0.74)% | |
| | | | |
| | | | | |
Ratios to Average Net Assets(f) | | | | | | | | | | | | | | | | | | | | |
Total expenses | | | 0.79% | | | | 0.78% | | | | 0.79% | | | | 0.83% | | | | 0.77% | |
| | | | |
Total expenses after fees waived and/or reimbursed | | | 0.57% | | | | 0.58% | | | | 0.58% | | | | 0.58% | | | | 0.58% | |
| | | | |
Total expenses after fees waived and/or reimbursed and excluding dividend expense, broker fees and expenses on short sales, interest expense and stock loan fees | | | 0.57% | | | | 0.57% | | | | 0.57% | | | | 0.57% | | | | 0.57% | |
| | | | |
Net investment income | | | 1.72% | | | | 1.67% | | | | 1.56% | | | | 1.62% | | | | 1.52% | |
| | | | |
| | | | | |
Supplemental Data | | | | | | | | | | | | | | | | | | | | |
Net assets, end of year (000) | | $ | 185,582 | | | $ | 173,983 | | | $ | 211,555 | | | $ | 206,525 | | | $ | 229,649 | |
| | | | |
Portfolio turnover rate | | | 207% | | | | 145% | | | | 129% | | | | 134% | | | | 89%(g) | |
| | | | |
|
(a) Consolidated Financial Highlights. (b) Based on average shares outstanding. (c) Distributions for annual periods determined in accordance with U.S. federal income tax regulations. (d) Amount is greater than $(0.005) per share. (e) Where applicable, excludes insurance-related fees and expenses and assumes the reinvestment of distributions. (f) Excludes expenses incurred indirectly as a result of investments in underlying funds as follows: | |
| |
| | | Year Ended December 31, | |
| | | 2019 | | | 2018 | | | 2017 | | | 2016 | | | 2015 | |
| |
Investments in underlying funds | | | — | % | | | 0.02 | % | | | 0.01 | % | | | — | % | | | — | % |
| | | | |
| (g) | Includes mortgage dollar roll transactions (“MDRs”). Excluding MDRs, the portfolio turnover rate would have been 87%. |
See notes to financial statements.
| | |
| 146 | | 2019 BLACKROCK ANNUAL REPORTTO SHAREHOLDERS |
Financial Highlights
(For a share outstanding throughout each period)
| | | | | | | | | | | | | | | | | | | | |
| | | BlackRock Government Money Market Portfolio | |
| |
| | | Year Ended December 31, | |
| | | 2019 | | | 2018 | | | 2017 | | | 2016 | | | 2015 | |
| |
| | | | | |
Net asset value, beginning of year | | $ | 1.00 | | | $ | 1.00 | | | $ | 1.00 | | | $ | 1.00 | | | $ | 1.00 | |
| | | | |
Net investment income | | | 0.0177 | | | | 0.0139 | | | | 0.0044 | | | | 0.0000 | (a) | | | 0.0000(a) | |
Net realized gain | | | 0.0000 | (a) | | | 0.0000 | (a) | | | 0.0000 | (a) | | | 0.0000 | (a) | | | 0.0001 | |
| | | | |
Net increase from investment operations | | | 0.0177 | | | | 0.0139 | | | | 0.0044 | | | | 0.0000 | | | | 0.0001 | |
| | | | |
| | | | | |
Distributions(b) | | | | | | | | | | | | | | | | | | | | |
From net investment income | | | (0.0177) | | | | (0.0139) | | | | (0.0044) | | | | (0.0000) | (c) | | | (0.0000)(c) | |
From net realized gain | | | (0.0000) | (c) | | | — | | | | (0.0000) | (c) | | | (0.0000) | (c) | | | (0.0001) | |
| | | | |
Total distributions | | | (0.0177) | | | | (0.0139) | | | | (0.0044) | | | | (0.0000) | | | | (0.0001) | |
| | | | |
| | | | | |
Net asset value, end of year | | $ | 1.00 | | | $ | 1.00 | | | $ | 1.00 | | | $ | 1.00 | | | $ | 1.00 | |
| | | | |
| | | | | |
Total Return(d) | | | | | | | | | | | | | | | | | | | | |
Based on net asset value | | | 1.78% | | | | 1.41% | | | | 0.45% | | | | 0.00% | | | | 0.01% | |
| | | | |
| | | | | |
Ratios to Average Net Assets | | | | | | | | | | | | | | | | | | | | |
Total expenses | | | 0.62% | | | | 0.64% | | | | 0.70% | | | | 0.54% | | | | 0.54% | |
| | | | |
Total expenses after fees waived and/or reimbursed | | | 0.50% | | | | 0.50% | | | | 0.50% | | | | 0.42% | | | | 0.22% | |
| | | | |
Net investment income | | | 1.77% | | | | 1.41% | | | | 0.44% | | | | 0.00% | | | | 0.00% | |
| | | | |
| | | | | |
Supplemental Data | | | | | | | | | | | | | | | | | | | | |
Net assets, end of year (000) | | $ | 112,454 | | | $ | 131,361 | | | $ | 107,299 | | | $ | 122,057 | | | $ | 125,641 | |
| | | | |
| (a) | Amount is less than $0.00005 per share. |
| (b) | Distributions for annual periods determined in accordance with U.S. federal income tax regulations. |
| (c) | Amount is greater than $(0.00005) per share. |
| (d) | Where applicable, excludes insurance-related fees and expenses and assumes the reinvestment of distributions. |
See notes to financial statements.
Financial Highlights
(For a share outstanding throughout each period)
| | | | | | | | | | | | | | | | | | | | |
| | | BlackRock High Yield Portfolio | |
| |
| | | Year Ended December 31, | |
| | | 2019 | | | 2018 | | | 2017 | | | 2016 | | | 2015 | |
| |
| | | | | |
Net asset value, beginning of year | | $ | 5.00 | | | $ | 5.42 | | | $ | 5.31 | | | $ | 4.91 | | | $ | 5.44 | |
| | | | |
Net investment income(a) | | | 0.31 | | | | 0.30 | | | | 0.30 | | | | 0.29 | | | | 0.28 | |
Net realized and unrealized gain (loss) | | | 0.43 | | | | (0.42) | | | | 0.12 | | | | 0.40 | | | | (0.52) | |
| | | | |
Net increase (decrease) from investment operations | | | 0.74 | | | | (0.12) | | | | 0.42 | | | | 0.69 | | | | (0.24) | |
| | | | |
| | | | | |
Distributions(b) | | | | | | | | | | | | | | | | | | | | |
From net investment income | | | (0.31) | | | | (0.30) | | | | (0.31) | | | | (0.29) | | | | (0.29) | |
From return of capital | | | — | | | | (0.00) | (c) | | | — | | | | — | | | | — | |
| | | | |
Total distributions | | | (0.31) | | | | (0.30) | | | | (0.31) | | | | (0.29) | | | | (0.29) | |
| | | | |
| | | | | |
Net asset value, end of year | | $ | 5.43 | | | $ | 5.00 | | | $ | 5.42 | | | $ | 5.31 | | | $ | 4.91 | |
| | | | |
| | | | | |
Total Return(d) | | | | | | | | | | | | | | | | | | | | |
Based on net asset value | | | 15.04% | | | | (2.31)% | (e) | | | 7.95% | | | | 14.43% | | | | (4.65)% | |
| | | | |
| | | | | |
Ratios to Average Net Assets | | | | | | | | | | | | | | | | | | | | |
Total expenses | | | 1.15% | | | | 1.98% | | | | 1.34% | | | | 0.99% | (f) | | | 0.91% | |
| | | | |
Total expenses after fees waived and/or reimbursed | | | 0.50% | | | | 0.50% | | | | 0.50% | | | | 0.50% | (f) | | | 0.50% | |
| | | | |
Net investment income | | | 5.76% | | | | 5.66% | | | | 5.53% | | | | 5.64% | (f) | | | 5.30% | |
| | | | |
| | | | | |
Supplemental Data | | | | | | | | | | | | | | | | | | | | |
Net assets, end of year (000) | | $ | 30,673 | | | $ | 27,068 | | | $ | 32,005 | | | $ | 33,794 | | | $ | 31,788 | |
| | | | |
Portfolio turnover rate | | | 74% | | | | 67% | | | | 73% | | | | 101% | | | | 84% | |
| | | | |
| (a) | Based on average shares outstanding. |
| (b) | Distributions for annual periods determined in accordance with U.S. federal income tax regulations. |
| (c) | Amount is greater than $(0.005) per share. |
| (d) | Where applicable, excludes insurance-related fees and expenses and assumes the reinvestment of distributions. |
| (e) | Includes payment received from an affiliate, which had no impact on the Fund’s total return. |
| (f) | Excludes expenses incurred indirectly as a result of investments in underlying funds of 0.01%. |
See notes to financial statements.
| | |
| 148 | | 2019 BLACKROCK ANNUAL REPORTTO SHAREHOLDERS |
Financial Highlights
(For a share outstanding throughout each period)
| | | | | | | | | | | | | | | | | | | | |
| | | BlackRock U.S. Government Bond Portfolio | |
| |
| | | Year Ended December 31, | |
| | | 2019 | | | 2018 | | | 2017 | | | 2016 | | | 2015 | |
| |
| | | | | |
Net asset value, beginning of year | | $ | 10.58 | | | $ | 10.80 | | | $ | 10.86 | | | $ | 10.90 | | | $ | 11.07 | |
| | | | |
Net investment income(a) | | | 0.27 | | | | 0.25 | | | | 0.21 | | | | 0.17 | | | | 0.17 | |
Net realized and unrealized gain (loss) | | | 0.44 | | | | (0.17) | | | | (0.02) | | | | 0.00 | (b) | | | (0.11) | |
| | | | |
Net increase from investment operations | | | 0.71 | | | | 0.08 | | | | 0.19 | | | | 0.17 | | | | 0.06 | |
| | | | |
Distributions from net investment income(c) | | | (0.28) | | | | (0.30) | | | | (0.25) | | | | (0.21) | | | | (0.23) | |
| | | | |
| | | | | |
Net asset value, end of year | | $ | 11.01 | | | $ | 10.58 | | | $ | 10.80 | | | $ | 10.86 | | | $ | 10.90 | |
| | | | |
| | | | | |
Total Return(d) | | | | | | | | | | | | | | | | | | | | |
Based on net asset value | | | 6.78% | | | | 0.77% | | | | 1.72% | | | | 1.54% | | | | 0.54% | |
| | | | |
| | | | | |
Ratios to Average Net Assets(e) | | | | | | | | | | | | | | | | | | | | |
Total expenses | | | 1.47% | | | | 1.69% | | | | 1.15% | | | | 0.94% | | | | 0.81% | |
| | | | |
Total expenses after fees waived and/or reimbursed | | | 1.02% | | | | 0.86% | | | | 0.63% | | | | 0.59% | | | | 0.53% | |
| | | | |
Total expenses after fees waived and/or reimbursed and excluding interest expense | | | 0.50% | | | | 0.50% | | | | 0.50% | | | | 0.50% | | | | 0.50% | |
| | | | |
Net investment income | | | 2.45% | | | | 2.39% | | | | 1.89% | | | | 1.50% | | | | 1.58% | |
| | | | |
| | | | | |
Supplemental Data | | | | | | | | | | | | | | | | | | | | |
Net assets, end of year (000) | | $ | 54,333 | | | $ | 53,941 | | | $ | 54,580 | | | $ | 60,506 | | | $ | 66,263 | |
| | | | |
Portfolio turnover rate(f) | | | 658% | | | | 728% | | | | 1,058% | | | | 1,004% | | | | 1,421% | |
| | | | |
(a) Based on average shares outstanding. (b) Amount is less than $0.005 per share. (c) Distributions for annual periods determined in accordance with U.S. federal income tax regulations. (d) Where applicable, excludes insurance-related fees and expenses and assumes the reinvestment of distributions. (e) Excludes expenses incurred indirectly as a result of investments in underlying funds as follows: | |
| |
| | | Year Ended December 31, | |
| | | 2019 | | | 2018 | | | 2017 | | | 2016 | | | 2015 | |
| |
Investments in underlying funds | | | 0.01 | % | | | 0.01 | % | | | 0.01 | % | | | — | % | | | 0.01 | % |
| | | | |
(f) Includes mortgage dollar roll transactions (“MDRs”). Additional information regarding portfolio turnover rate is as follows: | |
| | | Year Ended December 31, | |
| | | 2019 | | | 2018 | | | 2017 | | | 2016 | | | 2015 | |
| |
Portfolio turnover rate (excluding MDRs) | | | 425 | % | | | 434 | % | | | 694 | % | | | 631 | % | | | 891 | % |
| | | | |
See notes to financial statements.
Notes to Financial Statements
BlackRock Series Fund, Inc. (“Series Fund”) and BlackRock Series Fund II, Inc. (“Series Fund II” and together with Series Fund, the “Companies” and each, a “Company”) are each registered under the Investment Company Act of 1940, as amended (the “1940 Act”), asopen-end management investment companies. Each Company is organized as a Maryland corporation and is comprised of the separate portfolios indicated below. Series Fund is comprised of 5 separate portfolios and Series Fund II is comprised of 2 separate portfolios. The following are referred to herein collectively as the “Funds” or individually as a “Fund”:
| | | | | | |
| Fund Name | | Company | | Herein Referred To As | | Diversification
Classification |
BlackRock Advantage Large Cap Core Portfolio | | Series Fund | | Advantage Large Cap Core | | Diversified |
BlackRock Balanced Capital Portfolio | | Series Fund | | Balanced Capital | | Diversified |
BlackRock Capital Appreciation Portfolio | | Series Fund | | Capital Appreciation | | Diversified |
BlackRock Global Allocation Portfolio | | Series Fund | | Global Allocation | | Diversified |
BlackRock Government Money Market Portfolio | | Series Fund | | Government Money Market | | Diversified |
BlackRock High Yield Portfolio | | Series Fund II | | High Yield | | Diversified |
BlackRock U.S. Government Bond Portfolio | | Series Fund II | | U.S. Government Bond | | Diversified |
The Funds offer shares to insurance companies for their separate accounts to fund benefits under certain variable annuity and variable life insurance contracts.
Advantage Large Cap Core, Balanced Capital, Capital Appreciation, Global Allocation and Government Money Market, together with certain other registered investment companies advised by BlackRock Advisors, LLC (the “Manager”) or its affiliates, are included in a complex of equity, multi-asset, index and money market funds referred to as the BlackRock Multi-Asset Complex.
High Yield and U.S Government Bond, together with certain other registered investment companies advised by the Manager or its affiliates, are included in a complex ofnon-indexfixed-income mutual funds and all BlackRock-advisedclosed-end funds referred to as the BlackRock Fixed-Income Complex.
Government Money Market operates as a “government money market fund” under Rule2a-7 under the 1940 Act. The Fund is not subject to liquidity fees or temporary suspensions of redemptions due to declines in the Fund’s weekly liquid assets.
Basis of Consolidation:The accompanying consolidated financial statements of Global Allocation include the accounts of BlackRock Cayman Global Allocation Portfolio I, Ltd. (the “Subsidiary”), which is a wholly-owned subsidiary of Global Allocation and primarily invests in commodity-related instruments and other derivatives. The Subsidiary enables Global Allocation to hold these commodity-related instruments and satisfy regulated investment company tax requirements. Global Allocation may invest up to 25% of its total assets in the Subsidiary. The net assets of the Subsidiary as of period end were $5,635,560, which is 3.0% of Global Allocation’s consolidated net assets. Intercompany accounts and transactions, if any, have been eliminated. The Subsidiary is subject to the same investment policies and restrictions that apply to Global Allocation, except that the Subsidiary may invest without limitation in commodity-related instruments.
| 2. | SIGNIFICANT ACCOUNTING POLICIES |
The financial statements are prepared in conformity with accounting principles generally accepted in the United States of America (“U.S. GAAP”), which may require management to make estimates and assumptions that affect the reported amounts of assets and liabilities in the financial statements, disclosure of contingent assets and liabilities at the date of the financial statements and the reported amounts of increases and decreases in net assets from operations during the reporting period. Actual results could differ from those estimates. Each Fund is considered an investment company under U.S. GAAP and follows the accounting and reporting guidance applicable to investment companies. Below is a summary of significant accounting policies:
Investment Transactions and Income Recognition:For financial reporting purposes, investment transactions are recorded on the dates the transactions are executed (the “trade dates”) .Realized gains and losses on investment transactions are determined on the identified cost basis. Dividend income is recorded on theex-dividend date. Dividends from foreign securities where theex-dividend date may have passed are subsequently recorded when the Funds are informed of theex-dividend date. Under the applicable foreign tax laws, a withholding tax at various rates may be imposed on capital gains, dividends and interest. Upon notification from issuers, a portion of the dividend income received from a real estate investment trust may be redesignated as a reduction of cost of the related investment and/or realized gain. Interest income, including amortization and accretion of premiums and discounts on debt securities, is recognized on an accrual basis.
Foreign Currency Translation:Each Fund’s books and records are maintained in U.S. dollars. Securities and other assets and liabilities denominated in foreign currencies are translated into U.S. dollars using exchange rates determined as of the close of trading on the New York Stock Exchange (“NYSE”). Purchases and sales of investments are recorded at the rates of exchange prevailing on the respective dates of such transactions. Generally, when the U.S. dollar rises in value against a foreign currency, the investments denominated in that currency will lose value; the opposite effect occurs if the U.S. dollar falls in relative value.
Each Fund does not isolate the portion of the results of operations arising as a result of changes in the exchange rates from the changes in the market prices of investments held or sold for financial reporting purposes. Accordingly, the effects of changes in exchange rates on investments are not segregated in the Statements of Operations from the effects of changes in market prices of those investments, but are included as a component of net realized and unrealized gain (loss) from investments. Each Fund reports realized currency gains (losses) on foreign currency related transactions as components of net realized gain (loss) for financial reporting purposes, whereas such components are generally treated as ordinary income for U.S. federal income tax purposes.
Segregation and Collateralization:In cases where a Fund enters into certain investments (e.g., dollar rolls, TBA sale commitments, futures contracts, forward foreign currency exchange contracts, options written, swaps and short sales) or certain borrowings (e.g., reverse repurchase transactions) that would be treated as “senior securities” for 1940 Act purposes, a Fund may segregate or designate on its books and records cash or liquid assets having a market value at least equal to the amount of its future obligations under such investments or borrowings. Doing so allows the investment or borrowings to be excluded from treatment as a “senior security.” Furthermore, if required
| | |
| 150 | | 2019 BLACKROCK ANNUAL REPORTTO SHAREHOLDERS |
Notes to Financial Statements (continued)
by an exchange or counterparty agreement, the Funds may be required to deliver/deposit cash and/or securities to/with an exchange, or broker-dealer or custodian as collateral for certain investments or obligations.
Distributions:For Government Money Market, High Yield and U.S. Government Bond, distributions from net investment income are declared daily and paid monthly. For Advantage Large Cap Core, Balanced Capital, Capital Appreciation and Global Allocation, distributions from net investment income are declared and paid at least annually. For each Fund, distributions of capital gains are recorded on theex-dividend date and made at least annually. Portions of return of capital distributions under U.S. GAAP may be taxed at ordinary income rates. The character of distributions is determined in accordance with U.S. federal income tax regulations, which may differ from U.S. GAAP. The portion of distributions that exceeds a Fund’s current and accumulated earnings and profits, as measured on a tax basis, constitute a non-taxable return of capital. Realized net capital gains can be offset by capital losses carried forward from prior years. However, certain Funds have capital loss carryforwards frompre-2012 tax years that offset realized net capital gains but do not offset current earnings and profits. Consequently, if distributions in any tax year are less than the Fund’s current earnings and profits but greater than net investment income and net realized capital gains (taxable income), distributions in excess of taxable income are not treated asnon-taxable return of capital, but rather may be taxable to shareholders at ordinary income rates. Under certain circumstances, taxable excess distributions could be significant. See Note 8, Income Tax Information, for the tax character of each Fund’s distributions paid during the year.
Net income and realized gains from investments held by the Subsidiary are treated as ordinary income for tax purposes. If a net loss is realized by the Subsidiary in any taxable year, the loss will generally not be available to offset Global Allocation’s ordinary income and/or capital gains for that year.
Deferred Compensation Plan:Under the Deferred Compensation Plan (the “Plan”) approved by the Board of Directors of Series Fund II effective January 1, 2019, the directors who are not “interested persons” of the Funds, as defined in the 1940 Act (“Independent Directors”), may defer a portion of their annual complex-wide compensation. Deferred amounts earn an approximate return as though equivalent dollar amounts had been invested in common shares of certain funds in the BlackRock Fixed-Income Complex selected by the Independent Directors. This has the same economic effect for the Independent Directors as if the Independent Directors had invested the deferred amounts directly in certain funds in the BlackRock Fixed-Income Complex.
The Plan is not funded and obligations thereunder represent general unsecured claims against the general assets of High Yield and U.S. Government Bond, as applicable. Deferred compensation liabilities are included in the Directors’ and Officer’s fees payable in the Statements of Assets and Liabilities and will remain as a liability of the Funds until such amounts are distributed in accordance with the Plan.
Recent Accounting Standards:The Funds have adopted Financial Accounting Standards Board Accounting Standards Update2017-08 to amend the amortization period for certain purchased callable debt securities held at a premium. Under the new standard, the Funds have changed the amortization period for the premium on certain purchased callable debt securities withnon-contingent call features to the earliest call date. In accordance with the transition provisions of the standard, the Funds applied the amendments on a modified retrospective basis beginning with the fiscal period ended December 31, 2019. The adjusted cost basis of securities at December 31, 2018, if applicable, are as follows:
| | | | |
Balanced Capital | | $ | 491,079,614 | |
Global Allocation | | | 180,617,794 | |
High Yield | | | 28,970,079 | |
U.S. Government Bond | | | 65,040,692 | |
This change in accounting policy has been made to comply with the newly issued accounting standard and had no impact on accumulated earnings (loss) or the net asset value (“NAV”) of the Funds.
Indemnifications:In the normal course of business, a Fund enters into contracts that contain a variety of representations that provide general indemnification. A Fund’s maximum exposure under these arrangements is unknown because it involves future potential claims against a Fund, which cannot be predicted with any certainty.
Other:Expenses directly related to a Fund are charged to that Fund. Other operating expenses shared by several funds, including other funds managed by the Manager, are prorated among those funds on the basis of relative net assets or other appropriate methods.
Global Allocation has an arrangement with its custodian whereby credits are earned on uninvested cash balances, which could be used to reduce custody fees and/or overdraft charges. Global Allocation may incur charges on certain uninvested cash balances and overdrafts, subject to certain conditions.
| 3. | INVESTMENT VALUATION AND FAIR VALUE MEASUREMENTS |
Investment Valuation Policies:The Funds’ (except Government Money Market) investments are valued at fair value (also referred to as “market value” within the financial statements) as of the close of trading on the NYSE (generally 4:00 p.m., Eastern time). U.S. GAAP defines fair value as the price the Funds would receive to sell an asset or pay to transfer a liability in an orderly transaction between market participants at the measurement date. The Funds determine the fair values of their financial instruments using various independent dealers or pricing services under policies approved by the Boards of Directors of the Companies (each a” Board” and together the “Boards”). The BlackRock Global Valuation Methodologies Committee (the “Global Valuation Committee”) is the committee formed by management to develop global pricing policies and procedures and to oversee the pricing function for all financial instruments. U.S. GAAP defines fair value as the price Government Money Market would receive to sell an asset or pay to transfer a liability in an orderly transaction between market participants at the measurement date. Government Money Market’s investments are valued under the amortized cost method which approximates current market value in accordance with Rule2a-7 under the 1940 Act. Under this method, investments are valued at cost when purchased and, thereafter, a constant proportionate accretion of discounts and amortization of premiums are recorded until the maturity of the security. Government Money Market seeks to maintain its NAV per share at $1.00, although there is no assurance that it will be able to do so on a continuing basis.
Fair Value Inputs and Methodologies:The following methods and inputs are used to establish the fair value of each Fund’s (except Government Money Market) assets and liabilities:
| | | | |
| NOTESTO FINANCIAL STATEMENTS | | | 151 | |
Notes to Financial Statements (continued)
| | • | | Equity investments traded on a recognized securities exchange are valued at the official closing price each day, if available. For equity investments traded on more than one exchange, the official closing price on the exchange where the stock is primarily traded is used. Equity investments traded on a recognized exchange for which there were no sales on that day may be valued at the last available bid (long positions) or ask (short positions) price. |
| | • | | Fixed-income securities for which market quotations are readily available are generally valued using the last available bid prices or current market quotations provided by independent dealers or third party pricing services. Floating rate loan interests are valued at the mean of the bid prices from one or more independent brokers or dealers as obtained from a third party pricing service. Pricing services generally valuefixed-income securities assuming orderly transactions of an institutional round lot size, but a fund may hold or transact in such securities in smaller, odd lot sizes. Odd lots may trade at lower prices than institutional round lots. The pricing services may use matrix pricing or valuation models that utilize certain inputs and assumptions to derive values, including transaction data (e.g., recent representative bids and offers), credit quality information, perceived market movements, news, and other relevant information. Certainfixed-income securities, including asset-backed and mortgage related securities may be valued based on valuation models that consider the estimated cash flows of each tranche of the entity, establish a benchmark yield and develop an estimated tranche specific spread to the benchmark yield based on the unique attributes of the tranche. The amortized cost method of valuation may be used with respect to debt obligations with sixty days or less remaining to maturity unless the Manager determines such method does not represent fair value. |
Generally, trading in foreign instruments is substantially completed each day at various times prior to the close of trading on the NYSE. Occasionally, events affecting the values of such instruments may occur between the foreign market close and the close of trading on the NYSE that may not be reflected in the computation of the Funds’ net assets. Each business day, the Funds use a pricing service to assist with the valuation of certain foreign exchange-traded equity securities and foreign exchange-traded andover-the-counter (“OTC”) options (the “Systematic Fair Value Price”). Using current market factors, the Systematic Fair Value Price is designed to value such foreign securities and foreign options at fair value as of the close of trading on the NYSE, which follows the close of the local markets.
| | • | | Municipal investments (including commitments to purchase such investments on a “when-issued” basis) are valued on the basis of prices provided by dealers or pricing services. In determining the value of a particular investment, pricing services may use certain information with respect to transactions in such investments, quotations from dealers, pricing matrixes, market transactions in comparable investments and information with respect to various relationships between investments. |
| | • | | Investments inopen-end U.S. mutual funds are valued at NAV each business day. |
| | • | | The Funds value their investment in SL Liquidity Series, LLC, Money Market Series (the “Money Market Series”) at fair value, which is ordinarily based upon their pro rata ownership in the underlying fund’s net assets. The Money Market Series seeks current income consistent with maintaining liquidity and preserving capital. Although the Money Market Series is not registered under the 1940 Act, its investments may follow the parameters of investments by a money market fund that is subject to Rule2a-7 under the 1940 Act. |
| | • | | Futures contracts traded on exchanges are valued at their last sale price. |
| | • | | Forward foreign currency exchange contracts are valued at the mean between the bid and ask prices and are determined as of the close of trading on the NYSE based on that day’s prevailing forward exchange rate for the underlying currencies. Interpolated values are derived when the settlement date of the contract is an interim date for which quotations are not available. |
| | • | | Exchange-traded options are valued at the mean between the last bid and ask prices at the close of the options market in which the options trade. An exchange-traded option for which there is no mean price is valued at the last bid (long positions) or ask (short positions) price. If no bid or ask price is available, the prior day’s price will be used, unless it is determined that the prior day’s price no longer reflects the fair value of the option. OTC options and options on swaps (“swaptions”) are valued by an independent pricing service using a mathematical model, which incorporates a number of market data factors, such as the trades and prices of the underlying instruments. |
| | • | | Swap agreements are valued utilizing quotes received daily by the Funds’ pricing service or through brokers, which are derived using daily swap curves and models that incorporate a number of market data factors, such as discounted cash flows, trades and values of the underlying reference instruments. |
| | • | | To-be-announced (“TBA”) commitments are valued on the basis of last available bid prices or current market quotations provided by pricing services. |
If events (e.g., a company announcement, market volatility or a natural disaster) occur that are expected to materially affect the value of such investments, or in the event that the application of these methods of valuation results in a price for an investment that is deemed not to be representative of the market value of such investment, or if a price is not available, the investment will be valued by the Global Valuation Committee, or its delegate, in accordance with a policy approved by the Boards as reflecting fair value (“Fair Valued Investments”). The fair valuation approaches that may be used by the Global Valuation Committee will include market approach, income approach and cost approach. Valuation techniques such as discounted cash flow, use of market comparables and matrix pricing are types of valuation approaches and are typically used in determining fair value. When determining the price for Fair Valued Investments, the Global Valuation Committee, or its delegate, seeks to determine the price that each Fund might reasonably expect to receive or pay from the current sale or purchase of that asset or liability in anarm’s-length transaction. Fair value determinations shall be based upon all available factors that the Global Valuation Committee, or its delegate, deems relevant and consistent with the principles of fair value measurement. The pricing of all Fair Valued Investments is subsequently reported to the Boards or a committee thereof on a quarterly basis.
| | |
| 152 | | 2019 BLACKROCK ANNUAL REPORTTO SHAREHOLDERS |
Notes to Financial Statements (continued)
For investments in equity or debt issued by privately held companies or funds (“Private Company” or collectively, the “Private Companies”) and other Fair Valued Investments, the fair valuation approaches that are used by the Global Valuation Committee and third party pricing services utilize one or a combination of, but not limited to, the following inputs.
| | | | |
| | | Standard Inputs Generally Considered By Third Party Pricing Services |
Market approach | | | | (i) recent market transactions, including subsequent rounds of financing, in the underlying investment or comparable issuers; (ii) recapitalizations and other transactions across the capital structure; and (iii) market multiples of comparable issuers. |
Income approach | | | | (i) future cash flows discounted to present and adjusted as appropriate for liquidity, credit, and/or market risks; (ii) quoted prices for similar investments or assets in active markets; and (iii) other risk factors, such as interest rates, yield curves, volatilities, prepayment speeds, loss severities, credit risks, recovery rates, liquidation amounts and/or default rates. |
Cost approach | | | | (i) audited or unaudited financial statements, investor communications and financial or operational metrics issued by the Private Company; (ii) changes in the valuation of relevant indices or publicly traded companies comparable to the Private Company; (iii) relevant news and other public sources; and (iv) known secondary market transactions in the Private Company’s interests and merger or acquisition activity in companies comparable to the Private Company. |
Investments in series of preferred stock issued by Private Companies are typically valued utilizing market approach in determining the enterprise value of the company. Such investments often contain rights and preferences that differ from other series of preferred and common stock of the same issuer. Valuation techniques such as an option pricing model (“OPM”), a probability weighted expected return model (“PWERM”) or a hybrid of those techniques are used in allocating enterprise value of the company, as deemed appropriate under the circumstances. The use of OPM and PWERM techniques involve a determination of the exit scenarios of the investment in order to appropriately allocate the enterprise value of the company among the various parts of its capital structure.
The Private Companies are not subject to the public company disclosure, timing, and reporting standards as other investments held by a Fund. Typically, the most recently available information by a Private Company is as of a date that is earlier than the date a Fund is calculating its NAV. This factor may result in a difference between the value of the investment and the price a Fund could receive upon the sale of the investment.
Fair Value Hierarchy: Various inputs are used in determining the fair value of investments and derivative financial instruments. These inputs to valuation techniques are categorized into a fair value hierarchy consisting of three broad levels for financial statement purposes as follows:
| | • | | Level 1 — Unadjusted price quotations in active markets/exchanges for identical assets or liabilities that each Fund has the ability to access |
| | • | | Level 2 — Other observable inputs (including, but not limited to, quoted prices for similar assets or liabilities in markets that are active, quoted prices for identical or similar assets or liabilities in markets that are not active, inputs other than quoted prices that are observable for the assets or liabilities (such as interest rates, yield curves, volatilities, prepayment speeds, loss severities, credit risks and default rates) or other market–corroborated inputs) |
| | • | | Level 3 — Unobservable inputs based on the best information available in the circumstances, to the extent observable inputs are not available (including the Global Valuation Committee’s assumptions used in determining the fair value of investments and derivative financial instruments) |
The hierarchy gives the highest priority to unadjusted quoted prices in active markets for identical assets or liabilities (Level 1 measurements) and the lowest priority to unobservable inputs (Level 3 measurements). Accordingly, the degree of judgment exercised in determining fair value is greatest for instruments categorized in Level 3. The inputs used to measure fair value may fall into different levels of the fair value hierarchy. In such cases, for disclosure purposes, the fair value hierarchy classification is determined based on the lowest level input that is significant to the fair value measurement in its entirety. Investments classified within Level 3 have significant unobservable inputs used by the Global Valuation Committee in determining the price for Fair Valued Investments. Level 3 investments include equity or debt issued by Private Companies. There may not be a secondary market, and/or there are a limited number of investors. The categorization of a value determined for investments and derivative financial instruments is based on the pricing transparency of the investments and derivative financial instruments and is not necessarily an indication of the risks associated with investing in those securities.
As of December 31, 2019, certain investments of the Funds were valued using NAV per share as no quoted market value is available and therefore have been excluded from the fair value hierarchy.
| 4. | SECURITIES AND OTHER INVESTMENTS |
Asset-Backed and Mortgage-Backed Securities:Asset-backed securities are generally issued as pass-through certificates or as debt instruments. Asset-backed securities issued as pass-through certificates represent undivided fractional ownership interests in an underlying pool of assets. Asset-backed securities issued as debt instruments, which are also known as collateralized obligations, are typically issued as the debt of a special purpose entity organized solely for the purpose of owning such assets and issuing such debt. Asset-backed securities are often backed by a pool of assets representing the obligations of a number of different parties. The yield characteristics of certain asset-backed securities may differ from traditional debt securities. One such major difference is that all or a principal part of the obligations may be prepaid at any time because the underlying assets (i.e., loans) may be prepaid at any time. As a result, a decrease in interest rates in the market may result in increases in the level of prepayments as borrowers, particularly mortgagors, refinance and repay their loans. An increased prepayment rate with respect to an asset-backed security will have the effect of shortening the maturity of the security. In addition, a fund may subsequently have to reinvest the proceeds at lower interest rates. If a fund has purchased such an asset-backed security at a premium, a faster than anticipated prepayment rate could result in a loss of principal to the extent of the premium paid.
| | | | |
| NOTESTO FINANCIAL STATEMENTS | | | 153 | |
Notes to Financial Statements (continued)
For mortgage pass-through securities (the “Mortgage Assets”) there are a number of important differences among the agencies and instrumentalities of the U.S. Government that issue mortgage-related securities and among the securities that they issue. For example, mortgage-related securities guaranteed by Ginnie Mae are guaranteed as to the timely payment of principal and interest by Ginnie Mae and such guarantee is backed by the full faith and credit of the United States. However, mortgage-related securities issued by Freddie Mac and Fannie Mae, including Freddie Mac and Fannie Mae guaranteed mortgage pass-through certificates, which are solely the obligations of Freddie Mac and Fannie Mae, are not backed by or entitled to the full faith and credit of the United States, but are supported by the right of the issuer to borrow from the U.S. Treasury.
Non-agency mortgage-backed securities are securities issued bynon-governmental issuers and have no direct or indirect government guarantees of payment and are subject to various risks.Non-agency mortgage loans are obligations of the borrowers thereunder only and are not typically insured or guaranteed by any other person or entity. The ability of a borrower to repay a loan is dependent upon the income or assets of the borrower. A number of factors, including a general economic downturn, acts of God, terrorism, social unrest and civil disturbances, may impair a borrower’s ability to repay its loans.
Collateralized Debt Obligations:Collateralized debt obligations (“CDOs”), including collateralized bond obligations (“CBOs”) and collateralized loan obligations (“CLOs”), are types of asset-backed securities. A CDO is an entity that is backed by a diversified pool of debt securities (CBOs) or syndicated bank loans (CLOs). The cash flows of the CDO can be split into multiple segments, called “tranches,” which will vary in risk profile and yield. The riskiest segment is the subordinated or “equity” tranche. This tranche bears the greatest risk of defaults from the underlying assets in the CDO and serves to protect the other, more senior, tranches from default in all but the most severe circumstances. Since it is shielded from defaults by the more junior tranches, a” senior” tranche will typically have higher credit ratings and lower yields than their underlying securities, and often receive investment grade ratings from one or more of the nationally recognized rating agencies. Despite the protection from the more junior tranches, senior tranches can experience substantial losses due to actual defaults, increased sensitivity to future defaults and the disappearance of one or more protecting tranches as a result of changes in the credit profile of the underlying pool of assets.
Inflation-Indexed Bonds:Inflation-indexed bonds (other than municipal inflation-indexed and certain corporate inflation-indexed bonds) arefixed-income securities whose principal value is periodically adjusted according to the rate of inflation. If the index measuring inflation rises or falls, the principal value of inflation-indexed bonds (other than municipal inflation-indexed and certain corporate inflation-indexed bonds) will be adjusted upward or downward, and consequently the interest payable on these securities (calculated with respect to a larger or smaller principal amount) will be increased or reduced, respectively. Any upward or downward adjustment in the principal amount of an inflation-indexed bond will be included as interest income in the Statements of Operations, even though investors do not receive their principal until maturity. Repayment of the original bond principal upon maturity (as adjusted for inflation) is guaranteed in the case of U.S. Treasury inflation-indexed bonds. For bonds that do not provide a similar guarantee, the adjusted principal value of the bond repaid at maturity may be less than the original principal. With regard to municipal inflation-indexed bonds and certain corporate inflation-indexed bonds, the inflation adjustment is typically reflected in the semi-annual coupon payment. As a result, the principal value of municipal inflation-indexed bonds and such corporate inflation-indexed bonds does not adjust according to the rate of inflation.
Multiple Class Pass-Through Securities:Multiple class pass-through securities, including collateralized mortgage obligations (“CMOs”) and commercial mortgage-backed securities, may be issued by Ginnie Mae, U.S. Government agencies or instrumentalities or by trusts formed by private originators of, or investors in, mortgage loans. In general, CMOs are debt obligations of a legal entity that are collateralized by a pool of residential or commercial mortgage loans or Mortgage Assets. The payments on these are used to make payments on the CMOs or multiple pass-through securities. Multiple class pass-through securities represent direct ownership interests in the Mortgage Assets. Classes of CMOs include interest only (“IOs”), principal only (“POs”), planned amortization classes and targeted amortization classes. IOs and POs are stripped mortgage-backed securities representing interests in a pool of mortgages, the cash flow from which has been separated into interest and principal components. IOs receive the interest portion of the cash flow while POs receive the principal portion. IOs and POs can be extremely volatile in response to changes in interest rates. As interest rates rise and fall, the value of IOs tends to move in the same direction as interest rates. POs perform best when prepayments on the underlying mortgages rise since this increases the rate at which the principal is returned and the yield to maturity on the PO. When payments on mortgages underlying a PO are slower than anticipated, the life of the PO is lengthened and the yield to maturity is reduced. If the underlying Mortgage Assets experience greater than anticipated prepayments of principal, a fund’s initial investment in the IOs may not fully recoup.
Stripped Mortgage-Backed Securities:Stripped mortgage-backed securities are typically issued by the U.S. Government, its agencies and instrumentalities. Stripped mortgage-backed securities are usually structured with two classes that receive different proportions of the interest (IOs) and principal (POs) distributions on a pool of Mortgage Assets. Stripped mortgage-backed securities may be privately issued.
Zero-Coupon Bonds:Zero-coupon bonds are normally issued at a significant discount from face value and do not provide for periodic interest payments. These bonds may experience greater volatility in market value than other debt obligations of similar maturity which provide for regular interest payments.
Capital Securities and Trust Preferred Securities:Capital securities, including trust preferred securities, are typically issued by corporations, generally in the form of interest-bearing notes with preferred securities characteristics. In the case of trust preferred securities, an affiliated business trust of a corporation issues these securities, generally in the form of beneficial interests in subordinated debentures or similarly structured securities. The securities can be structured with either a fixed or adjustable coupon that can have either a perpetual or stated maturity date. For trust preferred securities, the issuing bank or corporation pays interest to the trust, which is then distributed to holders of these securities as a dividend. Dividends can be deferred without creating an event of default or acceleration, although maturity cannot take place unless all cumulative payment obligations have been met. The deferral of payments does not affect the purchase or sale of these securities in the open market. These securities generally are rated below that of the issuing company’s senior debt securities and are freely callable at the issuer’s option.
Preferred Stocks:Preferred stock has a preference over common stock in liquidation (and generally in receiving dividends as well), but is subordinated to the liabilities of the issuer in all respects. As a general rule, the market value of preferred stock with a fixed dividend rate and no conversion element varies inversely with interest rates and perceived credit risk, while the market price of convertible preferred stock generally also reflects some element of conversion value. Because preferred stock is junior to debt securities and other obligations of the issuer, deterioration in the credit quality of the issuer will cause greater changes in the value of a preferred stock than in a more senior debt security with similar stated yield characteristics. Unlike interest payments on debt securities, preferred stock dividends are payable only if declared by the issuer’s board of directors. Preferred stock also may be subject to optional or mandatory redemption provisions.
| | |
| 154 | | 2019 BLACKROCK ANNUAL REPORTTO SHAREHOLDERS |
Notes to Financial Statements (continued)
Floating Rate Loan Interests:Floating rate loan interests are typically issued to companies (the “borrower”) by banks, other financial institutions, or privately and publicly offered corporations (the “lender”). Floating rate loan interests are generallynon-investment grade, often involve borrowers whose financial condition is troubled or uncertain and companies that are highly leveraged or in bankruptcy proceedings. In addition, transactions in floating rate loan interests may settle on a delayed basis, which may result in proceeds from the sale not being readily available for a fund to make additional investments or meet its redemption obligations. Floating rate loan interests may include fully funded term loans or revolving lines of credit. Floating rate loan interests are typically senior in the corporate capital structure of the borrower. Floating rate loan interests generally pay interest at rates that are periodically determined by reference to a base lending rate plus a premium. Since the rates reset only periodically, changes in prevailing interest rates (and particularly sudden and significant changes) can be expected to cause some fluctuations in the NAV of a fund to the extent that it invests in floating rate loan interests. The base lending rates are generally the lending rate offered by one or more European banks, such as the London Interbank Offered Rate (“LIBOR”), the prime rate offered by one or more U.S. banks or the certificate of deposit rate. Floating rate loan interests may involve foreign borrowers, and investments may be denominated in foreign currencies. These investments are treated as investments in debt securities for purposes of a fund’s investment policies.
When a fund purchases a floating rate loan interest, it may receive a facility fee and when it sells a floating rate loan interest, it may pay a facility fee. On an ongoing basis, a fund may receive a commitment fee based on the undrawn portion of the underlying line of credit amount of a floating rate loan interest. Facility and commitment fees are typically amortized to income over the term of the loan or term of the commitment, respectively. Consent and amendment fees are recorded to income as earned. Prepayment penalty fees, which may be received by a fund upon the prepayment of a floating rate loan interest by a borrower, are recorded as realized gains. A fund may invest in multiple series or tranches of a loan. A different series or tranche may have varying terms and carry different associated risks.
Floating rate loan interests are usually freely callable at the borrower’s option. A fund may invest in such loans in the form of participations in loans (“Participations”) or assignments (“Assignments”) of all or a portion of loans from third parties. Participations typically will result in a fund having a contractual relationship only with the lender, not with the borrower. A fund has the right to receive payments of principal, interest and any fees to which it is entitled only from the lender selling the Participation and only upon receipt by the lender of the payments from the borrower. In connection with purchasing Participations, a fund generally will have no right to enforce compliance by the borrower with the terms of the loan agreement, nor any rights of offset against the borrower. A fund may not benefit directly from any collateral supporting the loan in which it has purchased the Participation. As a result, a fund assumes the credit risk of both the borrower and the lender that is selling the Participation. A fund’s investment in loan participation interests involves the risk of insolvency of the financial intermediaries who are parties to the transactions. In the event of the insolvency of the lender selling the Participation, a fund may be treated as a general creditor of the lender and may not benefit from any offset between the lender and the borrower. Assignments typically result in a fund having a direct contractual relationship with the borrower, and a fund may enforce compliance by the borrower with the terms of the loan agreement.
In connection with floating rate loan interests, certain funds may also enter into unfunded floating rate loan interests (“commitments”). In connection with these commitments, a fund earns a commitment fee, typically set as a percentage of the commitment amount. Such fee income, which is included in interest income in the Statements of Operations, is recognized ratably over the commitment period. Unfunded floating rate loan interests aremarked-to-market daily, and any unrealized appreciation (depreciation) is included in the Statements of Assets and Liabilities and Statements of Operations. As of period end, High Yield had the following unfunded floating rate loan interests:
| | | | | | | | | | | | | | | | |
| Borrower | | Par | | | Commitment
Amount | | | Value | | | Unrealized
Appreciation
(Depreciation) | |
McDermott International, Inc., Term Loan | | $ | 14,309 | | | $ | 13,749 | | | $ | 14,581 | | | $ | 832 | |
Triton Bidco, Term Loan B | | | 33,099 | | | | 32,437 | | | | 33,233 | | | | 796 | |
Forward Commitments, When-Issued and Delayed Delivery Securities:Certain funds may purchase securities on a when-issued basis and may purchase or sell securities on a forward commitment basis. Settlement of such transactions normally occurs within a month or more after the purchase or sale commitment is made. A fund may purchase securities under such conditions with the intention of actually acquiring them, but may enter into a separate agreement to sell the securities before the settlement date. Since the value of securities purchased may fluctuate prior to settlement, a fund may be required to pay more at settlement than the security is worth. In addition, a fund is not entitled to any of the interest earned prior to settlement. When purchasing a security on a delayed delivery basis, a fund assumes the rights and risks of ownership of the security, including the risk of price and yield fluctuations. In the event of default by the counterparty, a fund’s maximum amount of loss is the unrealized appreciation of unsettled when-issued transactions.
TBA Commitments:TBA commitments are forward agreements for the purchase or sale of mortgage-backed securities for a fixed price, with payment and delivery on an agreed upon future settlement date. The specific securities to be delivered are not identified at the trade date. However, delivered securities must meet specified terms, including issuer, rate and mortgage terms. When entering into TBA commitments, a fund may take possession of or deliver the underlying mortgage-backed securities but can extend the settlement or roll the transaction. TBA commitments involve a risk of loss if the value of the security to be purchased or sold declines or increases, respectively, prior to settlement date.
In order to better define contractual rights and to secure rights that will help a fund mitigate their counterparty risk, TBA commitments may be entered into by a fund under Master Securities Forward Transaction Agreements (each, an “MSFTA”). An MSFTA typically contains, among other things, collateral posting terms and netting provisions in the event of default and/or termination event. The collateral requirements are typically calculated by netting themark-to-market amount for each transaction under such agreement and comparing that amount to the value of the collateral currently pledged by a fund and the counterparty. Cash collateral that has been pledged to cover the obligations of a fund and cash collateral received from the counterparty, if any, is reported separately in the Statements of Assets and Liabilities as cash pledged as collateral for TBA commitments or cash received as collateral for TBA commitments, respectively. Non- cash collateral pledged by a fund, if any, is noted in the Schedules of Investments. Typically, a fund is permitted to sell,re-pledge or use the collateral it receives; however, the counterparty is not permitted to do so. To the extent amounts due to a fund are not fully collateralized, contractually or otherwise, a fund bears the risk of loss from counterpartynon-performance.
Mortgage Dollar Roll Transactions:Certain funds may sell TBA mortgage-backed securities and simultaneously contract to repurchase substantially similar (i.e., same type, coupon and maturity) securities on a specific future date at an agreed upon price. During the period between the sale and repurchase, a fund is not entitled to receive interest and principal payments on the securities sold. Mortgage dollar roll transactions are treated as purchases and sales and realize gains and losses on these
| | | | |
| NOTESTO FINANCIAL STATEMENTS | | | 155 | |
Notes to Financial Statements (continued)
transactions. Mortgage dollar rolls involve the risk that the market value of the securities that a fund is required to purchase may decline below the agreed upon repurchase price of those securities.
Repurchase Agreements:Repurchase agreements are commitments to purchase a security from a counterparty who agrees to repurchase the same security at a mutually agreed upon date and price. On a daily basis, the counterparty is required to maintain collateral subject to the agreement and in value no less than the agreed upon repurchase amount. Repurchase agreements may be traded bilaterally, in atri-party arrangement or may be centrally cleared through a sponsoring agent. Subject to the custodial undertaking associated with a tri-party repurchase arrangement and for centrally cleared repurchase agreements, a third party custodian maintains accounts to hold collateral for a fund and its counterparties. Typically, a fund and counterparty are not permitted to sell,re-pledge or use the collateral absent a default by the counterparty or a fund, respectively.
In the event the counterparty defaults and the fair value of the collateral declines, a fund could experience losses, delays and costs in liquidating the collateral.
Repurchase agreements are entered into by a fund under Master Repurchase Agreements (each, an “MRA”). The MRA permits a fund, under certain circumstances including an event of default (such as bankruptcy or insolvency), to offset payables and/or receivables with collateral held by and/or posted to the counterparty. As a result, one single net payment is created. Bankruptcy or insolvency laws of a particular jurisdiction may impose restrictions on or prohibitions against such a right of offset in the event of the MRA counterparty’s bankruptcy or insolvency. Based on the terms of the MRA, a fund receives securities as collateral with a market value in excess of the repurchase price at maturity. Upon a bankruptcy or insolvency of the MRA counterparty, a fund would recognize a liability with respect to such excess collateral. The liability reflects a fund’s obligation under bankruptcy law to return the excess to the counterparty.
Borrowed Bond Agreements:Repurchase agreements may be referred to as borrowed bond agreements when entered into in connection with short sales of bonds. In a borrowed bond agreement, a fund borrows a bond from a counterparty in exchange for cash collateral. The agreement contains a commitment that the security and the cash will be returned to the counterparty and a fund at a mutually agreed upon date. Certain agreements have no stated maturity and can be terminated by either party at any time. Earnings on cash collateral and compensation to the lender of the bond are based on agreed upon rates between a fund and the counterparty. The value of the underlying cash collateral approximates the market value and accrued interest of the borrowed bond. To the extent that a borrowed bond transaction exceeds one business day, the value of the cash collateral in the possession of the counterparty is monitored on a daily basis to ensure the adequacy of the collateral. As the market value of the borrowed bond changes, the cash collateral is periodically increased or decreased with a frequency and in amounts prescribed in the borrowed bond agreement. A fund may also experience delays in gaining access to the collateral.
Reverse Repurchase Agreements:Reverse repurchase agreements are agreements with qualified third party broker dealers in which a fund sells securities to a bank or broker-dealer and agrees to repurchase the same securities at a mutually agreed upon date and price. A fund receives cash from the sale to use for other investment purposes. During the term of the reverse repurchase agreement, a fund continues to receive the principal and interest payments on the securities sold. Certain agreements have no stated maturity and can be terminated by either party at any time. Interest on the value of the reverse repurchase agreements issued and outstanding is based upon competitive market rates determined at the time of issuance. A fund may utilize reverse repurchase agreements when it is anticipated that the interest income to be earned from the investment of the proceeds of the transaction is greater than the interest expense of the transaction. Reverse repurchase agreements involve leverage risk. If a fund suffers a loss on its investment of the transaction proceeds from a reverse repurchase agreement, a fund would still be required to pay the full repurchase price. Further, a fund remains subject to the risk that the market value of the securities repurchased declines below the repurchase price. In such cases, a fund would be required to return a portion of the cash received from the transaction or provide additional securities to the counterparty.
Cash received in exchange for securities delivered plus accrued interest due to the counterparty is recorded as a liability in the Statements of Assets and Liabilities at face value including accrued interest. Due to the short-term nature of the reverse repurchase agreements, face value approximates fair value. Interest payments made by a fund to the counterparties are recorded as a component of interest expense in the Statements of Operations. In periods of increased demand for the security, a fund may receive a fee for the use of the security by the counterparty, which may result in interest income to a fund.
For the year ended December 31, 2019, the average amount of reverse repurchase agreements and the daily weighted average interest rate for the Funds were as follows:
| | | | | | | | |
| | | Balanced
Capital | | | U.S. Government
Bond | |
Average Borrowings | | $ | 2,073,606 | | | $ | 12,575,058 | |
Daily Weighted Average Interest Rate | | | 2.11% | | | | 2.25% | |
Borrowed bond agreements and reverse repurchase transactions are entered into by a fund under Master Repurchase Agreements (each, an “MRA”), which permit a fund, under certain circumstances, including an event of default (such as bankruptcy or insolvency), to offset payables and/or receivables under the MRA with collateral held and/ or posted to the counterparty and create one single net payment due to or from a fund. With borrowed bond agreements and reverse repurchase transactions, typically a fund and counterparty under an MRA are permitted to sell,re-pledge, or use the collateral associated with the transaction. Bankruptcy or insolvency laws of a particular jurisdiction may impose restrictions on or prohibitions against such a right of offset in the event of the MRA counterparty’s bankruptcy or insolvency.Pursuant to the terms of the MRA, a fund receives or posts securities and cash as collateral with a market value in excess of the repurchase price to be paid or received by a fund upon the maturity of the transaction. Upon a bankruptcy or insolvency of the MRA counterparty,a fund is considered an unsecured creditor with respect to excess collateral and, as such, the return of excess collateral may be delayed.
| | |
| 156 | | 2019 BLACKROCK ANNUAL REPORTTO SHAREHOLDERS |
Notes to Financial Statements (continued)
As of period end, the following table is a summary of the Funds’ open borrowed bond agreements and reverse repurchase agreements by counterparty which are subject to offset under an MRA on a net basis:
| | | | | | | | | | | | | | | | | | | | | | | | | | | | | | | | | | | | | | | | |
Counterparty | |
| Borrowed
Bond
Agreements |
(a) | |
| Reverse
Repurchase
Agreements |
| |
| Borrowed
Bond
at Value
including
Accrued
Interest |
(b) | |
| Net Amount
before
Collateral |
| |
| Non-cash
Collateral
Received |
| |
| Cash
Collateral
Received |
| |
| Fair Value of
Non-cash
Collateral
Pledged
Including
Accrued
Interest |
(c) | |
| Cash
Collateral
Pledged |
| |
| Net Collateral
(Received) /
Pledged |
| |
| Net Exposure
Due (to) /from
Counterparty |
(d) |
Balanced Capital | | | | | | | | | | | | | | | | | | | | | | | | | | | | | | | | | | | | | |
Bank of America Securities, Inc. | | $ | 2,861,094 | | | $ | — | | | $ | (2,860,863) | | | $ | 231 | | | $ | — | | | $ | — | | | $ | — | | | $ | — | | | $ | — | | | $ | 231 | |
BNP Paribas SA | | | — | | | | (997,548) | | | | — | | | | (997,548) | | | | — | | | | — | | | | 997,247 | | | | — | | | | 997,247 | | | | (301) | |
| | | | | | | | | | | | | | | | | | | | | | | | | | | | | | | | | | | | | | | | |
| | $ | 2,861,094 | | | $ | (997,548) | | | $ | (2,860,863) | | | $ | (997,317) | | | $ | — | | | $ | — | | | $ | 997,247 | | | $ | — | | | $ | 997,247 | | | $ | (70) | |
| | | | | | | | | | | | | | | | | | | | | | | | | | | | | | | | | | | | | | | | |
| (a) | Included in Investments at value — unaffiliated in the Statements of Assets and Liabilities. |
| (b) | Includes accrued interest on borrowed bonds in the amount of $11,258 which is included in interest expense payable in the Statements of Assets and Liabilities. |
| (c) | Net collateral, including accrued interest, with a value of $997,247 has been pledged in connection with open reverse repurchase agreements. Excess of net collateral pledged to the individual counterparty is not shown for financial reporting purposes. |
| (d) | Net exposure represents the net receivable (payable) that would be due from/to the counterparty in the event of default. |
| | | | | | | | | | | | | | | | |
Counterparty | |
| Reverse
Repurchase
Agreements |
| |
| Fair Value of
Non-cash
Collateral
Pledged
Including
Accrued
Interest |
(a) | |
| Cash
Collateral
Pledged |
| |
| Net
Amount |
(b) |
U.S. Government Bond | | | | | | | | | | | | | | | | |
Bank of America Securities, Inc. | | $ | (10,142,309) | | | $ | 10,134,518 | | | $ | — | | | $ | (7,791 | ) |
J.P. Morgan Securities LLC | | | (4,932,515) | | | | 4,932,515 | | | | — | | | | — | |
| | | | | | | | | | | | | | | | |
| | $ | (15,074,824) | | | $ | 15,067,033 | | | $ | — | | | $ | (7,791) | |
| | | | | | | | | | | | | | | | |
| (a) | Collateral with a value of $15,068,948 has been pledged in connection with open reverse repurchase agreements. Excess of collateral pledged to the individual counterparty is not shown for financial reporting purposes. |
| (b) | Net amount represents the net amount payable due to the counterparty in the event of default. |
In the event the counterparty of securities under an MRA files for bankruptcy or becomes insolvent, a fund’s use of the proceeds from the agreement may be restricted while the counterparty, or its trustee or receiver, determines whether or not to enforce a fund’s obligation to repurchase the securities.
Short Sale Transactions (Borrowed Bonds):In short sale transactions, a fund sells a security it does not hold in anticipation of a decline in the market price of that security. When a fund makes a short sale, it will borrow the security sold short (borrowed bond) and deliver thefixed-income security to the counterparty to which it sold the security short. An amount equal to the proceeds received by a fund is reflected as an asset and an equivalent liability. The amount of the liability is subsequentlymarked-to-market to reflect the market value of the short sale. A fund is required to repay the counterparty interest on the security sold short, which, if applicable, is included in interest expense in the Statements of Operations. A fund is exposed to market risk based on the amount, if any, that the market value of the security increases beyond the market value at which the position was sold. Thus, a short sale of a security involves the risk that instead of declining, the price of the security sold short will rise. The short sale of securities involves the possibility of an unlimited loss since there is an unlimited potential for the market price of the security sold short to increase. A gain is limited to the price at which a fund sold the security short. A realized gain or loss is recognized upon the termination of a short sale if the market price is either less than or greater than the proceeds originally received. There is no assurance that a fund will be able to close out a short position at a particular time or at an acceptable price.
Short Sale Transactions (Equities):In short sale transactions, a fund sells a security it does not hold in anticipation of a decline in the market price of that security. When a fund makes a short sale, it will borrow the security sold short from a broker/counterparty and deliver the security to the purchaser. To close out a short position, a fund delivers the same security to the broker and records a liability to reflect the obligation to return the security to the broker. The amount of the liability is subsequentlymarked-to-market to reflect the market value of the short sale. A fund maintains a segregated account of securities or deposits cash with the broker-dealer as collateral for the short sales. Cash deposited with the broker is recorded as an asset in the Statements of Assets and Liabilities. Securities segregated as collateral are denoted in the Schedules of Investments. A fund may pay a financing fee for the difference between the market value of the short position and the cash collateral deposited with the broker which would be recorded as interest expense. A fund is required to repay the counterparty any dividends received on the security sold short, which, if applicable, is shown as dividend expense in the Statements of Operations. A fund may pay a fee on the assets borrowed from the counterparty, which, if applicable, is shown as broker fees and expenses on short sales in the Statements of Operations. A fund is exposed to market risk based on the amount, if any, that the market value of the security increases beyond the market value at which the position was sold. Thus, a short sale of a security involves the risk that instead of declining, the price of the security sold short will rise. The short sale of securities involves the possibility of an unlimited loss since there is an unlimited potential for the market price of the security sold short to increase. Again, limited to the price at which a fund sold the security short. A realized gain or loss is recognized upon the termination of a short sale if the market price is either less than or greater than the proceeds originally received. There is no assurance that a fund will be able to close out a short position at a particular time or at an acceptable price.
| | | | |
| NOTESTO FINANCIAL STATEMENTS | | | 157 | |
Notes to Financial Statements (continued)
Securities Lending:Certain Funds may lend their securities to approved borrowers, such as brokers, dealers and other financial institutions. The borrower pledges and maintains with the Funds collateral consisting of cash, an irrevocable letter of credit issued by a bank, or securities issued or guaranteed by the U.S. Government. The initial collateral received by each Fund is required to have a value of at least 102% of the current value of the loaned securities for securities traded on U.S. exchanges and a value of at least 105% for all other securities. The collateral is maintained thereafter at a value equal to at least 100% of the current market value of the securities on loan. The market value of the loaned securities is determined at the close of each business day of the Fund and any additional required collateral is delivered to the Fund, or excess collateral returned by the Fund, on the next business day. During the term of the loan, the Funds are entitled to all distributions made on or in respect of the loaned securities, but do not receive interest income on securities received as collateral. Loans of securities are terminable at any time and the borrower, after notice, is required to return borrowed securities within the standard time period for settlement of securities transactions.
The market value of any securities on loan, all of which were classified as common stocks and investment companies in the Funds’ Schedules of Investments, and the value of any related collateral are shown separately in the Statements of Assets and Liabilities as a component of investments at value — unaffiliated, and collateral on securities loaned at value, respectively. As of period end, any securities on loan were collateralized by cash and/or U.S. Government obligations. Cash collateral invested by the securities lending agent, BlackRock Investment Management, LLC (“BIM”), if any, is disclosed in the Schedules of Investments.
Securities lending transactions are entered into by the Funds under Master Securities Lending Agreements (each, an “MSLA”), which provide the right, in the event of default (including bankruptcy or insolvency), for thenon-defaulting party to liquidate the collateral and calculate a net exposure to the defaulting party or request additional collateral. In the event that a borrower defaults, the Funds, as lender, would offset the market value of the collateral received against the market value of the securities loaned. When the value of the collateral is greater than that of the market value of the securities loaned, the lender is left with a net amount payable to the defaulting party. However, bankruptcy or insolvency laws of a particular jurisdiction may impose restrictions on or prohibitions against such a right of offset in the event of an MSLA counterparty’s bankruptcy or insolvency. Under the MSLA, absent an event of default, the borrower can resell orre-pledge the loaned securities, and a Fund can reinvest cash collateral received in connection with loaned securities. Upon an event of default, the parties’ obligations to return the securities or collateral to the other party are extinguished, and the parties can resell orre-pledge the loaned securities or the collateral received in connection with the loaned securities in order to satisfy the defaulting party’s net payment obligation for all transactions under the MSLA. The defaulting party remains liable for any deficiency.
As of period end, the following table is a summary of each Funds’ securities lending agreements by counterparty which are subject to offset under an MSLA:
| | | | | | | | | | | | |
Counterparty | |
| Securities
Loaned at Value |
| |
| Cash Collateral
Received |
(a) | |
| Net
Amount |
|
Advantage Large Cap Core | | | | | | | | | | | | |
Citigroup Global Markets, Inc. | | $ | 1,057,850 | | | $ | (1,057,850 | ) | | $ | — | |
Credit Suisse Securities (USA) LLC | | | 1,092,119 | | | | (1,092,119 | ) | | | — | |
Deutsche Bank Securities, Inc. | | | 202,314 | | | | (202,314 | ) | | | — | |
Goldman Sachs & Co. | | | 559,569 | | | | (559,569 | ) | | | — | |
JP Morgan Securities LLC | | | 3,242,693 | | | | (3,242,693 | ) | | | — | |
Morgan Stanley & Co. LLC | | | 1,421,618 | | | | (1,421,618 | ) | | | — | |
| | | | |
| | $ | 7,576,163 | | | $ | (7,576,163 | ) | | $ | — | |
| | | | |
Balanced Capital | | | | | | | | | | | | |
Citigroup Global Markets, Inc. | | | 6,887,479 | | | | (6,887,479 | ) | | | — | |
Credit Suisse Securities (USA) LLC | | | 1,923,094 | | | | (1,923,094 | ) | | | — | |
Deutsche Bank Securities, Inc. | | | 89,889 | | | | (89,889 | ) | | | — | |
Goldman Sachs & Co. | | | 540,679 | | | | (540,679 | ) | | | — | |
JP Morgan Securities LLC | | | 3,965,436 | | | | (3,965,436 | ) | | | — | |
Morgan Stanley & Co. LLC | | | 1,442,218 | | | | (1,442,218 | ) | | | — | |
| | | | |
| | $ | 14,848,795 | | | $ | (14,848,795 | ) | | $ | — | |
| | | | |
Capital Appreciation | | | | | | | | | | | | |
Citigroup Global Markets, Inc. | | | 1,683,209 | | | | (1,683,209 | ) | | | — | |
Credit Suisse Securities (USA) LLC | | | 2,938,498 | | | | (2,938,498 | ) | | | — | |
| | | | |
| | $ | 4,621,707 | | | $ | (4,621,707 | ) | | $ | — | |
| | | | |
Global Allocation | | | | | | | | | | | | |
Citigroup Global Markets, Inc. | | | 952,121 | | | | (952,121 | ) | | | — | |
Credit Suisse Securities (USA) LLC | | | 34,350 | | | | (34,350 | ) | | | — | |
Deutsche Bank Securities, Inc. | | | 95,986 | | | | (95,986 | ) | | | — | |
Goldman Sachs & Co. | | | 499,045 | | | | (499,045 | ) | | | — | |
JP Morgan Securities LLC | | | 934,969 | | | | (934,969 | ) | | | — | |
| | | | |
| | $ | 2,516,471 | | | $ | (2,516,471 | ) | | $ | — | |
| | | | |
| (a) | Collateral received in excess of the market value of securities on loan is not presented in these tables. The total cash collateral received by each Fund is disclosed in the Statements of Assets and Liabilities. |
The risks of securities lending include the risk that the borrower may not provide additional collateral when required or may not return the securities when due. To mitigate these risks, the Funds benefit from a borrower default indemnity provided by BIM. BIM’s indemnity allows for full replacement of the securities loaned to the extent the collateral received does not cover the value on the securities loaned in the event of borrower default. Each Fund could incur a loss if the value of an investment purchased with cash collateral falls below the market value of loaned securities or if the value of an investment purchased with cash collateral falls below the value of the original cash collateral received. Such losses are borne entirely by the Funds.
| | |
| 158 | | 2019 BLACKROCK ANNUAL REPORTTO SHAREHOLDERS |
Notes to Financial Statements (continued)
| 5. | DERIVATIVE FINANCIAL INSTRUMENTS |
The Funds engage in various portfolio investment strategies using derivative contracts both to increase the returns of the Funds and/or to manage their exposure to certain risks such as credit risk, equity risk, interest rate risk, foreign currency exchange rate risk, commodity price risk or other risks (e.g., inflation risk). Derivative financial instruments categorized by risk exposure are included in the Schedules of Investments. These contracts may be transacted on an exchange or OTC.
Futures Contracts:Futures contracts are purchased or sold to gain exposure to, or manage exposure to, changes in interest rates (interest rate risk) and changes in the value of equity securities (equity risk) or foreign currencies (foreign currency exchange rate risk).
Futures contracts are agreements between the Funds and a counterparty to buy or sell a specific quantity of an underlying instrument at a specified price and on a specified date. Depending on the terms of a contract, it is settled either through physical delivery of the underlying instrument on the settlement date or by payment of a cash amount on the settlement date. Upon entering into a futures contract, the Funds are required to deposit initial margin with the broker in the form of cash or securities in an amount that varies depending on a contract’s size and risk profile. The initial margin deposit must then be maintained at an established level over the life of the contract. Amounts pledged, which are considered restricted, are included in cash pledged for futures contracts in the Statements of Assets and Liabilities.
Securities deposited as initial margin are designated in the Schedules of Investments and cash deposited, if any, are shown as cash pledged for futures contracts in the Statements of Assets and Liabilities. Pursuant to the contract, the Funds agree to receive from or pay to the broker an amount of cash equal to the daily fluctuation in market value of the contract (“variation margin”). Variation margin is recorded as unrealized appreciation (depreciation) and, if any, shown as variation margin receivable (or payable) on futures contracts in the Statements of Assets and Liabilities. When the contract is closed, a realized gain or loss is recorded in the Statements of Operations equal to the difference between the notional amount of the contract at the time it was opened and the notional amount at the time it was closed. The use of futures contracts involves the risk of an imperfect correlation in the movements in the price of futures contracts and interest, foreign currency exchange rates or underlying assets.
Forward Foreign Currency Exchange Contracts:Forward foreign currency exchange contracts are entered into to gain or reduce exposure to foreign currencies (foreign currency exchange rate risk).
A forward foreign currency exchange contract is an agreement between two parties to buy and sell a currency at a set exchange rate on a specified date. These contracts help to manage the overall exposure to the currencies in which some of the investments held by the Funds are denominated and in some cases, may be used to obtain exposure to a particular market.
The contract ismarked-to-market daily and the change in market value is recorded as unrealized appreciation (depreciation) in the Statements of Assets and Liabilities. When a contract is closed, a realized gain or loss is recorded in the Statements of Operations equal to the difference between the value at the time it was opened and the value at the time it was closed.Non-deliverable forward foreign currency exchange contracts are settled with the counterparty in cash without the delivery of foreign currency. The use of forward foreign currency exchange contracts involves the risk that the value of a forward foreign currency exchange contract changes unfavorably due to movements in the value of the referenced foreign currencies, and such value may exceed the amount(s) reflected in the Statements of Assets and Liabilities. Cash amounts pledged for forward foreign currency exchange contracts are considered restricted and are included in cash pledged as collateral for OTC derivatives in the Statements of Assets and Liabilities.
Options:Certain Funds purchase and write call and put options to increase or decrease their exposure to the risks of underlying instruments, including equity risk, interest rate risk and/or commodity price risk and/or, in the case of options written, to generate gains from options premiums.
A call option gives the purchaser (holder) of the option the right (but not the obligation) to buy, and obligates the seller (writer) to sell (when the option is exercised) the underlying instrument at the exercise or strike price at any time or at a specified time during the option period. A put option gives the holder the right to sell and obligates the writer to buy the underlying instrument at the exercise or strike price at any time or at a specified time during the option period.
Premiums paid on options purchased and premiums received on options written, as well as the daily fluctuation in market value, are included in investments at value — unaffiliated and options written at value, respectively, in the Statements of Assets and Liabilities. When an instrument is purchased or sold through the exercise of an option, the premium is offset against the cost or proceeds of the underlying instrument. When an option expires, a realized gain or loss is recorded in the Statements of Operations to the extent of the premiums received or paid. When an option is closed or sold, a gain or loss is recorded in the Statements of Operations to the extent the cost of the closing transaction exceeds the premiums received or paid. When the Funds write a call option, such option is typically “covered,” meaning that they hold the underlying instrument subject to being called by the option counterparty. When the Funds write a put option, cash is segregated in an amount sufficient to cover the obligation. These amounts, which are considered restricted, are included in cash pledged as collateral for options written in the Statements of Assets and Liabilities.
| | • | | Swaptions — Certain Funds purchase and write options on swaps (“swaptions”) primarily to preserve a return or spread on a particular investment or portion of the Funds’ holdings, as a duration management technique or to protect against an increase in the price of securities it anticipates purchasing at a later date. The purchaser and writer of a swaption is buying or granting the right to enter into a previously agreed upon interest rate or credit default swap agreement (interest rate risk and/or credit risk) at any time before the expiration of the option. |
| | • | | Interest rate caps and floors — Interest rate caps and floors are entered into to gain or reduce exposure to interest rates (interest rate risk and/or other risk). Caps are agreements whereby one party agrees to make payments to the other, in return for a premium, to the extent that interest rate indexes exceed a specified rate, or “cap.” Floors are agreements whereby one party agrees to make payments to the other, in return for a premium, to the extent that interest rate indexes fall below a specified rate, or “floor.” The maximum potential amount of future payments that a Fund would be required to make under an interest rate cap would be the notional amount times the percentage increase in interest rates determined by the difference between the interest rate index current value and the value at the time the cap was entered into. |
| | • | | Foreign currency options — Certain Funds purchase and write foreign currency options, foreign currency futures and options on foreign currency futures to gain or reduce exposure to foreign currencies (foreign currency exchange rate risk). Foreign currency options give the purchaser the right to buy from or sell to the writer a foreign currency at any time before the expiration of the option. |
| | • | | Barrier options — Certain Funds may purchase and write a variety of options withnon-standard payout structures or other features (“barrier options”) that are generally traded OTC. |
| | | | |
| NOTESTO FINANCIAL STATEMENTS | | | 159 | |
Notes to Financial Statements (continued)
The Funds may invest in various types of barrier options, includingdown-and-out options,down-and-in options, doubleno-touch options,one-touch options,up-and-out options andup-and-in options.Down-and-out options expire worthless to the purchaser if the price of the underlying instrument falls below a specific barrier price level prior to the expiration date.Down-and-in options expire worthless to the purchaser unless the price of the underlying instrument falls below a specific barrier price level prior to the expiration date. Doubleno-touch options provide the purchaser an agreed-upon payout if the price of the underlying instrument does not reach or surpass predetermined barrier price levels prior to the option’s expiration date.One-touch options provide the purchaser an agreed-upon payout if the price of the underlying instrument reaches or surpasses predetermined barrier price levels prior to the expiration date.Up-and-out options expire worthless to the purchaser if the price of the underlying instrument increases beyond a predetermined barrier price level prior to the expiration date.Up-and-in options can only be exercised when the price of the underlying instrument increases beyond a predetermined barrier price level.
In purchasing and writing options, the Funds bear the risk of an unfavorable change in the value of the underlying instrument or the risk that they may not be able to enter into a closing transaction due to an illiquid market. Exercise of a written option could result in the Funds purchasing or selling a security when they otherwise would not, or at a price different from the current market value.
Swaps:Swap contracts are entered into to manage exposure to issuers, markets and securities. Such contracts are agreements between the Funds and a counterparty to make periodic net payments on a specified notional amount or a net payment upon termination. Swap agreements are privately negotiated in the OTC market and may be entered into as a bilateral contract (“OTC swaps”) or centrally cleared (“centrally cleared swaps”).
For OTC swaps, any upfront premiums paid and any upfront fees received are shown as swap premiums paid and swap premiums received, respectively, in the Statements of Assets and Liabilities and amortized over the term of the contract. The daily fluctuation in market value is recorded as unrealized appreciation (depreciation) on OTC Swaps in the Statements of Assets and Liabilities. Payments received or paid are recorded in the Statements of Operations as realized gains or losses, respectively. When an OTC swap is terminated, a realized gain or loss is recorded in the Statements of Operations equal to the difference between the proceeds from (or cost of) the closing transaction and the Funds’ basis in the contract, if any. Generally, the basis of the contract is the premium received or paid.
In a centrally cleared swap, immediately following execution of the swap contract, the swap contract is novated to a central counterparty (the “CCP”) and the Funds’ counterparty on the swap agreement becomes the CCP. The Funds are required to interface with the CCP through the broker. Upon entering into a centrally cleared swap, the Funds are required to deposit initial margin with the broker in the form of cash or securities in an amount that varies depending on the size and risk profile of the particular swap. Securities deposited as initial margin are designated in the Schedules of Investments and cash deposited is shown as cash pledged for centrally cleared swaps in the Statements of Assets and Liabilities. Amounts pledged, which are considered restricted cash, are included in cash pledged for centrally cleared swaps in the Statements of Assets and Liabilities. Pursuant to the contract, the Funds agree to receive from or pay to the broker an amount of cash equal to the daily fluctuation in market value of the contract (“variation margin”). Variation margin is recorded as unrealized appreciation (depreciation) and shown as variation margin receivable (or payable) on centrally cleared swaps in the Statements of Assets and Liabilities. Payments received from (paid to) the counterparty, including at termination, are recorded as realized gains (losses) in the Statements of Operations.
| | • | | Credit default swaps — Credit default swaps are entered into to manage exposure to the market or certain sectors of the market, to reduce risk exposure to defaults of corporate and/or sovereign issuers or to create exposure to corporate and/or sovereign issuers to which a fund is not otherwise exposed (credit risk). |
The Funds may either buy or sell (write) credit default swaps on single-name issuers (corporate or sovereign), a combination or basket of single-name issuers or traded indexes. Credit default swaps are agreements in which the protection buyer pays fixed periodic payments to the seller in consideration for a promise from the protection seller to make a specific payment should a negative credit event take place with respect to the referenced entity (e.g., bankruptcy, failure to pay, obligation acceleration, repudiation, moratorium or restructuring). As a buyer, if an underlying credit event occurs, the Funds will either (i) receive from the seller an amount equal to the notional amount of the swap and deliver the referenced security or underlying securities comprising the index, or (ii) receive a net settlement of cash equal to the notional amount of the swap less the recovery value of the security or underlying securities comprising the index. As a seller (writer), if an underlying credit event occurs, the Funds will either pay the buyer an amount equal to the notional amount of the swap and take delivery of the referenced security or underlying securities comprising the index or pay a net settlement of cash equal to the notional amount of the swap less the recovery value of the security or underlying securities comprising the index.
| | • | | Total return swaps — Total return swaps are entered into to obtain exposure to a security or market without owning such security or investing directly in such market or to exchange the risk/return of one security or market (e.g.,fixed-income) with another security or market (e.g., equity or commodity prices) (equity risk, commodity price risk and/or interest rate risk). |
Total return swaps are agreements in which there is an exchange of cash flows whereby one party commits to make payments based on the total return (distributions plus capital gains/losses) of an underlying instrument, or basket of underlying instruments, in exchange for fixed or floating rate interest payments. If the total return of the instrument(s) or index underlying the transaction exceeds or falls short of the offsetting fixed or floating interest rate obligation, the Funds receive payment from or make a payment to the counterparty.
Certain total return swaps are designed to function as a portfolio of direct investments in long and short equity positions. This means that each Fund has the ability to trade in and out of these long and short positions within the swap and will receive the economic benefits and risks equivalent to direct investment in these positions, subject to certain adjustments due to events related to the counterparty. Benefits and risks include capital appreciation (depreciation), corporate actions and dividends received and paid, all of which are reflected in the swap’s market value. The market value also includes interest charges and credits (“financing fees”) related to the notional values of the long and short positions and cash balances within the swap. These interest charges and credits are based on a specified benchmark rate plus or minus a specified spread determined based upon the country and/or currency of the positions in the portfolio.
Positions within the swap and financing fees are reset periodically. During a reset, any unrealized appreciation (depreciation) on positions and accrued financing fees become available for cash settlement between the Funds and the counterparty. The amounts that are available for cash settlement are recorded as realized gains or losses in the Statements of Operations. Cash settlement in and out of the swap may occur at a reset date or any other date, at the discretion of the Funds and the counterparty, over the life of the agreement. Certain swaps have no stated expiration and can be terminated by either party at any time.
| | |
| 160 | | 2019 BLACKROCK ANNUAL REPORTTO SHAREHOLDERS |
Notes to Financial Statements (continued)
| | • | | Interest rate swaps — Interest rate swaps are entered into to gain or reduce exposure to interest rates or to manage duration, the yield curve or interest rate (interest rate risk). |
Interest rate swaps are agreements in which one party pays a stream of interest payments, either fixed or floating, in exchange for another party’s stream of interest payments, either fixed or floating, on the same notional amount for a specified period of time. In more complex interest rate swaps, the notional principal amount may decline (or amortize) over time.
| | • | | Currency swaps — Currency swaps are entered into to gain or reduce exposure to foreign currencies (foreign currency exchange rate risk). |
Currency swaps are interest rate swaps in which one party pays a stream of interest payments, either fixed or floating, in exchange for another party’s stream of interest payments, either fixed or floating, based on the notional amounts of two different currencies. The notional amounts are typically determined based on the spot exchange rates at the inception of the trade. Currency swaps may also involve an exchange of notional amounts at the start, during and/or at expiration of the contract, either at the current spot rate or another specified rate.
| | • | | Forward swaps — Certain Funds enter into forward interest rate swaps and forward total return swaps. In a forward swap, each Fund and the counterparty agree to make periodic net payments beginning on a specified date or a net payment at termination. |
| | • | | Inflation swaps — Inflation swaps are entered into to gain or reduce exposure to inflation (inflation risk). In an inflation swap, one party makes fixed interest payments on a notional principal amount in exchange for another party’s variable payments based on an inflation index, such as the Consumer Price Index. |
Swap transactions involve, to varying degrees, elements of interest rate, credit and market risk in excess of the amounts recognized in the Statements of Assets and Liabilities. Such risks involve the possibility that there will be no liquid market for these agreements, that the counterparty to the agreements may default on its obligation to perform or disagree as to the meaning of the contractual terms in the agreements, and that there may be unfavorable changes in interest rates and/or market values associated with these transactions.
Master Netting Arrangements:In order to define their contractual rights and to secure rights that will help them mitigate their counterparty risk, the Funds may enter into an International Swaps and Derivatives Association, Inc. Master Agreement (“ISDA Master Agreement”) or similar agreement with their counterparties. An ISDA Master Agreement is a bilateral agreement between each Fund and a counterparty that governs certain OTC derivatives and typically contains, among other things, collateral posting terms and netting provisions in the event of a default and/or termination event. Under an ISDA Master Agreement, each Fund may, under certain circumstances, offset with the counterparty certain derivative financial instruments’ payables and/or receivables with collateral held and/or posted and create one single net payment. The provisions of the ISDA Master Agreement typically permit a single net payment in the event of default including the bankruptcy or insolvency of the counterparty. Bankruptcy or insolvency laws of a particular jurisdiction may restrict or prohibit the right of offset in bankruptcy, insolvency or other events.
Collateral Requirements:For derivatives traded under an ISDA Master Agreement, the collateral requirements are typically calculated by netting themark-to-market amount for each transaction under such agreement and comparing that amount to the value of any collateral currently pledged by the Fund and the counterparty.
Cash collateral that has been pledged to cover obligations of the Funds and cash collateral received from the counterparty, if any, is reported separately in the Statements of Assets and Liabilities as cash pledged as collateral and cash received as collateral, respectively.Non-cash collateral pledged by the Funds, if any, is noted in the Schedules of Investments. Generally, the amount of collateral due from or to a counterparty is subject to a certain minimum transfer amount threshold before a transfer is required, which is determined at the close of business of the Funds. Any additional required collateral is delivered to/pledged by the Funds on the next business day. Typically, the counterparty is not permitted to sell,re-pledge or use cash andnon-cash collateral it receives. A Fund generally agrees not to usenon-cash collateral that it receives but may, absent default or certain other circumstances defined in the underlying ISDA Master Agreement, be permitted to use cash collateral received. In such cases, interest may be paid pursuant to the collateral arrangement with the counterparty. To the extent amounts due to the Funds from their counterparties are not fully collateralized, they bear the risk of loss from counterpartynon-performance. Likewise, to the extent the Funds have delivered collateral to a counterparty and stand ready to perform under the terms of their agreement with such counterparty, they bear the risk of loss from a counterparty in the amount of the value of the collateral in the event the counterparty fails to return such collateral. Based on the terms of agreements, collateral may not be required for all derivative contracts.
For financial reporting purposes, the Funds do not offset derivative assets and derivative liabilities that are subject to netting arrangements, if any, in the Statements of Assets and Liabilities.
| 6. | INVESTMENT ADVISORY AGREEMENTS AND OTHER TRANSACTIONS WITH AFFILIATES |
Investment Advisory:Each Company, on behalf of its respective Funds, entered into an Investment Advisory Agreement with the Manager, the Funds’ investment adviser and an indirect, wholly-owned subsidiary of BlackRock, Inc. (“BlackRock”), to provide investment advisory and administrative services. The Manager is responsible for the management of each Fund’s portfolio and provides the personnel, facilities, equipment and certain other services necessary to the operations of each Fund.
| | | | |
| NOTESTO FINANCIAL STATEMENTS | | | 161 | |
Notes to Financial Statements (continued)
For such services, each Fund pays the Manager a monthly fee based on the percentage of the seven combined Funds’ average daily net assets at the following annual rates:
| | | | |
| Average Daily Net Assets of the Seven Combined Funds | | Investment
Advisory Fees | |
First $250 Million | | | 0.50 | % |
$250 Million - $300 Million | | | 0.45 | |
$300 Million - $400 Million | | | 0.40 | |
$400 Million - $800 Million | | | 0.35 | |
Greater than $800 Million | | | 0.30 | |
The portion of the assets of a Fund to which the rate at each breakpoint level applies will be determined on a “uniform percentage” basis. The uniform percentage applicable to a breakpoint level is determined by dividing the amount of the aggregate average daily net assets of the seven combined Funds that falls within that breakpoint level by the aggregate average daily net assets of the seven combined Funds. The amount of the fee for a Fund at each breakpoint level is determined by multiplying the average daily net assets of that Fund by the uniform percentage applicable to that breakpoint level and multiplying the product by the applicable advisory fee rate.
The Manager provides investment management and other services to the Subsidiary of Global Allocation. The Manager does not receive separate compensation from the Subsidiary for providing investment management or administrative services. However, Global Allocation pays the Manager based on the Fund’s net assets which includes the assets of the Subsidiary.
With respect to Balanced Capital, the Manager entered into separatesub-advisory agreements, effective October 2, 2019, with BlackRock International Limited (“BIL”) and BlackRock (Singapore) Limited (“BRS”) (collectively, the“Sub-Advisers”), each an affiliate of the Manager. The Manager pays BIL and BRS for services they provide for that portion of Balanced Capital for which BIL and BRS, as applicable, acts assub-adviser, a monthly fee that is equal to a percentage of the investment advisory fees paid by Balanced Capital to the Manager.
Distribution Fees:Each Company, on behalf of its respective Funds, entered into a Distribution Agreement with BlackRock Investments, LLC (“BRIL”), an affiliate of the Manager.
Transfer Agent:On behalf of the Funds, the Manager entered into agreements with insurance companies and other financial intermediaries (“Service Organizations”), some of which may be affiliates. Pursuant to these agreements, the Service Organizations provide the Funds with administrative, networking, recordkeeping,sub-transfer agency and shareholder services to underlying investor accounts. For these services, the Service Organizations receive an annual fee per shareholder account, which will vary depending on share class and/or net assets of Fund shareholders serviced by the Service Organizations. For the year ended December 31, 2019, the Funds did not pay any amounts to affiliates in return for these services.
Expense Limitations, Waivers and Reimbursements:With respect to each Fund, the Manager voluntarily agreed to waive its investment advisory fees by the amount of investment advisory fees each Fund pays to the Manager indirectly through its investment in affiliated money market funds (the “affiliated money market fund waiver”). The amount of waivers and/or reimbursements of fees and expenses made pursuant to the expense limitation described below will be reduced by the amount of the affiliated money market fund waiver. However, the Manager does not waive its investment advisory fees by the amount of investment advisory fees paid in connection with Government Money Market’s investments in other affiliated investment companies, if any. These amounts are included in fees waived and/or reimbursed by the Manager in the Statements of Operations. For the year ended December 31, 2019, the amounts waived were as follows:
| | | | |
Advantage Large Cap Core | | $ | 1,189 | |
Balanced Capital | | | 8,823 | |
Capital Appreciation | | | 744 | |
Global Allocation | | | 665 | |
High Yield | | | 398 | |
U.S. Government Bond | | | 1,224 | |
The Manager has contractually agreed to waive its investment advisory fee with respect to any portion of each Fund’s assets (other than Government Money Market) invested in affiliated equity andfixed-income mutual funds and affiliated exchange-traded funds that have a contractual management fee through April 30, 2020. The contractual agreement may be terminated upon 90 days’ notice by a majority of the Independent Directors, or by a vote of a majority of the outstanding voting securities of a Fund. These amounts are included in fees waived and/or reimbursed by the Manager in the Statements of Operations. For the year ended December 31, 2019, the amounts waived in investment advisory fees pursuant to these arrangements were as follows:
| | | | |
Balanced Capital | | $ | 245 | |
Global Allocation | | | 2,102 | |
| | |
| 162 | | 2019 BLACKROCK ANNUAL REPORTTO SHAREHOLDERS |
Notes to Financial Statements (continued)
For the year ended December 31, 2019, the Funds reimbursed the Manager for certain accounting services, which is included in accounting services in the Statements of Operations. The reimbursements were as follows:
| | | | |
Advantage Large Cap Core | | $ | 2,216 | |
Balanced Capital | | | 6,045 | |
Capital Appreciation | | | 2,338 | |
Global Allocation | | | 2,201 | |
Government Money Market | | | 1,712 | |
High Yield | | | 375 | |
U.S. Government Bond | | | 696 | |
The Manager has contractually agreed to reimburse certain transfer agent fees in order to limit such expenses to a percentage of average daily net assets as follows:
| | | | |
Advantage Large Cap Core | | | 0.04 | % |
Balanced Capital | | | 0.04 | |
Capital Appreciation | | | 0.04 | |
Global Allocation | | | 0.04 | |
Government Money Market | | | 0.02 | |
High Yield | | | 0.05 | |
U.S. Government Bond | | | 0.05 | |
The Manager has agreed not to reduce or discontinue this contractual expense limitation prior to April 30, 2020. The contractual agreement may be terminated, with respect to each Fund, upon 90 days’ notice by a majority of the Independent Directors of the Funds, or by a vote of a majority of the outstanding voting securities of a Fund.
These amounts waived and/or reimbursed are included in transfer agent fees waived and/or reimbursed in the Statements of Operations. For the year ended December 31, 2019, class specific expense waivers and/or reimbursement are as follows:
| | | | |
Advantage Large Cap Core | | $ | 166,976 | |
Balanced Capital | | | 484,108 | |
Capital Appreciation | | | 176,617 | |
Global Allocation | | | 187,985 | |
Government Money Market | | | 142,969 | |
High Yield | | | 27,129 | |
U.S. Government Bond | | | 51,182 | |
With respect to each Fund, the Manager contractually agreed to waive and/or reimburse fees or expenses in order to limit expenses, excluding interest expense, dividend expense, tax expense, acquired fund fees and expenses, and certain other fund expenses, which constitute extraordinary expenses not incurred in the ordinary course of each Fund’s business (“expense limitation”). The expense limitations as a percentage of average daily net assets are as follows:
| | | | |
Advantage Large Cap Core | | | 0.50 | % |
Balanced Capital | | | 0.50 | |
Capital Appreciation | | | 0.57 | |
Global Allocation | | | 0.57 | |
Government Money Market | | | 0.50 | |
High Yield | | | 0.50 | |
U.S. Government Bond | | | 0.50 | |
The Manager has agreed not to reduce or discontinue these contractual expense limitations through April 30, 2020. The contractual agreement may be terminated, with respect to each Fund, upon 90 days’ notice by a majority of the Independent Directors of the Funds, or by a vote of a majority of the outstanding voting securities of a Fund. For the year ended December 31, 2019, the following amounts are included in fees waived and/or reimbursed by the Manager and transfer agent fees waived and/or reimbursed in the Statements of Operations:
| | | | |
| | | Fees Waived
and/or
Reimbursed
By the Manager | |
Advantage Large Cap Core | | $ | 101 | |
Global Allocation | | | 136,656 | |
Government Money Market | | | 1,961 | |
High Yield | | | 154,166 | |
U.S. Government Bond | | | 164,850 | |
| | | | |
| NOTESTO FINANCIAL STATEMENTS | | | 163 | |
Notes to Financial Statements (continued)
| | | | |
| | | Transfer Agent
Fees Waived and/
or Reimbursed | |
Advantage Large Cap Core | | $ | 15,708 | |
Balanced Capital | | | 7,984 | |
Global Allocation | | | 72,390 | |
Government Money Market | | | 3,306 | |
High Yield | | | 15,053 | |
U.S. Government Bond | | | 27,532 | |
The Manager voluntarily agreed to waive a portion of its management fees and/or reimburse operating expenses to enable Government Money Market to maintain minimum levels of daily net investment income, if applicable. For the year ended December 31, 2019, there were no fees waived and/or reimbursed by the Manager under this agreement. The Manager may discontinue the waiver or reimbursement at any time.
Securities Lending:The U.S. Securities and Exchange Commission (“SEC”) has issued an exemptive order which permits BIM, an affiliate of the Manager, to serve as securities lending agent for the Funds, subject to applicable conditions. As securities lending agent, BIM bears all operational costs directly related to securities lending. The Funds are responsible for expenses in connection with the investment of cash collateral received for securities on loan (the “collateral investment expenses”). The cash collateral is invested in a private investment company managed by the Manager or its affiliates. However, BIM has agreed to cap the collateral investment expenses of the private investment company to an annual rate of 0.04%. The investment adviser to the private investment company will not charge any advisory fees with respect to shares purchased by the Funds. The private investment company in which the cash collateral has been invested may, under certain circumstances, impose a liquidity fee of up to 2% of the value withdrawn or temporarily restrict withdrawals for up to 10 business days during a 90 day period, in the event that the private investment company’s weekly liquid assets fall below certain thresholds.
Securities lending income is equal to the total of income earned from the reinvestment of cash collateral, net of fees and other payments to and from borrowers of securities, and less the collateral investment expenses. Each Fund retains a portion of securities lending income and remits a remaining portion to BIM as compensation for its services as securities lending agent.
Pursuant to the current securities lending agreement, Advantage Large Cap Core, Balanced Capital and Capital Appreciation retain 73.5% of securities lending income (which excludes collateral investment expenses), and this amount retained can never be less than 70% of the total of securities lending income plus the collateral investment expenses.
In addition, commencing the business day following the date that the aggregate securities lending income earned across the BlackRock Multi-Asset Complex in a calendar year exceeds a specified threshold, Advantage Large Cap Core, Balanced Capital and Capital Appreciation, pursuant to the securities lending agreement, will retain for the remainder of that calendar year securities lending income in an amount equal to 80% of securities lending income (which excludes collateral investment expenses), and this amount retained can never be less than 70% of the total of securities lending income plus the collateral investment expenses.
Pursuant to the current securities lending agreement, Global Allocation, Government Money Market, High Yield and U.S. Government Bond retain 82% of securities lending income (which excludes collateral investment expenses), and this amount retained can never be less than 70% of the total of securities lending income plus the collateral investment expenses.
In addition, commencing the business day following the date that the aggregate securities lending income earned across the BlackRock Multi-Asset or Fixed-Income Complexes, as applicable, in a calendar year exceeds a specified threshold, Global Allocation, Government Money Market, High Yield and U.S. Government Bond, pursuant to the securities lending agreement, will retain for the remainder of that calendar year securities lending income in an amount equal to 85% of securities lending income (which excludes collateral investment expenses), and this amount retained can never be less than 70% of the total of securities lending income plus the collateral investment expenses.
The share of securities lending income earned by each Fund is shown as securities lending income — affiliated — net in the Statements of Operations. For the year ended December 31, 2019, each Fund paid BIM the following amounts for securities lending agent services:
| | | | |
Advantage Large Cap Core | | $ | 7,616 | |
Balanced Capital | | | 13,961 | |
Capital Appreciation | | | 3,851 | |
Global Allocation | | | 1,977 | |
Interfund Lending:In accordance with an exemptive order (the “Order”) from the SEC, each Fund may participate in a joint lending and borrowing facility for temporary purposes (the “Interfund Lending Program”), subject to compliance with the terms and conditions of the Order, and to the extent permitted by each Fund’s investment policies and restrictions. Each Fund is currently permitted to borrow and lend under the Interfund Lending Program.
A lending BlackRock fund may lend in aggregate up to 15% of its net assets, but may not lend more than 5% of its net assets to any one borrowing fund through the Interfund Lending Program. A borrowing BlackRock fund may not borrow through the Interfund Lending Program or from any other source more than 33 1/3% of its total assets (or any lower threshold provided for by the fund’s investment restrictions). If a borrowing BlackRock fund’s total outstanding borrowings exceed 10% of its total assets, each of its outstanding interfund loans will be subject to collateralization of at least 102% of the outstanding principal value of the loan. All interfund loans are for temporary or emergency purposes and the interest rate to be charged will be the average of the highest current overnight repurchase agreement rate available to a lending fund and the bank loan rate, as calculated according to a formula established by the Boards.
During the year ended December 31, 2019, the Funds did not participate in the Interfund Lending Program.
| | |
| 164 | | 2019 BLACKROCK ANNUAL REPORT TO SHAREHOLDERS |
Notes to Financial Statements (continued)
Directors and Officers:Certain directors and/or officers of the Companies are directors and/or officers of BlackRock or its affiliates. The Funds reimburse the Manager for a portion of the compensation paid to the Companies’ Chief Compliance Officer, which is included in Directors and Officer in the Statements of Operations.
Other Transactions:The Funds may purchase securities from, or sell securities to, an affiliated fund provided the affiliation is due solely to having a common investment adviser, common officers, or common directors. For the year ended December 31, 2019, the purchase and sale transactions and any net realized gains (losses) with affiliated funds in compliance with Rule17a-7 under the 1940 Act were as follows:
| | | | | | | | | | | | |
| | | Purchases | | | Sales | | | Net Realized Gain (Loss) | |
Balanced Capital | | $ | 147,127 | | | $ | 67,339 | | | $ | 2,710 | |
Capital Appreciation | | | 62,390 | | | | — | | | | — | |
High Yield | | | 54,412 | | | | — | | | | — | |
For the year ended December 31, 2019, purchases and sales of investments, including mortgage dollar rolls and paydowns and excluding short-term securities, were as follows:
| | | | | | | | | | | | | | | | | | | | | | | | |
| | | Advantage Large Cap
Core | | | Balanced Capital | | | Capital Appreciation | | | Global Allocation | | | High Yield | | | U.S. Government
Bond | |
Purchases | | | | | | | | | | | | | | | | | | | | | | | | |
Non-U.S. Government Securities | | $ | 232,392,982 | | | $ | 1,497,574,222 | | | $ | 77,803,059 | | | $ | 148,596,530 | | | $ | 23,996,266 | | | $ | 354,717,869 | |
U.S. Government Securities | | | — | | | | 74,064,413 | | | | — | | | | 191,770,330 | | | | — | | | | 60,936,101 | |
| | | | |
| | $ | 232,392,982 | | | $ | 1,571,638,635 | | | $ | 77,803,059 | | | $ | 340,366,860 | | | $ | 23,996,266 | | | $ | 415,653,970 | |
| | | | |
Sales | | | | | | | | | | | | | | | | | | | | | | | | |
Non-U.S. Government Securities | | $ | 246,421,701 | | | $ | 1,519,738,857 | | | $ | 92,873,933 | | | $ | 150,552,128 | | | $ | 21,752,863 | | | $ | 349,576,762 | |
U.S. Government Securities | | | — | | | | 60,136,498 | | | | — | | | | 215,448,988 | | | | — | | | | 60,631,716 | |
| | | | |
| | $ | 246,421,701 | | | $ | 1,579,875,355 | | | $ | 92,873,933 | | | $ | 366,001,116 | | | $ | 21,752,863 | | | $ | 410,208,478 | |
| | | | |
For the year ended December 31, 2019, purchases and sales related to mortgage dollar rolls were as follows:
| | | | | | | | |
| | | Balanced Capital | | | U.S. Government
Bond | |
Purchases | | $ | 448,876,080 | | | $ | 145,343,973 | |
Sales | | | 448,851,442 | | | | 145,456,434 | |
It is each Fund’s policy to comply with the requirements of the Internal Revenue Code of 1986, as amended, applicable to regulated investment companies, and to distribute substantially all of its taxable income to its shareholders. Therefore, no U.S. federal income tax provision is required, except with respect to any taxes related to the Subsidiary.
Each Fund files U.S. federal and various state and local tax returns. No income tax returns are currently under examination. The statute of limitations on each Fund’s U.S. federal tax returns generally remains open for each of the four years ended December 31, 2019. The statutes of limitations on each Fund’s state and local tax returns may remain open for an additional year depending upon the jurisdiction.
Management has analyzed tax laws and regulations and their application to the Funds as of December 31, 2019, inclusive of the open tax return years, and does not believe that there are any uncertain tax positions that require recognition of a tax liability in the Funds’ financial statements.
U.S. GAAP requires that certain components of net assets be adjusted to reflect permanent differences between financial and tax reporting. These reclassifications have no effect on net assets or net asset values per share. As of period end, the following permanent differences attributable to investment in wholly owned subsidiaries and the classification of investments, were reclassified to the following accounts:
| | | | | | | | |
| | | Global Allocation | | | High Yield | |
Paid-in capital | | $ | 117,023 | | | | (64 | ) |
Accumulated earnings (losses) | | | (117,023 | ) | | | 64 | |
| | | | |
| NOTESTO FINANCIAL STATEMENTS | | | 165 | |
Notes to Financial Statements (continued)
The tax character of distributions paid was as follows:
| | | | | | | | | | | | | | | | |
| | | Ordinary Income | | | Long-Term Capital
Gains | | | Tax Return of
Capital | | | Total | |
Advantage Large Cap Core | | | | | | | | | | | | | | | | |
12/31/19 | | $ | 3,492,185 | | | $ | 8,360,006 | | | $ | — | | | $ | 11,852,191 | |
12/31/18 | | | 15,692,629 | | | | 8,044,087 | | | | — | | | | 23,736,716 | |
Balanced Capital | | | | | | | | | | | | | | | | |
12/31/19 | | | 18,152,149 | | | | 16,827,678 | | | | — | | | | 34,979,827 | |
12/31/18 | | | 30,251,389 | | | | 12,613,658 | | | | — | | | | 42,865,047 | |
Capital Appreciation | | | | | | | | | | | | | | | | |
12/31/19 | | | 184,784 | | | | 20,827,877 | | | | — | | | | 21,012,661 | |
12/31/18 | | | 1,372,000 | | | | 18,264,188 | | | | — | | | | 19,636,188 | |
Global Allocation | | | | | | | | | | | | | | | | |
12/31/19 | | | 6,673,519 | | | | 1,480,755 | | | | — | | | | 8,154,274 | |
12/31/18 | | | 5,546,837 | | | | 6,774,163 | | | | — | | | | 12,321,000 | |
Government Money Market | | | | | | | | | | | | | | | | |
12/31/19 | | | 2,123,664 | | | | — | | | | — | | | | 2,123,664 | |
12/31/18 | | | 1,777,250 | | | | — | | | | — | | | | 1,777,250 | |
High Yield | | | | | | | | | | | | | | | | |
12/31/19 | | | 1,741,887 | | | | — | | | | — | | | | 1,741,887 | |
12/31/18 | | | 1,697,206 | | | | — | | | | 8,797 | | | | 1,706,003 | |
U.S. Government Bond | | | | | | | | | | | | | | | | |
12/31/19 | | | 1,423,246 | | | | — | | | | — | | | | 1,423,246 | |
12/31/18 | | | 1,565,228 | | | | — | | | | — | | | | 1,565,228 | |
As of period end, the tax components of accumulated earnings (losses) were as follows:
| | | | | | | | | | | | | | | | | | | | |
| | | Undistributed
Ordinary
Income | | | Undistributed
Long-Term
Capital Gains | | | Non-expiring
Capital Loss
Carryforwards (a) | | | Net Unrealized
Gains (Losses) (b) | | | Total | |
Advantage Large Cap Core | | $ | 1,264,355 | | | $ | 863,038 | | | $ | — | | | $ | 20,950,216 | | | $ | 23,077,609 | |
Balanced Capital | | | 1,220,685 | | | | 1,766,153 | | | | — | | | | 36,107,682 | | | | 39,094,520 | |
Capital Appreciation | | | 64,019 | | | | 1,671,887 | | | | — | | | | 64,952,286 | | | | 66,688,192 | |
Global Allocation | | | 322,116 | | | | 1,795,695 | | | | — | | | | 15,119,093 | | | | 17,236,904 | |
Government Money Market | | | 3,318 | | | | — | | | | — | | | | — | | | | 3,318 | |
High Yield | | | — | | | | — | | | | (2,206,579 | ) | | | 773,287 | | | | (1,433,292 | ) |
U.S. Government Bond | | | 46,613 | | | | — | | | | (2,695,521 | ) | | | 1,112,091 | | | | (1,536,817 | ) |
| | (a) | Amount available to offset future realized capital gains. | |
| | (b) | The difference between book-basis andtax-basis net unrealized gains (losses) was attributable primarily to the tax deferral of losses on wash sales and straddles, amortization and accretion methods of premiums and discounts on fixed income securities, the realization for tax purposes of unrealized gains (losses) on certain futures, options and foreign currency contracts, the timing and recognition of partnership income, the accounting for swap agreements, and the classification of investments. | |
During the year ended December 31, 2019, the Fund listed below utilized the following amount of its respective capital loss carryforward:
| | | | |
| | | U.S.
Government
Bond | |
Amount utilized | | $ | 451,184 | |
As of December 31, 2019, gross unrealized appreciation and depreciation for investments and derivatives based on cost for U.S. federal income tax purposes were as follows:
| | | | | | | | | | | | | | | | | | | | | | | | |
| | | Advantage Large
Cap Core | | | Balanced Capital | | | Capital
Appreciation | | | Global Allocation | | | High Yield | | | U.S. Government
Bond | |
| | | | | | |
Tax cost | | $ | 175,949,525 | | | $ | 527,649,992 | | | $ | 135,900,437 | | | $ | 177,135,445 | | | $ | 29,746,161 | | | $ | 77,668,098 | |
| | | | | | | | | | | | | | | | | | | | | | | | |
Gross unrealized appreciation | | $ | 22,293,435 | | | $ | 39,539,609 | | | $ | 65,656,891 | | | $ | 20,751,401 | | | $ | 1,299,731 | | | $ | 1,742,448 | |
Gross unrealized depreciation | | | (1,419,200 | ) | | | (3,461,677 | ) | | | (777,339 | ) | | | (5,308,552 | ) | | | (396,037 | ) | | | (627,506 | ) |
| | | | | | | | | | | | | | | | | | | | | | | | |
Net unrealized appreciation | | $ | 20,874,235 | | | $ | 36,077,932 | | | $ | 64,879,552 | | | $ | 15,442,849 | | | $ | 903,694 | | | $ | 1,114,942 | |
| | | | | | | | | | | | | | | | | | | | | | | | |
| | |
| 166 | | 2019 BLACKROCK ANNUAL REPORTTO SHAREHOLDERS |
Notes to Financial Statements (continued)
The Companies, on behalf of the Funds (except for Government Money Market), along with certain other funds managed by the Manager and its affiliates (“Participating Funds”), are party to a364-day, $2.25 billion credit agreement with a group of lenders. Under this agreement, the Funds may borrow to fund shareholder redemptions. Excluding commitments designated for certain individual funds, the Participating Funds, including the Funds, can borrow up to an aggregate commitment amount of $1.75 billion at any time outstanding, subject to asset coverage and other limitations as specified in the agreement. The credit agreement has the following terms: a fee of 0.10% per annum on unused commitment amounts and interest at a rate equal to the higher of(a) one-month LIBOR (but, in any event, not less than 0.00%) on the date the loan is made plus 0.80% per annum or (b) the Fed Funds rate (but, in any event, not less than 0.00%) in effect from time to time plus 0.80% per annum on amounts borrowed. The agreement expires in April 2020 unless extended or renewed. Prior to April 18, 2019, Participating Funds paid an upfront commitment fee of 0.02% on the total commitment amounts, in addition to administration, legal and arrangement fees, which are included in miscellaneous expenses in the Statements of Operations. These fees were allocated among such funds based upon portions of the aggregate commitment available to them and relative net assets of Participating Funds. During the year ended December 31, 2019, the Funds did not borrow under the credit agreement.
Many municipalities insure repayment of their bonds, which may reduce the potential for loss due to credit risk. The market value of these bonds may fluctuate for other reasons, including market perception of the value of such insurance, and there is no guarantee that the insurer will meet its obligation.
Inventories of municipal bonds held by brokers and dealers may decrease, which would lessen their ability to make a market in these securities. Such a reduction in market making capacity could potentially decrease a Fund’s ability to buy or sell bonds. As a result, a Fund may sell a security at a lower price, sell other securities to raise cash, or give up an investment opportunity, any of which could have a negative impact on performance. If a Fund needed to sell large blocks of bonds, those sales could further reduce the bonds’ prices and impact performance.
In the normal course of business, certain Funds invest in securities or other instruments and may enter into certain transactions, and such activities subject each Fund to various risks, including among others, fluctuations in the market (market risk) or failure of an issuer to meet all of its obligations. The value of securities or other instruments may also be affected by various factors, including, without limitation: (i) the general economy; (ii) the overall market as well as local, regional or global political and/or social instability; (iii) regulation, taxation or international tax treaties between various countries; or (iv) currency, interest rate and price fluctuations. Each Fund’s prospectus provides details of the risks to which each Fund is subject.
Each Fund may be exposed to prepayment risk, which is the risk that borrowers may exercise their option to prepay principal earlier than scheduled during periods of declining interest rates, which would force each Fund to reinvest in lower yielding securities. Each Fund may also be exposed to reinvestment risk, which is the risk that income from each Fund’s portfolio will decline if each Fund invests the proceeds from matured, traded or calledfixed-income securities at market interest rates that are below each Fund portfolio’s current earnings rate.
Certain obligations held by Government Money Market have a credit enhancement or liquidity feature that may, under certain circumstances, provide for repayment of principal and interest on the obligation when due. These enhancements, which may include letters of credit,stand-by bond purchase agreements and/or third party insurance, are issued by financial institutions. The value of the obligations may be affected by changes in creditworthiness of the entities that provide the credit enhancements or liquidity features. Government Money Market monitors its exposure by reviewing the creditworthiness of the issuers, as well as the financial institutions issuing the credit enhancements and by limiting the amount of holdings with credit enhancements from one financial institution.
The Funds may be exposed to additional risks when reinvesting cash collateral in money market funds that do not seek to maintain a stable NAV per share of $1.00, which may be subject to redemption gates or liquidity fees under certain circumstances.
Valuation Risk:The market values of equities, such as common stocks and preferred securities or equity related investments, such as futures and options, may decline due to general market conditions which are not specifically related to a particular company. They may also decline due to factors which affect a particular industry or industries. A Fund may invest in illiquid investments. An illiquid investment is any investment that a Fund reasonably expects cannot be sold or disposed of in current market conditions in seven calendar days or less without the sale or disposition significantly changing the market value of the investment. A Fund may experience difficulty in selling illiquid investments in a timely manner at the price that they believe the investments are worth. Prices may fluctuate widely over short or extended periods in response to company, market or economic news. Markets also tend to move in cycles, with periods of rising and falling prices. This volatility may cause each Fund’s NAV to experience significant increases or decreases over short periods of time. If there is a general decline in the securities and other markets, the NAV of a Fund may lose value, regardless of the individual results of the securities and other instruments in which a Fund invests.
The price a Fund could receive upon the sale of any particular portfolio investment may differ from a Fund’s valuation of the investment, particularly for securities that trade in thin or volatile markets or that are valued using a fair valuation technique or a price provided by an independent pricing service. Changes to significant unobservable inputs and assumptions (i.e., publicly traded company multiples, growth rate, time to exit) due to the lack of observable inputs may significantly impact the resulting fair value and therefore a Fund’s results of operations. As a result, the price received upon the sale of an investment may be less than the value ascribed by a Fund, and a Fund could realize a greater than expected loss or lesser than expected gain upon the sale of the investment. A Fund’s ability to value its investments may also be impacted by technological issues and/or errors by pricing services or other third party service providers.
Counterparty Credit Risk:The Funds may be exposed to counterparty credit risk, or the risk that an entity may fail to or be unable to perform on its commitments related to unsettled or open transactions. The Funds manage counterparty credit risk by entering into transactions only with counterparties that the Manager believes have the financial resources to honor their obligations and by monitoring the financial stability of those counterparties. Financial assets, which potentially expose the Funds to market, issuer and counterparty credit risks, consist principally of financial instruments and receivables due from counterparties. The extent of the Funds’ exposure to market, issuer and counterparty credit risks with respect to these financial assets is approximately their value recorded in the Statements of Assets and Liabilities, less any collateral held by the Funds.
| | | | |
| NOTESTO FINANCIAL STATEMENTS | | | 167 | |
Notes to Financial Statements (continued)
A derivative contract may suffer amark-to-market loss if the value of the contract decreases due to an unfavorable change in the market rates or values of the underlying instrument. Losses can also occur if the counterparty does not perform under the contract.
A Fund’s risk of loss from counterparty credit risk on OTC derivatives is generally limited to the aggregate unrealized gain less the value of any collateral held by such Fund.
For OTC options purchased, each Fund bears the risk of loss in the amount of the premiums paid plus the positive change in market values net of any collateral held by the Funds should the counterparty fail to perform under the contracts. Options written by the Funds do not typically give rise to counterparty credit risk, as options written generally obligate the Funds, and not the counterparty, to perform. The Funds may be exposed to counterparty credit risk with respect to options written to the extent each Fund deposits collateral with its counterparty to a written option.
With exchange-traded options purchased and futures and centrally cleared swaps, there is less counterparty credit risk to the Funds since the exchange or clearinghouse, as counterparty to such instruments, guarantees against a possible default. The clearinghouse stands between the buyer and the seller of the contract; therefore, credit risk is limited to failure of the clearinghouse. While offset rights may exist under applicable law, a Fund does not have a contractual right of offset against a clearing broker or clearinghouse in the event of a default (including the bankruptcy or insolvency). Additionally, credit risk exists in exchange-traded futures and centrally cleared swaps with respect to initial and variation margin that is held in a clearing broker’s customer accounts. While clearing brokers are required to segregate customer margin from their own assets, in the event that a clearing broker becomes insolvent or goes into bankruptcy and at that time there is a shortfall in the aggregate amount of margin held by the clearing broker for all its clients, typically the shortfall would be allocated on a pro rata basis across all the clearing broker’s customers, potentially resulting in losses to the Funds.
Concentration Risk:As of period end, Capital Appreciation invested a significant portion of its assets in securities in the Information Technology sector. Changes in economic conditions affecting such sector would have a greater impact on Capital Appreciation and could affect the value, income and/or liquidity of positions in such securities.
Certain Funds may invest in securities that are rated below investment grade quality (sometimes called “junk bonds”), which are predominantly speculative, have greater credit risk and generally are less liquid than, and have more volatile prices than, higher quality securities.
Certain Funds invest a significant portion of their assets infixed-income securities and/or use derivatives tied to thefixed-income markets. Changes in market interest rates or economic conditions may affect the value and/or liquidity of such investments. Interest rate risk is the risk that prices of bonds and otherfixed-income securities will increase as interest rates fall and decrease as interest rates rise. The Funds may be subject to a greater risk of rising interest rates due to the current period of historically low rates.
Certain Funds invest a significant portion of their assets in securities backed by commercial or residential mortgage loans or in issuers that hold mortgage and other asset-backed securities. Investment percentages in these securities are presented in the Schedules of Investments. Changes in economic conditions, including delinquencies and/ or defaults on assets underlying these securities, can affect the value, income and/or liquidity of such positions.
| 11. | CAPITAL SHARE TRANSACTIONS |
Transactions in capital shares were as follows:
| | | | | | | | | | | | | | | | |
| | | Year Ended
12/31/19 | | | Year Ended
12/31/18 | |
| | | Shares | | | Amount | | | Shares | | | Amount | |
Advantage Large Cap Core | | | | | | | | | | | | | | | | |
Shares sold | | | 66,878 | | | $ | 1,469,715 | | | | 99,043 | | | $ | 2,482,951 | |
Shares issued in reinvestment of distributions | | | 501,554 | | | | 11,852,191 | | | | 1,179,759 | | | | 23,736,716 | |
Shares redeemed | | | (832,213 | ) | | | (19,085,077 | ) | | | (825,637 | ) | | | (20,781,276 | ) |
| | | | |
Net increase (decrease) | | | (263,781 | ) | | $ | (5,763,171 | ) | | | 453,165 | | | $ | 5,438,391 | |
| | | | |
| | | | |
Balanced Capital | | | | | | | | | | | | | | | | |
Shares sold | | | 132,621 | | | $ | 2,069,462 | | | | 334,548 | | | $ | 5,391,449 | |
Shares issued in reinvestment of distributions | | | 2,208,322 | | | | 34,979,827 | | | | 3,015,997 | | | | 42,865,047 | |
Shares redeemed | | | (3,218,758 | ) | | | (50,591,392 | ) | | | (3,241,325 | ) | | | (52,133,796 | ) |
| | | | |
Net increase (decrease) | | | (877,815 | ) | | $ | (13,542,103 | ) | | | 109,220 | | | $ | (3,877,300 | ) |
| | | | |
| | | | |
Capital Appreciation | | | | | | | | | | | | | | | | |
Shares sold | | | 56,224 | | | $ | 2,303,761 | | | | 146,630 | | | $ | 6,537,756 | |
Shares issued in reinvestment of distributions | | | 490,562 | | | | 21,012,661 | | | | 528,706 | | | | 19,636,188 | |
Shares redeemed | | | (476,802 | ) | | | (20,570,216 | ) | | | (440,896 | ) | | | (19,790,990 | ) |
| | | | |
Net increase. | | | 69,984 | | | $ | 2,746,206 | | | | 234,440 | | | $ | 6,382,954 | |
| | | | |
| | | | |
Global Allocation | | | | | | | | | | | | | | | | |
Shares sold | | | 166,976 | | | $ | 2,557,633 | | | | 254,002 | | | $ | 4,146,671 | |
Shares issued in reinvestment of distributions | | | 511,283 | | | | 8,154,274 | | | | 839,563 | | | | 12,321,000 | |
Shares redeemed | | | (1,352,496 | ) | | | (20,894,767 | ) | | | (1,729,560 | ) | | | (27,841,331 | ) |
| | | | |
Net decrease | | | (674,237 | ) | | $ | (10,182,860 | ) | | | (635,995 | ) | | $ | (11,373,660 | ) |
| | | | |
| | |
| 168 | | 2019 BLACKROCK ANNUAL REPORTTO SHAREHOLDERS |
Notes to Financial Statements (continued)
| | | | | | | | | | | | | | | | |
| | | Year Ended
12/31/19 | | | Year Ended
12/31/18 | |
| | | Shares | | | Amount | | | Shares | | | Amount | |
Government Money Market | | | | | | | | | | | | | | | | |
Shares sold | | | 53,468,807 | | | $ | 53,468,807 | | | | 99,118,478 | | | $ | 99,118,478 | |
Shares issued in reinvestment of distributions | | | 2,119,850 | | | | 2,119,850 | | | | 1,777,250 | | | | 1,777,250 | |
Shares redeemed | | | (74,497,431 | ) | | | (74,497,431 | ) | | | (76,835,254 | ) | | | (76,835,254) | |
| | | | |
Net increase (decrease) | | | (18,908,774 | ) | | $ | (18,908,774 | ) | | | 24,060,474 | | | $ | 24,060,474 | |
| | | | |
| | | | |
High Yield | | | | | | | | | | | | | | | | |
Shares sold | | | 663,278 | | | $ | 3,476,409 | | | | 534,177 | | | $ | 2,855,921 | |
Shares issued in reinvestment of distributions | | | 327,898 | | | | 1,733,975 | | | | 322,100 | | | | 1,715,158 | |
Shares redeemed | | | (761,839 | ) | | | (4,045,309 | ) | | | (1,340,521 | ) | | | (7,115,994) | |
| | | | |
Net increase (decrease) | | | 229,337 | | | $ | 1,165,075 | | | | (484,244 | ) | | $ | (2,544,915) | |
| | | | |
| | | | |
U.S. Government Bond | | | | | | | | | | | | | | | | |
Shares sold | | | 463,896 | | | $ | 5,048,514 | | | | 764,341 | | | $ | 8,076,002 | |
Shares issued in reinvestment of distributions | | | 131,942 | | | | 1,430,787 | | | | 145,821 | | | | 1,539,514 | |
Shares redeemed | | | (757,229 | ) | | | (8,239,076 | ) | | | (866,836 | ) | | | (9,143,433) | |
| | | | |
Net increase (decrease) | | | (161,391 | ) | | $ | (1,759,775 | ) | | | 43,326 | | | $ | 472,083 | |
| | | | |
Management has evaluated the impact of all subsequent events on the Funds through the date the financial statements were issued and has determined that there were no subsequent events requiring adjustment or additional disclosure in the financial statements.
| | | | |
| NOTESTO FINANCIAL STATEMENTS | | | 169 | |
Report of Independent Registered Public Accounting Firm
To the Shareholders of the BlackRock Advantage Large Cap Core Portfolio, BlackRock Balanced Capital Portfolio, BlackRock Capital Appreciation Portfolio, BlackRock Global Allocation Portfolio, BlackRock Government Money Market Portfolio, BlackRock High Yield Portfolio, and BlackRock U.S. Government Bond Portfolio, and the Board of Directors of BlackRock Series Fund, Inc. and BlackRock Series Fund II, Inc.
Opinion on the Financial Statements and Financial Highlights
We have audited the accompanying consolidated statement of assets and liabilities of BlackRock Global Allocation Portfolio of BlackRock Series Fund, Inc. and subsidiary, including the consolidated schedule of investments, as of December 31, 2019, the related consolidated statement of operations for the year then ended, the consolidated statements of changes in net assets for each of the two years in the period then ended, the consolidated financial highlights for each of the five years in the period then ended, and the related notes. We have also audited the accompanying statements of assets and liabilities of BlackRock Advantage Large Cap Core Portfolio, BlackRock Balanced Capital Portfolio, BlackRock Capital Appreciation Portfolio, and BlackRock Government Money Market Portfolio of BlackRock Series Fund, Inc., and of BlackRock High Yield Portfolio and BlackRock U.S. Government Bond Portfolio of BlackRock Series Fund II, Inc., (collectively with BlackRock Global Allocation Portfolio, the “Funds”), including the schedules of investments, as of December 31, 2019, the related statements of operations (and the statement of cash flows for the Blackrock U.S. Government Bond Portfolio) for the year then ended, the statements of changes in net assets for each of the two years in the period then ended, the financial highlights for each of the five years in the period then ended, and the related notes. In our opinion, the financial statements and financial highlights present fairly, in all material respects, the financial position of the Funds as of December 31, 2019, and the results of their operations (and BlackRock U.S. Government Bond Portfolio’s cash flows) for the year then ended, the changes in their net assets for each of the two years in the period then ended, and the financial highlights for each of the five years in the period then ended, in conformity with accounting principles generally accepted in the United States of America.
Basis for Opinion
These financial statements and financial highlights are the responsibility of the Funds’ management. Our responsibility is to express an opinion on the Funds’ financial statements and financial highlights based on our audits. We are a public accounting firm registered with the Public Company Accounting Oversight Board (United States) (PCAOB) and are required to be independent with respect to the Funds in accordance with the U.S. federal securities laws and the applicable rules and regulations of the Securities and Exchange Commission and the PCAOB.
We conducted our audits in accordance with the standards of the PCAOB. Those standards require that we plan and perform the audits to obtain reasonable assurance about whether the financial statements and financial highlights are free of material misstatement, whether due to error or fraud. The Funds are not required to have, nor were we engaged to perform, an audit of their internal control over financial reporting. As part of our audits we are required to obtain an understanding of internal control over financial reporting but not for the purpose of expressing an opinion on the effectiveness of the Funds’ internal control over financial reporting. Accordingly, we express no such opinion.
Our audits included performing procedures to assess the risks of material misstatement of the financial statements and financial highlights, whether due to error or fraud, and performing procedures that respond to those risks. Such procedures included examining, on a test basis, evidence regarding the amounts and disclosures in the financial statements and financial highlights. Our audits also included evaluating the accounting principles used and significant estimates made by management, as well as evaluating the overall presentation of the financial statements and financial highlights. Our procedures included confirmation of securities owned as of December 31, 2019, by correspondence with the custodian, agent banks, and brokers; when replies were not received from agent banks and brokers, we performed other auditing procedures. We believe that our audits provide a reasonable basis for our opinion.
Deloitte & Touche LLP
Boston, Massachusetts
February 14, 2020
We have served as the auditor of one or more BlackRock investment companies since 1992.
| | |
| 170 | | 2019 BLACKROCK ANNUAL REPORTTO SHAREHOLDERS |
Disclosure of InvestmentSub-Advisory Agreements
The Board of Directors (the “Board,” the members of which are referred to as “Board Members”) of BlackRock Series Fund, Inc. (the “Corporation”) met in person on September17-19, 2019 (the “Meeting”) to consider the initial approval of (i) the proposedsub-advisory agreement (the “BILSub-Advisory Agreement”) between BlackRock Advisors, LLC (the “Manager”), the Corporation’s investment adviser, and BlackRock International Limited (“BIL”), with respect to BlackRock Balanced Capital Portfolio (the “Fund”), a series of the Corporation and (ii) the proposedsub-advisory agreement (the “BSLSub-Advisory Agreement,” and together with the BILSub-Advisory Agreement, the“Sub-Advisory Agreements”) between the Manager and BlackRock (Singapore) Limited (“BSL,” and together with BIL, the“Sub-Advisors”) with respect to the Fund.
On the date of the Meeting, the Board consisted of fifteen individuals, thirteen of whom were not “interested persons” of the Corporation or the Fund as defined in the Investment Company Act of 1940, as amended (the “1940 Act”) (the “Independent Board Members”). Consistent with the requirements of the 1940 Act, the Board considers the initial approval of theSub-Advisory Agreements.
At the Meeting, the Board reviewed materials relating to its consideration of eachSub-Advisory Agreement. The Board previously met in person on April 17, 2019 (the “April 2019 Meeting”) and on May14-15, 2019 (the “May 2019 Meeting”) to consider the approval of the continuation of the Corporation’s investment advisory agreement (the “Advisory Agreement”) with the Manager on behalf of the Fund. At the May 2019 Meeting, the Board, including the Independent Board Members, unanimously approved the continuation of the Advisory Agreement with respect to the Fund for a one-year term ending June 30, 2020. A discussion of the basis for the Board’s approval of the Advisory Agreement at the May 2019 Meeting is included in the semi-annual shareholder report for the Fund for the period ended June 30, 2019. The factors considered by the Board at the September 2019 Meeting in connection with approval of the proposedSub-Advisory Agreements were substantially the same as the factors considered at the May 2019 Meeting with respect to approval of the Advisory Agreement.
Following discussion, the Board, including the Independent Board Members, unanimously approved each of the BILSub-Advisory Agreement and the BSLSub-Advisory Agreement, each with respect to the Fund, and each for a two-year term beginning on the effective date of the pertinentSub-Advisory Agreement. Based upon its evaluation of all of the aforementioned factors in their totality, as well as other information, the Board, including the Independent Board Members, was satisfied that the terms of eachSub-Advisory Agreement were fair and reasonable and in the best interest of the Fund, as pertinent, and its shareholders. In arriving at its decision to approve eachSub-Advisory Agreement, the Board did not identify any single factor or group of factors asall-important or controlling, but considered all factors together, and different Board Members may have attributed different weights to the various factors considered. The Independent Board Members were also assisted by the advice of independent legal counsel in making this determination.
| | | | |
| DISCLOSUREOF INVESTMENT SUB-ADVISORY AGREEMENTS | | | 171 | |
Statement Regarding Liquidity Risk Management Program
The Securities and Exchange Commission adopted Rule22e-4 under the Investment Company Act of 1940, as amended (the “Liquidity Rule”) to promote effective liquidity risk management throughout theopen-end investment company industry, thereby reducing the risk that funds will be unable to meet their redemption obligations and mitigating dilution of the interests of fund shareholders.
The Board of Directors (the “Board”) of BlackRock Series Fund, Inc., on behalf of BlackRock Advantage Large Cap Core Portfolio, BlackRock Balanced Capital Portfolio, BlackRock Capital Appreciation Portfolio and BlackRock Global Allocation Portfolio, met on November12-13, 2019 and the Board of BlackRock Series Fund II, Inc., on behalf of BlackRock High Yield Portfolio and BlackRock U.S. Government Bond Portfolio, met on November14-15, 2019 (together, the “Meeting”) to review the liquidity risk management program (the “Program”) applicable to the BlackRockopen-end funds, excluding money market funds (each, a “Fund”), pursuant to the Liquidity Rule. The Board has appointed BlackRock Advisors, LLC or BlackRock Fund Advisors (“BlackRock”), each an investment adviser to certain Funds, as the program administrator for each Fund’s Program, as applicable. BlackRock has delegated oversight of the Program to the 40 Act Liquidity Risk Management Committee (the “Committee”). At the Meeting, the Committee, on behalf of BlackRock, provided the Board with a report that addressed the operation of the Program and assessed its adequacy and effectiveness of implementation, including the operation of each Fund’s Highly Liquid Investment Minimum (“HLIM”) where applicable, and any material changes to the Program (the “Report”). The Report covered the period from December 1, 2018 through September 30, 2019 (the “Program Reporting Period”).
The Report described the Program’s liquidity classification methodology for categorizing a Fund’s investments (including derivative transactions) into one of four liquidity buckets. It also described BlackRock’s methodology in establishing a Fund’s HLIM and noted that the Committee reviews and ratifies the HLIM assigned to each Fund no less frequently than annually.
The Report noted that the Program complied with the key factors for consideration under the Liquidity Rule for assessing, managing and periodically reviewing a Fund’s liquidity risk, as follows:
A. The Fund’s investment strategy and liquidity of portfolio investments during both normal and reasonably foreseeable stressed conditions:During the Program Reporting Period, the Committee reviewed whether each Fund’s strategy is appropriate for anopen-end fund structure with a focus on Funds with more significant and consistent holdings of less liquid and illiquid assets. The Committee also factored a Fund’s concentration in an issuer into the liquidity classification methodology by taking issuer position sizes into account. Where a Fund participated in borrowings for investment purposes (such as tender option bonds and reverse repurchase agreements), such borrowings were factored into the Program’s calculation of a Fund’s liquidity bucketing. Derivative exposure was also considered in such calculation.
B. Short-term and long-term cash flow projections during both normal and reasonably foreseeable stressed conditions:During the Program Reporting Period, the Committee reviewed historical net redemption activity and used this information as a component to establish each Fund’s reasonably anticipated trading size (“RATS”). Each Fund has adopted anin-kind redemption policy which may be utilized to meet larger redemption requests. The Committee may also take into consideration a Fund’s shareholder ownership concentration (which, depending on product type and distribution channel, may or may not be available), a Fund’s distribution channels, and the degree of certainty associated with a Fund’s short-term and long-term cash flow projections.
C. Holdings of cash and cash equivalents, as well as borrowing arrangements:The Committee considered the terms of the credit facility applicable to the Funds, the financial health of the institution providing the facility and the fact that the credit facility is shared among multiple Funds (including that a portion of the aggregate commitment amount is specifically designated for BlackRock Floating Rate Income Portfolio and BlackRock Credit Strategies Income Fund, each a series of BlackRock Funds V). The Committee also considered other types of borrowing available to the Funds, such as the ability to use reverse repurchase agreements and interfund lending, as applicable.
There were no material changes to the Program during the Program Reporting Period. The Report provided to the Board stated that the Committee concluded that based on the operation of the functions, as described in the Report, the Program is operating as intended and is effective in implementing the requirements of the Liquidity Rule.
| | |
| 172 | | 2019 BLACKROCK ANNUAL REPORTTO SHAREHOLDERS |
Director and Officer Information
BlackRock Series Funds, Inc.
| | | | | | | | |
| Independent Directors(a) |
| | | | | |
Name Year of Birth(b) | | Position(s) Held
(Length of Service)(c) | | Principal Occupation(s) During Past Five Years | | Number of BlackRock-Advised
Registered Investment Companies
(“RICs”) Consisting of
Investment Portfolios
(“Portfolios”) Overseen | | Public Company and
Other Investment Company
Directorships Held During
Past Five Years |
Mark Stalnecker 1951 | | Chair of the Board and Director (Since 2019) | | Chief Investment Officer, University of Delaware from 1999 to 2013; Trustee and Chair of the Finance and Investment Committees, Winterthur Museum and Country Estate from 2005 to 2016; Member of the Investment Committee, Delaware Public Employees’ Retirement System since 2002; Member of the Investment Committee, Christiana Care Health System from 2009 to 2017; Member of the Investment Committee, Delaware Community Foundation from 2013 to 2014; Director and Chair of the Audit Committee, SEI Private Trust Co. from 2001 to 2014. | | 37 RICs consisting of 177 Portfolios | | None |
Bruce R. Bond 1946 | | Director (Since 2007) | | Board Member, Amsphere Limited (software) since 2018; Trustee and Member of the Governance Committee, State Street Research Mutual Funds from 1997 to 2005; Board Member of Governance, Audit and Finance Committee, Avaya Inc. (computer equipment) from 2003 to 2007. | | 37 RICs consisting of 177 Portfolios | | None |
Susan J. Carter 1956 | | Director (Since 2019) | | Director, Pacific Pension Institute from 2014 to 2018; Advisory Board Member, Center for Private Equity and Entrepreneurship at Tuck School of Business since 1997; Senior Advisor, Common fund Capital, Inc. (“CCI”) (investment adviser) in 2015; Chief Executive Officer, CCI from 2013 to 2014; President & Chief Executive Officer, CCI from 1997 to 2013; Advisory Board Member, Girls Who Invest from 2015 to 2018 and Board Member thereof since 2018; Advisory Board Member,Bridges Fund Management since 2016; Trustee, Financial Accounting Foundation since 2017; Practitioner Advisory Board Member, Private Capital Research Institute (“PCRI”) since 2017. | | 37 RICs consisting of 177 Portfolios | | None |
Collette Chilton 1958 | | Director (Since 2019) | | Chief Investment Officer,Williams College since 2006; Chief Investment Officer,Lucent Asset Management Corporation from 1998 to 2006. | | 37 RICs consisting of 177 Portfolios | | None |
Neil A. Cotty 1954 | | Director (Since 2019) | | Bank of America Corporation from 1996 to 2015, serving in various senior finance leadership roles, including Chief Accounting Officer from 2009 to 2015, Chief Financial Officer of Global Banking, Markets and Wealth Management from 2008 to 2009, Chief Accounting Officer from 2004 to 2008, Chief Financial Officer of Consumer Bank from 2003 to 2004,Chief Financial Officer of Global Corporate Investment Bank from 1999 to 2002. | | 37 RICs consisting of 177 Portfolios | | None |
Lena G. Goldberg 1949 | | Director (Since 2016) | | Senior Lecturer,Harvard Business School, since 2008; Director, Charles Stark Draper Laboratory,Inc. since 2013; FMR LLC/ Fidelity Investments (financial services) from 1996 to 2008, serving in various senior roles including Executive Vice President -Strategic Corporate Initiatives and Executive Vice President and General Counsel; Partner,Sullivan &Worcester LLP from 1985 to 1996 and Associate thereof from 1979 to 1985. | | 37 RICs consisting of 177 Portfolios | | None |
Robert M. Hernandez 1944 | | Director (Since 2007) | | Director,Vice Chairman and Chief Financial Officer of USX Corporation (energy and steel business) from 1991 to 2001; Director andnon-executive Chairman, RTI International Metals, Inc. from 1990 to 2015; Director,TE Connectivity (electronics) from 2006 to 2012. | | 37 RICs consisting of 177 Portfolios | | Chubb Limited (insurance company); Eastman Chemical Company |
| | | | |
| DIRECTORAND OFFICER INFORMATION | | | 173 | |
Director and Officer Information (continued)
| | | | | | | | |
| Independent Directors(a)(continued) |
| | | | | |
Name Year of Birth(b) | | Position(s) Held (Length of Service)(c) | | Principal Occupation(s) During Past Five Years | | Number of BlackRock-Advised
Registered Investment Companies
(“RICs”) Consisting of Investment
Portfolios (“Portfolios”) Overseen | | Public Company and
Other Investment
Company Directorships
Held During Past Five
Years |
Henry R. Keizer 1956 | | Director (Since 2016) | | Director, Park Indemnity Ltd. (captive insurer) since 2010; Director, MUFG Americas Holdings Corporation and MUFG Union Bank, N.A. (financial and bank holding company) from 2014 to 2016; Director, American Institute of Certified Public Accountants from 2009 to 2011; Director, KPMG LLP (audit, tax and advisory services) from 2004 to 2005 and 2010 to 2012; Director, KPMG International in 2012, Deputy Chairman and Chief Operating Officer thereof from 2010 to 2012 and U.S. Vice Chairman of Audit thereof from 2005 to 2010; Global Head of Audit, KPMGI (consortium of KPMG firms) from 2006 to 2010; Director, YMCA of Greater New York from 2006 to 2010. | | 37 RICs consisting of 177 Portfolios | | Hertz Global Holdings (car rental); Montpelier Re Holdings, Ltd. (publicly held property and casualty reinsurance) from 2013 until 2015; Sealed Air Corp. (packaging); WABCO (commercial vehicle safety systems) |
Cynthia A. Montgomery 1952 | | Director (Since 2019) | | Professor, Harvard Business School since 1989. | | 37 RICs consisting of 177 Portfolios | | Newell Rubbermaid, Inc. (manufacturing) |
Donald C. Opatrny 1952 | | Director (Since 2015) | | Trustee, Vice Chair, Member of the Executive Committee and Chair of the Investment Committee, Cornell University since 2004; President, Trustee and Member of the Investment Committee, The Aldrich Contemporary Art Museum from 2007 to 2014; Member of the Board and Investment Committee, University School from 2007 to 2018; Member of the Investment Committee, Mellon Foundation from 2009 to 2015; Trustee, Artstor (a Mellon Foundation affiliate) from 2010 to 2015; President and Trustee, the Center for the Arts, Jackson Hole from 2011 to 2018; Director, Athena Capital Advisors LLC (investment management firm) since 2013; Trustee and Chair of the Investment Committee, Community Foundation of Jackson Hole since 2014; Member of Affordable Housing Supply Board of Jackson, Wyoming since 2018; Member, Investment Funds Committee, State of Wyoming since 2017; Trustee, Phoenix Art Museum since 2018. | | 37 RICs consisting of 177 Portfolios | | None |
Joseph P. Platt 1947 | | Director (Since 2019) | | General Partner, Thorn Partners, LP (private investments) since 1998; Director, WQED Multi-Media (public broadcastingnot-for- profit) since 2001; Chair, Basic Health International(non-profit) since 2015. | | 37 RICs consisting of 177 Portfolios | | Greenlight Capital Re, Ltd. (reinsurance company); Consol Energy Inc. |
Kenneth L. Urish 1951 | | Director (Since 2019) | | Managing Partner, Urish Popeck & Co., LLC (certified public accountants and consultants) since 1976; Past-Chairman of the Professional Ethics Committee of the Pennsylvania Institute of Certified Public Accountants and Committee Member thereof since 2007; Member of External Advisory Board, The Pennsylvania State University Accounting Department since founding in 2001; Principal, UP Strategic Wealth Investment Advisors, LLC since 2013; Trustee, The Holy Family Institute from 2001 to 2010; President and Trustee, Pittsburgh Catholic Publishing Associates from 2003 to 2008; Director,Inter-Tel from 2006 to 2007. | | 37 RICs consisting of 177 Portfolios | | None |
Claire A. Walton 1957 | | Director (Since 2019) | | Chief Operating Officer and Chief Financial Officer of Liberty Square Asset Management, LP from 1998 to 2015; General Partner of Neon Liberty Capital Management, LLC since 2003; Director, Boston Hedge Fund Group from 2009 to 2018; Director, Woodstock Ski Runners since 2013; Director, Massachusetts Council on Economic Education from 2013 to 2015. | | 37 RICs consisting of 177 Portfolios | | None |
| | |
| 174 | | 2019 BLACKROCK ANNUAL REPORTTO SHAREHOLDERS |
Director and Officer Information(continued)
| | | | | | | | |
| Interested Directors(a)(d) |
| | | | | |
Name
Year of Birth(b) | | Position(s) Held
(Length of Service)(c) | | Principal Occupation(s) During Past Five Years | | Number of BlackRock-Advised
Registered Investment
Companies (“RICs”) Consisting
of Investment Portfolios
(“Portfolios”) Overseen | | Public Company and
Other Investment
Company Directorships
Held During Past Five
Years |
Robert Fairbairn 1965 | | Director (Since 2015) | | Vice Chairman of BlackRock, Inc. since 2019; Member of BlackRock’s Global Executive and Global Operating Committees;Co-Chair of BlackRock’s Human Capital Committee; Senior Managing Director of BlackRock, Inc. from 2010 to 2019; oversaw BlackRock’s Strategic Partner Program and Strategic Product Management Group from 2012 to 2019; Member of the Board of Managers of BlackRock Investments, LLC from 2011 to 2018; Global Head of BlackRock’s Retail and iShares®businesses from 2012 to 2016. | | 123 RICs consisting of 287 Portfolios | | None |
John M. Perlowski(e) 1964 | | Director (Since 2015); President and Chief Executive Officer (Since 2010) | | Managing Director of BlackRock, Inc. since 2009; Head of BlackRock Global Accounting and Product Services since 2009; Advisory Director of Family Resource Network (charitable foundation) since 2009. | | 124 RICs consisting of 288 Portfolios | | None |
| (a) | The address of each Director is c/o BlackRock, Inc., 55 East 52nd Street, New York, New York 10055. |
| (b) | Each Independent Director holds office until his or her successor is duly elected and qualifies or until his or her earlier death, resignation, retirement or removal as provided by the Company’sby-laws or charter or statute, or until December 31 of the year in which he or she turns 75. Directors who are “interested persons,” as defined in the 1940 Act, serve until their successor is duly elected and qualifies or until their earlier death, resignation, retirement or removal as provided by the Company’sby-laws or statute, or until December 31 of the year in which they turn 72. The Board may determine to extend the terms of Independent Directors on acase-by-case basis, as appropriate. |
| (c) | Following the combination of Merrill Lynch Investment Managers, L.P. (“MLIM”) and BlackRock, Inc. in September 2006, the various legacy MLIM and legacy BlackRock fund boards were realigned and consolidated into three new fund boards in 2007. In addition, effective January 1, 2019, three BlackRock Fund Complexes were realigned and consolidated into two BlackRock Fund Complexes. As a result, although the chart shows the year that each Independent Director joined the Board, certain Independent Directors first became members of the boards of other BlackRock-advised Funds, legacy MLIM funds or legacy BlackRock funds as follows: Bruce R. Bond, 2005; Susan J. Carter, 2016; Collette Chilton, 2015; Neil A. Cotty, 2016; Robert M. Hernandez, 1996; Cynthia A. Montgomery, 1994; Joseph P. Platt, 1999; Mark Stalnecker, 2015; Kenneth L. Urish, 1999; Claire A. Walton, 2016. |
| (d) | Mr.Fairbairn and Mr.Perlowski are both “interested persons,” as defined in the 1940 Act, of the Company based on their positions with BlackRock, Inc. and its affiliates. Mr.Fairbairn and Mr. Perlowski are also board members of the BlackRock Fixed-Income Complex. |
| (e) | Mr.Perlowski is also a trustee of the BlackRock Credit Strategies Fund. |
| | | | |
| DIRECTORAND OFFICER INFORMATION | | | 175 | |
Director and Officer Information (continued)
| | | | |
| Officers Who Are Not Directors(a) |
| | | |
Name Year of Birth(b) | | Position(s) Held
(Length of Service) | | Principal Occupation(s) During Past Five Years |
Jennifer McGovern 1977 | | Vice President
(Since 2014) | | Managing Director of BlackRock, Inc. since 2016; Director of BlackRock, Inc. from 2011 to 2015; Head of Product Development and Oversight for BlackRock’s Strategic Product Management Group since 2019; Head of Product Structure and Oversight for BlackRock’s U.S. Wealth Advisory Group from 2013 to 2019. |
Neal J. Andrews 1966 | | Chief Financial Officer
(Since 2007) | | Chief Financial Officer of the iShares®exchange traded funds since 2019; Managing Director of BlackRock, Inc. since 2006. |
Jay M. Fife 1970 | | Treasurer (Since 2007) | | Managing Director of BlackRock, Inc. since 2007. |
Charles Park 1967 | | Chief Compliance Officer
(Since 2014) | | Anti-Money Laundering Compliance Officer for certain BlackRock-advised Funds from 2014 to 2015; Chief Compliance Officer of BlackRock Advisors, LLC and the BlackRock-advised Funds in the BlackRock Multi-Asset Complex and the BlackRock Fixed-Income Complex since 2014; Principal of and Chief Compliance Officer for iShares®Delaware Trust Sponsor LLC since 2012 and BlackRock Fund Advisors (“BFA”) since 2006; Chief Compliance Officer for theBFA-advised iShares®exchange traded funds since 2006; Chief Compliance Officer for BlackRock Asset Management International Inc. since 2012. |
Lisa Belle 1968 | | Anti-Money Laundering
Compliance Officer
(Since 2019) | | Managing Director of BlackRock, Inc. since 2019; Global Financial Crime Head for Asset and Wealth Management of JP Morgan from 2013 to 2019; Managing Director of RBS Securities from 2012 to 2013; Head of Financial Crimes for Barclays Wealth Americas from 2010 to 2012. |
Janey Ahn 1975 | | Secretary
(Since 2019) | | Managing Director of BlackRock, Inc. since 2018; Director of BlackRock, Inc. from 2009 to 2017. |
| (a) | The address of each Officer is c/o BlackRock, Inc., 55 East 52nd Street, New York, New York 10055. |
| (b) | Officers of the Company serve at the pleasure of the Board. |
Effective September 19, 2019, Lisa Belle replaced John MacKessy as the Anti-Money Laundering Compliance Officer of the Company.
Effective September 19, 2019, Janey Ahn replaced Benjamin Archibald as the Secretary of the Company.
Effective December 31, 2019, Robert M. Hernandez retired as Director of the Company.
Investment Adviser and Administrator
BlackRock Advisors, LLC Wilmington, DE 19809
Sub-Advisers(a)
BlackRock International Limited
Edinburgh, EH3 8BL
United Kingdom
BlackRock (Singapore) Limited
079912 Singapore
Accounting Agent
JPMorgan Chase Bank, N.A.
New York, NY 10179
Transfer Agent
BNY Mellon Investment Servicing (US) Inc.
Wilmington, DE 19809
Custodians
JPMorgan Chase Bank, N.A.(b)
New York, NY 10179
Brown Brothers Harriman & Co.(c)
Boston, MA 02109
Independent Registered Public Accounting Firm
Deloitte & Touche LLP
Boston, MA 02116
Distributor
BlackRock Investments, LLC
New York, NY 10022
Legal Counsel
Sidley Austin LLP
New York, NY 10019
Address of the Funds
100 Bellevue Parkway
Wilmington, DE 19809
| (a) | For BlackRock Balanced Capital Portfolio. |
| (b) | For all Funds except BlackRock Global Allocation Portfolio. |
| (c) | For BlackRock Global Allocation Portfolio. |
| | |
| 176 | | 2019 BLACKROCK ANNUAL REPORTTO SHAREHOLDERS |
Director and Officer Information
BlackRock Series Funds II, Inc.
| | | | | | | | |
| Independent Directors(a) |
| | | | | |
Name Year of Birth(b) | | Position(s) Held
(Length of Service)(c) | | Principal Occupation(s) During Past Five Years | | Number of BlackRock-Advised
Registered Investment Companies
(“RICs”) Consisting of Investment
Portfolios (“Portfolios”) Overseen | | Public Company and
Other Investment
Company Directorships
Held During Past Five
Years |
Richard E. Cavanagh 1946 | | Co-Chair of the Board and Director (Since 2019) | | Director, The Guardian Life Insurance Company of America since 1998; Board Chair, Volunteers of America (anot-for-profit organization) from 2015 to 2018 (board member since 2009); Director, Arch Chemicals (chemical and allied products) from 1999 to 2011; Trustee, Educational Testing Service from 1997 to 2009 and Chairman thereof from 2005 to 2009; Senior Advisor, The Fremont Group since 2008 and Director thereof since 1996; Faculty Member/Adjunct Lecturer, Harvard University since 2007 and Executive Dean from 1987 to 1995; President and Chief Executive Officer, The Conference Board, Inc. (global business research organization) from 1995 to 2007. | | 86 RICs consisting of 110 Portfolios | | None |
Karen P. Robards 1950 | | Co-Chair of the Board and Director (Since 2019) | | Principal of Robards & Company, LLC (consulting and private investing) since 1987;Co-founder and Director of the Cooke Center for Learning and Development (anot-for-profit organization) since 1987; Director of Enable Injections, LLC (medical devices) since 2019; Investment Banker at Morgan Stanley from 1976 to 1987. | | 86 RICs consisting of 110 Portfolios | | Greenhill &Co., Inc.; AtriCure, Inc. (medical devices) from 2000 until 2017 |
Michael J. Castellano 1946 | | Director (Since 2019) | | Chief Financial Officer of Lazard Group LLC from 2001 to 2011; Chief Financial Officer of Lazard Ltd from 2004 to 2011; Director, Support Our Aging Religious(non-profit) from 2009 to June 2015 and since 2017; Director, National Advisory Board of Church Management at Villanova University since 2010; Trustee, Domestic Church Media Foundation since 2012; Director, CircleBlack Inc. (financial technology company) since 2015. | �� | 86 RICs consisting of 110 Portfolios | | None |
Cynthia L. Egan 1955 | | Director (Since 2019) | | Advisor, U.S. Department of the Treasury from 2014 to 2015; President, Retirement Plan Services, for T. Rowe Price Group, Inc. from 2007 to 2012; executive positions within Fidelity Investments from 1989 to 2007. | | 86 RICs consisting of 110 Portfolios | | Unum (insurance); The Hanover Insurance Group (insurance); Envestnet (investment platform) from 2013 until 2016 |
Frank J. Fabozzi(d) 1948 | | Director (Since 2019) | | Editor of The Journal of Portfolio Management since 1986; Professor of Finance, EDHEC Business School (France) since 2011; Visiting Professor, Princeton University for the 2013 to 2014 academic year and Spring 2017 semester; Professor in the Practice of Finance, Yale University School of Management from 1994 to 2011 and currently a Teaching Fellow in Yale’s Executive Programs; Board Member, BlackRock Equity-Liquidity Funds from 2014 to 2016; affiliated professor Karlsruhe Institute of Technology from 2008 to 2011. | | 87 RICs consisting of 111 Portfolios | | None |
Henry Gabbay 1947 | | Director (Since 2007) | | Board Member, BlackRock Equity-Bond Board from 2007 to 2018; Board Member, BlackRock Equity-Liquidity and BlackRockClosed-End Fund Boards from 2007 through 2014; Consultant, BlackRock, Inc. from2007 to 2008; Managing Director, BlackRock, Inc. from 1989 to 2007; Chief Administrative Officer, BlackRock Advisors, LLC from 1998 to 2007; President of BlackRock Funds and BlackRock Allocation Target Shares (formerly, BlackRock Bond Allocation Target Shares) from 2005 to 2007 and Treasurer of certainclosed-end funds in the BlackRock fund complex from 1989 to 2006. | | 86 RICs consisting of 110 Portfolios | | None |
R. Glenn Hubbard 1958 | | Director (Since 2019) | | Dean, Columbia Business School from 2004 to 2019; Faculty member, Columbia Business School since 1988. | | 86 RICs consisting of 110 Portfolios | | ADP (data and information services); Metropolitan Life Insurance Company (insurance); KKR Financial Corporation (finance) from 2004 until 2014 |
| | | | |
| DIRECTORAND OFFICER INFORMATION | | | 177 | |
Director and Officer Information (continued)
| | | | | | | | |
| | | Independent Directors(a) (continued) | | | | |
| | | | | |
Name Year of Birth(b) | | Position(s) Held
(Length of Service)(c) | | Principal Occupation(s) During Past Five Years | | Number of BlackRock-Advised
Registered Investment Companies
(“RICs”) Consisting of Investment
Portfolios (“Portfolios”) Overseen | | Public Company and
Other Investment
Company Directorships
Held During Past Five
Years |
W. Carl Kester(d) 1951 | | Director (Since 2019) | | George Fisher Baker Jr. Professor of Business Administration, Harvard Business School since 2008; Deputy Dean for Academic Affairs from 2006 to 2010; Chairman of the Finance Unit, from 2005 to 2006; Senior Associate Dean and Chairman of the MBA Program from 1999 to 2005; Member of the faculty of Harvard Business School since 1981. | | 87 RICs consisting of 111 Portfolios | | None |
Catherine A. Lynch(d) 1961 | | Director (Since 2019) | | Chief Executive Officer, Chief Investment Officer and various other positions, National Railroad Retirement Investment Trust from 2003 to 2016; Associate Vice President for Treasury Management, The George Washington University from 1999 to 2003; Assistant Treasurer, Episcopal Church of America from 1995 to 1999. | | 87 RICs consisting of 111 Portfolios | | None |
| | | |
| | | Interested Directors(a)(e) | | | | |
Robert Fairbairn 1965 | | Director (Since 2015) | | Vice Chairman of BlackRock, Inc. since 2019; Member of BlackRock’s Global Executive and Global Operating Committees;Co-Chair of BlackRock’s Human Capital Committee; Senior Managing Director of BlackRock, Inc. from 2010 to 2019; oversaw BlackRock’s Strategic Partner Program and Strategic Product Management Group from 2012 to 2019; Member of the Board of Managers of BlackRock Investments, LLC from 2011 to 2018; Global Head of BlackRock’s Retail and iShares®businesses from 2012 to 2016. | | 123 RICs consisting of 287 Portfolios | | None |
John M. Perlowski(d) 1964 | | Director (Since 2015); President and Chief Executive Officer (Since 2010) | | Managing Director of BlackRock, Inc. since 2009; Head of BlackRock Global Accounting and Product Services since 2009; Advisory Director of Family Resource Network (charitable foundation) since 2009. | | 124 RICs consisting of 288 Portfolios | | None |
| (a) | The address of each Director is c/o BlackRock, Inc., 55 East 52nd Street, New York, New York 10055. |
| (b) | Each Independent Director holds office until his or her successor is duly elected and qualifies or until his or her earlier death, resignation, retirement or removal as provided by the Trust’sby-laws or charter or statute, or until December 31 of the year in which he or she turns 75. Directors who are “interested persons,” as defined in the Investment Company Act serve until their successor is duly elected and qualifies or until their earlier death, resignation, retirement or removal as provided by the Trust’sby-laws or statute, or until December 31 of the year in which they turn 72. The Board may determine to extend the terms of Independent Directors on acase-by-case basis, as appropriate. |
| (c) | Following the combination of Merrill Lynch Investment Managers, L.P. (“MLIM”) and BlackRock, Inc. in September 2006, the various legacy MLIM and legacy BlackRock fund boards were realigned and consolidated into three new fund boards in 2007. Certain Independent Directors first became members of the boards of other legacy MLIM or legacy BlackRock funds as follows: Richard E. Cavanagh, 1994; Frank J. Fabozzi, 1988; R. Glenn Hubbard, 2004; W. Carl Kester, 1995; and Karen P. Robards, 1998. Certain other Independent Directors became members of the boards of theclosed-end funds in the Fixed-Income Complex as follows: Michael J. Castellano, 2011; Cynthia L. Egan, 2016; and Catherine A. Lynch, 2016. |
| (d) | Dr. Fabozzi, Dr. Kester,Ms. Lynch and Mr. Perlowski are also trustees of the BlackRock Credit Strategies Fund. |
| (e) | Mr. Fairbairn and Mr. Perlowski are both “interested persons,” as defined in the 1940 Act, of the Company based on their positions with BlackRock, Inc. and its affiliates. Mr.Fairbairn and Mr. Perlowski are also board members of the BlackRock Multi-Asset Complex. |
| | |
| 178 | | 2019 BLACKROCK ANNUAL REPORTTO SHAREHOLDERS |
Director and Officer Information (continued)
| | | | |
| Officers Who Are Not Directors(a) |
| | | |
Name Year of Birth(b) | | Position(s) Held
(Length of Service) | | Principal Occupation(s) During Past Five Years |
Jennifer McGovern 1977 | | Vice President (Since 2014) | | Managing Director of BlackRock, Inc. since 2016; Director of BlackRock, Inc. from 2011 to 2015; Head of Product Development and Oversight for BlackRock’s Strategic Product Management Group since 2019; Head of Product Structure and Oversight for BlackRock’s U.S. Wealth Advisory Group from 2013 to 2019. |
Neal J. Andrews 1966 | | Chief Financial Officer (Since 2007) | | Chief Financial Officer of the iShares®exchange traded funds since 2019; Managing Director of BlackRock, Inc. since 2006. |
Jay M. Fife 1970 | | Treasurer (Since 2007) | | Managing Director of BlackRock, Inc. since 2007. |
Charles Park 1967 | | Chief Compliance Officer (Since 2014) | | Anti-Money Laundering Compliance Officer for certain BlackRock-advised Funds from 2014 to 2015; Chief Compliance Officer of BlackRock Advisors, LLC and the BlackRock-advised Funds in the BlackRock Multi-Asset Complex and the BlackRock Fixed-Income Complex since 2014; Principal of and Chief Compliance Officer for iShares®Delaware Trust Sponsor LLC since 2012 and BlackRock Fund Advisors (“BFA”) since 2006; Chief Compliance Officer for theBFA-advised iShares®exchange traded funds since 2006; Chief Compliance Officer for BlackRock Asset Management International Inc. since 2012. |
Lisa Belle 1968 | | Anti-Money Laundering Compliance Officer (Since 2019) | | Managing Director of BlackRock, Inc. since 2019; Global Financial Crime Head for Asset and Wealth Management of JP Morgan from 2013 to 2019; Managing Director of RBS Securities from 2012 to 2013; Head of Financial Crimes for Barclays Wealth Americas from 2010 to 2012. |
Janey Ahn 1975 | | Secretary (Since 2019) | | Managing Director of BlackRock, Inc. since 2018; Director of BlackRock, Inc. from 2009 to 2017. |
| (a) | The address of each Officer is c/o BlackRock, Inc., 55 East 52nd Street, New York, New York 10055. |
| (b) | Officers of the Company serve at the pleasure of the Board. |
Further information about the Company’s Directors and Officers is available in the Company’s Statement of Additional Information, which can be obtained without charge by calling (800)441-7762.
Effective September 4, 2019, Janey Ahn replaced Benjamin Archibald as the Secretary of the Company.
Effective September 5, 2019, Lisa Belle replaced John MacKessy as the Anti-Money Laundering Compliance Officer of the Company.
Investment Adviser and Administrator
BlackRock Advisors, LLC
Wilmington, DE 19809
Accounting Agent
JPMorgan Chase Bank, N.A.
New York, NY 10179
Transfer Agent
BNY Mellon Investment Servicing (US) Inc.
Wilmington, DE 19809
Custodian
JPMorgan Chase Bank, N.A.
New York, NY 10179
Independent Registered Public Accounting Firm
Deloitte & Touche LLP
Boston, MA 02116
Distributor
BlackRock Investments, LLC
New York, NY 10022
Legal Counsel
Willkie Farr & Gallagher LLP
New York, NY 10019
Address of the Funds
100 Bellevue Parkway
Wilmington, DE 19809
| | | | |
| DIRECTORAND OFFICER INFORMATION | | | 179 | |
Additional Information
General Information
Householding
The Funds will mail only one copy of shareholder documents, including prospectuses, annual and semi-annual reports and proxy statements, to shareholders with multiple accounts at the same address. This practice is commonly called “householding” and is intended to reduce expenses and eliminate duplicate mailings of shareholder documents. Mailings of your shareholder documents may be householded indefinitely unless you instruct us otherwise. If you do not want the mailing of these documents to be combined with those for other members of your household, please call the Funds at (800)441-7762.
Availability of Quarterly Schedule of Investments
The Funds (except BlackRock Government Money Market Portfolio) file their complete schedule of portfolio holdings with the SEC for the first and third quarters of each fiscal year as an exhibit to its reports on FormN-PORT, and for reporting periods ended prior to March 31, 2019, filed such information on FormN-Q. The Funds’ FormsN-PORT andN-Q are available on the SEC’s website at sec.gov. The Funds’ FormsN-Q may also be obtained upon request and without charge by calling (800)441-7762.
The BlackRock Government Money Market Portfolio files its complete schedule of portfolio holdings with the SEC each month on FormN-MFP. The Fund’s reports on FormN-MFP are available on the SEC’s website at sec.gov. The Fund makes portfolio holdings available to shareholders on its website at blackrock.com.
Availability of Proxy Voting Policies and Procedures
A description of the policies and procedures that the Funds use to determine how to vote proxies relating to portfolio securities is available upon request and without charge (1) by calling (800)441-7762; (2) atblackrock.com/prospectus/insurance; and(3) on the SEC’s website at sec.gov.
Availability of Proxy Voting Record
Information about how the Funds voted proxies relating to securities held in the Funds’ portfolios during the most recent12-month period ended June 30 is available upon request and without charge (1) atblackrock.com/prospectus/insuranceor by calling (800)441-7762 and (2) on the SEC’s website atsec.gov.
BlackRock’s Mutual Fund Family
BlackRock offers a diverse lineup ofopen-end mutual funds crossing all investment styles and managed by experts in equity,fixed-income andtax-exempt investing. Visitblackrock.comfor more information.
Shareholder Privileges
Account Information
Call us at (800)441-7762 from 8:00 AM to 6:00 PM ET on any business day to get information about your account balances, recent transactions and share prices. You can also visitblackrock.comfor more information.
Automatic Investment Plans
Investor class shareholders who want to invest regularly can arrange to have $50 or more automatically deducted from their checking or savings account and invested in any of the BlackRock funds.
Systematic Withdrawal Plans
Investor class shareholders can establish a systematic withdrawal plan and receive periodic payments of $50 or more from their BlackRock funds, as long as their account balance is at least $10,000.
Retirement Plans
Shareholders may make investments in conjunction with Traditional, Rollover, Roth, Coverdell, Simple IRAs, SEP IRAs and 403(b) Plans.
| | |
| 180 | | 2019 BLACKROCK ANNUAL REPORTTO SHAREHOLDERS |
Additional Information (continued)
BlackRock Privacy Principles
BlackRock is committed to maintaining the privacy of its current and former fund investors and individual clients (collectively, “Clients”) and to safeguarding theirnon-public personal information. The following information is provided to help you understand what personal information BlackRock collects, how we protect that information and why in certain cases we share such information with select parties.
If you are located in a jurisdiction where specific laws, rules or regulations require BlackRock to provide you with additional or different privacy-related rights beyond what is set forth below, then BlackRock will comply with those specific laws, rules or regulations.
BlackRock obtains or verifies personalnon-public information from and about you from different sources, including the following: (i) information we receive from you or, if applicable, your financial intermediary,on applications, forms or other documents; (ii) information about your transactions with us, our affiliates, or others; (iii) information we receive from a consumer reporting agency; and (iv) from visits to our websites.
BlackRock does not sell or disclose tonon-affiliated third parties anynon-public personal information about its Clients, except as permitted by law or as is necessary to respond to regulatory requests or to service Client accounts. Thesenon-affiliated third parties are required to protect the confidentiality and security of this information and to use it only for its intended purpose.
We may share information with our affiliates to service your account or to provide you with information about other BlackRock products or services that may be of interest to you. In addition, BlackRock restricts access tonon-public personal information about its Clients to those BlackRock employees with a legitimate business need for the information. BlackRock maintains physical, electronic and procedural safeguards that are designed to protect thenon-public personal information of its Clients, including procedures relating to the proper storage and disposal of such information.
| | | | |
| ADDITIONAL INFORMATION | | | 181 | |
Glossary of Terms Used in this Report
| | |
| Currency |
| |
| AUD | | Australian Dollar |
| |
| BRL | | Brazilian Real |
| |
| CAD | | Canadian Dollar |
| |
| CHF | | Swiss Franc |
| |
| CLP | | Chilean Peso |
| |
| CNH | | Chinese Yuan Offshore |
| |
| CNY | | Chinese Yuan |
| |
| COP | | Colombian Peso |
| |
| EGP | | Egyptian Pound |
| |
| EUR | | Euro |
| |
| GBP | | British Pound |
| |
| HKD | | Hong Kong Dollar |
| |
| IDR | | Indonesian Rupiah |
| |
| INR | | Indian Rupee |
| |
| JPY | | Japanese Yen |
| |
| KRW | | South Korean Won |
| |
| MXN | | Mexican Peso |
| |
| NGN | | Nigerian Naira |
| |
| NOK | | Norwegian Krone |
| |
| NZD | | New Zealand Dollar |
| |
| RUB | | New Russian Ruble |
| |
| SGD | | Singapore Dollar |
| |
| TRY | | Turkish Lira |
| |
| TWD | | Taiwan New Dollar |
| |
| USD | | United States Dollar |
| |
| ZAR | | South African Rand |
|
| Portfolio Abbreviations |
| |
| ABS | | Asset-Backed Security |
| |
| ADR | | American Depositary Receipts |
| |
| BA | | Canadian Bankers Acceptances |
| |
| BZDIOVER | | Overnight Brazil CETIP — Interbank Rate |
| |
| CLO | | Collateralized Loan Obligation |
| |
| CSMC | | Credit Suisse Mortgage Capital |
| |
| CVA | | Certification Van Aandelon (Dutch Certificate) |
| |
| CWABS | | Countrywide Asset-Backed Certificates |
| |
| DAC | | Designated Activity Company |
| |
| ETF | | Exchange-Traded Fund |
| |
| EURIBOR | | Euro Interbank Offered Rate |
| |
| GO | | General Obligation Bonds |
| |
| LIBOR | | London Interbank Offered Rate |
| |
| MSCI | | Morgan Stanley Capital International |
| |
| MXIBTIIE | | Mexico Interbank TIIE28-Day |
| |
| NASDAQ | | National Association of Securities Dealers Automated |
| |
| NYRS | | New York Registered Shares |
| |
| OTC | | Over-the-counter |
| |
| PCL | | Public Company Limited |
| |
| PIK | | Payment-In-Kind |
| |
| RB | | Revenue Bonds |
| |
| REIT | | Real Estate Investment Trust |
| |
| S&P | | Standard & Poor’s |
| |
| SOFR | | Secured Overnight Financing Rate |
| |
| SPDR | | Standard & Poor’s Depositary Receipts |
| |
| TBA | | To-be-announced |
| |
| VRDN | | Variable Rate Demand Notes |
| | |
| 182 | | 2019 BLACKROCK ANNUAL REPORTTO SHAREHOLDERS |
Want to know more?
blackrock.com | 877-275-1255(1-877-ASK-1BLK)
This report is authorized for distribution only to Policy owners of certain variable life insurance policies, which are funded by shares of BlackRock Series Fund, Inc. It is not authorized for use as an offer of sale or a solicitation of an offer to buy shares of the Fund or the policies. Past performance results shown in this report should not be considered a representation of future performance. Investment returns and principal value of shares will fluctuate so that shares, when redeemed, may be worth more or less than their original cost. Performance information used throughout this report does not include insurance-related fees and expenses. An investment in BlackRock Government Money Market Portfolio is not insured or guaranteed by the Federal Deposit Insurance Corporation or any other Government agency. BlackRock Government Money Market Portfolio’s sponsor has no legal obligation to provide financial support to the Portfolio. Total return information assumes reinvestment of all distributions. Current performance may be higher or lower than the performance data quoted. For current month-end performance, call (800)626-1960. BlackRock Government Money Market Portfolio’s current7-day yield more closely reflects the current earnings of the Portfolio than the total returns quoted. Although BlackRock Government Money Market Portfolio seeks to preserve the value of your investment at $1.00 per share, it cannot guarantee it will do so and it is possible to lose money by investing in the Portfolio. Statements and other information herein are as dated and are subject to change. Please see the Fund’s prospectus for a description of risks associated with global investments.
| | |
| Series8-12/19-AR | | 
|
| Item 2 – | Code of Ethics – The registrant (or the “Fund”) has adopted a code of ethics, as of the end of the period covered by this report, applicable to the registrant’s principal executive officer, principal financial officer, principal accounting officer or controller, or persons performing similar functions. During the period covered by this report, the code of ethics was amended to update certain information and to make othernon-material changes. During the period covered by this report, there have been no waivers granted under the code of ethics. The registrant undertakes to provide a copy of the code of ethics to any person upon request, without charge, who calls1-800-441-7762. |
| Item 3 – | Audit Committee Financial Expert – The registrant’s board of directors (the “board of directors”), has determined that (i) the registrant has the following audit committee financial experts serving on its audit committee and (ii) each audit committee financial expert is independent: |
Michael Castellano
Frank J. Fabozzi
Henry Gabbay
Catherine A. Lynch
Karen P. Robards
The registrant’s board of directors has determined that Karen P. Robards qualifies as an audit committee financial expert pursuant to Item 3(c)(4) of FormN-CSR.
Ms. Robards has a thorough understanding of generally accepted accounting principles, financial statements and internal control over financial reporting as well as audit committee functions. Ms. Robards has been President of Robards & Company, a financial advisory firm, since 1987. Ms. Robards was formerly an investment banker for more than 10 years where she was responsible for evaluating and assessing the performance of companies based on their financial results. Ms. Robards has over 30 years of experience analyzing financial statements. She also is a member of the audit committee of one publicly held company and anon-profit organization.
Under applicable securities laws, a person determined to be an audit committee financial expert will not be deemed an “expert” for any purpose, including without limitation for the purposes of Section 11 of the Securities Act of 1933, as a result of being designated or identified as an audit committee financial expert. The designation or identification of a person as an audit committee financial expert does not impose on such person any duties, obligations, or liabilities greater than the duties, obligations, and liabilities imposed on such person as a member of the audit committee and board of directors in the absence of such designation or identification. The designation or identification of a person as an audit committee financial expert does not affect the duties, obligations, or liability of any other member of the audit committee or board of directors.
| Item 4 – | Principal Accountant Fees and Services |
The following table presents fees billed by Deloitte & Touche LLP (“D&T”) in each of the last two fiscal years for the services rendered to the Fund:
| | | | | | | | | | | | | | | | |
| | | (a) Audit Fees | | (b) Audit-Related Fees1 | | (c) Tax Fees2 | | (d) All Other Fees |
| Entity Name | | Current
Fiscal Year
End | | Previous
Fiscal Year
End | | Current
Fiscal Year
End | | Previous
Fiscal Year
End | | Current
Fiscal Year
End | | Previous
Fiscal Year
End | | Current
Fiscal Year
End | | Previous
Fiscal Year
End |
2
| | | | | | | | | | | | | | | | |
| BlackRock High Yield Portfolio | | $30,192 | | $30,192 | | $38 | | $0 | | $10,100 | | $10,100 | | $0 | | $0 |
| BlackRock U.S. Government Bond Portfolio | | $39,474 | | $39,474 | | $38 | | $0 | | $15,400 | | $15,400 | | $0 | | $0 |
The following table presents fees billed by D&T that were required to be approved by the registrant’s audit committee (the “Committee”) for services that relate directly to the operations or financial reporting of the Fund and that are rendered on behalf of BlackRock Advisors, LLC (the “Investment Adviser” or “BlackRock”) and entities controlling, controlled by, or under common control with BlackRock (not including anysub-adviser whose role is primarily portfolio management and is subcontracted with or overseen by another investment adviser) that provide ongoing services to the Fund (“Affiliated Service Providers”):
| | | | |
| | | Current Fiscal Year End | | Previous Fiscal Year End |
(b) Audit-Related Fees1 | | $0 | | $0 |
(c) Tax Fees2 | | $0 | | $0 |
(d) All Other Fees3 | | $2,050,500 | | $2,274,000 |
1 The nature of the services includes assurance and related services reasonably related to the performance of the audit or review of financial statements not included in Audit Fees, including accounting consultations, agreed-upon procedure reports, attestation reports, comfort letters,out-of-pocket expenses and internal control reviews not required by regulators.
2 The nature of the services includes tax compliance and/or tax preparation, including services relating to the filing or amendment of federal, state or local income tax returns, regulated investment company qualification reviews, taxable income and tax distribution calculations.
3Non-audit fees of $2,050,500 and $2,274,000 for the current fiscal year and previous fiscal year, respectively, were paid to the Fund’s principal accountant in their entirety by BlackRock, in connection with services provided to the Affiliated Service Providers of the Fund and of certain other funds sponsored and advised by BlackRock or its affiliates for a service organization review and an accounting research tool subscription. These amounts represent aggregate fees paid by BlackRock and were not allocated on a per fund basis.
(e)(1) Audit CommitteePre-Approval Policies and Procedures:
The Committee has adopted policies and procedures with regard to thepre-approval of services. Audit, audit-related and tax compliance services provided to the registrant on an annual basis require specificpre-approval by the Committee. The Committee also must approve othernon-audit services provided to the registrant and thosenon-audit services provided to the Investment Adviser and Affiliated Service Providers that relate directly to the operations and the financial reporting of the registrant. Certain of thesenon-audit services that the Committee believes are (a) consistent with the SEC’s auditor independence rules and (b) routine and recurring services that will not impair the independence of the independent accountants may be approved by the Committee without consideration on a specificcase-by-case basis (“generalpre-approval”). The term of any generalpre-approval is 12 months from the date of thepre-approval, unless the Committee provides for a different period. Tax or othernon-audit services provided to the registrant which have a direct impact on the operations or financial reporting of the registrant will only be deemedpre-approved provided that any individual project does not exceed $10,000 attributable to the registrant or $50,000 per project. For this purpose, multiple projects will be aggregated to determine if they exceed the previously mentioned cost levels.
Any proposed services exceeding thepre-approved cost levels will require specificpre-approval by the Committee, as will any other services not subject to generalpre-approval (e.g., unanticipated but permissible services). The Committee is informed of each service approved subject to generalpre-approval at the next regularly scheduledin-person board meeting. At this
3
meeting, an analysis of such services is presented to the Committee for ratification. The Committee may delegate to the Committee Chairman the authority to approve the provision of and fees for any specific engagement of permittednon-audit services, including services exceedingpre-approved cost levels.
(e)(2) None of the services described in each of Items 4(b) through (d) were approved by the Committee pursuant to the de minimis exception in paragraph (c)(7)(i)(C) of Rule2-01 of RegulationS-X.
(f) Not Applicable
(g) The aggregatenon-audit fees, defined as the sum of the fees shown under “Audit-Related Fees,” “Tax Fees” and “All Other Fees,” paid to the accountant for services rendered by the accountant to the registrant, the Investment Adviser and the Affiliated Service Providers were:
| | | | |
| Entity Name | | Current Fiscal Year End | | Previous Fiscal Year End |
BlackRock High Yield Portfolio | | $10,138 | | $10,100 |
| BlackRock U.S. Government Bond Portfolio | | $15,438 | | $15,400 |
Additionally, the amounts billed by D&T in connection with services provided to the Affiliated Service Providers of the Fund and of other funds sponsored and advised by BlackRock or its affiliates during the current and previous fiscal years for a service organization review and an accounting research tool subscription were:
| | |
Current Fiscal Year End | | Previous Fiscal Year End |
$2,050,500 | | $2,274,000 |
These amounts represent aggregate fees paid by BlackRock and were not allocated on a per fund basis.
(h) The Committee has considered and determined that the provision ofnon-audit services that were rendered to the Investment Adviser and the Affiliated Service Providers that were notpre-approved pursuant to paragraph (c)(7)(ii) of Rule2-01 of RegulationS-X is compatible with maintaining the principal accountant’s independence.
| Item 5 – | Audit Committee of Listed Registrants – Not Applicable |
(a) The registrant’s Schedule of Investments is included as part of the Report to Stockholders filed under Item 1 of this Form.
(b) Not Applicable due to no such divestments during the semi-annual period covered since the previous FormN-CSR filing.
| Item 7 – | Disclosure of Proxy Voting Policies and Procedures forClosed-End Management Investment Companies – Not Applicable |
4
Item 8 – Portfolio Managers ofClosed-End Management Investment Companies – Not Applicable
Item 9 – Purchases of Equity Securities byClosed-End Management Investment Company and Affiliated Purchasers – Not Applicable
Item 10 – Submission of Matters to a Vote of Security Holders – There have been no material changes to these procedures.
Item 11 – Controls and Procedures
(a) – The registrant’s principal executive and principal financial officers, or persons performing similar functions, have concluded that the registrant’s disclosure controls and procedures (as defined in Rule30a-3(c) under the Investment Company Act of 1940, as amended (the “1940 Act”)) are effective as of a date within 90 days of the filing of this report based on the evaluation of these controls and procedures required by Rule30a-3(b) under the 1940 Act and Rule 15d-15(b) under the Securities Exchange Act of 1934, as amended.
(b) – There were no changes in the registrant’s internal control over financial reporting (as defined in Rule30a-3(d) under the 1940 Act) that occurred during the period covered by this report that have materially affected, or are reasonably likely to materially affect, the registrant’s internal control over financial reporting.
Item 12 – Disclosure of Securities Lending Activities forClosed-End Management Investment Companies – Not Applicable to the registrant.
Item 13 – Exhibits attached hereto
(a)(1) Code of Ethics – See Item 2
(a)(2) Certifications – Attached hereto
(a)(3) Not Applicable
(a)(4) Not Applicable
(b) Certifications – Attached hereto
5
Pursuant to the requirements of the Securities Exchange Act of 1934 and the Investment Company Act of 1940, the registrant has duly caused this report to be signed on its behalf by the undersigned, thereunto duly authorized.
| | |
BlackRock Series Fund II, Inc. |
| |
By: | | /s/ John M. Perlowski |
| | John M. Perlowski |
| | Chief Executive Officer (principal executive officer) of BlackRock Series Fund II, Inc. |
|
Date: February 28, 2020 |
Pursuant to the requirements of the Securities Exchange Act of 1934 and the Investment Company Act of 1940, this report has been signed below by the following persons on behalf of the registrant and in the capacities and on the dates indicated.
| | |
By: | | /s/ John M. Perlowski |
| | John M. Perlowski |
| | Chief Executive Officer (principal executive officer) of BlackRock Series Fund II, Inc. |
|
Date: February 28, 2020 |
| |
By: | | /s/ Neal J. Andrews |
| | Neal J. Andrews |
| | Chief Financial Officer (principal financial officer) of BlackRock Series Fund II, Inc. |
|
Date: February 28, 2020 |
6