UNITED STATES
SECURITIES AND EXCHANGE COMMISSION
Washington, D.C. 20549
FORM N-CSR
CERTIFIED SHAREHOLDER REPORT OF REGISTERED MANAGEMENT
INVESTMENT COMPANIES
Investment Company Act file number: 811-23341
| Name of Fund: | | BlackRock Funds IV |
| | | BlackRock Sustainable Advantage CoreAlpha Bond Fund |
| Fund Address: | | 100 Bellevue Parkway, Wilmington, DE 19809 |
Name and address of agent for service: John M. Perlowski, Chief Executive Officer, BlackRock Funds IV, 50 Hudson Yards, New York, NY 10001
Registrant’s telephone number, including area code: (800) 441-7762
Date of fiscal year end: 05/31/2023
Date of reporting period: 05/31/2023
Item 1 – Report to Stockholders
(a) The Report to Shareholders is attached herewith.
| | |

| | MAY 31, 2023 |
BlackRock Funds IV
· BlackRock Sustainable Advantage CoreAlpha Bond Fund
|
| Not FDIC Insured • May Lose Value • No Bank Guarantee |
The Markets in Review
Dear Shareholder,
Investors faced an uncertain economic landscape during the 12-month reporting period ended May 31, 2023, amid mixed indicators and rapidly changing market conditions. The U.S. economy returned to modest growth beginning in the third quarter of 2022, although the pace of growth slowed thereafter. Inflation was elevated, reaching a 40-year high as labor costs grew rapidly and unemployment rates reached the lowest levels in decades. However, inflation moderated as the period continued, while continued strength in consumer spending backstopped the economy.
Equity returns varied substantially, as large-capitalization U.S. stocks gained for the period amid a rebound in big tech stocks, whereas small-capitalization U.S. stocks declined. International equities from developed markets advanced, while emerging market stocks declined substantially, pressured by higher interest rates and falling commodities prices.
The 10-year U.S. Treasury yield rose during the reporting period, driving its price down, as investors reacted to elevated inflation and attempted to anticipate future interest rate changes. The corporate bond market also faced inflationary headwinds, although high-yield corporate bond prices fared better than investment-grade bonds as demand from yield-seeking investors remained strong.
The U.S. Federal Reserve (the “Fed”), acknowledging that inflation has been more persistent than expected, raised interest rates eight times. Furthermore, the Fed wound down its bond-buying programs and incrementally reduced its balance sheet by not replacing securities that reach maturity. In addition, the Fed added liquidity to markets amid the failure of prominent regional banks.
Restricted labor supply kept inflation elevated even as other inflation drivers, such as goods prices and energy costs, moderated. While economic growth was modest in the last year, we believe that stickiness in services inflation and continued wage growth will keep inflation above central bank targets for some time. Although the Fed has decelerated the pace of interest rate hikes and most recently opted for a pause, we believe that the Fed is likely to keep rates high for an extended period to get inflation under control. With this in mind, we believe the possibility of a U.S. recession in the near term is high, but the dimming economic outlook has not yet been fully reflected in current market prices. We believe investors should expect a period of higher volatility as markets adjust to the new economic reality and policymakers attempt to adapt. Resolution of the debt ceiling standoff late in the period eliminated one source of uncertainty, but the relatively modest spending cuts won’t move the needle on the government’s substantial debt burden.
While we favor an overweight to equities in the long term, we prefer an underweight stance on equities overall in the near term. Expectations for corporate earnings remain elevated, which seems inconsistent with the possibility of a recession. Nevertheless, we are overweight on emerging market stocks as we believe a weakening U.S. dollar could provide a supportive backdrop. While we are neutral on credit overall amid tightening credit and financial conditions, there are selective opportunities in the near term. For fixed income investing with a six- to twelve-month horizon, we see the most attractive investments in short-term U.S. Treasuries, global inflation-linked bonds, and emerging market bonds denominated in local currency.
Overall, our view is that investors need to think globally, position themselves to be prepared for a decarbonizing economy, and be nimble as market conditions change. We encourage you to talk with your financial advisor and visit blackrock.com for further insight about investing in today’s markets.
Sincerely,

Rob Kapito
President, BlackRock Advisors, LLC

Rob Kapito
President, BlackRock Advisors, LLC
| | | | |
| Total Returns as of May 31, 2023 |
| | | |
| | | 6-Month | | 12-Month |
| | |
U.S. large cap equities
(S&P 500® Index) | | 3.33% | | 2.92% |
| | |
U.S. small cap equities
(Russell 2000® Index) | | (6.53) | | (4.68) |
| | |
International equities
(MSCI Europe, Australasia, Far East Index) | | 6.89 | | 3.06 |
| | |
Emerging market equities
(MSCI Emerging Markets Index) | | (0.37) | | (8.49) |
| | |
3-month Treasury bills
(ICE BofA 3-Month U.S. Treasury Bill Index) | | 2.16 | | 3.16 |
| | |
U.S. Treasury securities
(ICE BofA 10-Year U.S. Treasury Index) | | 1.78 | | (3.65) |
| | |
U.S. investment grade bonds
(Bloomberg U.S. Aggregate Bond Index) | | 2.00 | | (2.14) |
| | |
Tax-exempt municipal bonds
(Bloomberg Municipal Bond Index) | | 1.94 | | 0.49 |
| | |
U.S. high yield bonds
(Bloomberg U.S. Corporate High Yield 2% Issuer Capped Index) | | 3.01 | | 0.05 |
|
| Past performance is not an indication of future results. Index performance is shown for illustrative purposes only. You cannot invest directly in an index. |
| | |
| 2 | | THIS PAGE IS NOT PART OF YOUR FUND REPORT |
Table of Contents

| | |
| Fund Summary as of May 31, 2023 | | BlackRock Sustainable Advantage CoreAlpha Bond Fund |
Investment Objective
BlackRock Sustainable Advantage CoreAlpha Bond Fund’s (the “Fund”) investment objective is to seek to provide a combination of income and capital growth while seeking to maintain certain environmental, governance and social (“ESG”) characteristics, climate risk exposure and climate opportunities relative to the Fund’s benchmark.
Portfolio Management Commentary
How did the Fund perform?
For the 12-month period ended May 31, 2023, all of the Fund’s share classes underperformed its benchmark, the Bloomberg U.S. Aggregate Bond Index with the exception of its Class K shares, which performed in line.
What factors influenced performance?
The Fund’s asset allocation detracted from relative performance, mainly due to out-of-benchmark positioning in high yield corporate credit. Selection within residential mortgage-backed securities (“MBS”) also weighed on relative return, primarily due to positioning within 15-year conventional MBS and 30-year GNMAs. Positioning with respect to U.S. interest rates detracted as the Treasury yield curve moved higher and flattened, with yields rising the most on shorter maturities.
Within corporate bonds, overweights to technology, consumer non-cyclical, and metals within basic materials proved beneficial. Within the Fund’s global interest rate strategies, relative value positioning within developed markets contributed positively to performance. While asset allocation detracted overall, the Fund’s modest overweight to securitized assets contributed over the period.
The Fund’s cash position was 7.9% at period-end and averaged approximately 9% for the period, representing holdings of Treasury bills. The relatively high cash balance proved beneficial as it allowed the Fund to pick up yield while reducing risk as risk assets performed poorly over the period. The Fund’s use of derivatives marginally detracted from performance. The performance impact of these positions is realized in the Fund’s asset allocation, global rates, and global inflation strategies.
Describe recent portfolio activity.
The Fund moved to an overweight allocation to investment grade corporate bonds and maintained its hedged out-of-benchmark exposure to high yield corporate bonds. The Fund has opportunistically increased exposure to securitized assets based on the continued strength of the consumer.
Describe portfolio positioning at period end.
As of period end, the Fund was overweight investment grade corporate bonds and had exposure to high yield corporate bonds. Within corporate credit, the largest sector overweights weights were in technology and consumer cyclicals, while the largest sector underweights were in communications and banking. The Fund was slightly overweight securitized assets, including agency MBS on the view that the Fed is near the end of its rate hiking cycle.
The views expressed reflect the opinions of BlackRock as of the date of this report and are subject to change based on changes in market, economic or other conditions. These views are not intended to be a forecast of future events and are no guarantee of future results.
| | |
| 4 | | 2 0 2 3 BLACK ROCK ANNUAL REPORT TO SHAREHOLDERS |
| | |
| Fund Summary as of May 31, 2023 (continued) | | BlackRock Sustainable Advantage CoreAlpha Bond Fund |
GROWTH OF $10,000 INVESTMENT
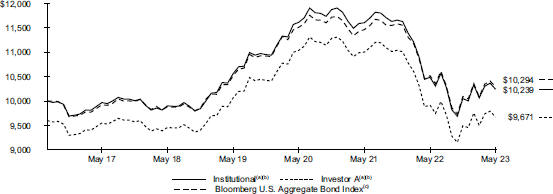
The Fund commenced operations on August 23, 2016.
| | (a) | Assuming maximum sales charges, transaction costs and other operating expenses, including administration fees, if any. Institutional Shares do not have a sales charge. | |
| | (b) | The Fund invests, under normal circumstances, at least 80% of its assets in bonds, including obligations issued or guaranteed by the U.S. Government, its agencies or instrumentalities; MBS issued or guaranteed by the U.S. Government or its agencies or instrumentalities, including U.S. agency mortgage pass-through securities; commercial MBS; mortgage to-be announced (“TBA”) securities; debt obligations of U.S. issuers, including corporate bonds and green bonds (which are bonds with proceeds that are used to fund eligible projects with specific environmental benefits); municipal securities; asset-backed securities; and U.S.-registered dollar-denominated debt obligations of foreign issuers. The Fund’s total returns for the period prior to October 1, 2021 are the returns of the Fund when it followed a different investment objective and different investment strategies under the name “BlackRock Systematic ESG Bond Fund”. Prior to May 1, 2020, BlackRock Systematic ESG Bond Fund was known as BlackRock Impact Bond Fund. On September 17, 2018, the Fund acquired all of the assets, subject to the liabilities, of BlackRock Impact Bond Fund (the “Predecessor Fund”), a series of BlackRock FundsSM, through a tax-free reorganization (the “Reorganization”). The Predecessor Fund is the performance and accounting survivor of the Reorganization. | |
| | (c) | A broad-based flagship benchmark that measures the investment grade, U.S. dollar-denominated, fixed-rate taxable bond market. | |
Performance
| | | | | | | | | | | | | | | | | | | | | | | | | | | | | | | | |
| | | | | | | | | Average Annual Total Returns(a)(b) | |
| | | | | |
| | | | | | | | | 1 Year | | | 5 Years | | | Since
Inception(c) | |
| | | | | | | | |
| | | Standardized
30-Day Yields | | | Unsubsidized
30-Day Yields | | | Without
Sales
Charge | | | With
Sales
Charge | | | Without
Sales
Charge | | | With
Sales
Charge | | | Without
Sales
Charge | | | With
Sales
Charge | |
| | | | | | | | |
Institutional | | | 4.06 | % | | | 2.03 | % | | | (2.34 | )% | | | N/A | | | | 0.68 | % | | | N/A | | | | 0.35 | % | | | N/A | |
Investor A | | | 3.65 | | | | 1.70 | | | | (2.48 | ) | | | (6.38 | )% | | | 0.44 | | | | (0.37 | )% | | | 0.11 | | | | (0.49 | )% |
Investor C | | | 3.06 | | | | 0.69 | | | | (3.32 | ) | | | (4.27 | ) | | | (0.33 | ) | | | (0.33 | ) | | | (0.65 | ) | | | (0.65 | ) |
Class K | | | 4.11 | | | | 2.11 | | | | (2.18 | ) | | | N/A | | | | 0.75 | | | | N/A | | | | 0.41 | | | | N/A | |
| | | | | | | | |
Bloomberg U.S. Aggregate Bond Index | | | — | | | | — | | | | (2.14 | ) | | | N/A | | | | 0.81 | | | | N/A | | | | 0.43 | | | | N/A | |
| | (a) | Assuming maximum sales charges, if any. Average annual total returns with and without sales charges reflect reductions for distribution and service fees. See “About Fund Performance” for a detailed description of share classes, including any related sales charges and fees. | |
| | (b) | The Fund invests, under normal circumstances, at least 80% of its assets in bonds, including obligations issued or guaranteed by the U.S. Government, its agencies or instrumentalities; MBS issued or guaranteed by the U.S. Government or its agencies or instrumentalities, including U.S. agency mortgage pass-through securities; commercial MBS; mortgage to-be announced (“TBA”) securities; debt obligations of U.S. issuers, including corporate bonds and green bonds (which are bonds with proceeds that are used to fund eligible projects with specific environmental benefits); municipal securities; asset-backed securities; and U.S.-registered dollar-denominated debt obligations of foreign issuers. The Fund’s total returns for the period prior to October 1, 2021 are the returns of the Fund when it followed a different investment objective and different investment strategies under the name “BlackRock Systematic ESG Bond Fund”. Prior to May 1, 2020, BlackRock Systematic ESG Bond Fund was known as BlackRock Impact Bond Fund. On September 17, 2018, the Fund acquired all of the assets, subject to the liabilities, of the Predecessor Fund through the Reorganization. The Predecessor Fund is the performance and accounting survivor of the Reorganization. | |
| | (c) | The Fund commenced operations on August 23, 2016. | |
N/A — Not applicable as the share class and index do not have a sales charge.
Past performance is not an indication of future results.
Performance results may include adjustments made for financial reporting purposes in accordance with U.S. generally accepted accounting principles.
Expense Example
| | | | | | | | | | | | | | | | | | | | | | | | | | | | |
| | | Actual | | | Hypothetical 5% Return | | | | |
| | | | | | | |
| | |
| Beginning
Account Value
(12/01/22) |
| |
| Ending
Account Value
(05/31/23) |
| |
| Expenses
Paid During
the Period |
(a) | |
| Beginning
Account Value
(12/01/22) |
| |
| Ending
Account Value
(05/31/23) |
| |
| Expenses
Paid During
the Period |
(a) | |
| Annualized
Expense
Ratio |
|
| | | | | | | |
Institutional | | | $ 1,000.00 | | | | $ 1,018.90 | | | | $ 1.41 | | | | $ 1,000.00 | | | | $ 1,023.54 | | | | $ 1.41 | | | | 0.28 | % |
| | |
| Fund Summary as of May 31, 2023 (continued) | | BlackRock Sustainable Advantage CoreAlpha Bond Fund |
Expense Example (continued)
| | | | | | | | | | | | | | | | | | | | | | | | | | | | |
| | | Actual | | | Hypothetical 5% Return | | | | |
| | | | | | | |
| | |
| Beginning
Account Value
(12/01/22) |
| |
| Ending
Account Value
(05/31/23) |
| |
| Expenses
Paid During
the Period |
(a) | |
| Beginning
Account Value
(12/01/22) |
| |
| Ending
Account Value
(05/31/23) |
| |
| Expenses
Paid During
the Period |
(a) | |
| Annualized
Expense
Ratio |
|
| | | | | | | |
Investor A | | | $ 1,000.00 | | | | $ 1,018.90 | | | | $ 2.67 | | | | $ 1,000.00 | | | | $ 1,022.29 | | | | $ 2.67 | | | | 0.53 | % |
Investor C | | | 1,000.00 | | | | 1,013.90 | | | | 6.43 | | | | 1,000.00 | | | | 1,018.55 | | | | 6.44 | | | | 1.28 | |
Class K | | | 1,000.00 | | | | 1,020.40 | | | | 1.16 | | | | 1,000.00 | | | | 1,023.78 | | | | 1.16 | | | | 0.23 | |
| | (a) | For each class of the Fund, expenses are equal to the annualized expense ratio for the class, multiplied by the average account value over the period, multiplied by 182/365 (to reflect the one-half year period shown). | |
See “Disclosure of Expenses” for further information on how expenses were calculated.
Portfolio Information
PORTFOLIO ALLOCATION
| | | | |
| | |
| Asset Type | | Percent of
Total Investments | |
| |
Corporate Bonds | | | 34.5% | |
U.S. Government Sponsored Agency Securities | | | 32.9 | |
U.S. Treasury Obligations | | | 23.1 | |
Asset-Backed Securities | | | 4.8 | |
Non-Agency Mortgage-Backed Securities | | | 4.5 | |
Money Market Funds | | | 2.2 | |
Other* | | | (2.0) | |
CREDIT QUALITY ALLOCATION
| | |
| | |
| Credit Rating(a)(b) | | Percent of Total Investments |
| |
AAA/Aaa(c) | | 55.7% |
AA/Aa | | 4.3 |
A | | 20.9 |
BBB/Baa | | 14.9 |
BB/Ba | | 2.3 |
B | | 0.8 |
CCC/Caa | | —(d) |
N/R | | 1.1 |
| (a) | For financial reporting purposes, credit quality ratings shown above reflect the highest rating assigned by either S&P Global Ratings or Moody’s Investors Service, Inc. if ratings differ. These rating agencies are independent, nationally recognized statistical rating organizations and are widely used. Investment grade ratings are credit ratings of BBB/Baa or higher. Below investment grade ratings are credit ratings of BB/Ba or lower. Investments designated N/R are not rated by either rating agency. Unrated investments do not necessarily indicate low credit quality. Credit quality ratings are subject to change. |
| (b) | Excludes short-term securities. |
| (c) | The investment adviser evaluates the credit quality of not-rated investments based upon certain factors including, but not limited to, credit ratings for similar investments and financial analysis of sectors, individual investments and/or issuer. Using this approach, the investment adviser has deemed U.S. Government Sponsored Agency Securities and U.S. Treasury Obligations as AAA/Aaa. |
| (d) | Rounds to less than 0.1% of total investments. |
| * | Includes one or more investment categories that individually represents less than 1.0% of the Fund’s total investments. Please refer to the Schedule of Investments for details. |
| | |
| 6 | | 2 0 2 3 BLACK ROCK ANNUAL REPORT TO SHAREHOLDERS |
| | |
| About Fund Performance | | BlackRock Sustainable Advantage CoreAlpha Bond Fund |
Institutional and Class K Shares are not subject to any sales charge. These shares bear no ongoing distribution or service fees and are available only to certain eligible investors.
Investor A Shares are subject to a maximum initial sales charge (front-end load) of 4.00% and a service fee of 0.25% per year (but no distribution fee). Certain redemptions of these shares may be subject to a contingent deferred sales charge (“CDSC”) where no initial sales charge was paid at the time of purchase. These shares are generally available through financial intermediaries.
Investor C Shares are subject to a 1.00% CDSC if redeemed within one year of purchase. In addition, these shares are subject to a distribution fee of 0.75% per year and a service fee of 0.25% per year. These shares are generally available through financial intermediaries. These shares automatically convert to Investor A Shares after approximately eight years.
Past performance is not an indication of future results. Financial markets have experienced extreme volatility and trading in many instruments has been disrupted. These circumstances may continue for an extended period of time and may continue to affect adversely the value and liquidity of the Fund’s investments. As a result, current performance may be lower or higher than the performance data quoted. Refer to blackrock.com to obtain performance data current to the most recent month-end. Performance results do not reflect the deduction of taxes that a shareholder would pay on Fund distributions or the redemption of Fund shares. Figures shown in the performance table(s) assume reinvestment of all distributions, if any, at net asset value (“NAV”) on the ex-dividend date or payable date, as applicable. Investment return and principal value of shares will fluctuate so that shares, when redeemed, may be worth more or less than their original cost. Distributions paid to each class of shares will vary because of the different levels of service, distribution and transfer agency fees applicable to each class, which are deducted from the income available to be paid to shareholders.
BlackRock Advisors, LLC (the “Manager”), the Fund’s investment adviser, has contractually and/or voluntarily agreed to waive and/or reimburse a portion of the Fund’s expenses. Without such waiver(s) and/or reimbursement(s), the Fund’s performance would have been lower. With respect to the Fund’s voluntary waiver(s), if any, the Manager is under no obligation to waive and/or reimburse or to continue waiving and/or reimbursing its fees and such voluntary waiver(s) may be reduced or discontinued at any time. With respect to the Fund’s contractual waiver(s), if any, the Manager is under no obligation to continue waiving and/or reimbursing its fees after the applicable termination date of such agreement. See the Notes to Financial Statements for additional information on waivers and/or reimbursements.
The standardized 30-day yield includes the effects of any waivers and/or reimbursements. The unsubsidized 30-day yield excludes the effects of any waivers and/or reimbursements.
Disclosure of Expenses
Shareholders of the Fund may incur the following charges: (a) transactional expenses, such as sales charges; and (b) operating expenses, including investment advisory fees, administration fees, service and distribution fees, including 12b-1 fees, acquired fund fees and expenses, and other fund expenses. The expense example shown (which is based on a hypothetical investment of $1,000 invested at the beginning of the period and held through the end of the period) is intended to assist shareholders both in calculating expenses based on an investment in the Fund and in comparing these expenses with similar costs of investing in other mutual funds.
The expense example provides information about actual account values and actual expenses. Annualized expense ratios reflect contractual and voluntary fee waivers, if any. In order to estimate the expenses a shareholder paid during the period covered by this report, shareholders can divide their account value by $1,000 and then multiply the result by the number corresponding to their share class under the heading entitled “Expenses Paid During the Period.”
The expense example also provides information about hypothetical account values and hypothetical expenses based on the Fund’s actual expense ratio and an assumed rate of return of 5% per year before expenses. In order to assist shareholders in comparing the ongoing expenses of investing in the Fund and other funds, compare the 5% hypothetical example with the 5% hypothetical examples that appear in shareholder reports of other funds.
The expenses shown in the expense example are intended to highlight shareholders’ ongoing costs only and do not reflect transactional expenses, such as sales charges, if any. Therefore, the hypothetical example is useful in comparing ongoing expenses only and will not help shareholders determine the relative total expenses of owning different funds. If these transactional expenses were included, shareholder expenses would have been higher.
Derivative Financial Instruments
The Fund may invest in various derivative financial instruments. These instruments are used to obtain exposure to a security, commodity, index, market, and/or other assets without owning or taking physical custody of securities, commodities and/or other referenced assets or to manage market, equity, credit, interest rate, foreign currency exchange rate, commodity and/or other risks. Derivative financial instruments may give rise to a form of economic leverage and involve risks, including the imperfect correlation between the value of a derivative financial instrument and the underlying asset, possible default of the counterparty to the transaction or illiquidity of the instrument. Pursuant to Rule 18f-4 under the 1940 Act, among other things, the Fund must either use derivative financial instruments with embedded leverage in a limited manner or comply with an outer limit on fund leverage risk based on value-at-risk. The Fund’s successful use of a derivative financial instrument depends on the investment adviser’s ability to predict pertinent market movements accurately, which cannot be assured. The use of these instruments may result in losses greater than if they had not been used, may limit the amount of appreciation the Fund can realize on an investment and/or may result in lower distributions paid to shareholders. The Fund’s investments in these instruments, if any, are discussed in detail in the Notes to Financial Statements.
| | |
ABOUT FUND PERFORMANCE / DISCLOSURE OF EXPENSES / DERIVATIVE FINANCIAL INSTRUMENTS | | 7 |
| | |
Schedule of Investments May 31, 2023 | | BlackRock Sustainable Advantage CoreAlpha Bond Fund (Percentages shown are based on Net Assets) |
| | | | | | | | |
| Security | | Par
(000) | | | Value | |
| | |
Asset-Backed Securities | | | | | | | | |
ACC Auto Trust, Series 2021, Class A, 1.08%, 04/15/27(a) | | $ | 9 | | | $ | 9,488 | |
Affirm Asset Securitization Trust, 6.61%, 01/18/28 | | | 100 | | | | 99,722 | |
Carvana Auto Receivables Trust, Series 2021-N2, Class B, 0.75%, 03/10/28 | | | 16 | | | | 14,777 | |
Drive Auto Receivables Trust, Series 2021-1, Class C, 1.02%, 06/15/27 | | | 134 | | | | 132,422 | |
Exeter Automobile Receivables Trust | | | | | | | | |
Series 2021-1A, Class C, 0.74%, 01/15/26 | | | 103 | | | | 101,810 | |
Series 2021-2A, Class D, 1.40%, 04/15/27 | | | 300 | | | | 278,030 | |
Series 2021-3A, Class B, 0.69%, 01/15/26 | | | 193 | | | | 190,957 | |
Series 2021-4A, Class C, 1.46%, 10/15/27 | | | 150 | | | | 143,298 | |
Series 2022-2A, Class B, 3.65%, 10/15/26 | | | 300 | | | | 294,596 | |
Series 2022-2A, Class C, 3.85%, 07/17/28 | | | 300 | | | | 290,080 | |
JPMorgan Chase Bank NA(a) | | | | | | | | |
Series 2021-2, Class B, 0.89%, 12/26/28 | | | 90 | | | | 87,202 | |
Series 2021-3, Class B, 0.76%, 02/26/29 | | | 116 | | | | 109,573 | |
Santander Drive Auto Receivables Trust | | | | | | | | |
Series 2020-2, Class D, 2.22%, 09/15/26 | | | 212 | | | | 207,297 | |
Series 2021-1, Class C, 0.75%, 02/17/26 | | | 41 | | | | 40,395 | |
Series 2022-1, Class C, 2.56%, 04/17/28 | | | 300 | | | | 287,071 | |
Toyota Auto Receivables Owner Trust, Series 2021-B, Class A4, 0.53%, 10/15/26 | | | 200 | | | | 183,671 | |
Upstart Securitization Trust(a) | | | | | | | | |
Series 2021-2, Class A, 0.91%, 06/20/31 | | | 13 | | | | 12,550 | |
Series 2021-3, Class A, 0.83%, 07/20/31 | | | 19 | | | | 18,460 | |
Series 2021-4, Class A, 0.84%, 09/20/31 | | | 71 | | | | 69,322 | |
Westlake Automobile Receivables Trust, Series 2022-3A, Class C, 6.44%, 12/15/27(a) | | | 160 | | | | 161,263 | |
| | | | | | | | |
| | |
Total Asset-Backed Securities — 5.0%
(Cost: $2,770,603) | | | | | | | 2,731,984 | |
| | | | | | | | |
| | |
Corporate Bonds | | | | | | | | |
| | |
Aerospace & Defense(a) — 0.1% | | | | | | | | |
BWX Technologies, Inc., 4.13%, 04/15/29 | | | 75 | | | | 66,374 | |
Spirit AeroSystems, Inc., 9.38%, 11/30/29 | | | 10 | | | | 10,651 | |
| | | | | | | | |
| | |
| | | | | | | 77,025 | |
| | |
| Automobile Components — 0.1% | | | | | | |
Allison Transmission, Inc., 5.88%, 06/01/29(a) | | | 46 | | | | 44,360 | |
| | | | | | | | |
| | |
| Banks — 1.5% | | | | | | |
Bank of Montreal
3.70%, 06/07/25 | | | 35 | | | | 33,924 | |
2.65%, 03/08/27 | | | 20 | | | | 18,446 | |
(5-year USD Swap + 1.43%), 3.80%, 12/15/32(b) | | | 25 | | | | 22,311 | |
Canadian Imperial Bank of Commerce, 1.00%, 10/18/24 | | | 30 | | | | 28,183 | |
HSBC USA, Inc., 3.50%, 06/23/24 | | | 100 | | | | 97,496 | |
ING Groep NV, 3.55%, 04/09/24 | | | 400 | | | | 391,743 | |
Royal Bank of Canada
0.75%, 10/07/24 | | | 90 | | | | 84,497 | |
2.25%, 11/01/24 | | | 25 | | | | 23,922 | |
Santander Holdings USA, Inc., (1-day SOFR + 2.36%), 6.50%, 03/09/29(b) | | | 20 | | | | 20,276 | |
Toronto-Dominion Bank, 0.30%, 06/02/23 | | | 100 | | | | 100,000 | |
| | | | | | �� | | |
| | |
| | | | | | | 820,798 | |
| | |
| Beverages — 1.6% | | | | | | |
Coca-Cola Co.
3.00%, 03/05/51 | | | 465 | | | | 347,623 | |
2.50%, 03/15/51 | | | 20 | | | | 13,423 | |
| | | | | | | | |
| Security | | Par
(000) | | | Value | |
| | |
| Beverages (continued) | | | | | | |
PepsiCo, Inc.
2.63%, 03/19/27 | | $ | 80 | | | $ | 75,311 | |
3.00%, 10/15/27 | | | 50 | | | | 47,574 | |
2.88%, 10/15/49 | | | 25 | | | | 18,435 | |
4.20%, 07/18/52 | | | 300 | | | | 276,725 | |
4.65%, 02/15/53 | | | 100 | | | | 99,477 | |
| | | | | | | | |
| | |
| | | | | | | 878,568 | |
| | |
| Biotechnology — 1.5% | | | | | | |
AbbVie, Inc.
4.40%, 11/06/42 | | | 5 | | | | 4,389 | |
4.70%, 05/14/45 | | | 5 | | | | 4,494 | |
4.25%, 11/21/49 | | | 30 | | | | 25,410 | |
Amgen, Inc., 5.51%, 03/02/26 | | | 30 | | | | 30,001 | |
Biogen, Inc.
2.25%, 05/01/30 | | | 180 | | | | 150,720 | |
3.25%, 02/15/51 | | | 140 | | | | 95,784 | |
Gilead Sciences, Inc., 0.75%, 09/29/23 | | | 30 | | | | 29,528 | |
Regeneron Pharmaceuticals, Inc.
1.75%, 09/15/30 | | | 500 | | | | 402,931 | |
2.80%, 09/15/50 | | | 150 | | | | 95,628 | |
| | | | | | | | |
| | |
| | | | | | | 838,885 | |
| | |
| Building Products — 0.1% | | | | | | |
Allegion PLC, 3.50%, 10/01/29 | | | 5 | | | | 4,465 | |
Builders FirstSource, Inc., 6.38%, 06/15/32(a) | | | 27 | | | | 26,565 | |
| | | | | | | | |
| | |
| | | | | | | 31,030 | |
| | |
| Capital Markets — 0.7% | | | | | | |
Ares Capital Corp., 2.88%, 06/15/27 | | | 50 | | | | 43,564 | |
Bank of New York Mellon Corp., (1-day SOFR + 1.51%), 4.71%, 02/01/34(b) | | | 10 | | | | 9,748 | |
Barings BDC, Inc., 3.30%, 11/23/26 | | | 15 | | | | 13,126 | |
Blackstone Private Credit Fund, 4.70%, 03/24/25 | | | 15 | | | | 14,475 | |
CME Group, Inc., 2.65%, 03/15/32 | | | 15 | | | | 12,857 | |
FactSet Research Systems, Inc.
2.90%, 03/01/27 | | | 80 | | | | 73,953 | |
3.45%, 03/01/32 | | | 40 | | | | 34,316 | |
FS KKR Capital Corp., 3.13%, 10/12/28 | | | 45 | | | | 36,712 | |
Intercontinental Exchange, Inc., 3.00%, 06/15/50 | | | 25 | | | | 17,036 | |
Invesco Finance PLC, 3.75%, 01/15/26 | | | 25 | | | | 24,143 | |
Morgan Stanley, (1-day SOFR + 1.87%), 5.25%, 04/21/34 | | | 55 | | | | 54,618 | |
S&P Global, Inc.
2.45%, 03/01/27 | | | 45 | | | | 41,767 | |
2.30%, 08/15/60 | | | 10 | | | | 5,595 | |
| | | | | | | | |
| | |
| | | | | | | 381,910 | |
| | |
| Chemicals — 0.4% | | | | | | |
Linde, Inc., 1.10%, 08/10/30 | | | 240 | | | | 190,016 | |
Nufarm Australia Ltd. / Nufarm Americas, Inc., 5.00%, 01/27/30(a) | | | 48 | | | | 43,203 | |
| | | | | | | | |
| | |
| | | | | | | 233,219 | |
| | |
| Commercial Services & Supplies — 0.0% | | | | | | |
AMN Healthcare, Inc., 4.00%, 04/15/29(a) | | | 12 | | | | 10,504 | |
Massachusetts Institute of Technology, 3.07%, 04/01/52 | | | 12 | | | | 8,904 | |
| | | | | | | | |
| | |
| | | | | | | 19,408 | |
| | |
| Communications Equipment — 0.6% | | | | | | |
Motorola Solutions, Inc.
2.30%, 11/15/30 | | | 160 | | | | 129,367 | |
2.75%, 05/24/31 | | | 100 | | | | 82,363 | |
| | |
| 8 | | 2 0 2 3 BLACK ROCK ANNUAL REPORT TO SHAREHOLDERS |
| | |
Schedule of Investments (continued) May 31, 2023 | | BlackRock Sustainable Advantage CoreAlpha Bond Fund (Percentages shown are based on Net Assets) |
| | | | | | | | |
| Security | | Par (000) | | | Value | |
| | |
| Communications Equipment (continued) | | | | | | |
Motorola Solutions, Inc. (continued)
5.60%, 06/01/32 | | $ | 120 | | | $ | 120,058 | |
5.50%, 09/01/44 | | | 10 | | | | 9,319 | |
| | | | | | | | |
| | |
| | | | | | | 341,107 | |
| | |
| Consumer Discretionary — 0.4% | | | | | | |
Quanta Services, Inc.
0.95%, 10/01/24 | | | 95 | | | | 88,929 | |
2.90%, 10/01/30 | | | 50 | | | | 42,416 | |
2.35%, 01/15/32 | | | 85 | | | | 67,522 | |
3.05%, 10/01/41 | | | 45 | | | | 30,796 | |
| | | | | | | | |
| | |
| | | | | | | 229,663 | |
| | |
| Consumer Finance — 1.3% | | | | | | |
American Express Co.
3.63%, 12/05/24 | | | 25 | | | | 24,291 | |
(1-day SOFR + 1.84%), 5.04%, 05/01/34 | | | 40 | | | | 39,488 | |
Automatic Data Processing, Inc.
1.70%, 05/15/28 | | | 450 | | | | 398,578 | |
1.25%, 09/01/30 | | | 150 | | | | 122,356 | |
Mastercard, Inc.
3.95%, 02/26/48 | | | 25 | | | | 22,030 | |
3.65%, 06/01/49 | | | 10 | | | | 8,238 | |
3.85%, 03/26/50 | | | 20 | | | | 17,036 | |
2.95%, 03/15/51 | | | 35 | | | | 25,427 | |
Synchrony Financial, 2.88%, 10/28/31 | | | 30 | | | | 21,419 | |
Visa, Inc., 3.65%, 09/15/47 | | | 48 | | | | 40,812 | |
| | | | | | | | |
| | |
| | | | | | | 719,675 | |
| | |
| Consumer Staples Distribution & Retail(a) — 0.1% | | | | | | |
Albertsons Cos., Inc./Safeway, Inc./New Albertsons LP/Albertsons LLC, 6.50%, 02/15/28 | | | 22 | | | | 21,862 | |
U.S. Foods, Inc., 4.75%, 02/15/29 | | | 24 | | | | 21,889 | |
| | | | | | | | |
| | |
| | | | | | | 43,751 | |
| | |
| Distributors — 0.1% | | | | | | |
Genuine Parts Co., 1.75%, 02/01/25 | | | 55 | | | | 51,620 | |
| | | | | | | | |
| | |
| Diversified REITs — 0.5% | | | | | | |
American Tower Corp., 4.00%, 06/01/25 | | | 35 | | | | 34,037 | |
Essential Properties LP, 2.95%, 07/15/31 | | | 30 | | | | 21,965 | |
Iron Mountain, Inc., 5.25%, 07/15/30(a) | | | 60 | | | | 53,752 | |
Prologis LP, 5.25%, 06/15/53 | | | 10 | | | | 9,757 | |
VICI Properties LP, 5.13%, 05/15/32 | | | 90 | | | | 84,028 | |
VICI Properties LP/VICI Note Co., Inc., 3.88%, 02/15/29(a) | | | 50 | | | | 44,181 | |
| | | | | | | | |
| | |
| | | | | | | 247,720 | |
| | |
| Diversified Telecommunication Services — 0.4% | | | | | | |
Cogent Communications Group, Inc., 7.00%, 06/15/27(a) | | | 64 | | | | 61,498 | |
Koninklijke KPN NV, 8.38%, 10/01/30 | | | 50 | | | | 58,369 | |
Level 3 Financing, Inc., 10.50%, 05/15/30(a) | | | 12 | | | | 11,403 | |
Uniti Group LP/Uniti Group Finance, Inc./CSL Capital LLC, 10.50%, 02/15/28(a) | | | 13 | | | | 12,613 | |
Verizon Communications, Inc.
4.33%, 09/21/28 | | | 51 | | | | 49,569 | |
2.65%, 11/20/40 | | | 25 | | | | 17,161 | |
| | | | | | | | |
| | |
| | | | | | | 210,613 | |
| | |
| Electric Utilities — 0.6% | | | | | | |
Avangrid, Inc.
3.15%, 12/01/24 | | | 50 | | | | 48,153 | |
3.80%, 06/01/29 | | | 100 | | | | 92,829 | |
Eversource Energy
3.45%, 01/15/50 | | | 50 | | | | 36,232 | |
| | | | | | | | |
| Security | | Par (000) | | | Value | |
| | |
| Electric Utilities (continued) | | | | | | |
Eversource Energy (continued) | | | | | | | | |
Series R, 1.65%, 08/15/30 | | $ | 30 | | | $ | 23,965 | |
Exelon Corp.
4.05%, 04/15/30 | | | 75 | | | | 70,343 | |
5.10%, 06/15/45 | | | 25 | | | | 22,953 | |
PECO Energy Co., 3.00%, 09/15/49 | | | 25 | | | | 17,138 | |
San Diego Gas & Electric Co.
6.00%, 06/01/39 | | | 25 | | | | 25,754 | |
4.15%, 05/15/48 | | | 15 | | | | 12,464 | |
Series UUU, 3.32%, 04/15/50 | | | 10 | | | | 7,176 | |
| | | | | | | | |
| | |
| | | | | | | 357,007 | |
|
| Electronic Equipment, Instruments & Components — 0.4% | |
CDW LLC/CDW Finance Corp., 3.57%, 12/01/31 | | | 27 | | | | 22,560 | |
Keysight Technologies, Inc., 3.00%, 10/30/29 | | | 240 | | | | 211,282 | |
| | | | | | | | |
| | |
| | | | | | | 233,842 | |
| | |
| Energy Equipment & Services(a) — 0.0% | | | | | | |
Venture Global LNG, Inc.
8.13%, 06/01/28 | | | 5 | | | | 5,025 | |
8.38%, 06/01/31 | | | 5 | | | | 5,026 | |
| | | | | | | | |
| | |
| | | | | | | 10,051 | |
| | |
| Financial Services — 5.7% | | | | | | |
Bank of America Corp.
4.45%, 03/03/26 | | | 50 | | | | 48,894 | |
(1-day SOFR + 0.96%), 1.73%, 07/22/27(b) | | | 255 | | | | 227,410 | |
(1-day SOFR + 1.75%), 4.83%, 07/22/26(b) | | | 60 | | | | 59,344 | |
(1-day SOFR + 2.04%), 4.95%, 07/22/28(b) | | | 55 | | | | 54,401 | |
Bank of Nova Scotia, 2.70%, 08/03/26 | | | 75 | | | | 69,600 | |
Barclays PLC, (1-year CMT + 1.05%), 2.28%, 11/24/27(b) | | | 200 | | | | 177,705 | |
Citigroup, Inc.
3.70%, 01/12/26 | | | 50 | | | | 48,319 | |
(1-day SOFR + 0.69%), 0.78%, 10/30/24(b) | | | 100 | | | | 97,848 | |
Goldman Sachs Group, Inc.
5.70%, 11/01/24 | | | 20 | | | | 20,048 | |
4.25%, 10/21/25 | | | 25 | | | | 24,356 | |
3.75%, 02/25/26 | | | 25 | | | | 24,144 | |
(1-day SOFR + 0.61%), 0.86%, 02/12/26(b) | | | 62 | | | | 56,764 | |
(1-day SOFR + 0.80%), 1.43%, 03/09/27(b) | | | 100 | | | | 89,842 | |
(3-mo. CME Term SOFR + 1.42%), 3.81%, 04/23/29(b) | | | 50 | | | | 46,605 | |
(3-mo. CME Term SOFR + 1.56%), 4.22%, 05/01/29(b) | | | 50 | | | | 47,390 | |
HSBC Holdings PLC, (1-day SOFR + 2.53%), 4.76%, 03/29/33(b) | | | 200 | | | | 181,021 | |
JPMorgan Chase & Co.(b) | | | | | | | | |
(1-day SOFR + 0.61%), 1.56%, 12/10/25 | | | 60 | | | | 56,283 | |
(1-day SOFR + 1.85%), 2.08%, 04/22/26 | | | 17 | | | | 15,984 | |
(1-day SOFR + 1.99%), 4.85%, 07/25/28 | | | 60 | | | | 59,680 | |
(3-mo. CME Term SOFR + 0.70%), 1.04%, 02/04/27 | | | 115 | | | | 102,825 | |
(3-mo. CME Term SOFR + 1.51%), 3.96%, 01/29/27 | | | 200 | | | | 193,393 | |
(3-mo. CME Term SOFR + 1.59%), 2.01%, 03/13/26 | | | 34 | | | | 31,990 | |
Mitsubishi UFJ Financial Group, Inc.
2.53%, 09/13/23 | | | 200 | | | | 198,238 | |
3.78%, 03/02/25 | | | 100 | | | | 97,125 | |
Mizuho Financial Group, Inc., (1-year CMT + 0.75%), 1.55%, 07/09/27(b) | | | 200 | | | | 176,830 | |
Morgan Stanley
5.00%, 11/24/25 | | | 50 | | | | 49,881 | |
3.88%, 01/27/26 | | | 75 | | | | 73,013 | |
6.38%, 07/24/42 | | | 25 | | | | 27,563 | |
4.38%, 01/22/47 | | | 15 | | | | 13,122 | |
(1-day SOFR + 0.53%), 0.79%, 05/30/25(b) | | | 50 | | | | 47,389 | |
| | |
SCHEDULE OF INVESTMENTS | | 9 |
| | |
Schedule of Investments (continued) May 31, 2023 | | BlackRock Sustainable Advantage CoreAlpha Bond Fund (Percentages shown are based on Net Assets) |
| | | | | | | | |
| Security | | Par (000) | | | Value | |
| | |
| Financial Services (continued) | | | | | | |
Morgan Stanley (continued) | | | | | | | | |
(1-day SOFR + 0.86%), 1.51%, 07/20/27(b) | | $ | 65 | | | $ | 57,884 | |
(1-day SOFR + 1.43%), 2.80%, 01/25/52(b) | | | 25 | | | | 16,074 | |
(1-day SOFR + 4.84%), 5.60%, 03/24/51(b) | | | 14 | | | | 14,479 | |
(3-mo. LIBOR US + 1.46%), 3.97%, 07/22/38(b) | | | 10 | | | | 8,533 | |
NatWest Group PLC(b) | | | | | | | | |
(1-year CMT + 0.90%), 1.64%, 06/14/27 | | | 200 | | | | 177,031 | |
(1-year CMT + 2.27%), 5.52%, 09/30/28 | | | 200 | | | | 199,076 | |
Sumitomo Mitsui Financial Group, Inc., 5.77%, 01/13/33 | | | 200 | | | | 208,911 | |
UniCredit SpA, (5-year USD ICE Swap + 3.70%), 5.86%, 06/19/32(a)(b) | | | 30 | | | | 27,169 | |
| | | | | | | | |
| | |
| | | | | | | 3,126,164 | |
| | |
| Food Products — 2.4% | | | | | | |
Campbell Soup Co., 4.80%, 03/15/48 | | | 20 | | | | 18,002 | |
Diageo Capital PLC
2.00%, 04/29/30 | | | 200 | | | | 169,333 | |
2.13%, 04/29/32 | | | 550 | | | | 451,060 | |
General Mills, Inc.
4.20%, 04/17/28 | | | 130 | | | | 127,370 | |
2.25%, 10/14/31 | | | 240 | | | | 197,769 | |
4.95%, 03/29/33 | | | 110 | | | | 109,908 | |
3.00%, 02/01/51 | | | 60 | | | | 41,858 | |
Kellogg Co., 3.25%, 04/01/26 | | | 50 | | | | 47,812 | |
Unilever Capital Corp., 1.75%, 08/12/31 | | | 200 | | | | 162,197 | |
| | | | | | | | |
| | |
| | | | | | | 1,325,309 | |
| | |
| Ground Transportation — 0.0% | | | | | | |
Canadian National Railway Co., 4.40%, 08/05/52 | | | 20 | | | | 18,139 | |
| | | | | | | | |
| | |
| Health Care Equipment & Supplies — 0.7% | | | | | | |
Abbott Laboratories, 4.90%, 11/30/46 | | | 20 | | | | 19,983 | |
DH Europe Finance II SARL
2.60%, 11/15/29 | | | 400 | | | | 355,863 | |
3.40%, 11/15/49 | | | 15 | | | | 11,541 | |
| | | | | | | | |
| | |
| | | | | | | 387,387 | |
| | |
| Health Care Providers & Services — 1.9% | | | | | | |
Allina Health System, Series 2021, 2.90%, 11/15/51 | | | 10 | | | | 6,460 | |
AmerisourceBergen Corp.
2.70%, 03/15/31 | | | 13 | | | | 11,110 | |
4.30%, 12/15/47 | | | 8 | | | | 6,713 | |
Baylor Scott & White Holdings, Series 2021, 2.84%, 11/15/50 | | | 4 | | | | 2,659 | |
Beth Israel Lahey Health, Inc., Series L, 3.08%, 07/01/51 | | | 7 | | | | 4,561 | |
CHS/Community Health Systems, Inc., 6.88%, 04/15/29(a) | | | 17 | | | | 9,560 | |
DaVita, Inc., 4.63%, 06/01/30(a) | | | 63 | | | | 53,956 | |
Elevance Health, Inc., 2.38%, 01/15/25 | | | 25 | | | | 23,886 | |
Encompass Health Corp., 4.75%, 02/01/30 | | | 36 | | | | 32,793 | |
HCA, Inc.
5.25%, 06/15/26 | | | 5 | | | | 4,965 | |
5.20%, 06/01/28 | | | 55 | | | | 54,660 | |
3.63%, 03/15/32(a) | | | 43 | | | | 37,478 | |
5.50%, 06/01/33 | | | 120 | | | | 119,773 | |
5.13%, 06/15/39 | | | 25 | | | | 22,878 | |
3.50%, 07/15/51 | | | 10 | | | | 6,730 | |
4.63%, 03/15/52(a) | | | 40 | | | | 32,214 | |
Humana, Inc.
5.75%, 03/01/28 | | | 5 | | | | 5,178 | |
3.70%, 03/23/29 | | | 20 | | | | 18,545 | |
Kaiser Foundation Hospitals, Series 2021,
3.00%, 06/01/51 | | | 7 | | | | 4,856 | |
| | | | | | | | |
| Security | | Par (000) | | | Value | |
| | |
| Health Care Providers & Services (continued) | | | | | | |
Tenet Healthcare Corp., 6.13%, 10/01/28 | | $ | 28 | | | $ | 26,539 | |
UnitedHealth Group, Inc.
4.20%, 05/15/32 | | | 340 | | | | 327,753 | |
4.45%, 12/15/48 | | | 45 | | | | 40,510 | |
5.88%, 02/15/53 | | | 55 | | | | 60,137 | |
5.05%, 04/15/53 | | | 80 | | | | 78,545 | |
3.13%, 05/15/60 | | | 50 | | | | 33,888 | |
WakeMed, Series A, 3.29%, 10/01/52 | | | 6 | | | | 4,163 | |
| | | | | | | | |
| | |
| | | | | | | 1,030,510 | |
| | |
| Hotels, Restaurants & Leisure — 0.3% | | | | | | |
Caesars Entertainment, Inc.(a)
8.13%, 07/01/27 | | | 33 | | | | 33,627 | |
7.00%, 02/15/30 | | | 28 | | | | 28,128 | |
Hilton Domestic Operating Co., Inc., 4.88%, 01/15/30 | | | 30 | | | | 27,891 | |
Sands China Ltd., 5.90%, 08/08/28 | | | 25 | | | | 23,625 | |
Yum! Brands, Inc., 5.38%, 04/01/32 | | | 29 | | | | 27,473 | |
| | | | | | | | |
| | |
| | | | | | | 140,744 | |
| | |
| Household Durables — 0.6% | | | | | | |
Lennar Corp., 4.75%, 11/29/27 | | | 130 | | | | 127,333 | |
NVR, Inc., 3.00%, 05/15/30 | | | 150 | | | | 131,154 | |
Toll Brothers Finance Corp., 3.80%, 11/01/29 | | | 100 | | | | 89,490 | |
| | | | | | | | |
| | |
| | | | | | | 347,977 | |
| | |
| Industrial Conglomerates — 0.5% | | | | | | |
nVent Finance SARL, 5.65%, 05/15/33 | | | 130 | | | | 127,433 | |
Trane Technologies Luxembourg Finance SA, 3.80%, 03/21/29 | | | 170 | | | | 159,877 | |
| | | | | | | | |
| | |
| | | | | | | 287,310 | |
| | |
| Insurance — 0.8% | | | | | | |
Arthur J Gallagher & Co., 3.50%, 05/20/51 | | | 85 | | | | 59,312 | |
Berkshire Hathaway Finance Corp., 3.85%, 03/15/52 | | | 5 | | | | 4,079 | |
Marsh & McLennan Cos., Inc.
4.75%, 03/15/39 | | | 30 | | | | 27,801 | |
4.20%, 03/01/48 | | | 160 | | | | 133,735 | |
Progressive Corp., 3.70%, 03/15/52 | | | 100 | | | | 77,537 | |
RenaissanceRe Holdings Ltd., 5.75%, 06/05/33 | | | 100 | | | | 99,964 | |
Travelers Cos., Inc., 3.75%, 05/15/46 | | | 25 | | | | 19,782 | |
Willis North America, Inc., 3.88%, 09/15/49 | | | 25 | | | | 17,864 | |
| | | | | | | | |
| | |
| | | | | | | 440,074 | |
| | |
| IT Services — 1.0% | | | | | | |
CGI, Inc., 2.30%, 09/14/31 | | | 210 | | | | 165,625 | |
Fiserv, Inc.
5.45%, 03/02/28 | | | 40 | | | | 40,616 | |
3.50%, 07/01/29 | | | 25 | | | | 22,894 | |
5.60%, 03/02/33 | | | 50 | | | | 51,221 | |
Gartner, Inc., 4.50%, 07/01/28(a) | | | 57 | | | | 53,661 | |
International Business Machines Corp., 4.00%, 07/27/25 | | | 135 | | | | 133,030 | |
Open Text Holdings, Inc., 4.13%, 02/15/30(a) | | | 19 | | | | 16,084 | |
VeriSign, Inc., 2.70%, 06/15/31 | | | 55 | | | | 45,825 | |
| | | | | | | | |
| | |
| | | | | | | 528,956 | |
| | |
| Life Sciences Tools & Services — 0.7% | | | | | | |
Agilent Technologies, Inc.
2.75%, 09/15/29 | | | 100 | | | | 88,321 | |
2.30%, 03/12/31 | | | 360 | | | | 297,814 | |
| | | | | | | | |
| | |
| | | | | | | 386,135 | |
| | |
| Machinery — 0.7% | | | | | | |
Chart Industries, Inc., 9.50%, 01/01/31(a) | | | 26 | | | | 27,192 | |
| | |
| 10 | | 2 0 2 3 BLACK ROCK ANNUAL REPORT TO SHAREHOLDERS |
| | |
Schedule of Investments (continued) May 31, 2023 | | BlackRock Sustainable Advantage CoreAlpha Bond Fund (Percentages shown are based on Net Assets) |
| | | | | | | | |
| Security | | Par (000) | | | Value | |
| | |
| Machinery (continued) | | | | | | |
Cummins, Inc., 2.60%, 09/01/50 | | $ | 30 | | | $ | 19,044 | |
IDEX Corp.
3.00%, 05/01/30 | | | 50 | | | | 43,138 | |
2.63%, 06/15/31 | | | 152 | | | | 126,829 | |
Louisiana-Pacific Corp., 3.63%, 03/15/29(a) | | | 63 | | | | 55,125 | |
Snap-on, Inc., 4.10%, 03/01/48 | | | 15 | | | | 12,942 | |
Wabash National Corp., 4.50%, 10/15/28(a) | | | 100 | | | | 86,996 | |
| | | | | | | | |
| | |
| | | | | | | 371,266 | |
| | |
| Media — 0.4% | | | | | | |
Directv Financing LLC/Directv Financing Co.-Obligor, Inc., 5.88%, 08/15/27(a) | | | 30 | | | | 26,425 | |
RELX Capital, Inc., 3.00%, 05/22/30 | | | 30 | | | | 26,606 | |
Thomson Reuters Corp., 3.35%, 05/15/26 | | | 200 | | | | 191,544 | |
| | | | | | | | |
| | |
| | | | | | | 244,575 | |
| | |
| Metals & Mining — 1.3% | | | | | | |
AngloGold Ashanti Holdings PLC, 3.75%, 10/01/30 | | | 200 | | | | 171,100 | |
FMG Resources August Pty. Ltd.(a)
5.88%, 04/15/30 | | | 29 | | | | 27,369 | |
6.13%, 04/15/32 | | | 30 | | | | 28,308 | |
Mineral Resources Ltd., 8.50%, 05/01/30(a) | | | 100 | | | | 100,375 | |
Rio Tinto Alcan, Inc., 6.13%, 12/15/33 | | | 250 | | | | 271,030 | |
Rio Tinto Finance USA Ltd., 2.75%, 11/02/51 | | | 125 | | | | 82,933 | |
Rio Tinto Finance USA PLC, 5.13%, 03/09/53 | | | 50 | | | | 49,579 | |
| | | | | | | | |
| | |
| | | | | | | 730,694 | |
| | |
| Oil, Gas & Consumable Fuels — 0.5% | | | | | | |
AmeriGas Partners LP/AmeriGas Finance Corp.
5.75%, 05/20/27 | | | 57 | | | | 51,630 | |
9.38%, 06/01/28(a) | | | 10 | | | | 10,000 | |
CGG SA, 8.75%, 04/01/27(a) | | | 50 | | | | 43,125 | |
Cheniere Corpus Christi Holdings LLC, 5.13%, 06/30/27 | | | 10 | | | | 9,916 | |
Crestwood Midstream Partners LP/Crestwood Midstream Finance Corp., 6.00%, 02/01/29(a) | | | 11 | | | | 10,176 | |
Enerflex Ltd., 9.00%, 10/15/27(a) | | | 5 | | | | 4,864 | |
MPLX LP
5.50%, 02/15/49 | | | 20 | | | | 17,830 | |
4.90%, 04/15/58 | | | 15 | | | | 11,891 | |
ONEOK, Inc.
4.45%, 09/01/49 | | | 40 | | | | 29,847 | |
7.15%, 01/15/51 | | | 30 | | | | 31,002 | |
TotalEnergies Capital International SA, 3.39%, 06/29/60 | | | 10 | | | | 7,178 | |
Vermilion Energy, Inc., 6.88%, 05/01/30(a) | | | 57 | | | | 51,870 | |
| | | | | | | | |
| | |
| | | | | | | 279,329 | |
| | |
| Personal Care Products — 0.1% | | | | | | |
Colgate-Palmolive Co., 3.25%, 08/15/32 | | | 5 | | | | 4,622 | |
Procter & Gamble Co., 3.60%, 03/25/50 | | | 30 | | | | 25,329 | |
| | | | | | | | |
| | |
| | | | | | | 29,951 | |
| | |
| Pharmaceuticals — 2.3% | | | | | | |
Astrazeneca Finance LLC
2.25%, 05/28/31 | | | 160 | | | | 135,971 | |
4.88%, 03/03/33 | | | 140 | | | | 142,617 | |
AstraZeneca PLC, 3.38%, 11/16/25 | | | 50 | | | | 48,452 | |
Bausch Health Cos., Inc., 11.00%, 09/30/28(a) | | | 14 | | | | 10,570 | |
Bristol-Myers Squibb Co., 3.90%, 03/15/62 | | | 45 | | | | 35,132 | |
Eli Lilly & Co.
4.88%, 02/27/53 | | | 25 | | | | 25,185 | |
4.95%, 02/27/63 | | | 110 | | | | 109,226 | |
Jazz Securities DAC, 4.38%, 01/15/29(a) | | | 100 | | | | 89,598 | |
Johnson & Johnson, 2.25%, 09/01/50 | | | 130 | | | | 84,601 | |
Merck & Co, Inc., 5.00%, 05/17/53 | | | 40 | | | | 40,259 | |
| | | | | | | | |
| Security | | Par (000) | | | Value | |
| | |
| Pharmaceuticals (continued) | | | | | | |
Merck & Co., Inc., 3.60%, 09/15/42 | | $ | 50 | | | $ | 41,600 | |
Novartis Capital Corp.
2.20%, 08/14/30 | | | 290 | | | | 251,873 | |
2.75%, 08/14/50 | | | 15 | | | | 10,576 | |
Zoetis, Inc.
4.50%, 11/13/25 | | | 100 | | | | 98,918 | |
5.40%, 11/14/25 | | | 140 | | | | 141,837 | |
2.00%, 05/15/30 | | | 20 | | | | 16,697 | |
| | | | | | | | |
| | |
| | | | | | | 1,283,112 | |
| | |
| Real Estate Management & Development — 0.1% | | | | | | |
CBRE Services, Inc., 4.88%, 03/01/26 | | | 30 | | | | 29,459 | |
| | | | | | | | |
|
| Semiconductors & Semiconductor Equipment — 1.8% | |
Broadcom, Inc., 3.75%, 02/15/51(a) | | | 100 | | | | 72,154 | |
Hubbell, Inc., 3.50%, 02/15/28 | | | 35 | | | | 32,811 | |
Lam Research Corp., 3.75%, 03/15/26 | | | 100 | | | | 97,867 | |
Micron Technology, Inc., 6.75%, 11/01/29 | | | 10 | | | | 10,453 | |
NVIDIA Corp.
3.20%, 09/16/26 | | | 100 | | | | 96,893 | |
2.85%, 04/01/30 | | | 25 | | | | 22,850 | |
2.00%, 06/15/31 | | | 200 | | | | 168,301 | |
3.50%, 04/01/50 | | | 160 | | | | 128,345 | |
3.70%, 04/01/60 | | | 50 | | | | 39,451 | |
Texas Instruments, Inc.
1.75%, 05/04/30 | | | 23 | | | | 19,329 | |
3.65%, 08/16/32 | | | 210 | | | | 196,303 | |
2.70%, 09/15/51 | | | 40 | | | | 27,151 | |
4.10%, 08/16/52 | | | 65 | | | | 56,297 | |
| | | | | | | | |
| | |
| | | | | | | 968,205 | |
| | |
| Software — 2.6% | | | | | | |
Adobe, Inc., 2.15%, 02/01/27 | | | 570 | | | | 527,028 | |
Electronic Arts, Inc., 2.95%, 02/15/51 | | | 20 | | | | 13,375 | |
Gen Digital, Inc., 7.13%, 09/30/30(a) | | | 39 | | | | 38,933 | |
Intuit, Inc., 1.65%, 07/15/30 | | | 352 | | | | 284,528 | |
Microsoft Corp.
2.53%, 06/01/50 | | | 25 | | | | 17,209 | |
2.92%, 03/17/52 | | | 50 | | | | 36,998 | |
2.68%, 06/01/60 | | | 50 | | | | 33,425 | |
Oracle Corp.
4.90%, 02/06/33 | | | 30 | | | | 28,978 | |
5.55%, 02/06/53 | | | 30 | | | | 28,015 | |
3.85%, 04/01/60 | | | 65 | | | | 43,828 | |
Roper Technologies, Inc., 2.95%, 09/15/29 | | | 25 | | | | 22,244 | |
ServiceNow, Inc., 1.40%, 09/01/30 | | | 100 | | | | 79,565 | |
VMware, Inc., 1.80%, 08/15/28 | | | 340 | | | | 286,011 | |
| | | | | | | | |
| | |
| | | | | | | 1,440,137 | |
| | |
| Specialty Retail — 0.3% | | | | | | |
Bath & Body Works, Inc., 6.95%, 03/01/33 | | | 12 | | | | 10,723 | |
Home Depot, Inc.
3.30%, 04/15/40 | | | 50 | | | | 40,118 | |
3.35%, 04/15/50 | | | 50 | | | | 37,313 | |
2.38%, 03/15/51 | | | 50 | | | | 30,561 | |
Lowe’s Cos., Inc., 3.75%, 04/01/32 | | | 22 | | | | 19,960 | |
| | | | | | | | |
| | |
| | | | | | | 138,675 | |
|
| Technology Hardware, Storage & Peripherals — 0.3% | |
Apple, Inc.
2.70%, 08/05/51 | | | 40 | | | | 27,631 | |
3.95%, 08/08/52 | | | 50 | | | | 43,604 | |
2.55%, 08/20/60 | | | 5 | | | | 3,234 | |
2.85%, 08/05/61 | | | 20 | | | | 13,381 | |
| | |
SCHEDULE OF INVESTMENTS | | 11 |
| | |
Schedule of Investments (continued) May 31, 2023 | | BlackRock Sustainable Advantage CoreAlpha Bond Fund (Percentages shown are based on Net Assets) |
| | | | | | | | |
| Security | | Par (000) | | | Value | |
|
| Technology Hardware, Storage & Peripherals (continued) | |
Apple, Inc. (continued)
4.10%, 08/08/62 | | $ | 15 | | | $ | 13,012 | |
Hewlett Packard Enterprise Co.
5.90%, 10/01/24 | | | 30 | | | | 30,076 | |
6.10%, 04/01/26 | | | 30 | | | | 30,162 | |
Xerox Holdings Corp., 5.50%, 08/15/28(a) | | | 33 | | | | 28,106 | |
| | | | | | | | |
| | |
| | | | | | | 189,206 | |
| | |
| Thrifts & Mortgage Finance — 0.0% | | | | | | |
Rocket Mortgage LLC/Rocket Mortgage Co-Issuer, Inc., 4.00%, 10/15/33(a) | | | 14 | | | | 10,544 | |
| | | | | | | | |
| | |
| Trading Companies & Distributors — 0.1% | | | | | | |
Boise Cascade Co., 4.88%, 07/01/30(a) | | | 62 | | | | 55,564 | |
| | | | | | | | |
| | |
| Transportation Infrastructure — 0.0% | | | | | | |
Ryder System, Inc., 5.65%, 03/01/28 | | | 10 | | | | 10,082 | |
| | | | | | | | |
| | |
| Wireless Telecommunication Services — 0.1% | | | | | | |
Rogers Communications, Inc., 3.20%, 03/15/27(a) | | | 30 | | | | 27,928 | |
| | | | | | | | |
| | |
Total Corporate Bonds — 35.6%
(Cost: $21,161,703) | | | | | | | 19,597,684 | |
| | | | | | | | |
|
Foreign Agency Obligations | |
| | |
| Mexico — 0.1% | | | | | | |
Mexico Government International Bond, 5.55%, 01/21/45 | | | 80 | | | | 75,190 | |
| | | | | | | | |
| | |
| Panama — 0.1% | | | | | | |
Panama Government International Bond, 9.38%, 04/01/29 | | | 25 | | | | 30,403 | |
| | | | | | | | |
| | |
| Uruguay — 0.2% | | | | | | |
Uruguay Government International Bond
4.38%, 10/27/27 | | | 25 | | | | 24,926 | |
4.38%, 01/23/31 | | | 50 | | | | 49,791 | |
4.98%, 04/20/55 | | | 30 | | | | 28,834 | |
| | | | | | | | |
| | |
| | | | | | | 103,551 | |
| | | | | | | | |
| | |
Total Foreign Agency Obligations — 0.4%
(Cost: $244,830) | | | | | | | 209,144 | |
| | | | | | | | |
|
Municipal Bonds | |
| | |
| California — 0.3% | | | | | | |
Bay Area Toll Authority, Refunding RB, Series F-3, 3.13%, 04/01/55 | | | 35 | | | | 24,983 | |
California State University, Refunding RB, Series B, 2.72%, 11/01/52 | | | 20 | | | | 13,149 | |
Regents of the University of California Medical Center Pooled Revenue, RB, BAB, Series H, 6.55%, 05/15/48 | | | 25 | | | | 29,314 | |
Santa Clara Valley Transportation Authority, RB, BAB, 5.88%, 04/01/32 | | | 15 | | | | 15,950 | |
State of California, GO, BAB, 7.30%, 10/01/39 | | | 50 | | | | 60,337 | |
| | | | | | | | |
| | |
| | | | | | | 143,733 | |
| | |
| District of Columbia — 0.0% | | | | | | |
District of Columbia Water & Sewer Authority, RB, Series A, Senior Lien, 4.81%, 10/01/2114 | | | 15 | | | | 13,751 | |
| | | | | | | | |
| | | | | | | | |
| Security | | Par (000) | | | Value | |
| | |
| Illinois — 0.0% | | | | | | |
Sales Tax Securitization Corp., Refunding RB, Series B, 2nd Lien, 3.24%, 01/01/42 | | $ | 10 | | | $ | 7,940 | |
| | | | | | | | |
| | |
| Michigan — 0.0% | | | | | | |
University of Michigan, RB, Series B, 3.50%, 04/01/52 | | | 9 | | | | 7,193 | |
University of Michigan, Refunding RB, Series C, 3.60%, 04/01/47 | | | 14 | | | | 12,064 | |
| | | | | | | | |
| | |
| | | | | | | 19,257 | |
| | |
| New Jersey — 0.1% | | | | | | |
New Jersey Transportation Trust Fund Authority, Refunding RB, 4.13%, 06/15/42 | | | 25 | | | | 21,413 | |
New Jersey Turnpike Authority, RB, BAB, Series A, 7.10%, 01/01/41 | | | 10 | | | | 12,183 | |
| | | | | | | | |
| | |
| | | | | | | 33,596 | |
| | |
| North Carolina — 0.0% | | | | | | |
Charlotte-Mecklenburg Hospital Authority, RB, Series S, 3.20%, 01/15/51 | | | 20 | | | | 14,074 | |
| | | | | | | | |
| | |
| Tennessee — 0.1% | | | | | | |
Metropolitan Government Nashville & Davidson County Health & Educational Facs Bd, RB, Series B, 4.05%, 07/01/26 | | | 50 | | | | 48,378 | |
| | | | | | | | |
| | |
| Texas — 0.0% | | | | | | |
Dallas Fort Worth International Airport, Refunding RB, 2.84%, 11/01/46 | | | 10 | | | | 7,256 | |
| | | | | | | | |
| | |
| Virginia — 0.0% | | | | | | |
University of Virginia, Refunding RB, Series U, 2.58%, 11/01/51 | | | 20 | | | | 13,359 | |
| | | | | | | | |
| | |
Total Municipal Bonds — 0.5%
(Cost: $383,577) | | | | | | | 301,344 | |
| | | | | | | | |
|
Non-Agency Mortgage-Backed Securities | |
| | |
| Collateralized Mortgage Obligations(b) — 4.2% | | | | | | |
Connecticut Avenue Securities Trust(a) | | | | | | | | |
Series 2019-R02, Class 1M2, (1-mo. LIBOR US + 2.30%), 7.44%, 08/25/31 | | | 7 | | | | 7,368 | |
Series 2019-R07, Class 1M2, (1-mo. LIBOR US + 2.40%), 7.54%, 04/25/31 | | | 20 | | | | 19,767 | |
Series 2020-R01, Class 1M2, (1-mo. LIBOR US + 2.05%), 7.19%, 01/25/40 | | | 185 | | | | 185,809 | |
Series 2020-R02, Class 2M2, (1-mo. LIBOR US + 2.00%), 7.14%, 01/25/40 | | | 320 | | | | 320,691 | |
Series 2022-R04, Class 1M1, (30-day Avg SOFR + 2.00%), 6.97%, 03/25/42 | | | 222 | | | | 223,114 | |
Series 2022-R07, Class 1M1, (30-day Avg SOFR + 2.95%), 7.93%, 06/25/42 | | | 123 | | | | 125,714 | |
Fannie Mae Connecticut Avenue Securities | | | | | | | | |
Series 2018-C02, Class 2M2, (1-mo. LIBOR US + 2.20%), 7.34%, 08/25/30 | | | 131 | | | | 133,335 | |
Series 2021-R02, Class 2M1, (30-day Avg SOFR + 0.90%), 5.87%, 11/25/41(a) | | | 70 | | | | 69,079 | |
Freddie Mac STACR REMIC Trust(a) | | | | | | | | |
Series 2020-DNA1, Class M2, (1-mo. LIBOR US + 1.70%), 6.84%, 01/25/50 | | | 47 | | | | 46,652 | |
| | |
| 12 | | 2 0 2 3 BLACK ROCK ANNUAL REPORT TO SHAREHOLDERS |
| | |
Schedule of Investments (continued) May 31, 2023 | | BlackRock Sustainable Advantage CoreAlpha Bond Fund (Percentages shown are based on Net Assets) |
| | | | | | | | |
| Security | | Par (000) | | | Value | |
|
| Collateralized Mortgage Obligations (continued) | |
Freddie Mac STACR REMIC Trust(a) (continued) | | | | | | | | |
Series 2020-HQA2, Class M2, (1-mo. LIBOR US + 3.10%), 8.24%, 03/25/50 | | $ | 115 | | | $ | 117,575 | |
Series 2021-DNA3, Class M1, (30-day Avg SOFR + 0.75%), 5.72%, 10/25/33 | | | 68 | | | | 67,457 | |
Series 2021-DNA3, Class M2, (30-day Avg SOFR + 2.10%), 7.07%, 10/25/33 | | | 170 | | | | 166,812 | |
Series 2021-DNA5, Class M2, (30-day Avg SOFR + 1.65%), 6.62%, 01/25/34 | | | 135 | | | | 133,581 | |
Series 2021-DNA6, Class M1, (30-day Avg SOFR + 0.80%), 5.77%, 10/25/41 | | | 204 | | | | 202,826 | |
Series 2021-HQA2, Class M1, (30-day Avg SOFR + 0.70%), 5.67%, 12/25/33 | | | 48 | | | | 47,348 | |
Series 2022-DNA5, Class M1A, (30-day Avg SOFR + 2.95%), 7.92%, 06/25/42 | | | 204 | | | | 207,427 | |
Series 2022-HQA1, Class M1A, (30-day Avg SOFR + 2.10%), 7.07%, 03/25/42 | | | 257 | | | | 257,714 | |
| | | | | | | | |
| | |
| | | | | | | 2,332,269 | |
| |
| Commercial Mortgage-Backed Securities — 0.4% | | | | |
BBCMS Mortgage Trust, 5.45%, 04/15/56 | | | 20 | | | | 20,506 | |
JPMDB Commercial Mortgage Securities Trust,
Series 2020-COR7, Class A5, 2.18%, 05/13/53 | | | 200 | | | | 163,283 | |
Wells Fargo Commercial Mortgage Trust, Series 2015-C31, Class A5, 3.70%, 11/15/48 | | | 45 | | | | 42,845 | |
| | | | | | | | |
| | |
| | | | | | | 226,634 | |
| | | | | | | | |
| | |
Total Non-Agency Mortgage-Backed Securities — 4.6%
(Cost: $2,590,408) | | | | | | | 2,558,903 | |
| | | | | | | | |
|
U.S. Government Sponsored Agency Securities | |
| | |
| Mortgage-Backed Securities — 34.0% | | | | | | |
Fannie Mae, Series 2018-M4, Class A2, 3.06%, 03/25/28(b) | | | 191 | | | | 180,754 | |
Fannie Mae Mortgage-Backed Securities, 5.00%, 03/01/53 | | | 74 | | | | 73,714 | |
Freddie Mac Mortgage-Backed Securities
3.00%, 05/01/29 - 06/01/47 | | | 242 | | | | 225,775 | |
3.50%, 03/01/46 - 06/01/49 | | | 259 | | | | 241,869 | |
4.00%, 02/01/47 - 01/01/48 | | | 58 | | | | 55,394 | |
5.50%, 05/01/53(c) | | | 21 | | | | 20,956 | |
Freddie Mac Multifamily Structured Pass Through Certificates, Series KSG1, Class A2, 1.50%, 09/25/30 | | | 120 | | | | 99,210 | |
Ginnie Mae Mortgage-Backed Securities
3.00%, 05/20/45 - 11/20/51 | | | 971 | | | | 881,139 | |
3.50%, 06/20/45 - 08/20/50 | | | 937 | | | | 880,375 | |
4.00%, 03/20/46 - 06/20/53(c)(d) | | | 406 | | | | 389,127 | |
2.50%, 12/20/46 - 08/20/51 | | | 1,666 | | | | 1,458,605 | |
4.50%, 07/20/47 - 06/20/53(c)(d) | | | 803 | | | | 781,030 | |
2.00%, 10/20/51 - 12/20/51 | | | 648 | | | | 549,790 | |
5.00%, 12/20/52 - 06/20/53(c)(d) | | | 1,496 | | | | 1,477,801 | |
5.50%, 03/20/53 - 06/20/53(c) | | | 126 | | | | 126,275 | |
1.50%, 06/20/53(c)(d) | | | 75 | | | | 60,601 | |
Uniform Mortgage-Backed Securities
3.00%, 03/01/30 - 06/13/53(c)(d) | | | 1,033 | | | | 936,599 | |
2.50%, 04/01/32 - 04/01/52 | | | 2,344 | | | | 2,040,117 | |
4.00%, 05/01/33 - 06/13/53(c)(d) | | | 721 | | | | 690,648 | |
| | | | | | | | |
| Security | | Par (000) | | | Value | |
| | |
| Mortgage-Backed Securities (continued) | | | | | | |
Uniform Mortgage-Backed Securities (continued) | | | | | |
3.50%, 02/01/34 - 06/13/53(c)(d) | | $ | 434 | | | $ | 407,373 | |
2.00%, 12/01/35 - 03/01/52 | | | 4,490 | | | | 3,779,160 | |
1.50%, 03/01/36 - 11/01/51 | | | 424 | | | | 354,685 | |
5.00%, 03/01/41 - 06/13/53(c)(d) | | | 2,352 | | | | 2,320,864 | |
4.50%, 02/01/48 - 06/13/53(c)(d) | | | 172 | | | | 169,827 | |
5.50%, 03/01/53 - 06/13/53(c) | | | 482 | | | | 483,981 | |
| | | | | | | | |
| | |
| | | | | | | 18,685,669 | |
| | | | | | | | |
| |
Total U.S. Government Sponsored Agency Securities — 34.0%
(Cost: $20,590,989) | | | | 18,685,669 | |
| | | | | | | | |
|
U.S. Treasury Obligations | |
U.S. Treasury Bonds
7.50%, 11/15/24 | | | 200 | | | | 207,766 | |
6.00%, 02/15/26 | | | 100 | | | | 104,766 | |
3.88%, 02/15/43 | | | 125 | | | | 122,695 | |
3.63%, 02/15/44 - 02/15/53 | | | 650 | | | | 614,062 | |
3.38%, 11/15/48 | | | 825 | | | | 747,463 | |
2.88%, 05/15/49 | | | 275 | | | | 227,648 | |
1.25%, 05/15/50 | | | 150 | | | | 84,094 | |
U.S. Treasury Inflation Indexed Bonds, 1.25%, 04/15/28 | | | 503 | | | | 492,989 | |
U.S. Treasury Notes
2.00%, 06/30/24 | | | 1,200 | | | | 1,160,438 | |
2.38%, 08/15/24 | | | 200 | | | | 193,906 | |
0.75%, 08/31/26 | | | 6,200 | | | | 5,589,930 | |
0.63%, 05/15/30 | | | 500 | | | | 406,484 | |
| | | | | | | | |
| |
Total U.S. Treasury Obligations — 18.1%
(Cost: $10,649,049) | | | | 9,952,241 | |
| | | | | | | | |
| |
Total Long-Term Investments — 98.2%
(Cost: $58,391,159) | | | | 54,036,969 | |
| | | | | | | | |
| | |
| | | Shares | | | | |
| |
| | |
Short-Term Securities | | | | | | | | |
| | |
| Money Market Funds — 2.3% | | | | | | |
BlackRock Liquidity Funds, T-Fund, Institutional Class, 5.00%(e)(f) | | | 1,258,114 | | | | 1,258,114 | |
| | | | | | | | |
| | |
| | | Par
(000) | | | | |
| |
| | |
| U.S. Treasury Obligations — 5.7% | | | | | | |
U.S. Treasury Bills, 5.00%, 09/05/23 - 11/09/23(g) | | $ | 2,000 | | | | 1,957,599 | |
U.S. Treasury Notes, 2.25%, 03/31/24 | | | 1,200 | | | | 1,170,703 | |
| | | | | | | | |
| | |
| | | | | | | 3,128,302 | |
| | | | | | | | |
| |
Total Short-Term Securities — 8.0%
(Cost: $4,415,906) | | | | 4,386,416 | |
| | | | | | | | |
| |
Total Investments Before TBA Sale Commitments — 106.2%
(Cost: $62,807,065) | | | | 58,423,385 | |
| | |
TBA Sale Commitments(c)(d) | | | | | | | | |
| | |
| Mortgage-Backed Securities — (3.0)% | | | | | | |
Uniform Mortgage-Backed Securities 3.50%, 06/13/53 | | | (44 | ) | | | (40,423 | ) |
| | |
SCHEDULE OF INVESTMENTS | | 13 |
| | |
Schedule of Investments (continued) May 31, 2023 | | BlackRock Sustainable Advantage CoreAlpha Bond Fund (Percentages shown are based on Net Assets) |
| | | | | | | | |
| Security | | Par (000) | | | Value | |
| |
| | |
| Mortgage-Backed Securities (continued) | | | | | | |
Uniform Mortgage-Backed Securities (continued) | | | | | |
4.50%, 06/13/53 | | $ | (210) | | | $ | (203,401 | ) |
5.00%, 06/13/53 | | | (1,417 | ) | | | (1,395,828 | ) |
5.50%, 06/13/53 | | | (25 | ) | | | (24,984 | ) |
| | | | | | | | |
| |
Total TBA Sale Commitments — (3.0)%
(Proceeds: $(1,682,531)) | | | | (1,664,636 | ) |
| | | | | | | | |
| |
Total Investments, Net of TBA Sale Commitments — 103.2%
(Cost: $61,124,534) | | | | 56,758,749 | |
Liabilities in Excess of Other Assets — (3.2)% | | | | (1,746,299 | ) |
| | | | | | | | |
| | |
Net Assets — 100.0% | | | | | | $ | 55,012,450 | |
| | | | | | | | |
| (a) | Security exempt from registration pursuant to Rule 144A under the Securities Act of 1933, as amended. These securities may be resold in transactions exempt from registration to qualified institutional investors. |
| (b) | Variable rate security. Interest rate resets periodically. The rate shown is the effective interest rate as of period end. Security description also includes the reference rate and spread if published and available. |
| (d) | Represents or includes a TBA transaction. |
| (e) | Affiliate of the Fund. |
| (f) | Annualized 7-day yield as of period end. |
| (g) | Rates are discount rates or a range of discount rates as of period end. |
For Fund compliance purposes, the Fund’s industry classifications refer to one or more of the industry sub-classifications used by one or more widely recognized market indexes or rating group indexes, and/or as defined by the investment adviser. These definitions may not apply for purposes of this report, which may combine such industry sub-classifications for reporting ease.
Affiliates
Investments in issuers considered to be affiliate(s) of the Fund during the year ended May 31, 2023 for purposes of Section 2(a)(3) of the Investment Company Act of 1940, as amended, were as follows:
| | | | | | | | | | | | | | | | | | | | | | | | | | | | | | | | | | | | |
| |
| | | | | | | | | |
| Affiliated Issuer | | Value at
05/31/22 | | | Purchases
at Cost | | | Proceeds
from Sales | | | Net
Realized
Gain (Loss) | | | Change in
Unrealized
Appreciation
(Depreciation) | | | Value at
05/31/23 | | | Shares
Held at
05/31/23 | | | Income | | | Capital Gain
Distributions
from
Underlying
Funds | |
| |
| | | | | | | | | |
BlackRock Liquidity Funds, T-Fund, Institutional Class | | $ | 3,186,359 | | | $ | — | | | $ | (1,928,245)(a) | | | $ | — | | | $ | — | | | $ | 1,258,114 | | | | 1,258,114 | | | $ | 96,430 | | | $ | — | |
| | | | | | | | | | | | | | | | | | | | | | | | | | | | | | | | | | | | |
| | (a) | Represents net amount purchased (sold). | |
Derivative Financial Instruments Outstanding as of Period End
Futures Contracts
| | | | | | | | | | | | | | | | |
| |
| | | | |
| Description | | Number of
Contracts | | | Expiration
Date | | | Notional
Amount (000) | | | Value/
Unrealized
Appreciation
(Depreciation) | |
| |
| | | | |
Long Contracts | | | | | | | | | | | | | | | | |
10-Year U.S. Treasury Note | | | 16 | | | | 09/20/23 | | | $ | 1,831 | | | $ | 3,639 | |
10-Year U.S. Ultra Long Treasury Note | | | 1 | | | | 09/20/23 | | | | 121 | | | | 795 | |
U.S. Long Bond | | | 29 | | | | 09/20/23 | | | | 3,726 | | | | 32,622 | |
Ultra U.S. Treasury Bond | | | 5 | | | | 09/20/23 | | | | 686 | | | | 10,994 | |
2-Year U.S. Treasury Note | | | 13 | | | | 09/29/23 | | | | 2,675 | | | | (6,161 | ) |
5-Year U.S. Treasury Note | | | 9 | | | | 09/29/23 | | | | 981 | | | | (1,638 | ) |
| | | | | | | | | | | | | | | | |
| | | | |
| | | | | | | | | | | | | | | 40,251 | |
| | | | | | | | | | | | | | | | |
| | | | |
Short Contracts | | | | | | | | | | | | | | | | |
Euro BTP | | | 3 | | | | 06/08/23 | | | | 372 | | | | (8,030 | ) |
Euro Bund | | | 1 | | | | 06/08/23 | | | | 145 | | | | (1,914 | ) |
Euro OAT | | | 4 | | | | 06/08/23 | | | | 558 | | | | (1,810 | ) |
10-Year Australian Treasury Bonds | | | 2 | | | | 06/15/23 | | | | 156 | | | | (726 | ) |
10-Year Canadian Bond | | | 8 | | | | 09/20/23 | | | | 729 | | | | 5,501 | |
Long Gilt | | | 1 | | | | 09/27/23 | | | | 120 | | | | (200 | ) |
| | | | | | | | | | | | | | | | |
| | | | |
| | | | | | | | | | | | | | | (7,179 | ) |
| | | | | | | | | | | | | | | | |
| | | | |
| | | | | | | | | | | | | | $ | 33,072 | |
| | | | | | | | | | | | | | | | |
| | |
| 14 | | 2 0 2 3 BLACK ROCK ANNUAL REPORT TO SHAREHOLDERS |
| | |
Schedule of Investments (continued) May 31, 2023 | | BlackRock Sustainable Advantage CoreAlpha Bond Fund |
Forward Foreign Currency Exchange Contracts
| | | | | | | | | | | | | | | | | | |
| | | | | |
| Currency Purchased | | Currency Sold | | | Counterparty | | Settlement Date | | | Unrealized
Appreciation
(Depreciation) | |
USD | | 6,663 | | AUD | | | 10,000 | | | Morgan Stanley & Co. International PLC | | | 06/21/23 | | | $ | 153 | |
USD | | 6,714 | | AUD | | | 10,000 | | | Morgan Stanley & Co. International PLC | | | 06/21/23 | | | | 204 | |
USD | | 11,060 | | CHF | | | 10,000 | | | Deutsche Bank AG | | | 06/21/23 | | | | 56 | |
USD | | 11,004 | | EUR | | | 10,000 | | | Barclays Bank PLC | | | 06/21/23 | | | | 303 | |
USD | | 11,057 | | EUR | | | 10,000 | | | Deutsche Bank AG | | | 06/21/23 | | | | 356 | |
USD | | 10,740 | | EUR | | | 10,000 | | | JPMorgan Chase Bank N.A. | | | 06/21/23 | | | | 40 | |
USD | | 11,064 | | EUR | | | 10,000 | | | Morgan Stanley & Co. International PLC | | | 06/21/23 | | | | 364 | |
USD | | 64,422 | | EUR | | | 60,000 | | | Morgan Stanley & Co. International PLC | | | 06/21/23 | | | | 218 | |
USD | | 75,532 | | EUR | | | 70,000 | | | Morgan Stanley & Co. International PLC | | | 06/21/23 | | | | 627 | |
USD | | 12,459 | | GBP | | | 10,000 | | | Barclays Bank PLC | | | 06/21/23 | | | | 14 | |
USD | | 12,454 | | GBP | | | 10,000 | | | Morgan Stanley & Co. International PLC | | | 06/21/23 | | | | 10 | |
USD | | 17,919 | | HKD | | | 140,000 | | | JPMorgan Chase Bank N.A. | | | 06/21/23 | | | | 32 | |
USD | | 6,194 | | NZD | | | 10,000 | | | Deutsche Bank AG | | | 06/21/23 | | | | 172 | |
USD | | 6,191 | | NZD | | | 10,000 | | | Morgan Stanley & Co. International PLC | | | 06/21/23 | | | | 168 | |
USD | | 51,626 | | SEK | | | 550,000 | | | JPMorgan Chase Bank N.A. | | | 06/21/23 | | | | 891 | |
USD | | 44,739 | | SGD | | | 60,000 | | | JPMorgan Chase Bank N.A. | | | 06/21/23 | | | | 346 | |
USD | | 7,467 | | SGD | | | 10,000 | | | Societe Generale | | | 06/21/23 | | | | 68 | |
| | | | | | | | | | | | | | | | | | |
| | | | | | |
| | | | | | | | | | | | | | | | | 4,022 | |
| | | | | | | | | | | | | | | | | | |
EUR | | 123,608 | | USD | | | 133,333 | | | Citibank N.A. | | | 06/21/23 | | | | (1,064 | ) |
EUR | | 50,000 | | USD | | | 55,458 | | | Morgan Stanley & Co. International PLC | | | 06/21/23 | | | | (1,955 | ) |
GBP | | 73,343 | | USD | | | 91,426 | | | JPMorgan Chase Bank N.A. | | | 06/21/23 | | | | (155 | ) |
USD | | 42,673 | | EUR | | | 40,000 | | | Morgan Stanley & Co. International PLC | | | 06/21/23 | | | | (129 | ) |
USD | | 12,381 | | GBP | | | 10,000 | | | Morgan Stanley & Co. International PLC | | | 06/21/23 | | | | (63 | ) |
USD | | 84,699 | | GBP | | | 70,000 | | | Morgan Stanley & Co. International PLC | | | 06/21/23 | | | | (2,413 | ) |
| | | | | | | | | | | | | | | | | | |
| | | | | | |
| | | | | | | | | | | | | | | | | (5,779 | ) |
| | | | | | | | | | | | | | | | | | |
| | | | | | |
| | | | | | | | | | | | | | | | $ | (1,757 | ) |
| | | | | | | | | | | | | | | | | | |
Centrally Cleared Credit Default Swaps — Buy Protection
| | | | | | | | | | | | | | | | | | | | | | | | | | | | |
| | | | | | | | |
| Reference Obligation/Index | | Financing
Rate Paid
by the Fund | | | Payment
Frequency | | | Termination
Date | | | Notional
Amount (000) | | | Value | | | Upfront
Premium
Paid
(Received) | | | Unrealized
Appreciation
(Depreciation) | |
CDX.NA.HY.40.V1 | | | 5.00 | % | | | Quarterly | | | | 06/20/28 | | | | USD 1,051 | | | $ | (21,862 | ) | | $ | 1,040 | | | $ | (22,902 | ) |
| | | | | | | | | | | | | | | | | | | | | | | | | | | | |
Centrally Cleared Inflation Swaps
| | | | | | | | | | | | | | | | | | | | | | | | | | | | |
Paid by the Fund | | Received by the Fund | | Termination | | | Notional | | | | | Upfront
Premium
Paid | | | Unrealized
Appreciation | |
| Reference | | Frequency | | Rate | | Frequency | | Date | | | Amount (000) | | Value | | | (Received) | | | (Depreciation) | |
US CPI for All Urban Consumers NSA | | Monthly | | 2.47% | | Monthly | | | 03/23/33 | | | | USD | | | 90 | | $ | (92 | ) | | $ | 2 | | | $ | (94 | ) |
US CPI for All Urban Consumers NSA | | Monthly | | 2.53% | | Monthly | | | 04/13/33 | | | | USD | | | 60 | | | 366 | | | | 1 | | | | 365 | |
US CPI for All Urban Consumers NSA | | Monthly | | 2.50% | | Monthly | | | 04/14/33 | | | | USD | | | 100 | | | 363 | | | | 2 | | | | 361 | |
UK RPI All Items NSA | | Monthly | | 3.77% | | Monthly | | | 04/15/33 | | | | GBP | | | 50 | | | (306 | ) | | | 262 | | | | (568 | ) |
UK RPI All Items NSA | | Monthly | | 3.78% | | Monthly | | | 04/15/33 | | | | GBP | | | 180 | | | (998 | ) | | | (269 | ) | | | (729 | ) |
Eurostat Eurozone HICP Ex Tobacco Unrevised | | Monthly | | 2.38% | | Monthly | | | 05/15/33 | | | | EUR | | | 130 | | | (1,076 | ) | | | 3 | | | | (1,079 | ) |
UK RPI All Items NSA | | Monthly | | 3.79% | | Monthly | | | 05/15/33 | | | | GBP | | | 100 | | | 71 | | | | 3 | | | | 68 | |
US CPI for All Urban Consumers NSA | | Monthly | | 2.49% | | Monthly | | | 05/18/33 | | | | USD | | | 70 | | | 181 | | | | 1 | | | | 180 | |
US CPI for All Urban Consumers NSA | | Monthly | | 2.50% | | Monthly | | | 06/02/33 | | | | USD | | | 510 | | | 1,336 | | | | 11 | | | | 1,325 | |
| | | | | | | | | | | | | | | | | | | | | | | | | | | | |
| | | | | | | | | |
| | | | | | | | | | | | | | | | | | $ | (155 | ) | | $ | 16 | | | $ | (171 | ) |
| | | | | | | | | | | | | | | | | | | | | | | | | | | | |
| | |
SCHEDULE OF INVESTMENTS | | 15 |
| | |
Schedule of Investments (continued) May 31, 2023 | | BlackRock Sustainable Advantage CoreAlpha Bond Fund |
Centrally Cleared Interest Rate Swaps
| | | | | | | | | | | | | | | | | | | | | | | | | | | | | | | | |
Paid by the Fund | | Received by the Fund | | Effective | | | Termination | | | Notional | | | | | | Upfront
Premium
Paid | | | Unrealized
Appreciation | |
| Rate | | Frequency | | Rate | | Frequency | | Date | | | Date | | | Amount (000) | | | Value | | | (Received) | | | (Depreciation) | |
3.42% | | Annual | | 6-mo. EURIBOR, 3.75% | | Semi-Annual | | | 06/21/23 | (a) | | | 06/21/25 | | | EUR | | | 3,100 | | | $ | 4,167 | | | $ | (3,565 | ) | | $ | 7,732 | |
1-Day SONIA, 4.43% | | Annual | | 3.93% | | Annual | | | 06/21/23 | (a) | | | 06/21/25 | | | GBP | | | 2,750 | | | | (71,514 | ) | | | 10,671 | | | | (82,185 | ) |
3.16% | | Annual | | 6-mo. EURIBOR, 3.75% | | Semi-Annual | | | 06/21/23 | (a) | | | 06/21/26 | | | EUR | | | 620 | | | | 1,607 | | | | (256 | ) | | | 1,863 | |
3.16% | | Annual | | 6-mo. EURIBOR, 3.75% | | Semi-Annual | | | 06/21/23 | (a) | | | 06/21/26 | | | EUR | | | 300 | | | | 796 | | | | 59 | | | | 737 | |
3.22% | | Annual | | 6-mo. EURIBOR, 3.75% | | Semi-Annual | | | 06/21/23 | (a) | | | 06/21/26 | | | EUR | | | 2,360 | | | | 1,819 | | | | 25 | | | | 1,794 | |
3.24% | | Annual | | 6-mo. EURIBOR, 3.75% | | Semi-Annual | | | 06/21/23 | (a) | | | 06/21/26 | | | EUR | | | 180 | | | | 33 | | | | (69 | ) | | | 102 | |
3.34% | | Quarterly | | 3-mo. BBSW, 3.98% | | Quarterly | | | 06/21/23 | (a) | | | 06/21/26 | | | AUD | | | 290 | | | | 2,076 | | | | 2 | | | | 2,074 | |
3.38% | | Annual | | 6-mo. EURIBOR, 3.75% | | Semi-Annual | | | 06/21/23 | (a) | | | 06/21/26 | | | EUR | | | 170 | | | | (675 | ) | | | 9 | | | | (684 | ) |
3-mo. BBSW, 3.98% | | Quarterly | | 3.43% | | Quarterly | | | 06/21/23 | (a) | | | 06/21/26 | | | AUD | | | 290 | | | | (1,634 | ) | | | 333 | | | | (1,967 | ) |
3.45% | | Annual | | 1-Day SOFR, 5.06% | | Annual | | | 06/21/23 | (a) | | | 06/21/26 | | | USD | | | 190 | | | | 2,058 | | | | 158 | | | | 1,900 | |
3.48% | | Quarterly | | 3-mo. BBSW, 3.98% | | Quarterly | | | 06/21/23 | (a) | | | 06/21/26 | | | AUD | | | 290 | | | | 1,331 | | | | (5 | ) | | | 1,336 | |
3.51% | | Annual | | 1-Day SOFR, 5.06% | | Annual | | | 06/21/23 | (a) | | | 06/21/26 | | | USD | | | 200 | | | | 1,839 | | | | (20 | ) | | | 1,859 | |
1-Day SOFR, 5.06% | | Annual | | 3.51% | | Annual | | | 06/21/23 | (a) | | | 06/21/26 | | | USD | | | 570 | | | | (5,305 | ) | | | 23 | | | | (5,328 | ) |
1-Day SOFR, 5.06% | | Annual | | 3.54% | | Annual | | | 06/21/23 | (a) | | | 06/21/26 | | | USD | | | 860 | | | | (7,146 | ) | | | (177 | ) | | | (6,969 | ) |
1-Day SOFR, 5.06% | | Annual | | 3.55% | | Annual | | | 06/21/23 | (a) | | | 06/21/26 | | | USD | | | 110 | | | | (896 | ) | | | 939 | | | | (1,835 | ) |
3-mo. BBSW, 3.98% | | Quarterly | | 3.63% | | Quarterly | | | 06/21/23 | (a) | | | 06/21/26 | | | AUD | | | 850 | | | | (1,627 | ) | | | 2,697 | | | | (4,324 | ) |
3.72% | | Semi-Annual | | 3-mo. Canada Bank Acceptance, 5.08% | | Semi-Annual | | | 06/21/23 | (a) | | | 06/21/26 | | | CAD | | | 260 | | | | 3,154 | | | | (51 | ) | | | 3,205 | |
1-Day SONIA, 4.43% | | Annual | | 3.97% | | Annual | | | 06/21/23 | (a) | | | 06/21/26 | | | GBP | | | 460 | | | | (13,073 | ) | | | 6 | | | | (13,079 | ) |
4.01% | | Annual | | 1-Day SONIA, 4.43% | | Annual | | | 06/21/23 | (a) | | | 06/21/26 | | | GBP | | | 160 | | | | 4,358 | | | | 190 | | | | 4,168 | |
4.22% | | Annual | | 1-Day SONIA, 4.43% | | Annual | | | 06/21/23 | (a) | | | 06/21/26 | | | GBP | | | 150 | | | | 2,983 | | | | 6 | | | | 2,977 | |
2.87% | | Annual | | 6-mo. EURIBOR, 3.75% | | Semi-Annual | | | 06/21/23 | (a) | | | 06/21/28 | | | EUR | | | 1,850 | | | | 13,776 | | | | 7,777 | | | | 5,999 | |
3.09% | | Annual | | 1-Day SOFR, 5.06% | | Annual | | | 06/21/23 | (a) | | | 06/21/28 | | | USD | | | 2,990 | | | | 58,762 | | | | 20,963 | | | | 37,799 | |
6-mo. EURIBOR, 3.75% | | Semi-Annual | | 3.09% | | Annual | | | 06/21/23 | (a) | | | 06/21/28 | | | EUR | | | 1,290 | | | | 4,437 | | | | 6,633 | | | | (2,196 | ) |
3.55% | | Annual | | 1-Day SONIA, 4.43% | | Annual | | | 06/21/23 | (a) | | | 06/21/28 | | | GBP | | | 1,160 | | | | 57,589 | | | | (12,926 | ) | | | 70,515 | |
4.65% | | Annual | | 1-Day SONIA, 4.43% | | Annual | | | 06/21/23 | (a) | | | 06/21/28 | | | GBP | | | 2,360 | | | | (23,899 | ) | | | (2,931 | ) | | | (20,968 | ) |
8.20% | | Monthly | | 28-Day MXIBTIIE, 11.50% | | Monthly | | | 09/20/23 | (a) | | | 09/13/28 | | | MXN | | | 730 | | | | 85 | | | | — | | | | 85 | |
8.37% | | Monthly | | 28-Day MXIBTIIE, 11.50% | | Monthly | | | 09/20/23 | (a) | | | 09/13/28 | | | MXN | | | 1,110 | | | | (276 | ) | | | 1 | | | | (277 | ) |
8.38% | | Monthly | | 28-Day MXIBTIIE, 11.50% | | Monthly | | | 09/20/23 | (a) | | | 09/13/28 | | | MXN | | | 1,060 | | | | (298 | ) | | | 1 | | | | (299 | ) |
8.47% | | Monthly | | 28-Day MXIBTIIE, 11.50% | | Monthly | | | 09/20/23 | (a) | | | 09/13/28 | | | MXN | | | 460 | | | | (221 | ) | | | — | | | | (221 | ) |
8.82% | | Monthly | | 28-Day MXIBTIIE, 11.50% | | Monthly | | | 09/20/23 | (a) | | | 09/13/28 | | | MXN | | | 430 | | | | (539 | ) | | | — | | | | (539 | ) |
8.83% | | Monthly | | 28-Day MXIBTIIE, 11.50% | | Monthly | | | 09/20/23 | (a) | | | 09/13/28 | | | MXN | | | 590 | | | | (750 | ) | | | — | | | | (750 | ) |
8.86% | | Monthly | | 28-Day MXIBTIIE, 11.50% | | Monthly | | | 09/20/23 | (a) | | | 09/13/28 | | | MXN | | | 5,070 | | | | (6,782 | ) | | | 3 | | | | (6,785 | ) |
8.92% | | Monthly | | 28-Day MXIBTIIE, 11.50% | | Monthly | | | 09/20/23 | (a) | | | 09/13/28 | | | MXN | | | 810 | | | | (1,186 | ) | | | — | | | | (1,186 | ) |
8.96% | | Monthly | | 28-Day MXIBTIIE, 11.50% | | Monthly | | | 09/20/23 | (a) | | | 09/13/28 | | | MXN | | | 290 | | | | (454 | ) | | | — | | | | (454 | ) |
1.87% | | Annual | | 1-Day SSARON, 1.44% | | Annual | | | 09/20/23 | (a) | | | 09/20/28 | | | CHF | | | 10 | | | | (86 | ) | | | 6 | | | | (92 | ) |
1-Day THOR, 2.00% | | Quarterly | | 2.26% | | Quarterly | | | 09/20/23 | (a) | | | 09/20/28 | | | THB | | | 560 | | | | (8 | ) | | | — | | | | (8 | ) |
1-Day THOR, 2.00% | | Quarterly | | 2.30% | | Quarterly | | | 09/20/23 | (a) | | | 09/20/28 | | | THB | | | 560 | | | | 20 | | | | — | | | | 20 | |
2.75% | | Semi-Annual | | 1-Day SORA, 3.72% | | Semi-Annual | | | 09/20/23 | (a) | | | 09/20/28 | | | SGD | | | 10 | | | | 45 | | | | — | | | | 45 | |
2.77% | | Semi-Annual | | 1-Day SORA, 3.72% | | Semi-Annual | | | 09/20/23 | (a) | | | 09/20/28 | | | SGD | | | 10 | | | | 39 | | | | — | | | | 39 | |
2.82% | | Annual | | 3-mo. STIBOR, 3.71% | | Quarterly | | | 09/20/23 | (a) | | | 09/20/28 | | | SEK | | | 540 | | | | 436 | | | | 1 | | | | 435 | |
2.83% | | Annual | | 3-mo. STIBOR, 3.71% | | Quarterly | | | 09/20/23 | (a) | | | 09/20/28 | | | SEK | | | 290 | | | | 219 | | | | — | | | | 219 | |
2.88% | | Annual | | 3-mo. STIBOR, 3.71% | | Quarterly | | | 09/20/23 | (a) | | | 09/20/28 | | | SEK | | | 400 | | | | 226 | | | | — | | | | 226 | |
2.89% | | Annual | | 6-mo. EURIBOR, 3.75% | | Semi-Annual | | | 09/20/23 | (a) | | | 09/20/28 | | | EUR | | | 40 | | | | 143 | | | | — | | | | 143 | |
2.90% | | Annual | | 3-mo. STIBOR, 3.71% | | Quarterly | | | 09/20/23 | (a) | | | 09/20/28 | | | SEK | | | 550 | | | | 259 | | | | (1 | ) | | | 260 | |
2.92% | | Semi-Annual | | 1-Day SORA, 3.72% | | Semi-Annual | | | 09/20/23 | (a) | | | 09/20/28 | | | SGD | | | 50 | | | | (64 | ) | | | — | | | | (64 | ) |
2.92% | | Annual | | 3-mo. STIBOR, 3.71% | | Quarterly | | | 09/20/23 | (a) | | | 09/20/28 | | | SEK | | | 530 | | | | 196 | | | | 1 | | | | 195 | |
3-mo. KRW CDC, 3.76% | | Quarterly | | 2.93% | | Quarterly | | | 09/20/23 | (a) | | | 09/20/28 | | | KRW | | | 36,290 | | | | (415 | ) | | | — | | | | (415 | ) |
2.93% | | Annual | | 3-mo. STIBOR, 3.71% | | Quarterly | | | 09/20/23 | (a) | | | 09/20/28 | | | SEK | | | 260 | | | | 87 | | | | (82 | ) | | | 169 | |
3-mo. KRW CDC, 3.76% | | Quarterly | | 2.94% | | Quarterly | | | 09/20/23 | (a) | | | 09/20/28 | | | KRW | | | 36,290 | | | | (398 | ) | | | — | | | | (398 | ) |
3.00% | | Annual | | 3-mo. STIBOR, 3.71% | | Quarterly | | | 09/20/23 | (a) | | | 09/20/28 | | | SEK | | | 530 | | | | 33 | | | | 1 | | | | 32 | |
3.01% | | Annual | | 3-mo. STIBOR, 3.71% | | Quarterly | | | 09/20/23 | (a) | | | 09/20/28 | | | SEK | | | 220 | | | | 2 | | | | — | | | | 2 | |
3-mo. KRW CDC, 3.76% | | Quarterly | | 3.03% | | Quarterly | | | 09/20/23 | (a) | | | 09/20/28 | | | KRW | | | 42,760 | | | | (336 | ) | | | — | | | | (336 | ) |
3-mo. KRW CDC, 3.76% | | Quarterly | | 3.05% | | Quarterly | | | 09/20/23 | (a) | | | 09/20/28 | | | KRW | | | 55,560 | | | | (413 | ) | | | — | | | | (413 | ) |
3.05% | | Annual | | 3-mo. STIBOR, 3.71% | | Quarterly | | | 09/20/23 | (a) | | | 09/20/28 | | | SEK | | | 240 | | | | (33 | ) | | | — | | | | (33 | ) |
3.05% | | Annual | | 3-mo. STIBOR, 3.71% | | Quarterly | | | 09/20/23 | (a) | | | 09/20/28 | | | SEK | | | 250 | | | | (39 | ) | | | (1 | ) | | | (38 | ) |
3-mo. HIBOR, 4.77% | | Quarterly | | 3.06% | | Quarterly | | | 09/20/23 | (a) | | | 09/20/28 | | | HKD | | | 50 | | | | (183 | ) | | | — | | | | (183 | ) |
3-mo. KRW CDC, 3.76% | | Quarterly | | 3.06% | | Quarterly | | | 09/20/23 | (a) | | | 09/20/28 | | | KRW | | | 13,252 | | | | (90 | ) | | | — | | | | (90 | ) |
3-mo. KRW CDC, 3.76% | | Quarterly | | 3.06% | | Quarterly | | | 09/20/23 | (a) | | | 09/20/28 | | | KRW | | | 34,540 | | | | (245 | ) | | | — | | | | (245 | ) |
3-mo. KRW CDC, 3.76% | | Quarterly | | 3.06% | | Quarterly | | | 09/20/23 | (a) | | | 09/20/28 | | | KRW | | | 50,530 | | | | (345 | ) | | | — | | | | (345 | ) |
3-mo. KRW CDC, 3.76% | | Quarterly | | 3.07% | | Quarterly | | | 09/20/23 | (a) | | | 09/20/28 | | | KRW | | | 27,500 | | | | (180 | ) | | | — | | | | (180 | ) |
| | |
| 16 | | 2 0 2 3 BLACK ROCK ANNUAL REPORT TO SHAREHOLDERS |
| | |
Schedule of Investments (continued) May 31, 2023 | | BlackRock Sustainable Advantage CoreAlpha Bond Fund |
Centrally Cleared Interest Rate Swaps (continued)
| | | | | | | | | | | | | | | | | | | | | | | | | | | | | | | | |
Paid by the Fund | | Received by the Fund | | Effective | | | Termination | | | Notional | | | | | | Upfront
Premium
Paid | | | Unrealized
Appreciation | |
| Rate | | Frequency | | Rate | | Frequency | | Date | | | Date | | | Amount (000) | | | Value | | | (Received) | | | (Depreciation) | |
3-mo. KRW CDC, 3.76% | | Quarterly | | 3.08% | | Quarterly | | | 09/20/23 | (a) | | | 09/20/28 | | | KRW | | | 28,130 | | | $ | (180 | ) | | $ | — | | | $ | (180 | ) |
3.08% | | Annual | | 3-mo. STIBOR, 3.71% | | Quarterly | | | 09/20/23 | (a) | | | 09/20/28 | | | SEK | | | 260 | | | | (68 | ) | | | — | | | | (68 | ) |
3.08% | | Annual | | 6-mo. EURIBOR, 3.75% | | Semi-Annual | | | 09/20/23 | (a) | | | 09/20/28 | | | EUR | | | 30 | | | | (170 | ) | | | — | | | | (170 | ) |
3.08% | | Annual | | 6-mo. EURIBOR, 3.75% | | Semi-Annual | | | 09/20/23 | (a) | | | 09/20/28 | | | EUR | | | 40 | | | | (231 | ) | | | — | | | | (231 | ) |
3-mo. HIBOR, 4.77% | | Quarterly | | 3.10% | | Quarterly | | | 09/20/23 | (a) | | | 09/20/28 | | | HKD | | | 50 | | | | (171 | ) | | | — | | | | (171 | ) |
3-mo. KRW CDC, 3.76% | | Quarterly | | 3.11% | | Quarterly | | | 09/20/23 | (a) | | | 09/20/28 | | | KRW | | | 19,878 | | | | (106 | ) | | | — | | | | (106 | ) |
3-mo. HIBOR, 4.77% | | Quarterly | | 3.12% | | Quarterly | | | 09/20/23 | (a) | | | 09/20/28 | | | HKD | | | 140 | | | | (463 | ) | | | — | | | | (463 | ) |
3-mo. KRW CDC, 3.76% | | Quarterly | | 3.13% | | Quarterly | | | 09/20/23 | (a) | | | 09/20/28 | | | KRW | | | 56,580 | | | | (249 | ) | | | — | | | | (249 | ) |
3-mo. KRW CDC, 3.76% | | Quarterly | | 3.13% | | Quarterly | | | 09/20/23 | (a) | | | 09/20/28 | | | KRW | | | 62,630 | | | | (280 | ) | | | — | | | | (280 | ) |
3.15% | | Annual | | 6-mo. EURIBOR, 3.75% | | Semi-Annual | | | 09/20/23 | (a) | | | 09/20/28 | | | EUR | | | 60 | | | | (541 | ) | | | 1 | | | | (542 | ) |
3.16% | | Annual | | 6-mo. EURIBOR, 3.75% | | Semi-Annual | | | 09/20/23 | (a) | | | 09/20/28 | | | EUR | | | 60 | | | | (586 | ) | | | 1 | | | | (587 | ) |
3.18% | | Annual | | 6-mo. EURIBOR, 3.75% | | Semi-Annual | | | 09/20/23 | (a) | | | 09/20/28 | | | EUR | | | 30 | | | | (317 | ) | | | 16 | | | | (333 | ) |
3-mo. KRW CDC, 3.76% | | Quarterly | | 3.21% | | Quarterly | | | 09/20/23 | (a) | | | 09/20/28 | | | KRW | | | 25,780 | | | | (41 | ) | | | — | | | | (41 | ) |
3.23% | | Annual | | 1-Day SOFR, 5.06% | | Annual | | | 09/20/23 | (a) | | | 09/20/28 | | | USD | | | 20 | | | | 149 | | | | — | | | | 149 | |
3-mo. HIBOR, 4.77% | | Quarterly | | 3.23% | | Quarterly | | | 09/20/23 | (a) | | | 09/20/28 | | | HKD | | | 74 | | | | (198 | ) | | | — | | | | (198 | ) |
3-mo. HIBOR, 4.77% | | Quarterly | | 3.24% | | Quarterly | | | 09/20/23 | (a) | | | 09/20/28 | | | HKD | | | 206 | | | | (544 | ) | | | — | | | | (544 | ) |
3-mo. KRW CDC, 3.76% | | Quarterly | | 3.29% | | Quarterly | | | 09/20/23 | (a) | | | 09/20/28 | | | KRW | | | 16,400 | | | | 20 | | | | — | | | | 20 | |
3-mo. KRW CDC, 3.76% | | Quarterly | | 3.30% | | Quarterly | | | 09/20/23 | (a) | | | 09/20/28 | | | KRW | | | 18,240 | | | | 26 | | | | — | | | | 26 | |
3.30% | | Annual | | 3-mo. STIBOR, 3.71% | | Quarterly | | | 09/20/23 | (a) | | | 09/20/28 | | | SEK | | | 150 | | | | (182 | ) | | | — | | | | (182 | ) |
3.32% | | Annual | | 1-Day SOFR, 5.06% | | Annual | | | 09/20/23 | (a) | | | 09/20/28 | | | USD | | | 40 | | | | 144 | | | | 17 | | | | 127 | |
3-mo. HIBOR, 4.77% | | Quarterly | | 3.36% | | Quarterly | | | 09/20/23 | (a) | | | 09/20/28 | | | HKD | | | 160 | | | | (312 | ) | | | — | | | | (312 | ) |
3.36% | | Annual | | 3-mo. STIBOR, 3.71% | | Quarterly | | | 09/20/23 | (a) | | | 09/20/28 | | | SEK | | | 560 | | | | (805 | ) | | | 231 | | | | (1,036 | ) |
3-mo. HIBOR, 4.77% | | Quarterly | | 3.37% | | Quarterly | | | 09/20/23 | (a) | | | 09/20/28 | | | HKD | | | 160 | | | | (303 | ) | | | — | | | | (303 | ) |
3.41% | | Annual | | 6-mo. NIBOR, 4.37% | | Semi-Annual | | | 09/20/23 | (a) | | | 09/20/28 | | | NOK | | | 270 | | | | 198 | | | | 54 | | | | 144 | |
1-Day SONIA, 4.43% | | Annual | | 3.42% | | Annual | | | 09/20/23 | (a) | | | 09/20/28 | | | GBP | | | 30 | | | | (1,579 | ) | | | — | | | | (1,579 | ) |
3.44% | | Semi-Annual | | 1-Day SORA, 3.72% | | Semi-Annual | | | 09/20/23 | (a) | | | 09/20/28 | | | SGD | | | 30 | | | | (566 | ) | | | — | | | | (566 | ) |
3.44% | | Annual | | 6-mo. NIBOR, 4.37% | | Semi-Annual | | | 09/20/23 | (a) | | | 09/20/28 | | | NOK | | | 140 | | | | 84 | | | | — | | | | 84 | |
3.46% | | Semi-Annual | | 6-mo. BBSW, 4.17% | | Semi-Annual | | | 09/20/23 | (a) | | | 09/20/28 | | | AUD | | | 40 | | | | 420 | | | | — | | | | 420 | |
1-Day SONIA, 4.43% | | Annual | | 3.49% | | Annual | | | 09/20/23 | (a) | | | 09/20/28 | | | GBP | | | 40 | | | | (1,959 | ) | | | 1 | | | | (1,960 | ) |
3-mo. KRW CDC, 3.76% | | Quarterly | | 3.50% | | Quarterly | | | 09/20/23 | (a) | | | 09/20/28 | | | KRW | | | 121,550 | | | | 1,019 | | | | 2 | | | | 1,017 | |
3.51% | | Semi-Annual | | 6-mo. BBSW, 4.17% | | Semi-Annual | | | 09/20/23 | (a) | | | 09/20/28 | | | AUD | | | 50 | | | | 455 | | | | — | | | | 455 | |
3-mo. Canada Bank Acceptance, 5.08% | | Semi-Annual | | 3.53% | | Semi-Annual | | | 09/20/23 | (a) | | | 09/20/28 | | | CAD | | | 70 | | | | (450 | ) | | | (122 | ) | | | (328 | ) |
3.55% | | Semi-Annual | | 6-mo. BBSW, 4.17% | | Semi-Annual | | | 09/20/23 | (a) | | | 09/20/28 | | | AUD | | | 40 | | | | 323 | | | | — | | | | 323 | |
3.57% | | Annual | | 6-mo. NIBOR, 4.37% | | Semi-Annual | | | 09/20/23 | (a) | | | 09/20/28 | | | NOK | | | 410 | | | | 38 | | | | — | | | | 38 | |
3.58% | | Semi-Annual | | 6-mo. BBSW, 4.17% | | Semi-Annual | | | 09/20/23 | (a) | | | 09/20/28 | | | AUD | | | 70 | | | | 498 | | | | 1 | | | | 497 | |
3.60% | | Semi-Annual | | 6-mo. BBSW, 4.17% | | Semi-Annual | | | 09/20/23 | (a) | | | 09/20/28 | | | AUD | | | 30 | | | | 193 | | | | — | | | | 193 | |
1-Day SONIA, 4.43% | | Annual | | 3.61% | | Annual | | | 09/20/23 | (a) | | | 09/20/28 | | | GBP | | | 30 | | | | (1,276 | ) | | | — | | | | (1,276 | ) |
3-mo. Canada Bank Acceptance, 5.08% | | Semi-Annual | | 3.61% | | Semi-Annual | | | 09/20/23 | (a) | | | 09/20/28 | | | CAD | | | 50 | | | | (187 | ) | | | (13 | ) | | | (174 | ) |
1-Day SONIA, 4.43% | | Annual | | 3.63% | | Annual | | | 09/20/23 | (a) | | | 09/20/28 | | | GBP | | | 20 | | | | (825 | ) | | | — | | | | (825 | ) |
1-Day SONIA, 4.43% | | Annual | | 3.65% | | Annual | | | 09/20/23 | (a) | | | 09/20/28 | | | GBP | | | 30 | | | | (1,201 | ) | | | (14 | ) | | | (1,187 | ) |
1-Day SONIA, 4.43% | | Annual | | 3.67% | | Annual | | | 09/20/23 | (a) | | | 09/20/28 | | | GBP | | | 10 | | | | (392 | ) | | | (19 | ) | | | (373 | ) |
3-mo. Canada Bank Acceptance, 5.08% | | Semi-Annual | | 3.67% | | Semi-Annual | | | 09/20/23 | (a) | | | 09/20/28 | | | CAD | | | 80 | | | | (138 | ) | | | 94 | | | | (232 | ) |
3.68% | | Semi-Annual | | 6-mo. BBSW, 4.17% | | Semi-Annual | | | 09/20/23 | (a) | | | 09/20/28 | | | AUD | | | 30 | | | | 123 | | | | — | | | | 123 | |
3.69% | | Semi-Annual | | 6-mo. BBSW, 4.17% | | Semi-Annual | | | 09/20/23 | (a) | | | 09/20/28 | | | AUD | | | 20 | | | | 79 | | | | — | | | | 79 | |
3.71% | | Semi-Annual | | 6-mo. BBSW, 4.17% | | Semi-Annual | | | 09/20/23 | (a) | | | 09/20/28 | | | AUD | | | 40 | | | | 136 | | | | — | | | | 136 | |
3-mo. Canada Bank Acceptance, 5.08% | | Semi-Annual | | 3.72% | | Semi-Annual | | | 09/20/23 | (a) | | | 09/20/28 | | | CAD | | | 40 | | | | 3 | | | | (41 | ) | | | 44 | |
3-mo. Canada Bank Acceptance, 5.08% | | Semi-Annual | | 3.74% | | Semi-Annual | | | 09/20/23 | (a) | | | 09/20/28 | | | CAD | | | 50 | | | | 32 | | | | 15 | | | | 17 | |
3.74% | | Semi-Annual | | 6-mo. BBSW, 4.17% | | Semi-Annual | | | 09/20/23 | (a) | | | 09/20/28 | | | AUD | | | 60 | | | | 143 | | | | — | | | | 143 | |
3.75% | | Semi-Annual | | 6-mo. BBSW, 4.17% | | Semi-Annual | | | 09/20/23 | (a) | | | 09/20/28 | | | AUD | | | 70 | | | | 152 | | | | 1 | | | | 151 | |
1-Day SONIA, 4.43% | | Annual | | 3.76% | | Annual | | | 09/20/23 | (a) | | | 09/20/28 | | | GBP | | | 10 | | | | (341 | ) | | | (23 | ) | | | (318 | ) |
3.76% | | Semi-Annual | | 6-mo. BBSW, 4.17% | | Semi-Annual | | | 09/20/23 | (a) | | | 09/20/28 | | | AUD | | | 20 | | | | 39 | | | | — | | | | 39 | |
3-mo. Canada Bank Acceptance, 5.08% | | Semi-Annual | | 3.79% | | Semi-Annual | | | 09/20/23 | (a) | | | 09/20/28 | | | CAD | | | 50 | | | | 110 | | | | 48 | | | | 62 | |
3.80% | | Semi-Annual | | 6-mo. BBSW, 4.17% | | Semi-Annual | | | 09/20/23 | (a) | | | 09/20/28 | | | AUD | | | 50 | | | | 39 | | | | — | | | | 39 | |
3.80% | | Semi-Annual | | 6-mo. BBSW, 4.17% | | Semi-Annual | | | 09/20/23 | (a) | | | 09/20/28 | | | AUD | | | 30 | | | | 25 | | | | — | | | | 25 | |
1-Day SONIA, 4.43% | | Annual | | 3.85% | | Annual | | | 09/20/23 | (a) | | | 09/20/28 | | | GBP | | | 20 | | | | (590 | ) | | | — | | | | (590 | ) |
| | |
SCHEDULE OF INVESTMENTS | | 17 |
| | |
Schedule of Investments (continued) May 31, 2023 | | BlackRock Sustainable Advantage CoreAlpha Bond Fund |
Centrally Cleared Interest Rate Swaps (continued)
| | | | | | | | | | | | | | | | | | | | | | | | | | | | | | | | | | |
Paid by the Fund | | Received by the Fund | | Effective | | | Termination | | | Notional | | | | | | Upfront
Premium
Paid | | | Unrealized
Appreciation | |
| Rate | | Frequency | | Rate | | Frequency | | Date | | | Date | | | Amount (000) | | | Value | | | (Received) | | | (Depreciation) | |
1-Day SONIA, 4.43% | | Annual | | 3.87% | | Annual | | | 09/20/23 | (a) | | | 09/20/28 | | | | GBP | | | | 30 | | | $ | (850 | ) | | $ | (145 | ) | | $ | (705 | ) |
1-Day SONIA, 4.43% | | Annual | | 3.88% | | Annual | | | 09/20/23 | (a) | | | 09/20/28 | | | | GBP | | | | 30 | | | | (843 | ) | | | — | | | | (843 | ) |
3-mo. Canada Bank Acceptance, 5.08% | | Semi-Annual | | 3.88% | | Semi-Annual | | | 09/20/23 | (a) | | | 09/20/28 | | | | CAD | | | | 50 | | | | 257 | | | | 110 | | | | 147 | |
1-Day SONIA, 4.43% | | Annual | | 3.90% | | Annual | | | 09/20/23 | (a) | | | 09/20/28 | | | | GBP | | | | 40 | | | | (1,068 | ) | | | 1 | | | | (1,069 | ) |
1-Day SONIA, 4.43% | | Annual | | 3.92% | | Annual | | | 09/20/23 | (a) | | | 09/20/28 | | | | GBP | | | | 40 | | | | (1,031 | ) | | | (115 | ) | | | (916 | ) |
1-Day SONIA, 4.43% | | Annual | | 3.94% | | Annual | | | 09/20/23 | (a) | | | 09/20/28 | | | | GBP | | | | 10 | | | | (244 | ) | | | 21 | | | | (265 | ) |
1-Day SONIA, 4.43% | | Annual | | 3.96% | | Annual | | | 09/20/23 | (a) | | | 09/20/28 | | | | GBP | | | | 20 | | | | (469 | ) | | | — | | | | (469 | ) |
4.14% | | Semi-Annual | | 3-mo. BBR, 5.67% | | Quarterly | | | 09/20/23 | (a) | | | 09/20/28 | | | | NZD | | | | 70 | | | | 367 | | | | 1 | | | | 366 | |
4.19% | | Semi-Annual | | 3-mo. BBR, 5.67% | | Quarterly | | | 09/20/23 | (a) | | | 09/20/28 | | | | NZD | | | | 50 | | | | 196 | | | | — | | | | 196 | |
4.36% | | Semi-Annual | | 3-mo. BBR, 5.67% | | Quarterly | | | 09/20/23 | (a) | | | 09/20/28 | | | | NZD | | | | 20 | | | | (9 | ) | | | — | | | | (9 | ) |
4.40% | | Semi-Annual | | 3-mo. BBR, 5.67% | | Quarterly | | | 09/20/23 | (a) | | | 09/20/28 | | | | NZD | | | | 50 | | | | (81 | ) | | | — | | | | (81 | ) |
6-mo. PRIBOR, 7.20% | | Semi-Annual | | 4.44% | | Annual | | | 09/20/23 | (a) | | | 09/20/28 | | | | CZK | | | | 500 | | | | (23 | ) | | | — | | | | (23 | ) |
4.48% | | Semi-Annual | | 3-mo. BBR, 5.67% | | Quarterly | | | 09/20/23 | (a) | | | 09/20/28 | | | | NZD | | | | 60 | | | | (219 | ) | | | — | | | | (219 | ) |
6-mo. PRIBOR, 7.20% | | Semi-Annual | | 4.50% | | Annual | | | 09/20/23 | (a) | | | 09/20/28 | | | | CZK | | | | 330 | | | | 27 | | | | — | | | | 27 | |
4.63% | | Semi-Annual | | 3-mo. BBR, 5.67% | | Quarterly | | | 09/20/23 | (a) | | | 09/20/28 | | | | NZD | | | | 30 | | | | (230 | ) | | | — | | | | (230 | ) |
6-mo. WIBOR, 6.95% | | Semi-Annual | | 5.13% | | Annual | | | 09/20/23 | (a) | | | 09/20/28 | | | | PLN | | | | 150 | | | | (174 | ) | | | — | | | | (174 | ) |
6-mo. WIBOR, 6.95% | | Semi-Annual | | 5.23% | | Annual | | | 09/20/23 | (a) | | | 09/20/28 | | | | PLN | | | | 90 | | | | (13 | ) | | | — | | | | (13 | ) |
6-mo. WIBOR, 6.95% | | Semi-Annual | | 5.26% | | Annual | | | 09/20/23 | (a) | | | 09/20/28 | | | | PLN | | | | 110 | | | | 7 | | | | — | | | | 7 | |
6-mo. WIBOR, 6.95% | | Semi-Annual | | 5.31% | | Annual | | | 09/20/23 | (a) | | | 09/20/28 | | | | PLN | | | | 80 | | | | 45 | | | | — | | | | 45 | |
6-mo. WIBOR, 6.95% | | Semi-Annual | | 5.35% | | Annual | | | 09/20/23 | (a) | | | 09/20/28 | | | | PLN | | | | 60 | | | | 57 | | | | — | | | | 57 | |
6-mo. WIBOR, 6.95% | | Semi-Annual | | 5.37% | | Annual | | | 09/20/23 | (a) | | | 09/20/28 | | | | PLN | | | | 80 | | | | 94 | | | | — | | | | 94 | |
6-mo. WIBOR, 6.95% | | Semi-Annual | | 5.42% | | Annual | | | 09/20/23 | (a) | | | 09/20/28 | | | | PLN | | | | 110 | | | | 185 | | | | — | | | | 185 | |
6-mo. WIBOR, 6.95% | | Semi-Annual | | 5.44% | | Annual | | | 09/20/23 | (a) | | | 09/20/28 | | | | PLN | | | | 110 | | | | 205 | | | | — | | | | 205 | |
6-mo. WIBOR, 6.95% | | Semi-Annual | | 5.45% | | Annual | | | 09/20/23 | (a) | | | 09/20/28 | | | | PLN | | | | 160 | | | | 316 | | | | — | | | | 316 | |
6-mo. WIBOR, 6.95% | | Semi-Annual | | 5.45% | | Annual | | | 09/20/23 | (a) | | | 09/20/28 | | | | PLN | | | | 60 | | | | 119 | | | | — | | | | 119 | |
3-mo. JIBAR, 8.49% | | Quarterly | | 8.42% | | Quarterly | | | 09/20/23 | (a) | | | 09/20/28 | | | | ZAR | | | | 670 | | | | (1,408 | ) | | | — | | | | (1,408 | ) |
3-mo. JIBAR, 8.49% | | Quarterly | | 8.57% | | Quarterly | | | 09/20/23 | (a) | | | 09/20/28 | | | | ZAR | | | | 710 | | | | (1,282 | ) | | | — | | | | (1,282 | ) |
3-mo. JIBAR, 8.49% | | Quarterly | | 9.04% | | Quarterly | | | 09/20/23 | (a) | | | 09/20/28 | | | | ZAR | | | | 790 | | | | (700 | ) | | | — | | | | (700 | ) |
3-mo. JIBAR, 8.49% | | Quarterly | | 9.35% | | Quarterly | | | 09/20/23 | (a) | | | 09/20/28 | | | | ZAR | | | | 700 | | | | (202 | ) | | | — | | | | (202 | ) |
3-mo. JIBAR, 8.49% | | Quarterly | | 9.38% | | Quarterly | | | 09/20/23 | (a) | | | 09/20/28 | | | | ZAR | | | | 480 | | | | (110 | ) | | | — | | | | (110 | ) |
3-mo. JIBAR, 8.49% | | Quarterly | | 9.40% | | Quarterly | | | 09/20/23 | (a) | | | 09/20/28 | | | | ZAR | | | | 350 | | | | (63 | ) | | | — | | | | (63 | ) |
3-mo. JIBAR, 8.49% | | Quarterly | | 9.50% | | Quarterly | | | 09/20/23 | (a) | | | 09/20/28 | | | | ZAR | | | | 580 | | | | 9 | | | | — | | | | 9 | |
3-mo. JIBAR, 8.49% | | Quarterly | | 9.55% | | Quarterly | | | 09/20/23 | (a) | | | 09/20/28 | | | | ZAR | | | | 620 | | | | 70 | | | | — | | | | 70 | |
6-mo. EURIBOR, 3.75% | | Semi-Annual | | 2.84% | | Annual | | | 06/21/23 | (a) | | | 06/21/33 | | | | EUR | | | | 2,800 | | | | (28,254 | ) | | | (19,924 | ) | | | (8,330 | ) |
1-Day SOFR, 5.06% | | Annual | | 3.03% | | Annual | | | 06/21/23 | (a) | | | 06/21/33 | | | | USD | | | | 4,870 | | | | (133,232 | ) | | | (42,130 | ) | | | (91,102 | ) |
3.21% | | Annual | | 1-Day SONIA, 4.43% | | Annual | | | 06/21/23 | (a) | | | 06/21/33 | | | | GBP | | | | 1,010 | | | | 88,671 | | | | 11,817 | | | | 76,854 | |
1-Day SONIA, 4.43% | | Annual | | 4.28% | | Annual | | | 06/21/23 | (a) | | | 06/21/33 | | | | GBP | | | | 1,293 | | | | 23,088 | | | | 5,308 | | | | 17,780 | |
2.34% | | Annual | | 6-mo. EURIBOR, 3.75% | | Semi-Annual | | | 06/21/23 | (a) | | | 06/21/53 | | | | EUR | | | | 820 | | | | 44,804 | | | | 18,699 | | | | 26,105 | |
2.86% | | Annual | | 1-Day SOFR, 5.06% | | Annual | | | 06/21/23 | (a) | | | 06/21/53 | | | | USD | | | | 1,360 | | | | 74,609 | | | | 19,635 | | | | 54,974 | |
2.97% | | Annual | | 1-Day SOFR, 5.06% | | Annual | | | 06/21/23 | (a) | | | 06/21/53 | | | | USD | | | | 40 | | | | 1,377 | | | | (34 | ) | | | 1,411 | |
1-Day SONIA, 4.43% | | Annual | | 3.09% | | Annual | | | 06/21/23 | (a) | | | 06/21/53 | | | | GBP | | | | 460 | | | | (77,249 | ) | | | (8,339 | ) | | | (68,910 | ) |
| | | | | | | | | | | | | | | | | | | | | | | | | | | | | | | | | | |
| | | | | | | | | | | | | | | | | | | | | | | | $ | (589 | ) | | $ | 15,576 | | | $ | (16,165 | ) |
| | | | | | | | | | | | | | | | | | | | | | | | | | | | | | | | | | |
Balances Reported in the Statement of Assets and Liabilities for Centrally Cleared Swaps
| | | | | | | | | | | | | | |
| | | | | |
| Description | | Swap Premiums Paid | | | Swap Premiums Received | | | Unrealized Appreciation | | | Unrealized Depreciation |
Centrally Cleared Swaps(a) | | $ | 107,904 | | | $ | (91,272 | ) | | $ | 331,547 | | | $ (370,785) |
| | (a) | Includes cumulative appreciation (depreciation) on centrally cleared swaps, as reported in the Schedule of Investments. Only current day’s variation margin is reported within the Statement of Assets and Liabilities and is net of any previously paid (received) swap premium amounts. | |
| | |
| 18 | | 2 0 2 3 BLACK ROCK ANNUAL REPORT TO SHAREHOLDERS |
| | |
Schedule of Investments (continued) May 31, 2023 | | BlackRock Sustainable Advantage CoreAlpha Bond Fund |
Derivative Financial Instruments Categorized by Risk Exposure
As of period end, the fair values of derivative financial instruments located in the Statement of Assets and Liabilities were as follows:
| | | | | | | | | | | | | | | | | | | | | | | | | | | | |
| |
| | | | | | | |
| | | Commodity
Contracts | | | Credit
Contracts | | | Equity
Contracts | | | Foreign
Currency
Exchange
Contracts | | | Interest
Rate
Contracts | | | Other
Contracts | | | Total | |
| |
| | | | | | |
Assets — Derivative Financial Instruments | | | | | | | | | | | | | | | | | | | | | | | | | |
Futures contracts | | | | | | | | | | | | | | | | | | | | | | | | | | | | |
Unrealized appreciation on futures contracts(a) | | $ | — | | | $ | — | | | $ | — | | | $ | — | | | $ | 53,551 | | | $ | — | | | $ | 53,551 | |
Forward foreign currency exchange contracts | | | | | | | | | | | | | | | | | | | | | | | | | | | | |
Unrealized appreciation on forward foreign currency exchange contracts | | | — | | | | — | | | | — | | | | 4,022 | | | | — | | | | — | | | | 4,022 | |
Swaps — centrally cleared | | | | | | | | | | | | | | | | | | | | | | | | | | | | |
Unrealized appreciation on centrally cleared swaps(a) | | | — | | | | — | | | | — | | | | — | | | | 329,248 | | | | 2,299 | | | | 331,547 | |
| | | | | | | | | | | | | | | | | | | | | | | | | | | | |
| | | | | | | |
| | $ | — | | | $ | — | | | $ | — | | | $ | 4,022 | | | $ | 382,799 | | | $ | 2,299 | | | $ | 389,120 | |
| | | | | | | | | | | | | | | | | | | | | | | | | | | | |
Liabilities — Derivative Financial Instruments | | | | | | | | | | | | | | | | | | | | | | | | | | | | |
Futures contracts | | | | | | | | | | | | | | | | | | | | | | | | | | | | |
Unrealized depreciation on futures contracts(a) | | $ | — | | | $ | — | | | $ | — | | | $ | — | | | $ | 20,479 | | | $ | — | | | $ | 20,479 | |
Forward foreign currency exchange contracts | | | | | | | | | | | | | | | | | | | | | | | | | | | | |
Unrealized depreciation on forward foreign currency exchange contracts | | | — | | | | — | | | | — | | | | 5,779 | | | | — | | | | — | | | | 5,779 | |
Swaps — centrally cleared | | | | | | | | | | | | | | | | | | | | | | | | | | | | |
Unrealized depreciation on centrally cleared swaps(a) | | | — | | | | 22,902 | | | | — | | | | — | | | | 345,413 | | | | 2,470 | | | | 370,785 | |
| | | | | | | | | | | | | | | | | | | | | | | | | | | | |
| | | | | | | |
| | $ | — | | | $ | 22,902 | | | $ | — | | | $ | 5,779 | | | $ | 365,892 | | | $ | 2,470 | | | $ | 397,043 | |
| | | | | | | | | | | | | | | | | | | | | | | | | | | | |
| | (a) | Net cumulative unrealized appreciation (depreciation) on futures contracts and centrally cleared swaps, if any, are reported in the Schedule of Investments. In the Statement of Assets and Liabilities, only current day’s variation margin is reported in receivables or payables and the net cumulative unrealized appreciation (depreciation) is included in accumulated earnings (loss). | |
For the period ended May 31, 2023, the effect of derivative financial instruments in the Statement of Operations was as follows:
| | | | | | | | | | | | | | | | | | | | | | | | | | | | |
| |
| | | | | | | |
| | | Commodity
Contracts | | | Credit
Contracts | | | Equity
Contracts | | | Foreign
Currency
Exchange
Contracts | | | Interest
Rate
Contracts | | | Other
Contracts | | | Total | |
| |
Net Realized Gain (Loss) from: | | | | | | | | | | | | | | | | | | | | | | | | | | | | |
Futures contracts | | $ | — | | | $ | — | | | $ | — | | | $ | — | | | $ | (821,726 | ) | | $ | — | | | $ | (821,726 | ) |
Forward foreign currency exchange contracts | | | — | | | | — | | | | — | | | | 26,073 | | | | — | | | | — | | | | 26,073 | |
Swaps | | | — | | | | (315,721 | ) | | | — | | | | — | | | | 200,340 | | | | (6,180 | ) | | | (121,561 | ) |
| | | | | | | | | | | | | | | | | | | | | | | | | | | | |
| | | | | | | |
| | $ | — | | | $ | (315,721 | ) | | $ | — | | | $ | 26,073 | | | $ | (621,386 | ) | | $ | (6,180 | ) | | $ | (917,214 | ) |
| | | | | | | | | | | | | | | | | | | | | | | | | | | | |
Net Change in Unrealized Appreciation (Depreciation) on: | | | | | | | | | | | | | | | | | | | | | | | | | | | | |
Futures contracts | | $ | — | | | $ | — | | | $ | — | | | $ | — | | | $ | 54,426 | | | $ | — | | | $ | 54,426 | |
Forward foreign currency exchange contracts | | | — | | | | — | | | | — | | | | (6,691 | ) | | | — | | | | — | | | | (6,691 | ) |
Swaps | | | — | | | | 113,574 | | | | — | | | | — | | | | (7,410 | ) | | | (35,122 | ) | | | 71,042 | |
| | | | | | | | | | | | | | | | | | | | | | | | | | | | |
| | | | | | | |
| | $ | — | | | $ | 113,574 | | | $ | — | | | $ | (6,691 | ) | | $ | 47,016 | | | $ | (35,122 | ) | | $ | 118,777 | |
| | | | | | | | | | | | | | | | | | | | | | | | | | | | |
Average Quarterly Balances of Outstanding Derivative Financial Instruments
| | | | |
| | |
| | | | |
Futures contracts: | | | | |
Average notional value of contracts — long | | $ | 9,479,473 | |
Average notional value of contracts — short | | $ | 2,794,169 | |
Forward foreign currency exchange contracts: | | | | |
Average amounts purchased — in USD | | $ | 631,365 | |
Average amounts sold — in USD | | $ | 274,133 | |
Credit default swaps: | | | | |
Average notional value — buy protection | | $ | 3,973,517 | |
Interest rate swaps: | | | | |
Average notional value — pays fixed rate | | $ | 28,554,542 | |
Average notional value — receives fixed rate | | $ | 21,413,641 | |
Inflation swaps: | | | | |
Average notional value — pays fixed rate | | $ | 242,564 | |
Average notional value — receives fixed rate | | $ | 356,894 | |
| | |
SCHEDULE OF INVESTMENTS | | 19 |
| | |
Schedule of Investments (continued) May 31, 2023 | | BlackRock Sustainable Advantage CoreAlpha Bond Fund |
For more information about the Fund’s investment risks regarding derivative financial instruments, refer to the Notes to Financial Statements.
Derivative Financial Instruments — Offsetting as of Period End
The Fund’s derivative assets and liabilities (by type) were as follows:
| | | | | | | | |
| | | |
| | | Assets | | | Liabilities | |
| | |
Derivative Financial Instruments | | | | | | | | |
Futures contracts | | $ | 45,407 | | | $ | 11,346 | |
Forward foreign currency exchange contracts | | | 4,022 | | | | 5,779 | |
Swaps — centrally cleared | | | 9,788 | | | | — | |
| | | | | | | | |
| | |
Total derivative assets and liabilities in the Statement of Assets and Liabilities | | | 59,217 | | | | 17,125 | |
| | | | | | | | |
| | |
Derivatives not subject to a Master Netting Agreement or similar agreement (“MNA”) | | | (55,195 | ) | | | (11,346 | ) |
| | | | | | | | |
| | |
Total derivative assets and liabilities subject to an MNA | | $ | 4,022 | | | $ | 5,779 | |
| | | | | | | | |
The following table presents the Fund’s derivative assets and liabilities by counterparty net of amounts available for offset under an MNA and net of the related collateral received (and pledged) by the Fund:
| | | | | | | | | | | | | | | | | | | | |
| | | | | | |
Counterparty | |
| Derivative
Assets
Subject to
an MNA by
Counterparty |
| |
| Derivatives
Available
for Offset |
(a) | |
| Non-Cash
Collateral
Received |
| |
| Cash
Collateral
Received |
| |
| Net Amount
of Derivative
Assets |
(b)(c) |
Barclays Bank PLC | | $ | 317 | | | $ | — | | | $ | — | | | $ | — | | | $ | 317 | |
Deutsche Bank AG | | | 584 | | | | — | | | | — | | | | — | | | | 584 | |
JPMorgan Chase Bank N.A. | | | 1,309 | | | | (155 | ) | | | — | | | | — | | | | 1,154 | |
Morgan Stanley & Co. International PLC | | | 1,744 | | | | (1,744 | ) | | | — | | | | — | | | | — | |
Societe Generale | | | 68 | | | | — | | | | — | | | | — | | | | 68 | |
| | | | | | | | | | | | | | | | | | | | |
| | | | | |
| | $ | 4,022 | | | $ | (1,899 | ) | | $ | — | | | $ | — | | | $ | 2,123 | |
| | | | | | | | | | | | | | | | | | | | |
| | | | | | | | | | | | | | | | | | | | |
| | | | | | |
Counterparty | |
| Derivative
Liabilities
Subject to
an MNA by
Counterparty |
| |
| Derivatives
Available
for Offset |
(a) | |
| Non-Cash
Collateral
Pledged |
| |
| Cash
Collateral
Pledged |
| |
| Net Amount
of Derivative
Liabilities |
(b)(d) |
| | | | | |
Citibank N.A. | | $ | 1,064 | | | $ | — | | | $ | — | | | $ | — | | | $ | 1,064 | |
JPMorgan Chase Bank N.A. | | | 155 | | | | (155 | ) | | | — | | | | — | | | | — | |
Morgan Stanley & Co. International PLC | | | 4,560 | | | | (1,744 | ) | | | — | | | | — | | | | 2,816 | |
| | | | | | | | | | | | | | | | | | | | |
| | | | | |
| | $ | 5,779 | | | $ | (1,899 | ) | | $ | — | | | $ | — | | | $ | 3,880 | |
| | | | | | | | | | | | | | | | | | | | |
| | (a) | The amount of derivatives available for offset is limited to the amount of derivative asset and/or liabilities that are subject to an MNA. | |
| | (b) | Net amount may also include forward foreign currency exchange contracts that are not required to be collateralized. | |
| | (c) | Net amount represents the net amount receivable from the counterparty in the event of default. | |
| | (d) | Net amount represents the net amount payable due to counterparty in the event of default. | |
Fair Value Hierarchy as of Period End
Various inputs are used in determining the fair value of financial instruments. For a description of the input levels and information about the Fund’s policy regarding valuation of financial instruments, refer to the Notes to Financial Statements.
The following table summarizes the Fund’s financial instruments categorized in the fair value hierarchy. The breakdown of the Fund’s financial instruments into major categories is disclosed in the Schedule of Investments above.
| | | | | | | | | | | | | | | | |
| | | | | |
| | | Level 1 | | | Level 2 | | | Level 3 | | | Total | |
| | | | |
Assets | | | | | | | | | | | | | | | | |
Investments | | | | | | | | | | | | | | | | |
Long-Term Investments | | | | | | | | | | | | | | | | |
Asset-Backed Securities | | $ | — | | | $ | 2,731,984 | | | $ | — | | | $ | 2,731,984 | |
Corporate Bonds | | | — | | | | 19,597,684 | | | | — | | | | 19,597,684 | |
Foreign Agency Obligations | | | — | | | | 209,144 | | | | — | | | | 209,144 | |
Municipal Bonds | | | — | | | | 301,344 | | | | — | | | | 301,344 | |
| | |
| 20 | | 2 0 2 3 BLACK ROCK ANNUAL REPORT TO SHAREHOLDERS |
| | |
Schedule of Investments (continued) May 31, 2023 | | BlackRock Sustainable Advantage CoreAlpha Bond Fund |
Fair Value Hierarchy as of Period End (continued)
| | | | | | | | | | | | | | | | |
| | | | | |
| | | Level 1 | | | Level 2 | | | Level 3 | | | Total | |
Non-Agency Mortgage-Backed Securities | | $ | — | | | $ | 2,558,903 | | | $ | — | | | $ | 2,558,903 | |
U.S. Government Sponsored Agency Securities | | | — | | | | 18,685,669 | | | | — | | | | 18,685,669 | |
U.S. Treasury Obligations | | | — | | | | 9,952,241 | | | | — | | | | 9,952,241 | |
Short-Term Securities | | | | | | | | | | | | | | | | |
Money Market Funds | | | 1,258,114 | | | | — | | | | — | | | | 1,258,114 | |
U.S. Treasury Obligations | | | — | | | | 3,128,302 | | | | — | | | | 3,128,302 | |
Liabilities | | | | | | | | | | | | | | | | |
Investments | | | | | | | | | | | | | | | | |
TBA Sale Commitments | | | — | | | | (1,664,636 | ) | | | — | | | | (1,664,636 | ) |
| | | | | | | | | | | | | | | | |
| | | | |
| | $ | 1,258,114 | | | $ | 55,500,635 | | | $ | — | | | $ | 56,758,749 | |
| | | | | | | | | | | | | | | | |
| | | | |
Derivative Financial Instruments(a) | | | | | | | | | | | | | | | | |
Assets | | | | | | | | | | | | | | | | |
Foreign Currency Exchange Contracts | | $ | — | | | $ | 4,022 | | | $ | — | | | $ | 4,022 | |
Interest Rate Contracts | | | 53,551 | | | | 329,248 | | | | — | | | | 382,799 | |
Other Contracts | | | — | | | | 2,299 | | | | — | | | | 2,299 | |
Liabilities | | | | | | | | | | | | | | | | |
Credit Contracts | | | — | | | | (22,902 | ) | | | — | | | | (22,902 | ) |
Foreign Currency Exchange Contracts | | | — | | | | (5,779 | ) | | | — | | | | (5,779 | ) |
Interest Rate Contracts | | | (20,479 | ) | | | (345,413 | ) | | | — | | | | (365,892 | ) |
Other Contracts | | | — | | | | (2,470 | ) | | | — | | | | (2,470 | ) |
| | | | | | | | | | | | | | | | |
| | | | |
| | $ | 33,072 | | | $ | (40,995 | ) | | $ | — | | | $ | (7,923 | ) |
| | | | | | | | | | | | | | | | |
| | (a) | Derivative financial instruments are swaps, futures contracts and forward foreign currency exchange contracts. Swaps, futures contracts and forward foreign currency exchange contracts are valued at the unrealized appreciation (depreciation) on the instrument. | |
See notes to financial statements.
| | |
| SCHEDULE OF INVESTMENTS | | 21 |
Statement of Assets and Liabilities
May 31, 2023
| | | | |
| | | BlackRock
Sustainable
Advantage
CoreAlpha Bond Fund | |
| |
| |
ASSETS | | | | |
Investments, at value — unaffiliated(a) | | $ | 57,165,271 | |
Investments, at value — affiliated(b) | | | 1,258,114 | |
Cash pledged: | | | | |
Futures contracts | | | 289,000 | |
Centrally cleared swaps | | | 255,000 | |
Foreign currency, at value(c) | | | 222,272 | |
Receivables: | | | | |
Investments sold | | | 2,774 | |
TBA sale commitments | | | 1,682,531 | |
Capital shares sold | | | 76,720 | |
Dividends — affiliated | | | 2,006 | |
Interest — unaffiliated | | | 265,336 | |
From the Manager | | | 97,644 | |
Variation margin on futures contracts | | | 45,407 | |
Variation margin on centrally cleared swaps | | | 9,788 | |
Unrealized appreciation on forward foreign currency exchange contracts | | | 4,022 | |
Prepaid expenses | | | 39,200 | |
| | | | |
| |
Total assets | | | 61,415,085 | |
| | | | |
| |
LIABILITIES | | | | |
TBA sale commitments, at value(d) | | | 1,664,636 | |
Payables: | | | | |
Investments purchased | | | 4,442,630 | |
Accounting services fees | | | 9,407 | |
Capital shares redeemed | | | 89,064 | |
Custodian fees | | | 27,266 | |
Income dividend distributions | | | 25,395 | |
Trustees’ and Officer’s fees | | | 416 | |
Other accrued expenses | | | 104,246 | |
Professional fees | | | 18,157 | |
Service and distribution fees | | | 533 | |
Transfer agent fees | | | 3,760 | |
Variation margin on futures contracts | | | 11,346 | |
Unrealized depreciation on forward foreign currency exchange contracts | | | 5,779 | |
| | | | |
| |
Total liabilities | | | 6,402,635 | |
| | | | |
| |
NET ASSETS | | $ | 55,012,450 | |
| | | | |
| |
NET ASSETS CONSIST OF | | | | |
Paid-in capital | | $ | 65,958,286 | |
Accumulated loss | | | (10,945,836 | ) |
| | | | |
| |
NET ASSETS | | $ | 55,012,450 | |
| | | | |
| |
(a) Investments, at cost — unaffiliated | | $ | 61,548,951 | |
(b) Investments, at cost — affiliated | | $ | 1,258,114 | |
(c) Foreign currency, at cost | | $ | 225,156 | |
(d) Proceeds from TBA sale commitments | | $ | 1,682,531 | |
| | |
| 22 | | 2 0 2 3 BLACK ROCK ANNUAL REPORT TO SHAREHOLDERS |
Statement of Assets and Liabilities (continued)
May 31, 2023
| | | | |
| | | BlackRock
Sustainable
Advantage
CoreAlpha
Bond Fund | |
| |
| |
NET ASSET VALUE | | | | |
| |
| Institutional | | | |
Net assets | | $ | 48,037,258 | |
| | | | |
| |
Shares outstanding | | | 5,558,819 | |
| | | | |
| |
Net asset value | | $ | 8.64 | |
| |
| | | | |
| |
Shares authorized | | | Unlimited | |
| | | | |
| |
Par value | | $ | 0.001 | |
| | | | |
| |
| Investor A | | | |
| |
Net assets | | $ | 1,973,609 | |
| | | | |
| |
Shares outstanding | | | 228,294 | |
| | | | |
| |
Net asset value | | $ | 8.65 | |
| | | | |
| |
Shares authorized | | | Unlimited | |
| | | | |
| |
Par value | | $ | 0.001 | |
| | | | |
| |
Investor C | | | | |
| |
Net assets | | $ | 140,661 | |
| | | | |
| |
Shares outstanding | | | 16,273 | |
| | | | |
| |
Net asset value | | $ | 8.64 | |
| | | | |
| |
Shares authorized | | | Unlimited | |
| | | | |
| |
Par value | | $ | 0.001 | |
| | | | |
| |
Class K | | | | |
| |
Net assets | | $ | 4,860,922 | |
| | | | |
| |
Shares outstanding | | | 562,268 | |
| | | | |
| |
Net asset value | | $ | 8.65 | |
| | | | |
| |
Shares authorized | | | Unlimited | |
| | | | |
| |
Par value | | $ | 0.001 | |
| | | | |
See notes to financial statements.
Statement of Operations
Year Ended May 31, 2023
| | | | |
| | | BlackRock
Sustainable
Advantage
CoreAlpha
Bond Fund | |
| |
| |
INVESTMENT INCOME | | | | |
Dividends — affiliated | | $ | 96,430 | |
Interest — unaffiliated | | | 1,814,372 | |
| | | | |
| |
Total investment income | | | 1,910,802 | |
| | | | |
| |
EXPENSES | | | | |
| |
Investment advisory | | | 139,169 | |
Professional | | | 115,939 | |
Registration | | | 88,727 | |
Custodian | | | 70,180 | |
Transfer agent — class specific | | | 47,985 | |
Printing and postage | | | 35,905 | |
Administration | | | 25,716 | |
Accounting services | | | 12,797 | |
Administration — class specific | | | 12,102 | |
Service and distribution — class specific | | | 9,798 | |
Trustees and Officer | | | 2,344 | |
Miscellaneous | | | 85,069 | |
| | | | |
| |
Total expenses | | | 645,731 | |
Less: | | | | |
Administration fees waived | | | (25,716 | ) |
Administration fees waived by the Manager — class specific | | | (12,102 | ) |
Fees waived and/or reimbursed by the Manager | | | (410,791 | ) |
Transfer agent fees waived and/or reimbursed by the Manager — class specific | | | (19,635 | ) |
| | | | |
| |
Total expenses after fees waived and/or reimbursed | | | 177,487 | |
| | | | |
| |
Net investment income | | | 1,733,315 | |
| | | | |
| |
REALIZED AND UNREALIZED GAIN (LOSS) | | | | |
Net realized gain (loss) from: | | | | |
Investments — unaffiliated | | | (2,937,347 | ) |
Forward foreign currency exchange contracts | | | 26,073 | |
Foreign currency transactions | | | (28,593 | ) |
Futures contracts | | | (821,726 | ) |
Swaps | | | (121,561 | ) |
| | | | |
| |
| | | (3,883,154 | ) |
| | | | |
| |
Net change in unrealized appreciation (depreciation) on: | | | | |
Investments — unaffiliated | | | 150,779 | |
Forward foreign currency exchange contracts | | | (6,691 | ) |
Foreign currency translations | | | (2,151 | ) |
Futures contracts | | | 54,426 | |
Swaps | | | 71,042 | |
| | | | |
| |
| | | 267,405 | |
| | | | |
| |
Net realized and unrealized loss | | | (3,615,749 | ) |
| | | | |
| |
NET DECREASE IN NET ASSETS RESULTING FROM OPERATIONS | | $ | (1,882,434) | |
| | | | |
See notes to financial statements.
| | |
| 24 | | 2 0 2 3 BLACK ROCK ANNUAL REPORT TO SHAREHOLDERS |
Statements of Changes in Net Assets
| | | | | | | | | | | | | | | | | | | | | | | | | | | | | | | | | | | | | | | | | | | | | | |
| | | | | | | | | | | | | | | | | | | | | | | | | | | | | | | BlackRock Sustainable Advantage CoreAlpha Bond Fund | |
| | | | | | |
| | | | | | | | | | | | | | Year Ended | | | Year Ended | |
| | | | | | | | | | | | | | 05/31/23 | | | 05/31/22 | |
| |
| | | | | | | | | | | | | |
INCREASE (DECREASE) IN NET ASSETS | | | | | | | | | | | | | | | | | | | | | | | | | | | | | | | | | | | | | | | | | | | | | | |
| | | | | | | | | | | | | |
OPERATIONS | | | | | | | | | | | | | | | | | | | | | | | | | | | | | | | | | | | | | | | | | | | | | | |
Net investment income | | | | | | | | | | | | | | | | | | | | | | | | | | | | | | | | | | | | | | $ | 1,733,315 | | | | | $ | 1,162,048 | |
Net realized loss | | | | | | | | | | | | | | | | | | | | | | | | | | | | | | | | | | | | | | | (3,883,154 | ) | | | | | (3,200,557 | ) |
Net change in unrealized appreciation (depreciation) | | | | | | | | | | | | | | | | | | | | | | | | | | | | | | | | | | | | | | | 267,405 | | | | | | (5,290,967 | ) |
| | | | | | | | | | | | | | | | | | | | | | | | | | | | | | | | | | | | | | | | | | | | | | |
| | | | | | | | | | | | | |
Net decrease in net assets resulting from operations | | | | | | | | | | | | | | | | | | | | | | | | | | | | | | | | | | | | | | | (1,882,434 | ) | | | | | (7,329,476 | ) |
| | | | | | | | | | | | | | | | | | | | | | | | | | | | | | | | | | | | | | | | | | | | | | |
| | | | | | | | | | | | | |
DISTRIBUTIONS TO SHAREHOLDERS(a) | | | | | | | | | | | | | | | | | | | | | | | | | | | | | | | | | | | | | | | | | | | | | | |
From net investment income and net realized gain | | | | | | | | | | | | | | | | | | | | | | | | | | | | | | | | | | | | | | | | | | | | | | |
Institutional | | | | | | | | | | | | | | | | | | | | | | | | | | | | | | | | | | | | | | | (999,958 | ) | | | | | (1,100,157 | ) |
Investor A | | | | | | | | | | | | | | | | | | | | | | | | | | | | | | | | | | | | | | | (52,057 | ) | | | | | (101,830 | ) |
Investor C | | | | | | | | | | | | | | | | | | | | | | | | | | | | | | | | | | | | | | | (1,114 | ) | | | | | (1,063 | ) |
Class K | | | | | | | | | | | | | | | | | | | | | | | | | | | | | | | | | | | | | | | (77,130 | ) | | | | | (38,254 | ) |
Return of capital | | | | | | | | | | | | | | | | | | | | | | | | | | | | | | | | | | | | | | | | | | | | | | |
Institutional | | | | | | | | | | | | | | | | | | | | | | | | | | | | | | | | | | | | | | | (416,654 | ) | | | | | (244,378 | ) |
Investor A | | | | | | | | | | | | | | | | | | | | | | | | | | | | | | | | | | | | | | | (26,830 | ) | | | | | (25,881 | ) |
Investor C | | | | | | | | | | | | | | | | | | | | | | | | | | | | | | | | | | | | | | | (973 | ) | | | | | (558 | ) |
Class K | | | | | | | | | | | | | | | | | | | | | | | | | | | | | | | | | | | | | | | (29,871 | ) | | | | | (8,192 | ) |
| | | | | | | | | | | | | | | | | | | | | | | | | | | | | | | | | | | | | | | | | | | | | | |
| | | | | | | | | | | | | |
Decrease in net assets resulting from distributions to shareholders | | | | | | | | | | | | | | | | | | | | | | | | | | | | | | | | | | | | | | | (1,604,587 | ) | | | | | (1,520,313 | ) |
| | | | | | | | | | | | | | | | | | | | | | | | | | | | | | | | | | | | | | | | | | | | | | |
| | | | | | | | | | | | | |
CAPITAL SHARE TRANSACTIONS | | | | | | | | | | | | | | | | | | | | | | | | | | | | | | | | | | | | | | | | | | | | | | |
Net increase (decrease) in net assets derived from capital share transactions | | | | | | | | | | | | | | | | | | | | | | | | | | | | | | | | | | | | | | | (8,021,575 | ) | | | | | 13,520,611 | |
| | | | | | | | | | | | | | | | | | | | | | | | | | | | | | | | | | | | | | | | | | | | | | |
| | | | | | | | | | | | | |
NET ASSETS | | | | | | | | | | | | | | | | | | | | | | | | | | | | | | | | | | | | | | | | | | | | | | |
Total increase (decrease) in net assets | | | | | | | | | | | | | | | | | | | | | | | | | | | | | | | | | | | | | | | (11,508,596 | ) | | | | | 4,670,822 | |
Beginning of year | | | | | | | | | | | | | | | | | | | | | | | | | | | | | | | | | | | | | | | 66,521,046 | | | | | | 61,850,224 | |
| | | | | | | | | | | | | | | | | | | | | | | | | | | | | | | | | | | | | | | | | | | | | | |
| | | | | | | | | | | | | |
End of year | | | | | | | | | | | | | | | | | | | | | | | | | | | | | | | | | | | | | | $ | 55,012,450 | | | | | $ | 66,521,046 | |
| | | | | | | | | | | | | | | | | | | | | | | | | | | | | | | | | | | | | | | | | | | | | | |
| (a) | Distributions for annual periods determined in accordance with U.S. federal income tax regulations. |
See notes to financial statements.
Financial Highlights
(For a share outstanding throughout each period)
| | | | | | | | | | | | | | | | | | | | | | | | | | | | | | | | | | | | | | | | |
| | | | | | | BlackRock Sustainable Advantage CoreAlpha Bond Fund | |
| | | |
| | | | | | | Institutional | |
| | | | | | |
| | | | | Year Ended
05/31/23 | | | Year Ended
05/31/22 | | | Year Ended
05/31/21 | | | Year Ended
05/31/20 | | | Year Ended
05/31/19 | |
| | | | | | | | | | |
Net asset value, beginning of year | | $ | 9.09 | | | | | | | $ | 10.28 | | | | | | | $ | 10.58 | | | | | | | $ | 9.85 | | | | | | | $ | 9.51 | |
| | | | | | | | | | | | | | | | | | | | | | | | | | | | | | | | | | | | | | | | |
Net investment income(a) | | | 0.25 | | | | | | | | 0.17 | | | | | | | | 0.17 | | | | | | | | 0.22 | | | | | | | | 0.25 | |
Net realized and unrealized gain (loss) | | | (0.46 | ) | | | | | | | (1.14 | ) | | | | | | | (0.17 | ) | | | | | | | 0.76 | | | | | | | | 0.36 | |
| | | | | | | | | | | | | | | | | | | | | | | | | | | | | | | | | | | | | | | | |
| | | | | | | | | | |
Net increase (decrease) from investment operations | | | | | (0.21 | ) | | | | | | | (0.97 | ) | | | | | | | — | | | | | | | | 0.98 | | | | | | | | 0.61 | |
| | | | | | | | | | | | | | | | | | | | | | | | | | | | | | | | | | | | | | | | |
| | | | | | |
Distributions(b) | | | | | | | | | | | | | | | | | | | | | | | | | |
From net investment income | | | (0.17 | ) | | | | | | | (0.12 | ) | | | | | | | (0.23 | ) | | | | | | | (0.25 | ) | | | | | | | (0.27 | ) |
From net realized gain | | | — | | | | | | | | (0.06 | ) | | | | | | | (0.07 | ) | | | | | | | — | | | | | | | | — | |
Return of capital | | | (0.07 | ) | | | | | | | (0.04 | ) | | | | | | | — | | | | | | | | — | | | | | | | | — | |
| | | | | | | | | | | | | | | | | | | | | | | | | | | | | | | | | | | | | | | | |
| | | | | | | | | |
Total distributions | | | (0.24 | ) | | | | | | | (0.22 | ) | | | | | | | (0.30 | ) | | | | | | | (0.25 | ) | | | | | | | (0.27 | ) |
| | | | | | | | | | | | | | | | | | | | | | | | | | | | | | | | | | | | | | | | |
| | | | | | | | | |
Net asset value, end of year | | $ | 8.64 | | | | | | | $ | 9.09 | | | | | | | $ | 10.28 | | | | | | | $ | 10.58 | | | | | | | $ | 9.85 | |
| | | | | | | | | | | | | | | | | | | | | | | | | | | | | | | | | | | | | | | | |
| | | | | | |
Total Return(c) | | | | | | | | | | | | | | | | | | | | | | | | | |
Based on net asset value | | | (2.34 | )% | | | | | | | (9.62 | )% | | | | | | | (0.08 | )% | | | | | | | 10.06 | % | | | | | | | 6.55 | % |
| | | | | | | | | | | | | | | | | | | | | | | | | | | | | | | | | | | | | | | | |
| | | | | | |
Ratios to Average Net Assets(d) | | | | | | | | | | | | | | | | | | | | | | | | | |
Total expenses | | | 1.05 | % | | | | | | | 0.95 | % | | | | | | | 1.20 | % | | | | | | | 1.54 | % | | | | | | | 2.02 | %(e) |
| | | | | | | | | | | | | | | | | | | | | | | | | | | | | | | | | | | | | | | | |
| | | | | | | | | |
Total expenses after fees waived and/or reimbursed | | | 0.28 | % | | | | | | | 0.29 | % | | | | | | | 0.41 | % | | | | | | | 0.40 | % | | | | | | | 0.41 | % |
| | | | | | | | | | | | | | | | | | | | | | | | | | | | | | | | | | | | | | | | |
| | | | | | | | | |
Net investment income | | | 2.88 | % | | | | | | | 1.69 | % | | | | | | | 1.62 | % | | | | | | | 2.15 | % | | | | | | | 2.64 | % |
| | | | | | | | | | | | | | | | | | | | | | | | | | | | | | | | | | | | | | | | |
| | | | | | |
Supplemental Data | | | | | | | | | | | | | | | | | | | | | | | | | |
Net assets, end of year (000) | | $ | 48,037 | | | | | | | $ | 58,835 | | | | | | | $ | 54,288 | | | | | | | $ | 47,860 | | | | | | | $ | 24,031 | |
| | | | | | | | | | | | | | | | | | | | | | | | | | | | | | | | | | | | | | | | |
| | | | | | | | | |
Portfolio turnover rate(f) | | | 376 | % | | | | | | | 304 | % | | | | | | | 503 | % | | | | | | | 287 | % | | | | | | | 202 | % |
| | | | | | | | | | | | | | | | | | | | | | | | | | | | | | | | | | | | | | | | |
|
(a) Based on average shares outstanding. | |
(b) Distributions for annual periods determined in accordance with U.S. federal income tax regulations. | | | | | | | | | | | | | | | | | | | | | | | | | |
(c) Where applicable, assumes the reinvestment of distributions. | |
(d) Excludes fees and expenses incurred indirectly as a result of investments in underlying funds. | |
(e) Includes non-recurring expenses of Board realignment and consolidation costs. Without these costs, total expenses would have been 1.79%. | |
(f) Includes mortgage dollar roll transactions (“MDRs”). Additional information regarding portfolio turnover rate is as follows: | |
| | | | | | | | | | | |
| | | | | | | Year Ended
05/31/23 | | | | | | Year Ended
05/31/22 | | | | | | Year Ended
05/31/21 | | | | | | Year Ended
05/31/20 | | | | | | Year Ended
05/31/19 | |
| | | | | | | | | | |
Portfolio turnover rate (excluding MDRs) | | | | | 193 | % | | | | | | | 173 | % | | | | | | | 302 | % | | | | | | | 177 | % | | | | | | | 117 | % |
| | | | | | | | | | | | | | | | | | | | | | | | | | | | | | | | | | | | | | | | |
See notes to financial statements.
| | |
| 26 | | 2 0 2 3 BLACK ROCK ANNUAL REPORT TO SHAREHOLDERS |
Financial Highlights (continued)
(For a share outstanding throughout each period)
| | | | | | | | | | | | | | | | | | | | | | | | | | | | | | | | | | | | | | | | | | |
| | | | | | | BlackRock Sustainable Advantage CoreAlpha Bond Fund (continued) | |
| | | | |
| | | | | | | | | Investor A | |
| | | | | | |
| | | | | Year Ended 05/31/23 | | | Year Ended
05/31/22 | | | Year Ended
05/31/21 | | | Year Ended
05/31/20 | | | Year Ended
05/31/19 | |
| | | | | | | | | | | | |
Net asset value, beginning of year | | | | | | $ | 9.09 | | | | | | | $ | 10.28 | | | | | | | $ | 10.58 | | | | | | | $ | 9.86 | | | | | | | $ | 9.51 | |
| | | | | | | | | | | | | | | | | | | | | | | | | | | | | | | | | | | | | | | | | | |
| | | | | | | | | | | |
Net investment income(a) | | | | | | | 0.22 | | | | | | | | 0.14 | | | | | | | | 0.15 | | | | | | | | 0.19 | | | | | | | | 0.23 | |
Net realized and unrealized gain (loss) | | | | | | | (0.45 | ) | | | | | | | (1.14 | ) | | | | | | | (0.18 | ) | | | | | | | 0.75 | | | | | | | | 0.37 | |
| | | | | | | | | | | | | | | | | | | | | | | | | | | | | | | | | | | | | | | | | | |
| | | | | | | | | | | |
Net increase (decrease) from investment operations | | | | | | | (0.23 | ) | | | | | | | (1.00 | ) | | | | | | | (0.03 | ) | | | | | | | 0.94 | | | | | | | | 0.60 | |
| | | | | | | | | | | | | | | | | | | | | | | | | | | | | | | | | | | | | | | | | | |
| | | | | | | | | | | |
Distributions(b) | | | | | | | | | | | | | | | | | | | | | | | | | | | | | | | | | | | | | | | | |
From net investment income | | | | | | | (0.14 | ) | | | | | | | (0.09 | ) | | | | | | | (0.20 | ) | | | | | | | (0.22 | ) | | | | | | | (0.25 | ) |
From net realized gain | | | | | | | — | | | | | | | | (0.06 | ) | | | | | | | (0.07 | ) | | | | | | | — | | | | | | | | — | |
Return of capital | | | | | | | (0.07 | ) | | | | | | | (0.04 | ) | | | | | | | — | | | | | | | | — | | | | | | | | — | |
| | | | | | | | | | | | | | | | | | | | | | | | | | | | | | | | | | | | | | | | | | |
| | | | | | | | | | | |
Total distributions | | | | | | | (0.21 | ) | | | | | | | (0.19 | ) | | | | | | | (0.27 | ) | | | | | | | (0.22 | ) | | | | | | | (0.25 | ) |
| | | | | | | | | | | | | | | | | | | | | | | | | | | | | | | | | | | | | | | | | | |
| | | | | | | | | | | |
Net asset value, end of year | | | | | | $ | 8.65 | | | | | | | $ | 9.09 | | | | | | | $ | 10.28 | | | | | | | $ | 10.58 | | | | | | | $ | 9.86 | |
| | | | | | | | | | | | | | | | | | | | | | | | | | | | | | | | | | | | | | | | | | |
| | | | | | | | | | | |
Total Return(c) | | | | | | | | | | | | | | | | | | | | | | | | | | | | | | | | | | | | | | | | |
Based on net asset value | | | | | | | (2.48 | )% | | | | | | | (9.85 | )% | | | | | | | (0.32 | )% | | | | | | | 9.66 | % | | | | | | | 6.39 | % |
| | | | | | | | | | | | | | | | | | | | | | | | | | | | | | | | | | | | | | | | | | |
| | | | | | | | | | | |
Ratios to Average Net Assets(d) | | | | | | | | | | | | | | | | | | | | | | | | | | | | | | | | | | | | | | | | |
Total expenses | | | | | | | 1.34 | % | | | | | | | 1.28 | % | | | | | | | 1.54 | % | | | | | | | 1.97 | % | | | | | | | 2.44 | %(e) |
| | | | | | | | | | | | | | | | | | | | | | | | | | | | | | | | | | | | | | | | | | |
| | | | | | | | | | | |
Total expenses after fees waived and/or reimbursed | | | | | | | 0.53 | % | | | | | | | 0.54 | % | | | | | | | 0.66 | % | | | | | | | 0.66 | % | | | | | | | 0.66 | % |
| | | | | | | | | | | | | | | | | | | | | | | | | | | | | | | | | | | | | | | | | | |
| | | | | | | | | | | |
Net investment income | | | | | | | 2.54 | % | | | | | | | 1.43 | % | | | | | | | 1.40 | % | | | | | | | 1.89 | % | | | | | | | 2.39 | % |
| | | | | | | | | | | | | | | | | | | | | | | | | | | | | | | | | | | | | | | | | | |
| | | | | | | | | | | |
Supplemental Data | | | | | | | | | | | | | | | | | | | | | | | | | | | | | | | | | | | | | | | | |
Net assets, end of year (000) | | | | | | $ | 1,974 | | | | | | | $ | 5,156 | | | | | | | $ | 6,049 | | | | | | | $ | 1,807 | | | | | | | $ | 550 | |
| | | | | | | | | | | | | | | | | | | | | | | | | | | | | | | | | | | | | | | | | | |
| | | | | | | | | | | |
Portfolio turnover rate(f) | | | | | | | 376 | % | | | | | | | 304 | % | | | | | | | 503 | % | | | | | | | 287 | % | | | | | | | 202 | % |
| | | | | | | | | | | | | | | | | | | | | | | | | | | | | | | | | | | | | | | | | | |
|
(a) Based on average shares outstanding. | |
(b) Distributions for annual periods determined in accordance with U.S. federal income tax regulations. | |
(c) Where applicable, excludes the effects of any sales charges and assumes the reinvestment of distributions. | |
(d) Excludes fees and expenses incurred indirectly as a result of investments in underlying funds. | |
(e) Includes non-recurring expenses of Board realignment and consolidation costs. Without these costs, total expenses would have been 2.21%. | |
(f) Includes mortgage dollar roll transactions (“MDRs”). Additional information regarding portfolio turnover rate is as follows: | |
| | | | | | |
| | | | | Year Ended
05/31/23 | | | Year Ended
05/31/22 | | | Year Ended
05/31/21 | | | Year Ended
05/31/20 | | | Year Ended
05/31/19 | |
| | | | | | | | | | | |
Portfolio turnover rate (excluding MDRs) | | | | | | | 193 | % | | | | | | | 173 | % | | | | | | | 302 | % | | | | | | | 177 | % | | | | | | | 117 | % |
| | | | | | | | | | | | | | | | | | | | | | | | | | | | | | | | | | | | | | | | | | |
See notes to financial statements.
Financial Highlights (continued)
(For a share outstanding throughout each period)
| | | | | | | | | | | | | | | | | | | | | | | | | | | | | | | | | | | | | | | | | | |
| | | | | | | BlackRock Sustainable Advantage CoreAlpha Bond Fund (continued) | |
| | | | | | | | | Investor C | |
| | | | | | |
| | | | | Year Ended
05/31/23 | | | Year Ended
05/31/22 | | | Year Ended
05/31/21 | | | Year Ended
05/31/20 | | | Year Ended
05/31/19 | |
| | | | | | | | | | | | |
Net asset value, beginning of year | | | | | | $ | 9.09 | | | | | | | $ | 10.28 | | | | | | | $ | 10.58 | | | | | | | $ | 9.85 | | | | | | | $ | 9.51 | |
| | | | | | | | | | | | | | | | | | | | | | | | | | | | | | | | | | | | | | | | | | |
| | | | | | | | | | | |
Net investment income(a) | | | | | | | 0.16 | | | | | | | | 0.07 | | | | | | | | 0.07 | | | | | | | | 0.12 | | | | | | | | 0.16 | |
Net realized and unrealized gain (loss) | | | | | | | (0.46 | ) | | | | | | | (1.14 | ) | | | | | | | (0.18 | ) | | | | | | | 0.75 | | | | | | | | 0.35 | |
| | | | | | | | | | | | | | | | | | | | | | | | | | | | | | | | | | | | | | | | | | |
| | | | | | | | | | | |
Net increase (decrease) from investment operations | | | | | | | (0.30 | ) | | | | | | | (1.07 | ) | | | | | | | (0.11 | ) | | | | | | | 0.87 | | | | | | | | 0.51 | |
| | | | | | | | | | | | | | | | | | | | | | | | | | | | | | | | | | | | | | | | | | |
| | | | | | | | | | | |
Distributions(b) | | | | | | | | | | | | | | | | | | | | | | | | | | | | | | | | | | | | | | | | |
From net investment income | | | | | | | (0.08 | ) | | | | | | | (0.02 | ) | | | | | | | (0.12 | ) | | | | | | | (0.14 | ) | | | | | | | (0.17 | ) |
From net realized gain | | | | | | | — | | | | | | | | (0.06 | ) | | | | | | | (0.07 | ) | | | | | | | — | | | | | | | | — | |
Return of capital | | | | | | | (0.07 | ) | | | | | | | (0.04 | ) | | | | | | | — | | | | | | | | — | | | | | | | | — | |
| | | | | | | | | | | | | | | | | | | | | | | | | | | | | | | | | | | | | | | | | | |
| | | | | | | | | | | |
Total distributions | | | | | | | (0.15 | ) | | | | | | | (0.12 | ) | | | | | | | (0.19 | ) | | | | | | | (0.14 | ) | | | | | | | (0.17 | ) |
| | | | | | | | | | | | | | | | | | | | | | | | | | | | | | | | | | | | | | | | | | |
| | | | | | | | | | | |
Net asset value, end of year | | | | | | $ | 8.64 | | | | | | | $ | 9.09 | | | | | | | $ | 10.28 | | | | | | | $ | 10.58 | | | | | | | $ | 9.85 | |
| | | | | | | | | | | | | | | | | | | | | | | | | | | | | | | | | | | | | | | | | | |
| | | | | | | | | | | |
Total Return(c) | | | | | | | | | | | | | | | | | | | | | | | | | | | | | | | | | | | | | | | | |
Based on net asset value | | | | | | | (3.32 | )% | | | | | | | (10.53 | )% | | | | | | | (1.07 | )% | | | | | | | 8.96 | % | | | | | | | 5.49 | % |
| | | | | | | | | | | | | | | | | | | | | | | | | | | | | | | | | | | | | | | | | | |
| | | | | | | | | | | |
Ratios to Average Net Assets(d) | | | | | | | | | | | | | | | | | | | | | | | | | | | | | | | | | | | | | | | | |
Total expenses | | | | | | | 2.42 | % | | | | | | | 2.29 | % | | | | | | | 2.40 | % | | | | | | | 2.66 | % | | | | | | | 3.20 | %(e) |
| | | | | | | | | | | | | | | | | | | | | | | | | | | | | | | | | | | | | | | | | | |
| | | | | | | | | | | |
Total expenses after fees waived and/or reimbursed | | | | | | | 1.28 | % | | | | | | | 1.29 | % | | | | | | | 1.41 | % | | | | | | | 1.41 | % | | | | | | | 1.41 | % |
| | | | | | | | | | | | | | | | | | | | | | | | | | | | | | | | | | | | | | | | | | |
| | | | | | | | | | | |
Net investment income | | | | | | | 1.89 | % | | | | | | | 0.69 | % | | | | | | | 0.62 | % | | | | | | | 1.15 | % | | | | | | | 1.64 | % |
| | | | | | | | | | | | | | | | | | | | | | | | | | | | | | | | | | | | | | | | | | |
| | | | | | | | | | | |
Supplemental Data | | | | | | | | | | | | | | | | | | | | | | | | | | | | | | | | | | | | | | | | |
Net assets, end of year (000) | | | | | | $ | 141 | | | | | | | $ | 136 | | | | | | | $ | 134 | | | | | | | $ | 124 | | | | | | | $ | 69 | |
| | | | | | | | | | | | | | | | | | | | | | | | | | | | | | | | | | | | | | | | | | |
| | | | | | | | | | | |
Portfolio turnover rate(f) | | | | | | | 376 | % | | | | | | | 304 | % | | | | | | | 503 | % | | | | | | | 287 | % | | | | | | | 202 | % |
| | | | | | | | | | | | | | | | | | | | | | | | | | | | | | | | | | | | | | | | | | |
|
(a) Based on average shares outstanding. | |
(b) Distributions for annual periods determined in accordance with U.S. federal income tax regulations. | |
(c) Where applicable, excludes the effects of any sales charges and assumes the reinvestment of distributions. | |
(d) Excludes fees and expenses incurred indirectly as a result of investments in underlying funds. | |
(e) Includes non-recurring expenses of Board realignment and consolidation costs. Without these costs, total expenses would have been 2.97%. | |
(f) Includes mortgage dollar roll transactions (“MDRs”). Additional information regarding portfolio turnover rate is as follows: | |
| | | | | | |
| | | | | Year Ended
05/31/23 | | | Year Ended
05/31/22 | | | Year Ended
05/31/21 | | | Year Ended
05/31/20 | | | Year Ended
05/31/19 | |
| | | | | | | | | | | |
Portfolio turnover rate (excluding MDRs) | | | | | | | 193 | % | | | | | | | 173 | % | | | | | | | 302 | % | | | | | | | 177 | % | | | | | | | 117 | % |
| | | | | | | | | | | | | | | | | | | | | | | | | | | | | | | | | | | | | | | | | | |
See notes to financial statements.
| | |
| 28 | | 2 0 2 3 BLACK ROCK ANNUAL REPORT TO SHAREHOLDERS |
Financial Highlights (continued)
(For a share outstanding throughout each period)
| | | | | | | | | | | | | | | | | | | | | | | | | | | | | | | | | | | | | | | | | | |
| | | | | | | BlackRock Sustainable Advantage CoreAlpha Bond Fund (continued) | |
| | | | | | | | | Class K | |
| | | | | | |
| | | | | Year Ended
05/31/23 | | | Year Ended
05/31/22 | | | Year Ended
05/31/21 | | | Year Ended
05/31/20 | | | Year Ended
05/31/19 | |
| | | | | | | | | | | | |
Net asset value, beginning of year | | | | | | $ | 9.09 | | | | | | | $ | 10.28 | | | | | | | $ | 10.58 | | | | | | | $ | 9.85 | | | | | | | $ | 9.51 | |
| | | | | | | | | | | | | | | | | | | | | | | | | | | | | | | | | | | | | | | | | | |
| | | | | | | | | | | |
Net investment income(a) | | | | | | | 0.26 | | | | | | | | 0.17 | | | | | | | | 0.18 | | | | | | | | 0.24 | | | | | | | | 0.26 | |
Net realized and unrealized gain (loss) | | | | | | | (0.46 | ) | | | | | | | (1.14 | ) | | | | | | | (0.18 | ) | | | | | | | 0.74 | | | | | | | | 0.35 | |
| | | | | | | | | | | | | | | | | | | | | | | | | | | | | | | | | | | | | | | | | | |
| | | | | | | | | | | |
Net increase (decrease) from investment operations | | | | | | | (0.20 | ) | | | | | | | (0.97 | ) | | | | | | | — | | | | | | | | 0.98 | | | | | | | | 0.61 | |
| | | | | | | | | | | | | | | | | | | | | | | | | | | | | | | | | | | | | | | | | | |
| | | | | | | | | | | |
Distributions(b) | | | | | | | | | | | | | | | | | | | | | | | | | | | | | | | | | | | | | | | | |
From net investment income | | | | | | | (0.17 | ) | | | | | | | (0.12 | ) | | | | | | | (0.23 | ) | | | | | | | (0.25 | ) | | | | | | | (0.27 | ) |
From net realized gain | | | | | | | — | | | | | | | | (0.06 | ) | | | | | | | (0.07 | ) | | | | | | | — | | | | | | | | — | |
Return of capital | | | | | | | (0.07 | ) | | | | | | | (0.04 | ) | | | | | | | — | | | | | | | | — | | | | | | | | — | |
| | | | | | | | | | | | | | | | | | | | | | | | | | | | | | | | | | | | | | | | | | |
| | | | | | | | | | | |
Total distributions | | | | | | | (0.24 | ) | | | | | | | (0.22 | ) | | | | | | | (0.30 | ) | | | | | | | (0.25 | ) | | | | | | | (0.27 | ) |
| | | | | | | | | | | | | | | | | | | | | | | | | | | | | | | | | | | | | | | | | | |
| | | | | | | | | | | |
Net asset value, end of year | | | | | | $ | 8.65 | | | | | | | $ | 9.09 | | | | | | | $ | 10.28 | | | | | | | $ | 10.58 | | | | | | | $ | 9.85 | |
| | | | | | | | | | | | | | | | | | | | | | | | | | | | | | | | | | | | | | | | | | |
| | | | | | | | | | | |
Total Return(c) | | | | | | | | | | | | | | | | | | | | | | | | | | | | | | | | | | | | | | | | |
Based on net asset value | | | | | | | (2.18 | )% | | | | | | | (9.58 | )% | | | | | | | (0.02 | )% | | | | | | | 10.10 | % | | | | | | | 6.60 | % |
| | | | | | | | | | | | | | | | | | | | | | | | | | | | | | | | | | | | | | | | | | |
| | | | | | | | | | | |
Ratios to Average Net Assets(d) | | | | | | | | | | | | | | | | | | | | | | | | | | | | | | | | | | | | | | | | |
Total expenses | | | | | | | 1.03 | % | | | | | | | 0.93 | % | | | | | | | 1.17 | % | | | | | | | 1.67 | % | | | | | | | 2.70 | %(e) |
| | | | | | | | | | | | | | | | | | | | | | | | | | | | | | | | | | | | | | | | | | |
| | | | | | | | | | | |
Total expenses after fees waived and/or reimbursed | | | | | | | 0.23 | % | | | | | | | 0.24 | % | | | | | | | 0.36 | % | | | | | | | 0.36 | % | | | | | | | 0.36 | % |
| | | | | | | | | | | | | | | | | | | | | | | | | | | | | | | | | | | | | | | | | | |
| | | | | | | | | | | |
Net investment income | | | | | | | 3.00 | % | | | | | | | 1.75 | % | | | | | | | 1.72 | % | | | | | | | 2.38 | % | | | | | | | 2.66 | % |
| | | | | | | | | | | | | | | | | | | | | | | | | | | | | | | | | | | | | | | | | | |
| | | | | | | | | | | |
Supplemental Data | | | | | | | | | | | | | | | | | | | | | | | | | | | | | | | | | | | | | | | | |
Net assets, end of year (000) | | | | | | $ | 4,861 | | | | | | | $ | 2,394 | | | | | | | $ | 1,380 | | | | | | | $ | 130 | | | | | | | $ | 449 | |
| | | | | | | | | | | | | | | | | | | | | | | | | | | | | | | | | | | | | | | | | | |
| | | | | | | | | | | |
Portfolio turnover rate(f) | | | | | | | 376 | % | | | | | | | 304 | % | | | | | | | 503 | % | | | | | | | 287 | % | | | | | | | 202 | % |
| | | | | | | | | | | | | | | | | | | | | | | | | | | | | | | | | | | | | | | | | | |
|
(a) Based on average shares outstanding. | |
(b) Distributions for annual periods determined in accordance with U.S. federal income tax regulations. | |
(c) Where applicable, assumes the reinvestment of distributions. | |
(d) Excludes fees and expenses incurred indirectly as a result of investments in underlying funds. | |
(e) Includes non-recurring expenses of Board realignment and consolidation costs. Without these costs, total expenses would have been 2.48%. | |
(f) Includes mortgage dollar roll transactions (“MDRs”). Additional information regarding portfolio turnover rate is as follows: | |
| | | | | | |
| | | | | Year Ended
05/31/23 | | | Year Ended
05/31/22 | | | Year Ended
05/31/21 | | | Year Ended
05/31/20 | | | Year Ended
05/31/19 | |
| | | | | | | | | | | |
Portfolio turnover rate (excluding MDRs) | | | | | | | 193 | % | | | | | | | 173 | % | | | | | | | 302 | % | | | | | | | 177 | % | | | | | | | 117 | % |
| | | | | | | | | | | | | | | | | | | | | | | | | | | | | | | | | | | | | | | | | | |
See notes to financial statements.
Notes to Financial Statements
BlackRock Funds IV (the “Trust”) is registered under the Investment Company Act of 1940, as amended (the “1940 Act”), as an open-end management investment company. The Trust is organized as a Massachusetts business trust. BlackRock Sustainable Advantage CoreAlpha Bond Fund (the “Fund”) is a series of the Trust. The Fund is classified as diversified.
The Fund offers multiple classes of shares. All classes of shares have identical voting, dividend, liquidation and other rights and are subject to the same terms and conditions, except that certain classes bear expenses related to the shareholder servicing and distribution of such shares. Institutional and Class K Shares are sold only to certain eligible investors. Investor A and Investor C Shares bear certain expenses related to shareholder servicing of such shares, and Investor C Shares also bear certain expenses related to the distribution of such shares. Investor A and Investor C Shares are generally available through financial intermediaries. Each class has exclusive voting rights with respect to matters relating to its shareholder servicing and distribution expenditures (except that Investor C shareholders may vote on material changes to the Investor A Shares distribution and service plan).
| | | | | | |
| | | | |
| Share Class | | Initial Sales Charge | | CDSC | | Conversion Privilege |
| | | |
Institutional and Class K Shares | | No | | No | | None |
Investor A Shares | | Yes | | No(a) | | None |
Investor C Shares | | No | | Yes(b) | | To Investor A Shares after approximately 8 years |
| | (a) | Investor A Shares may be subject to a contingent deferred sales charge (“CDSC”) for certain redemptions where no initial sales charge was paid at the time of purchase. | |
| | (b) | A CDSC of 1.00% is assessed on certain redemptions of Investor C Shares made within one year after purchase. | |
The Fund, together with certain other registered investment companies advised by BlackRock Advisors, LLC (the “Manager”) or its affiliates, is included in a complex of funds referred to as the BlackRock Fixed-Income Complex.
| 2. | SIGNIFICANT ACCOUNTING POLICIES |
The financial statements are prepared in conformity with accounting principles generally accepted in the United States of America (“U.S. GAAP”), which may require management to make estimates and assumptions that affect the reported amounts of assets and liabilities in the financial statements, disclosure of contingent assets and liabilities at the date of the financial statements and the reported amounts of increases and decreases in net assets from operations during the reporting period. Actual results could differ from those estimates. The Fund is considered an investment company under U.S. GAAP and follows the accounting and reporting guidance applicable to investment companies. Below is a summary of significant accounting policies:
Investment Transactions and Income Recognition: For financial reporting purposes, investment transactions are recorded on the dates the transactions are executed. Realized gains and losses on investment transactions are determined using the specific identification method. Dividend income and capital gain distributions, if any, are recorded on the ex-dividend dates. Non-cash dividends, if any, are recorded on the ex-dividend dates at fair value. Upon notification from issuers, a portion of the dividend income received from a real estate investment trust may be redesignated as a reduction of cost of the related investment and/or realized gain. Interest income, including amortization and accretion of premiums and discounts on debt securities, is recognized daily on an accrual basis. Income, expenses and realized and unrealized gains and losses are allocated daily to each class based on its relative net assets.
Foreign Currency Translation: The Fund’s books and records are maintained in U.S. dollars. Securities and other assets and liabilities denominated in foreign currencies are translated into U.S. dollars using exchange rates determined as of the close of trading on the New York Stock Exchange (“NYSE”). Purchases and sales of investments are recorded at the rates of exchange prevailing on the respective dates of such transactions. Generally, when the U.S. dollar rises in value against a foreign currency, the investments denominated in that currency will lose value; the opposite effect occurs if the U.S. dollar falls in relative value.
The Fund does not isolate the effect of fluctuations in foreign exchange rates from the effect of fluctuations in the market prices of investments for financial reporting purposes. Accordingly, the effects of changes in exchange rates on investments are not segregated in the Statement of Operations from the effects of changes in market prices of those investments, but are included as a component of net realized and unrealized gain (loss) from investments. The Fund reports realized currency gains (losses) on foreign currency related transactions as components of net realized gain (loss) for financial reporting purposes, whereas such components are generally treated as ordinary income for U.S. federal income tax purposes.
Collateralization: If required by an exchange or counterparty agreement, the Fund may be required to deliver/deposit cash and/or securities to/with an exchange, or broker-dealer or custodian as collateral for certain investments.
Distributions: Distributions from net investment income are declared daily and paid monthly. Distributions of capital gains are recorded on the ex-dividend dates and made at least annually. The portion of distributions, if any, that exceeds a fund’s current and accumulated earnings and profits, as measured on a tax basis, constitute a non-taxable return of capital. The character and timing of distributions are determined in accordance with U.S. federal income tax regulations, which may differ from U.S. GAAP.
Deferred Compensation Plan: Under the Deferred Compensation Plan (the “Plan”) approved by the Board of Trustees of the Trust (the “Board”), the trustees who are not “interested persons” of the Fund, as defined in the 1940 Act (“Independent Trustees”), may defer a portion of their annual complex-wide compensation. Deferred amounts earn an approximate return as though equivalent dollar amounts had been invested in common shares of certain funds in the BlackRock Fixed-Income Complex selected by the Independent Trustees. This has the same economic effect for the Independent Trustees as if the Independent Trustees had invested the deferred amounts directly in certain funds in the BlackRock Fixed-Income Complex.
The Plan is not funded and obligations thereunder represent general unsecured claims against the general assets of the Fund, as applicable. Deferred compensation liabilities, if any, are included in the Trustees’ and Officer’s fees payable in the Statement of Assets and Liabilities and will remain as a liability of the Fund until such amounts are
| | |
| 30 | | 2 0 2 3 BLACK ROCK ANNUAL REPORT TO SHAREHOLDERS |
Notes to Financial Statements (continued)
distributed in accordance with the Plan. Net appreciation (depreciation) in the value of participants’ deferral accounts is allocated among the participating funds in the BlackRock Fixed-Income Complex and reflected as Trustees and Officer expense on the Statement of Operations. The Trustees and Officer expense may be negative as a result of a decrease in value of the deferred accounts.
Indemnifications: In the normal course of business, the Fund enters into contracts that contain a variety of representations that provide general indemnification. The Fund’s maximum exposure under these arrangements is unknown because it involves future potential claims against the Fund, which cannot be predicted with any certainty.
Other: Expenses directly related to the Fund or its classes are charged to the Fund or the applicable class. Expenses directly related to the Fund and other shared expenses prorated to the Fund are allocated daily to each class based on its relative net assets or other appropriate methods. Other operating expenses shared by several funds, including other funds managed by the Manager, are prorated among those funds on the basis of relative net assets or other appropriate methods.
| 3. | INVESTMENT VALUATION AND FAIR VALUE MEASUREMENTS |
Investment Valuation Policies: The Fund’s investments are valued at fair value (also referred to as “market value” within the financial statements) each day that the Fund is open for business and, for financial reporting purposes, as of the report date. U.S. GAAP defines fair value as the price a fund would receive to sell an asset or pay to transfer a liability in an orderly transaction between market participants at the measurement date. The Board has approved the designation of the Fund’s Manager as the valuation designee for the Fund. The Fund determines the fair values of its financial instruments using various independent dealers or pricing services under the Manager’s policies. If a security’s market price is not readily available or does not otherwise accurately represent the fair value of the security, the security will be valued in accordance with the Manager’s policies and procedures as reflecting fair value. The Manager has formed a committee (the “Valuation Committee”) to develop pricing policies and procedures and to oversee the pricing function for all financial instruments, with assistance from other BlackRock pricing committees.
Fair Value Inputs and Methodologies: The following methods and inputs are used to establish the fair value of the Fund’s assets and liabilities:
| | • | | Fixed-income investments for which market quotations are readily available are generally valued using the last available bid price or current market quotations provided by independent dealers or third-party pricing services. Pricing services generally value fixed-income securities assuming orderly transactions of an institutional round lot size, but a fund may hold or transact in such securities in smaller, odd lot sizes. Odd lots may trade at lower prices than institutional round lots. The pricing services may use matrix pricing or valuation models that utilize certain inputs and assumptions to derive values, including transaction data (e.g., recent representative bids and offers), market data, credit quality information, perceived market movements, news, and other relevant information. Certain fixed-income securities, including asset-backed and mortgage related securities may be valued based on valuation models that consider the estimated cash flows of each tranche of the entity, establish a benchmark yield and develop an estimated tranche specific spread to the benchmark yield based on the unique attributes of the tranche. The amortized cost method of valuation may be used with respect to debt obligations with sixty days or less remaining to maturity unless the Manager determines such method does not represent fair value. |
| | • | | Investments in open-end U.S. mutual funds (including money market funds) are valued at that day’s published net asset value (“NAV”). |
| | • | | Futures contracts are valued based on that day’s last reported settlement or trade price on the exchange where the contract is traded. |
| | • | | Forward foreign currency exchange contracts are valued at the mean between the bid and ask prices and are determined as of the close of trading on the NYSE based on that day’s prevailing forward exchange rate for the underlying currencies. |
| | • | | Swap agreements are valued utilizing quotes received daily by independent pricing services or through brokers, which are derived using daily swap curves and models that incorporate a number of market data factors, such as discounted cash flows, trades and values of the underlying reference instruments. |
Generally, trading in foreign instruments is substantially completed each day at various times prior to the close of trading on the NYSE. Each business day, the Fund uses current market factors supplied by independent pricing services to value certain foreign instruments (“Systematic Fair Value Price”). The Systematic Fair Value Price is designed to value such foreign securities at fair value as of the close of trading on the NYSE, which follows the close of the local markets.
If events (e.g., market volatility, company announcement or a natural disaster) occur that are expected to materially affect the value of such investment, or in the event that application of these methods of valuation results in a price for an investment that is deemed not to be representative of the market value of such investment, or if a price is not available, the investment will be valued by the Valuation Committee in accordance with the Manager’s policies and procedures as reflecting fair value (“Fair Valued Investments”). The fair valuation approaches that may be used by the Valuation Committee include market approach, income approach and cost approach. Valuation techniques such as discounted cash flow, use of market comparables and matrix pricing are types of valuation approaches and are typically used in determining fair value. When determining the price for Fair Valued Investments, the Valuation Committee seeks to determine the price that the Fund might reasonably expect to receive or pay from the current sale or purchase of that asset or liability in an arm’s-length transaction. Fair value determinations shall be based upon all available factors that the Valuation Committee deems relevant and consistent with the principles of fair value measurement.
Fair Value Hierarchy: Various inputs are used in determining the fair value of financial instruments. These inputs to valuation techniques are categorized into a fair value hierarchy consisting of three broad levels for financial reporting purposes as follows:
| | • | | Level 1 – Unadjusted price quotations in active markets/exchanges for identical assets or liabilities that the Fund has the ability to access; |
| | • | | Level 2 – Other observable inputs (including, but not limited to, quoted prices for similar assets or liabilities in markets that are active, quoted prices for identical or similar assets or liabilities in markets that are not active, inputs other than quoted prices that are observable for the assets or liabilities (such as interest rates, yield curves, volatilities, prepayment speeds, loss severities, credit risks and default rates) or other market–corroborated inputs); and |
| | |
NOTES TO FINANCIAL STATEMENTS | | 31 |
Notes to Financial Statements (continued)
| | • | | Level 3 – Unobservable inputs based on the best information available in the circumstances, to the extent observable inputs are not available (including the Valuation Committee’s assumptions used in determining the fair value of financial instruments). |
The hierarchy gives the highest priority to unadjusted quoted prices in active markets for identical assets or liabilities (Level 1 measurements) and the lowest priority to unobservable inputs (Level 3 measurements). Accordingly, the degree of judgment exercised in determining fair value is greatest for instruments categorized in Level 3. The inputs used to measure fair value may fall into different levels of the fair value hierarchy. In such cases, for disclosure purposes, the fair value hierarchy classification is determined based on the lowest level input that is significant to the fair value measurement in its entirety. Investments classified within Level 3 have significant unobservable inputs used by the Valuation Committee in determining the price for Fair Valued Investments. Level 3 investments include equity or debt issued by privately held companies or funds that may not have a secondary market and/or may have a limited number of investors. The categorization of a value determined for financial instruments is based on the pricing transparency of the financial instruments and is not necessarily an indication of the risks associated with investing in those securities.
| 4. | SECURITIES AND OTHER INVESTMENTS |
Asset-Backed and Mortgage-Backed Securities: Asset-backed securities are generally issued as pass-through certificates or as debt instruments. Asset-backed securities issued as pass-through certificates represent undivided fractional ownership interests in an underlying pool of assets. Asset-backed securities issued as debt instruments, which are also known as collateralized obligations, are typically issued as the debt of a special purpose entity organized solely for the purpose of owning such assets and issuing such debt. Asset-backed securities are often backed by a pool of assets representing the obligations of a number of different parties. The yield characteristics of certain asset-backed securities may differ from traditional debt securities. One such major difference is that all or a principal part of the obligations may be prepaid at any time because the underlying assets (i.e., loans) may be prepaid at any time. As a result, a decrease in interest rates in the market may result in increases in the level of prepayments as borrowers, particularly mortgagors, refinance and repay their loans. An increased prepayment rate with respect to an asset-backed security will have the effect of shortening the maturity of the security. In addition, a fund may subsequently have to reinvest the proceeds at lower interest rates. If a fund has purchased such an asset-backed security at a premium, a faster than anticipated prepayment rate could result in a loss of principal to the extent of the premium paid.
For mortgage pass-through securities (the “Mortgage Assets”) there are a number of important differences among the agencies and instrumentalities of the U.S. Government that issue mortgage-related securities and among the securities that they issue. For example, mortgage-related securities guaranteed by Ginnie Mae are guaranteed as to the timely payment of principal and interest by Ginnie Mae and such guarantee is backed by the full faith and credit of the United States. However, mortgage-related securities issued by Freddie Mac and Fannie Mae, including Freddie Mac and Fannie Mae guaranteed mortgage pass-through certificates, which are solely the obligations of Freddie Mac and Fannie Mae, are not backed by or entitled to the full faith and credit of the United States, but are supported by the right of the issuer to borrow from the U.S. Treasury.
Non-agency mortgage-backed securities are securities issued by non-governmental issuers and have no direct or indirect government guarantees of payment and are subject to various risks. Non-agency mortgage loans are obligations of the borrowers thereunder only and are not typically insured or guaranteed by any other person or entity. The ability of a borrower to repay a loan is dependent upon the income or assets of the borrower. A number of factors, including a general economic downturn, acts of God, terrorism, social unrest and civil disturbances, may impair a borrower’s ability to repay its loans.
Inflation-Indexed Bonds: Inflation-indexed bonds (other than municipal inflation-indexed and certain corporate inflation-indexed bonds) are fixed-income securities whose principal value is periodically adjusted according to the rate of inflation. If the index measuring inflation rises or falls, the principal value of inflation-indexed bonds (other than municipal inflation-indexed and certain corporate inflation-indexed bonds) will be adjusted upward or downward, and consequently the interest payable on these securities (calculated with respect to a larger or smaller principal amount) will be increased or reduced, respectively. Any upward or downward adjustment in the principal amount of an inflation-indexed bond is included as interest income in the Statement of Operations, even though investors do not receive their principal until maturity. Repayment of the original bond principal upon maturity (as adjusted for inflation) is guaranteed in the case of U.S. Treasury inflation-indexed bonds. For bonds that do not provide a similar guarantee, the adjusted principal value of the bond repaid at maturity may be less than the original principal. With regard to municipal inflation-indexed bonds and certain corporate inflation-indexed bonds, the inflation adjustment is typically reflected in the semi-annual coupon payment. As a result, the principal value of municipal inflation-indexed bonds and such corporate inflation-indexed bonds does not adjust according to the rate of inflation.
Multiple Class Pass-Through Securities: Multiple class pass-through securities, including collateralized mortgage obligations (“CMOs”) and commercial mortgage-backed securities, may be issued by Ginnie Mae, U.S. Government agencies or instrumentalities or by trusts formed by private originators of, or investors in, mortgage loans. In general, CMOs are debt obligations of a legal entity that are collateralized by a pool of residential or commercial mortgage loans or Mortgage Assets. The payments on these are used to make payments on the CMOs or multiple pass-through securities. Multiple class pass-through securities represent direct ownership interests in the Mortgage Assets. Classes of CMOs include interest only (“IOs”), principal only (“POs”), planned amortization classes and targeted amortization classes. IOs and POs are stripped mortgage-backed securities representing interests in a pool of mortgages, the cash flow from which has been separated into interest and principal components. IOs receive the interest portion of the cash flow while POs receive the principal portion. IOs and POs can be extremely volatile in response to changes in interest rates. As interest rates rise and fall, the value of IOs tends to move in the same direction as interest rates. POs perform best when prepayments on the underlying mortgages rise since this increases the rate at which the principal is returned and the yield to maturity on the PO. When payments on mortgages underlying a PO are slower than anticipated, the life of the PO is lengthened and the yield to maturity is reduced. If the underlying Mortgage Assets experience greater than anticipated prepayments of principal, a fund’s initial investment in the IOs may not fully recoup.
Forward Commitments, When-Issued and Delayed Delivery Securities: The Fund may purchase securities on a when-issued basis and may purchase or sell securities on a forward commitment basis. Settlement of such transactions normally occurs within a month or more after the purchase or sale commitment is made. The Fund may purchase securities under such conditions with the intention of actually acquiring them but may enter into a separate agreement to sell the securities before the settlement date. Since the value of securities purchased may fluctuate prior to settlement, the Fund may be required to pay more at settlement than the security is worth. In addition, a fund is not entitled to any of the interest earned prior to settlement. When purchasing a security on a delayed delivery basis, the Fund assumes the rights and risks of ownership of the security, including the risk of price and yield fluctuations. In the event of default by the counterparty, the Fund’s maximum amount of loss is the unrealized appreciation of unsettled when-issued transactions.
| | |
| 32 | | 2 0 2 3 BLACK ROCK ANNUAL REPORT TO SHAREHOLDERS |
Notes to Financial Statements (continued)
TBA Commitments: TBA commitments are forward agreements for the purchase or sale of securities, including mortgage-backed securities for a fixed price, with payment and delivery on an agreed upon future settlement date. The specific securities to be delivered are not identified at the trade date. However, delivered securities must meet specified terms, including issuer, rate and mortgage terms. When entering into TBA commitments, a fund may take possession of or deliver the underlying mortgage-backed securities but can extend the settlement or roll the transaction. TBA commitments involve a risk of loss if the value of the security to be purchased or sold declines or increases, respectively, prior to settlement date, if there are expenses or delays in connection with the TBA transactions, or if the counterparty fails to complete the transaction.
In order to better define contractual rights and to secure rights that will help a fund mitigate its counterparty risk, TBA commitments may be entered into by a fund under Master Securities Forward Transaction Agreements (each, an “MSFTA”). An MSFTA typically contains, among other things, collateral posting terms and netting provisions in the event of default and/or termination event. The collateral requirements are typically calculated by netting the mark-to-market amount for each transaction under such agreement and comparing that amount to the value of the collateral currently pledged by a fund and the counterparty. Cash collateral that has been pledged to cover the obligations of a fund and cash collateral received from the counterparty, if any, is reported separately in the Statement of Assets and Liabilities as cash pledged as collateral for TBA commitments or cash received as collateral for TBA commitments, respectively. Non-cash collateral pledged by a fund, if any, is noted in the Schedule of Investments. Typically, a fund is permitted to sell, re-pledge or use the collateral it receives; however, the counterparty is not permitted to do so. To the extent amounts due to a fund are not fully collateralized, contractually or otherwise, a fund bears the risk of loss from counterparty non-performance.
Mortgage Dollar Roll Transactions: The Fund may sell TBA mortgage-backed securities and simultaneously contract to repurchase substantially similar (i.e., same type, coupon and maturity) securities on a specific future date at an agreed upon price. During the period between the sale and repurchase, a fund is not entitled to receive interest and principal payments on the securities sold. Mortgage dollar roll transactions are treated as purchases and sales and a fund realizes gains and losses on these transactions. Mortgage dollar rolls involve the risk that the market value of the securities that a fund is required to purchase may decline below the agreed upon repurchase price of those securities.
| 5. | DERIVATIVE FINANCIAL INSTRUMENTS |
The Fund engages in various portfolio investment strategies using derivative contracts both to increase the returns of the Fund and/or to manage its exposure to certain risks such as credit risk, equity risk, interest rate risk, foreign currency exchange rate risk, commodity price risk or other risks (e.g., inflation risk). Derivative financial instruments categorized by risk exposure are included in the Schedule of Investments. These contracts may be transacted on an exchange or over-the-counter (“OTC”).
Futures Contracts: Futures contracts are purchased or sold to gain exposure to, or manage exposure to, changes in interest rates (interest rate risk) and changes in the value of equity securities (equity risk) or foreign currencies (foreign currency exchange rate risk).
Futures contracts are exchange-traded agreements between the Fund and a counterparty to buy or sell a specific quantity of an underlying instrument at a specified price and on a specified date. Depending on the terms of a contract, it is settled either through physical delivery of the underlying instrument on the settlement date or by payment of a cash amount on the settlement date. Upon entering into a futures contract, the Fund is required to deposit initial margin with the broker in the form of cash or securities in an amount that varies depending on a contract’s size and risk profile. The initial margin deposit must then be maintained at an established level over the life of the contract. Amounts pledged, which are considered restricted, are included in cash pledged for futures contracts in the Statement of Assets and Liabilities.
Securities deposited as initial margin are designated in the Schedule of Investments and cash deposited, if any, are shown as cash pledged for futures contracts in the Statement of Assets and Liabilities. Pursuant to the contract, the Fund agrees to receive from or pay to the broker an amount of cash equal to the daily fluctuation in market value of the contract (“variation margin”). Variation margin is recorded as unrealized appreciation (depreciation) and, if any, shown as variation margin receivable (or payable) on futures contracts in the Statement of Assets and Liabilities. When the contract is closed, a realized gain or loss is recorded in the Statement of Operations equal to the difference between the notional amount of the contract at the time it was opened and the notional amount at the time it was closed. The use of futures contracts involves the risk of an imperfect correlation in the movements in the price of futures contracts and interest rates, foreign currency exchange rates or underlying assets.
Forward Foreign Currency Exchange Contracts: Forward foreign currency exchange contracts are entered into to gain or reduce exposure to foreign currencies (foreign currency exchange rate risk).
A forward foreign currency exchange contract is an agreement between two parties to buy and sell a currency at a set exchange rate on a specified date. These contracts help to manage the overall exposure to the currencies in which some of the investments held by the Fund are denominated and in some cases, may be used to obtain exposure to a particular market. The contracts are traded OTC and not on an organized exchange.
The contract is marked-to-market daily and the change in market value is recorded as unrealized appreciation (depreciation) in the Statement of Assets and Liabilities. When a contract is closed, a realized gain or loss is recorded in the Statement of Operations equal to the difference between the value at the time it was opened and the value at the time it was closed. Non-deliverable forward foreign currency exchange contracts are settled with the counterparty in cash without the delivery of foreign currency. The use of forward foreign currency exchange contracts involves the risk that the value of a forward foreign currency exchange contract changes unfavorably due to movements in the value of the referenced foreign currencies, and such value may exceed the amount(s) reflected in the Statement of Assets and Liabilities. Cash amounts pledged for forward foreign currency exchange contracts are considered restricted and are included in cash pledged as collateral for OTC derivatives in the Statement of Assets and Liabilities. A Fund’s risk of loss from counterparty credit risk on OTC derivatives is generally limited to the aggregate unrealized gain netted against any collateral held by the Fund.
Swaps: Swap contracts are entered into to manage exposure to issuers, markets and securities. Such contracts are agreements between the Fund and a counterparty to make periodic net payments on a specified notional amount or a net payment upon termination. Swap agreements are privately negotiated in the OTC market and may be entered into as a bilateral contract (“OTC swaps”) or centrally cleared (“centrally cleared swaps”).
For OTC swaps, any upfront premiums paid and any upfront fees received are shown as swap premiums paid and swap premiums received, respectively, in the Statement of Assets and Liabilities and amortized over the term of the contract. The daily fluctuation in market value is recorded as unrealized appreciation (depreciation) on OTC Swaps
| | |
NOTES TO FINANCIAL STATEMENTS | | 33 |
Notes to Financial Statements (continued)
in the Statement of Assets and Liabilities. Payments received or paid are recorded in the Statement of Operations as realized gains or losses, respectively. When an OTC swap is terminated, a realized gain or loss is recorded in the Statement of Operations equal to the difference between the proceeds from (or cost of) the closing transaction and the Fund’s basis in the contract, if any. Generally, the basis of the contract is the premium received or paid.
In a centrally cleared swap, immediately following execution of the swap contract, the swap contract is novated to a central counterparty (the “CCP”) and the CCP becomes the Fund’s counterparty on the swap. The Fund is required to interface with the CCP through the broker. Upon entering into a centrally cleared swap, the Fund is required to deposit initial margin with the broker in the form of cash or securities in an amount that varies depending on the size and risk profile of the particular swap. Securities deposited as initial margin are designated in the Schedule of Investments and cash deposited is shown as cash pledged for centrally cleared swaps in the Statement of Assets and Liabilities. Amounts pledged, which are considered restricted cash, are included in cash pledged for centrally cleared swaps in the Statement of Assets and Liabilities. Pursuant to the contract, the Fund agrees to receive from or pay to the broker variation margin. Variation margin is recorded as unrealized appreciation (depreciation) and shown as variation margin receivable (or payable) on centrally cleared swaps in the Statement of Assets and Liabilities. Payments received from (paid to) the counterparty are amortized over the term of the contract and recorded as realized gains (losses) in the Statement of Operations, including those at termination.
| | • | | Credit default swaps — Credit default swaps are entered into to manage exposure to the market or certain sectors of the market, to reduce risk exposure to defaults of corporate and/or sovereign issuers or to create exposure to corporate and/or sovereign issuers to which a fund is not otherwise exposed (credit risk). |
The Fund may either buy or sell (write) credit default swaps on single-name issuers (corporate or sovereign), a combination or basket of single-name issuers or traded indexes. Credit default swaps are agreements in which the protection buyer pays fixed periodic payments to the seller in consideration for a promise from the protection seller to make a specific payment should a negative credit event take place with respect to the referenced entity (e.g., bankruptcy, failure to pay, obligation acceleration, repudiation, moratorium or restructuring). As a buyer, if an underlying credit event occurs, the Fund will either (i) receive from the seller an amount equal to the notional amount of the swap and deliver the referenced security or underlying securities comprising the index, or (ii) receive a net settlement of cash equal to the notional amount of the swap less the recovery value of the security or underlying securities comprising the index. As a seller (writer), if an underlying credit event occurs, the Fund will either pay the buyer an amount equal to the notional amount of the swap and take delivery of the referenced security or underlying securities comprising the index or pay a net settlement of cash equal to the notional amount of the swap less the recovery value of the security or underlying securities comprising the index.
| | • | | Interest rate swaps — Interest rate swaps are entered into to gain or reduce exposure to interest rates or to manage duration, the yield curve or interest rate (interest rate risk). |
Interest rate swaps are agreements in which one party pays a stream of interest payments, either fixed or floating, in exchange for another party’s stream of interest payments, either fixed or floating, on the same notional amount for a specified period of time. In more complex interest rate swaps, the notional principal amount may decline (or amortize) over time.
| | • | | Forward swaps — The Fund may enter into forward interest rate swaps and forward total return swaps. In a forward swap, the Fund and the counterparty agree to make periodic net payments beginning on a specified date or a net payment at termination. |
| | • | | Inflation swaps — Inflation swaps are entered into to gain or reduce exposure to inflation (inflation risk). In an inflation swap, one party makes fixed interest payments on a notional principal amount in exchange for another party’s variable payments based on an inflation index, such as the Consumer Price Index. |
Swap transactions involve, to varying degrees, elements of interest rate, credit and market risks in excess of the amounts recognized in the Statement of Assets and Liabilities. Such risks involve the possibility that there will be no liquid market for these agreements, that the counterparty to the agreements may default on its obligation to perform or disagree as to the meaning of the contractual terms in the agreements, and that there may be unfavorable changes in interest rates and/or market values associated with these transactions.
Master Netting Arrangements: In order to define its contractual rights and to secure rights that will help it mitigate its counterparty risk, the Fund may enter into an International Swaps and Derivatives Association, Inc. Master Agreement (“ISDA Master Agreement”) or similar agreement with its counterparties. An ISDA Master Agreement is a bilateral agreement between a Fund and a counterparty that governs certain OTC derivatives and typically contains, among other things, collateral posting terms and netting provisions in the event of a default and/or termination event. Under an ISDA Master Agreement, a Fund may, under certain circumstances, offset with the counterparty certain derivative financial instruments’ payables and/or receivables with collateral held and/or posted and create one single net payment. The provisions of the ISDA Master Agreement typically permit a single net payment in the event of default including the bankruptcy or insolvency of the counterparty. However, bankruptcy or insolvency laws of a particular jurisdiction may impose restrictions on or prohibitions against the right of offset in bankruptcy, insolvency or other events.
Collateral Requirements: For derivatives traded under an ISDA Master Agreement, the collateral requirements are typically calculated by netting the mark-to-market amount for each transaction under such agreement and comparing that amount to the value of any collateral currently pledged by the Fund and the counterparty.
Cash collateral that has been pledged to cover obligations of the Fund and cash collateral received from the counterparty, if any, is reported separately in the Statement of Assets and Liabilities as cash pledged as collateral and cash received as collateral, respectively. Non-cash collateral pledged by the Fund, if any, is noted in the Schedule of Investments. Generally, the amount of collateral due from or to a counterparty is subject to a certain minimum transfer amount threshold before a transfer is required, which is determined at the close of business of the Fund. Any additional required collateral is delivered to/pledged by the Fund on the next business day. Typically, the counterparty is not permitted to sell, re-pledge or use cash and non-cash collateral it receives. The Fund generally agrees not to use non-cash collateral that it receives but may, absent default or certain other circumstances defined in the underlying ISDA Master Agreement, be permitted to use cash collateral received. In such cases, interest may be paid pursuant to the collateral arrangement with the counterparty. To the extent amounts due to the Fund from the counterparties are not fully collateralized, the Fund bears the risk of loss from counterparty non-performance. Likewise, to the extent the Fund has delivered collateral to a counterparty and stands ready to perform under the terms of its agreement with such counterparty, the Fund bears the risk of loss from a counterparty in the amount of the value of the collateral in the event the counterparty fails to return such collateral. Based on the terms of agreements, collateral may not be required for all derivative contracts.
| | |
| 34 | | 2 0 2 3 BLACK ROCK ANNUAL REPORT TO SHAREHOLDERS |
Notes to Financial Statements (continued)
For financial reporting purposes, the Fund does not offset derivative assets and derivative liabilities that are subject to netting arrangements, if any, in the Statement of Assets and Liabilities.
| 6. | INVESTMENT ADVISORY AGREEMENT AND OTHER TRANSACTIONS WITH AFFILIATES |
Investment Advisory: The Trust, on behalf of the Fund, entered into an Investment Advisory Agreement with the Manager, the Fund’s investment adviser and an indirect, wholly-owned subsidiary of BlackRock, Inc. (“BlackRock”), to provide investment advisory services. The Manager is responsible for the management of the Fund’s portfolio and provides the personnel, facilities, equipment and certain other services necessary to the operations of the Fund.
For such services, the Fund pays the Manager a monthly fee at an annual rate equal to the following percentages of the average daily value of the Fund’s net assets:
| | | | |
| | |
| Average Daily Net Assets | | Investment
Advisory Fees | |
| |
First $1 billion | | | 0.23 | % |
$1 billion — $3 billion | | | 0.22 | |
$3 billion — $5 billion | | | 0.21 | |
$5 billion — $10 billion | | | 0.20 | |
Greater than $10 billion | | | 0.20 | |
The Manager entered into a sub-advisory agreement with BlackRock International Limited (“BIL”), an affiliate of the Manager. The Manager pays BIL for services it provides for that portion of the Fund for which BIL acts as sub-adviser a monthly fee that is equal to a percentage of the investment advisory fees paid by the Fund to the Manager.
Service and Distribution Fees: The Trust, on behalf of the Fund, entered into a Distribution Agreement and a Distribution and Service Plan with BlackRock Investments, LLC (“BRIL”), an affiliate of the Manager. Pursuant to the Distribution and Service Plan and in accordance with Rule 12b-1 under the 1940 Act, the Fund pays BRIL ongoing service and distribution fees. The fees are accrued daily and paid monthly at annual rates based upon the average daily net assets of the relevant share class of the Fund as follows:
| | | | | | | | |
| | | |
| Share Class | | Service Fees | | | Distribution Fees | |
| | |
Investor A | | | 0.25 | % | | | N/A | |
Investor C | | | 0.25 | | | | 0.75 | % |
BRIL and broker-dealers, pursuant to sub-agreements with BRIL, provide shareholder servicing and distribution services to the Fund. The ongoing service and/or distribution fee compensates BRIL and each broker-dealer for providing shareholder servicing and/or distribution related services to shareholders.
For the year ended May 31, 2023, the following table shows the class specific service and distribution fees borne directly by each share class of the Fund:
| | | | | | | | | | | | |
| |
| | | |
| | | Investor A | | | Investor C | | | Total | |
| |
| | | |
Service and distribution fees — class specific | | $ | 8,556 | | | $ | 1,242 | | | $ | 9,798 | |
| |
Administration: The Trust, on behalf of the Fund, entered into an Administration Agreement with the Manager, an indirect, wholly-owned subsidiary of BlackRock, to provide administrative services. For these services, the Manager receives an administration fee computed daily and payable monthly, based on a percentage of the average daily net assets of the Fund. The administration fee, which is shown as administration in the Statement of Operations, is paid at the annual rates below.
| | | | |
| | |
| Average Daily Net Assets | | Administration Fees | |
| |
First $500 million | | | 0.0425 | % |
$500 million — $1 billion | | | 0.0400 | |
$1 billion — $2 billion | | | 0.0375 | |
$2 billion — $4 billion | | | 0.0350 | |
$4 billion — $13 billion | | | 0.0325 | |
Greater than $13 billion | | | 0.0300 | |
In addition, the Manager charges each of the share classes an administration fee, which is shown as administration – class specific in the Statement of Operations, at an annual rate of 0.02% of the average daily net assets of each respective class.
For the year ended May 31, 2023, the following table shows the class specific administration fees borne directly by each share class of the Fund:
| | | | | | | | | | | | | | | | | | | | |
| |
| | | | | |
| | | Institutional | | | Investor A | | | Investor C | | | Class K | | | Total | |
| |
| | | | | |
Administration fees — class specific | | $ | 10,630 | | | $ | 685 | | | $ | 25 | | | $ | 762 | | | $ | 12,102 | |
| |
Transfer Agent: Pursuant to written agreements, certain financial intermediaries, some of which may be affiliates, provide the Fund with sub-accounting, recordkeeping, sub-transfer agency and other administrative services with respect to servicing of underlying investor accounts. For these services, these entities receive an asset-based fee or an annual fee per shareholder account, which will vary depending on share class and/or net assets. For the year ended May 31, 2023, the Fund did not pay any amounts to affiliates in return for these services.
| | |
NOTES TO FINANCIAL STATEMENTS | | 35 |
Notes to Financial Statements (continued)
The Manager maintains a call center that is responsible for providing certain shareholder services to the Fund. Shareholder services include responding to inquiries and processing purchases and sales based upon instructions from shareholders. For the year ended May 31, 2023, the Fund reimbursed the Manager the following amounts for costs incurred in running the call center, which are included in transfer agent — class specific in the Statement of Operations:
| | | | | | | | | | | | | | | | | | | | |
| |
| | | | | |
| | | Institutional | | | Investor A | | | Investor C | | | Class K | | | Total | |
| |
| | | | | |
Reimbursed amounts | | $ | 131 | | | $ | 218 | | | $ | 197 | | | $ | 47 | | | $ | 593 | |
| |
For the year ended May 31, 2023, the following table shows the class specific transfer agent fees borne directly by each share class of the Fund:
| | | | | | | | | | | | | | | | | | | | |
| |
| | | | | |
| | | Institutional | | | Investor A | | | Investor C | | | Class K | | | Total | |
| |
| | | | | |
Transfer agent fees — class specific | | $ | 41,294 | | | $ | 5,670 | | | $ | 530 | | | $ | 491 | | | $ | 47,985 | |
| |
Other Fees: For the year ended May 31, 2023, affiliates earned underwriting discounts, direct commissions and dealer concessions on sales of the Fund’s Investor A Shares for a total of $163.
Expense Limitations, Waivers, Reimbursements, and Recoupments: The Manager contractually agreed to waive its investment advisory fees by the amount of investment advisory fees the Fund pays to the Manager indirectly through its investment in affiliated money market funds (the “affiliated money market fund waiver”) through June 30, 2024. The contractual agreement may be terminated upon 90 days’ notice by a majority of the Independent Trustees, or by a vote of a majority of the outstanding voting securities of the Fund. The amount of waivers and/or reimbursements of fees and expenses made pursuant to the expense limitation described below will be reduced by the amount of the affiliated money market fund waiver. This amount is included in fees waived and/or reimbursed by the Manager in the Statement of Operations. For the year ended May 31, 2023, the amount waived was $2,804.
The Manager has contractually agreed to waive its investment advisory fee with respect to any portion of the Fund’s assets invested in affiliated equity and fixed-income mutual funds and affiliated exchange-traded funds that have a contractual management fee through June 30, 2024. The contractual agreement may be terminated upon 90 days’ notice by a majority of the Independent Trustees, or by a vote of a majority of the outstanding voting securities of the Fund. For the year ended May 31, 2023, there were no fees waived by the Manager pursuant to this arrangement.
The Manager contractually agreed to waive and/or reimburse fees or expenses in order to limit expenses, excluding interest expense, dividend expense, acquired fund fees and expenses, and certain other fund expenses, which constitute extraordinary expenses not incurred in the ordinary course of the Fund’s business (“expense limitation”). The expense limitations as a percentage of average daily net assets are as follows:
| | | | |
| | |
| Share Class | | Expense Limitation | |
| |
Institutional | | | 0.28 | % |
Investor A | | | 0.53 | |
Investor C | | | 1.28 | |
Class K | | | 0.23 | |
The Manager has agreed not to reduce or discontinue the contractual expense limitations through June 30, 2024, unless approved by the Board, including a majority of the Independent Trustees, or by a vote of a majority of the outstanding voting securities of the Fund. For the year ended May 31, 2023, amounts included in the Statement of Operations were as follows:
| | | | |
| |
| |
Fees waived and/or reimbursed by the Manager | | $ | 407,987 | |
| |
| | | | |
| |
| |
Administration fees waived | | $ | 25,716 | |
| |
In addition, these amounts waived and/or reimbursed by the Manager are included in administration fees waived by the Manager- class specific and transfer agent fees waived and/or reimbursed by the Manager - class specific, respectively, in the Statement of Operations. For the year ended May 31, 2023, class specific expense waivers and/or reimbursements were as follows:
| | | | | | | | | | | | | | | | | | | | |
| |
| | | | | |
| | | Institutional | | | Investor A | | | Investor C | | | Class K | | | Total | |
| |
| | | | | |
Administration fees waived by the Manager — class specific | | $ | 10,630 | | | $ | 685 | | | $ | 25 | | | $ | 762 | | | $ | 12,102 | |
| |
| | | | | | | | | | | | | | | | | | | | |
| |
| | | | | |
| | | Institutional | | | Investor A | | | Investor C | | | Class K | | | Total | |
| |
| | | | | |
Transfer agent fees waived and/or reimbursed by the Manager — class specific | | $ | 14,720 | | | $ | 3,958 | | | $ | 467 | | | $ | 490 | | | $ | 19,635 | |
| |
With respect to the contractual expense limitation, if during the Fund’s fiscal year the operating expenses of a share class, that at any time during the prior two fiscal years received a waiver and/or reimbursement from the Manager, are less than the current expense limitation for that share class, the Manager is entitled to be reimbursed by such share class up to the lesser of: (a) the amount of fees waived and/or expenses reimbursed during those prior two fiscal years under the agreement and (b) an amount not to exceed either the current expense limitation of that share class or the expense limitation of the share class in effect at the time that the share class received the applicable waiver and/or reimbursement, provided that:
(1) the Fund, of which the share class is a part, has more than $50 million in assets for the fiscal year, and
(2) the Manager or an affiliate continues to serve as the Fund’s investment adviser or administrator.
| | |
| 36 | | 2 0 2 3 BLACK ROCK ANNUAL REPORT TO SHAREHOLDERS |
Notes to Financial Statements (continued)
This repayment applies only to the contractual expense limitation on net expenses and does not apply to the contractual investment advisory fee waiver described above or any voluntary waivers that may be in effect from time to time. Effective August 23, 2023, the repayment arrangement between the Fund and the Manager pursuant to which such Fund may be required to repay amounts waived and/or reimbursed under the Fund’s contractual caps on net expenses will be terminated.
As of May 31, 2023, the fund level and class specific waivers and/or reimbursements subject to possible future recoupment under the expense limitation agreement are as follows:
| | | | |
| |
| |
| | | Expiring | |
| | | | |
| |
| Fund Name/Fund Level/Share Class | | 08/23/23 | |
| |
| |
BlackRock Sustainable Advantage CoreAlpha Bond Fund | | | | |
Fund Level | | $ | 867,148 | |
Institutional | | | 47,258 | |
Investor A | | | 12,658 | |
Investor C | | | 1,011 | |
Class K | | | 2,290 | |
| |
The following fund level and class specific waivers and/or reimbursements previously recorded by the Fund, which were subject to recoupment by the Manager, expired on May 31, 2023:
| | | | |
| |
| |
| Fund Name/Fund Level/Share Class | | Expired
05/31/23 | |
| |
| |
BlackRock Sustainable Advantage CoreAlpha Bond Fund | | | | |
Fund Level | | $ | 416,368 | |
Institutional | | | 13,574 | |
Investor A | | | 4,815 | |
Investor C | | | 310 | |
Class K | | | 372 | |
| |
Interfund Lending: In accordance with an exemptive order (the “Order”) from the U.S. Securities and Exchange Commission (“SEC”), the Fund may participate in a joint lending and borrowing facility for temporary purposes (the “Interfund Lending Program”), subject to compliance with the terms and conditions of the Order, and to the extent permitted by the Fund’s investment policies and restrictions. The Fund is currently permitted to borrow and lend under the Interfund Lending Program.
A lending BlackRock fund may lend in aggregate up to 15% of its net assets but may not lend more than 5% of its net assets to any one borrowing fund through the Interfund Lending Program. A borrowing BlackRock fund may not borrow through the Interfund Lending Program or from any other source more than 33 1/3% of its total assets (or any lower threshold provided for by the fund’s investment restrictions). If a borrowing BlackRock fund’s total outstanding borrowings exceed 10% of its total assets, each of its outstanding interfund loans will be subject to collateralization of at least 102% of the outstanding principal value of the loan. All interfund loans are for temporary or emergency purposes and the interest rate to be charged will be the average of the highest current overnight repurchase agreement rate available to a lending fund and the bank loan rate, as calculated according to a formula established by the Board.
During the year ended May 31, 2023, the Fund did not participate in the Interfund Lending Program.
Trustees and Officers: Certain trustees and/or officers of the Trust are directors and/or officers of BlackRock or its affiliates. The Fund reimburses the Manager for a portion of the compensation paid to the Trust’s Chief Compliance Officer, which is included in Trustees and Officer in the Statement of Operations.
For the year ended May 31, 2023, purchases and sales of investments, including paydowns/payups and mortgage dollar rolls and excluding short-term securities, were as follows:
| | | | | | | | | | | | | | | | |
| |
| | |
| | | U.S. Government
Securities | | | Other Securities | |
| | | | |
| | | | |
| Fund Name | | Purchases | | | Sales | | | Purchases | | | Sales | |
| |
| | | | |
BlackRock Sustainable Advantage CoreAlpha Bond Fund | | $ | 860,289 | | | $ | 5,531,050 | | | $ | 218,361,531 | | | $ | 224,489,520 | |
| |
For the year ended May 31, 2023, purchases and sales related to mortgage dollar rolls were $107,078,985 and $107,120,529, respectively.
It is the Fund’s policy to comply with the requirements of the Internal Revenue Code of 1986, as amended, applicable to regulated investment companies, and to distribute substantially all of its taxable income to its shareholders. Therefore, no U.S. federal income tax provision is required.
The Fund files U.S. federal and various state and local tax returns. No income tax returns are currently under examination. The statute of limitations on the Fund’s U.S. federal tax returns generally remains open for a period of three years after they are filed. The statutes of limitations on the Fund’s state and local tax returns may remain open for an additional year depending upon the jurisdiction.
| | |
NOTES TO FINANCIAL STATEMENTS | | 37 |
Notes to Financial Statements (continued)
Management has analyzed tax laws and regulations and their application to the Fund as of May 31, 2023, inclusive of the open tax return years, and does not believe that there are any uncertain tax positions that require recognition of a tax liability in the Fund’s financial statements.
The tax character of distributions paid was as follows:
| | | | | | | | |
| |
| | |
| Fund Name | | Year Ended
05/31/23 | | | Year Ended
05/31/22 | |
| |
| | |
BlackRock Sustainable Advantage CoreAlpha Bond Fund | | | | | | | | |
Ordinary income | | $ | 1,130,259 | | | $ | 880,365 | |
Long-term capital gains | | | — | | | | 360,939 | |
Return of capital | | | 474,328 | | | | 279,009 | |
| | | | | | | | |
| | |
| | $ | 1,604,587 | | | $ | 1,520,313 | |
| | | | | | | | |
As of May 31, 2023, the tax components of accumulated earnings (loss) were as follows:
| | | | | | | | | | | | |
| |
| | | |
| Fund Name | | Non-Expiring
Capital Loss
Carryforwards(a) | | | Net Unrealized
Gains (Losses)(b) | | | Total | |
| |
| | | |
BlackRock Sustainable Advantage CoreAlpha Bond Fund | | $ | (6,548,134 | ) | | $ | (4,397,702 | ) | | $ | (10,945,836) | |
| |
| | (a) | Amounts available to offset future realized capital gains. | |
| | (b) | The difference between book-basis and tax-basis net unrealized gains was attributable primarily to the realization for tax purposes of unrealized gains(losses) on certain foreign currency contracts, the realization for tax purposes of unrealized gains(losses) on certain futures contracts, accounting for swap agreements and amortization methods for premiums on fixed income securities. | |
As of May 31, 2023, gross unrealized appreciation and depreciation based on cost of investments (including short positions and derivatives, if any) for U.S. federal income tax purposes were as follows:
| | | | | | | | | | | | | | | | |
| |
| | | | |
| Fund Name | | Tax Cost | | | Gross Unrealized
Appreciation | | | Gross Unrealized
Depreciation | | | Net Unrealized
Appreciation
(Depreciation) | |
| |
| | | | |
BlackRock Sustainable Advantage CoreAlpha Bond Fund | | $ | 62,812,723 | | | $ | 507,716 | | | $ | (4,902,534 | ) | | $ | (4,394,818 | ) |
| |
The Trust, on behalf of the Fund, along with certain other funds managed by the Manager and its affiliates (“Participating Funds”), is party to a 364-day, $2.50 billion credit agreement with a group of lenders. Under this agreement, the Fund may borrow to fund shareholder redemptions. Excluding commitments designated for certain individual funds, the Participating Funds, including the Fund, can borrow up to an aggregate commitment amount of $1.75 billion at any time outstanding, subject to asset coverage and other limitations as specified in the agreement. The credit agreement has the following terms: a fee of 0.10% per annum on unused commitment amounts and interest at a rate equal to the higher of (a) Overnight Bank Funding Rate (“OBFR”) (but, in any event, not less than 0.00%) on the date the loan is made plus 0.80% per annum, (b) the Fed Funds rate (but, in any event, not less than 0.00%) in effect from time to time plus 0.80% per annum on amounts borrowed or (c) the sum of (x) Daily Simple Secured Overnight Financing Rate (“SOFR”) (but, in any event, not less than 0.00%) on the date the loan is made plus 0.10% and (y) 0.80% per annum. The agreement expires in April 2024 unless extended or renewed. These fees were allocated among such funds based upon portions of the aggregate commitment available to them and relative net assets of Participating Funds. During the year ended May 31, 2023, the Fund did not borrow under the credit agreement.
In the normal course of business, the Fund invests in securities or other instruments and may enter into certain transactions, and such activities subject the Fund to various risks, including among others, fluctuations in the market (market risk) or failure of an issuer to meet all of its obligations. The value of securities or other instruments may also be affected by various factors, including, without limitation: (i) the general economy; (ii) the overall market as well as local, regional or global political and/or social instability; (iii) regulation, taxation or international tax treaties between various countries; or (iv) currency, interest rate and price fluctuations. Local, regional or global events such as war, acts of terrorism, the spread of infectious illness or other public health issues, recessions, or other events could have a significant impact on the Fund and its investments. The Fund’s prospectus provides details of the risks to which the Fund is subject.
Market Risk: The Fund may be exposed to prepayment risk, which is the risk that borrowers may exercise their option to prepay principal earlier than scheduled during periods of declining interest rates, which would force the Fund to reinvest in lower yielding securities. The Fund may also be exposed to reinvestment risk, which is the risk that income from the Fund’s portfolio will decline if the Fund invests the proceeds from matured, traded or called fixed-income securities at market interest rates that are below the Fund portfolio’s current earnings rate.
Municipal securities are subject to the risk that litigation, legislation or other political events, local business or economic conditions, credit rating downgrades, or the bankruptcy of the issuer could have a significant effect on an issuer’s ability to make payments of principal and/or interest or otherwise affect the value of such securities. Municipal securities can be significantly affected by political or economic changes, including changes made in the law after issuance of the securities, as well as uncertainties in the municipal market related to, taxation, legislative changes or the rights of municipal security holders, including in connection with an issuer insolvency. Municipal securities backed by current or anticipated revenues from a specific project or specific assets can be negatively affected by the discontinuance of the tax benefits supporting the project or assets or the inability to collect revenues for the project or from the assets. Municipal securities may be less liquid than taxable bonds, and there may be less publicly available information on the financial condition of municipal security issuers than for issuers of other securities.
| | |
| 38 | | 2 0 2 3 BLACK ROCK ANNUAL REPORT TO SHAREHOLDERS |
Notes to Financial Statements (continued)
Infectious Illness Risk: An outbreak of an infectious illness, such as the COVID-19 pandemic, may adversely impact the economies of many nations and the global economy, and may impact individual issuers and capital markets in ways that cannot be foreseen. An infectious illness outbreak may result in, among other things, closed international borders, prolonged quarantines, supply chain disruptions, market volatility or disruptions and other significant economic, social and political impacts.
Counterparty Credit Risk: The Fund may be exposed to counterparty credit risk, or the risk that an entity may fail to or be unable to perform on its commitments related to unsettled or open transactions, including making timely interest and/or principal payments or otherwise honoring its obligations. The Fund manages counterparty credit risk by entering into transactions only with counterparties that the Manager believes have the financial resources to honor their obligations and by monitoring the financial stability of those counterparties. Financial assets, which potentially expose the Fund to market, issuer and counterparty credit risks, consist principally of financial instruments and receivables due from counterparties. The extent of the Fund’s exposure to market, issuer and counterparty credit risks with respect to these financial assets is approximately their value recorded in the Statement of Assets and Liabilities, less any collateral held by the Fund.
A derivative contract may suffer a mark-to-market loss if the value of the contract decreases due to an unfavorable change in the market rates or values of the underlying instrument. Losses can also occur if the counterparty does not perform under the contract.
With exchange-traded futures and centrally cleared swaps, there is less counterparty credit risk to the Fund since the exchange or clearinghouse, as counterparty to such instruments, guarantees against a possible default. The clearinghouse stands between the buyer and the seller of the contract; therefore, credit risk is limited to failure of the clearinghouse. While offset rights may exist under applicable law, the Fund does not have a contractual right of offset against a clearing broker or clearinghouse in the event of a default (including the bankruptcy or insolvency). Additionally, credit risk exists in exchange-traded futures and centrally cleared swaps with respect to initial and variation margin that is held in a clearing broker’s customer accounts. While clearing brokers are required to segregate customer margin from their own assets, in the event that a clearing broker becomes insolvent or goes into bankruptcy and at that time there is a shortfall in the aggregate amount of margin held by the clearing broker for all its clients, typically the shortfall would be allocated on a pro rata basis across all the clearing broker’s customers, potentially resulting in losses to the Fund.
Concentration Risk: A diversified portfolio, where this is appropriate and consistent with a fund’s objectives, minimizes the risk that a price change of a particular investment will have a material impact on the NAV of a fund. The investment concentrations within the Fund’s portfolio are disclosed in its Schedule of Investments.
The Fund invests a significant portion of its assets in fixed-income securities and/or uses derivatives tied to the fixed-income markets. Changes in market interest rates or economic conditions may affect the value and/or liquidity of such investments. Interest rate risk is the risk that prices of bonds and other fixed-income securities will decrease as interest rates rise and increase as interest rates fall. The Fund may be subject to a greater risk of rising interest rates due to the recent period of historically low interest rates. The Federal Reserve has recently begun to raise the federal funds rate as part of its efforts to address inflation. There is a risk that interest rates will continue to rise, which will likely drive down the prices of bonds and other fixed-income securities, and could negatively impact the Fund’s performance.
The Fund invests a significant portion of its assets in securities of issuers located in the United States. A decrease in imports or exports, changes in trade regulations, inflation and/or an economic recession in the United States may have a material adverse effect on the U.S. economy and the securities listed on U.S. exchanges. Proposed and adopted policy and legislative changes in the United States may also have a significant effect on U.S. markets generally, as well as on the value of certain securities. Governmental agencies project that the United States will continue to maintain elevated public debt levels for the foreseeable future which may constrain future economic growth. Circumstances could arise that could prevent the timely payment of interest or principal on U.S. government debt, such as reaching the legislative “debt ceiling.” Such non-payment would result in substantial negative consequences for the U.S. economy and the global financial system. If U.S. relations with certain countries deteriorate, it could adversely affect issuers that rely on the United States for trade. The United States has also experienced increased internal unrest and discord. If these trends were to continue, they may have an adverse impact on the U.S. economy and the issuers in which the Fund invests.
The Fund invests a significant portion of its assets in securities backed by commercial or residential mortgage loans or in issuers that hold mortgage and other asset-backed securities. When a Fund concentrates its investments in this manner, it assumes a greater risk of prepayment or payment extension by securities issuers. Changes in economic conditions, including delinquencies and/or defaults on assets underlying these securities, can affect the value, income and/or liquidity of such positions. Investment percentages in these securities are presented in the Schedule of Investments.
Significant Shareholder Redemption Risk: Certain shareholders may own or manage a substantial amount of fund shares and/or hold their fund investments for a limited period of time. Large redemptions of fund shares by these shareholders may force a fund to sell portfolio securities, which may negatively impact the fund’s NAV, increase the fund’s brokerage costs, and/or accelerate the realization of taxable income/gains and cause the fund to make additional taxable distributions to shareholders.
LIBOR Transition Risk:The Fund may be exposed to financial instruments that are tied to the London Interbank Offered Rate (“LIBOR”) to determine payment obligations, financing terms, hedging strategies or investment value. The United Kingdom’s Financial Conduct Authority, which regulates LIBOR, announced that a majority of USD LIBOR settings will no longer be published after June 30, 2023. All other LIBOR settings and certain other interbank offered rates ceased to be published after December 31, 2021. SOFR has been used increasingly on a voluntary basis in new instruments and transactions. The Federal Reserve Board adopted regulations that provide a fallback mechanism by identifying benchmark rates based on SOFR that will replace LIBOR in certain financial contracts after June 30, 2023. The ultimate effect of the LIBOR transition process on the Fund is uncertain.
| | |
NOTES TO FINANCIAL STATEMENTS | | 39 |
Notes to Financial Statements (continued)
| 11. | CAPITAL SHARE TRANSACTIONS |
Transactions in capital shares for each class were as follows:
| | | | | | | | | | | | | | | | |
| |
| | |
| | | Year Ended 05/31/23 | | | Year Ended 05/31/22 | |
| | | | | | | | |
| | | | |
| Fund Name / Share Class | | Shares | | | Amounts | | | Shares | | | Amounts | |
| |
| | | | |
BlackRock Sustainable Advantage CoreAlpha Bond Fund | | | | | | | | | | | | | | | | |
Institutional | | | | | | | | | | | | | | | | |
Shares sold | | | 1,907,806 | | | $ | 16,681,544 | | | | 2,956,406 | | | $ | 29,643,929 | |
Shares issued in reinvestment of distributions | | | 123,490 | | | | 1,071,939 | | | | 91,424 | | | | 910,884 | |
Shares redeemed | | | (2,946,281 | ) | | | (25,431,104 | ) | | | (1,854,682 | ) | | | (18,247,226 | ) |
| | | | | | | | | | | | | | | | |
| | | | |
| | | (914,985 | ) | | $ | (7,677,621 | ) | | | 1,193,148 | | | $ | 12,307,587 | |
| | | | | | | | | | | | | | | | |
| | | | |
Investor A | | | | | | | | | | | | | | | | |
Shares sold and automatic conversion of shares | | | 55,205 | | | $ | 476,810 | | | | 294,488 | | | $ | 2,962,320 | |
Shares issued in reinvestment of distributions | | | 8,992 | | | | 78,186 | | | | 12,650 | | | | 126,668 | |
Shares redeemed | | | (403,149 | ) | | | (3,526,436 | ) | | | (328,192 | ) | | | (3,192,705 | ) |
| | | | | | | | | | | | | | | | |
| | | | |
| | | (338,952 | ) | | $ | (2,971,440 | ) | | | (21,054 | ) | | $ | (103,717 | ) |
| | | | | | | | | | | | | | | | |
| | | | |
Investor C | | | | | | | | | | | | | | | | |
Shares sold | | | 4,227 | | | $ | 37,032 | | | | 3,215 | | | $ | 32,121 | |
Shares issued in reinvestment of distributions | | | 155 | | | | 1,343 | | | | 102 | | | | 1,022 | |
Shares redeemed and automatic conversion of shares | | | (3,068 | ) | | | (26,534 | ) | | | (1,361 | ) | | | (12,883 | ) |
| | | | | | | | | | | | | | | | |
| | | | |
| | | 1,314 | | | $ | 11,841 | | | | 1,956 | | | $ | 20,260 | |
| | | | | | | | | | | | | | | | |
| | | | |
Class K | | | | | | | | | | | | | | | | |
Shares sold | | | 410,345 | | | $ | 3,593,197 | | | | 184,976 | | | $ | 1,833,326 | |
Shares issued in reinvestment of distributions | | | 12,258 | | | | 106,471 | | | | 4,566 | | | | 45,324 | |
Shares redeemed | | | (123,666 | ) | | | (1,084,023 | ) | | | (60,387 | ) | | | (582,169 | ) |
| | | | | | | | | | | | | | | | |
| | | | |
| | | 298,937 | | | $ | 2,615,645 | | | | 129,155 | | | $ | 1,296,481 | |
| | | | | | | | | | | | | | | | |
| | | | |
| | | (953,686 | ) | | $ | (8,021,575 | ) | | | 1,303,205 | | | $ | 13,520,611 | |
| | | | | | | | | | | | | | | | |
As of May 31, 2023, shares owned by BlackRock HoldCo 2, Inc., an affiliate of the Fund, were as follows:
| | | | | | | | |
| |
| | |
| Fund Name | | Institutional | | | Investor C | |
| |
| | |
BlackRock Sustainable Advantage CoreAlpha Bond Fund | | | 1,065,743 | | | | 5,000 | |
| |
Management has evaluated the impact of all subsequent events on the Fund through the date the financial statements were issued and has determined that there were no subsequent events requiring adjustment or additional disclosure in the financial statements.
| | |
| 40 | | 2 0 2 3 BLACK ROCK ANNUAL REPORT TO SHAREHOLDERS |
Report of Independent Registered Public Accounting Firm
To the Shareholders of BlackRock Sustainable Advantage CoreAlpha Bond Fund and the Board of Trustees of BlackRock Funds IV:
Opinion on the Financial Statements and Financial Highlights
We have audited the accompanying statement of assets and liabilities of BlackRock Sustainable Advantage CoreAlpha Bond Fund of BlackRock Funds IV (the “Fund”), including the schedule of investments, as of May 31, 2023, the related statement of operations for the year then ended, the statements of changes in net assets for each of the two years in the period then ended, the financial highlights for each of the five years in the period then ended, and the related notes. In our opinion, the financial statements and financial highlights present fairly, in all material respects, the financial position of the Fund as of May 31, 2023, and the results of its operations for the year then ended, the changes in its net assets for each of the two years in the period then ended, and the financial highlights for each of the five years in the period then ended, in conformity with accounting principles generally accepted in the United States of America.
Basis for Opinion
These financial statements and financial highlights are the responsibility of the Fund’s management. Our responsibility is to express an opinion on the Fund’s financial statements and financial highlights based on our audits. We are a public accounting firm registered with the Public Company Accounting Oversight Board (United States) (PCAOB) and are required to be independent with respect to the Fund in accordance with the U.S. federal securities laws and the applicable rules and regulations of the Securities and Exchange Commission and the PCAOB.
We conducted our audits in accordance with the standards of the PCAOB. Those standards require that we plan and perform the audit to obtain reasonable assurance about whether the financial statements and financial highlights are free of material misstatement, whether due to error or fraud. The Fund is not required to have, nor were we engaged to perform, an audit of its internal control over financial reporting. As part of our audits we are required to obtain an understanding of internal control over financial reporting but not for the purpose of expressing an opinion on the effectiveness of the Fund’s internal control over financial reporting. Accordingly, we express no such opinion.
Our audits included performing procedures to assess the risks of material misstatement of the financial statements and financial highlights, whether due to error or fraud, and performing procedures that respond to those risks. Such procedures included examining, on a test basis, evidence regarding the amounts and disclosures in the financial statements and financial highlights. Our audits also included evaluating the accounting principles used and significant estimates made by management, as well as evaluating the overall presentation of the financial statements and financial highlights. Our procedures included confirmation of securities owned as of May 31, 2023, by correspondence with custodians or counterparties; when replies were not received, we performed other auditing procedures. We believe that our audits provide a reasonable basis for our opinion.
Deloitte & Touche LLP
Boston, Massachusetts
July 21, 2023
We have served as the auditor of one or more BlackRock investment companies since 1992.
| | |
REPORT OF INDEPENDENT REGISTERED PUBLIC ACCOUNTING FIRM | | 41 |
| | |
| Important Tax Information (unaudited) | | |
The Fund hereby designates the following amount, or maximum amount allowable by law, of distributions from direct federal obligation interest for the fiscal year ended May 31, 2023:
| | | | |
| |
| |
| Fund Name | | Federal Obligation
Interest | |
| |
| |
BlackRock Sustainable Advantage CoreAlpha Bond Fund | | $ | 358,710 | |
| |
The law varies in each state as to whether and what percent of ordinary income dividends attributable to federal obligations is exempt from state income tax. Shareholders are advised to check with their tax advisers to determine if any portion of the dividends received is exempt from state income tax.
The Fund hereby designates the following amount, or maximum amount allowable by law, as interest income eligible to be treated as a Section 163(j) interest dividend for the fiscal year ended May 31, 2023:
| | | | |
| |
| |
| Fund Name | | Interest Dividends | |
| |
| |
BlackRock Sustainable Advantage CoreAlpha Bond Fund | | $ | 1,159,251 | |
| |
The Fund hereby designates the following amounts, or maximum amounts allowable by law, as interest-related dividends eligible for exemption from U.S. withholding tax for nonresident aliens and foreign corporations for the fiscal year ended May 31, 2023:
| | | | |
| |
| |
| Fund Name | | Interest
Related
Dividends | |
| |
| |
BlackRock Sustainable Advantage CoreAlpha Bond Fund | | $ | 1,159,251 | |
| |
| | |
| 42 | | 2 0 2 3 BLACK ROCK ANNUAL REPORT TO SHAREHOLDERS |
Trustee and Officer Information
| | | | | | | | |
| | | | | Independent Trustees(a) | | | | |
| | | | | |
Name Year of Birth(b) | | Position(s) Held (Length of Service)(c) | | Principal Occupation(s) During Past 5 Years | | Number of BlackRock-Advised Registered Investment Companies (“RICs”) Consisting of Investment Portfolios (“Portfolios”) Overseen | | Public Company
and Other
Investment
Company
Directorships Held
During Past 5 Years |
| | | | |
R. Glenn Hubbard 1958 | | Chair of the Board (Since 2022) Trustee (Since 2019) | | Dean, Columbia Business School from 2004 to 2019; Faculty member, Columbia Business School since 1988. | | 70 RICs consisting of 101 Portfolios | | ADP (data and information services) from 2004 to 2020; Metropolitan Life Insurance Company (insurance); TotalEnergies SE (multi-energy) |
| | | | |
W. Carl Kester(d) 1951 | | Vice Chair of the Board (Since 2022) Trustee (Since 2019) | | Baker Foundation Professor and George Fisher Baker Jr. Professor of Business Administration, Emeritus, Harvard Business School since 2022; George Fisher Baker Jr. Professor of Business Administration, Harvard Business School from 2008 to 2022; Deputy Dean for Academic Affairs from 2006 to 2010; Chairman of the Finance Unit, from 2005 to 2006; Senior Associate Dean and Chairman of the MBA Program from 1999 to 2005; Member of the faculty of Harvard Business School since 1981. | | 72 RICs consisting of 103 Portfolios | | None |
| | | | |
Cynthia L. Egan 1955 | | Trustee (Since 2019) | | Advisor, U.S. Department of the Treasury from 2014 to 2015; President, Retirement Plan Services, for T. Rowe Price Group, Inc. from 2007 to 2012; executive positions within Fidelity Investments from 1989 to 2007. | | 70 RICs consisting of 101 Portfolios | | Unum (insurance); The Hanover Insurance Group (Board Chair); Huntsman Corporation (Lead Independent Director and non Executive Vice Chair of the Board) (chemical products) |
| | | | |
Frank J. Fabozzi(d) 1948 | | Trustee (Since 2019) | | Editor of The Journal of Portfolio Management since 1986; Professor of Finance, EDHEC Business School (France) from 2011 to 2022; Professor of Practice, Johns Hopkins University since 2021; Professor in the Practice of Finance, Yale University School of Management from 1994 to 2011 and currently a Teaching Fellow in Yale’s Executive Programs; Visiting Professor, Rutgers University for the Spring 2019 semester; Visiting Professor, New York University for the 2019 academic year; Adjunct Professor of Finance, Carnegie Mellon University in fall 2020 semester. | | 72 RICs consisting of 103 Portfolios | | None |
| | | | |
Lorenzo A. Flores 1964 | | Trustee (Since 2021) | | Vice Chairman, Kioxia, Inc. since 2019; Chief Financial Officer, Xilinx, Inc. from 2016 to 2019; Corporate Controller, Xilinx, Inc. from 2008 to 2016. | | 70 RICs consisting of 101 Portfolios | | None |
| | | | |
Stayce D. Harris 1959 | | Trustee (Since 2021) | | Lieutenant General, Inspector General, of the United States Air Force from 2017 to 2019; Lieutenant General, Assistant Vice Chief of Staff and Director, Air Staff, United States Air Force from 2016 to 2017; Major General, Commander, 22nd Air Force, AFRC, Dobbins Air Reserve Base, Georgia from 2014 to 2016; Pilot, United Airlines from 1990 to 2020. | | 70 RICs consisting of 101 Portfolios | | KULR Technology Group, Inc. in 2021; The Boeing Company (airplane manufacturer) |
| | |
TRUSTEE AND OFFICER INFORMATION | | 43 |
Trustee and Officer Information (continued)
| | | | | | | | |
| Independent Trustees(a) (continued) |
| | | | | |
Name Year of Birth(b) | | Position(s) Held (Length of Service)(c) | | Principal Occupation(s) During Past 5 Years | | Number of BlackRock-Advised Registered Investment Companies (“RICs”) Consisting of Investment Portfolios (“Portfolios”) Overseen | | Public Company
and Other
Investment
Company
Directorships Held
During Past 5 Years |
| | | | |
J. Phillip Holloman 1955 | | Trustee (Since 2021) | | President and Chief Operating Officer, Cintas Corporation from 2008 to 2018. | | 70 RICs consisting of 101 Portfolios | | PulteGroup, Inc. (home construction); Rockwell Automation Inc. (industrial automation) |
| | | | |
Catherine A. Lynch(d) 1961 | | Trustee (Since 2019) | | Chief Executive Officer, Chief Investment Officer and various other positions, National Railroad Retirement Investment Trust from 2003 to 2016; Associate Vice President for Treasury Management, The George Washington University from 1999 to 2003; Assistant Treasurer, Episcopal Church of America from 1995 to 1999. | | 72 RICs consisting of 103 Portfolios | | PennyMac Mortgage Investment Trust |
| | | | | | | | |
| Interested Trustees(a)(e) |
| | | | | |
Name Year of Birth(b) | | Position(s) Held (Length of Service)(c) | | Principal Occupation(s) During Past 5 Years | | Number of BlackRock-Advised Registered Investment Companies (“RICs”) Consisting of Investment Portfolios (“Portfolios”) Overseen | | Public Company
and Other
Investment
Company
Directorships Held During Past 5 Years |
| | | | |
Robert Fairbairn 1965 | | Trustee (Since 2018) | | Vice Chairman of BlackRock, Inc. since 2019; Member of BlackRock’s Global Executive and Global Operating Committees; Co-Chair of BlackRock’s Human Capital Committee; Senior Managing Director of BlackRock, Inc. from 2010 to 2019; oversaw BlackRock’s Strategic Partner Program and Strategic Product Management Group from 2012 to 2019; Member of the Board of Managers of BlackRock Investments, LLC from 2011 to 2018; Global Head of BlackRock’s Retail and iShares® businesses from 2012 to 2016. | | 98 RICs consisting of 268 Portfolios | | None |
| | | | |
John M. Perlowski(d) 1964 | | Trustee (Since 2015) President and Chief Executive Officer (Since 2010) | | Managing Director of BlackRock, Inc. since 2009; Head of BlackRock Global Accounting and Product Services since 2009; Advisory Director of Family Resource Network (charitable foundation) since 2009. | | 100 RICs consisting of 270 Portfolios | | None |
| (a) | The address of each Trustee is c/o BlackRock, Inc., 50 Hudson Yards, New York, NY 10001. |
| (b) | Each Independent Trustee holds office until his or her successor is duly elected and qualifies or until his or her earlier death, resignation, retirement or removal as provided by the Trust’s by-laws or charter or statute, or until December 31 of the year in which he or she turns 75. Trustees who are “interested persons,” as defined in the Investment Company Act serve until their successor is duly elected and qualifies or until their earlier death, resignation, retirement or removal as provided by the Trust’s by-laws or statute, or until December 31 of the year in which they turn 72. The Board may determine to extend the terms of Independent Trustees on a case-by-case basis, as appropriate. |
| (c) | Following the combination of Merrill Lynch Investment Managers, L.P. (“MLIM”) and BlackRock, Inc. in September 2006, the various legacy MLIM and legacy BlackRock fund boards were realigned and consolidated into three new fund boards in 2007. Certain Independent Trustees first became members of the boards of other legacy MLIM or legacy BlackRock funds as follows: Frank J. Fabozzi, 1988; R. Glenn Hubbard, 2004; and W. Carl Kester, 1995. Certain other Independent Trustees became members of the boards of the closed-end funds in the Fixed-Income Complex as follows: Cynthia L. Egan, 2016; and Catherine A. Lynch, 2016. |
| (d) | Dr. Fabozzi, Dr. Kester, Ms. Lynch and Mr. Perlowski are also trustees of the BlackRock Credit Strategies Fund and BlackRock Private Investments Fund. |
| (e) | Mr. Fairbairn and Mr. Perlowski are both “interested persons,” as defined in the 1940 Act, of the Trust based on their positions with BlackRock, Inc. and its affiliates. Mr. Fairbairn and Mr. Perlowski are also board members of the BlackRock Multi-Asset Complex. |
| | |
| 44 | | 2 0 2 3 BLACK ROCK ANNUAL REPORT TO SHAREHOLDERS |
Trustee and Officer Information (continued)
| | | | |
| Officers Who Are Not Trustees(a) |
| | | |
Name Year of Birth(b) | | Position(s) Held (Length of Service) | | Principal Occupation(s) During Past 5 Years |
| | |
Jennifer McGovern 1977 | | Vice President (Since 2014) | | Managing Director of BlackRock, Inc. since 2016; Director of BlackRock, Inc. from 2011 to 2015; Head of Americas Product Development and Governance for BlackRock’s Global Product Group since 2019; Head of Product Structure and Oversight for BlackRock’s U.S. Wealth Advisory Group from 2013 to 2019. |
| | |
Trent Walker 1974 | | Chief Financial Officer (Since 2021) | | Managing Director of BlackRock, Inc. since September 2019; Executive Vice President of PIMCO from 2016 to 2019; Senior Vice President of PIMCO from 2008 to 2015; Treasurer from 2013 to 2019 and Assistant Treasurer from 2007 to 2017 of PIMCO Funds, PIMCO Variable Insurance Trust, PIMCO ETF Trust, PIMCO Equity Series, PIMCO Equity Series VIT, PIMCO Managed Accounts Trust, 2 PIMCO-sponsored interval funds and 21 PIMCO-sponsored closed-end funds. |
| | |
Jay M. Fife 1970 | | Treasurer (Since 2007) | | Managing Director of BlackRock, Inc. since 2007. |
| | |
Charles Park 1967 | | Chief Compliance Officer (Since 2014) | | Anti-Money Laundering Compliance Officer for certain BlackRock-advised Funds from 2014 to 2015; Chief Compliance Officer of BlackRock Advisors, LLC and the BlackRock-advised Funds in the BlackRock Multi-Asset Complex and the BlackRock Fixed-Income Complex since 2014; Principal of and Chief Compliance Officer for iShares® Delaware Trust Sponsor LLC since 2012 and BlackRock Fund Advisors (“BFA”) since 2006; Chief Compliance Officer for the BFA-advised iShares® exchange traded funds since 2006; Chief Compliance Officer for BlackRock Asset Management International Inc. since 2012. |
| | |
Lisa Belle 1968 | | Anti-Money Laundering Compliance Officer (Since 2019) | | Managing Director of BlackRock, Inc. since 2019; Global Financial Crime Head for Asset and Wealth Management of JP Morgan from 2013 to 2019; Managing Director of RBS Securities from 2012 to 2013; Head of Financial Crimes for Barclays Wealth Americas from 2010 to 2012. |
| | |
Janey Ahn 1975 | | Secretary (Since 2019) | | Managing Director of BlackRock, Inc. since 2018; Director of BlackRock, Inc. from 2009 to 2017. |
| (a) | The address of each Officer is c/o BlackRock, Inc., 50 Hudson Yards, New York, NY 10001. |
| (b) | Officers of the Trust serve at the pleasure of the Board. |
Further information about the Trust’s Trustees and Officers is available in the Trust’s Statement of Additional Information, which can be obtained without charge by calling (800) 441-7762.
Effective July 1, 2023, Aaron Wasserman replaced Charles Park as Chief Compliance Officer of the Trust.
| | |
TRUSTEE AND OFFICER INFORMATION | | 45 |
Additional Information
Tailored Shareholder Reports for Mutual Funds and ETFs
Effective January 24, 2023, the SEC adopted rule and form amendments to require mutual funds and ETFs to transmit concise and visually engaging streamlined annual and semiannual reports to shareholders that highlight key information. Other information, including financial statements, will no longer appear in a streamlined shareholder report but must be available online, delivered free of charge upon request, and filed on a semiannual basis on Form N-CSR. The rule and form amendments have a compliance date of July 24, 2024. At this time, management is evaluating the impact of these amendments on the shareholder reports for the Fund.
General Information
Quarterly performance, semi-annual and annual reports, current net asset value and other information regarding the Fund may be found on BlackRock’s website, which can be accessed at blackrock.com. Any reference to BlackRock’s website in this report is intended to allow investors public access to information regarding the Fund and does not, and is not intended to, incorporate BlackRock’s website in this report.
Householding
The Fund will mail only one copy of shareholder documents, including prospectuses, annual and semi-annual reports, Rule 30e-3 notices and proxy statements, to shareholders with multiple accounts at the same address. This practice is commonly called “householding” and is intended to reduce expenses and eliminate duplicate mailings of shareholder documents. Mailings of your shareholder documents may be householded indefinitely unless you instruct us otherwise. If you do not want the mailing of these documents to be combined with those for other members of your household, please call the Fund at (800) 441-7762.
Availability of Quarterly Schedule of Investments
The Fund files its complete schedule of portfolio holdings with the SEC for the first and third quarters of each fiscal year as an exhibit to its reports on Form N-PORT. The Fund’s Form N-PORT is available on the SEC’s website at sec.gov. Additionally, the Fund makes its portfolio holdings for the first and third quarters of each fiscal year available at blackrock.com/fundreports.
Availability of Proxy Voting Policies, Procedures and Voting Records
A description of the policies and procedures that the Fund uses to determine how to vote proxies relating to portfolio securities and information about how the Fund voted proxies relating to securities held in the Fund’s portfolio during the most recent 12-month period ended June 30 is available without charge, upon request (1) by calling (800) 441-7762; (2) on the BlackRock website at blackrock.com; and (3) on the SEC’s website at sec.gov.
BlackRock’s Mutual Fund Family
BlackRock offers a diverse lineup of open-end mutual funds crossing all investment styles and managed by experts in equity, fixed-income and tax-exempt investing. Visit blackrock.com for more information.
Shareholder Privileges
Account Information
Call us at (800) 441-7762 from 8:00 AM to 6:00 PM ET on any business day to get information about your account balances, recent transactions and share prices. You can also visit blackrock.com for more information.
Automatic Investment Plans
Investor class shareholders who want to invest regularly can arrange to have $50 or more automatically deducted from their checking or savings account and invested in any of the BlackRock funds.
Systematic Withdrawal Plans
Investor class shareholders can establish a systematic withdrawal plan and receive periodic payments of $50 or more from their BlackRock funds, as long as their account balance is at least $10,000.
Retirement Plans
Shareholders may make investments in conjunction with Traditional, Rollover, Roth, Coverdell, Simple IRAs, SEP IRAs and 403(b) Plans.
BlackRock Privacy Principles
BlackRock is committed to maintaining the privacy of its current and former fund investors and individual clients (collectively, “Clients”) and to safeguarding their non-public personal information. The following information is provided to help you understand what personal information BlackRock collects, how we protect that information and why in certain cases we share such information with select parties.
| | |
| 46 | | 2 0 2 3 BLACK ROCK ANNUAL REPORT TO SHAREHOLDERS |
Additional Information (continued)
BlackRock Privacy Principles (continued)
If you are located in a jurisdiction where specific laws, rules or regulations require BlackRock to provide you with additional or different privacy-related rights beyond what is set forth below, then BlackRock will comply with those specific laws, rules or regulations.
BlackRock obtains or verifies personal non-public information from and about you from different sources, including the following: (i) information we receive from you or, if applicable, your financial intermediary, on applications, forms or other documents; (ii) information about your transactions with us, our affiliates, or others; (iii) information we receive from a consumer reporting agency; and (iv) from visits to our websites.
BlackRock does not sell or disclose to non-affiliated third parties any non-public personal information about its Clients, except as permitted by law or as is necessary to respond to regulatory requests or to service Client accounts. These non-affiliated third parties are required to protect the confidentiality and security of this information and to use it only for its intended purpose.
We may share information with our affiliates to service your account or to provide you with information about other BlackRock products or services that may be of interest to you. In addition, BlackRock restricts access to non-public personal information about its Clients to those BlackRock employees with a legitimate business need for the information. BlackRock maintains physical, electronic and procedural safeguards that are designed to protect the non-public personal information of its Clients, including procedures relating to the proper storage and disposal of such information.
Fund and Service Providers
| | |
| Investment Adviser and Administrator | | Distributor |
BlackRock Advisors, LLC | | BlackRock Investments, LLC |
Wilmington, DE 19809 | | New York, NY 10001 |
| |
| Sub-Adviser | | Independent Registered Public Accounting Firm |
BlackRock International Limited | | Deloitte & Touche LLP |
Edinburgh, EH3 8BL | | Boston, MA 02116 |
United Kingdom | | |
| | Legal Counsel |
| Accounting Agent and Custodian | | Willkie Farr & Gallagher LLP |
State Street Bank and Trust Company | | New York, NY 10019 |
Boston, MA 02114 | | |
| | Address of the Fund |
| Transfer Agent | | 100 Bellevue Parkway |
BNY Mellon Investment Servicing (US) Inc. | | Wilmington, DE 19809 |
Wilmington, DE 19809 | | |
| | |
ADDITIONAL INFORMATION | | 47 |
Glossary of Terms Used in this Report
Currency Abbreviation
| | |
| |
| AUD | | Australian Dollar |
| |
| CAD | | Canadian Dollar |
| |
| CHF | | Swiss Franc |
| |
| CZK | | Czech Koruna |
| |
| EUR | | Euro |
| |
| GBP | | British Pound |
| |
| HKD | | Hong Kong Dollar |
| |
| KRW | | South Korean Won |
| |
| MXN | | Mexican Peso |
| |
| NOK | | Norwegian Krone |
| |
| NZD | | New Zealand Dollar |
| |
| PLN | | Polish Zloty |
| |
| SEK | | Swedish Krona |
| |
| SGD | | Singapore Dollar |
| |
| THB | | Thai Baht |
| |
| USD | | United States Dollar |
| |
| ZAR | | South African Rand |
| | |
| Portfolio Abbreviation |
| |
| BAB | | Build America Bond |
| |
| BBR | | Bank Bill Rate |
| |
| BBSW | | Bank Bill Swap Rate |
| |
| CMT | | Constant Maturity Treasury |
| |
| CPI | | Consumer Price Index |
| |
| DAC | | Designated Activity Company |
| |
| EURIBOR | | Euro Interbank Offered Rate |
| |
| GO | | General Obligation Bonds |
| |
| HIBOR | | Hong Kong Interbank Offered Rate |
| |
| JIBAR | | Johannesburg Interbank Average Rate |
| |
| LIBOR | | London Interbank Offered Rate |
| |
| LP | | Limited Partnership |
| |
| MXIBTIIE | | Mexico Interbank TIIE 28-Day |
| |
| NIBOR | | Norwegian Interbank Offered Rate |
| |
| PRIBOR | | Prague Interbank Offer Rate |
| |
| RB | | Revenue Bond |
| |
| REMIC | | Real Estate Mortgage Investment Conduit |
| |
| SAN | | State Aid Notes |
| |
| SOFR | | Secured Overnight Financing Rate |
| |
| SONIA | | Sterling Overnight Interbank Average Rate |
| |
| SORA | | Singapore Overnight Rate Average |
| |
| SSARON | | Swiss Average Overnight Rate |
| |
| STACR | | Structured Agency Credit Risk |
| |
| STIBOR | | Stockholm Interbank Offered Rate |
| |
| TBA | | To-Be-Announced |
| |
| THOR | | Thai Overnight Repurchase Rate |
| |
| UK RPI | | United Kingdom Retail Price Index |
| |
| WIBOR | | Warsaw Interbank Offered Rate |
| | |
| 48 | | 2 0 2 3 BLACK ROCK ANNUAL REPORT TO SHAREHOLDERS |
Want to know more?
blackrock.com | 800-441-7762
This report is intended for current holders. It is not authorized for use as an offer of sale or a solicitation of an offer to buy shares of the Fund unless preceded or accompanied by the Fund’s current prospectus. Past performance results shown in this report should not be considered a representation of future performance. Investment returns and principal value of shares will fluctuate so that shares, when redeemed, may be worth more or less than their original cost. Statements and other information herein are as dated and are subject to change.
IMPBOND-05/23-AR
(b) Not Applicable
| Item 2 – | Code of Ethics – The registrant (or the “Fund”) has adopted a code of ethics, as of the end of the period covered by this report, applicable to the registrant’s principal executive officer, principal financial officer, principal accounting officer or controller, or persons performing similar functions. During the period covered by this report, the code of ethics was amended to update certain information and to make other non-material changes. During the period covered by this report, there have been no waivers granted under the code of ethics. The registrant undertakes to provide a copy of the code of ethics to any person upon request, without charge, who calls 1-800-441-7762. |
| Item 3 – | Audit Committee Financial Expert – The registrant’s board of trustees (the “board of trustees”), has determined that (i) the registrant has the following audit committee financial experts serving on its audit committee and (ii) each audit committee financial expert is independent: |
Frank J. Fabozzi
Lorenzo A. Flores
Catherine A. Lynch
Under applicable securities laws, a person determined to be an audit committee financial expert will not be deemed an “expert” for any purpose, including without limitation for the purposes of Section 11 of the Securities Act of 1933, as a result of being designated or identified as an audit committee financial expert. The designation or identification as an audit committee financial expert does not impose on such person any duties, obligations, or liabilities greater than the duties, obligations, and liabilities imposed on such person as a member of the audit committee and board of trustees in the absence of such designation or identification. The designation or identification of a person as an audit committee financial expert does not affect the duties, obligations, or liability of any other member of the audit committee or board of trustees.
| Item 4 – | Principal Accountant Fees and Services |
The following table presents fees billed by Deloitte & Touche LLP (“D&T”) in each of the last two fiscal years for the services rendered to the Fund:
| | | | | | | | | | | | | | | | |
| | | (a) Audit Fees | | (b) Audit-Related Fees1 | | (c) Tax Fees2 | | (d) All Other Fees |
| Entity Name | | Current
Fiscal
Year End | | Previous
Fiscal
Year
End | | Current
Fiscal
Year
End | | Previous
Fiscal
Year
End | | Current
Fiscal
Year
End | | Previous
Fiscal
Year
End | | Current
Fiscal
Year
End | | Previous
Fiscal
Year
End |
| BlackRock Sustainable Advantage CoreAlpha Bond | | $41,616 | | $39,984 | | $44 | | $420 | | $18,200 | | $17,500 | | $218 | | $0 |
The following table presents fees billed by D&T that were required to be approved by the registrant’s audit committee (the “Committee”) for services that relate directly to the operations or financial reporting of the Fund and that are rendered on behalf of BlackRock Advisors, LLC ( the “Investment Adviser” or “BlackRock”) and entities controlling, controlled by, or under common control with BlackRock (not
2
including any sub-adviser whose role is primarily portfolio management and is subcontracted with or overseen by another investment adviser) that provide ongoing services to the Fund (“Affiliated Service Providers”):
| | | | |
| | | Current Fiscal Year End | | Previous Fiscal Year End |
(b) Audit-Related Fees1 | | $0 | | $0 |
(c) Tax Fees2 | | $0 | | $0 |
(d) All Other Fees3 | | $2,154,000 | | $2,098,000 |
1 The nature of the services includes assurance and related services reasonably related to the performance of the audit or review of financial statements not included in Audit Fees, including accounting consultations, agreed-upon procedure reports, attestation reports, comfort letters, out-of-pocket expenses and internal control reviews not required by regulators.
2 The nature of the services includes tax compliance and/or tax preparation, including services relating to the filing or amendment of federal, state or local income tax returns, regulated investment company qualification reviews, taxable income and tax distribution calculations.
3 Non-audit fees of $2,154,000 and $2,098,000 for the current fiscal year and previous fiscal year, respectively, were paid to the Fund’s principal accountant in their entirety by BlackRock, in connection with services provided to the Affiliated Service Providers of the Fund and of certain other funds sponsored and advised by BlackRock or its affiliates for a service organization review and an accounting research tool subscription. These amounts represent aggregate fees paid by BlackRock and were not allocated on a per fund basis.
(e)(1) Audit Committee Pre-Approval Policies and Procedures:
The Committee has adopted policies and procedures with regard to the pre-approval of services. Audit, audit-related and tax compliance services provided to the registrant on an annual basis require specific pre-approval by the Committee. The Committee also must approve other non-audit services provided to the registrant and those non-audit services provided to the Investment Adviser and Affiliated Service Providers that relate directly to the operations and the financial reporting of the registrant. Certain of these non-audit services that the Committee believes are (a) consistent with the SEC’s auditor independence rules and (b) routine and recurring services that will not impair the independence of the independent accountants may be approved by the Committee without consideration on a specific case-by-case basis (“general pre-approval”). The term of any general pre-approval is 12 months from the date of the pre-approval, unless the Committee provides for a different period. Tax or other non-audit services provided to the registrant which have a direct impact on the operations or financial reporting of the registrant will only be deemed pre-approved provided that any individual project does not exceed $10,000 attributable to the registrant or $50,000 per project. For this purpose, multiple projects will be aggregated to determine if they exceed the previously mentioned cost levels.
Any proposed services exceeding the pre-approved cost levels will require specific pre-approval by the Committee, as will any other services not subject to general pre-approval (e.g., unanticipated but permissible services). The Committee is informed of each service approved subject to general pre-approval at the next regularly scheduled in-person board meeting. At this meeting, an analysis of such services is presented to the Committee for ratification. The Committee may delegate to the Committee Chairman the authority to approve the provision of and fees for any specific engagement of permitted non-audit services, including services exceeding pre-approved cost levels.
(e)(2) None of the services described in each of Items 4(b) through (d) were approved by the Committee pursuant to the de minimis exception in paragraph (c)(7)(i)(C) of Rule 2-01 of Regulation S-X.
(f) Not Applicable
3
(g) The aggregate non-audit fees, defined as the sum of the fees shown under “Audit-Related Fees,” “Tax Fees” and “All Other Fees,” paid to the accountant for services rendered by the accountant to the registrant, the Investment Adviser and the Affiliated Service Providers were:
| | | | | | |
| Entity Name | | Current Fiscal Year End | | Previous Fiscal Year End | | |
| BlackRock Sustainable Advantage CoreAlpha Bond | | $18,462 | | $17,920 | | |
Additionally, the amounts billed by D&T in connection with services provided to the Affiliated Service Providers of the Fund and of other funds sponsored and advised by BlackRock or its affiliates during the current and previous fiscal years for a service organization review and an accounting research tool subscription were:
| | |
Current Fiscal Year End | | Previous Fiscal Year End |
$2,154,000 | | $2,098,000 |
These amounts represent aggregate fees paid by BlackRock and were not allocated on a per fund basis.
(h) The Committee has considered and determined that the provision of non-audit services that were rendered to the Investment Adviser and the Affiliated Service Providers that were not pre-approved pursuant to paragraph (c)(7)(ii) of Rule 2-01 of Regulation S-X is compatible with maintaining the principal accountant’s independence.
(i) – Not Applicable
(j) – Not Applicable
| Item 5 – | Audit Committee of Listed Registrant – Not Applicable |
(a) The registrant’s Schedule of Investments is included as part of the Report to Stockholders filed under Item 1(a) of this Form.
(b) Not Applicable due to no such divestments during the semi-annual period covered since the previous Form N-CSR filing.
| Item 7 – | Disclosure of Proxy Voting Policies and Procedures for Closed-End Management Investment Companies – Not Applicable |
| Item 8 – | Portfolio Managers of Closed-End Management Investment Companies – Not Applicable |
| Item 9 – | Purchases of Equity Securities by Closed-End Management Investment Company and Affiliated Purchasers – Not Applicable |
4
| Item 10 – | Submission of Matters to a Vote of Security Holders – There have been no material changes to these procedures. |
| Item 11 – | Controls and Procedures |
(a) The registrant’s principal executive and principal financial officers, or persons performing similar functions, have concluded that the registrant’s disclosure controls and procedures (as defined in Rule 30a-3(c) under the Investment Company Act of 1940, as amended (the “1940 Act”)) are effective as of a date within 90 days of the filing of this report based on the evaluation of these controls and procedures required by Rule 30a-3(b) under the 1940 Act and Rule 15d-15(b) under the Securities Exchange Act of 1934, as amended.
(b) There were no changes in the registrant’s internal control over financial reporting (as defined in Rule 30a-3(d) under the 1940 Act) that occurred during the period covered by this report that have materially affected, or are reasonably likely to materially affect, the registrant’s internal control over financial reporting.
| Item 12 – | Disclosure of Securities Lending Activities for Closed-End Management Investment Companies – Not Applicable |
| Item 13 – | Exhibits attached hereto |
(a)(1) Code of Ethics – See Item 2
(a)(2) Section 302 Certifications are attached
(a)(3) Any written solicitation to purchase securities under Rule 23c-1 – Not Applicable
(a)(4) Change in Registrant’s independent public accountant – Not Applicable
(b) Section 906 Certifications are attached
5
Pursuant to the requirements of the Securities Exchange Act of 1934 and the Investment Company Act of 1940, the registrant has duly caused this report to be signed on its behalf by the undersigned, thereunto duly authorized.
BlackRock Funds IV
| | | | |
| | By: | | /s/ John M. Perlowski |
| | | | John M. Perlowski |
| | | | Chief Executive Officer (principal executive officer) of |
| | | | BlackRock Funds IV |
Date: July 21, 2023
Pursuant to the requirements of the Securities Exchange Act of 1934 and the Investment Company Act of 1940, this report has been signed below by the following persons on behalf of the registrant and in the capacities and on the dates indicated.
| | | | |
| | By: | | /s/ John M. Perlowski |
| | | | John M. Perlowski |
| | | | Chief Executive Officer (principal executive officer) of |
| | | | BlackRock Funds IV |
Date: July 21, 2023
| | | | |
| | By: | | /s/ Trent Walker |
| | | | Trent Walker |
| | | | Chief Financial Officer (principal financial officer) of |
| | | | BlackRock Funds IV |
Date: July 21, 2023
6