UNITED STATES
SECURITIES AND EXCHANGE COMMISSION
Washington, D.C. 20549
FORM N-CSR
CERTIFIED SHAREHOLDER REPORT OF REGISTERED MANAGEMENT INVESTMENT COMPANIES
Investment Company Act file number: 811-23341
Name of Fund: BlackRock Funds IV
BlackRock Global Long/Short Credit Fund
Fund Address: 100 Bellevue Parkway, Wilmington, DE 19809
Name and address of agent for service: John M. Perlowski, Chief Executive Officer, BlackRock Funds IV, 50 Hudson Yards, New York, NY 10001
Registrant’s telephone number, including area code: (800) 441-7762
Date of fiscal year end: 07/31/2024
Date of reporting period: 07/31/2024
Item 1 – Report to Stockholders
(a) The Reports to Shareholders is attached herewith.
BlackRock Global Long/Short Credit Fund
Institutional Shares | BGCIX
Annual Shareholder Report — July 31, 2024
This annual shareholder report contains important information about BlackRock Global Long/Short Credit Fund (the “Fund”) for the period of August 1, 2023 to July 31, 2024.You can find additional information about the Fund at blackrock.com/fundreports. You can also request this information by contacting us at (800) 441-7762.
What were the Fund costs for the last year?
(based on a hypothetical $10,000 investment)
| Class name | Costs of a $10,000 investment | Costs paid as a percentage of a $10,000 investment |
|---|
| Institutional Shares | $153 | 1.46% |
How did the Fund perform last year?
The global fixed-income markets produced positive returns during the reporting period, with income making a sizable contribution in the high interest rate environment.
Credit-oriented investments performed particularly well, as positive investor sentiment contributed to a narrowing of yield spreads.
What contributed to performance?
The Fund’s U.S. and European absolute return strategies and European traditional strategies contributed to performance. Specifically, idiosyncratic long positions, event-related trades, and thematic trades all made meaningful contributions. European absolute return strategies, particularly event-related trades, also contributed. European traditional strategies further helped results, primarily in high yield, financials, and mezzanine collateralized loan obligations.
As part of its investment strategy, the Fund used derivatives to manage duration (sensitivity to interest rate movements) and currency risk. The Fund also has the flexibility to utilize derivatives in order to express a positive or negative view on a particular issuer or sector, or to manage overall credit risk. Derivatives may also serve as a more liquid way to establish positions. The use of derivatives had a marginally positive impact on the Fund’s performance during the reporting period.
What detracted from performance?
At a time of positive returns for the broader market, few aspects of the Fund’s positioning detracted. With that said, idiosyncratic short positions in the Fund’s U.S. absolute return strategies, along with U.S. and European risk-management strategies, had small adverse effects.
The views expressed reflect the opinions of BlackRock as of the date of this report and are subject to change based on changes in market, economic or other conditions. These views are not intended to be a forecast of future events and are no guarantee of future results.
Cumulative performance: August 1, 2014 through July 31, 2024
Initial investment of $10,000
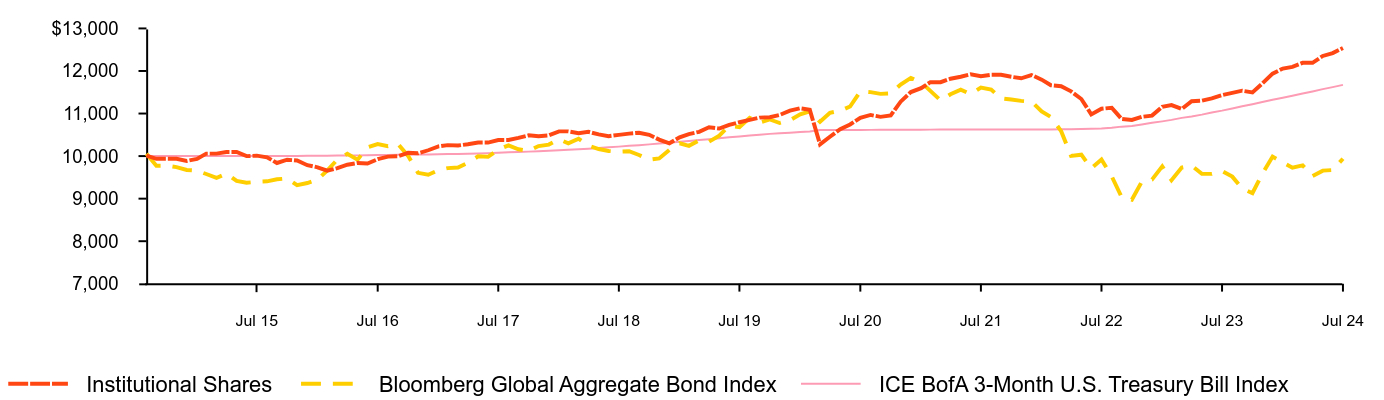
| Institutional Shares | Bloomberg Global Aggregate Bond Index | ICE BofA 3-Month U.S. Treasury Bill Index |
|---|
| Aug 14 | 10,009 | 10,055 | 10,000 |
| Sep 14 | 9,936 | 9,774 | 10,001 |
| Oct 14 | 9,936 | 9,776 | 10,001 |
| Nov 14 | 9,936 | 9,740 | 10,001 |
| Dec 14 | 9,886 | 9,673 | 10,001 |
| Jan 15 | 9,934 | 9,658 | 10,001 |
| Feb 15 | 10,058 | 9,579 | 10,001 |
| Mar 15 | 10,058 | 9,487 | 10,001 |
| Apr 15 | 10,096 | 9,588 | 10,002 |
| May 15 | 10,096 | 9,416 | 10,002 |
| Jun 15 | 10,000 | 9,375 | 10,002 |
| Jul 15 | 10,010 | 9,396 | 10,001 |
| Aug 15 | 9,972 | 9,407 | 10,003 |
| Sep 15 | 9,838 | 9,455 | 10,003 |
| Oct 15 | 9,915 | 9,475 | 10,002 |
| Nov 15 | 9,896 | 9,318 | 10,003 |
| Dec 15 | 9,787 | 9,368 | 10,006 |
| Jan 16 | 9,737 | 9,449 | 10,007 |
| Feb 16 | 9,657 | 9,659 | 10,009 |
| Mar 16 | 9,717 | 9,920 | 10,014 |
| Apr 16 | 9,797 | 10,052 | 10,016 |
| May 16 | 9,837 | 9,917 | 10,017 |
| Jun 16 | 9,827 | 10,207 | 10,021 |
| Jul 16 | 9,927 | 10,284 | 10,024 |
| Aug 16 | 9,987 | 10,234 | 10,026 |
| Sep 16 | 9,997 | 10,290 | 10,031 |
| Oct 16 | 10,077 | 10,005 | 10,033 |
| Nov 16 | 10,067 | 9,607 | 10,035 |
| Dec 16 | 10,137 | 9,563 | 10,039 |
| Jan 17 | 10,228 | 9,671 | 10,044 |
| Feb 17 | 10,258 | 9,717 | 10,048 |
| Mar 17 | 10,248 | 9,732 | 10,049 |
| Apr 17 | 10,278 | 9,841 | 10,056 |
| May 17 | 10,318 | 9,994 | 10,061 |
| Jun 17 | 10,318 | 9,985 | 10,070 |
| Jul 17 | 10,378 | 10,153 | 10,078 |
| Aug 17 | 10,378 | 10,253 | 10,088 |
| Sep 17 | 10,428 | 10,161 | 10,096 |
| Oct 17 | 10,488 | 10,122 | 10,105 |
| Nov 17 | 10,468 | 10,235 | 10,114 |
| Dec 17 | 10,488 | 10,270 | 10,125 |
| Jan 18 | 10,580 | 10,393 | 10,137 |
| Feb 18 | 10,580 | 10,301 | 10,147 |
| Mar 18 | 10,539 | 10,410 | 10,161 |
| Apr 18 | 10,570 | 10,243 | 10,174 |
| May 18 | 10,509 | 10,166 | 10,190 |
| Jun 18 | 10,468 | 10,121 | 10,207 |
| Jul 18 | 10,499 | 10,104 | 10,223 |
| Aug 18 | 10,529 | 10,114 | 10,241 |
| Sep 18 | 10,549 | 10,027 | 10,257 |
| Oct 18 | 10,499 | 9,915 | 10,275 |
| Nov 18 | 10,387 | 9,946 | 10,296 |
| Dec 18 | 10,302 | 10,147 | 10,315 |
| Jan 19 | 10,442 | 10,302 | 10,335 |
| Feb 19 | 10,517 | 10,242 | 10,354 |
| Mar 19 | 10,571 | 10,371 | 10,377 |
| Apr 19 | 10,678 | 10,340 | 10,396 |
| May 19 | 10,646 | 10,480 | 10,420 |
| Jun 19 | 10,732 | 10,712 | 10,443 |
| Jul 19 | 10,796 | 10,682 | 10,462 |
| Aug 19 | 10,850 | 10,900 | 10,483 |
| Sep 19 | 10,904 | 10,789 | 10,502 |
| Oct 19 | 10,914 | 10,861 | 10,522 |
| Nov 19 | 10,968 | 10,778 | 10,535 |
| Dec 19 | 11,067 | 10,841 | 10,550 |
| Jan 20 | 11,123 | 10,980 | 10,564 |
| Feb 20 | 11,090 | 11,053 | 10,580 |
| Mar 20 | 10,276 | 10,806 | 10,611 |
| Apr 20 | 10,454 | 11,018 | 10,611 |
| May 20 | 10,633 | 11,066 | 10,612 |
| Jun 20 | 10,744 | 11,165 | 10,613 |
| Jul 20 | 10,900 | 11,521 | 10,615 |
| Aug 20 | 10,967 | 11,503 | 10,616 |
| Sep 20 | 10,922 | 11,462 | 10,617 |
| Oct 20 | 10,956 | 11,473 | 10,618 |
| Nov 20 | 11,279 | 11,681 | 10,619 |
| Dec 20 | 11,505 | 11,838 | 10,620 |
| Jan 21 | 11,597 | 11,734 | 10,621 |
| Feb 21 | 11,737 | 11,532 | 10,622 |
| Mar 21 | 11,737 | 11,310 | 10,623 |
| Apr 21 | 11,818 | 11,453 | 10,623 |
| May 21 | 11,864 | 11,560 | 10,624 |
| Jun 21 | 11,922 | 11,458 | 10,623 |
| Jul 21 | 11,876 | 11,611 | 10,624 |
| Aug 21 | 11,910 | 11,563 | 10,624 |
| Sep 21 | 11,910 | 11,357 | 10,625 |
| Oct 21 | 11,864 | 11,330 | 10,624 |
| Nov 21 | 11,829 | 11,297 | 10,625 |
| Dec 21 | 11,905 | 11,281 | 10,626 |
| Jan 22 | 11,797 | 11,050 | 10,625 |
| Feb 22 | 11,665 | 10,918 | 10,627 |
| Mar 22 | 11,641 | 10,586 | 10,630 |
| Apr 22 | 11,521 | 10,006 | 10,632 |
| May 22 | 11,341 | 10,033 | 10,639 |
| Jun 22 | 10,981 | 9,711 | 10,642 |
| Jul 22 | 11,113 | 9,918 | 10,647 |
| Aug 22 | 11,137 | 9,526 | 10,665 |
| Sep 22 | 10,873 | 9,037 | 10,692 |
| Oct 22 | 10,849 | 8,975 | 10,709 |
| Nov 22 | 10,921 | 9,397 | 10,743 |
| Dec 22 | 10,952 | 9,448 | 10,782 |
| Jan 23 | 11,160 | 9,758 | 10,816 |
| Feb 23 | 11,199 | 9,434 | 10,851 |
| Mar 23 | 11,108 | 9,732 | 10,898 |
| Apr 23 | 11,290 | 9,775 | 10,932 |
| May 23 | 11,303 | 9,584 | 10,975 |
| Jun 23 | 11,355 | 9,583 | 11,025 |
| Jul 23 | 11,433 | 9,649 | 11,069 |
| Aug 23 | 11,485 | 9,517 | 11,119 |
| Sep 23 | 11,537 | 9,239 | 11,170 |
| Oct 23 | 11,498 | 9,129 | 11,220 |
| Nov 23 | 11,706 | 9,589 | 11,270 |
| Dec 23 | 11,936 | 9,988 | 11,323 |
| Jan 24 | 12,057 | 9,850 | 11,371 |
| Feb 24 | 12,098 | 9,726 | 11,418 |
| Mar 24 | 12,192 | 9,780 | 11,469 |
| Apr 24 | 12,192 | 9,533 | 11,518 |
| May 24 | 12,353 | 9,658 | 11,573 |
| Jun 24 | 12,420 | 9,672 | 11,621 |
| Jul 24 | 12,541 | 9,939 | 11,673 |
See “Average annual total returns” for additional information on fund performance.
Average annual total returns
| Average Annual Total Returns | 1 Year | 5 Years | 10 Years |
|---|
Institutional Shares ........................................................................................................................................................................................................................................................................................................................................................................................................................................................................................................................................................................................................................................................................................................................................................................................................................................................................................................................................................................................................................................ | 9.69% | 3.04% | 2.29% |
Bloomberg Global Aggregate Bond Index........................................................................................................................................................................................................................................................................................................................................................................................................................................................................................................................................................................................................................................................................................................................................................................................................................................................................................................................................................................................................................................ | 3.00 | (1.43) | (0.06) |
ICE BofA 3-Month U.S. Treasury Bill Index........................................................................................................................................................................................................................................................................................................................................................................................................................................................................................................................................................................................................................................................................................................................................................................................................................................................................................................................................................................................................................................ | 5.45 | 2.21 | 1.56 |
The Fund has added the Bloomberg Global Aggregate Bond Index in response to new regulatory requirements.
On September 17, 2018, the Fund acquired all of the assets, subject to the liabilities, of BlackRock Global Long/Short Credit Fund (the “Predecessor Fund”), a series of BlackRock FundsSM, through a tax-free reorganization (the “Reorganization”). The Predecessor Fund is the performance and accounting survivor of the Reorganization.
On December 1, 2023, the Fund began to compare its performance to the standard pricing time of the ICE BofA 3-Month U.S. Treasury Bill Index (the “Index”). Index data prior to March 1, 2021 is for the Index’s standard pricing time of 3pm. Index data from March 1, 2021 through November 30, 2023 is for a custom 4pm pricing variant of the Index. Index returns beginning on December 1, 2023 reflect the Index’s new standard pricing time of 4pm. The change of the Index’s standard pricing time from 3pm to 4pm resulted in the discontinuation of the custom 4pm pricing variant used from March 1, 2021 through November 30, 2023.
Net Assets........................................................................................................................................................................................................................................................................................................................................................................................................................................................................................................................................................................................................................................................................................................................................................................................................................................................................................................................................................................................................................................ | $872,029,693 |
Number of Portfolio Holdings........................................................................................................................................................................................................................................................................................................................................................................................................................................................................................................................................................................................................................................................................................................................................................................................................................................................................................................................................................................................................................................ | 926 |
Net Investment Advisory Fees........................................................................................................................................................................................................................................................................................................................................................................................................................................................................................................................................................................................................................................................................................................................................................................................................................................................................................................................................................................................................................................ | $9,223,077 |
Portfolio Turnover Rate........................................................................................................................................................................................................................................................................................................................................................................................................................................................................................................................................................................................................................................................................................................................................................................................................................................................................................................................................................................................................................................ | 110% |
Past performance is not an indication of future results. Performance results may include adjustments made for financial reporting purposes in accordance with U.S. generally accepted accounting principles. Performance results do not reflect the deduction of taxes that a shareholder would pay on fund distributions or on the redemption or sale of fund shares. Visit blackrock.com for more recent performance information.
What did the Fund invest in?
Credit quality allocation
| Percent of Total InvestmentsFootnote Reference(a) |
|---|
| Country/Geographic Region | Long | Short | Total |
|---|
United States........................................................................................................................................................................................................................................................................................................................................................................................................................................................................................................................................................................................................................................................................................................................................................................................................................................................................................................................................................................................................................................ | 47.2% | 1.1% | 48.3% |
United Kingdom........................................................................................................................................................................................................................................................................................................................................................................................................................................................................................................................................................................................................................................................................................................................................................................................................................................................................................................................................................................................................................................ | 9.5 | 0.6 | 10.1 |
Ireland........................................................................................................................................................................................................................................................................................................................................................................................................................................................................................................................................................................................................................................................................................................................................................................................................................................................................................................................................................................................................................................ | 9.9 | - | 9.9 |
Germany........................................................................................................................................................................................................................................................................................................................................................................................................................................................................................................................................................................................................................................................................................................................................................................................................................................................................................................................................................................................................................................ | 6.3 | 0.3 | 6.6 |
France........................................................................................................................................................................................................................................................................................................................................................................................................................................................................................................................................................................................................................................................................................................................................................................................................................................................................................................................................................................................................................................ | 3.9 | - | 3.9 |
Italy........................................................................................................................................................................................................................................................................................................................................................................................................................................................................................................................................................................................................................................................................................................................................................................................................................................................................................................................................................................................................................................ | 3.3 | 0.3 | 3.6 |
Spain........................................................................................................................................................................................................................................................................................................................................................................................................................................................................................................................................................................................................................................................................................................................................................................................................................................................................................................................................................................................................................................ | 2.8 | 0.4 | 3.2 |
Luxembourg........................................................................................................................................................................................................................................................................................................................................................................................................................................................................................................................................................................................................................................................................................................................................................................................................................................................................................................................................................................................................................................ | 2.4 | - | 2.4 |
Sweden........................................................................................................................................................................................................................................................................................................................................................................................................................................................................................................................................................................................................................................................................................................................................................................................................................................................................................................................................................................................................................................ | 1.2 | 0.7 | 1.9 |
Portugal........................................................................................................................................................................................................................................................................................................................................................................................................................................................................................................................................................................................................................................................................................................................................................................................................................................................................................................................................................................................................................................ | 1.8 | - | 1.8 |
OtherFootnote Reference(b) | 7.9 | 0.4 | 8.3 |
Total........................................................................................................................................................................................................................................................................................................................................................................................................................................................................................................................................................................................................................................................................................................................................................................................................................................................................................................................................................................................................................................ | 96.2% | 3.8% | 100.0% |
Credit RatingFootnote Reference(c) | Percent of Total InvestmentsFootnote Reference(d) |
|---|
AAA/AaaFootnote Reference(e)........................................................................................................................................................................................................................................................................................................................................................................................................................................................................................................................................................................................................................................................................................................................................................................................................................................................................................................................................................................................................................................ | 7.3% |
AA/Aa........................................................................................................................................................................................................................................................................................................................................................................................................................................................................................................................................................................................................................................................................................................................................................................................................................................................................................................................................................................................................................................ | 0.3 |
A........................................................................................................................................................................................................................................................................................................................................................................................................................................................................................................................................................................................................................................................................................................................................................................................................................................................................................................................................................................................................................................ | 0.7 |
BBB/Baa........................................................................................................................................................................................................................................................................................................................................................................................................................................................................................................................................................................................................................................................................................................................................................................................................................................................................................................................................................................................................................................ | 15.3 |
BB/Ba........................................................................................................................................................................................................................................................................................................................................................................................................................................................................................................................................................................................................................................................................................................................................................................................................................................................................................................................................................................................................................................ | 25.9 |
B........................................................................................................................................................................................................................................................................................................................................................................................................................................................................................................................................................................................................................................................................................................................................................................................................................................................................................................................................................................................................................................ | 30.3 |
CCC/Caa........................................................................................................................................................................................................................................................................................................................................................................................................................................................................................................................................................................................................................................................................................................................................................................................................................................................................................................................................................................................................................................ | 5.3 |
CC/Ca........................................................................................................................................................................................................................................................................................................................................................................................................................................................................................................................................................................................................................................................................................................................................................................................................................................................................................................................................................................................................................................ | 0.4 |
C........................................................................................................................................................................................................................................................................................................................................................................................................................................................................................................................................................................................................................................................................................................................................................................................................................................................................................................................................................................................................................................ | 0.0Footnote Reference(f) |
D........................................................................................................................................................................................................................................................................................................................................................................................................................................................................................................................................................................................................................................................................................................................................................................................................................................................................................................................................................................................................................................ | 0.3 |
NR........................................................................................................................................................................................................................................................................................................................................................................................................................................................................................................................................................................................................................................................................................................................................................................................................................................................................................................................................................................................................................................ | 14.2 |
| Footnote | Description |
Footnote(a) | Includes the gross market value of long and short securities and excludes short-term securities and options, if any. |
Footnote(b) | Ten largest country/geographic regions are presented. Additional country/geographic regions are found in Other. |
Footnote(c) | For purposes of this report, credit quality ratings shown above reflect the highest rating assigned by either S&P Global Ratings or Moody’s Investors Service, Inc. if ratings differ. These rating agencies are independent, nationally recognized statistical rating organizations and are widely used. Investment grade ratings are credit ratings of BBB/Baa or higher. Below investment grade ratings are credit ratings of BB/Ba or lower. Investments designated NR are not rated by either rating agency. Unrated investments do not necessarily indicate low credit quality. Credit quality ratings are subject to change. |
Footnote(d) | Excludes short-term securities, short investments and options, if any. |
Footnote(e) | The investment adviser evaluates the credit quality of unrated investments based upon certain factors including, but not limited to, credit ratings for similar investments and financial analysis of sectors, individual investments and/or issuers. Using this approach, the investment adviser has deemed unrated U.S. Government Sponsored Agency Securities and U.S. Treasury Obligations to be of similar credit quality as investments rated AAA/Aaa. |
Footnote(f) | Rounds to less than 0.1%. |
If you wish to view additional information about the Fund, including but not limited to financial statements, the Fund’s prospectus, and proxy voting policies and procedures, please visit blackrock.com/fundreports. For proxy voting records, visit blackrock.com/proxyrecords.
The Fund will mail only one copy of shareholder documents, including prospectuses, annual and semi-annual reports and proxy statements, to shareholders with multiple accounts at the same address. This practice is commonly called “householding” and is intended to reduce expenses and eliminate duplicate mailings of shareholder documents. Mailings of your shareholder documents may be householded indefinitely unless you instruct us otherwise. If you do not want the mailing of these documents to be combined with those for other members of your household, please call the Fund at (800) 441-7762.

The Fund is not sponsored, endorsed, issued, sold, or promoted by Bloomberg Index Services Limited, ICE Data Indices, LLC, and their respective affiliates, nor do these companies make any representation regarding the advisability of investing in the Fund. BlackRock is not affiliated with the companies listed above.
© 2024 BlackRock, Inc. or its affiliates. All rights reserved. BLACKROCK is a registered trademark of BlackRock, Inc. or its affiliates. All other trademarks are those of their respective owners.
BlackRock Global Long/Short Credit Fund
Institutional Shares | BGCIX
Annual Shareholder Report — July 31, 2024
BlackRock Global Long/Short Credit Fund
Investor A Shares | BGCAX
Annual Shareholder Report — July 31, 2024
This annual shareholder report contains important information about BlackRock Global Long/Short Credit Fund (the “Fund”) for the period of August 1, 2023 to July 31, 2024.You can find additional information about the Fund at blackrock.com/fundreports. You can also request this information by contacting us at (800) 441-7762.
What were the Fund costs for the last year?
(based on a hypothetical $10,000 investment)
| Class name | Costs of a $10,000 investment | Costs paid as a percentage of a $10,000 investment |
|---|
| Investor A Shares | $176 | 1.68% |
How did the Fund perform last year?
The global fixed-income markets produced positive returns during the reporting period, with income making a sizable contribution in the high interest rate environment.
Credit-oriented investments performed particularly well, as positive investor sentiment contributed to a narrowing of yield spreads.
What contributed to performance?
The Fund’s U.S. and European absolute return strategies and European traditional strategies contributed to performance. Specifically, idiosyncratic long positions, event-related trades, and thematic trades all made meaningful contributions. European absolute return strategies, particularly event-related trades, also contributed. European traditional strategies further helped results, primarily in high yield, financials, and mezzanine collateralized loan obligations.
As part of its investment strategy, the Fund used derivatives to manage duration (sensitivity to interest rate movements) and currency risk. The Fund also has the flexibility to utilize derivatives in order to express a positive or negative view on a particular issuer or sector, or to manage overall credit risk. Derivatives may also serve as a more liquid way to establish positions. The use of derivatives had a marginally positive impact on the Fund’s performance during the reporting period.
What detracted from performance?
At a time of positive returns for the broader market, few aspects of the Fund’s positioning detracted. With that said, idiosyncratic short positions in the Fund’s U.S. absolute return strategies, along with U.S. and European risk-management strategies, had small adverse effects.
The views expressed reflect the opinions of BlackRock as of the date of this report and are subject to change based on changes in market, economic or other conditions. These views are not intended to be a forecast of future events and are no guarantee of future results.
Cumulative performance: August 1, 2014 through July 31, 2024
Initial investment of $10,000
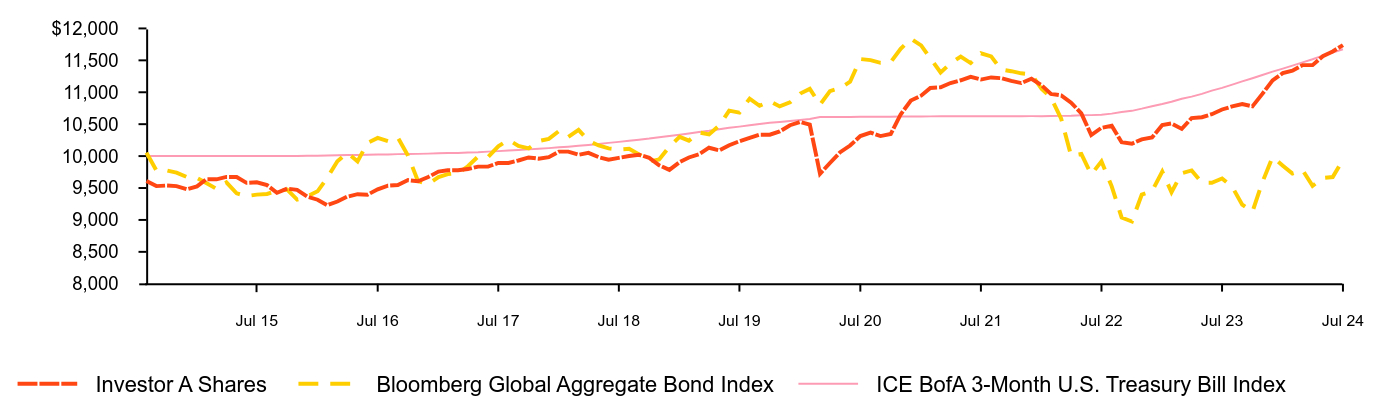
| Investor A Shares | Bloomberg Global Aggregate Bond Index | ICE BofA 3-Month U.S. Treasury Bill Index |
|---|
| Aug 14 | 9,609 | 10,055 | 10,000 |
| Sep 14 | 9,530 | 9,774 | 10,001 |
| Oct 14 | 9,539 | 9,776 | 10,001 |
| Nov 14 | 9,530 | 9,740 | 10,001 |
| Dec 14 | 9,480 | 9,673 | 10,001 |
| Jan 15 | 9,526 | 9,658 | 10,001 |
| Feb 15 | 9,636 | 9,579 | 10,001 |
| Mar 15 | 9,636 | 9,487 | 10,001 |
| Apr 15 | 9,673 | 9,588 | 10,002 |
| May 15 | 9,673 | 9,416 | 10,002 |
| Jun 15 | 9,581 | 9,375 | 10,002 |
| Jul 15 | 9,590 | 9,396 | 10,001 |
| Aug 15 | 9,545 | 9,407 | 10,003 |
| Sep 15 | 9,426 | 9,455 | 10,003 |
| Oct 15 | 9,490 | 9,475 | 10,002 |
| Nov 15 | 9,471 | 9,318 | 10,003 |
| Dec 15 | 9,365 | 9,368 | 10,006 |
| Jan 16 | 9,317 | 9,449 | 10,007 |
| Feb 16 | 9,231 | 9,659 | 10,009 |
| Mar 16 | 9,288 | 9,920 | 10,014 |
| Apr 16 | 9,365 | 10,052 | 10,016 |
| May 16 | 9,403 | 9,917 | 10,017 |
| Jun 16 | 9,394 | 10,207 | 10,021 |
| Jul 16 | 9,480 | 10,284 | 10,024 |
| Aug 16 | 9,538 | 10,234 | 10,026 |
| Sep 16 | 9,547 | 10,290 | 10,031 |
| Oct 16 | 9,624 | 10,005 | 10,033 |
| Nov 16 | 9,605 | 9,607 | 10,035 |
| Dec 16 | 9,672 | 9,563 | 10,039 |
| Jan 17 | 9,758 | 9,671 | 10,044 |
| Feb 17 | 9,778 | 9,717 | 10,048 |
| Mar 17 | 9,778 | 9,732 | 10,049 |
| Apr 17 | 9,797 | 9,841 | 10,056 |
| May 17 | 9,835 | 9,994 | 10,061 |
| Jun 17 | 9,835 | 9,985 | 10,070 |
| Jul 17 | 9,893 | 10,153 | 10,078 |
| Aug 17 | 9,893 | 10,253 | 10,088 |
| Sep 17 | 9,931 | 10,161 | 10,096 |
| Oct 17 | 9,979 | 10,122 | 10,105 |
| Nov 17 | 9,960 | 10,235 | 10,114 |
| Dec 17 | 9,983 | 10,270 | 10,125 |
| Jan 18 | 10,070 | 10,393 | 10,137 |
| Feb 18 | 10,070 | 10,301 | 10,147 |
| Mar 18 | 10,021 | 10,410 | 10,161 |
| Apr 18 | 10,050 | 10,243 | 10,174 |
| May 18 | 9,983 | 10,166 | 10,190 |
| Jun 18 | 9,944 | 10,121 | 10,207 |
| Jul 18 | 9,973 | 10,104 | 10,223 |
| Aug 18 | 10,002 | 10,114 | 10,241 |
| Sep 18 | 10,021 | 10,027 | 10,257 |
| Oct 18 | 9,973 | 9,915 | 10,275 |
| Nov 18 | 9,857 | 9,946 | 10,296 |
| Dec 18 | 9,784 | 10,147 | 10,315 |
| Jan 19 | 9,906 | 10,302 | 10,335 |
| Feb 19 | 9,978 | 10,242 | 10,354 |
| Mar 19 | 10,029 | 10,371 | 10,377 |
| Apr 19 | 10,131 | 10,340 | 10,396 |
| May 19 | 10,090 | 10,480 | 10,420 |
| Jun 19 | 10,171 | 10,712 | 10,443 |
| Jul 19 | 10,233 | 10,682 | 10,462 |
| Aug 19 | 10,284 | 10,900 | 10,483 |
| Sep 19 | 10,335 | 10,789 | 10,502 |
| Oct 19 | 10,335 | 10,861 | 10,522 |
| Nov 19 | 10,386 | 10,778 | 10,535 |
| Dec 19 | 10,483 | 10,841 | 10,550 |
| Jan 20 | 10,536 | 10,980 | 10,564 |
| Feb 20 | 10,493 | 11,053 | 10,580 |
| Mar 20 | 9,723 | 10,806 | 10,611 |
| Apr 20 | 9,892 | 11,018 | 10,611 |
| May 20 | 10,061 | 11,066 | 10,612 |
| Jun 20 | 10,166 | 11,165 | 10,613 |
| Jul 20 | 10,314 | 11,521 | 10,615 |
| Aug 20 | 10,367 | 11,503 | 10,616 |
| Sep 20 | 10,314 | 11,462 | 10,617 |
| Oct 20 | 10,346 | 11,473 | 10,618 |
| Nov 20 | 10,652 | 11,681 | 10,619 |
| Dec 20 | 10,871 | 11,838 | 10,620 |
| Jan 21 | 10,947 | 11,734 | 10,621 |
| Feb 21 | 11,068 | 11,532 | 10,622 |
| Mar 21 | 11,078 | 11,310 | 10,623 |
| Apr 21 | 11,144 | 11,453 | 10,623 |
| May 21 | 11,188 | 11,560 | 10,624 |
| Jun 21 | 11,242 | 11,458 | 10,623 |
| Jul 21 | 11,199 | 11,611 | 10,624 |
| Aug 21 | 11,232 | 11,563 | 10,624 |
| Sep 21 | 11,221 | 11,357 | 10,625 |
| Oct 21 | 11,177 | 11,330 | 10,624 |
| Nov 21 | 11,144 | 11,297 | 10,625 |
| Dec 21 | 11,211 | 11,281 | 10,626 |
| Jan 22 | 11,109 | 11,050 | 10,625 |
| Feb 22 | 10,974 | 10,918 | 10,627 |
| Mar 22 | 10,951 | 10,586 | 10,630 |
| Apr 22 | 10,838 | 10,006 | 10,632 |
| May 22 | 10,669 | 10,033 | 10,639 |
| Jun 22 | 10,330 | 9,711 | 10,642 |
| Jul 22 | 10,443 | 9,918 | 10,647 |
| Aug 22 | 10,476 | 9,526 | 10,665 |
| Sep 22 | 10,217 | 9,037 | 10,692 |
| Oct 22 | 10,194 | 8,975 | 10,709 |
| Nov 22 | 10,262 | 9,397 | 10,743 |
| Dec 22 | 10,292 | 9,448 | 10,782 |
| Jan 23 | 10,487 | 9,758 | 10,816 |
| Feb 23 | 10,511 | 9,434 | 10,851 |
| Mar 23 | 10,426 | 9,732 | 10,898 |
| Apr 23 | 10,596 | 9,775 | 10,932 |
| May 23 | 10,609 | 9,584 | 10,975 |
| Jun 23 | 10,657 | 9,583 | 11,025 |
| Jul 23 | 10,730 | 9,649 | 11,069 |
| Aug 23 | 10,779 | 9,517 | 11,119 |
| Sep 23 | 10,816 | 9,239 | 11,170 |
| Oct 23 | 10,779 | 9,129 | 11,220 |
| Nov 23 | 10,974 | 9,589 | 11,270 |
| Dec 23 | 11,187 | 9,988 | 11,323 |
| Jan 24 | 11,300 | 9,850 | 11,371 |
| Feb 24 | 11,338 | 9,726 | 11,418 |
| Mar 24 | 11,425 | 9,780 | 11,469 |
| Apr 24 | 11,425 | 9,533 | 11,518 |
| May 24 | 11,564 | 9,658 | 11,573 |
| Jun 24 | 11,639 | 9,672 | 11,621 |
| Jul 24 | 11,739 | 9,939 | 11,673 |
See “Average annual total returns” for additional information on fund performance.
Average annual total returns
| Average Annual Total Returns | 1 Year | 5 Years | 10 Years |
|---|
Investor A Shares ........................................................................................................................................................................................................................................................................................................................................................................................................................................................................................................................................................................................................................................................................................................................................................................................................................................................................................................................................................................................................................................ | 9.40% | 2.79% | 2.03% |
Investor A Shares (with sales charge)........................................................................................................................................................................................................................................................................................................................................................................................................................................................................................................................................................................................................................................................................................................................................................................................................................................................................................................................................................................................................................................ | 5.03 | 1.95 | 1.62 |
Bloomberg Global Aggregate Bond Index........................................................................................................................................................................................................................................................................................................................................................................................................................................................................................................................................................................................................................................................................................................................................................................................................................................................................................................................................................................................................................................ | 3.00 | (1.43) | (0.06) |
ICE BofA 3-Month U.S. Treasury Bill Index........................................................................................................................................................................................................................................................................................................................................................................................................................................................................................................................................................................................................................................................................................................................................................................................................................................................................................................................................................................................................................................ | 5.45 | 2.21 | 1.56 |
Assuming maximum sales charges. Average annual total returns with and without sales charges reflect reductions for service fees.
The Fund has added the Bloomberg Global Aggregate Bond Index in response to new regulatory requirements.
On September 17, 2018, the Fund acquired all of the assets, subject to the liabilities, of BlackRock Global Long/Short Credit Fund (the “Predecessor Fund”), a series of BlackRock FundsSM, through a tax-free reorganization (the “Reorganization”). The Predecessor Fund is the performance and accounting survivor of the Reorganization.
On December 1, 2023, the Fund began to compare its performance to the standard pricing time of the ICE BofA 3-Month U.S. Treasury Bill Index (the “Index”). Index data prior to March 1, 2021 is for the Index’s standard pricing time of 3pm. Index data from March 1, 2021 through November 30, 2023 is for a custom 4pm pricing variant of the Index. Index returns beginning on December 1, 2023 reflect the Index’s new standard pricing time of 4pm. The change of the Index’s standard pricing time from 3pm to 4pm resulted in the discontinuation of the custom 4pm pricing variant used from March 1, 2021 through November 30, 2023.
Net Assets........................................................................................................................................................................................................................................................................................................................................................................................................................................................................................................................................................................................................................................................................................................................................................................................................................................................................................................................................................................................................................................ | $872,029,693 |
Number of Portfolio Holdings........................................................................................................................................................................................................................................................................................................................................................................................................................................................................................................................................................................................................................................................................................................................................................................................................................................................................................................................................................................................................................................ | 926 |
Net Investment Advisory Fees........................................................................................................................................................................................................................................................................................................................................................................................................................................................................................................................................................................................................................................................................................................................................................................................................................................................................................................................................................................................................................................ | $9,223,077 |
Portfolio Turnover Rate........................................................................................................................................................................................................................................................................................................................................................................................................................................................................................................................................................................................................................................................................................................................................................................................................................................................................................................................................................................................................................................ | 110% |
Past performance is not an indication of future results. Performance results may include adjustments made for financial reporting purposes in accordance with U.S. generally accepted accounting principles. Performance results do not reflect the deduction of taxes that a shareholder would pay on fund distributions or on the redemption or sale of fund shares. Visit blackrock.com for more recent performance information.
What did the Fund invest in?
Credit quality allocation
| Percent of Total InvestmentsFootnote Reference(a) |
|---|
| Country/Geographic Region | Long | Short | Total |
|---|
United States........................................................................................................................................................................................................................................................................................................................................................................................................................................................................................................................................................................................................................................................................................................................................................................................................................................................................................................................................................................................................................................ | 47.2% | 1.1% | 48.3% |
United Kingdom........................................................................................................................................................................................................................................................................................................................................................................................................................................................................................................................................................................................................................................................................................................................................................................................................................................................................................................................................................................................................................................ | 9.5 | 0.6 | 10.1 |
Ireland........................................................................................................................................................................................................................................................................................................................................................................................................................................................................................................................................................................................................................................................................................................................................................................................................................................................................................................................................................................................................................................ | 9.9 | - | 9.9 |
Germany........................................................................................................................................................................................................................................................................................................................................................................................................................................................................................................................................................................................................................................................................................................................................................................................................................................................................................................................................................................................................................................ | 6.3 | 0.3 | 6.6 |
France........................................................................................................................................................................................................................................................................................................................................................................................................................................................................................................................................................................................................................................................................................................................................................................................................................................................................................................................................................................................................................................ | 3.9 | - | 3.9 |
Italy........................................................................................................................................................................................................................................................................................................................................................................................................................................................................................................................................................................................................................................................................................................................................................................................................................................................................................................................................................................................................................................ | 3.3 | 0.3 | 3.6 |
Spain........................................................................................................................................................................................................................................................................................................................................................................................................................................................................................................................................................................................................................................................................................................................................................................................................................................................................................................................................................................................................................................ | 2.8 | 0.4 | 3.2 |
Luxembourg........................................................................................................................................................................................................................................................................................................................................................................................................................................................................................................................................................................................................................................................................................................................................................................................................................................................................................................................................................................................................................................ | 2.4 | - | 2.4 |
Sweden........................................................................................................................................................................................................................................................................................................................................................................................................................................................................................................................................................................................................................................................................................................................................................................................................................................................................................................................................................................................................................................ | 1.2 | 0.7 | 1.9 |
Portugal........................................................................................................................................................................................................................................................................................................................................................................................................................................................................................................................................................................................................................................................................................................................................................................................................................................................................................................................................................................................................................................ | 1.8 | - | 1.8 |
OtherFootnote Reference(b) | 7.9 | 0.4 | 8.3 |
Total........................................................................................................................................................................................................................................................................................................................................................................................................................................................................................................................................................................................................................................................................................................................................................................................................................................................................................................................................................................................................................................ | 96.2% | 3.8% | 100.0% |
Credit RatingFootnote Reference(c) | Percent of Total InvestmentsFootnote Reference(d) |
|---|
AAA/AaaFootnote Reference(e)........................................................................................................................................................................................................................................................................................................................................................................................................................................................................................................................................................................................................................................................................................................................................................................................................................................................................................................................................................................................................................................ | 7.3% |
AA/Aa........................................................................................................................................................................................................................................................................................................................................................................................................................................................................................................................................................................................................................................................................................................................................................................................................................................................................................................................................................................................................................................ | 0.3 |
A........................................................................................................................................................................................................................................................................................................................................................................................................................................................................................................................................................................................................................................................................................................................................................................................................................................................................................................................................................................................................................................ | 0.7 |
BBB/Baa........................................................................................................................................................................................................................................................................................................................................................................................................................................................................................................................................................................................................................................................................................................................................................................................................................................................................................................................................................................................................................................ | 15.3 |
BB/Ba........................................................................................................................................................................................................................................................................................................................................................................................................................................................................................................................................................................................................................................................................................................................................................................................................................................................................................................................................................................................................................................ | 25.9 |
B........................................................................................................................................................................................................................................................................................................................................................................................................................................................................................................................................................................................................................................................................................................................................................................................................................................................................................................................................................................................................................................ | 30.3 |
CCC/Caa........................................................................................................................................................................................................................................................................................................................................................................................................................................................................................................................................................................................................................................................................................................................................................................................................................................................................................................................................................................................................................................ | 5.3 |
CC/Ca........................................................................................................................................................................................................................................................................................................................................................................................................................................................................................................................................................................................................................................................................................................................................................................................................................................................................................................................................................................................................................................ | 0.4 |
C........................................................................................................................................................................................................................................................................................................................................................................................................................................................................................................................................................................................................................................................................................................................................................................................................................................................................................................................................................................................................................................ | 0.0Footnote Reference(f) |
D........................................................................................................................................................................................................................................................................................................................................................................................................................................................................................................................................................................................................................................................................................................................................................................................................................................................................................................................................................................................................................................ | 0.3 |
NR........................................................................................................................................................................................................................................................................................................................................................................................................................................................................................................................................................................................................................................................................................................................................................................................................................................................................................................................................................................................................................................ | 14.2 |
| Footnote | Description |
Footnote(a) | Includes the gross market value of long and short securities and excludes short-term securities and options, if any. |
Footnote(b) | Ten largest country/geographic regions are presented. Additional country/geographic regions are found in Other. |
Footnote(c) | For purposes of this report, credit quality ratings shown above reflect the highest rating assigned by either S&P Global Ratings or Moody’s Investors Service, Inc. if ratings differ. These rating agencies are independent, nationally recognized statistical rating organizations and are widely used. Investment grade ratings are credit ratings of BBB/Baa or higher. Below investment grade ratings are credit ratings of BB/Ba or lower. Investments designated NR are not rated by either rating agency. Unrated investments do not necessarily indicate low credit quality. Credit quality ratings are subject to change. |
Footnote(d) | Excludes short-term securities, short investments and options, if any. |
Footnote(e) | The investment adviser evaluates the credit quality of unrated investments based upon certain factors including, but not limited to, credit ratings for similar investments and financial analysis of sectors, individual investments and/or issuers. Using this approach, the investment adviser has deemed unrated U.S. Government Sponsored Agency Securities and U.S. Treasury Obligations to be of similar credit quality as investments rated AAA/Aaa. |
Footnote(f) | Rounds to less than 0.1%. |
If you wish to view additional information about the Fund, including but not limited to financial statements, the Fund’s prospectus, and proxy voting policies and procedures, please visit blackrock.com/fundreports. For proxy voting records, visit blackrock.com/proxyrecords.
The Fund will mail only one copy of shareholder documents, including prospectuses, annual and semi-annual reports and proxy statements, to shareholders with multiple accounts at the same address. This practice is commonly called “householding” and is intended to reduce expenses and eliminate duplicate mailings of shareholder documents. Mailings of your shareholder documents may be householded indefinitely unless you instruct us otherwise. If you do not want the mailing of these documents to be combined with those for other members of your household, please call the Fund at (800) 441-7762.

The Fund is not sponsored, endorsed, issued, sold, or promoted by Bloomberg Index Services Limited, ICE Data Indices, LLC, and their respective affiliates, nor do these companies make any representation regarding the advisability of investing in the Fund. BlackRock is not affiliated with the companies listed above.
© 2024 BlackRock, Inc. or its affiliates. All rights reserved. BLACKROCK is a registered trademark of BlackRock, Inc. or its affiliates. All other trademarks are those of their respective owners.
BlackRock Global Long/Short Credit Fund
Investor A Shares | BGCAX
Annual Shareholder Report — July 31, 2024
BlackRock Global Long/Short Credit Fund
Investor C Shares | BGCCX
Annual Shareholder Report — July 31, 2024
This annual shareholder report contains important information about BlackRock Global Long/Short Credit Fund (the “Fund”) for the period of August 1, 2023 to July 31, 2024.You can find additional information about the Fund at blackrock.com/fundreports. You can also request this information by contacting us at (800) 441-7762.
What were the Fund costs for the last year?
(based on a hypothetical $10,000 investment)
| Class name | Costs of a $10,000 investment | Costs paid as a percentage of a $10,000 investment |
|---|
| Investor C Shares | $254 | 2.44% |
How did the Fund perform last year?
The global fixed-income markets produced positive returns during the reporting period, with income making a sizable contribution in the high interest rate environment.
Credit-oriented investments performed particularly well, as positive investor sentiment contributed to a narrowing of yield spreads.
What contributed to performance?
The Fund’s U.S. and European absolute return strategies and European traditional strategies contributed to performance. Specifically, idiosyncratic long positions, event-related trades, and thematic trades all made meaningful contributions. European absolute return strategies, particularly event-related trades, also contributed. European traditional strategies further helped results, primarily in high yield, financials, and mezzanine collateralized loan obligations.
As part of its investment strategy, the Fund used derivatives to manage duration (sensitivity to interest rate movements) and currency risk. The Fund also has the flexibility to utilize derivatives in order to express a positive or negative view on a particular issuer or sector, or to manage overall credit risk. Derivatives may also serve as a more liquid way to establish positions. The use of derivatives had a marginally positive impact on the Fund’s performance during the reporting period.
What detracted from performance?
At a time of positive returns for the broader market, few aspects of the Fund’s positioning detracted. With that said, idiosyncratic short positions in the Fund’s U.S. absolute return strategies, along with U.S. and European risk-management strategies, had small adverse effects.
The views expressed reflect the opinions of BlackRock as of the date of this report and are subject to change based on changes in market, economic or other conditions. These views are not intended to be a forecast of future events and are no guarantee of future results.
Cumulative performance: August 1, 2014 through July 31, 2024
Initial investment of $10,000
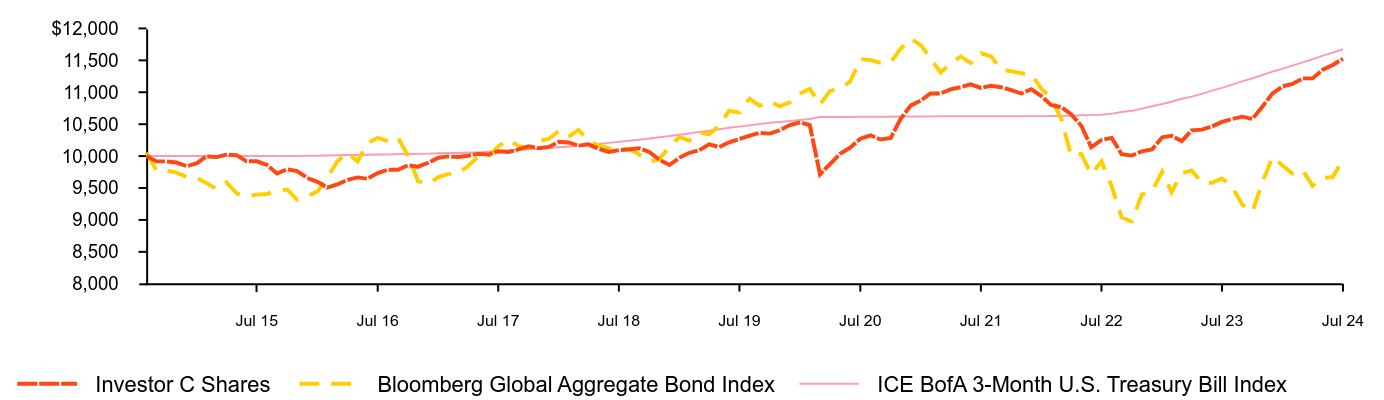
| Investor C Shares | Bloomberg Global Aggregate Bond Index | ICE BofA 3-Month U.S. Treasury Bill Index |
|---|
| Aug 14 | 10,000 | 10,055 | 10,000 |
| Sep 14 | 9,917 | 9,774 | 10,001 |
| Oct 14 | 9,917 | 9,776 | 10,001 |
| Nov 14 | 9,899 | 9,740 | 10,001 |
| Dec 14 | 9,842 | 9,673 | 10,001 |
| Jan 15 | 9,890 | 9,658 | 10,001 |
| Feb 15 | 9,995 | 9,579 | 10,001 |
| Mar 15 | 9,985 | 9,487 | 10,001 |
| Apr 15 | 10,023 | 9,588 | 10,002 |
| May 15 | 10,014 | 9,416 | 10,002 |
| Jun 15 | 9,918 | 9,375 | 10,002 |
| Jul 15 | 9,918 | 9,396 | 10,001 |
| Aug 15 | 9,861 | 9,407 | 10,003 |
| Sep 15 | 9,727 | 9,455 | 10,003 |
| Oct 15 | 9,794 | 9,475 | 10,002 |
| Nov 15 | 9,765 | 9,318 | 10,003 |
| Dec 15 | 9,656 | 9,368 | 10,006 |
| Jan 16 | 9,596 | 9,449 | 10,007 |
| Feb 16 | 9,506 | 9,659 | 10,009 |
| Mar 16 | 9,556 | 9,920 | 10,014 |
| Apr 16 | 9,626 | 10,052 | 10,016 |
| May 16 | 9,666 | 9,917 | 10,017 |
| Jun 16 | 9,646 | 10,207 | 10,021 |
| Jul 16 | 9,735 | 10,284 | 10,024 |
| Aug 16 | 9,785 | 10,234 | 10,026 |
| Sep 16 | 9,785 | 10,290 | 10,031 |
| Oct 16 | 9,855 | 10,005 | 10,033 |
| Nov 16 | 9,835 | 9,607 | 10,035 |
| Dec 16 | 9,895 | 9,563 | 10,039 |
| Jan 17 | 9,975 | 9,671 | 10,044 |
| Feb 17 | 9,995 | 9,717 | 10,048 |
| Mar 17 | 9,985 | 9,732 | 10,049 |
| Apr 17 | 10,005 | 9,841 | 10,056 |
| May 17 | 10,035 | 9,994 | 10,061 |
| Jun 17 | 10,025 | 9,985 | 10,070 |
| Jul 17 | 10,075 | 10,153 | 10,078 |
| Aug 17 | 10,065 | 10,253 | 10,088 |
| Sep 17 | 10,104 | 10,161 | 10,096 |
| Oct 17 | 10,154 | 10,122 | 10,105 |
| Nov 17 | 10,124 | 10,235 | 10,114 |
| Dec 17 | 10,144 | 10,270 | 10,125 |
| Jan 18 | 10,224 | 10,393 | 10,137 |
| Feb 18 | 10,214 | 10,301 | 10,147 |
| Mar 18 | 10,164 | 10,410 | 10,161 |
| Apr 18 | 10,184 | 10,243 | 10,174 |
| May 18 | 10,114 | 10,166 | 10,190 |
| Jun 18 | 10,065 | 10,121 | 10,207 |
| Jul 18 | 10,094 | 10,104 | 10,223 |
| Aug 18 | 10,104 | 10,114 | 10,241 |
| Sep 18 | 10,124 | 10,027 | 10,257 |
| Oct 18 | 10,065 | 9,915 | 10,275 |
| Nov 18 | 9,945 | 9,946 | 10,296 |
| Dec 18 | 9,861 | 10,147 | 10,315 |
| Jan 19 | 9,976 | 10,302 | 10,335 |
| Feb 19 | 10,049 | 10,242 | 10,354 |
| Mar 19 | 10,091 | 10,371 | 10,377 |
| Apr 19 | 10,185 | 10,340 | 10,396 |
| May 19 | 10,143 | 10,480 | 10,420 |
| Jun 19 | 10,216 | 10,712 | 10,443 |
| Jul 19 | 10,268 | 10,682 | 10,462 |
| Aug 19 | 10,321 | 10,900 | 10,483 |
| Sep 19 | 10,363 | 10,789 | 10,502 |
| Oct 19 | 10,352 | 10,861 | 10,522 |
| Nov 19 | 10,404 | 10,778 | 10,535 |
| Dec 19 | 10,486 | 10,841 | 10,550 |
| Jan 20 | 10,529 | 10,980 | 10,564 |
| Feb 20 | 10,486 | 11,053 | 10,580 |
| Mar 20 | 9,714 | 10,806 | 10,611 |
| Apr 20 | 9,875 | 11,018 | 10,611 |
| May 20 | 10,036 | 11,066 | 10,612 |
| Jun 20 | 10,133 | 11,165 | 10,613 |
| Jul 20 | 10,272 | 11,521 | 10,615 |
| Aug 20 | 10,326 | 11,503 | 10,616 |
| Sep 20 | 10,261 | 11,462 | 10,617 |
| Oct 20 | 10,283 | 11,473 | 10,618 |
| Nov 20 | 10,583 | 11,681 | 10,619 |
| Dec 20 | 10,794 | 11,838 | 10,620 |
| Jan 21 | 10,871 | 11,734 | 10,621 |
| Feb 21 | 10,981 | 11,532 | 10,622 |
| Mar 21 | 10,981 | 11,310 | 10,623 |
| Apr 21 | 11,046 | 11,453 | 10,623 |
| May 21 | 11,079 | 11,560 | 10,624 |
| Jun 21 | 11,123 | 11,458 | 10,623 |
| Jul 21 | 11,068 | 11,611 | 10,624 |
| Aug 21 | 11,101 | 11,563 | 10,624 |
| Sep 21 | 11,079 | 11,357 | 10,625 |
| Oct 21 | 11,035 | 11,330 | 10,624 |
| Nov 21 | 10,981 | 11,297 | 10,625 |
| Dec 21 | 11,049 | 11,281 | 10,626 |
| Jan 22 | 10,936 | 11,050 | 10,625 |
| Feb 22 | 10,802 | 10,918 | 10,627 |
| Mar 22 | 10,768 | 10,586 | 10,630 |
| Apr 22 | 10,656 | 10,006 | 10,632 |
| May 22 | 10,476 | 10,033 | 10,639 |
| Jun 22 | 10,140 | 9,711 | 10,642 |
| Jul 22 | 10,252 | 9,918 | 10,647 |
| Aug 22 | 10,285 | 9,526 | 10,665 |
| Sep 22 | 10,030 | 9,037 | 10,692 |
| Oct 22 | 10,008 | 8,975 | 10,709 |
| Nov 22 | 10,075 | 9,397 | 10,743 |
| Dec 22 | 10,104 | 9,448 | 10,782 |
| Jan 23 | 10,296 | 9,758 | 10,816 |
| Feb 23 | 10,319 | 9,434 | 10,851 |
| Mar 23 | 10,236 | 9,732 | 10,898 |
| Apr 23 | 10,403 | 9,775 | 10,932 |
| May 23 | 10,415 | 9,584 | 10,975 |
| Jun 23 | 10,463 | 9,583 | 11,025 |
| Jul 23 | 10,535 | 9,649 | 11,069 |
| Aug 23 | 10,583 | 9,517 | 11,119 |
| Sep 23 | 10,618 | 9,239 | 11,170 |
| Oct 23 | 10,583 | 9,129 | 11,220 |
| Nov 23 | 10,774 | 9,589 | 11,270 |
| Dec 23 | 10,983 | 9,988 | 11,323 |
| Jan 24 | 11,094 | 9,850 | 11,371 |
| Feb 24 | 11,131 | 9,726 | 11,418 |
| Mar 24 | 11,217 | 9,780 | 11,469 |
| Apr 24 | 11,217 | 9,533 | 11,518 |
| May 24 | 11,353 | 9,658 | 11,573 |
| Jun 24 | 11,427 | 9,672 | 11,621 |
| Jul 24 | 11,525 | 9,939 | 11,673 |
See “Average annual total returns” for additional information on fund performance.
Average annual total returns
| Average Annual Total Returns | 1 Year | 5 Years | 10 Years |
|---|
Investor C Shares ........................................................................................................................................................................................................................................................................................................................................................................................................................................................................................................................................................................................................................................................................................................................................................................................................................................................................................................................................................................................................................................ | 8.64% | 2.01% | 1.43% |
Investor C Shares (with sales charge)........................................................................................................................................................................................................................................................................................................................................................................................................................................................................................................................................................................................................................................................................................................................................................................................................................................................................................................................................................................................................................................ | 7.64 | 2.01 | 1.43 |
Bloomberg Global Aggregate Bond Index........................................................................................................................................................................................................................................................................................................................................................................................................................................................................................................................................................................................................................................................................................................................................................................................................................................................................................................................................................................................................................................ | 3.00 | (1.43) | (0.06) |
ICE BofA 3-Month U.S. Treasury Bill Index........................................................................................................................................................................................................................................................................................................................................................................................................................................................................................................................................................................................................................................................................................................................................................................................................................................................................................................................................................................................................................................ | 5.45 | 2.21 | 1.56 |
Assuming maximum sales charges. Average annual total returns with and without sales charges reflect reductions for distribution and service fees.
The Fund has added the Bloomberg Global Aggregate Bond Index in response to new regulatory requirements.
On September 17, 2018, the Fund acquired all of the assets, subject to the liabilities, of BlackRock Global Long/Short Credit Fund (the “Predecessor Fund”), a series of BlackRock FundsSM, through a tax-free reorganization (the “Reorganization”). The Predecessor Fund is the performance and accounting survivor of the Reorganization.
On December 1, 2023, the Fund began to compare its performance to the standard pricing time of the ICE BofA 3-Month U.S. Treasury Bill Index (the “Index”). Index data prior to March 1, 2021 is for the Index’s standard pricing time of 3pm. Index data from March 1, 2021 through November 30, 2023 is for a custom 4pm pricing variant of the Index. Index returns beginning on December 1, 2023 reflect the Index’s new standard pricing time of 4pm. The change of the Index’s standard pricing time from 3pm to 4pm resulted in the discontinuation of the custom 4pm pricing variant used from March 1, 2021 through November 30, 2023.
Net Assets........................................................................................................................................................................................................................................................................................................................................................................................................................................................................................................................................................................................................................................................................................................................................................................................................................................................................................................................................................................................................................................ | $872,029,693 |
Number of Portfolio Holdings........................................................................................................................................................................................................................................................................................................................................................................................................................................................................................................................................................................................................................................................................................................................................................................................................................................................................................................................................................................................................................................ | 926 |
Net Investment Advisory Fees........................................................................................................................................................................................................................................................................................................................................................................................................................................................................................................................................................................................................................................................................................................................................................................................................................................................................................................................................................................................................................................ | $9,223,077 |
Portfolio Turnover Rate........................................................................................................................................................................................................................................................................................................................................................................................................................................................................................................................................................................................................................................................................................................................................................................................................................................................................................................................................................................................................................................ | 110% |
Past performance is not an indication of future results. Performance results may include adjustments made for financial reporting purposes in accordance with U.S. generally accepted accounting principles. Performance results do not reflect the deduction of taxes that a shareholder would pay on fund distributions or on the redemption or sale of fund shares. Visit blackrock.com for more recent performance information.
What did the Fund invest in?
Credit quality allocation
| Percent of Total InvestmentsFootnote Reference(a) |
|---|
| Country/Geographic Region | Long | Short | Total |
|---|
United States........................................................................................................................................................................................................................................................................................................................................................................................................................................................................................................................................................................................................................................................................................................................................................................................................................................................................................................................................................................................................................................ | 47.2% | 1.1% | 48.3% |
United Kingdom........................................................................................................................................................................................................................................................................................................................................................................................................................................................................................................................................................................................................................................................................................................................................................................................................................................................................................................................................................................................................................................ | 9.5 | 0.6 | 10.1 |
Ireland........................................................................................................................................................................................................................................................................................................................................................................................................................................................................................................................................................................................................................................................................................................................................................................................................................................................................................................................................................................................................................................ | 9.9 | - | 9.9 |
Germany........................................................................................................................................................................................................................................................................................................................................................................................................................................................................................................................................................................................................................................................................................................................................................................................................................................................................................................................................................................................................................................ | 6.3 | 0.3 | 6.6 |
France........................................................................................................................................................................................................................................................................................................................................................................................................................................................................................................................................................................................................................................................................................................................................................................................................................................................................................................................................................................................................................................ | 3.9 | - | 3.9 |
Italy........................................................................................................................................................................................................................................................................................................................................................................................................................................................................................................................................................................................................................................................................................................................................................................................................................................................................................................................................................................................................................................ | 3.3 | 0.3 | 3.6 |
Spain........................................................................................................................................................................................................................................................................................................................................................................................................................................................................................................................................................................................................................................................................................................................................................................................................................................................................................................................................................................................................................................ | 2.8 | 0.4 | 3.2 |
Luxembourg........................................................................................................................................................................................................................................................................................................................................................................................................................................................................................................................................................................................................................................................................................................................................................................................................................................................................................................................................................................................................................................ | 2.4 | - | 2.4 |
Sweden........................................................................................................................................................................................................................................................................................................................................................................................................................................................................................................................................................................................................................................................................................................................................................................................................................................................................................................................................................................................................................................ | 1.2 | 0.7 | 1.9 |
Portugal........................................................................................................................................................................................................................................................................................................................................................................................................................................................................................................................................................................................................................................................................................................................................................................................................................................................................................................................................................................................................................................ | 1.8 | - | 1.8 |
OtherFootnote Reference(b) | 7.9 | 0.4 | 8.3 |
Total........................................................................................................................................................................................................................................................................................................................................................................................................................................................................................................................................................................................................................................................................................................................................................................................................................................................................................................................................................................................................................................ | 96.2% | 3.8% | 100.0% |
Credit RatingFootnote Reference(c) | Percent of Total InvestmentsFootnote Reference(d) |
|---|
AAA/AaaFootnote Reference(e)........................................................................................................................................................................................................................................................................................................................................................................................................................................................................................................................................................................................................................................................................................................................................................................................................................................................................................................................................................................................................................................ | 7.3% |
AA/Aa........................................................................................................................................................................................................................................................................................................................................................................................................................................................................................................................................................................................................................................................................................................................................................................................................................................................................................................................................................................................................................................ | 0.3 |
A........................................................................................................................................................................................................................................................................................................................................................................................................................................................................................................................................................................................................................................................................................................................................................................................................................................................................................................................................................................................................................................ | 0.7 |
BBB/Baa........................................................................................................................................................................................................................................................................................................................................................................................................................................................................................................................................................................................................................................................................................................................................................................................................................................................................................................................................................................................................................................ | 15.3 |
BB/Ba........................................................................................................................................................................................................................................................................................................................................................................................................................................................................................................................................................................................................................................................................................................................................................................................................................................................................................................................................................................................................................................ | 25.9 |
B........................................................................................................................................................................................................................................................................................................................................................................................................................................................................................................................................................................................................................................................................................................................................................................................................................................................................................................................................................................................................................................ | 30.3 |
CCC/Caa........................................................................................................................................................................................................................................................................................................................................................................................................................................................................................................................................................................................................................................................................................................................................................................................................................................................................................................................................................................................................................................ | 5.3 |
CC/Ca........................................................................................................................................................................................................................................................................................................................................................................................................................................................................................................................................................................................................................................................................................................................................................................................................................................................................................................................................................................................................................................ | 0.4 |
C........................................................................................................................................................................................................................................................................................................................................................................................................................................................................................................................................................................................................................................................................................................................................................................................................................................................................................................................................................................................................................................ | 0.0Footnote Reference(f) |
D........................................................................................................................................................................................................................................................................................................................................................................................................................................................................................................................................................................................................................................................................................................................................................................................................................................................................................................................................................................................................................................ | 0.3 |
NR........................................................................................................................................................................................................................................................................................................................................................................................................................................................................................................................................................................................................................................................................................................................................................................................................................................................................................................................................................................................................................................ | 14.2 |
| Footnote | Description |
Footnote(a) | Includes the gross market value of long and short securities and excludes short-term securities and options, if any. |
Footnote(b) | Ten largest country/geographic regions are presented. Additional country/geographic regions are found in Other. |
Footnote(c) | For purposes of this report, credit quality ratings shown above reflect the highest rating assigned by either S&P Global Ratings or Moody’s Investors Service, Inc. if ratings differ. These rating agencies are independent, nationally recognized statistical rating organizations and are widely used. Investment grade ratings are credit ratings of BBB/Baa or higher. Below investment grade ratings are credit ratings of BB/Ba or lower. Investments designated NR are not rated by either rating agency. Unrated investments do not necessarily indicate low credit quality. Credit quality ratings are subject to change. |
Footnote(d) | Excludes short-term securities, short investments and options, if any. |
Footnote(e) | The investment adviser evaluates the credit quality of unrated investments based upon certain factors including, but not limited to, credit ratings for similar investments and financial analysis of sectors, individual investments and/or issuers. Using this approach, the investment adviser has deemed unrated U.S. Government Sponsored Agency Securities and U.S. Treasury Obligations to be of similar credit quality as investments rated AAA/Aaa. |
Footnote(f) | Rounds to less than 0.1%. |
If you wish to view additional information about the Fund, including but not limited to financial statements, the Fund’s prospectus, and proxy voting policies and procedures, please visit blackrock.com/fundreports. For proxy voting records, visit blackrock.com/proxyrecords.
The Fund will mail only one copy of shareholder documents, including prospectuses, annual and semi-annual reports and proxy statements, to shareholders with multiple accounts at the same address. This practice is commonly called “householding” and is intended to reduce expenses and eliminate duplicate mailings of shareholder documents. Mailings of your shareholder documents may be householded indefinitely unless you instruct us otherwise. If you do not want the mailing of these documents to be combined with those for other members of your household, please call the Fund at (800) 441-7762.

The Fund is not sponsored, endorsed, issued, sold, or promoted by Bloomberg Index Services Limited, ICE Data Indices, LLC, and their respective affiliates, nor do these companies make any representation regarding the advisability of investing in the Fund. BlackRock is not affiliated with the companies listed above.
© 2024 BlackRock, Inc. or its affiliates. All rights reserved. BLACKROCK is a registered trademark of BlackRock, Inc. or its affiliates. All other trademarks are those of their respective owners.
BlackRock Global Long/Short Credit Fund
Investor C Shares | BGCCX
Annual Shareholder Report — July 31, 2024
BlackRock Global Long/Short Credit Fund
Annual Shareholder Report — July 31, 2024
This annual shareholder report contains important information about BlackRock Global Long/Short Credit Fund (the “Fund”) for the period of August 1, 2023 to July 31, 2024.You can find additional information about the Fund at blackrock.com/fundreports. You can also request this information by contacting us at (800) 441-7762.
What were the Fund costs for the last year?
(based on a hypothetical $10,000 investment)
| Class name | Costs of a $10,000 investment | Costs paid as a percentage of a $10,000 investment |
|---|
| Class K Shares | $144 | 1.37% |
How did the Fund perform last year?
The global fixed-income markets produced positive returns during the reporting period, with income making a sizable contribution in the high interest rate environment.
Credit-oriented investments performed particularly well, as positive investor sentiment contributed to a narrowing of yield spreads.
What contributed to performance?
The Fund’s U.S. and European absolute return strategies and European traditional strategies contributed to performance. Specifically, idiosyncratic long positions, event-related trades, and thematic trades all made meaningful contributions. European absolute return strategies, particularly event-related trades, also contributed. European traditional strategies further helped results, primarily in high yield, financials, and mezzanine collateralized loan obligations.
As part of its investment strategy, the Fund used derivatives to manage duration (sensitivity to interest rate movements) and currency risk. The Fund also has the flexibility to utilize derivatives in order to express a positive or negative view on a particular issuer or sector, or to manage overall credit risk. Derivatives may also serve as a more liquid way to establish positions. The use of derivatives had a marginally positive impact on the Fund’s performance during the reporting period.
What detracted from performance?
At a time of positive returns for the broader market, few aspects of the Fund’s positioning detracted. With that said, idiosyncratic short positions in the Fund’s U.S. absolute return strategies, along with U.S. and European risk-management strategies, had small adverse effects.
The views expressed reflect the opinions of BlackRock as of the date of this report and are subject to change based on changes in market, economic or other conditions. These views are not intended to be a forecast of future events and are no guarantee of future results.
Cumulative performance: August 1, 2014 through July 31, 2024
Initial investment of $10,000
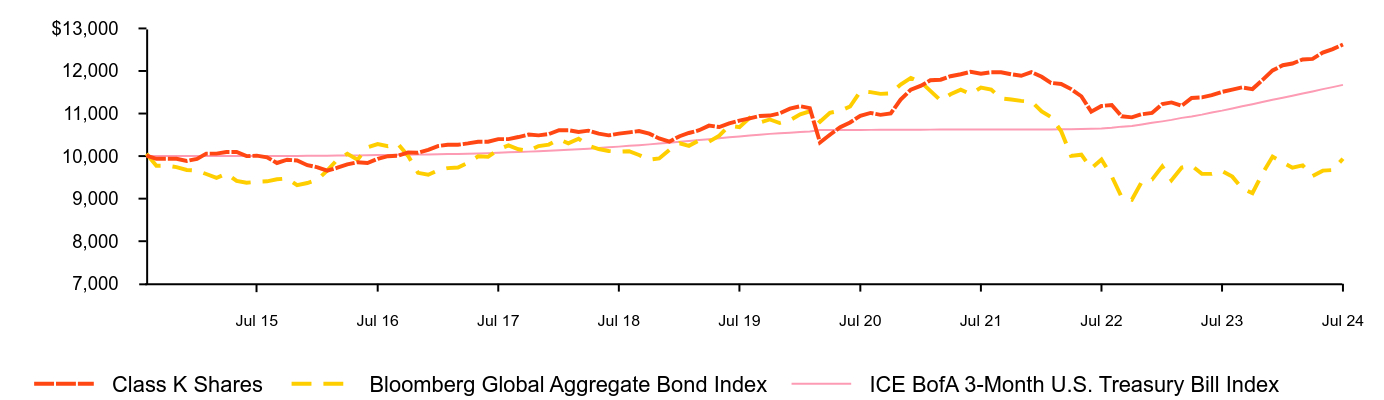
| Class K Shares | Bloomberg Global Aggregate Bond Index | ICE BofA 3-Month U.S. Treasury Bill Index |
|---|
| Aug 14 | 10,009 | 10,055 | 10,000 |
| Sep 14 | 9,936 | 9,774 | 10,001 |
| Oct 14 | 9,936 | 9,776 | 10,001 |
| Nov 14 | 9,936 | 9,740 | 10,001 |
| Dec 14 | 9,886 | 9,673 | 10,001 |
| Jan 15 | 9,934 | 9,658 | 10,001 |
| Feb 15 | 10,058 | 9,579 | 10,001 |
| Mar 15 | 10,058 | 9,487 | 10,001 |
| Apr 15 | 10,096 | 9,588 | 10,002 |
| May 15 | 10,096 | 9,416 | 10,002 |
| Jun 15 | 10,000 | 9,375 | 10,002 |
| Jul 15 | 10,010 | 9,396 | 10,001 |
| Aug 15 | 9,972 | 9,407 | 10,003 |
| Sep 15 | 9,838 | 9,455 | 10,003 |
| Oct 15 | 9,915 | 9,475 | 10,002 |
| Nov 15 | 9,896 | 9,318 | 10,003 |
| Dec 15 | 9,787 | 9,368 | 10,006 |
| Jan 16 | 9,737 | 9,449 | 10,007 |
| Feb 16 | 9,657 | 9,659 | 10,009 |
| Mar 16 | 9,727 | 9,920 | 10,014 |
| Apr 16 | 9,807 | 10,052 | 10,016 |
| May 16 | 9,857 | 9,917 | 10,017 |
| Jun 16 | 9,837 | 10,207 | 10,021 |
| Jul 16 | 9,937 | 10,284 | 10,024 |
| Aug 16 | 9,997 | 10,234 | 10,026 |
| Sep 16 | 10,007 | 10,290 | 10,031 |
| Oct 16 | 10,087 | 10,005 | 10,033 |
| Nov 16 | 10,077 | 9,607 | 10,035 |
| Dec 16 | 10,147 | 9,563 | 10,039 |
| Jan 17 | 10,238 | 9,671 | 10,044 |
| Feb 17 | 10,268 | 9,717 | 10,048 |
| Mar 17 | 10,268 | 9,732 | 10,049 |
| Apr 17 | 10,298 | 9,841 | 10,056 |
| May 17 | 10,338 | 9,994 | 10,061 |
| Jun 17 | 10,338 | 9,985 | 10,070 |
| Jul 17 | 10,398 | 10,153 | 10,078 |
| Aug 17 | 10,398 | 10,253 | 10,088 |
| Sep 17 | 10,448 | 10,161 | 10,096 |
| Oct 17 | 10,508 | 10,122 | 10,105 |
| Nov 17 | 10,488 | 10,235 | 10,114 |
| Dec 17 | 10,517 | 10,270 | 10,125 |
| Jan 18 | 10,609 | 10,393 | 10,137 |
| Feb 18 | 10,609 | 10,301 | 10,147 |
| Mar 18 | 10,568 | 10,410 | 10,161 |
| Apr 18 | 10,598 | 10,243 | 10,174 |
| May 18 | 10,527 | 10,166 | 10,190 |
| Jun 18 | 10,487 | 10,121 | 10,207 |
| Jul 18 | 10,527 | 10,104 | 10,223 |
| Aug 18 | 10,558 | 10,114 | 10,241 |
| Sep 18 | 10,588 | 10,027 | 10,257 |
| Oct 18 | 10,527 | 9,915 | 10,275 |
| Nov 18 | 10,416 | 9,946 | 10,296 |
| Dec 18 | 10,339 | 10,147 | 10,315 |
| Jan 19 | 10,468 | 10,302 | 10,335 |
| Feb 19 | 10,543 | 10,242 | 10,354 |
| Mar 19 | 10,608 | 10,371 | 10,377 |
| Apr 19 | 10,716 | 10,340 | 10,396 |
| May 19 | 10,683 | 10,480 | 10,420 |
| Jun 19 | 10,769 | 10,712 | 10,443 |
| Jul 19 | 10,834 | 10,682 | 10,462 |
| Aug 19 | 10,888 | 10,900 | 10,483 |
| Sep 19 | 10,942 | 10,789 | 10,502 |
| Oct 19 | 10,953 | 10,861 | 10,522 |
| Nov 19 | 11,006 | 10,778 | 10,535 |
| Dec 19 | 11,115 | 10,841 | 10,550 |
| Jan 20 | 11,171 | 10,980 | 10,564 |
| Feb 20 | 11,126 | 11,053 | 10,580 |
| Mar 20 | 10,321 | 10,806 | 10,611 |
| Apr 20 | 10,500 | 11,018 | 10,611 |
| May 20 | 10,679 | 11,066 | 10,612 |
| Jun 20 | 10,791 | 11,165 | 10,613 |
| Jul 20 | 10,947 | 11,521 | 10,615 |
| Aug 20 | 11,014 | 11,503 | 10,616 |
| Sep 20 | 10,970 | 11,462 | 10,617 |
| Oct 20 | 11,003 | 11,473 | 10,618 |
| Nov 20 | 11,327 | 11,681 | 10,619 |
| Dec 20 | 11,562 | 11,838 | 10,620 |
| Jan 21 | 11,655 | 11,734 | 10,621 |
| Feb 21 | 11,783 | 11,532 | 10,622 |
| Mar 21 | 11,795 | 11,310 | 10,623 |
| Apr 21 | 11,876 | 11,453 | 10,623 |
| May 21 | 11,923 | 11,560 | 10,624 |
| Jun 21 | 11,981 | 11,458 | 10,623 |
| Jul 21 | 11,934 | 11,611 | 10,624 |
| Aug 21 | 11,969 | 11,563 | 10,624 |
| Sep 21 | 11,969 | 11,357 | 10,625 |
| Oct 21 | 11,923 | 11,330 | 10,624 |
| Nov 21 | 11,888 | 11,297 | 10,625 |
| Dec 21 | 11,972 | 11,281 | 10,626 |
| Jan 22 | 11,864 | 11,050 | 10,625 |
| Feb 22 | 11,719 | 10,918 | 10,627 |
| Mar 22 | 11,695 | 10,586 | 10,630 |
| Apr 22 | 11,575 | 10,006 | 10,632 |
| May 22 | 11,406 | 10,033 | 10,639 |
| Jun 22 | 11,044 | 9,711 | 10,642 |
| Jul 22 | 11,177 | 9,918 | 10,647 |
| Aug 22 | 11,201 | 9,526 | 10,665 |
| Sep 22 | 10,936 | 9,037 | 10,692 |
| Oct 22 | 10,911 | 8,975 | 10,709 |
| Nov 22 | 10,984 | 9,397 | 10,743 |
| Dec 22 | 11,013 | 9,448 | 10,782 |
| Jan 23 | 11,222 | 9,758 | 10,816 |
| Feb 23 | 11,261 | 9,434 | 10,851 |
| Mar 23 | 11,183 | 9,732 | 10,898 |
| Apr 23 | 11,366 | 9,775 | 10,932 |
| May 23 | 11,379 | 9,584 | 10,975 |
| Jun 23 | 11,431 | 9,583 | 11,025 |
| Jul 23 | 11,510 | 9,649 | 11,069 |
| Aug 23 | 11,562 | 9,517 | 11,119 |
| Sep 23 | 11,614 | 9,239 | 11,170 |
| Oct 23 | 11,575 | 9,129 | 11,220 |
| Nov 23 | 11,784 | 9,589 | 11,270 |
| Dec 23 | 12,013 | 9,988 | 11,323 |
| Jan 24 | 12,135 | 9,850 | 11,371 |
| Feb 24 | 12,175 | 9,726 | 11,418 |
| Mar 24 | 12,270 | 9,780 | 11,469 |
| Apr 24 | 12,283 | 9,533 | 11,518 |
| May 24 | 12,432 | 9,658 | 11,573 |
| Jun 24 | 12,513 | 9,672 | 11,621 |
| Jul 24 | 12,621 | 9,939 | 11,673 |
See “Average annual total returns” for additional information on fund performance.
Average annual total returns
| Average Annual Total Returns | 1 Year | 5 Years | 10 Years |
|---|
Class K Shares ........................................................................................................................................................................................................................................................................................................................................................................................................................................................................................................................................................................................................................................................................................................................................................................................................................................................................................................................................................................................................................................ | 9.66% | 3.10% | 2.36% |
Bloomberg Global Aggregate Bond Index........................................................................................................................................................................................................................................................................................................................................................................................................................................................................................................................................................................................................................................................................................................................................................................................................................................................................................................................................................................................................................................ | 3.00 | (1.43) | (0.06) |
ICE BofA 3-Month U.S. Treasury Bill Index........................................................................................................................................................................................................................................................................................................................................................................................................................................................................................................................................................................................................................................................................................................................................................................................................................................................................................................................................................................................................................................ | 5.45 | 2.21 | 1.56 |
The Fund has added the Bloomberg Global Aggregate Bond Index in response to new regulatory requirements.
On September 17, 2018, the Fund acquired all of the assets, subject to the liabilities, of BlackRock Global Long/Short Credit Fund (the “Predecessor Fund”), a series of BlackRock FundsSM, through a tax-free reorganization (the “Reorganization”). The Predecessor Fund is the performance and accounting survivor of the Reorganization.
Performance shown prior to the Class K Shares inception date of March 28, 2016 is that of Institutional Shares. The performance of Class K Shares would be substantially similar to Institutional Shares because Class K Shares and Institutional Shares invest in the same portfolio of securities and performance would only differ to the extent that Class K Shares and Institutional Shares have different expenses. The actual returns of Class K Shares would have been higher than those of the Institutional Shares because Class K Shares have lower expenses than the Institutional Shares.
On December 1, 2023, the Fund began to compare its performance to the standard pricing time of the ICE BofA 3-Month U.S. Treasury Bill Index (the “Index”). Index data prior to March 1, 2021 is for the Index’s standard pricing time of 3pm. Index data from March 1, 2021 through November 30, 2023 is for a custom 4pm pricing variant of the Index. Index returns beginning on December 1, 2023 reflect the Index’s new standard pricing time of 4pm. The change of the Index’s standard pricing time from 3pm to 4pm resulted in the discontinuation of the custom 4pm pricing variant used from March 1, 2021 through November 30, 2023.
Net Assets........................................................................................................................................................................................................................................................................................................................................................................................................................................................................................................................................................................................................................................................................................................................................................................................................................................................................................................................................................................................................................................ | $872,029,693 |
Number of Portfolio Holdings........................................................................................................................................................................................................................................................................................................................................................................................................................................................................................................................................................................................................................................................................................................................................................................................................................................................................................................................................................................................................................................ | 926 |
Net Investment Advisory Fees........................................................................................................................................................................................................................................................................................................................................................................................................................................................................................................................................................................................................................................................................................................................................................................................................................................................................................................................................................................................................................................ | $9,223,077 |
Portfolio Turnover Rate........................................................................................................................................................................................................................................................................................................................................................................................................................................................................................................................................................................................................................................................................................................................................................................................................................................................................................................................................................................................................................................ | 110% |
Past performance is not an indication of future results. Performance results may include adjustments made for financial reporting purposes in accordance with U.S. generally accepted accounting principles. Performance results do not reflect the deduction of taxes that a shareholder would pay on fund distributions or on the redemption or sale of fund shares. Visit blackrock.com for more recent performance information.
What did the Fund invest in?
Credit quality allocation
| Percent of Total InvestmentsFootnote Reference(a) |
|---|
| Country/Geographic Region | Long | Short | Total |
|---|
United States........................................................................................................................................................................................................................................................................................................................................................................................................................................................................................................................................................................................................................................................................................................................................................................................................................................................................................................................................................................................................................................ | 47.2% | 1.1% | 48.3% |
United Kingdom........................................................................................................................................................................................................................................................................................................................................................................................................................................................................................................................................................................................................................................................................................................................................................................................................................................................................................................................................................................................................................................ | 9.5 | 0.6 | 10.1 |
Ireland........................................................................................................................................................................................................................................................................................................................................................................................................................................................................................................................................................................................................................................................................................................................................................................................................................................................................................................................................................................................................................................ | 9.9 | - | 9.9 |
Germany........................................................................................................................................................................................................................................................................................................................................................................................................................................................................................................................................................................................................................................................................................................................................................................................................................................................................................................................................................................................................................................ | 6.3 | 0.3 | 6.6 |
France........................................................................................................................................................................................................................................................................................................................................................................................................................................................................................................................................................................................................................................................................................................................................................................................................................................................................................................................................................................................................................................ | 3.9 | - | 3.9 |
Italy........................................................................................................................................................................................................................................................................................................................................................................................................................................................................................................................................................................................................................................................................................................................................................................................................................................................................................................................................................................................................................................ | 3.3 | 0.3 | 3.6 |
Spain........................................................................................................................................................................................................................................................................................................................................................................................................................................................................................................................................................................................................................................................................................................................................................................................................................................................................................................................................................................................................................................ | 2.8 | 0.4 | 3.2 |
Luxembourg........................................................................................................................................................................................................................................................................................................................................................................................................................................................................................................................................................................................................................................................................................................................................................................................................................................................................................................................................................................................................................................ | 2.4 | - | 2.4 |
Sweden........................................................................................................................................................................................................................................................................................................................................................................................................................................................................................................................................................................................................................................................................................................................................................................................................................................................................................................................................................................................................................................ | 1.2 | 0.7 | 1.9 |
Portugal........................................................................................................................................................................................................................................................................................................................................................................................................................................................................................................................................................................................................................................................................................................................................................................................................................................................................................................................................................................................................................................ | 1.8 | - | 1.8 |
OtherFootnote Reference(b) | 7.9 | 0.4 | 8.3 |
Total........................................................................................................................................................................................................................................................................................................................................................................................................................................................................................................................................................................................................................................................................................................................................................................................................................................................................................................................................................................................................................................ | 96.2% | 3.8% | 100.0% |
Credit RatingFootnote Reference(c) | Percent of Total InvestmentsFootnote Reference(d) |
|---|
AAA/AaaFootnote Reference(e)........................................................................................................................................................................................................................................................................................................................................................................................................................................................................................................................................................................................................................................................................................................................................................................................................................................................................................................................................................................................................................................ | 7.3% |
AA/Aa........................................................................................................................................................................................................................................................................................................................................................................................................................................................................................................................................................................................................................................................................................................................................................................................................................................................................................................................................................................................................................................ | 0.3 |
A........................................................................................................................................................................................................................................................................................................................................................................................................................................................................................................................................................................................................................................................................................................................................................................................................................................................................................................................................................................................................................................ | 0.7 |
BBB/Baa........................................................................................................................................................................................................................................................................................................................................................................................................................................................................................................................................................................................................................................................................................................................................................................................................................................................................................................................................................................................................................................ | 15.3 |
BB/Ba........................................................................................................................................................................................................................................................................................................................................................................................................................................................................................................................................................................................................................................................................................................................................................................................................................................................................................................................................................................................................................................ | 25.9 |
B........................................................................................................................................................................................................................................................................................................................................................................................................................................................................................................................................................................................................................................................................................................................................................................................................................................................................................................................................................................................................................................ | 30.3 |
CCC/Caa........................................................................................................................................................................................................................................................................................................................................................................................................................................................................................................................................................................................................................................................................................................................................................................................................................................................................................................................................................................................................................................ | 5.3 |
CC/Ca........................................................................................................................................................................................................................................................................................................................................................................................................................................................................................................................................................................................................................................................................................................................................................................................................................................................................................................................................................................................................................................ | 0.4 |
C........................................................................................................................................................................................................................................................................................................................................................................................................................................................................................................................................................................................................................................................................................................................................................................................................................................................................................................................................................................................................................................ | 0.0Footnote Reference(f) |
D........................................................................................................................................................................................................................................................................................................................................................................................................................................................................................................................................................................................................................................................................................................................................................................................................................................................................................................................................................................................................................................ | 0.3 |
NR........................................................................................................................................................................................................................................................................................................................................................................................................................................................................................................................................................................................................................................................................................................................................................................................................................................................................................................................................................................................................................................ | 14.2 |
| Footnote | Description |
Footnote(a) | Includes the gross market value of long and short securities and excludes short-term securities and options, if any. |
Footnote(b) | Ten largest country/geographic regions are presented. Additional country/geographic regions are found in Other. |
Footnote(c) | For purposes of this report, credit quality ratings shown above reflect the highest rating assigned by either S&P Global Ratings or Moody’s Investors Service, Inc. if ratings differ. These rating agencies are independent, nationally recognized statistical rating organizations and are widely used. Investment grade ratings are credit ratings of BBB/Baa or higher. Below investment grade ratings are credit ratings of BB/Ba or lower. Investments designated NR are not rated by either rating agency. Unrated investments do not necessarily indicate low credit quality. Credit quality ratings are subject to change. |
Footnote(d) | Excludes short-term securities, short investments and options, if any. |
Footnote(e) | The investment adviser evaluates the credit quality of unrated investments based upon certain factors including, but not limited to, credit ratings for similar investments and financial analysis of sectors, individual investments and/or issuers. Using this approach, the investment adviser has deemed unrated U.S. Government Sponsored Agency Securities and U.S. Treasury Obligations to be of similar credit quality as investments rated AAA/Aaa. |
Footnote(f) | Rounds to less than 0.1%. |
If you wish to view additional information about the Fund, including but not limited to financial statements, the Fund’s prospectus, and proxy voting policies and procedures, please visit blackrock.com/fundreports. For proxy voting records, visit blackrock.com/proxyrecords.
The Fund will mail only one copy of shareholder documents, including prospectuses, annual and semi-annual reports and proxy statements, to shareholders with multiple accounts at the same address. This practice is commonly called “householding” and is intended to reduce expenses and eliminate duplicate mailings of shareholder documents. Mailings of your shareholder documents may be householded indefinitely unless you instruct us otherwise. If you do not want the mailing of these documents to be combined with those for other members of your household, please call the Fund at (800) 441-7762.

The Fund is not sponsored, endorsed, issued, sold, or promoted by Bloomberg Index Services Limited, ICE Data Indices, LLC, and their respective affiliates, nor do these companies make any representation regarding the advisability of investing in the Fund. BlackRock is not affiliated with the companies listed above.
© 2024 BlackRock, Inc. or its affiliates. All rights reserved. BLACKROCK is a registered trademark of BlackRock, Inc. or its affiliates. All other trademarks are those of their respective owners.
BlackRock Global Long/Short Credit Fund
Annual Shareholder Report — July 31, 2024
(b) Not Applicable
Item 2 – Code of Ethics – The registrant (or the “Fund”) has adopted a code of ethics, as of the end of the period covered by this report, applicable to the registrant’s principal executive officer, principal financial officer, principal accounting officer or controller, or persons performing similar functions. During the period covered by this report, the code of ethics was amended to update certain information and to make other non-material changes. During the period covered by this report, there have been no waivers granted under the code of ethics. The registrant undertakes to provide a copy of the code of ethics to any person upon request, without charge, who calls 1-800-441-7762.
Item 3 – Audit Committee Financial Expert – The registrant’s board of directors (the “board of directors”), has determined that (i) the registrant has the following audit committee financial experts serving on its audit committee and (ii) each audit committee financial expert is independent:
Lorenzo A. Flores
Catherine A. Lynch
Arthur P. Steinmetz
Under applicable securities laws, a person determined to be an audit committee financial expert will not be deemed an “expert” for any purpose, including without limitation for the purposes of Section 11 of the Securities Act of 1933, as a result of being designated or identified as an audit committee financial expert. The designation or identification of a person as an audit committee financial expert does not impose on such person any duties, obligations, or liabilities greater than the duties, obligations, and liabilities imposed on such person as a member of the audit committee and board of directors in the absence of such designation or identification. The designation or identification of a person as an audit committee financial expert does not affect the duties, obligations, or liability of any other member of the audit committee or board of directors.
Item 4 – Principal Accountant Fees and Services
The following table presents fees billed by PricewaterhouseCoopers LLP (“PwC”) in each of the last two fiscal years for the services rendered to the Fund:
| | (a) Audit Fees | (b) Audit-Related Fees1 | (c) Tax Fees2 | (d) All Other Fees |
Entity Name | Current Fiscal Year End | Previous Fiscal Year End | Current Fiscal Year End | Previous Fiscal Year End3 | Current Fiscal Year End | Previous Fiscal Year End | Current Fiscal Year End | Previous Fiscal Year End |
| BlackRock Global Long/Short Credit Fund | $ 77,871 | $77,871 | $0 | $0 | $28,080 | $28,080 | $0 | $303 |
The following table presents fees billed by PwC that were required to be approved by the registrant’s audit committee (the “Committee”) for services that relate directly to the operations or financial reporting of the Fund and that are rendered on behalf of BlackRock Advisors, LLC (the “Investment Adviser” or “BlackRock”) and entities controlling, controlled by, or under common control with BlackRock (not including any sub-adviser whose role is primarily portfolio management and is subcontracted with or overseen by another investment adviser) that provide ongoing services to the Fund (“Affiliated Service Providers”):
| | Current Fiscal Year End | Previous Fiscal Year End |
(b) Audit-Related Fees1 | $0 | $0 |
(c) Tax Fees2 | $0 | $0 |
(d) All Other Fees | $0 | $0 |
1 The nature of the services includes assurance and related services reasonably related to the performance of the audit or review of financial statements not included in Audit Fees, including accounting consultations, agreed upon procedure reports, attestation reports, comfort letters, out-of-pocket expenses and internal control reviews not required by regulators.
2 The nature of the services includes tax compliance and/or tax preparation, including services relating to the filing or amendment of federal, state or local income tax returns, regulated investment company qualification reviews, taxable income and tax distribution calculations.
(e)(1) Audit Committee Pre-Approval Policies and Procedures:
The Committee has adopted policies and procedures with regard to the pre-approval of services. Audit, audit-related and tax compliance services provided to the registrant on an annual basis require specific pre-approval by the Committee. The Committee also must approve other non-audit services provided to the registrant and those non-audit services provided to the Investment Adviser and Affiliated Service Providers that relate directly to the operations and the financial reporting of the registrant. Certain of these non-audit services that the Committee believes are (a) consistent with the SEC’s auditor independence rules and (b) routine and recurring services that will not impair the independence of the independent accountants may be approved by the Committee without consideration on a specific case-by-case basis (“general pre-approval”). The term of any general pre-approval is 12 months from the date of the pre-approval, unless the Committee provides for a different period. Tax or other non-audit services provided to the registrant which have a direct impact on the operations or financial reporting of the registrant will only be deemed pre-approved provided that any individual project does not exceed $10,000 attributable to the registrant or $50,000 per project. For this purpose, multiple projects will be aggregated to determine if they exceed the previously mentioned cost levels.
Any proposed services exceeding the pre-approved cost levels will require specific pre-approval by the Committee, as will any other services not subject to general pre-approval (e.g., unanticipated but permissible services). The Committee is informed of each service approved subject to general pre-approval at the next regularly scheduled in-person board meeting. At this meeting, an analysis of such services is presented to the Committee for ratification. The Committee may delegate to the Committee Chairman the authority to approve the provision of and fees for any specific engagement of permitted non-audit services, including services exceeding pre-approved cost levels.
(e)(2) None of the services described in each of Items 4(b) through (d) were approved by the Committee pursuant to the de minimis exception in paragraph (c)(7)(i)(C) of Rule 2-01 of Regulation S-X.
(f) Not Applicable
(g) The aggregate non-audit fees, defined as the sum of the fees shown under “Audit-Related Fees,” “Tax Fees” and “All Other Fees,” paid to the accountant for services rendered by the accountant to the registrant, the Investment Adviser and the Affiliated Service Providers were:
Entity Name | Current Fiscal Year End | Previous Fiscal Year End |
| BlackRock Global Long/Short Credit Fund | $28,080 | $28,383 |
(h) The Committee has considered and determined that the provision of non-audit services that were rendered to the Investment Adviser and the Affiliated Service Providers that were not pre-approved pursuant to paragraph (c)(7)(ii) of Rule 2-01 of Regulation S-X is compatible with maintaining the principal accountant’s independence.
(i) – Not Applicable
(j) – Not Applicable
Item 5 – Audit Committee of Listed Registrant – Not Applicable
Item 6 – Investments
(a) The registrant’s Schedule of Investments is included as part of the Financial Statement and Financial Highlights for Open-End Management Investment Companies filed under Item 7 of this Form.
(b) Not Applicable due to no such divestments during the semi-annual period covered since the previous Form N-CSR filing.
Item 7 – Financial Statements and Financial Highlights for Open-End Management Investment Companies –
(a) The registrant’s Financial Statements are attached herewith.
(b) The registrant’s Financial Highlights are attached herewith.
Not
FDIC
Insured
-
May
Lose
Value
-
No
Bank
Guarantee
2024
Annual
Financial
Statements
BlackRock
Funds
IV
BlackRock
Global
Long/Short
Credit
Fund
The
Benefits
and
Risks
of
Leveraging
..........................................................................................
3
Derivative
Financial
Instruments
.............................................................................................
3
Schedule
of
Investments
..................................................................................................
4
Statement
of
Assets
and
Liabilities
............................................................................................
35
Statement
of
Operations
..................................................................................................
38
Statements
of
Changes
in
Net
Assets
..........................................................................................
39
Financial
Highlights
.....................................................................................................
40
Notes
to
Financial
Statements
...............................................................................................
44
Report
of
Independent
Registered
Public
Accounting
Firm
..............................................................................
58
Important
Tax
Information
.................................................................................................
59
Additional
Information
....................................................................................................
60
Disclosure
of
Investment
Advisory
Agreement
and
Sub-Advisory
Agreements
..................................................................
62
Glossary
of
Terms
Used
in
this
Report
..........................................................................................
65
The
Benefits
and
Risks
of
Leveraging
The
Benefits
and
Risks
of
Leveraging
/
Derivative
Financial
Instruments
The
Fund
may
utilize
leverage
to
seek
to
enhance
returns
and
net
asset
value
(“NAV”).
However,
there
is
no
guarantee
that
these
objectives
can
be
achieved
in
all
interest
rate
environments.
The
Fund
may
utilize
leverage
by
entering
into
reverse
repurchase
agreements.
In
general,
the
concept
of
leveraging
is
based
on
the
premise
that
the
financing
cost
of
leverage,
which
is
based
on
short-term
interest
rates,
is
normally
lower
than
the
income
earned
by
the
Fund
on
its
longer-term
portfolio
investments
purchased
with
the
proceeds
from
leverage.
To
the
extent
that
the
total
assets
of
the
Fund
(including
the
assets
obtained
from
leverage)
are
invested
in
higher-yielding
portfolio
investments,
the
Fund’s
shareholders
benefit
from
the
incremental
net
income.
The
interest
earned
on
securities
purchased
with
the
proceeds
from
leverage
is
distributed
to
the
Fund’s
shareholders,
and
the
value
of
these
portfolio
holdings
is
reflected
in
the
Fund’s
per
share
NAV.
However,
in
order
to
benefit
shareholders,
the
return
on
assets
purchased
with
leverage
proceeds
must
exceed
the
ongoing
costs
associated
with
the
leverage.
If
interest
and
other
ongoing
costs
of
leverage
exceed
the
Fund’s
return
on
assets
purchased
with
leverage
proceeds,
income
to
shareholders
is
lower
than
if
the
Fund
had
not
used
leverage.
Furthermore,
the
value
of
the
Fund’s
portfolio
investments
generally
varies
inversely
with
the
direction
of
long-term
interest
rates,
although
other
factors
can
also
influence
the
value
of
portfolio
investments.
As
a
result,
changes
in
interest
rates
can
influence
the
Fund’s
NAV
positively
or
negatively
in
addition
to
the
impact
on
the
Fund’s
performance
from
leverage.
Changes
in
the
direction
of
interest
rates
are
difficult
to
predict
accurately,
and
there
is
no
assurance
that
the
Fund’s
leveraging
strategy
will
be
successful.
The
use
of
leverage
also
generally
causes
greater
changes
in
the
Fund’s
NAV
and
dividend
rates
than
comparable
portfolios
without
leverage.
In
a
declining
market,
leverage
is
likely
to
cause
a
greater
decline
in
the
NAV
of the
Fund’s
shares
than
if
the
Fund
were
not
leveraged.
In
addition,
the
Fund
may
be
required
to
sell
portfolio
securities
at
inopportune
times
or
at
distressed
values
in
order
to
comply
with
regulatory
requirements
applicable
to
the
use
of
leverage
or
as
required
by
the
terms
of
the
leverage
instruments,
which
may
cause
the
Fund
to
incur
losses.
The
use
of
leverage
may
limit the
Fund’s
ability
to
invest
in
certain
types
of
securities
or
use
certain
types
of
hedging
strategies.
The
Fund
incurs
expenses
in
connection
with
the
use
of
leverage,
all
of
which
are
borne
by
the
Fund’s
shareholders
and
may
reduce
income.
Derivative
Financial
Instruments
The
Fund
may
invest
in
various
derivative
financial
instruments.
These
instruments
are
used
to
obtain
exposure
to
a
security,
commodity,
index,
market,
and/or
other
assets
without
owning
or
taking
physical
custody
of
securities,
commodities
and/or
other
referenced
assets
or
to
manage
market,
equity,
credit,
interest
rate,
foreign
currency
exchange
rate,
commodity
and/or
other
risks.
Derivative
financial
instruments
may
give
rise
to
a
form
of
economic
leverage
and
involve
risks,
including
the
imperfect
correlation
between
the
value
of
a
derivative
financial
instrument
and
the
underlying
asset,
possible
default
of
the
counterparty
to
the
transaction
or
illiquidity
of
the
instrument. Pursuant
to Rule
18f-4
under
the
1940
Act,
among
other
things,
the
Fund
must
either
use
derivative
financial
instruments
with
embedded
leverage
in
a
limited
manner
or
comply
with
an
outer
limit
on
fund
leverage
risk
based
on
value-at-risk.
The
Fund’s
successful
use
of
a
derivative
financial
instrument
depends
on
the
investment
adviser’s
ability
to
predict
pertinent
market
movements
accurately,
which
cannot
be
assured.
The
use
of
these
instruments
may
result
in
losses
greater
than
if
they
had
not
been
used,
may
limit
the
amount
of
appreciation the
Fund
can
realize
on
an
investment
and/or
may
result
in
lower
distributions
paid
to
shareholders.
The
Fund’s
investments
in
these
instruments,
if
any,
are
discussed
in
detail
in
the
Notes
to
Financial
Statements.
2024
BlackRock
Annual
Financial
Statements
Schedule
of
Investments
July
31,
2024
BlackRock
Global
Long/Short
Credit
Fund
(Percentages
shown
are
based
on
Net
Assets)
Security
Par
(000)
Pa
r
(
000)
Value
Asset-Backed
Securities
Cayman
Islands
—
0.3%
(a)(b)
Apidos
CLO
XXIV,
Series
2016-24A,
Class
A1AL,
(3-mo.
CME
Term
SOFR
at
0.95%
Floor
+
1.21%),
6.49%,
10/20/30
............
USD
182
$
182,050
Benefit
Street
Partners
CLO
XII
Ltd.,
Series
2017-12A,
Class
A1R,
(3-mo.
CME
Term
SOFR
at
0.95%
Floor
+
1.21%),
6.51%,
10/15/30
.......
87
87,518
BlueMountain
CLO
Ltd.,
Series
2015-
3A,
Class
A1R,
(3-mo.
CME
Term
SOFR
at
0.00%
Floor
+
1.26%),
6.54%,
04/20/31
............
172
171,786
Carlyle
Global
Market
Strategies
CLO
Ltd.
Series
2014-2RA,
Class
A1,
(3-mo.
CME
Term
SOFR
at
0.00%
Floor
+
1.31%),
6.63%,
05/15/31
...
162
161,957
Series
2014-3RA,
Class
A1A,
(3-mo.
CME
Term
SOFR
at
0.00%
Floor
+
1.31%),
6.58%,
07/27/31
...
138
138,662
CIFC
Funding
Ltd.,
Series
2015-3A,
Class
AR,
(3-mo.
CME
Term
SOFR
at
0.00%
Floor
+
1.13%),
6.41%,
04/19/29
.................
78
78,328
Dryden
41
Senior
Loan
Fund,
Series
2015-41A,
Class
AR,
(3-mo.
CME
Term
SOFR
at
0.97%
Floor
+
1.23%),
6.53%,
04/15/31
.......
171
170,961
Flatiron
CLO
18
Ltd.,
Series
2018-1A,
Class
A,
(3-mo.
CME
Term
SOFR
at
0.95%
Floor
+
1.21%),
6.50%,
04/17/31
.................
113
112,891
Galaxy
XX
CLO
Ltd.,
Series
2015-20A,
Class
AR,
(3-mo.
CME
Term
SOFR
at
1.00%
Floor
+
1.26%),
6.54%,
04/20/31
.................
119
119,169
Galaxy
XXVIII
CLO
Ltd.,
Series
2018-
28A,
Class
A2,
(3-mo.
CME
Term
SOFR
at
0.00%
Floor
+
1.56%),
6.86%,
07/15/31
............
139
139,531
Madison
Park
Funding
XVII
Ltd.,
Series
2015-17A,
Class
AR2,
(3-mo.
CME
Term
SOFR
at
0.00%
Floor
+
1.26%),
6.54%,
07/21/30
.......
175
175,216
OCP
CLO
Ltd.,
Series
2017-14A,
Class
A1A,
(3-mo.
CME
Term
SOFR
at
1.15%
Floor
+
1.41%),
6.74%,
11/20/30
..................
144
143,992
Octagon
Investment
Partners
32
Ltd.,
Series
2017-1A,
Class
A1R,
(3-mo.
CME
Term
SOFR
at
0.95%
Floor
+
1.21%),
6.51%,
07/15/29
.......
121
121,198
Octagon
Investment
Partners
33
Ltd.,
Series
2017-1A,
Class
A1,
(3-mo.
CME
Term
SOFR
at
0.26%
Floor
+
1.45%),
6.73%,
01/20/31
.......
94
93,620
Palmer
Square
Loan
Funding
Ltd.
Series
2021-2A,
Class
A1,
(3-mo.
CME
Term
SOFR
at
1.06%
Floor
+
1.06%),
6.39%,
05/20/29
...
55
54,694
Series
2021-4A,
Class
A1,
(3-mo.
CME
Term
SOFR
at
1.06%
Floor
+
1.06%),
6.36%,
10/15/29
...
79
78,521
Security
Par
(000)
Par
(000)
Value
Cayman
Islands
(continued)
Pikes
Peak
CLO
1,
Series
2018-1A,
Class
A,
(3-mo.
CME
Term
SOFR
at
1.18%
Floor
+
1.44%),
6.72%,
07/24/31
.................
USD
179
$
179,581
TCI-Flatiron
CLO
Ltd.,
Series
2016-1A,
Class
AR3,
(3-mo.
CME
Term
SOFR
at
1.10%
Floor
+
1.10%),
6.39%,
01/17/32
.................
106
106,178
2,315,853
Ireland
—
8.3%
(b)(c)
AB
Carval
Euro
CLO
II-C
DAC,
Series
2X,
Class
D,
(3-mo.
EURIBOR
at
3.75%
Floor
+
3.75%),
0.00%,
02/15/37
.................
EUR
340
367,965
Aqueduct
European
CLO
DAC
Series
2022-7X,
Class
A,
(3-mo.
EURIBOR
at
2.05%
Floor
+
2.05%),
5.77%,
03/15/36
....
2,002
2,168,373
Series
2022-7X,
Class
AR,
(3-mo.
EURIBOR
at
1.28%
Floor
+
1.28%),
0.00%,
08/15/37
....
2,002
2,166,664
Arini
European
CLO
I
DAC
Series
1X,
Class
A,
(3-mo.
EURIBOR
at
1.90%
Floor
+
1.90%),
5.59%,
07/15/36
....
1,000
1,092,777
Series
1X,
Class
D,
(3-mo.
EURIBOR
at
6.04%
Floor
+
6.04%),
9.73%,
07/15/36
....
480
534,548
Arini
European
CLO
II
DAC,
Series
2X,
Class
A,
(3-mo.
EURIBOR
at
1.55%
Floor
+
1.55%),
5.41%,
04/15/38
.
1,500
1,633,126
Aurium
CLO
IV
DAC,
Series
4X,
Class
AR,
(3-mo.
EURIBOR
at
0.73%
Floor
+
0.73%),
4.39%,
01/16/31
.
896
969,625
Aurium
CLO
VIII
DAC,
Series
8X,
Class
A,
(3-mo.
EURIBOR
at
0.85%
Floor
+
0.85%),
4.55%,
06/23/34
.....
1,500
1,617,694
Avoca
CLO
XIV
DAC
Series
14X,
Class
ER,
(3-mo.
EURIBOR
at
4.70%
Floor
+
4.70%),
8.40%,
01/12/31
....
1,970
2,157,183
Series
14X,
Class
FR,
(3-mo.
EURIBOR
at
6.35%
Floor
+
6.35%),
10.05%,
01/12/31
....
2,200
2,370,029
Series
14X,
Class
SUB,
0.00%,
01/12/31
(d)
(e)
.............
1,500
832,791
Avoca
CLO
XV
DAC
Series
15X,
Class
ER,
(3-mo.
EURIBOR
at
4.13%
Floor
+
4.13%),
7.81%,
04/15/31
....
1,765
1,896,146
Series
15X,
Class
FR,
(3-mo.
EURIBOR
at
5.84%
Floor
+
5.84%),
9.52%,
04/15/31
....
3,425
3,589,782
Capital
Four
CLO
V
DAC,
Series
5X,
Class
A,
(3-mo.
EURIBOR
at
1.84%
Floor
+
1.84%),
5.52%,
04/25/36
.
2,968
3,229,785
CIFC
European
Funding
CLO
IV
DAC,
Series
4X,
Class
A,
(3-mo.
EURIBOR
at
0.95%
Floor
+
0.95%),
4.62%,
08/18/35
............
2,800
3,027,816
Contego
CLO
VI
DAC,
Series
6X,
Class
AR,
(3-mo.
EURIBOR
at
0.79%
Floor
+
0.79%),
4.48%,
04/15/34
.
4,400
4,746,320
Schedule
of
Investments
(continued)
July
31,
2024
BlackRock
Global
Long/Short
Credit
Fund
(Percentages
shown
are
based
on
Net
Assets)
Security
Par
(000)
Par
(000)
Value
Ireland
(continued)
Contego
CLO
VII
DAC,
Series
7X,
Class
D,
(3-mo.
EURIBOR
at
3.95%
Floor
+
3.95%),
7.65%,
05/14/32
.
EUR
200
$
219,568
CVC
Cordatus
Loan
Fund
XXII
DAC,
Series
22X,
Class
D,
(3-mo.
EURIBOR
at
3.15%
Floor
+
3.15%),
6.87%,
12/15/34
............
400
436,229
CVC
Cordatus
Loan
Fund
XXX
DAC,
Series
30X,
Class
A,
(3-mo.
EURIBOR
at
1.48%
Floor
+
1.48%),
5.35%,
05/15/37
............
2,000
2,177,073
Fidelity
Grand
Harbour
CLO
DAC,
Series
2023-1X,
Class
A,
(3-mo.
EURIBOR
at
1.90%
Floor
+
1.90%),
5.73%,
08/15/36
............
4,800
5,225,472
Harvest
CLO
XXXII
DAC,
Series
32X,
Class
D,
(3-mo.
EURIBOR
at
3.60%
Floor
+
3.60%),
7.30%,
07/25/37
.
188
204,377
Henley
CLO
I
DAC,
Series
1X,
Class
AR,
(3-mo.
EURIBOR
at
0.95%
Floor
+
0.95%),
4.64%,
07/25/34
.
1,500
1,621,114
Invesco
Euro
CLO
III
DAC,
Series
3X,
Class
F,
(3-mo.
EURIBOR
at
8.07%
Floor
+
8.07%),
11.76%,
07/15/32
622
673,430
Invesco
Euro
CLO
IX
DAC,
Series
9X,
Class
A,
(3-mo.
EURIBOR
at
1.65%
Floor
+
1.65%),
5.34%,
04/20/36
.
3,000
3,253,742
Margay
CLO
I
DAC
Series
1X,
Class
A,
(3-mo.
EURIBOR
at
1.95%
Floor
+
1.95%),
5.64%,
07/15/36
....
2,928
3,181,840
Series
1X,
Class
D,
(3-mo.
EURIBOR
at
6.40%
Floor
+
6.40%),
10.09%,
07/15/36
....
285
315,281
Neuberger
Berman
Loan
Advisers
Euro
CLO,
Series
2021-1X,
Class
E,
(3-mo.
EURIBOR
at
5.52%
Floor
+
5.52%),
9.18%,
04/17/34
.......
438
477,551
Neuberger
Berman
Loan
Advisers
Euro
CLO
DAC,
Series
2022-3X,
Class
A,
(3-mo.
EURIBOR
at
0.92%
Floor
+
0.92%),
4.61%,
10/25/34
.......
1,700
1,836,008
OCP
Euro
CLO
DAC,
Series
2017-2X,
Class
F,
(3-mo.
EURIBOR
at
6.40%
Floor
+
6.40%),
10.09%,
01/15/32
1,000
1,085,615
Palmer
Square
European
CLO
DAC
Series
2023-1X,
Class
A,
(3-mo.
EURIBOR
at
1.90%
Floor
+
1.90%),
5.59%,
07/15/36
....
4,700
5,104,380
Series
2024-2X,
Class
A,
(3-mo.
EURIBOR
at
1.34%
Floor
+
1.34%),
0.00%,
10/15/37
....
1,700
1,839,825
Palmer
Square
European
Loan
Funding
DAC,
Series
2024-2X,
Class
D,
(3-mo.
EURIBOR
at
3.15%
Floor
+
3.15%),
0.00%,
05/15/34
.......
340
367,965
Penta
CLO
DAC,
Series
2024-17X,
Class
D,
(3-mo.
EURIBOR
at
3.25%
Floor
+
3.25%),
0.00%,
08/15/38
.
211
228,355
Rockfield
Park
CLO
DAC,
Series
1X,
Class
C,
(3-mo.
EURIBOR
at
3.00%
Floor
+
3.00%),
6.66%,
07/16/34
.
870
948,592
RRE
18
Loan
Management
DAC,
Series
18X,
Class
A1,
(3-mo.
EURIBOR
at
1.47%
Floor
+
1.47%),
5.27%,
04/15/39
............
2,000
2,182,917
Security
Par
(000)
Par
(000)
Value
Ireland
(continued)
RRE
19
Loan
Management
DAC,
Series
19X,
Class
A1,
(3-mo.
EURIBOR
at
1.41%
Floor
+
1.41%),
5.11%,
07/15/37
............
EUR
936
$
1,016,759
Tikehau
CLO
VII
DAC,
Series
7X,
Class
A,
(3-mo.
EURIBOR
at
2.00%
Floor
+
2.00%),
5.69%,
10/20/35
.....
4,500
4,880,352
Tikehau
CLO
XII
DAC
Series
12X,
Class
A,
(3-mo.
EURIBOR
at
1.34%
Floor
+
1.34%),
0.00%,
10/20/38
....
1,700
1,839,825
Series
12X,
Class
D,
(3-mo.
EURIBOR
at
3.25%
Floor
+
3.25%),
0.00%,
10/20/38
....
500
541,125
72,058,019
United
Kingdom
—
0.4%
Greene
King
Finance
plc,
Series
B1,
(Sterling
Overnight
Index
Average
+
1.92%),
7.15%,
12/15/34
(b)
.....
GBP
1,518
1,668,894
Unique
Pub
Finance
Co.
plc
(The),
Series
N,
6.46%,
03/30/32
(c)
(f)
....
1,575
2,072,200
3,741,094
United
States
—
0.0%
(a)(b)
Carlyle
Global
Market
Strategies
CLO
Ltd.,
Series
2013-1A,
Class
A1RR,
(3-mo.
CME
Term
SOFR
at
0.95%
Floor
+
1.21%),
6.53%,
08/14/30
.
USD
74
73,668
Flatiron
CLO
17
Ltd.,
Series
2017-1A,
Class
AR,
(3-mo.
CME
Term
SOFR
at
0.98%
Floor
+
1.24%),
6.56%,
05/15/30
.................
184
184,241
Greenwood
Park
CLO
Ltd.,
Series
2018-1A,
Class
A1,
(3-mo.
CME
Term
SOFR
at
0.00%
Floor
+
1.29%),
6.59%,
04/15/31
.......
135
134,633
392,542
Total
Asset-Backed
Securities
—
9.0%
(Cost:
$
79,291,085
)
..............................
78,507,508
Shares
Shares
Common
Stocks
Canada
—
0.1%
Algoma
Steel
Group,
Inc.
........
8,666
76,694
Lionsgate
Studios
Corp.
(e)
........
62,500
451,875
528,569
France
—
0.0%
Casino
Guichard
Perrachon
SA
(e)
...
16,223
61,451
Germany
—
0.0%
ADLER
Group
SA
(a)
(c)
(e)
..........
58,949
10,361
Japan
—
0.0%
New
TOPCO
(e)
(g)
(h)
.............
59,462
1
Luxembourg
—
0.0%
Travelport
Finance
SARL
(e)
(h)
......
70
188,292
United
Kingdom
—
0.0%
(e)
Genius
Sports
Ltd.
.............
42,682
291,518
NEW
Look
Retailers
(h)
...........
5,436,112
70
291,588
2024
BlackRock
Annual
Financial
Statements
Schedule
of
Investments
(continued)
July
31,
2024
BlackRock
Global
Long/Short
Credit
Fund
(Percentages
shown
are
based
on
Net
Assets)
Security
Shares
Shares
Value
United
States
—
0.9%
AGNC
Investment
Corp.
.........
50,000
$
500,500
Aiven,
Inc.
,
Series
D
(e)
(h)
.........
6,597
391,004
Altice
USA,
Inc.
,
Class
A
(e)
........
14,012
29,285
AMC
Networks,
Inc.
,
Class
A
(e)
.....
3,409
37,942
Astra
Space,
Inc.
,
Class
A
(e)
.......
3,047
1,523
Avaya,
Inc.
(e)
.................
2,625
17,884
Boyd
Gaming
Corp.
............
877
53,383
Caesars
Entertainment,
Inc.
(e)
.....
5,931
236,943
California
Resources
Corp.
.......
590
30,350
Centuri
Holdings,
Inc.
(e)
..........
1,365
22,536
Cheniere
Energy,
Inc.
...........
912
166,568
Citigroup,
Inc.
................
3,486
226,172
Comerica,
Inc.
................
577
31,625
Concentra
Group
Holdings
Parent,
Inc.
(e)
....................
2,661
62,028
Constellium
SE
,
Class
A
(e)
........
9,633
171,564
Crown
PropTech
Acquisitions
(e)
(h)
...
15,186
669
Crown
PropTech
Acquisitions
,
Class
A
(e)
6,461
69,391
DiamondRock
Hospitality
Co.
(i)
.....
15,329
126,158
Fanatics
Holdings,
Inc.
,
Class
A
,
(Acquired
12/15/21
,
cost
$
1,041,005
)
(e)
(h)
(j)
............
15,345
970,725
First
Citizens
BancShares,
Inc.
,
Class
A
101
210,857
First
Horizon
Corp.
.............
6,598
110,385
Forestar
Group,
Inc.
(e)
...........
3,273
103,525
Freewire
Technologies,
Inc.
(e)
(h)
.....
13
—
Golden
Entertainment,
Inc.
.......
1,570
52,485
Green
Plains,
Inc.
(e)
............
10,121
179,445
Halliburton
Co.
...............
3,944
136,778
HawkEye
360,
Inc.
,
Series
D1
(e)
(h)
...
34,579
346,136
Kinder
Morgan,
Inc.
............
3,088
65,249
Landsea
Homes
Corp.
(e)
.........
5,918
72,081
Latch,
Inc.
(e)
.................
31,344
12,538
Lineage,
Inc.
(e)
................
257
22,585
Lions
Gate
Entertainment
Corp.
,
Class
A
(e)
.....................
30,865
283,032
Marathon
Petroleum
Corp.
.......
1,262
223,399
New
Look
Builders,
Inc.
(e)
(h)
.......
11,518,792
115
New
York
Community
Bancorp,
Inc.
.
24,767
260,545
Palladyne
AI
Corp.
(e)
............
35,879
71,758
Palladyne
AI
Corp.
(e)
............
2,874
5,748
Paramount
Global
,
Class
B
.......
37,500
428,250
Park
Hotels
&
Resorts,
Inc.
.......
8,214
123,703
Playstudios,
Inc.
(e)
.............
50,453
109,483
Screaming
Eagle
Acquistion
Corp.
,
(Acquired
05/14/24
,
cost
$
203,300
)
(e)
(j)
...............
20,000
144,600
Service
Properties
Trust
.........
21,310
120,828
Smith
Douglas
Homes
Corp.
(e)
.....
1,690
55,584
Sonder
Holdings,
Inc.
,
Class
A
(e)
....
2,393
6,843
Sunstone
Hotel
Investors,
Inc.
.....
9,225
95,571
Texas
Capital
Bancshares,
Inc.
(e)
...
1,834
121,227
Transocean
Ltd.
(e)
.............
47,745
276,444
Tribune
Resources
LLC
(e)
........
86,655
89,515
United
States
Steel
Corp.
........
12,682
521,103
Valero
Energy
Corp.
............
1,165
188,404
Waystar
Holding
Corp.
(e)
.........
19,468
447,764
8,032,230
Zambia
—
0.0%
First
Quantum
Minerals
Ltd.
.......
814
9,964
Total
Common
Stocks
—
1.0%
(Cost:
$
21,957,336
)
..............................
9,122,456
Security
Par
(000)
Pa
r
(
000)
Value
Corporate
Bonds
Australia
—
0.1%
Mineral
Resources
Ltd.
,
9.25%
,
10/01/28
(a)
................
USD
28
$
29,777
Oceana
Australian
Fixed
Income
Trust
(h)
12.00%
,
08/31/25
...........
AUD
178
116,333
12.50%
,
07/31/26
...........
267
174,937
12.50%
,
07/31/27
...........
445
292,841
613,888
Austria
—
0.5%
ams-OSRAM
AG
(c)
0.00%
,
03/05/25
(k)
(l)
..........
EUR
1,200
1,244,865
2.13%
,
11/03/27
(l)
...........
1,300
1,111,471
10.50%
,
03/30/29
...........
1,385
1,570,617
3,926,953
Canada
—
0.6%
1011778
BC
ULC
,
6.13%
,
06/15/29
(a)
USD
2,250
2,272,977
Brookfield
Residential
Properties,
Inc.
,
5.00%
,
06/15/29
(a)
...........
100
92,872
Dye
&
Durham
Ltd.
,
8.63%
,
04/15/29
(a)
88
90,046
Freed
Hotels
&
Resorts
,
12.00%
,
11/21/28
(b)
(h)
...............
2,457
2,460,595
Garda
World
Security
Corp.
(a)
9.50%
,
11/01/27
............
50
50,316
7.75%
,
02/15/28
............
27
27,861
Mattamy
Group
Corp.
(a)
5.25%
,
12/15/27
............
21
20,536
4.63%
,
03/01/30
............
217
203,203
5,218,406
Chile
—
0.0%
Kenbourne
Invest
SA
(a)(d)(e)
6.88%
,
11/26/24
............
23
13,167
4.70%
,
01/22/28
............
200
112,750
125,917
China
—
0.2%
(c)(d)(e)
European
TopSoho
SARL
,
Series
SMCP
,
4.00%
,
10/14/24
(l)
......
EUR
7,100
2,087,415
Fantasia
Holdings
Group
Co.
Ltd.
,
11.75%
,
04/17/25
...........
USD
200
2,000
2,089,415
Cyprus
—
0.1%
Bank
of
Cyprus
PCL
(1-Year
EUR
Swap
Annual
+
2.79%),
2.50%
,
06/24/27
(b)
(c)
..
EUR
1,110
1,168,262
Czech
Republic
—
0.2%
Allwyn
Entertainment
Financing
UK
plc
7.25%
,
04/30/30
(c)
...........
1,544
1,767,076
Denmark
—
0.1%
SGL
Group
ApS
,
(3-mo.
EURIBOR
at
0.00%
Floor
+
4.75%),
8.44%
,
04/22/30
(b)
................
538
587,636
Finland
—
0.1%
Ahlstrom
Holding
3
Oy
,
4.88%
,
02/04/28
(a)
................
USD
640
601,578
France
—
2.7%
Alstom
SA
,
(5-Year
EURIBOR
ICE
Swap
Rate
+
2.93%),
5.87%
(b)
(c)
(m)
.
EUR
400
451,870
Altice
France
SA
,
11.50%
,
02/01/27
(c)
419
368,280
Schedule
of
Investments
(continued)
July
31,
2024
BlackRock
Global
Long/Short
Credit
Fund
(Percentages
shown
are
based
on
Net
Assets)
Security
Par
(000)
Par
(000)
Value
France
(continued)
Atos
SE
(c)(d)(e)
0.00%
,
11/06/24
(k)
(l)
..........
EUR
2,300
$
186,688
1.75%
,
05/07/25
............
700
57,219
2.50%
,
11/07/28
............
400
24,730
1.00%
,
11/12/29
............
600
48,887
Bertrand
Franchise
Finance
SAS
(c)
6.50%
,
07/18/30
............
399
438,692
(3-mo.
EURIBOR
at
0.00%
Floor
+
3.75%),
7.49%
,
07/18/30
(b)
...
1,171
1,273,651
BNP
Paribas
SA
,
Series
TMO
,
(BFRTMO
at
0.00%
Floor
-
0.25%),
2.82%
(b)
(m)
.................
1,163
1,192,171
Clariane
SE
(5-Year
U.K.
Government
Bonds
Note
Generic
Bid
Yield
+
9.08%),
13.17%
(b)
(c)
(m)
.............
GBP
2,200
2,715,082
Eramet
SA
,
6.50%
,
11/30/29
(c)
.....
EUR
1,000
1,095,237
Eutelsat
SA
,
1.50%
,
10/13/28
(c)
....
800
704,328
Goldstory
SAS
(c)
6.75%
,
02/01/30
............
759
822,455
(3-mo.
EURIBOR
at
0.00%
Floor
+
4.00%),
7.84%
,
02/01/30
(b)
...
529
573,884
La
Financiere
Atalian
,
8.50%
,
(
8.50
%
Cash
or
5.00
%
PIK),
06/30/28
(c)
(n)
.
2,752
1,753,640
Lion/Polaris
Lux
4
SA
,
(3-mo.
EURIBOR
at
0.00%
Floor
+
3.63%),
7.33%
,
07/01/29
(b)
(c)
..........
833
906,455
Lune
Holdings
SARL
,
5.63%
,
11/15/28
(c)
.................
1,024
976,789
Nova
Alexandre
III
SAS
,
(3-mo.
EURIBOR
at
0.00%
Floor
+
5.25%),
8.91%
,
07/15/29
(b)
(c)
..........
469
510,874
Paprec
Holding
SA
,
7.25%
,
11/17/29
(c)
1,563
1,780,617
Picard
Bondco
SA
,
5.38%
,
07/01/27
(c)
700
740,392
Picard
Groupe
SAS
,
6.38%
,
07/01/29
(c)
701
774,525
RCI
Banque
SA
,
(5-Year
EUR
Swap
Annual
+
2.85%),
2.63%
,
02/18/30
(b)
(c)
...............
3,400
3,636,963
Sabena
Technics
SAS
,
(Acquired
10/28/22
,
cost
$
292,597
)
,
(3-mo.
EURIBOR
+
5.00%),
8.72%
,
09/30/29
(b)
(h)
(j)
..............
297
321,913
Worldline
SA
,
0.00%
,
07/30/26
(c)
(k)
(l)
..
2,174
2,213,030
23,568,372
Germany
—
4.8%
ADLER
Group
SA
,
21.00%
,
(
21.00
%
Cash
or
21.00
%
PIK),
07/31/25
(c)
(n)
1,700
2,160,206
Agps
Bondco
plc
(c)(d)(e)
6.00%
,
08/05/25
............
1,900
659,550
5.50%
,
11/13/26
............
700
241,098
5.00%
,
04/27/27
............
1,900
645,814
5.00%
,
01/14/29
............
2,300
791,558
Aroundtown
Finance
SARL
(b)(c)(m)
(5-Year
U.K.
Government
Bonds
Note
Generic
Bid
Yield
+
4.49%),
8.63%
.................
GBP
2,097
2,117,415
(5-Year
US
Treasury
Yield
Curve
Rate
T
Note
Constant
Maturity
+
3.16%),
7.88%
...........
USD
1,500
1,113,000
(5-Year
EURIBOR
ICE
Swap
Rate
+
4.51%),
7.13%
...........
EUR
1,200
1,029,941
Aroundtown
SA
(c)
2.00%
,
11/02/26
............
1,000
1,026,785
0.38%
,
04/15/27
............
1,500
1,456,921
Security
Par
(000)
Par
(000)
Value
Germany
(continued)
1.45%
,
07/09/28
............
EUR
2,300
$
2,192,119
Commerzbank
AG
(b)(c)
(5-Year
EUR
Swap
Annual
+
6.36%),
6.13%
(m)
..........
4,400
4,750,729
(3-mo.
EURIBOR
+
1.25%),
4.00%
,
07/16/32
...............
1,100
1,201,368
(5-Year
U.K.
Government
Bonds
Note
Generic
Bid
Yield
+
5.25%),
8.63%
,
02/28/33
..........
GBP
600
829,762
DEMIRE
Deutsche
Mittelstand
Real
Estate
AG
,
1.88%
,
10/15/24
(c)
...
EUR
2,400
2,183,115
Deutsche
Bank
AG
(b)(c)
(USISOA05
at
0.00%
Floor
+
4.36%),
4.79%
(m)
..........
USD
1,600
1,536,000
(5-Year
EURIBOR
ICE
Swap
Rate
+
5.26%),
8.13%
(m)
..........
EUR
800
882,138
(5-Year
EURIBOR
ICE
Swap
Rate
+
3.30%),
4.00%
,
06/24/32
....
2,000
2,144,788
Envalior
,
13.63%
,
03/31/31
(h)
......
458
481,108
Fraport
AG
Frankfurt
Airport
Services
Worldwide
,
4.25%
,
06/11/32
(c)
...
850
944,373
HT
Troplast
GmbH
,
9.38%
,
07/15/28
(c)
776
842,870
Mahle
GmbH
,
6.50%
,
05/02/31
(c)
...
1,365
1,504,231
PCF
GmbH
,
4.75%
,
04/15/26
(c)
....
1,370
1,244,230
PrestigeBidCo
GmbH
,
(3-mo.
EURIBOR
at
0.00%
Floor
+
3.75%),
7.46%
,
07/01/29
(b)
(c)
..........
678
739,260
Techem
Verwaltungsgesellschaft
674
mbH
,
6.00%
,
07/30/26
(c)
.......
636
688,015
Tele
Columbus
AG
,
10.00%
,
(
10.00
%
Cash
or
10.00
%
PIK),
01/01/29
(b)
(c)
(n)
5,313
4,213,270
TUI
AG
,
1.95%
,
07/26/31
(c)
(l)
.......
1,000
1,073,228
TUI
Cruises
GmbH
,
6.50%
,
05/15/26
(c)
411
447,635
Volkswagen
International
Finance
NV
,
(9-Year
EUR
Swap
Annual
+
3.96%),
3.88%
(b)
(c)
(m)
................
2,300
2,325,477
Wintershall
Dea
Finance
2
BV
,
Series
NC8
,
(5-Year
EUR
Swap
Annual
+
3.32%),
3.00%
(b)
(c)
(m)
..........
700
683,711
42,149,715
Greece
—
0.2%
National
Bank
of
Greece
SA
,
(5-Year
EURIBOR
ICE
Swap
Rate
+
3.15%),
5.88%
,
06/28/35
(b)
(c)
..........
1,450
1,640,526
Hong
Kong
—
0.4%
FWD
Group
Holdings
Ltd.
,
8.40%
,
04/05/29
(c)
................
USD
3,604
3,730,338
Ireland
—
0.6%
Bank
of
Ireland
Group
plc
,
(5-Year
EUR
Swap
Annual
+
7.92%),
7.50%
(b)
(c)
(m)
EUR
2,808
3,093,416
Flutter
Treasury
DAC
,
6.38%
,
04/29/29
(a)
................
USD
2,000
2,036,140
5,129,556
Israel
—
0.1%
Teva
Pharmaceutical
Finance
Netherlands
II
BV
,
7.38%
,
09/15/29
EUR
888
1,076,363
Italy
—
2.9%
A2A
SpA
,
(5-Year
EURIBOR
ICE
Swap
Rate
+
2.26%),
5.00%
(b)
(c)
(m)
.....
950
1,035,849
Azzurra
Aeroporti
SpA
,
2.63%
,
05/30/27
(c)
................
992
1,024,142
2024
BlackRock
Annual
Financial
Statements
Schedule
of
Investments
(continued)
July
31,
2024
BlackRock
Global
Long/Short
Credit
Fund
(Percentages
shown
are
based
on
Net
Assets)
Security
Par
(000)
Par
(000)
Value
Italy
(continued)
Davide
Campari-Milano
NV
,
2.38%
,
01/17/29
(c)
(l)
................
EUR
1,200
$
1,291,945
Duomo
Bidco
SpA
,
(3-mo.
EURIBOR
at
0.00%
Floor
+
4.13%),
7.80%
,
07/15/31
(b)
(c)
...............
1,526
1,678,152
Engineering
-
Ingegneria
Informatica
-
SpA
,
11.13%
,
05/15/28
(c)
.......
1,312
1,365,778
Fiber
Bidco
SpA
(c)
10.00%
,
06/15/29
...........
778
809,492
(3-mo.
EURIBOR
at
0.00%
Floor
+
4.00%),
7.69%
,
01/15/30
(b)
...
600
652,925
IMA
Industria
Macchine
Automatiche
SpA
,
(3-mo.
EURIBOR
at
0.00%
Floor
+
3.75%),
7.44%
,
04/15/29
(b)
(c)
1,132
1,238,353
Infrastrutture
Wireless
Italiane
SpA
,
1.63%
,
10/21/28
(c)
...........
2,604
2,621,817
Intesa
Sanpaolo
SpA
(c)
5.15%
,
06/10/30
............
GBP
399
485,820
8.51%
,
09/20/32
............
364
519,943
Lottomatica
SpA
(c)
5.38%
,
06/01/30
............
EUR
462
507,589
(3-mo.
EURIBOR
at
0.00%
Floor
+
3.25%),
7.05%
,
06/01/31
(b)
...
701
766,244
Nexi
SpA
,
0.00%
,
02/24/28
(c)
(k)
(l)
....
3,600
3,315,455
Optics
Bidco
SpA
,
Series
2034
,
6.00%
,
09/30/34
(a)
................
USD
406
383,670
Pachelbel
Bidco
SpA
(c)
7.13%
,
05/17/31
............
EUR
596
669,012
(3-mo.
EURIBOR
at
0.00%
Floor
+
4.25%),
8.07%
,
05/17/31
(b)
...
784
856,969
Rekeep
SpA
,
7.25%
,
02/01/26
(c)
....
583
578,898
Rossini
SARL
(c)
6.75%
,
12/31/29
............
1,225
1,372,158
(3-mo.
EURIBOR
at
0.00%
Floor
+
3.88%),
7.55%
,
12/31/29
(b)
...
1,741
1,907,278
Salini
SpA
,
4.00%
,
05/30/28
(c)
(l)
.....
900
1,038,111
TeamSystem
SpA
,
(3-mo.
EURIBOR
at
0.00%
Floor
+
3.50%),
7.19%
,
07/31/31
(b)
(c)
...............
1,087
1,177,876
25,297,476
Japan
—
0.5%
Rakuten
Group,
Inc.
,
9.75%
,
04/15/29
(a)
USD
200
211,732
SoftBank
Group
Corp.
(c)
3.13%
,
09/19/25
............
EUR
1,250
1,330,897
3.38%
,
07/06/29
............
230
227,521
4.00%
,
09/19/29
............
240
243,792
3.88%
,
07/06/32
............
1,963
1,898,733
3,912,675
Jersey,
Channel
Islands
—
0.2%
Aston
Martin
Capital
Holdings
Ltd.
10.00%
,
03/31/29
(a)
..........
USD
200
200,806
10.38%
,
03/31/29
(c)
..........
GBP
1,456
1,871,761
2,072,567
Luxembourg
—
1.6%
Altice
Financing
SA
2.25%
,
01/15/25
(c)
...........
EUR
1,280
1,354,180
9.63%
,
07/15/27
(a)
...........
USD
1,175
1,097,041
Cidron
Aida
Finco
SARL
,
5.00%
,
04/01/28
(c)
................
EUR
1,797
1,803,192
Codere
New
Holdco
SA
(d)(e)
7.50%
,
11/30/27
(c)
...........
1,514
14,745
7.50%
,
11/30/27
(a)
...........
197
1,542
Security
Par
(000)
Par
(000)
Value
Luxembourg
(continued)
Ephios
Subco
3
SARL
,
7.88%
,
01/31/31
(c)
................
EUR
1,141
$
1,330,562
Garfunkelux
Holdco
3
SA
,
6.75%
,
11/01/25
(c)
.................
2,877
1,977,157
INEOS
Finance
plc
,
6.38%
,
04/15/29
(c)
709
789,391
Kleopatra
Finco
SARL
,
4.25%
,
03/01/26
(c)
................
884
856,255
Opus-Chartered
Issuances
SA
,
2.50%
,
07/04/25
(b)
(c)
...............
897
975,632
Sani/Ikos
Financial
Holdings
1
Sarl
,
7.25%
,
07/31/30
(c)
...........
1,021
1,113,817
Vivion
Investments
SARL
(c)
3.00%
,
08/08/24
............
1,600
1,723,202
7.90%
,
(
7.90
%
Cash
or
7.90
%
PIK),
02/28/29
(n)
..............
556
547,051
13,583,767
Netherlands
—
0.4%
ABN
AMRO
Bank
NV
,
(5-Year
EURIBOR
ICE
Swap
Rate
+
1.63%),
4.38%
,
07/16/36
(b)
(c)
..........
1,100
1,203,141
ING
Groep
NV
,
(5-Year
US
Treasury
Yield
Curve
Rate
T
Note
Constant
Maturity
+
2.86%),
3.88%
(b)
(m)
....
USD
1,857
1,599,574
Titan
Holdings
II
BV
,
5.13%
,
07/15/29
(c)
EUR
734
803,507
3,606,222
Norway
—
0.4%
Var
Energi
ASA
,
(5-Year
EURIBOR
ICE
Swap
Rate
+
4.77%),
7.86%
,
11/15/83
(b)
(c)
...............
2,525
2,992,286
Portugal
—
1.7%
Banco
Espirito
Santo
SA
(c)(d)(e)
2.63%
,
05/08/17
............
6,100
1,848,483
4.75%
,
01/15/18
............
19,300
5,848,479
4.00%
,
07/30/24
............
22,800
6,909,084
14,606,046
Romania
—
0.4%
RCS
&
RDS
SA
(c)
2.50%
,
02/05/25
............
500
534,854
3.25%
,
02/05/28
............
2,800
2,880,512
3,415,366
Slovenia
—
0.3%
(c)
Summer
BidCo
BV
,
10.00%
,
02/15/29
609
661,432
United
Group
BV
,
(3-mo.
EURIBOR
at
0.00%
Floor
+
4.25%),
8.08%
,
02/15/31
(b)
................
1,549
1,682,692
2,344,124
South
Korea
—
0.2%
SK
Hynix,
Inc.
,
6.25%
,
01/17/26
(a)
...
USD
2,000
2,028,750
Spain
—
1.3%
Banco
Bilbao
Vizcaya
Argentaria
SA
,
(5-Year
EUR
Swap
Annual
+
4.27%),
6.88%
(b)
(c)
(m)
................
EUR
1,200
1,298,700
Cellnex
Telecom
SA
(c)
2.13%
,
08/11/30
(l)
...........
3,700
4,126,052
1.75%
,
10/23/30
............
700
680,087
0.75%
,
11/20/31
(l)
...........
2,700
2,488,339
Cirsa
Finance
International
SARL
(c)
7.88%
,
07/31/28
............
482
551,900
(3-mo.
EURIBOR
+
4.50%),
8.14%
,
07/31/28
(b)
..............
940
1,028,760
Schedule
of
Investments
(continued)
July
31,
2024
BlackRock
Global
Long/Short
Credit
Fund
(Percentages
shown
are
based
on
Net
Assets)
Security
Par
(000)
Par
(000)
Value
Spain
(continued)
6.50%
,
03/15/29
............
EUR
403
$
449,776
Natural
Foods
,
(6-mo.
EURIBOR
at
0.00%
Floor
+
6.75%),
10.36%
,
10/13/29
(b)
(h)
...............
698
755,843
11,379,457
Sweden
—
1.1%
Heimstaden
Bostad
AB
(c)
(5-Year
EUR
Swap
Annual
+
3.67%),
3.25%
(b)
(m)
.........
531
435,316
1.13%
,
01/21/26
............
332
336,235
(5-Year
EUR
Swap
Annual
+
3.15%),
2.63%
(b)
(m)
.........
124
84,551
Heimstaden
Bostad
Treasury
BV
(c)
0.63%
,
07/24/25
............
332
338,944
1.38%
,
03/03/27
............
332
321,280
1.00%
,
04/13/28
............
996
913,723
Intrum
AB
(c)
3.00%
,
09/15/27
............
5,120
3,851,078
9.25%
,
03/15/28
............
438
327,658
Stena
International
SA
(a)
7.25%
,
01/15/31
............
USD
2,675
2,736,437
7.63%
,
02/15/31
............
425
437,015
9,782,237
Switzerland
—
0.5%
Julius
Baer
Group
Ltd.
,
(5-Year
EUR
Swap
Annual
+
3.85%),
6.63%
(b)
(c)
(m)
EUR
698
745,054
UBS
AG
,
0.25%
,
09/01/28
(c)
.......
900
866,413
UBS
Group
AG
(b)
(5-Year
USD
Swap
Semi
+
4.87%),
7.00%
(c)
(m)
...............
USD
2,250
2,250,000
(1-Year
EURIBOR
ICE
Swap
Rate
+
0.77%),
0.65%
,
01/14/28
(c)
...
EUR
500
505,232
(5-Year
US
Treasury
Yield
Curve
Rate
T
Note
Constant
Maturity
+
4.75%),
9.25%
(a)
(m)
.........
USD
225
244,962
4,611,661
United
Arab
Emirates
—
0.0%
Shelf
Drilling
Holdings
Ltd.
,
9.63%
,
04/15/29
(a)
................
265
254,649
United
Kingdom
—
7.1%
Amber
Finco
plc
,
6.63%
,
07/15/29
(c)
.
EUR
1,561
1,750,663
Ardonagh
Finco
Ltd.
,
6.88%
,
02/15/31
(c)
1,970
2,110,712
Barclays
plc
,
(USISSO05
+
5.78%),
9.63%
(b)
(m)
.................
USD
825
900,984
British
Airways
Pass-Through
Trust
,
Series
2013-1
,
Class
A
,
8.63%
,
12/15/32
(h)
................
19,378
20,420,707
Centrica
plc
,
(5-Year
U.K.
Government
Bonds
Note
Generic
Bid
Yield
+
2.51%),
6.50%
,
05/21/55
(b)
(c)
....
GBP
525
685,645
CK
Hutchison
Group
Telecom
Finance
SA
,
2.63%
,
10/17/34
(c)
........
1,296
1,242,645
CPUK
Finance
Ltd.
(c)
3.59%
,
08/28/25
............
341
429,522
7.88%
,
08/28/29
............
316
412,327
Deuce
Finco
plc
,
5.50%
,
06/15/27
(c)
.
709
872,992
EnQuest
plc
,
11.63%
,
11/01/27
(a)
...
USD
1,712
1,750,592
Galaxy
Bidco
Ltd.
,
6.50%
,
07/31/26
(c)
GBP
2,257
2,879,725
Global
Switch
Finance
BV
,
1.38%
,
10/07/30
(c)
................
EUR
2,142
2,097,598
INEOS
Quattro
Finance
2
plc
,
8.50%
,
03/15/29
(c)
................
2,157
2,483,174
Security
Par
(000)
Par
(000)
Value
United
Kingdom
(continued)
Intu
Jersey
2
Ltd.
,
2.88%
,
11/01/24
(c)
(d)
(e)
(l)
.......................
GBP
4,134
$
810,473
Jerrold
Finco
plc
,
5.25%
,
01/15/27
(c)
.
1,799
2,249,105
Lloyds
Banking
Group
plc
(b)(m)
(5-Year
U.K.
Government
Bonds
Note
Generic
Bid
Yield
+
4.61%),
5.13%
.................
587
748,015
(5-Year
EURIBOR
ICE
Swap
Rate
+
5.29%),
4.95%
(c)
..........
EUR
2,645
2,836,376
Metrocentre
Finance
plc
,
8.75%
,
(
8.75
%
Cash
or
8.75
%
PIK),
12/05/24
(n)
................
GBP
632
400,610
Motion
Finco
SARL
,
7.38%
,
06/15/30
(c)
EUR
1,890
2,134,524
Nationwide
Building
Society
,
(5-Year
U.K.
Government
Bonds
Note
Generic
Bid
Yield
+
5.39%),
5.88%
(b)
(c)
(m)
................
GBP
1,132
1,448,025
NatWest
Group
plc
,
Series
-*-
,
(5-Year
US
Treasury
Yield
Curve
Rate
T
Note
Constant
Maturity
+
5.63%),
6.00%
(b)
(m)
.................
USD
1,433
1,414,505
Phoenix
Group
Holdings
plc
,
(5-Year
US
Treasury
Yield
Curve
Rate
T
Note
Constant
Maturity
+
4.19%),
8.50%
(b)
(c)
(m)
................
1,470
1,471,837
Pinewood
Finco
plc
,
6.00%
,
03/27/30
(c)
GBP
2,004
2,564,494
Premier
Foods
Finance
plc
,
3.50%
,
10/15/26
(c)
................
951
1,179,842
Stonegate
Pub
Co.
Financing
2019
plc
(c)
(3-mo.
EURIBOR
+
0.00%),
10.27%
,
07/31/29
(b)
........
EUR
587
635,281
10.75%
,
07/31/29
...........
GBP
1,156
1,486,096
Thames
Water
Kemble
Finance
plc
,
4.63%
,
05/19/26
(c)
...........
432
16,716
Thames
Water
Utilities
Finance
plc
(c)
4.00%
,
06/19/25
............
1,810
1,780,037
0.88%
,
01/31/28
............
EUR
662
494,372
Zegona
Finance
plc
6.75%
,
07/15/29
(c)
...........
1,620
1,786,118
8.63%
,
07/15/29
(a)
...........
USD
225
229,528
61,723,240
United
States
—
31.2%
AAR
Escrow
Issuer
LLC
,
6.75%
,
03/15/29
(a)
................
1,739
1,777,586
Affinity
Interactive
,
6.88%
,
12/15/27
(a)
125
108,990
Alexander
Funding
Trust
II
,
7.47%
,
07/31/28
(a)
................
10,012
10,711,113
Allegiant
Travel
Co.
,
7.25%
,
08/15/27
(a)
90
83,940
Allied
Universal
Holdco
LLC
9.75%
,
07/15/27
(a)
...........
60
59,949
4.88%
,
06/01/28
(c)
...........
GBP
1,852
2,180,253
AMC
Networks,
Inc.
10.25%
,
01/15/29
(a)
..........
USD
107
105,733
4.25%
,
02/15/29
............
163
112,151
Amentum
Escrow
Corp.
,
7.25%
,
08/01/32
(a)
................
441
450,397
Amkor
Technology,
Inc.
,
6.63%
,
09/15/27
(a)
................
3,000
3,006,972
Ardagh
Packaging
Finance
plc
2.13%
,
08/15/26
(c)
...........
EUR
1,783
1,580,144
4.13%
,
08/15/26
(a)
...........
USD
604
510,798
4.75%
,
07/15/27
(c)
...........
GBP
393
270,596
2024
BlackRock
Annual
Financial
Statements
Schedule
of
Investments
(continued)
July
31,
2024
BlackRock
Global
Long/Short
Credit
Fund
(Percentages
shown
are
based
on
Net
Assets)
Security
Par
(000)
Par
(000)
Value
United
States
(continued)
Ashton
Woods
USA
LLC
(a)
4.63%
,
08/01/29
............
USD
38
$
35,086
4.63%
,
04/01/30
............
154
140,582
Bausch
+
Lomb
Corp.
,
8.38%
,
10/01/28
(a)
................
4,500
4,623,394
Big
River
Steel
LLC
,
6.63%
,
01/31/29
(a)
121
121,245
Buckeye
Partners
LP
4.35%
,
10/15/24
............
41
40,860
4.13%
,
03/01/25
(a)
...........
38
37,498
California
Resources
Corp.
,
8.25%
,
06/15/29
(a)
................
78
79,875
Calumet
Specialty
Products
Partners
LP
,
9.75%
,
07/15/28
(a)
.........
221
202,682
Carnival
Corp.
,
7.00%
,
08/15/29
(a)
...
470
491,206
Catalent
Pharma
Solutions,
Inc.
,
5.00%
,
07/15/27
(a)
................
2,000
1,986,145
Champions
Financing,
Inc.
,
8.75%
,
02/15/29
(a)
................
21
21,419
Civitas
Resources,
Inc.
(a)
5.00%
,
10/15/26
............
156
152,576
8.38%
,
07/01/28
............
291
305,524
Cloud
Software
Group,
Inc.
(a)
6.50%
,
03/31/29
............
3,000
2,924,242
9.00%
,
09/30/29
............
1,210
1,203,231
8.25%
,
06/30/32
............
2,940
3,050,259
Clydesdale
Acquisition
Holdings,
Inc.
,
8.75%
,
04/15/30
(a)
...........
90
88,326
CommScope
Technologies
LLC
,
6.00%
,
06/15/25
(a)
................
3,669
3,444,274
Constellium
SE
,
5.38%
,
08/15/32
(c)
..
EUR
1,129
1,224,915
Crescent
Energy
Finance
LLC
,
7.63%
,
04/01/32
(a)
................
USD
74
75,892
CSC
Holdings
LLC
(a)
5.50%
,
04/15/27
............
200
167,206
11.25%
,
05/15/28
...........
200
180,816
11.75%
,
01/31/29
...........
200
180,798
DISH
DBS
Corp.
,
5.88%
,
11/15/24
..
498
464,406
DISH
Network
Corp.
(l)
0.00%
,
12/15/25
(k)
...........
185
134,881
3.38%
,
08/15/26
............
60
36,445
Dresdner
Funding
Trust
I
,
8.15%
,
06/30/31
(c)
................
2,023
2,212,389
Edison
International
,
(5-Year
US
Treasury
Yield
Curve
Rate
T
Note
Constant
Maturity
+
3.66%),
7.88%
,
06/15/54
(b)
................
3,650
3,820,455
EQM
Midstream
Partners
LP
,
7.50%
,
06/01/27
(a)
................
7,250
7,448,386
EquipmentShare.com,
Inc.
,
9.00%
,
05/15/28
(a)
................
1,397
1,437,964
Forestar
Group,
Inc.
,
5.00%
,
03/01/28
(a)
557
536,203
Freewire
Technologies,
Inc.
,
6.00%
,
02/20/28
(h)
................
769
—
Frontier
Communications
Holdings
LLC
(a)
8.75%
,
05/15/30
............
11,344
11,884,336
8.63%
,
03/15/31
............
150
157,109
Frontier
Florida
LLC
,
Series
E
,
6.86%
,
02/01/28
.................
8,500
8,603,608
Full
House
Resorts,
Inc.
,
8.25%
,
02/15/28
(a)
................
48
47,252
GoTo
Group,
Inc.
5.50%
,
05/01/28
(a)
...........
3,512
1,871,181
Security
Par
(000)
Par
(000)
Value
United
States
(continued)
Gray
Television,
Inc.
,
10.50%
,
07/15/29
(a)
................
USD
2,000
$
2,087,014
Helios
Software
Holdings,
Inc.
,
7.88%
,
05/01/29
(c)
................
EUR
1,391
1,527,601
Howard
Hughes
Corp.
(The)
,
5.38%
,
08/01/28
(a)
................
USD
323
313,227
Icon
Investments
Six
DAC
,
5.81%
,
05/08/27
.................
3,000
3,060,326
Illuminate
Buyer
LLC
,
9.00%
,
07/01/28
(a)
................
67
67,219
Iron
Mountain
UK
plc
,
3.88%
,
11/15/25
(c)
.................
GBP
1,443
1,818,666
JPMorgan
Chase
&
Co.
,
Series
KK
,
(5-
Year
US
Treasury
Yield
Curve
Rate
T
Note
Constant
Maturity
+
2.85%),
3.65%
(b)
(m)
.................
USD
35
33,236
Kronos
International,
Inc.
(c)
3.75%
,
09/15/25
............
EUR
319
341,785
9.50%
,
03/15/29
............
1,467
1,718,643
Landsea
Homes
Corp.
,
11.00%
,
07/17/28
(h)
................
USD
1,819
1,962,337
Lessen,
Inc.
,
(3-mo.
CME
Term
SOFR
+
8.50%),
13.40%
,
01/05/28
(a)
(b)
(h)
..
1,287
1,197,018
Level
3
Financing,
Inc.
,
4.63%
,
09/15/27
(a)
................
295
194,818
LGI
Homes,
Inc.
,
8.75%
,
12/15/28
(a)
.
122
129,619
Lightning
eMotors,
Inc.
,
7.50%
,
05/15/25
(a)
(d)
(e)
(l)
.............
200
2,000
Lions
Gate
Capital
Holdings
1,
Inc.
,
5.50%
,
04/15/29
(a)
...........
17,535
15,693,825
Macy's
Retail
Holdings
LLC
,
5.88%
,
04/01/29
(a)
................
1,000
976,707
Mauser
Packaging
Solutions
Holding
Co.
,
7.88%
,
04/15/27
(a)
........
281
290,001
Midwest
Gaming
Borrower
LLC
,
4.88%
,
05/01/29
(a)
................
122
115,202
Nationstar
Mortgage
Holdings,
Inc.
(a)
6.00%
,
01/15/27
............
40
39,702
5.50%
,
08/15/28
............
193
187,444
5.13%
,
12/15/30
............
190
176,943
5.75%
,
11/15/31
............
89
84,940
NCR
Atleos
Corp.
,
9.50%
,
04/01/29
(a)
6,750
7,373,850
Neogen
Food
Safety
Corp.
,
8.63%
,
07/20/30
(a)
................
5,334
5,761,515
Nexstar
Media,
Inc.
,
5.63%
,
07/15/27
(a)
6
5,819
NiSource,
Inc.
,
(5-Year
US
Treasury
Yield
Curve
Rate
T
Note
Constant
Maturity
+
2.45%),
6.95%
,
11/30/54
(b)
................
3,000
3,042,244
Olympus
Water
US
Holding
Corp.
,
9.75%
,
11/15/28
(a)
...........
304
323,051
Palomino
Funding
Trust
I
,
7.23%
,
05/17/28
(a)
................
10,850
11,572,893
Paramount
Global
7.88%
,
07/30/30
............
3,000
3,183,300
(5-Year
US
Treasury
Yield
Curve
Rate
T
Note
Constant
Maturity
+
4.00%),
6.38%
,
03/30/62
(b)
...
3,851
3,535,699
Park
Intermediate
Holdings
LLC
,
4.88%
,
05/15/29
(a)
...........
168
158,744
PennyMac
Financial
Services,
Inc.
,
7.88%
,
12/15/29
(a)
...........
43
45,012
Permian
Resources
Operating
LLC
(a)
7.75%
,
02/15/26
............
28
28,348
Schedule
of
Investments
(continued)
July
31,
2024
BlackRock
Global
Long/Short
Credit
Fund
(Percentages
shown
are
based
on
Net
Assets)
Security
Par
(000)
Par
(000)
Value
United
States
(continued)
8.00%
,
04/15/27
............
USD
208
$
214,697
5.88%
,
07/01/29
............
61
60,631
7.00%
,
01/15/32
............
69
71,441
Pilgrim's
Pride
Corp.
,
6.25%
,
07/01/33
209
216,425
Pitney
Bowes,
Inc.
,
6.88%
,
03/15/27
(a)
6,350
6,280,308
Playtika
Holding
Corp.
,
4.25%
,
03/15/29
(a)
................
32
28,432
Rand
Parent
LLC
,
8.50%
,
02/15/30
(a)
6,500
6,427,637
Reworld
Holding
Corp.
,
4.88%
,
12/01/29
(a)
................
51
46,636
RingCentral,
Inc.
,
8.50%
,
08/15/30
(a)
.
7,500
7,879,935
Sabre
GLBL,
Inc.
(a)
8.63%
,
06/01/27
............
4,739
4,430,066
11.25%
,
12/15/27
...........
4,183
4,142,457
SCIL
IV
LLC
,
9.50%
,
07/15/28
(c)
....
EUR
1,528
1,785,550
Seagate
HDD
Cayman
8.25%
,
12/15/29
(a)
...........
USD
7,000
7,543,766
8.50%
,
07/15/31
(a)
...........
1,269
1,377,859
9.63%
,
12/01/32
............
7,150
8,187,975
Service
Properties
Trust
8.38%
,
06/15/29
............
5,383
5,358,906
8.88%
,
06/15/32
............
415
395,395
Sitio
Royalties
Operating
Partnership
LP
,
7.88%
,
11/01/28
(a)
.........
99
103,587
Sonder
Corp.
,
10.00%
,
12/31/24
(h)
..
132
127,652
Sonder
Holdings,
Inc.
,
(3-mo.
CME
Term
SOFR
at
1.00%
Floor
+
9.00%),
14.35%
,
01/19/27
(b)
(h)
...
1,464
1,291,684
Spirit
AeroSystems,
Inc.
(a)
9.38%
,
11/30/29
............
5,500
5,952,664
9.75%
,
11/15/30
............
8,762
9,765,205
Stem,
Inc.
,
0.50%
,
12/01/28
(a)
(l)
.....
47
18,677
STL
Holding
Co.
LLC
,
8.75%
,
02/15/29
(a)
................
82
85,371
SUN
Country
Marine,
Inc.
,
Series
2022-
1B
,
5.75%
,
03/15/29
(h)
........
10,235
10,413,943
Talen
Energy
Supply
LLC
,
8.63%
,
06/01/30
(a)
................
3,600
3,879,463
Tenneco,
Inc.
,
8.00%
,
11/17/28
(a)
...
203
184,235
Texas
Capital
Bancshares,
Inc.
,
(5-Year
US
Treasury
Yield
Curve
Rate
T
Note
Constant
Maturity
+
3.15%),
4.00%
,
05/06/31
(b)
...........
100
92,695
Transocean
Titan
Financing
Ltd.
,
8.38%
,
02/01/28
(a)
...........
77
80,081
Transocean,
Inc.
,
8.25%
,
05/15/29
(a)
.
124
126,613
Uniti
Group
LP
(a)
Series
MAY
,
10.50%
,
02/15/28
...
439
444,026
10.50%
,
02/15/28
...........
8,632
8,730,822
Univision
Communications,
Inc.
,
8.00%
,
08/15/28
(a)
................
2,000
2,009,900
Venture
Global
LNG,
Inc.
(a)
9.50%
,
02/01/29
............
6,764
7,524,877
7.00%
,
01/15/30
............
3,000
3,031,330
Veritas
US,
Inc.
,
7.50%
,
09/01/25
(a)
..
2,790
2,427,300
Vistra
Operations
Co.
LLC
(a)
7.75%
,
10/15/31
............
4,002
4,229,134
6.00%
,
04/15/34
............
2,000
2,046,448
Vital
Energy,
Inc.
,
7.88%
,
04/15/32
(a)
.
52
52,893
Warnermedia
Holdings,
Inc.
,
6.41%
,
03/15/26
.................
7,025
7,024,646
Weekley
Homes
LLC
,
4.88%
,
09/15/28
(a)
................
147
139,948
Security
Par
(000)
Par
(000)
Value
United
States
(continued)
William
Carter
Co.
(The)
,
5.63%
,
03/15/27
(a)
................
USD
11
$
10,881
XHR
LP
(a)
6.38%
,
08/15/25
............
104
104,010
4.88%
,
06/01/29
............
25
23,591
Zayo
Group
Holdings,
Inc.
,
4.00%
,
03/01/27
(a)
................
148
125,854
271,935,682
Zambia
—
0.4%
First
Quantum
Minerals
Ltd.
,
9.38%
,
03/01/29
(a)
................
3,544
3,732,293
Total
Corporate
Bonds
—
60.9%
(Cost:
$
575,430,884
)
.............................
530,672,499
Fixed
Rate
Loan
Interests
Jersey,
Channel
Islands
—
0.0%
New
Look
Corp.
Ltd.,
Term
Loan
,
0.00
%
,
11/09/29
(h)
...........
GBP
213
2,744
United
States
—
0.0%
AVSC
Holding
Corp.,
1st
Lien
Term
Loan
B3
,
5.00
%
,
10/15/26
......
USD
382
386,831
Total
Fixed
Rate
Loan
Interests
—
0.0%
(Cost:
$
420,647
)
................................
389,575
Floating
Rate
Loan
Interests
Colombia
—
0.0%
Ecopetrol
SA,
Term
Loan
,
(3-mo.
CME
Term
SOFR
at
0.00%
Floor
+
0.00%),
10.00
%
,
09/06/30
(b)
(h)
...
150
153,480
Finland
—
0.1%
Mehilainen
Yhtiot
Oy,
Facility
Term
Loan
B4
,
(3-mo.
EURIBOR
at
0.00%
Floor
+
0.00%),
7.65
%
,
08/09/28
(b)
EUR
867
939,830
France
—
0.5%
(b)
Altice
France
SA,
Term
Loan
B14
,
(3-mo.
EURIBOR
at
0.00%
Floor
+
5.50%),
9.19
%
,
08/15/28
......
1,990
1,608,240
Tarkett
Participation,
Facility
Term
Loan
B
,
(6-mo.
EURIBOR
at
0.00%
Floor
+
3.45%),
7.12
%
,
04/21/28
.....
2,831
3,065,466
4,673,706
Germany
—
1.1%
(b)
Apleona
Holding
GmbH,
Facility
Term
Loan
B3
,
7.39
%
,
04/28/28
......
1,240
1,344,387
Nidda
Healthcare
Holding
GmbH,
Term
Loan
B3
,
02/21/30
(o)
..........
3,263
3,523,209
Tele
Columbus
AG,
Facility
Term
Loan
B
,
10.00
%
,
01/01/29
.........
1,000
793,430
TK
Elevator
Midco
GmbH,
Facility
Term
Loan
B2
,
(6-mo.
EURIBOR
at
0.00%
Floor
+
4.00%),
7.59
%
,
04/30/30
.
2,357
2,555,099
Wittur
Holding
GmbH,
Facility
Term
Loan
B
,
(3-mo.
EURIBOR
at
0.00%
Floor
+
5.50%),
9.18
%
,
09/29/28
.
1,412
1,346,206
9,562,331
2024
BlackRock
Annual
Financial
Statements
Schedule
of
Investments
(continued)
July
31,
2024
BlackRock
Global
Long/Short
Credit
Fund
(Percentages
shown
are
based
on
Net
Assets)
Security
Par
(000)
Par
(000)
Value
Jersey,
Channel
Islands
—
0.0%
New
Look
Corp.
Ltd.,
Term
Loan
,
(6-
mo.
SONIA
at
0.00%
Floor
+
0.00%),
16.50
%
,
11/10/27
(b)
(h)
.........
GBP
390
$
301,123
Luxembourg
—
0.7%
(b)
Altice
Financing
SA,
Term
Loan
(3-mo.
EURIBOR
at
0.00%
Floor
+
5.00%),
8.69
%
,
10/28/27
....
EUR
1,194
1,109,421
(3-mo.
EURIBOR
at
0.00%
Floor
+
5.00%),
8.69
%
,
10/31/27
....
1,933
1,795,708
Concrete
Investment
II
SCA,
Facility
Term
Loan
A2
,
(3-mo.
EURIBOR
at
0.00%
Floor
+
2.00%),
5.87
%
,
10/30/24
(h)
...........
86
9
EURO
Parfums
Fze,
Term
Loan
,
(6-
mo.
LIBOR
USD
at
0.00%
Floor
+
0.00%),
12.21
%
,
01/01/30
(h)
.....
USD
218
218,000
Index
Holdco
SARL,
Facility
Term
Loan
A
,
(6-mo.
EURIBOR
at
0.00%
Floor
+
0.10%),
0.10
%
,
12/29/28
.....
EUR
1,714
259,564
Rainbow
UK
Holdco
Ltd.,
Facility
Term
Loan
B2
,
(6-mo.
EURIBOR
at
0.00%
Floor
+
3.50%),
7.41
%
,
02/24/29
.
2,400
2,589,660
5,972,362
Netherlands
—
1.0%
(b)
Boels
Topholding
BV,
Facility
Term
Loan
B2
,
(3-mo.
EURIBOR
at
0.00%
Floor
+
3.00%),
6.80
%
,
05/23/31
.....
1,293
1,401,560
Median
BV,
Facility
Term
Loan
B2
,
11.02
%
,
10/14/27
(d)
(e)
.........
GBP
1,700
2,073,432
Sigma
Holdco
BV,
Facility
Term
Loan
B6
,
01/02/28
(o)
..............
EUR
2,500
2,701,675
Ziggo
BV,
Facility
Term
Loan
H
,
(1-mo.
EURIBOR
at
0.00%
Floor
+
3.00%),
6.61
%
,
01/31/29
............
2,139
2,277,986
8,454,653
Spain
—
1.1%
(b)
Europa
University
Education
Group
SL,
Term
Loan
,
06/13/31
(o)
........
927
1,003,344
Lorca
Holdco
Ltd.,
Facility
Term
Loan
B3
,
(6-mo.
EURIBOR
at
0.00%
Floor
+
3.50%),
7.20
%
,
03/25/31
.....
5,946
6,437,506
Pax
Midco
SLU,
Facility
Term
Loan
B2
,
(6-mo.
EURIBOR
at
0.00%
Floor
+
5.00%),
8.74
%
,
12/31/29
......
1,706
1,830,033
9,270,883
United
Kingdom
—
1.3%
(b)
Bellis
Acquisition
Co.
plc,
Term
Loan
B
,
(6-mo.
EURIBOR
at
0.00%
Floor
+
4.00%),
7.80
%
,
12/31/30
......
1,293
1,393,180
CD&R
Firefly
Bidco
Ltd.,
Facility
Term
Loan
B6
,
(6-mo.
SONIA
at
0.00%
Floor
+
5.75%),
10.81
%
,
06/21/28
GBP
2,250
2,892,487
Ineos
Quattro
Holdings
UK
Ltd.,
Term
Loan
B
,
(1-mo.
EURIBOR
at
0.00%
Floor
+
4.50%),
8.10
%
,
04/02/29
.
EUR
2,810
3,044,521
Ineos
US
Finance
LLC,
Term
Loan
,
(1-mo.
EURIBOR
+
3.50%),
7.10
%
,
06/23/31
............
3,931
4,225,353
Security
Par
(000)
Par
(000)
Value
United
Kingdom
(continued)
Seashell
Bidco
SL,
Facility
Term
Loan
B
,
(6-mo.
EURIBOR
at
0.00%
Floor
+
6.50%),
0.00
%
,
10/10/29
(h)
....
EUR
74
$
79,789
11,635,330
United
States
—
10.2%
Aimbridge
Acquisition
Co.,
Inc.,
1st
Lien
Term
Loan
,
(1-mo.
CME
Term
SOFR
at
0.00%
Floor
+
4.75%),
10.21
%
,
02/02/26
(b)
..........
USD
173
170,660
Altar
BidCo,
Inc.,
1st
Lien
Term
Loan
,
(12-mo.
CME
Term
SOFR
at
0.50%
Floor
+
3.10%),
7.95
%
,
02/01/29
(b)
2,985
2,985,518
Altar
BidCo,
Inc.,
2nd
Lien
Term
Loan
,
(12-mo.
CME
Term
SOFR
at
0.50%
Floor
+
5.60%),
10.40
%
,
02/01/30
(b)
11,512
11,252,863
American
Auto
Auction
Group
LLC,
1st
Lien
Term
Loan
B
,
(3-mo.
CME
Term
SOFR
at
0.75%
Floor
+
5.00%),
10.49
%
,
12/30/27
(b)
..........
117
117,454
Amneal
Pharmaceuticals
LLC,
Term
Loan
,
(1-mo.
CME
Term
SOFR
at
0.00%
Floor
+
5.50%),
10.84
%
,
05/04/28
(b)
..........
3,237
3,264,389
Applied
Systems,
Inc.,
1st
Lien
Term
Loan
,
(3-mo.
CME
Term
SOFR
at
0.00%
Floor
+
3.50%),
8.84
%
,
02/24/31
(b)
...........
851
854,907
Ascensus
Group
Holdings,
Inc.,
1st
Lien
Term
Loan
,
(1-mo.
CME
Term
SOFR
at
0.50%
Floor
+
3.50%),
8.96
%
,
08/02/28
(b)
...........
2
2,376
Atlas
CC
Acquisition
Corp.,
1st
Lien
Term
Loan
B
,
05/25/28
(b)
(o)
......
831
607,451
Atlas
CC
Acquisition
Corp.,
1st
Lien
Term
Loan
C
,
05/25/28
(b)
(o)
......
169
123,549
Avaya,
Inc.,
Term
Loan
,
(1-mo.
CME
Term
SOFR
at
1.00%
Floor
+
7.50%),
12.84
%
,
08/01/28
(b)
.....
58
51,382
AVSC
Holding
Corp.,
1st
Lien
Term
Loan
B1
,
(1-mo.
CME
Term
SOFR
at
1.00%
Floor
+
3.25%),
8.69
%
,
03/03/25
(b)
...........
956
949,237
Boxer
Parent
Co.,
Inc.,
Term
Loan
,
(1-mo.
EURIBOR
+
4.00%),
7.61
%
,
07/03/31
(b)
...........
EUR
2,388
2,587,643
Champions
Holdco,
Inc.,
Term
Loan
,
(3-mo.
CME
Term
SOFR
at
0.00%
Floor
+
4.75%),
10.08
%
,
02/23/29
(b)
USD
765
757,671
Chemours
Co.
(The),
Term
Loan
B3
,
(1-mo.
EURIBOR
at
0.00%
Floor
+
4.00%),
7.60
%
,
08/18/28
(b)
.....
EUR
4,000
4,332,593
Cloud
Software
Group,
Inc.,
1st
Lien
Term
Loan
,
(3-mo.
CME
Term
SOFR
at
0.50%
Floor
+
4.50%),
9.84
%
,
03/21/31
(b)
...........
USD
1,782
1,788,023
Cloud
Software
Group,
Inc.,
Term
Loan
,
(3-mo.
CME
Term
SOFR
at
0.50%
Floor
+
4.00%),
9.34
%
,
03/30/29
(b)
715
714,115
Conair
Holdings
LLC,
1st
Lien
Term
Loan
,
(1-mo.
CME
Term
SOFR
at
0.50%
Floor
+
3.75%),
9.21
%
,
05/17/28
(b)
...........
88
84,368
Schedule
of
Investments
(continued)
July
31,
2024
BlackRock
Global
Long/Short
Credit
Fund
(Percentages
shown
are
based
on
Net
Assets)
Security
Par
(000)
Par
(000)
Value
United
States
(continued)
ConnectWise
LLC,
Term
Loan
,
(3-mo.
CME
Term
SOFR
at
0.50%
Floor
+
3.50%),
9.10
%
,
09/29/28
(b)
.....
USD
79
$
78,659
CoreWeave
Compute
Acquisition
Co.
II
LLC,
Delayed
Draw
Term
Loan
(b)(h)
(3-mo.
CME
Term
SOFR
at
0.00%
Floor
+
9.62%),
14.08
%
,
07/31/28
1,432
1,429,822
(3-mo.
CME
Term
SOFR
+
0.00%),
2.50
%
,
05/16/29
..........
122
120,501
Cotiviti
Holdings,
Inc.,
Term
Loan
,
(1-mo.
CME
Term
SOFR
at
0.00%
Floor
+
3.25%),
8.59
%
,
05/01/31
(b)
1,494
1,498,932
DirecTV
Financing
LLC,
Term
Loan
,
(1-mo.
CME
Term
SOFR
at
0.75%
Floor
+
5.00%),
10.46
%
,
08/02/27
(b)
135
135,460
DRI
Holding,
Inc.,
1st
Lien
Term
Loan
,
(1-mo.
CME
Term
SOFR
at
0.50%
Floor
+
5.25%),
10.69
%
,
12/21/28
(b)
237
227,242
Dynasty
Acquisition
Co.,
Inc.,
Term
Loan
B1
,
(1-mo.
CME
Term
SOFR
at
0.00%
Floor
+
3.50%),
8.84
%
,
08/24/28
(b)
...........
186
186,498
Dynasty
Acquisition
Co.,
Inc.,
Term
Loan
B2
,
(1-mo.
CME
Term
SOFR
at
0.00%
Floor
+
3.50%),
8.84
%
,
08/24/28
(b)
...........
72
71,909
ECL
Entertainment
LLC,
Term
Loan
B
,
(1-mo.
CME
Term
SOFR
at
0.00%
Floor
+
4.00%),
9.34
%
,
08/31/30
(b)
492
493,059
EIS
Group
Ltd.,
Term
Loan
(1-mo.
CME
Term
SOFR
at
0.75%
Floor
+
7.00%),
12.34
%
,
07/10/28
(b)
(h)
.......
642
632,829
Ellucian
Holdings,
Inc.,
2nd
Lien
Term
Loan
,
(1-mo.
CME
Term
SOFR
at
1.00%
Floor
+
8.00%),
13.44
%
,
10/09/28
(b)
(h)
.........
1,417
1,416,667
Emerald
Technologies
US
AcquisitionCo.,
Inc.,
Term
Loan
B
,
(3-mo.
CME
Term
SOFR
at
1.00%
Floor
+
6.25%),
11.75
%
,
12/29/27
(b)
(h)
285
250,811
First
Brands
Group
LLC,
1st
Lien
Term
Loan
,
(3-mo.
EURIBOR
at
1.00%
Floor
+
5.00%),
8.64
%
,
03/30/27
(b)
(h)
EUR
2,598
2,814,906
Flexsys
Holdings,
Inc.,
1st
Lien
Term
Loan
,
(3-mo.
CME
Term
SOFR
at
0.75%
Floor
+
5.25%),
10.85
%
,
11/01/28
(b)
..........
USD
171
153,956
Genesys
Cloud
Services
Holdings
I
LLC,
Term
Loan
(b)
(1-mo.
CME
Term
SOFR
at
0.75%
Floor
+
3.50%),
8.84
%
,
12/01/27
1,990
1,999,858
(1-mo.
CME
Term
SOFR
at
0.75%
Floor
+
3.75%),
9.21
%
,
12/01/27
3,260
3,279,308
GoTo
Group,
Inc.,
Term
Loan
,
(1-mo.
LIBOR
USD
at
0.00%
Floor
+
4.75%),
10.14
%
,
04/28/28
(b)
.....
3,501
3,082,149
Green
Plains
Operating
Co.
LLC,
Term
Loan
,
(3-mo.
CME
Term
SOFR
at
0.00%
Floor
+
8.00%),
13.59
%
,
07/20/26
(b)
(h)
.........
414
408,918
Security
Par
(000)
Par
(000)
Value
United
States
(continued)
Helios
Service
Partners
LLC,
1st
Lien
Term
Loan
,
(3-mo.
CME
Term
SOFR
at
1.00%
Floor
+
6.50%),
12.10
%
,
03/19/27
(b)
(h)
.........
USD
20
$
20,484
Helios
Service
Partners
LLC,
2nd
Lien
Term
Loan
,
(3-mo.
CME
Term
SOFR
at
1.00%
Floor
+
6.25%),
11.85
%
,
03/19/27
(b)
(h)
.........
107
107,260
Helios
Service
Partners
LLC,
Delayed
Draw
2nd
Lien
Term
Loan
,
(3-mo.
CME
Term
SOFR
at
1.00%
Floor
+
0.00%),
1.00
%
,
03/19/27
(b)
(h)
....
165
164,890
Helios
Services
Partners,
Delayed
Draw
Term
Loan
,
0.00
%
,
12/31/30
(b)
(e)
(h)
.
108
107,315
Hydrofarm
Holdings
Group,
Inc.,
Term
Loan
,
(1-mo.
CME
Term
SOFR
at
1.00%
Floor
+
5.50%),
10.96
%
,
10/25/28
(b)
(h)
.........
165
132,831
J&J
Ventures
Gaming
LLC,
Term
Loan
,
(1-mo.
CME
Term
SOFR
at
0.75%
Floor
+
4.00%),
9.46
%
,
04/26/28
(b)
319
319,219
Jack
Ohio
Finance
LLC,
Term
Loan
,
(1-mo.
CME
Term
SOFR
at
0.75%
Floor
+
4.75%),
10.21
%
,
10/04/28
(b)
129
128,560
Level
3
Financing,
Inc.,
Term
Loan
B1
,
(1-mo.
CME
Term
SOFR
at
2.00%
Floor
+
6.56%),
11.91
%
,
04/15/29
(b)
54
53,796
Maverick
Gaming
LLC,
1st
Lien
Term
Loan
,
(3-mo.
CME
Term
SOFR
at
1.00%
Floor
+
7.50%),
12.82
%
,
06/03/28
(b)
..........
115
109,326
Maverick
Gaming
LLC,
2nd
Lien
Term
Loan
,
(3-mo.
CME
Term
SOFR
at
1.00%
Floor
+
7.50%),
12.82
%
,
06/03/28
(b)
(h)
.........
190
132,870
Medical
Solutions
Holdings,
Inc.,
2nd
Lien
Term
Loan
,
(3-mo.
CME
Term
SOFR
at
0.50%
Floor
+
7.00%),
12.35
%
,
11/01/29
(b)
..........
461
308,870
MH
Sub
I
LLC,
2nd
Lien
Term
Loan
,
(3-mo.
CME
Term
SOFR
at
0.00%
Floor
+
6.25%),
11.50
%
,
02/23/29
(b)
302
299,264
Mitchell
International,
Inc.,
1st
Lien
Term
Loan
,
(1-mo.
CME
Term
SOFR
at
0.50%
Floor
+
3.25%),
8.59
%
,
06/17/31
(b)
...........
878
867,833
Modena
Buyer
LLC,
Term
Loan
,
(3-mo.
CME
Term
SOFR
at
0.00%
Floor
+
4.50%),
9.83
%
,
07/01/31
(b)
.....
1,000
961,500
Naked
Juice
LLC,
1st
Lien
Term
Loan
,
(3-mo.
CME
Term
SOFR
at
0.50%
Floor
+
3.25%),
8.69
%
,
01/24/29
(b)
400
355,456
Naked
Juice
LLC,
2nd
Lien
Term
Loan
,
(3-mo.
CME
Term
SOFR
at
0.50%
Floor
+
6.00%),
11.44
%
,
01/24/30
(b)
969
722,448
NGP
XI
Midstream
Holdings
LLC,
Term
Loan
,
(3-mo.
CME
Term
SOFR
+
4.00%),
9.29
%
,
07/25/31
(b)
(h)
....
95
94,644
Nielsen
Consumer,
Inc.,
Term
Loan
,
(1-mo.
EURIBOR
+
4.75%),
8.35
%
,
03/06/28
(b)
...........
EUR
1,678
1,815,189
Olympus
Water
US
Holding
Corp.,
Term
Loan
B
,
(3-mo.
EURIBOR
at
0.00%
Floor
+
3.75%),
7.46
%
,
06/20/31
(b)
1,438
1,551,945
2024
BlackRock
Annual
Financial
Statements
Schedule
of
Investments
(continued)
July
31,
2024
BlackRock
Global
Long/Short
Credit
Fund
(Percentages
shown
are
based
on
Net
Assets)
Security
Par
(000)
Par
(000)
Value
United
States
(continued)
Orion
Group
HoldCo
LLC,
Delayed
Draw
1st
Lien
Term
Loan
,
(3-mo.
CME
Term
SOFR
at
1.00%
Floor
+
6.50%),
0.00
%
,
03/19/27
(b)
(h)
....
USD
91
$
92,073
Orion
Group
HoldCo
LLC,
Delayed
Draw
Term
Loan
(3-mo.
CME
Term
SOFR
at
1.00%
Floor
+
0.00%),
11.60
%
,
03/19/27
(b)
(h)
.......
238
239,539
Orion
Group
HoldCo
LLC,
Term
Loan
(3-mo.
CME
Term
SOFR
at
1.00%
Floor
+
0.00%),
11.60
%
,
03/19/27
(b)
(h)
.......
21
20,982
Park
River
Holdings,
Inc.,
1st
Lien
Term
Loan
,
(3-mo.
CME
Term
SOFR
at
0.75%
Floor
+
3.25%),
8.84
%
,
12/28/27
(b)
...........
91
86,305
Playtika
Holding
Corp.,
Term
Loan
B1
,
(1-mo.
CME
Term
SOFR
at
0.00%
Floor
+
2.75%),
8.21
%
,
03/13/28
(b)
478
478,495
Potters
Industries
LLC,
Term
Loan
,
(3-mo.
CME
Term
SOFR
at
0.75%
Floor
+
3.75%),
9.09
%
,
12/14/27
(b)
88
88,192
Project
Montage
Note,
Term
Loan
,
01/01/28
(b)
(h)
(o)
..............
143
143,077
Project
Montage,
Term
Loan
,
01/01/38
(b)
(h)
(o)
.....................
322
321,923
Proofpoint,
Inc.,
1st
Lien
Term
Loan
,
(1-mo.
CME
Term
SOFR
at
0.50%
Floor
+
3.00%),
8.34
%
,
08/31/28
(b)
637
638,510
Quartz
AcquireCo
LLC,
Term
Loan
B1
,
(3-mo.
CME
Term
SOFR
at
0.00%
Floor
+
2.75%),
8.09
%
,
06/28/30
(b)
5,868
5,886,056
RealPage,
Inc.,
2nd
Lien
Term
Loan
,
(1-mo.
CME
Term
SOFR
at
0.75%
Floor
+
6.50%),
11.96
%
,
04/23/29
(b)
1,293
1,221,943
Redstone
HoldCo
2
LP,
1st
Lien
Term
Loan
,
(3-mo.
CME
Term
SOFR
at
0.75%
Floor
+
4.75%),
10.26
%
,
04/27/28
(b)
..........
4,690
3,963,949
Redstone
HoldCo
2
LP,
2nd
Lien
Term
Loan
,
(3-mo.
CME
Term
SOFR
at
0.75%
Floor
+
7.75%),
13.26
%
,
04/27/29
(b)
..........
3,548
2,703,860
SCIH
Salt
Holdings,
Inc.,
1st
Lien
Term
Loan
B1
,
(3-mo.
CME
Term
SOFR
at
0.75%
Floor
+
3.50%),
8.76
%
,
03/16/27
(b)
...........
344
345,310
Sedgwick
Claims
Management
Services,
Inc.,
Term
Loan
,
02/24/28
(b)
(o)
...............
242
242,291
StubHub
Holdco
Sub
LLC,
Term
Loan
B
,
(1-mo.
CME
Term
SOFR
at
0.00%
Floor
+
4.75%),
10.09
%
,
03/15/30
(b)
1,620
1,617,631
Triton
Water
Holdings,
Inc.,
1st
Lien
Term
Loan
,
(3-mo.
CME
Term
SOFR
at
0.50%
Floor
+
3.25%),
8.85
%
,
03/31/28
(b)
...........
170
170,158
Truist
Insurance
Holdings
LLC,
1st
Lien
Term
Loan
,
(3-mo.
CME
Term
SOFR
at
0.00%
Floor
+
3.25%),
8.59
%
,
05/06/31
(b)
...........
417
417,717
Security
Par
(000)
Par
(000)
Value
United
States
(continued)
Vaco
Holdings
LLC,
Term
Loan
,
(3-mo.
CME
Term
SOFR
at
0.75%
Floor
+
5.00%),
10.49
%
,
01/21/29
(b)
.....
USD
286
$
282,675
VeriFone
Systems,
Inc.,
First
Lien
Term
Loan
,
08/20/25
(b)
(o)
...........
2,498
2,150,067
Veritas
US,
Inc.,
Term
Loan
B
,
09/01/25
(b)
(o)
...............
250
218,827
VS
Buyer
LLC,
Term
Loan
,
(1-mo.
CME
Term
SOFR
at
0.00%
Floor
+
3.25%),
8.58
%
,
04/12/31
(b)
.....
908
910,822
Waystar
Technologies,
Inc.,
1st
Lien
Term
Loan
,
(1-mo.
CME
Term
SOFR
at
0.00%
Floor
+
2.75%),
8.09
%
,
10/22/29
(b)
...........
3,841
3,870,122
Woof
Holdings,
Inc.,
1st
Lien
Term
Loan
,
(3-mo.
CME
Term
SOFR
at
0.75%
Floor
+
3.75%),
9.35
%
,
12/21/27
(b)
...........
147
111,766
Xerox
Corp.,
1st
Lien
Term
Loan
,
(1-mo.
CME
Term
SOFR
at
0.50%
Floor
+
4.00%),
9.34
%
,
11/17/29
(b)
5,216
5,190,169
Zayo
Group
Holdings,
Inc.,
Term
Loan
,
(1-mo.
CME
Term
SOFR
at
0.00%
Floor
+
3.00%),
8.46
%
,
03/09/27
(b)
92
81,977
88,673,819
Total
Floating
Rate
Loan
Interests
—
16.0%
(Cost:
$
143,091,014
)
.............................
139,637,517
Foreign
Agency
Obligations
France
—
0.4%
Electricite
de
France
SA
(b)(c)(m)
(13-Year
GBP
Swap
Semi
+
4.23%),
6.00%
.................
GBP
1,000
1,268,947
(BPISDS15
+
3.32%),
5.88%
...
400
494,274
(5-Year
EUR
Swap
Annual
+
3.97%),
3.38%
...........
EUR
1,600
1,547,618
3,310,839
Ireland
—
0.4%
AIB
Group
plc
,
(5-Year
EUR
Swap
Annual
+
5.70%),
5.25%
(b)
(c)
(m)
...
3,030
3,274,954
Italy
—
0.2%
Banca
Monte
dei
Paschi
di
Siena
SpA
,
(3-mo.
EURIBOR
+
3.21%),
6.75%
,
03/02/26
(b)
(c)
...............
1,725
1,889,900
Total
Foreign
Agency
Obligations
—
1.0%
(Cost:
$
8,155,317
)
..............................
8,475,693
Shares
Shares
Investment
Companies
Invesco
Senior
Loan
ETF
........
300,000
6,300,000
SPDR
S&P
Oil
&
Gas
Exploration
&
Production
ETF
.............
512
74,952
Total
Investment
Companies
—
0.7%
(Cost:
$
6,406,647
)
..............................
6,374,952
Schedule
of
Investments
(continued)
July
31,
2024
BlackRock
Global
Long/Short
Credit
Fund
(Percentages
shown
are
based
on
Net
Assets)
Security
Par
(000)
Pa
r
(
000)
Value
Non-Agency
Mortgage-Backed
Securities
Commercial
Mortgage-Backed
Securities
—
0
.5
%
United
States
—
0.5%
CSMC
Trust,
Series
2022-LION,
Class
A,
(1-mo.
CME
Term
SOFR
at
3.59%
Floor
+
3.44%),
8.77%,
02/15/25
(a)
(b)
(h)
..............
USD
4,000
$
3,896,978
Total
Non-Agency
Mortgage-Backed
Securities
—
0.5%
(Cost:
$
3,988,304
)
..............................
3,896,978
Preferred
Securities
Capital
Trusts
—
0
.3
%
Spain
—
0.3%
Banco
Bilbao
Vizcaya
Argentaria
SA
,
(5-Year
EUR
Swap
Annual
+
6.46%),
6.00
%
(b)
(c)
(m)
................
EUR
2,000
2,172,617
United
States
—
0.0%
Citigroup,
Inc.
,
Series
Y
,
(5-Year
US
Treasury
Yield
Curve
Rate
T
Note
Constant
Maturity
+
3.00%),
4.15
%
(b)
(m)
.................
USD
35
32,454
Total
Capital
Trusts
—
0.3%
(Cost:
$
2,061,023
)
..............................
2,205,071
Shares
Shares
Preferred
Stocks
—
0
.5
%
United
States
—
0.5%
(h)
Cap
Hill
Brands
(Preference)
,
Class
E
(e)
506,652
106,397
Coreweave,
Inc.
,
10.00
%
(e)
.......
430,000
438,600
Dream
Finders
Homes,
Inc.
(Preference)
,
9.00
%
(m)
........
2,261
2,184,692
HNG
Hospitality
offshore
LP
,
(Acquired
02/16/24
,
cost
$
723,000
)
(e)
(j)
.....
723,000
730,230
Lessen
Holdings,
Inc.
,
Series
B
(e)
...
16,373
76,462
Versa
Networks,
Inc.
,
Series
E
,
(Acquired
10/14/22
,
cost
$
567,638
)
,
12.00
%
,
(e)
(j)
...............
194,516
805,296
4,341,677
Total
Preferred
Stocks
—
0.5%
(Cost:
$
5,095,410
)
..............................
4,341,677
Total
Preferred
Securities
—
0.8%
(Cost:
$
7,156,433
)
..............................
6,546,748
Warrants
Brazil
—
0.0%
Lavoro
Ltd.
(
Issued/Exercisable
12/27/22
,
1
Share
for
1
Warrant,
Expires
12/27/27
,
Strike
Price
USD
11.50
)
(e)
..................
5,012
1,506
Germany
—
0.0%
Tonies
SE
(
Issued/Exercisable
04/30/21
,
1
Share
for
1
Warrant,
Expires
04/30/26
,
Strike
Price
EUR
11.50
)
(e)
..................
109,736
17,814
Security
Shares
Shares
Value
Luxembourg
—
0.0%
HomeToGo
SE
(
Issued/Exercisable
02/17/21
,
1
Share
for
1
Warrant,
Expires
12/31/25
,
Strike
Price
EUR
11.50
)
(e)
..................
71,516
$
77
United
States
—
0.0%
(e)
Aurora
Innovation,
Inc.
(
Issued/
Exercisable
05/04/21
,
1
Share
for
1
Warrant,
Expires
11/03/26
,
Strike
Price
USD
11.50
)
............
1,667
509
Crown
PropTech
Acquisitions
(
Issued/
Exercisable
01/25/21
,
1
Share
for
1
Warrant,
Expires
12/31/27
,
Strike
Price
USD
11.50
)
(h)
..........
9,692
—
Crown
PropTech
Acquisitions
(
Issued/
Exercisable
02/05/21
,
1
Share
for
1
Warrant,
Expires
02/01/26
,
Strike
Price
USD
11.50
)
(h)
..........
16,190
180
EVgo,
Inc.
(
Issued/Exercisable
11/10/20
,
1
Share
for
1
Warrant,
Expires
07/01/26
,
Strike
Price
USD
11.50
)
...................
7,796
2,339
HawkEye
360,
Inc.
(
Issued/Exercisable
07/07/23
,
1
Share
for
1
Warrant,
Expires
07/07/33
,
Strike
Price
USD
0.01
)
(h)
...................
4,328
23,588
HawkEye
360,
Inc.
(
Issued/Exercisable
07/07/23
,
1
Share
for
1
Warrant,
Expires
07/07/33
,
Strike
Price
USD
11.17
)
(h)
..................
1,695
4,932
HawkEye
360,
Inc.
(
Issued/Exercisable
07/07/23
,
1
Share
for
1
Warrant,
Expires
07/07/33
,
Strike
Price
USD
0.01
)
(h)
...................
10,681
58,211
Latch,
Inc.
(
Issued/Exercisable
12/29/20
,
1
Share
for
1
Warrant,
Expires
06/04/26
,
Strike
Price
USD
11.50
)
...................
6,894
1
Lightning
eMotors,
Inc.
(
Issued/
Exercisable
05/06/21
,
1
Share
for
1
Warrant,
Expires
12/15/25
,
Strike
Price
USD
11.50
)
............
17,391
12
New
York
Community
Bancorp,
Inc.
,
(Acquired
03/07/24
,
cost
$
0
)
(
Issued/
Exercisable
03/11/24
,
1
Share
for
1
Warrant,
Expires
03/11/31
,
Strike
Price
USD
2.50
)
(j)
............
43
90,189
Offerpad
Solutions,
Inc.
(
Issued/
Exercisable
10/13/20
,
1
Share
for
1
Warrant,
Expires
09/01/26
,
Strike
Price
USD
11.50
)
............
13,726
63
Palladyne
AI
Corp.
(
Issued/Exercisable
01/15/21
,
1
Share
for
1
Warrant,
Expires
06/15/27
,
Strike
Price
USD
69.00
)
...................
5,599
167
Palladyne
AI
Corp.
(
Issued/Exercisable
12/21/20
,
1
Share
for
1
Warrant,
Expires
09/24/26
,
Strike
Price
USD
11.50
)
...................
20,304
605
Service
King
Midas
International
(
Issued/Exercisable
07/14/22
,
1
Share
for
1
Warrant,
Expires
04/26/27
,
Strike
Price
USD
10.00
)
(h)
580
—
Sonder
Holdings,
Inc.
(
Issued/
Exercisable
06/10/24
,
1
Share
for
1
Warrant,
Expires
12/10/26
,
Strike
Price
USD
36.00
)
(h)
..........
3,909
12,900
2024
BlackRock
Annual
Financial
Statements
Schedule
of
Investments
(continued)
July
31,
2024
BlackRock
Global
Long/Short
Credit
Fund
(Percentages
shown
are
based
on
Net
Assets)
Security
Shares
Shares
Value
United
States
(continued)
Versa
Networks,
Inc.
,
Series
E
,
(Acquired
10/14/22
,
cost
$
0
)
(
Issued/
Exercisable
10/14/22
,
1
Share
for
1
Warrant,
Expires
10/07/32
,
Strike
Price
USD
0.01
)
(h)
(j)
..........
23,975
$
83,193
Volato
Group,
Inc.
,
(Acquired
12/03/23
,
cost
$
11,228
)
(
Issued/Exercisable
12/04/23
,
1
Share
for
1
Warrant,
Expires
12/03/28
,
Strike
Price
USD
11.50
)
(j)
..................
11,228
146
277,035
Total
Warrants
—
0
.0
%
(Cost:
$
140,376
)
................................
296,432
Total
Long-Term
Investments
—
89
.9
%
(Cost:
$
846,038,043
)
.............................
783,920,358
Par
(000)
Pa
r
(
000)
Short-Term
Securities
Borrowed
Bond
Agreements
—
3.5%
(p)
Barclays
Bank
plc
,
3.25
%
,
08/01/24
(Purchased
on
07/18/24
to
be
repurchased
at
USD
344,122
,
collateralized
by
CommScope
LLC
,
8.25
%,
due
at
03/01/27
,
par
and
fair
value
of
USD
650,000
and
$
449,843
,
respectively)
........
USD
344
343,688
Barclays
Bank
plc
,
5.15
%
,
08/01/24
(Purchased
on
07/25/24
to
be
repurchased
at
USD
1,180,869
,
collateralized
by
CommScope
LLC
,
6.00
%,
due
at
03/01/26
,
par
and
fair
value
of
USD
1,250,000
and
$
1,173,348
,
respectively)
......
1,180
1,179,688
Barclays
Bank
plc
,
(
0.40
)
%
,
Open
(Purchased
on
06/04/24
to
be
repurchased
at
USD
756,809
,
collateralized
by
Webuild
SpA
,
7.00
%,
due
at
09/27/28
,
par
and
fair
value
of
EUR
620,000
and
$
721,568
,
respectively)
(q)
......
EUR
700
757,251
Barclays
Bank
plc
,
0.60
%
,
Open
(Purchased
on
07/17/24
to
be
repurchased
at
USD
1,952,904
,
collateralized
by
INEOS
Quattro
Finance
1
plc
,
3.75
%,
due
at
07/15/26
,
par
and
fair
value
of
EUR
1,850,000
and
$
1,955,866
,
respectively)
(q)
..............
1,804
1,952,449
Barclays
Bank
plc
,
1.90
%
,
Open
(Purchased
on
07/17/24
to
be
repurchased
at
USD
853,259
,
collateralized
by
Intrum
AB
,
4.88
%,
due
at
08/15/25
,
par
and
fair
value
of
EUR
1,010,000
and
$
860,248
,
respectively)
(q)
..............
788
852,629
Security
Par
(000)
Par
(000)
Value
Barclays
Bank
plc
,
2.25
%
,
Open
(Purchased
on
07/17/24
to
be
repurchased
at
USD
1,396,702
,
collateralized
by
Motion
Bondco
DAC
,
4.50
%,
due
at
11/15/27
,
par
and
fair
value
of
EUR
1,350,000
and
$
1,388,716
,
respectively)
(q)
.....
EUR
1,289
$
1,395,480
Barclays
Bank
plc
,
3.30
%
,
Open
(Purchased
on
07/17/24
to
be
repurchased
at
USD
1,635,140
,
collateralized
by
Akelius
Residential
Property
Financing
BV
,
0.75
%,
due
at
02/22/30
,
par
and
fair
value
of
EUR
1,850,000
and
$
1,643,954
,
respectively)
(q)
..............
1,509
1,633,044
Barclays
Bank
plc
,
5.00
%
,
Open
(Purchased
on
05/17/24
to
be
repurchased
at
USD
1,978,920
,
collateralized
by
AthenaHealth
Group,
Inc.
,
6.50
%,
due
at
02/15/30
,
par
and
fair
value
of
USD
2,100,000
and
$
1,979,952
,
respectively)
(q)
..
USD
1,958
1,958,250
Barclays
Bank
plc
,
5.15
%
,
Open
(Purchased
on
02/08/24
to
be
repurchased
at
USD
130,505
,
collateralized
by
Park
River
Holdings,
Inc.
,
5.63
%,
due
at
02/01/29
,
par
and
fair
value
of
USD
156,000
and
$
126,232
,
respectively)
(q)
..............
127
127,335
Barclays
Capital,
Inc.
,
3.75
%
,
08/01/24
(Purchased
on
06/13/24
to
be
repurchased
at
USD
235,771
,
collateralized
by
Great
Lakes
Dredge
&
Dock
Corp.
,
5.25
%,
due
at
06/01/29
,
par
and
fair
value
of
USD
261,000
and
$
235,103
,
respectively)
235
234,574
BNP
Paribas
SA
,
0.55
%
,
Open
(Purchased
on
07/17/24
to
be
repurchased
at
USD
1,061,476
,
collateralized
by
Webuild
SpA
,
3.63
%,
due
at
01/28/27
,
par
and
fair
value
of
EUR
990,000
and
$
1,051,477
,
respectively)
(q)
.....
EUR
981
1,061,249
BNP
Paribas
SA
,
3.00
%
,
Open
(Purchased
on
07/17/24
to
be
repurchased
at
USD
1,363,148
,
collateralized
by
Next
Group
plc
,
3.63
%,
due
at
05/18/28
,
par
and
fair
value
of
GBP
1,100,000
and
$
1,361,246
,
respectively)
(q)
.....
GBP
1,059
1,361,585
BNP
Paribas
SA
,
3.25
%
,
Open
(Purchased
on
07/17/24
to
be
repurchased
at
USD
1,218,346
,
collateralized
by
Banco
de
Sabadell
SA
,
5.13
%,
due
at
06/27/34
,
par
and
fair
value
of
EUR
1,100,000
and
$
1,223,402
,
respectively)
(q)
.....
EUR
1,124
1,216,808
BNP
Paribas
SA
,
5.16
%
,
Open
(Purchased
on
07/17/24
to
be
repurchased
at
USD
310,781
,
collateralized
by
PHH
Mortgage
Corp.
,
7.88
%,
due
at
03/15/26
,
par
and
fair
value
of
USD
309,000
and
$
303,236
,
respectively)
(q)
......
USD
310
310,159
Schedule
of
Investments
(continued)
July
31,
2024
BlackRock
Global
Long/Short
Credit
Fund
(Percentages
shown
are
based
on
Net
Assets)
Security
Par
(000)
Par
(000)
Value
BNP
Paribas
SA
,
5.16
%
,
Open
(Purchased
on
07/17/24
to
be
repurchased
at
USD
170,186
,
collateralized
by
CrownRock
LP
,
5.00
%,
due
at
05/01/29
,
par
and
fair
value
of
USD
169,000
and
$
169,702
,
respectively)
(q)
......
USD
170
$
169,845
BofA
Securities,
Inc.
,
3.50
%
,
08/15/24
(Purchased
on
07/17/24
to
be
repurchased
at
USD
2,643,099
,
collateralized
by
GN
Bondco
LLC
,
9.50
%,
due
at
10/15/31
,
par
and
fair
value
of
USD
2,700,000
and
$
2,541,668
,
respectively)
......
2,639
2,639,250
Goldman
Sachs
&
Co.
LLC
,
5.10
%
,
Open
(Purchased
on
06/12/24
to
be
repurchased
at
USD
329,674
,
collateralized
by
PBF
Holding
Co.
LLC
,
6.00
%,
due
at
02/15/28
,
par
and
fair
value
of
USD
329,000
and
$
322,724
,
respectively)
(q)
..............
327
327,355
Goldman
Sachs
International
,
3.35
%
,
Open
(Purchased
on
07/17/24
to
be
repurchased
at
USD
1,181,307
,
collateralized
by
Verisure
Midholding
AB
,
5.25
%,
due
at
02/15/29
,
par
and
fair
value
of
EUR
1,080,000
and
$
1,155,739
,
respectively)
(q)
..............
EUR
1,090
1,179,770
J.P.
Morgan
Securities
plc
,
(
1.75
)
%
,
Open
(Purchased
on
06/04/24
to
be
repurchased
at
USD
365,415
,
collateralized
by
Webuild
SpA
,
7.00
%,
due
at
09/27/28
,
par
and
fair
value
of
EUR
300,000
and
$
349,146
,
respectively)
(q)
......
339
366,412
J.P.
Morgan
Securities
plc
,
1.50
%
,
Open
(Purchased
on
07/12/24
to
be
repurchased
at
USD
836,662
,
collateralized
by
Intrum
AB
,
4.88
%,
due
at
08/15/25
,
par
and
fair
value
of
EUR
1,010,000
and
$
860,248
,
respectively)
(q)
......
773
836,069
J.P.
Morgan
Securities
plc
,
3.30
%
,
Open
(Purchased
on
07/17/24
to
be
repurchased
at
USD
1,613,516
,
collateralized
by
Vonovia
SE
,
0.25
%,
due
at
09/01/28
,
par
and
fair
value
of
EUR
1,700,000
and
$
1,616,069
,
respectively)
(q)
.....
1,489
1,611,448
J.P.
Morgan
Securities
plc
,
3.35
%
,
Open
(Purchased
on
07/17/24
to
be
repurchased
at
USD
759,316
,
collateralized
by
Vonovia
SE
,
0.25
%,
due
at
09/01/28
,
par
and
fair
value
of
EUR
800,000
and
$
760,503
,
respectively)
(q)
......
701
758,328
J.P.
Morgan
Securities
plc
,
3.37
%
,
Open
(Purchased
on
07/17/24
to
be
repurchased
at
USD
2,435,497
,
collateralized
by
Grifols
SA
,
2.25
%,
due
at
11/15/27
,
par
and
fair
value
of
EUR
2,400,000
and
$
2,400,803
,
respectively)
(q)
.....
2,247
2,432,309
Security
Par
(000)
Par
(000)
Value
J.P.
Morgan
Securities
plc
,
3.40
%
,
Open
(Purchased
on
07/17/24
to
be
repurchased
at
USD
1,768,106
,
collateralized
by
Erste
Group
Bank
AG
,
0.88
%,
due
at
11/15/32
,
par
and
fair
value
of
EUR
1,800,000
and
$
1,764,953
,
respectively)
(q)
..............
EUR
1,632
$
1,765,771
J.P.
Morgan
Securities
plc
,
3.45
%
,
Open
(Purchased
on
07/17/24
to
be
repurchased
at
USD
1,768,140
,
collateralized
by
Erste
Group
Bank
AG
,
0.88
%,
due
at
11/15/32
,
par
and
fair
value
of
EUR
1,800,000
and
$
1,764,953
,
respectively)
(q)
..............
1,632
1,765,771
RBC
Capital
Markets
LLC
,
0.50
%
,
Open
(Purchased
on
06/28/24
to
be
repurchased
at
USD
525,183
,
collateralized
by
Walgreens
Boots
Alliance,
Inc.
,
4.80
%,
due
at
11/18/44
,
par
and
fair
value
of
USD
650,000
and
$
487,347
,
respectively)
(q)
..............
USD
524
524,062
RBC
Capital
Markets
LLC
,
4.45
%
,
Open
(Purchased
on
07/24/24
to
be
repurchased
at
USD
277,177
,
collateralized
by
Walgreens
Boots
Alliance,
Inc.
,
4.50
%,
due
at
11/18/34
,
par
and
fair
value
of
USD
350,000
and
$
278,312
,
respectively)
(q)
..............
277
276,938
RBC
Capital
Markets
LLC
,
5.15
%
,
Open
(Purchased
on
07/26/24
to
be
repurchased
at
USD
368,816
,
collateralized
by
Community
Health
Systems,
Inc.
,
6.00
%,
due
at
01/15/29
,
par
and
fair
value
of
USD
400,000
and
$
371,381
,
respectively)
(q)
......
369
368,500
RBC
Europe
Ltd.
,
3.40
%
,
Open
(Purchased
on
07/17/24
to
be
repurchased
at
USD
1,181,330
,
collateralized
by
Verisure
Midholding
AB
,
5.25
%,
due
at
02/15/29
,
par
and
fair
value
of
EUR
1,080,000
and
$
1,155,739
,
respectively)
(q)
.....
EUR
1,090
1,179,770
TD
Securities
(USA)
LLC
,
1.20
%
,
Open
(Purchased
on
07/25/24
to
be
repurchased
at
USD
289,255
,
collateralized
by
Walgreens
Boots
Alliance,
Inc.
,
3.20
%,
due
at
04/15/30
,
par
and
fair
value
of
USD
350,000
and
$
288,604
,
respectively)
(q)
..............
USD
289
289,188
Total
Borrowed
Bond
Agreements
—
3.5%
(Cost:
$
31,101,841
)
..............................
30,874,975
2024
BlackRock
Annual
Financial
Statements
Schedule
of
Investments
(continued)
July
31,
2024
BlackRock
Global
Long/Short
Credit
Fund
(Percentages
shown
are
based
on
Net
Assets)
Security
Par
(000)
Pa
r
(
000)
Value
Commercial
Paper
—
0.6%
L3Harris
Technologies,
Inc.
,
6.22%
,
08/29/24
(a)
(r)
...............
USD
5,000
$
4,977,898
Total
Commercial
Paper
—
0.6%
(Cost:
$
4,977,172
)
..............................
4,977,898
Shares
Shares
Money
Market
Funds
—
10.9%
BlackRock
Liquidity
Funds,
T-Fund,
Institutional
Class
,
5.21
%
(s)
(t)
....
94,657,933
94,657,933
Total
Money
Market
Funds
—
10
.9
%
(Cost:
$
94,657,933
)
..............................
94,657,933
Total
Short-Term
Securities
—
15.0%
(Cost:
$
130,736,946
)
.............................
130,510,806
Total
Options
Purchased
—
0
.0
%
(Cost:
$
1,046,045
)
..............................
755,295
Total
Investments
Before
Options
Written
and
Borrowed
Bonds
—
104.9%
(Cost:
$
977,821,034
)
.............................
915,186,459
Total
Options
Written
—
(0.0)
%
(Premiums
Received
—
$
(
267,533
)
)
..................
(
173,376
)
Par
(000)
Pa
r
(
000)
Borrowed
Bonds
Corporate
Bonds
—
(
3
.5
)
%
Austria
—
(0.4)%
Erste
Group
Bank
AG
,
(5-Year
EURIBOR
ICE
Swap
Rate
+
1.10%),
0.88
%
,
11/15/32
(b)
...........
EUR
(
3,600
)
(
3,529,906
)
Germany
—
(0.3)%
Vonovia
SE
,
0.25
%
,
09/01/28
......
(
2,500
)
(
2,376,572
)
Italy
—
(0.2)%
Webuild
SpA:
3.63
%
,
01/28/27
............
(
990
)
(
1,051,477
)
7.00
%
,
09/27/28
............
(
920
)
(
1,070,714
)
(
2,122,191
)
Spain
—
(0.4)%
Banco
de
Sabadell
SA
,
(5-Year
EURIBOR
ICE
Swap
Rate
+
2.40%),
5.13
%
,
06/27/34
(b)
...........
(
1,100
)
(
1,223,402
)
Grifols
SA
,
2.25
%
,
11/15/27
.......
(
2,400
)
(
2,400,803
)
(
3,624,205
)
Sweden
—
(0.7)%
Akelius
Residential
Property
Financing
BV
,
0.75
%
,
02/22/30
.........
(
1,850
)
(
1,643,954
)
Intrum
AB
,
4.88
%
,
08/15/25
.......
(
2,020
)
(
1,720,496
)
Verisure
Midholding
AB
,
5.25
%
,
02/15/29
............
(
2,160
)
(
2,311,478
)
(
5,675,928
)
United
Kingdom
—
(0.5)%
INEOS
Quattro
Finance
1
plc
,
3.75
%
,
07/15/26
............
(
1,850
)
(
1,955,866
)
Motion
Bondco
DAC
,
4.50
%
,
11/15/27
(
1,350
)
(
1,388,716
)
Security
Par
(000)
Par
(000)
Value
United
Kingdom
(continued)
Next
Group
plc
,
3.63
%
,
05/18/28
...
GBP
(
1,100
)
$
(
1,361,246
)
(
4,705,828
)
United
States
—
(1.0)%
AthenaHealth
Group,
Inc.
,
6.50
%
,
02/15/30
(a)
...........
USD
(
2,100
)
(
1,979,952
)
CommScope
LLC
(a)
:
6.00
%
,
03/01/26
............
(
1,250
)
(
1,173,348
)
8.25
%
,
03/01/27
............
(
650
)
(
449,843
)
Community
Health
Systems,
Inc.
,
6.00
%
,
01/15/29
(a)
...........
(
400
)
(
371,381
)
CrownRock
LP
,
5.00
%
,
05/01/29
(a)
..
(
169
)
(
169,702
)
GN
Bondco
LLC
,
9.50
%
,
10/15/31
(a)
.
(
2,700
)
(
2,541,668
)
Great
Lakes
Dredge
&
Dock
Corp.
,
5.25
%
,
06/01/29
(a)
...........
(
261
)
(
235,103
)
Park
River
Holdings,
Inc.
,
5.63
%
,
02/01/29
(a)
...........
(
156
)
(
126,232
)
PBF
Holding
Co.
LLC
,
6.00
%
,
02/15/28
(
329
)
(
322,724
)
PHH
Mortgage
Corp.
,
7.88
%
,
03/15/26
(a)
...........
(
309
)
(
303,236
)
Walgreens
Boots
Alliance,
Inc.:
3.20
%
,
04/15/30
............
(
350
)
(
288,604
)
4.50
%
,
11/18/34
............
(
350
)
(
278,312
)
4.80
%
,
11/18/44
............
(
650
)
(
487,347
)
(
8,727,452
)
Total
Borrowed
Bonds
—
(
3
.5
)
%
(Proceeds:
$
(
29,943,822
)
)
.........................
(
30,762,082
)
Total
Investments
Net
of
Options
Written
and
Borrowed
Bonds
—
101
.4
%
(Cost:
$
947,609,679
)
.............................
884,251,001
Liabilities
in
Excess
of
Other
Assets
—
(
1.4
)
%
............
(
12,221,308
)
Net
Assets
—
100.0%
..............................
$
872,029,693
Schedule
of
Investments
(continued)
July
31,
2024
BlackRock
Global
Long/Short
Credit
Fund
Affiliates
Investments
in
issuers
considered
to
be
affiliate(s)
of
the
Fund
during
the year
ended
July
31,
2024
for
purposes
of
Section
2(a)(3)
of
the
Investment
Company
Act
of
1940,
as
amended,
were
as
follows:
(a)
Security
exempt
from
registration
pursuant
to
Rule
144A
under
the
Securities
Act
of
1933,
as
amended.
These
securities
may
be
resold
in
transactions
exempt
from
registration
to
qualified
institutional
investors.
(b)
Variable
rate
security.
Interest
rate
resets
periodically.
The
rate
shown
is
the
effective
interest
rate
as
of
period
end.
Security
description
also
includes
the
reference
rate
and
spread
if
published
and
available.
(c)
This
security
may
be
resold
to
qualified
foreign
investors
and
foreign
institutional
buyers
under
Regulation
S
of
the
Securities
Act
of
1933.
(d)
Issuer
filed
for
bankruptcy
and/or
is
in
default.
(e)
Non-income
producing
security.
(f)
Step
coupon
security.
Coupon
rate
will
either
increase
(step-up
bond)
or
decrease
(step-down
bond)
at
regular
intervals
until
maturity.
Interest
rate
shown
reflects
the
rate
currently
in
effect.
(g)
A
security
contractually
bound
to
one
or
more
other
securities
to
form
a
single
saleable
unit
which
cannot
be
sold
separately.
(h)
Security
is
valued
using
significant
unobservable
inputs
and
is
classified
as
Level
3
in
the
fair
value
hierarchy.
(i)
All
or
a
portion
of
the
security
has
been
pledged
and/or
segregated
as
collateral
in
connection
with
outstanding
exchange-traded
options
written.
(j)
Restricted
security
as
to
resale,
excluding
144A
securities.
The
Fund
held
restricted
securities
with
a
current
value
of
$3,146,292,
representing
0.36%
of
its
net
assets
as
of
period
end,
and
an
original
cost
of
$2,838,768.
(k)
Zero-coupon
bond.
(l)
Convertible
security.
(m)
Perpetual
security
with
no
stated
maturity
date.
(n)
Payment-in-kind
security
which
may
pay
interest/dividends
in
additional
par/shares
and/or
in
cash.
Rates
shown
are
the
current
rate
and
possible
payment
rates.
(o)
Represents
an
unsettled
loan
commitment
at
period
end.
Certain
details
associated
with
this
purchase
are
not
known
prior
to
the
settlement
date,
including
coupon
rate.
(p)
Certain
agreements
have
no
stated
maturity
and
can
be
terminated
by
either
party
at
any
time.
(q)
The
amount
to
be
repurchased
assumes
the
maturity
will
be
the
day
after
the
period
end.
(r)
Rates
are
discount
rates
or
a
range
of
discount
rates
as
of
period
end.
(s)
Affiliate
of
the
Fund.
(t)
Annualized
7-day
yield
as
of
period
end.
Affiliated
Issuer
Value
at
07/31/23
Purchases
at
Cost
Proceeds
from
Sales
Net
Realized
Gain
(Loss)
Change
in
Unrealized
Appreciation
(Depreciation)
Value
at
07/31/24
Shares
Held
at
07/31/24
Income
Capital
Gain
Distributions
from
Underlying
Funds
BlackRock
Liquidity
Funds,
T-Fund,
Institutional
Class
.
$
56,350,784
$
38,307,149
(a)
$
—
$
—
$
—
$
94,657,933
94,657,933
$
3,463,033
$
—
iShares
0-5
Year
High
Yield
Corporate
Bond
ETF
(b)
...
—
2,018,530
(
2,059,904
)
41,374
—
—
—
—
—
$
41,374
$
—
$
94,657,933
$
3,463,033
$
—
—
—
(a)
Represents
net
amount
purchased
(sold).
(b)
As
of
period
end,
the
entity
is
no
longer
held.
2024
BlackRock
Annual
Financial
Statements
Schedule
of
Investments
(continued)
July
31,
2024
BlackRock
Global
Long/Short
Credit
Fund
Derivative
Financial
Instruments
Outstanding
as
of
Period
End
Futures
Contracts
Description
Number
of
Contracts
Expiration
Date
Notional
Amount
(000)
Value/
Unrealized
Appreciation
(Depreciation)
Long
Contracts
U.S.
Treasury
10-Year
Note
...................................................
36
09/19/24
$
4,039
$
115,059
U.S.
Treasury
10-Year
Ultra
Note
...............................................
2
09/19/24
232
7,309
U.S.
Treasury
2-Year
Note
....................................................
50
09/30/24
10,282
20,988
143,356
Short
Contracts
Euro-Bobl
...............................................................
7
09/06/24
890
(17,921)
EURO
STOXX
50
Index
.....................................................
24
09/20/24
1,273
4,843
Russell
2000
E-Mini
Index
....................................................
61
09/20/24
6,933
(692,326)
S&P
500
E-Mini
Index
.......................................................
1
09/20/24
278
(
2,716)
(708,120)
$
(564,764)
Forward
Foreign
Currency
Exchange
Contracts
Currency
Purchased
Currency
Sold
Counterparty
Settlement
Date
Unrealized
Appreciation
(Depreciation)
EUR
4,740,990
USD
5,104,144
JPMorgan
Chase
Bank
NA
09/18/24
$
38,405
GBP
60,208
EUR
71,000
Deutsche
Bank
AG
09/18/24
420
GBP
1,462,290
USD
1,873,916
Barclays
Bank
plc
09/18/24
6,743
USD
545,601
AUD
816,000
Deutsche
Bank
AG
09/18/24
11,323
USD
3,134,509
EUR
2,885,000
Barclays
Bank
plc
09/18/24
5,151
USD
19,705,905
EUR
18,084,000
Deutsche
Bank
AG
09/18/24
90,199
USD
845,798
EUR
777,028
Goldman
Sachs
International
09/18/24
2,956
USD
519,110
EUR
475,000
JPMorgan
Chase
Bank
NA
09/18/24
3,878
USD
1,278,214
EUR
1,172,119
Morgan
Stanley
&
Co.
International
plc
09/18/24
6,817
USD
8,743
EUR
8,000
Nomura
International
plc
09/18/24
65
165,957
EUR
3,851,000
USD
4,170,439
Deutsche
Bank
AG
08/02/24
(2,694)
USD
4,141,538
EUR
3,858,702
Barclays
Bank
plc
08/02/24
(34,542)
USD
877,519
EUR
809,713
JPMorgan
Chase
Bank
NA
09/04/24
(218)
USD
305,676
GBP
237,907
JPMorgan
Chase
Bank
NA
09/04/24
(267)
EUR
8,125,852
USD
8,823,196
Barclays
Bank
plc
09/18/24
(9,088)
USD
730,355
EUR
677,000
Barclays
Bank
plc
09/18/24
(3,986)
USD
288,642,936
EUR
268,108,256
BNP
Paribas
SA
09/18/24
(2,173,964)
USD
2,908,082
EUR
2,699,000
Deutsche
Bank
AG
09/18/24
(19,523)
USD
1,878,121
EUR
1,734,933
JPMorgan
Chase
Bank
NA
09/18/24
(3,760)
USD
1,059,820
EUR
984,744
Toronto
Dominion
Bank
09/18/24
(8,332)
USD
448,076
GBP
353,125
Barclays
Bank
plc
09/18/24
(6,080)
USD
5,648,386
GBP
4,453,000
Citibank
NA
09/18/24
(78,640)
USD
365,785
GBP
286,000
Deutsche
Bank
AG
09/18/24
(2,041)
USD
19,180,466
GBP
15,125,000
Goldman
Sachs
International
09/18/24
(271,874)
USD
15,309,679
GBP
12,051,000
JPMorgan
Chase
Bank
NA
09/18/24
(189,174)
USD
127,089
JPY
19,821,000
Deutsche
Bank
AG
09/18/24
(6,174)
(2,810,357)
$
(2,644,400)
Schedule
of
Investments
(continued)
July
31,
2024
BlackRock
Global
Long/Short
Credit
Fund
Exchange-Traded
Options
Purchased
Description
Number
of
Contracts
Expiration
Date
Exercise
Price
Notional
Amount
(000)
Value
Call
iShares
20+
Year
Treasury
Bond
ETF
..............
1,000
08/02/24
USD
96.50
USD
9,481
$
10,500
iShares
20+
Year
Treasury
Bond
ETF
..............
1,500
08/02/24
USD
96.00
USD
14,222
24,750
CommScope
Holding
Co.,
Inc.
...................
500
08/16/24
USD
2.00
USD
130
30,000
iShares
20+
Year
Treasury
Bond
ETF
..............
500
08/16/24
USD
95.50
USD
4,741
43,750
iShares
20+
Year
Treasury
Bond
ETF
..............
500
08/16/24
USD
102.00
USD
4,741
1,750
Paramount
Global
...........................
500
08/16/24
USD
13.00
USD
571
2,000
Pitney
Bowes,
Inc.
...........................
750
08/16/24
USD
8.00
USD
495
16,875
Western
Digital
Corp.
.........................
300
08/16/24
USD
77.50
USD
2,012
24,150
Western
Digital
Corp.
.........................
300
08/16/24
USD
81.00
USD
2,012
13,200
Western
Digital
Corp.
.........................
350
08/16/24
USD
90.00
USD
2,347
5,075
CBOE
Volatility
Index
.........................
1,000
08/21/24
USD
20.00
USD
1,636
63,000
U.S.
Treasury
5-Year
Note
.....................
350
08/23/24
USD
108.50
USD
35,000
82,031
Western
Digital
Corp.
.........................
300
09/20/24
USD
90.00
USD
2,012
10,800
Sabre
Corp.
...............................
750
10/18/24
USD
4.50
USD
257
12,375
CommScope
Holding
Co.,
Inc.
...................
350
11/15/24
USD
3.00
USD
91
20,126
Paramount
Global
...........................
500
12/20/24
USD
15.00
USD
571
8,000
Paramount
Global
...........................
500
01/17/25
USD
15.00
USD
571
9,000
Sabre
Corp.
...............................
1,000
01/17/25
USD
5.00
USD
343
27,501
404,883
Put
iShares
iBoxx
$
High
Yield
Corporate
Bond
ETF
.......
2,250
08/16/24
USD
74.00
USD
17,672
25,875
iShares
Russell
2000
ETF
......................
250
08/16/24
USD
210.00
USD
5,597
19,000
S&P
500
Index
.............................
20
08/16/24
USD
5,300.00
USD
11,045
23,900
SPDR
S&P
500
ETF
Trust
......................
200
08/16/24
USD
525.00
USD
11,016
20,000
Spirit
Airlines,
Inc.
...........................
500
08/16/24
USD
2.00
USD
151
3,250
Spirit
Airlines,
Inc.
...........................
500
08/16/24
USD
2.50
USD
151
5,750
Xerox
Holdings
Corp.
.........................
400
08/16/24
USD
10.00
USD
431
6,000
American
Airlines
Group,
Inc.
....................
750
09/20/24
USD
9.00
USD
798
7,875
EURO
STOXX
50
Index
.......................
81
09/20/24
EUR
4,750.00
EUR
3,947
45,365
iShares
Russell
2000
ETF
......................
200
09/20/24
USD
200.00
USD
4,477
20,400
American
Airlines
Group,
Inc.
....................
350
11/15/24
USD
8.00
USD
372
4,725
182,140
$
587,023
OTC
Credit
Default
Swaptions
Purchased
Paid
by
the
Fund
Received
by
the
Fund
Description
Rate/Reference
Rate/Reference
Frequency
Counterparty
Expiration
Date
Exercise
Price
Notional
Amount
(000)
(a)
Value
Put
Bought
Protection
on
5-Year
Credit
Default
Swap
......
1.00
%
iTraxx
Europe
Main
Index
Series
41.V1
Quarterly
Morgan
Stanley
&
Co.
International
plc
09/18/24
EUR
55.00
EUR
19,230
$
37,521
Bought
Protection
on
5-Year
Credit
Default
Swap
......
1.00
iTraxx
Europe
Main
Index
Series
41.V1
Quarterly
Morgan
Stanley
&
Co.
International
plc
09/18/24
EUR
55.00
EUR
19,230
37,521
Bought
Protection
on
5-Year
Credit
Default
Swap
......
1.00
iTraxx
Europe
Main
Index
Series
41.V1
Quarterly
Morgan
Stanley
&
Co.
International
plc
09/18/24
EUR
70.00
EUR
19,230
9,441
Bought
Protection
on
5-Year
Credit
Default
Swap
......
5.00
Markit
CDX
North
American
High
Yield
Index
Series
42.V1
Quarterly
Bank
of
America
NA
10/16/24
USD
101.50
USD
10,000
17,367
Bought
Protection
on
5-Year
Credit
Default
Swap
......
5.00
Markit
CDX
North
American
High
Yield
Index
Series
42.V1
Quarterly
Bank
of
America
NA
10/16/24
USD
101.50
USD
5,000
8,684
Bought
Protection
on
5-Year
Credit
Default
Swap
......
5.00
Markit
CDX
North
American
High
Yield
Index
Series
42.V1
Quarterly
Barclays
Bank
plc
09/18/24
USD
102.00
USD
10,000
10,237
Bought
Protection
on
5-Year
Credit
Default
Swap
......
5.00
Markit
CDX
North
American
High
Yield
Index
Series
42.V1
Quarterly
Barclays
Bank
plc
09/18/24
USD
102.00
USD
5,000
5,119
2024
BlackRock
Annual
Financial
Statements
Schedule
of
Investments
(continued)
July
31,
2024
BlackRock
Global
Long/Short
Credit
Fund
OTC
Credit
Default
Swaptions
Purchased
(continued)
Paid
by
the
Fund
Received
by
the
Fund
Description
Rate/Reference
Rate/Reference
Frequency
Counterparty
Expiration
Date
Exercise
Price
Notional
Amount
(000)
(a)
Value
Bought
Protection
on
5-Year
Credit
Default
Swap
......
5.00
%
Markit
CDX
North
American
High
Yield
Index
Series
42.V1
Quarterly
Goldman
Sachs
International
08/21/24
USD
106.00
USD
15,000
$
30,207
Bought
Protection
on
5-Year
Credit
Default
Swap
......
5.00
iTraxx
Europe
Crossover
Index
Series
41.V1
Quarterly
Morgan
Stanley
&
Co.
International
plc
08/21/24
EUR
337.50
EUR
10,000
10,117
Bought
Protection
on
5-Year
Credit
Default
Swap
......
5.00
iTraxx
Europe
Crossover
Index
Series
41.V1
Quarterly
BNP
Paribas
SA
08/21/24
EUR
475.00
EUR
7,500
1,235
Bought
Protection
on
5-Year
Credit
Default
Swap
......
5.00
iTraxx
Europe
Crossover
Index
Series
41.V1
Quarterly
BNP
Paribas
SA
08/21/24
EUR
475.00
EUR
5,000
823
$
168,272
(a)
The
maximum
potential
amount
the
Fund
may
pay
should
a
negative
credit
event
take
place
as
defined
under
the
terms
of
the
agreement.
Exchange-Traded
Options
Written
Description
Number
of
Contracts
Expiration
Date
Exercise
Price
Notional
Amount
(000)
Value
Call
iShares
20+
Year
Treasury
Bond
ETF
...............
1,500
08/02/24
USD
99.00
USD
14,222
$
(
1,500)
iShares
20+
Year
Treasury
Bond
ETF
...............
500
08/16/24
USD
99.00
USD
4,741
(6,750)
Western
Digital
Corp.
..........................
300
08/16/24
USD
88.00
USD
2,012
(21,000)
Western
Digital
Corp.
..........................
300
08/16/24
USD
85.00
USD
2,012
(7,350)
Western
Digital
Corp.
..........................
350
08/16/24
USD
100.00
USD
2,347
(3,325)
CBOE
Volatility
Index
..........................
1,000
08/21/24
USD
35.00
USD
1,636
(20,000)
Western
Digital
Corp.
..........................
300
09/20/24
USD
105.00
USD
2,012
(9,150)
(69,075)
Put
iShares
Russell
2000
ETF
.......................
250
08/16/24
USD
195.00
USD
5,597
(3,250)
S&P
500
Index
..............................
20
08/16/24
USD
5,100.00
USD
11,045
(7,500)
SPDR
S&P
500
ETF
Trust
.......................
200
08/16/24
USD
475.00
USD
11,016
(3,300)
EURO
STOXX
50
Index
........................
81
09/20/24
EUR
4,400.00
EUR
3,947
(10,782)
iShares
Russell
2000
ETF
.......................
200
09/20/24
USD
175.00
USD
4,477
(4,600)
(29,432)
$
(98,507)
OTC
Credit
Default
Swaptions
Written
Paid
by
the
Fund
Received
by
the
Fund
Description
Rate/Reference
Rate/Reference
Frequency
Counterparty
Expiration
Date
Credit
Rating
(a)
Exercise
Price
Notional
Amount
(000)
(b)
Value
Put
Sold
Protection
on
5-Year
Credit
Default
Swap
.........
iTraxx
Europe
Main
Index
Series
41.V1
1.00
%
Quarterly
Morgan
Stanley
&
Co.
International
plc
09/18/24
A-
EUR
60.00
EUR
19,230
$
(21,923)
Sold
Protection
on
5-Year
Credit
Default
Swap
.........
iTraxx
Europe
Main
Index
Series
41.V1
1.00
Quarterly
Morgan
Stanley
&
Co.
International
plc
09/18/24
A-
EUR
60.00
EUR
19,230
(21,923)
Sold
Protection
on
5-Year
Credit
Default
Swap
.........
iTraxx
Europe
Main
Index
Series
41.V1
1.00
Quarterly
Morgan
Stanley
&
Co.
International
plc
09/18/24
A-
EUR
65.00
EUR
19,230
(13,852)
Schedule
of
Investments
(continued)
July
31,
2024
BlackRock
Global
Long/Short
Credit
Fund
OTC
Credit
Default
Swaptions
Written
(continued)
Paid
by
the
Fund
Received
by
the
Fund
Description
Rate/Reference
Rate/Reference
Frequency
Counterparty
Expiration
Date
Credit
Rating
(a)
Exercise
Price
Notional
Amount
(000)
(b)
Value
Sold
Protection
on
5-Year
Credit
Default
Swap
.........
iTraxx
Europe
Main
Index
Series
41.V1
1.00
%
Quarterly
Morgan
Stanley
&
Co.
International
plc
09/18/24
A-
EUR
65.00
EUR
19,230
$
(13,852)
Sold
Protection
on
5-Year
Credit
Default
Swap
.........
iTraxx
Europe
Crossover
Index
Series
41.V1
5.00
Quarterly
Morgan
Stanley
&
Co.
International
plc
08/21/24
BB-
EUR
400.00
EUR
10,000
(3,319)
$
(74,869)
(a)
Using
the
rating
of
the
issuer
or
the
underlying
securities
of
the
index,
as
applicable,
provided
by
S&P
Global
Ratings.
(b)
The
maximum
potential
amount
the
Fund
may
pay
should
a
negative
credit
event
take
place
as
defined
under
the
terms
of
the
agreement.
Centrally
Cleared
Credit
Default
Swaps
—
Buy
Protection
Reference
Obligation/Index
Financing
Rate
Paid
by
the
Fund
Payment
Frequency
Termination
Date
Notional
Amount
(000)
Value
Upfront
Premium
Paid
(Received)
Unrealized
Appreciation
(Depreciation)
iTraxx
Europe
Crossover
Index
Series
41.V1
.
5.00
%
Quarterly
06/20/29
EUR
318
$
(31,265)
$
(30,308)
$
(957)
iTraxx
Europe
Crossover
Index
Series
41.V1
.
5.00
Quarterly
06/20/29
EUR
15,720
(1,545,559)
(1,197,914)
(347,645)
iTraxx
Europe
Main
Index
Series
41.V1
.....
1.00
Quarterly
06/20/29
EUR
1,009
(23,787)
(22,365)
(1,422)
iTraxx
Europe
Senior
Financials
Index
Series
41.V1
.........................
1.00
Quarterly
06/20/29
EUR
2,667
(53,431)
(47,127)
(6,304)
iTraxx
Europe
Subordinated
Financials
Index
Series
41.V1
.....................
1.00
Quarterly
06/20/29
EUR
9,636
38,152
77,886
(
39,734)
Markit
CDX
North
American
High
Yield
Index
Series
42.V1
.....................
5.00
Quarterly
06/20/29
USD
7,347
(542,496)
(456,881)
(85,615)
$
(2,158,386)
$
(1,676,709)
$
(481,677)
Centrally
Cleared
Interest
Rate
Swap
s
Paid
by
the
Fund
Received
by
the
Fund
Rate
Frequency
Rate
Frequency
Termination
Date
Notional
Amount
(000)
Value
Upfront
Premium
Paid
(Received)
Unrealized
Appreciation
(Depreciation)
0.18%
Quarterly
1-day
EFFR
Quarterly
10/21/25
USD
143
$
7,430
$
—
$
7,430
1-day
SOFR
Quarterly
0.17%
Quarterly
10/21/25
USD
143
(7,514)
—
(7,514)
$
(84)
$
—
$
(84)
OTC
Credit
Default
Swap
s
—
Buy
Protection
Reference
Obligation/Index
Financing
Rate
Paid
by
the
Fund
Payment
Frequency
Counterparty
Termination
Date
Notional
Amount
(000)
Value
Upfront
Premium
Paid
(Received)
Unrealized
Appreciation
(Depreciation)
American
Airlines
Group,
Inc.
..
5.00
%
Quarterly
JPMorgan
Chase
Bank
NA
12/20/24
USD
1,000
$
(15,896)
$
(4,509)
$
(11,387)
American
Airlines
Group,
Inc.
..
5.00
Quarterly
JPMorgan
Chase
Bank
NA
12/20/24
USD
500
(7,948)
(2,254)
(5,694)
Avis
Budget
Car
Rental
LLC
..
5.00
Quarterly
JPMorgan
Chase
Bank
NA
12/20/24
USD
270
(6,008)
1,752
(7,760)
Southwest
Airlines
Co.
......
1.00
Quarterly
Citibank
NA
12/20/24
USD
10,000
(40,501)
(16,020)
(24,481)
Ally
Financial,
Inc.
.........
5.00
Quarterly
Citibank
NA
06/20/25
USD
1,320
(60,535)
(25,193)
(35,342)
Ally
Financial,
Inc.
.........
5.00
Quarterly
Citibank
NA
06/20/25
USD
880
(40,357)
(16,798)
(23,559)
Ardagh
Packaging
Finance
plc
.
5.00
Quarterly
Deutsche
Bank
AG
06/20/25
EUR
964
262,070
267,828
(5,758)
Ardagh
Packaging
Finance
plc
.
5.00
Quarterly
JPMorgan
Chase
Bank
NA
06/20/25
EUR
873
237,331
145,160
92,171
Avis
Budget
Car
Rental
LLC
..
5.00
Quarterly
JPMorgan
Chase
Bank
NA
06/20/25
USD
270
(10,837)
5,945
(16,782)
Macy's
Retail
Holdings
LLC
...
1.00
Quarterly
Goldman
Sachs
International
06/20/25
USD
2,300
(11,523)
98,922
(110,445)
2024
BlackRock
Annual
Financial
Statements
Schedule
of
Investments
(continued)
July
31,
2024
BlackRock
Global
Long/Short
Credit
Fund
OTC
Credit
Default
Swaps
—
Buy
Protection
(continued)
Reference
Obligation/Index
Financing
Rate
Paid
by
the
Fund
Payment
Frequency
Counterparty
Termination
Date
Notional
Amount
(000)
Value
Upfront
Premium
Paid
(Received)
Unrealized
Appreciation
(Depreciation)
Pitney
Bowes,
Inc.
.........
1.00
%
Quarterly
Goldman
Sachs
International
06/20/25
USD
1,000
$
(970)
$
92,686
$
(
93,656)
Simon
Property
Group
LP
....
1.00
Quarterly
Goldman
Sachs
International
06/20/25
USD
1,200
(10,052)
17,439
(27,491)
Simon
Property
Group
LP
....
1.00
Quarterly
Goldman
Sachs
International
06/20/25
USD
1,000
(8,377)
19,092
(27,469)
Boparan
Finance
plc
.......
5.00
Quarterly
Goldman
Sachs
International
12/20/25
EUR
1,709
(3,988)
48,016
(52,004)
Grifols
SA
...............
5.00
Quarterly
JPMorgan
Chase
Bank
NA
12/20/25
EUR
670
(18,319)
(9,188)
(
9,131)
Grifols
SA
...............
5.00
Quarterly
Morgan
Stanley
&
Co.
International
plc
12/20/25
EUR
1,068
(29,201)
(3,708)
(25,493)
Community
Health
Systems,
Inc.
5.00
Quarterly
Goldman
Sachs
International
06/20/26
USD
300
7,285
26,428
(19,143)
Community
Health
Systems,
Inc.
5.00
Quarterly
Goldman
Sachs
International
06/20/26
USD
200
4,857
13,590
(8,733)
General
Electric
Co.
........
1.00
Quarterly
Morgan
Stanley
&
Co.
International
plc
06/20/27
USD
899
(21,482)
10,940
(32,422)
General
Electric
Co.
........
1.00
Quarterly
Morgan
Stanley
&
Co.
International
plc
06/20/27
USD
1,201
(28,701)
13,687
(42,388)
General
Electric
Co.
........
1.00
Quarterly
Morgan
Stanley
&
Co.
International
plc
06/20/27
USD
899
(21,482)
10,940
(32,422)
BorgWarner,
Inc.
..........
1.00
Quarterly
BNP
Paribas
SA
12/20/27
USD
2,000
(35,406)
18,801
(54,207)
INEOS
Group
Holdings
SA
...
5.00
Quarterly
BNP
Paribas
SA
12/20/27
EUR
449
(69,134)
(32,609)
(36,525)
Intesa
Sanpaolo
SpA
.......
1.00
Quarterly
BNP
Paribas
SA
12/20/27
EUR
2,100
(4,442)
113,891
(118,333)
Pitney
Bowes,
Inc.
.........
1.00
Quarterly
Bank
of
America
NA
12/20/27
USD
750
59,730
135,786
(76,056)
Pitney
Bowes,
Inc.
.........
1.00
Quarterly
Barclays
Bank
plc
12/20/27
USD
510
40,617
89,850
(49,233)
Pitney
Bowes,
Inc.
.........
1.00
Quarterly
Citibank
NA
12/20/27
USD
450
35,838
85,882
(50,044)
Pitney
Bowes,
Inc.
.........
1.00
Quarterly
Citibank
NA
12/20/27
USD
300
23,892
55,630
(31,738)
Pitney
Bowes,
Inc.
.........
1.00
Quarterly
Citibank
NA
12/20/27
USD
1,500
119,461
378,032
(258,571)
Pitney
Bowes,
Inc.
.........
1.00
Quarterly
Goldman
Sachs
International
12/20/27
USD
500
39,820
88,138
(48,318)
Pitney
Bowes,
Inc.
.........
1.00
Quarterly
JPMorgan
Chase
Bank
NA
12/20/27
USD
1,000
79,641
238,797
(159,156)
Simon
Property
Group
LP
....
1.00
Quarterly
Goldman
Sachs
International
12/20/27
USD
5,250
(98,523)
55,426
(153,949)
Simon
Property
Group
LP
....
1.00
Quarterly
JPMorgan
Chase
Bank
NA
12/20/27
USD
3,650
(68,497)
38,607
(107,104)
UniCredit
SpA
............
1.00
Quarterly
Goldman
Sachs
International
12/20/27
EUR
2,100
(4,256)
112,348
(116,604)
UniCredit
SpA
............
1.00
Quarterly
JPMorgan
Chase
Bank
NA
12/20/27
EUR
1,939
(3,930)
94,765
(98,695)
Xerox
Corp.
.............
1.00
Quarterly
Citibank
NA
12/20/27
USD
490
32,992
38,748
(5,756)
Xerox
Corp.
.............
1.00
Quarterly
JPMorgan
Chase
Bank
NA
12/20/27
USD
830
55,884
65,868
(9,984)
Deutsche
Bank
AG
.........
1.00
Quarterly
JPMorgan
Chase
Bank
NA
06/20/28
EUR
600
(5,230)
39,046
(44,276)
Deutsche
Bank
AG
.........
1.00
Quarterly
JPMorgan
Chase
Bank
NA
06/20/28
EUR
352
(3,068)
14,862
(17,930)
Deutsche
Bank
AG
.........
1.00
Quarterly
JPMorgan
Chase
Bank
NA
06/20/28
EUR
117
(1,020)
4,940
(5,960)
Deutsche
Bank
AG
.........
1.00
Quarterly
JPMorgan
Chase
Bank
NA
06/20/28
EUR
131
(1,142)
5,837
(6,979)
Paramount
Global
.........
1.00
Quarterly
JPMorgan
Chase
Bank
NA
06/20/28
USD
4,150
63,285
143,123
(79,838)
Pitney
Bowes,
Inc.
.........
1.00
Quarterly
Citibank
NA
06/20/28
USD
750
78,667
210,553
(131,886)
UBS
Group
AG
...........
1.00
Quarterly
BNP
Paribas
SA
06/20/28
EUR
133
(2,887)
4,678
(7,565)
UBS
Group
AG
...........
1.00
Quarterly
JPMorgan
Chase
Bank
NA
06/20/28
EUR
38
(825)
1,641
(2,466)
UBS
Group
AG
...........
1.00
Quarterly
JPMorgan
Chase
Bank
NA
06/20/28
EUR
1,000
(21,705)
27,824
(49,529)
UBS
Group
AG
...........
1.00
Quarterly
JPMorgan
Chase
Bank
NA
06/20/28
EUR
112
(2,431)
4,646
(7,077)
UBS
Group
AG
...........
1.00
Quarterly
JPMorgan
Chase
Bank
NA
06/20/28
EUR
117
(2,539)
5,454
(7,993)
Boeing
Co.
(The)
..........
1.00
Quarterly
Deutsche
Bank
AG
12/20/28
USD
200
1,311
(859)
2,170
Deutsche
Bank
AG
.........
1.00
Quarterly
Bank
of
America
NA
12/20/28
EUR
1,070
21,942
57,183
(35,241)
eG
Global
Finance
plc
......
5.00
Quarterly
Deutsche
Bank
AG
12/20/28
EUR
1,711
40,734
60,891
(20,157)
Gap,
Inc.
(The)
...........
1.00
Quarterly
Morgan
Stanley
&
Co.
International
plc
12/20/28
USD
1,000
27,322
136,582
(109,260)
International
Consolidated
Airlines
Group
SA
.......
5.00
Quarterly
JPMorgan
Chase
Bank
NA
12/20/28
EUR
3,000
(496,449)
(167,856)
(328,593)
Paramount
Global
.........
1.00
Quarterly
JPMorgan
Chase
Bank
NA
12/20/28
USD
125
3,367
7,909
(4,542)
Xerox
Corp.
.............
1.00
Quarterly
JPMorgan
Chase
Bank
NA
12/20/28
USD
170
19,703
18,100
1,603
Xerox
Corp.
.............
1.00
Quarterly
Morgan
Stanley
&
Co.
International
plc
12/20/28
USD
330
38,248
35,135
3,113
Boeing
Co.
(The)
..........
1.00
Quarterly
JPMorgan
Chase
Bank
NA
06/20/29
USD
200
2,136
2,347
(211)
DXC
Technology
Co.
.......
5.00
Quarterly
JPMorgan
Chase
Bank
NA
06/20/29
USD
750
(112,111)
(82,165)
(29,946)
DXC
Technology
Co.
.......
5.00
Quarterly
JPMorgan
Chase
Bank
NA
06/20/29
USD
1,500
(224,222)
(185,929)
(38,293)
eG
Global
Finance
plc
......
5.00
Quarterly
Deutsche
Bank
AG
06/20/29
EUR
970
37,301
43,381
(6,080)
ELO
SACA
..............
1.00
Quarterly
Bank
of
America
NA
06/20/29
EUR
1,975
249,347
141,398
107,949
Grifols
SA
...............
5.00
Quarterly
Barclays
Bank
plc
06/20/29
EUR
1,568
10,784
158,928
(148,144)
Ladbrokes
Group
Finance
plc
.
1.00
Quarterly
Bank
of
America
NA
06/20/29
EUR
426
9,570
11,853
(2,283)
Ladbrokes
Group
Finance
plc
.
1.00
Quarterly
Goldman
Sachs
International
06/20/29
EUR
1,705
38,279
55,082
(16,803)
Monitchem
HoldCo
3
SA
.....
5.00
Quarterly
Deutsche
Bank
AG
06/20/29
EUR
576
(20,262)
(14,451)
(5,811)
Novafives
SAS
...........
5.00
Quarterly
Goldman
Sachs
International
06/20/29
EUR
948
(165,185)
(
86,036)
(79,149)
Novafives
SAS
...........
5.00
Quarterly
JPMorgan
Chase
Bank
NA
06/20/29
EUR
1,026
(178,776)
(72,161)
(106,615)
Picard
Bondco
SA
.........
5.00
Quarterly
Deutsche
Bank
AG
06/20/29
EUR
1,069
(109,863)
(92,569)
(
17,294)
Republic
of
Panama
........
1.00
Quarterly
Bank
of
America
NA
06/20/29
USD
4,000
126,767
147,659
(20,892)
Southwest
Airlines
Co.
......
1.00
Quarterly
Citibank
NA
06/20/29
USD
10,070
4,176
(71,294)
75,470
Southwest
Airlines
Co.
......
1.00
Quarterly
Citibank
NA
06/20/29
USD
4,500
1,866
(11,507)
13,373
Schedule
of
Investments
(continued)
July
31,
2024
BlackRock
Global
Long/Short
Credit
Fund
OTC
Credit
Default
Swaps
—
Buy
Protection
(continued)
Reference
Obligation/Index
Financing
Rate
Paid
by
the
Fund
Payment
Frequency
Counterparty
Termination
Date
Notional
Amount
(000)
Value
Upfront
Premium
Paid
(Received)
Unrealized
Appreciation
(Depreciation)
Stena
AB
...............
5.00
%
Quarterly
Morgan
Stanley
&
Co.
International
plc
06/20/29
EUR
2,617
$
(387,735)
$
(320,279)
$
(67,456)
Telecom
Italia
SpA
.........
1.00
Quarterly
Goldman
Sachs
International
06/20/29
EUR
1,987
85,959
143,791
(57,832)
United
Group
BV
..........
5.00
Quarterly
Deutsche
Bank
AG
06/20/29
EUR
1,930
(219,142)
(208,053)
(11,089)
Verisure
Midholding
AB
......
5.00
Quarterly
Deutsche
Bank
AG
06/20/29
EUR
1,000
(75,518)
(57,958)
(17,560)
Volvo
Car
AB
............
5.00
Quarterly
Barclays
Bank
plc
06/20/29
EUR
2,140
(332,063)
(335,702)
3,639
Volvo
Car
AB
............
5.00
Quarterly
Goldman
Sachs
International
06/20/29
EUR
2,000
(310,339)
(320,489)
10,150
Xerox
Corp.
.............
1.00
Quarterly
Bank
of
America
NA
06/20/29
USD
700
97,206
82,013
15,193
$
–
$
–
$
–
$
(1,335,489)
$
1,810,263
$
(3,145,752)
$
–
$
–
$
–
OTC
Credit
Default
Swap
s
—
Sell
Protection
Reference
Obligation/Index
Financing
Rate
Received
by
the
Fund
Payment
Frequency
Counterparty
Termination
Date
Credit
Rating
(a)
Notional
Amount
(000)
(b)
Value
Upfront
Premium
Paid
(Received)
Unrealized
Appreciation
(Depreciation)
ADLER
Real
Estate
GmbH
5.00
%
Quarterly
JPMorgan
Chase
Bank
NA
12/20/24
NR
EUR
420
$
(3,086)
$
(13,932)
$
10,846
Sprint
Communications
LLC
5.00
Quarterly
Barclays
Bank
plc
06/20/25
NR
USD
667
31,636
22,215
9,421
Sprint
Communications
LLC
5.00
Quarterly
Barclays
Bank
plc
06/20/25
NR
USD
2,200
104,401
72,983
31,418
Sprint
Communications
LLC
5.00
Quarterly
Barclays
Bank
plc
06/20/25
NR
USD
1,300
61,691
41,936
19,755
Sprint
Communications
LLC
5.00
Quarterly
Barclays
Bank
plc
06/20/25
NR
USD
3,000
142,365
80,067
62,298
Sprint
Communications
LLC
5.00
Quarterly
Barclays
Bank
plc
06/20/25
NR
USD
2,000
94,910
58,156
36,754
CCO
Holdings
LLC
....
5.00
Quarterly
BNP
Paribas
SA
12/20/25
BB-
USD
909
55,924
46,919
9,005
CCO
Holdings
LLC
....
5.00
Quarterly
BNP
Paribas
SA
12/20/25
BB-
USD
545
33,555
28,165
5,390
CCO
Holdings
LLC
....
5.00
Quarterly
JPMorgan
Chase
Bank
NA
12/20/25
BB-
USD
545
33,555
28,404
5,151
CCO
Holdings
LLC
....
5.00
Quarterly
JPMorgan
Chase
Bank
NA
12/20/25
BB-
USD
2,000
123,033
98,695
24,338
ADLER
Real
Estate
GmbH
5.00
Quarterly
Goldman
Sachs
International
06/20/26
CCC-
EUR
712
(22,895)
(21,812)
(1,083)
ADLER
Real
Estate
GmbH
5.00
Quarterly
Barclays
Bank
plc
12/20/27
NR
EUR
125
(3,430)
(18,494)
15,064
ADLER
Real
Estate
GmbH
5.00
Quarterly
Barclays
Bank
plc
12/20/27
NR
EUR
182
(5,000)
(26,953)
21,953
ADLER
Real
Estate
GmbH
5.00
Quarterly
Citibank
NA
12/20/27
NR
EUR
248
(6,827)
(37,885)
31,058
ADLER
Real
Estate
GmbH
5.00
Quarterly
Morgan
Stanley
&
Co.
International
plc
12/20/27
NR
EUR
377
(10,359)
(56,995)
46,636
CMA
CGM
SA
........
5.00
Quarterly
Bank
of
America
NA
12/20/27
NR
EUR
800
99,592
(17,214)
116,806
CMA
CGM
SA
........
5.00
Quarterly
BNP
Paribas
SA
12/20/27
NR
EUR
942
117,268
(22,352)
139,620
Amkor
Technology,
Inc.
..
5.00
Quarterly
Citibank
NA
06/20/28
BB
USD
2,000
317,772
237,687
80,085
Amkor
Technology,
Inc.
..
5.00
Quarterly
JPMorgan
Chase
Bank
NA
06/20/28
BB
USD
2,000
317,772
234,077
83,695
Amkor
Technology,
Inc.
..
5.00
Quarterly
JPMorgan
Chase
Bank
NA
06/20/28
BB
USD
2,000
317,772
229,208
88,564
AT&T,
Inc.
...........
1.00
Quarterly
Bank
of
America
NA
12/20/28
BBB
USD
5,000
86,837
48,548
38,289
Boparan
Finance
plc
...
5.00
Quarterly
Goldman
Sachs
International
12/20/28
NR
EUR
2,137
(77,778)
(150,101)
72,323
Bristol-Myers
Squibb
Co.
.
1.00
Quarterly
JPMorgan
Chase
Bank
NA
12/20/28
A
USD
5,000
139,298
124,619
14,679
CCO
Holdings
LLC
....
5.00
Quarterly
Bank
of
America
NA
12/20/28
BB-
USD
2,000
229,922
143,065
86,857
CCO
Holdings
LLC
....
5.00
Quarterly
Bank
of
America
NA
12/20/28
BB-
USD
2,000
229,922
150,366
79,556
CCO
Holdings
LLC
....
5.00
Quarterly
Bank
of
America
NA
12/20/28
BB-
USD
3,000
344,884
214,975
129,909
Teva
Pharmaceutical
Finance
Netherlands
III
BV
.............
1.00
Quarterly
Goldman
Sachs
International
12/20/28
BB-
USD
2,000
(8,765)
(
57,292)
48,527
Teva
Pharmaceutical
Finance
Netherlands
III
BV
.............
1.00
Quarterly
Goldman
Sachs
International
12/20/28
BB-
USD
2,000
(11,465)
(50,519)
39,054
ADLER
Real
Estate
GmbH
5.00
Quarterly
JPMorgan
Chase
Bank
NA
06/20/29
CCC-
EUR
712
(16,753)
(16,865)
112
CCO
Holdings
LLC
....
5.00
Quarterly
Bank
of
America
NA
06/20/29
BB-
USD
2,000
233,091
162,595
70,496
2024
BlackRock
Annual
Financial
Statements
Schedule
of
Investments
(continued)
July
31,
2024
BlackRock
Global
Long/Short
Credit
Fund
OTC
Credit
Default
Swaps
—
Sell
Protection
(continued)
Reference
Obligation/Index
Financing
Rate
Received
by
the
Fund
Payment
Frequency
Counterparty
Termination
Date
Credit
Rating
(a)
Notional
Amount
(000)
(b)
Value
Upfront
Premium
Paid
(Received)
Unrealized
Appreciation
(Depreciation)
EQM
Midstream
Partners
LP
..............
5.00
%
Quarterly
JPMorgan
Chase
Bank
NA
06/20/29
BBB-
USD
2,000
$
363,512
$
357,743
$
5,769
Forvia
SE
...........
5.00
Quarterly
Deutsche
Bank
AG
06/20/29
BB
EUR
969
122,728
110,995
11,733
Frontier
Communications
Holdings
LLC
......
5.00
Quarterly
Bank
of
America
NA
06/20/29
CCC+
USD
1,000
74,805
67,058
7,747
Frontier
Communications
Holdings
LLC
......
5.00
Quarterly
Barclays
Bank
plc
06/20/29
CCC+
USD
650
46,633
46,633
—
Oracle
Corp.
.........
1.00
Quarterly
Bank
of
America
NA
06/20/29
BBB
USD
5,000
135,416
120,386
15,030
Royal
Caribbean
Cruises
Ltd.
.............
5.00
Quarterly
Bank
of
America
NA
06/20/29
BB+
USD
2,000
351,062
304,054
47,008
Sunrise
HoldCo
IV
BV
..
5.00
Quarterly
Bank
of
America
NA
06/20/29
B
EUR
572
78,352
55,009
23,343
Sunrise
HoldCo
IV
BV
..
5.00
Quarterly
Deutsche
Bank
AG
06/20/29
B
EUR
364
49,812
34,107
15,705
Uber
Technologies,
Inc.
..
5.00
Quarterly
Barclays
Bank
plc
06/20/29
BB
USD
2,000
395,121
347,479
47,642
Virgin
Media
Finance
plc
.
5.00
Quarterly
Bank
of
America
NA
06/20/29
B-
EUR
2,380
117,193
80,251
36,942
Virgin
Media
Finance
plc
.
5.00
Quarterly
JPMorgan
Chase
Bank
NA
06/20/29
B-
EUR
618
30,447
22,724
7,723
Virgin
Media
Finance
plc
.
5.00
Quarterly
JPMorgan
Chase
Bank
NA
06/20/29
B-
EUR
442
18,364
15,628
2,736
Vistra
Operations
Co.
LLC
5.00
Quarterly
Barclays
Bank
plc
06/20/29
BB
USD
2,000
322,928
297,862
25,066
Vistra
Operations
Co.
LLC
5.00
Quarterly
BNP
Paribas
SA
06/20/29
BB
USD
1,000
161,464
154,749
6,715
Vistra
Operations
Co.
LLC
5.00
Quarterly
Goldman
Sachs
International
06/20/29
BB
USD
1,000
161,464
146,993
14,471
Vistra
Operations
Co.
LLC
5.00
Quarterly
Goldman
Sachs
International
06/20/29
BB
USD
1,000
161,464
153,364
8,100
Vistra
Operations
Co.
LLC
5.00
Quarterly
JPMorgan
Chase
Bank
NA
06/20/29
BB
USD
650
102,868
102,868
—
$
5,642,475
$
3,950,169
$
1,692,306
(a)
Using
the
rating
of
the
issuer
or
the
underlying
securities
of
the
index,
as
applicable,
provided
by
S&P
Global
Ratings.
(b)
The
maximum
potential
amount
the
Fund
may
pay
should
a
negative
credit
event
take
place
as
defined
under
the
terms
of
the
agreement.
OTC
Total
Return
Swaps
Reference
Entity
Payment
Frequency
Counterparty
(a)
Termination
Date
Net
Notional
Accrued
Unrealized
Appreciation
(Depreciation)
Net
Value
of
Reference
Entity
Gross
Notional
Amount
Net
Asset
Percentage
Equity
Securities
Long/Short
...
Monthly
Barclays
Bank
plc
(b)
03/31/25
$
641,653
$
(25,270)
(c)
$
618,902
0.1
%
Monthly
JPMorgan
Chase
Bank
NA
(d)
08/09/24
(2,383,259)
(
115,761)
(e)
(2,506,640)
0.5
Monthly
Merrill
Lynch
International
&
Co.
(f)
02/15/28
(583,900)
(26,118)
(g)
(611,200)
0.1
Monthly
Merrill
Lynch
International
&
Co.
(h)
02/15/28
369,196
23,631
(
i
)
399,683
0.5
$
(143,518)
$
(2,099,255)
Schedule
of
Investments
(continued)
July
31,
2024
BlackRock
Global
Long/Short
Credit
Fund
(a)
The
Fund
receives
the
total
return
on
a
portfolio
of
long
positions
underlying the
total
return
swap.
The
Fund
pays
the
total
return
on
a
portfolio
of
short
positions
underlying
the
total
return
swap.
In
addition,
the
Fund
pays
or
receives
a
variable
rate
of
interest,
based
on
a
specified
benchmark.
The
benchmark
and
spread
are
determined
based
upon
the
country
and/or
currency
of
the
individual
underlying
positions.
The
following
are
the
specified
benchmarks
(plus
or
minus
a
range)
used
in
determining
the
variable
rate
of
interest:
(b)
(d)
(f)
Range:
15-26
basis
points
15-40
basis
points
20-59
basis
points
Benchmarks:
EUR
-
1D
Euro
Short
Term
Rate
(ESTR)
USD
-
1D
Overnight
Bank
Funding
Rate
(OBFR01)
EUR
-
1D
Euro
Short
Term
Rate
(ESTR)
USD
-
1D
Overnight
Bank
Funding
Rate
(OBFR01)
GBP
-
1D
Sterling
Overnight
Index
Average
(SONIA)
USD
-
1D
Overnight
Bank
Funding
Rate
(OBFR01)
(h)
Range:
15
basis
points
Benchmarks:
USD
-
1D
Overnight
Bank
Funding
Rate
(OBFR01)
(b)
Barclays
Bank
(c)
Amount
includes
$(2,519)
of
net
dividends
and
financing
fees.
(d)
JPMChase
(e)
Amount
includes
$7,620
of
net
dividends
and
financing
fees.
(f)
Merill
L
(g)
Amount
includes
$1,182
of
net
dividends
and
financing
fees.
(h)
Merill
Lynch
(i)
Amount
includes
$(6,856)
of
net
dividends
and
financing
fees.
The
following
table
represents
the
individual
long
and
short
positions
and
related
values
of
equity
securities
underlying
the
total
return
swap
with
Barclays
Bank
plc,
as
of
period
end,
termination
date
March
31,
2025:
Shares
Value
%
of
Basket
Value
Reference
Entity
—
Long
Common
Stocks
Germany
Northern
Data
AG
.........
29,000
$
659,061
106.5
%
United
States
AMC
Networks,
Inc.,
Class
A
..
3,085
34,336
5.5
Total
Reference
Entity
—
Long
............
693,397
Reference
Entity
—
Short
Common
Stocks
United
States
Devon
Energy
Corp.
.......
(1,584)
(74,495)
(12.0)
Net
Value
of
Reference
Entity
—
Barclays
Bank
plc
................................
$
618,902
The
following
table
represents
the
individual
long
and
short
positions
and
related
values
of
equity
securities
underlying
the
total
return
swap
with
JPMorgan
Chase
Bank
NA,
as
of
period
end,
termination
date
August
9,
2024:
Shares
Value
%
of
Basket
Value
Reference
Entity
—
Long
Common
Stocks
United
States
CommScope
Holding
Co.,
Inc.
10,000
25,900
(1.0)
Eagle
Bancorp,
Inc.
........
1,722
37,057
(1.5)
New
York
Community
Bancorp,
Inc.
.................
29,731
312,770
(12.5)
Pitney
Bowes,
Inc.
........
25,000
165,000
(6.6)
Western
Digital
Corp.
.......
4,000
268,200
(10.7)
808,927
Shares
Value
%
of
Basket
Value
Reference
Entity
—
Short
Investment
Companies
United
States
iShares
iBoxx
$
High
Yield
Corporate
Bond
ETF
.....
(10,534)
$
(827,340)
33.0
%
iShares
iBoxx
$
Investment
Grade
Corporate
Bond
ETF
(7,392)
(809,868)
32.3
Vanguard
Intermediate-Term
Corporate
Bond
ETF
.....
(16,935)
(1,383,420)
55.2
(3,020,628)
Common
Stocks
United
States
Atlantic
Union
Bankshares
Corp.
(796)
(32,867)
1.3
Community
Financial
System,
Inc.
.................
(552)
(34,047)
1.4
CVB
Financial
Corp.
.......
(1,903)
(36,271)
1.5
Dime
Community
Bancshares,
Inc.
.................
(108)
(2,730)
0.1
First
Bancorp
............
(848)
(35,447)
1.4
Independent
Bank
Group,
Inc.
.
(904)
(53,390)
2.1
Provident
Financial
Services,
Inc.
.................
(2,608)
(48,352)
1.9
ServisFirst
Bancshares,
Inc.
..
(646)
(51,835)
2.1
(294,939)
Net
Value
of
Reference
Entity
—
JPMorgan
Chase
Bank
NA
............................
$
(2,506,640)
The
following
table
represents
the
individual
short
positions
and
related
values
of
equity
securities
underlying
the
total
return
swap
with
Merrill
Lynch
International
&
Co.,
as
of
period
end,
termination
date
February
15,
2028:
2024
BlackRock
Annual
Financial
Statements
Schedule
of
Investments
(continued)
July
31,
2024
BlackRock
Global
Long/Short
Credit
Fund
Shares
Value
%
of
Basket
Value
Reference
Entity
—
Short
Common
Stocks
United
States
Brandywine
Realty
Trust
....
(5,000)
$
(25,200)
11.9
%
Frontier
Communications
Parent,
Inc.
.................
(20,000)
(586,000)
277.1
(611,200)
Net
Value
of
Reference
Entity
—
Merrill
Lynch
International
&
Co.
.....................
$
(611,200)
The
following
table
represents
the
individual
long
and
short
positions
and
related
values
of
equity
securities
underlying
the
total
return
swap
with
Merrill
Lynch
International
&
Co.,
as
of
period
end,
termination
date
February
15,
2028:
Shares
Value
%
of
Basket
Value
Reference
Entity
—
Long
Common
Stocks
Belgium
Liberty
Global
Ltd.,
Class
A
...
60,802
1,185,031
(560.3)
Shares
Value
%
of
Basket
Value
Germany
ADLER
Group
SA
.........
6,390
$
1,123
(0.5)
%
United
Kingdom
EnQuest
plc
.............
2,969,582
504,680
(238.6)
Synthomer
plc
...........
225,140
766,387
(362.3)
1,271,067
United
States
Waystar
Holding
Corp.
......
5,000
115,000
(54.4)
Total
Reference
Entity
—
Long
............
2,572,221
Reference
Entity
—
Short
Investment
Companies
United
States
iShares
iBoxx
$
High
Yield
Corporate
Bond
ETF
.....
(8,080)
(634,603)
300.0
iShares
Preferred
&
Income
Securities
ETF
.........
(48,500)
(1,537,935)
727.1
(2,172,538)
Net
Value
of
Reference
Entity
—
Merrill
Lynch
International
&
Co.
.....................
$
399,683
The
following
reference
rates,
and
their
values
as
of
period
end,
are
used
for
security
descriptions:
Reference
Index
Reference
Rate
1-day
EFFR
.........................................
Effective
Federal
Funds
Rate
5.33
%
1-day
SOFR
.........................................
Secured
Overnight
Financing
Rate
5.35
Balances
Reported
in
the
Statement
of
Assets
and
Liabilities
for
Centrally
Cleared
Swaps,
OTC
Swaps
and
Options
Written
Description
Swap
Premiums
Paid
Swap
Premiums
Received
Unrealized
Appreciation
Unrealized
Depreciation
Value
Centrally
Cleared
Swaps
(a)
............................................
$
77,886
$
(1,754,595)
$
7,430
$
(489,191)
$
—
OTC
Swaps
.....................................................
8,388,433
(2,628,001)
2,041,851
(3,638,815)
—
Options
Written
...................................................
N/A
N/A
117,768
(23,611)
(173,376)
(a)
Includes
cumulative
appreciation
(depreciation)
on
centrally
cleared
swaps,
as
reported
in
the
Schedule
of
Investments.
Only
current
day’s
variation
margin
is
reported
within
the
Statement
of
Assets
and
Liabilities
and
is
net
of
any
previously
paid
(received)
swap
premium
amounts.
Schedule
of
Investments
(continued)
July
31,
2024
BlackRock
Global
Long/Short
Credit
Fund
Derivative
Financial
Instruments
Categorized
by
Risk
Exposure
As
of
period
end,
the
fair
values
of
derivative
financial
instruments
located
in
the
Statement
of
Assets
and
Liabilities
were
as
follows:
Commodity
Contracts
Credit
Contracts
Equity
Contracts
Foreign
Currency
Exchange
Contracts
Interest
Rate
Contracts
Other
Contracts
Total
Assets
—
Derivative
Financial
Instruments
Futures
contracts
Unrealized
appreciation
on
futures
contracts
(a)
......
$
—
$
—
$
4,843
$
—
$
143,356
$
—
$
148,199
Forward
foreign
currency
exchange
contracts
Unrealized
appreciation
on
forward
foreign
currency
exchange
contracts
......................
—
—
—
165,957
—
—
165,957
Options
purchased
Investments
at
value
—
unaffiliated
(b)
............
—
168,272
504,992
—
82,031
—
755,295
Swaps
—
centrally
cleared
Unrealized
appreciation
on
centrally
cleared
swaps
(a)
.
—
—
—
—
7,430
—
7,430
Swaps
—
OTC
Unrealized
appreciation
on
OTC
swaps;
Swap
premiums
paid
................................
—
10,406,653
23,631
—
—
—
10,430,284
$
—
$
10,574,925
$
533,466
$
165,957
$
232,817
$
—
$
11,507,165
Liabilities
—
Derivative
Financial
Instruments
Futures
contracts
Unrealized
depreciation
on
futures
contracts
(a)
......
$
—
$
—
$
695,042
$
—
$
17,921
$
—
$
712,963
Forward
foreign
currency
exchange
contracts
Unrealized
depreciation
on
forward
foreign
currency
exchange
contracts
......................
—
—
—
2,810,357
—
—
2,810,357
Options
written
Options
written
at
value
.....................
—
74,869
98,507
—
—
—
173,376
Swaps
—
centrally
cleared
Unrealized
depreciation
on
centrally
cleared
swaps
(a)
.
—
481,677
—
—
7,514
—
489,191
Swaps
—
OTC
Unrealized
depreciation
on
OTC
swaps;
Swap
premiums
received
.............................
—
6,099,667
167,149
—
—
—
6,266,816
$
—
$
6,656,213
$
960,698
$
2,810,357
$
25,435
$
—
$
10,452,703
(a)
Net
cumulative
unrealized
appreciation
(depreciation)
on
futures
contracts
and
centrally
cleared
swaps,
if
any,
are
reported
in
the
Schedule
of
Investments.
In
the
Statement
of
Assets
and
Liabilities,
only
current
day’s
variation
margin
is
reported
in
receivables
or
payables
and
the
net
cumulative
unrealized
appreciation
(depreciation)
is
included
in
accumulated
earnings
(loss).
(b)
Includes
options
purchased
at
value
as
reported
in
the
Schedule
of
Investments.
For
the
period
ended
July
31,
2024,
the
effect
of
derivative
financial
instruments
in
the
Statement
of
Operations
was
as
follows:
Commodity
Contracts
Credit
Contracts
Equity
Contracts
Foreign
Currency
Exchange
Contracts
Interest
Rate
Contracts
Other
Contracts
Total
Net
Realized
Gain
(Loss)
from
Futures
contracts
.......................
$
—
$
—
$
(1,008,981)
$
—
$
206,652
$
—
$
(802,329)
Forward
foreign
currency
exchange
contracts
....
—
—
—
10,373,841
—
—
10,373,841
Options
purchased
(a)
.....................
—
(3,067,989)
(4,564,543)
—
(234,006)
—
(7,866,538)
Options
written
........................
—
1,577,905
1,735,126
—
60,922
—
3,373,953
Swaps
..............................
—
(6,711,398)
(454,173)
—
—
—
(7,165,571)
$
—
$
(8,201,482)
$
(4,292,571)
$
10,373,841
$
33,568
$
—
$
(2,086,644)
Net
Change
in
Unrealized
Appreciation
(Depreciation)
on
Futures
contracts
.......................
$
—
$
—
$
363,049
$
—
$
(33,844)
$
—
$
329,205
Forward
foreign
currency
exchange
contracts
....
—
—
—
(653,549)
—
—
(653,549)
Options
purchased
(b)
.....................
—
41,267
430,014
—
11,567
—
482,848
Options
written
........................
—
437,225
(207,380)
—
—
—
229,845
Swaps
..............................
—
939,303
92,779
—
42
—
1,032,124
$
—
$
1,417,795
$
678,462
$
(653,549)
$
(22,235)
$
—
$
1,420,473
(a)
Options
purchased
are
included
in
net
realized
gain
(loss)
from
investments
—
unaffiliated.
(b)
Options
purchased
are
included
in
net
change
in
unrealized
appreciation
(depreciation)
on
investments
—
unaffiliated.
2024
BlackRock
Annual
Financial
Statements
Schedule
of
Investments
(continued)
July
31,
2024
BlackRock
Global
Long/Short
Credit
Fund
For
more
information
about
the
Fund’s
investment
risks
regarding
derivative
financial
instruments,
refer
to
the
Notes
to
Financial
Statements.
Derivative
Financial
Instruments
—
Offsetting
as
of
Period
End
Average
Quarterly
Balances
of
Outstanding
Derivative
Financial
Instruments
Futures
contracts
Average
notional
value
of
contracts
—
long
..................................................................................
$
10,250,614
Average
notional
value
of
contracts
—
short
.................................................................................
$
13,740,901
Forward
foreign
currency
exchange
contracts
Average
amounts
purchased
—
in
USD
....................................................................................
$
390,348,727
Average
amounts
sold
—
in
USD
........................................................................................
$
25,058,868
Options
Average
value
of
option
contracts
purchased
................................................................................
$
995,591
Average
value
of
option
contracts
written
...................................................................................
$
261,102
Average
notional
value
of
swaption
contracts
purchased
.........................................................................
$
143,143,114
Average
notional
value
of
swaption
contracts
written
...........................................................................
$
101,432,832
Credit
default
swaps
Average
notional
value
—
buy
protection
...................................................................................
$
219,272,517
Average
notional
value
—
sell
protection
...................................................................................
$
91,406,906
Interest
rate
swaps
Average
notional
value
—
pays
fixed
rate
...................................................................................
$
143,110
Average
notional
value
—
receives
fixed
rate
................................................................................
$
143,110
Total
return
swaps
Average
notional
value
...............................................................................................
$
9,663,276
The
Fund's
derivative
assets
and
liabilities
(by
type)
were
as
follows:
Assets
Liabilities
Derivative
Financial
Instruments
$
—
Futures
contracts
....................................................................................
$
13,203
$
25,157
Forward
f
oreign
currency
exchange
contracts
.................................................................
165,957
2,810,357
Options
(a)
.........................................................................................
755,295
173,376
Swaps
—
centrally
cleared
..............................................................................
—
58,326
Swaps
—
OTC
(b)
.....................................................................................
10,430,284
6,266,816
Total
derivative
assets
and
liabilities
in
the
Statement
of
Assets
and
Liabilities
.............................................
$
11,364,739
$
9,334,032
Derivatives
not
subject
to
a
Master
Netting
Agreement
or
similar
agreement
("MNA")
........................................
(600,226)
(181,990)
Total
derivative
assets
and
liabilities
subject
to
an
MNA
............................................................
$
10,764,513
$
9,152,042
(a)
Includes
options
purchased
at
value
which
is
included
in
Investments
at
value
–
unaffiliated
in
the
Statement
of
Assets
and
Liabilities
and
reported
in
the
Schedule
of
Investments.
(b)
Includes
unrealized
appreciation
(depreciation)
on
OTC
swaps
and
swap
premiums
(paid/received)
in
the
Statement
of
Assets
and
Liabilities.
The
following
tables
present
the
Fund's
derivative
assets
and
liabilities
by
counterparty
net
of
amounts
available
for
offset
under
an
MNA
and
net
of
the
related
collateral
received
and
pledged
by
the
Fund:
Counterparty
Derivative
Assets
Subject
to
an
MNA
by
Counterparty
Derivatives
Available
for
Offset
(a)
Non-cash
Collateral
Received
(b)
Cash
Collateral
Received
(b)
Net
Amount
of
Derivative
Assets
(c)(d)
Bank
of
America
NA
..............................
$
2,723,375
$
(151,686)
$
(2,245,844)
$
—
$
325,845
Barclays
Bank
plc
................................
1,516,369
(657,492)
—
(858,877)
—
BNP
Paribas
SA
.................................
529,991
(529,991)
—
—
—
Citibank
NA
....................................
1,206,518
(818,714)
—
(387,804)
—
Deutsche
Bank
AG
...............................
648,752
(
488,071)
—
—
160,681
Goldman
Sachs
International
........................
1,297,103
(1,297,103)
—
—
—
JPMorgan
Chase
Bank
NA
..........................
2,460,259
(2,019,980)
—
(440,279)
—
Merrill
Lynch
International
&
Co.
......................
23,631
(23,631)
—
—
—
Morgan
Stanley
&
Co.
International
plc
..................
358,450
(358,450)
—
—
—
Nomura
International
plc
...........................
65
—
—
—
65
$
10,764,513
$
(
6,345,118)
$
(2,245,844)
$
(1,686,960)
$
486,591
Schedule
of
Investments
(continued)
July
31,
2024
BlackRock
Global
Long/Short
Credit
Fund
Fair
Value
Hierarchy
as
of Period
End
Various
inputs
are
used
in
determining
the
fair
value
of
financial
instruments.
For
a
description
of
the
input
levels
and
information
about
the
Fund’s
policy
regarding
valuation
of
financial
instruments,
refer
to
the
Notes
to
Financial
Statements.
The
following
table
summarizes
the
Fund’s
financial
instruments
categorized
in
the
fair
value
hierarchy.
The
breakdown
of
the
Fund's
financial
instruments
into
major
categories
is
disclosed
in
the Schedule
of
Investments
above.
Counterparty
Derivative
Liabilities
Subject
to
an
MNA
by
Counterparty
Derivatives
Available
for
Offset
(a)
Non-cash
Collateral
Pledged
Cash
Collateral
Pledged
(b)
Net
Amount
of
Derivative
Liabilities
(c)(e)
Bank
of
America
NA
..............................
$
151,686
$
(151,686)
$
—
$
—
$
—
Barclays
Bank
plc
................................
657,492
(657,492)
—
—
—
BNP
Paribas
SA
.................................
2,445,555
(
529,991)
—
—
1,915,564
Citibank
NA
....................................
818,714
(818,714)
—
—
—
Deutsche
Bank
AG
...............................
488,071
(488,071)
—
—
—
Goldman
Sachs
International
........................
1,770,802
(1,297,103)
—
—
473,699
JPMorgan
Chase
Bank
NA
..........................
2,019,980
(2,019,980)
—
—
—
Merrill
Lynch
International
&
Co.
......................
26,118
(23,631)
—
(2,487)
—
Morgan
Stanley
&
Co.
International
plc
..................
765,292
(358,450)
—
(406,842)
—
Toronto
Dominion
Bank
............................
8,332
—
—
—
8,332
$
9,152,042
$
(6,345,118)
$
—
$
(409,329)
$
2,397,595
(a)
The
amount
of
derivatives
available
for
offset
is
limited
to
the
amount
of
derivative
assets
and/or
liabilities
that
are
subject
to
an
MNA.
(b)
Excess
of
collateral
received/pledged,
if
any,
from
the
individual
counterparty
is
not
shown
for
financial
reporting
purposes.
(c)
Net
amount
may
also
include
forward
foreign
currency
exchange
contracts
that
are
not
required
to
be
collateralized.
(d)
Net
amount
represents
the
net
amount
receivable
from
the
counterparty
in
the
event
of
default.
(e)
Net
amount
represents
the
net
amount
payable
due
to
the
counterparty
in
the
event
of
default.
Level
1
Level
2
Level
3
Total
Assets
Investments
Long-Term
Investments
Asset-Backed
Securities
...................................
$
—
$
78,507,508
$
—
$
78,507,508
Common
Stocks
Canada
.............................................
528,569
—
—
528,569
France
..............................................
61,451
—
—
61,451
Germany
............................................
10,361
—
—
10,361
Japan
...............................................
—
—
1
1
Luxembourg
..........................................
—
—
188,292
188,292
United
Kingdom
........................................
291,518
—
70
291,588
United
States
..........................................
5,800,046
523,535
1,708,649
8,032,230
Zambia
..............................................
9,964
—
—
9,964
Corporate
Bonds
Australia
.............................................
—
29,777
584,111
613,888
Austria
..............................................
—
3,926,953
—
3,926,953
Canada
.............................................
—
2,757,811
2,460,595
5,218,406
Chile
...............................................
—
125,917
—
125,917
China
...............................................
—
2,089,415
—
2,089,415
Cyprus
..............................................
—
1,168,262
—
1,168,262
Czech
Republic
........................................
—
1,767,076
—
1,767,076
Denmark
.............................................
—
587,636
—
587,636
Finland
..............................................
—
601,578
—
601,578
France
..............................................
—
23,246,459
321,913
23,568,372
Germany
............................................
—
41,668,607
481,108
42,149,715
Greece
..............................................
—
1,640,526
—
1,640,526
Hong
Kong
...........................................
—
3,730,338
—
3,730,338
Ireland
..............................................
—
5,129,556
—
5,129,556
Israel
...............................................
—
1,076,363
—
1,076,363
Italy
................................................
—
25,297,476
—
25,297,476
Japan
...............................................
—
3,912,675
—
3,912,675
Jersey,
Channel
Islands
...................................
—
2,072,567
—
2,072,567
Luxembourg
..........................................
—
13,583,767
—
13,583,767
2024
BlackRock
Annual
Financial
Statements
Schedule
of
Investments
(continued)
July
31,
2024
BlackRock
Global
Long/Short
Credit
Fund
Level
1
Level
2
Level
3
Total
Netherlands
...........................................
$
—
$
3,606,222
$
—
$
3,606,222
Norway
..............................................
—
2,992,286
—
2,992,286
Portugal
.............................................
—
14,606,046
—
14,606,046
Romania
.............................................
—
3,415,366
—
3,415,366
Slovenia
.............................................
—
2,344,124
—
2,344,124
South
Korea
..........................................
—
2,028,750
—
2,028,750
Spain
...............................................
—
10,623,614
755,843
11,379,457
Sweden
.............................................
—
9,782,237
—
9,782,237
Switzerland
...........................................
—
4,611,661
—
4,611,661
United
Arab
Emirates
....................................
—
254,649
—
254,649
United
Kingdom
........................................
—
41,302,533
20,420,707
61,723,240
United
States
..........................................
—
256,943,048
14,992,634
271,935,682
Zambia
..............................................
—
3,732,293
—
3,732,293
Fixed
Rate
Loan
Interests
Jersey,
Channel
Islands
...................................
—
—
2,744
2,744
United
States
..........................................
—
386,831
—
386,831
Floating
Rate
Loan
Interests
Colombia
............................................
—
—
153,480
153,480
Finland
..............................................
—
939,830
—
939,830
France
..............................................
—
4,673,706
—
4,673,706
Germany
............................................
—
9,562,331
—
9,562,331
Jersey,
Channel
Islands
...................................
—
—
301,123
301,123
Luxembourg
..........................................
—
5,754,353
218,009
5,972,362
Netherlands
...........................................
—
8,454,653
—
8,454,653
Spain
...............................................
—
9,270,883
—
9,270,883
United
Kingdom
........................................
—
11,555,541
79,789
11,635,330
United
States
..........................................
—
80,021,477
8,652,342
88,673,819
Foreign
Agency
Obligations
.................................
—
8,475,693
—
8,475,693
Investment
Companies
....................................
6,374,952
—
—
6,374,952
Non-Agency
Mortgage-Backed
Securities
........................
—
—
3,896,978
3,896,978
Preferred
Securities
Spain
...............................................
—
2,172,617
—
2,172,617
United
States
..........................................
—
32,454
4,341,677
4,374,131
Warrants
..............................................
22,914
90,514
183,004
296,432
Short-Term
Securities
Borrowed
Bond
Agreements
.................................
—
30,874,975
—
30,874,975
Commercial
Paper
.......................................
—
4,977,898
—
4,977,898
Money
Market
Funds
......................................
94,657,933
—
—
94,657,933
Options
Purchased
Credit
contracts
..........................................
—
168,272
—
168,272
Equity
contracts
..........................................
504,992
—
—
504,992
Interest
rate
contracts
......................................
82,031
—
—
82,031
Unfunded
Floating
Rate
Loan
Interests
(a)
..............................
—
—
2,715
2,715
Liabilities
Borrowed
Bonds
.........................................
—
(30,762,082)
—
(30,762,082)
$
108,344,731
$
716,336,577
$
59,745,784
$
884,427,092
Derivative
Financial
Instruments
(b)
Assets
Credit
contracts
...........................................
$
—
$
2,018,220
$
—
$
2,018,220
Equity
contracts
...........................................
—
28,474
—
28,474
Foreign
currency
exchange
contracts
............................
—
165,957
—
165,957
Interest
rate
contracts
.......................................
143,356
7,430
—
150,786
Liabilities
Credit
contracts
...........................................
—
(4,028,212)
—
(4,028,212)
Equity
contracts
...........................................
(793,549)
(167,149)
—
(960,698)
Foreign
currency
exchange
contracts
............................
—
(2,810,357)
—
(2,810,357)
Interest
rate
contracts
.......................................
(17,921)
(7,514)
—
(25,435)
$
(668,114)
$
(4,793,151)
$
—
$
(5,461,265)
(a)
Unfunded
floating
rate
loan
interests
are
valued
at
the
unrealized
appreciation
(depreciation)
on
the
commitment.
Fair
Value
Hierarchy
as
of Period
End
(continued)
Schedule
of
Investments
(continued)
July
31,
2024
BlackRock
Global
Long/Short
Credit
Fund
(b)
Derivative
financial
instruments
are
swaps,
futures
contracts,
forward
foreign
currency
exchange
contracts
and
options
written.
Swaps,
futures
contracts
and
forward
foreign
currency
exchange
contracts
are
valued
at
the
unrealized
appreciation
(depreciation)
on
the
instrument
and
options
written
are
shown
at
value.
A
reconciliation
of
Level
3
financial
instruments
is
presented
when
the
Fund
had
a
significant
amount
of
Level
3
investments
and
derivative
financial
instruments
at
the
beginning
and/or
end
of
the
year
in
relation
to
net
assets.
The
following
table
is
a
reconciliation
of
Level
3
investments
for
which
significant
unobservable
inputs
were
used
in
determining
fair
value:
Asset-
Backed
Securities
Common
Stocks
Corporate
Bonds
Fixed
Rate
Loan
Interests
Floating
Rate
Loan
Interests
Non-Agency
Mortgage-
Backed
Securities
Preferred
Securities
Unfunded
Floating
Rate
Loan
Interests
Warrants
Total
Investments
Assets/Liabilities
Opening
balance,
as
of
July
31,
2023
..........
$
5,279,991
$
1,640,563
$
66,615,016
$
2,739
$
11,362,356
$
3,586,951
$
4,369,932
$
—
$
125,966
$
92,983,514
Transfers
into
Level
3
....................
—
—
—
—
2,244,375
—
—
—
204
2,244,579
Transfers
out
of
Level
3
...................
(5,279,991)
—
—
—
(110,214)
—
—
—
—
(
5,390,205)
Other
(a)
..............................
—
607,452
—
—
—
—
(607,452)
—
—
—
Accrued
discounts/premiums
................
—
—
75,779
(2,958)
17,212
6,574
—
—
—
96,607
Net
realized
gain
(loss)
...................
—
(1,255,470)
61,762
—
(150,980)
—
—
—
(715,938)
(2,060,626)
Net
change
in
unrealized
appreciation
(depreciation)
(b)
(c)
...............................
—
1,008,562
(64,357)
2,963
398,195
303,453
(573,803)
2,715
789,530
1,867,258
Purchases
............................
—
214,134
3,842,854
—
6,830,604
3,940,000
1,364,970
—
—
16,192,562
Sales
...............................
—
(318,229)
(30,514,143)
—
(11,186,805)
(3,940,000)
(211,970)
—
(16,758)
(46,187,905)
Closing
balance,
as
of
July
31,
2024
...........
$
—
$
1,897,012
$
40,016,911
$
2,744
$
9,404,743
$
3,896,978
$
4,341,677
$
2,715
$
183,004
$
59,745,784
Net
change
in
unrealized
appreciation
(depreciation)
on
investments
still
held
at
July
31,
2024
(c)
.....
$
—
$
(504,568)
$
(303,776)
$
2,963
$
(192,595)
$
(91,327)
$
(620,406)
$
2,715
$
112,774
$
(1,594,220)
(a)
Certain
Level
3
investments
were
re-classified
between
Common
Stocks
and
Preferred
Securities.
(b)
Included
in
the
related
net
change
in
unrealized
appreciation
(depreciation)
in
the
Statement
of
Operations.
(c)
Any
difference
between
net
change
in
unrealized
appreciation
(depreciation)
and
net
change
in
unrealized
appreciation
(depreciation)
on
investments
still
held
at
July
31,
2024
is
generally
due
to
investments
no
longer
held
or
categorized
as
Level
3
at
period
end.
2024
BlackRock
Annual
Financial
Statements
Schedule
of
Investments
(continued)
July
31,
2024
BlackRock
Global
Long/Short
Credit
Fund
See
notes
to
financial
statements.
The
following
table
summarizes
the
valuation
approaches
used
and
unobservable
inputs
utilized
by
the
Valuation
Committee
to
determine
the
value
of
certain
of
the
Fund’s
Level
3
financial
instruments
as
of
period
end.
The
table
does
not
include
Level
3
financial
instruments
with
values
based
upon
unadjusted
third-party
pricing
information
in
the
amount
of
$5,302,986.
Value
Valuation
Approach
Unobservable
Inputs
Range
of
Unobservable
Inputs
Utilized
(a)
Weighted
Average
of
Unobservable
Inputs
Based
on
Fair
Value
Assets
Common
Stocks
.............................
$
1,896,826
Market
Time
to
Exit
3.0
–
5.1
years
3.0
years
Volatility
75%
–
80%
80%
Revenue
Multiple
3.38x
–
14.00x
6.95x
EBITDA
Multiple
13.25x
—
Corporate
Bonds
.............................
40,016,911
Income
Discount
Rate
5%
–
19%
8%
Floating
Rate
Interests
.........................
4,107,402
Income
Discount
Rate
6%
–
14%
11%
Preferred
Stocks
.............................
4,341,677
Income
Discount
Rate
11%
—
Market
Revenue
Multiple
8.75x
–
9.38x
8.97x
EBITDA
Multiple
7.00x
–
12.40x
11.71x
Time
to
Exit
2.0
–
3.0
years
2.6
years
Volatility
80%
–
90%
86%
Gross
Profit
Multiple
4.50x
—
Warrants
..................................
183,004
Market
Time
to
Exit
3.0
–
5.1
years
3.0
years
Volatility
75%
–
80%
80%
Revenue
Multiple
8.75x
–
9.00x
8.88x
Income
Discount
Rate
6%
–
19%
19%
Non-Agency
Mortgage-Backed
Securities
..............
3,896,978
Income
Discount
Rate
10%
—
$
54,442,798
(a)
A
significant
change
in
unobservable
input
would
have
resulted
in
a
correlated
(inverse)
significant
change
to
value.
Statement
of
Assets
and
Liabilities
July
31,
2024
Statement
of
Assets
and
Liabilities
BlackRock
Global
Long/
Short
Credit
Fund
ASSETS
Investments,
at
value
—
unaffiliated
(a)
........................................................................................
$
820,528,526
Investments,
at
value
—
affiliated
(b)
..........................................................................................
94,657,933
Cash
.............................................................................................................
156,234
Cash
pledged:
–
Collateral
—
OTC
derivatives
............................................................................................
1,494,766
Futures
contracts
....................................................................................................
722,880
Centrally
cleared
swaps
................................................................................................
1,475,600
Foreign
currency,
at
value
(c)
...............................................................................................
610,789
Receivables:
–
Investments
sold
....................................................................................................
3,260,821
Swaps
..........................................................................................................
23,472
Capital
shares
sold
...................................................................................................
4,487,546
Dividends
—
unaffiliated
...............................................................................................
11,150
Dividends
—
affiliated
.................................................................................................
402,373
Interest
—
unaffiliated
.................................................................................................
10,878,061
Due
from
broker
.....................................................................................................
126,000
Variation
margin
on
futures
contracts
.......................................................................................
13,203
Swap
premiums
paid
...................................................................................................
8,388,433
Unrealized
appreciation
on:
–
Forward
foreign
currency
exchange
contracts
.................................................................................
165,957
OTC
swaps
........................................................................................................
2,041,851
Unfunded
floating
rate
loan
interests
.......................................................................................
2,715
Prepaid
e
xpenses
.....................................................................................................
34,831
Total
a
ssets
.........................................................................................................
949,483,141
LIABILITIES
Cash
received:
–
Collateral
—
OTC
derivatives
............................................................................................
2,099,659
Borrowed
bonds,
at
value
(d)
...............................................................................................
30,762,082
Options
written,
at
value
(e)
................................................................................................
173,376
Payables:
–
Investments
purchased
................................................................................................
27,958,541
Swaps
..........................................................................................................
458,717
Administration
fees
...................................................................................................
40,708
Capital
shares
redeemed
...............................................................................................
4,976,157
Interest
expense
....................................................................................................
474,180
Investment
advisory
fees
..............................................................................................
686,528
Trustees'
and
Officer's
fees
.............................................................................................
29,440
Other
affiliate
fees
...................................................................................................
2,101
Professional
fees
....................................................................................................
124,765
Service
and
distribution
fees
.............................................................................................
49,171
Variation
margin
on
futures
contracts
.......................................................................................
25,157
Variation
margin
on
centrally
cleared
swaps
..................................................................................
58,326
Other
accrued
expenses
...............................................................................................
457,367
Swap
premiums
received
................................................................................................
2,628,001
Unrealized
depreciation
on:
–
Forward
foreign
currency
exchange
contracts
.................................................................................
2,810,357
OTC
swaps
........................................................................................................
3,638,815
Total
li
abilities
........................................................................................................
77,453,448
Commitments
and
contingent
liabilities
$
–
NET
ASSETS
........................................................................................................
$
872,029,693
Statement
of
Assets
and
Liabilities
(continued)
July
31,
2024
2024
BlackRock
Annual
Financial
Statements
See
notes
to
financial
statements.
BlackRock
Global
Long/
Short
Credit
Fund
NET
ASSETS
CONSIST
OF:
Paid-in
capital
........................................................................................................
$
1,474,939,051
Accumulated
loss
.....................................................................................................
(
602,909,358
)
NET
ASSETS
........................................................................................................
$
872,029,693
(a)
Investments,
at
cost
—
unaffiliated
.................................................................................
$
883,163,101
(b)
Investments,
at
cost
—
affiliated
...................................................................................
$
94,657,933
(c)
Foreign
currency,
at
cost
.......................................................................................
$
606,504
(d)
Proceeds
received
from
borrowed
bonds
.............................................................................
$
29,943,822
(e)
Premiums
received
...........................................................................................
$
267,533
Statement
of
Assets
and
Liabilities
(continued)
July
31,
2024
Statement
of
Assets
and
Liabilities
See
notes
to
financial
statements.
BlackRock
Global
Long/
Short
Credit
Fund
NET
ASSET
VALUE
Institutional
Net
assets
.........................................................................................................
$
617,576,420
Shares
outstanding
...................................................................................................
66,151,272
Net
asset
value
.....................................................................................................
$
9.34
Shares
authorized
...................................................................................................
Unlimited
Par
value
.........................................................................................................
$
0.001
Investor
A
Net
assets
.........................................................................................................
$
49,768,761
Shares
outstanding
...................................................................................................
5,325,652
Net
asset
value
.....................................................................................................
$
9.35
Shares
authorized
...................................................................................................
Unlimited
Par
value
.........................................................................................................
$
0.001
Investor
C
Net
assets
.........................................................................................................
$
2,960,617
Shares
outstanding
...................................................................................................
318,112
Net
asset
value
.....................................................................................................
$
9.31
Shares
authorized
...................................................................................................
Unlimited
Par
value
.........................................................................................................
$
0.001
Class
K
Net
assets
.........................................................................................................
$
201,723,895
Shares
outstanding
...................................................................................................
21,589,611
Net
asset
value
.....................................................................................................
$
9.34
Shares
authorized
...................................................................................................
Unlimited
Par
value
.........................................................................................................
$
0.001
Statement
of
Operations
Year
Ended
July
31,
2024
2024
BlackRock
Annual
Financial
Statements
See
notes
to
financial
statements.
BlackRock
Global
Long/
Short
Credit
Fund
INVESTMENT
INCOME
Dividends
—
unaffiliated
...............................................................................................
$
548,546
Dividends
—
affiliated
.................................................................................................
3,463,033
Interest
—
unaffiliated
.................................................................................................
70,854,672
Foreign
taxes
withheld
................................................................................................
(
304
)
Total
investment
income
.................................................................................................
74,865,947
EXPENSES
Investment
advisory
..................................................................................................
9,273,149
Transfer
agent
—
class
specific
..........................................................................................
735,059
Administration
.....................................................................................................
402,955
Accounting
services
..................................................................................................
215,636
Service
and
distribution
—
class
specific
....................................................................................
173,293
Administration
—
class
specific
..........................................................................................
146,638
Registration
.......................................................................................................
111,514
Professional
.......................................................................................................
110,175
Custodian
.........................................................................................................
67,709
Printing
and
postage
.................................................................................................
62,767
Trustees
and
Officer
..................................................................................................
19,289
Miscellaneous
......................................................................................................
257,307
Total
expenses
excluding
dividend
expense
and
interest
expense
.....................................................................
11,575,491
Dividends
expense
—
unaffiliated
.........................................................................................
400
Interest
expense
....................................................................................................
2,774,000
Total
expenses
.......................................................................................................
14,349,891
Less:
–
Administration
fees
waived
by
the
Manager
—
class
specific
.......................................................................
(
27,649
)
Fees
waived
and/or
reimbursed
by
the
Manager
...............................................................................
(
50,072
)
Transfer
agent
fees
waived
and/or
reimbursed
by
the
Manager
—
class
specific
..........................................................
(
9,509
)
Total
expenses
after
fees
waived
and/or
reimbursed
..............................................................................
14,262,661
Net
investment
income
..................................................................................................
60,603,286
REALIZED
AND
UNREALIZED
GAIN
(LOSS)
$
29,279,067
Net
realized
gain
(loss)
from:
$
–
Investments
—
unaffiliated
...........................................................................................
(
29,307,743
)
Investments
—
affiliated
.............................................................................................
41,374
Borrowed
bonds
..................................................................................................
2,425,267
Forward
foreign
currency
exchange
contracts
...............................................................................
10,373,841
Foreign
currency
transactions
.........................................................................................
1,085,786
Futures
contracts
..................................................................................................
(
802,329
)
Options
written
...................................................................................................
3,373,953
Payment
by
affiliate
................................................................................................
1,118
Short
sales
—
unaffiliated
............................................................................................
(
227,990
)
Swaps
.........................................................................................................
(
7,165,571
)
A
(20,202,294)
Net
change
in
unrealized
appreciation
(depreciation)
on:
Investments
—
unaffiliated
...........................................................................................
50,400,136
Borrowed
bonds
..................................................................................................
(
1,925,464
)
Forward
foreign
currency
exchange
contracts
...............................................................................
(
653,549
)
Foreign
currency
translations
..........................................................................................
(
107,427
)
Futures
contracts
..................................................................................................
329,205
Options
written
...................................................................................................
229,845
Short
sales
—
unaffiliated
............................................................................................
173,776
Swaps
.........................................................................................................
1,032,124
Unfunded
floating
rate
loan
interests
.....................................................................................
2,715
A
49,481,361
Net
realized
and
unrealized
gain
...........................................................................................
29,279,067
NET
INCREASE
IN
NET
ASSETS
RESULTING
FROM
OPERATIONS
..................................................................
$
89,882,353
Statements
of
Changes
in
Net
Assets
Statements
of
Changes
in
Net
Assets
See
notes
to
financial
statements.
BlackRock
Global
Long/Short
Credit
Fund
Year
Ended
07/31/24
Year
Ended
07/31/23
INCREASE
(DECREASE)
IN
NET
ASSETS
OPERATIONS
Net
investment
income
..............................................................................
$
60,603,286
$
59,266,211
Net
realized
loss
..................................................................................
(
20,202,294
)
(
137,259,190
)
Net
change
in
unrealized
appreciation
(depreciation)
..........................................................
49,481,361
102,001,892
Net
increase
in
net
assets
resulting
from
operations
.............................................................
89,882,353
24,008,913
DISTRIBUTIONS
TO
SHAREHOLDERS
(a)
Institutional
.....................................................................................
(
24,041,522
)
(
66,995,894
)
Investor
A
......................................................................................
(
1,678,966
)
(
5,315,056
)
Investor
C
......................................................................................
(
62,946
)
(
433,580
)
Class
K
.......................................................................................
(
7,348,283
)
(
20,255,590
)
Decrease
in
net
assets
resulting
from
distributions
to
shareholders
...................................................
(33,131,717
)
(93,000,120
)
CAPITAL
SHARE
TRANSACTIONS
Net
decrease
in
net
assets
derived
from
capital
share
transactions
...................................................
(273,093,801
)
(384,466,653
)
NET
ASSETS
Total
decrease
in
net
assets
............................................................................
(
216,343,165
)
(
453,457,860
)
Beginning
of
year
....................................................................................
1,088,372,858
1,541,830,718
End
of
year
........................................................................................
$
872,029,693
$
1,088,372,858
(a)
Distributions
for
annual
periods
determined
in
accordance
with
U.S.
federal
income
tax
regulations.
Financial
Highlights
(For
a
share
outstanding
throughout
each
period)
2024
BlackRock
Annual
Financial
Statements
BlackRock
Global
Long/Short
Credit
Fund
Institutional
Year
Ended
07/31/24
Year
Ended
07/31/23
Year
Ended
07/31/22
Year
Ended
07/31/21
Year
Ended
07/31/20
Net
asset
value,
beginning
of
year
...........................
$
8.80
$
9.26
$
10.25
$
9.78
$
10.05
Net
investment
income
(a)
.................................
0
.56
0
.43
0
.28
0
.38
0
.37
Net
realized
and
unrealized
gain
(loss)
........................
0
.28
(
0
.19
)
(
0
.92
)
0
.48
(
0
.27
)
Net
increase
(decrease)
from
investment
operations
................
0.84
0.24
(0.64
)
0.86
0.10
Distributions
from
net
investment
income
(b)
....................
(0.30
)
(0.70
)
(0.35
)
(0.39
)
(0.37
)
Net
asset
value,
end
of
year
...............................
$
9.34
$
8.80
$
9.26
$
10.25
$
9.78
Total
Return
(c)
Based
on
net
asset
value
..................................
9.69
%
(d)
2.88
%
(6.42
)%
8.95
%
0.96
%
(d)
Ratios
to
Average
Net
Assets
(e)
Total
expen
ses
.........................................
1.47
%
1.49
%
1.34
%
1.46
%
1.85
%
Total
expenses
after
fees
waived
and/or
reimbursed
................
1.46
%
1.47
%
1.33
%
1.45
%
1.85
%
Total
expenses
after
fees
waived
and/or
reimbursed
and
excluding
dividend
expense,
interest
expense,
broker
fees
and
expenses
on
short
sales
...
1.18
%
1.17
%
1.12
%
1.09
%
1.12
%
Net
investment
income
...................................
6.19
%
4.87
%
2.89
%
3.80
%
3.74
%
Supplemental
Data
Net
assets,
end
of
year
(000)
................................
$
617,576
$
783,811
$
1,077,774
$
1,202,628
$
1,223,282
Portfolio
turnover
rate
.....................................
110
%
(f)
132
%
(f)
149
%
156
%
232
%
(a)
Based
on
average
shares
outstanding.
(b)
Distributions
for
annual
periods
determined
in
accordance
with
U.S.
federal
income
tax
regulations.
(c)
Where
applicable,
assumes
the
reinvestment
of
distributions.
(d)
Includes
payment
from
an
affiliate,
which
had
no
impact
on
the
Fund’s
total
return.
(e)
Excludes
fees
and
expenses
incurred
indirectly
as
a
result
of
investments
in
underlying
funds.
(f)
Excludes
underlying
investments
in
total
return
swaps.
See
notes
to
financial
statements.
Financial
Highlights
(continued)
(For
a
share
outstanding
throughout
each
period)
BlackRock
Global
Long/Short
Credit
Fund
Investor
A
Year
Ended
07/31/24
Year
Ended
07/31/23
Year
Ended
07/31/22
Year
Ended
07/31/21
Year
Ended
07/31/20
Net
asset
value,
beginning
of
year
...........................
$
8.81
$
9.24
$
10.24
$
9.76
$
10.03
Net
investment
income
(a)
.................................
0
.54
0
.40
0
.26
0
.35
0
.34
Net
realized
and
unrealized
gain
(loss)
........................
0
.27
(
0
.17
)
(
0
.93
)
0
.49
(
0
.27
)
Net
increase
(decrease)
from
investment
operations
................
0.81
0.23
(0.67
)
0.84
0.07
Distributions
from
net
investment
income
(b)
....................
(0.27
)
(0.66
)
(0.33
)
(0.36
)
(0.34
)
Net
asset
value,
end
of
year
...............................
$
9.35
$
8.81
$
9.24
$
10.24
$
9.76
Total
Return
(c)
Based
on
net
asset
value
..................................
9.40
%
(d)
2.76
%
(6.75
)%
8.69
%
0.69
%
(d)
Ratios
to
Average
Net
Assets
(e)
Total
expen
ses
.........................................
1.71
%
1.76
%
1.61
%
1.73
%
2.10
%
Total
expenses
after
fees
waived
and/or
reimbursed
................
1.68
%
1.70
%
1.60
%
1.72
%
2.10
%
Total
expenses
after
fees
waived
and/or
reimbursed
and
excluding
dividend
expense,
interest
expense,
broker
fees
and
expenses
on
short
sales
...
1.40
%
1.40
%
1.39
%
1.36
%
1.37
%
Net
investment
income
...................................
5.97
%
4.50
%
2.70
%
3.53
%
3.49
%
Supplemental
Data
Net
assets,
end
of
year
(000)
................................
$
49,769
$
65,580
$
136,073
$
86,176
$
101,727
Portfolio
turnover
rate
.....................................
110
%
(f)
132
%
(f)
149
%
156
%
232
%
(a)
Based
on
average
shares
outstanding.
(b)
Distributions
for
annual
periods
determined
in
accordance
with
U.S.
federal
income
tax
regulations.
(c)
Where
applicable,
excludes
the
effects
of
any
sales
charges
and
assumes
the
reinvestment
of
distributions.
(d)
Includes
payment
from
an
affiliate,
which
had
no
impact
on
the
Fund’s
total
return.
(e)
Excludes
fees
and
expenses
incurred
indirectly
as
a
result
of
investments
in
underlying
funds.
(f)
Excludes
underlying
investments
in
total
return
swaps.
See
notes
to
financial
statements.
Financial
Highlights
(continued)
(For
a
share
outstanding
throughout
each
period)
2024
BlackRock
Annual
Financial
Statements
BlackRock
Global
Long/Short
Credit
Fund
Investor
C
Year
Ended
07/31/24
Year
Ended
07/31/23
Year
Ended
07/31/22
Year
Ended
07/31/21
Year
Ended
07/31/20
Net
asset
value,
beginning
of
year
...........................
$
8.73
$
9.14
$
10.09
$
9.58
$
9.82
Net
investment
income
(a)
.................................
0
.47
0
.34
0
.18
0
.27
0
.27
Net
realized
and
unrealized
gain
(loss)
........................
0
.28
(
0
.19
)
(
0
.91
)
0
.47
(
0
.26
)
Net
increase
(decrease)
from
investment
operations
................
0.75
0.15
(0.73
)
0.74
0.01
Distributions
from
net
investment
income
(b)
....................
(0.17
)
(0.56
)
(0.22
)
(0.23
)
(0.25
)
Net
asset
value,
end
of
year
...............................
$
9.31
$
8.73
$
9.14
$
10.09
$
9.58
Total
Return
(c)
Based
on
net
asset
value
..................................
8.64
%
(d)
1.84
%
(7.37
)%
7.75
%
0.03
%
(d)
Ratios
to
Average
Net
Assets
(e)
Total
expen
ses
.........................................
2.48
%
2.51
%
2.37
%
2.50
%
2.86
%
Total
expenses
after
fees
waived
and/or
reimbursed
................
2.44
%
2.45
%
2.36
%
2.49
%
2.86
%
Total
expenses
after
fees
waived
and/or
reimbursed
and
excluding
dividend
expense,
interest
expense,
broker
fees
and
expenses
on
short
sales
...
2.15
%
2.15
%
2.15
%
2.13
%
2.13
%
Net
investment
income
...................................
5.22
%
3.82
%
1.88
%
2.71
%
2.75
%
Supplemental
Data
Net
assets,
end
of
year
(000)
................................
$
2,961
$
4,735
$
9,827
$
18,771
$
29,291
Portfolio
turnover
rate
.....................................
110
%
(f)
132
%
(f)
149
%
156
%
232
%
(a)
Based
on
average
shares
outstanding.
(b)
Distributions
for
annual
periods
determined
in
accordance
with
U.S.
federal
income
tax
regulations.
(c)
Where
applicable,
excludes
the
effects
of
any
sales
charges
and
assumes
the
reinvestment
of
distributions.
(d)
Includes
payment
from
an
affiliate,
which
had
no
impact
on
the
Fund’s
total
return.
(e)
Excludes
fees
and
expenses
incurred
indirectly
as
a
result
of
investments
in
underlying
funds.
(f)
Excludes
underlying
investments
in
total
return
swaps.
See
notes
to
financial
statements.
Financial
Highlights
(continued)
(For
a
share
outstanding
throughout
each
period)
BlackRock
Global
Long/Short
Credit
Fund
Class
K
Year
Ended
07/31/24
Year
Ended
07/31/23
Year
Ended
07/31/22
Year
Ended
07/31/21
Year
Ended
07/31/20
Net
asset
value,
beginning
of
year
...........................
$
8.81
$
9.27
$
10.26
$
9.79
$
10.06
Net
investment
income
(a)
.................................
0
.57
0
.44
0
.29
0
.39
0
.38
Net
realized
and
unrealized
gain
(loss)
........................
0
.26
(
0
.20
)
(
0
.92
)
0
.48
(
0
.27
)
Net
increase
(decrease)
from
investment
operations
................
0.83
0.24
(0.63
)
0.87
0.11
Distributions
from
net
investment
income
(b)
....................
(0.30
)
(0.70
)
(0.36
)
(0.40
)
(0.38
)
Net
asset
value,
end
of
year
...............................
$
9.34
$
8.81
$
9.27
$
10.26
$
9.79
Total
Return
(c)
Based
on
net
asset
value
..................................
9.66
%
(d)
2.98
%
(6.35
)%
9.02
%
1.04
%
(d)
Ratios
to
Average
Net
Assets
(e)
Total
expen
ses
.........................................
1.38
%
1.40
%
1.26
%
1.39
%
1.77
%
Total
expenses
after
fees
waived
and/or
reimbursed
................
1.37
%
1.38
%
1.26
%
1.38
%
1.76
%
Total
expenses
after
fees
waived
and/or
reimbursed
and
excluding
dividend
expense,
interest
expense,
broker
fees
and
expenses
on
short
sales
...
1.09
%
1.09
%
1.05
%
1.02
%
1.04
%
Net
investment
income
...................................
6.29
%
4.95
%
2.97
%
3.85
%
3.85
%
Supplemental
Data
Net
assets,
end
of
year
(000)
................................
$
201,724
$
234,247
$
318,157
$
299,722
$
399,165
Portfolio
turnover
rate
.....................................
110
%
(f)
132
%
(f)
149
%
156
%
232
%
(a)
Based
on
average
shares
outstanding.
(b)
Distributions
for
annual
periods
determined
in
accordance
with
U.S.
federal
income
tax
regulations.
(c)
Where
applicable,
assumes
the
reinvestment
of
distributions.
(d)
Includes
payment
from
an
affiliate,
which
had
no
impact
on
the
Fund’s
total
return.
(e)
Excludes
fees
and
expenses
incurred
indirectly
as
a
result
of
investments
in
underlying
funds.
(f)
Excludes
underlying
investments
in
total
return
swaps.
See
notes
to
financial
statements.
Notes
to
Financial
Statements
2024
BlackRock
Annual
Financial
Statements
1.
ORGANIZATION
BlackRock
Funds
IV (the
“Trust”)
is
registered
under
the
Investment
Company
Act
of
1940,
as
amended
(the
“1940
Act”),
as
an
open-end
management
investment
company.
The Trust
is
organized
as
a Massachusetts
business
trust.
BlackRock
Global
Long/Short
Credit
Fund
(the
“Fund”)
is
a
series
of
the
Trust.
The
Fund
is
classified
as
diversified.
The
Fund
offers
multiple
classes
of
shares.
All
classes
of
shares
have
identical
voting,
dividend,
liquidation
and
other
rights
and
are
subject
to
the
same
terms
and
conditions,
except
that
certain
classes
bear
expenses
related
to
the
shareholder
servicing
and
distribution
of
such
shares.
Institutional
and
Class
K
Shares
are
sold
without
a
sales
charge
and
only
to
certain
eligible
investors.
Investor
A
Shares
are
generally
sold
with
an
initial
sales
charge,
and
may
be
subject
to
a
contingent
deferred
sales
charge
("CDSC")
for
certain
redemptions
where
no
initial
sales
charge
was
paid
at
the
time
of
purchase.
Investor
C
Shares
may
be
subject
to
a
1.00%
CDSC
if
redeemed
within
one
year
of
purchase.
Investor
A
and
Investor
C
Shares
bear
certain
expenses
related
to
shareholder
servicing
of
such
shares,
and
Investor
C
Shares
also
bear
certain
expenses
related
to
the
distribution
of
such
shares.
Investor
A
and
Investor
C
Shares
are
generally
available
through
financial
intermediaries.
Each
class
has
exclusive
voting
rights
with
respect
to
matters
relating
to
its
shareholder
servicing
and
distribution
expenditures
(except
that
Investor
C
shareholders
may
vote
on
material
changes
to
the
Investor
A
Shares
distribution
and
service
plan).
(a)
Investor
A
Shares
may
be
subject
to
a
CDSC
for
certain
redemptions
where
no
initial
sales
charge
was
paid
at
the
time
of
purchase.
(b)
A
CDSC
of
1.00%
is
assessed
on
certain
redemptions
of
Investor
C
Shares
made
within
one
year
after
purchase.
The
Fund,
together
with
certain
other
registered
investment
companies
advised
by
BlackRock
Advisors,
LLC
(the
“Manager”) or
its
affiliates,
is
included
in
a
complex
of
funds
referred
to
as
the BlackRock
Fixed-Income
Complex.
2.
SIGNIFICANT
ACCOUNTING
POLICIES
The
financial
statements
are
prepared
in
conformity
with
accounting
principles
generally
accepted
in
the
United
States
of
America
(“U.S.
GAAP”),
which
may
require
management
to
make
estimates
and
assumptions
that
affect
the
reported
amounts
of
assets
and
liabilities
in
the
financial
statements,
disclosure
of
contingent
assets
and
liabilities
at
the
date
of
the
financial
statements
and
the
reported
amounts
of
increases
and
decreases
in
net
assets
from
operations
during
the
reporting
period.
Actual
results
could
differ
from
those
estimates.
The
Fund
is
considered
an
investment
company
under
U.S.
GAAP
and
follows
the
accounting
and
reporting
guidance
applicable
to
investment
companies.
Below
is
a
summary
of
significant
accounting
policies:
Investment
Transactions
and
Income
Recognition:
For
financial
reporting
purposes,
investment
transactions
are
recorded
on
the
dates
the
transactions
are
executed.
Realized
gains
and
losses
on
investment
transactions
are
determined
using
the
specific
identification
method.
Dividend
income
and
capital
gain
distributions,
if
any,
are
recorded
on
the
ex-dividend
dates.
Non-cash
dividends,
if
any,
are
recorded
on
the
ex-dividend
dates
at
fair
value.
Dividends
from
foreign
securities
where
the
ex-dividend
dates
may
have
passed
are
subsequently
recorded
when
the
Fund
is
informed
of
the
ex-dividend
dates.
Under
the
applicable
foreign
tax
laws,
a
withholding
tax
at
various
rates
may
be
imposed
on
capital
gains,
dividends
and
interest.
Upon
notification
from
issuers,
a
portion
of
the
dividend
income
received
from
a
real
estate
investment
trust
may
be
redesignated
as
a
reduction
of
cost
of
the
related
investment
and/or
realized
gain.
Interest
income,
including
amortization
and
accretion
of
premiums
and
discounts
on
debt
securities
and
payment-in-kind
interest,
are
recognized
daily
on
an
accrual
basis.
Income,
expenses
and
realized
and
unrealized
gains
and
losses
are
allocated
daily
to
each
class
based
on
its
relative
net
assets. For
convertible
securities,
premiums
attributable
to
the
debt
instrument
are
amortized,
but
premiums
attributable
to
the
conversion
feature
are
not
amortized.
Foreign
Currency
Translation:
The
Fund’s
books
and
records
are
maintained
in
U.S.
dollars.
Securities
and
other
assets
and
liabilities
denominated
in
foreign
currencies
are
translated
into
U.S.
dollars
using
exchange
rates
determined
as
of
the
close
of
trading
on
the
New
York
Stock
Exchange
(“NYSE”).
Purchases
and
sales
of
investments
are
recorded
at
the
rates
of
exchange
prevailing
on
the
respective
dates
of
such
transactions.
Generally,
when
the
U.S.
dollar
rises
in
value
against
a
foreign
currency,
the
investments
denominated
in
that
currency
will
lose
value;
the
opposite
effect
occurs
if
the
U.S.
dollar
falls
in
relative
value.
The
Fund
does
not
isolate
the
effect
of
fluctuations
in
foreign
exchange
rates
from
the
effect
of
fluctuations
in
the
market
prices
of
investments
for
financial
reporting
purposes.
Accordingly,
the
effects
of
changes
in
exchange
rates
on
investments
are
not
segregated
in
the
Statement
of
Operations
from
the
effects
of
changes
in
market
prices
of
those
investments,
but
are
included
as
a
component
of
net
realized
and
unrealized
gain
(loss)
from
investments.
The
Fund
reports
realized
currency
gains
(losses)
on
foreign
currency
related
transactions
as
components
of
net
realized
gain
(loss)
for
financial
reporting
purposes,
whereas
such
components
are
generally
treated
as
ordinary
income
for
U.S.
federal
income
tax
purposes.
Foreign
Taxes:
The
Fund
may
be
subject
to
foreign
taxes
(a
portion
of
which
may
be
reclaimable)
on
income,
stock
dividends,
capital
gains
on
investments,
or
certain
foreign
currency
transactions.
All
foreign
taxes
are
recorded
in
accordance
with
the
applicable
foreign
tax
regulations
and
rates
that
exist
in
the
foreign
jurisdictions
in
which
the
Fund
invests.
These
foreign
taxes,
if
any,
are
paid
by
the
Fund
and
are
reflected
in
its
Statement
of
Operations
as
follows:
foreign
taxes
withheld
at
source
are
presented
as
a
reduction
of
income,
foreign
taxes
on
securities
lending
income
are
presented
as
a
reduction
of
securities
lending
income,
foreign
taxes
on
stock
dividends
are
presented
as
“Foreign
taxes
withheld”,
and
foreign
taxes
on
capital
gains
from
sales
of
investments
and
foreign
taxes
on
foreign
currency
transactions
are
included
in
their
respective
net
realized
gain
(loss)
categories.
Foreign
taxes
payable
or
deferred
as
of
July
31,
2024
,
if
any,
are
disclosed
in
the Statement
of
Assets
and
Liabilities.
The
Fund
files
withholding
tax
reclaims
in
certain
jurisdictions
to
recover
a
portion
of
amounts
previously
withheld.
The
Fund
may
record
a
reclaim
receivable
based
on
collectability,
which
includes
factors
such
as
the
jurisdiction’s
applicable
laws,
payment
history
and
market
convention.
The Statement
of
Operations
includes
tax
reclaims
recorded
as
well
as
professional
and
other
fees,
if
any,
associated
with
recovery
of
foreign
withholding
taxes.
Share
Class
Initial
Sales
Charge
CDSC
Conversion
Privilege
Institutional
and
Class
K
Shares
...................................
No
No
None
Investor
A
Shares
............................................
Yes
No
(a)
None
Investor
C
Shares
...........................................
No
Yes
(b)
To
Investor
A
Shares
after
approximately
8
years
Notes
to
Financial
Statements
(continued)
Notes
to
Financial
Statements
Bank
Overdraft:
The
Fund
had
outstanding
cash
disbursements
exceeding
deposited
cash
amounts
at
the
custodian
during
the
reporting
period.
The
Fund
is
obligated
to
repay
the
custodian
for
any
overdraft,
including
any
related
costs
or
expenses,
where
applicable.
For
financial
reporting
purposes,
overdraft
fees,
if
any,
are
included
in
interest
expense
in
the
Statement
of
Operations.
Collateralization:
If
required
by
an
exchange
or
counterparty
agreement,
the
Fund
may
be
required
to
deliver/deposit
cash
and/or
securities
to/with
an
exchange,
or
broker-
dealer
or
custodian
as
collateral
for
certain
investments.
Distributions:
Distributions
from
net
investment
income
are
declared and
paid
at
least
annually.
Distributions
of
capital
gains
are
recorded
on
the
ex-dividend
dates
and
made
at
least
annually.
The
character
and
timing
of
distributions
are
determined
in
accordance
with
U.S.
federal
income
tax
regulations,
which
may
differ
from
U.S.
GAAP.
Deferred
Compensation
Plan:
Under
the
Deferred
Compensation
Plan
(the
“Plan”)
approved
by
the
Board
of
Trustees
of
the
Trust
(the
“Board”), the
trustees
who
are
not
“interested
persons”
of
the
Fund,
as
defined
in
the
1940
Act
(“Independent
Trustees
”),
may
defer
a
portion
of
their
annual
complex-wide
compensation.
Deferred
amounts
earn
an
approximate
return
as
though
equivalent
dollar
amounts
had
been
invested
in
common
shares
of
certain
funds
in
the
BlackRock
Fixed-Income
Complex
selected
by
the
Independent
Trustees
.
This
has
the
same
economic
effect
for
the
Independent
Trustees
as
if
the
Independent
Trustees
had
invested
the
deferred
amounts
directly
in
certain
funds
in
the
BlackRock
Fixed-Income
Complex.
The
Plan
is
not
funded
and
obligations
thereunder
represent
general
unsecured
claims
against
the
general
assets
of
the
Fund,
as
applicable.
Deferred
compensation
liabilities,
if
any, are
included
in
the Trustees’
and
Officer’s
fees
payable
in
the
Statement
of
Assets
and
Liabilities
and
will
remain
as
a
liability
of
the
Fund
until
such
amounts
are
distributed
in
accordance
with
the
Plan.
Net
appreciation
(depreciation)
in
the
value
of
participants’
deferral
accounts
is
allocated
among
the
participating
funds
in
the
BlackRock
Fixed-Income
Complex
and
reflected
as
Trustee
and
Officer
expense
on
the
Statement
of
Operations.
The
Trustee
and
Officer
expense
may
be
negative
as
a
result
of
a
decrease
in
value
of
the
deferred
accounts.
Indemnifications:
In
the
normal
course
of
business,
the
Fund
enters
into
contracts
that
contain
a
variety
of
representations
that
provide
general
indemnification.
The
Fund’s
maximum
exposure
under
these
arrangements
is
unknown
because
it
involves
future
potential
claims
against
the
Fund,
which
cannot
be
predicted
with
any
certainty.
Other:
Expenses
directly
related
to the
Fund
or
its
classes
are
charged
to
the
Fund
or
the
applicable
class.
Expenses
directly
related
to
the
Fund
and
other
shared
expenses
prorated
to
the
Fund
are
allocated
daily
to
each
class
based
on
its
relative
net
assets
or
other
appropriate
methods.
Other
operating
expenses
shared
by
several
funds,
including
other
funds
managed
by
the
Manager,
are
prorated
among
those
funds
on
the
basis
of
relative
net
assets
or
other
appropriate
methods.
3.
INVESTMENT
VALUATION
AND
FAIR
VALUE
MEASUREMENTS
Investment
Valuation
Policies:
The
Fund’s
investments
are
valued
at
fair
value
(also
referred
to
as
“market
value”
within
the
financial
statements)
each
day
that
the
Fund
is
open
for
business
and,
for
financial
reporting
purposes,
as
of
the
report
date.
U.S.
GAAP
defines
fair
value
as
the
price
a
fund
would
receive
to
sell
an
asset
or
pay
to
transfer
a
liability
in
an
orderly
transaction
between
market
participants
at
the
measurement
date.
The
Board
has
approved
the
designation
of
the
Fund’s
Manager
as
the
valuation
designee
for
the
Fund.
The
Fund
determines
the
fair
values
of
its
financial
instruments
using
various
independent
dealers
or
pricing
services
under
the
Manager’s
policies.
If
a
security’s
market
price
is
not
readily
available
or
does
not
otherwise
accurately
represent
the
fair
value
of
the
security,
the
security
will
be
valued
in
accordance
with
the
Manager’s
policies
and
procedures
as
reflecting
fair
value.
The
Manager
has
formed
a
committee
(the
“Valuation
Committee”)
to
develop
pricing
policies
and
procedures
and
to
oversee
the
pricing
function
for
all
financial
instruments,
with
assistance
from
other
BlackRock
pricing
committees.
Fair
Value
Inputs
and
Methodologies:
The
following
methods
and
inputs
are
used
to
establish
the
fair
value
of
the
Fund’s
assets
and
liabilities:
Equity
investments
traded
on
a
recognized
securities
exchange
are
valued
at
that
day’s official
closing
price,
as
applicable,
on
the
exchange
where
the
stock
is
primarily
traded.
Equity
investments
traded
on
a
recognized
exchange
for
which
there
were
no
sales
on
that
day
may
be
valued
at
the
last
available
bid
(long
positions)
or
ask
(short
positions)
price.
Fixed-income investments
for
which
market
quotations
are
readily
available
are
generally
valued
using
the
last
available
bid
price
or
current
market
quotations
provided
by
independent
dealers
or
third-party
pricing
services. Floating
rate
loan
interests
are
valued
at
the
mean
of
the
bid
prices
from
one
or
more
independent
brokers
or
dealers
as
obtained
from
a
third-party
pricing
service. Pricing
services
generally
value
fixed-income
securities
assuming
orderly
transactions
of
an
institutional
round
lot
size,
but
a
fund
may
hold
or
transact
in
such
securities
in
smaller,
odd
lot
sizes.
Odd
lots
may
trade
at
lower
prices
than
institutional
round
lots.
The
pricing
services
may
use
matrix
pricing
or
valuation
models
that
utilize
certain
inputs
and
assumptions
to
derive
values,
including
transaction
data
(e.g.,
recent
representative
bids
and
offers),
market
data, credit
quality
information,
perceived
market
movements,
news,
and
other
relevant
information.
Certain
fixed-income
securities,
including
asset-
backed
and
mortgage
related
securities
may
be
valued
based
on
valuation
models
that
consider
the
estimated
cash
flows
of
each
tranche
of
the
entity,
establish
a
benchmark
yield
and
develop
an
estimated
tranche
specific
spread
to
the
benchmark
yield
based
on
the
unique
attributes
of
the
tranche.
The
amortized
cost
method
of
valuation
may
be
used
with
respect
to
debt
obligations
with
sixty
days
or
less
remaining
to
maturity
unless
the
Manager
determines
such
method
does
not
represent
fair
value.
Exchange-traded
funds
(“ETFs”)
and
closed-end
funds traded
on
a
recognized
securities
exchange
are
valued at
that
day’s
official
closing
price,
as
applicable,
on
the
exchange
where
the
stock
is
primarily
traded.
ETFs
and
closed-end
funds
traded
on
a
recognized
exchange
for
which
there
were
no
sales
on
that
day
may
be
valued
at
the
last
available
bid
(long
positions)
or
ask
(short
positions)
price.
Investments
in
open-end
U.S.
mutual
funds
(including
money
market
funds) are
valued
at
that
day’s
published net
asset
value
(“NAV”).
Futures
contracts
are valued
based
on
that
day’s
last
reported
settlement
or
trade price
on
the
exchange
where
the
contract
is
traded.
Forward
foreign
currency
exchange
contracts
are
valued
at
the
mean
between
the
bid
and
ask
prices
and
are
determined
as
of
the
close
of
trading
on
the
NYSE
based
on
that
day’s
prevailing
forward
exchange
rate
for
the
underlying
currencies.
Notes
to
Financial
Statements
(continued)
2024
BlackRock
Annual
Financial
Statements
Exchange-traded
options
are
valued
at
the
mean
between
the
last bid
and
ask
prices
at
the
close
of
the
options
market in
which
the
options
trade.
An
exchange-
traded
option
for
which there
is
no
mean
price
is
valued
at
the
last
bid
(long
positions)
or
ask
(short
positions)
price.
If
no
bid
or
ask
price
is
available,
the
prior
day’s
price will
be
used,
unless
it
is
determined
that
the
prior
day’s
price
no
longer
reflects
the
fair
value
of
the
option.
Over-the-counter
(“OTC”)
options
and
options
on
swaps
(“swaptions”)
are
valued
by
an
independent
pricing
service
using
a
mathematical
model,
which
incorporates
a
number
of
market
data
factors,
such
as
the
trades
and
prices
of
the
underlying
instruments.
Swap
agreements
are
valued
utilizing
quotes
received
daily
by
independent pricing
services
or
through
brokers,
which
are
derived
using
daily
swap
curves
and
models
that
incorporate
a
number
of
market
data
factors,
such
as
discounted
cash
flows,
trades
and
values
of
the
underlying
reference
instruments.
Generally,
trading
in
foreign
instruments
is
substantially
completed
each
day
at
various
times
prior
to
the
close
of
trading
on
the
NYSE.
Each
business
day,
the
Fund
uses
current
market
factors
supplied
by
independent
pricing
services
to
value
certain
foreign
instruments
(“Systematic
Fair
Value
Price”).
The
Systematic
Fair
Value
Price
is
designed
to
value
such
foreign
securities
at
fair
value
as
of
the
close
of
trading
on
the
NYSE,
which
follows
the
close
of
the
local
markets.
If
events
(e.g.,
market
volatility,
company
announcement or
a
natural
disaster)
occur
that
are
expected
to
materially
affect
the
value
of
such
investment,
or
in
the
event
that application
of
these
methods
of
valuation
results
in
a
price
for
an
investment
that
is
deemed
not
to
be
representative
of
the
market
value
of
such
investment,
or
if
a
price
is
not
available,
the
investment
will
be
valued
by
the
Valuation
Committee
in
accordance
with the
Manager's policies
and
procedures
as
reflecting
fair
value
(“Fair
Valued
Investments”).
The
fair
valuation
approaches
that
may
be
used
by
the
Valuation
Committee include
market
approach,
income
approach
and
cost
approach.
Valuation
techniques
such
as
discounted
cash
flow,
use
of
market
comparables
and
matrix
pricing
are
types
of
valuation
approaches
and
are
typically
used
in
determining
fair
value.
When
determining
the
price
for
Fair
Valued
Investments,
the
Valuation
Committee
seeks
to
determine
the
price
that
the
Fund
might
reasonably
expect
to
receive
or
pay
from
the
current
sale
or
purchase
of
that
asset
or
liability
in
an
arm’s-length
transaction.
Fair
value
determinations
shall
be
based
upon
all
available
factors
that
the
Valuation
Committee
deems
relevant
and
consistent
with
the
principles
of
fair
value
measurement.
For
investments
in
equity
or
debt
issued
by
privately
held
companies
or
funds
(“Private
Company”
or
collectively,
the
“Private
Companies”)
and
other
Fair
Valued
Investments,
the
fair
valuation
approaches
that
are
used
by
the
Valuation
Committee
and
third-party
pricing
services
utilized
by
the
Valuation
Committee
include one
or
a
combination
of,
but
not
limited
to,
the
following
inputs.
Investments
in
series
of
preferred
stock
issued
by
Private
Companies
are
typically
valued
utilizing
market
approach
in
determining
the
enterprise
value
of
the
company.
Such
investments
often
contain
rights
and
preferences
that
differ
from
other
series
of
preferred
and
common
stock
of
the
same
issuer.
Enterprise
valuation
techniques
such
as
an
option
pricing
model
(“OPM”),
a
probability
weighted
expected
return
model
(“PWERM”),
current
value
method or
a
hybrid
of
those
techniques
are
used
as
deemed
appropriate
under
the
circumstances.
The
use
of these
valuation techniques
involves
a
determination
of
the
exit
scenarios
of
the
investment
in
order
to
appropriately
allocate
the
enterprise
value
of
the
company
among
the
various
parts
of
its
capital
structure.
The
Private
Companies
are
not
subject
to
the
public
company
disclosure,
timing,
and
reporting
standards
applicable
to other
investments
held
by the
Fund.
Typically,
the
most
recently
available
information
by
a
Private
Company
is
as
of
a
date
that
is
earlier
than
the
date the
Fund
is
calculating
its
NAV.
This
factor
may
result
in
a
difference
between
the
value
of
the
investment
and
the
price the
Fund
could
receive
upon
the
sale
of
the
investment.
Fair
Value
Hierarchy:
Various
inputs
are
used
in
determining
the
fair
value
of
financial
instruments.
These
inputs
to
valuation
techniques
are
categorized
into
a
fair
value
hierarchy
consisting
of
three
broad
levels
for
financial reporting purposes
as
follows:
Level
1
—
Unadjusted
price
quotations
in
active
markets/exchanges
for
identical
assets
or
liabilities
that
the
Fund
has
the
ability
to
access;
Level
2
—
Other
observable
inputs
(including,
but
not
limited
to,
quoted
prices
for
similar
assets
or
liabilities
in
markets
that
are
active,
quoted
prices
for
identical
or
similar
assets
or
liabilities
in
markets
that
are
not
active,
inputs
other
than
quoted
prices
that
are
observable
for
the
assets
or
liabilities
(such
as
interest
rates,
yield
curves,
volatilities,
prepayment
speeds,
loss
severities,
credit
risks
and
default
rates)
or
other
market–corroborated
inputs);
and
Level
3 —
Unobservable
inputs
based
on
the
best
information
available
in
the
circumstances,
to
the
extent
observable
inputs
are
not
available
(including
the
Valuation
Committee’s
assumptions
used
in
determining
the
fair
value
of
financial
instruments).
The
hierarchy
gives
the
highest
priority
to
unadjusted
quoted
prices
in
active
markets
for
identical
assets
or
liabilities
(Level
1
measurements)
and
the
lowest
priority
to
unobservable
inputs
(Level
3
measurements).
Accordingly,
the
degree
of
judgment
exercised
in
determining
fair
value
is
greatest
for
instruments
categorized
in
Level
3.
The
inputs
used
to
measure
fair
value
may
fall
into
different
levels
of
the
fair
value
hierarchy.
In
such
cases,
for
disclosure
purposes,
the
fair
value
hierarchy
classification
is
determined
based
on
the
lowest
level
input
that
is
significant
to
the
fair
value
measurement
in
its
entirety. Investments
classified
within
Level
3
have
significant
unobservable
inputs
used
by
the
Valuation
Committee
in
determining
the
price
for
Fair
Valued
Investments.
Level
3
investments
include
equity
or
debt
issued
by
Private
Companies
that
Standard
Inputs
Generally
Considered
By
The
Valuation
Committee
And
Third-Party
Pricing
Services
Market
approach
........................
(
i
)
recent
market
transactions,
including
subsequent
rounds
of
financing,
in
the
underlying
investment
or
comparable
issuers;
(ii) recapitalizations
and
other
transactions
across
the
capital
structure;
and
(iii)
market
multiples
of
comparable
issuers.
Income
approach
..........................
(
i
)
future
cash
flows
discounted
to
present
and
adjusted
as
appropriate
for
liquidity,
credit,
and/or
market
risks;
(ii) quoted
prices
for
similar
investments
or
assets
in
active
markets;
and
(iii)
other
risk
factors,
such
as
interest
rates,
yield
curves,
volatilities,
prepayment
speeds,
loss
severities,
credit
risks,
recovery
rates,
liquidation
amounts
and/or
default
rates.
Cost
approach
............................
(
i
)
audited
or
unaudited
financial
statements,
investor
communications
and
financial
or
operational
metrics
issued
by
the
Private
Company;
(ii) changes
in
the
valuation
of
relevant
indices
or
publicly
traded
companies
comparable
to
the
Private
Company;
(iii)
relevant
news
and
other
public
sources;
and
(iv)
known
secondary
market
transactions
in
the
Private
Company’s
interests
and
merger
or
acquisition
activity
in
companies
comparable
to
the
Private
Company.
Notes
to
Financial
Statements
(continued)
Notes
to
Financial
Statements
may
not
have
a
secondary
market
and/or
may
have
a
limited
number
of
investors.
The
categorization
of
a
value
determined
for
financial
instruments
is
based
on
the
pricing
transparency
of
the financial
instruments
and
is
not
necessarily
an
indication
of
the
risks
associated
with
investing
in
those
securities.
4.
SECURITIES
AND
OTHER
INVESTMENTS
Asset-Backed
and
Mortgage-Backed
Securities:
Asset-backed
securities
are
generally
issued
as
pass-through
certificates
or
as
debt
instruments.
Asset-backed
securities
issued
as
pass-through
certificates
represent
undivided
fractional
ownership
interests
in
an
underlying
pool
of
assets.
Asset-backed
securities
issued
as
debt
instruments,
which
are
also
known
as
collateralized
obligations,
are
typically
issued
as
the
debt
of
a
special
purpose
entity
organized
solely
for
the
purpose
of
owning
such
assets
and
issuing
such
debt.
Asset-backed
securities
are
often
backed
by
a
pool
of
assets
representing
the
obligations
of
a
number
of
different
parties.
The
yield
characteristics
of
certain
asset-backed
securities
may
differ
from
traditional
debt
securities.
One
such
major
difference
is
that
all
or
a
principal
part
of
the
obligations
may
be
prepaid
at
any
time
because
the
underlying
assets
(i.e.,
loans)
may
be
prepaid
at
any
time.
As
a
result,
a
decrease
in
interest
rates
in
the
market
may
result
in
increases
in
the
level
of
prepayments
as
borrowers,
particularly
mortgagors,
refinance
and
repay
their
loans.
An
increased
prepayment
rate
with
respect
to
an
asset-backed
security
will
have
the
effect
of
shortening
the
maturity
of
the
security.
In
addition,
a
fund
may
subsequently
have
to
reinvest
the
proceeds
at
lower
interest
rates.
If
a
fund
has
purchased
such
an
asset-backed
security
at
a
premium,
a
faster
than
anticipated
prepayment
rate
could
result
in
a
loss
of
principal
to
the
extent
of
the
premium
paid.
For
mortgage
pass-through
securities
(the
“Mortgage
Assets”)
there
are
a
number
of
important
differences
among
the
agencies
and
instrumentalities
of
the
U.S.
Government
that
issue
mortgage-related
securities
and
among
the
securities
that
they
issue.
For
example,
mortgage-related
securities
guaranteed
by
Ginnie
Mae
are
guaranteed
as
to
the
timely
payment
of
principal
and
interest
by
Ginnie
Mae
and
such
guarantee
is
backed
by
the
full
faith
and
credit
of
the
United
States.
However,
mortgage-related
securities
issued
by
Freddie
Mac
and
Fannie
Mae,
including
Freddie
Mac
and
Fannie
Mae
guaranteed
mortgage
pass-through
certificates,
which
are
solely
the
obligations
of
Freddie
Mac
and
Fannie
Mae,
are
not
backed
by
or
entitled
to
the
full
faith
and
credit
of
the
United
States,
but
are
supported
by
the
right
of
the
issuer
to
borrow
from
the
U.S.
Treasury.
Non-agency
mortgage-backed
securities
are
securities
issued
by
non-governmental
issuers
and
have
no
direct
or
indirect
government
guarantees
of
payment
and
are
subject
to
various
risks.
Non-agency
mortgage
loans
are
obligations
of
the
borrowers
thereunder
only
and
are
not
typically
insured
or
guaranteed
by
any
other
person
or
entity.
The
ability
of
a
borrower
to
repay
a
loan
is
dependent
upon
the
income
or
assets
of
the
borrower.
A
number
of
factors,
including
a
general
economic
downturn,
acts
of
God,
terrorism,
social
unrest
and
civil
disturbances,
may
impair
a
borrower’s
ability
to
repay
its
loans.
Collateralized
Debt
Obligations:
Collateralized
debt
obligations
(“CDOs”),
including
collateralized
bond
obligations
(“CBOs”)
and
collateralized
loan
obligations
(“CLOs”),
are
types
of
asset-backed
securities.
A
CDO
is
an
entity
that
is
backed
by
a
diversified
pool
of
debt
securities
(CBOs)
or
syndicated
bank
loans
(CLOs).
The
cash
flows
of
the
CDO
can
be
split
into
multiple
segments,
called
“tranches,”
which
will
vary
in
risk
profile
and
yield.
The
riskiest
segment
is
the
subordinated
or
“equity”
tranche.
This
tranche
bears
the
greatest
risk
of
defaults
from
the
underlying
assets
in
the
CDO
and
serves
to
protect
the
other,
more
senior,
tranches
from
default
in
all
but
the
most
severe
circumstances.
Since
it
is
shielded
from
defaults
by
the
more
junior
tranches,
a
“senior”
tranche
will
typically
have
higher
credit
ratings
and
lower
yields
than
their
underlying
securities,
and
often
receive
investment
grade
ratings
from
one
or
more
of
the
nationally
recognized
rating
agencies.
Despite
the
protection
from
the
more
junior
tranches,
senior
tranches
can
experience
substantial
losses
due
to
actual
defaults,
increased
sensitivity
to
future
defaults
and
the
disappearance
of
one
or
more
protecting
tranches
as
a
result
of
changes
in
the
credit
profile
of
the
underlying
pool
of
assets.
Multiple
Class
Pass-Through
Securities:
Multiple
class
pass-through
securities,
including
collateralized
mortgage
obligations
(“CMOs”)
and
commercial
mortgage-backed
securities,
may
be
issued
by
Ginnie
Mae,
U.S.
Government
agencies
or
instrumentalities
or
by
trusts
formed
by
private
originators
of,
or
investors
in,
mortgage
loans.
In
general,
CMOs
are
debt
obligations
of
a
legal
entity
that
are
collateralized
by
a
pool
of
residential
or
commercial
mortgage
loans
or
Mortgage
Assets.
The
payments
on
these
are
used
to
make
payments
on
the
CMOs
or
multiple
pass-through
securities.
Multiple
class
pass-through
securities
represent
direct
ownership
interests
in
the
Mortgage
Assets.
Classes
of
CMOs
include
interest
only
(“IOs”),
principal
only
(“POs”),
planned
amortization
classes
and
targeted
amortization
classes.
IOs
and
POs
are
stripped
mortgage-backed
securities
representing
interests
in
a
pool
of
mortgages,
the
cash
flow
from
which
has
been
separated
into
interest
and
principal
components.
IOs
receive
the
interest
portion
of
the
cash
flow
while
POs
receive
the
principal
portion.
IOs
and
POs
can
be
extremely
volatile
in
response
to
changes
in
interest
rates.
As
interest
rates
rise
and
fall,
the
value
of
IOs
tends
to
move
in
the
same
direction
as
interest
rates.
POs
perform
best
when
prepayments
on
the
underlying
mortgages
rise
since
this
increases
the
rate
at
which
the
principal
is
returned
and
the
yield
to
maturity
on
the
PO.
When
payments
on
mortgages
underlying
a
PO
are
slower
than
anticipated,
the
life
of
the
PO
is
lengthened
and
the
yield
to
maturity
is
reduced.
If
the
underlying
Mortgage
Assets
experience
greater
than
anticipated
prepayments
of
principal,
a
fund’s
initial
investment
in
the
IOs
may
not
fully
recoup.
Zero-Coupon
Bonds:
Zero-coupon
bonds
are
normally
issued
at
a
significant
discount
from
face
value
and
do
not
provide
for
periodic
interest
payments.
These
bonds
may
experience
greater
volatility
in
market
value
than
other
debt
obligations
of
similar
maturity
which
provide
for
regular
interest
payments.
Capital
Securities
and
Trust
Preferred
Securities:
Capital
securities,
including
trust
preferred
securities,
are
typically
issued
by
corporations,
generally
in
the
form
of
interest-bearing
notes
with
preferred
securities
characteristics.
In
the
case
of
trust
preferred
securities,
an
affiliated
business
trust
of
a
corporation
issues
these
securities,
generally
in
the
form
of
beneficial
interests
in
subordinated
debentures
or
similarly
structured
securities.
The
securities
can
be
structured
with
either
a
fixed
or
adjustable
coupon
that
can
have
either
a
perpetual
or
stated
maturity
date.
For
trust
preferred
securities,
the
issuing
bank
or
corporation
pays
interest
to
the
trust,
which
is
then
distributed
to
holders
of
these
securities
as
a
dividend.
Dividends
can
be
deferred
without
creating
an
event
of
default
or
acceleration,
although
maturity
cannot
take
place
unless
all
cumulative
payment
obligations
have
been
met.
The
deferral
of
payments
does
not
affect
the
purchase
or
sale
of
these
securities
in
the
open
market.
These
securities
generally
are
rated
below
that
of
the
issuing
company’s
senior
debt
securities
and
are
freely
callable
at
the
issuer’s
option.
Preferred
Stocks:
Preferred
stock
has
a
preference
over
common
stock
in
liquidation
(and
generally
in
receiving
dividends
as
well),
but
is
subordinated
to
the
liabilities
of
the
issuer
in
all
respects.
As
a
general
rule,
the
market
value
of
preferred
stock
with
a
fixed
dividend
rate
and
no
conversion
element
varies
inversely
with
interest
rates
and
perceived
credit
risk,
while
the
market
price
of
convertible
preferred
stock
generally
also
reflects
some
element
of
conversion
value.
Because
preferred
stock
is
junior
to
debt
securities
and
other
obligations
of
the
issuer,
deterioration
in
the
credit
quality
of
the
issuer
will
cause
greater
changes
in
the
value
of
a
preferred
stock
than
in
a
more
senior
debt
security
with
similar
stated
yield
characteristics.
Unlike
interest
payments
on
debt
securities,
preferred
stock
dividends
are
payable
only
if
declared
by
the
issuer’s
board
of
directors.
Preferred
stock
also
may
be
subject
to
optional
or
mandatory
redemption
provisions.
Notes
to
Financial
Statements
(continued)
2024
BlackRock
Annual
Financial
Statements
Warrants:
Warrants
entitle
a
fund
to
purchase
a
specified
number
of
shares
of
common
stock
and
are
non-income
producing.
The
purchase
price
and
number
of
shares
are
subject
to
adjustment
under
certain
conditions
until
the
expiration
date
of
the
warrants,
if
any.
If
the
price
of
the
underlying
stock
does
not
rise
above
the
strike
price
before
the
warrant
expires,
the
warrant
generally
expires
without
any
value
and
a
fund
will
lose
any
amount
it
paid
for
the
warrant.
Thus,
investments
in
warrants
may
involve
more
risk
than
investments
in
common
stock.
Warrants
may
trade
in
the
same
markets
as
their
underlying
stock;
however,
the
price
of
the
warrant
does
not
necessarily
move
with
the
price
of
the
underlying
stock.
Floating
Rate
Loan
Interests:
Floating
rate
loan
interests
are
typically
issued
to
companies
(the
“borrower”)
by
banks,
other
financial
institutions,
or
privately
and
publicly
offered
corporations
(the
“lender”).
Floating
rate
loan
interests
are
generally
non-investment
grade,
often
involve
borrowers
whose
financial
condition
is
troubled
or
uncertain
and
companies
that
are
highly
leveraged
or
in
bankruptcy
proceedings.
In
addition,
transactions
in
floating
rate
loan
interests
may
settle
on
a
delayed
basis,
which
may
result
in
proceeds
from
the
sale
not
being
readily
available
for
a
fund
to
make
additional
investments
or
meet
its
redemption
obligations.
Floating
rate
loan
interests
may
include
fully
funded
term
loans
or
revolving
lines
of
credit.
Floating
rate
loan
interests
are
typically
senior
in
the
corporate
capital
structure
of
the
borrower.
Floating
rate
loan
interests
generally
pay
interest
at
rates
that
are
periodically
determined
by
reference
to
a
base
lending
rate
plus
a
premium.
Since
the
rates
reset
only
periodically,
changes
in
prevailing
interest
rates
(and
particularly
sudden
and
significant
changes)
can
be
expected
to
cause
some
fluctuations
in
the
NAV
of
a
fund
to
the
extent
that
it
invests
in
floating
rate
loan
interests.
The
base
lending
rates
are
generally
the
lending
rate
offered
by
one
or
more
European
banks,
such
as
the
Secured
Overnight
Financing
Rate
(“SOFR”),
the
prime
rate
offered
by
one
or
more
U.S.
banks
or
the
certificate
of
deposit
rate.
Floating
rate
loan
interests
may
involve
foreign
borrowers,
and
investments
may
be
denominated
in
foreign
currencies.
These
investments
are
treated
as
investments
in
debt
securities
for
purposes
of
a
fund’s
investment
policies.
When
a
fund
purchases
a
floating
rate
loan
interest,
it
may
receive
a
facility
fee
and
when
it
sells
a
floating
rate
loan
interest,
it
may
pay
a
facility
fee.
On
an
ongoing
basis,
a
fund
may
receive
a
commitment
fee
based
on
the
undrawn
portion
of
the
underlying
line
of
credit
amount
of
a
floating
rate
loan
interest.
Facility
and
commitment
fees
are
typically
amortized
to
income
over
the
term
of
the
loan
or
term
of
the
commitment,
respectively.
Consent
and
amendment
fees
are
recorded
to
income
as
earned.
Prepayment
penalty
fees,
which
may
be
received
by
a
fund
upon
the
prepayment
of
a
floating
rate
loan
interest
by
a
borrower,
are
recorded
as
realized
gains.
A
fund
may
invest
in
multiple
series
or
tranches
of
a
loan.
A
different
series
or
tranche
may
have
varying
terms
and
carry
different
associated
risks.
Floating
rate
loan
interests
are
usually
freely
callable
at
the
borrower’s
option.
A
fund
may
invest
in
such
loans
in
the
form
of
participations
in
loans
(“Participations”)
or
assignments
(“Assignments”)
of
all
or
a
portion
of
loans
from
third
parties.
Participations
typically
will
result
in
a
fund
having
a
contractual
relationship
only
with
the
lender,
not
with
the
borrower.
A
fund
has
the
right
to
receive
payments
of
principal,
interest
and
any
fees
to
which
it
is
entitled
only
from
the
lender
selling
the
Participation
and
only
upon
receipt
by
the
lender
of
the
payments
from
the
borrower.
In
connection
with
purchasing
Participations,
a
fund
generally
will
have
no
right
to
enforce
compliance
by
the
borrower
with
the
terms
of
the
loan
agreement,
nor
any
rights
of
offset
against
the
borrower.
A
fund
may
not
benefit
directly
from
any
collateral
supporting
the
loan
in
which
it
has
purchased
the
Participation.
As
a
result,
a
fund
assumes
the
credit
risk
of
both
the
borrower
and
the
lender
that
is
selling
the
Participation.
A
fund’s
investment
in
loan
participation
interests
involves
the
risk
of
insolvency
of
the
financial
intermediaries
who
are
parties
to
the
transactions.
In
the
event
of
the
insolvency
of
the
lender
selling
the
Participation,
a
fund
may
be
treated
as
a
general
creditor
of
the
lender
and
may
not
benefit
from
any
offset
between
the
lender
and
the
borrower.
Assignments
typically
result
in
a
fund
having
a
direct
contractual
relationship
with
the
borrower,
and
a
fund
may
enforce
compliance
by
the
borrower
with
the
terms
of
the
loan
agreement.
In
connection
with
floating
rate
loan
interests,
the
Fund
may
also
enter
into
unfunded
floating
rate
loan
interests
(“commitments”).
In
connection
with
these
commitments,
the
fund
earns
a
commitment
fee,
typically
set
as
a
percentage
of
the
commitment
amount.
Such
fee
income,
which
is
included
in
interest
income
in
the
Statement
of
Operations,
is
recognized
ratably
over
the
commitment
period.
Unfunded
floating
rate
loan
interests
are
marked-to-market
daily,
and
any
unrealized
appreciation
(depreciation)
is
included
in
the
Statement
of
Assets
and
Liabilities
and
Statement
of
Operations.
As
of
period
end, the
Fund
had
the
following
unfunded
floating
rate
loan
interests:
Borrowed
Bond
Agreements:
Repurchase
agreements
may
be
referred
to
as
borrowed
bond
agreements
when
entered
into
in
connection
with
short
sales
of
bonds.
In
a
borrowed
bond
agreement,
a
fund
borrows
a
bond
from
a
counterparty
in
exchange
for
cash
collateral.
The
agreement
contains
a
commitment
that
the
security
and
the
cash
will
be
returned
to
the
counterparty
and
a
fund
at
a
mutually
agreed
upon
date.
Certain
agreements
have
no
stated
maturity
and
can
be
terminated
by
either
party
at
any
time.
Earnings
on
cash
collateral
and
compensation
to
the
lender
of
the
bond
are
based
on
agreed
upon
rates
between
a
fund
and
the
counterparty.
The
value
of
the
underlying
cash
collateral
approximates
the
market
value
and
accrued
interest
of
the
borrowed
bond.
To
the
extent
that
a
borrowed
bond
transaction
exceeds
one
business
day,
the
value
of
the
cash
collateral
in
the
possession
of
the
counterparty
is
monitored
on
a
daily
basis
to
ensure
the
adequacy
of
the
collateral.
As
the
market
value
of
the
borrowed
bond
changes,
the
cash
collateral
is
periodically
increased
or
decreased
with
a
frequency
and
in
amounts
prescribed
in
the
borrowed
bond
agreement.
A
fund
may
also
experience
delays
in
gaining
access
to
the
collateral.
Reverse
Repurchase
Agreements:
Reverse
repurchase
agreements
are
agreements
with
qualified
third-party
broker
dealers
in
which
a
fund
sells
securities
to
a
bank
or
broker-dealer
and
agrees
to
repurchase
the
same
securities
at
a
mutually
agreed
upon
date
and
price.
A
fund
receives
cash
from
the
sale
to
use
for
other
investment
purposes.
During
the
term
of
the
reverse
repurchase
agreement,
a
fund
continues
to
receive
the
principal
and
interest
payments
on
the
securities
sold.
Certain
agreements
have
no
stated
maturity
and
can
be
terminated
by
either
party
at
any
time.
Interest
on
the
value
of
the
reverse
repurchase
agreements
issued
and
outstanding
is
based
upon
competitive
market
rates
determined
at
the
time
of
issuance.
A
fund
may
utilize
reverse
repurchase
agreements
when
it
is
anticipated
that
the
interest
income
to
be
earned
from
the
investment
of
the
proceeds
of
the
transaction
is
greater
than
the
interest
expense
of
the
transaction.
Reverse
repurchase
agreements
involve
leverage
risk.
If
a
fund
suffers
a
loss
on
its
investment
of
the
transaction
proceeds
from
a
reverse
repurchase
agreement,
a
fund
would
still
be
required
to
pay
the
full
repurchase
price.
Further,
a
fund
remains
subject
to
the
risk
that
the
market
value
of
the
securities
repurchased
declines
below
the
repurchase
price.
In
such
cases,
a
fund
would
be
required
to
return
a
portion
of
the
cash
received
from
the
transaction
or
provide
additional
securities
to
the
counterparty.
Borrower
Par
Commitment
Amount
Value
Unrealized
Appreciation
(Depreciation)
CoreWeave
Compute
Acquisition
Co.
II
LLC,
Delayed
Draw
Term
Loan
..............
$
1,437,825
$
1,416,258
$
1,418,127
$
1,869
Helios
Service
Partners
LLC,
Delayed
Draw
2nd
Lien
Term
Loan
..................
37,794
37,794
37,844
50
Seashell
Bidco
SL,
Facility
Term
Loan
B
..................................
221,175
238,570
239,366
796
$
2,715
Notes
to
Financial
Statements
(continued)
Notes
to
Financial
Statements
Cash
received
in
exchange
for
securities
delivered
plus
accrued
interest
due
to
the
counterparty
is
recorded
as
a
liability
in
the
Statement
of
Assets
and
Liabilities
at
face
value
including
accrued
interest.
Due
to
the
short-term
nature
of
the
reverse
repurchase
agreements,
face
value
approximates
fair
value.
Interest
payments
made
by
a
fund
to
the
counterparties
are
recorded
as
a
component
of
interest
expense
in
the
Statement
of
Operations.
In
periods
of
increased
demand
for
the
security,
a
fund
may
receive
a
fee
for
the
use
of
the
security
by
the
counterparty,
which
may
result
in
interest
income
to
a
fund.
For
the
year
ended
July
31,
2024,
the
average
daily
amount
of
reverse
repurchase
agreements outstanding and
the
weighted
average
interest
rate
for
the
Fund
were
$313,086
and
4.82%,
respectively.
Borrowed
bond
agreements
and
reverse
repurchase
transactions are
entered
into
by
a
fund
under
Master
Repurchase
Agreements
(each,
an
“MRA”),
which
permit
a
fund,
under
certain
circumstances,
including
an
event
of
default
(such
as
bankruptcy
or
insolvency),
to
offset
payables
and/or
receivables
under
the
MRA
with
collateral
held
and/or
posted
to
the
counterparty
and
create
one
single
net
payment
due
to
or
from
a
fund.
With
borrowed
bond
agreements
and
reverse
repurchase
transactions,
typically
a
fund
and
counterparty
under
an
MRA
are
permitted
to
sell,
re-pledge,
or
use
the
collateral
associated
with
the
transaction.
Bankruptcy
or
insolvency
laws
of
a
particular
jurisdiction
may
impose
restrictions
on
or
prohibitions
against
such
a
right
of
offset
in
the
event
of
the
MRA
counterparty’s
bankruptcy
or
insolvency.
Pursuant
to
the
terms
of
the
MRA,
a
fund
receives
or
posts
securities
and
cash
as
collateral
with
a
market
value
in
excess
of
the
repurchase
price
to
be
paid
or
received
by
a
fund
upon
the
maturity
of
the
transaction.
Upon
a
bankruptcy
or
insolvency
of
the
MRA
counterparty,
a
fund
is
considered
an
unsecured
creditor
to
the
extent
that
the
aggregate
market
value
of
the
cash
collateral
and
the
purchased
securities
it
holds
is
less
than
the
repurchase
price.
As
such,
the
receipt
of
any
shortfall
or
any
closeout
amount
owed
to
a
fund
upon
termination
of
the
MRA
could
be
delayed
or
not
received
at
all.
As
of
period
end,
the
following
table
is
a
summary
of
the
Fund’s
open
borrowed
bond
agreements by
counterparty
which
are
subject
to
offset
under
an MRA
on
a
net
basis:
Short
Sale
Transactions:
In
short
sale
transactions,
a
fund
sells
a
security
it
does
not
hold
in
anticipation
of
a
decline
in
the
market
price
of
that
security.
When
a
fund
makes
a
short
sale,
it
will
borrow
the
security
sold
short
(borrowed
bond)
and
deliver
the
fixed-income
security
to
the
counterparty
to
which
it
sold
the
security
short.
An
amount
equal
to
the
proceeds
received
by
a
fund
is
reflected
as
an
asset
and
an
equivalent
liability.
The
amount
of
the
liability
is
subsequently
marked-to-market
to
reflect
the
market
value
of
the
short
sale.
A
fund
is
required
to
repay
the
counterparty
interest
on
the
security
sold
short,
which,
if
applicable,
is
included
in
interest
expense
in
the
Statement
of
Operations.
A
fund
is
exposed
to
market
risk
based
on
the
amount,
if
any,
that
the
market
value
of
the
security
increases
beyond
the
market
value
at
which
the
position
was
sold.
Thus,
a
short
sale
of
a
security
involves
the
risk
that
instead
of
declining,
the
price
of
the
security
sold
short
will
rise.
The
short
sale
of
securities
involves
the
possibility
of
an
unlimited
loss
since
there
is
an
unlimited
potential
for
the
market
price
of
the
security
sold
short
to
increase.
A
gain
is
limited
to
the
price
at
which
a
fund
sold
the
security
short.
A
realized
gain
or
loss
is
recognized
upon
the
termination
of
a
short
sale
if
the
market
price
is
either
less
than
or
greater
than
the
proceeds
originally
received.
There
is
no
assurance
that
a
fund
will
be
able
to
close
out
a
short
position
at
a
particular
time
or
at
an
acceptable
price.
In
short
sale
transactions,
a
fund
sells
a
security
it
does
not
hold
in
anticipation
of
a
decline
in
the
market
price
of
that
security.
When
a
fund
makes
a
short
sale,
it
will
borrow
the
security
sold
short
from
a
broker/counterparty
and
deliver
the
security
to
the
purchaser. To
close
out
a
short
position,
a
fund
delivers
the
same
security
to
the
broker
and
records
a
liability
to
reflect
the
obligation
to
return
the
security
to
the
broker. The
amount
of
the
liability
is
subsequently
marked-to-market
to
reflect
the
market
value
of
the
short
sale. A
fund
maintains
a
segregated
account
of
securities
or
deposits
cash
with
the
broker-dealer
as
collateral
for
the
short
sales.
Cash
deposited
with
the
broker
is
recorded
as
an
asset
in
the
Statement
of
Assets
and
Liabilities.
Securities
segregated
as
collateral
are
denoted
in
the
Schedule
of
Investments. A
fund
may
pay
a
financing
fee
for
the
difference
between
the
market
value
of
the
short
position
and
the
cash
collateral
deposited
with
the
broker
which
would
be
recorded
as
interest
expense.
A
fund
is
required
to
repay
the
counterparty
any
dividends
received
on
the
security
sold
short,
which,
if
applicable,
is
shown
as
dividend
expense
in
the
Statement
of
Operations.
A
fund
may
pay
a
fee
on
the
assets
borrowed
from
the
counterparty,
which,
if
applicable,
is
shown
as
broker
fees
and
expenses
on
short
sales
in
the
Statement
of
Operations.
A
fund
is
exposed
to
market
risk
based
on
the
amount,
if
any,
that
the
market
value
of
the
security
increases
beyond
the
market
value
at
which
the
position
was
sold.
Thus,
a
short
sale
of
a
security
involves
the
risk
that
instead
of
declining,
the
price
of
the
security
sold
short
will
rise.
The
short
sale
of
securities
involves
the
possibility
of
an
unlimited
loss
since
there
is
an
unlimited
potential
for
the
market
price
of
the
security
sold
short
to
increase.
A
gain
is
limited
to
the
price
at
which
a
fund
sold
the
security
short.
A
realized
gain
or
loss
is
recognized
upon
the
termination
of
a
short
sale
if
the
market
price
is
either
less
than
or
greater
than
the
proceeds
originally
received.
There
is
no
assurance
that
a
fund
will
be
able
to
close
out
a
short
position
at
a
particular
time
or
at
an
acceptable
price.
Counterparty
Borrowed
Bond
Agreements
(a)
Borrowed
Bonds
at
Value
including
Accrued
Interest
(b)
Exposure
Due
(to)/from
Counterparty
before
Collateral
Non-Cash
Collateral
Received
Cash
Collateral
Received
Non-Cash
Collateral
Pledged
Including
Accrued
Interest
Cash
Collateral
Pledged
Net
Collateral
(Received)/
Pledged
Net
Exposure
Due
(to)/from
Counterparty
(c)
Barclays
Bank
plc
..............
$
10,199,814
$
(10,495,442)
$
(295,628)
$
—
$
—
$
—
$
—
$
—
$
(295,628)
Barclays
Capital,
Inc.
............
234,574
(237,387)
(2,813)
—
—
—
—
—
(2,813)
BNP
Paribas
SA
...............
4,119,646
(4,156,488)
(36,842)
—
—
—
—
—
(36,842)
BofA
Securities,
Inc.
.............
2,639,250
(2,617,430)
21,820
—
—
—
—
—
21,820
Goldman
Sachs
&
Co.
LLC
........
327,355
(331,835)
(4,480)
—
—
—
—
—
(4,480)
Goldman
Sachs
International
.......
1,179,770
(1,184,060)
(4,290)
—
—
—
—
—
(4,290)
J.P.
Morgan
Securities
plc
.........
9,536,108
(9,589,953)
(53,845)
—
—
—
—
—
(53,845)
RBC
Capital
Markets
LLC
.........
1,169,500
(1,147,679)
21,821
—
—
—
—
—
21,821
RBC
Europe
Ltd.
...............
1,179,770
(1,184,060)
(4,290)
—
—
—
—
—
(4,290)
TD
Securities
(USA)
LLC
.........
289,188
(291,928)
(2,740)
—
—
—
—
—
(2,740)
$
30,874,975
$
(31,236,262)
$
(361,287)
$
—
$
—
$
—
$
—
$
—
$
(361,287)
...........................................
(a)
Included
in
Investments
at
value-unaffiliated
in
the
Statement
of
Assets
and
Liabilities.
(b)
Includes
accrued
interest
on
borrowed
bonds
in
the
amount
of
$474,180
which
is
included
in
interest
expense
payable
in
the
Statement
of
Assets
and
Liabilities.
(c)
Net
exposure
represents
the
net
receivable
(payable)
that
would
be
due
from/to
the
counterparty
in
the
event
of
default.
Notes
to
Financial
Statements
(continued)
2024
BlackRock
Annual
Financial
Statements
5.
Derivative
Financial
Instruments
The
Fund
engages
in
various
portfolio
investment
strategies
using
derivative
contracts
both
to
increase
the
returns
of
the
Fund
and/or
to
manage
its
exposure
to
certain
risks
such
as
credit
risk,
equity
risk,
interest
rate
risk,
foreign
currency
exchange
rate
risk,
commodity
price
risk
or
other
risks
(e.g.,
inflation
risk).
Derivative
financial
instruments
categorized
by
risk
exposure
are
included
in
the
Schedule
of
Investments.
These
contracts
may
be
transacted
on
an
exchange or
OTC.
Futures
Contracts:
Futures
contracts
are
purchased
or
sold
to
gain
exposure
to,
or
manage
exposure
to,
changes
in
interest
rates
(interest
rate
risk)
and
changes
in
the
value
of
equity
securities
(equity
risk)
or
foreign
currencies
(foreign
currency
exchange
rate
risk)
.
Futures
contracts
are
exchange-traded agreements
between
the
Fund
and
a
counterparty
to
buy
or
sell
a
specific
quantity
of
an
underlying
instrument
at
a
specified
price
and
on
a
specified
date.
Depending
on
the
terms
of
a
contract,
it
is
settled
either
through
physical
delivery
of
the
underlying
instrument
on
the
settlement
date
or
by
payment
of
a
cash
amount
on
the
settlement
date.
Upon
entering
into
a
futures
contract,
the
Fund
is
required
to
deposit
initial
margin
with
the
broker
in
the
form
of
cash
or
securities
in
an
amount
that
varies
depending
on
a
contract’s
size
and
risk
profile.
The
initial
margin
deposit
must
then
be
maintained
at
an
established
level
over
the
life
of
the
contract.
Amounts
pledged,
which
are
considered
restricted,
are
included
in
cash
pledged
for
futures
contracts
in
the Statement
of
Assets
and
Liabilities.
Securities
deposited
as
initial
margin
are
designated
in
the
Schedule
of
Investments
and
cash
deposited,
if
any, are
shown
as
cash
pledged
for
futures
contracts
in
the
Statement
of
Assets
and
Liabilities.
Pursuant
to
the
contract,
the
Fund
agrees
to
receive
from
or
pay
to
the
broker
an
amount
of
cash
equal
to
the
daily
fluctuation
in
market
value
of
the
contract
(“variation
margin”).
Variation
margin
is
recorded
as
unrealized
appreciation
(depreciation)
and,
if
any,
shown
as
variation
margin
receivable
(or
payable)
on
futures
contracts
in
the
Statement
of
Assets
and
Liabilities.
When
the
contract
is
closed,
a
realized
gain
or
loss
is
recorded
in
the
Statement
of
Operations
equal
to
the
difference
between
the
notional
amount
of
the
contract
at
the
time
it
was
opened
and
the
notional
amount
at
the
time
it
was
closed.
The
use
of
futures
contracts
involves
the
risk
of
an
imperfect
correlation
in
the
movements
in
the
price
of
futures
contracts
and
interest
rates,
foreign
currency
exchange
rates
or
underlying
assets.
Forward
Foreign
Currency
Exchange
Contracts
:
Forward
foreign
currency
exchange
contracts
are
entered
into
to
gain
or
reduce
exposure
to
foreign
currencies
(foreign
currency
exchange
rate
risk).
A
forward
foreign
currency
exchange
contract
is
an
agreement
between
two
parties
to
buy
and
sell
a
currency
at
a
set
exchange
rate
on
a
specified
date.
These
contracts
help
to
manage
the
overall
exposure
to
the
currencies
in
which
some
of
the
investments
held
by
the
Fund
are
denominated
and
in
some
cases,
may
be
used
to
obtain
exposure
to
a
particular
market.
The
contracts
are
traded
OTC
and
not
on
an
organized
exchange.
The
contract
is
marked-to-market
daily
and
the
change
in
market
value
is
recorded
as
unrealized
appreciation
(depreciation)
in
the
Statement
of
Assets
and
Liabilities.
When
a
contract
is
closed,
a
realized
gain
or
loss
is
recorded
in
the
Statement
of
Operations
equal
to
the
difference
between
the
value
at
the
time
it
was
opened
and
the
value
at
the
time
it
was
closed.
Non-deliverable
forward
foreign
currency
exchange
contracts
are
settled
with
the
counterparty
in
cash
without
the
delivery
of
foreign
currency.
The
use
of
forward
foreign
currency
exchange
contracts
involves
the
risk
that
the
value
of
a
forward
foreign
currency
exchange
contract
changes
unfavorably
due
to
movements
in
the
value
of
the
referenced
foreign
currencies,
and
such
value
may
exceed
the
amount(s)
reflected
in
the
Statement
of
Assets
and
Liabilities.
Cash
amounts
pledged
for
forward
foreign
currency
exchange
contracts
are
considered
restricted
and
are
included
in
cash
pledged
as
collateral
for
OTC
derivatives
in
the
Statement
of
Assets
and
Liabilities. The
Fund’s
risk
of
loss
from
counterparty
credit
risk
on
OTC
derivatives
is
generally
limited
to
the
aggregate
unrealized
gain
netted
against
any
collateral
held
by
the
Fund.
Options:
The
Fund
may purchase
and
write
call
and
put
options
to
increase
or
decrease
its
exposure
to
the
risks
of
underlying
instruments,
including
equity
risk,
interest
rate
risk
and/or
commodity
price
risk
and/or,
in
the
case
of
options
written,
to
generate
gains
from
options
premiums.
A
call
option
gives
the
purchaser
(holder)
of
the
option
the
right
(but
not
the
obligation)
to
buy,
and
obligates
the
seller
(writer)
to
sell
(when
the
option
is
exercised)
the
underlying
instrument
at
the
exercise
or
strike
price
at
any
time
or
at
a
specified
time
during
the
option
period.
A
put
option
gives
the
holder
the
right
to
sell
and
obligates
the
writer
to
buy
the
underlying
instrument
at
the
exercise
or
strike
price
at
any
time
or
at
a
specified
time
during
the
option
period.
Premiums
paid
on
options
purchased
and
premiums
received
on
options
written,
as
well
as
the
daily
fluctuation
in
market
value,
are
included
in
investments
at
value
–
unaffiliated
and
options
written
at
value,
respectively,
in
the
Statement
of
Assets
and
Liabilities.
When
an
instrument
is
purchased
or
sold
through
the
exercise
of
an
option,
the
premium
is
offset
against
the
cost
or
proceeds
of
the
underlying
instrument.
When
an
option
expires,
a
realized
gain
or
loss
is
recorded
in
the
Statement
of
Operations
to
the
extent
of
the
premiums
received
or
paid.
When
an
option
is
closed
or
sold,
a
gain
or
loss
is
recorded
in
the
Statement
of
Operations
to
the
extent
the
cost
of
the
closing
transaction
exceeds
the
premiums
received
or
paid.
When
the
Fund
writes
a
call
option,
such
option
is
typically
“covered,”
meaning
that
it
holds
the
underlying
instrument
subject
to
being
called
by
the
option
counterparty.
When
the
Fund
writes
a
put
option,
cash
is
segregated in
an
amount
sufficient
to
cover
the
obligation.
These
amounts,
which
are
considered
restricted,
are
included
in
cash
pledged
as
collateral
for
options
written
in
the
Statement
of
Assets
and
Liabilities.
Swaptions
–
The
Fund
may purchase
and
write
options
on
swaps
(“swaptions”)
primarily
to
preserve
a
return
or
spread
on
a
particular
investment
or
portion
of
the
Fund’s
holdings,
as
a
duration
management
technique
or
to
protect
against
an
increase
in
the
price
of
securities
it
anticipates
purchasing
at
a
later
date.
The
purchaser
and
writer
of
a
swaption
is
buying
or
granting
the
right
to
enter
into
a
previously
agreed
upon
interest
rate
or
credit
default
swap
agreement
(interest
rate
risk
and/or
credit
risk)
at
any
time
before
the
expiration
of
the
option.
In
purchasing
and
writing
options,
the
Fund
bears
the
risk
of
an
unfavorable
change
in
the
value
of
the
underlying
instrument
or
the
risk
that
it
may
not
be
able
to
enter
into
a
closing
transaction
due
to
an
illiquid
market.
Exercise
of
a
written
option
could
result
in
the
Fund
purchasing
or
selling
a
security
when
it
otherwise
would
not,
or
at
a
price
different
from
the
current
market
value.
Swaps:
Swap
contracts
are
entered
into
to
manage
exposure
to
issuers,
markets
and
securities.
Such
contracts
are
agreements
between
the
Fund
and
a
counterparty
to
make
periodic
net
payments
on
a
specified
notional
amount
or
a
net
payment
upon
termination.
Swap
agreements
are
privately
negotiated
in
the
OTC
market
and
may
be
entered
into
as
a
bilateral
contract
(“OTC
swaps”)
or
centrally
cleared
(“centrally
cleared
swaps”).
Notes
to
Financial
Statements
(continued)
Notes
to
Financial
Statements
For
OTC
swaps,
any
upfront
premiums
paid
and
any
upfront
fees
received
are
shown
as
swap
premiums
paid
and
swap
premiums
received,
respectively,
in
the
Statement
of
Assets
and
Liabilities
and
amortized
over
the
term
of
the
contract.
The
daily
fluctuation
in
market
value
is
recorded
as
unrealized
appreciation
(depreciation)
on
OTC
swaps
in
the
Statement
of
Assets
and
Liabilities.
Payments
received
or
paid
are
recorded
in
the
Statement
of
Operations
as
realized
gains
or
losses,
respectively.
When
an
OTC
swap
is
terminated,
a
realized
gain
or
loss
is
recorded
in
the
Statement
of
Operations
equal
to
the
difference
between
the
proceeds
from
(or
cost
of)
the
closing
transaction
and
the
Fund’s
basis
in
the
contract,
if
any.
Generally,
the
basis
of
the
contract
is
the
premium
received
or
paid.
In
a
centrally
cleared
swap,
immediately
following
execution
of
the
swap
contract,
the
swap
contract
is
novated
to
a
central
counterparty
(the
“CCP”)
and
the
CCP
becomes
the Fund’s
counterparty
on
the
swap.
The
Fund
is
required
to
interface
with
the
CCP
through
the
broker.
Upon
entering
into
a
centrally
cleared
swap,
the
Fund
is
required
to
deposit
initial
margin
with
the
broker
in
the
form
of
cash
or
securities
in
an
amount
that
varies
depending
on
the
size
and
risk
profile
of
the
particular
swap. Securities
deposited
as
initial
margin
are
designated
in
the
Schedule
of
Investments
and
cash
deposited
is
shown
as
cash
pledged
for
centrally
cleared
swaps
in
the
Statement
of
Assets
and
Liabilities. Amounts
pledged,
which
are
considered
restricted
cash,
are
included
in
cash
pledged
for
centrally
cleared
swaps
in
the
Statement
of
Assets
and
Liabilities.
Pursuant
to
the
contract,
the
Fund
agrees
to
receive
from
or
pay
to
the
broker
variation
margin.
Variation
margin
is
recorded
as
unrealized
appreciation
(depreciation)
and
shown
as
variation
margin
receivable
(or
payable)
on
centrally
cleared
swaps
in
the
Statement
of
Assets
and
Liabilities.
Payments
received
from
(paid
to)
the
counterparty
are
amortized
over
the
term
of
the
contract
and
recorded
as
realized
gains
(losses)
in
the
Statement
of
Operations,
including
those
at
termination.
Credit
default
swaps
—
Credit
default
swaps
are
entered
into
to
manage
exposure
to
the
market
or
certain
sectors
of
the
market,
to
reduce
risk
exposure
to
defaults
of
corporate
and/or
sovereign
issuers
or
to
create
exposure
to
corporate
and/or
sovereign
issuers
to
which
a
fund
is
not
otherwise
exposed
(credit
risk).
The
Fund
may
either
buy
or
sell
(write)
credit
default
swaps
on
single-name
issuers
(corporate
or
sovereign),
a
combination
or
basket
of
single-name
issuers
or
traded
indexes.
Credit
default
swaps
are
agreements
in
which
the
protection
buyer
pays
fixed
periodic
payments
to
the
seller
in
consideration
for
a
promise
from
the
protection
seller
to
make
a
specific
payment
should
a
negative
credit
event
take
place
with
respect
to
the
referenced
entity
(e.g.,
bankruptcy,
failure
to
pay,
obligation
acceleration,
repudiation,
moratorium
or
restructuring).
As
a
buyer,
if
an
underlying
credit
event
occurs,
the
Fund
will
either
(i)
receive
from
the
seller
an
amount
equal
to
the
notional
amount
of
the
swap
and
deliver
the
referenced
security
or
underlying
securities
comprising
the
index,
or
(ii)
receive
a
net
settlement
of
cash
equal
to
the
notional
amount
of
the
swap
less
the
recovery
value
of
the
security
or
underlying
securities
comprising
the
index.
As
a
seller
(writer),
if
an
underlying
credit
event
occurs,
the
Fund
will
either
pay
the
buyer
an
amount
equal
to
the
notional
amount
of
the
swap
and
take
delivery
of
the
referenced
security
or
underlying
securities
comprising
the
index
or
pay
a
net
settlement
of
cash
equal
to
the
notional
amount
of
the
swap
less
the
recovery
value
of
the
security
or
underlying
securities
comprising
the
index.
Total
return
swaps
—
Total
return
swaps
are
entered
into
to
obtain
exposure
to
a
security
or
market
without
owning
such
security
or
investing
directly
in
such
market
or
to
exchange
the
risk/return
of
one
security
or market
(e.g.,
fixed-income)
with
another
security
or
market
(e.g.,
equity
or
commodity
prices)
(equity
risk,
commodity
price
risk
and/or
interest
rate
risk).
Total
return
swaps
are
agreements
in
which
there
is
an
exchange
of
cash
flows
whereby
one
party
commits
to
make
payments
based
on
the
total
return
(distributions
plus
capital
gains/losses)
of
an
underlying
instrument,
or
basket
of
underlying
instruments,
in
exchange
for
fixed
or
floating
rate
interest
payments.
If
the
total
return
of
the
instrument(s)
or
index
underlying
the
transaction
exceeds
or
falls
short
of
the
offsetting
fixed
or
floating
interest
rate
obligation,
the
Fund
receives
payment
from
or
makes
a
payment
to
the
counterparty.
Certain
total
return
swaps
are
designed
to
function
as
a
portfolio
of
direct
investments
in
long
and
short
equity
positions.
This
means
that
the
Fund
has
the
ability
to
trade
in
and
out
of
these
long
and
short
positions
within
the
swap
and
will
receive
the
economic
benefits
and
risks
equivalent
to
direct
investment
in
these
positions,
subject
to
certain
adjustments
due
to
events
related
to
the
counterparty.
Benefits
and
risks
include
capital
appreciation
(depreciation),
corporate
actions
and
dividends
received
and
paid,
all
of
which
are
reflected
in
the
swap’s
market
value.
The
market
value
also
includes
interest
charges
and
credits
(“financing
fees”)
related
to
the
notional
values
of
the
long
and
short
positions
and
cash
balances
within
the
swap.
These
interest
charges
and
credits
are
based
on
a
specified
benchmark
rate
plus
or
minus
a
specified
spread
determined
based
upon
the
country
and/or
currency
of
the
positions
in
the
portfolio.
Positions
within
the
swap
and
financing
fees
are
reset
periodically.
During
a
reset,
any
unrealized
appreciation
(depreciation)
on
positions
and
accrued
financing
fees
become
available
for
cash
settlement
between
the
Fund
and
the
counterparty.
The
amounts
that
are
available
for
cash
settlement
are
recorded
as
realized
gains
or
losses
in
the
Statement
of
Operations.
Cash
settlement
in
and
out
of
the
swap
may
occur
at
a
reset
date
or
any
other
date,
at
the
discretion
of
the
Fund
and
the
counterparty,
over
the
life
of
the
agreement.
Certain
swaps
have
no
stated
expiration
and
can
be
terminated
by
either
party
at
any
time.
Interest
rate
swaps
—
Interest
rate
swaps
are
entered
into
to
gain
or
reduce
exposure
to
interest
rates
or
to
manage
duration,
the
yield
curve
or
interest
rate
(interest
rate
risk).
Interest
rate
swaps
are
agreements
in
which
one
party
pays
a
stream
of
interest
payments,
either
fixed
or
floating,
in
exchange
for
another
party’s
stream
of
interest
payments,
either
fixed
or
floating,
on
the
same
notional
amount
for
a
specified
period
of
time.
In
more
complex
interest
rate
swaps,
the
notional
principal
amount
may
decline
(or
amortize)
over
time.
Swap
transactions
involve,
to
varying
degrees,
elements
of
interest
rate,
credit
and
market
risks
in
excess
of
the
amounts
recognized
in
the
Statement
of
Assets
and
Liabilities.
Such
risks
involve
the
possibility
that
there
will
be
no
liquid
market
for
these
agreements,
that
the
counterparty
to
the
agreements
may
default
on
its
obligation
to
perform
or
disagree
as
to
the
meaning
of
the
contractual
terms
in
the
agreements,
and
that
there
may
be
unfavorable
changes
in
interest
rates
and/or
market
values
associated
with
these
transactions.
Master
Netting
Arrangements:
In
order
to
define
its
contractual
rights
and
to
secure
rights
that
will
help
it mitigate its
counterparty
risk, the
Fund
may
enter
into
an
International
Swaps
and
Derivatives
Association,
Inc.
Master
Agreement
(“ISDA
Master
Agreement”)
or
similar
agreement
with
its
derivative
contract
counterparties.
An
ISDA
Master
Agreement
is
a
bilateral
agreement
between the
Fund
and
a
counterparty
that
governs
certain
OTC
derivatives
and
typically
contains,
among
other
things,
collateral
posting
terms
and
netting
provisions
in
the
event
of
a
default
and/or
termination
event.
Under
an
ISDA
Master
Agreement, the
Fund
may,
under
certain
circumstances,
offset
with
the
counterparty
certain
derivative
financial
instruments’
payables
and/or
receivables
with
collateral
held
and/or
posted
and
create
one
single
net
payment.
The
Notes
to
Financial
Statements
(continued)
2024
BlackRock
Annual
Financial
Statements
provisions
of
the
ISDA
Master
Agreement
typically
permit
a
single
net
payment
in
the
event
of
default
including
the
bankruptcy
or
insolvency
of
the
counterparty.
However,
bankruptcy
or
insolvency
laws
of
a
particular
jurisdiction
may
impose
restrictions
on
or
prohibitions
against
the
right
of
offset
in
bankruptcy,
insolvency
or
other
events
Collateral
Requirements:
For
derivatives
traded
under
an
ISDA
Master
Agreement,
the
collateral
requirements
are
typically
calculated
by
netting
the
mark-to-market
amount
for
each
transaction
under
such
agreement
and
comparing
that
amount
to
the
value
of
any
collateral
currently
pledged
by
the
Fund(s)
and
the
counterparty.
Cash
collateral
that
has
been
pledged
to
cover
obligations
of
the
Fund
and
cash
collateral
received
from
the
counterparty,
if
any,
is
reported
separately
in
the
Statement
of
Assets
and
Liabilities
as
cash
pledged
as
collateral
and
cash
received
as
collateral,
respectively.
Non-cash
collateral
pledged
by
the
Fund,
if
any,
is
noted
in
the
Schedule
of
Investments.
Generally,
the
amount
of
collateral
due
from
or
to
a
counterparty
is
subject
to
a
certain
minimum
transfer
amount
threshold
before
a
transfer
is
required,
which
is
determined
at
the
close
of
business
of
the
Fund.
Any
additional
required
collateral
is
delivered
to/pledged
by
the
Fund
on
the
next
business
day.
Typically,
the
counterparty
is
not
permitted
to
sell,
re-pledge
or
use
cash
and
non-cash
collateral
it
receives.
The
Fund
generally
agrees
not
to
use
non-cash
collateral
that
it
receives
but
may,
absent
default
or
certain
other
circumstances
defined
in
the
underlying
ISDA
Master
Agreement,
be
permitted
to
use
cash
collateral
received.
In
such
cases,
interest
may
be
paid
pursuant
to
the
collateral
arrangement
with
the
counterparty.
To
the
extent
amounts
due
to
the
Fund
from the
counterparties
are
not
fully
collateralized, the
Fund bears
the
risk
of
loss
from
counterparty
non-performance.
Likewise,
to
the
extent
the
Fund
has
delivered
collateral
to
a
counterparty
and
stands
ready
to
perform
under
the
terms
of
its
agreement
with
such
counterparty, the
Fund bears the
risk
of
loss
from
a
counterparty
in
the
amount
of
the
value
of
the
collateral
in
the
event
the
counterparty
fails
to
return
such
collateral.
Based
on
the
terms
of
agreements,
collateral
may
not
be
required
for
all
derivative
contracts.
For
financial
reporting
purposes,
the
Fund
does
not
offset
derivative
assets
and
derivative
liabilities
that
are
subject
to
netting
arrangements,
if
any,
in
the
Statement
of
Assets
and
Liabilities.
6.
INVESTMENT
ADVISORY
AGREEMENT
AND
OTHER
TRANSACTIONS
WITH
AFFILIATES
Investment
Advisory:
The
Trust,
on
behalf
of
the
Fund,
entered
into
an
Investment
Advisory
Agreement
with
the
Manager,
the
Fund’s
investment
adviser
and
an
indirect,
wholly-owned
subsidiary
of
BlackRock,
Inc.
(“BlackRock”),
to
provide
investment
advisory
services.
The
Manager
is
responsible
for
the
management
of the
Fund’s
portfolio
and
provides
the
personnel,
facilities,
equipment
and
certain
other
services
necessary
to
the
operations
of the
Fund.
For
such
services,
the
Fund
pays
the
Manager
a
monthly
fee
at
an
annual
rate
equal
to
the
following
percentages
of
the
average
daily
value
of
the
Fund’s
net
assets:
The
Manager
entered
into
separate
sub-advisory
agreements
with
each
of
BlackRock
International
Limited
(“BIL”)
and
BlackRock
(Singapore)
Limited
(“BSL”)
(collectively,
the
“Sub-Advisers”),
each
an
affiliate
of
the
Manager.
The
Manager
pays
BIL
and
BSL
for
services
they
provide
for
that
portion
of
the
Fund
for
which
BIL
and
BSL,
respectively,
acts
as
sub-adviser,
a
monthly
fee
that
is
equal
to
a
percentage
of
the
investment
advisory
fees
paid
by
the
Fund
to
the
Manager.
Service
and
Distribution
Fees:
The
Trust
,
on behalf
of
the
Fund,
entered
into
a
Distribution
Agreement
and
a Distribution and
Service
Plan
with
BlackRock
Investments,
LLC
(“BRIL”),
an
affiliate
of
the
Manager.
Pursuant
to
the
Distribution
and
Service
Plan
and
in
accordance
with
Rule
12b-1
under
the
1940
Act,
the
Fund
pays
BRIL
ongoing
service
and
distribution
fees.
The
fees
are
accrued
daily
and
paid
monthly
at
annual
rates
based
upon
the
average
daily
net
assets
of
the
relevant
share
class
of
the
Fund
as
follows:
BRIL
and
broker-dealers,
pursuant
to
sub-agreements
with
BRIL,
provide
shareholder
servicing
and
distribution
services to
the
Fund.
The
ongoing
service and/or
distribution
fee compensates BRIL
and
each
broker-dealer
for
providing
shareholder
servicing
and/or
distribution related
services
to
shareholders.
For
the year
ended
July
31,
2024,
the
following
table
shows
the
class
specific
service
and
distribution
fees
borne
directly
by
each
share
class
of
the
Fund:
Average
Daily
Net
Assets
Investment
Advisory
Fees
First
$1
billion
.........................................................................................................
0.95%
$1
billion
-
$3
billion
.....................................................................................................
0.89
$3
billion
-
$5
billion
.....................................................................................................
0.86
$5
billion
-
$6.5
billion
....................................................................................................
0.83
$6.5
billion
-
$10
billion
...................................................................................................
0.80
Greater
than
$10
billion
...................................................................................................
0.76
Share
Class
Service
Fees
Distribution
Fees
Investor
A
.................................................................................................
0.25
%
—
%
Investor
C
.................................................................................................
0.25
0.75
Share
Class
Service
and
Distribution
Fees
—
Class
Specific
Investor
A
........................................................................................................
$
137,726
Investor
C
........................................................................................................
35,567
$
173,293
Notes
to
Financial
Statements
(continued)
Notes
to
Financial
Statements
Administration:
The
Trust,
on
behalf
of
the
Fund,
entered
into
an
Administration
Agreement
with
the
Manager,
an
indirect,
wholly-owned
subsidiary
of
BlackRock,
to
provide
administrative
services.
For
these
services,
the
Manager
receives
an
administration
fee
computed
daily
and
payable
monthly,
based
on
a
percentage
of
the
average
daily
net
assets
of
the
Fund.
The
administration
fee,
which
is
shown
as
administration
in
the
Statement
of
Operations,
is
paid
at
the
annual
rates
below.
In
addition,
the
Manager
charges
each
of
the
share
classes
an
administration
fee,
which
is
shown
as
administration —
class
specific
in
the
Statement
of
Operations,
at
an
annual
rate
of
0.015% of
the
average
daily
net
assets
of
each
respective
class.
For
the
year
ended
July
31,
2024,
the
Fund
paid
the
following
to
the
Manager
in
return
for
these
services,
which
are
included
in
administration —
class
specific
in
the
Statement
of
Operations:
Transfer
Agent:
Pursuant
to
written
agreements,
certain
financial
intermediaries,
some
of
which
may
be
affiliates,
provide
the
Fund
with
sub-accounting,
recordkeeping,
sub-transfer
agency
and
other
administrative
services
with
respect
to
servicing
of
underlying
investor
accounts.
For
these
services,
these
entities
receive
an
asset-based
fee
or
an
annual
fee
per
shareholder
account,
which
will
vary
depending
on
share
class
and/or
net
assets.
For
the
year ended July
31,
2024,
the
Fund
paid
the
following
amounts
to
affiliates
of
BlackRock
in
return
for
these
services,
which
are
included
in
transfer
agent
—
class
specific
in
the
Statement
of
Operations:
The
Manager
maintains
a
call
center
that
is
responsible
for
providing
certain
shareholder
services
to
the
Fund.
Shareholder
services
include
responding
to
inquiries
and
processing
purchases
and
sales
based
upon
instructions
from
shareholders.
For
the year
ended
July
31,
2024,
the
Fund
reimbursed
the
Manager
the
following
amounts
for
costs
incurred
in
running
the
call
center,
which
are
included
in
transfer
agent
—
class
specific
in
the
Statement
of
Operations:
For
the
year ended
July
31,
2024,
the
following
table
shows
the
class
specific
transfer
agent
fees
borne
directly
by
each
share
class
of
the
Fund:
Other
Fees:
For
the
year
ended
July
31,
2024
,
affiliates
earned
underwriting
discounts,
direct
commissions
and
dealer
concessions
on
sales
of
the Fund's
Investor
A
Shares for
a
total
of
$94
.
For
the year
ended
July
31,
2024,
affiliates
received
CDSCs
as
follows:
Expense
Limitations,
Waivers,
and
Reimbursements:
The
Manager
contractually
agreed
to
waive
its
investment
advisory
fees
by
the
amount
of
investment
advisory
fees
the
Fund
pays
to
the
Manager
indirectly
through
its
investment
in
affiliated
money
market
funds
(the
“affiliated
money
market
fund
waiver”)
through
June
30,
2025.
The
contractual
agreement
may
be
terminated
upon
90
days’
notice
by
a
majority
of
the
Independent
Trustees
,
or
by
a
vote
of
a
majority
of
the
outstanding
voting
securities
of
the
Fund.
The
amount
of
waivers
and/or
reimbursements
of
fees
and
expenses
made
pursuant
to
the
expense
limitation
described
below
will
be
reduced
by
the
amount
of
the
affiliated
money
market
fund
waiver. This
amount
is
included
in
fees
waived
and/or
reimbursed
by
the
Manager
in
the
Statement
of
Operations.
For
the
year
ended
July
31,
2024,
the
amount
waived
was
$49,821.
The
Manager
has
contractually
agreed
to
waive
its
investment
advisory
fee
with
respect
to
any
portion
of
the
Fund’s
assets
invested
in
affiliated
equity
and
fixed-income mutual
funds
and
affiliated
exchange-traded
funds
that
have
a
contractual
management
fee
through
June
30,
2025.
The
contractual
agreement
may
be
terminated
upon
90
days’
notice
by
a
majority
of
the
Independent
Trustees,
or
by
a
vote
of
a
majority
of
the
outstanding
voting
securities
of
the
Fund.
This
amount
is
included
in
fees
waived
and/
or
reimbursed
by
the
Manager
in
the
Statement
of
Operations.
For
the
year
ended
July
31,
2024,
the
Manager
waived
$251
in
investment
advisory
fees
pursuant
to
this
arrangement.
The
Manager
contractually
agreed
to
waive
and/or
reimburse
fees
or
expenses
in
order
to
limit
expenses,
excluding
interest
expense,
dividend
expense,
tax
expense,
acquired
fund
fees
and
expenses,
and
certain
other
fund
expenses,
which
constitute
extraordinary
expenses
not
incurred
in
the
ordinary
course
of
the
Fund’s
business
(“expense
limitation”).
The
expense
limitations
as
a
percentage
of
average
daily
net
assets
are
as
follows:
The
Manager
has
agreed
not
to
reduce
or
discontinue
the
contractual
expense
limitations
through
June
30,
2025,
unless
approved
by
the
Board,
including
a
majority
of
the Independent
Trustees,
or
by
a
vote
of
a
majority
of
the
outstanding
voting
securities
of the
Fund.
For
the
year ended
July
31,
2024,
there
were
no
fees
waived
and/or
reimbursed
by
the
Manager
pursuant
to
this
agreement.
Average
Daily
Net
Assets
Administration
Fees
First
$500
million
......................................................................................................
0.0425%
$500
million
-
$1
billion
..................................................................................................
0.0400
$1
billion
-
$2
billion
....................................................................................................
0.0375
$2
billion
-
$4
billion
....................................................................................................
0.0350
$4
billion
-
$13
billion
...................................................................................................
0.0325
Greater
than
$13
billion
..................................................................................................
0.0300
Institutional
Investor
A
Investor
C
Class
K
Total
Administration
fees
-
class
specific
..........................................
$
105,527
$
8,264
$
534
$
32,313
$
146,638
Institutional
.............................................................................................................
$
735
Institutional
Investor
A
Investor
C
Class
K
Total
Reimbursed
Amount
....................................................
$
1,626
$
829
$
543
$
526
$
3,524
Institutional
Investor
A
Investor
C
Class
K
Total
Transfer
agent
fees
-
class
specific
..........................................
$
680,496
$
45,734
$
3,493
$
5,336
$
735,059
Fund
Name
Investor
A
Investor
C
BlackRock
Global
Long/Short
Credit
Fund
.............................................................................
$
2,816
$
10
Institutional
Investor
A
Investor
C
Class
K
Expense
Limitations
................................................
1.20%
1.40%
2.15%
1.15%
Notes
to
Financial
Statements
(continued)
2024
BlackRock
Annual
Financial
Statements
In
addition,
these
amounts
waived
and/or
reimbursed
by
the
Manager are
included
in administration
fees
waived
by
the
Manager
—
class
specific
and
transfer
agent
fees
waived
and/or
reimbursed
by
the
Manager
—
class
specific,
respectively,
in
the
Statement
of
Operations.
For
the
year ended
July
31,
2024,
class
specific
expense
waivers
and/or
reimbursements were as
follows:
Interfund
Lending:
In
accordance
with
an
exemptive
order
(the
“Order”)
from
the
U.S.
Securities
and
Exchange
Commission
(“SEC”),
the
Fund
may
participate
in
a
joint
lending
and
borrowing
facility
for
temporary
purposes
(the
“Interfund
Lending
Program”),
subject
to
compliance
with
the
terms
and
conditions
of
the
Order,
and
to
the
extent
permitted
by
the
Fund’s
investment
policies
and
restrictions.
The
Fund
is
currently
permitted
to
borrow
and
lend
under
the
Interfund
Lending
Program.
A
lending
BlackRock
fund
may
lend
in
aggregate
up
to
15%
of
its
net
assets
but
may
not
lend
more
than
5%
of
its
net
assets
to
any
one
borrowing
fund
through
the
Interfund
Lending
Program.
A
borrowing
BlackRock
fund
may
not
borrow
through
the
Interfund
Lending
Program
or
from
any
other
source
more
than
33
1/3%
of
its
total
assets
(or
any
lower
threshold
provided
for
by
the fund’s
investment
restrictions).
If
a
borrowing
BlackRock
fund’s
total
outstanding
borrowings
exceed
10%
of
its
total
assets,
each
of
its
outstanding
interfund
loans
will
be
subject
to
collateralization
of
at
least
102%
of
the
outstanding
principal
value
of
the
loan.
All
interfund
loans
are
for
temporary
or
emergency
purposes
and
the
interest
rate
to
be
charged
will
be
the
average
of
the
highest
current
overnight
repurchase
agreement
rate
available
to
a
lending
fund
and
the
bank
loan
rate,
as
calculated
according
to
a
formula
established
by
the
Board.
During the
year
ended
July
31,
2024,
the
Fund
did
not
participate
in
the
Interfund
Lending
Program.
Trustees
and
Officers:
Certain
trustees
and/or
officers
of
the Trust are directors and/or
officers
of BlackRock
or
its
affiliates.
The
Fund
reimburses
the
Manager
for
a
portion
of
the
compensation
paid
to
the
Fund’s
Chief
Compliance
Officer,
which
is
included
in
Trustees and
Officer
in
the
Statement
of
Operations.
Other
Transactions:
During
the year
ended
July
31,
2024, the
Fund
received
a
reimbursement
of $1,118
from
an
affiliate,
which
is
included
in
payment
by
affiliate
in
the
Statements
of
Operations,
related
to
an operating
event.
7.
PURCHASES
AND
SALES
For
the
year ended
July
31,
2024,
purchases
and
sales
of
investments,
including
paydowns/payups
and
excluding
short-term
investments,
were
as
follows:
8.
INCOME
TAX
INFORMATION
It
is
the
Fund’s
policy
to
comply
with
the
requirements
of
the
Internal
Revenue
Code
of
1986,
as
amended,
applicable
to
regulated
investment
companies,
and
to
distribute
substantially
all
of
its
taxable
income
to
its
shareholders.
Therefore,
no
U.S.
federal
income
tax
provision
is
required.
The
Fund
files
U.S.
federal
and
various
state
and
local
tax
returns.
No
income
tax
returns
are
currently
under
examination.
The
statute
of
limitations
on
the
Fund’s
U.S.
federal
tax
returns
generally
remains
open
for
a
period
of
three
years
after
they
are
filed.
The
statutes
of
limitations
on
the
Fund’s
state
and
local
tax
returns
may
remain
open
for
an
additional
year
depending
upon
the
jurisdiction.
Management
has
analyzed
tax
laws
and
regulations
and
their
application
to
the Fund
as
of
July
31,
2024,
inclusive
of
the
open
tax
return
years,
and
does
not
believe
that
there
are
any
uncertain
tax
positions
that
require
recognition
of
a
tax
liability
in
the
Fund’s
financial
statements.
The
tax
character
of
distributions
paid
was
as
follows:
Share
Class
Administration
Fees
Waived
by
the
Manager
—
Class
Specific
Transfer
Agent
Fees
Waived
and/or
Reimbursed
by
the
Manager
—
Class
Specific
Institutional
....................................................................................
$
23,747
$
1,366
Investor
A
.....................................................................................
3,525
7,357
Investor
C
.....................................................................................
377
786
$
27,649
$
9,509
U.S.
Government
Securities
Other
Securities
Fund
Name
Sales
Purchases
Sales
BlackRock
Global
Long/Short
Credit
Fund
.....................................
$
10,111,777
$
981,129,460
$
1,225,645,640
Fund
Name
Year
Ended
07/31/24
Year
Ended
07/31/23
BlackRock
Global
Long/Short
Credit
Fund
Ordinary
income
...........................................................................................
$
33,131,717
$
93,000,120
Notes
to
Financial
Statements
(continued)
Notes
to
Financial
Statements
As
of
July
31,
2024,
the
tax
components
of
accumulated earnings
(loss) were
as
follows:
(a)
Amounts
available
to
offset
future
realized
capital
gains.
(b)
The
difference
between
book-basis
and
tax-basis
net
unrealized
gains
(losses)
was
attributable
primarily
to
the
tax
deferral
of
losses
on
wash
sales
and
straddles,
amortization
methods
of
premiums
on
fixed
income
securities,
the
realization
for
tax
purposes
of
unrealized
gains
(losses)
on
certain
futures
and
foreign
currency
exchange
contracts,
the
accrual
of
income
on
securities
in
default,
the
realization
for
tax
purposes
of
unrealized
gains
on
investments
in
passive
foreign
investment
companies,
the
timing
and
recognition
of
partnership
income,
accounting
for
swap
agreements,
the
deferral
of
compensation
to
Trustees
and
classification
of
investments.
As
of
July
31,
2024, gross
unrealized
appreciation
and
depreciation
based
on
cost
of
investments
(including
short
positions
and
derivatives,
if
any)
for
U.S.
federal
income
tax
purposes
were
as
follows:
9.
BANK
BORROWINGS
The
Trust,
on
behalf
of
the
Fund,
along
with
certain
other
funds
managed
by
the
Manager
and
its
affiliates
(“Participating
Funds”), is
party
to
a
364-day,
$2.40
billion
credit
agreement
with
a
group
of
lenders.
Under
this
agreement,
the
Fund
may
borrow
to
fund
shareholder
redemptions.
Excluding
commitments
designated
for
certain
individual
funds,
the
Participating
Funds,
including
the
Fund,
can
borrow
up
to
an
aggregate
commitment
amount
of
$1.75
billion
at
any
time
outstanding,
subject
to
asset
coverage
and
other
limitations
as
specified
in
the
agreement.
The
credit
agreement
has
the
following
terms:
a
fee
of
0.10%
per
annum
on
unused
commitment
amounts
and
interest
at
a
rate
equal
to
the
higher
of
(a)
Overnight
Bank
Funding
Rate
(“OBFR”)
(but,
in
any
event,
not
less
than
0.00%)
on
the
date
the
loan
is
made
plus
0.80%
per
annum,
(b)
the
Fed
Funds
rate
(but,
in
any
event,
not
less
than
0.00%)
in
effect
from
time
to
time
plus
0.80%
per
annum
on
amounts
borrowed
or
(c)
the
sum
of
(x)
Daily
Simple
SOFR
(but,
in
any
event,
not
less
than
0.00%)
on
the
date
the
loan
is
made
plus
0.10%
and
(y)
0.80%
per
annum. The
agreement
expires
in
April
2025
unless
extended
or
renewed. Prior
to
April
11,
2024,
the
aggregate
commitment
amount
was
$2.50
billion.
These
fees
were
allocated
among
such
funds
based
upon
portions
of
the
aggregate
commitment
available
to
them
and
relative
net
assets
of
Participating
Funds.
During
the
year ended
July
31,
2024,
the
Fund
did
not
borrow
under
the
credit
agreement.
10.
PRINCIPAL
RISKS
In
the
normal
course
of
business,
the
Fund
invests
in
securities
or
other
instruments
and
may
enter
into
certain
transactions,
and
such
activities
subject
the
Fund
to
various
risks,
including
among
others,
fluctuations
in
the
market
(market
risk)
or
failure
of
an
issuer
to
meet
all
of
its
obligations.
The
value
of
securities
or
other
instruments
may
also
be
affected
by
various
factors,
including,
without
limitation:
(i)
the
general
economy;
(ii)
the
overall
market
as
well
as
local,
regional
or
global
political
and/or
social
instability;
(iii)
regulation,
taxation
or
international
tax
treaties
between
various
countries;
or
(iv)
currency,
interest
rate
and
price
fluctuations.
Local,
regional
or
global
events
such
as
war,
acts
of
terrorism,
the
spread
of
infectious
illness
or
other
public
health
issues,
recessions,
or
other
events
could
have
a
significant
impact
on
the
Fund
and its
investments.
The
Fund’s
prospectus
provides
details
of
the
risks
to
which
the
Fund
is
subject.
Market Risk:
The
Fund
may
be
exposed
to
prepayment
risk,
which
is
the
risk
that
borrowers
may
exercise
their
option
to
prepay
principal
earlier
than
scheduled
during
periods
of
declining
interest
rates,
which
would
force
the
Fund
to
reinvest
in
lower
yielding
securities. The
Fund
may
also
be
exposed
to
reinvestment
risk,
which
is
the
risk
that
income
from
the
Fund’s
portfolio
will
decline
if
the Fund
invests
the
proceeds
from
matured,
traded
or
called
fixed-income
securities
at
market
interest
rates
that
are
below
the
Fund
portfolio’s
current
earnings
rate.
Valuation
Risk:
The
market
values
of
equities,
such
as
common
stocks
and
preferred
securities
or
equity
related
investments,
such
as
futures
and
options,
may
decline
due
to
general
market
conditions
which
are
not
specifically
related
to
a
particular
company.
They
may
also
decline
due
to
factors
which
affect
a
particular
industry
or
industries. The
Fund
may
invest
in
illiquid
investments.
An
illiquid
investment
is
any
investment
that the
Fund
reasonably
expects
cannot
be
sold
or
disposed
of
in
current
market
conditions
in
seven
calendar
days
or
less
without
the
sale
or
disposition
significantly
changing
the
market
value
of
the
investment. The
Fund
may
experience
difficulty
in
selling
illiquid
investments
in
a
timely
manner
at
the
price
that it
believes
the
investments
are
worth.
Prices
may
fluctuate
widely
over
short
or
extended
periods
in
response
to
company,
market
or
economic
news.
Markets
also
tend
to
move
in
cycles,
with
periods
of
rising
and
falling
prices.
This
volatility
may
cause
the
Fund’s
NAV
to
experience
significant
increases
or
decreases
over
short
periods
of
time.
If
there
is
a
general
decline
in
the
securities
and
other
markets,
the
NAV
of the
Fund
may
lose
value,
regardless
of
the
individual
results
of
the
securities
and
other
instruments
in
which the
Fund
invests.
The
price the
Fund
could
receive
upon
the
sale
of
any
particular
portfolio
investment
may
differ
from the
Fund’s
valuation
of
the
investment,
particularly
for
securities
that
trade
in
thin
or
volatile
markets
or
that
are
valued
using
a
fair
valuation
technique
or
a
price
provided
by
an
independent
pricing
service.
Changes
to
significant
unobservable
inputs
and
assumptions
(i.e.,
publicly
traded
company
multiples,
growth
rate,
time
to
exit)
due
to
the
lack
of
observable
inputs
may
significantly
impact
the
resulting
fair
value
and
therefore
the
Fund’s
results
of
operations.
As
a
result,
the
price
received
upon
the
sale
of
an
investment
may
be
less
than
the
value
ascribed
by the
Fund,
and the
Fund
could
realize
a
greater
than
expected
loss
or
lesser
than
expected
gain
upon
the
sale
of
the
investment. The
Fund’s
ability
to
value
its
investments
may
also
be
impacted
by
technological
issues
and/or
errors
by
pricing
services
or
other
third-party
service
providers.
Counterparty
Credit
Risk:
The
Fund
may
be
exposed
to
counterparty
credit
risk,
or
the
risk
that
an
entity
may
fail
to
or
be
unable
to
perform
on
its
commitments
related
to
unsettled
or
open
transactions,
including
making
timely
interest
and/or
principal
payments
or
otherwise
honoring
its
obligations.
The
Fund
manages
counterparty
credit
risk
by
entering
into
transactions
only
with
counterparties
that
the
Manager
believes
have
the
financial
resources
to
honor
their
obligations
and
by
monitoring
the
financial
stability
of
those
counterparties.
Financial
assets,
which
potentially
expose
the
Fund
to
market,
issuer
and
counterparty
credit
risks,
consist
principally
of
financial
instruments
and
Fund
Name
Undistributed
Ordinary
Income
Non-Expiring
Capital
Loss
Carryforwards
(a)
Net
Unrealized
Gains
(Losses)
(b)
Total
BlackRock
Global
Long/Short
Credit
Fund
......................................
$
34,994,785
$
(553,226,079)
$
(84,678,064)
$
(602,909,358)
Fund
Name
Tax
Cost
Gross
Unrealized
Appreciation
Gross
Unrealized
Depreciation
Net
Unrealized
Appreciation
(Depreciation)
BlackRock
Global
Long/Short
Credit
Fund
.................................
$
985,228,462
$
21,845,721
$
(96,533,885)
$
(74,688,164)
Notes
to
Financial
Statements
(continued)
2024
BlackRock
Annual
Financial
Statements
receivables
due
from
counterparties.
The
extent
of
the
Fund’s
exposure
to
market,
issuer
and
counterparty
credit
risks
with
respect
to
these
financial
assets
is
approximately
their
value
recorded
in
the
Statement
of
Assets
and
Liabilities,
less
any
collateral
held
by
the
Fund.
A
derivative
contract
may
suffer
a
mark-to-market
loss
if
the
value
of
the
contract
decreases
due
to
an
unfavorable
change
in
the
market
rates
or
values
of
the
underlying
instrument.
Losses
can
also
occur
if
the
counterparty
does
not
perform
under
the
contract.
For
OTC
options
purchased,
the
Fund
bears
the
risk
of
loss
in
the
amount
of
the
premiums
paid
plus
the
positive
change
in
market
values
net
of
any
collateral
held
by
the
Fund
should
the
counterparty
fail
to
perform
under
the
contracts.
Options
written
by
the
Fund
do
not
typically
give
rise
to
counterparty
credit
risk,
as
options
written
generally
obligate
the
Fund,
and
not
the
counterparty,
to
perform.
The
Fund
may
be
exposed
to
counterparty
credit
risk
with
respect
to
options
written
to
the
extent
the
Fund
deposits
collateral
with
its
counterparty
to
a
written
option.
With
exchange-traded
options
purchased
and
exchange-traded
futures
and
centrally
cleared
swaps,
there
is
less
counterparty
credit
risk
to
the
Fund
since
the
exchange
or
clearinghouse,
as
counterparty
to
such
instruments,
guarantees
against
a
possible
default.
The
clearinghouse
stands
between
the
buyer
and
the
seller
of
the
contract;
therefore,
credit
risk
is
limited
to
failure
of
the
clearinghouse.
While
offset
rights
may
exist
under
applicable
law, the
Fund
does
not
have
a
contractual
right
of
offset
against
a
clearing
broker
or
clearinghouse
in
the
event
of
a
default
(including
the
bankruptcy
or
insolvency).
Additionally,
credit
risk
exists
in exchange-traded
futures
and
centrally
cleared
swaps with
respect
to
initial
and
variation
margin
that
is
held
in
a
clearing
broker’s
customer
accounts.
While
clearing
brokers
are
required
to
segregate
customer
margin
from
their
own
assets,
in
the
event
that
a
clearing
broker
becomes
insolvent
or
goes
into
bankruptcy
and
at
that
time
there
is
a
shortfall
in
the
aggregate
amount
of
margin
held
by
the
clearing
broker
for
all
its
clients,
typically
the
shortfall
would
be
allocated
on
a
pro
rata
basis
across
all
the
clearing
broker’s
customers,
potentially
resulting
in
losses
to
the
Fund.
Geographic/Asset
Class
Risk:
A
diversified
portfolio,
where
this
is appropriate
and
consistent
with
a
fund’s
objectives,
minimizes
the
risk
that
a
price
change
of
a
particular
investment
will
have
a
material
impact
on
the
NAV
of
a
fund.
The
investment
concentrations
within
the
Fund’s
portfolio
are
disclosed
in
its Schedule
of
Investments.
The
Fund
invests
a
significant
portion
of
its
assets
in
high
yield
securities.
High
yield
securities
that
are
rated
below
investment-grade
(commonly
referred
to
as
“junk
bonds”)
or
are
unrated
may
be
deemed
speculative,
involve
greater
levels
of
risk
than
higher-rated
securities
of
similar
maturity
and
are
more
likely
to
default.
High
yield
securities
may
be
issued
by
less
creditworthy
issuers,
and
issuers
of
high
yield
securities
may
be
unable
to
meet
their
interest
or
principal
payment
obligations.
High
yield
securities
are
subject
to
extreme
price
fluctuations,
may
be
less
liquid
than
higher
rated
fixed-income
securities,
even
under
normal
economic
conditions,
and
frequently
have
redemption
features.
The
Fund
invests
a
significant
portion
of
its
assets
in fixed-income securities and/or uses
derivatives tied
to
the
fixed-income
markets.
Changes
in
market
interest
rates
or
economic
conditions
may affect
the
value
and/or
liquidity
of
such investments.
Interest
rate
risk
is
the
risk
that
prices
of
bonds
and
other
fixed-income
securities
will
decrease
as
interest
rates
rise
and
increase
as
interest
rates
fall.
The
Fund
may
be
subject
to
a
greater
risk
of
rising
interest
rates
during
a
period
of
historically
low
interest
rates. The
Federal
Reserve
has
raised
the
federal
funds
rate
as
part
of
its
efforts
to
address
inflation.
Changing
interest
rates
may
have
unpredictable
effects
on
markets,
may
result
in
heightened
market
volatility,
and
could
negatively
impact
the
Fund’s
performance.
The
Fund
invests
a
significant
portion
of
its
assets
in
securities
of
issuers
located
in
the
United
States.
A
decrease
in
imports
or
exports,
changes
in
trade
regulations,
inflation
and/or
an
economic
recession
in
the
United
States
may
have
a
material
adverse
effect
on
the
U.S.
economy
and
the
securities
listed
on
U.S.
exchanges.
Proposed
and
adopted
policy
and
legislative
changes
in
the
United
States
may
also
have
a
significant
effect
on
U.S.
markets
generally,
as
well
as
on
the
value
of
certain
securities.
Governmental
agencies
project
that
the
United
States
will
continue
to
maintain
elevated
public
debt
levels
for
the
foreseeable
future
which
may
constrain
future
economic
growth.
Circumstances
could
arise
that
could
prevent
the
timely
payment
of
interest
or
principal
on
U.S.
government
debt,
such
as
reaching
the
legislative
“debt
ceiling.”
Such
non-payment
would
result
in
substantial
negative
consequences
for
the
U.S.
economy
and
the
global
financial
system.
If
U.S.
relations
with
certain
countries
deteriorate,
it
could
adversely
affect
issuers
that
rely
on
the
United
States
for
trade.
The
United
States
has
also
experienced
increased
internal
unrest
and
discord.
If
these
trends
were
to
continue,
they
may
have
an
adverse
impact
on
the
U.S.
economy
and
the
issuers
in
which
the
Fund
invests.
The
Fund
invests
a
significant
portion
of
its
assets
in
securities
of
issuers
located
in
Europe
or
with
significant
exposure
to
European
issuers
or
countries.
The
European
financial
markets
recently
experienced
volatility
and
adverse
trends
due
to
concerns
about
economic
downturns
in,
or
rising
government
debt
levels
of,
several
European
countries
as
well
as
acts
of
war
in
the
region.
These
events
may
spread
to
other
countries
in
Europe
and
may
affect
the
value
and
liquidity
of
certain
of
the
Fund’s
investments.
Responses
to
the
financial
problems
by
European
governments,
central
banks
and
others,
including
austerity
measures
and
reforms,
may
not
work,
may
result
in
social
unrest
and
may
limit
future
growth
and
economic
recovery
or
have
other
unintended
consequences.
Further
defaults
or
restructurings
by
governments
and
others
of
their
debt
could
have
additional
adverse
effects
on
economies,
financial
markets
and
asset
valuations
around
the
world.
The
United
Kingdom
has
withdrawn
from
the
European
Union,
and
one
or
more
other
countries
may
withdraw
from
the
European
Union
and/or
abandon
the
Euro,
the
common
currency
of
the
European
Union.
These
events
and
actions
have
adversely
affected,
and
may
in
the
future
adversely
affect,
the
value
and
exchange
rate
of
the
Euro
and
may
continue
to
significantly
affect
the
economies
of
every
country
in
Europe,
including
countries
that
do
not
use
the
Euro
and
non-European
Union
member
states. The
impact
of
these
actions,
especially
if
they
occur
in
a
disorderly
fashion,
is
not
clear
but
could
be
significant
and
far
reaching.
In
addition,
Russia
launched
a
large-scale
invasion
of
Ukraine
on
February
24,
2022.
The
extent
and
duration
of
the
military
action,
resulting
sanctions
and
resulting
future
market
disruptions
in
the
region
are
impossible
to
predict,
but
have
been,
and
may
continue
to
be,
significant
and
have
a
severe
adverse
effect
on
the
region,
including
significant
negative
impacts
on
the
economy
and
the
markets
for
certain
securities
and
commodities,
such
as
oil
and
natural
gas,
as
well
as
other
sectors.
Significant
Shareholder
Redemption
Risk:
Certain
shareholders
may
own
or
manage
a
substantial
amount
of
fund
shares
and/or
hold
their
fund
investments
for
a
limited
period
of
time.
Large
redemptions
of
fund
shares
by
these
shareholders
may
force
a
fund
to
sell
portfolio
securities,
which
may
negatively
impact
the
fund’s
NAV,
increase
the
fund’s
brokerage
costs,
and/or
accelerate
the
realization
of
taxable
income/gains
and
cause
the
fund
to
make
additional
taxable
distributions
to
shareholders.
LIBOR
Transition
Risk:
The
Fund
may
be
exposed
to
financial
instruments
that
recently
transitioned
from,
or
continue
to
be
tied
to,
the
London
Interbank
Offered
Rate
(“LIBOR”)
to
determine
payment
obligations,
financing
terms,
hedging
strategies
or
investment
value.
The
United
Kingdom’s
Financial
Conduct
Authority,
which
regulates
Notes
to
Financial
Statements
(continued)
Notes
to
Financial
Statements
LIBOR,
has
ceased
publishing
all
LIBOR
settings,
but
some
USD
LIBOR
settings
will
continue
to
be
published
under
a
synthetic
methodology
until
September
30,
2024
for
certain
legacy
contracts.
SOFR
has
been
used
increasingly
on
a
voluntary
basis
in
new
instruments
and
transactions.
Under
U.S.
regulations
that
implement
a
statutory
fallback
mechanism
to
replace
LIBOR,
benchmark
rates
based
on
SOFR
have
replaced
LIBOR
in
certain
financial
contracts.
The
ultimate
effect
of
the
LIBOR
transition
process
on
the
Fund
is
uncertain.
11.
CAPITAL
SHARE
TRANSACTIONS
Transactions
in
capital
shares
for
each
class
were
as
follows:
12.
SUBSEQUENT
EVENTS
Management
has
evaluated
the
impact
of
all
subsequent
events
on
the
Fund
through
the
date
the
financial
statements
were
issued
and
has
determined
that
there
were
no
subsequent
events
requiring
adjustment
or
additional
disclosure
in
the
financial
statements.
Year
Ended
07/31/24
Year
Ended
07/31/23
Fund
Name/Share
Class
Shares
Amount
Shares
Amount
BlackRock
Global
Long/Short
Credit
Fund
Institutional
Shares
sold
.............................................
22,937,743
$
206,598,748
32,070,701
$
284,550,002
Shares
issued
in
reinvestment
of
distributions
........................
2,226,143
19,679,102
6,464,375
54,430,040
Shares
redeemed
.........................................
(48,085,127)
(433,309,730)
(65,878,345)
(584,133,352)
(22,921,241)
$
(207,031,880)
(27,343,269)
$
(245,153,310)
Investor
A
Shares
sold
and
automatic
conversion
of
shares
.......................
1,236,696
$
11,087,655
1,780,436
$
15,948,428
Shares
issued
in
reinvestment
of
distributions
........................
169,697
1,503,513
564,634
4,765,509
Shares
redeemed
.........................................
(3,527,662)
(31,655,416)
(9,617,384)
(85,960,296)
(2,121,269)
$
(19,064,248)
(7,272,314)
$
(65,246,359)
Investor
C
Shares
sold
.............................................
35,143
$
314,588
50,419
$
436,299
Shares
issued
in
reinvestment
of
distributions
........................
7,038
62,428
51,209
430,667
Shares
redeemed
and
automatic
conversion
of
shares
..................
(266,231)
(2,372,154)
(634,856)
(5,582,929)
(224,050)
$
(1,995,138)
(533,228)
$
(4,715,963)
Class
K
Shares
sold
.............................................
5,030,210
$
45,501,253
6,862,326
$
60,444,858
Shares
issued
in
reinvestment
of
distributions
........................
126,460
1,119,173
343,658
2,897,041
Shares
redeemed
.........................................
(10,163,297)
(91,622,961)
(14,940,513)
(132,692,920)
(5,006,627)
$
(45,002,535)
(7,734,529)
$
(69,351,021)
(30,273,187)
$
(273,093,801)
(42,883,340)
$
(384,466,653)
Report
of
Independent
Registered
Public
Accounting
Firm
2024
BlackRock
Annual
Financial
Statements
To
the
Board
of
Trustees
of
BlackRock
Funds
IV
and
Shareholders
of
BlackRock
Global
Long/Short
Credit
Fund
Opinion
on
the
Financial
Statements
We
have
audited
the
accompanying
statement
of
assets
and
liabilities,
including
the
schedule
of
investments,
of
BlackRock
Global
Long/Short
Credit
Fund
(one
of
the
funds
constituting
BlackRock
Funds
IV,
referred
to
hereafter
as
the
"Fund")
as
of
July
31,
2024,
the
related
statement
of
operations
for
the
year
ended
July
31,
2024,
the
statement
of
changes
in
net
assets
for
each
of
the
two
years
in
the
period
ended
July
31,
2024,
including
the
related
notes,
and
the
financial
highlights
for
each
of
the
five
years
in
the
period
ended
July
31,
2024
(collectively
referred
to
as
the
“financial
statements”).
In
our
opinion,
the
financial
statements
present
fairly,
in
all
material
respects,
the
financial
position
of
the
Fund
as
of
July
31,
2024,
the
results
of
its
operations
for
the
year
then
ended,
the
changes
in
its
net
assets
for
each
of
the
two
years
in
the
period
ended
July
31,
2024
and
the
financial
highlights
for
each
of
the
five
years
in
the
period
ended
July
31,
2024
in
conformity
with
accounting
principles
generally
accepted
in
the
United
States
of
America.
Basis
for
Opinion
These
financial
statements
are
the
responsibility
of
the
Fund’s
management.
Our
responsibility
is
to
express
an
opinion
on
the
Fund’s
financial
statements
based
on
our
audits.
We
are
a
public
accounting
firm
registered
with
the
Public
Company
Accounting
Oversight
Board
(United
States)
(PCAOB)
and
are
required
to
be
independent
with
respect
to
the
Fund
in
accordance
with
the
U.S.
federal
securities
laws
and
the
applicable
rules
and
regulations
of
the
Securities
and
Exchange
Commission
and
the
PCAOB.
We
conducted
our
audits
of
these
financial
statements
in
accordance
with
the
standards
of
the
PCAOB.
Those
standards
require
that
we
plan
and
perform
the
audit
to
obtain
reasonable
assurance
about
whether
the
financial
statements
are
free
of
material
misstatement,
whether
due
to
error
or
fraud.
Our
audits
included
performing
procedures
to
assess
the
risks
of
material
misstatement
of
the
financial
statements,
whether
due
to
error
or
fraud,
and
performing
procedures
that
respond
to
those
risks.
Such
procedures
included
examining,
on
a
test
basis,
evidence
regarding
the
amounts
and
disclosures
in
the
financial
statements.
Our
audits
also
included
evaluating
the
accounting
principles
used
and
significant
estimates
made
by
management,
as
well
as
evaluating
the
overall
presentation
of
the
financial
statements.
Our
procedures
included
confirmation
of
securities
owned
as
of
July
31,
2024
by
correspondence
with
the
custodian,
transfer
agent,
agent
banks
and
brokers;
when
replies
were
not
received
from
agent
banks
and
brokers,
we
performed
other
auditing
procedures.
We
believe
that
our
audits
provide
a
reasonable
basis
for
our
opinion.
/s/PricewaterhouseCoopers
LLP
Philadelphia,
Pennsylvania
September
23,
2024
We
have
served
as
the
auditor
of
one
or
more
BlackRock
investment
companies
since
2000.
Important
Tax
Information
(unaudited)
The
following
amount,
or maximum
amount
allowable
by
law, is
hereby
designated
as
qualified
dividend
income
for
individuals
for
the
fiscal
year
ended
July
31,
2024
:
The
following
amount,
or
maximum
amount
allowable
by
law, are
hereby
designated
as
qualified
business
income
for
individuals
for
the
fiscal
year
ended
July
31,
2024:
The
Fund
hereby
designates
the
following
amount,
or
maximum
amount
allowable
by
law,
of
distributions
from
direct
federal
obligation
interest
for
the
fiscal
year
ended
July
31,
2024:
The
law
varies
in
each
state
as
to
whether
and
what
percent
of
ordinary
income
dividends
attributable
to
federal
obligations
is
exempt
from
state
income
tax.
Shareholders
are
advised
to
check
with
their
tax
advisers
to
determine
if
any
portion
of
the
dividends
received
is
exempt
from
state
income
tax.
The
following
percentage,
or
maximum
percentage
allowable
by
law,
of
ordinary
income
distributions
paid
during
the
fiscal
year
ended
July
31,
2024
qualified
for
the
dividends-received
deduction
for
corporate
shareholders:
100
The
Fund
hereby
designates
the
following
amount,
or
maximum
amount
allowable
by
law,
as
interest
income
eligible
to
be
treated
as
a
Section
163(j)
interest
dividend
for
the
fiscal
year
ended
July
31,
2024:
The
Fund
hereby
designates
the
following
amount,
or
maximum
amount
allowable
by
law,
as
interest-related
dividends
and
qualified
short-term
capital
gains
eligible
for
exemption
from
U.S.
withholding
tax
for
nonresident
aliens
and
foreign
corporations
for
the
fiscal
year
ended
July
31,
2024:
Fund
Name
Qualified
Dividend
Income
BlackRock
Global
Long/Short
Credit
Fund
..................................................................................
$
2,996,182
Fund
Name
Qualified
Business
Income
BlackRock
Global
Long/Short
Credit
Fund
..................................................................................
$
24,877
Fund
Name
Federal
Obligation
Interest
BlackRock
Global
Long/Short
Credit
Fund
..................................................................................
$
465,956
Fund
Name
Dividends-Received
Deduction
BlackRock
Global
Long/Short
Credit
Fund
..................................................................................
0
.88
%
Fund
Name
Interest
Dividends
BlackRock
Global
Long/Short
Credit
Fund
..................................................................................
$
56,325,303
Fund
Name
Interest-Related
Dividends
BlackRock
Global
Long/Short
Credit
Fund
..................................................................................
$
33,630,993
2024
BlackRock
Annual
Financial
Statements
Changes
in
and
Disagreements
with
Accountants
Not
applicable.
Proxy
Results
Not
applicable.
Remuneration
Paid
to
Trustees,
Officers,
and
Others
Compensation
to
the
independent
directors/trustees
of
the
Trust
is
paid
by
the
Trust,
on
behalf
of
the
Fund.
General
Information
Quarterly
performance,
semi-annual
and
annual
reports,
current
net
asset
value
and
other
information
regarding
the
Fund
may
be
found
on
BlackRock’s
website,
which
can
be
accessed
at
blackrock.com
.
Any
reference
to
BlackRock’s
website
in
this
report
is
intended
to
allow
investors
public
access
to
information
regarding
the
Fund
and
does
not,
and
is
not
intended
to,
incorporate
BlackRock’s
website
in
this
report.
Electronic
Delivery
Shareholders
can
sign
up
for
e-mail
notifications
of
quarterly
statements,
annual
and
semi-annual
shareholder
reports
and
prospectuses
by
enrolling
in
the
electronic
delivery
program.
To
enroll
in
electronic
delivery:
Shareholders
Who
Hold
Accounts
with
Investment
Advisors,
Banks
or
Brokerages:
Please
contact
your
financial
advisor.
Please
note
that
not
all
investment
advisors,
banks
or
brokerages
may
offer
this
service.
Shareholders
Who
Hold
Accounts
Directly
with
BlackRock:
1.
Access
the
BlackRock
website
at
blackrock.com
2.
Select
"Access
Your
Account"
3.
Next,
select
"eDelivery"
in
the
"Related
Resources"
box
and
follow
the
sign-up
instructions
BlackRock’s
Mutual
Fund
Family
BlackRock
offers
a
diverse
lineup
of
open-end
mutual
funds
crossing
all
investment
styles
and
managed
by
experts
in
equity,
fixed-income
and
tax-exempt
investing.
Visit
blackrock.com
for
more
information.
Shareholder
Privileges
Account
Information
Call
us
at
(800)
441-7762
from
8:00
AM
to
6:00
PM
ET
on
any
business
day
to
get
information
about
your
account
balances,
recent
transactions
and
share
prices.
You
can
also
visit
blackrock.com
for
more
information.
Automatic
Investment
Plans
Investor
class
shareholders
who
want
to
invest
regularly
can
arrange
to
have
$50
or
more
automatically
deducted
from
their
checking
or
savings
account
and
invested
in
any
of
the
BlackRock
funds.
Systematic
Withdrawal
Plans
Investor
class
shareholders
can
establish
a
systematic
withdrawal
plan
and
receive
periodic
payments
of
$50
or
more
from
their
BlackRock
funds,
as
long
as
their
account
balance
is
at
least
$10,000.
Retirement
Plans
Shareholders
may
make
investments
in
conjunction
with
Traditional,
Rollover,
Roth,
Coverdell,
Simple
IRAs,
SEP
IRAs
and
403(b)
Plans.
Additional
Information
(continued)
Fund
and
Service
Providers
Investment
Adviser
and
Administrator
BlackRock
Advisors,
LLC
Wilmington,
DE
19809
Sub-Advisors
BlackRock
International
Limited
Edinburgh,
EH3
8BL
United
Kingdom
BlackRock
(Singapore)
Limited
079912
Singapore
Accounting
Agent
JPMorgan
Chase
Bank,
N.A.
New
York,
NY
10179
Transfer
Agent
BNY
Mellon
Investment
Servicing
(US)
Inc.
Wilmington,
DE
19809
Custodian
JPMorgan
Chase
Bank,
N.A.
New
York,
NY
10179
Independent
Registered
Public
Accounting
Firm
PricewaterhouseCoopers
LLP
Philadelphia,
PA
19103
Distributor
BlackRock
Investments,
LLC
New
York,
NY
10001
Legal
Counsel
Willkie
Farr
&
Gallagher
LLP
New
York,
NY
10019
Address
of
the
Trust
100
Bellevue
Parkway
Wilmington,
DE
19809
Disclosure
of
Investment
Advisory
Agreement
and
Sub-Advisory
Agreements
2024
BlackRock
Annual
Financial
Statements
The
Board
of
Trustees
(the
“Board,”
the
members
of
which
are
referred
to
as
“Board
Members”)
of
BlackRock
Funds
IV
(the
“Trust”)
met
on
May
3,
2024
(the
“May
Meeting”)
and
June
6-7,
2024
(the
“June
Meeting”)
to
consider
the
approval
to
continue
the
investment
advisory
agreement
(the
“Advisory
Agreement”)
between
the
Trust,
on
behalf
of
BlackRock
Global
Long/Short
Credit
Fund
(the
“Fund,”),
and
BlackRock
Advisors,
LLC
(the
“Manager”),
the
Fund’s
investment
advisor.
The
Board
also
considered
the
approval
to
continue
the
sub-advisory
agreements
(the
“Sub-Advisory
Agreements”)
between
(1)
the
Manager
and
BlackRock
International
Limited
(“BIL”),
with
respect
to
the
Fund
and
(2)
BlackRock
(Singapore)
Limited
(“BRS”
and
together
with
BIL,
the
“Sub-Advisors”),
with
respect
to
the
Fund.
The
Manager
and
the
Sub-Advisors
are
referred
to
herein
as
“BlackRock.”
The
Advisory
Agreement
and
the
Sub-Advisory
Agreements
are
referred
to
herein
as
the
“Agreements.”
The
Approval
Process
Consistent
with
the
requirements
of
the
Investment
Company
Act
of
1940
(the
“1940
Act”),
the
Board
considers
the
approval
of
the
continuation
of
the
Agreements
for
the
Fund
on
an
annual
basis.
The
Board
members
who
are
not
“interested
persons”
of
the
Trust,
as
defined
in
the
1940
Act,
are
considered
independent
Board
members
(the
“Independent
Board
Members”).
The
Board’s
consideration
entailed
a
year-long
deliberative
process
during
which
the
Board
and
its
committees
assessed
BlackRock’s
various
services
to
the
Fund,
including
through
the
review
of
written
materials
and
oral
presentations,
and
the
review
of
additional
information
provided
in
response
to
requests
from
the
Independent
Board
Members.
The
Board
had
four
quarterly
meetings
per
year,
each
of
which
extended
over
a
two-day
period,
as
well
as
additional
ad
hoc
meetings
and
executive
sessions
throughout
the
year,
as
needed.
The
committees
of
the
Board
similarly
met
throughout
the
year.
The
Board
also
had
an
additional
one-day
meeting
to
consider
specific
information
regarding
the
renewal
of
the
Agreements.
In
considering
the
renewal
of
the
Agreements,
the
Board
assessed,
among
other
things,
the
nature,
extent
and
quality
of
the
services
provided
to
the
Fund
by
BlackRock,
BlackRock’s
personnel
and
affiliates,
including
(as
applicable):
investment
management
services;
accounting
oversight;
administrative
and
shareholder
services;
oversight
of
the
Fund’s
service
providers;
risk
management
and
oversight;
and
legal,
regulatory
and
compliance
services.
Throughout
the
year,
including
during
the
contract
renewal
process,
the
Independent
Board
Members
were
advised
by
independent
legal
counsel,
and
met
with
independent
legal
counsel
in
various
executive
sessions
outside
of
the
presence
of
BlackRock’s
management.
During
the
year,
the
Board,
acting
directly
and
through
its
committees,
considered
information
that
was
relevant
to
its
annual
consideration
of
the
renewal
of
the
Agreements,
including
the
services
and
support
provided
by
BlackRock
to
the
Fund
and
its
shareholders.
BlackRock
also
furnished
additional
information
to
the
Board
in
response
to
specific
questions
from
the
Board.
Among
the
matters
the
Board
considered
were:
(a)
investment
performance
for
one-year,
three-year,
five-year,
and/or
since
inception
periods,
as
applicable,
against
peer
funds,
relevant
benchmarks,
and
other
performance
metrics,
as
applicable,
as
well
as
BlackRock
senior
management’s
and
portfolio
managers’
investment
performance
analyses,
and
the
reasons
for
any
outperformance
or
underperformance
relative
to
its
peers,
benchmarks,
and
other
performance
metrics,
as
applicable;
(b)
fees,
including
advisory,
administration,
if
applicable,
and
other
amounts
paid
to
BlackRock
and
its
affiliates
by
the
Fund
for
services;
(c)
Fund
operating
expenses
and
how
BlackRock
allocates
expenses
to
the
Fund;
(d)
the
resources
devoted
to,
risk
oversight
of,
and
compliance
reports
relating
to,
implementation
of
the
Fund’s
investment
objective,
policies
and
restrictions,
and
meeting
regulatory
requirements;
(e)
BlackRock’s
and
the
Fund’s
adherence
to
applicable
compliance
policies
and
procedures;
(f)
the
nature,
character
and
scope
of
non-investment
management
services
provided
by
BlackRock
and
its
affiliates
and
the
estimated
cost
of
such
services,
as
applicable;
(g)
BlackRock’s
and
other
service
providers’
internal
controls
and
risk
and
compliance
oversight
mechanisms;
(h)
BlackRock’s
implementation
of
the
proxy
voting
policies
approved
by
the
Board;
(i)
execution
quality
of
portfolio
transactions;
(j)
BlackRock’s
implementation
of
the
Fund’s
valuation
and
liquidity
procedures;
(k)
an
analysis
of
management
fees
paid
to
BlackRock
for
products
with
similar
investment
mandates
across
the
open-end
fund,
exchange-traded
fund
(“ETF”),
closed-end
fund,
sub-advised
mutual
fund,
separately
managed
account,
collective
investment
trust,
and
institutional
separate
account
product
channels,
as
applicable,
and
the
similarities
and
differences
between
these
products
and
the
services
provided
as
compared
to
the
Fund;
(l)
BlackRock’s
compensation
methodology
for
its
investment
professionals
and
the
incentives
and
accountability
it
creates,
along
with
investment
professionals’
investments
in
the
fund(s)
they
manage;
and
(m)
periodic
updates
on
BlackRock’s
business.
Prior
to
and
in
preparation
for
the
May
Meeting,
the
Board
received
and
reviewed
materials
specifically
relating
to
the
renewal
of
the
Agreements.
The
Independent
Board
Members
continuously
engaged
in
a
process
with
their
independent
legal
counsel
and
BlackRock
to
review
the
nature
and
scope
of
the
information
provided
to
the
Board
to
better
assist
its
deliberations.
The
materials
provided
in
connection
with
the
May
Meeting
included,
among
other
things:
(a)
information
independently
compiled
and
prepared
by
Broadridge
Financial
Solutions,
Inc.
(“Broadridge”),
based
on
either
a
Lipper
classification
or
Morningstar
category,
regarding
the
Fund’s
fees
and
expenses
as
compared
with
a
peer
group
of
funds
as
determined
by
Broadridge
(“Expense
Peers”)
and
the
investment
performance
of
the
Fund
as
compared
with
a
peer
group
of
funds
(“Performance
Peers”);
(b)
information
on
the
composition
of
the
Expense
Peers
and
Performance
Peers
and
a
description
of
Broadridge’s
methodology;
(c)
information
on
the
estimated
profits
realized
by
BlackRock
and
its
affiliates
pursuant
to
the
Agreements
and
a
discussion
of
fall-out
benefits
to
BlackRock
and
its
affiliates;
(d)
a
general
analysis
provided
by
BlackRock
concerning
investment
management
fees
received
in
connection
with
other
types
of
investment
products,
such
as
institutional
accounts,
sub-advised
mutual
funds,
ETFs,
closed-end
funds,
open-end
funds,
and
separately
managed
accounts,
under
similar
investment
mandates,
as
well
as
the
performance
of
such
other
products,
as
applicable;
(e)
a
review
of
non-management
fees;
(f)
the
existence,
impact
and
sharing
of
potential
economies
of
scale,
if
any,
with
the
Fund;
(g)
a
summary
of
aggregate
amounts
paid
by
the
Fund
to
BlackRock;
(h)
sales
and
redemption
data
regarding
the
Fund’s
shares;
and
(i)
various
additional
information
requested
by
the
Board
as
appropriate
regarding
BlackRock’s
and
the
Fund’s
operations.
At
the
May
Meeting,
the
Board
reviewed
materials
relating
to
its
consideration
of
the
Agreements
and
the
Independent
Board
Members
presented
BlackRock
with
questions
and
requests
for
additional
information.
BlackRock
responded
to
these
questions
and
requests
with
additional
written
information
in
advance
of
the
June
Meeting
and
such
responses
were
reviewed
by
the
Board
Members.
At
the
June
Meeting,
the
Board
concluded
its
assessment
of,
among
other
things:
(a)
the
nature,
extent
and
quality
of
the
services
provided
by
BlackRock;
(b)
the
investment
performance
of
the
Fund
as
compared
to
its
Performance
Peers
and
to
other
metrics,
as
applicable;
(c)
the
advisory
fee
and
the
estimated
cost
of
the
services
and
estimated
profits
realized
by
BlackRock
and
its
affiliates
from
their
relationship
with
the
Fund;
(d)
the
Fund’s
fees
and
expenses
compared
to
its
Expense
Peers;
(e)
the
existence
and
sharing
of
potential
economies
of
scale;
(f)
any
fall-out
benefits
to
BlackRock
and
its
affiliates
as
a
result
of
BlackRock’s
relationship
with
the
Fund;
and
(g)
other
factors
deemed
relevant
by
the
Board
Members.
The
Board
also
considered
other
matters
it
deemed
important
to
the
approval
process,
such
as
other
payments
made
to
BlackRock
or
its
affiliates
relating
to
securities
lending
and
cash
management,
and
BlackRock’s
services
related
to
the
valuation
and
pricing
of
Fund
portfolio
holdings.
The
Board
noted
the
willingness
of
BlackRock’s
personnel
to
engage
in
open,
candid
discussions
with
the
Board.
The
Board
evaluated
the
information
available
to
it
on
a
fund-by-fund
basis.
The
following
paragraphs
provide
more
information
about
some
of
the
primary
factors
that
were
relevant
to
the
Board’s
decision.
The
Board
Members
did
not
identify
any
particular
information,
or
any
single
factor
as
determinative,
and
each
Board
Member
may
have
attributed
different
weights
to
the
various
items
and
factors
considered.
Disclosure
of
Investment
Advisory
Agreement
and
Sub-Advisory
Agreements
(continued)
Disclosure
of
Investment
Advisory
Agreement
and
Sub-Advisory
Agreements
A.
Nature,
Extent
and
Quality
of
the
Services
Provided
by
BlackRock
The
Board,
including
the
Independent
Board
Members,
reviewed
the
nature,
extent
and
quality
of
services
provided
by
BlackRock,
including
the
investment
advisory
services,
and
the
resulting
performance
of
the
Fund.
Throughout
the
year,
the
Board
compared
Fund
performance
to
the
performance
of
a
comparable
group
of
mutual
funds,
relevant
benchmarks,
and
performance
metrics,
as
applicable.
The
Board
met
with
BlackRock’s
senior
management
personnel
responsible
for
investment
activities,
including
the
senior
investment
officers.
The
Board
also
reviewed
the
materials
provided
by
the
Fund’s
portfolio
management
team
discussing
the
Fund’s
performance,
investment
strategies
and
outlook.
The
Board
considered,
among
other
factors,
with
respect
to
BlackRock:
the
experience
of
the
Fund’s
portfolio
management
team;
research
capabilities;
investments
by
portfolio
managers
in
the
funds
they
manage;
portfolio
trading
capabilities;
use
of
technology;
commitment
to
compliance;
credit
analysis
capabilities;
risk
analysis
and
oversight
capabilities;
and
the
approach
to
training
and
retaining
portfolio
managers
and
other
research,
advisory
and
management
personnel.
The
Board
also
considered
BlackRock’s
overall
risk
management
program,
including
the
continued
efforts
of
BlackRock
and
its
affiliates
to
address
cybersecurity
risks
and
the
role
of
BlackRock’s
Risk
&
Quantitative
Analysis
Group.
The
Board
engaged
in
a
review
of
BlackRock’s
compensation
structure
with
respect
to
the
Fund’s
portfolio
management
team
and
BlackRock’s
ability
to
attract
and
retain
high-quality
talent
and
create
performance
incentives.
In
addition
to
investment
advisory
services,
the
Board
considered
the
nature
and
quality
of
the
administrative
and
other
non-investment
advisory
services
provided
to
the
Fund.
BlackRock
and
its
affiliates
provide
the
Fund
with
certain
administrative,
shareholder
and
other
services
(in
addition
to
any
such
services
provided
to
the
Fund
by
third
parties)
and
officers
and
other
personnel
as
are
necessary
for
the
operations
of
the
Fund.
In
particular,
BlackRock
and
its
affiliates
provide
the
Fund
with
administrative
services
including,
among
others:
(i)
responsibility
for
disclosure
documents,
such
as
the
prospectus,
the
summary
prospectus
(as
applicable),
the
statement
of
additional
information
and
periodic
shareholder
reports;
(ii)
oversight
of
daily
accounting
and
pricing;
(iii)
responsibility
for
periodic
filings
with
regulators;
(iv)
overseeing
and
coordinating
the
activities
of
third-party
service
providers
including,
among
others,
the
Fund’s
custodian,
fund
accountant,
transfer
agent,
and
auditor;
(v)
organizing
Board
meetings
and
preparing
the
materials
for
such
Board
meetings;
(vi)
providing
legal
and
compliance
support;
(vii)
furnishing
analytical
and
other
support
to
assist
the
Board
in
its
consideration
of
strategic
issues
such
as
the
merger,
consolidation
or
repurposing
of
certain
open-end
funds;
and
(viii)
performing
or
managing
administrative
functions
necessary
for
the
operation
of
the
Fund,
such
as
tax
reporting,
expense
management,
fulfilling
regulatory
filing
requirements,
overseeing
the
Fund’s
distribution
partners,
and
shareholder
call
center
and
other
services.
The
Board
reviewed
the
structure
and
duties
of
BlackRock’s
fund
administration,
shareholder
services,
and
legal
and
compliance
departments
and
considered
BlackRock’s
policies
and
procedures
for
assuring
compliance
with
applicable
laws
and
regulations.
The
Board
considered
the
operation
of
BlackRock’s
business
continuity
plans.
The
Board
noted
that
the
engagement
of
the
Sub-Advisors
with
respect
to
the
Fund
facilitates
the
provision
of
investment
advice
and
trading
by
investment
personnel
out
of
non-U.S.
jurisdictions.
The
Board
considered
that
this
arrangement
provides
additional
flexibility
to
the
portfolio
management
team,
which
may
benefit
the
Fund
and
its
shareholders.
B.
The
Investment
Performance
of
the
Fund
The
Board,
including
the
Independent
Board
Members,
reviewed
and
considered
the
performance
history
of
the
Fund
throughout
the
year
and
at
the
May
Meeting.
In
preparation
for
the
May
Meeting,
the
Board
was
provided
with
reports
independently
prepared
by
Broadridge,
which
included
an
analysis
of
the
Fund’s
performance
as
of
December
31,
2023,
as
compared
to
its
Performance
Peers.
Broadridge
ranks
funds
in
quartiles,
ranging
from
first
to
fourth,
where
first
is
the
most
desirable
quartile
position
and
fourth
is
the
least
desirable.
In
connection
with
its
review,
the
Board
received
and
reviewed
information
regarding
the
investment
performance
of
the
Fund
as
compared
to
its
Performance
Peers
and,
in
light
of
the
Fund’s
outcome-oriented
investment
objective,
certain
performance
metrics
(“Outcome-Oriented
Performance
Metrics”).
The
Board
and
its
Performance
Oversight
Committee
regularly
review
and
meet
with
Fund
management
to
discuss
the
performance
of
the
Fund
throughout
the
year.
In
evaluating
performance,
the
Board
focused
particular
attention
on
funds
with
less
favorable
performance
records.
The
Board
also
noted
that
while
it
found
the
data
provided
by
Broadridge
generally
useful,
it
recognized
the
limitations
of
such
data,
including
in
particular,
that
notable
differences
may
exist
between
a
fund
and
its
Performance
Peers
(for
example,
the
investment
objectives
and
strategies).
Further,
the
Board
recognized
that
the
performance
data
reflects
a
snapshot
of
a
period
as
of
a
particular
date
and
that
selecting
a
different
performance
period
could
produce
significantly
different
results.
The
Board
also
acknowledged
that
long-term
performance
could
be
impacted
by
even
one
period
of
significant
outperformance
or
underperformance,
and
that
a
single
investment
theme
could
have
the
ability
to
disproportionately
affect
long-term
performance.
The
Board
reviewed
and
considered
the
Fund’s
performance
relative
to
the
Fund’s
Outcome-Oriented
Performance
Metrics,
including
a
total
return
target.
The
Board
noted
that
for
the
one-,
three-,
and
five-year
periods
reported,
the
Fund
outperformed,
underperformed
and
underperformed,
respectively,
its
total
return
target.
The
Board
noted
that
BlackRock
believes
that
the
Outcome-Oriented
Performance
Metrics
are
an
appropriate
performance
metric
for
the
Fund,
and
that
BlackRock
has
explained
its
rationale
for
this
belief
to
the
Board.
The
Board
and
BlackRock
reviewed
the
Fund’s
underperformance
relative
to
its
total
return
target
during
the
applicable
periods.
C.
Consideration
of
the
Advisory/Management
Fees
and
the
Estimated
Cost
of
the
Services
and
Estimated
Profits
Realized
by
BlackRock
and
its
Affiliates
from
their
Relationship
with
the
Fund
The
Board,
including
the
Independent
Board
Members,
reviewed
the
Fund’s
contractual
management
fee
rate
compared
with
those
of
its
Expense
Peers.
The
contractual
management
fee
rate
represents
a
combination
of
the
advisory
fee
and
any
administrative
fees,
before
taking
into
account
any
reimbursements
or
fee
waivers.
The
Board
also
compared
the
Fund’s
total
expense
ratio,
as
well
as
its
actual
management
fee
rate,
to
those
of
its
Expense
Peers.
The
total
expense
ratio
represents
a
fund’s
total
net
operating
expenses,
including
any
12b-1
or
non-12b-1
service
fees.
The
total
expense
ratio
gives
effect
to
any
expense
reimbursements
or
fee
waivers,
and
the
actual
management
fee
rate
gives
effect
to
any
management
fee
reimbursements
or
waivers.
The
Board
considered
that
the
fee
and
expense
information
in
the
Broadridge
report
for
the
Fund
reflected
information
for
a
specific
period
and
that
historical
asset
levels
and
expenses
may
differ
from
current
levels,
particularly
in
a
period
of
market
volatility.
The
Board
considered
the
services
provided
and
the
fees
charged
by
BlackRock
and
its
affiliates
to
other
types
of
clients
with
similar
investment
mandates,
as
applicable,
including
institutional
accounts
and
sub-advised
mutual
funds
(including
mutual
funds
sponsored
by
third
parties).
Disclosure
of
Investment
Advisory
Agreement
and
Sub-Advisory
Agreements
(continued)
2024
BlackRock
Annual
Financial
Statements
The
Board
received
and
reviewed
statements
relating
to
BlackRock’s
financial
condition.
The
Board
reviewed
BlackRock’s
profitability
methodology
and
was
also
provided
with
an
estimated
profitability
analysis
that
detailed
the
revenues
earned
and
the
expenses
incurred
by
BlackRock
for
services
provided
to
the
Fund.
The
Board
reviewed
BlackRock’s
estimated
profitability
with
respect
to
the
Fund
and
other
funds
the
Board
currently
oversees
for
the
year
ended
December
31,
2023
compared
to
available
aggregate
estimated
profitability
data
provided
for
the
prior
two
years.
The
Board
reviewed
BlackRock’s
estimated
profitability
with
respect
to
certain
other
U.S.
fund
complexes
managed
by
the
Manager
and/or
its
affiliates.
The
Board
reviewed
BlackRock’s
assumptions
and
methodology
of
allocating
expenses
in
the
estimated
profitability
analysis,
noting
the
inherent
limitations
in
allocating
costs
among
various
advisory
products.
The
Board
recognized
that
profitability
may
be
affected
by
numerous
factors
including,
among
other
things,
fee
waivers
and
expense
reimbursements
by
the
Manager,
the
types
of
funds
managed,
precision
of
expense
allocations
and
business
mix.
The
Board
thus
recognized
that
calculating
and
comparing
profitability
at
the
individual
fund
level
is
difficult.
The
Board
noted
that,
in
general,
individual
fund
or
product
line
profitability
of
other
advisors
is
not
publicly
available.
The
Board
reviewed
BlackRock’s
overall
operating
margin,
in
general,
compared
to
that
of
certain
other
publicly
traded
asset
management
firms.
The
Board
considered
the
differences
between
BlackRock
and
these
other
firms,
including
the
contribution
of
technology
at
BlackRock,
BlackRock’s
expense
management,
and
the
relative
product
mix.
The
Board
considered
whether
BlackRock
has
the
financial
resources
necessary
to
attract
and
retain
high
quality
investment
management
personnel
to
perform
its
obligations
under
the
Agreements
and
to
continue
to
provide
the
high
quality
of
services
that
is
expected
by
the
Board.
The
Board
further
considered
factors
including
but
not
limited
to
BlackRock’s
commitment
of
time
and
resources,
assumption
of
risk,
and
liability
profile
in
servicing
the
Fund,
including
in
contrast
to
what
is
required
of
BlackRock
with
respect
to
other
products
with
similar
investment
mandates
across
the
open-end
fund,
ETF,
closed-end
fund,
sub-advised
mutual
fund,
separately
managed
account,
collective
investment
trust,
and
institutional
separate
account
product
channels,
as
applicable.
The
Board
noted
that
the
Fund’s
contractual
management
fee
rate
ranked
in
the
fourth
quartile,
and
that
the
actual
management
fee
rate
and
total
expense
ratio
each
ranked
in
the
fourth
quartile
relative
to
the
Fund’s
Expense
Peers.
The
Board
also
noted,
however,
that
given
the
comparability
limitations
of
the
Expense
Peers,
BlackRock
provided
the
Board
a
supplemental
peer
group
consisting
of
funds
that
BlackRock
believes
are
generally
similar
to
the
Fund.
The
Board
noted
that
the
Fund’s
actual
management
fee
rate
and
total
expense
ratio
ranked
in
the
fourth
and
third
quartiles,
respectively,
relative
to
the
supplemental
peer
group.
The
Board
also
noted
that
the
Fund
has
an
advisory
fee
arrangement
that
includes
breakpoints
that
adjust
the
fee
rate
downward
as
the
size
of
the
Fund
increases
above
certain
contractually
specified
levels.
The
Board
additionally
noted
that
the
breakpoints
can,
conversely,
adjust
the
advisory
fee
rate
upward
as
the
size
of
the
Fund
decreases
below
certain
contractually
specified
levels.
Additionally,
the
Board
noted
that
BlackRock
and
the
Board
have
contractually
agreed
to
a
cap
on
the
Fund’s
total
expenses
as
a
percentage
of
the
Fund’s
average
daily
net
assets
on
a
class-by-class
basis.
D.
Economies
of
Scale
The
Board,
including
the
Independent
Board
Members,
considered
the
extent
to
which
any
economies
of
scale
might
benefit
the
Fund
in
a
variety
of
ways
as
the
assets
of
the
Fund
increase.
The
Board
considered
multiple
factors,
including
the
advisory
fee
rate
and
breakpoints,
unitary
fee
structure,
fee
waivers,
and/or
expense
caps,
as
applicable.
The
Board
considered
the
Fund’s
asset
levels
and
whether
the
current
fee
schedule
was
appropriate.
E.
Other
Factors
Deemed
Relevant
by
the
Board
Members
The
Board,
including
the
Independent
Board
Members,
also
took
into
account
other
ancillary
or
“fall-out”
benefits
that
BlackRock
or
its
affiliates
may
derive
from
BlackRock’s
respective
relationships
with
the
Fund,
both
tangible
and
intangible,
such
as
BlackRock’s
ability
to
leverage
its
investment
professionals
who
manage
other
portfolios
and
its
risk
management
personnel,
an
increase
in
BlackRock’s
profile
in
the
investment
advisory
community,
and
the
engagement
of
BlackRock’s
affiliates
as
service
providers
to
the
Fund,
including
for
administrative,
distribution,
securities
lending
and
cash
management
services.
With
respect
to
securities
lending,
during
the
year
the
Board
also
considered
information
provided
by
independent
third-party
consultants
related
to
the
performance
of
each
BlackRock
affiliate
as
securities
lending
agent.
The
Board
also
considered
BlackRock’s
overall
operations
and
its
efforts
to
expand
the
scale
of,
and
improve
the
quality
of,
its
operations.
The
Board
also
noted
that,
subject
to
applicable
law,
BlackRock
may
use
and
benefit
from
third-party
research
obtained
by
soft
dollars
generated
by
certain
registered
fund
transactions
to
assist
in
managing
all
or
a
number
of
its
other
client
accounts.
In
connection
with
its
consideration
of
the
Agreements,
the
Board
also
received
information
regarding
BlackRock’s
brokerage
and
soft
dollar
practices.
The
Board
received
reports
from
BlackRock
which
included
information
on
brokerage
commissions
and
trade
execution
practices
throughout
the
year.
The
Board
noted
the
competitive
nature
of
the
open-end
fund
marketplace,
and
that
shareholders
are
able
to
redeem
their
Fund
shares
if
they
believe
that
the
Fund’s
fees
and
expenses
are
too
high
or
if
they
are
dissatisfied
with
the
performance
of
the
Fund.
Conclusion
At
the
June
Meeting,
in
a
continuation
of
the
discussions
that
occurred
during
the
May
Meeting,
and
as
a
culmination
of
the
Board’s
year-long
deliberative
process,
the
Board,
including
the
Independent
Board
Members,
unanimously
approved
the
continuation
of
the
Advisory
Agreement
between
the
Manager
and
the
Trust,
on
behalf
of
the
Fund,
for
a
one-year
term
ending
June
30,
2025,
and
the
Sub-Advisory
Agreements
between
the
Manager
and
the
Sub-Advisors,
with
respect
to
the
Fund,
for
a
one-year
term
ending
June
30,
2025.
Based
upon
its
evaluation
of
all
of
the
aforementioned
factors
in
their
totality,
as
well
as
other
information,
the
Board,
including
the
Independent
Board
Members,
was
satisfied
that
the
terms
of
the
Agreements
were
fair
and
reasonable
and
in
the
best
interest
of
the
Fund
and
its
shareholders.
In
arriving
at
its
decision
to
approve
the
Agreements,
the
Board
did
not
identify
any
single
factor
or
group
of
factors
as
all-important
or
controlling,
but
considered
all
factors
together,
and
different
Board
Members
may
have
attributed
different
weights
to
the
various
factors
considered.
The
Independent
Board
Members
were
advised
by
independent
legal
counsel
throughout
the
deliberative
process.
Glossary
of
Terms
Used
in
this
Report
Glossary
of
Terms
Used
in
this
Report
Currency
Abbreviation
AUD
Australian
Dollar
EUR
Euro
GBP
British
Pound
JPY
Japanese
Yen
USD
United
States
Dollar
Portfolio
Abbreviation
CLO
Collateralized
Loan
Obligation
CSMC
Credit
Suisse
Mortgage
Capital
DAC
Designated
Activity
Company
EFFR
Effective
Federal
Funds
Rate
ETF
Exchange-Traded
Fund
EURIBOR
Euro
Interbank
Offered
Rate
LIBOR
London
Interbank
Offered
Rate
OTC
Over-the-counter
PCL
Public
Company
Limited
PIK
Payment-In-Kind
SCA
Svenska
Cellulosa
Aktiebolaget
SONIA
Sterling
Overnight
Interbank
Average
Rate
SOFR
Secured
Overnight
Financing
Rate
SPDR
Standard
&
Poor’s
Depositary
Receipts
Want
to
know
more?
blackrock.com
|
800-441-7762
This
report
is
intended
for
current
holders.
It
is
not
authorized
for
use
as
an
offer
of
sale
or
a
solicitation
of
an
offer
to
buy
shares
of
the
Fund
unless
preceded
or
accompanied
by
the
Fund’s
current
prospectus.
Past
performance
results
shown
in
this
report
should
not
be
considered
a
representation
of
future
performance.
Investment
returns
and
principal
value
of
shares
will
fluctuate
so
that
shares,
when
redeemed,
may
be
worth
more
or
less
than
their
original
cost.
Statements
and
other
information
herein
are
as
dated
and
are
subject
to
change.
Item 8 – Changes in and Disagreements with Accountants for Open-End Management Investment Companies – See Item 7
Item 9 – Proxy Disclosures for Open-End Management Investment Companies – See Item 7
Item 10 – Remuneration Paid to Directors, Officers, and Others of Open-End Management Investment Companies – See Item 7
Item 11 – Statement Regarding Basis for Approval of Investment Advisory Contract – See Item 7
Item 12 – Disclosure of Proxy Voting Policies and Procedures for Closed-End Management Investment Companies – Not Applicable
Item 13 – Portfolio Managers of Closed-End Management Investment Companies - Not Applicable
Item 14 – Purchases of Equity Securities by Closed-End Management Investment Company and Affiliated Purchasers – Not Applicable
Item 15 – Submission of Matters to a Vote of Security Holders – There have been no material changes to these procedures.
Item 16 – Controls and Procedures
(a) The registrant’s principal executive and principal financial officers, or persons performing similar functions, have concluded that the registrant’s disclosure controls and procedures (as defined in Rule 30a-3(c) under the Investment Company Act of 1940, as amended (the “1940 Act”)) are effective as of a date within 90 days of the filing date of this report based on the evaluation of these controls and procedures required by Rule 30a-3(b) under the 1940 Act and Rule 13a-15(b) or 15d-15(b) under the Securities Exchange Act of 1934, as amended.
(b) There were no changes in the registrant’s internal control over financial reporting (as defined in Rule 30a-3(d) under the 1940 Act) that occurred during the period covered by this report that have materially affected, or are reasonably likely to materially affect, the registrant’s internal control over financial reporting.
Item 17 – Disclosure of Securities Lending Activities for Closed-End Management Investment Companies –Not Applicable
Item 18 – Recovery of Erroneously Awarded Compensation – Not Applicable
Item 19 – Exhibits attached hereto
(a)(1) Code of Ethics – See Item 2
(a)(2) Any policy required by the listing standards adopted pursuant to Rule 10D-1 under the Exchange Act (17 CFR 240.10D-1) by the registered national securities exchange or registered national securities association upon which the registrant’s securities are listed – Not Applicable
(a)(3) Section 302 Certifications are attached
(a)(4) Any written solicitation to purchase securities under Rule 23c-1 – Not Applicable
(a)(5) Change in Registrant’s independent public accountant – Not Applicable
(b) Section 906 Certifications are attached
Pursuant to the requirements of the Securities Exchange Act of 1934 and the Investment Company Act of 1940, the registrant has duly caused this report to be signed on its behalf by the undersigned, thereunto duly authorized.
BlackRock Funds IV
By: /s/ John M. Perlowski
John M. Perlowski
Chief Executive Officer (principal executive officer) of
BlackRock Funds IV
Date: September 23, 2024
Pursuant to the requirements of the Securities Exchange Act of 1934 and the Investment Company Act of 1940, this report has been signed below by the following persons on behalf of the registrant and in the capacities and on the dates indicated.
By: /s/ John M. Perlowski
John M. Perlowski
Chief Executive Officer (principal executive officer) of
BlackRock Funds IV
Date: September 23, 2024
By: /s/ Trent Walker
Trent Walker
Chief Financial Officer (principal financial officer) of
BlackRock Funds IV
Date: September 23, 2024