UNITED STATES
SECURITIES AND EXCHANGE COMMISSION
Washington, D.C. 20549
FORMN-CSR
CERTIFIED SHAREHOLDER REPORT OF REGISTERED MANAGEMENT
INVESTMENT COMPANIES
Investment Company Act file number:811-23342
Name of Fund: FDP Series II, Inc.
FDP BlackRock CoreAlpha Bond Fund
Fund Address: 100 Bellevue Parkway, Wilmington, DE 19809
Name and address of agent for service: John M. Perlowski, Chief Executive Officer, FDP Series II, Inc., 55 East 52nd Street, New York, NY 10055
Registrant’s telephone number, including area code: (800)441-7762
Date of fiscal year end: 05/31/2019
Date of reporting period: 05/31/2019
Item 1 – Report to Stockholders
MAY 31, 2019
ANNUAL REPORT |  |
FDP Series II, Inc.
| Ø | FDP BlackRock CoreAlpha Bond Fund |
Beginning on January 1, 2021, as permitted by regulations adopted by the Securities and Exchange Commission, paper copies of the Fund’s shareholder reports will no longer be sent by mail, unless you specifically request paper copies of the reports from BlackRock or from your financial intermediary, such as a broker-dealer or bank. Instead, the reports will be made available on a website, and you will be notified by mail each time a report is posted and provided with a website link to access the report.
You may elect to receive all future reports in paper free of charge. If you hold accounts directly with BlackRock, you can call (800) 441-7762 to inform BlackRock that you wish to continue receiving paper copies of your shareholder reports. If you hold accounts through a financial intermediary, you can follow the instructions included with this disclosure, if applicable, or contact your financial intermediary to request that you continue to receive paper copies of your shareholder reports. Please note that not all financial intermediaries may offer this service. Your election to receive reports in paper will apply to all funds advised by BlackRock Advisors, LLC, BlackRock Fund Advisors or their affiliates, or all funds held with your financial intermediary, as applicable.
If you already elected to receive shareholder reports electronically, you will not be affected by this change and you need not take any action. You may elect to receive electronic delivery of shareholder reports and other communications by: (i) accessing the BlackRock website at www.blackrock.com/edelivery and logging into your accounts, if you hold accounts directly with BlackRock, or (ii) contacting your financial intermediary, if you hold accounts through a financial intermediary. Please note that not all financial intermediaries may offer this service.
| Not FDIC Insured • May Lose Value • No Bank Guarantee |
Dear Shareholder,
In the 12 months ended May 31, 2019, the U.S. equity and bond markets posted mixed returns while weathering significant volatility. Less volatile U.S. large cap equities and U.S. bonds posted positive returns, while equities at the high end of the risk spectrum — emerging markets, international developed, and U.S. small cap — all declined during the reporting period.
Volatility rose in emerging markets, as the rising U.S. dollar and higher interest rates in the United States disrupted economic growth abroad. U.S.-China trade relations and debt concerns adversely affected the Chinese stock market, while Turkey and Argentina became embroiled in currency crises, largely due to hyperinflation in both countries. An economic slowdown in Europe also led to negative performance for European equities. However, recent economic data indicates that Europe may emerge from its economic soft patch, reinvigorated by a manufacturing rebound and China’s economic stimulus.
In the U.S. equity market, volatility spiked in late 2018, as a wide range of risks were brought to bear on markets, ranging from rising interest rates and slowing global growth to heightened trade tensions and political turmoil in several countries, including the United States. These risks manifested in a broad-based sell-off in December, leading to the worst December performance on record since 1931.
By comparison, fixed-income securities delivered modest positive returns with relatively low volatility. Short-term U.S. Treasury yields rose, while longer-term yields declined. This led to positive returns for U.S. Treasuries and a substantial flattening of the yield curve. Investment-grade and high-yield corporate bonds also posted positive returns, as the credit fundamentals in corporate markets remained relatively solid.
As global economic growth slowed, the U.S. Federal Reserve (the “Fed”) shifted to a more patient perspective on the economy in January 2019, which led to a strong rebound in the equity market. In its last four meetings, the Fed left interest rates unchanged and signaled a slower pace of rate hikes in response to the global economic slowdown. Relatively low inflation and modest economic growth give the Fed room to maintain support for the economy until the economic data builds the case for changing interest rates. Signs of slowing economic growth also prompted investors to increase expectations for Fed rate cuts in the latter half of 2019. Similarly, the European Central Bank signaled a continuation of accommodative monetary policy, while China committed to looser credit conditions and an increase in fiscal spending.
We continue to believe the probability of recession in 2019 remains relatively low. In our view, a slowing expansion with room to run is the most likely scenario. However, escalating trade tensions and the resulting disruptions in global supply chains have become the greatest risk to the global expansion.
Despite the crosscurrents, U.S. and emerging market equities remain relatively attractive. Within U.S. equities, we believe that companies with high-quality earnings and strong balance sheets offer the most attractive risk/reward trade-off. For bonds, U.S. Treasuries are likely to help buffer against volatility in risk assets, while income from other types of bonds can continue to offer steady returns.
In this environment, investors need to think globally, extend their scope across a broad array of asset classes, and be nimble as market conditions change. We encourage you to talk with your financial advisor and visitblackrock.com for further insight about investing in today’s markets.
Sincerely,

Rob Kapito
President, BlackRock Advisors, LLC

Rob Kapito
President, BlackRock Advisors, LLC
| Total Returns as of May 31, 2019 | ||||
6-month | 12-month | |||
U.S. large cap equities | 0.74% | 3.78% | ||
U.S. small cap equities | (3.72) | (9.04) | ||
International equities | 2.41 | (5.75) | ||
Emerging market equities | 1.33 | (8.70) | ||
3-month Treasury bills | 1.20 | 2.26 | ||
U.S. Treasury securities | 9.11 | 8.81 | ||
U.S. investment grade bonds | 6.72 | 6.40 | ||
Tax-exempt municipal bonds | 5.68 | 6.06 | ||
U.S. high yield bonds | 5.19 | 5.50 | ||
Past performance is no guarantee of future results. Index performance is shown for illustrative purposes only. You cannot invest directly in an index. | ||||
| 2 | THIS PAGEISNOT PARTOF YOUR FUND REPORT |
| Page | ||||
| 2 | ||||
Annual Report: | ||||
| 4 | ||||
| 6 | ||||
| 6 | ||||
| 6 | ||||
| 7 | ||||
Financial Statements: | ||||
| 8 | ||||
| 15 | ||||
| 16 | ||||
| 17 | ||||
| 18 | ||||
| 21 | ||||
| 32 | ||||
| 33 | ||||
| 34 | ||||
| 37 | ||||
| 38 | ||||
FDP Series II, Inc. is part of the Funds Diversified PortfoliosSM (“FDP”) Service. You may receive separate shareholder reports for other funds available through the FDP Service.

| 3 |
| Fund Summary as of May 31, 2019 | FDP BlackRock CoreAlpha Bond Fund |
Investment Objective
FDP BlackRock CoreAlpha Bond Fund’s (the “Fund”) investment objective is to seek to provide a combination of income and capital growth.
On May 1, 2019, the Board of Directors of FDP Series II, Inc. and the Board of Trustees of BlackRock Funds VI each approved the reorganization of the Fund with and into BlackRock CoreAlpha Bond Fund, a series of BlackRock Funds VI. The reorganization is expected to occur during the third quarter of 2019 and is not subject to approval by the Fund’s shareholders.
PORTFOLIO MANAGEMENT COMMENTARY
How did the Fund perform?
For the 12-month period ended May 31, 2019, the Fund underperformed its benchmark, the Bloomberg Barclays U.S. Aggregate Bond Index.
What factors influenced performance?
During the period, the Fund’s positioning with respect to mortgage-backed securities (“MBS”) was the largest detractor from relative performance. Specifically, the Fund’s pool selection within 30-year residential MBS and its preference toward higher-coupon securities weighed on performance as the yield curve flattened.
Asset allocation was the primary contributor to performance, as the Fund was overweight in high-yield corporate bonds as well as securitized sectors including MBS, asset-backed securities (“ABS”) and commercial mortgage-backed securities (“CMBS”). This positioning benefited performance because of continued spread tightening during the period as well as the incremental income it provided. Selection within corporate credit also contributed positively to Fund performance, due principally to the Fund’s positioning within the communication services sector. In particular, an overweight allocation to the cable & wireless industry added to relative return.
The Fund held derivatives in the form of futures contracts during the period as a means to manage risk. The Fund’s use of derivatives had a positive impact on Fund performance. The Fund also held a modest amount of cash at period end. This cash balance was committed for pending transactions and did not have a material impact on performance during the period.
Describe recent portfolio activity.
During the 12-month period, the Fund maintained its overweight allocation to industrials, albeit at a reduced level. The Fund increased its overweight to communication services but decreased its overweight allocation to consumer cyclicals. In consumer non-cyclicals, the Fund moved from an overweight position to an underweight, especially with respect to the pharmaceutical industry. Finally, the Fund continued to reduce its overweight position in the energy sector, driven largely by a shift to an underweight position in the independent energy segment.
Describe portfolio positioning at period end.
Relative to the benchmark, the Fund was underweight in U.S. Treasury securities. Within spread sectors, the Fund was overweight in investment-grade corporate credit, agency MBS, and ABS, with underweights in consumer non-cyclicals, capital goods, and basic materials. The Fund also held a non-benchmark allocation to high yield corporate credit. Within investment grade credit, the portfolio was overweight in the communication services sector, as well as banking names among financials and select issues within information technology.
The views expressed reflect the opinions of BlackRock as of the date of this report and are subject to change based on changes in market, economic or other conditions. These views are not intended to be a forecast of future events and are no guarantee of future results.
| 4 | 2019 BLACKROCK ANNUAL REPORTTO SHAREHOLDERS |
| Fund Summary as of May 31, 2019 (continued) | FDP BlackRock CoreAlpha Bond Fund |
TOTAL RETURN BASED ON A $10,000 INVESTMENT
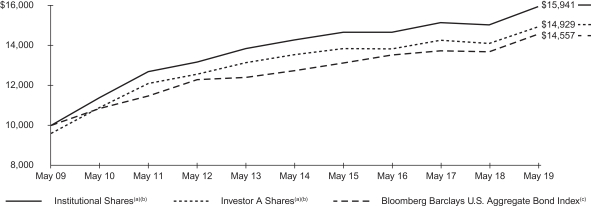
| (a) | Assuming maximum sales charges, if any, transaction costs and other operating expenses, including advisory fees. Institutional Shares do not have a sales charge. |
| (b) | The Fund invests, under normal circumstances, at least 80% of its assets in bonds and futures and other instruments that have economic characteristics similar to bonds. On September 17, 2018, the Fund acquired all of the assets, subject to the liabilities, of FDP BlackRock CoreAlpha Bond Fund (the “Predecessor Fund”), a series of FDP Series, Inc., through a tax free organization (the “Reorganization”). The Predecessor Fund is the performance and accounting survivor of the Reorganization. The Predecessor Fund’s total return prior to March 10, 2017 are the returns of the Predecessor Fund when it followed a different investment objective and investment strategies under the name FDP BlackRock Franklin Templeton Total Return Fund. |
| (c) | A market-weighted index, comprised of investment-grade U.S. Treasury bonds, government-related bonds, corporate bonds, mortgage-backed pass-through securities, CMBS and ABS that are publicly offered for sale in the United States with $250 million or more of outstanding face value and at least one year to maturity. |
Performance Summary for the Period Ended May 31, 2019
| Average Annual Total Returns (a)(b) | ||||||||||||||||||||||||||||||||||||||||||||
| 1 Year | 5 Years | 10 Years | ||||||||||||||||||||||||||||||||||||||||||
| Standardized 30-Day Yields | 6-Month Total Returns | w/o sales charge | w/sales charge | w/o sales charge | w/sales charge | w/o sales charge | w/sales charge | |||||||||||||||||||||||||||||||||||||
Institutional | 2.96 | % | 6.76 | % | 6.10 | % | N/A | 2.22 | % | N/A | 4.77 | % | N/A | |||||||||||||||||||||||||||||||
Investor A | 2.60 | 6.73 | 5.93 | 1.69 | % | 1.97 | 1.14 | % | 4.51 | 4.09 | % | |||||||||||||||||||||||||||||||||
Investor C | 2.20 | 6.46 | 5.38 | 4.38 | 1.41 | 1.41 | 3.94 | 3.94 | ||||||||||||||||||||||||||||||||||||
Bloomberg Barclays U.S. Aggregate Bond Index | — | 6.72 | 6.40 | N/A | 2.70 | N/A | 3.83 | N/A | ||||||||||||||||||||||||||||||||||||
| (a) | Assuming maximum sales charges, if any. Average annual total returns with and without sales charges reflect reductions for distribution and service fees. See “About Fund Performance” on page 6 for a detailed description of share classes, including any related sales charges and fees. |
| (b) | The Fund invests, under normal circumstances, at least 80% of its assets in bonds and futures and other instruments that have economic characteristics similar to bonds. On September 17, 2018, the Fund acquired all of the assets, subject to the liabilities, of FDP BlackRock CoreAlpha Bond Fund (the “Predecessor Fund”), a series of FDP Series, Inc., through a tax free organization (the “Reorganization”). The Predecessor Fund is the performance and accounting survivor of the Reorganization. The Predecessor Fund’s total return prior to March 10, 2017 are the returns of the Predecessor Fund when it followed a different investment objective and investment strategies under the name FDP BlackRock Franklin Templeton Total Return Fund. |
N/A — Not applicable as share class and index do not have a sales charge.
Past performance is not indicative of future results.
Performance results may include adjustments made for financial reporting purposes in accordance with U.S. generally accepted accounting principles.
Expense Example
| Actual | Hypothetical (b) | |||||||||||||||||||||||||||||||
Beginning (12/01/18) | Ending Account Value (05/31/19) | Expenses Paid During the Period (a) | Beginning (12/01/18) | Ending (05/31/19) | Expenses Paid During the Period (a) | Annualized Expense Ratio | ||||||||||||||||||||||||||
Institutional | $ | 1,000.00 | $ | 1,067.60 | $ | 3.30 | $ | 1,000.00 | $ | 1,021.74 | $ | 3.23 | 0.64 | % | ||||||||||||||||||
Investor A | 1,000.00 | 1,067.30 | 4.64 | 1,000.00 | 1,020.44 | 4.53 | 0.90 | |||||||||||||||||||||||||
Investor C | 1,000.00 | 1,064.60 | 7.31 | 1,000.00 | 1,017.85 | 7.14 | 1.42 | |||||||||||||||||||||||||
| (a) | For each class of the Fund, expenses are equal to the annualized net expense ratio for the class, multiplied by the average account value over the period, multiplied by 182/365 (to reflect the one-half year period shown). |
| (b) | Hypothetical 5% annual return before expenses is calculated by prorating the number of days in the most recent fiscal half year divided by 365. |
See “Disclosure of Expenses” on page 6 for further information on how expenses were calculated.
| FUND SUMMARY | 5 |
On September 17, 2018, the Fund acquired all of the assets, subject to the liabilities, of FDP BlackRock CoreAlpha Bond Fund (the “Target Fund”), a series of FDP Series, Inc. in a tax-free reorganization (the “Reorganization”). The Target Fund is the performance and accounting survivor of the Reorganization. Accordingly, information provided herein for periods prior to the Reorganization is that of the Target Fund. See Note 1 of the Notes to Financial Statements for additional information regarding the Reorganization.
Shares are only available for purchase through the FDP Service.
Institutional Sharesare not subject to any sales charge. These shares bear no ongoing distribution or service fees and are available only to certain eligible investors.
Investor A Sharesare subject to a maximum initial sales charge (front-end load) of 4.00% and a service fee of 0.25% per year (but no distribution fee). Certain redemptions of these shares may be subject to a contingent deferred sales charge (“CDSC”) where no initial sales charge was paid at the time of purchase.
Investor C Sharesare subject to a distribution fee of 0.55% per year and a service fee of 0.25% per year. In addition, these shares are subject to a 1.00% CDSC if redeemed within one year of purchase. Effective November 8, 2018, the Fund adopted an automatic conversion feature whereby Investor C Shares held for approximately ten years will be automatically converted into Investor A Shares, and, thereafter, investors will be subject to lower ongoing fees.
Performance information reflects past performance and does not guarantee future results. Current performance may be lower or higher than the performance data quoted. Refer towww.blackrock.com to obtain performance data current to the most recent month end. Performance results do not reflect the deduction of taxes that a shareholder would pay on fund distributions or the redemption of fund shares. Figures shown in the performance tables on the previous pages assume reinvestment of all distributions, if any, at net asset value (“NAV”) on the ex-dividend/payable date. Investment return and principal value of shares will fluctuate so that shares, when redeemed, may be worth more or less than their original cost. Distributions paid to each class of shares will vary because of the different levels of service, distribution and transfer agency fees applicable to each class, which are deducted from the income available to be paid to shareholders.
BlackRock Advisors, LLC (the “Manager”), the Fund’s investment adviser, has contractually and/or voluntarily agreed to waive and/or reimburse a portion of the Fund’s expenses. Without such waiver and/or reimbursement, the Fund’s performance would have been lower. The Manager is under no obligation to waive and/or reimburse or to continue waiving and/or reimbursing its fees and such voluntary waiver may be reduced or discontinued at any time after the applicable termination date of such agreement. See Note 6 of the Notes to Financial Statements for additional information on waivers and reimbursements.
Shareholders of the Fund may incur the following charges: (a) transactional expenses, such as sales charges; and (b) operating expenses, including investment advisory fees, service and distribution fees, including 12b-1 fees, acquired fund fees and expenses and other fund expenses. The expense examples on previous pages (which are based on a hypothetical investment of $1,000 invested on December 1, 2018 and held through May 31, 2019) are intended to assist shareholders both in calculating expenses based on an investment in the Fund and in comparing these expenses with similar costs of investing in other mutual funds.
The expense example provides information about actual account values and actual expenses. In order to estimate the expenses a shareholder paid during the period covered by this report, shareholders can divide their account value by $1,000 and then multiply the result by the number corresponding to their Fund and share class under the heading entitled “Expenses Paid During the Period.”
The expense example also provides information about hypothetical account values and hypothetical expenses based on the Fund’s actual expense ratio and an assumed rate of return of 5% per year before expenses. In order to assist shareholders in comparing the ongoing expenses of investing in the Fund and other funds, compare the 5% hypothetical example with the 5% hypothetical examples that appear in shareholder reports of other funds.
The expenses shown in the expense example are intended to highlight shareholders’ ongoing costs only and do not reflect transactional expenses, such as sales charges, if any. Therefore, the hypothetical example is useful in comparing ongoing expenses only, and will not help shareholders determine the relative total expenses of owning different funds. If these transactional expenses were included, shareholder expenses would have been higher.
Derivative Financial Instruments
The Fund may invest in various derivative financial instruments. These instruments are used to obtain exposure to a security, commodity, index, market, and/or other assets without owning or taking physical custody of securities, commodities and/or other referenced assets or to manage market, equity, credit, interest rate, foreign currency exchange rate, commodity and/or other risks. Derivative financial instruments may give rise to a form of economic leverage and involve risks, including the imperfect correlation between the value of a derivative financial instrument and the underlying asset, possible default of the counterparty to the transaction or illiquidity of the instrument. The Fund’s successful use of a derivative financial instrument depends on the investment adviser’s ability to predict pertinent market movements accurately, which cannot be assured. The use of these instruments may result in losses greater than if they had not been used, may limit the amount of appreciation the Fund can realize on an investment and/or may result in lower distributions paid to shareholders. The Fund’s investments in these instruments, if any, are discussed in detail in the Notes to Financial Statements.
| 6 | 2019 BLACKROCK ANNUAL REPORTTO SHAREHOLDERS |
| Portfolio Information as of May 31, 2019 | FDP BlackRock CoreAlpha Bond Fund |
PORTFOLIO COMPOSITION
| Asset Type | Percent of Total Investments (a) | |||
Corporate Bonds | 43 | % | ||
U.S. Government Sponsored Agency Securities | 40 | |||
Asset-Backed Securities | 8 | |||
U.S. Treasury Obligations | 4 | |||
Non-Agency Mortgage-Backed Securities | 3 | |||
Foreign Agency Obligations | 1 | |||
Municipal Bonds | 1 | |||
Floating Rate Loan Interests | — | (b) | ||
Common Stocks | — | (b) | ||
| (a) | Total investments exclude short-term securities and TBA sale commitments. |
| (b) | Represents less than 1% of total investments. |
| PORTFOLIO INFORMATION | 7 |
May 31, 2019 | FDP BlackRock CoreAlpha Bond Fund (Percentages shown are based on Net Assets) |
| Security | Shares | Value | ||||||||||
Common Stocks — 0.0% | ||||||||||||
| Diversified Financial Services — 0.0% | ||||||||||||
HoldCo 2 NPV, Class A(a)(b) | 1,643,572 | $ | — | |||||||||
HoldCo 2 NPV, Class B(a)(b) | 163,543 | — | ||||||||||
|
| |||||||||||
Total Common Stocks — 0.0% |
| — | ||||||||||
|
| |||||||||||
| Par (000) | ||||||||||||
| Asset-Backed Securities — 8.6% | ||||||||||||
AmeriCredit Automobile Receivables Trust,Series 2017-3, Class C, 2.69%, 06/19/23 | USD | 450 | 452,651 | |||||||||
Ameriquest Mortgage Securities, Inc.,Series 2004-R4, Class M1, (1 mo. LIBOR US + 0.83%), 3.25%, 06/25/34(c) | 87 | 87,392 | ||||||||||
Argent Securities, Inc.,Series 2005-W2, Class A2C, (1 mo. LIBOR US + 0.36%), 2.79%, 10/25/35(c) | 70 | 70,604 | ||||||||||
Avant Loans Funding Trust, Class A(d): | ||||||||||||
Series 2018-A, 3.09%, 06/15/21 | 34 | 34,215 | ||||||||||
Series 2019-A, 3.48%, 07/15/22 | 384 | 384,602 | ||||||||||
Chase Funding Trust,Series 2004-2, Class 2A2, (1 mo. LIBOR US + 0.50%), 2.93%, 02/26/35(c) | 120 | 114,604 | ||||||||||
Conn’s Receivables Funding LLC, Class A(d): | ||||||||||||
Series 2018-A, 3.25%, 01/15/23 | 118 | 117,801 | ||||||||||
Series 2019-A, 3.40%, 10/16/23 | 410 | 410,943 | ||||||||||
Conseco Finance Corp.,Series 1996-9, Class M1, 7.63%, 08/15/27(e) | 57 | 62,161 | ||||||||||
Countrywide Asset-Backed Certificates,Series 2004-1, Class M1, (1 mo. LIBOR US + 0.75%), 3.18%, 03/25/34(c) | 31 | 30,756 | ||||||||||
Drive Auto Receivables Trust: | ||||||||||||
Series 2017-3, Class D, 3.53%, 12/15/23(d) | 500 | 504,261 | ||||||||||
Series 2018-3, Class B, 3.37%, 09/15/22 | 50 | 50,174 | ||||||||||
Series 2019-2, Class B, 3.17%, 11/15/23 | 425 | 429,938 | ||||||||||
Exeter Automobile Receivables Trust,Series 2015-1A, Class C, 4.10%, 12/15/20(d) | 44 | 44,450 | ||||||||||
Flagship Credit Auto Trust,Series 2016-4, Class B, 2.41%, 10/15/21(d) | 85 | 85,204 | ||||||||||
GSAA Home Equity Trust,Series 2005-5, Class M3, (1 mo. LIBOR US + 0.95%), 3.37%, 02/25/35(c) | 91 | 92,049 | ||||||||||
Home Equity Mortgage Trust,Series 2004-4, Class M3, (1 mo. LIBOR US + 0.98%), 3.40%, 12/25/34(c) | 25 | 24,703 | ||||||||||
Marlette Funding Trust,Series 2019-2A, Class A, 3.13%, 07/16/29(d) | 400 | 401,624 | ||||||||||
Morgan Stanley ABS Capital I Trust, Inc.,Series 2005-WMC1, Class M2, (1 mo. LIBOR US + 0.74%), 3.16%, 01/25/35(c) | 8 | 8,174 | ||||||||||
National Collegiate Student Loan Trust(c): | ||||||||||||
Series 2006-3, Class A4, (1 mo. LIBOR US + 0.27%), 2.70%, 03/26/29 | 166 | 165,332 | ||||||||||
Series 2007-1, Class A3, (1 mo. LIBOR US + 0.24%), 2.67%, 07/25/30 | 277 | 274,922 | ||||||||||
Prosper Marketplace Issuance Trust,Series 2019-3A, Class A, 3.19%, 07/15/25(d)(f) | 400 | 399,985 | ||||||||||
Santander Drive Auto Receivables Trust: | ||||||||||||
Series 2016-1, Class C, 3.09%, 04/15/22 | 358 | 358,667 | ||||||||||
Series 2016-3, Class D, 2.80%, 08/15/22 | 450 | 451,880 | ||||||||||
Series 2017-2, Class C, 2.79%, 08/15/22 | 730 | 730,142 | ||||||||||
Series 2017-2, Class D, 3.49%, 07/17/23 | 200 | 202,028 | ||||||||||
SLM Private Education Loan Trust,Series 2011-B, Class A2, 3.74%, 02/15/29(d) | 15 | 14,905 | ||||||||||
SoFi Consumer Loan Program LLC, Class A(d): | ||||||||||||
Series 2017-3, 2.77%, 05/25/26 | 211 | 211,294 | ||||||||||
Series 2017-4, 2.50%, 05/26/26 | 283 | 282,537 | ||||||||||
| Security | Par (000) | Value | ||||||||||
| Asset-Backed Securities (continued) | ||||||||||||
SoFi Consumer Loan Program Trust,Series 2018-3, Class A1, 3.20%, 08/25/27(d) | USD | 94 | $ | 93,761 | ||||||||
Trafigura Securitisation Finance PLC,Series 2017-1A, Class A1, 3.29%, 12/15/20 | 750 | 749,642 | ||||||||||
|
| |||||||||||
Total Asset-Backed Securities — 8.6% |
| 7,341,401 | ||||||||||
|
| |||||||||||
Corporate Bonds — 43.1% | ||||||||||||
Aerospace & Defense — 0.4% | ||||||||||||
Boeing Co., 3.60%, 05/01/34 | 200 | 203,364 | ||||||||||
Spirit AeroSystems, Inc., 3.95%, 06/15/23 | 125 | 128,426 | ||||||||||
|
| |||||||||||
| 331,790 | ||||||||||||
| Auto Components — 0.2% | ||||||||||||
Fiat Chrysler Automobiles NV, 4.50%, 04/15/20 | 200 | 201,000 | ||||||||||
|
| |||||||||||
| Automobiles — 0.2% | ||||||||||||
Ford Motor Co., 6.63%, 10/01/28 | 100 | 109,442 | ||||||||||
General Motors Co., 5.20%, 04/01/45 | 100 | 90,588 | ||||||||||
|
| |||||||||||
| 200,030 | ||||||||||||
| Banks — 6.4% | ||||||||||||
Barclays Bank PLC, 2.65%, 01/11/21 | 200 | 199,652 | ||||||||||
Capital One Financial Corp., 3.45%, 04/30/21 | 106 | 107,460 | ||||||||||
Capital One NA, 2.65%, 08/08/22 | 300 | 299,839 | ||||||||||
Citibank NA: | ||||||||||||
2.84%, 05/20/22(e) | 250 | 250,773 | ||||||||||
3.65%, 01/23/24 | 250 | 259,692 | ||||||||||
Compass Bank, 3.50%, 06/11/21 | 250 | 253,299 | ||||||||||
Discover Bank, 3.10%, 06/04/20 | 1,000 | 1,002,990 | ||||||||||
HSBC Bank USA NA, 4.88%, 08/24/20 | 400 | 409,796 | ||||||||||
HSBC Holdings PLC: | ||||||||||||
3.60%, 05/25/23 | 800 | 819,073 | ||||||||||
3.03%, 11/22/23(e) | 200 | 200,326 | ||||||||||
4.30%, 03/08/26 | 200 | 209,850 | ||||||||||
3.97%, 05/22/30(e) | 200 | 202,309 | ||||||||||
ING Groep NV, 4.10%, 10/02/23 | 200 | 207,791 | ||||||||||
Santander UK PLC, 3.75%, 11/15/21 | 200 | 204,619 | ||||||||||
SunTrust Bank, 2.80%, 05/17/22 | 200 | 201,239 | ||||||||||
Synchrony Bank, 3.65%, 05/24/21 | 250 | 253,276 | ||||||||||
Wells Fargo & Co., 3.75%, 01/24/24 | 100 | 103,813 | ||||||||||
Wells Fargo Bank NA(3 mo. LIBOR US + 0.61%), 2.90%, 05/27/22(c) | 250 | 251,098 | ||||||||||
|
| |||||||||||
| 5,436,895 | ||||||||||||
| Beverages — 0.3% | ||||||||||||
Keurig Dr. Pepper, Inc.(d): | ||||||||||||
3.55%, 05/25/21 | 110 | 111,684 | ||||||||||
5.09%, 05/25/48 | 25 | 26,694 | ||||||||||
PepsiCo, Inc., 3.45%, 10/06/46 | 100 | 98,534 | ||||||||||
|
| |||||||||||
| 236,912 | ||||||||||||
| Biotechnology — 0.2% | ||||||||||||
Baxalta, Inc., 3.60%, 06/23/22 | 120 | 121,820 | ||||||||||
Celgene Corp., 3.45%, 11/15/27 | 31 | 31,534 | ||||||||||
|
| |||||||||||
| 153,354 | ||||||||||||
| Capital Markets — 1.8% | ||||||||||||
CME Group, Inc., 4.15%, 06/15/48 | 100 | 108,659 | ||||||||||
Goldman Sachs Group, Inc.: | ||||||||||||
3.75%, 05/22/25 | 300 | 307,102 | ||||||||||
3.27%, 09/29/25(e) | 200 | 199,828 | ||||||||||
3.75%, 02/25/26 | 200 | 203,954 | ||||||||||
4.22%, 05/01/29(e) | 300 | 311,760 | ||||||||||
| 8 | 2019 BLACKROCK ANNUAL REPORTTO SHAREHOLDERS |
Schedule of Investments (continued) May 31, 2019 | FDP BlackRock CoreAlpha Bond Fund (Percentages shown are based on Net Assets) |
| Security | Par (000) | Value | ||||||||||
| Capital Markets (continued) | ||||||||||||
Morgan Stanley: | ||||||||||||
2.75%, 05/19/22 | USD | 200 | $ | 199,900 | ||||||||
3.88%, 01/27/26 | 200 | 207,714 | ||||||||||
4.43%, 01/23/30(e) | 40 | 42,939 | ||||||||||
|
| |||||||||||
| 1,581,856 | ||||||||||||
| Chemicals — 0.1% | ||||||||||||
DuPont de Nemours, Inc., 3.77%, 11/15/20 | 95 | 96,543 | ||||||||||
|
| |||||||||||
| Commercial Services & Supplies — 0.4% | ||||||||||||
Aviation Capital Group LLC, 6.75%, 04/06/21(d) | 300 | 320,849 | ||||||||||
Park Aerospace Holdings Ltd., 5.50%, 02/15/24(d) | 50 | 52,416 | ||||||||||
|
| |||||||||||
| 373,265 | ||||||||||||
| Communications Equipment — 0.2% | ||||||||||||
CommScope Technologies LLC, 5.00%, 03/15/27(d) | 50 | 42,328 | ||||||||||
Motorola Solutions, Inc., 4.60%, 02/23/28 | 137 | 141,309 | ||||||||||
|
| |||||||||||
| 183,637 | ||||||||||||
| Construction Materials — 0.1% | ||||||||||||
Allegion US Holding Co., Inc., 3.55%, 10/01/27 | 125 | 121,351 | ||||||||||
|
| |||||||||||
| Consumer Discretionary — 0.1% | ||||||||||||
Royal Caribbean Cruises Ltd., 2.65%, 11/28/20 | 65 | 65,016 | ||||||||||
|
| |||||||||||
| Consumer Finance — 2.0% | ||||||||||||
American Express Co., 2.75%, 05/20/22 | 200 | 200,687 | ||||||||||
Ford Motor Credit Co. LLC: | ||||||||||||
2.43%, 06/12/20 | 245 | 243,200 | ||||||||||
3.16%, 08/04/20 | 500 | 499,402 | ||||||||||
Synchrony Financial, 2.70%, 02/03/20 | 600 | 599,679 | ||||||||||
Total System Services, Inc., 4.00%, 06/01/23 | 200 | 207,272 | ||||||||||
|
| |||||||||||
| 1,750,240 | ||||||||||||
| Containers & Packaging — 0.1% | ||||||||||||
Reynolds Group Issuer, Inc./Reynolds Group Issuer, 7.00%, 07/15/24(d) | 100 | 100,665 | ||||||||||
|
| |||||||||||
| Diversified Financial Services — 5.4% | ||||||||||||
AerCap Ireland Capital DAC/AerCap Global Aviation Trust, 4.25%, 07/01/20 | 250 | 253,798 | ||||||||||
Bank of America Corp.: | ||||||||||||
3.50%, 05/17/22(e) | 200 | 202,909 | ||||||||||
3.00%, 12/20/23(e) | 542 | 544,055 | ||||||||||
3.86%, 07/23/24(e) | 100 | 103,533 | ||||||||||
3.97%, 02/07/30(e) | 175 | 181,342 | ||||||||||
(3 mo. LIBOR US + 1.81%), 4.24%, 04/24/38(c) | 100 | 104,640 | ||||||||||
4.08%, 04/23/40(e) | 100 | 102,455 | ||||||||||
Brookfield Finance, Inc., 4.85%, 03/29/29 | 100 | 106,579 | ||||||||||
Citigroup, Inc.: | ||||||||||||
3.35%, 04/24/25(e) | 165 | 166,946 | ||||||||||
4.65%, 07/23/48 | 100 | 110,647 | ||||||||||
General Motors Financial Co., Inc.: | ||||||||||||
3.20%, 07/13/20 | 400 | 401,136 | ||||||||||
4.20%, 11/06/21 | 140 | 142,730 | ||||||||||
3.55%, 07/08/22 | 195 | 195,947 | ||||||||||
3.70%, 05/09/23 | 200 | 200,023 | ||||||||||
4.15%, 06/19/23 | 155 | 156,618 | ||||||||||
5.25%, 03/01/26 | 100 | 104,727 | ||||||||||
Intercontinental Exchange, Inc., 3.75%, 09/21/28 | 30 | 31,546 | ||||||||||
JPMorgan Chase & Co.: | ||||||||||||
3.30%, 04/01/26 | 600 | 607,166 | ||||||||||
3.96%, 01/29/27(e) | 180 | 187,714 | ||||||||||
3.70%, 05/06/30(e) | 200 | 204,528 | ||||||||||
3.96%, 11/15/48(e) | 100 | 101,021 | ||||||||||
Lloyds Banking Group PLC, 4.45%, 05/08/25 | 200 | 208,892 | ||||||||||
Mitsubishi UFJ Financial Group, Inc., 3.54%, 07/26/21 | 45 | 45,861 | ||||||||||
| Security | Par (000) | Value | ||||||||||
| Diversified Financial Services (continued) | ||||||||||||
National Rural Utilities Cooperative Finance Corp., 3.70%, 03/15/29 | USD | 100 | $ | 106,252 | ||||||||
ORIX Corp., 2.90%, 07/18/22 | 80 | 80,463 | ||||||||||
|
| |||||||||||
| 4,651,528 | ||||||||||||
| Diversified Telecommunication Services — 1.1% | ||||||||||||
AT&T, Inc.: | ||||||||||||
4.45%, 04/01/24 | 115 | 122,664 | ||||||||||
3.95%, 01/15/25 | 200 | 208,144 | ||||||||||
4.35%, 03/01/29 | 100 | 104,421 | ||||||||||
4.85%, 03/01/39 | 80 | 81,992 | ||||||||||
Verizon Communications, Inc., 4.50%, 08/10/33 | 400 | 432,124 | ||||||||||
|
| |||||||||||
| 949,345 | ||||||||||||
| Electric Utilities — 1.8% | ||||||||||||
Berkshire Hathaway Energy Co., 4.45%, 01/15/49 | 100 | 108,742 | ||||||||||
Commonwealth Edison Co., 4.00%, 03/01/49 | 90 | 93,633 | ||||||||||
Consolidated Edison Co. of New York, Inc., Series A, 4.13%, 05/15/49 | 50 | 51,894 | ||||||||||
Duke Energy Ohio, Inc., 4.30%, 02/01/49 | 100 | 108,733 | ||||||||||
Eversource Energy, Series L, 2.90%, 10/01/24 | 170 | 170,833 | ||||||||||
Oncor Electric Delivery Co. LLC, 3.80%, 06/01/49(d) | 20 | 20,488 | ||||||||||
Public Service Co. of Colorado, 4.05%, 09/15/49 | 20 | 21,396 | ||||||||||
Public Service Electric & Gas Co., 3.00%, 05/15/27 | 500 | 501,250 | ||||||||||
Southern Co., 3.25%, 07/01/26 | 400 | 399,636 | ||||||||||
Virginia Electric & Power Co., Series C, 2.75%, 03/15/23 | 60 | 60,381 | ||||||||||
|
| |||||||||||
| 1,536,986 | ||||||||||||
| Electronic Equipment, Instruments & Components — 0.2% | ||||||||||||
Seagate HDD Cayman, 4.75%, 01/01/25 | 100 | 99,211 | ||||||||||
Tyco Electronics Group SA, 3.13%, 08/15/27 | 40 | 40,000 | ||||||||||
|
| |||||||||||
| 139,211 | ||||||||||||
| Energy Equipment & Services — 0.6% | ||||||||||||
CNOOC Finance 2013 Ltd., 3.00%, 05/09/23 | 500 | 500,928 | ||||||||||
|
| |||||||||||
| Equity Real Estate Investment Trusts (REITs) — 0.9% | ||||||||||||
EPR Properties, 4.95%, 04/15/28 | 200 | 213,679 | ||||||||||
Hospitality Properties Trust, 4.50%, 06/15/23 | 135 | 139,509 | ||||||||||
MPT Operating Partnership LP/MPT Finance Corp., 5.25%, 08/01/26 | 100 | 100,810 | ||||||||||
Omega Healthcare Investors, Inc., 4.95%, 04/01/24 | 300 | 314,998 | ||||||||||
|
| |||||||||||
| 768,996 | ||||||||||||
| Food & Staples Retailing — 0.5% | ||||||||||||
Lamb Weston Holdings, Inc., 4.88%, 11/01/26(d) | 100 | 100,250 | ||||||||||
McCormick & Co., Inc., 2.70%, 08/15/22 | 180 | 179,821 | ||||||||||
Mondelez International, Inc., 3.63%, 02/13/26 | 130 | 134,313 | ||||||||||
|
| |||||||||||
| 414,384 | ||||||||||||
| Food Products — 0.1% | ||||||||||||
Kraft Heinz Foods Co., 3.50%, 07/15/22 | 100 | 101,572 | ||||||||||
|
| |||||||||||
| Health Care Equipment & Supplies — 0.6% | ||||||||||||
Baxter International, Inc., 2.60%, 08/15/26 | 250 | 244,141 | ||||||||||
Becton Dickinson & Co., 2.89%, 06/06/22 | 105 | 105,430 | ||||||||||
Stryker Corp., 3.50%, 03/15/26 | 100 | 103,086 | ||||||||||
Zimmer Biomet Holdings, Inc., 3.70%, 03/19/23 | 55 | 56,361 | ||||||||||
|
| |||||||||||
| 509,018 | ||||||||||||
| Health Care Providers & Services — 1.1% | ||||||||||||
Anthem, Inc., 3.35%, 12/01/24 | 185 | 188,459 | ||||||||||
Cigna Corp., 3.75%, 07/15/23(d) | 130 | 133,392 | ||||||||||
HCA, Inc.: | ||||||||||||
5.88%, 05/01/23 | 100 | 106,188 | ||||||||||
5.50%, 06/15/47 | 118 | 124,012 | ||||||||||
Humana, Inc., 2.90%, 12/15/22 | 155 | 155,215 | ||||||||||
MPH Acquisition Holdings LLC, 7.13%, 06/01/24(d) | 50 | 49,750 | ||||||||||
| SCHEDULE OF INVESTMENTS | 9 |
Schedule of Investments (continued) May 31, 2019 | FDP BlackRock CoreAlpha Bond Fund (Percentages shown are based on Net Assets) |
| Security | Par (000) | Value | ||||||||||
| Health Care Providers & Services (continued) | ||||||||||||
UnitedHealth Group, Inc., 3.10%, 03/15/26 | USD | 150 | $ | 151,613 | ||||||||
|
| |||||||||||
| 908,629 | ||||||||||||
| Hotels, Restaurants & Leisure — 1.1% | ||||||||||||
GLP Capital LP/GLP Financing II, Inc.: | ||||||||||||
5.38%, 11/01/23 | 100 | 106,208 | ||||||||||
5.25%, 06/01/25 | 100 | 105,595 | ||||||||||
5.38%, 04/15/26 | 170 | 179,724 | ||||||||||
5.75%, 06/01/28 | 50 | 54,350 | ||||||||||
5.30%, 01/15/29 | 150 | 159,608 | ||||||||||
KFC Holding Co./Pizza Hut Holdings LLC/Taco Bell of America LLC, 5.00%, 06/01/24(d) | 100 | 101,250 | ||||||||||
Starbucks Corp., 3.55%, 08/15/29 | 200 | 203,291 | ||||||||||
|
| |||||||||||
| 910,026 | ||||||||||||
| Household Durables — 0.1% | ||||||||||||
PulteGroup, Inc., 5.00%, 01/15/27 | 50 | 50,500 | ||||||||||
|
| |||||||||||
| Insurance — 0.7% | ||||||||||||
Aflac, Inc., 3.63%, 06/15/23 | 500 | 522,083 | ||||||||||
Marsh & McLennan Cos., Inc., 4.90%, 03/15/49 | 50 | 56,369 | ||||||||||
|
| |||||||||||
| 578,452 | ||||||||||||
| Interactive Media & Services — 0.1% | ||||||||||||
VeriSign, Inc., 4.75%, 07/15/27 | 100 | 101,770 | ||||||||||
|
| |||||||||||
| Internet & Direct Marketing Retail — 0.1% | ||||||||||||
Expedia Group, Inc., 3.80%, 02/15/28 | 100 | 99,972 | ||||||||||
|
| |||||||||||
| IT Services — 1.1% | ||||||||||||
Alibaba Group Holding Ltd., 4.50%, 11/28/34 | 300 | 319,593 | ||||||||||
Fidelity National Information Services, Inc., 3.75%, 05/21/29 | 30 | 30,643 | ||||||||||
First Data Corp., 5.00%, 01/15/24(d) | 200 | 204,375 | ||||||||||
International Business Machines Corp.: | ||||||||||||
2.85%, 05/13/22 | 200 | 201,536 | ||||||||||
4.25%, 05/15/49 | 100 | 101,794 | ||||||||||
Mastercard, Inc., 2.95%, 06/01/29 | 70 | 70,756 | ||||||||||
|
| |||||||||||
| 928,697 | ||||||||||||
| Media — 3.3% | ||||||||||||
Charter Communications Operating LLC/Charter Communications Operating Capital: | ||||||||||||
3.58%, 07/23/20 | 1,000 | 1,008,368 | ||||||||||
4.46%, 07/23/22 | 200 | 207,273 | ||||||||||
4.20%, 03/15/28 | 300 | 301,201 | ||||||||||
5.05%, 03/30/29 | 100 | 106,753 | ||||||||||
5.38%, 04/01/38 | 100 | 102,310 | ||||||||||
Comcast Corp.: | ||||||||||||
4.15%, 10/15/28 | 200 | 214,745 | ||||||||||
4.70%, 10/15/48 | 100 | 111,158 | ||||||||||
Fox Corp. (d): | ||||||||||||
4.03%, 01/25/24 | 65 | 68,064 | ||||||||||
4.71%, 01/25/29 | 55 | 60,065 | ||||||||||
Hughes Satellite Systems Corp., 6.63%, 08/01/26 | 50 | 49,938 | ||||||||||
Interpublic Group of Cos., Inc., 3.75%, 10/01/21 | 25 | 25,577 | ||||||||||
Nexstar Broadcasting, Inc., 5.63%, 08/01/24(d) | 50 | 50,375 | ||||||||||
Walt Disney Co., 6.15%, 02/15/41(d) | 50 | 67,448 | ||||||||||
Warner Media LLC, 4.05%, 12/15/23 | 400 | 419,709 | ||||||||||
|
| |||||||||||
| 2,792,984 | ||||||||||||
| Metals & Mining — 0.2% | ||||||||||||
Rio Tinto Finance USA PLC, 4.13%, 08/21/42 | 25 | 26,610 | ||||||||||
Vale Overseas Ltd., 6.88%, 11/21/36 | 100 | 112,000 | ||||||||||
|
| |||||||||||
| 138,610 | ||||||||||||
| Security | Par (000) | Value | ||||||||||
| Multi-Utilities — 1.0% | ||||||||||||
Dominion Energy, Inc.: | ||||||||||||
2.58%, 07/01/20 | USD | 40 | $ | 39,880 | ||||||||
3.90%, 10/01/25 | 500 | 525,114 | ||||||||||
DTE Energy Co., Series D, 3.70%, 08/01/23 | 75 | 77,760 | ||||||||||
Sempra Energy: | ||||||||||||
2.90%, 02/01/23 | 30 | 30,010 | ||||||||||
3.75%, 11/15/25 | 200 | 204,001 | ||||||||||
|
| |||||||||||
| 876,765 | ||||||||||||
| Office Supplies & Equipment — 0.7% | ||||||||||||
VMware, Inc.: | ||||||||||||
2.30%, 08/21/20 | 80 | 79,607 | ||||||||||
2.95%, 08/21/22 | 250 | 249,875 | ||||||||||
3.90%, 08/21/27 | 300 | 296,351 | ||||||||||
|
| |||||||||||
| 625,833 | ||||||||||||
| Oil, Gas & Consumable Fuels — 2.3% | ||||||||||||
Cheniere Corpus Christi Holdings LLC, 5.88%, 03/31/25 | 100 | 107,500 | ||||||||||
Energy Transfer Operating LP, 7.50%, 10/15/20 | 200 | 212,253 | ||||||||||
ONEOK, Inc.: | ||||||||||||
4.00%, 07/13/27 | 225 | 227,520 | ||||||||||
4.55%, 07/15/28 | 300 | 316,050 | ||||||||||
4.35%, 03/15/29 | 300 | 310,084 | ||||||||||
Petroleos Mexicanos, 6.75%, 09/21/47 | 100 | 90,280 | ||||||||||
Sabine Pass Liquefaction LLC: | ||||||||||||
5.75%, 05/15/24 | 200 | 219,622 | ||||||||||
5.88%, 06/30/26 | 50 | 55,544 | ||||||||||
5.00%, 03/15/27 | 214 | 228,317 | ||||||||||
4.20%, 03/15/28 | 86 | 86,932 | ||||||||||
Shell International Finance BV, 4.00%, 05/10/46 | 75 | 78,652 | ||||||||||
TransCanada PipeLines Ltd., 4.88%, 05/15/48 | 47 | 49,333 | ||||||||||
|
| |||||||||||
| 1,982,087 | ||||||||||||
| Pharmaceuticals — 0.8% | ||||||||||||
AstraZeneca PLC, 3.50%, 08/17/23 | 200 | 205,824 | ||||||||||
Bausch Health Cos., Inc., 6.13%, 04/15/25(d) | 50 | 48,719 | ||||||||||
GlaxoSmithKline Capital PLC, 3.38%, 06/01/29 | 300 | 308,856 | ||||||||||
Zoetis, Inc., 3.90%, 08/20/28 | 125 | 130,485 | ||||||||||
|
| |||||||||||
| 693,884 | ||||||||||||
| Professional Services — 0.7% | ||||||||||||
IHS Markit Ltd.: | ||||||||||||
4.13%, 08/01/23 | 148 | 152,292 | ||||||||||
4.75%, 08/01/28 | 45 | 47,655 | ||||||||||
4.25%, 05/01/29 | 100 | 101,290 | ||||||||||
Verisk Analytics, Inc.: | ||||||||||||
4.00%, 06/15/25 | 200 | 211,007 | ||||||||||
4.13%, 03/15/29 | 50 | 52,622 | ||||||||||
|
| |||||||||||
| 564,866 | ||||||||||||
| Road & Rail — 0.3% | ||||||||||||
Canadian National Railway Co., 3.65%, 02/03/48 | 200 | 203,122 | ||||||||||
Ryder System, Inc., 2.88%, 06/01/22 | 40 | 40,275 | ||||||||||
|
| |||||||||||
| 243,397 | ||||||||||||
| Semiconductors & Semiconductor Equipment — 2.5% | ||||||||||||
Broadcom Corp./Broadcom Cayman Finance Ltd.: | ||||||||||||
3.63%, 01/15/24 | 700 | 693,005 | ||||||||||
3.88%, 01/15/27 | 100 | 95,096 | ||||||||||
Broadcom, Inc., 4.25%, 04/15/26(d) | 200 | 197,518 | ||||||||||
Maxim Integrated Products, Inc., 3.38%, 03/15/23 | 1,000 | 1,015,428 | ||||||||||
QUALCOMM, Inc., 3.25%, 05/20/27 | 100 | 99,830 | ||||||||||
|
| |||||||||||
| 2,100,877 | ||||||||||||
| 10 | 2019 BLACKROCK ANNUAL REPORTTO SHAREHOLDERS |
Schedule of Investments (continued) May 31, 2019 | FDP BlackRock CoreAlpha Bond Fund (Percentages shown are based on Net Assets) |
| Security | Par (000) | Value | ||||||||||
| Software — 0.2% | ||||||||||||
CDK Global, Inc.: | ||||||||||||
5.88%, 06/15/26 | USD | 20 | $ | 20,700 | ||||||||
4.88%, 06/01/27 | 60 | 58,725 | ||||||||||
MSCI, Inc., 4.75%, 08/01/26(d) | 100 | 101,970 | ||||||||||
|
| |||||||||||
| 181,395 | ||||||||||||
| Specialty Retail — 0.2% | ||||||||||||
Dollar Tree, Inc., 4.20%, 05/15/28 | 200 | 202,134 | ||||||||||
|
| |||||||||||
| Technology Hardware, Storage & Peripherals — 0.4% | ||||||||||||
Dell International LLC/EMC Corp.(d): | ||||||||||||
4.00%, 07/15/24 | 200 | 201,049 | ||||||||||
5.30%, 10/01/29 | 49 | 50,122 | ||||||||||
8.35%, 07/15/46 | 100 | 122,072 | ||||||||||
|
| |||||||||||
| 373,243 | ||||||||||||
| Tobacco — 0.4% | ||||||||||||
Altria Group, Inc.: | ||||||||||||
3.49%, 02/14/22 | 30 | 30,535 | ||||||||||
5.80%, 02/14/39 | 100 | 108,312 | ||||||||||
Philip Morris International, Inc.: | ||||||||||||
6.38%, 05/16/38 | 100 | 127,680 | ||||||||||
4.25%, 11/10/44 | 100 | 100,333 | ||||||||||
|
| |||||||||||
| 366,860 | ||||||||||||
| Water Utilities — 0.1% | ||||||||||||
Aqua America, Inc., 3.57%, 05/01/29 | 60 | 61,147 | ||||||||||
|
| |||||||||||
| Wireless Telecommunication Services — 2.0% | ||||||||||||
American Tower Corp.: | ||||||||||||
3.50%, 01/31/23 | 500 | 511,671 | ||||||||||
4.40%, 02/15/26 | 400 | 421,237 | ||||||||||
Crown Castle International Corp.: | ||||||||||||
5.25%, 01/15/23 | 600 | 644,777 | ||||||||||
3.20%, 09/01/24 | 125 | 125,179 | ||||||||||
Sprint Communications, Inc., 6.00%, 11/15/22 | 50 | 51,016 | ||||||||||
|
| |||||||||||
| 1,753,880 | ||||||||||||
|
| |||||||||||
Total Corporate Bonds — 43.1% |
| 36,940,530 | ||||||||||
|
| |||||||||||
Floating Rate Loan Interests(c) — 0.0% |
| |||||||||||
Pharmaceuticals — 0.0% |
| |||||||||||
Valeant Pharmaceuticals International, Inc., 2018 Term Loan B, (1 mo. LIBOR + 3.00%), 5.47%, 06/02/25 | 15 | 14,716 | ||||||||||
|
| |||||||||||
Total Floating Rate Loan Interests — 0.0% |
| 14,716 | ||||||||||
|
| |||||||||||
Foreign Agency Obligations — 1.3% |
| |||||||||||
Colombia Government International Bond: | ||||||||||||
4.50%, 01/28/26 | 200 | 210,700 | ||||||||||
3.88%, 04/25/27 | 200 | 202,700 | ||||||||||
Indonesia Government International Bond, 3.50%, 01/11/28 | 200 | 197,000 | ||||||||||
Mexico Government International Bond, 4.15%, 03/28/27 | 375 | 382,500 | ||||||||||
Uruguay Government International Bond: | ||||||||||||
4.38%, 01/23/31 | 55 | 57,735 | ||||||||||
4.98%, 04/20/55 | 50 | 52,675 | ||||||||||
|
| |||||||||||
Total Foreign Agency Obligations — 1.3% |
| 1,103,310 | ||||||||||
|
| |||||||||||
| Security | Par (000) | Value | ||||||||||
Municipal Bonds — 0.8% |
| |||||||||||
Bay Area Toll Authority, RB, Build America Bonds, San Francisco Toll Bridge,Series S-1, 6.92%, 04/01/40 | USD | 50 | $ | 71,855 | ||||||||
New Jersey State Turnpike Authority, RB, Build America Bonds, Series A, 7.10%, 01/01/41 | 50 | 74,749 | ||||||||||
Port Authority of New York & New Jersey, ARB, 192nd Series, 4.81%, 10/15/65 | 50 | 62,721 | ||||||||||
Port Authority of New York & New Jersey, RB, 191th Series, 4.82%, 06/01/45 | 200 | 218,156 | ||||||||||
State of California, GO, Build America Bonds, Various Purpose, 7.55%, 04/01/39 | 25 | 39,176 | ||||||||||
State of Illinois, GO, Pension, 5.10%, 06/01/33 | 30 | 30,953 | ||||||||||
University of California, Refunding RB, Series J, 4.13%, 05/15/45 | 150 | 164,768 | ||||||||||
|
| |||||||||||
Total Municipal Bonds — 0.8% |
| 662,378 | ||||||||||
|
| |||||||||||
Non-Agency Mortgage-Backed Securities — 2.8% |
| |||||||||||
Collateralized Mortgage Obligations — 1.7% |
| |||||||||||
American Home Mortgage Investment Trust,Series 2004-3, Class 4A, (6 mo. LIBOR US + 1.50%), 4.14%, 10/25/34(c) | 60 | 60,128 | ||||||||||
Bear Stearns Alternative A Trust,Series 2004-13, Class A2, (1 mo. LIBOR US + 0.88%), 3.31%, 11/25/34(c) | 5 | 4,744 | ||||||||||
Citigroup Mortgage Loan Trust,Series 2013-A, Class A, 3.00%, 05/25/42(d)(e) | 25 | 25,116 | ||||||||||
Connecticut Avenue Securities Trust,Series 2019-R03, Class 1M1, 3.18%, 09/25/31(d)(e) | 346 | 346,183 | ||||||||||
Credit Suisse First Boston Mortgage Securities Corp.,Series 2004-6, Class 3A1, 5.00%, 09/25/19 | 8 | 7,270 | ||||||||||
Credit Suisse Mortgage Capital Certificates,Series 2009-15R, Class 3A1, 5.16%, 03/26/36(d)(e) | 27 | 27,632 | ||||||||||
Fannie Mae Connecticut Avenue Securities,Series 2017-C06, Class 1M2A, 5.08%, 02/25/30(e) | 430 | 440,436 | ||||||||||
Freddie Mac STACR Trust, Series 2019-HQA2, Class M1, 3.13%, 04/25/49(d)(e) | 260 | 260,260 | ||||||||||
STACR Trust, Series 2018-HRP1, Class M2, 4.08%, 04/25/43(d)(e) | 207 | 207,877 | ||||||||||
Wells Fargo Mortgage-Backed Securities Trust: | ||||||||||||
Series 2004-W, Class A9, 4.85%, 11/25/34(e) | 39 | 39,925 | ||||||||||
Series 2007-3, Class 3A1, 5.50%, 04/25/22 | 4 | 4,252 | ||||||||||
|
| |||||||||||
| 1,423,823 | ||||||||||||
| Commercial Mortgage-Backed Securities — 1.1% | ||||||||||||
Citigroup Commercial Mortgage Trust,Series 2006-C5, Class AJ, 5.48%, 10/15/49 | 25 | 24,731 | ||||||||||
Core Industrial Trust, Series 2015-CALW, Class A, 3.04%, 02/10/34(d) | 380 | 386,298 | ||||||||||
Eleven Madison Avenue Mortgage Trust, Series 2015-11MD, Class A, 3.67%, 09/10/35(d)(e) | 150 | 157,635 | ||||||||||
GE Commercial Mortgage Corp.,Series 2007-C1, Class AM, 5.61%, 12/10/49(e) | 66 | 55,289 | ||||||||||
Greenwich Capital Commercial Funding Corp. Commercial Mortgage Trust,Series 2006-GG7, Class AM, 5.83%, 07/10/38(e) | 47 | 46,838 | ||||||||||
JPMBB Commercial Mortgage Securities Trust,Series 2014-C22, Class A4, 3.80%, 09/15/47 | 200 | 210,746 | ||||||||||
JPMorgan Chase Commercial Mortgage Securities Trust, Series 2006-CB16, Class B, 5.67%, 05/12/45(e) | 210 | 11,185 | ||||||||||
Wells Fargo Commercial Mortgage Trust, Series 2014-LC16, Class A5, 3.82%, 08/15/50 | 90 | 94,750 | ||||||||||
|
| |||||||||||
| 987,472 | ||||||||||||
|
| |||||||||||
TotalNon-Agency Mortgage-Backed Securities — 2.8% |
| 2,411,295 | ||||||||||
|
| |||||||||||
| SCHEDULE OF INVESTMENTS | 11 |
Schedule of Investments (continued) May 31, 2019 | FDP BlackRock CoreAlpha Bond Fund (Percentages shown are based on Net Assets) |
| Security | Par (000) | Value | ||||||||||
U.S. Government Sponsored Agency Securities — 40.5% |
| |||||||||||
Collateralized Mortgage Obligations — 6.4% |
| |||||||||||
Fannie Mae Connecticut Avenue Securities: | ||||||||||||
Series 2017-C05, Class 1M2A, (1 mo. LIBOR US + 2.20%), 4.63%, 01/25/30(c) | USD | 250 | $ | 253,408 | ||||||||
Series 2017-C07, Class 2M2A, 4.93%, 05/25/30(e) | 250 | 257,274 | ||||||||||
Series 2014-C03, Class 2M2, (1 mo. LIBOR US + 2.90%), 5.33%, 07/25/24(c) | 88 | 93,124 | ||||||||||
Series 2016-C05, Class 2M2, (1 mo. LIBOR US + 4.45%), 6.88%, 01/25/29(c) | 120 | 129,471 | ||||||||||
Series 2015-C01, Class 2M2, (1 mo. LIBOR US + 4.55%), 6.98%, 02/25/25(c) | 367 | 389,617 | ||||||||||
Series 2014-C04, Class 1M2, (1 mo. LIBOR US + 4.90%), 7.33%, 11/25/24(c) | 81 | 91,383 | ||||||||||
Series 2014-C04, Class 1M2, (1 mo. LIBOR US + 5.00%), 7.43%, 11/25/24(c) | 148 | 163,902 | ||||||||||
Freddie Mac Structured Agency Credit Risk Debt Notes: | ||||||||||||
Series 2016-DNA1, Class M2, (1 mo. LIBOR US + 2.90%), 5.38%, 07/25/28(c) | 144 | 145,634 | ||||||||||
Series 2017-DNA3, Class M1, 3.18%, 03/25/30(e) | 311 | 311,191 | ||||||||||
Series 2016-HQA3, Class M2, (1 mo. LIBOR US + 1.35%), 3.78%, 03/25/29(c) | 241 | 242,155 | ||||||||||
Series 2014-DN1, Class M2, (1 mo. LIBOR US + 2.20%), 4.63%, 02/25/24(c) | 139 | 141,018 | ||||||||||
Series 2016-DNA2, Class M2, (1 mo. LIBOR US + 2.20%), 4.63%, 10/25/28(c) | 296 | 297,182 | ||||||||||
Series 2016-HQA2, Class M2, (1 mo. LIBOR US + 2.25%), 4.68%, 11/25/28(c) | 429 | 434,611 | ||||||||||
Series 2015-HQA1, Class M2, (1 mo. LIBOR US + 2.65%), 5.08%, 03/25/28(c) | 367 | 372,052 | ||||||||||
Series 2015-HQA2, Class M2, (1 mo. LIBOR US + 2.80%), 5.23%, 05/25/28(c) | 86 | 87,484 | ||||||||||
Series 2015-DNA3, Class M2, (1 mo. LIBOR US + 2.85%), 5.28%, 04/25/28(c) | 501 | 513,076 | ||||||||||
Series 2015-HQ1, Class M3, (1 mo. LIBOR US + 3.80%), 6.23%, 03/25/25(c) | 916 | 957,403 | ||||||||||
Series 2015-DN1, Class M3, (1 mo. LIBOR US + 4.15%), 6.58%, 01/25/25(c) | 352 | 372,718 | ||||||||||
Series 2014-DN4, Class M3, (1 mo. LIBOR US + 4.55%), 6.98%, 10/25/24(c) | 173 | 188,405 | ||||||||||
|
| |||||||||||
| 5,441,108 | ||||||||||||
| Commercial Mortgage-Backed Securities — 0.9% | ||||||||||||
Freddie Mac Multifamily Structured Pass-Through Certificates, Class A2: | ||||||||||||
Series K057, 2.57%, 07/25/26 | 250 | 250,786 | ||||||||||
Series K062, 3.41%, 12/25/26 | 520 | 550,492 | ||||||||||
|
| |||||||||||
| 801,278 | ||||||||||||
| Mortgage-Backed Securities — 33.2% | ||||||||||||
Fannie Mae Mortgage-Backed Securities: | ||||||||||||
(11th District Cost of Funds + 1.25%), 2.42%, 09/01/34(c) | 174 | 173,013 | ||||||||||
3.00%, 03/01/45 - 08/01/47 | 527 | 530,463 | ||||||||||
3.50%, 02/01/45 - 11/01/51(g) | 3,206 | 3,289,972 | ||||||||||
(6 mo. LIBOR US + 1.19%), 3.88%, 05/01/33(c) | 7 | 6,956 | ||||||||||
4.00%, 06/01/34 - 06/01/49(g) | 3,790 | 3,912,712 | ||||||||||
(6 mo. LIBOR US + 1.36%), 4.14%, 10/01/32(c) | 27 | 27,810 | ||||||||||
(12 mo. LIBOR US + 1.37%), 4.38%, 04/01/35(c) | 96 | 99,353 | ||||||||||
4.50%, 02/01/48 - 06/01/49(f)(g) | 4,433 | 4,706,634 | ||||||||||
(1 year CMT + 1.94%), 4.56%, 04/01/35(c) | 16 | 16,017 | ||||||||||
5.00%, 08/01/35 - 04/01/48 | 960 | 1,014,835 | ||||||||||
5.50%, 11/01/34 - 01/01/47 | 958 | 1,055,475 | ||||||||||
6.00%, 06/01/21 - 09/01/38 | 233 | 258,081 | ||||||||||
6.50%, 01/01/36 | 18 | 19,664 | ||||||||||
| Security | Par (000) | Value | ||||||||||
| Mortgage-Backed Securities (continued) | ||||||||||||
Freddie Mac Mortgage-Backed Securities: | ||||||||||||
(11th District Cost of Funds + 1.25%), 2.21%, 11/01/27(c) | USD | 88 | $ | 87,702 | ||||||||
3.00%, 08/01/46 - 06/01/47 | 230 | 233,260 | ||||||||||
3.50%, 10/01/42 - 04/01/49(g) | 1,679 | 1,718,789 | ||||||||||
4.00%, 06/01/46 - 08/01/46 | 5,757 | 5,974,187 | ||||||||||
4.50%, 09/01/20 - 10/01/48 | 53 | 56,969 | ||||||||||
(12 mo. LIBOR US + 1.79%), 4.54%, 09/01/32(c) | 3 | 3,078 | ||||||||||
(1 year CMT + 2.34%), 4.95%, 04/01/32(c) | 34 | 35,579 | ||||||||||
5.00%, 07/01/23 - 07/01/48 | 572 | 590,118 | ||||||||||
5.50%, 11/01/37 | 1 | 936 | ||||||||||
6.00%, 10/01/21 - 04/01/38 | 28 | 29,700 | ||||||||||
6.50%, 09/01/38 | 1 | 753 | ||||||||||
Ginnie Mae Mortgage-Backed Securities: | ||||||||||||
3.00%, 06/01/40 - 12/20/47(g) | 562 | 572,124 | ||||||||||
3.50%, 10/20/42 - 06/01/49(g) | 2,467 | 2,538,608 | ||||||||||
4.00%, 07/20/47 - 06/01/49(g) | 398 | 411,321 | ||||||||||
4.50%, 04/20/48 - 01/20/49 | 247 | 256,885 | ||||||||||
5.00%, 05/20/48 | 686 | 716,536 | ||||||||||
6.50%, 12/20/37 - 07/15/38 | 75 | 87,584 | ||||||||||
|
| |||||||||||
| 28,425,114 | ||||||||||||
|
| |||||||||||
Total U.S. Government Sponsored Agency Securities — 40.5% |
| 34,667,500 | ||||||||||
|
| |||||||||||
U.S. Treasury Obligations — 4.3% |
| |||||||||||
U.S. Treasury Notes: | ||||||||||||
2.50%, 05/31/20 | 2,000 | 2,004,844 | ||||||||||
2.38%, 04/15/21 | 1,000 | 1,007,070 | ||||||||||
2.13%, 03/31/24 | 500 | 504,141 | ||||||||||
2.63%, 02/15/29 | 138 | 143,795 | ||||||||||
|
| |||||||||||
Total U.S. Treasury Obligations — 4.3% |
| 3,659,850 | ||||||||||
|
| |||||||||||
Total Long-Term Investments — 101.4% |
| 86,800,980 | ||||||||||
|
| |||||||||||
| Shares | ||||||||||||
Short-Term Securities — 3.4% |
| |||||||||||
| Money Market Funds — 3.3% | ||||||||||||
BlackRock Liquidity Funds,T-Fund, Institutional Class, 2.29%(h)(i) | 2,856,428 | 2,856,428 | ||||||||||
|
| |||||||||||
Total Money Market — 3.3% |
| 2,856,428 | ||||||||||
|
| |||||||||||
| Par (000) | ||||||||||||
Time Deposits — 0.1% |
| |||||||||||
| Europe — 0.1% | ||||||||||||
BNP Paribas SA, (0.57%), 06/03/19 | EUR | 59 | 65,583 | |||||||||
|
| |||||||||||
Total Time Deposits — 0.1% |
| 65,583 | ||||||||||
|
| |||||||||||
Total Short-Term Securities — 3.4% |
| 2,922,011 | ||||||||||
|
| |||||||||||
Total Investments Before TBA Sale Commitments — 104.8% |
| 89,722,991 | ||||||||||
|
| |||||||||||
| 12 | 2019 BLACKROCK ANNUAL REPORTTO SHAREHOLDERS |
Schedule of Investments (continued) May 31, 2019 | FDP BlackRock CoreAlpha Bond Fund (Percentages shown are based on Net Assets) |
| Security | Par (000) | Value | ||||||||||
| TBA Sale Commitments — (0.2%) | ||||||||||||
Mortgage-Backed Securities — (0.2%) |
| |||||||||||
Fannie Mae Mortgage-Backed Securities, 4.50%, 06/13/49(g) | USD | 125 | $ | (130,586 | ) | |||||||
Ginnie Mae Mortgage-Backed Securities, 4.50%, 06/20/49(g) | 29 | (30,159 | ) | |||||||||
|
| |||||||||||
Total TBA Sale Commitments — (0.2)% |
| (160,745 | ) | |||||||||
|
| |||||||||||
Total Investments, Net of TBA Sale Commitments — 104.6% |
| 89,562,246 | ||||||||||
Liabilities in Excess of Other Assets — (4.6)% |
| (3,917,843 | ) | |||||||||
|
| |||||||||||
Net Assets — 100.0% |
| $ | 85,644,403 | |||||||||
|
| |||||||||||
| (a) | Security is valued using significant unobservable inputs and is classified as Level 3 in the fair value hierarchy. |
| (b) | Non-income producing security. |
| (c) | Floating rate security. Rate shown is the rate in effect as of period end. |
| (d) | Security exempt from registration pursuant to Rule 144A under the Securities Act of 1933, as amended. These securities may be resold in transactions exempt from registration to qualified institutional investors. |
| (e) | Variable or floating rate security, which interest rate adjusts periodically based on changes in current interest rates and prepayments on the underlying pool of assets. Rate shown is the rate in effect as of period end. |
| (f) | When-issued security. |
| (g) | Represents or includes a TBA transaction. |
| (h) | Annualized7-day yield as of period end. |
| (i) | During the year ended May 31, 2019, investments in issuers considered to be an affiliate/affiliates of the Fund for purposes of Section 2(a)(3) of the Investment Company Act of 1940, as amended, were as follows: |
| Affiliate | Shares Held at 05/31/18 | Net Activity | Shares Held at 05/31/19 | Value at 05/31/19 | Income | Net Realized Gain (Loss) (a) | Change in Unrealized Appreciation (Depreciation) | |||||||||||||||||||||
BlackRock Liquidity Funds,T-Fund, Institutional Class | 1,425,386 | 1,431,042 | 2,856,428 | $ | 2,856,428 | $ | 106,136 | $ | — | $ | — | |||||||||||||||||
| (a) | Includes net capital gain distributions, if applicable. |
For Fund compliance purposes, the Fund’s industry classifications refer to one or more of the industrysub-classifications used by one or more widely recognized market indexes or rating group indexes, and/or as defined by the investment adviser. These definitions may not apply for purposes of this report, which may combine such industrysub-classifications for reporting ease.
Derivative Financial Instruments Outstanding as of Period End
Futures Contracts
| Description | Number of Contracts | Expiration Date | Notional Amount (000) | Value / Unrealized Appreciation (Depreciation) | ||||||||||||
| Long Contracts: | ||||||||||||||||
10-Year U.S. Treasury Note | 10 | 09/19/19 | $ | 1,268 | $ | 9,916 | ||||||||||
10-Year U.S. Ultra Long Treasury Note | 2 | 09/19/19 | 273 | 5,669 | ||||||||||||
Long U.S. Treasury Bond | 18 | 09/19/19 | 2,767 | 55,194 | ||||||||||||
Ultra Long U.S. Treasury Bond | 38 | 09/19/19 | 6,680 | 186,833 | ||||||||||||
2-Year U.S. Treasury Note | 11 | 09/30/19 | 2,361 | 9,479 | ||||||||||||
5-Year U.S. Treasury Note | 43 | 09/30/19 | 5,047 | 40,328 | ||||||||||||
|
| |||||||||||||||
| $ | 307,419 | |||||||||||||||
|
| |||||||||||||||
Derivative Financial Instruments Categorized by Risk Exposure
As of period end, the fair values of derivative financial instruments located in the Statement of Assets and Liabilities were as follows:
| Commodity Contracts | Credit Contracts | Equity Contracts | Foreign Currency Exchange Contracts | Interest Rate Contracts | Other Contracts | Total | ||||||||||||||||||||||
Assets — Derivative Financial Instruments |
| |||||||||||||||||||||||||||
Futures contracts | ||||||||||||||||||||||||||||
Net unrealized appreciation(a) | $ | — | $ | — | $ | — | $ | — | $ | 307,419 | $ | — | $ | 307,419 | ||||||||||||||
|
|
|
|
|
|
|
|
|
|
|
|
|
| |||||||||||||||
| (a) | Includes cumulative appreciation on futures contracts, as reported in the Schedule of Investments. Only current day’s variation margin is reported within the Statement of Assets and Liabilities. |
| SCHEDULE OF INVESTMENTS | 13 |
Schedule of Investments (continued) May 31, 2019 | FDP BlackRock CoreAlpha Bond Fund |
For the year ended May 31, 2019, the effect of derivative financial instruments in the Statement of Operations was as follows:
| Commodity Contracts | Credit Contracts | Equity Contracts | Foreign Currency Exchange Contracts | Interest Rate Contracts | Other Contracts | Total | ||||||||||||||||||||||
Net Realized Gain (Loss) from: |
| |||||||||||||||||||||||||||
Futures contracts | $ | — | $ | — | $ | — | $ | — | $ | 680,584 | $ | — | $ | 680,584 | ||||||||||||||
Swaps | — | — | — | — | — | 71,017 | 71,017 | |||||||||||||||||||||
|
|
|
|
|
|
|
|
|
|
|
|
|
| |||||||||||||||
| $ | — | $ | — | $ | — | $ | — | $ | 680,584 | $ | 71,017 | $ | 751,601 | |||||||||||||||
|
|
|
|
|
|
|
|
|
|
|
|
|
| |||||||||||||||
| Net Change in Unrealized Appreciation (Depreciation) on: | ||||||||||||||||||||||||||||
Futures contracts | $ | — | $ | — | $ | — | $ | — | $ | 338,170 | $ | — | $ | 338,170 | ||||||||||||||
Swaps | — | — | — | — | — | (45,271 | ) | (45,271 | ) | |||||||||||||||||||
|
|
|
|
|
|
|
|
|
|
|
|
|
| |||||||||||||||
| $ | — | $ | — | $ | — | $ | — | $ | 338,170 | $ | (45,271 | ) | $ | 292,899 | ||||||||||||||
|
|
|
|
|
|
|
|
|
|
|
|
|
| |||||||||||||||
Average Quarterly Balances of Outstanding Derivative Financial Instruments
Futures contracts: | ||||
Average notional value of contracts — long | $ | 17,533,727 | ||
Average notional value of contracts — short | $ | 422,875 | ||
Inflation swaps | ||||
Average notional amount — pays | $ | 452,500 | ||
Average notional amount — receives | $ | 477,500 |
Fair Value Hierarchy as of Period End
Various inputs are used in determining the fair value of investments and derivative financial instruments. For information about the Fund’s policy regarding valuation of investments and derivative financial instruments, refer to the Notes to Financial Statements.
The following tables summarize the Fund’s investments and derivative financial instruments categorized in the disclosure hierarchy:
| Level 1 | Level 2 | Level 3 | Total | |||||||||||||
Assets: | ||||||||||||||||
Investments: | ||||||||||||||||
Common Stocks | $ | — | $ | — | $ | — | $ | — | ||||||||
Asset-Backed Securities | — | 7,341,401 | — | 7,341,401 | ||||||||||||
Corporate Bonds | — | 36,940,530 | — | 36,940,530 | ||||||||||||
Floating Rate Loan Interests | — | 14,716 | — | 14,716 | ||||||||||||
Foreign Agency Obligations | — | 1,103,310 | — | 1,103,310 | ||||||||||||
Municipal Bonds | — | 662,378 | — | 662,378 | ||||||||||||
Non-Agency Mortgage-Backed Securities | — | 2,411,295 | — | 2,411,295 | ||||||||||||
U.S. Government Sponsored Agency Securities | — | 34,667,500 | — | 34,667,500 | ||||||||||||
U.S. Treasury Obligations | — | 3,659,850 | — | 3,659,850 | ||||||||||||
Short-Term Securities: | ||||||||||||||||
Money Market Funds | 2,856,428 | — | — | 2,856,428 | ||||||||||||
Time Deposits | — | 65,583 | — | 65,583 | ||||||||||||
Liabilities: | ||||||||||||||||
Investments: | ||||||||||||||||
TBA Sale Commitments | — | (160,745 | ) | — | (160,745 | ) | ||||||||||
|
|
|
|
|
|
|
| |||||||||
| $ | 2,856,428 | $ | 86,705,818 | $ | — | $ | 89,562,246 | |||||||||
|
|
|
|
|
|
|
| |||||||||
Derivative Financial Instruments(a) | ||||||||||||||||
Assets: | ||||||||||||||||
Interest rate contracts | $ | 307,419 | $ | — | $ | — | $ | 307,419 | ||||||||
|
|
|
|
|
|
|
| |||||||||
| (a) | Derivative financial instruments are future contracts. Future contracts are valued at the unrealized appreciation (depreciation) on the investments. |
See notes to financial statements.
| 14 | 2019 BLACKROCK ANNUAL REPORTTO SHAREHOLDERS |
Statement of Assets and Liabilities
May 31, 2019
| FDP BlackRock CoreAlpha Bond Fund | ||||
ASSETS |
| |||
Investments at value — unaffiliated (cost — $85,808,891) | $ | 86,866,563 | ||
Investments at value — affiliated (cost — $2,856,428) | 2,856,428 | |||
Cash pledged for futures contracts | 213,000 | |||
Foreign currency at value (cost — $51,761) | 50,243 | |||
Receivables: | ||||
Investments sold | 368,841 | |||
TBA sale commitments | 160,353 | |||
Capital shares sold | 163,418 | |||
Dividends — affiliated | 5,980 | |||
Interest — unaffiliated | 483,526 | |||
Principal paydowns | 1,127 | |||
Variation margin on futures contracts | 133,364 | |||
Prepaid expenses | 15,348 | |||
|
| |||
Total assets | 91,318,191 | |||
|
| |||
LIABILITIES |
| |||
TBA sale commitments at value (proceeds — $160,353) | 160,745 | |||
Payables: | ||||
Investments purchased | 4,899,328 | |||
Capital shares redeemed | 158,816 | |||
Income dividend distributions | 210,631 | |||
Investment advisory fees | 22,973 | |||
Directors’ and Officer’s fees | 407 | |||
Other accrued expenses | 191,603 | |||
Other affiliates | 276 | |||
Service and distribution fees | 29,009 | |||
|
| |||
Total liabilities | 5,673,788 | |||
|
| |||
NET ASSETS | $ | 85,644,403 | ||
|
| |||
NET ASSETS CONSIST OF |
| |||
Paid-in capital | $ | 88,607,053 | ||
Accumulated loss | (2,962,650 | ) | ||
|
| |||
NET ASSETS | $ | 85,644,403 | ||
|
| |||
NET ASSET VALUE |
| |||
Institutional — Based on net assets of $4,266,672 and 418,185 shares outstanding, 100 million shares authorized, $0.10 par value | $ | 10.20 | ||
|
| |||
Investor A — Based on net assets of $56,062,474 and 5,492,979 shares outstanding, 100 million shares authorized, $0.10 par value | $ | 10.21 | ||
|
| |||
Investor C — Based on net assets of $25,315,257 and 2,480,047 shares outstanding, 100 million shares authorized, $0.10 par value | $ | 10.21 | ||
|
| |||
See notes to financial statements.
| FINANCIAL STATEMENTS | 15 |
Year Ended May 31, 2019
| FDP BlackRock CoreAlpha Bond Fund | ||||
INVESTMENT INCOME |
| |||
Interest — unaffiliated | $ | 3,138,422 | ||
Dividends — affiliated | 106,136 | |||
|
| |||
Total investment income | 3,244,558 | |||
|
| |||
EXPENSES |
| |||
Service and distribution — class specific | 374,764 | |||
Investment advisory | 365,294 | |||
Transfer agent — class specific | 99,073 | |||
Professional | 81,532 | |||
Board realignment and consolidation | 73,048 | |||
Registration | 46,114 | |||
Accounting services | 24,555 | |||
Printing | 19,817 | |||
Directors and Officer | 6,500 | |||
Custodian | 5,361 | |||
Miscellaneous | 41,742 | |||
|
| |||
Total expenses | 1,137,800 | |||
Less: | ||||
Fees waived and/or reimbursed by the Manager | (149,443 | ) | ||
Fees paid indirectly | (96 | ) | ||
|
| |||
Total expenses after fees waived and/or reimbursed and paid indirectly | 988,261 | |||
|
| |||
Net investment income | 2,256,297 | |||
|
| |||
REALIZED AND UNREALIZED GAIN (LOSS) |
| |||
Net realized gain (loss) from: |
| |||
Investments — unaffiliated | (755,282 | ) | ||
Futures contracts | 680,584 | |||
Foreign currency transactions | (384 | ) | ||
Swaps | 71,017 | |||
|
| |||
| (4,065 | ) | |||
|
| |||
Net change in unrealized appreciation (depreciation) on: |
| |||
Investments — unaffiliated | 2,252,667 | |||
Futures contracts | 338,170 | |||
Foreign currency translations | 644 | |||
Swaps | (45,271 | ) | ||
|
| |||
| 2,546,210 | ||||
|
| |||
Net realized and unrealized gain | 2,542,145 | |||
|
| |||
NET INCREASE IN NET ASSETS RESULTING FROM OPERATIONS | $ | 4,798,442 | ||
|
| |||
See notes to financial statements.
| 16 | 2019 BLACKROCK ANNUAL REPORTTO SHAREHOLDERS |
Statements of Changes in Net Assets
| FDP BlackRock CoreAlpha Bond Fund | ||||||||
| Year Ended May 31, | ||||||||
| 2019 | 2018 | |||||||
INCREASE (DECREASE) IN NET ASSETS | ||||||||
OPERATIONS | ||||||||
Net investment income | $ | 2,256,297 | $ | 2,576,664 | ||||
Net realized loss | (4,065 | ) | (1,479,380 | ) | ||||
Net change in unrealized appreciation (depreciation) | 2,546,210 | (2,429,692 | ) | |||||
|
|
|
| |||||
Net increase (decrease) in net assets resulting from operations | 4,798,442 | (1,332,408 | ) | |||||
|
|
|
| |||||
DISTRIBUTIONS TO SHAREHOLDERS(a)(b) | ||||||||
From net investment income: | ||||||||
Institutional | (135,012 | ) | (95,073 | ) | ||||
Investor A | (1,621,324 | ) | (1,160,153 | ) | ||||
Investor C | (645,451 | ) | (581,449 | ) | ||||
From return of capital: | ||||||||
Institutional | (955 | ) | (62,106 | ) | ||||
Investor A | (11,471 | ) | (757,874 | ) | ||||
Investor C | (4,567 | ) | (379,833 | ) | ||||
|
|
|
| |||||
Decrease in net assets resulting from distributions to shareholders | (2,418,780 | ) | (3,036,488 | ) | ||||
|
|
|
| |||||
CAPITAL SHARE TRANSACTIONS | ||||||||
Net decrease in net assets derived from capital share transactions | (18,904,929 | ) | (64,470,638 | ) | ||||
|
|
|
| |||||
NET ASSETS(b) |
| |||||||
Total decrease in net assets | (16,525,267 | ) | (68,839,534 | ) | ||||
Beginning of year | 102,169,670 | 171,009,204 | ||||||
|
|
|
| |||||
End of year | $ | 85,644,403 | $ | 102,169,670 | ||||
|
|
|
| |||||
| (a) | Distributions for annual periods determined in accordance with U.S. federal income tax regulations. |
| (b) | Prior year distribution character information and distributions in excess of net investment income has been modified or removed to conform with current year RegulationS-X presentation changes. Refer to Note 12 for this prior year information. |
See notes to financial statements.
| FINANCIAL STATEMENTS | 17 |
(For a share outstanding throughout each period)
| FDP BlackRock CoreAlpha Bond Fund | ||||||||||||||||||||
| Institutional | ||||||||||||||||||||
| Year Ended May 31, | ||||||||||||||||||||
| 2019 | 2018 | 2017 | 2016 | 2015 | ||||||||||||||||
Net asset value, beginning of year | $ | 9.91 | $ | 10.27 | $ | 10.20 | $ | 10.67 | $ | 10.75 | ||||||||||
|
|
|
|
|
|
|
|
|
| |||||||||||
Net investment income(a) | 0.28 | 0.25 | 0.27 | 0.23 | 0.23 | |||||||||||||||
Net realized and unrealized gain (loss) | 0.31 | (0.33 | ) | 0.06 | (0.24 | ) | 0.05 | |||||||||||||
|
|
|
|
|
|
|
|
|
| |||||||||||
Net increase (decrease) from investment operations | 0.59 | (0.08 | ) | 0.33 | (0.01 | ) | 0.28 | |||||||||||||
|
|
|
|
|
|
|
|
|
| |||||||||||
Distributions(b) |
| |||||||||||||||||||
From net investment income | (0.30 | ) | (0.17 | ) | (0.14 | ) | (0.23 | ) | (0.23 | ) | ||||||||||
From net realized gain | — | — | — | (0.23 | ) | (0.13 | ) | |||||||||||||
From return of capital | (0.00 | )(c) | (0.11 | ) | (0.12 | ) | — | — | ||||||||||||
|
|
|
|
|
|
|
|
|
| |||||||||||
Total distributions | (0.30 | ) | (0.28 | ) | (0.26 | ) | (0.46 | ) | (0.36 | ) | ||||||||||
|
|
|
|
|
|
|
|
|
| |||||||||||
Net asset value, end of year | $ | 10.20 | $ | 9.91 | $ | 10.27 | $ | 10.20 | $ | 10.67 | ||||||||||
|
|
|
|
|
|
|
|
|
| |||||||||||
Total Return(d) |
| |||||||||||||||||||
Based on net asset value | 6.10 | % | (0.79 | )% | 3.31 | % | 0.05 | % | 2.61 | % | ||||||||||
|
|
|
|
|
|
|
|
|
| |||||||||||
Ratios to Average Net Assets |
| |||||||||||||||||||
Total expenses | 0.84 | %(e) | 0.79 | % | 0.67 | % | 0.82 | % | 0.69 | % | ||||||||||
|
|
|
|
|
|
|
|
|
| |||||||||||
Total expenses after fees waived and/or reimbursed and paid indirectly | 0.68 | %(e) | 0.68 | % | 0.64 | % | 0.81 | % | 0.69 | % | ||||||||||
|
|
|
|
|
|
|
|
|
| |||||||||||
Net investment income | 2.87 | %(e) | 2.42 | % | 2.63 | % | 2.26 | % | 2.12 | % | ||||||||||
|
|
|
|
|
|
|
|
|
| |||||||||||
Supplemental Data |
| |||||||||||||||||||
Net assets, end of year (000) | $ | 4,267 | $ | 4,792 | $ | 6,868 | $ | 7,507 | $ | 7,455 | ||||||||||
|
|
|
|
|
|
|
|
|
| |||||||||||
Portfolio turnover rate(f) | 187 | % | 301 | % | 277 | % | 315 | % | 283 | % | ||||||||||
|
|
|
|
|
|
|
|
|
| |||||||||||
| (a) | Based on average shares outstanding. |
| (b) | Distributions for annual periods determined in accordance with U.S. federal income tax regulations. |
| (c) | Amount is greater than $(0.005) per share. |
| (d) | Where applicable, assumes the reinvestment of distributions. |
| (e) | Excludes 0.01% of expenses incurred indirectly as a result of investments in underlying funds. |
| (f) | Includes mortgage dollar roll transactions (“MDRs”). Additional information regarding portfolio turnover rate is as follows: |
| Year Ended May 31, | ||||||||||||||||||||||||||||||||||||||||
| 2019 | 2018 | 2017 | 2016 | 2015 | ||||||||||||||||||||||||||||||||||||
Portfolio turnover rate (excluding MDRs) | 111 | % | 164 | % | 175 | % | 115 | % | 80 | % | ||||||||||||||||||||||||||||||
|
|
|
|
|
|
|
|
|
| |||||||||||||||||||||||||||||||
See notes to financial statements.
| 18 | 2019 BLACKROCK ANNUAL REPORTTO SHAREHOLDERS |
Financial Highlights (continued)
(For a share outstanding throughout each period)
| FDP BlackRock CoreAlpha Bond Fund (continued) | ||||||||||||||||||||
| Investor A | ||||||||||||||||||||
| Year Ended May 31, | ||||||||||||||||||||
| 2019 | 2018 | 2017 | 2016 | 2015 | ||||||||||||||||
Net asset value, beginning of year | $ | 9.91 | $ | 10.28 | $ | 10.20 | $ | 10.67 | $ | 10.76 | ||||||||||
|
|
|
|
|
|
|
|
|
| |||||||||||
Net investment income(a) | 0.26 | 0.22 | 0.24 | 0.21 | 0.20 | |||||||||||||||
Net realized and unrealized gain (loss) | 0.32 | (0.33 | ) | 0.08 | (0.25 | ) | 0.04 | |||||||||||||
|
|
|
|
|
|
|
|
|
| |||||||||||
Net increase (decrease) from investment operations | 0.58 | (0.11 | ) | 0.32 | (0.04 | ) | 0.24 | |||||||||||||
|
|
|
|
|
|
|
|
|
| |||||||||||
Distributions(b) |
| |||||||||||||||||||
From net investment income | (0.28 | ) | (0.16 | ) | (0.14 | ) | (0.20 | ) | (0.20 | ) | ||||||||||
From net realized gain | — | — | — | (0.23 | ) | (0.13 | ) | |||||||||||||
From return of capital | (0.00 | )(c) | (0.10 | ) | (0.10 | ) | — | — | ||||||||||||
|
|
|
|
|
|
|
|
|
| |||||||||||
Total distributions | (0.28 | ) | (0.26 | ) | (0.24 | ) | (0.43 | ) | (0.33 | ) | ||||||||||
|
|
|
|
|
|
|
|
|
| |||||||||||
Net asset value, end of year | $ | 10.21 | $ | 9.91 | $ | 10.28 | $ | 10.20 | $ | 10.67 | ||||||||||
|
|
|
|
|
|
|
|
|
| |||||||||||
Total Return(d) |
| |||||||||||||||||||
Based on net asset value | 5.93 | % | (1.13 | )% | 3.16 | % | (0.20 | )% | 2.26 | % | ||||||||||
|
|
|
|
|
|
|
|
|
| |||||||||||
Ratios to Average Net Assets |
| |||||||||||||||||||
Total expenses | 1.09 | %(e) | 1.04 | % | 0.92 | % | 1.07 | % | 0.94 | % | ||||||||||
|
|
|
|
|
|
|
|
|
| |||||||||||
Total expenses after fees waived and/or reimbursed and paid indirectly | 0.93 | %(e) | 0.92 | % | 0.89 | % | 1.06 | % | 0.94 | % | ||||||||||
|
|
|
|
|
|
|
|
|
| |||||||||||
Net investment income | 2.63 | %(e) | 2.18 | % | 2.38 | % | 2.01 | % | 1.87 | % | ||||||||||
|
|
|
|
|
|
|
|
|
| |||||||||||
Supplemental Data | ||||||||||||||||||||
Net assets, end of year (000) | $ | 56,062 | $ | 62,904 | $ | 95,020 | $ | 86,870 | $ | 97,067 | ||||||||||
|
|
|
|
|
|
|
|
|
| |||||||||||
Portfolio turnover rate(f) | 187 | % | 301 | % | 277 | % | 315 | % | 283 | % | ||||||||||
|
|
|
|
|
|
|
|
|
| |||||||||||
| (a) | Based on average shares outstanding. |
| (b) | Distributions for annual periods determined in accordance with U.S. federal income tax regulations. |
| (c) | Amount is greater than $(0.005) per share. |
| (d) | Where applicable, excludes the effects of any sales charges and assumes the reinvestment of distributions. |
| (e) | Excludes 0.01% of expenses incurred indirectly as a result of investments in underlying funds. |
| (f) | Includes mortgage dollar roll transactions (“MDRs”). Additional information regarding portfolio turnover rate is as follows: |
| Year Ended May 31, | ||||||||||||||||||||||||||||||||||||||||
| 2019 | 2018 | 2017 | 2016 | 2015 | ||||||||||||||||||||||||||||||||||||
Portfolio turnover rate (excluding MDRs) | 111 | % | 164 | % | 175 | % | 115 | % | 80 | % | ||||||||||||||||||||||||||||||
|
|
|
|
|
|
|
|
|
| |||||||||||||||||||||||||||||||
See notes to financial statements.
| FINANCIAL HIGHLIGHTS | 19 |
Financial Highlights (continued)
(For a share outstanding throughout each period)
| FDP BlackRock CoreAlpha Bond Fund (continued) | ||||||||||||||||||||
| Investor C | ||||||||||||||||||||
| Year Ended May 31, | ||||||||||||||||||||
| 2019 | 2018 | 2017 | 2016 | 2015 | ||||||||||||||||
Net asset value, beginning of year | $ | 9.91 | $ | 10.28 | $ | 10.20 | $ | 10.67 | $ | 10.76 | ||||||||||
|
|
|
|
|
|
|
|
|
| |||||||||||
Net investment income(a) | 0.21 | 0.17 | 0.19 | 0.15 | 0.14 | |||||||||||||||
Net realized and unrealized gain (loss) | 0.31 | (0.34 | ) | 0.07 | (0.24 | ) | 0.04 | |||||||||||||
|
|
|
|
|
|
|
|
|
| |||||||||||
Net increase (decrease) from investment operations | 0.52 | (0.17 | ) | 0.26 | (0.09 | ) | 0.18 | |||||||||||||
|
|
|
|
|
|
|
|
|
| |||||||||||
Distributions(b) |
| |||||||||||||||||||
From net investment income | (0.22 | ) | (0.12 | ) | (0.11 | ) | (0.15 | ) | (0.14 | ) | ||||||||||
From net realized gain | — | — | — | (0.23 | ) | (0.13 | ) | |||||||||||||
From return of capital | (0.00 | )(c) | (0.08 | ) | (0.07 | ) | — | — | ||||||||||||
|
|
|
|
|
|
|
|
|
| |||||||||||
Total distributions | (0.22 | ) | (0.20 | ) | (0.18 | ) | (0.38 | ) | (0.27 | ) | ||||||||||
|
|
|
|
|
|
|
|
|
| |||||||||||
Net asset value, end of year | $ | 10.21 | $ | 9.91 | $ | 10.28 | $ | 10.20 | $ | 10.67 | ||||||||||
|
|
|
|
|
|
|
|
|
| |||||||||||
Total Return(d) |
| |||||||||||||||||||
Based on net asset value | 5.38 | % | (1.68 | )% | 2.58 | % | (0.76 | )% | 1.69 | % | ||||||||||
|
|
|
|
|
|
|
|
|
| |||||||||||
Ratios to Average Net Assets |
| |||||||||||||||||||
Total expenses | 1.62 | %(e) | 1.59 | % | 1.48 | % | 1.63 | % | 1.50 | % | ||||||||||
|
|
|
|
|
|
|
|
|
| |||||||||||
Total expenses after fees waived and/or reimbursed and paid indirectly | 1.46 | %(e) | 1.47 | % | 1.45 | % | 1.62 | % | 1.50 | % | ||||||||||
|
|
|
|
|
|
|
|
|
| |||||||||||
Net investment income | 2.09 | %(e) | 1.63 | % | 1.84 | % | 1.45 | % | 1.31 | % | ||||||||||
|
|
|
|
|
|
|
|
|
| |||||||||||
Supplemental Data |
| |||||||||||||||||||
Net assets, end of year (000) | $ | 25,315 | $ | 34,474 | $ | 69,120 | $ | 125,490 | $ | 142,617 | ||||||||||
|
|
|
|
|
|
|
|
|
| |||||||||||
Portfolio turnover rate(f) | 187 | % | 301 | % | 277 | % | 315 | % | 283 | % | ||||||||||
|
|
|
|
|
|
|
|
|
| |||||||||||
| (a) | Based on average shares outstanding. |
| (b) | Distributions for annual periods determined in accordance with U.S. federal income tax regulations. |
| (c) | Amount is greater than $(0.005) per share. |
| (d) | Where applicable, excludes the effects of any sales charges and assumes the reinvestment of distributions. |
| (e) | Excludes 0.01% of expenses incurred indirectly as a result of investments in underlying funds. |
| (f) | Includes mortgage dollar roll transactions (“MDRs”). Additional information regarding portfolio turnover rate is as follows: |
| Year Ended May 31, | ||||||||||||||||||||||||||||||||||||||||
| 2019 | 2018 | 2017 | 2016 | 2015 | ||||||||||||||||||||||||||||||||||||
Portfolio turnover rate (excluding MDRs) | 111 | % | 164 | % | 175 | % | 115 | % | 80 | % | ||||||||||||||||||||||||||||||
|
|
|
|
|
|
|
|
|
| |||||||||||||||||||||||||||||||
See notes to financial statements.
| 20 | 2019 BLACKROCK ANNUAL REPORTTO SHAREHOLDERS |
| 1. | ORGANIZATION |
FDP BlackRock CoreAlpha Bond Fund (the “Fund”), a series of FDP Series II, Inc. (the “Trust”), is registered under the Investment Company Act of 1940, as amended (the “1940 Act”), as an open-end management investment company. The Fund is classified as diversified. The Trust is organized as a Maryland corporation.
The Fund offers multiple classes of shares. All classes of shares have identical voting, dividend, liquidation and other rights and are subject to the same terms and conditions, except that certain classes bear expenses related to the shareholder servicing and distribution of such shares. Institutional Shares are sold without a sales charge and only to certain eligible investors. Investor A Shares are generally sold with an initial sales charge, and may be subject to a contingent deferred sales charge (“CDSC”) for certain redemptions where no initial sales charge was paid at the time of purchase. Investor C Shares may be subject to a CDSC. Investor A and Investor C Shares bear certain expenses related to shareholder servicing of such shares, and Investor C Shares also bear certain expenses related to the distribution of such shares. Effective November 8, 2018, the Fund adopted an automatic conversion feature whereby Investor C Shares held for approximately ten years will be automatically converted into Investor A Shares, and, thereafter, investors will be subject to lower ongoing fees. Each class has exclusive voting rights with respect to matters relating to its shareholder servicing and distribution expenditures (except that Investor C shareholders may vote on material changes to the Investor A Shares distribution and service plan). Shares are only available for purchase through the FDP Service.
| Share Class | Initial Sales Charge | CDSC | Conversion Privilege | |||||
Institutional Shares | No | No | None | |||||
Investor A Shares | Yes | No | (a) | None | ||||
Investor C Shares | No | Yes | To Investor A Shares after approximately 10 years | |||||
| (a) | Investor A Shares may be subject to a contingent deferred sales charge (“CDSC”) for certain redemptions where no initial sales charge was paid at the time of purchase. |
The Fund, together with certain other registered investment companies advised by BlackRock Advisors, LLC (the “Manager”) or its affiliates, is included in a complex of non-index fixed-income mutual funds and all BlackRock-advised closed-end funds referred to as the BlackRock Fixed-Income Complex.
On May 1, 2019, the Board of Directors of FDP Series II, Inc. (the “Board”) and the Board of Trustees of BlackRock Funds VI each approved the reorganization of the Fund with and into BlackRock CoreAlpha Bond Fund, a series of BlackRock Funds VI. BlackRock CoreAlpha Bond Fund is a “feeder” fund that invests all of its assets in CoreAlpha Bond Master Portfolio, a series of Master Investment Portfolio II. The reorganization is expected to occur during the third quarter of 2019 and is not subject to approval by the Fund’s shareholders.
Reorganization: The Board approved an Agreement and Plan of Reorganization with respect to the FDP BlackRock CoreAlpha Bond Fund (the “Target Fund”), pursuant to which the Target Fund reorganized into a newly created series (the “Acquiring Fund”) of FDP Series II, Inc., a newly organized Maryland corporation. The reorganization (the “Reorganization”) closed on September 17, 2018 and was not subject to approval by shareholders of the Target Fund.
The Reorganization was effected in connection with the reconfiguration of the boards of directors/trustees of certain BlackRock-advised funds.
The Acquiring Fund has the same investment objective, strategies and policies, investment adviser,sub-adviser, portfolio management team and service providers as the Target Fund. The Target Fund is the performance and accounting survivor of its Reorganization, meaning that the Acquiring Fund assumed the performance and financial history of the Target Fund upon completion of the Reorganization. In addition, the Acquiring Fund is subject to the same contractual arrangements, including the same contractual fees and expenses, as those of the Target Fund as of the date of the Reorganization. The Reorganization wastax-free, meaning that the Target Fund’s shareholders became shareholders of the Acquiring Fund without realizing any gain or loss for federal income tax purposes.
As a result, the Acquiring Fund acquired all of the assets and assumed all of the liabilities of the Target Fund in exchange for an equal aggregate value of newly-issued shares of the Acquiring Fund. Each shareholder of the Target Fund received shares of the Acquiring Fund in an amount equal to the aggregate net asset value (“NAV”) of such shareholder’s Target Fund shares, as determined at the close of business on September 14, 2018.
The Reorganization was accomplished by atax-free exchange of shares of the Acquiring Fund in the following amounts and at the following conversion ratio:
| Target Fund | Shares Prior to Reorganization | Conversion Ratio | Shares Post-Reorganization | |||||||||
FDP BlackRock CoreAlpha Bond Fund | 9,610,750 | 1 | 9,610,750 | |||||||||
For financial reporting purposes, assets received and shares issued by the Acquiring Fund were recorded at fair value. However, the cost basis of the investments received from the Target Fund were carried forward to align ongoing reporting of the Acquiring Fund’s realized and unrealized gains and losses with amounts distributable to shareholders for tax purposes.
Prior to the Reorganization, the Acquiring Fund had not yet commenced operations and had no assets or liabilities. The Target Fund’s net assets, fair value and cost of investments and derivative financial instruments prior to the Reorganization were as follows:
| Target Fund | Net Assets | Fair Value of Investments | Cost of Investments | |||||||||
FDP BlackRock CoreAlpha Bond Fund | $ | 94,478,105 | $ | 102,957,123 | $ | 104,500,095 | ||||||
Prior to the Reorganization’s effective date, the Target Fund began to incur expenses in connection with the realignment and consolidation of the boards of directors/trustees of certain BlackRock-advised funds. These expenses and liabilities have been assumed by the Acquiring Fund. The Manager has voluntarily agreed to reimburse certain Acquiring Funds for all or a portion of such expenses, which amounts are included in fees waived and/or reimbursed by the Manager in the Statement of Operations.
| NOTESTO FINANCIAL STATEMENTS | 21 |
Notes to Financial Statements (continued)
| 2. | SIGNIFICANT ACCOUNTING POLICIES |
The financial statements are prepared in conformity with accounting principles generally accepted in the United States of America (“U.S. GAAP”), which may require management to make estimates and assumptions that affect the reported amounts of assets and liabilities in the financial statements, disclosure of contingent assets and liabilities at the date of the financial statements and the reported amounts of increases and decreases in net assets from operations during the reporting period. Actual results could differ from those estimates. The Fund is considered an investment company under U.S. GAAP and follows the accounting and reporting guidance applicable to investment companies. Below is a summary of significant accounting policies:
Investment Transactions and Income Recognition: For financial reporting purposes, investment transactions are recorded on the dates the transactions are executed (the “trade dates”). Realized gains and losses on investment transactions are determined on the identified cost basis. Dividend income is recorded on theex-dividend date. Dividends from foreign securities where theex-dividend date may have passed are subsequently recorded when the Fund is informed of theex-dividend date. Under the applicable foreign tax laws, a withholding tax at various rates may be imposed on capital gains, dividends and interest. Upon notification from issuers, a portion of the dividend income received from a real estate investment trust may be redesignated as a reduction of cost of the related investment and/or realized gain. Interest income, including amortization and accretion of premiums and discounts on debt securities, is recognized on an accrual basis. Income, expenses and realized and unrealized gains and losses are allocated daily to each class based on its relative net assets.
Foreign Currency Translation: The Fund’s books and records are maintained in U.S. dollars. Securities and other assets and liabilities denominated in foreign currencies are translated into U.S. dollars using exchange rates determined as of the close of trading on the New York Stock Exchange (“NYSE”). Purchases and sales of investments are recorded at the rates of exchange prevailing on the respective dates of such transactions. Generally, when the U.S. dollar rises in value against a foreign currency, the investments denominated in that currency will lose value; the opposite effect occurs if the U.S. dollar falls in relative value.
The Fund does not isolate the portion of the results of operations arising as a result of changes in the exchange rates from the changes in the market prices of investments held or sold for financial reporting purposes. Accordingly, the effects of changes in exchange rates on investments are not segregated in the Statement of Operations from the effects of changes in market prices of those investments, but are included as a component of net realized and unrealized gain (loss) from investments. The Fund reports realized currency gains (losses) on foreign currency related transactions as components of net realized gain (loss) for financial reporting purposes, whereas such components are generally treated as ordinary income for U.S. federal income tax purposes.
Segregation and Collateralization: In cases where the Fund enters into certain investments (e.g., dollar rolls, TBA sale commitments, futures contracts and swaps) that would be treated as “senior securities” for 1940 Act purposes, the Fund may segregate or designate on its books and records cash or liquid assets having a market value at least equal to the amount of its future obligations under such investments. Doing so allows the investment to be excluded from treatment as a “senior security.” Furthermore, if required by an exchange or counterparty agreement, the Fund may be required to deliver/deposit cash and/or securities to/with an exchange, or broker-dealer or custodian as collateral for certain investments or obligations.
Distributions: Distributions from net investment income are declared daily and paid monthly. Distributions of capital gains are recorded on theex-dividend date and made at least annually. The portion of distributions, if any, that exceeds a fund’s current and accumulated earnings and profits, as measured on a tax basis, constitute anon-taxable return of capital. The character and timing of distributions are determined in accordance with U.S. federal income tax regulations, which may differ from U.S. GAAP.
Deferred Compensation Plan: Under the Deferred Compensation Plan (the “Plan”) approved by the Fund’s Board effective January 1, 2019, the directors who are not “interested persons” of the Fund, as defined in the 1940 Act (“Independent Directors”), may defer a portion of their annual complex-wide compensation. Deferred amounts earn an approximate return as though equivalent dollar amounts had been invested in common shares of certain funds in the BlackRock Fixed-Income Complex selected by the Independent Directors. This has the same economic effect for the Independent Directors as if the Independent Directors had invested the deferred amounts directly in certain funds in the BlackRock Fixed-Income Complex.
The Plan is not funded and obligations thereunder represent general unsecured claims against the general assets of the Fund, as applicable. Deferred compensation liabilities are included in the Directors’ and Officer’s fees payable in the Statement of Assets and Liabilities and will remain as a liability of the Fund until such amounts are distributed in accordance with the Plan.
Recent Accounting Standards: In March 2017, the Financial Accounting Standards Board issued Accounting Standards Update “Premium Amortization of Purchased Callable Debt Securities” which amends the amortization period for certain purchased callable debt securities. Under the new guidance, the premium amortization of purchased callable debt securities that have explicit,non-contingent call features and are callable at fixed prices will be amortized to the earliest call date. The guidance will be applied on a modified retrospective basis and is effective for fiscal years, and their interim periods, beginning after December 15, 2018. Management continues to evaluate the impact of this guidance on the Fund.
Indemnifications: In the normal course of business, the Fund enters into contracts that contain a variety of representations that provide general indemnification. The Fund’s maximum exposure under these arrangements is unknown because it involves future potential claims against the Fund, which cannot be predicted with any certainty.
Other: Expenses directly related to the Fund or its classes are charged to the Fund or the applicable class. Other operating expenses shared by several funds, including other funds managed by the Manager, are prorated among those funds on the basis of relative net assets or other appropriate methods. Expenses directly related to the Fund and other shared expenses prorated to the Fund are allocated daily to each class based on its relative net assets or other appropriate methods.
The Fund has an arrangement with its custodian whereby credits are earned on uninvested cash balances, which could be used to reduce custody fees and/or overdraft charges. The Fund may incur charges on certain uninvested cash balances and overdrafts, subject to certain conditions.
| 22 | 2019 BLACKROCK ANNUAL REPORTTO SHAREHOLDERS |
Notes to Financial Statements (continued)
| 3. | INVESTMENT VALUATION AND FAIR VALUE MEASUREMENTS |
Investment Valuation Policies: The Fund’s investments are valued at fair value (also referred to as “market value” within the financial statements) as of the close of trading on the NYSE (generally 4:00 p.m., Eastern time). U.S. GAAP defines fair value as the price the Fund would receive to sell an asset or pay to transfer a liability in an orderly transaction between market participants at the measurement date. The Fund determines the fair values of its financial instruments using various independent dealers or pricing services under policies approved by the Board. The BlackRock Global Valuation Methodologies Committee (the “Global Valuation Committee”) is the committee formed by management to develop global pricing policies and procedures and to oversee the pricing function for all financial instruments.
Fair Value Inputs and Methodologies: The following methods and inputs are used to establish the fair value of the Fund’s assets and liabilities:
| • | Equity investments traded on a recognized securities exchange are valued at the official closing price each day, if available. For equity investments traded on more than one exchange, the official closing price on the exchange where the stock is primarily traded is used. Equity investments traded on a recognized exchange for which there were no sales on that day may be valued at the last available bid (long positions) or ask (short positions) price. |
| • | Fixed-income securities for which market quotations are readily available are generally valued using the last available bid prices or current market quotations provided by independent dealers or third party pricing services. Floating rate loan interests are valued at the mean of the bid prices from one or more independent brokers or dealers as obtained from a third party pricing service. Pricing services generally value fixed-income securities assuming orderly transactions of an institutional round lot size, but a fund may hold or transact in such securities in smaller, odd lot sizes. Odd lots may trade at lower prices than institutional round lots. The pricing services may use matrix pricing or valuation models that utilize certain inputs and assumptions to derive values, including transaction data (e.g., recent representative bids and offers), credit quality information, perceived market movements, news, and other relevant information. Certain fixed-income securities, including asset-backed and mortgage related securities may be valued based on valuation models that consider the estimated cash flows of each tranche of the entity, establish a benchmark yield and develop an estimated tranche specific spread to the benchmark yield based on the unique attributes of the tranche. The amortized cost method of valuation may be used with respect to debt obligations with sixty days or less remaining to maturity unless the Manager determines such method does not represent fair value. |
Generally, trading in foreign instruments is substantially completed each day at various times prior to the close of trading on the NYSE. Occasionally, events affecting the values of such instruments may occur between the foreign market close and the close of trading on the NYSE that may not be reflected in the computation of the Fund’s net assets. Each business day, the Fund uses a pricing service to assist with the valuation of certain foreign exchange-traded equity securities and foreign exchange-tradedover-the-counter (“OTC”) options (the “Systematic Fair Value Price”). Using current market factors, the Systematic Fair Value Price is designed to value such foreign securities and foreign options at fair value as of the close of trading on the NYSE, which follows the close of the local markets.
| • | Municipal investments (including commitments to purchase such investments on a “when-issued” basis) are valued on the basis of prices provided by dealers or pricing services. In determining the value of a particular investment, pricing services may use certain information with respect to transactions in such investments, quotations from dealers, pricing matrixes, market transactions in comparable investments and information with respect to various relationships between investments. |
| • | Investments inopen-end U.S. mutual funds are valued at NAV each business day. |
| • | Futures contracts traded on exchanges are valued at their last sale price. |
| • | Swap agreements are valued utilizing quotes received daily by the Fund’s pricing service or through brokers, which are derived using daily swap curves and models that incorporate a number of market data factors, such as discounted cash flows, trades and values of the underlying reference instruments. |
| • | To-be-announced (“TBA”) commitments are valued on the basis of last available bid prices or current market quotations provided by pricing services. |
If events (e.g., a company announcement, market volatility or a natural disaster) occur that are expected to materially affect the value of such investments, or in the event that the application of these methods of valuation results in a price for an investment that is deemed not to be representative of the market value of such investment, or if a price is not available, the investment will be valued by the Global Valuation Committee, or its delegate, in accordance with a policy approved by the Board as reflecting fair value (“Fair Valued Investments”). The fair valuation approaches that may be used by the Global Valuation Committee will include market approach, income approach and cost approach. Valuation techniques such as discounted cash flow, use of market comparables and matrix pricing are types of valuation approaches and are typically used in determining fair value. When determining the price for Fair Valued Investments, the Global Valuation Committee, or its delegate, seeks to determine the price that the Fund might reasonably expect to receive or pay from the current sale or purchase of that asset or liability in anarm’s-length transaction. Fair value determinations shall be based upon all available factors that the Global Valuation Committee, or its delegate, deems relevant and consistent with the principles of fair value measurement. The pricing of all Fair Valued Investments is subsequently reported to the Board or a committee thereof on a quarterly basis.
| NOTESTO FINANCIAL STATEMENTS | 23 |
Notes to Financial Statements (continued)
For investments in equity or debt issued by privately held companies or funds (“Private Company” or collectively, the “Private Companies”) and other Fair Valued Investments, the fair valuation approaches that are used by third party pricing services utilize one or a combination of, but not limited to, the following inputs.
| Standard Inputs Generally Considered By Third Party Pricing Services | ||
Market approach | (i) recent market transactions, including subsequent rounds of financing, in the underlying investment or comparable issuers; (ii) recapitalizations and other transactions across the capital structure; and (iii) market multiples of comparable issuers. | |
Income approach | (i) future cash flows discounted to present and adjusted as appropriate for liquidity, credit, and/or market risks; (ii) quoted prices for similar investments or assets in active markets; and (iii) other risk factors, such as interest rates, yield curves, volatilities, prepayment speeds, loss severities, credit risks, recovery rates, liquidation amounts and/or default rates. | |
Cost approach | (i) audited or unaudited financial statements, investor communications and financial or operational metrics issued by the Private Company; (ii) changes in the valuation of relevant indices or publicly traded companies comparable to the Private Company; (iii) relevant news and other public sources; and (iv) known secondary market transactions in the Private Company’s interests and merger or acquisition activity in companies comparable to the Private Company. |
Investments in series of preferred stock issued by Private Companies are typically valued utilizing market approach in determining the enterprise value of the company. Such investments often contain rights and preferences that differ from other series of preferred and common stock of the same issuer. Valuation techniques such as an option pricing model (“OPM”), a probability weighted expected return model (“PWERM”) or a hybrid of those techniques are used in allocating enterprise value of the company, as deemed appropriate under the circumstances. The use of OPM and PWERM techniques involve a determination of the exit scenarios of the investment in order to appropriately allocate the enterprise value of the company among the various parts of its capital structure.
The Private Companies are not subject to the public company disclosure, timing, and reporting standards as other investments held by the Fund. Typically, the most recently available information by a Private Company is as of a date that is earlier than the date the Fund is calculating its NAV. This factor may result in a difference between the value of the investment and the price the Fund could receive upon the sale of the investment.
Fair Value Hierarchy: Various inputs are used in determining the fair value of investments and derivative financial instruments. These inputs to valuation techniques are categorized into a fair value hierarchy consisting of three broad levels for financial statement purposes as follows:
| • | Level 1 — Unadjusted price quotations in active markets/exchanges for identical assets or liabilities that the Fund has the ability to access |
| • | Level 2 — Other observable inputs (including, but not limited to, quoted prices for similar assets or liabilities in markets that are active, quoted prices for identical or similar assets or liabilities in markets that are not active, inputs other than quoted prices that are observable for the assets or liabilities (such as interest rates, yield curves, volatilities, prepayment speeds, loss severities, credit risks and default rates) or other market-corroborated inputs) |
| • | Level 3 — Unobservable inputs based on the best information available in the circumstances, to the extent observable inputs are not available (including the Fund’s own assumptions used in determining the fair value of investments and derivative financial instruments) |
The hierarchy gives the highest priority to unadjusted quoted prices in active markets for identical assets or liabilities (Level 1 measurements) and the lowest priority to unobservable inputs (Level 3 measurements). Accordingly, the degree of judgment exercised in determining fair value is greatest for instruments categorized in Level 3. The inputs used to measure fair value may fall into different levels of the fair value hierarchy. In such cases, for disclosure purposes, the fair value hierarchy classification is determined based on the lowest level input that is significant to the fair value measurement in its entirety. Investments classified within Level 3 have significant unobservable inputs used by the Global Valuation Committee in determining the price for Fair Valued Investments. Level 3 investments include equity or debt issued by Private Companies. There may not be a secondary market, and/or there are a limited number of investors. The categorization of a value determined for investments and derivative financial instruments is based on the pricing transparency of the investments and derivative financial instruments and is not necessarily an indication of the risks associated with investing in those securities.
| 4. | SECURITIES AND OTHER INVESTMENTS |
Asset-Backed and Mortgage-Backed Securities: Asset-backed securities are generally issued as pass-through certificates or as debt instruments. Asset-backed securities issued as pass-through certificates represent undivided fractional ownership interests in an underlying pool of assets. Asset-backed securities issued as debt instruments, which are also known as collateralized obligations, are typically issued as the debt of a special purpose entity organized solely for the purpose of owning such assets and issuing such debt. Asset-backed securities are often backed by a pool of assets representing the obligations of a number of different parties. The yield characteristics of certain asset-backed securities may differ from traditional debt securities. One such major difference is that all or a principal part of the obligations may be prepaid at any time because the underlying assets (i.e., loans) may be prepaid at any time. As a result, a decrease in interest rates in the market may result in increases in the level of prepayments as borrowers, particularly mortgagors, refinance and repay their loans. An increased prepayment rate with respect to an asset-backed security will have the effect of shortening the maturity of the security. In addition, a fund may subsequently have to reinvest the proceeds at lower interest rates. If a fund has purchased such an asset-backed security at a premium, a faster than anticipated prepayment rate could result in a loss of principal to the extent of the premium paid.
For mortgage pass-through securities (the “Mortgage Assets”) there are a number of important differences among the agencies and instrumentalities of the U.S. Government that issue mortgage-related securities and among the securities that they issue. For example, mortgage-related securities guaranteed by Ginnie Mae are guaranteed as to the timely payment of principal and interest by Ginnie Mae and such guarantee is backed by the full faith and credit of the United States. However,
| 24 | 2019 BLACKROCK ANNUAL REPORTTO SHAREHOLDERS |
Notes to Financial Statements (continued)
mortgage-related securities issued by Freddie Mac and Fannie Mae, including Freddie Mac and Fannie Mae guaranteed mortgage pass-through certificates, which are solely the obligations of Freddie Mac and Fannie Mae, are not backed by or entitled to the full faith and credit of the United States, but are supported by the right of the issuer to borrow from the U.S. Treasury.
Non-agency mortgage-backed securities are securities issued bynon-governmental issuers and have no direct or indirect government guarantees of payment and are subject to various risks.Non-agency mortgage loans are obligations of the borrowers thereunder only and are not typically insured or guaranteed by any other person or entity. The ability of a borrower to repay a loan is dependent upon the income or assets of the borrower. A number of factors, including a general economic downturn, acts of God, terrorism, social unrest and civil disturbances, may impair a borrower’s ability to repay its loans.
Multiple Class Pass-Through Securities: Multiple class pass-through securities, including collateralized mortgage obligations (“CMOs”) and commercial mortgage-backed securities, may be issued by Ginnie Mae, U.S. Government agencies or instrumentalities or by trusts formed by private originators of, or investors in, mortgage loans. In general, CMOs are debt obligations of a legal entity that are collateralized by a pool of residential or commercial mortgage loans or Mortgage Assets. The payments on these are used to make payments on the CMOs or multiple pass-through securities. Multiple class pass-through securities represent direct ownership interests in the Mortgage Assets. Classes of CMOs include interest only (“IOs”), principal only (“POs”), planned amortization classes and targeted amortization classes. IOs and POs are stripped mortgage-backed securities representing interests in a pool of mortgages, the cash flow from which has been separated into interest and principal components. IOs receive the interest portion of the cash flow while POs receive the principal portion. IOs and POs can be extremely volatile in response to changes in interest rates. As interest rates rise and fall, the value of IOs tends to move in the same direction as interest rates. POs perform best when prepayments on the underlying mortgages rise since this increases the rate at which the principal is returned and the yield to maturity on the PO. When payments on mortgages underlying a PO are slower than anticipated, the life of the PO is lengthened and the yield to maturity is reduced. If the underlying Mortgage Assets experience greater than anticipated prepayments of principal, a fund’s initial investment in the IOs may not fully recoup.
Floating Rate Loan Interests: Floating rate loan interests are typically issued to companies (the “borrower”) by banks, other financial institutions, or privately and publicly offered corporations (the “lender”). Floating rate loan interests are generallynon-investment grade, often involve borrowers whose financial condition is troubled or uncertain and companies that are highly leveraged or in bankruptcy proceedings. In addition, transactions in floating rate loan interests may settle on a delayed basis, which may result in proceeds from the sale not being readily available for a fund to make additional investments or meet its redemption obligations. Floating rate loan interests may include fully funded term loans or revolving lines of credit. Floating rate loan interests are typically senior in the corporate capital structure of the borrower. Floating rate loan interests generally pay interest at rates that are periodically determined by reference to a base lending rate plus a premium. Since the rates reset only periodically, changes in prevailing interest rates (and particularly sudden and significant changes) can be expected to cause some fluctuations in the NAV of a fund to the extent that it invests in floating rate loan interests. The base lending rates are generally the lending rate offered by one or more European banks, such as the London Interbank Offered Rate (“LIBOR”), the prime rate offered by one or more U.S. banks or the certificate of deposit rate. Floating rate loan interests may involve foreign borrowers, and investments may be denominated in foreign currencies. These investments are treated as investments in debt securities for purposes of a fund’s investment policies.
When a fund purchases a floating rate loan interest, it may receive a facility fee and when it sells a floating rate loan interest, it may pay a facility fee. On an ongoing basis, a fund may receive a commitment fee based on the undrawn portion of the underlying line of credit amount of a floating rate loan interest. Facility and commitment fees are typically amortized to income over the term of the loan or term of the commitment, respectively. Consent and amendment fees are recorded to income as earned. Prepayment penalty fees, which may be received by a fund upon the prepayment of a floating rate loan interest by a borrower, are recorded as realized gains. A fund may invest in multiple series or tranches of a loan. A different series or tranche may have varying terms and carry different associated risks.
Floating rate loan interests are usually freely callable at the borrower’s option. A fund may invest in such loans in the form of participations in loans (“Participations”) or assignments (“Assignments”) of all or a portion of loans from third parties. Participations typically will result in a fund having a contractual relationship only with the lender, not with the borrower. A fund has the right to receive payments of principal, interest and any fees to which it is entitled only from the lender selling the Participation and only upon receipt by the lender of the payments from the borrower. In connection with purchasing Participations, a fund generally will have no right to enforce compliance by the borrower with the terms of the loan agreement, nor any rights of offset against the borrower. A fund may not benefit directly from any collateral supporting the loan in which it has purchased the Participation. As a result, a fund assumes the credit risk of both the borrower and the lender that is selling the Participation. A fund’s investment in loan participation interests involves the risk of insolvency of the financial intermediaries who are parties to the transactions. In the event of the insolvency of the lender selling the Participation, a fund may be treated as a general creditor of the lender and may not benefit from any offset between the lender and the borrower. Assignments typically result in a fund having a direct contractual relationship with the borrower, and a fund may enforce compliance by the borrower with the terms of the loan agreement.
TBA Commitments: TBA commitments are forward agreements for the purchase or sale of mortgage-backed securities for a fixed price, with payment and delivery on an agreed upon future settlement date. The specific securities to be delivered are not identified at the trade date. However, delivered securities must meet specified terms, including issuer, rate and mortgage terms. When entering into TBA commitments, a fund may take possession of or deliver the underlying mortgage-backed securities but can extend the settlement or roll the transaction. TBA commitments involve a risk of loss if the value of the security to be purchased or sold declines or increases, respectively, prior to settlement date.
In order to better define contractual rights and to secure rights that will help a fund mitigate their counterparty risk, TBA commitments may be entered into by a fund under Master Securities Forward Transaction Agreements (each, an “MSFTA”). An MSFTA typically contains, among other things, collateral posting terms and netting provisions in the event of default and/or termination event. The collateral requirements are typically calculated by netting themark-to-market amount for each transaction under such agreement and comparing that amount to the value of the collateral currently pledged by a fund and the counterparty. Cash collateral that has been pledged to cover the obligations of a fund and cash collateral received from the counterparty, if any, is reported separately in the Statement of Assets and Liabilities as cash pledged as collateral for TBA commitments or cash received as collateral for TBA commitments, respectively.Non-cash collateral pledged by a fund, if any, is noted in the Schedule of Investments. Typically, a fund is permitted to sell,re-pledge or use the collateral it receives; however, the counterparty is not permitted to do so. To the extent amounts due to a fund are not fully collateralized, contractually or otherwise, a fund bears the risk of loss from counterpartynon-performance.
| NOTESTO FINANCIAL STATEMENTS | 25 |
Notes to Financial Statements (continued)
Mortgage Dollar Roll Transactions: The Fund may sell TBA mortgage-backed securities and simultaneously contract to repurchase substantially similar (i.e., same type, coupon and maturity) securities on a specific future date at an agreed upon price. During the period between the sale and repurchase, a fund is not entitled to receive interest and principal payments on the securities sold. Mortgage dollar roll transactions are treated as purchases and sales and realizes gains and losses on these transactions. Mortgage dollar rolls involve the risk that the market value of the securities that a fund is required to purchase may decline below the agreed upon repurchase price of those securities.
| 5. | DERIVATIVE FINANCIAL INSTRUMENTS |
The Fund engages in various portfolio investment strategies using derivative contracts both to increase the returns of the Fund and/or to manage its exposure to certain risks such as credit risk, equity risk, interest rate risk, foreign currency exchange rate risk, commodity price risk or other risks (e.g., inflation risk). Derivative financial instruments categorized by risk exposure are included in the Schedule of Investments. These contracts may be transacted on an exchange or OTC.
Futures Contracts: Futures contracts are purchased or sold to gain exposure to, or manage exposure to, changes in interest rates (interest rate risk) and changes in the value of equity securities (equity risk) or foreign currencies (foreign currency exchange rate risk).
Futures contracts are agreements between the Fund and a counterparty to buy or sell a specific quantity of an underlying instrument at a specified price and on a specified date. Depending on the terms of a contract, it is settled either through physical delivery of the underlying instrument on the settlement date or by payment of a cash amount on the settlement date. Upon entering into a futures contract, the Fund is required to deposit initial margin with the broker in the form of cash or securities in an amount that varies depending on a contract’s size and risk profile. The initial margin deposit must then be maintained at an established level over the life of the contract. Amounts pledged, which are considered restricted, are included in cash pledged for futures contracts in the Statement of Assets and Liabilities.
Securities deposited as initial margin are designated in the Schedule of Investments and cash deposited, if any, is shown as cash pledged for futures contracts in the Statement of Assets and Liabilities. Pursuant to the contract, the Fund agrees to receive from or pay to the broker an amount of cash equal to the daily fluctuation in market value of the contract (“variation margin”). Variation margin is recorded as unrealized appreciation (depreciation) and, if any, shown as variation margin receivable (or payable) on futures contracts in the Statement of Assets and Liabilities. When the contract is closed, a realized gain or loss is recorded in the Statement of Operations equal to the difference between the notional amount of the contract at the time it was opened and the notional amount at the time it was closed. The use of futures contracts involves the risk of an imperfect correlation in the movements in the price of futures contracts and interest, foreign currency exchange rates or underlying assets.
Swaps: Swap contracts are entered into to manage exposure to issuers, markets and securities. Such contracts are agreements between the Fund and a counterparty to make periodic net payments on a specified notional amount or a net payment upon termination. Swap agreements are privately negotiated in the OTC market and may be entered into as a bilateral contract (“OTC swaps”) or centrally cleared (“centrally cleared swaps”).
For OTC swaps, any upfront premiums paid and any upfront fees received are shown as swap premiums paid and swap premiums received, respectively, in the Statement of Assets and Liabilities and amortized over the term of the contract. The daily fluctuation in market value is recorded as unrealized appreciation (depreciation) on OTC Swaps in the Statement of Assets and Liabilities. Payments received or paid are recorded in the Statement of Operations as realized gains or losses, respectively. When an OTC swap is terminated, a realized gain or loss is recorded in the Statement of Operations equal to the difference between the proceeds from (or cost of) the closing transaction and the Fund’s basis in the contract, if any. Generally, the basis of the contract is the premium received or paid.
In a centrally cleared swap, immediately following execution of the swap contract, the swap contract is novated to a central counterparty (the “CCP”) and the Fund’s counterparty on the swap agreement becomes the CCP. The Fund is required to interface with the CCP through the broker. Upon entering into a centrally cleared swap, the Fund is required to deposit initial margin with the broker in the form of cash or securities in an amount that varies depending on the size and risk profile of the particular swap. Securities deposited as initial margin are designated in the Schedule of Investments and cash deposited is shown as cash pledged for centrally cleared swaps in the Statement of Assets and Liabilities. Amounts pledged, which are considered restricted cash, are included in cash pledged for centrally cleared swaps in the Statement of Assets and Liabilities. Pursuant to the contract, the Fund agrees to receive from or pay to the broker an amount of cash equal to the daily fluctuation in market value of the contract (“variation margin”). Variation margin is recorded as unrealized appreciation (depreciation) and shown as variation margin receivable (or payable) on centrally cleared swaps in the Statement of Assets and Liabilities. Payments received from (paid to) the counterparty, including at termination, are recorded as realized gains (losses) in the Statement of Operations.
| • | Inflation swaps — Inflation swaps are entered into to gain or reduce exposure to inflation (inflation risk). In an inflation swap, one party makes fixed interest payments on a notional principal amount in exchange for another party’s variable payments based on an inflation index, such as the Consumer Price Index. |
Master Netting Arrangements: In order to define its contractual rights and to secure rights that will help it mitigate its counterparty risk, the Fund may enter into an International Swaps and Derivatives Association, Inc. Master Agreement (“ISDA Master Agreement”) or similar agreement with its counterparties. An ISDA Master Agreement is a bilateral agreement between the Fund and a counterparty that governs certain OTC derivatives and typically contains, among other things, collateral posting terms and netting provisions in the event of a default and/or termination event. Under an ISDA Master Agreement, the Fund may, under certain circumstances, offset with the counterparty certain derivative financial instruments’ payables and/or receivables with collateral held and/or posted and create one single net payment. The provisions of the ISDA Master Agreement typically permit a single net payment in the event of default including the bankruptcy or insolvency of the counterparty. Bankruptcy or insolvency laws of a particular jurisdiction may restrict or prohibit the right of offset in bankruptcy, insolvency or other events.
Collateral Requirements: For derivatives traded under an ISDA Master Agreement, the collateral requirements are typically calculated by netting themark-to-market amount for each transaction under such agreement and comparing that amount to the value of any collateral currently pledged by the Fund and the counterparty.
Cash collateral that has been pledged to cover obligations of the Fund and cash collateral received from the counterparty, if any, is reported separately in the Statement of Assets and Liabilities as cash pledged as collateral and cash received as collateral, respectively.Non-cash collateral pledged by the Fund, if any, is noted in the Schedule of Investments. Generally, the amount of collateral due from or to a counterparty is subject to a certain minimum transfer amount threshold before a transfer is required,
| 26 | 2019 BLACKROCK ANNUAL REPORTTO SHAREHOLDERS |
Notes to Financial Statements (continued)
which is determined at the close of business of the Fund. Any additional required collateral is delivered to/pledged by the Fund on the next business day. Typically, the counterparty is not permitted to sell,re-pledge or use cash andnon-cash collateral it receives. The Fund generally agrees not to usenon-cash collateral that it receives but may, absent default or certain other circumstances defined in the underlying ISDA Master Agreement, be permitted to use cash collateral received. In such cases, interest may be paid pursuant to the collateral arrangement with the counterparty. To the extent amounts due to the Fund from its counterparties are not fully collateralized, it bears the risk of loss from counterpartynon-performance. Likewise, to the extent the Fund has delivered collateral to a counterparty and stands ready to perform under the terms of its agreement with such counterparty, it bears the risk of loss from a counterparty in the amount of the value of the collateral in the event the counterparty fails to return such collateral. Based on the terms of agreements, collateral may not be required for all derivative contracts.
For financial reporting purposes, the Fund does not offset derivative assets and derivative liabilities that are subject to netting arrangements, if any, in the Statement of Assets and Liabilities.
| 6. | INVESTMENT ADVISORY AGREEMENT AND OTHER TRANSACTIONS WITH AFFILIATES |
Investment Advisory: The Fund entered into an Investment Advisory Agreement with the Manager, the Fund’s investment adviser and an indirect, wholly-owned subsidiary of BlackRock, to provide investment advisory and administrative services. The Manager is responsible for the management of the Fund’s portfolio and provides the personnel, facilities, equipment and certain other services necessary to the operations of the Fund.
For such services, the Fund pays the Manager a monthly fee at an annual rate equal to the following percentages of the average daily value of the Fund’s net assets.
| Average Daily Net Assets | ||||
Not exceeding $1 Billion | 0.40 | % | ||
$1 Billion — $3 Billion | 0.38 | |||
$3 Billion — $5 Billion | 0.36 | |||
$5 Billion — $10 Billion | 0.35 | |||
Greater than $10 Billion | 0.34 | |||
Service and Distribution Fees: The Fund entered into a Distribution Agreement and Distribution and Service Plan with BlackRock Investments, LLC (“BRIL”), an affiliate of the Manager. Pursuant to the Distribution and Service Plan and in accordance with Rule12b-1 under the 1940 Act, the Fund pays BRIL ongoing service and distribution fees. The fees are accrued daily and paid monthly at annual rates based upon the average daily net assets of the relevant share class of the Fund as follows:
| Distribution Fees | Service Fees | |||||||
Investor A | — | % | 0.25 | % | ||||
Investor C | 0.55 | 0.25 | ||||||
BRIL and broker-dealers, pursuant tosub-agreements with BRIL, provide shareholder servicing and distribution services to the Fund. The ongoing service and/or distribution fee compensates/reimburses BRIL and each broker-dealer for providing shareholder servicing and/or distribution related services to shareholders.
For the year ended May 31, 2019, the following table shows the class specific service and distribution fees borne directly by each share class of the Fund:
| Investor A | Investor C | Total | ||||||||||||
| $ | 145,568 | $ | 229,196 | $ | 374,764 | |||||||||
Transfer Agent: For the year ended May 31, 2019, the following table shows the class specific transfer agent fees borne directly by each share class of the Fund:
| Institutional | Investor A | Investor C | Total | |||||||||||||||||
| $ | 5,030 | $ | 67,102 | $ | 26,941 | $ | 99,073 | |||||||||||||
In addition, the Fund pays the transfer agent, which is not an affiliate, a fee for the issuance, transfer and redemption of shares and the opening and maintenance of shareholder accounts, which is included in transfer agent in the Statement of Operations.
Expense Limitations, Waivers and Reimbursements: With respect to the Fund, the Manager has contractually agreed to waive a portion of its investment advisory fees to cap the annual management fee of the Fund at 0.32% through September 30, 2019. The contractual agreement may be terminated upon 90 days’ notice by a majority of the Independent Directors or by a vote of a majority of the outstanding voting securities of the Fund. This amount is included in fees waived and/or reimbursed by the Manager in the Statement of Operations. For the year ended May 31, 2019, the Manager waived $73,059 in investment advisory fees pursuant to this arrangement.
With respect to the Fund, the Manager voluntarily agreed to waive its investment advisory fees by the amount of investment advisory fees the Fund pays to the Manager indirectly through its investment in affiliated money market funds (the “affiliated money market fund waiver”). The amount of waivers and/or reimbursements of fees and expenses made pursuant to the expense limitation described below will be reduced by the amount of the affiliated money market fund waiver. This amount is included in fees waived and/or reimbursed by the Manager in the Statement of Operations. For the year ended May 31, 2019, the amounts waived were $3,336.
The Manager has contractually agreed to waive its investment advisory fee with respect to any portion of the Fund’s assets invested in affiliated equity and fixed-income mutual funds and affiliated exchange-traded funds that have a contractual management fee through September 30, 2019. The contractual agreement may be terminated upon 90 days’ notice by a majority of the Independent Directors or by a vote of a majority of the outstanding voting securities of the Fund. For the year ended May 31, 2019, there were no fees waived and/or reimbursed by the Manager pursuant to this agreement.
| NOTESTO FINANCIAL STATEMENTS | 27 |
Notes to Financial Statements (continued)
For the year ended May 31, 2019, the Fund reimbursed the Manager for certain accounting services, which is included in accounting services in the Statement of Operations was $1,042.
The Fund has incurred expenses in connection with the realignment and consolidation of the boards of directors of certain BlackRock-advised funds. The Manager has voluntarily agreed to reimburse the Fund for all or a portion of such expenses, which amounts are included in fees waived and/or reimbursed by the Manager in the Statement of Operations. For the year ended May 31, 2019, the amount reimbursed for the Fund was $73,048.
With respect to the Fund, the Manager contractually agreed to waive and/or reimburse fees or expenses in order to limit expenses, excluding interest expense, dividend expense, tax expense, acquired fund fees and expenses, and certain other fund expenses, which constitute extraordinary expenses not incurred in the ordinary course of the Fund’s business (“expense limitation”). The expense limitations as a percentage of average daily assets are as follows:
Institutional | 1.95 | % | ||
Investor A | 2.20 | |||
Investor C | 2.75 |
The Manager has agreed not to reduce or discontinue this contractual expense limitations through September 30, 2019, unless approved by the Board, including a majority of the Independent Directors, or by a vote of a majority of the outstanding voting securities of the Fund. For the year ended May 31, 2019, there were no fees waived and/or reimbursed by the Manager.
Interfund Lending: In accordance with an exemptive order (the “Order”) from the U.S. Securities and Exchange Commission (“SEC”), the Fund may participate in a joint lending and borrowing facility for temporary purposes (the “Interfund Lending Program”), subject to compliance with the terms and conditions of the Order, and to the extent permitted by the Fund’s investment policies and restrictions. The Fund is currently permitted to borrow and lend under the Interfund Lending Program.
A lending BlackRock fund may lend in aggregate up to 15% of its net assets, but may not lend more than 5% of its net assets to any one borrowing fund through the Interfund Lending Program. A borrowing BlackRock fund may not borrow through the Interfund Lending Program or from any other source more than 33 1/3% of its total assets (or any lower threshold provided for by the fund’s investment restrictions). If a borrowing BlackRock fund’s total outstanding borrowings exceed 10% of its total assets, each of its outstanding interfund loans will be subject to collateralization of at least 102% of the outstanding principal value of the loan. All interfund loans are for temporary or emergency purposes and the interest rate to be charged will be the average of the highest current overnight repurchase agreement rate available to a lending fund and the bank loan rate, as calculated according to a formula established by the Board.
During the year ended May 31, 2019, the Fund did not participate in the Interfund Lending Program.
Directors and Officers: Certain directors and/or officers of the Fund are directors and/or officers of BlackRock or its affiliates. The Fund reimburses the Manager for a portion of the compensation paid to the Fund’s Chief Compliance Officer, which is included in Directors and Officer in the Statement of Operations.
| 7. | PURCHASES AND SALES |
For the year ended May 31, 2019, purchases and sales of investments, including TBA transactions and mortgage dollar rolls and excluding short-term securities, were as follows:
Purchases | ||||
Non-U.S. Government Securities | $ | 170,377,831 | ||
U.S. Government Securities | 3,633,381 | |||
|
| |||
| $ | 174,011,212 | |||
|
| |||
Sales | ||||
Non-U.S. Government Securities | $ | 197,786,681 | ||
U.S. Government Securities | — | |||
|
| |||
| $ | 197,786,681 | |||
|
|
For the year ended May 31, 2019, purchases and sales related to mortgage dollar rolls were $71,159,487 and $71,229,735, respectively.
| 8. | INCOME TAX INFORMATION |
It is the Fund’s policy to comply with the requirements of the Internal Revenue Code of 1986, as amended, applicable to regulated investment companies, and to distribute substantially all of its taxable income to its shareholders. Therefore, no U.S. federal income tax provision is required.
The Fund files U.S. federal and various state and local tax returns. No income tax returns are currently under examination. The statute of limitations on the Fund’s U.S. federal tax returns generally remains open for each of the four years ended May 31, 2019. The statutes of limitations on the Fund’s state and local tax returns may remain open for an additional year depending upon the jurisdiction.
Management has analyzed tax laws and regulations and their application to the Fund as of May 31, 2019, inclusive of the open tax return years, and does not believe that there are any uncertain tax positions that require recognition of a tax liability in the Fund’s financial statements.
| 28 | 2019 BLACKROCK ANNUAL REPORTTO SHAREHOLDERS |
Notes to Financial Statements (continued)
The tax character of distributions paid was as follows:
| 5/31/2019 | 5/31/2018 | |||||||
Ordinary income | $ | 2,401,787 | $ | 1,836,675 | ||||
Long-term capital gains | — | — | ||||||
Return of capital | 16,993 | 1,199,813 | ||||||
|
|
|
| |||||
| $ | 2,418,780 | $ | 3,036,488 | |||||
|
|
|
| |||||
As of May 31, 2019, the tax components of accumulated net earnings (losses) were as follows:
Non-expiring capital loss carryforwards(a) | $ | (3,794,133 | ) | |
Net unrealized gains (losses)(b) | 832,361 | |||
Qualified late-year losses(c) | (878 | ) | ||
|
| |||
| $ | (2,962,650 | ) | ||
|
|
| (a) | Available to offset future realized capital gains. |
| (b) | The differences between book-basis and tax-basis net unrealized gains were attributable primarily to the tax deferral of losses on wash sales and the realization for tax purposes of unrealized gains/losses on certain futures contracts. |
| (c) | The Fund has elected to defer certain qualified late-year losses and recognize such losses in the next taxable year. |
During the year ended May 31, 2019, the Fund utilized $193,168 of its capital loss carryforward.
As of May 31, 2019, gross unrealized appreciation and depreciation for investments and derivatives based on cost for U.S. federal income tax purposes were as follows:
Tax cost | $ | 88,678,079 | ||
|
| |||
Gross unrealized appreciation | $ | 1,834,055 | ||
Gross unrealized depreciation | (789,531 | ) | ||
|
| |||
Net unrealized appreciation (depreciation) | $ | 1,044,524 | ||
|
|
| 9. | BANK BORROWINGS |
The Fund, along with certain other funds managed by the Manager and its affiliates (“Participating Funds”), is a party to a364-day, $2.25 billion credit agreement with a group of lenders. Under this agreement, the Fund may borrow to fund shareholder redemptions. Excluding commitments designated for certain individual funds, the Participating Funds, including the Fund, can borrow up to an aggregate commitment amount of $1.75 billion at any time outstanding, subject to asset coverage and other limitations as specified in the agreement. The credit agreement has the following terms: a fee of 0.10% per annum on unused commitment amounts and interest at a rate equal to the higher of(a) one-month LIBOR (but, in any event, not less than 0.00%) on the date the loan is made plus 0.80% per annum or (b) the Fed Funds rate (but, in any event, not less than 0.00%) in effect from time to time plus 0.80% per annum on amounts borrowed. The agreement expires in April 2020 unless extended or renewed. Prior to April 18, 2019, Participating Funds paid an upfront commitment fee of 0.02% on the total commitment amounts, in addition to administration, legal and arrangement fees, which are included in miscellaneous expenses in the Statement of Operations. These fees were allocated among such funds based upon portions of the aggregate commitment available to them and relative net assets of Participating Funds. During the year ended May 31, 2019, the Fund did not borrow under the credit agreement.
| 10. | PRINCIPAL RISKS |
Many municipalities insure repayment of their bonds, which may reduce the potential for loss due to credit risk. The market value of these bonds may fluctuate for other reasons, including market perception of the value of such insurance, and there is no guarantee that the insurer will meet its obligation.
Inventories of municipal bonds held by brokers and dealers may decrease, which would lessen their ability to make a market in these securities. Such a reduction in market making capacity could potentially decrease the Fund’s ability to buy or sell bonds. As a result, the Fund may sell a security at a lower price, sell other securities to raise cash, or give up an investment opportunity, any of which could have a negative impact on performance. If the Fund needed to sell large blocks of bonds, those sales could further reduce the bonds’ prices and impact performance.
In the normal course of business, the Fund invests in securities or other instruments and may enter into certain transactions, and such activities subject the Fund to various risks, including among others, fluctuations in the market (market risk) or failure of an issuer to meet all of its obligations. The value of securities or other instruments may also be affected by various factors, including, without limitation: (i) the general economy; (ii) the overall market as well as local, regional or global political and/or social instability; (iii) regulation, taxation or international tax treaties between various countries; or (iv) currency, interest rate and price fluctuations. The Fund’s prospectus provides details of the risks to which the Fund is subject.
The Fund may be exposed to prepayment risk, which is the risk that borrowers may exercise their option to prepay principal earlier than scheduled during periods of declining interest rates, which would force the Fund to reinvest in lower yielding securities. The Fund may also be exposed to reinvestment risk, which is the risk that income from the Fund’s portfolio will decline if the Fund invests the proceeds from matured, traded or called fixed-income securities at market interest rates that are below the Fund portfolio’s current earnings rate.
| NOTESTO FINANCIAL STATEMENTS | 29 |
Notes to Financial Statements (continued)
Valuation Risk: The market values of equities, such as common stocks and preferred securities or equity related investments, such as futures and options, may decline due to general market conditions which are not specifically related to a particular company. They may also decline due to factors which affect a particular industry or industries. The Fund may invest in illiquid investments. An illiquid investment is any investment that the Fund reasonably expects cannot be sold or disposed of in current market conditions in seven calendar days or less without the sale or disposition significantly changing the market value of the investment. The Fund may experience difficulty in selling illiquid investments in a timely manner at the price that it believes the investments are worth. Prices may fluctuate widely over short or extended periods in response to company, market or economic news. Markets also tend to move in cycles, with periods of rising and falling prices. This volatility may cause the Fund’s NAV to experience significant increases or decreases over short periods of time. If there is a general decline in the securities and other markets, the NAV of the Fund may lose value, regardless of the individual results of the securities and other instruments in which the Fund invests.
The price the Fund could receive upon the sale of any particular portfolio investment may differ from the Fund’s valuation of the investment, particularly for securities that trade in thin or volatile markets or that are valued using a fair valuation technique or a price provided by an independent pricing service. Changes to significant unobservable inputs and assumptions (i.e., publicly traded company multiples, growth rate, time to exit) due to the lack of observable inputs may significantly impact the resulting fair value and therefore the Fund’s results of operations. As a result, the price received upon the sale of an investment may be less than the value ascribed by the Fund, and the Fund could realize a greater than expected loss or lesser than expected gain upon the sale of the investment. The Fund’s ability to value its investments may also be impacted by technological issues and/or errors by pricing services or other third party service providers.
Counterparty Credit Risk: The Fund may be exposed to counterparty credit risk, or the risk that an entity may fail to or be unable to perform on its commitments related to unsettled or open transactions. The Fund manages counterparty credit risk by entering into transactions only with counterparties that the Manager believes have the financial resources to honor their obligations and by monitoring the financial stability of those counterparties. Financial assets, which potentially expose the Fund to market, issuer and counterparty credit risks, consist principally of financial instruments and receivables due from counterparties. The extent of the Fund’s exposure to market, issuer and counterparty credit risks with respect to these financial assets is approximately their value recorded in the Statement of Assets and Liabilities, less any collateral held by the Fund.
A derivative contract may suffer amark-to-market loss if the value of the contract decreases due to an unfavorable change in the market rates or values of the underlying instrument. Losses can also occur if the counterparty does not perform under the contract.
The Fund’s risk of loss from counterparty credit risk on OTC derivatives is generally limited to the aggregate unrealized gain less the value of any collateral held by the Fund.
With exchange-traded futures, there is less counterparty credit risk to the Fund since the exchange or clearinghouse, as counterparty to such instruments, guarantees against a possible default. The clearinghouse stands between the buyer and the seller of the contract; therefore, credit risk is limited to failure of the clearinghouse. While offset rights may exist under applicable law, the Fund does not have a contractual right of offset against a clearing broker or clearinghouse in the event of a default (including the bankruptcy or insolvency). Additionally, credit risk exists inexchange-traded futures with respect to initial and variation margin that is held in a clearing broker’s customer accounts. While clearing brokers are required to segregate customer margin from their own assets, in the event that a clearing broker becomes insolvent or goes into bankruptcy and at that time there is a shortfall in the aggregate amount of margin held by the clearing broker for all its clients, typically the shortfall would be allocated on a pro rata basis across all the clearing broker’s customers, potentially resulting in losses to the Fund.
Concentration Risk: The Fund invests a significant portion of its assets in fixed-income securities and/or uses derivatives tied to the fixed-income markets. Changes in market interest rates or economic conditions may affect the value and/or liquidity of such investments. Interest rate risk is the risk that prices of bonds and other fixed-income securities will increase as interest rates fall and decrease as interest rates rise. The Fund may be subject to a greater risk of rising interest rates due to the current period of historically low rates.
The Fund invests a significant portion of its assets in securities backed by commercial or residential mortgage loans or in issuers that hold mortgage and other asset-backed securities. Investment percentages in these securities are presented in the Schedule of Investments. Changes in economic conditions, including delinquencies and/or defaults on assets underlying these securities, can affect the value, income and/or liquidity of such positions.
| 11. | CAPITAL SHARE TRANSACTIONS |
Transactions in capital shares for each class were as follows:
| Year Ended 05/31/19 | Year Ended 05/31/18 | |||||||||||||||
| Shares | Amount | Shares | Amount | |||||||||||||
Institutional | ||||||||||||||||
Shares sold | 241 | $ | 2,407 | 1,642 | $ | 16,766 | ||||||||||
Shares issued in reinvestment of distributions | 11,081 | 109,703 | 12,954 | 131,309 | ||||||||||||
Shares redeemed | (76,742 | ) | (757,414 | ) | (199,473 | ) | (2,025,574 | ) | ||||||||
|
|
|
|
|
|
|
| |||||||||
Net decrease | (65,420 | ) | $ | (645,304 | ) | (184,877 | ) | $ | (1,877,499 | ) | ||||||
|
|
|
|
|
|
|
| |||||||||
Investor A | ||||||||||||||||
Shares sold and automatic conversion of shares | 175,512 | $ | 1,730,755 | 420,594 | $ | 4,258,505 | ||||||||||
Shares issued in reinvestment of distributions | 137,681 | 1,363,665 | 161,071 | 1,634,127 | ||||||||||||
Shares redeemed | (1,166,514 | ) | (11,512,446 | ) | (3,480,161 | ) | (35,430,975 | ) | ||||||||
|
|
|
|
|
|
|
| |||||||||
Net decrease | (853,321 | ) | $ | (8,418,026 | ) | (2,898,496 | ) | $ | (29,538,343 | ) | ||||||
|
|
|
|
|
|
|
| |||||||||
| 30 | 2019 BLACKROCK ANNUAL REPORTTO SHAREHOLDERS |
Notes to Financial Statements (continued)
| Year Ended 05/31/19 | Year Ended 05/31/18 | |||||||||||||||
| Shares | Amount | Shares | Amount | |||||||||||||
Investor C | ||||||||||||||||
Shares sold | 5,384 | $ | 53,511 | 37,606 | $ | 383,663 | ||||||||||
Shares issued in reinvestment of distributions | 52,708 | 521,876 | 76,655 | 778,393 | ||||||||||||
Shares redeemed and automatic conversion of shares | (1,055,787 | ) | (10,416,986 | ) | (3,360,893 | ) | (34,216,852 | ) | ||||||||
|
|
|
|
|
|
|
| |||||||||
Net decrease | (997,695 | ) | $ | (9,841,599 | ) | (3,246,632 | ) | $ | (33,054,796 | ) | ||||||
|
|
|
|
|
|
|
| |||||||||
Total Net Decrease | (1,916,436 | ) | $ | (18,904,929 | ) | (6,330,005 | ) | $ | (64,470,638 | ) | ||||||
|
|
|
|
|
|
|
| |||||||||
| 12. | REGULATIONS-X AMENDMENTS |
On August 17, 2018, the SEC adopted amendments to certain disclosure requirements in Securities Act ReleaseNo. 33-10532, Disclosure Update and Simplification. The Fund has adopted the amendments pertinent to RegulationS-X in this shareholder report. The amendments impacted certain disclosure presentation on the Statement of Assets and Liabilities, Statements of Changes in Net Assets and Notes to the Financial Statements.
Prior year distribution information and distributions in excess of net investment income in the Statements of Changes in Net Assets has been modified to conform to the current year presentation in accordance with the RegulationS-X changes.
Distributions for the year ended May 31, 2018 were classified as follows:
| Share Class | Net Investment Income | Net Realized Gain | Return of Capital | |||||||||
Institutional | $ | 95,073 | $ | — | $ | 62,106 | ||||||
Investor A | 1,160,153 | — | 757,874 | |||||||||
Investor C | 581,449 | — | 379,833 | |||||||||
Distributions in excess of net investment income as of May 31, 2018, was $212,031.
| 13. | SUBSEQUENT EVENTS |
Management has evaluated the impact of all subsequent events on the Fund through the date the financial statements were issued and has determined that there were no subsequent events requiring adjustment or additional disclosure in the financial statements.
| NOTESTO FINANCIAL STATEMENTS | 31 |
Report of Independent Registered Public Accounting Firm
To theShareholders of FDP BlackRock CoreAlpha Bond Fund and the Board of Directors of FDP Series II, Inc.:
Opinion on the Financial Statements and Financial Highlights
We have audited the accompanying statement of assets and liabilities of FDP BlackRock CoreAlpha Bond Fund of FDP Series II, Inc. (the “Fund”), including the schedule of investments, as of May 31, 2019, the related statement of operations for the year then ended, the statements of changes in net assets for each of the two years in the period then ended, the financial highlights for each of the five years in the period then ended, and the related notes. In our opinion, the financial statements and financial highlights present fairly, in all material respects, the financial position of the Fund as of May 31, 2019, and the results of its operations for the year then ended, the changes in its net assets for each of the two years in the period then ended, and the financial highlights for each of the five years in the period then ended, in conformity with accounting principles generally accepted in the United States of America.
Basis for Opinion
These financial statements and financial highlights are the responsibility of the Fund’s management. Our responsibility is to express an opinion on the Fund’s financial statements and financial highlights based on our audits. We are a public accounting firm registered with the Public Company Accounting Oversight Board (United States) (PCAOB) and are required to be independent with respect to the Fund in accordance with the U.S. federal securities laws and the applicable rules and regulations of the Securities and Exchange Commission and the PCAOB.
We conducted our audits in accordance with the standards of the PCAOB. Those standards require that we plan and perform the audit to obtain reasonable assurance about whether the financial statements and financial highlights are free of material misstatement, whether due to error or fraud. The Fund is not required to have, nor were we engaged to perform, an audit of its internal control over financial reporting. As part of our audits we are required to obtain an understanding of internal control over financial reporting but not for the purpose of expressing an opinion on the effectiveness of the Fund’s internal control over financial reporting. Accordingly, we express no such opinion.
Our audits included performing procedures to assess the risks of material misstatement of the financial statements and financial highlights, whether due to error or fraud, and performing procedures that respond to those risks. Such procedures included examining, on a test basis, evidence regarding the amounts and disclosures in the financial statements and financial highlights. Our audits also included evaluating the accounting principles used and significant estimates made by management, as well as evaluating the overall presentation of the financial statements and financial highlights. Our procedures included confirmation of securities owned as of May 31, 2019, by correspondence with the custodian and brokers; when replies were not received from brokers, we performed other auditing procedures. We believe that our audits provide a reasonable basis for our opinion.
Deloitte & Touche LLP
Boston, Massachusetts
July 23, 2019
We have served as the auditor of one or more BlackRock investment companies since 1992.
| 32 | 2019 BLACKROCK ANNUAL REPORTTO SHAREHOLDERS |
Important Tax Information (unaudited)
During fiscal year ended May 31, 2019, the following information is provided with respect to the ordinary income distributions paid by the fund.
| Months Paid | ||||||||
| June 2018- December 2018 | January 2019- May 2019 | |||||||
Qualified Dividend Income for Individuals(a) | — | % | — | % | ||||
Dividends Qualifying for the Dividends Received Deduction for Corporations(a) | — | — | ||||||
Qualified Short-Term Gains for Non-U.S. Residents(b) | 78.86 | 100.00 | ||||||
| (a) | The Fund hereby designates the percentage indicated above or the maximum amount allowable by law. |
| (b) | Represents the portion of the taxable ordinary income dividends eligible for exemption from U.S. withholding tax for nonresident aliens and foreign corporations. |
| IMPORTANT TAX INFORMATION | 33 |
Director and Officer Information
| Independent Directors (a) | ||||||||
| Name Year of Birth (b) | Position(s) Held (Length of Service) (c) | Principal Occupation(s) During Past Five Years | Number of BlackRock-Advised Registered Investment Companies (“RICs”) Consisting of Investment Portfolios (“Portfolios”) Overseen | Public Company and Other Investment Company Directorships Held During Past Five Years | ||||
Richard E. Cavanagh 1946 | Co-Chair of the Board and Director (Since 2019) | Director, The Guardian Life Insurance Company of America since 1998; Board Chair, Volunteers of America (anot-for-profit organization) from 2015 to 2018 (board member since 2009); Director, Arch Chemicals (chemical and allied products) from 1999 to 2011; Trustee, Educational Testing Service from 1997 to 2009 and Chairman thereof from 2005 to 2009; Senior Advisor, The Fremont Group since 2008 and Director thereof since 1996; Faculty Member/Adjunct Lecturer, Harvard University since 2007 and Executive Dean from 1987 to 1995; President and Chief Executive Officer, The Conference Board, Inc. (global business research organization) from 1995 to 2007. | 88 RICs consisting of 112 Portfolios | None | ||||
Karen P. Robards 1950 | Co-Chair of the Board and Director (Since 2019) | Principal of Robards & Company, LLC (consulting and private investing) since 1987;Co-founder and Director of the Cooke Center for Learning and Development (anot-for-profit organization) since 1987; Director of Enable Injections, LLC (medical devices) since 2019; Investment Banker at Morgan Stanley from 1976 to 1987. | 88 RICs consisting of 112 Portfolios | Greenhill & Co., Inc.; AtriCure, Inc. (medical devices) from 2000 until 2017 | ||||
Michael J. Castellano 1946 | Director (Since 2019) | Chief Financial Officer of Lazard Group LLC from 2001 to 2011; Chief Financial Officer of Lazard Ltd from 2004 to 2011; Director, Support Our Aging Religious(non-profit) from 2009 to June 2015 and since 2017; Director, National Advisory Board of Church Management at Villanova University since 2010; Trustee, Domestic Church Media Foundation since 2012; Director, CircleBlack Inc. (financial technology company) since 2015. | 88 RICs consisting of 112 Portfolios | None | ||||
Cynthia L. Egan 1955 | Director (Since 2019) | Advisor, U.S. Department of the Treasury from 2014 to 2015; President, Retirement Plan Services for T. Rowe Price Group, Inc. from 2007 to 2012; executive positions within Fidelity Investments from 1989 to 2007. | 88 RICs consisting of 112 Portfolios | Unum (insurance); The Hanover Insurance Group (insurance); Envestnet (investment platform) from 2013 until 2016 | ||||
Frank J. Fabozzi 1948 | Director (Since 2019) | Editor of The Journal of Portfolio Management since 1986; Professor of Finance, EDHEC Business School (France) since 2011; Visiting Professor, Princeton University for the 2013 to 2014 academic year and Spring 2017 semester; Professor in the Practice of Finance, Yale University School of Management from 1994 to 2011 and currently a Teaching Fellow in Yale’s Executive Programs; Board Member, BlackRock Equity-Liquidity Funds from 2014 to 2016; affiliated professor Karlsruhe Institute of Technology from 2008 to 2011. | 88 RICs consisting of 112 Portfolios | None | ||||
Henry Gabbay 1947 | Director (Since 2007) | Board Member, BlackRock Equity-Bond Board from 2007 to 2018; Board Member, BlackRock Equity-Liquidity and BlackRockClosed-End Fund Boards from 2007 through 2014; Consultant, BlackRock, Inc. from 2007 to 2008; Managing Director, BlackRock, Inc. from 1989 to 2007; Chief Administrative Officer, BlackRock Advisors, LLC from 1998 to 2007; President of BlackRock Funds and BlackRock Allocation Target Shares (formerly, BlackRock Bond Allocation Target Shares) from 2005 to 2007 and Treasurer of certainclosed-end funds in the BlackRock fund complex from 1989 to 2006. | 88 RICs consisting of 112 Portfolios | None | ||||
| 34 | 2019 BLACKROCK ANNUAL REPORTTO SHAREHOLDERS |
Director and Officer Information (continued)
| Independent Directors (a)(continued) | ||||||||
| Name Year of Birth (b) | Position(s) Held (Length of Service) (c) | Principal Occupation(s) During Past Five Years | Number of BlackRock-Advised Registered Investment Companies (“RICs”) Consisting of Investment Portfolios (“Portfolios”) Overseen | Public Company and Other Investment Company Directorships Held During Past Five Years | ||||
R. Glenn Hubbard 1958 | Director (Since 2019) | Dean, Columbia Business School since 2004; Faculty member, Columbia Business School since 1988. | 88 RICs consisting of 112 Portfolios | ADP (data and information services); Metropolitan Life Insurance Company (insurance); KKR Financial Corporation (finance) from 2004 until 2014 | ||||
W. Carl Kester 1951 | Director (Since 2019) | George Fisher Baker Jr. Professor of Business Administration, Harvard Business School since 2008; Deputy Dean for Academic Affairs from 2006 to 2010; Chairman of the Finance Unit, from 2005 to 2006; Senior Associate Dean and Chairman of the MBA Program from 1999 to 2005; Member of the faculty of Harvard Business School since 1981. | 88 RICs consisting of 112 Portfolios | None | ||||
Catherine A. Lynch 1961 | Director (Since 2019) | Chief Executive Officer, Chief Investment Officer and various other positions, National Railroad Retirement Investment Trust from 2003 to 2016; Associate Vice President for Treasury Management, The George Washington University from 1999 to 2003; Assistant Treasurer, Episcopal Church of America from 1995 to 1999. | 88 RICs consisting of 112 Portfolios | None | ||||
| Interested Directors (a)(d) | ||||||||
| Name Year of Birth (b) | Position(s) Held (Length of Service) (c) | Principal Occupation(s) During Past Five Years | Number of BlackRock-Advised Registered Investment Companies (“RICs”) Consisting of Investment Portfolios (“Portfolios”) Overseen | Public Company and Other Investment Company Directorships Held During Past Five Years | ||||
Robert Fairbairn 1965 | Director (Since 2015) | Vice Chairman of BlackRock, Inc. since 2019; Member of BlackRock’s Global Executive and Global Operating Committees;Co-Chair of BlackRock’s Human Capital Committee; Senior Managing Director of BlackRock, Inc. from 2010 to 2019; oversaw BlackRock’s Strategic Partner Program and Strategic Product Management Group from 2012 to 2019; Member of the Board of Managers of BlackRock Investments, LLC from 2011 to 2018; Global Head of BlackRock’s Retail and iShares® businesses from 2012 to 2016. | 126 RICs consisting of 294 Portfolios | None | ||||
John M. Perlowski 1964 | Director (Since 2015); President and Chief Executive Officer (Since 2010) | Managing Director of BlackRock, Inc. since 2009; Head of BlackRock Global Accounting and Product Services since 2009; Advisory Director of Family Resource Network (charitable foundation) since 2009. | 126 RICs consisting of 294 Portfolios | None | ||||
(a) The address of each Director is c/o BlackRock, Inc., 55 East 52nd Street, New York, New York 10055. (b) Each Independent Director holds office until his or her successor is duly elected and qualifies or until his or her earlier death, resignation, retirement or removal as provided by the Fund’sby-laws or charter or statute, or until December 31 of the year in which he or she turns 75. Directors who are “interested persons,” as defined in the Investment Company Act serve until their successor is duly elected and qualifies or until their earlier death, resignation, retirement or removal as provided by the Fund’sby-laws or statute, or until December 31 of the year in which they turn 72. The Board may determine to extend the terms of Independent Directors on acase-by-case basis, as appropriate. (c) Following the combination of Merrill Lynch Investment Managers, L.P. (“MLIM”) and BlackRock, Inc. in September 2006, the various legacy MLIM and legacy BlackRock fund boards were realigned and consolidated into three new fund boards in 2007. Certain Independent Directors first became members of the boards of other legacy MLIM or legacy BlackRock funds as follows: Richard E. Cavanagh, 1994; Frank J. Fabozzi, 1988; R. Glenn Hubbard, 2004; W. Carl Kester, 1995; and Karen P. Robards, 1998. Certain other Independent Directors became members of the boards of theclosed-end funds in the Fixed-Income Complex as follows: Michael J. Castellano, 2011; Cynthia L. Egan, 2016; and Catherine A. Lynch, 2016. (d) Mr. Fairbairn and Mr. Perlowski are both “interested persons,” as defined in the Investment Company Act 1940 Act, of the Fund based on their positions with BlackRock, Inc. and its affiliates. Mr. Fairbairn and Mr. Perlowski are also board members of the BlackRock Multi-Asset Complex . | ||||||||
| DIRECTORAND OFFICER INFORMATION | 35 |
Director and Officer Information (continued)
| Officers Who Are Not Directors (a) | ||||
| Name Year of Birth (b) | Position(s) Held (Length of Service) | Principal Occupation(s) During Past Five Years | ||
Jennifer McGovern 1977 | Vice President (Since 2014) | Managing Director of BlackRock, Inc. since 2016; Director of BlackRock, Inc. from 2011 to 2015; Head of Product Development and Oversight for BlackRock’s Strategic Product Management Group since 2019; Previously Head of Product Structure and Oversight for BlackRock’s U.S. Wealth Advisory Group from 2013 to 2019. | ||
Neal J. Andrews 1966 | Chief Financial Officer (Since 2007) | Chief Financial Officer of the iShares® exchange traded funds since 2019; Managing Director of BlackRock, Inc. since 2006. | ||
Jay M. Fife 1970 | Treasurer (Since 2007) | Managing Director of BlackRock, Inc. since 2007. | ||
Charles Park 1967 | Chief Compliance Officer (Since 2014) | Anti-Money Laundering Compliance Officer for certain BlackRock-advised Funds from 2014 to 2015; Chief Compliance Officer of BlackRock Advisors, LLC and the BlackRock-advised Funds in the BlackRock Multi-Asset Complex and the BlackRock Fixed-Income Complex since 2014; Principal of and Chief Compliance Officer for iShares® Delaware Trust Sponsor LLC since 2012 and BlackRock Fund Advisors (“BFA”) since 2006; Chief Compliance Officer for theBFA-advised iShares® exchange traded funds since 2006; Chief Compliance Officer for BlackRock Asset Management International Inc. since 2012. | ||
John MacKessy 1972 | Anti-Money Laundering Compliance Officer (Since 2018) | Director of BlackRock, Inc. since 2017; Global Head of Anti-Money Laundering at BlackRock, Inc. since 2017; Director of AML Monitoring and Investigations Group of Citibank from 2015 to 2017; Global Anti-Money Laundering and Economic Sanctions Officer for MasterCard from 2011 to 2015. | ||
Benjamin Archibald 1975 | Secretary (Since 2012) | Managing Director of BlackRock, Inc. since 2014; Director of BlackRock, Inc. from 2010 to 2013; Secretary of the iShares® exchange traded funds since 2015; Secretary of the BlackRock-advised mutual funds since 2012. | ||
(a) The address of each Officer is c/o BlackRock, Inc., 55 East 52nd Street, New York, New York 10055. (b) Officers of the Fund serve at the pleasure of the Board. | ||||
Further information about the Fund’s Directors and Officers is available in the Fund’s Statement of Additional Information, which can be obtained without charge by calling (800)441-7762.
Investment Adviser
BlackRock Advisors, LLC
Wilmington, DE 19809
Accounting Agent
State Street Bank and Trust Company
Boston, MA 02111
Custodian
Brown Brothers Harriman & Co.
Boston, MA 02109
Transfer Agent
BNY Mellon Investment Servicing (US) Inc.
Wilmington, DE 19809
Independent Registered Public Accounting Firm
Deloitte & Touche LLP
Boston, MA 02116
Distributor
BlackRock Investments, LLC
New York, NY 10022
Legal Counsel
Willkie Farr & Gallagher LLP
New York, NY 10019
Address of the Fund
100 Bellevue Parkway
Wilmington, DE 19809
| 36 | 2019 BLACKROCK ANNUAL REPORTTO SHAREHOLDERS |
General Information
Householding
The Fund will mail only one copy of shareholder documents, including prospectuses, annual and semi-annual reports and proxy statements, to shareholders with multiple accounts at the same address. This practice is commonly called “householding” and is intended to reduce expenses and eliminate duplicate mailings of shareholder documents. Mailings of your shareholder documents may be householded indefinitely unless you instruct us otherwise. If you do not want the mailing of these documents to be combined with those for other members of your household, please call the Fund at(800) 441-7762.
Availability of Quarterly Schedule of Investments
The Fund files its complete schedule of portfolio holdings with the SEC for the first and third quarters of each fiscal year as an exhibit to its reports on Form N-PORT, and for reporting periods ended prior to March 31, 2019, filed such information on Form N-Q. The Fund’s Forms N-PORT and N-Q are available on the SEC’s website at http://www.sec.gov. The Fund’s Forms N-PORT and N-Q may also be obtained upon request and without charge by calling (800) 441-7762.
Availability of Proxy Voting Policies and Procedures
A description of the policies and procedures that the Fund uses to determine how to vote proxies relating to portfolio securities is available upon request and without charge (1) by calling (800) 441-7762; (2) athttp://www.blackrock.com; and (3) on the SEC’s website at http://www.sec.gov.
Availability of Proxy Voting Record
Information about how the Fund voted proxies relating to securities held in the Fund’s portfolios during the most recent 12-month period ended June 30 is available upon request and without charge (1) athttp://www.blackrock.com; or by calling (800) 441-7762 and (2) on the SEC’s website at http://www.sec.gov.
BlackRock’s Mutual Fund Family
BlackRock offers a diverse lineup of open-end mutual funds crossing all investment styles and managed by experts in equity, fixed income and tax-exempt investing. Visithttp://www.blackrock.com for more information.
Shareholder Privileges
Account Information
Call us at (800) 441-7762 from 8:00 AM to 6:00 PM ET on any business day to get information about your account balances, recent transactions and share prices. You can also reach us on the Web athttp://www.blackrock.com.
Automatic Investment Plans
Investor Class shareholders who want to invest regularly can arrange to have $50 or more automatically deducted from their checking or savings account and invested in any of the BlackRock funds.
Systematic Withdrawal Plans
Investor Class shareholders can establish a systematic withdrawal plan and receive periodic payments of $50 or more from their BlackRock funds, as long as their account balance is at least $10,000.
Retirement Plans
Shareholders may make investments in conjunction with Traditional, Rollover, Roth, Coverdell, Simple IRAs, SEP IRAs and 403(b) Plans.
| ADDITIONAL INFORMATION | 37 |
Additional Information (continued)
BlackRock Privacy Principles
BlackRock is committed to maintaining the privacy of its current and former fund investors and individual clients (collectively, “Clients”) and to safe-guarding their non-public personal information. The following information is provided to help you understand what personal information BlackRock collects, how we protect that information and why in certain cases we share such information with select parties.
If you are located in a jurisdiction where specific laws, rules or regulations require BlackRock to provide you with additional or different privacy-related rights beyond what is set forth below, then BlackRock will comply with those specific laws, rules or regulations.
BlackRock obtains or verifies personal non-public information from and about you from different sources, including the following: (i) information we receive from you or, if applicable, your financial intermediary, on applications, forms or other documents; (ii) information about your transactions with us, our affiliates, or others; (iii) information we receive from a consumer reporting agency; and (iv) from visits to our websites.
BlackRock does not sell or disclose to non-affiliated third parties any non-public personal information about its Clients, except as permitted by law or as is necessary to respond to regulatory requests or to service Client accounts. These non-affiliated third parties are required to protect the confidentiality and security of this information and to use it only for its intended purpose.
We may share information with our affiliates to service your account or to provide you with information about other BlackRock products or services that may be of interest to you. In addition, BlackRock restricts access to non-public personal information about its Clients to those BlackRock employees with a legitimate business need for the information. BlackRock maintains physical, electronic and procedural safeguards that are designed to protect the non-public personal information of its Clients, including procedures relating to the proper storage and disposal of such information.
Glossary of Terms Used in this Report
| Currency | ||
| EUR | Euro | |
| USD | United States Dollar | |
| Portfolio Abbreviations | ||
| ABS | Asset-Backed Security | |
| ARB | Airport Revenue Bonds | |
| CME | Chicago Mercantile Exchange | |
| CMT | Constant Maturity Treasury | |
| GO | General Obligation Bonds | |
| LIBOR | London Interbank Offered Rate | |
| MSCI | Morgan Stanley Capital International | |
| RB | Revenue Bonds | |
| TBA | To-Be-Announced | |
| 38 | 2019 BLACKROCK ANNUAL REPORTTO SHAREHOLDERS |
This report is intended for current holders. It is not authorized for use as an offer of sale or a solicitation of an offer to buy shares of the Fund unless preceded or accompanied by the Fund’s current prospectus. Past performance results shown in this report should not be considered a representation of future performance. Investment returns and principal value of shares will fluctuate so that shares, when redeemed, may be worth more or less than their original cost. Statements and other information herein are as dated and are subject to change.

| FDPCORE-5/19-AR |  |
| Item 2 – | Code of Ethics – The registrant (or the “Fund”) has adopted a code of ethics, as of the end of the period covered by this report, applicable to the registrant’s principal executive officer, principal financial officer, principal accounting officer or controller, or persons performing similar functions. During the period covered by this report, the code of ethics was amended to update certain information and to make othernon-material changes. During the period covered by this report, there have been no waivers granted under the code of ethics. The registrant undertakes to provide a copy of the code of ethics to any person upon request, without charge, who calls1-800-441-7762. |
| Item 3 – | Audit Committee Financial Expert – The registrant’s board of directors (the “board of directors”), has determined that (i) the registrant has the following audit committee financial experts serving on its audit committee and (ii) each audit committee financial expert is independent: |
Michael Castellano
Frank J. Fabozzi
Henry Gabbay
Catherine A. Lynch
Karen P. Robards
The registrant’s board of directors has determined that Karen P. Robards qualifies as an audit committee financial expert pursuant to Item 3(c)(4) of FormN-CSR.
Ms. Robards has a thorough understanding of generally accepted accounting principles, financial statements and internal control over financial reporting as well as audit committee functions. Ms. Robards has been President of Robards & Company, a financial advisory firm, since 1987. Ms. Robards was formerly an investment banker for more than 10 years where she was responsible for evaluating and assessing the performance of companies based on their financial results. Ms. Robards has over 30 years of experience analyzing financial statements. She also is a member of the audit committee of one publicly held company and anon-profit organization.
Under applicable securities laws, a person determined to be an audit committee financial expert will not be deemed an “expert” for any purpose, including without limitation for the purposes of Section 11 of the Securities Act of 1933, as a result of being designated or identified as an audit committee financial expert. The designation or identification as an audit committee financial expert does not impose on such person any duties, obligations, or liabilities greater than the duties, obligations, and liabilities imposed on such person as a member of the audit committee and board of directors in the absence of such designation or identification. The designation or identification of a person as an audit committee financial expert does not affect the duties, obligations, or liability of any other member of the audit committee or board of directors.
| Item 4 – | Principal Accountant Fees and Services |
The following table presents fees billed by Deloitte & Touche LLP (“D&T”) in each of the last two fiscal years for the services rendered to the Fund:
| (a) Audit Fees | (b) Audit-Related Fees1 | (c) Tax Fees2 | (d) All Other Fees | |||||||||||||||
| Entity Name | Current Year | Previous Year | Current Year | Previous Year | Current Year | Previous Year | Current Year | Previous Year | ||||||||||
| FDP BlackRock CoreAlpha Bond Fund | $40,800 | $40,800 | $0 | $0 | $16,600 | $16,600 | $0 | $0 | ||||||||||
2
The following table presents fees billed by D&T that were required to be approved by the registrant’s audit committee (the “Committee”) for services that relate directly to the operations or financial reporting of the Fund and that are rendered on behalf of BlackRock Advisors, LLC ( the “Investment Adviser” or “BlackRock”) and entities controlling, controlled by, or under common control with BlackRock (not including anysub-adviser whose role is primarily portfolio management and is subcontracted with or overseen by another investment adviser) that provide ongoing services to the Fund (“Affiliated Service Providers”):
| Current Fiscal Year End | Previous Fiscal Year End | |||
(b) Audit-Related Fees1 | $0 | $0 | ||
(c) Tax Fees2 | $0 | $0 | ||
(d) All Other Fees3 | $2,050,500 | $2,274,000 |
1 The nature of the services includes assurance and related services reasonably related to the performance of the audit or review of financial statements not included in Audit Fees, including accounting consultations, agreed-upon procedure reports, attestation reports, comfort letters,out-of-pocket expenses and internal control reviews not required by regulators.
2 The nature of the services includes tax compliance and/or tax preparation, including services relating to the filing or amendment of federal, state or local income tax returns, regulated investment company qualification reviews, taxable income and tax distribution calculations.
3Non-audit fees of $2,050,500 and $2,274,000 for the current fiscal year and previous fiscal year, respectively, were paid to the Fund’s principal accountant in their entirety by BlackRock, in connection with services provided to the Affiliated Service Providers of the Fund and of certain other funds sponsored and advised by BlackRock or its affiliates for a service organization review and an accounting research tool subscription. These amounts represent aggregate fees paid by BlackRock and were not allocated on a per fund basis.
(e)(1) Audit CommitteePre-Approval Policies and Procedures:
The Committee has adopted policies and procedures with regard to thepre-approval of services. Audit, audit-related and tax compliance services provided to the registrant on an annual basis require specificpre-approval by the Committee. The Committee also must approve othernon-audit services provided to the registrant and thosenon-audit services provided to the Investment Adviser and Affiliated Service Providers that relate directly to the operations and the financial reporting of the registrant. Certain of thesenon-audit services that the Committee believes are (a) consistent with the SEC’s auditor independence rules and (b) routine and recurring services that will not impair the independence of the independent accountants may be approved by the Committee without consideration on a specificcase-by-case basis (“generalpre-approval”). The term of any generalpre-approval is 12 months from the date of thepre-approval, unless the Committee provides for a different period. Tax or othernon-audit services provided to the registrant which have a direct impact on the operations or financial reporting of the registrant will only be deemedpre-approved provided that any individual project does not exceed $10,000 attributable to the registrant or $50,000 per project. For this purpose, multiple projects will be aggregated to determine if they exceed the previously mentioned cost levels.
Any proposed services exceeding thepre-approved cost levels will require specificpre-approval by the Committee, as will any other services not subject to generalpre-approval (e.g., unanticipated but permissible services). The Committee is informed of each service approved
3
subject to generalpre-approval at the next regularly scheduledin-person board meeting. At this meeting, an analysis of such services is presented to the Committee for ratification. The Committee may delegate to the Committee Chairman the authority to approve the provision of and fees for any specific engagement of permittednon-audit services, including services exceedingpre-approved cost levels.
(e)(2) None of the services described in each of Items 4(b) through (d) were approved by the Committee pursuant to the de minimis exception in paragraph (c)(7)(i)(C) of Rule2-01 of RegulationS-X.
(f) Not Applicable
(g) The aggregatenon-audit fees, defined as the sum of the fees shown under “Audit-Related Fees,” “Tax Fees” and “All Other Fees,” paid to the accountant for services rendered by the accountant to the registrant, the Investment Adviser and the Affiliated Service Providers were:
| Entity Name | Current Fiscal Year End | Previous Fiscal Year End | ||||||
FDP BlackRock CoreAlpha Bond Fund | $16,600 | $16,600 |
Additionally, the amounts billed by D&T in connection with services provided to the Affiliated Service Providers of the Fund and of other funds sponsored and advised by BlackRock or its affiliates during the current and previous fiscal years for a service organization review and an accounting research tool subscription were:
| Current Fiscal Year End | Previous Fiscal Year End | |
$2,050,500 | $2,274,000 |
These amounts represent aggregate fees paid by BlackRock and were not allocated on a per fund basis.
(h) The Committee has considered and determined that the provision ofnon-audit services that were rendered to the Investment Adviser and the Affiliated Service Providers that were notpre-approved pursuant to paragraph (c)(7)(ii) of Rule2-01 of RegulationS-X is compatible with maintaining the principal accountant’s independence.
| Item 5 – | Audit Committee of Listed Registrants – Not Applicable |
| Item 6 – | Investments |
(a) The registrant’s Schedule of Investments is included as part of the Report to Stockholders filed under Item 1 of this Form.
(b) Not Applicable due to no such divestments during the semi-annual period covered since the previousForm N-CSR filing.
4
| Item 7 – | Disclosure of Proxy Voting Policies and Procedures forClosed-End Management Investment Companies – Not Applicable |
| Item 8 – | Portfolio Managers ofClosed-End Management Investment Companies – Not Applicable |
| Item 9 – | Purchases of Equity Securities byClosed-End Management Investment Company and Affiliated Purchasers – Not Applicable |
| Item 10 – | Submission of Matters to a Vote of Security Holders – There have been no material changes to these procedures. |
| Item 11 – | Controls and Procedures |
(a) The registrant’s principal executive and principal financial officers, or persons performing similar functions, have concluded that the registrant’s disclosure controls and procedures (as defined in Rule30a-3(c) under the Investment Company Act of 1940, as amended (the “1940 Act”)) are effective as of a date within 90 days of the filing of this report based on the evaluation of these controls and procedures required by Rule30a-3(b) under the 1940 Act and Rule 15d-15(b) under the Securities Exchange Act of 1934, as amended.
(b) There were no changes in the registrant’s internal control over financial reporting (as defined inRule 30a-3(d) under the 1940 Act) that occurred during the last fiscal quarter of the period covered by this report that have materially affected, or are reasonably likely to materially affect, the registrant’s internal control over financial reporting.
| Item 12 – | Disclosure of Securities Lending Activities forClosed-End Management Investment Companies – Not Applicable |
| Item 13 – | Exhibits attached hereto |
(a)(1) Code of Ethics – See Item 2
(a)(2) Certifications – Attached hereto
(a)(3) Not Applicable
(a)(4) Not Applicable
(b) Certifications – Attached hereto
5
Pursuant to the requirements of the Securities Exchange Act of 1934 and the Investment Company Act of 1940, the registrant has duly caused this report to be signed on its behalf by the undersigned, thereunto duly authorized.
FDP Series II, Inc.
| By: | /s/ John M. Perlowski | |||
| John M. Perlowski | ||||
| Chief Executive Officer (principal executive officer) of | ||||
| FDP Series II, Inc. |
Date: August 2, 2019
Pursuant to the requirements of the Securities Exchange Act of 1934 and the Investment Company Act of 1940, this report has been signed below by the following persons on behalf of the registrant and in the capacities and on the dates indicated.
| By: | /s/ John M. Perlowski | |||
| John M. Perlowski | ||||
| Chief Executive Officer (principal executive officer) of | ||||
| FDP Series II, Inc. |
Date: August 2, 2019
| By: | /s/ Neal J. Andrews | |||
| Neal J. Andrews | ||||
| Chief Financial Officer (principal financial officer) of | ||||
| FDP Series II, Inc. |
Date: August 2, 2019
6