UNITED STATES
SECURITIES AND EXCHANGE COMMISSION
Washington, D.C. 20549
FORMN-CSR
CERTIFIED SHAREHOLDER REPORT OF REGISTERED MANAGEMENT INVESTMENT COMPANIES
Investment Company Act file number:811-23344 and811-23343
Name of Fund: BlackRock Funds VI
BlackRock CoreAlpha Bond Fund
Master Investment Portfolio II
CoreAlpha Bond Master Portfolio
Fund Address: 100 Bellevue Parkway, Wilmington, DE 19809
Name and address of agent for service: John M. Perlowski, Chief Executive Officer, BlackRock Funds VI and Master Investment Portfolio II, 55 East 52nd Street, New York, NY 10055
Registrants’ telephone number, including area code: (800)537-4942
Date of fiscal year end: 12/31/2018
Date of reporting period: 12/31/2018
Item 1 – Report to Stockholders
DECEMBER 31, 2018
| | |
ANNUAL REPORT | |  |
BlackRock Funds VI
| Ø | | BlackRock CoreAlpha Bond Fund |
Beginning on January 1, 2021, as permitted by regulations adopted by the Securities and Exchange Commission, paper copies of the Fund’s shareholder reports will no longer be sent by mail, unless you specifically request paper copies of the reports from BlackRock or from your financial intermediary, such as a broker-dealer or bank. Instead, the reports will be made available on a website, and you will be notified by mail each time a report is posted and provided with a website link to access the report.
You may elect to receive all future reports in paper free of charge. If you hold accounts directly with BlackRock, you can call 1-800-441-7762 to inform BlackRock that you wish to continue receiving paper copies of your shareholder reports. If you hold accounts through a financial intermediary, you can follow the instructions included with this disclosure, if applicable, or contact your financial intermediary to request that you continue to receive paper copies of your shareholder reports. Please note that not all financial intermediaries may offer this service. Your election to receive reports in paper will apply to all funds advised by BlackRock Advisors, LLC, BlackRock Fund Advisors or their affiliates, or all funds held with your financial intermediary, as applicable.
If you already elected to receive shareholder reports electronically, you will not be affected by this change and you need not take any action. You may elect to receive electronic delivery of shareholder reports and other communications by: (i) accessing the BlackRock website at www.blackrock.com/edelivery and logging into your accounts, if you hold accounts directly with BlackRock, or (ii) contacting your financial intermediary, if you hold accounts through a financial intermediary. Please note that not all financial intermediaries may offer this service.
|
| Not FDIC Insured • May Lose Value • No Bank Guarantee |
The Markets in Review
Dear Shareholder,
In the 12 months ended December 31, 2018, concerns about a variety of political risks and a modest slowdown in global growth worked against the equity market despite solid corporate earnings, while rising interest rates constrained bond returns. Though the market’s appetite for risk remained healthy for most of the reporting period, risk-taking declined sharply later in the reporting period. As a result, bonds held their value better than stocks, which posted negative returns across the globe. Shorter-term, higher-quality securities led the bond market, and U.S. equities outperformed most international stock markets.
Volatility rose in emerging market stocks, as the rising U.S. dollar and higher interest rates in the U.S. disrupted economic growth abroad. U.S.-China trade relations and debt concerns adversely affected the Chinese stock market, while Turkey and Argentina became embroiled in currency crises, largely due to hyperinflation in both countries. An economic slowdown in Europe also led to negative performance for European equities.
In fixed income markets, short-term U.S. Treasury interest rates rose the fastest, while longer-term rates slightly increased. This led to a negative return for long-term U.S. Treasuries and a substantial flattening of the yield curve. Many investors are concerned with the flattening yield curve as a harbinger of recession. However, given the extraordinary monetary measures in the last decade, we believe a more accurate barometer for the economy is the returns along the risk spectrums in stock and bond markets. Although the fundamentals in credit markets remained relatively solid, investment-grade bonds posted flat returns, and high-yield bonds declined slightly. Recent sell-offs in risk assets have flattened asset returns along the risk spectrum somewhat, which bears further scrutiny in the months ahead.
In response to rising growth and inflation, the U.S. Federal Reserve (the “Fed”) increased short-term interest rates four times during the reporting period. The Fed also continued to reduce its balance sheet, gradually reversing the unprecedented stimulus measures it enacted after the financial crisis. By our estimation, the Fed’s neutral interest rate, or the theoretical rate that is neither stimulative nor restrictive to the economy, is approximately 3.0%. With that perspective, the Fed’s current policy is still mildly stimulative to the U.S. economy, which leaves room for further Fed rate hikes to arrive at monetary policy that is a neutral factor for economic growth.
Volatility in the U.S. equity market spiked in October, as a wide range of risks were brought to bear on markets, ranging from rising interest rates and slowing global growth to heightened trade tensions and political turmoil in several countries, including the United States. This was accompanied by a broad based risk-off in December — which was the worst December performance on record since 1931. Although fears of recession drove equity volatility higher at the end of 2018, we continue to believe the probability of recession in 2019 remains relatively low.
Economic growth and global earnings are likely to slow somewhat in 2019 — the tax cut stimulus will be less pronounced, and the Fed’s rate hikes in 2018 will gain traction in 2019. Trade frictions look more baked into asset prices than a year ago, but markets may be overlooking European political risks. Consequently, we are cautious on European equities, as European unity remains tenuous with a history of flare-ups. We continue to prefer to take risk in U.S. and emerging market equities. Within U.S. equities, we believe that companies with high-quality earnings and strong balance sheets offer the most attractive risk/reward trade-off. Going into 2019, we also favor short-term bonds over long-term bonds because they offer nearly equivalent yields with far lower volatility.
In this environment, investors need to think globally, extend their scope across a broad array of asset classes, and be nimble as market conditions change. We encourage you to talk with your financial advisor and visitblackrock.com for further insight about investing in today’s markets.
Sincerely,

Rob Kapito
President, BlackRock Advisors, LLC

Rob Kapito
President, BlackRock Advisors, LLC
| | | | |
| Total Returns as of December 31, 2018 |
| | | 6-month | | 12-month |
U.S. large cap equities
(S&P 500® Index) | | (6.85)% | | (4.38)% |
U.S. small cap equities
(Russell 2000® Index) | | (17.35) | | (11.01) |
International equities
(MSCI Europe, Australasia,
Far East Index) | | (11.35) | | (13.79) |
Emerging market equities
(MSCI Emerging Markets Index) | | (8.48) | | (14.57) |
3-month Treasury bills
(ICE BofAML3-Month
U.S. Treasury Bill Index) | | 1.06 | | 1.87 |
U.S. Treasury securities
(ICE BofAML10-Year
U.S. Treasury Index) | | 2.72 | | (0.03) |
U.S. investment grade bonds
(Bloomberg Barclays U.S.
Aggregate Bond Index) | | 1.65 | | 0.01 |
Tax-exempt municipal bonds
(S&P Municipal Bond Index) | | 1.38 | | 1.36 |
U.S. high yield bonds
(Bloomberg Barclays
U.S. Corporate High Yield
2% Issuer Capped Index) | | (2.24) | | (2.08) |
| Past performance is no guarantee of future results. Index performance is shown for illustrative purposes only. You cannot invest directly in an index. |
| | |
| 2 | | THIS PAGEISNOT PARTOF YOUR FUND REPORT |
Table of Contents

| | |
| Fund Information as of December 31, 2018 | | BlackRock CoreAlpha Bond Fund |
Investment Objective
BlackRock CoreAlpha Bond Fund’s (the “Fund”) investment objective is to seek to provide a combination of income and capital growth.
On May 17, 2018, the Board of Trustees of BlackRock Funds III (the “Trust”) and, on May 23, 2018, the Board of Trustees of State Farm Mutual Fund Trust each approved a reorganization of the State Farm Bond Fund (the “Target Fund”), with and into the Fund. At a special shareholder meeting on September 14, 2018, the shareholders of the Target Fund approved the reorganization, which was completed on November 19, 2018.
Portfolio Management Commentary
How did the Fund perform?
For the12-month period ended December 31, 2018, all of the Fund’s share classes underperformed the benchmark, the Bloomberg Barclays U.S. Aggregate Bond Index (the “Index”).
The Fund invests all of its assets in the CoreAlpha Bond Master Portfolio (the “Master Portfolio”), a series of Master Investment Portfolio II.
What factors influenced performance?
During the period, the Master Portfolio’s positioning with respect to mortgage-backed securities (“MBS”) was the largest detractor from performance. In particular, a focus on higher coupons within30-year MBS weighed on returns as the yield curve flattened. Asset allocation also detracted based on overweight positions to both investment grade and high yield corporate bonds as credit sentiment deteriorated in the fourth quarter of 2018.
Positioning with respect to U.S. interest rates was the primary positive contributor to performance, driven by Treasury futures strategies surrounding auction supply. For most of the period, the Master Portfolio’s global rates strategies benefited from short positions in Canadian and European rates versus long positions in Australian and U.K. rates.
The Master Portfolio used derivatives in the form of futures contracts and swaps during the period in order to manage risk. The use of derivatives had a positive impact on Fund performance.
The Master Portfolio held a small amount of cash committed for pending transactions. The cash balance did not have a material impact on performance.
Describe recent portfolio activity.
Over the period, the Master Portfolio modestly trimmed its overweight position to industrials. In addition, overweights to communications, consumer cyclicals and consumernon-cyclicals and an underweight to transportation were reduced. Within financials, overweights to banking and insurance were increased. The Master Portfolio also shifted from an underweight to an overweight position within finance companies.
Describe portfolio positioning at period end.
At period end, the Master Portfolio remained underweight U.S. Treasury securities. Within spread sectors, the Master Portfolio was overweight investment grade corporate credit, agency MBS and asset-backed securities, with an underweight in transportation. The Master Portfolio also held anon-benchmark allocation to high yield corporate debt. Within investment grade corporates, the portfolio was overweight in the consumer sectors, banking names and select issues within communications. In terms of global rate positioning, the Master Portfolio remained short to Canadian and European rates relative to Australian and U.K. rates.
The views expressed reflect the opinions of BlackRock as of the date of this report and are subject to change based on changes in market, economic or other conditions. These views are not intended to be a forecast of future events and are no guarantee of future results.
| | |
| 4 | | 2018 BLACKROCK ANNUAL REPORTTO SHAREHOLDERS |
| | |
| Fund Information as of December 31, 2018 (continued) | | BlackRock CoreAlpha Bond Fund |
TOTAL RETURN BASED ON A $10,000 INVESTMENT
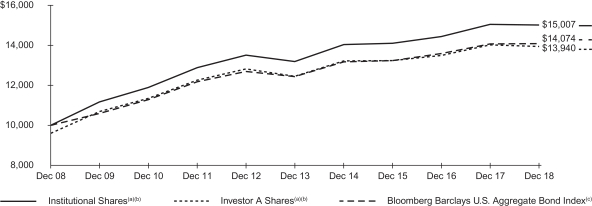
| (a) | Assuming maximum sales charges, transaction costs and other operating expenses, including administration fees, if any. Institutional Shares do not have a sales charge. |
| (b) | The Fund invests all of its assets in the Master Portfolio. The Master Portfolio invests, under normal circumstances, at least 80% the value of the Master Portfolio’s net assets, plus the amount of any borrowing for investment purposes, in bonds. On September 17, 2018, the Fund acquired all of the assets, subject to the liabilities, of BlackRock CoreAlpha Bond Fund (the “Predecessor Fund”), a series of BlackRock BlackRock Funds III, through a tax-free reorganization (the “Board Reorganization”). The Predecessor Fund is the performance and accounting survivor of the Board Reorganization. |
| (c) | A widely recognized unmanaged market-weighted index, comprised of investment-grade corporate bonds rated BBB or better, mortgages and U.S. Treasury and U.S. Government agency issues with at least one year to maturity. |
Performance Summary for the Period Ended December 31, 2018
| | | | | | | | | | | | | | | | | | | | | | | | | | | | | | | | | | | | | | | | | | | | | | | | |
| | | | | | | | | | | | | | | Average Annual Total Returns (a) | |
| | | | | | | | | | | | | | | 1 Year | | | | | | 5 Years | | | | | | 10 Years | |
| | | Standardized 30-Day Yields | | | Unsubsidized 30-Day Yields | | | 6-Month
Total Returns | | | | | | w/o sales
charge | | | w/sales
charge | | | | | | w/o sales
charge | | | w/sales
charge | | | | | | w/o sales
charge | | | w/sales
charge | |
Institutional | | | 3.06 | % | | | 3.04 | % | | | 1.10 | % | | | | | | | (0.18 | )% | | | N/A | | | | | | | | 2.63 | % | | | N/A | | | | | | | | 4.14 | % | | | N/A | |
Investor A | | | 2.59 | | | | 2.59 | | | | 0.94 | | | | | | | | (0.52 | ) | | | (4.50 | )% | | | | | | | 2.28 | | | | 1.45 | % | | | | | | | 3.80 | | | | 3.38 | % |
Investor C | | | 1.96 | | | | 1.94 | | | | 0.46 | | | | | | | | (1.36 | ) | | | (2.32 | ) | | | | | | | 1.53 | | | | 1.53 | | | | | | | | 3.02 | | | | 3.02 | |
Class K | | | 3.10 | | | | 3.08 | | | | 1.03 | | | | | | | | (0.14 | ) | | | N/A | | | | | | | | 2.69 | | | | N/A | | | | | | | | 4.17 | | | | N/A | |
Bloomberg Barclays U.S. Aggregate Bond Index | | | | | | | | | | | 1.65 | | | | | | | | 0.01 | | | | N/A | | | | | | | | 2.52 | | | | N/A | | | | | | | | 3.48 | | | | N/A | |
| | (a) | Assuming maximum sales charges, if any. Average annual total returns with and without sales charges reflect reductions for distribution and service fees. See “About Fund Performance” on page 6 for a detailed description of share classes, including any related sales charges and fees, and how performance was calculated for certain share classes. On September 17, 2018, the Fund acquired all of the assets, subject to the liabilities, of the Predecessor Fund through the Board Reorganization. The Predecessor Fund is the performance and accounting survivor of the Board Reorganization. | |
N/A — Not applicable as share class and index do not have a sales charge.
Past performance is not indicative of future results.
Performance results may include adjustments made for financial reporting purposes in accordance with U.S. generally accepted accounting principles.
Expense Example
| | | | | | | | | | | | | | | | | | | | | | | | | | | | | | | | |
| | | Actual | | | | | | Hypothetical (b) | | | | |
| | | Beginning
Account Value
(07/01/18) | | | Ending
Account Value
(12/31/18) | | | Expenses Paid During the Period (a) | | | | | | Beginning
Account Value
(07/01/18) | | | Ending
Account Value
(12/31/18) | | | Expenses Paid During the Period (a) | | | Annualized
Expense Ratio | |
Institutional | | $ | 1,000.00 | | | $ | 1,011.00 | | | $ | 1.72 | | | | | | | $ | 1,000.00 | | | | 1,023.49 | | | | 1.73 | | | | 0.34 | % |
Investor A | | | 1,000.00 | | | $ | 1,009.40 | | | $ | 2.68 | | | | | | | | 1,000.00 | | | | 1,022.53 | | | | 2.70 | | | | 0.53 | % |
Investor C | | | 1,000.00 | | | $ | 1,004.60 | | | $ | 7.23 | | | | | | | | 1,000.00 | | | | 1,018.00 | | | | 7.27 | | | | 1.43 | % |
Class K | | | 1,000.00 | | | $ | 1,010.30 | | | $ | 1.52 | | | | | | | | 1,000.00 | | | | 1,023.69 | | | | 1.53 | | | | 0.30 | % |
| | (a) | For each class of the Fund, expenses are equal to the annualized net expense ratio for the class, multiplied by the average account value over the period, multiplied by 184/365 (to reflect the one-half year period shown). Because the Fund invests all of its assets in the Master Portfolio, the expense example reflects the net expenses of both the Fund and the Master Portfolio in which it invests. | |
| | (b) | Hypothetical 5% annual return before expenses is calculated by prorating the number of days in the most recent fiscal half year divided by 365. | |
See “Disclosure of Expenses” on page 6 for further information on how expenses are calculated.
About Fund Performance
On September 17, 2018, the Fund acquired all of the assets, subject to the liabilities, of BlackRock CoreAlpha Bond Fund (the “Predecessor Fund”), a series of BlackRock BlackRock Funds III, through a tax-free reorganization (the “Board Reorganization”). The Predecessor Fund is the performance and accounting survivor of the Board Reorganization.
Institutional and Class K Sharesare not subject to any sales charge. These shares bear no ongoing distribution or service fees and are available only to certain eligible investors.
Investor A Shares are subject to a maximum initial sales charge (front-end load) of 4.00% and a service fee of 0.25% per year (but no distribution fee). Certain redemptions of these shares may be subject to a contingent deferred sales charge (“CDSC”) where no initial sales charge was paid at the time of purchase. These shares are generally available through financial intermediaries.
Investor C Shares are subject to a 1.00% CDSC if redeemed within one year of purchase. In addition, these shares are subject to a distribution fee of 0.75% per year and a service fee of 0.25% per year. These shares are generally available through financial intermediaries. Effective November 8, 2018, the Fund adopted an automatic conversion feature whereby Investor C Shares held for approximately ten years will be automatically converted into Investor A Shares and, thereafter, investors will be subject to lower ongoing fees.
Prior to February 28, 2011 for Institutional Shares, April 30, 2012 for Investor A and Investor C Shares and March 28, 2016 for Class K Shares, the performance of the classes is based on the returns of CoreAlpha Bond Master Portfolio, a Series of Master Investment Portfolio, adjusted to reflect the estimated annual fund fees and operating expenses of each respective share class of the Predecessor Fund.
Performance information reflects past performance and does not guarantee future results. Current performance may be lower or higher than the performance data quoted. Refer towww.blackrock.comto obtain performance data current to the most recent month-end. Performance results do not reflect the deduction of taxes that a shareholder would pay on fund distributions or the redemption of fund shares. Figures shown in the performance table on the previous page assume reinvestment of all distributions, if any, at net asset value (“NAV”) on the ex-dividend/payable date. Investment return and principal value of shares will fluctuate so that shares, when redeemed, may be worth more or less than their original cost. Distributions paid to each class of shares will vary because of the different levels of service, distribution and transfer agency fees applicable to each class, which are deducted from the income available to be paid to shareholders.
BlackRock Advisors, LLC (“BAL” or the “Administrator”), the Fund’s administrator, has contractually agreed to waive and/or reimburse a portion of the Fund’s expenses. Without such waiver and/or reimbursement, the Fund’s performance would have been lower. The Administrator is under no obligation to continue waiving and/or reimbursing its fees after the applicable termination date of such agreement. See Note 4 of the Notes to Financial Statements for additional information on waivers and/or reimbursements. The standardized 30-day yield includes the effects of any waivers and/ or reimbursements. The unsubsidized 30-day yield excludes the effects of any waivers and/or reimbursements.
Disclosure of Expenses
Shareholders of the Fund may incur the following charges: (a) transactional expenses, such as sales charges; and (b) operating expenses, including administration fees, service and distribution fees, including12b-1 fees, acquired fund fees and expenses, and other fund expenses. The expense example shown on the previous page (which is based on a hypothetical investment of $1,000 invested on July 1, 2018 and held through December 31, 2018) is intended to assist shareholders both in calculating expenses based on an investment in the Fund and in comparing these expenses with similar costs of investing in other mutual funds.
The expense example provides information about actual account values and actual expenses. In order to estimate the expenses a shareholder paid during the period covered by this report, shareholders can divide their account value by $1,000 and then multiply the result by the number corresponding to their Fund and share class under the heading entitled “Expenses Paid During the Period.”
The expense example also provides information about hypothetical account values and hypothetical expenses based on the Fund’s actual expense ratio and an assumed rate of return of 5% per year before expenses. In order to assist shareholders in comparing the ongoing expenses of investing in the Fund and other funds, compare the 5% hypothetical example with the 5% hypothetical examples that appear in shareholder reports of other funds.
The expenses shown in the expense example are intended to highlight shareholders’ ongoing costs only and do not reflect transactional expenses, such as sales charges, if any. Therefore, the hypothetical example is useful in comparing ongoing expenses only, and will not help shareholders determine the relative total expenses of owning different funds. If these transactional expenses were included, shareholder expenses would have been higher.
Derivative Financial Instruments
The Fund may invest in various derivative financial instruments. These instruments are used to obtain exposure to a security, commodity, index, market, and/or other assets without owning or taking physical custody of securities, commodities and/or other referenced assets or to manage market, equity, credit, interest rate, foreign currency exchange rate, commodity and/or other risks. Derivative financial instruments may give rise to a form of economic leverage and involve risks, including the imperfect correlation between the value of a derivative financial instrument and the underlying asset, possible default of the counterparty to the transaction or illiquidity of the instrument. The Fund’s successful use of a derivative financial instrument depends on the investment adviser’s ability to predict pertinent market movements accurately, which cannot be assured. The use of these instruments may result in losses greater than if they had not been used, may limit the amount of appreciation the Fund can realize on an investment and/or may result in lower distributions paid to shareholders. The Fund’s investments in these instruments, if any, are discussed in detail in the Notes to Financial Statements.
| | |
| 6 | | 2018 BLACKROCK ANNUAL REPORTTO SHAREHOLDERS |
Statement of Assets and Liabilities
December 31, 2018
| | | | |
| | | BlackRock CoreAlpha Bond Fund | |
|
ASSETS | |
Investments at value — Master Portfolio | | $ | 1,225,881,553 | |
Receivables: | | | | |
Withdrawals from the Master Portfolio | | | 22,014,302 | |
Capital shares sold | | | 139,805 | |
From the Administrator/Manager | | | 1,173 | |
| | | | |
Total assets | | | 1,248,036,833 | |
| | | | |
|
LIABILITIES | |
Payables: | | | | |
Capital shares redeemed | | | 22,154,107 | |
Administration fees | | | 51,759 | |
Income dividend distributions | | | 110,135 | |
Board realignment and consolidation | | | 97,563 | |
Other accrued expenses | | | 10,999 | |
Service and distribution fees | | | 92,232 | |
| | | | |
Total liabilities | | | 22,516,795 | |
| | | | |
| |
NET ASSETS | | $ | 1,225,520,038 | |
| | | | |
|
NET ASSETS CONSIST OF | |
Paid-in capital | | $ | 1,258,697,277 | |
Accumulated loss | | | (33,177,239 | ) |
| | | | |
NET ASSETS | | $ | 1,225,520,038 | |
| | | | |
|
NET ASSET VALUE | |
Institutional — Based on net assets of $791,196,736 and 78,979,023 shares outstanding, unlimited shares authorized, no par value | | $ | 10.02 | |
| | | | |
Investor A — Based on net assets of $433,789,300 and 43,301,068 shares outstanding, unlimited shares authorized, no par value | | $ | 10.02 | |
| | | | |
Investor C — Based on net assets of $156,751 and 15,640 shares outstanding, unlimited shares authorized, no par value | | $ | 10.02 | |
| | | | |
Class K — Based on net assets of $377,251 and 37,638 shares outstanding, unlimited shares authorized, no par value | | $ | 10.02 | |
| | | | |
See notes to financial statements.
Statement of Operations
Year Ended December 31, 2018
| | | | |
| | | BlackRock CoreAlpha Bond Fund | |
|
INVESTMENT INCOME | |
Net investment income allocated from the Master Portfolio: | |
Interest — unaffiliated | | $ | 20,887,137 | |
Dividends — affiliated | | | 1,956,263 | |
Securities lending income — affiliated — net | | | 284,090 | |
Expenses | | | (1,775,635 | ) |
Fees waived | | | 213,786 | |
| | | | |
Total investment income | | | 21,565,641 | |
| | | | |
|
FUND EXPENSES | |
Administration — class specific | | | 589,760 | |
Reorganization costs | | | 152,494 | |
Service and distribution — class specific | | | 130,930 | |
Board realignment and consolidation | | | 114,109 | |
Professional | | | 7,416 | |
Miscellaneous | | | 1,500 | |
| | | | |
Total expenses | | | 996,209 | |
Less fees waived and/or reimbursed by the Administrator/Manager | | | (161,085 | ) |
| | | | |
Total expenses after fees waived and/or reimbursed | | | 835,124 | |
| | | | |
Net investment income | | | 20,730,517 | |
| | | | |
|
REALIZED AND UNREALIZED GAIN (LOSS) ALLOCATED FROM THE MASTER PORTFOLIO | |
Net realized gain (loss) from: | |
Investments — unaffiliated | | | (10,633,570 | ) |
Investments — affiliated | | | 161 | |
Futures contracts | | | (3,356,403 | ) |
Forward foreign currency exchange contracts | | | 11,966 | |
Foreign currency transactions | | | (20,511 | ) |
Options written | | | 15,493 | |
Swaps | | | 208,766 | |
| | | | |
| | | (13,774,098 | ) |
| | | | |
Net change in unrealized appreciation (depreciation) on: | |
Investments — unaffiliated | | | 454,338 | |
Investments — affiliated | | | (1,558,093 | ) |
Futures contracts | | | 6,534,881 | |
Forward foreign currency exchange contracts | | | 1,157 | |
Foreign currency translations | | | (103,216 | ) |
Swaps | | | (2,064,868 | ) |
| | | | |
| | | 3,264,199 | |
| | | | |
Net realized and unrealized loss | | | (10,509,899 | ) |
| | | | |
NET INCREASE IN NET ASSETS RESULTING FROM OPERATIONS | | $ | 10,220,618 | |
| | | | |
See notes to financial statements.
| | |
| 8 | | 2018 BLACKROCK ANNUAL REPORTTO SHAREHOLDERS |
Statements of Changes in Net Assets
| | | | | | | | |
| | | BlackRock CoreAlpha Bond Fund | |
| | | Year Ended December 31, | |
| | | 2018 | | | 2017 | |
|
INCREASE (DECREASE) IN NET ASSETS | |
|
OPERATIONS | |
Net investment income | | $ | 20,730,517 | | | $ | 9,246,381 | |
Net realized gain (loss) | | | (13,774,098 | ) | | | 3,927,648 | |
Net change in unrealized appreciation (depreciation) | | | 3,264,199 | | | | 1,913,676 | |
| | | | | | | | |
Net increase in net assets resulting from operations | | | 10,220,618 | | | | 15,087,705 | |
| | | | | | | | |
|
DISTRIBUTIONS TO SHAREHOLDERS(a)(b)(c) | |
From net investment income and net realized gain: | | | | | | | | |
Institutional | | | (18,916,261 | ) | | | (9,228,774 | ) |
Investor A | | | (1,760,243 | ) | | | (26,480 | ) |
Investor C | | | (3,565 | ) | | | (4,049 | ) |
Class K | | | (11,020 | ) | | | (4,884 | ) |
From return of capital: | | | | | | | | |
Institutional | | | — | | | | (1,542,649 | ) |
Investor A | | | — | | | | (4,426 | ) |
Investor C | | | — | | | | (677 | ) |
Class K | | | — | | | | (816 | ) |
| | | | | | | | |
Decrease in net assets resulting from distributions to shareholders | | | (20,691,089 | ) | | | (10,812,755 | ) |
| | | | | | | | |
|
CAPITAL SHARE TRANSACTIONS | |
Net increase in net assets derived from capital share transactions | | | 738,451,689 | | | | 145,778,113 | |
| | | | | | | | |
|
NET ASSETS(c) | |
Total increase in net assets | | | 727,981,218 | | | | 150,053,063 | |
Beginning of year | | | 497,538,820 | | | | 347,485,757 | |
| | | | | | | | |
End of year | | $ | 1,225,520,038 | | | $ | 497,538,820 | |
| | | | | | | | |
| (a) | Distributions for annual periods determined in accordance with U.S. federal income tax regulations. |
| (b) | The Fund’s current practice is to retain long-term capital gains, if any, and to pay federal taxes thereon at corporate tax rates on behalf of the shareholders. For federal income tax purposes, each shareholder will be required to include their proportionate share of the retained capital gains in income and are entitled to report a credit for their share of the tax paid by the Fund. |
| (c) | Prior year distribution character information and undistributed net investment income has been modified or removed to conform with current year RegulationS-X presentation changes. Refer to Note 7 for this prior year information. |
See notes to financial statements.
Financial Highlights
(For a share outstanding throughout each period)
| | | | | | | | | | | | | | | | | | | | |
| | | BlackRock CoreAlpha Bond Fund | |
| |
| | | Institutional | |
| |
| | | Year Ended December 31, | |
| | | 2018 | | | 2017 | | | 2016 | | | 2015 | | | 2014 | |
| | | | | |
Net asset value, beginning of year | | $ | 10.35 | | | $ | 10.22 | | | $ | 10.32 | | | $ | 10.57 | | | $ | 10.19 | |
| | | | | | | | | | | | | | | | | | | | |
Net investment income(a) | | | 0.31 | | | | 0.25 | | | | 0.24 | | | | 0.26 | | | | 0.26 | |
Net realized and unrealized gain (loss) | | | (0.34 | ) | | | 0.17 | | | | 0.01 | | | | (0.20 | ) | | | 0.39 | |
| | | | | | | | | | | | | | | | | | | | |
Net increase (decrease) from investment operations | | | (0.03 | ) | | | 0.42 | | | | 0.25 | | | | 0.06 | | | | 0.65 | |
| | | | | | | | | | | | | | | | | | | | |
|
| Distributions(b) | |
From net investment income | | | (0.30 | ) | | | (0.25 | ) | | | (0.22 | ) | | | (0.25 | ) | | | (0.26 | ) |
From net realized gain | | | (0.00 | )(c) | | | — | | | | (0.12 | ) | | | (0.06 | ) | | | (0.01 | ) |
From return of capital | | | — | | | | (0.04 | ) | | | (0.01 | ) | | | — | | | | — | |
| | | | | | | | | | | | | | | | | | | | |
Total distributions | | | (0.30 | ) | | | (0.29 | ) | | | (0.35 | ) | | | (0.31 | ) | | | (0.27 | ) |
| | | | | | | | | | | | | | | | | | | | |
| | | | | |
Net asset value, end of year | | $ | 10.02 | | | $ | 10.35 | | | $ | 10.22 | | | $ | 10.32 | | | $ | 10.57 | |
| | | | | | | | | | | | | | | | | | | | |
|
Total Return(d) | |
Based on net asset value | | | (0.18 | )% | | | 4.19 | % | | | 2.37 | % | | | 0.48 | % | | | 6.45 | % |
| | | | | | | | | | | | | | | | | | | | |
|
Ratios to Average Net Assets(e) | |
Total expenses(f) | | | 0.37 | %(g) | | | 0.35 | % | | | 0.35 | % | | | 0.35 | % | | | 0.35 | % |
| | | | | | | | | | | | | | | | | | | | |
Total expenses after fees waived and/or reimbursed (f) | | | 0.35 | %(g) | | | 0.34 | % | | | 0.35 | % | | | 0.35 | % | | | 0.34 | % |
| | | | | | | | | | | | | | | | | | | | |
Net investment income(f) | | | 3.14 | % | | | 2.44 | % | | | 2.24 | % | | | 2.48 | % | | | 2.53 | % |
| | | | | | | | | | | | | | | | | | | | |
|
Supplemental Data | |
Net assets, end of year (000) | | $ | 791,197 | | | $ | 496,618 | | | $ | 345,259 | | | $ | 236,267 | | | $ | 183,880 | |
| | | | | | | | | | | | | | | | | | | | |
Portfolio turnover rate of the Master Portfolio(h) | | | 331 | % | | | 515 | % | | | 677 | % | | | 612 | % | | | 686 | % |
| | | | | | | | | | | | | | | | | | | | |
| (a) | Based on average shares outstanding. |
| (b) | Distributions for annual periods determined in accordance with U.S. federal income tax regulations. |
| (c) | Amount is greater than $(0.005) per share. |
| (d) | Where applicable, assumes the reinvestment of distributions. |
| (e) | Includes the Fund’s share of the Master Portfolio’s allocated expenses and/or net investment income. |
| (f) | Includes the Fund’s share of its corresponding Master Portfolio’s allocated fees waived and expenses and/or net investment income. Excludes expenses incurred indirectly as a result of the Master Portfolio’s investments in underlying funds as follows: |
| | | | | | | | | | | | | | | | | | | | | | | | | | | | | | | | | | | | | | | | |
| | | 2018 | | | | | | 2017 | | | | | | 2016 | | | | | | 2015 | | | | | | 2014 | | | | |
Allocated fees waived | | | 0.02 | % | | | | | | | 0.02 | % | | | | | | | 0.01 | % | | | | | | | 0.01 | % | | | | | | | 0.01 | % | | | | |
Investments in underlying funds | | | 0.02 | % | | | | | | | 0.02 | % | | | | | | | — | | | | | | | | — | | | | | | | | — | | | | | |
| | | | | | | | | | | | | | | | | | | | | | | | | | | | | | | | | | | | | | | | |
| (g) | Includes reorganization and board realignment and consolidation costs. Without these costs, total expenses and total expenses after fees waived and/or reimbursed would have been 0.33% and 0.31%, respectively. |
| (h) | Includes mortgage dollar roll transactions (“MDRs”). Additional information regarding portfolio turnover rate is as follows: |
| | | | | | | | | | | | | | | | | | | | | | | | | | | | | | | | | | | | | | |
| | | 2018 | | | | | 2017 | | | | | | 2016 | | | | | | 2015 | | | | | | 2014 | | | | |
Portfolio turnover rate (excluding MDRs) | | | 189 | % | | | | | 322 | % | | | | | | | 459 | % | | | | | | | 540 | % | | | | | | | 470 | % | | | | |
| | | | | | | | | | | | | | | | | | | | | | | | | | | | | | | | | | | | | | |
See notes to financial statements.
| | |
| 10 | | 2018 BLACKROCK ANNUAL REPORTTO SHAREHOLDERS |
Financial Highlights (continued)
(For a share outstanding throughout each period)
| | | | | | | | | | | | | | | | | | | | |
| | | BlackRock CoreAlpha Bond Fund | |
| |
| | | Investor A | |
| |
| | | Year Ended December 31, | |
| | | 2018 | | | 2017 | | | 2016 | | | 2015 | | | 2014 | |
| | | | | |
Net asset value, beginning of year | | $ | 10.35 | | | $ | 10.22 | | | $ | 10.32 | | | $ | 10.58 | | | $ | 10.19 | |
| | | | | | | | | | | | | | | | | | | | |
Net investment income(a) | | | 0.30 | | | | 0.20 | | | | 0.20 | | | | 0.22 | | | | 0.23 | |
Net realized and unrealized gain (loss) | | | (0.36 | ) | | | 0.19 | | | | 0.01 | | | | (0.21 | ) | | | 0.39 | |
| | | | | | | | | | | | | | | | | | | | |
Net increase (decrease) from investment operations | | | (0.06 | ) | | | 0.39 | | | | 0.21 | | | | 0.01 | | | | 0.62 | |
| | | | | | | | | | | | | | | | | | | | |
|
| Distributions(b) | |
From net investment income | | | (0.27 | ) | | | (0.22 | ) | | | (0.18 | ) | | | (0.21 | ) | | | (0.22 | ) |
From net realized gain | | | (0.00 | )(c) | | | — | | | | (0.12 | ) | | | (0.06 | ) | | | (0.01 | ) |
From return of capital | | | — | | | | (0.04 | ) | | | 0.01 | | | | — | | | | — | |
| | | | | | | | | | | | | | | | | | | | |
Total distributions | | | (0.27 | ) | | | (0.26 | ) | | | (0.31 | ) | | | (0.27 | ) | | | (0.23 | ) |
| | | | | | | | | | | | | | | | | | | | |
| | | | | |
Net asset value, end of year | | $ | 10.02 | | | $ | 10.35 | | | $ | 10.22 | | | $ | 10.32 | | | $ | 10.58 | |
| | | | | | | | | | | | | | | | | | | | |
|
Total Return(d) | |
Based on net asset value | | | (0.52 | )% | | | 3.83 | % | | | 2.01 | % | | | 0.04 | % | | | 6.18 | % |
| | | | | | | | | | | | | | | | | | | | |
|
Ratios to Average Net Assets(e) | |
Total expenses(f) | | | 0.56 | %(g) | | | 0.69 | % | | | 0.70 | % | | | 0.70 | % | | | 0.71 | % |
| | | | | | | | | | | | | | | | | | | | |
Total expenses after fees waived and/or reimbursed(f) | | | 0.53 | %(g) | | | 0.69 | % | | | 0.69 | % | | | 0.70 | % | | | 0.69 | % |
| | | | | | | | | | | | | | | | | | | | |
Net investment income(f) | | | 3.05 | % | | | 1.99 | % | | | 1.92 | % | | | 2.13 | % | | | 2.19 | % |
| | | | | | | | | | | | | | | | | | | | |
|
Supplemental Data | |
Net assets, end of year (000) | | $ | 433,789 | | | $ | 485 | | | $ | 1,695 | | | $ | 2,463 | | | $ | 1,776 | |
| | | | | | | | | | | | | | | | | | | | |
Portfolio turnover rate of the Master Portfolio(h) | | | 331 | % | | | 515 | % | | | 677 | % | | | 612 | % | | | 686 | % |
| | | | | | | | | | | | | | | | | | | | |
| (a) | Based on average shares outstanding. |
| (b) | Distributions for annual periods determined in accordance with U.S. federal income tax regulations. |
| (c) | Amount is greater than $(0.005) per share. |
| (d) | Where applicable, excludes the effects of any sales charges and assumes the reinvestment of distributions. |
| (e) | Includes the Fund’s share of the Master Portfolio’s allocated expenses and/or net investment income. |
| (f) | Includes the Fund’s share of its corresponding Master Portfolio’s allocated fees waived and expenses and/or net investment income. Excludes expenses incurred indirectly as a result of the Master Portfolio’s investments in underlying funds as follows: |
| | | | | | | | | | | | | | | | | | | | | | | | | | | | | | | | | | | | | | | | |
| | | 2018 | | | | | | 2017 | | | | | | 2016 | | | | | | 2015 | | | | | | 2014 | | | | |
Allocated fees waived | | | 0.02 | % | | | | | | | 0.02 | % | | | | | | | 0.01 | % | | | | | | | 0.01 | % | | | | | | | 0.01 | % | | | | |
Investments in underlying funds | | | 0.02 | % | | | | | | | 0.02 | % | | | | | | | — | | | | | | | | — | | | | | | | | — | | | | | |
| | | | | | | | | | | | | | | | | | | | | | | | | | | | | | | | | | | | | | | | |
| (g) | Includes reorganization and board realignment and consolidation costs. Without these costs, total expenses and total expenses after fees waived and/or reimbursed would have been 0.52% and 0.49%, respectively. |
| (h) | Includes mortgage dollar roll transactions (“MDRs”). Additional information regarding portfolio turnover rate is as follows: |
| | | | | | | | | | | | | | | | | | | | | | | | | | | | | | | | | | | | | | |
| | | 2018 | | | | | 2017 | | | | | | 2016 | | | | | | 2015 | | | | | | 2014 | | | | |
Portfolio turnover rate (excluding MDRs) | | | 189 | % | | | | | 322 | % | | | | | | | 459 | % | | | | | | | 540 | % | | | | | | | 470 | % | | | | |
| | | | | | | | | | | | | | | | | | | | | | | | | | | | | | | | | | | | | | |
See notes to financial statements.
Financial Highlights (continued)
(For a share outstanding throughout each period)
| | | | | | | | | | | | | | | | | | | | |
| | | BlackRock CoreAlpha Bond Fund | |
| |
| | | Investor C | |
| |
| | | Year Ended December 31, | |
| | | 2018 | | | 2017 | | | 2016 | | | 2015 | | | 2014 | |
| | | | | |
Net asset value, beginning of year | | $ | 10.36 | | | $ | 10.23 | | | $ | 10.32 | | | $ | 10.57 | | | $ | 10.18 | |
| | | | | | | | | | | | | | | | | | | | |
Net investment income(a) | | | 0.20 | | | | 0.13 | | | | 0.12 | | | | 0.15 | | | | 0.15 | |
Net realized and unrealized gain (loss) | | | (0.35 | ) | | | 0.18 | | | | 0.02 | | | | (0.21 | ) | | | 0.40 | |
| | | | | | | | | | | | | | | | | | | | |
Net increase (decrease) from investment operations | | | (0.15 | ) | | | 0.31 | | | | 0.14 | | | | (0.06 | ) | | | 0.55 | |
| | | | | | | | | | | | | | | | | | | | |
|
| Distributions(b) | |
From net investment income | | | (0.19 | ) | | | (0.15 | ) | | | (0.10 | ) | | | (0.13 | ) | | | (0.15 | ) |
From net realized gain | | | (0.00 | )(c) | | | — | | | | (0.12 | ) | | | (0.06 | ) | | | (0.01 | ) |
From return of capital | | | — | | | | (0.03 | ) | | | (0.01 | ) | | | — | | | | — | |
| | | | | | | | | | | | | | | | | | | | |
Total distributions | | | (0.19 | ) | | | (0.18 | ) | | | (0.23 | ) | | | (0.19 | ) | | | (0.16 | ) |
| | | | | | | | | | | | | | | | | | | | |
| | | | | |
Net asset value, end of year | | $ | 10.02 | | | $ | 10.36 | | | $ | 10.23 | | | $ | 10.32 | | | $ | 10.57 | |
| | | | | | | | | | | | | | | | | | | | |
|
Total Return(d) | |
Based on net asset value | | | (1.36 | )% | | | 3.05 | % | | | 1.35 | % | | | (0.61 | )% | | | 5.40 | % |
| | | | | | | | | | | | | | | | | | | | |
|
Ratios to Average Net Assets(e) | |
Total expenses(f) | | | 1.46 | %(g) | | | 1.44 | % | | | 1.45 | % | | | 1.46 | % | | | 1.45 | % |
| | | | | | | | | | | | | | | | | | | | |
Total expenses after fees waived and/or reimbursed(f) | | | 1.44 | %(g) | | | 1.44 | % | | | 1.45 | % | | | 1.45 | % | | | 1.44 | % |
| | | | | | | | | | | | | | | | | | | | |
Net investment income(f) | | | 2.02 | % | | | 1.30 | % | | | 1.14 | % | | | 1.39 | % | | | 1.44 | % |
| | | | | | | | | | | | | | | | | | | | |
|
Supplemental Data | |
Net assets, end of year (000) | | $ | 157 | | | $ | 238 | | | $ | 337 | | | $ | 272 | | | $ | 253 | |
| | | | | | | | | | | | | | | | | | | | |
Portfolio turnover rate of the Master Portfolio(h) | | | 331 | % | | | 515 | % | | | 677 | % | | | 612 | % | | | 686 | % |
| | | | | | | | | | | | | | | | | | | | |
| (a) | Based on average shares outstanding. |
| (b) | Distributions for annual periods determined in accordance with U.S. federal income tax regulations. |
| (c) | Amount is greater than $(0.005) per share. |
| (d) | Where applicable, excludes the effects of any sales charges and assumes the reinvestment of distributions. |
| (e) | Includes the Fund’s share of the Master Portfolio’s allocated expenses and/or net investment income. |
| (f) | Includes the Fund’s share of its corresponding Master Portfolio’s allocated fees waived and expenses and/or net investment income. Excludes expenses incurred indirectly as a result of the Master Portfolio’s investments in underlying funds as follows: |
| | | | | | | | | | | | | | | | | | | | | | | | | | | | | | | | | | | | | | | | |
| | | 2018 | | | | | | 2017 | | | | | | 2016 | | | | | | 2015 | | | | | | 2014 | | | | |
Allocated fees waived | | | 0.02 | % | | | | | | | 0.02 | % | | | | | | | 0.01 | % | | | | | | | 0.01 | % | | | | | | | 0.01 | % | | | | |
Investments in underlying funds | | | 0.02 | % | | | | | | | 0.02 | % | | | | | | | — | | | | | | | | — | | | | | | | | — | | | | | |
| | | | | | | | | | | | | | | | | | | | | | | | | | | | | | | | | | | | | | | | |
| (g) | Includes reorganization and board realignment and consolidation costs. Without these costs, total expenses and total expenses after fees waived and/or reimbursed would have been 1.42% and 1.40%, respectively. |
| (h) | Includes mortgage dollar roll transactions (“MDRs”). Additional information regarding portfolio turnover rate is as follows: |
| | | | | | | | | | | | | | | | | | | | | | | | | | | | | | | | | | | | | | |
| | | 2018 | | | | | 2017 | | | | | | 2016 | | | | | | 2015 | | | | | | 2014 | | | | |
Portfolio turnover rate (excluding MDRs) | | | 189 | % | | | | | 322 | % | | | | | | | 459 | % | | | | | | | 540 | % | | | | | | | 470 | % | | | | |
| | | | | | | | | | | | | | | | | | | | | | | | | | | | | | | | | | | | | | |
See notes to financial statements.
| | |
| 12 | | 2018 BLACKROCK ANNUAL REPORTTO SHAREHOLDERS |
Financial Highlights (continued)
(For a share outstanding throughout each period)
| | | | | | | | | | | | | | | | |
| | | BlackRock CoreAlpha Bond Fund | |
| |
| | | Class K | |
| | | |
| | | Year Ended
December 31, | | | | | | Period from 03/28/16 (a) to 12/31/16 | |
| | | 2018 | | | 2017 | | | | |
| | | | | |
Net asset value, beginning of period | | $ | 10.35 | | | $ | 10.23 | | | | | | | $ | 10.51 | |
| | | | | | | | | | | | | | | | |
Net investment income(b) | | | 0.32 | | | | 0.26 | | | | | | | | 0.18 | |
Net realized and unrealized gain (loss) | | | (0.34 | ) | | | 0.16 | | | | | | | | (0.17 | ) |
| | | | | | | | | | | | | | | | |
Net increase (decrease) from investment operations | | | (0.02 | ) | | | 0.42 | | | | | | | | 0.01 | |
| | | | | | | | | | | | | | | | |
|
| Distributions(c) | |
From net investment income | | | (0.31 | ) | | | (0.26 | ) | | | | | | | (0.16 | ) |
From net realized gain | | | (0.00 | )(d) | | | — | | | | | | | | (0.12 | ) |
From return of capital | | | — | | | | (0.04 | ) | | | | | | | (0.01 | ) |
| | | | | | | | | | | | | | | | |
Total distributions | | | (0.31 | ) | | | (0.30 | ) | | | | | | | (0.29 | ) |
| | | | | | | | | | | | | | | | |
| | | | |
Net asset value, end of period | | $ | 10.02 | | | $ | 10.35 | | | | | | | $ | 10.23 | |
| | | | | | | | | | | | | | | | |
|
Total Return(e) | |
Based on net asset value | | | (0.14 | )% | | | 4.14 | % | | | | | | | 0.00 | %(f) |
| | | | | | | | | | | | | | | | |
|
Ratios to Average Net Assets(g) | |
Total expenses(h) | | | 0.33 | %(i) | | | 0.30 | % | | | | | | | 0.30 | %(j) |
| | | | | | | | | | | | | | | | |
Total expenses after fees waived and/ or reimbursed(h) | | | 0.30 | %(i) | | | 0.30 | % | | | | | | | 0.30 | %(j) |
| | | | | | | | | | | | | | | | |
Net investment income(h) | | | 3.19 | % | | | 2.48 | % | | | | | | | 2.25 | %(j) |
| | | | | | | | | | | | | | | | |
|
Supplemental Data | |
Net assets, end of period (000) | | $ | 377 | | | $ | 197 | | | | | | | $ | 195 | |
| | | | | | | | | | | | | | | | |
Portfolio turnover rate of the Master Portfolio(k) | | | 331 | % | | | 515 | % | | | | | | | 677 | % |
| | | | | | | | | | | | | | | | |
| (a) | Commencement of operations. |
| (b) | Based on average shares outstanding. |
| (c) | Distributions for annual periods determined in accordance with U.S. federal income tax regulations. |
| (d) | Amount is greater than $(0.005) per share. |
| (e) | Where applicable, assumes the reinvestment of distributions. |
| (f) | Aggregate total return. |
| (g) | Includes the Fund’s share of the Master Portfolio’s allocated expenses and/or net investment income. |
| (h) | Includes the Fund’s share of its corresponding Master Portfolio’s allocated fees waived and expenses and/or net investment income. Excludes expenses incurred indirectly as a result of the Master Portfolio’s investments in underlying funds as follows: |
| | | | | | | | | | | | | | | | | | | | | | | | |
| | | 2018 | | | | | | 2017 | | | | | | Period from
03/28/16(a) to
12/31/16 | | | | |
Allocated fees waived | | | 0.02 | % | | | | | | | 0.02 | % | | | | | | | 0.01 | % | | | | |
Investments in underlying funds | | | 0.02 | % | | | | | | | 0.02 | % | | | | | | | — | | | | | |
| | | | | | | | | | | | | | | | | | | | | | | | |
| (i) | Includes reorganization and board realignment and consolidation costs. Without these costs, total expenses and total expenses after fees waived and/or reimbursed would have been 0.29% and 0.26%, respectively. |
| (k) | Includes mortgage dollar roll transactions (“MDRs”). Additional information regarding portfolio turnover rate is as follows: |
| | | | | | | | | | | | | | | | | | | | | | | | |
| | | 2018 | | | | | | 2017 | | | | | | Period from
03/28/16(a) to
12/31/16 | | | | |
Portfolio turnover rate (excluding MDRs) | | | 189 | % | | | | | | | 322 | % | | | | | | | 459 | % | | | | |
| | | | | | | | | | | | | | | | | | | | | | | | |
See notes to financial statements.
Notes to Financial Statements
BlackRock Funds VI (the “Trust”) is registered under the Investment Company Act of 1940, as amended (the “1940 Act”), as anopen-end management investment company. The Trust is organized as a Delaware statutory trust. BlackRock CoreAlpha Bond Fund (the “Fund”) is a series of the Trust. The Fund is classified as diversified. The Fund seeks to achieve its investment objective by investing all of its assets in CoreAlpha Bond Master Portfolio (the “Master Portfolio”), a series of Master Investment Portfolio II (“MIP II”), an affiliate of the Fund, which has the same investment objective and strategies as the Fund. The value of the Fund’s investment in the Master Portfolio reflects the Fund’s proportionate interest in the net assets of the Master Portfolio. The performance of the Fund is directly affected by the performance of the Master Portfolio. At December 31, 2018, the percentage of the Master Portfolio owned by the Fund was 82.51%. The financial statements of the Master Portfolio, including the Schedule of Investments, are included elsewhere in this report and should be read in conjunction with the Fund’s financial statements.
The Fund offers multiple classes of shares. All classes of shares have identical voting, dividend, liquidation and other rights and are subject to the same terms and conditions, except that Investor A and Investor C Shares bear expenses related to the shareholder servicing of such shares, and Investor C Shares also bear certain expenses related to the distribution of such shares. Institutional and Class K Shares are sold without a sales charge and only to certain eligible investors. Investor A and Investor C Shares are generally available through financial intermediaries. Effective November 8, 2018, the Fund adopted an automatic conversion feature whereby Investor C Shares held for approximately ten years will be automatically converted into Investor A Shares, and, thereafter, investors will be subject to lower ongoing fees. Each class has exclusive voting rights with respect to matters relating to its shareholder servicing and distribution expenditures (except that Investor C shareholders may vote on material changes to the Investor A distribution and service plan). The Board of Trustees of the Trust and Board of Trustees of MIP II are referred to throughout this report as the “Board of Trustees” or the “Board” and the members are referred to as “Trustees.”
| | | | | | | | | | |
| Share Class | | Initial Sales Charge | | CDSC | | | Conversion Privilege | |
Institutional Shares | | No | | | No | | | | None | |
Investor A Shares | | Yes | | | No | (a) | | | None | |
Investor C Shares | | No | | | Yes | | | | To Investor A Shares after approximately 10 years | (b) |
Investor K | | No | | | No | | | | None | |
| | (a) | Investor A Shares may be subject to a contingent deferred sales charge (“CDSC”) for certain redemptions where no initial sales charge was paid at the time of purchase. | |
| | (b) | Effective November 8, 2018, these shares implemented an automatic conversion feature whereby such shares will be automatically converted into Investor A Shares after a conversion period of approximately ten years, and, thereafter, investors will be subject to lower ongoing fees. | |
The Fund, together with certain other registered investment companies advised by BlackRock Advisors, LLC (“BAL” or the “Administrator”) or its affiliates, is included in a complex ofopen-end funds referred to as the Equity-Liquidity Complex.
Reorganizations: The Board approved an Agreement and Plan of Reorganization with respect to the following Predecessor Fund, pursuant to which the Predecessor Fund reorganized into a newly created series (the “Acquiring Fund”) of BlackRock Funds VI, a newly organized Delaware statutory trust. This reorganization (the “Board Reorganization”) closed on September 17, 2018 and was not subject to approval by shareholders of the Predecessor Fund.
| | | | | | |
| Predecessor Fund | | Predecessor Fund’s Registrant | | Acquiring Fund | | Acquiring Fund’s Registrant |
BlackRock CoreAlpha Bond Fund | | BlackRock Funds III | | BlackRock CoreAlpha Bond Fund | | BlackRock Funds VI |
The Board Reorganization was effected in connection with a reconfiguration of the boards of directors/trustees of certain BlackRock-advised funds.
The Acquiring Fund has the same investment objective, strategies and policies, investment adviser, sub-advisers, portfolio management team and service providers as the Predecessor Fund. The Predecessor Fund is the performance and accounting survivor of the Board Reorganization, meaning that the Acquiring Fund assumed the performance and financial history of the Predecessor Fund upon completion of the Board Reorganization. In addition, the Acquiring Fund is subject to the same contractual arrangements, including the same contractual fees and expenses, as those of the Predecessor Fund as of the date of the Board Reorganization. The Board Reorganization was tax-free, meaning that the Predecessor Fund’s shareholders became shareholders of the Acquiring Fund without realizing any gain or loss for federal income tax purposes.
As a result, the Acquiring Fund acquired all of the assets and assumed all of the liabilities of the Predecessor Fund in exchange for an equal aggregate value of newly-issued shares of the Acquiring Fund. Each shareholder of the Predecessor Fund received shares of the Acquiring Fund in an amount equal to the aggregate net asset value (“NAV”) of such shareholder’s Predecessor Fund shares, as determined at the close of business on September 14, 2018.
The Board Reorganization was accomplished by a tax-free exchange of shares of the Acquiring Fund in the following amounts and at the following conversion ratio:
| | | | | | | | | | | | |
| Predecessor Fund | | Shares Prior to
Reorganization | | | Conversion
Ratio | | | Shares
Post-Reorganization | |
BlackRock CoreAlpha Bond Fund | | | 114,172,202 | | | | 1 | | | | 114,172,202 | |
For financial reporting purposes, assets received and shares issued by the Acquiring Fund were recorded at fair value. However, the cost basis of the investments received from the Predecessor Fund was carried forward to align ongoing reporting of the Acquiring Fund’s realized and unrealized gains and losses with amounts distributable to shareholders for tax purposes.
Prior to the Board Reorganization, the Acquiring Fund had not yet commenced operations and had no assets or liabilities. The Predecessor Fund’s net asset value and fair value of investments prior to the Board Reorganization were as follows:
| | | | | | | | |
| Predecessor Fund | | Net Assets | | | Fair Value
of Investments | |
BlackRock CoreAlpha Bond Fund | | $ | 573,163,749 | | | $ | 574,104,618 | |
| | |
| 14 | | 2018 BLACKROCK ANNUAL REPORTTO SHAREHOLDERS |
Notes to Financial Statements (continued)
On September 17, 2018, all of the portfolio securities previously held by CoreAlpha Bond Master Portfolio, a series of Master Investment Portfolio, the Predecessor Master Portfolio, were transferred to the Master Portfolio, and the Master Portfolio interests held by the Predecessor Fund were subsequently transferred to the Acquiring Fund in exchange for shares of the Acquiring Fund.
The Board of the Trust and the Board of Trustees of State Farm Mutual Fund Trust and the shareholders of State Farm Bond Fund (the “State Farm Fund”), a series of State Farm Mutual Fund Trust, approved an agreement and plan of reorganization (the “State Farm Reorganization”) of the State Farm Fund into the Fund. As a result, the Fund acquired all of the assets and assumed certain stated liabilities of the State Farm Fund in exchange for an equal aggregate value of newly-issued shares of the Fund.
On November 19, 2018, all of the portfolio securities previously held by the State Farm Fund were subsequently contributed by the Fund to the Master Portfolio in exchange for an investment in the Master Portfolio.
Each shareholder of the State Farm Fund received shares of the Fund in an amount equal to the aggregate NAV of the shareholder’s State Farm Fund shares, as determined at the close of business on November 16, 2018.
On November 19, 2018, all of the portfolio securities previously held by the State Farm Fund were subsequently contributed by the Fund to the Master Portfolio in exchange for an investment in the Master Portfolio.
The reorganization was accomplished by atax-free exchange of shares of the Fund in the following amounts and at the following conversion ratios:
| | | | | | | | |
| State Farm Fund’s Share Class | | Shares Prior to Reorganization | | Conversion Ratio | | Fund’s Share Class | | Shares of the Fund |
Premier | | 25,537,367.6520 | | 1.08421723 | | Investor A | | 27,688,054 |
Legacy Class B | | 98,760.3240 | | 1.08476271 | | Investor A | | 107,132 |
Class A | | 13,708,571.0790 | | 1.08346971 | | Investor A | | 14,852,822 |
Class B | | 237,859.5660 | | 1.08218680 | | Investor A | | 257,408 |
Institutional | | 5,178,385.6840 | | 1.08354126 | | Institutional | | 5,610,994 |
Class R-1 | | 192,231.8120 | | 1.08320706 | | Investor A | | 208,227 |
Class R-2 | | 740,366.4990 | | 1.08229792 | | Investor A | | 801,297 |
Class R-3 | | 64,355.2510 | | 1.08375340 | | Institutional | | 69,745 |
The State Farm Fund’s net assets and composition of net assets on November 16, 2018, the valuation date of the reorganization, were as follows:
| | | | |
| | | State Farm Fund | |
Net assets | | $ | 490,968,191 | |
Paid-in-capital | | | 512,783,899 | |
Accumulated losses | | | (21,815,708 | ) |
For financial reporting purposes, assets received and shares issued by the Fund were recorded at fair value. However, the cost basis of the investments received from the State Farm Fund was carried forward by the Master Portfolio to align ongoing reporting of the Fund’s realized and unrealized gains and losses with amounts distributable to shareholders for tax purposes.
The net assets of the Fund before the acquisition were $741,214,553. The aggregate net assets of the Fund immediately after the acquisition amounted to $1,232,182,744. The State Farm Fund’s fair value and cost of investments prior to the reorganization were as follows:
| | | | | | | | |
| State Farm Fund | | Fair Value
of Investments | | | Cost of
Investments | |
State Farm Bond Fund | | $ | 474,337,429 | | | $ | 495,163,771 | |
The purpose of the transaction was to combine the assets of the State Farm Fund with the assets of the Fund. The reorganization was a tax-free event and closed on November 19, 2018. Assuming the acquisition had been completed on January 1, 2018, the beginning of the fiscal reporting period of the Fund, the pro forma results of operations for the year ended December 31, 2018, are as follows:
| | • | | Net investment income (loss): $37,980,626 |
| | • | | Net realized and change in unrealized gain (loss) on investments: $(48,129,426) |
| | • | | Net increase (decrease) in net assets resulting from operations: $(10,148,800) |
Because the combined investment portfolios have been managed as a single integrated portfolio since the acquisition was completed, it is not practicable to separate the amounts of revenue and earnings of the Fund that have been included in the Fund’s Statement of Operations since November 19, 2018.
Reorganization costs incurred by the Fund in connection with the reorganization were expensed by the Fund. The BlackRock Fund Advisors (the “Manager”) reimbursed the Fund $149,895, which is included in fees waived and/or reimbursed by the Administrator/Manager in the Statement of Operations.
| | | | |
| NOTESTO FINANCIAL STATEMENTS | | | 15 | |
Notes to Financial Statements (continued)
| 2. | SIGNIFICANT ACCOUNTING POLICIES |
The financial statements are prepared in conformity with accounting principles generally accepted in the United States of America (“U.S. GAAP”), which may require management to make estimates and assumptions that affect the reported amounts of assets and liabilities in the financial statements, disclosure of contingent assets and liabilities at the date of the financial statements and the reported amounts of increases and decreases in net assets from operations during the reporting period. Actual results could differ from those estimates. The Fund is considered an investment company under U.S. GAAP and follows the accounting and reporting guidance applicable to investment companies. Below is a summary of significant accounting policies:
Investment Transactions and Income Recognition:For financial reporting purposes, contributions to and withdrawals from the Master Portfolio are accounted for on a trade date basis. The Fund records its proportionate share of the Master Portfolio’s income, expenses and realized and unrealized gains and losses on a daily basis. Realized and unrealized gains and losses are adjusted utilizing partnership tax allocation rules. In addition, the Fund accrues its own expenses. Income, expenses and realized and unrealized gains and losses are allocated daily to each class based on its relative net assets.
Distributions: Distributions from net investment income are declared daily and paid monthly. Distributions of capital gains are recorded on theex-dividend date and made at least annually. The portion of distributions, if any, that exceeds a fund’s current and accumulated earnings and profits, as measured on a tax basis, constitute anon-taxable return of capital. The character and timing of distributions are determined in accordance with U.S. federal income tax regulations, which may differ from U.S. GAAP.
Indemnifications:In the normal course of business, the Fund enters into contracts that contain a variety of representations that provide general indemnification. The Fund’s maximum exposure under these arrangements is unknown because it involves future potential claims against the Fund, which cannot be predicted with any certainty.
Other: Expenses directly related to the Fund or its classes are charged to the Fund or the applicable class. Other operating expenses shared by several funds, including other funds managed by the Administrator, are prorated among those funds on the basis of relative net assets or other appropriate methods. Expenses directly related to the Fund and other shared expenses prorated to the Fund are allocated daily to each class based on its relative net assets or other appropriate methods.
| 3. | INVESTMENT VALUATION AND FAIR VALUE MEASUREMENTS |
Investment Valuation Policies: The Fund’s policy is to value its financial instruments at fair value. The Fund records its investment in the Master Portfolio at fair value based on the Fund’s proportionate interest in the net assets of the Master Portfolio. Valuation of securities held by the Master Portfolio is discussed in Note 3 of the Master Portfolio’s Notes to Financial Statements, which are included elsewhere in this report.
| 4. | ADMINISTRATION AGREEMENT AND OTHER TRANSACTIONS WITH AFFILIATES |
Administration:The Trust, on behalf of the Fund, entered into an Administration Agreement with BAL, which has agreed to provide general administrative services (other than investment advice and related portfolio activities). BAL has agreed to bear all of the Fund’s ordinary operating expenses, excluding, generally, investment advisory fees, distribution fees, brokerage and other expenses related to the execution of portfolio transactions, extraordinary expenses and certain other expenses which are borne by the Fund. BAL is entitled to receive for these administrative services an annual fee based on the average daily net assets of the Fund as follows:
| | | | | | | | | | | | | | | | | | | | |
| Institutional | | | | | Investor A | | | | | Investor C | | | | | Class K | |
| | 0.05% | | | | | | 0.05% | | | | | | 0.05% | | | | | | 0.05% | |
Prior to November 19, 2018 the rates were as follows:
| | | | | | | | | | | | | | | | | | | | |
| Institutional | | | | | Investor A | | | | | Investor C | | | | | Class K | |
| | 0.10% | | | | | | 0.20% | | | | | | 0.20% | | | | | | 0.05% | |
For the year ended December 31, 2018, the following table shows the class specific administration fees borne directly by each share class of the Fund:
| | | | | | | | | | | | | | | | | | | | | | | | | | |
| Institutional | | | | | Investor A | | | | | Investor C | | | | | Class K | | | | | Total | |
| $ | 562,665 | | | | | $ | 26,583 | | | | | $ | 336 | | | | | $ | 176 | | | | | $ | 589,760 | |
From time to time, BAL may waive such fees in whole or in part. Any such waiver will reduce the expenses of the Fund and, accordingly, have a favorable impact on its performance. BAL may delegate certain of its administration duties tosub-administrators.
Service and Distribution Fees:The Trust, on behalf of the Fund, entered into a Distribution Agreement and a Distribution and Service Plan with BlackRock Investments, LLC (“BRIL”), an affiliate of BAL. Pursuant to the Distribution and Service Plan and in accordance with Rule12b-1 under the 1940 Act, the Fund pays BRIL ongoing service and distribution fees. The fees are accrued daily and paid monthly at annual rates based upon the average daily net assets of the relevant share class of the Fund as follows:
| | | | | | | | |
| | | Distribution
Fees | | | Service
Fees | |
Investor A | | | — | % | | | 0.25 | % |
Investor C | | | 0.75 | | | | 0.25 | |
| | |
| 16 | | 2018 BLACKROCK ANNUAL REPORTTO SHAREHOLDERS |
Notes to Financial Statements (continued)
BRIL and broker-dealers, pursuant tosub-agreements with BRIL, provide shareholder servicing and distribution services to the Fund. The ongoing service and/or distribution fee compensates BRIL and each broker-dealer for providing shareholder servicing and/or distribution related services to shareholders.
For the year ended December 31, 2018, the following table shows the class specific service and distribution fees borne directly by each share class of the Fund:
| | | | | | | | | | | | | | |
| Investor A | | | | | Investor C | | | | | Total | |
| $ | 129,104 | | | | | $ | 1,826 | | | | | $ | 130,930 | |
Other Fees:For the year ended December 31, 2018, affiliates earned underwriting discounts, direct commissions and dealer concessions on sales of the Fund’s Investor A Shares, which totaled $143.
Expense Waivers and Reimbursements:The fees and expenses of the Trust’s trustees who are not “interested persons” of the Trust, as defined in the 1940 Act (“Independent Trustees”), counsel to the Independent Trustees and the Trust’s independent registered public accounting firm (together, the “independent expenses”) are paid directly by the Fund. BAL has contractually agreed to reimburse the Fund or provide an offsetting credit against the administration fees paid by the Fund in an amount equal to these independent expenses through April 30, 2021. For the year ended December 31, 2018, the amount waived was $10,015 which is included in fees waived and/or reimbursed by the Administrator/Manager in the Statement of Operations.
Effective November 19, 2018, BAL has contractually agreed to waive 0.05% of the administration fee payable to BAL applicable to Class K Shares of the Fund through April 30, 2021. For the year ended December 31, 2018, the amount waived was $22 which is included in fees waived and/or reimbursed by the Administrator/Manager in the Statement of Operations.
The Fund has begun to incur expenses in connection with a realignment and consolidation of the boards of trustees of certain BlackRock-advised funds. The Manager has voluntarily agreed to reimburse the Fund for all or a portion of such expenses, which amounts are included in fees waived and/or reimbursed by the Administrator/Manager in the Statement of Operations. For the year ended December 31, 2018, the amount reimbursed was $1,153.
Interfund Lending: In accordance with an exemptive order (the “Order”) from the U.S. Securities and Exchange Commission (“SEC”), the Fund may participate in a joint lending and borrowing facility for temporary purposes (the “Interfund Lending Program”), subject to compliance with the terms and conditions of the Order, and to the extent permitted by the Fund’s investment policies and restrictions. The Fund is currently permitted to borrow and lend under the Interfund Lending Program.
A lending BlackRock fund may lend in aggregate up to 15% of its net assets, but may not lend more than 5% of its net assets to any one borrowing fund through the Interfund Lending Program. A borrowing BlackRock fund may not borrow through the Interfund Lending Program or from any other source more than 33 1/3% of its total assets (or any lower threshold provided for by the fund’s investment restrictions). If a borrowing BlackRock fund’s total outstanding borrowings exceed 10% of its total assets, each of its outstanding interfund loans will be subject to collateralization of at least 102% of the outstanding principal value of the loan. All interfund loans are for temporary or emergency purposes and the interest rate to be charged will be the average of the highest current overnight repurchase agreement rate available to a lending fund and the bank loan rate, as calculated according to a formula established by the Board.
During the year ended December 31, 2018, the Fund did not participate in the Interfund Lending Program.
Trustees and Officers:Certain Trustees and/or officers of the Trust are trustees and/or officers of BlackRock or its affiliates.
It is the Fund’s policy to comply with the requirements of the Internal Revenue Code of 1986, as amended, applicable to regulated investment companies, and to distribute substantially all of its taxable income to its shareholders. Therefore, no U.S. federal income tax provision is required.
The Fund files U.S. federal and various state and local tax returns. No income tax returns are currently under examination. The statute of limitations on the Fund’s U.S. federal tax returns generally remains open for each of the four years ended December 31, 2018. The statutes of limitations on the Fund’s state and local tax returns may remain open for an additional year depending upon the jurisdiction.
Management has analyzed tax laws and regulations and their application to the Fund as of December 31, 2018, inclusive of the open tax return years, and does not believe that there are any uncertain tax positions that require recognition of a tax liability in the Fund’s financial statements.
U.S. GAAP requires that certain components of net assets be adjusted to reflect permanent differences between financial and tax reporting. These reclassifications have no effect on net assets or net asset values per share. As of period end, the following permanent differences attributable tonon-deductible expenses were reclassified to the following accounts:
| | | | |
Paid-in capital | | $ | (126,713 | ) |
Accumulated Loss | | $ | 126,713 | |
The tax character of distributions paid was as follows:
| | | | | | | | |
| | | 12/31/18 | | | 12/31/17 | |
Ordinary income | | $ | 20,691,089 | | | $ | 9,264,187 | |
Long-term capital gains | | | — | | | | — | |
Return of capital | | | — | | | | 1,548,568 | |
| | | | | | | | |
| | $ | 20,691,089 | | | $ | 10,812,755 | |
| | | | | | | | |
As of period end, the tax components of accumulated losses were as follows:
| | | | |
Undistributed ordinary income | | $ | 710,075 | |
Capital loss carryforwards | | | (11,421,188 | ) |
Net unrealized gains (losses)(a) | | | (22,466,126 | ) |
| | | | |
| | $ | (33,177,239 | ) |
| | | | |
| | (a) | The difference between book-basis andtax-basis net unrealized gains (losses) was attributable primarily to the timing and recognition of partnership income. | |
| | | | |
| NOTESTO FINANCIAL STATEMENTS | | | 17 | |
Notes to Financial Statements (continued)
As of December 31, 2018, the Fund had a capital loss carryforward of $11,421,188, with no expiration date, available to offset future realized capital gains. The capital loss carryforward is subject to limitations.
| 6. | CAPITAL SHARE TRANSACTIONS |
Transactions in capital shares for each class were as follows:
| | | | | | | | | | | | | | | | |
| | | Year Ended
12/31/18 | | | Year Ended
12/31/17 | |
| | | Shares | | | Amount | | | Shares | | | Amount | |
Institutional | | | | | | | | | | | | | | | | |
Shares sold | | | 42,043,295 | | | $ | 422,102,732 | | | | 21,098,758 | | | $ | 218,383,843 | |
Shares issued in reinvestment of distributions | | | 1,864,126 | | | | 18,707,975 | | | | 996,456 | | | | 10,298,835 | |
Shares issued in reorganization | | | 5,680,740 | | | | 56,235,352 | | | | — | | | | — | |
Shares redeemed | | | (18,599,615 | ) | | | (186,877,150 | ) | | | (7,877,535 | ) | | | (81,568,430 | ) |
| | | | | | | | | | | | | | | | |
Net increase | | | 30,988,546 | | | $ | 310,168,909 | | | | 14,217,679 | | | $ | 147,114,248 | |
| | | | | | | | | | | | | | | | |
| | | | |
Investor A | | | | | | | | | | | | | | | | |
Shares sold and automatic conversion of shares | | | 227,980 | | | $ | 2,273,577 | | | | 24,882 | | | $ | 257,800 | |
Shares issued in reinvestment of distributions | | | 172,572 | | | | 1,722,898 | | | | 2,990 | | | | 30,861 | |
Shares issued in reorganization | | | 43,914,939 | | | | 434,732,839 | | | | — | | | | — | |
Shares redeemed | | | (1,061,331 | ) | | | (10,563,280 | ) | | | (146,785 | ) | | | (1,522,541 | ) |
| | | | | | | | | | | | | | | | |
Net increase (decrease) | | | 43,254,160 | | | $ | 428,166,034 | | | | (118,913 | ) | | $ | (1,233,880 | ) |
| | | | | | | | | | | | | | | | |
| | | | |
Investor C | | | | | | | | | | | | | | | | |
Shares sold | | | — | | | $ | — | | | | — | | | $ | — | |
Shares issued in reinvestment of distributions | | | 315 | | | | 3,170 | | | | 422 | | | | 4,369 | |
Shares redeemed and automatic conversion of shares | | | (7,687 | ) | | | (77,868 | ) | | | (10,377 | ) | | | (106,624 | ) |
| | | | | | | | | | | | | | | | |
Net decrease | | | (7,372 | ) | | $ | (74,698 | ) | | | (9,955 | ) | | $ | (102,255 | ) |
| | | | | | | | | | | | | | | | |
| | | | |
Class K | | | | | | | | | | | | | | | | |
Shares sold | | | 21,966 | | | $ | 225,333 | | | | — | | | $ | — | |
Shares issued in reinvestment of distributions | | | 503 | | | | 5,055 | | | | — | | | | — | |
Shares redeemed | | | (3,860 | ) | | | (38,944 | ) | | | — | | | | — | |
| | | | | | | | | | | | | | | | |
Net increase | | | 18,609 | | | $ | 191,444 | | | | — | | | | — | |
| | | | | | | | | | | | | | | | |
Total Net Increase | | | 74,253,943 | | | $ | 738,451,689 | | | | 14,088,811 | | | $ | 145,778,113 | |
| | | | | | | | | | | | | | | | |
As of December 31, 2018, shares owned by BlackRock HoldCo 2, Inc., an affiliate of the Fund, were as follows:
| | | | |
Investor C | | | 1,924 | |
Class K | | | 19,029 | |
| 7. | REGULATIONS-X AMENDMENTS |
On August 17, 2018, the SEC adopted amendments to certain disclosure requirements in Securities Act ReleaseNo. 33-10532, Disclosure Update and Simplification. The Fund has adopted the amendments pertinent to RegulationS-X in this shareholder report. The amendments impacted certain disclosure presentation on the Statement of Assets and Liabilities, Statements of Changes in Net Assets and Notes to the Financial Statements.
Prior year distribution information and undistributed net investment income in the Statements of Changes in Net Assets has been modified to conform to the current year presentation in accordance with the RegulationS-X changes.
Distributions for the year ended December 31, 2017 were classified as follows:
| | | | | | | | |
| Share Class | | Net Investment Income | | | Return of Capital | |
Institutional | | $ | 9,228,774 | | | $ | 1,542,649 | |
Investor A | | | 26,480 | | | | 4,426 | |
Investor C | | | 4,049 | | | | 677 | |
Class K | | | 4,884 | | | | 816 | |
Undistributed net investment income as of December 31, 2017 was $787,235.
Management has evaluated the impact of all subsequent events on the Fund through the date the financial statements were issued and has determined that there were no subsequent events requiring adjustment or additional disclosure in the financial statements.
| | |
| 18 | | 2018 BLACKROCK ANNUAL REPORTTO SHAREHOLDERS |
| | |
| Report of Independent Registered Public Accounting Firm | | BlackRock CoreAlpha Bond Fund |
To the Board of Trustees of
BlackRock Funds VI and the Shareholders of BlackRock CoreAlpha Bond Fund
Opinion on the Financial Statements
We have audited the accompanying statement of assets and liabilities of BlackRock CoreAlpha Bond Fund (the “Fund”) as of December 31, 2018, the related statement of operations for the year ended December 31, 2018, the statement of changes in net assets for each of the two years in the period ended December 31, 2018, including the related notes, and the financial highlights for each of the periods indicated therein (collectively referred to as the “financial statements”). In our opinion, the financial statements present fairly, in all material respects, the financial position of the Fund as of December 31, 2018, the results of its operations for the year then ended, the changes in its net assets for each of the two years in the period ended December 31, 2018 and the financial highlights for each of the periods indicated therein in conformity with accounting principles generally accepted in the United States of America.
Basis for Opinion
These financial statements are the responsibility of the Fund’s management. Our responsibility is to express an opinion on the Fund’s financial statements based on our audits. We are a public accounting firm registered with the Public Company Accounting Oversight Board (United States) (“PCAOB”) and are required to be independent with respect to the Fund in accordance with the U.S. federal securities laws and the applicable rules and regulations of the Securities and Exchange Commission and the PCAOB.
We conducted our audits of these financial statements in accordance with the standards of the PCAOB. Those standards require that we plan and perform the audit to obtain reasonable assurance about whether the financial statements are free of material misstatement, whether due to error or fraud.
Our audits included performing procedures to assess the risks of material misstatement of the financial statements, whether due to error or fraud, and performing procedures that respond to those risks. Such procedures included examining, on a test basis, evidence regarding the amounts and disclosures in the financial statements. Our audits also included evaluating the accounting principles used and significant estimates made by management, as well as evaluating the overall presentation of the financial statements. Our procedures included confirmation of securities owned as of December 31, 2018 by correspondence with the administrator of the Master Portfolio. We believe that our audits provide a reasonable basis for our opinion.
/s/PricewaterhouseCoopers LLP
Philadelphia, Pennsylvania
February 27, 2019
We have served as the auditor of one or more BlackRock investment companies since 2000.
Important Tax Information (unaudited)
For the fiscal year ended December 31, 2018, the following information is provided with respect to the ordinary income distributions paid by the Fund:
| | |
Interest-Related Dividends and Qualified Short-Term Capital Gains for Non-U.S. Residents(a) | | 81.15% |
Federal Obligation Interest(b) | | 0.56% |
| | (a) | Represents the portion of the taxable ordinary income dividends eligible for exemption from U.S. withholding tax for nonresident aliens and foreign corporations. | |
| | (b) | The law varies in each state as to whether and what percentage of dividend income attributable to federal obligations is exempt from state income tax. We recommend that you consult your tax advisor to determine if any portion of the dividends you received is exempt from state income taxes. | |
| | | | |
| REPORTOF INDEPENDENT REGISTERED PUBLIC ACCOUNTING FIRM / IMPORTANT TAX INFORMATION | | | 19 | |
| | |
| Master Portfolio Information as of December 31, 2018 | | CoreAlpha Bond Master Portfolio |
PORTFOLIO COMPOSITION
| | | | |
Asset Type | | Percent of Total Investments (a) | |
U.S. Government Sponsored Agency Securities | | | 36 | % |
Corporate Bonds | | | 35 | |
Asset-Backed Securities | | | 13 | |
Short-Term Securities | | | 7 | |
Non-Agency Mortgage-Backed Securities | | | 4 | |
U.S. Treasury Obligations | | | 4 | |
Investment Companies | | | 2 | |
Foreign Agency Obligations | | | 0 | |
Municipal Bonds | | | 0 | |
TBA Sale Commitments | | | (1 | ) |
CREDIT QUALITY ALLOCATION (b)
| | | | |
Credit Rating | | Percent of
Total Investments (a) | |
AAA/Aaa | | | 46 | % |
AA/Aa | | | 8 | |
A | | | 17 | |
BBB/Baa | | | 21 | |
BB/Ba | | | 1 | |
Not Rated(c) | | | 7 | |
| | (a) | Excludes short-term securities. | |
| | (b) | For financial reporting purposes, credit quality ratings shown above reflect the highest rating assigned by either S&P Global Ratings (“S&P”) or Moody’s Investors Service, Inc. (“Moody’s”) if ratings differ. These rating agencies are independent, nationally recognized statistical rating organizations and are widely used. Investment grade ratings are credit ratings of BBB/Baa or higher. Below investment grade ratings are credit ratings of BB/Ba or lower. Investments designated N/R are not rated by either rating agency. Unrated investments do not necessarily indicate low credit quality. Credit quality ratings are subject to change. | |
| | (c) | The investment adviser evaluates the credit quality of not-rated investments based upon certain factors including, but not limited to, credit ratings for similar investments and financial analysis of sectors, individual investments and/or issuer. Using this approach, the investment adviser has deemed U.S. Government Sponsored Agency Securities and U.S. Treasury Obligations as AAA/Aaa. | |
| | |
| 20 | | 2018 BLACKROCK ANNUAL REPORTTO SHAREHOLDERS |
| | |
Schedule of Investments December 31, 2018 | | CoreAlpha Bond Master Portfolio (Percentages shown are based on Net Assets) |
| | | | | | | | |
| Security | | Par
(000) | | | Value | |
|
Asset-Backed Securities — 14.7% | |
AmeriCredit Automobile Receivables Trust: | | | | | | | | |
Series2014-4, Class D, 3.07%, 11/09/20 | | $ | 800 | | | $ | 799,758 | |
Series2016-1, Class D, 3.59%, 02/08/22 | | | 420 | | | | 421,982 | |
Series2017-3, Class C, 2.69%, 06/19/23 | | | 1,960 | | | | 1,936,464 | |
Avant Loans Funding Trust(a): | | | | | | | | |
Series2017-B, Class B, 3.38%, 04/15/21 | | | 4,298 | | | | 4,291,910 | |
Series2018-A, Class A, 3.09%, 06/15/21 | | | 1,856 | | | | 1,852,383 | |
Series2018-A, Class B, 3.95%, 12/15/22 | | | 3,000 | | | | 3,001,696 | |
Series2018-B, Class A, 3.42%, 01/18/22 | | | 3,578 | | | | 3,572,578 | |
Chase Issuance Trust, Series2012-A7, Class A7, 2.16%, 09/15/24 | | | 1,190 | | | | 1,154,675 | |
Citibank Credit Card Issuance Trust, Series2014-A6, Class A6, 2.15%, 07/15/21 | | | 2,940 | | | | 2,927,894 | |
CLUB Credit Trust(a): | | | | | | | | |
Series2017-P1, Class B, 3.56%, 09/15/23 | | | 6,000 | | | | 5,981,630 | |
Series2017-P2, Class A, 2.61%, 01/15/24 | | | 1,271 | | | | 1,263,270 | |
Series2018-NP1, Class A, 2.99%, 05/15/24 | | | 375 | | | | 374,747 | |
Series2018-P3, Class A, 3.82%, 01/15/26 | | | 7,670 | | | | 7,664,910 | |
College Loan Corp. Trust I, Series2004-1, Class A4, (3 mo. LIBOR US + 0.19%), 2.68%, 04/25/24(b) | | | 751 | | | | 751,158 | |
Consumer Loan Underlying Bond Credit Trust(a): | | | | | | | | |
Series2017-NP2, Class A, 2.55%, 01/16/24 | | | 39 | | | | 38,836 | |
Series2017-NP2, Class B, 3.50%, 01/16/24 | | | 868 | | | | 866,924 | |
Series2018-P1, Class A, 3.39%, 07/15/25 | | | 3,133 | | | | 3,126,282 | |
Series2018-P2, Class A, 3.47%, 10/15/25 | | | 1,514 | | | | 1,508,621 | |
Credit Suisse Mortgage Capital Certificates,Series 2006-CF3, Class A1, (1 mo. LIBOR US + 0.54%), 3.05%, 10/25/36(a)(b) | | | 26 | | | | 25,949 | |
Discover Card Execution Note Trust, Series2015-A2, Class A, 1.90%, 10/17/22 | | | 1,160 | | | | 1,144,012 | |
Drive Auto Receivables Trust: | | | | | | | | |
Series2015-DA, Class C, 3.38%, 11/15/21(a) | | | 132 | | | | 132,155 | |
Series2016-AA, Class C, 3.91%, 05/17/21(a) | | | 166 | | | | 166,538 | |
Series2016-BA, Class C, 3.19%, 07/15/22(a) | | | 826 | | | | 826,232 | |
Series2016-BA, Class D, 4.53%, 08/15/23(a) | | | 1,900 | | | | 1,912,261 | |
Series2016-CA, Class D, 4.18%, 03/15/24(a) | | | 1,100 | | | | 1,105,590 | |
Series2017-1, Class B, 2.36%, 03/15/21 | | | 360 | | | | 360,136 | |
Series2017-1, Class D, 3.84%, 03/15/23 | | | 4,011 | | | | 4,025,379 | |
Series2017-2, Class B, 2.25%, 06/15/21 | | | 196 | | | | 195,601 | |
Series2017-2, Class D, 3.49%, 09/15/23(a) | | | 1,435 | | | | 1,439,733 | |
Series2017-3, Class B, 2.30%, 05/17/21 | | | 1,144 | | | | 1,142,871 | |
Series2017-3, Class C, 2.80%, 07/15/22 | | | 1,940 | | | | 1,935,052 | |
Series2017-3, Class D, 3.53%, 12/15/23(a) | | | 4,950 | | | | 4,953,960 | |
Series2017-AA, Class D, 4.16%, 05/15/24(a) | | | 1,500 | | | | 1,516,898 | |
Series2017-BA, Class D, 3.72%, 10/17/22(a) | | | 4,000 | | | | 4,007,590 | |
Series2018-1, Class C, 3.22%, 03/15/23 | | | 4,570 | | | | 4,560,735 | |
Series2018-1, Class D, 3.81%, 05/15/24 | | | 1,150 | | | | 1,151,863 | |
Series2018-2, Class B, 3.22%, 04/15/22 | | | 4,000 | | | | 3,995,810 | |
Series2018-2, Class C, 3.63%, 08/15/24 | | | 4,125 | | | | 4,142,292 | |
Series2018-2, Class D, 4.14%, 08/15/24 | | | 910 | | | | 917,344 | |
Series2018-3, Class B, 3.37%, 09/15/22 | | | 2,130 | | | | 2,131,103 | |
Series2018-3, Class C, 3.72%, 09/16/24 | | | 2,430 | | | | 2,435,763 | |
Series2018-3, Class D, 4.30%, 09/16/24 | | | 1,840 | | | | 1,864,830 | |
Series2018-4, Class C, 3.66%, 11/15/24 | | | 3,000 | | | | 3,012,002 | |
Series2018-5, Class C, 3.99%, 01/15/25 | | | 2,990 | | | | 3,016,862 | |
DT Auto Owner Trust(a): | | | | | | | | |
Series2015-3A, Class D, 4.53%, 10/17/22 | | | 783 | | | | 786,888 | |
Series2017-4A, Class C, 2.86%, 07/17/23 | | | 900 | | | | 897,427 | |
Enva LLC, Series2018-A, Class A, 4.20%, 05/20/26(a) | | | 4,350 | | | | 4,350,770 | |
Exeter Automobile Receivables Trust(a): | | | | | | | | |
Series2015-1A, Class C, 4.10%, 12/15/20 | | | 5,085 | | | | 5,094,503 | |
Series2017-2A, Class A, 2.11%, 06/15/21 | | | 210 | | | | 209,511 | |
Series2018-4A, Class B, 3.64%, 11/15/22 | | | 4,630 | | | | 4,628,895 | |
| | | | | | | | |
| Security | | Par
(000) | | | Value | |
|
| Asset-Backed Securities (continued) | |
Flagship Credit Auto Trust(a): | | | | | | | | |
Series2016-3, Class C, 2.72%, 07/15/22 | | $ | 7,500 | | | $ | 7,432,442 | |
Series2016-4, Class B, 2.41%, 10/15/21 | | | 2,400 | | | | 2,384,220 | |
KeyCorp Student Loan Trust, Series2006-A, Class 2A4, (3 mo. LIBOR US + 0.31%), 3.13%, 09/27/35(b) | | | 83 | | | | 83,400 | |
Marlette Funding Trust, Class A(a): | | | | | | | | |
Series2017-3A, 2.36%, 12/15/24 | | | 916 | | | | 913,420 | |
Series2018-3A, 3.20%, 09/15/28 | | | 2,478 | | | | 2,474,486 | |
Series2018-4A, 3.71%, 12/15/28 | | | 3,169 | | | | 3,176,481 | |
National Collegiate Student Loan Trust(b): | | | | | | | | |
Series2006-2, Class A3, (1 mo. LIBOR US + 0.21%), 2.72%, 11/25/27 | | | 54 | | | | 54,302 | |
Series2006-3, Class A4, (1 mo. LIBOR US + 0.27%), 2.78%, 03/26/29 | | | 1,209 | | | | 1,196,885 | |
Series2007-1, Class A3, (1 mo. LIBOR US + 0.24%), 2.75%, 07/25/30 | | | 1,775 | | | | 1,748,410 | |
OneMain Financial Issuance Trust, Series2016-2A, Class A, 4.10%, 03/20/28(a) | | | 721 | | | | 723,144 | |
Prestige Auto Receivables Trust, Series2016-1A, Class D, 5.15%, 11/15/21(a) | | | 3,339 | | | | 3,401,059 | |
Prosper Marketplace Issuance Trust, Class A(a): | | | | | | | | |
Series2018-1A, 3.11%, 06/17/24 | | | 1,209 | | | | 1,207,106 | |
Series2018-2A, 3.35%, 10/15/24 | | | 2,220 | | | | 2,215,879 | |
Santander Drive Auto Receivables Trust: | | | | | | | | |
Series2015-1, Class C, 2.57%, 04/15/21 | | | 35 | | | | 34,629 | |
Series2015-1, Class D, 3.24%, 04/15/21 | | | 1,000 | | | | 1,000,204 | |
Series2015-2, Class C, 2.44%, 04/15/21 | | | 127 | | | | 127,175 | |
Series2015-3, Class C, 2.74%, 01/15/21 | | | 370 | | | | 370,100 | |
Series2015-4, Class C, 2.97%, 03/15/21 | | | 261 | | | | 261,238 | |
Series2016-1, Class C, 3.09%, 04/15/22 | | | 2,695 | | | | 2,694,508 | |
Series2016-3, Class C, 2.46%, 03/15/22 | | | 2,100 | | | | 2,085,906 | |
Series2016-3, Class D, 2.80%, 08/15/22 | | | 3,000 | | | | 2,983,541 | |
Series2017-1, Class B, 2.10%, 06/15/21 | | | 1,884 | | | | 1,879,193 | |
Series2017-2, Class B, 2.21%, 10/15/21 | | | 3,080 | | | | 3,071,525 | |
Series2017-2, Class C, 2.79%, 08/15/22 | | | 2,190 | | | | 2,179,582 | |
Series2017-2, Class D, 3.49%, 07/17/23 | | | 6,040 | | | | 6,008,232 | |
Series2017-3, Class D, 3.20%, 11/15/23 | | | 8,000 | | | | 7,965,395 | |
Series2018-5, Class D, 4.19%, 12/16/24 | | | 3,840 | | | | 3,883,474 | |
SLM Private Education Loan Trust(a): | | | | | | | | |
Series2010-A, Class 1A, (Prime - 0.05%), 5.20%, 05/16/44(b) | | | 194 | | | | 195,680 | |
Series2011-B, Class A2, 3.74%, 02/15/29 | | | 459 | | | | 458,989 | |
SoFi Consumer Loan Program LLC(a): | | | | | | | | |
Series2016-1, Class A, 3.26%, 08/25/25 | | | 481 | | | | 479,677 | |
Series2016-2A, Class A, 3.09%, 10/27/25 | | | 555 | | | | 554,218 | |
Series2016-3, Class A, 3.05%, 12/26/25 | | | 640 | | | | 638,252 | |
Series2017-1, Class A, 3.28%, 01/26/26 | | | 4,121 | | | | 4,118,951 | |
Series2017-3, Class A, 2.77%, 05/25/26 | | | 1,002 | | | | 992,806 | |
Series2017-6, Class A1, 2.20%, 11/25/26 | | | 303 | | | | 301,116 | |
Series2017-6, Class A2, 2.82%, 11/25/26 | | | 1,050 | | | | 1,041,342 | |
SoFi Consumer Loan Program Trust(a): | | | | | | | | |
Series2015-1, Class A, 3.28%, 09/15/23 | | | 328 | | | | 327,669 | |
Series2018-1, Class A1, 2.55%, 02/25/27 | | | 1,114 | | | | 1,107,891 | |
Series2018-1, Class A2, 3.14%, 02/25/27 | | | 2,380 | | | | 2,373,427 | |
Series2018-3, Class A1, 3.20%, 08/25/27 | | | 1,398 | | | | 1,395,021 | |
SoFi Professional Loan Program LLC, Series2015-B, Class A2, 2.51%, 09/27/32(a) | | | 84 | | | | 83,047 | |
Springleaf Funding Trust, Series2016-AA, Class A, 2.90%, 11/15/29(a) | | | 7,325 | | | | 7,282,839 | |
Trafigura Securitisation Finance PLC, Series2017-1A, Class A1, (1 mo. LIBOR US + 0.85%), 3.31%, 12/15/20(a)(b) | | | 1,940 | | | | 1,949,902 | |
Upgrade Receivables Trust, Series2018-1A, Class A, 3.76%, 11/15/24(a) | | | 2,577 | | | | 2,575,210 | |
| | | | |
| SCHEDULE OF INVESTMENTS | | | 21 | |
| | |
Schedule of Investments (continued) December 31, 2018 | | CoreAlpha Bond Master Portfolio (Percentages shown are based on Net Assets) |
| | | | | | | | |
| Security | | Par
(000) | | | Value | |
|
| Asset-Backed Securities (continued) | |
Westlake Automobile Receivables Trust(a): | | | | | | | | |
Series2017-1A, Class D, 3.46%, 10/17/22 | | $ | 7,500 | | | $ | 7,471,205 | |
Series2018-1A, Class D, 3.41%, 05/15/23 | | | 3,000 | | | | 2,978,630 | |
Series2018-2A, Class��B, 3.20%, 01/16/24 | | | 2,735 | | | | 2,727,593 | |
Series2018-3A, Class B, 3.32%, 10/16/23 | | | 3,510 | | | | 3,517,326 | |
Series2018-3A, Class C, 3.61%, 10/16/23 | | | 2,980 | | | | 2,981,661 | |
Series2018-3A, Class D, 4.00%, 10/16/23 | | | 1,140 | | | | 1,143,803 | |
| | | | | | | | |
| |
Total Asset-Backed Securities — 14.7%
(Cost — $217,952,514) | | | | 217,874,464 | |
| | | | | |
|
Corporate Bonds — 40.5% | |
|
Aerospace & Defense — 0.6% | |
Illinois Tool Works, Inc., 2.65%, 11/15/26 | | | 500 | | | | 464,611 | |
L3 Technologies, Inc., 4.95%, 02/15/21 | | | 1,618 | | | | 1,655,707 | |
Lockheed Martin Corp.: | | | | | | | | |
3.10%, 01/15/23 | | | 500 | | | | 495,577 | |
2.90%, 03/01/25 | | | 2,390 | | | | 2,293,911 | |
Raytheon Co.: | | | | | | | | |
3.13%, 10/15/20 | | | 1,190 | | | | 1,193,706 | |
3.15%, 12/15/24 | | | 800 | | | | 795,766 | |
Rockwell Collins, Inc., 2.80%, 03/15/22 | | | 275 | | | | 267,296 | |
Spirit AeroSystems, Inc., 3.95%, 06/15/23 | | | 1,060 | | | | 1,056,847 | |
| | | | | | | | |
| | | | | | | 8,223,421 | |
|
| Air Freight & Logistics — 0.0% | |
CH Robinson Worldwide, Inc., 4.20%, 04/15/28 | | | 500 | | | | 501,403 | |
| | | | | | | | |
|
| Airlines — 0.1% | |
Delta Air Lines, Inc., 3.40%, 04/19/21 | | | 1,000 | | | | 991,655 | |
| | | | | | | | |
|
| Auto Components — 0.3% | |
Icahn Enterprises LP/Icahn Enterprises Finance Corp.: | | | | | | | | |
6.00%, 08/01/20 | | | 525 | | | | 524,344 | |
6.38%, 12/15/25 | | | 200 | | | | 192,500 | |
Lear Corp.: | | | | | | | | |
5.38%, 03/15/24 | | | 2,115 | | | | 2,175,674 | |
5.25%, 01/15/25 | | | 755 | | | | 775,575 | |
ZF North America Capital, Inc., 4.50%, 04/29/22(a) | | | 191 | | | | 186,571 | |
| | | | | | | | |
| | | | | | | 3,854,664 | |
|
| Automobiles — 0.1% | |
Ford Motor Co., 4.35%, 12/08/26 | | | 1,700 | | | | 1,514,370 | |
General Motors Co., 5.00%, 10/01/28 | | | 1,000 | | | | 947,530 | |
| | | | | | | | |
| | | | | | | 2,461,900 | |
|
| Banks — 3.6% | |
Barclays Bank PLC, 2.65%, 01/11/21 | | | 1,560 | | | | 1,527,440 | |
Barclays PLC, 4.61%, 02/15/23(c) | | | 2,000 | | | | 1,983,122 | |
Capital One Financial Corp.: | | | | | | | | |
2.50%, 05/12/20 | | | 550 | | | | 542,883 | |
2.40%, 10/30/20 | | | 1,090 | | | | 1,067,130 | |
3.45%, 04/30/21 | | | 634 | | | | 633,702 | |
3.30%, 10/30/24 | | | 1,600 | | | | 1,513,195 | |
Capital One NA/Mclean VA, 2.65%, 08/08/22 | | | 1,300 | | | | 1,248,396 | |
Citibank NA: | | | | | | | | |
2.10%, 06/12/20 | | | 1,150 | | | | 1,130,964 | |
3.40%, 07/23/21 | | | 840 | | | | 841,067 | |
Citizens Bank Providence, 2.25%, 03/02/20 | | | 450 | | | | 445,183 | |
Compass Bank, 3.50%, 06/11/21 | | | 2,300 | | | | 2,293,589 | |
Cooperatieve Rabobank UA, 2.25%, 01/14/19 | | | 1,160 | | | | 1,159,625 | |
Discover Bank, 4.20%, 08/08/23 | | | 1,600 | | | | 1,600,368 | |
HSBC Bank USA NA, 5.88%, 11/01/34 | | | 590 | | | | 661,036 | |
HSBC Holdings PLC: | | | | | | | | |
3.40%, 03/08/21 | | | 1,525 | | | | 1,521,042 | |
3.60%, 05/25/23 | | | 1,900 | | | | 1,889,151 | |
| | | | | | | | |
| Security | | Par
(000) | | | Value | |
|
| Banks (continued) | |
HSBC Holdings PLC (continued) | | | | | | | | |
3.03%, 11/22/23(c) | | $ | 1,635 | | | $ | 1,582,538 | |
3.95%, 05/18/24(c) | | | 605 | | | | 601,733 | |
3.90%, 05/25/26 | | | 1,500 | | | | 1,437,307 | |
4.29%, 09/12/26(c) | | | 2,185 | | | | 2,152,175 | |
4.38%, 11/23/26 | | | 210 | | | | 203,305 | |
(3 mo. LIBOR US + 1.55%), 4.04%, 03/13/28(d) | | | 2,000 | | | | 1,913,506 | |
6.50%, 09/15/37 | | | 400 | | | | 453,346 | |
5.25%, 03/14/44 | | | 350 | | | | 346,914 | |
Huntington National Bank, 2.38%, 03/10/20 | | | 600 | | | | 594,189 | |
ING Groep NV: | | | | | | | | |
3.15%, 03/29/22 | | | 415 | | | | 408,044 | |
4.10%, 10/02/23 | | | 2,090 | | | | 2,088,730 | |
Lloyds Banking Group PLC: | | | | | | | | |
3.10%, 07/06/21 | | | 1,000 | | | | 980,631 | |
4.45%, 05/08/25 | | | 1,175 | | | | 1,166,733 | |
National Bank of Canada, 2.15%, 06/12/20 | | | 1,000 | | | | 985,492 | |
Regions Bank, 2.75%, 04/01/21 | | | 1,500 | | | | 1,475,268 | |
Santander UK PLC, 3.75%, 11/15/21 | | | 1,140 | | | | 1,137,324 | |
Sumitomo Mitsui Banking Corp., 1.97%, 01/11/19 | | | 920 | | | | 919,772 | |
SunTrust Bank, 2.59%, 01/29/21(c) | | | 975 | | | | 965,507 | |
Svenska Handelsbanken AB: | | | | | | | | |
2.45%, 03/30/21 | | | 800 | | | | 784,285 | |
3.90%, 11/20/23 | | | 2,700 | | | | 2,724,628 | |
Synchrony Bank, 3.65%, 05/24/21 | | | 1,040 | | | | 1,017,584 | |
Wells Fargo & Co.: | | | | | | | | |
2.15%, 01/15/19 | | | 800 | | | | 799,768 | |
3.30%, 09/09/24 | | | 1,590 | | | | 1,538,072 | |
3.00%, 02/19/25 | | | 800 | | | | 753,942 | |
3.00%, 10/23/26 | | | 2,654 | | | | 2,456,873 | |
Series N, 2.15%, 01/30/20 | | | 800 | | | | 791,300 | |
Wells Fargo Bank NA, 2.60%, 01/15/21 | | | 1,600 | | | | 1,580,127 | |
Westpac Banking Corp., 2.15%, 03/06/20 | | | 1,300 | | | | 1,286,061 | |
Zions Bancorp. NA, 3.50%, 08/27/21 | | | 640 | | | | 638,016 | |
| | | | | | | | |
| | | | | | | 53,841,063 | |
|
| Beverages — 1.0% | |
Anheuser-Busch Cos. LLC/Anheuser-Busch InBev Worldwide, Inc., 3.65%, 02/01/26(a) | | | 1,100 | | | | 1,040,103 | |
Anheuser-Busch InBev Finance, Inc., 3.30%, 02/01/23 | | | 3,300 | | | | 3,208,751 | |
Anheuser-Busch InBev Worldwide, Inc., 3.50%, 01/12/24 | | | 340 | | | | 332,569 | |
Constellation Brands, Inc., 4.40%, 11/15/25 | | | 600 | | | | 601,187 | |
Keurig Dr. Pepper, Inc.(a): | | | | | | | | |
4.60%, 05/25/28 | | | 550 | | | | 545,851 | |
3.55%, 05/25/21 | | | 2,905 | | | | 2,900,599 | |
4.42%, 05/25/25 | | | 3,100 | | | | 3,085,655 | |
Molson Coors Brewing Co., 2.25%, 03/15/20 | | | 405 | | | | 399,481 | |
PepsiCo, Inc.: | | | | | | | | |
2.25%, 01/07/19 | | | 1,590 | | | | 1,589,806 | |
2.85%, 02/24/26 | | | 800 | | | | 764,819 | |
3.00%, 10/15/27 | | | 1,190 | | | | 1,147,226 | |
| | | | | | | | |
| | | | | | | 15,616,047 | |
|
| Biotechnology — 0.6% | |
Amgen, Inc.: | | | | | | | | |
2.20%, 05/22/19 | | | 800 | | | | 796,912 | |
2.65%, 05/11/22 | | | 820 | | | | 801,586 | |
3.63%, 05/22/24 | | | 800 | | | | 797,570 | |
3.13%, 05/01/25 | | | 800 | | | | 765,438 | |
2.60%, 08/19/26 | | | 800 | | | | 726,960 | |
3.20%, 11/02/27 | | | 800 | | | | 749,676 | |
Baxalta, Inc., 2.88%, 06/23/20 | | | 231 | | | | 228,936 | |
Celgene Corp., 2.25%, 08/15/21 | | | 1,700 | | | | 1,648,094 | |
| | |
| 22 | | 2018 BLACKROCK ANNUAL REPORTTO SHAREHOLDERS |
| | |
Schedule of Investments (continued) December 31, 2018 | | CoreAlpha Bond Master Portfolio (Percentages shown are based on Net Assets) |
| | | | | | | | |
| Security | | Par
(000) | | | Value | |
|
| Biotechnology (continued) | |
Gilead Sciences, Inc.: | | | | | | | | |
2.35%, 02/01/20 | | $ | 400 | | | $ | 397,317 | |
3.50%, 02/01/25 | | | 400 | | | | 394,714 | |
2.95%, 03/01/27 | | | 800 | | | | 744,787 | |
Hubbell, Inc., 3.35%, 03/01/26 | | | 800 | | | | 756,285 | |
Lowe’s Cos., Inc., 3.13%, 09/15/24 | | | 800 | | | | 774,770 | |
| | | | | | | | |
| | | | | | | 9,583,045 | |
|
| Building Products — 0.1% | |
Johnson Controls International PLC, 3.63%, 07/02/24(e) | | | 1,590 | | | | 1,566,806 | |
| | | | | | | | |
|
| Capital Markets — 1.5% | |
Brookfield Finance, Inc., 3.90%, 01/25/28 | | | 1,063 | | | | 1,003,485 | |
CME Group, Inc., 3.00%, 03/15/25 | | | 2,200 | | | | 2,142,159 | |
Goldman Sachs Group, Inc.: | | | | | | | | |
6.00%, 06/15/20 | | | 1,040 | | | | 1,076,594 | |
2.35%, 11/15/21 | | | 490 | | | | 472,464 | |
3.00%, 04/26/22 | | | 2,000 | | | | 1,936,887 | |
3.75%, 05/22/25 | | | 2,000 | | | | 1,913,544 | |
3.27%, 09/29/25(c) | | | 2,000 | | | | 1,874,745 | |
3.75%, 02/25/26 | | | 1,900 | | | | 1,796,728 | |
3.50%, 11/16/26 | | | 365 | | | | 337,133 | |
3.85%, 01/26/27 | | | 1,090 | | | | 1,025,306 | |
(3 mo. LIBOR US + 1.51%), 3.69%, 06/05/28(d) | | | 3,000 | | | | 2,788,111 | |
6.75%, 10/01/37 | | | 500 | | | | 564,642 | |
4.02%, 10/31/38(c) | | | 500 | | | | 440,003 | |
Jefferies Group LLC/Jefferies Group Capital Finance, Inc., 4.85%, 01/15/27 | | | 1,512 | | | | 1,444,850 | |
Morgan Stanley: | | | | | | | | |
2.63%, 11/17/21 | | | 1,195 | | | | 1,166,352 | |
2.75%, 05/19/22 | | | 700 | | | | 681,016 | |
3.13%, 07/27/26 | | | 1,000 | | | | 924,634 | |
3.63%, 01/20/27 | | | 300 | | | | 285,119 | |
6.38%, 07/24/42 | | | 460 | | | | 562,947 | |
4.30%, 01/27/45 | | | 400 | | | | 374,138 | |
| | | | | | | | |
| | | | | | | 22,810,857 | |
|
| Chemicals — 0.8% | |
Chemours Co., 5.38%, 05/15/27 | | | 200 | | | | 180,000 | |
DowDuPont, Inc., 3.77%, 11/15/20 | | | 900 | | | | 908,628 | |
International Flavors & Fragrances, Inc.: | | | | | | | | |
3.40%, 09/25/20 | | | 1,550 | | | | 1,551,190 | |
3.20%, 05/01/23 | | | 1,590 | | | | 1,569,885 | |
4.45%, 09/26/28 | | | 505 | | | | 512,447 | |
LyondellBasell Industries NV, 5.00%, 04/15/19 | | | 868 | | | | 868,944 | |
PPG Industries, Inc., 3.75%, 03/15/28 | | | 1,590 | | | | 1,532,148 | |
RPM International, Inc.: | | | | | | | | |
6.13%, 10/15/19 | | | 743 | | | | 756,527 | |
3.75%, 03/15/27 | | | 1,000 | | | | 949,507 | |
Sherwin-Williams Co.: | | | | | | | | |
3.13%, 06/01/24 | | | 265 | | | | 253,032 | |
3.30%, 02/01/25 | | | 800 | | | | 764,937 | |
3.95%, 01/15/26 | | | 400 | | | | 391,110 | |
4.20%, 01/15/22 | | | 1,590 | | | | 1,610,674 | |
| | | | | | | | |
| | | | | | | 11,849,029 | |
|
| Commercial Services & Supplies — 0.2% | |
Ecolab, Inc., 2.25%, 01/12/20 | | | 800 | | | | 794,806 | |
IHS Markit Ltd., 4.13%, 08/01/23 | | | 1,096 | | | | 1,084,821 | |
United Rentals North America, Inc., 4.88%, 01/15/28 | | | 250 | | | | 219,375 | |
Waste Management, Inc., 2.40%, 05/15/23 | | | 1,000 | | | | 959,120 | |
| | | | | | | | |
| | | | | | | 3,058,122 | |
|
| Communications Equipment — 0.2% | |
Cisco Systems, Inc., 2.45%, 06/15/20 | | | 800 | | | | 795,754 | |
Motorola Solutions, Inc., 4.60%, 02/23/28 | | | 2,732 | | | | 2,671,312 | |
| | | | | | | | |
| | | | | | | 3,467,066 | |
| | | | | | | | |
| Security | | Par
(000) | | | Value | |
|
| Construction & Engineering — 0.1% | |
ABB Finance USA, Inc., 3.80%, 04/03/28 | | $ | 400 | | | $ | 405,922 | |
Fluor Corp., 3.50%, 12/15/24 | | | 800 | | | | 780,234 | |
| | | | | | | | |
| | | | | | | 1,186,156 | |
|
| Consumer Discretionary — 0.2% | |
Ecolab, Inc., 3.25%, 12/01/27 | | | 1,190 | | | | 1,148,645 | |
Royal Caribbean Cruises Ltd.: | | | | | | | | |
2.65%, 11/28/20 | | | 315 | | | | 309,221 | |
3.70%, 03/15/28 | | | 900 | | | | 832,271 | |
| | | | | | | | |
| | | | | | | 2,290,137 | |
|
| Consumer Finance — 0.9% | |
American Express Co.: | | | | | | | | |
2.50%, 08/01/22 | | | 1,000 | | | | 965,180 | |
3.70%, 08/03/23 | | | 1,500 | | | | 1,504,338 | |
Automatic Data Processing, Inc., 2.25%, 09/15/20 | | | 400 | | | | 397,808 | |
Capital One NA, 2.35%, 01/31/20 | | | 1,500 | | | | 1,480,983 | |
Mastercard, Inc.: | | | | | | | | |
3.38%, 04/01/24 | | | 900 | | | | 905,617 | |
2.95%, 11/21/26 | | | 1,335 | | | | 1,284,569 | |
S&P Global, Inc.: | | | | | | | | |
3.30%, 08/14/20 | | | 800 | | | | 801,576 | |
4.40%, 02/15/26 | | | 1,000 | | | | 1,031,740 | |
2.95%, 01/22/27 | | | 685 | | | | 644,368 | |
Synchrony Financial, 3.00%, 08/15/19 | | | 1,540 | | | | 1,529,835 | |
Total System Services, Inc., 4.00%, 06/01/23 | | | 1,200 | | | | 1,198,055 | |
Visa, Inc.: | | | | | | | | |
3.15%, 12/14/25 | | | 800 | | | | 786,152 | |
2.75%, 09/15/27 | | | 1,195 | | | | 1,131,718 | |
| | | | | | | | |
| | | | | | | 13,661,939 | |
|
| Containers & Packaging — 0.0% | |
Ball Corp., 4.38%, 12/15/20 | | | 195 | | | | 195,731 | |
| | | | | | | | |
|
| Diversified Financial Services — 4.2% | |
AerCap Ireland Capital DAC/AerCap Global Aviation Trust: | | | | | | | | |
3.30%, 01/23/23 | | | 1,600 | | | | 1,521,138 | |
4.13%, 07/03/23 | | | 1,300 | | | | 1,268,219 | |
4.45%, 10/01/25 | | | 1,100 | | | | 1,044,278 | |
Banco Santander SA: | | | | | | | | |
3.50%, 04/11/22 | | | 2,000 | | | | 1,962,681 | |
4.38%, 04/12/28 | | | 800 | | | | 746,980 | |
Bank of America Corp.: | | | | | | | | |
5.49%, 03/15/19 | | | 600 | | | | 602,723 | |
3.50%, 05/17/22(c) | | | 1,195 | | | | 1,195,179 | |
(3 mo. LIBOR US + 1.02%), 2.88%, 04/24/23(d) | | | 3,000 | | | | 2,917,779 | |
3.00%, 12/20/23(c) | | | 553 | | | | 537,521 | |
3.86%, 07/23/24(c) | | | 3,300 | | | | 3,292,140 | |
4.45%, 03/03/26 | | | 2,700 | | | | 2,669,207 | |
4.27%, 07/23/29(c) | | | 260 | | | | 258,780 | |
(3 mo. LIBOR US + 1.81%), 4.24%, 04/24/38(d) | | | 100 | | | | 95,130 | |
Citigroup, Inc.: | | | | | | | | |
4.50%, 01/14/22 | | | 1,000 | | | | 1,021,734 | |
2.75%, 04/25/22 | | | 1,400 | | | | 1,359,924 | |
3.14%, 01/24/23(c) | | | 1,600 | | | | 1,571,601 | |
Credit Suisse Group Funding Guernsey Ltd.: | | | | | | | | |
3.45%, 04/16/21 | | | 2,030 | | | | 2,022,706 | |
3.80%, 09/15/22 | | | 670 | | | | 665,112 | |
3.80%, 06/09/23 | | | 300 | | | | 294,386 | |
Ford Motor Credit Co. LLC: | | | | | | | | |
2.02%, 05/03/19 | | | 1,650 | | | | 1,643,331 | |
1.90%, 08/12/19 | | | 615 | | | | 608,949 | |
2.43%, 06/12/20 | | | 1,010 | | | | 983,461 | |
3.81%, 10/12/21 | | | 1,845 | | | | 1,791,853 | |
3.82%, 11/02/27 | | | 1,500 | | | | 1,265,565 | |
| | | | |
| SCHEDULE OF INVESTMENTS | | | 23 | |
| | |
Schedule of Investments (continued) December 31, 2018 | | CoreAlpha Bond Master Portfolio (Percentages shown are based on Net Assets) |
| | | | | | | | |
| Security | | Par
(000) | | | Value | |
|
| Diversified Financial Services (continued) | |
General Motors Financial Co., Inc.: | | | | | | | | |
2.40%, 05/09/19 | | $ | 1,700 | | | $ | 1,693,611 | |
2.65%, 04/13/20 | | | 1,000 | | | | 983,303 | |
4.20%, 03/01/21 | | | 2,200 | | | | 2,198,818 | |
4.20%, 11/06/21 | | | 1,360 | | | | 1,359,388 | |
3.45%, 04/10/22 | | | 1,780 | | | | 1,721,369 | |
3.25%, 01/05/23 | | | 1,200 | | | | 1,130,066 | |
3.70%, 05/09/23 | | | 400 | | | | 380,572 | |
4.15%, 06/19/23 | | | 1,000 | | | | 974,351 | |
4.30%, 07/13/25 | | | 180 | | | | 170,572 | |
Intercontinental Exchange, Inc.: | | | | | | | | |
3.75%, 09/21/28 | | | 1,840 | | | | 1,841,172 | |
4.25%, 09/21/48 | | | 350 | | | | 342,601 | |
JPMorgan Chase & Co.: | | | | | | | | |
2.35%, 01/28/19 | | | 800 | | | | 799,605 | |
2.20%, 10/22/19 | | | 400 | | | | 396,645 | |
4.25%, 10/15/20 | | | 1,770 | | | | 1,801,894 | |
2.55%, 03/01/21 | | | 1,100 | | | | 1,084,490 | |
3.25%, 09/23/22 | | | 780 | | | | 773,806 | |
3.20%, 01/25/23 | | | 1,380 | | | | 1,359,894 | |
(3 mo. LIBOR US + 0.94%), 2.78%, 04/25/23(d) | | | 1,000 | | | | 969,646 | |
3.63%, 05/13/24 | | | 400 | | | | 397,336 | |
3.13%, 01/23/25 | | | 800 | | | | 762,165 | |
(3 mo. LIBOR US + 1.16%), 3.22%, 03/01/25(d) | | | 600 | | | | 579,589 | |
4.01%, 04/23/29(c) | | | 2,555 | | | | 2,504,825 | |
4.20%, 07/23/29(c) | | | 1,555 | | | | 1,550,273 | |
Kimberly-Clark Corp., 2.40%, 06/01/23 | | | 800 | | | | 775,483 | |
Mitsubishi UFJ Financial Group, Inc.: | | | | | | | | |
3.54%, 07/26/21 | | | 340 | | | | 341,278 | |
3.00%, 02/22/22 | | | 335 | | | | 330,309 | |
3.46%, 03/02/23 | | | 1,600 | | | | 1,590,178 | |
MSCI, Inc., 5.75%, 08/15/25(a) | | | 300 | | | | 302,250 | |
Nasdaq, Inc., 3.85%, 06/30/26 | | | 32 | | | | 30,902 | |
ORIX Corp., 2.90%, 07/18/22 | | | 325 | | | | 317,557 | |
Sumitomo Mitsui Financial Group, Inc., 3.10%, 01/17/23 | | | 1,900 | | | | 1,863,795 | |
| | | | | | | | |
| | | | | | | 62,668,120 | |
|
| Diversified Telecommunication Services — 1.6% | |
AT&T, Inc.: | | | | | | | | |
4.60%, 02/15/21 | | | 1,000 | | | | 1,022,805 | |
3.00%, 02/15/22 | | | 800 | | | | 786,209 | |
3.20%, 03/01/22 | | | 810 | | | | 799,029 | |
2.63%, 12/01/22 | | | 800 | | | | 768,517 | |
3.80%, 03/01/24 | | | 2,360 | | | | 2,336,193 | |
3.90%, 03/11/24 | | | 1,590 | | | | 1,579,286 | |
4.45%, 04/01/24 | | | 1,165 | | | | 1,184,331 | |
3.40%, 05/15/25 | | | 1,590 | | | | 1,497,228 | |
CC Holdings GS V LLC/Crown Castle GS III Corp., 3.85%, 04/15/23 | | | 1,270 | | | | 1,257,665 | |
Verizon Communications, Inc.: | | | | | | | | |
3.50%, 11/01/24 | | | 2,500 | | | | 2,465,693 | |
3.38%, 02/15/25 | | | 1,000 | | | | 970,409 | |
2.63%, 08/15/26 | | | 1,190 | | | | 1,078,891 | |
4.13%, 03/16/27 | | | 1,590 | | | | 1,591,227 | |
4.33%, 09/21/28 | | | 1,767 | | | | 1,774,262 | |
4.50%, 08/10/33 | | | 2,300 | | | | 2,270,297 | |
4.86%, 08/21/46 | | | 1,750 | | | | 1,719,848 | |
5.01%, 08/21/54 | | | 220 | | | | 212,582 | |
| | | | | | | | |
| | | | | | | 23,314,472 | |
|
| Electric Utilities — 4.1% | |
Alabama Power Co.: | | | | | | | | |
3.38%, 10/01/20 | | | 800 | | | | 800,382 | |
2.80%, 04/01/25 | | | 800 | | | | 762,631 | |
| | | | | | | | |
| Security | | Par
(000) | | | Value | |
|
| Electric Utilities (continued) | |
American Electric Power Co., Inc., 3.20%, 11/13/27 | | $ | 1,300 | | | $ | 1,233,063 | |
Appalachian Power Co.: | | | | | | | | |
3.40%, 06/01/25 | | | 800 | | | | 783,353 | |
Series X, 3.30%, 06/01/27 | | | 1,190 | | | | 1,136,874 | |
Arizona Public Service Co.: | | | | | | | | |
3.15%, 05/15/25 | | | 400 | | | | 389,635 | |
2.95%, 09/15/27 | | | 800 | | | | 757,580 | |
Baltimore Gas & Electric Co.: | | | | | | | | |
3.35%, 07/01/23 | | | 2,390 | | | | 2,392,549 | |
2.40%, 08/15/26 | | | 800 | | | | 731,892 | |
4.25%, 09/15/48 | | | 225 | | | | 223,438 | |
Berkshire Hathaway Energy Co., 4.45%, 01/15/49(a) | | | 400 | | | | 395,586 | |
CenterPoint Energy Houston Electric LLC, Series Z, 2.40%, 09/01/26 | | | 800 | | | | 735,078 | |
Commonwealth Edison Co.: | | | | | | | | |
2.55%, 06/15/26 | | | 800 | | | | 748,915 | |
3.70%, 08/15/28 | | | 2,200 | | | | 2,206,543 | |
Consolidated Edison Co. of New York, Inc.: | | | | | | | | |
Series06-A, 5.85%, 03/15/36 | | | 1,000 | | | | 1,178,119 | |
Series B, 3.13%, 11/15/27 | | | 800 | | | | 769,330 | |
Consumers Energy Co., 3.38%, 08/15/23 | | | 800 | | | | 802,633 | |
DTE Electric Co., 3.65%, 03/15/24 | | | 1,590 | | | | 1,622,978 | |
Duke Energy Corp.: | | | | | | | | |
5.05%, 09/15/19 | | | 400 | | | | 403,697 | |
2.65%, 09/01/26 | | | 1,000 | | | | 909,135 | |
Duke Energy Florida LLC, 3.80%, 07/15/28 | | | 1,365 | | | | 1,378,642 | |
Duke Energy Progress LLC, 3.25%, 08/15/25 | | | 1,590 | | | | 1,547,208 | |
Edison International, 4.13%, 03/15/28 | | | 1,000 | | | | 946,461 | |
Eversource Energy: | | | | | | | | |
Series L, 2.90%, 10/01/24 | | | 1,360 | | | | 1,303,375 | |
Series M, 3.30%, 01/15/28 | | | 1,000 | | | | 948,439 | |
Florida Power & Light Co.: | | | | | | | | |
2.75%, 06/01/23 | | | 1,590 | | | | 1,556,016 | |
3.25%, 06/01/24 | | | 800 | | | | 798,103 | |
Georgia Power Co., 3.25%, 04/01/26 | | | 800 | | | | 747,621 | |
Indiana Michigan Power Co.: | | | | | | | | |
3.85%, 05/15/28 | | | 800 | | | | 804,508 | |
Series J, 3.20%, 03/15/23 | | | 1,190 | | | | 1,177,855 | |
Interstate Power & Light Co., 3.25%, 12/01/24 | | | 800 | | | | 779,635 | |
IPALCO Enterprises, Inc., 3.70%, 09/01/24 | | | 275 | | | | 267,712 | |
Jersey Central Power & Light Co., 4.30%, 01/15/26(a) | | | 800 | | | | 805,747 | |
Kansas City Power & Light Co.: | | | | | | | | |
3.15%, 03/15/23 | | | 1,590 | | | | 1,572,867 | |
3.65%, 08/15/25 | | | 800 | | | | 795,250 | |
Kentucky Utilities Co., 3.25%, 11/01/20 | | | 800 | | | | 802,252 | |
MidAmerican Energy Co., 3.10%, 05/01/27 | | | 800 | | | | 778,633 | |
NextEra Energy Capital Holdings, Inc.: | | | | | | | | |
2.70%, 09/15/19 | | | 1,040 | | | | 1,034,322 | |
3.55%, 05/01/27 | | | 645 | | | | 615,488 | |
PacifiCorp: | | | | | | | | |
2.95%, 06/01/23 | | | 800 | | | | 792,170 | |
4.13%, 01/15/49 | | | 700 | | | | 688,861 | |
Pennsylvania Electric Co., 3.25%, 03/15/28(a) | | | 1,590 | | | | 1,488,130 | |
PPL Electric Utilities Corp., 2.50%, 09/01/22 | | | 400 | | | | 388,426 | |
Progress Energy, Inc.: | | | | | | | | |
4.88%, 12/01/19 | | | 920 | | | | 931,635 | |
4.40%, 01/15/21 | | | 1,110 | | | | 1,131,181 | |
PSEG Power LLC: | | | | | | | | |
4.15%, 09/15/21 | | | 350 | | | | 353,837 | |
3.85%, 06/01/23 | | | 1,300 | | | | 1,301,059 | |
Public Service Co. of Colorado: | | | | | | | | |
3.20%, 11/15/20 | | | 800 | | | | 803,643 | |
3.70%, 06/15/28 | | | 1,800 | | | | 1,821,992 | |
| | |
| 24 | | 2018 BLACKROCK ANNUAL REPORTTO SHAREHOLDERS |
| | |
Schedule of Investments (continued) December 31, 2018 | | CoreAlpha Bond Master Portfolio (Percentages shown are based on Net Assets) |
| | | | | | | | |
| Security | | Par
(000) | | | Value | |
|
| Electric Utilities (continued) | |
Public Service Electric & Gas Co.: | | | | | | | | |
2.38%, 05/15/23 | | $ | 400 | | | $ | 386,849 | |
2.25%, 09/15/26 | | | 800 | | | | 730,844 | |
3.70%, 05/01/28 | | | 800 | | | | 812,669 | |
San Diego Gas & Electric Co., 2.50%, 05/15/26 | | | 400 | | | | 370,886 | |
Southern Co., 3.25%, 07/01/26 | | | 2,000 | | | | 1,873,507 | |
Virginia Electric & Power Co.: | | | | | | | | |
Series A, 3.80%, 04/01/28 | | | 3,300 | | | | 3,313,894 | |
Series C, 2.75%, 03/15/23 | | | 1,190 | | | | 1,160,308 | |
Westar Energy, Inc.: | | | | | | | | |
2.55%, 07/01/26 | | | 800 | | | | 747,451 | |
3.10%, 04/01/27 | | | 800 | | | | 773,759 | |
Wisconsin Electric Power Co., 3.10%, 06/01/25 | | | 800 | | | | 782,181 | |
Wisconsin Power & Light Co., 3.05%, 10/15/27 | | | 1,590 | | | | 1,520,888 | |
Xcel Energy, Inc., 4.00%, 06/15/28 | | | 900 | | | | 910,291 | |
| | | | | | | | |
| | | | | | | 60,728,006 | |
|
| Electrical Equipment — 0.3% | |
Amphenol Corp., 2.55%, 01/30/19 | | | 600 | | | | 599,606 | |
Emerson Electric Co.: | | | | | | | | |
2.63%, 12/01/21 | | | 800 | | | | 789,026 | |
2.63%, 02/15/23 | | | 1,190 | | | | 1,165,662 | |
Roper Technologies, Inc.: | | | | | | | | |
3.80%, 12/15/26 | | | 1,000 | | | | 975,062 | |
4.20%, 09/15/28 | | | 1,500 | | | | 1,485,056 | |
| | | | | | | | |
| | | | | | | 5,014,412 | |
|
| Electronic Equipment, Instruments & Components — 0.1% | |
Arrow Electronics, Inc., 3.25%, 09/08/24 | | | 395 | | | | 367,789 | |
CDW LLC/CDW Finance Corp., 5.00%, 09/01/25 | | | 300 | | | | 287,250 | |
Fortive Corp., 1.80%, 06/15/19 | | | 47 | | | | 46,438 | |
Tyco Electronics Group SA, 3.13%, 08/15/27 | | | 210 | | | | 194,248 | |
| | | | | | | | |
| | | | | | | 895,725 | |
|
| Energy Equipment & Services — 0.1% | |
Ensco PLC: | | | | | | | | |
4.50%, 10/01/24 | | | 1,590 | | | | 1,033,500 | |
5.20%, 03/15/25 | | | 400 | | | | 266,000 | |
| | | | | | | | |
| | | | | | | 1,299,500 | |
|
| Equity Real Estate Investment Trusts (REITs) — 1.6% | |
Alexandria Real Estate Equities, Inc., 2.75%, 01/15/20 | | | 1,190 | | | | 1,180,700 | |
American Tower Corp.: | | | | | | | | |
3.40%, 02/15/19 | | | 538 | | | | 538,304 | |
2.80%, 06/01/20 | | | 1,190 | | | | 1,180,855 | |
5.05%, 09/01/20 | | | 400 | | | | 409,585 | |
3.45%, 09/15/21 | | | 740 | | | | 739,861 | |
2.25%, 01/15/22 | | | 960 | | | | 918,727 | |
4.70%, 03/15/22 | | | 1,000 | | | | 1,027,041 | |
3.50%, 01/31/23 | | | 1,400 | | | | 1,375,883 | |
3.00%, 06/15/23 | | | 1,000 | | | | 962,124 | |
3.38%, 10/15/26 | | | 3,100 | | | | 2,883,981 | |
CoreCivic, Inc.: | | | | | | | | |
4.13%, 04/01/20 | | | 760 | | | | 742,900 | |
4.63%, 05/01/23 | | | 735 | | | | 679,875 | |
Crown Castle International Corp.: | | | | | | | | |
2.25%, 09/01/21 | | | 275 | | | | 265,875 | |
4.88%, 04/15/22 | | | 830 | | | | 854,056 | |
5.25%, 01/15/23 | | | 400 | | | | 415,370 | |
3.20%, 09/01/24 | | | 1,500 | | | | 1,423,058 | |
3.70%, 06/15/26 | | | 1,000 | | | | 961,253 | |
3.65%, 09/01/27 | | | 500 | | | | 463,520 | |
3.80%, 02/15/28 | | | 596 | | | | 563,989 | |
Omega Healthcare Investors, Inc., 4.50%, 04/01/27 | | | 1,000 | | | | 965,685 | |
Public Storage, 3.09%, 09/15/27 | | | 2,500 | | | | 2,341,494 | |
Senior Housing Properties Trust, 3.25%, 05/01/19 | | | 1,600 | | | | 1,592,006 | |
| | | | | | | | |
| Security | | Par
(000) | | | Value | |
|
| Equity Real Estate Investment Trusts (REITs) (continued) | |
WEA Finance LLC/Westfield UK & Europe Finance PLC, 2.70%, 09/17/19(a) | | $ | 655 | | | $ | 652,100 | |
| | | | | | | | |
| | | | | | | 23,138,242 | |
|
| Food & Staples Retailing — 0.6% | |
Conagra Brands, Inc., 3.80%, 10/22/21 | | | 595 | | | | 595,210 | |
CVS Caremark Corp., 2.75%, 12/01/22 | | | 800 | | | | 769,925 | |
Lamb Weston Holdings, Inc., 4.88%, 11/01/26(a) | | | 150 | | | | 144,000 | |
McCormick & Co., Inc., 2.70%, 08/15/22 | | | 700 | | | | 678,761 | |
Mondelez International, Inc., 4.13%, 05/07/28 | | | 1,590 | | | | 1,586,607 | |
Walgreen Co.: | | | | | | | | |
3.10%, 09/15/22 | | | 800 | | | | 780,401 | |
4.40%, 09/15/42 | | | 750 | | | | 657,495 | |
Walgreens Boots Alliance, Inc.: | | | | | | | | |
3.30%, 11/18/21 | | | 800 | | | | 796,321 | |
3.80%, 11/18/24 | | | 400 | | | | 393,917 | |
3.45%, 06/01/26 | | | 1,400 | | | | 1,317,242 | |
Walmart, Inc., 2.55%, 04/11/23 | | | 800 | | | | 779,947 | |
| | | | | | | | |
| | | | | | | 8,499,826 | |
|
| Food Products — 0.5% | |
Conagra Brands, Inc., 4.30%, 05/01/24 | | | 2,000 | | | | 1,987,930 | |
Kellogg Co., 2.65%, 12/01/23 | | | 1,100 | | | | 1,040,099 | |
Kraft Heinz Foods Co., 3.50%, 06/06/22 | | | 1,190 | | | | 1,177,998 | |
Pilgrim’s Pride Corp., 5.75%, 03/15/25(a) | | | 860 | | | | 806,250 | |
Sysco Corp.: | | | | | | | | |
3.30%, 07/15/26 | | | 800 | | | | 761,327 | |
3.25%, 07/15/27 | | | 1,590 | | | | 1,491,293 | |
| | | | | | | | |
| | | | | | | 7,264,897 | |
|
| Gas Utilities — 0.1% | |
Atmos Energy Corp., 3.00%, 06/15/27 | | | 400 | | | | 381,455 | |
Southern California Gas Co.: | | | | | | | | |
3.15%, 09/15/24 | | | 800 | | | | 794,284 | |
Series TT, 2.60%, 06/15/26 | | | 800 | | | | 750,512 | |
| | | | | | | | |
| | | | | | | 1,926,251 | |
|
| Health Care Equipment & Supplies — 1.6% | |
Abbott Laboratories, 3.40%, 11/30/23 | | | 910 | | | | 907,225 | |
Baxter International, Inc.: | | | | | | | | |
1.70%, 08/15/21 | | | 800 | | | | 767,520 | |
2.60%, 08/15/26 | | | 3,110 | | | | 2,838,937 | |
Becton Dickinson & Co.: | | | | | | | | |
2.68%, 12/15/19 | | | 292 | | | | 289,223 | |
2.40%, 06/05/20 | | | 480 | | | | 472,509 | |
3.25%, 11/12/20 | | | 1,800 | | | | 1,789,115 | |
3.13%, 11/08/21 | | | 800 | | | | 789,006 | |
2.89%, 06/06/22 | | | 470 | | | | 455,204 | |
3.36%, 06/06/24 | | | 3,223 | | | | 3,095,617 | |
3.73%, 12/15/24 | | | 1,590 | | | | 1,535,933 | |
Boston Scientific Corp.: | | | | | | | | |
2.85%, 05/15/20 | | | 225 | | | | 223,534 | |
3.85%, 05/15/25 | | | 1,300 | | | | 1,278,882 | |
Covidien International Finance SA: | | | | | | | | |
4.20%, 06/15/20 | | | 1,485 | | | | 1,508,730 | |
2.95%, 06/15/23 | | | 2,390 | | | | 2,340,036 | |
Stryker Corp.: | | | | | | | | |
2.63%, 03/15/21 | | | 245 | | | | 241,694 | |
3.50%, 03/15/26 | | | 800 | | | | 769,276 | |
3.65%, 03/07/28 | | | 800 | | | | 778,482 | |
Zimmer Biomet Holdings, Inc.: | | | | | | | | |
2.70%, 04/01/20 | | | 1,340 | | | | 1,327,212 | |
3.15%, 04/01/22 | | | 800 | | | | 782,169 | |
3.70%, 03/19/23 | | | 305 | | | | 301,745 | |
3.55%, 04/01/25 | | | 1,590 | | | | 1,511,221 | |
| �� | | | | | | | |
| | | | | | | 24,003,270 | |
| | | | |
| SCHEDULE OF INVESTMENTS | | | 25 | |
| | |
Schedule of Investments (continued) December 31, 2018 | | CoreAlpha Bond Master Portfolio (Percentages shown are based on Net Assets) |
| | | | | | | | |
| Security | | Par
(000) | | | Value | |
|
| Health Care Providers & Services — 0.8% | |
Aetna, Inc., 2.75%, 11/15/22 | | $ | 1,000 | | | $ | 959,368 | |
Anthem, Inc.: | | | | | | | | |
3.35%, 12/01/24 | | | 1,210 | | | | 1,178,776 | |
3.65%, 12/01/27 | | | 1,500 | | | | 1,433,140 | |
Cigna Corp., 3.75%, 07/15/23(a) | | | 1,100 | | | | 1,096,337 | |
HCA, Inc.: | | | | | | | | |
5.25%, 04/15/25 | | | 1,600 | | | | 1,592,000 | |
5.25%, 06/15/26 | | | 500 | | | | 496,250 | |
Humana, Inc.: | | | | | | | | |
2.90%, 12/15/22 | | | 760 | | | | 738,842 | |
3.85%, 10/01/24 | | | 1,000 | | | | 999,189 | |
Omega Healthcare Investors, Inc., 4.95%, 04/01/24 | | | 1,100 | | | | 1,116,332 | |
Quest Diagnostics, Inc., 2.50%, 03/30/20 | | | 705 | | | | 698,566 | |
Thermo Fisher Scientific, Inc., 2.95%, 09/19/26 | | | 400 | | | | 369,138 | |
UnitedHealth Group, Inc., 4.75%, 07/15/45 | | | 800 | | | | 846,400 | |
| | | | | | | | |
| | | | | | | 11,524,338 | |
|
| Hotels, Restaurants & Leisure — 0.7% | |
GLP Capital LP/GLP Financing II, Inc.: | | | | | | | | |
5.38%, 11/01/23 | | | 1,200 | | | | 1,216,440 | |
5.25%, 06/01/25 | | | 1,690 | | | | 1,678,035 | |
5.38%, 04/15/26 | | | 1,840 | | | | 1,819,778 | |
5.75%, 06/01/28 | | | 1,095 | | | | 1,105,950 | |
5.30%, 01/15/29 | | | 645 | | | | 630,829 | |
Hilton Worldwide Finance LLC/Hilton Worldwide Finance Corp., 4.88%, 04/01/27 | | | 300 | | | | 281,250 | |
McDonald’s Corp.: | | | | | | | | |
1.88%, 05/29/19 | | | 400 | | | | 398,188 | |
3.70%, 01/30/26 | | | 1,000 | | | | 980,291 | |
3.50%, 03/01/27 | | | 278 | | | | 269,996 | |
3.80%, 04/01/28 | | | 1,590 | | | | 1,561,028 | |
6.30%, 10/15/37 | | | 310 | | | | 362,175 | |
| | | | | | | | |
| | | | | | | 10,303,960 | |
|
| Household Products — 0.1% | |
Clorox Co., 3.50%, 12/15/24 | | | 800 | | | | 799,138 | |
| | | | | | | | |
|
| Independent Power and Renewable Electricity Producers — 0.0% | |
Exelon Corp., 5.15%, 12/01/20 | | | 360 | | | | 367,903 | |
| | | | | | | | |
|
| Insurance — 1.1% | |
Aflac, Inc., 3.63%, 11/15/24 | | | 1,000 | | | | 999,221 | |
Allstate Corp., 4.20%, 12/15/46 | | | 110 | | | | 106,821 | |
American Financial Group, Inc., 3.50%, 08/15/26 | | | 2,300 | | | | 2,169,720 | |
American International Group, Inc., 3.30%, 03/01/21 | | | 320 | | | | 318,915 | |
Berkshire Hathaway, Inc.: | | | | | | | | |
3.13%, 03/15/26 | | | 2,355 | | | | 2,282,561 | |
4.50%, 02/11/43 | | | 500 | | | | 522,050 | |
Chubb INA Holdings, Inc., 3.35%, 05/15/24 | | | 660 | | | | 655,767 | |
Fidelity National Financial, Inc., 5.50%, 09/01/22 | | | 385 | | | | 407,254 | |
Markel Corp.: | | | | | | | | |
5.35%, 06/01/21 | | | 400 | | | | 416,334 | |
3.50%, 11/01/27 | | | 1,500 | | | | 1,415,488 | |
Marsh & McLennan Cos., Inc.: | | | | | | | | |
2.35%, 09/10/19 | | | 880 | | | | 875,366 | |
3.30%, 03/14/23 | | | 175 | | | | 173,037 | |
3.75%, 03/14/26 | | | 4,478 | | | | 4,425,149 | |
Old Republic International Corp., 3.88%, 08/26/26 | | | 1,500 | | | | 1,432,319 | |
Willis Towers Watson PLC, 5.75%, 03/15/21 | | | 350 | | | | 366,032 | |
| | | | | | | | |
| | | | | | | 16,566,034 | |
|
| Internet & Direct Marketing Retail — 0.4% | |
Amazon.com, Inc.: | | | | | | | | |
2.80%, 08/22/24 | | | 440 | | | | 427,661 | |
3.15%, 08/22/27 | | | 2,390 | | | | 2,307,501 | |
Expedia Group, Inc., 3.80%, 02/15/28 | | | 3,100 | | | | 2,811,185 | |
| | | | | | | | |
| | | | | | | 5,546,347 | |
| | | | | | | | |
| Security | | Par
(000) | | | Value | |
|
| Internet Software & Services — 0.4% | |
Alphabet, Inc., 2.00%, 08/15/26 | | $ | 800 | | | $ | 727,276 | |
Baidu, Inc.: | | | | | | | | |
3.88%, 09/29/23 | | | 935 | | | | 932,340 | |
4.38%, 05/14/24 | | | 2,300 | | | | 2,314,403 | |
3.63%, 07/06/27 | | | 200 | | | | 187,173 | |
Booking Holdings, Inc., 3.60%, 06/01/26 | | | 944 | | | | 917,140 | |
Equinix, Inc.: | | | | | | | | |
5.38%, 01/01/22 | | | 555 | | | | 559,162 | |
5.75%, 01/01/25 | | | 430 | | | | 433,225 | |
VeriSign, Inc., 4.63%, 05/01/23 | | | 415 | | | | 408,775 | |
| | | | | | | | |
| | | | | | | 6,479,494 | |
|
| IT Services — 1.1% | |
Alibaba Group Holding Ltd.: | | | | | | | | |
2.80%, 06/06/23 | | | 200 | | | | 192,545 | |
3.60%, 11/28/24 | | | 2,445 | | | | 2,382,541 | |
3.40%, 12/06/27 | | | 4,800 | | | | 4,431,228 | |
Broadridge Financial Solutions, Inc., 3.40%, 06/27/26 | | | 720 | | | | 685,018 | |
DXC Technology Co.: | | | | | | | | |
2.88%, 03/27/20 | | | 50 | | | | 49,568 | |
4.25%, 04/15/24 | | | 1,020 | | | | 1,003,656 | |
Fidelity National Information Services, Inc., 3.63%, 10/15/20 | | | 714 | | | | 717,246 | |
Fiserv, Inc., 4.20%, 10/01/28 | | | 2,000 | | | | 1,995,992 | |
International Business Machines Corp.: | | | | | | | | |
1.88%, 05/15/19 | | | 1,590 | | | | 1,584,361 | |
1.63%, 05/15/20 | | | 800 | | | | 784,198 | |
3.38%, 08/01/23 | | | 800 | | | | 791,262 | |
Verisk Analytics, Inc., 4.00%, 06/15/25 | | | 1,200 | | | | 1,204,719 | |
| | | | | | | | |
| | | | | | | 15,822,334 | |
|
| Life Sciences Tools & Services — 0.0% | |
Thermo Fisher Scientific, Inc., 3.15%, 01/15/23 | | | 400 | | | | 392,000 | |
| | | | | | | | |
|
| Machinery — 0.2% | |
Caterpillar Financial Services Corp.: | | | | | | | | |
2.63%, 03/01/23 | | | 1,590 | | | | 1,546,798 | |
2.40%, 08/09/26 | | | 800 | | | | 735,612 | |
Fortive Corp., 3.15%, 06/15/26 | | | 275 | | | | 259,348 | |
| | | | | | | | |
| | | | | | | 2,541,758 | |
|
| Media — 1.1% | |
21st Century Fox America, Inc.: | | | | | | | | |
6.40%, 12/15/35 | | | 200 | | | | 249,511 | |
6.15%, 02/15/41 | | | 175 | | | | 217,320 | |
Altice Financing SA, 6.63%, 02/15/23(a) | | | 480 | | | | 460,800 | |
Charter Communications Operating LLC/Charter Communications Operating Capital: | | | | | | | | |
3.58%, 07/23/20 | | | 395 | | | | 394,574 | |
4.91%, 07/23/25 | | | 1,350 | | | | 1,342,386 | |
3.75%, 02/15/28 | | | 1,750 | | | | 1,583,079 | |
Comcast Corp.: | | | | | | | | |
3.38%, 02/15/25 | | | 1,590 | | | | 1,557,292 | |
2.35%, 01/15/27 | | | 400 | | | | 357,556 | |
4.60%, 10/15/38 | | | 1,200 | | | | 1,211,734 | |
4.70%, 10/15/48 | | | 1,300 | | | | 1,314,145 | |
DISH DBS Corp.: | | | | | | | | |
7.88%, 09/01/19 | | | 780 | | | | 795,834 | |
6.75%, 06/01/21 | | | 360 | | | | 356,292 | |
Interpublic Group of Cos., Inc., 3.75%, 10/01/21 | | | 190 | | | | 191,185 | |
Outfront Media Capital LLC/Outfront Media Capital Corp., 5.25%, 02/15/22 | | | 260 | | | | 258,700 | |
Sirius XM Radio, Inc., 5.00%, 08/01/27(a) | | | 250 | | | | 228,438 | |
Thomson Reuters Corp.: | | | | | | | | |
3.85%, 09/29/24 | | | 800 | | | | 784,130 | |
3.35%, 05/15/26 | �� | | 800 | | | | 742,277 | |
| | |
| 26 | | 2018 BLACKROCK ANNUAL REPORTTO SHAREHOLDERS |
| | |
Schedule of Investments (continued) December 31, 2018 | | CoreAlpha Bond Master Portfolio (Percentages shown are based on Net Assets) |
| | | | | | | | |
| Security | | Par
(000) | | | Value | |
|
| Media (continued) | |
Time Warner Cable LLC, 5.00%, 02/01/20 | | $ | 680 | | | $ | 689,537 | |
Warner Media LLC: | | | | | | | | |
2.10%, 06/01/19 | | | 1,190 | | | | 1,183,179 | |
3.55%, 06/01/24 | | | 1,190 | | | | 1,147,941 | |
3.60%, 07/15/25 | | | 1,175 | | | | 1,112,868 | |
2.95%, 07/15/26 | | | 725 | | | | 648,175 | |
| | | | | | | | |
| | | | | | | 16,826,953 | |
|
| Metals & Mining — 0.3% | |
Alcoa Nederland Holding BV, 6.13%, 05/15/28(a) | | | 200 | | | | 191,500 | |
Vale Overseas Ltd.: | | | | | | | | |
4.38%, 01/11/22 | | | 413 | | | | 418,163 | |
6.25%, 08/10/26 | | | 3,500 | | | | 3,780,000 | |
| | | | | | | | |
| | | | | | | 4,389,663 | |
|
| Multi-Utilities — 0.4% | |
CenterPoint Energy, Inc., 4.25%, 11/01/28 | | | 1,230 | | | | 1,246,419 | |
Dominion Energy, Inc., 2.58%, 07/01/20 | | | 170 | | | | 167,340 | |
DTE Energy Co., Series D, 3.70%, 08/01/23 | | | 760 | | | | 754,679 | |
National Fuel Gas Co., 3.95%, 09/15/27 | | | 809 | | | | 755,468 | |
San Diego Gas & Electric Co., 3.60%, 09/01/23 | | | 1,590 | | | | 1,602,666 | |
Sempra Energy, 2.90%, 02/01/23 | | | 225 | | | | 218,633 | |
Southwest Gas Corp., 3.70%, 04/01/28 | | | 1,590 | | | | 1,581,485 | |
| | | | | | | | |
| | | | | | | 6,326,690 | |
|
| Office Supplies & Equipment — 0.4% | |
VMware, Inc.: | | | | | | | | |
2.30%, 08/21/20 | | | 390 | | | | 381,989 | |
2.95%, 08/21/22 | | | 3,550 | | | | 3,383,745 | |
3.90%, 08/21/27 | | | 2,200 | | | | 1,951,433 | |
| | | | | | | | |
| | | | | | | 5,717,167 | |
|
| Oil, Gas & Consumable Fuels — 2.6% | |
Cheniere Energy Partners LP, Series WI, 5.25%, 10/01/25 | | | 300 | | | | 279,750 | |
CNOOC Finance 2015 USA LLC, 3.50%, 05/05/25 | | | 1,500 | | | | 1,458,322 | |
Energy Transfer LP, 9.70%, 03/15/19 | | | 262 | | | | 265,113 | |
Energy Transfer Partners LP, 9.00%, 04/15/19 | | | 123 | | | | 125,076 | |
Equinor ASA: | | | | | | | | |
2.75%, 11/10/21 | | | 2,480 | | | | 2,459,994 | |
3.25%, 11/10/24 | | | 400 | | | | 398,326 | |
Exxon Mobil Corp.: | | | | | | | | |
3.18%, 03/15/24 | | | 800 | | | | 801,094 | |
3.04%, 03/01/26 | | | 1,590 | | | | 1,551,151 | |
Hess Corp., 4.30%, 04/01/27 | | | 2,400 | | | | 2,199,201 | |
HollyFrontier Corp., 5.88%, 04/01/26 | | | 3,500 | | | | 3,538,171 | |
Kinder Morgan, Inc., 3.05%, 12/01/19 | | | 265 | | | | 263,472 | |
MPLX LP, 4.88%, 06/01/25 | | | 2,000 | | | | 2,018,325 | |
Nabors Industries, Inc., 5.10%, 09/15/23 | | | 1,590 | | | | 1,207,610 | |
ONEOK Partners LP: | | | | | | | | |
3.38%, 10/01/22 | | | 1,000 | | | | 981,857 | |
4.90%, 03/15/25 | | | 2,000 | | | | 2,026,313 | |
6.13%, 02/01/41 | | | 800 | | | | 824,241 | |
ONEOK, Inc.: | | | | | | | | |
4.00%, 07/13/27 | | | 1,500 | | | | 1,430,744 | |
4.55%, 07/15/28 | | | 1,800 | | | | 1,776,603 | |
4.95%, 07/13/47 | | | 500 | | | | 461,900 | |
Petroleos Mexicanos: | | | | | | | | |
4.88%, 01/24/22 | | | 400 | | | | 389,400 | |
4.63%, 09/21/23 | | | 1,635 | | | | 1,534,447 | |
5.35%, 02/12/28 | | | 1,165 | | | | 1,016,463 | |
6.38%, 01/23/45 | | | 460 | | | | 369,725 | |
QEP Resources, Inc., 5.63%, 03/01/26 | | | 200 | | | | 166,000 | |
Sabine Pass Liquefaction LLC: | | | | | | | | |
5.75%, 05/15/24 | | | 900 | | | | 939,021 | |
5.63%, 03/01/25 | | | 1,000 | | | | 1,038,460 | |
| | | | | | | | |
| Security | | Par
(000) | | | Value | |
|
| Oil, Gas & Consumable Fuels (continued) | |
Sabine Pass Liquefaction LLC (continued) | | | | | | | | |
5.88%, 06/30/26 | | $ | 500 | | | $ | 529,402 | |
5.00%, 03/15/27 | | | 3,442 | | | | 3,453,496 | |
4.20%, 03/15/28 | | | 1,258 | | | | 1,203,300 | |
Shell International Finance BV: | | | | | | | | |
3.40%, 08/12/23 | | | 400 | | | | 403,371 | |
3.88%, 11/13/28 | | | 3,065 | | | | 3,149,747 | |
TransCanada PipeLines Ltd., 3.75%, 10/16/23 | | | 800 | | | | 797,093 | |
| | | | | | | | |
| | | | | | | 39,057,188 | |
|
| Personal Products — 0.1% | |
Estee Lauder Cos., Inc., 1.70%, 05/10/21 | | | 400 | | | | 389,037 | |
Unilever Capital Corp., 2.00%, 07/28/26 | | | 800 | | | | 721,228 | |
| | | | | | | | |
| | | | | | | 1,110,265 | |
|
| Pharmaceuticals — 2.1% | |
AbbVie, Inc., 2.50%, 05/14/20 | | | 490 | | | | 485,349 | |
AstraZeneca PLC: | | | | | | | | |
1.95%, 09/18/19 | | | 1,190 | | | | 1,181,433 | |
3.50%, 08/17/23 | | | 1,000 | | | | 994,755 | |
3.13%, 06/12/27 | | | 1,590 | | | | 1,479,015 | |
4.00%, 01/17/29 | | | 2,815 | | | | 2,771,010 | |
Bayer US Finance II LLC, 2.85%, 04/15/25(a) | | | 800 | | | | 725,097 | |
Bristol-Myers Squibb Co., 3.25%, 11/01/23 | | | 400 | | | | 400,830 | |
CVS Health Corp.: | | | | | | | | |
3.35%, 03/09/21 | | | 1,265 | | | | 1,261,388 | |
3.88%, 07/20/25 | | | 800 | | | | 779,600 | |
Elanco Animal Health, Inc., 4.27%, 08/28/23(a) | | | 575 | | | | 574,514 | |
Eli Lilly & Co., 2.75%, 06/01/25 | | | 800 | | | | 770,573 | |
Express Scripts Holding Co., 4.80%, 07/15/46 | | | 800 | | | | 766,937 | |
Johnson & Johnson: | | | | | | | | |
2.95%, 03/03/27 | | | 2,530 | | | | 2,432,746 | |
2.90%, 01/15/28 | | | 400 | | | | 383,378 | |
Merck & Co., Inc.: | | | | | | | | |
1.85%, 02/10/20 | | | 800 | | | | 792,836 | |
2.80%, 05/18/23 | | | 800 | | | | 789,228 | |
2.75%, 02/10/25 | | | 800 | | | | 773,910 | |
Novartis Capital Corp.: | | | | | | | | |
2.40%, 09/21/22 | | | 800 | | | | 781,439 | |
3.10%, 05/17/27 | | | 3,500 | | | | 3,388,942 | |
Pfizer, Inc.: | | | | | | | | |
2.10%, 05/15/19 | | | 800 | | | | 797,905 | |
3.00%, 12/15/26 | | | 1,000 | | | | 965,539 | |
7.20%, 03/15/39 | | | 1,000 | | | | 1,380,905 | |
Takeda Pharmaceutical Co. Ltd., 4.00%, 11/26/21(a) | | | 3,000 | | | | 3,040,917 | |
Zoetis, Inc.: | | | | | | | | |
3.45%, 11/13/20 | | | 355 | | | | 355,979 | |
3.00%, 09/12/27 | | | 1,800 | | | | 1,662,380 | |
3.90%, 08/20/28 | | | 1,030 | | | | 1,009,103 | |
| | | | | | | | |
| | | | | | | 30,745,708 | |
|
| Producer Durables: Miscellaneous — 0.1% | |
Oracle Corp., 2.38%, 01/15/19 | | | 800 | | | | 799,811 | |
| | | | | | | | |
|
| Professional Services — 0.1% | |
IHS Markit Ltd., 4.75%, 08/01/28 | | | 2,060 | | | | 2,017,131 | |
| | | | | | | | |
|
| Road & Rail — 0.4% | |
Burlington Northern Santa Fe LLC, 3.00%, 04/01/25 | | | 800 | | | | 775,123 | |
Canadian National Railway Co., 2.75%, 03/01/26 | | | 800 | | | | 765,098 | |
CSX Corp.: | | | | | | | | |
3.40%, 08/01/24 | | | 800 | | | | 798,968 | |
2.60%, 11/01/26 | | | 800 | | | | 727,838 | |
3.80%, 03/01/28 | | | 800 | | | | 784,890 | |
Union Pacific Corp.: | | | | | | | | |
2.75%, 04/15/23 | | | 1,590 | | | | 1,553,068 | |
| | | | |
| SCHEDULE OF INVESTMENTS | | | 27 | |
| | |
Schedule of Investments (continued) December 31, 2018 | | CoreAlpha Bond Master Portfolio (Percentages shown are based on Net Assets) |
| | | | | | | | |
| Security | | Par
(000) | | | Value | |
|
| Road & Rail (continued) | |
Union Pacific Corp. (continued): | | | | | | | | |
3.25%, 08/15/25 | | $ | 400 | | | $ | 387,513 | |
2.75%, 03/01/26 | | | 800 | | | | 746,138 | |
| | | | | | | | |
| | | | | | | 6,538,636 | |
|
| Semiconductors & Semiconductor Equipment — 1.2% | |
Broadcom Corp./Broadcom Cayman Finance Ltd.: | | | | | | | | |
2.38%, 01/15/20 | | | 1,700 | | | | 1,678,769 | |
3.00%, 01/15/22 | | | 1,700 | | | | 1,634,896 | |
3.63%, 01/15/24 | | | 1,700 | | | | 1,608,371 | |
3.13%, 01/15/25 | | | 1,040 | | | | 938,871 | |
3.88%, 01/15/27 | | | 3,200 | | | | 2,870,735 | |
Intel Corp., 2.88%, 05/11/24 | | | 800 | | | | 780,464 | |
Maxim Integrated Products, Inc., 3.45%, 06/15/27 | | | 1,160 | | | | 1,081,960 | |
NVIDIA Corp., 3.20%, 09/16/26 | | | 1,765 | | | | 1,674,009 | |
QUALCOMM, Inc.: | | | | | | | | |
3.45%, 05/20/25 | | | 800 | | | | 769,706 | |
3.25%, 05/20/27 | | | 3,435 | | | | 3,195,236 | |
Texas Instruments, Inc.: | | | | | | | | |
1.65%, 08/03/19 | | | 800 | | | | 793,541 | |
2.25%, 05/01/23 | | | 800 | | | | 768,782 | |
Xilinx, Inc., 2.95%, 06/01/24 | | | 345 | | | | 329,296 | |
| | | | | | | | |
| | | | | | | 18,124,636 | |
|
| Software — 0.5% | |
Activision Blizzard, Inc., 2.30%, 09/15/21 | | | 200 | | | | 194,779 | |
Autodesk, Inc., 3.50%, 06/15/27 | | | 2,820 | | | | 2,635,847 | |
CDK Global, Inc.: | | | | | | | | |
5.88%, 06/15/26 | | | 175 | | | | 175,709 | |
4.88%, 06/01/27 | | | 185 | | | | 171,587 | |
Citrix Systems, Inc., 4.50%, 12/01/27 | | | 1,300 | | | | 1,242,554 | |
Microsoft Corp.: | | | | | | | | |
3.00%, 10/01/20 | | | 800 | | | | 805,408 | |
2.70%, 02/12/25 | | | 800 | | | | 775,918 | |
Oracle Corp.: | | | | | | | | |
2.95%, 05/15/25 | | | 800 | | | | 765,556 | |
2.65%, 07/15/26 | | | 400 | | | | 370,705 | |
| | | | | | | | |
| | | | | | | 7,138,063 | |
|
| Specialty Retail — 0.1% | |
Home Depot, Inc.: | | | | | | | | |
2.80%, 09/14/27 | | | 800 | | | | 750,861 | |
5.40%, 09/15/40 | | | 200 | | | | 229,047 | |
| | | | | | | | |
| | | | | | | 979,908 | |
|
| Technology Hardware, Storage & Peripherals — 0.4% | |
Apple, Inc., 3.00%, 06/20/27 | | | 925 | | | | 881,466 | |
Dell International LLC/EMC Corp., 3.48%, 06/01/19(a) | | | 300 | | | | 299,113 | |
Hewlett Packard Enterprise Co.: | | | | | | | | |
3.60%, 10/15/20 | | | 1,000 | | | | 1,002,589 | |
3.50%, 10/05/21 | | | 1,165 | | | | 1,168,208 | |
4.90%, 10/15/25 | | | 1,000 | | | | 1,007,863 | |
HP, Inc., 2.75%, 01/14/19 | | | 1,300 | | | | 1,299,671 | |
Seagate HDD Cayman, 4.25%, 03/01/22 | | | 960 | | | | 917,455 | |
| | | | | | | | |
| | | | | | | 6,576,365 | |
|
| Tobacco — 0.4% | |
Altria Group, Inc.: | | | | | | | | |
2.63%, 09/16/26 | | | 2,000 | | | | 1,747,083 | |
5.38%, 01/31/44 | | | 535 | | | | 498,870 | |
3.88%, 09/16/46 | | | 500 | | | | 380,858 | |
BAT Capital Corp.: | | | | | | | | |
2.30%, 08/14/20 | | | 1,205 | | | | 1,176,849 | |
2.76%, 08/15/22 | | | 1,070 | | | | 1,010,636 | |
Reynolds American, Inc.: | | | | | | | | |
3.25%, 06/12/20 | | | 127 | | | | 126,220 | |
| | | | | | | | |
| Security | | Par
(000) | | | Value | |
|
| Tobacco (continued) | |
Reynolds American, Inc. (continued): | | | | | | | | |
4.00%, 06/12/22 | | $ | 305 | | | $ | 301,712 | |
| | | | | | | | |
| | | | | | | 5,242,228 | |
|
| Wireless Telecommunication Services — 0.4% | |
EPR Properties, 4.95%, 04/15/28 | | | 3,500 | | | | 3,463,277 | |
Sprint Spectrum Co. LLC/Sprint Spectrum Co. II LLC/Sprint Spectrum Co. III LLC(a): | | | | | | | | |
3.36%, 03/20/23 | | | 1,141 | | | | 1,126,985 | |
4.74%, 09/20/29 | | | 1,200 | | | | 1,177,500 | |
| | | | | | | | |
| | | | | | | 5,767,762 | |
| | | | | | | | |
| |
Total Corporate Bonds — 40.5%
(Cost — $614,608,883) | | | | 601,613,242 | |
| | | | | |
|
Foreign Agency Obligations — 0.4% | |
Indonesia Government International Bond, 3.50%, 01/11/28 | | | 1,600 | | | | 1,476,000 | |
Mexico Government International Bond: | | | | | | | | |
3.50%, 01/21/21 | | | 865 | | | | 858,729 | |
4.15%, 03/28/27 | | | 2,325 | | | | 2,240,719 | |
6.75%, 09/27/34 | | | 720 | | | | 820,800 | |
Uruguay Government International Bond, 5.10%, 06/18/50 | | | 500 | | | | 492,375 | |
| | | | | | | | |
| |
Total Foreign Agency Obligations — 0.4%
(Cost — $6,155,800) | | | | 5,888,623 | |
| | | | | |
| | |
| | | Shares | | | | |
|
Investment Companies — 1.9% | |
iShares iBoxx USD High Yield Corporate Bond ETF(f)(j) | | | 350,000 | | | | 28,385,000 | |
| | | | | | | | |
| |
Total Investment Companies — 1.9%
(Cost — $30,458,256) | | | | 28,385,000 | |
| | | | | |
| | |
| | | Par
(000) | | | | |
|
Municipal Bonds — 0.2% | |
Metropolitan Transportation Authority, RB, Build America Bonds, Series E, 6.81%, 11/15/40 | | $ | 355 | | | | 471,536 | |
Port Authority of New York & New Jersey, RB, 4.03%, 09/01/48 | | | 1,000 | | | | 999,400 | |
State of California, GO, Build America Bonds, Various Purpose, 7.55%, 04/01/39 | | | 1,000 | | | | 1,432,550 | |
State of California, GO, Refunding, 3.50%, 04/01/28 | | | 500 | | | | 499,185 | |
| | | | | | | | |
| |
Total Municipal Bonds — 0.2%
(Cost — $3,597,378) | | | | 3,402,671 | |
| | | | | |
|
Non-Agency Mortgage-Backed Securities — 4.3% | |
|
Collateralized Mortgage Obligations — 2.8% | |
Citicorp Mortgage Securities Trust, Series2006-1, Class 2A1, 5.00%, 02/25/21 | | | 8 | | | | 8,368 | |
Citigroup Mortgage Loan Trust, Series2014-A, Class A, 4.00%, 01/25/35(a)(c) | | | 109 | | | | 111,189 | |
Freddie Mac Structured Agency Credit Risk Debt Notes: | | | | | | | | |
Series 2016-DNA1, Class M2,
(1 mo. LIBOR US + 2.90%), 5.41%, 07/25/28(b) | | | 335 | | | | 340,566 | |
Series 2017-HQA2, Class M1,
(1 mo. LIBOR US + 0.80%), 3.31%, 12/25/29(b) | | | 1,443 | | | | 1,442,129 | |
Series 2017-HQA3, Class M1, 3.06%, 04/25/30(c) | | | 1,207 | | | | 1,204,889 | |
Series2014-DN2, Class M2,
(1 mo. LIBOR US + 1.65%), 4.16%, 04/25/24(b) | | | 1,008 | | | | 1,015,385 | |
| | |
| 28 | | 2018 BLACKROCK ANNUAL REPORTTO SHAREHOLDERS |
| | |
Schedule of Investments (continued) December 31, 2018 | | CoreAlpha Bond Master Portfolio (Percentages shown are based on Net Assets) |
| | | | | | | | |
| | |
| | | Par
(000) | | | | |
| | |
| Collateralized Mortgage Obligations (continued) | | | | | | |
Freddie Mac Structured Agency Credit Risk Debt Notes (continued): | | | | | | | | |
Series 2014-HQ1, Classs M2,
(1mo. LIBOR US + 2.50%), 5.01%, 08/25/24(b) | | $ | 56 | | | $ | 56,344 | |
Series 2015-DN1, Class M3,
(1 mo. LIBOR US + 4.15%), 6.66%, 01/25/25(b) | | | 1,789 | | | | 1,900,248 | |
Series 2015-DNA1, Class M2,
(1 mo. LIBOR US + 1.85%), 4.36%, 10/25/27(b) | | | 9,026 | | | | 9,137,375 | |
Series2015-HQ1, Class M3,
(1 mo. LIBOR US + 3.80%), 6.31%, 03/25/25(b) | | | 860 | | | | 905,920 | |
Series 2015-HQA1, Class M2,
(1 mo. LIBOR US + 2.65%), 5.16%, 03/25/28(b) | | | 1,210 | | | | 1,224,865 | |
Series 2016-HQA3, Class M1,
(1 mo. LIBOR US + 0.80%), 3.31%, 03/25/29(b) | | | 161 | | | | 161,242 | |
Series 2017-DNA1, Class M1,
(1 mo. LIBOR US + 1.20%), 3.71%, 07/25/29(b) | | | 3,172 | | | | 3,186,578 | |
Series 2017-DNA2, Class M1,
(1 mo. LIBOR US + 1.20%), 3.71%, 10/25/29(b) | | | 1,437 | | | | 1,444,960 | |
Series 2017-DNA3, Class M1, 3.26%, 03/25/30(c) | | | 1,532 | | | | 1,527,765 | |
RALI Trust, Series2004-QS9, Class A1, 5.00%, 06/25/19 | | | 4 | | | | 4,305 | |
STACR Trust(a)(c): | | | | | | | | |
Series 2018-DNA3, Class M1, 3.26%, 09/25/48 | | | 2,950 | | | | 2,944,314 | |
Series 2018-HRP1, Class M2, 4.16%, 04/25/43 | | | 10,575 | | | | 10,587,275 | |
Series 2018-HRP2, Class M2, 3.76%, 02/25/47 | | | 2,390 | | | | 2,390,735 | |
Wells Fargo Commercial Mortgage Trust, Class A5: | | | | | | | | |
Series 2014-LC16, 3.82%, 08/15/50 | | | 1,210 | | | | 1,232,743 | |
Series2018-C44, 4.21%, 05/15/51 | | | 780 | | | | 805,246 | |
| | | | | | | | |
| | | | | | | 41,632,441 | |
|
| Commercial Mortgage-Backed Securities — 1.5% | |
Banc of America Commercial Mortgage Trust, Series 2015-UBS7, Class B, 4.36%, 09/15/48(c) | | | 360 | | | | 359,294 | |
Citigroup Commercial Mortgage Trust: | | | | | | | | |
Series 2015-GC35, Class A4, 3.82%, 11/10/48 | | | 870 | | | | 883,570 | |
Series 2016-GC36, Class A5, 3.62%, 02/10/49 | | | 550 | | | | 551,127 | |
Commercial Mortgage Trust: | | | | | | | | |
Series 2013-CR11, Class B, 5.16%, 08/10/50(c) | | | 380 | | | | 397,290 | |
Series2013-LC6, Class AM, 3.28%, 01/10/46 | | | 400 | | | | 397,662 | |
Series 2014-CR17, Class A5, 3.98%, 05/10/47 | | | 670 | | | | 689,578 | |
CSAIL Commercial Mortgage Trust, Series 2017-CX10, Class A5, 3.46%, 11/15/50(c) | | | 800 | | | | 783,528 | |
DBJPM Mortgage Trust, Series2016-C1, Class B, 4.20%, 05/10/49(c) | | | 330 | | | | 328,260 | |
GS Mortgage Securities Corp. II, Series 2015-GC30, Class B, 4.01%, 05/10/50(c) | | | 300 | | | | 299,991 | |
GS Mortgage Securities Trust: | | | | | | | | |
Series 2012-GCJ7, Class AS, 4.09%, 05/10/45 | | | 280 | | | | 287,125 | |
Series 2013-GC13, Class A5, 4.05%, 07/10/46(c) | | | 170 | | | | 176,321 | |
Series 2013-GC16, Class A3, 4.24%, 11/10/46 | | | 449 | | | | 466,450 | |
Series 2014-GC20, Class A5, 4.00%, 04/10/47 | | | 730 | | | | 753,180 | |
JPMBB Commercial Mortgage Securities Trust: | | | | | | | | |
Series2013-C14, Class A4, 4.13%, 08/15/46(c) | | | 430 | | | | 443,315 | |
Series2013-C14, Class AS, 4.41%, 08/15/46(c) | | | 240 | | | | 246,718 | |
Series2013-C17, Class A4, 4.20%, 01/15/47 | | | 750 | | | | 776,952 | |
Series2014-C19, Class A4, 4.00%, 04/15/47 | | | 1,320 | | | | 1,355,105 | |
Series2014-C22, Class A4, 3.80%, 09/15/47 | | | 1,270 | | | | 1,290,908 | |
Series2015-C30, Class A5, 3.82%, 07/15/48 | | | 1,780 | | | | 1,813,084 | |
Series2016-C1, Class A5, 3.58%, 03/15/49 | | | 810 | | | | 810,718 | |
JPMorgan Chase Commercial Mortgage Securities Trust: | | | | | | | | |
Series2011-C5, Class A3, 4.17%, 08/15/46 | | | 227 | | | | 231,689 | |
Series2012-CBX, Class AS, 4.27%, 06/15/45 | | | 350 | | | | 357,164 | |
Series2016-JP3, Class A4, 2.63%, 08/15/49 | | | 1,190 | | | | 1,116,223 | |
| | | | | | | | |
| | |
| | | Par
(000) | | | | |
|
| Commercial Mortgage-Backed Securities (continued) | |
Morgan Stanley Bank of America Merrill Lynch Trust, Class A4: | | | | | | | | |
Series2013-C10, 4.08%, 07/15/46(c) | | $ | 470 | | | $ | 485,339 | |
Series2013-C13, 4.04%, 11/15/46 | | | 460 | | | | 473,717 | |
Series2015-C20, 3.25%, 02/15/48 | | | 1,040 | | | | 1,025,190 | |
Series2015-C27, 3.75%, 12/15/47 | | | 1,030 | | | | 1,042,123 | |
Morgan Stanley Capital I Trust, Class A4: | | | | | | | | |
Series2012-C4, 3.24%, 03/15/45 | | | 680 | | | | 678,472 | |
Series2015-MS1, 3.78%, 05/15/48(c) | | | 550 | | | | 558,153 | |
UBS-Barclays Commercial Mortgage Trust,Series 2012-C4, Class A5, 2.85%, 12/10/45 | | | 505 | | | | 499,377 | |
Wells Fargo Commercial Mortgage Trust,Series 2014-LC18, Class AS, 3.81%, 12/15/47 | | | 510 | | | | 507,926 | |
WF-RBS Commercial Mortgage Trust: | | | | | | | | |
Series2012-C08, Class AS, 3.66%, 08/15/45 | | | 640 | | | | 645,493 | |
Series2012-C10, Class AS, 3.24%, 12/15/45 | | | 460 | | | | 453,751 | |
Series2013-C18, Class A5, 4.16%, 12/15/46(c) | | | 570 | | | | 591,080 | |
Series2014-C23, Class A4, 3.65%, 10/15/57 | | | 330 | | | | 333,772 | |
| | | | | | | | |
| | | | | | | 22,109,645 | |
| | | | | | | | |
| |
TotalNon-Agency Mortgage-Backed Securities — 4.3%
(Cost — $84,124,781) | | | | 63,742,086 | |
| | | | | |
|
U.S. Government Sponsored Agency Securities — 41.6% | |
|
Agency Obligations — 0.2% | |
Federal Home Loan Bank, 3.25%, 11/16/28 | | | 1,530 | | | | 1,555,811 | |
| | | | | | | | |
|
| Collateralized Mortgage Obligations — 2.7% | |
Fannie Mae Connecticut Avenue Securities: | | | | | | | | |
Series2018-C06, Class 1M1, 3.06%, 03/25/31(c) | | | 1,466 | | | | 1,461,836 | |
Series2018-C06, Class 2M1, 3.06%, 03/25/31(c) | | | 1,271 | | | | 1,267,245 | |
Series2014-C01, Class M1,
(1 mo. LIBOR US + 1.60%), 4.11%, 01/25/24(b) | | | 128 | | | | 127,902 | |
Series2014-C02, Class 1M1,
(1 mo. LIBOR US + 0.95%), 3.46%, 05/25/24(b) | | | 214 | | | | 214,541 | |
Series2016-C02, Class 1M1,
(1 mo. LIBOR US + 2.15%), 4.66%, 09/25/28(b) | | | 106 | | | | 105,780 | |
Series2016-C05, Class 2M2F,
(1 mo. LIBOR US + 2.75%), 5.26%, 01/25/29(b) | | | 8,004 | | | | 8,180,464 | |
Series2016-C07, Class 2M1,
(1 mo. LIBOR US + 1.30%), 3.81%, 05/25/29(b) | | | 383 | | | | 383,557 | |
Series2017-C02, Class 1M1,
(1 mo. LIBOR US + 1.15%), 3.66%, 09/25/29(a)(b) | | | 1,326 | | | | 1,328,780 | |
Series2017-C04, Class 2M1,
(1 mo. LIBOR US + 0.85%), 3.36%, 11/25/29(b) | | | 1,751 | | | | 1,751,320 | |
Series2017-C05, Class 1M1,
(1 mo. LIBOR US + 0.55%), 3.06%, 01/25/30(b) | | | 1,865 | | | | 1,862,056 | |
Series2017-C06, Class 1M1, 3.26%, 02/25/30(c) | | | 508 | | | | 507,437 | |
Series2017-C06, Class 2M1, 3.26%, 02/25/30(c) | | | 269 | | | | 268,851 | |
Series2017-C07, Class 2M1, 3.16%, 05/25/30(c) | | | 2,327 | | | | 2,322,722 | |
Series2018-C02, Class 2M1, 3.16%, 08/25/30(c) | | | 2,210 | | | | 2,207,365 | |
Series2018-C03, Class 1M1, 3.19%, 10/25/30(c) | | | 2,125 | | | | 2,119,262 | |
Series2017-C01, Class 1M1,
(1 mo. LIBOR US + 1.30%), 3.81%, 07/25/29(b) | | | 954 | | | | 956,707 | |
Series2016-C05, Class 2M1,
(1 mo. LIBOR US + 1.35%), 3.86%, 01/25/29(b) | | | 395 | | | | 395,864 | |
Series2016-C04, Class 1M1,
(1 mo. LIBOR US + 1.45%), 3.96%, 01/25/29(b) | | | 1,557 | | | | 1,562,688 | |
Series2017-C05, Class 1M2A,
(1 mo. LIBOR US + 2.20%), 4.71%, 01/25/30(b) | | | 2,853 | | | | 2,892,432 | |
Series2017-C07, Class 2M2A, 5.01%, 05/25/30(c) | | | 1,225 | | | | 1,257,039 | |
Series2014-C02, Class 2M2,
(1 mo. LIBOR US + 2.60%), 5.11%, 05/25/24(b) | | | 1,832 | | | | 1,897,276 | |
| | | | |
| SCHEDULE OF INVESTMENTS | | | 29 | |
| | |
Schedule of Investments (continued) December 31, 2018 | | CoreAlpha Bond Master Portfolio (Percentages shown are based on Net Assets) |
| | | | | | | | |
| | |
| | | Par
(000) | | | | |
|
| Collateralized Mortgage Obligations (continued) | |
Fannie Mae Connecticut Avenue Securities (continued): | | | | | | | | |
Series2014-C03, Class 2M2,
(1 mo. LIBOR US + 2.90%), 5.41%, 07/25/24(b) | | $ | 1,666 | | | $ | 1,742,679 | |
Series2017-C01, Class 1M2A,
(1 mo. LIBOR US + 3.55%), 6.06%, 07/25/29(b) | | | 2,570 | | | | 2,693,519 | |
Series2014-C01, Class M2,
(1 mo. LIBOR US + 4.40%), 6.91%, 01/25/24(b) | | | 1,090 | | | | 1,204,983 | |
Series2016-C05, Class 2M2,
(1 mo. LIBOR US + 4.45%), 6.96%, 01/25/29(b) | | | 490 | | | | 534,651 | |
Series2014-C04, Class 1M2,
(1 mo. LIBOR US + 4.90%), 7.41%, 11/25/24(b) | | | 941 | | | | 1,050,687 | |
| | | | | | | | |
| | | | | | | 40,297,643 | |
|
| Commercial Mortgage-Backed Securities — 4.9% | |
Fannie Mae, Class A2: | | | | | | | | |
Series2012-M13, 2.38%, 05/25/22 | | | 3,980 | | | | 3,911,537 | |
Series2016-M13, 2.48%, 09/25/26(c) | | | 800 | | | | 757,900 | |
Series2012-M9, 2.48%, 04/25/22 | | | 6,381 | | | | 6,318,930 | |
Series2013-M3, 2.51%, 11/25/22(c) | | | 4,780 | | | | 4,706,699 | |
Series2017-M4, 2.60%, 12/25/26(c) | | | 6,650 | | | | 6,325,888 | |
Series2012-M5, 2.72%, 02/25/22 | | | 2,665 | | | | 2,648,800 | |
Series2017-M2, 2.78%, 02/25/27(c) | | | 1,990 | | | | 1,920,292 | |
Series2018-M1, 2.99%, 12/25/27(c) | | | 1,590 | | | | 1,555,141 | |
Series2018-M7, 3.05%, 03/25/28(c) | | | 1,590 | | | | 1,546,903 | |
Freddie Mac: | | | | | | | | |
Series K020, 2.37%, 05/25/22 | | | 7,960 | | | | 7,843,207 | |
Series K055, 2.67%, 03/25/26 | | | 1,590 | | | | 1,540,895 | |
Series K725, 3.00%, 01/25/24 | | | 5,570 | | | | 5,574,560 | |
Series K724, 3.06%, 11/25/23(c) | | | 400 | | | | 401,529 | |
Series K069, 3.19%, 09/25/27(c) | | | 2,390 | | | | 2,367,008 | |
Series K064, 3.22%, 03/25/27 | | | 2,790 | | | | 2,783,556 | |
Series K068, 3.24%, 08/25/27 | | | 1,590 | | | | 1,583,233 | |
Series K071, 3.29%, 11/25/27 | | | 1,590 | | | | 1,584,766 | |
Series K031, 3.30%, 04/25/23(c) | | | 281 | | | | 285,159 | |
Series K060, 3.30%, 10/25/26 | | | 1,190 | | | | 1,194,098 | |
Series K070, 3.30%, 11/25/27(c) | | | 800 | | | | 798,542 | |
Series K061, 3.35%, 11/25/26(c) | | | 1,590 | | | | 1,600,524 | |
Series K073, 3.35%, 01/25/28 | | | 1,610 | | | | 1,612,146 | |
Series K072, 3.44%, 12/25/27 | | | 1,190 | | | | 1,200,290 | |
Series K076, 3.90%, 06/25/51 | | | 2,390 | | | | 2,493,403 | |
Freddie Mac Multifamily Structured Pass-Through Certificates, Class A2: | | | | | | | | |
Series K056, 2.53%, 05/25/26 | | | 1,480 | | | | 1,418,252 | |
Series K025, 2.68%, 10/25/22 | | | 3,980 | | | | 3,950,542 | |
Series K062, 3.41%, 12/25/26 | | | 4,820 | | | | 4,873,342 | |
| | | | | | | | |
| | | | | | | 72,797,142 | |
|
| Mortgage-Backed Securities — 33.8% | |
Fannie Mae Mortgage-Backed Securities: | | | | | | | | |
(12 mo. LIBOR US + 1.54%), 2.05%, 06/01/43(b) | | | 172 | | | | 170,321 | |
2.50%, 09/01/28 - 01/01/49(g) | | | 556 | | | | 528,419 | |
(12 mo. LIBOR US + 1.77%), 2.93%, 01/01/42(b) | | | 60 | | | | 62,584 | |
3.00%, 12/01/26 - 01/01/49(g) | | | 11,898 | | | | 11,709,540 | |
3.50%, 11/01/31 - 11/01/51(g) | | | 61,700 | | | | 61,835,706 | |
(12 mo. LIBOR US + 1.81%), 3.79%, 02/01/42(b) | | | 7 | | | | 6,949 | |
(12 mo. LIBOR US + 1.53%), 3.91%, 04/01/43(b) | | | 17 | | | | 17,997 | |
4.00%, 06/01/24 - 01/01/49(g) | | | 104,948 | | | | 107,165,672 | |
(12 mo. LIBOR US + 1.53%), 4.03%, 05/01/43(b) | | | 67 | | | | 69,129 | |
(12 mo. LIBOR US + 1.73%), 4.03%, 04/01/40(b) | | | 15 | | | | 15,212 | |
4.50%, 12/01/19 - 01/01/49(g) | | | 36,686 | | | | 38,118,649 | |
(12 mo. LIBOR US + 1.75%), 4.50%, 08/01/41(b) | | | 72 | | | | 74,238 | |
(12 mo. LIBOR US + 1.83%), 4.58%, 09/01/41(b) | | | 65 | | | | 67,542 | |
4.00%, 09/01/47 | | | 1,496 | | | | 1,532,299 | |
5.00%, 06/01/19 - 01/01/49(g) | | | 14,773 | | | | 15,508,526 | |
| | | | | | | | |
| Security | | Par
(000) | | | Value | |
|
| Mortgage-Backed Securities (continued) | |
Fannie Mae Mortgage-Backed Securities (continued): | | | | | | | | |
5.50%, 09/01/19 - 01/01/47 | | $ | 3,609 | | | $ | 3,877,779 | |
6.00%, 11/01/22 - 08/01/38 | | | 985 | | | | 1,068,925 | |
6.50%, 12/01/30 - 12/01/32 | | | 1,053 | | | | 1,174,881 | |
7.00%, 01/01/32 - 06/01/32 | | | 28 | | | | 32,443 | |
7.50%, 09/01/29 | | | 9 | | | | 10,152 | |
Freddie Mac Mortgage-Backed Securities: | | | | | | | | |
(12 mo. LIBOR US + 1.65%), 2.45%, 05/01/43(b) | | | 133 | | | | 131,550 | |
2.50%, 02/01/27 - 01/01/34 | | | 1,472 | | | | 1,454,855 | |
(12 mo. LIBOR US + 1.60%), 2.52%, 08/01/43(b) | | | 51 | | | | 51,015 | |
3.00%, 05/01/27 - 06/01/47 | | | 4,680 | | | | 4,632,087 | |
3.50%, 04/01/26 - 01/01/49(g) | | | 30,306 | | | | 30,352,018 | |
(12 mo. LIBOR US + 1.75%), 3.72%, 02/01/40(b) | | | 106 | | | | 110,862 | |
(12 mo. LIBOR US + 1.90%), 3.91%, 01/01/42(b) | | | 3 | | | | 3,355 | |
4.00%, 10/01/24 - 01/01/49(g) | | | 55,227 | | | | 56,326,064 | |
(12 mo. LIBOR US + 1.50%), 4.06%, 06/01/43(b) | | | 23 | | | | 23,639 | |
(12 mo. LIBOR US + 1.75%), 4.10%, 04/01/38(b) | | | 159 | | | | 166,798 | |
(12 mo. LIBOR US + 1.80%), 4.43%, 08/01/41(b) | | | 60 | | | | 61,979 | |
4.50%, 03/01/19 - 01/01/49(g) | | | 29,412 | | | | 30,480,754 | |
(12 mo. LIBOR US + 1.89%), 4.61%, 07/01/41(b) | | | 53 | | | | 55,165 | |
5.00%, 01/01/19 - 01/01/49(g) | | | 11,833 | | | | 12,401,995 | |
5.50%, 07/01/20 - 01/01/49(g) | | | 1,247 | | | | 1,334,020 | |
6.00%, 07/01/21 - 01/01/38 | | | 479 | | | | 518,262 | |
6.50%, 05/01/21 - 08/01/36 | | | 402 | | | | 452,712 | |
7.50%, 12/01/30 | | | 1 | | | | 771 | |
Ginnie Mae Mortgage-Backed Securities: | | | | | | | | |
3.50%, 01/15/41 - 01/15/49(g) | | | 41,345 | | | | 41,646,172 | |
3.00%, 01/15/43 - 01/15/49(g) | | | 3,849 | | | | 3,800,450 | |
4.00%, 09/15/40 - 01/15/49(g) | | | 28,397 | | | | 29,120,816 | |
4.50%, 03/15/39 - 01/15/49(g) | | | 33,412 | | | | 34,622,246 | |
5.00%, 11/15/33 - 01/15/49(g) | | | 10,310 | | | | 10,788,402 | |
5.50%, 06/15/34 - 04/15/48 | | | 981 | | | | 1,046,148 | |
6.00%, 01/15/32 - 10/15/38 | | | 295 | | | | 318,248 | |
6.50%, 06/15/28 - 03/15/29 | | | 32 | | | | 35,358 | |
7.00%, 06/15/29 | | | 14 | | | | 13,953 | |
7.50%, 08/15/30 | | | 4 | | | | 5,293 | |
| | | | | | | | |
| | | | | | | 503,001,950 | |
| | | | | | | | |
| |
Total U.S. Government Sponsored Agency Securities — 41.6%
(Cost — $597,835,918) | | | | 617,652,546 | |
| | | | | | | | |
|
U.S. Treasury Obligations — 4.2% | |
U.S. Treasury Notes: | | | | | | | | |
1.63%, 04/30/19 | | | 3,980 | | | | 3,968,806 | |
1.63%, 06/30/20 | | | 3,980 | | | | 3,926,208 | |
2.63%, 08/15/20 | | | 3,980 | | | | 3,985,597 | |
1.38%, 04/30/21 | | | 3,980 | | | | 3,881,744 | |
1.63%, 04/30/23 | | | 2,390 | | | | 2,304,576 | |
1.63%, 10/31/23 | | | 1,990 | | | | 1,910,011 | |
2.00%, 05/31/24 | | | 3,980 | | | | 3,872,416 | |
2.38%, 08/15/24 | | | 7,960 | | | | 7,886,930 | |
2.25%, 11/15/24 | | | 3,980 | | | | 3,911,438 | |
2.00%, 02/15/25 | | | 7,960 | | | | 7,699,745 | |
6.88%, 08/15/25 | | | 3,180 | | | | 4,004,688 | |
2.25%, 11/15/25 | | | 7,960 | | | | 7,784,320 | |
2.25%, 02/15/27 | | | 4,780 | | | | 4,641,455 | |
2.38%, 05/15/27 | | | 2,390 | | | | 2,339,960 | |
| | | | | | | | |
| |
Total U.S. Treasury Obligations — 4.2%
(Cost — $63,483,350) | | | | 62,117,894 | |
| | | | | | | | |
| |
Total Long-Term Investments — 107.8%
(Cost — $1,618,216,880) | | | | 1,600,676,526 | |
| | | | | | | | |
| | |
| 30 | | 2018 BLACKROCK ANNUAL REPORTTO SHAREHOLDERS |
| | |
Schedule of Investments (continued) December 31, 2018 | | CoreAlpha Bond Master Portfolio (Percentages shown are based on Net Assets) |
| | | | | | | | |
| Security | |
Shares | | | Value | |
|
Short-Term Securities — 7.9% | |
BlackRock Cash Funds: Institutional,
SL Agency Shares, | | | | | | | | |
2.58%(h)(i)(j) | | | 117,660,556 | | | $ | 117,672,322 | |
BlackRock Cash Funds: Treasury,
SL Agency Shares, | | | | | | | | |
2.38%(i)(j) | | | 100,000 | | | | 100,000 | |
| | | | | | | | |
| |
Total Short-Term Securities — 7.9%
(Cost — $117,772,321) | | | | 117,772,322 | |
| | | | | |
| |
Total Investments Before TBA Sale Commitments — 115.7%
(Cost — $1,735,989,201) | | | | 1,718,448,848 | |
| | | | | |
| | |
| | | Par
(000) | | | | |
|
TBA Sale Commitments — (0.7%) | |
|
Mortgage-Backed Securities — (0.7%) | |
Fannie Mae Mortgage-Backed Securities(g): | | | | | | | | |
2.50%, 01/01/49 | | USD | 375 | | | | (354,053 | ) |
3.00%, 01/01/34 | | | 3,322 | | | | (3,314,031 | ) |
3.50%, 01/01/34 | | | 625 | | | | (632,507 | ) |
4.50%, 01/01/49 | | | 728 | | | | (753,835 | ) |
5.50%, 01/01/49 | | | 125 | | | | (132,266 | ) |
Freddie Mac Mortgage-Backed Securities(g): | | | | | | | | |
3.00%, 01/01/34 | | | 99 | | | | (98,650 | ) |
3.50%, 01/01/34 | | | 1,025 | | | | (1,037,953 | ) |
| | | | | | | | |
| Security | | Par
(000) | | | Value | |
|
Mortgage-Backed Securities (continued) | |
Ginnie Mae Mortgage-Backed Securities(g): | | | | | | | | |
2.50%, 01/15/49 | | USD | 100 | | | $ | (95,773 | ) |
4.50%, 01/15/49 | | | 2,932 | | | | (3,033,876 | ) |
5.50%, 01/15/49 | | | 675 | | | | (706,245 | ) |
| | | | | | | | |
| |
Total TBA Sale Commitments — (0.7)%
(Proceeds — $10,112,334) | | | | (10,159,189 | ) |
| | | | | | | | |
| |
Total Investments, Net of TBA Sale Commitments — 115.0%
(Cost — $1,725,876,867) | | | | 1,708,289,659 | |
| |
Liabilities in Excess of Other Assets — (15.0)% | | | | (222,600,851 | ) |
| | | | | | | | |
| |
Net Assets — 100.0% | | | $ | 1,485,688,808 | |
| | | | | | | | |
| (a) | Security exempt from registration pursuant to Rule 144A under the Securities Act of 1933, as amended. These securities may be resold in transactions exempt from registration to qualified institutional investors. |
| (b) | Variable rate security. Rate shown is the rate in effect as of period end. |
| (c) | Variable or floating rate security, which interest rate adjusts periodically based on changes in current interest rates and prepayments on the underlying pool of assets. Rate shown is the rate in effect as of period end. |
| (d) | Variable rate security. Security may be issued at a fixed coupon rate, which converts to a variable rate at a specified date. Rate shown is the rate in effect as of period end. |
| (e) | Step-up bond that pays an initial coupon rate for the first period and then a higher coupon rate for the following periods. Rate as of period end. |
| (f) | Security, or a portion of the security, is on loan. |
| (g) | Represents or includes a TBA transaction. |
| (h) | All or a portion of security was purchased with the cash collateral from loaned securities. |
| (i) | Annualized7-day yield as of period end. |
| (j) | During the year ended December 31, 2018, investments in issuers considered to be affiliates of the Master Portfolio for purposes of Section 2(a)(3) of the Investment Company Act of 1940, as amended, and/or related parties of the Master Portfolio were as follows: |
| | | | | | | | | | | | | | | | | | | | | | | | | | | | | | | | |
| Affiliate Persons and/or Related Parties | | Shares
Held at
12/31/17 | | | Shares
Purchased | | | Shares
Sold | | | Shares
Held at
12/31/18 | | | Value at
12/31/18 | | | Income | | | Net
Realized
Gain (Loss) (a) | | | Change in
Unrealized
Appreciation
(Depreciation) | |
BlackRock Cash Funds: Institutional, SL Agency Shares | | | 79,196,030 | | | | 38,464,526 | (b) | | | — | | | | 117,660,556 | | | $ | 117,672,322 | | | $ | 1,689,645 | (c) | | $ | 194 | | | $ | 3,819 | |
BlackRock Cash Funds: Treasury, SL Agency Shares | | | 100,000 | | | | — | | | | — | | | | 100,000 | | | | 100,000 | | | | 1,780 | | | | — | | | | — | |
iShares iBoxx USD High Yield Corporate Bond ETF | | | 300,000 | | | | 50,000 | | | | — | | | | 350,000 | | | | 28,385,000 | | | | 1,427,047 | | | | — | | | | (2,105,350 | ) |
| | | | | | | | | | | | | | | | | | | | | | | | | | | | | | | | |
| | | $ | 146,157,322 | | | $ | 3,118,472 | | | $ | 194 | | | $ | (2,101,531 | ) |
| | | | | | | | | | | | | | | | | |
| | (a) | Includes net capital gain distributions, if applicable. | |
| | (b) | Represents net shares purchased. | |
| | (c) | All or a portion represents securities lending income earned from the reinvestment of cash collateral from loaned securities, net of fees and collateral investment expenses, and other payments to and from borrowers of securities. | |
| | | | |
| SCHEDULE OF INVESTMENTS | | | 31 | |
| | |
Schedule of Investments (continued) December 31, 2018 | | CoreAlpha Bond Master Portfolio |
Derivative Financial Instruments Outstanding as of Period End
Futures Contracts
| | | | | | | | | | | | | | | | |
| Description | | Number of
Contracts | | | Expiration
Date | | | Notional
Amount (000) | | | Value/
Unrealized
Appreciation
(Depreciation) | |
Long Contracts: | | | | | | | | | | | | | | | | |
Euro OAT | | | 197 | | | | 03/07/19 | | | $ | 34,037 | | | $ | (7,567 | ) |
10-Year Australian Treasury Bond | | | 561 | | | | 03/15/19 | | | | 52,425 | | | | 556,460 | |
10-Year U.S. Treasury Note | | | 105 | | | | 03/20/19 | | | | 12,812 | | | | 102,919 | |
Long U.S. Treasury Bond | | | 354 | | | | 03/20/19 | | | | 51,684 | | | | 2,344,856 | |
U.S. Ultra Bond | | | 827 | | | | 03/20/19 | | | | 132,863 | | | | 6,909,665 | |
Long Gilt | | | 110 | | | | 03/27/19 | | | | 17,269 | | | | 159,721 | |
2-Year U.S. Treasury Note | | | 125 | | | | 03/29/19 | | | | 26,539 | | | | 180,995 | |
5-Year U.S. Treasury Note | | | 230 | | | | 03/29/19 | | | | 26,378 | | | | 392,062 | |
| | | | | | | | | | | | | | | | |
| | | | | | | | | | | | | | | 10,639,111 | |
| | | | | | | | | | | | | | | | |
Short Contracts: | | | | | | | | | | | | | | | | |
Euro BTP | | | 7 | | | | 03/07/19 | | | | 1,025 | | | | (35,456 | ) |
Euro Bund | | | 165 | | | | 03/07/19 | | | | 30,917 | | | | (125,398 | ) |
10-Year Canada Bond | | | 560 | | | | 03/20/19 | | | | 56,103 | | | | (1,721,316 | ) |
10-Year U.S. Ultra Long Treasury | | | 318 | | | | 03/20/19 | | | | 41,365 | | | | (1,310,798 | ) |
| | | | | | | | | | | | | | | | |
| | | | | | | | | | | | | | | (3,192,968 | ) |
| | | | | | | | | | | | | | | | |
| | | | | | | | | | | | | | $ | 7,446,143 | |
| | | | | | | | | | | | | | | | |
Centrally Cleared Credit Default Swaps — Sell Protection
| | | | | | | | | | | | | | | | | | | | | | | | | | | | | | | | | | | | |
| Reference Obligation/Index | | Financing Rate
Received by the
Master Portfolio | | | Payment
Frequency | | | Termination
Date | | | Credit
Rating (a) | | | Notional Amount (000) (b) | | | Value | | | Upfront
Premium
Paid
(Received) | | | Unrealized
Appreciation
(Depreciation) | |
CDX.NA.HY.31.V1 | | | 5.00% | | | | Quarterly | | | | 12/20/23 | | | | B+ | | | | USD | | | | 33,420 | | | $ | 726,503 | | | $ | 1,680,721 | | | $ | (954,218 | ) |
iTraxx XO, Series 30, Version 2 | | | 5.00 | | | | Quarterly | | | | 12/20/23 | | | | B+ | | | | EUR | | | | 28,633 | | | | 2,141,932 | | | | 2,873,554 | | | | (731,622 | ) |
| | | | | | | | | | | | | | | | | | | | | | | | | | | | | | | | | | | | |
| | | | | | | | | | | | | | | | | | | | | | | | | | $ | 2,868,435 | | | $ | 4,554,275 | | | $ | (1,685,840 | ) |
| | | | | | | | | | | | | | | | | | | | | | | | | | | | | | | | | | | | |
| | (a) | Using S&P’s rating of the issuer or the underlying securities of the index, as applicable. | |
| | (b) | The maximum potential amount the Master Portfolio may pay should a negative credit event take place as defined under the terms of the agreement. | |
Centrally Cleared Interest Rate Swaps
| | | | | | | | | | | | | | | | | | | | | | | | | | | | | | | | |
| Paid by the Master Portfolio | | Received by the Master Portfolio | | Effective
Date | | | Termination
Date | | | Notional
Amount (000) | | | Value | | | Upfront
Premium
Paid
(Received) | | | Unrealized
Appreciation
(Depreciation) | |
| Rate | | Frequency | | Rate | | Frequency |
| 6-Month GBP LIBOR, 1.03% | | Semi-annual | | 1.18% | | Semi-annual | | | 03/07/19 | (a) | | | 03/07/21 | | | GBP | | | 78,420 | | | $ | (4,012 | ) | | $ | (48,456 | ) | | $ | 44,444 | |
| 3-Month LIBOR, 2.81% | | Quarterly | | 3.12% | | Semi-annual | | | 03/07/19 | (a) | | | 03/07/21 | | | USD | | | 164,150 | | | | 1,576,473 | | | | 143,020 | | | | 1,433,453 | |
| (0.10)% | | Annual | | 6-Month EURIBOR, (0.24)% | | Semi-annual | | | 03/07/19 | (a) | | | 03/07/21 | | | EUR | | �� | 65,520 | | | | (80,751 | ) | | | (16,485 | ) | | | (64,266 | ) |
| (0.11)% | | Annual | | 6-Month EURIBOR, (0.24)% | | Semi-annual | | | 03/07/19 | (a) | | | 03/07/21 | | | EUR | | | 65,965 | | | | (72,702 | ) | | | (1,864 | ) | | | (70,838 | ) |
| (0.09)% | | Annual | | 6-Month EURIBOR, (0.24)% | | Semi-annual | | | 03/07/19 | (a) | | | 03/07/21 | | | EUR | | | 132,210 | | | | (190,485 | ) | | | (14,789 | ) | | | (175,696 | ) |
| 6-Month GBP LIBOR, 1.03% | | Semi-annual | | 1.19% | | Semi-annual | | | 03/07/19 | (a) | | | 03/07/21 | | | GBP | | | 158,900 | | | | 20,727 | | | | (13,495 | ) | | | 34,222 | |
| 3-Month LIBOR, 2.81% | | Quarterly | | 2.91% | | Semi-annual | | | 03/07/19 | (a) | | | 03/07/21 | | | USD | | | 147,350 | | | | 813,528 | | | | (5,403 | ) | | | 818,931 | |
| 2.91% | | Semi-annual | | 3-Month LIBOR, 2.81% | | Quarterly | | | 03/07/19 | (a) | | | 03/07/21 | | | USD | | | 78,020 | | | | (433,531 | ) | | | (15,360 | ) | | | (418,171 | ) |
| 2.91% | | Semi-annual | | 3-Month LIBOR, 2.81% | | Quarterly | | | 03/07/19 | (a) | | | 03/07/21 | | | USD | | | 78,012 | | | | (433,488 | ) | | | (77,052 | ) | | | (356,436 | ) |
| 6-Month EURIBOR, (0.24)% | | Semi-annual | | (0.09)% | | Annual | | | 03/07/19 | (a) | | | 03/07/21 | | | EUR | | | 64,920 | | | | 92,277 | | | | 7,801 | | | | 84,476 | |
| 6-Month GBP LIBOR, 1.03% | | Semi-annual | | 1.21% | | Semi-annual | | | 03/07/19 | (a) | | | 03/07/21 | | | GBP | | | 67,590 | | | | 52,429 | | | | 47,819 | | | | 4,610 | |
| (0.10)% | | Annual | | 6-Month EURIBOR, (0.24)% | | Semi-annual | | | 03/07/19 | (a) | | | 03/07/21 | | | EUR | | | 67,560 | | | | (81,114 | ) | | | 1,915 | | | | (83,029 | ) |
| (0.13)% | | Annual | | 6-Month EURIBOR, (0.24)% | | Semi-annual | | | 03/07/19 | (a) | | | 03/07/21 | | | EUR | | | 65,015 | | | | (43,158 | ) | | | 441 | | | | (43,599 | ) |
| (0.13)% | | Annual | | 6-Month EURIBOR, (0.24)% | | Semi-annual | | | 03/07/19 | (a) | | | 03/07/21 | | | EUR | | | 65,015 | | | | (43,158 | ) | | | (1,548 | ) | | | (41,610 | ) |
| 6-Month GBP LIBOR, 1.03% | | Semi-annual | | 1.21% | | Semi-annual | | | 03/07/19 | (a) | | | 03/07/21 | | | GBP | | | 58,640 | | | | 35,550 | | | | 28,206 | | | | 7,344 | |
| 6-Month GBP LIBOR, 1.03% | | Semi-annual | | 1.29% | | Semi-annual | | | N/A | | | | 12/06/23 | | | GBP | | | 46,600 | | | | (12,962 | ) | | | (49,681 | ) | | | 36,719 | |
| 1.37% | | Semi-annual | | 6-Month GBP LIBOR, 1.03% | | Semi-annual | | | N/A | | | | 12/06/23 | | | GBP | | | 17,110 | | | | (87,402 | ) | | | (29,211 | ) | | | (58,191 | ) |
| 1.47% | | Semi-annual | | 6-Month GBP LIBOR, 1.03% | | Semi-annual | | | N/A | | | | 12/06/23 | | | GBP | | | 29,420 | | | | (324,226 | ) | | | (131,465 | ) | | | (192,761 | ) |
| 6-Month EURIBOR, (0.24)% | | Semi-annual | | 0.35% | | Annual | | | N/A | | | | 12/19/23 | | | EUR | | | 4,040 | | | | 38,672 | | | | 94 | | | | 38,578 | |
| | |
| 32 | | 2018 BLACKROCK ANNUAL REPORTTO SHAREHOLDERS |
| | |
Schedule of Investments (continued) December 31, 2018 | | CoreAlpha Bond Master Portfolio |
Centrally Cleared Interest Rate Swaps (continued)
| | | | | | | | | | | | | | | | | | | | | | | | | | | | | | | | |
| Paid by the Master Portfolio | | Received by the Master Portfolio | | Effective
Date | | | Termination
Date | | | Notional
Amount (000) | | | Value | | | Upfront
Premium
Paid
(Received) | | | Unrealized
Appreciation
(Depreciation) | |
| Rate | | Frequency | | Rate | | Frequency |
| 6-Month EURIBOR, (0.24)% | | Semi-annual | | 0.28% | | Annual | | | N/A | | | | 12/19/23 | | | EUR | | | 2,540 | | | $ | 12,989 | | | $ | 58 | | | $ | 12,931 | |
| 6-Month EURIBOR, (0.24)% | | Semi-annual | | 0.34% | | Annual | | | N/A | | | | 12/19/23 | | | EUR | | | 1,680 | | | | 14,872 | | | | 39 | | | | 14,833 | |
| 6-Month EURIBOR, (0.24)% | | Semi-annual | | 0.39% | | Annual | | | N/A | | | | 12/19/23 | | | EUR | | | 1,010 | | | | 11,816 | | | | 23 | | | | 11,793 | |
| 6-Month EURIBOR, (0.24)% | | Semi-annual | | 0.39% | | Annual | | | N/A | | | | 12/19/23 | | | EUR | | | 4,020 | | | | 47,146 | | | | 93 | | | | 47,053 | |
| 6-Month EURIBOR, (0.24)% | | Semi-annual | | 0.43% | | Annual | | | N/A | | | | 12/19/23 | | | EUR | | | 1,640 | | | | 22,913 | | | | 38 | | | | 22,875 | |
| 1.36% | | Semi-annual | | 6-Month GBP LIBOR, 1.03% | | Semi-annual | | | 03/07/19 | (a) | | | 03/07/24 | | | GBP | | | 31,860 | | | | (99,230 | ) | | | 94,218 | | | | (193,448 | ) |
| 6-Month EURIBOR, (0.24)% | | Semi-annual | | 0.40% | | Annual | | | 03/07/19 | (a) | | | 03/07/24 | | | EUR | | | 51,890 | | | | 478,029 | | | | 69,872 | | | | 408,157 | |
| 3.11% | | Semi-annual | | 3-Month LIBOR, 2.81% | | Quarterly | | | 03/07/19 | (a) | | | 03/07/24 | | | USD | | | 183,360 | | | | (4,594,343 | ) | | | (285,572 | ) | | | (4,308,771 | ) |
| 3.06% | | Semi-annual | | 3-Month LIBOR, 2.81% | | Quarterly | | | 03/07/19 | (a) | | | 03/07/24 | | | USD | | | 31,585 | | | | (721,736 | ) | | | (7,791 | ) | | | (713,945 | ) |
| 6-Month EURIBOR, (0.24)% | | Semi-annual | | 0.34% | | Annual | | | 03/07/19 | (a) | | | 03/07/24 | | | EUR | | | 26,480 | | | | 153,798 | | | | 50,936 | | | | 102,862 | |
| 6-Month EURIBOR, (0.24)% | | Semi-annual | | 0.32% | | Annual | | | 03/07/19 | (a) | | | 03/07/24 | | | EUR | | | 26,545 | | | | 120,892 | | | | 6,777 | | | | 114,115 | |
| 6-Month EURIBOR, (0.24)% | | Semi-annual | | 0.34% | | Annual | | | 03/07/19 | (a) | | | 03/07/24 | | | EUR | | | 161,570 | | | | 913,808 | | | | 194,529 | | | | 719,279 | |
| 1.31% | | Semi-annual | | 6-Month GBP LIBOR, 1.03% | | Semi-annual | | | 03/07/19 | (a) | | | 03/07/24 | | | GBP | | | 65,190 | | | | 18,782 | | | | 93,064 | | | | (74,282 | ) |
| 2.86% | | Semi-annual | | 3-Month LIBOR, 2.81% | | Quarterly | | | 03/07/19 | (a) | | | 03/07/24 | | | USD | | | 61,610 | | | | (829,318 | ) | | | 19,683 | | | | (849,001 | ) |
| 6-Month GBP LIBOR, 1.03% | | Semi-annual | | 1.26% | | Semi-annual | | | 03/07/19 | (a) | | | 03/07/24 | | | GBP | | | 49,700 | | | | (180,911 | ) | | | (88,797 | ) | | | (92,114 | ) |
| 0.31% | | Annual | | 6-Month EURIBOR, (0.24)% | | Semi-annual | | | 03/07/19 | (a) | | | 03/07/24 | | | EUR | | | 27,890 | | | | (112,354 | ) | | | 15,356 | | | | (127,710 | ) |
| 2.88% | | Semi-annual | | 3-Month LIBOR, 2.81% | | Quarterly | | | 03/07/19 | (a) | | | 03/07/24 | | | USD | | | 246,460 | | | | (3,490,380 | ) | | | (4,722 | ) | | | (3,485,658 | ) |
| 3-Month LIBOR, 2.81% | | Quarterly | | 2.88% | | Semi-annual | | | 03/07/19 | (a) | | | 03/07/24 | | | USD | | | 32,738 | | | | 464,120 | | | | 28,303 | | | | 435,817 | |
| 2.88% | | Semi-annual | | 3-Month LIBOR, 2.81% | | Quarterly | | | 03/07/19 | (a) | | | 03/07/24 | | | USD | | | 30,530 | | | | (432,824 | ) | | | (23,253 | ) | | | (409,571 | ) |
| 2.88% | | Semi-annual | | 3-Month LIBOR, 2.81% | | Quarterly | | | 03/07/19 | (a) | | | 03/07/24 | | | USD | | | 16,285 | | | | (230,873 | ) | | | (44,144 | ) | | | (186,729 | ) |
| 3-Month LIBOR, 2.81% | | Quarterly | | 2.88% | | Semi-annual | | | 03/07/19 | (a) | | | 03/07/24 | | | USD | | | 32,734 | | | | 464,074 | | | | 92,454 | | | | 371,620 | |
| 0.33% | | Annual | | 6-Month EURIBOR, (0.24)% | | Semi-annual | | | 03/07/19 | (a) | | | 03/07/24 | | | EUR | | | 26,210 | | | | (137,063 | ) | | | (17,265 | ) | | | (119,798 | ) |
| 0.33% | | Annual | | 6-Month EURIBOR, (0.24)% | | Semi-annual | | | 03/07/19 | (a) | | | 03/07/24 | | | EUR | | | 25,500 | | | | (133,350 | ) | | | (16,797 | ) | | | (116,553 | ) |
| 6-Month GBP LIBOR, 1.03% | | Semi-annual | | 1.36% | | Semi-annual | | | 03/07/19 | (a) | | | 03/07/24 | | | GBP | | | 24,680 | | | | 68,173 | | | | 57,431 | | | | 10,742 | |
| 1.36% | | Semi-annual | | 6-Month GBP LIBOR, 1.03% | | Semi-annual | | | 03/07/19 | (a) | | | 03/07/24 | | | GBP | | | 26,940 | | | | (74,416 | ) | | | (59,678 | ) | | | (14,738 | ) |
| 6-Month EURIBOR, (0.24)% | | Semi-annual | | 0.32% | | Annual | | | 03/07/19 | (a) | | | 03/07/24 | | | EUR | | | 27,170 | | | | 120,039 | | | | (8,092 | ) | | | 128,131 | |
| 0.32% | | Annual | | 6-Month EURIBOR, (0.24)% | | Semi-annual | | | 03/07/19 | (a) | | | 03/07/24 | | | EUR | | | 53,290 | | | | (235,205 | ) | | | 18,075 | | | | (253,280 | ) |
| 6-Month EURIBOR, (0.24)% | | Semi-annual | | 0.29% | | Annual | | | 03/07/19 | (a) | | | 03/07/24 | | | EUR | | | 26,175 | | | | 81,680 | | | | 24,823 | | | | 56,857 | |
| 0.29% | | Annual | | 6-Month EURIBOR, (0.24)% | | Semi-annual | | | 03/07/19 | (a) | | | 03/07/24 | | | EUR | | | 26,855 | | | | (83,802 | ) | | | (25,780 | ) | | | (58,022 | ) |
| 6-Month EURIBOR, (0.24)% | | Semi-annual | | 0.29% | | Annual | | | 03/07/19 | (a) | | | 03/07/24 | | | EUR | | | 26,175 | | | | 81,680 | | | | 25,769 | | | | 55,911 | |
| 0.29% | | Annual | | 6-Month EURIBOR, (0.24)% | | Semi-annual | | | 03/07/19 | (a) | | | 03/07/24 | | | EUR | | | 26,855 | | | | (83,802 | ) | | | (26,074 | ) | | | (57,728 | ) |
| 1.41% | | Semi-annual | | 6-Month GBP LIBOR, 1.03% | | Semi-annual | | | 03/07/19 | (a) | | | 03/07/24 | | | GBP | | | 24,050 | | | | (146,659 | ) | | | (59,523 | ) | | | (87,136 | ) |
| 3.06% | | Semi-annual | | 3-Month LIBOR, 2.81% | | Quarterly | | | 03/07/19 | (a) | | | 03/07/24 | | | USD | | | 31,330 | | | | (710,607 | ) | | | 19,694 | | | | (730,301 | ) |
| MXN 28D TIIE, 8.59% | | Monthly | | 8.19% | | Monthly | | | 03/20/19 | (a) | | | 03/13/24 | | | MXN | | | 107,160 | | | | (88,848 | ) | | | 101 | | | | (88,949 | ) |
| MXN 28D TIIE, 8.59% | | Monthly | | 8.09% | | Monthly | | | 03/20/19 | (a) | | | 03/13/24 | | | MXN | | | 51,380 | | | | (53,115 | ) | | | 50 | | | | (53,165 | ) |
| MXN 28D TIIE, 8.59% | | Monthly | | 8.11% | | Monthly | | | 03/20/19 | (a) | | | 03/13/24 | | | MXN | | | 28,930 | | | | (28,782 | ) | | | 28 | | | | (28,810 | ) |
| MXN 28D TIIE, 8.59% | | Monthly | | 8.84% | | Monthly | | | 03/20/19 | (a) | | | 03/13/24 | | | MXN | | | 156,620 | | | | 78,499 | | | | 142 | | | | 78,357 | |
| MXN 28D TIIE, 8.59% | | Monthly | | 9.00% | | Monthly | | | 03/20/19 | (a) | | | 03/13/24 | | | MXN | | | 107,130 | | | | 88,775 | | | | 96 | | | | 88,679 | |
| MXN 28D TIIE, 8.59% | | Monthly | | 8.51% | | Monthly | | | 03/20/19 | (a) | | | 03/13/24 | | | MXN | | | 43,230 | | | | (7,972 | ) | | | 39 | | | | (8,011 | ) |
| MXN 28D TIIE, 8.59% | | Monthly | | 8.60% | | Monthly | | | 03/20/19 | (a) | | | 03/13/24 | | | MXN | | | 89,550 | | | | 438 | | | | 82 | | | | 356 | |
| 3-Month JIBAR, 7.15% | | Quarterly | | 8.33% | | Quarterly | | | 03/20/19 | (a) | | | 03/20/24 | | | ZAR | | | 37,470 | | | | 63,263 | | | | 50 | | | | 63,213 | |
| 0.17% | | Semi-annual | | 6-Month JPY LIBOR, 0.01% | | Semi-annual | | | 03/20/19 | (a) | | | 03/20/24 | | | JPY | | | 753,000 | | | | (49,027 | ) | | | 137 | | | | (49,164 | ) |
| 0.70% | | Annual | | 3-Month STIBOR, (0.13%) | | Quarterly | | | 03/20/19 | (a) | | | 03/20/24 | | | SEK | | | 40,220 | | | | (29,013 | ) | | | (4,892 | ) | | | (24,121 | ) |
| 2.35% | | Semi-annual | | 6-Month SIBOR,1.94% | | Semi-annual | | | 03/20/19 | (a) | | | 03/20/24 | | | SGD | | | 2,360 | | | | (35,099 | ) | | | 31 | | | | (35,130 | ) |
| 2.95% | | Quarterly | | 3-Month HIBOR, 2.33% | | Quarterly | | | 03/20/19 | (a) | | | 03/20/24 | | | HKD | | | 23,650 | | | | (88,775 | ) | | | 55 | | | | (88,830 | ) |
| 2.42% | | Semi-annual | | 6-Month SIBOR,1.94% | | Semi-annual | | | 03/20/19 | (a) | | | 03/20/24 | | | SGD | | | 2,660 | | | | (46,773 | ) | | | 35 | | | | (46,808 | ) |
| 2.43% | | Semi-annual | | 6-Month SIBOR,1.94% | | Semi-annual | | | 03/20/19 | (a) | | | 03/20/24 | | | SGD | | | 1,140 | | | | (20,345 | ) | | | 15 | | | | (20,360 | ) |
| 3-Month JIBAR, 7.15% | | Quarterly | | 8.41% | | Quarterly | | | 03/20/19 | (a) | | | 03/20/24 | | | ZAR | | | 39,260 | | | | 75,118 | | | | 48 | | | | 75,070 | |
| 2.49% | | Semi-annual | | 6-Month SIBOR,1.94% | | Semi-annual | | | 03/20/19 | (a) | | | 03/20/24 | | | SGD | | | 391 | | | | (7,731 | ) | | | 5 | | | | (7,736 | ) |
| 3-Month JIBAR, 7.15% | | Quarterly | | 8.19% | | Quarterly | | | 03/20/19 | (a) | | | 03/20/24 | | | ZAR | | | 33,760 | | | | 44,181 | | | | 43 | | | | 44,138 | |
| 2.51% | | Semi-annual | | 6-Month SIBOR,1.94% | | Semi-annual | | | 03/20/19 | (a) | | | 03/20/24 | | | SGD | | | 1,979 | | | | (40,855 | ) | | | 26 | | | | (40,881 | ) |
| 6-Month BBR, (0.24%) | | Semi-annual | | 2.60% | | Semi-annual | | | 03/20/19 | (a) | | | 03/20/24 | | | AUD | | | 5,400 | | | | 65,779 | | | | 79 | | | | 65,700 | |
| 0.12% | | Semi-annual | | 6-Month JPY LIBOR, 0.01% | | Semi-annual | | | 03/20/19 | (a) | | | 03/20/24 | | | JPY | | | 659,000 | | | | (27,159 | ) | | | 107 | | | | (27,266 | ) |
| 6-Month BBR, (0.24%) | | Semi-annual | | 2.57% | | Semi-annual | | | 03/20/19 | (a) | | | 03/20/24 | | | AUD | | | 12,680 | | | | 140,245 | | | | 168 | | | | 140,077 | |
| 3.06% | | Semi-annual | | 3-Month LIBOR, 2.81% | | Quarterly | | | 03/20/19 | (a) | | | 03/20/24 | | | USD | | | 17,030 | | | | (391,817 | ) | | | 347 | | | | (392,164 | ) |
| 6-Month WIBOR, 1.69% | | Semi-annual | | 2.59% | | Annual | | | 03/20/19 | (a) | | | 03/20/24 | | | PLN | | | 28,820 | | | | 157,707 | | | | 139 | | | | 157,568 | |
| 3-Month JIBAR, 7.15% | | Quarterly | | 8.05% | | Quarterly | | | 03/20/19 | (a) | | | 03/20/24 | | | ZAR | | | 129,140 | | | | 118,518 | | | | 188 | | | | 118,330 | |
| 2.33% | | Semi-annual | | 6-Month SIBOR,1.94% | | Semi-annual | | | 03/20/19 | (a) | | | 03/20/24 | | | SGD | | | 1,840 | | | | (26,078 | ) | | | 24 | | | | (26,102 | ) |
| 0.70% | | Annual | | 3-Month STIBOR, (0.13%) | | Quarterly | | | 03/20/19 | (a) | | | 03/20/24 | | | SEK | | | 5,330 | | | | (3,973 | ) | | | 12 | | | | (3,985 | ) |
| 1.37% | | Semi-annual | | 6-Month GBP LIBOR, 1.03% | | Semi-annual | | | 03/20/19 | (a) | | | 03/20/24 | | | GBP | | | 1,000 | | | | (3,032 | ) | | | 26 | | | | (3,058 | ) |
| | | | |
| SCHEDULE OF INVESTMENTS | | | 33 | |
| | |
Schedule of Investments (continued) December 31, 2018 | | CoreAlpha Bond Master Portfolio |
Centrally Cleared Interest Rate Swaps (continued)
| | | | | | | | | | | | | | | | | | | | | | | | | | | | | | | | |
| Paid by the Master Portfolio | | Received by the Master Portfolio | | Effective
Date | | | Termination
Date | | | Notional
Amount (000) | | | Value | | | Upfront
Premium
Paid
(Received) | | | Unrealized
Appreciation
(Depreciation) | |
| Rate | | Frequency | | Rate | | Frequency |
| 6-Month BBR, (0.24%) | | Semi-annual | | 2.42% | | Semi-annual | | | 03/20/19 | (a) | | | 03/20/24 | | | AUD | | | 4,510 | | | $ | 26,833 | | | $ | 60 | | | $ | 26,773 | |
| 2.10% | | Semi-annual | | 6-Month SIBOR,1.94% | | Semi-annual | | | 03/20/19 | (a) | | | 03/20/24 | | | SGD | | | 5,780 | | | | (35,412 | ) | | | 77 | | | | (35,489 | ) |
| 1.35% | | Semi-annual | | 6-Month GBP LIBOR, 1.03% | | Semi-annual | | | 03/20/19 | (a) | | | 03/20/24 | | | GBP | | | 2,900 | | | | (6,096 | ) | | | 75 | | | | (6,171 | ) |
| 6-Month EURIBOR, (0.24)% | | Semi-annual | | 0.32% | | Annual | | | 03/20/19 | (a) | | | 03/20/24 | | | EUR | | | 2,350 | | | | 9,485 | | | | 54 | | | | 9,431 | |
| 1.96% | | Semi-annual | | 6-Month SIBOR,1.94% | | Semi-annual | | | 03/20/19 | (a) | | | 03/20/24 | | | SGD | | | 2,495 | | | | (3,502 | ) | | | 33 | | | | (3,535 | ) |
| 1.96% | | Semi-annual | | 6-Month SIBOR,1.94% | | Semi-annual | | | 03/20/19 | (a) | | | 03/20/24 | | | SGD | | | 2,533 | | | | (3,555 | ) | | | 34 | | | | (3,589 | ) |
| 2.00% | | Semi-annual | | 6-Month SIBOR,1.94% | | Semi-annual | | | 03/20/19 | (a) | | | 03/20/24 | | | SGD | | | 2,533 | | | | (6,656 | ) | | | 34 | | | | (6,690 | ) |
| 2.39% | | Quarterly | | 3-Month HIBOR, 2.33% | | Quarterly | | | 03/20/19 | (a) | | | 03/20/24 | | | HKD | | | 61,260 | | | | (21,399 | ) | | | 142 | | | | (21,541 | ) |
| 1.97% | | Semi-annual | | 6-Month SIBOR,1.94% | | Semi-annual | | | 03/20/19 | (a) | | | 03/20/24 | | | SGD | | | 5,170 | | | | (8,162 | ) | | | 69 | | | | (8,231 | ) |
| 1.35% | | Semi-annual | | 6-Month GBP LIBOR, 1.03% | | Semi-annual | | | 03/20/19 | (a) | | | 03/20/24 | | | GBP | | | 3,680 | | | | (6,936 | ) | | | 95 | | | | (7,031 | ) |
| 6-Month BBR, (0.24%) | | Semi-annual | | 2.57% | | Semi-annual | | | 03/20/19 | (a) | | | 03/20/24 | | | AUD | | | 1,780 | | | | 19,394 | | | | 23 | | | | 19,371 | |
| 6-Month BBR, (0.24%) | | Semi-annual | | 2.58% | | Semi-annual | | | 03/20/19 | (a) | | | 03/20/24 | | | AUD | | | 1,780 | | | | 20,333 | | | | 23 | | | | 20,310 | |
| 6-Month BBR, (0.24%) | | Semi-annual | | 2.59% | | Semi-annual | | | 03/20/19 | (a) | | | 03/20/24 | | | AUD | | | 4,100 | | | | 47,781 | | | | 54 | | | | 47,727 | |
| 6-Month BBR, (0.24%) | | Semi-annual | | 2.59% | | Semi-annual | | | 03/20/19 | (a) | | | 03/20/24 | | | AUD | | | 4,100 | | | | 48,389 | | | | 54 | | | | 48,335 | |
| 6-Month BBR, (0.24%) | | Semi-annual | | 2.60% | | Semi-annual | | | 03/20/19 | (a) | | | 03/20/24 | | | AUD | | | 3,370 | | | | 40,385 | | | | 45 | | | | 40,340 | |
| 6-Month BBR, (0.24%) | | Semi-annual | | 2.60% | | Semi-annual | | | 03/20/19 | (a) | | | 03/20/24 | | | AUD | | | 8,030 | | | | 97,022 | | | | 106 | | | | 96,916 | |
| 6-Month BBR, (0.24%) | | Semi-annual | | 2.62% | | Semi-annual | | | 03/20/19 | (a) | | | 03/20/24 | | | AUD | | | 5,780 | | | | 72,505 | | | | 75 | | | | 72,430 | |
| 2.73% | | Semi-annual | | 3-Month CAD BA, 2.31% | | Semi-annual | | | 03/20/19 | (a) | | | 03/20/24 | | | CAD | | | 1,210 | | | | (18,094 | ) | | | (351 | ) | | | (17,743 | ) |
| 3.06% | | Quarterly | | 3-Month HIBOR, 2.33% | | Quarterly | | | 03/20/19 | (a) | | | 03/20/24 | | | HKD | | | 20,550 | | | | (91,206 | ) | | | 48 | | | | (91,254 | ) |
| 1.44% | | Semi-annual | | 6-Month GBP LIBOR, 1.03% | | Semi-annual | | | N/A | | | | 12/06/28 | | | GBP | | | 23,650 | | | | (28,379 | ) | | | 65,685 | | | | (94,064 | ) |
| 6-Month GBP LIBOR, 1.03% | | Semi-annual | | 1.59% | | Semi-annual | | | N/A | | | | 12/06/28 | | | GBP | | | 8,760 | | | | 176,728 | | | | 30,033 | | | | 146,695 | |
| 6-Month GBP LIBOR, 1.03% | | Semi-annual | | 1.69% | | Semi-annual | | | N/A | | | | 12/06/28 | | | GBP | | | 15,420 | | | | 495,955 | | | | 94,465 | | | | 401,490 | |
| 6-Month EURIBOR, (0.24)% | | Semi-annual | | 0.99% | | Annual | | | 03/07/19 | (a) | | | 03/07/29 | | | EUR | | | 13,190 | | | | 210,447 | | | | 117,040 | | | | 93,407 | |
| 6-Month GBP LIBOR, 1.03% | | Semi-annual | | 1.57% | | Semi-annual | | | 03/07/19 | (a) | | | 03/07/29 | | | GBP | | | 4,200 | | | | 61,509 | | | | (27,296 | ) | | | 88,805 | |
| 3-Month LIBOR, 2.81% | | Quarterly | | 3.20% | | Semi-annual | | | 03/07/19 | (a) | | | 03/07/29 | | | USD | | | 83,300 | | | | 3,536,383 | | | | 167,370 | | | | 3,369,013 | |
| 3-Month LIBOR, 2.81% | | Quarterly | | 3.16% | | Semi-annual | | | 03/07/19 | (a) | | | 03/07/29 | | | USD | | | 33,699 | | | | 1,304,549 | | | | 68,390 | | | | 1,236,159 | |
| 3-Month LIBOR, 2.81% | | Quarterly | | 3.15% | | Semi-annual | | | 03/07/19 | (a) | | | 03/07/29 | | | USD | | | 16,785 | | | | 637,802 | | | | 17,428 | | | | 620,374 | |
| 6-Month EURIBOR, (0.24)% | | Semi-annual | | 0.96% | | Annual | | | 03/07/19 | (a) | | | 03/07/29 | | | EUR | | | 13,600 | | | | 173,438 | | | | (4,103 | ) | | | 177,541 | |
| 6-Month EURIBOR, (0.24)% | | Semi-annual | | 0.94% | | Annual | | | 03/07/19 | (a) | | | 03/07/29 | | | EUR | | | 12,900 | | | | 130,851 | | | | 7,315 | | | | 123,536 | |
| 6-Month EURIBOR, (0.24)% | | Semi-annual | | 0.93% | | Annual | | | 03/07/19 | (a) | | | 03/07/29 | | | EUR | | | 13,880 | | | | 129,032 | | | | 17,389 | | | | 111,643 | |
| 0.92% | | Annual | | 6-Month EURIBOR, (0.24)% | | Semi-annual | | | 03/07/19 | (a) | | | 03/07/29 | | | EUR | | | 10,050 | | | | (79,440 | ) | | | (29,385 | ) | | | (50,055 | ) |
| 6-Month EURIBOR, (0.24)% | | Semi-annual | | 0.92% | | Annual | | | 03/07/19 | (a) | | | 03/07/29 | | | EUR | | | 6,880 | | | | 54,383 | | | | 7,338 | | | | 47,045 | |
| 1.54% | | Semi-annual | | 6-Month GBP LIBOR, 1.03% | | Semi-annual | | | 03/07/19 | (a) | | | 03/07/29 | | | GBP | | | 25,244 | | | | (284,650 | ) | | | (179,235 | ) | | | (105,415 | ) |
| 6-Month GBP LIBOR, 1.03% | | Semi-annual | | 1.45% | | Semi-annual | | | 03/07/19 | (a) | | | 03/07/29 | | | GBP | | | 8,510 | | | | 11,869 | | | | (28,117 | ) | | | 39,986 | |
| 3-Month LIBOR, 2.81% | | Quarterly | | 2.96% | | Semi-annual | | | 03/07/19 | (a) | | | 03/07/29 | | | USD | | | 67,630 | | | | 1,452,064 | | | | 3,982 | | | | 1,448,082 | |
| 1.39% | | Semi-annual | | 6-Month GBP LIBOR, 1.03% | | Semi-annual | | | 03/07/19 | (a) | | | 03/07/29 | | | GBP | | | 51,642 | | | | 341,269 | | | | 244,518 | | | | 96,751 | |
| 6-Month EURIBOR, (0.24)% | | Semi-annual | | 0.89% | | Annual | | | 03/07/19 | (a) | | | 03/07/29 | | | EUR | | | 15,230 | | | | 69,079 | | | | (29,239 | ) | | | 98,318 | |
| 3-Month LIBOR, 2.81% | | Quarterly | | 2.95% | | Semi-annual | | | 03/07/19 | (a) | | | 03/07/29 | | | USD | | | 134,150 | | | | 2,762,015 | | | | 23,199 | | | | 2,738,816 | |
| 3-Month LIBOR, 2.81% | | Quarterly | | 2.95% | | Semi-annual | | | 03/07/19 | (a) | | | 03/07/29 | | | USD | | | 12,540 | | | | 255,776 | | | | 10,692 | | | | 245,084 | |
| 3-Month LIBOR, 2.81% | | Quarterly | | 2.95% | | Semi-annual | | | 03/07/19 | (a) | | | 03/07/29 | | | USD | | | 16,638 | | | | 339,369 | | | | 56,457 | | | | 282,912 | |
| 1.50% | | Semi-annual | | 6-Month GBP LIBOR, 1.03% | | Semi-annual | | | 03/07/19 | (a) | | | 03/07/29 | | | GBP | | | 12,802 | | | | (80,426 | ) | | | (62,522 | ) | | | (17,904 | ) |
| 1.50% | | Semi-annual | | 6-Month GBP LIBOR, 1.03% | | Semi-annual | | | 03/07/19 | (a) | | | 03/07/29 | | | GBP | | | 13,210 | | | | (82,989 | ) | | | (64,514 | ) | | | (18,475 | ) |
| 6-Month EURIBOR, (0.24)% | | Semi-annual | | 0.91% | | Annual | | | 03/07/19 | (a) | | | 03/07/29 | | | EUR | | | 27,560 | | | | 191,705 | | | | (27,576 | ) | | | 219,281 | |
| 0.91% | | Annual | | 6-Month EURIBOR, (0.24)% | | Semi-annual | | | 03/07/19 | (a) | | | 03/07/29 | | | EUR | | | 7,000 | | | | (48,692 | ) | | | 7,303 | | | | (55,995 | ) |
| 0.88% | | Annual | | 6-Month EURIBOR, (0.24)% | | Semi-annual | | | 03/07/19 | (a) | | | 03/07/29 | | | EUR | | | 6,825 | | | | (26,479 | ) | | | (13,221 | ) | | | (13,258 | ) |
| 6-Month EURIBOR, (0.24)% | | Semi-annual | | 0.88% | | Annual | | | 03/07/19 | (a) | | | 03/07/29 | | | EUR | | | 13,905 | | | | 53,948 | | | | 26,083 | | | | 27,865 | |
| 6-Month EURIBOR, (0.24)% | | Semi-annual | | 0.88% | | Annual | | | 03/07/19 | (a) | | | 03/07/29 | | | EUR | | | 13,905 | | | | 53,948 | | | | 32,174 | | | | 21,774 | |
| 0.88% | | Annual | | 6-Month EURIBOR, (0.24)% | | Semi-annual | | | 03/07/19 | (a) | | | 03/07/29 | | | EUR | | | 6,825 | | | | (26,479 | ) | | | (15,874 | ) | | | (10,605 | ) |
| 6-Month EURIBOR, (0.24)% | | Semi-annual | | 1.02% | | Annual | | | 03/07/19 | (a) | | | 03/07/29 | | | EUR | | | 9,550 | | | | 185,616 | | | | 31,683 | | | | 153,933 | |
| 3-Month LIBOR, 2.81% | | Quarterly | | 3.15% | | Semi-annual | | | 03/07/19 | (a) | | | 03/07/29 | | | USD | | | 16,505 | | | | 626,711 | | | | (8,448 | ) | | | 635,159 | |
| 3-Month LIBOR, 2.81% | | Quarterly | | 3.21% | | Semi-annual | | | 03/07/19 | (a) | | | 03/07/29 | | | USD | | | 17,810 | | | | 775,413 | | | | 49,526 | | | | 725,887 | |
| 1.52% | | Annual | | 6-Month EURIBOR, (0.24)% | | Semi-annual | | | 03/07/19 | (a) | | | 03/07/49 | | | EUR | | | 10,620 | | | | (386,604 | ) | | | 31,982 | | | | (418,586 | ) |
| 3.26% | | Semi-annual | | 3-Month LIBOR, 2.81% | | Quarterly | | | 03/07/19 | (a) | | | 03/07/49 | | | USD | | | 9,500 | | | | (842,440 | ) | | | (26,243 | ) | | | (816,197 | ) |
| 3.23% | | Semi-annual | | 3-Month LIBOR, 2.81% | | Quarterly | | | 03/07/19 | (a) | | | 03/07/49 | | | USD | | | 14,146 | | | | (1,142,534 | ) | | | (71,253 | ) | | | (1,071,281 | ) |
| 1.49% | | Annual | | 6-Month EURIBOR, (0.24)% | | Semi-annual | | | 03/07/19 | (a) | | | 03/07/49 | | | EUR | | | 5,060 | | | | (147,308 | ) | | | 8,540 | | | | (155,848 | ) |
| 1.48% | | Annual | | 6-Month EURIBOR, (0.24)% | | Semi-annual | | | 03/07/19 | (a) | | | 03/07/49 | | | EUR | | | 5,130 | | | | (128,446 | ) | | | (5,956 | ) | | | (122,490 | ) |
| 1.47% | | Annual | | 6-Month EURIBOR, (0.24)% | | Semi-annual | | | 03/07/19 | (a) | | | 03/07/49 | | | EUR | | | 5,180 | | | | (118,625 | ) | | | (18,795 | ) | | | (99,830 | ) |
| 1.45% | | Annual | | 6-Month EURIBOR, (0.24)% | | Semi-annual | | | 03/07/19 | (a) | | | 03/07/49 | | | EUR | | | 23,540 | | | | (382,074 | ) | | | (183,983 | ) | | | (198,091 | ) |
| 6-Month GBP LIBOR, 1.03% | | Semi-annual | | 1.71% | | Semi-annual | | | 03/07/19 | (a) | | | 03/07/49 | | | GBP | | | 9,739 | | | | 503,382 | | | | 238,444 | | | | 264,938 | |
| 3.05% | | Semi-annual | | 3-Month LIBOR, 2.81% | | Quarterly | | | 03/07/19 | (a) | | | 03/07/49 | | | USD | | | 30,210 | | | | (1,305,731 | ) | | | 3,463 | | | | (1,309,194 | ) |
| 6-Month GBP LIBOR, 1.03% | | Semi-annual | | 1.52% | | Semi-annual | | | 03/07/19 | (a) | | | 03/07/49 | | | GBP | | | 9,672 | | | | (86,160 | ) | | | (95,668 | ) | | | 9,508 | |
| | |
| 34 | | 2018 BLACKROCK ANNUAL REPORTTO SHAREHOLDERS |
| | |
Schedule of Investments (continued) December 31, 2018 | | CoreAlpha Bond Master Portfolio |
Centrally Cleared Interest Rate Swaps (continued)
| | | | | | | | | | | | | | | | | | | | | | | | | | | | | | | | |
| Paid by the Master Portfolio | | Received by the Master Portfolio | | Effective
Date | | | Termination
Date | | | Notional
Amount (000) | | | Value | | | Upfront
Premium
Paid
(Received) | | | Unrealized
Appreciation
(Depreciation) | |
| Rate | | Frequency | | Rate | | Frequency |
| 3.01% | | Semi-annual | | 3-Month LIBOR, 2.81% | | Quarterly | | | 03/07/19 | (a) | | | 03/07/49 | | | USD | | | 6,193 | | | $ | (224,859 | ) | | $ | (29,211 | ) | | $ | (195,648 | ) |
| 6-Month EURIBOR, (0.24)% | | Semi-annual | | 1.44% | | Annual | | | 03/07/19 | (a) | | | 03/07/49 | | | EUR | | | 220 | | | | 3,246 | | | | 80 | | | | 3,166 | |
6-Month GBP LIBOR,
1.03% | | Semi-annual | | 1.60% | | Semi-annual | | | 03/07/19 | (a) | | | 03/07/49 | | | GBP | | | 4,840 | | | | 84,108 | | | | 69,606 | | | | 14,502 | |
| 1.54% | | Annual | | 6-Month EURIBOR, (0.24)% | | Semi-annual | | | 03/07/19 | (a) | | | 03/07/49 | | | EUR | | | 3,840 | | | | (161,278 | ) | | | (18,685 | ) | | | (142,593 | ) |
| 3.26% | | Semi-annual | | 3-Month LIBOR, 2.81% | | Quarterly | | | 03/07/19 | (a) | | | 03/07/49 | | | USD | | | 7,935 | | | | (705,611 | ) | | | (34,365 | ) | | | (671,246 | ) |
| | | | | | | | | | | | | | | | | | | | | | | | | | | | | | | | |
| | | | | | | | | | | | | | | | | | | | | | $ | (2,766 | ) | | $ | 422,661 | | | $ | (425,427 | ) |
| | | | | | | | | | | | | | | | | | | | | | | | | | | | | | | | |
Centrally Cleared Inflation Swaps
| | | | | | | | | | | | | | | | | | | | | | | | | | | | |
Paid by the Master Portfolio | | Received by the
Master Portfolio | | Termination
Date | | | Notional
Amount (000) | | Value | | | Upfront
Premium
Paid
(Received) | | | Unrealized
Appreciation
(Depreciation) | |
| Reference | | Frequency | | Rate | | Frequency |
| Change in Return of the US CPI Urban Consumers NSA | | At Termination | | 2.20% | | At Termination | | | 10/26/23 | | | | USD | | | 10,650 | | $ | 216,924 | | | $ | 384 | | | $ | 216,540 | |
| | | | | | | | | | | | | | | | | | | | | | | | | | | | |
OTC Interest Rate Swaps
| | | | | | | | | | | | | | | | | | | | | | | | | | | | | | | | | | | | | | |
Paid by the
Master Portfolio | | Received by the
Master Portfolio | | Counterparty | | Effective
Date (a) | | | Termination
Date | | | Notional
Amount (000) | | | Value | | | Upfront
Premium
Paid
(Received) | | | Unrealized
Appreciation
(Depreciation) | |
| Rate | | Frequency | | Rate | | | Frequency |
| 1.98% | | Quarterly | |
| 3-Month KRW
CDC, 1.90% |
| | Quarterly | | Deutsche Bank AG | | | 03/20/19 | | | | 03/20/24 | | | | KRW | | | | 1,735 | | | $ | (15,766 | ) | | $ | — | | | $ | (15,766 | ) |
| 1.98 | | Quarterly | |
| 3-Month KRW
CDC, 1.90% |
| | Quarterly | | Goldman Sachs International | | | 03/20/19 | | | | 03/20/24 | | | | KRW | | | | 5,746 | | | | (51,834 | ) | | | — | | | | (51,834 | ) |
| 2.03 | | Quarterly | |
| 3-Month KRW
CDC, 1.90% |
| | Quarterly | | Deutsche Bank AG | | | 03/20/19 | | | | 03/20/24 | | | | KRW | | | | 3,016 | | | | (33,641 | ) | | | — | | | | (33,641 | ) |
| 2.03 | | Quarterly | |
| 3-Month KRW
CDC, 1.90% |
| | Quarterly | | Citibank N.A. | | | 03/20/19 | | | | 03/20/24 | | | | KRW | | | | 1,501 | | | | (16,585 | ) | | | — | | | | (16,585 | ) |
| 2.04 | | Quarterly | |
| 3-Month KRW
CDC, 1.90% |
| | Quarterly | | Bank of America N.A. | | | 03/20/19 | | | | 03/20/24 | | | | KRW | | | | 1,853 | | | | (21,706 | ) | | | — | | | | (21,706 | ) |
| 2.05 | | Quarterly | |
| 3-Month KRW
CDC, 1.90% |
| | Quarterly | | Deutsche Bank AG | | | 03/20/19 | | | | 03/20/24 | | | | KRW | | | | 2,008 | | | | (23,962 | ) | | | — | | | | (23,962 | ) |
| 2.13 | | Quarterly | |
| 3-Month KRW
CDC, 1.90% |
| | Quarterly | | Deutsche Bank AG | | | 03/20/19 | | | | 03/20/24 | | | | KRW | | | | 3,906 | | | | (60,647 | ) | | | — | | | | (60,647 | ) |
| 2.14 | | Quarterly | |
| 3-Month KRW
CDC, 1.90% |
| | Quarterly | | Deutsche Bank AG | | | 03/20/19 | | | | 03/20/24 | | | | KRW | | | | 3,906 | | | | (61,480 | ) | | | — | | | | (61,480 | ) |
| 2.15 | | Quarterly | |
| 3-Month KRW
CDC, 1.90% |
| | Quarterly | | Citibank N.A. | | | 03/20/19 | | | | 03/20/24 | | | | KRW | | | | 2,751 | | | | (44,465 | ) | | | — | | | | (44,465 | ) |
| 1.96 | | Quarterly | |
| 3-Month KRW
CDC, 1.90% |
| | Quarterly | | JPMorgan Chase Bank N.A. | | | 03/20/19 | | | | 03/20/24 | | | | KRW | | | | 15,587 | | | | (130,789 | ) | | | — | | | | (130,789 | ) |
| 2.15 | | Quarterly | |
| 3-Month KRW
CDC, 1.90% |
| | Quarterly | | Citibank N.A. | | | 03/20/19 | | | | 03/20/24 | | | | KRW | | | | 5,806 | | | | (93,884 | ) | | | — | | | | (93,884 | ) |
| | | | | | | | | | | | | | | | | | | | | | | | | | | | | | | | | | | | | | |
| | | | | | | | | | | | | | | | | | | | | | | | | | | | $ | (554,759 | ) | | $ | — | | | $ | (554,759 | ) |
| | | | | | | | | | | | | | | | | | | | | | | | | | | | | | | | | | | | | | |
| | | | |
| SCHEDULE OF INVESTMENTS | | | 35 | |
| | |
Schedule of Investments (continued) December 31, 2018 | | CoreAlpha Bond Master Portfolio |
Balances Reported in the Statement of Assets and Liabilities for Centrally Cleared Swaps and OTC Derivatives
| | | | | | | | | | | | | | | | |
| | | Swap
Premiums
Paid | | | Swap
Premiums
Received | | | Unrealized
Appreciation | | | Unrealized
Depreciation | |
Centrally Cleared Swaps(a) | | $ | 7,028,549 | | | $ | (2,051,229 | ) | | $ | 19,887,084 | | | $ | (21,781,811 | ) |
OTC Swaps | | | — | | | | — | | | | — | | | | (554,759 | ) |
| | (a) | Includes cumulative appreciation (depreciation) on centrally cleared swaps, as reported in the Schedule of Investments. Only current day’s variation margin is reported within the Statement of Assets and Liabilities and is net of any previously paid (received) swap premium amounts. | |
Derivative Financial Instruments Categorized by Risk Exposure
As of period end, the fair values of derivative financial instruments located in the Statement of Assets and Liabilities were as follows:
| | | | | | | | | | | | | | | | | | | | | | | | | | | | |
| | | Commodity
Contracts | | | Credit
Contracts | | | Equity
Contracts | | | Foreign
Currency
Exchange
Contracts | | | Interest
Rate
Contracts | | | Other
Contracts | | | Total | |
Assets— Derivative Financial Instruments | | | | | | | | | | | | | | | | | | | | | | | | | | | | |
Futures contracts | | | | | | | | | | | | | | | | | | | | | | | | | | | | |
Net unrealized appreciation(a) | | $ | — | | | $ | — | | | $ | — | | | $ | — | | | $ | 10,646,678 | | | $ | — | | | $ | 10,646,678 | |
Swaps — centrally cleared | | | | | | | | | | | | | | | | | | | | | | | | | | | | |
Net unrealized appreciation(a) | | | — | | | | — | | | | — | | | | — | | | | 19,670,544 | | | | 216,540 | | | | 19,887,084 | |
| | | | | | | | | | | | | | | | | | | | | | | | | | | | |
| | $ | — | | | $ | — | | | $ | — | | | $ | — | | | $ | 30,317,222 | | | $ | 216,540 | | | $ | 30,533,762 | |
| | | | | | | | | | | | | | | | | | | | | | | | | | | | |
| | | | | | | |
| Liabilities— Derivative Financial Instruments | | | | | | | | | | | | | | | | | | | | | |
Futures contracts | | | | | | | | | | | | | | | | | | | | | | | | | | | | |
Net unrealized depreciation(a) | | $ | — | | | $ | — | | | $ | — | | | $ | — | | | $ | 3,200,535 | | | $ | — | | | $ | 3,200,535 | |
Swaps — centrally cleared | | | | | | | | | | | | | | | | | | | | | | | | | | | | |
Net unrealized depreciation(a) | | | — | | | | 1,685,840 | | | | — | | | | — | | | | 20,095,971 | | | | — | | | | 21,781,811 | |
Swaps — OTC | | | | | | | | | | | | | | | | | | | | | | | | | | | | |
Net unrealized depreciation | | | — | | | | — | | | | — | | | | — | | | | 554,759 | | | | — | | | | 554,759 | |
| | | | | | | | | | | | | | | | | | | | | | | | | | | | |
| | $ | — | | | $ | 1,685,840 | | | $ | — | | | $ | — | | | $ | 23,851,265 | | | $ | — | | | $ | 25,537,105 | |
| | | | | | | | | | | | | | | | | | | | | | | | | | | | |
| | (a) | Includes cumulative appreciation (depreciation) on futures contracts and centrally cleared swaps, if any, as reported in the Schedule of Investments. Only current day’s variation margin is reported within the Statement of Assets and Liabilities. | |
For the year ended December 31, 2018, the effect of derivative financial instruments in the Statement of Operations was as follows:
| | | | | | | | | | | | | | | | | | | | | | | | | | | | |
| | | Commodity
Contracts | | | Credit
Contracts | | | Equity
Contracts | | | Foreign
Currency
Exchange
Contracts | | | Interest
Rate
Contracts | | | Other
Contracts | | | Total | |
Net Realized Gain (Loss) from: | | | | | | | | | | | | | | | | | | | | | | | | | | | | |
Futures contracts | | $ | — | | | $ | — | | | $ | — | | | $ | — | | | $ | (4,978,935 | ) | | $ | — | | | $ | (4,978,935 | ) |
Forward foreign currency exchange contracts | | | — | | | | — | | | | — | | | | 15,805 | | | | — | | | | — | | | | 15,805 | |
Options written | | | — | | | | — | | | | — | | | | — | | | | 18,666 | | | | — | | | | 18,666 | |
Swaps | | | — | | | | (280,309 | ) | | | — | | | | — | | | | 35,765 | | | | 538,757 | | | | 294,213 | |
| | | | | | | | | | | | | | | | | | | | | | | | | | | | |
| | $ | — | | | $ | (280,309 | ) | | $ | — | | | $ | 15,805 | | | $ | (4,924,504 | ) | | $ | 538,757 | | | $ | (4,650,251 | ) |
| | | | | | | | | | | | | | | | | | | | | | | | | | | | |
Net Change in Unrealized Appreciation (Depreciation) on: | | | | | | | | | | | | | | | | | | | | | | | | | | | | |
Futures contracts | | $ | — | | | $ | — | | | $ | — | | | $ | — | | | $ | 7,311,282 | | | $ | — | | | $ | 7,311,282 | |
Forward foreign currency exchange contracts | | | — | | | | — | | | | — | | | | 1,814 | | | | — | | | | — | | | | 1,814 | |
Swaps | | | — | | | | (1,781,203 | ) | | | — | | | | — | | | | (940,256 | ) | | | 165,379 | | | | (2,556,080 | ) |
| | | | | | | | | | | | | | | | | | | | | | | | | | | | |
| | $ | — | | | $ | (1,781,203 | ) | | $ | — | | | $ | 1,814 | | | $ | 6,371,026 | | | $ | 165,379 | | | $ | 4,757,016 | |
| | | | | | | | | | | | | | | | | | | | | | | | | | | | |
| | |
| 36 | | 2018 BLACKROCK ANNUAL REPORTTO SHAREHOLDERS |
| | |
Schedule of Investments (continued) December 31, 2018 | | CoreAlpha Bond Master Portfolio |
Average Quarterly Balances of Outstanding Derivative Financial Instruments
| | | | |
Futures contracts: | | | | |
Average notional value of contracts — long | | $ | 234,737,665 | |
Average notional value of contracts — short | | $ | 95,673,841 | |
Forward foreign currency exchange contracts: | | | | |
Average amounts purchased — in USD | | $ | 94,818 | |
Average amounts sold — in USD | | $ | — | (a) |
Options | | | | |
Average market value of option contracts written | | $ | — | (a) |
Credit default swaps: | | | | |
Average notional amount — buy protection | | $ | 5,244,415 | |
Average notional amount — sell protection | | $ | 26,440,143 | |
Interest rate swaps: | | | | |
Average notional value — pays fixed rate | | $ | 1,132,623,217 | |
Average notional value — receives fixed rate | | $ | 1,186,488,602 | |
Inflation swaps: | | | | |
Average notional amount — pays | | $ | 11,695,000 | |
Average notional amount — receives | | $ | 2,662,500 | |
| | (a) | Derivative not held atquarter-end. The risk exposure table serves as an indicator of activity during the period. | |
For more information about the Master Portfolio’s investment risks regarding derivative financial instruments, refer to the Notes to Financial Statements.
Derivative Financial Instruments — Offsetting as Period End
The Master Portfolio’s derivative assets and liabilities (by type) were as follows:
| | | | | | | | |
| | | Assets | | | Liabilities | |
Futures contracts | | $ | 1,042,088 | | | $ | 167,290 | |
Swaps — Centrally cleared | | | 155,083 | | | | — | |
Swaps — OTC(a) | | | — | | | | 554,759 | |
| | | | | | | | |
Total derivative assets and liabilities in the Statement of Assets and Liabilities | | $ | 1,197,171 | | | $ | 722,049 | |
Derivatives not subject to an Master Netting Agreement or similar agreement (“MNA”) | | | (1,197,171 | ) | | | (167,290 | ) |
| | | | | | | | |
Total derivative assets and liabilities subject to an MNA | | $ | — | | | $ | 554,759 | |
| | | | | | | | |
| | (a) | Includes unrealized depreciation on OTC swaps in the Statement of Assets and Liabilities. | |
The following table presents the Master Portfolio’s derivative assets and (liabilities) by counterparty net of amounts available for offset under a MNA and net of the related collateral received (and pledged) by the Master Portfolio:
| | | | | | | | | | | | | | | | | | | | |
| Counterparty | | Derivative
Liabilities
Subject to
an MNA by
Counterparty | | | Derivatives
Available
for Offset | | | Non-cash
Collateral
Pledged | | | Cash
Collateral
Pledged | | | Net Amount
of Derivative
Liabilities | |
Bank of America N.A. | | $ | 21,706 | | | $ | — | | | $ | — | | | $ | — | | | $ | 21,706 | |
Citibank N.A. | | | 154,934 | | | | — | | | | — | | | | — | | | | 154,934 | |
Deutsche Bank AG | | | 195,496 | | | | — | | | | — | | | | — | | | | 195,496 | |
Goldman Sachs International | | | 51,834 | | | | — | | | | — | | | | — | | | | 51,834 | |
JPMorgan Chase Bank N.A. | | | 130,789 | | | | — | | | | — | | | | — | | | | 130,789 | |
| | | | | | | | | | | | | | | | | | | | |
| | $ | 554,759 | | | $ | — | | | $ | — | | | $ | — | | | $ | 554,759 | |
| | | | | | | | | | | | | | | | | | | | |
| | | | |
| SCHEDULE OF INVESTMENTS | | | 37 | |
| | |
Schedule of Investments (continued) December 31, 2018 | | CoreAlpha Bond Master Portfolio |
Fair Value Hierarchy as of Period End
Various inputs are used in determining the fair value of investments and derivative financial instruments. For information about the Master Portfolio’s policy regarding valuation of investments and derivative financial instruments, refer to the Notes to Financial Statements.
The following tables summarize the Master Portfolio’s investments and derivative financial instruments categorized in the disclosure hierarchy:
| | | | | | | | | | | | | | | | |
| | | Level 1 | | | Level 2 | | | Level 3 | | | Total | |
Assets: | | | | | | | | | | | | | | | | |
Investments: | | | | | | | | | | | | | | | | |
Long-Term Investments: | | | | | | | | | | | | | | | | |
Asset-Backed Securities | | $ | — | | | $ | 217,874,464 | | | $ | — | | | $ | 217,874,464 | |
Corporate Bonds(a) | | | — | | | | 601,613,242 | | | | — | | | | 601,613,242 | |
Foreign Agency Obligations | | | — | | | | 5,888,623 | | | | — | | | | 5,888,623 | |
Investment Companies | | | 28,385,000 | | | | — | | | | — | | | | 28,385,000 | |
Municipal Bonds | | | — | | | | 3,402,671 | | | | — | | | | 3,402,671 | |
Non-Agency Mortgage-Backed Securities | | | — | | | | 63,742,086 | | | | — | | | | 63,742,086 | |
U.S. Government Sponsored Agency Securities | | | — | | | | 617,652,546 | | | | — | | | | 617,652,546 | |
U.S. Treasury Obligations | | | — | | | | 62,117,894 | | | | — | | | | 62,117,894 | |
Short-Term Securities | | | 117,772,322 | | | | — | | | | — | | | | 117,772,322 | |
| | | | | | | | | | | | | | | | |
| | $ | 146,157,322 | | | $ | 1,572,291,526 | | | $ | — | | | $ | 1,718,448,848 | |
| | | | | | | | | | | | | | | | |
Liabilities: | |
Investments: | |
TBA Sale Commitments | | $ | — | | | $ | (10,159,189 | ) | | $ | — | | | $ | (10,159,189 | ) |
| | | | | | | | | | | | | | | | |
| | $ | 146,157,322 | | | $ | 1,562,132,337 | | | $ | — | | | $ | 1,708,289,659 | |
| | | | | | | | | | | | | | | | |
Derivative Financial Instruments(b) | |
Assets: | |
Interest rate contracts | | $ | 10,646,678 | | | $ | 19,670,544 | | | $ | — | | | $ | 30,317,222 | |
Other contracts | | | — | | | | 216,540 | | | | — | | | | 216,540 | |
Liabilities: | |
Credit contracts | | | — | | | | (1,685,840 | ) | | | — | | | | (1,685,840 | ) |
Interest rate contracts | | | (3,200,535 | ) | | | (20,650,730 | ) | | | — | | | | (23,851,265 | ) |
| | | | | | | | | | | | | | | | |
| | $ | 7,446,143 | | | $ | (2,449,486 | ) | | $ | — | | | $ | 4,996,657 | |
| | | | | | | | | | | | | | | | |
| | (a) | See above Schedule of Investments for values in each industry. | |
| | (b) | Derivative financial instruments are swaps and futures contracts. Swaps and futures contracts are valued at the unrealized appreciation (depreciation) on the instrument. | |
During the year ended December 31, 2018, there were no transfers between levels.
See notes to financial statements.
| | |
| 38 | | 2018 BLACKROCK ANNUAL REPORTTO SHAREHOLDERS |
Statement of Assets and Liabilities
December 31, 2018
| | | | |
| | | CoreAlpha
Bond Master
Portfolio | |
| |
ASSETS | | | | |
Investments at value — unaffiliated (including securities loaned at value of $28,380,945, cost — $1,587,758,624) | | $ | 1,572,291,526 | |
Investments at value — affiliated (cost — $148,230,577) | | | 146,157,322 | |
Cash pledged: | | | | |
Centrally cleared swaps | | | 12,116,000 | |
Futures contracts | | | 6,931,000 | |
Foreign currency at value (cost — $5,676,308) | | | 5,543,078 | |
Receivables: | | | | |
Investments sold | | | 1,834,981 | |
Interest — unaffiliated | | | 8,253,209 | |
Dividends — affiliated | | | 266,785 | |
From the Manager | | | 108,222 | |
Variation margin on futures contracts | | | 1,042,088 | |
Variation margin on centrally cleared swaps | | | 155,083 | |
TBA sale commitments | | | 10,112,334 | |
Securities lending income — affiliated | | | 39,258 | |
Principal paydowns | | | 21,051 | |
| | | | |
Total assets | | | 1,764,871,937 | |
| | | | |
| |
LIABILITIES | | | | |
Cash collateral on securities loaned at value | | | 29,131,108 | |
Bank overdraft | | | 14,697 | |
Collateral — TBA commitments | | | 1,065,000 | |
TBA sale commitments at value (proceeds — $10,112,334) | | | 10,159,189 | |
Payables: | | | | |
Investments purchased | | | 210,273,417 | |
Investment advisory fees | | | 281,942 | |
Board realignment and consolidation | | | 108,222 | |
Trustees’ fees | | | 9,929 | |
Variation margin on futures contracts | | | 167,290 | |
Other accrued expenses | | | 77,681 | |
Withdrawals to investors | | | 27,339,895 | |
Unrealized depreciation on OTC derivatives | | | 554,759 | |
| | | | |
Total liabilities | | | 279,183,129 | |
| | | | |
| |
NET ASSETS | | $ | 1,485,688,808 | |
| | | | |
| |
NET ASSETS CONSIST OF | | | | |
Investors’ capital | | $ | 1,498,412,636 | |
Net unrealized appreciation (depreciation) | | | (12,723,828 | ) |
| | | | |
NET ASSETS | | $ | 1,485,688,808 | |
| | | | |
See notes to financial statements.
Statement of Operations
Year Ended December 31, 2018
| | | | |
| | | CoreAlpha
Bond Master
Portfolio | |
| |
INVESTMENT INCOME | | | | |
Interest — unaffiliated | | $ | 28,099,227 | |
Dividends — affiliated | | | 2,717,081 | |
Securities lending income — affiliated — net | | | 401,391 | |
| | | | |
Total investment income | | | 31,217,699 | |
| | | | |
| |
EXPENSES | | | | |
Investment advisory | | | 2,310,513 | |
Board realignment and consolidation | | | 108,222 | |
Trustees | | | 25,542 | |
Professional | | | 42,473 | |
| | | | |
Total expenses | | | 2,486,750 | |
Less fees waived and/or reimbursed by the Manager | | | (284,804 | ) |
| | | | |
Total expenses after fees waived and/or reimbursed | | | 2,201,946 | |
| | | | |
Net investment income | | | 29,015,753 | |
| | | | |
| |
REALIZED AND UNREALIZED GAIN (LOSS) | | | | |
Net realized gain (loss) from: | | | | |
Investments — unaffiliated | | | (17,969,712 | ) |
Investments — affiliated | | | 194 | |
Futures contracts | | | (4,978,935 | ) |
Forward foreign currency exchange contracts | | | 15,805 | |
Foreign currency transactions | | | (20,118 | ) |
Options written | | | 18,666 | |
Swaps | | | 294,213 | |
| | | | |
| | | (22,639,887 | ) |
| | | | |
Net change in unrealized appreciation (depreciation) on: | | | | |
Investments — unaffiliated | | | 1,616,329 | |
Investments — affiliated | | | (2,101,531 | ) |
Futures contracts | | | 7,311,282 | |
Forward foreign currency exchange contracts | | | 1,814 | |
Foreign currency translations | | | (131,503 | ) |
Swaps | | | (2,556,080 | ) |
| | | | |
| | | 4,140,311 | |
| | | | |
Net realized and unrealized loss | | | (18,499,576 | ) |
| | | | |
NET INCREASE IN NET ASSETS RESULTING FROM OPERATIONS | | $ | 10,516,177 | |
| | | | |
See notes to financial statements.
| | |
| 40 | | 2018 BLACKROCK ANNUAL REPORTTO SHAREHOLDERS |
Statements of Changes in Net Assets
| | | | | | | | |
| | | CoreAlpha Bond Master Portfolio | |
| | | Year Ended December 31, | |
| | | 2018 | | | 2017 | |
| | |
INCREASE (DECREASE) IN NET ASSETS | | | | | | | | |
| | |
OPERATIONS | | | | | | | | |
Net investment income | | $ | 29,015,753 | | | $ | 17,187,855 | |
Net realized gain (loss) | | | (22,639,887 | ) | | | 6,478,726 | |
Net change in unrealized appreciation (depreciation) | | | 4,140,311 | | | | 4,370,866 | |
| | | | | | | | |
Net increase in net assets resulting from operations | | | 10,516,177 | | | | 28,037,447 | |
| | | | | | | | |
| | |
CAPITAL TRANSACTIONS | | | | | | | | |
Proceeds from contributions | | | 958,651,640 | | | | 237,253,300 | |
Value of withdrawals | | | (263,738,503 | ) | | | (157,212,194 | ) |
| | | | | | | | |
Net increase in net assets derived from capital share transactions | | | 694,913,137 | | | | 80,041,106 | |
| | | | | | | | |
| | |
NET ASSETS | | | | | | | | |
Total increase in net assets | | | 705,429,314 | | | | 108,078,553 | |
Beginning of year | | | 780,259,494 | | | | 672,180,941 | |
| | | | | | | | |
End of year | | $ | 1,485,688,808 | | | $ | 780,259,494 | |
| | | | | | | | |
See notes to financial statements.
Financial Highlights
| | | | | | | | | | | | | | | | | | | | |
| | | CoreAlpha Bond Master Portfolio | |
| |
| | | Year Ended December 31, | |
| | | 2018 | | | 2017 | | | 2016 | | | 2015 | | | 2014 | |
| | | | | |
| Total Return | | | | | | | | | | | | | | | |
Total return | | | (0.11 | )% | | | 4.28 | % | | | 2.46 | % | | | 0.60 | % | | | 6.64 | % |
| | | | | | | | | | | | | | | | | | | | |
| | | | | |
Ratios to Average Net Assets(a) | | | | | | | | | | | | | | | | | | | | |
Total expenses | | | 0.27 | %(b) | | | 0.26 | % | | | 0.26 | % | | | 0.25 | % | | | 0.25 | % |
| | | | | | | | | | | | | | | | | | | | |
Total expenses after fees waived and paid indirectly | | | 0.24 | % | | | 0.24 | % | | | 0.25 | % | | | 0.24 | % | | | 0.24 | % |
| | | | | | | | | | | | | | | | | | | | |
Net investment income | | | 3.11 | % | | | 2.54 | % | | | 2.33 | % | | | 2.53 | % | | | 2.52 | % |
| | | | | | | | | | | | | | | | | | | | |
| | | | | |
Supplemental Data | | | | | | | | | | | | | | | | | | | | |
Net assets, end of year (000) | | $ | 1,485,689 | | | $ | 780,259 | | | $ | 672,181 | | | $ | 815,997 | | | $ | 2,887,381 | |
| | | | | | | | | | | | | | | | | | | | |
Portfolio turnover rate(c)(d) | | | 331 | % | | | 515 | % | | | 677 | % | | | 612 | % | | | 686 | % |
| | | | | | | | | | | | | | | | | | | | |
| (a) | Excludes expenses incurred indirectly as a result of investments in underlying funds as follows: |
| | | | | | | | | | | | | | | | | | | | | | | | | | | | | | | | | | | | | | | | |
| | | Year Ended December 31, | |
| | | 2018 | | | | | | 2017 | | | | | | 2016 | | | | | | 2015 | | | | | | 2014 | | | | |
Investments in underlying funds | | | 0.02 | % | | | | | | | 0.02 | % | | | | | | | — | | | | | | | | — | | | | | | | | — | | | | | |
| | | | | | | | | | | | | | | | | | | | | | | | | | | | | | | | | | | | | | | | |
| (b) | Includes board realignment and consolidation costs. Without these costs, total expenses a would have been 0.25%. |
| (c) | Portfolio turnover rates include TBA transactions, if any. |
| (d) | Includes mortgage dollar roll transactions. Additional information regarding portfolio turnover rate is as follows: |
| | | | | | | | | | | | | | | | | | | | | | | | | | | | | | | | | | | | | | | | |
| | | Year Ended December 31, | |
| | | 2018 | | | | | | 2017 | | | | | | 2016 | | | | | | 2015 | | | | | | 2014 | | | | |
Portfolio turnover rate (excluding MDRs) | | | 189 | % | | | | | | | 322 | % | | | | | | | 459 | % | | | | | | | 540 | % | | | | | | | 470 | % | | | | |
| | | | | | | | | | | | | | | | | | | | | | | | | | | | | | | | | | | | | | | | |
See notes to financial statements.
| | |
| 42 | | 2018 BLACKROCK ANNUAL REPORTTO SHAREHOLDERS |
Notes to Financial Statements
Master Investment Portfolio II (“MIP II”) is registered under the Investment Company Act of 1940, as amended (the “1940 Act”), as anopen-end management investment company. MIP II is organized as a Delaware statutory trust. CoreAlpha Bond Master Portfolio (the “Master Portfolio”) is a series of MIP II. The Master Portfolio is classified as diversified.
The Master Portfolio, together with certain other registered investment companies advised by BlackRock Fund Advisors (the “Manager”) or its affiliates, is included in a complex ofopen-end funds referred to as the Equity-Liquidity Complex.
Reorganizations: The Board approved an Agreement and Plan of Reorganization with respect to the following Target Master Portfolio (“Target Master Portfolio”), pursuant to which the Target Master Portfolio reorganized into a newly created series (the “Acquiring Master Portfolio”) of MIP II, a newly organized Delaware statutory trust. This reorganization (the “Board Reorganization”) closed on September 17, 2018 and was not subject to approval by interestholders of the Target Master Portfolio.
| | | | | | |
| Target Master Portfolio | | Target Master Portfolio’s Registrant | | Acquiring Master Portfolio | | Acquiring Master Portfolio’s Registrant |
CoreAlpha Bond Master Portfolio | | Master Investment Portfolio | | CoreAlpha Bond Master Portfolio | | Master Investment Portfolio II |
The Board Reorganization was effected in connection with a reconfiguration of the boards of directors/trustees of certain BlackRock-advised funds.
The Acquiring Master Portfolio has the same investment objective, strategies and policies, investment adviser, sub-advisers, portfolio management team and service providers as the Target Master Portfolio. The Target Master Portfolio is the performance and accounting survivor of the Board Reorganization, meaning that the Acquiring Master Portfolio assumed the performance and financial history of the Target Master Portfolio upon completion of the Board Reorganization. In addition, the Acquiring Master Portfolio is subject to the same contractual arrangements, including the same contractual fees and expenses, as those of the Target Master Portfolio as of the date of the Board Reorganization. The Board Reorganization was tax-free, meaning that the Target Master Portfolio’s interestholders became interestholders of the Acquiring Master Portfolio without realizing any gain or loss for federal income tax purposes.
The Board Reorganization was accomplished by a tax-free exchange of beneficial interests of the Acquiring Master Portfolio in the following amounts and at the following conversion ratio:
| | | | | | | | | | | | |
| Target Master Portfolio | | Beneficial
Interests Prior to
Reorganization | | | Conversion
Ratio | | | Beneficial Interests
Post-Reorganization | |
CoreAlpha Bond Master Portfolio | | | 72,539,078 | | | | 1 | | | | 72,539,078 | |
For financial reporting purposes, assets received and shares issued by the Acquiring Master Portfolio were recorded at fair value. However, the cost basis of the investments received from the Target Master Portfolio were carried forward to align ongoing reporting of the Acquiring Master Portfolio’s realized and unrealized gains and losses with amounts distributable to interestholders for tax purposes.
Prior to the Board Reorganization, the Acquiring Master Portfolio had not yet commenced operations and had no assets or liabilities. The Target Master Portfolio’s net assets, fair value and cost of investments and derivative financial instruments prior to the Board Reorganization were as follows:
| | | | | | | | | | | | |
| Target Master Portfolio | | Net Assets | | | Fair Value of
Investments | | | Cost of
Investments | |
CoreAlpha Bond Master Portfolio | | $ | 846,051,633 | | | $ | 955,741,363 | | | $ | 968,022,196 | |
The Board of BlackRock Funds VI and the Board of State Farm Mutual Fund Trust and the shareholders of State Farm Bond Fund (the “State Farm Fund”) approved the reorganization of the State Farm Fund into BlackRock CoreAlpha Bond Fund (the “Fund”). As a result, the Fund acquired all of the assets and assumed certain stated liabilities of the State Farm Fund in exchange for an equal aggregate value of newly-issued shares of the Fund.
On November 19, 2018, all of the portfolio securities previously held by the State Farm Fund were subsequently contributed by the Fund to the Master Portfolio in exchange for an investment in the Master Portfolio.
For financial reporting purposes, assets received and shares issued by the Fund were recorded at fair value. However, the cost basis of the investments received from the State Farm Fund was carried forward by the Master Portfolio to align ongoing reporting of the Fund’s realized and unrealized gains and losses with amounts distributable to shareholders for tax purposes.
The State Farm Fund’s fair value and cost of investments prior to the reorganization were as follows:
| | | | | | | | |
| State Farm Fund | | Fair Value of
Investments | | | Cost of
Investments | |
State Farm Bond Fund | | $ | 474,337,429 | | | $ | 495,163,771 | |
| | | | |
| NOTESTO FINANCIAL STATEMENTS | | | 43 | |
Notes to Financial Statements (continued)
| 2. | SIGNIFICANT ACCOUNTING POLICIES |
The financial statements are prepared in conformity with accounting principles generally accepted in the United States of America (“U.S. GAAP”), which may require management to make estimates and assumptions that affect the reported amounts of assets and liabilities in the financial statements, disclosure of contingent assets and liabilities at the date of the financial statements and the reported amounts of increases and decreases in net assets from operations during the reporting period. Actual results could differ from those estimates. The Master Portfolio is considered an investment company under U.S. GAAP and follows the accounting and reporting guidance applicable to investment companies. Below is a summary of significant accounting policies:
Investment Transactions and Income Recognition:For financial reporting purposes, investment transactions are recorded on the dates the transactions are entered into (the “trade dates”). Realized gains and losses on investment transactions are determined on the identified cost basis. Dividend income is recorded on theex-dividend date. Interest income, including amortization and accretion of premiums and discounts on debt securities, is recognized on an accrual basis.
Foreign Currency Translation:The Master Portfolio’s books and records are maintained in U.S. dollars. Securities and other assets and liabilities denominated in foreign currencies are translated into U.S. dollars using exchange rates determined as of the close of trading on the New York Stock Exchange (“NYSE”). Purchases and sales of investments are recorded at the rates of exchange prevailing on the respective dates of such transactions. Generally, when the U.S. dollar rises in value against a foreign currency, the investments denominated in that currency will lose value; the opposite effect occurs if the U.S. dollar falls in relative value.
The Master Portfolio does not isolate the portion of the results of operations arising as a result of changes in the exchange rates from the changes in the market prices of investments held or sold for financial reporting purposes. Accordingly, the effects of changes in exchange rates on investments are not segregated in the Statement of Operations from the effects of changes in market prices of those investments, but are included as a component of net realized and unrealized gain (loss) from investments. The Master Portfolio reports realized currency gains (losses) on foreign currency related transactions as components of net realized gain (loss) for financial reporting purposes, whereas such components are generally treated as ordinary income for U.S. federal income tax purposes.
Segregation and Collateralization:In cases where the Master Portfolio enters into certain investments (e.g., dollar rolls, TBA sale commitments, futures contracts, forward foreign currency exchange contracts, and swaps) that would be treated as “senior securities” for 1940 Act purposes, the Master Portfolio may segregate or designate on its books and records cash or liquid assets having a market value at least equal to the amount of its future obligations under such investments. Doing so allows the investment to be excluded from treatment as a “senior security.” Furthermore, if required by an exchange or counterparty agreement, the Master Portfolio may be required to deliver/deposit cash and/or securities to/with an exchange, or broker-dealer or custodian as collateral for certain investments or obligations.
Recent Accounting Standards:In March 2017, the Financial Accounting Standards Board issued Accounting Standards Update “Premium Amortization of Purchased Callable Debt Securities” which amends the amortization period for certain purchased callable debt securities. Under the new guidance, the premium amortization of purchased callable debt securities that have explicit,non-contingent call features and are callable at fixed prices will be amortized to the earliest call date. The guidance will be applied on a modified retrospective basis and is effective for fiscal years, and their interim periods, beginning after December 15, 2018. Management is currently evaluating the impact of this guidance to the Master Portfolio.
In August 2018, the Financial Accounting Standards Board issued Accounting Standards Update2018-13 “Changes to the Disclosure Requirements for Fair Value Measurement” which modifies disclosure requirements for fair value measurements. The guidance is effective for fiscal years beginning after December 15, 2019 and for interim periods within those fiscal years. Management is currently evaluating the impact of this guidance to the Master Portfolio.
Indemnifications:In the normal course of business, the Master Portfolio enters into contracts that contain a variety of representations that provide general indemnification. The Master Portfolio’s maximum exposure under these arrangements is unknown because it involves future potential claims against the Master Portfolio, which cannot be predicted with any certainty.
Other: Expenses directly related to the Master Portfolio are charged to the Master Portfolio. Other operating expenses shared by several funds, including other funds managed by the Manager, are prorated among those funds on the basis of relative net assets or other appropriate methods.
| 3. | INVESTMENT VALUATION AND FAIR VALUE MEASUREMENTS |
Investment Valuation Policies: The Master Portfolio’s investments are valued at fair value (also referred to as “market value” within the financial statements) as of the close of trading on the NYSE generally 4:00 p.m., Eastern time. U.S. GAAP defines fair value as the price the Master Portfolio would receive to sell an asset or pay to transfer a liability in an orderly transaction between market participants at the measurement date. The Master Portfolio determines the fair values of its financial instruments using various independent dealers or pricing services under policies approved by the Board of Trustees of MIP II (the “Board”). The BlackRock Global Valuation Methodologies Committee (the “Global Valuation Committee”) is the committee formed by management to develop global pricing policies and procedures and to oversee the pricing function for all financial instruments.
Fair Value Inputs and Methodologies: The following methods and inputs are used to establish the fair value of the Master Portfolio’s assets and liabilities:
| | • | | Fixed-income securities for which market quotations are readily available are generally valued using the last available bid prices or current market quotations provided by independent dealers or third party pricing services. Floating rate loan interests are valued at the mean of the bid prices from one or more independent brokers or dealers as obtained from a third party pricing service. Pricing services generally value fixed-income securities assuming orderly transactions of an institutional round lot size, but a fund may hold or transact in such securities in smaller, odd lot sizes. Odd lots may trade at lower prices than institutional round lots. The pricing services may use matrix pricing or valuation models that utilize certain inputs and assumptions to derive values, including transaction data (e.g., recent representative bids and offers), credit quality information, perceived market movements, news, and other relevant information. Certain fixed-income securities, including asset-backed and mortgage related securities may be valued based on valuation models that consider the estimated cash flows of each tranche of the entity, establish a benchmark yield and develop an estimated tranche specific spread to the benchmark yield based on the unique attributes of the |
| | |
| 44 | | 2018 BLACKROCK ANNUAL REPORTTO SHAREHOLDERS |
Notes to Financial Statements (continued)
| | tranche. The amortized cost method of valuation may be used with respect to debt obligations with sixty days or less remaining to maturity unless the Manager determines such method does not represent fair value. |
Generally, trading in foreign instruments is substantially completed each day at various times prior to the close of trading on the NYSE. Occasionally, events affecting the values of such instruments may occur between the foreign market close and the close of trading on the NYSE that may not be reflected in the computation of the Master Portfolio’s net assets.
| | • | | Municipal investments (including commitments to purchase such investments on a “when-issued” basis) are valued on the basis of prices provided by dealers or pricing services. In determining the value of a particular investment, pricing services may use certain information with respect to transactions in such investments, quotations from dealers, pricing matrixes, market transactions in comparable investments and information with respect to various relationships between investments. |
| | • | | Investments inopen-end U.S. mutual funds are valued at net asset value (“NAV”) each business day. |
| | • | | Futures contracts traded on exchanges are valued at their last sale price. |
| | • | | Forward foreign currency exchange contracts are valued at the mean between the bid and ask prices and are determined as of the close of trading on the NYSE. Interpolated values are derived when the settlement date of the contract is an interim date for which quotations are not available. |
| | • | | Exchange-traded options are valued at the mean between the last bid and ask prices at the close of the options market in which the options trade. An exchange-traded option for which there is no mean price is valued at the last bid (long positions) or ask (short positions) price. If no bid or ask price is available, the prior day’s price will be used, unless it is determined that the prior day’s price no longer reflects the fair value of the option.Over-the-counter (“OTC”) options and options on swaps (“swaptions”) are valued by an independent pricing service using a mathematical model, which incorporates a number of market data factors, such as the trades and prices of the underlying instruments. |
| | • | | Swap agreements are valued utilizing quotes received daily by the Master Portfolio’s pricing service or through brokers, which are derived using daily swap curves and models that incorporate a number of market data factors, such as discounted cash flows, trades and values of the underlying reference instruments. |
| | • | | To-be-announced (“TBA”) commitments are valued on the basis of last available bid prices or current market quotations provided by pricing services. |
If events (e.g., a company announcement, market volatility or a natural disaster) occur that are expected to materially affect the value of such investments, or in the event that the application of these methods of valuation results in a price for an investment that is deemed not to be representative of the market value of such investment, or if a price is not available, the investment will be valued by the Global Valuation Committee, or its delegate, in accordance with a policy approved by the Board as reflecting fair value (“Fair Valued Investments”). The fair valuation approaches that may be used by the Global Valuation Committee will include market approach, income approach and cost approach. Valuation techniques such as discounted cash flow, use of market comparables and matrix pricing are types of valuation approaches and are typically used in determining fair value. When determining the price for Fair Valued Investments, the Global Valuation Committee, or its delegate, seeks to determine the price that the Master Portfolio might reasonably expect to receive or pay from the current sale or purchase of that asset or liability in anarm’s-length transaction. Fair value determinations shall be based upon all available factors that the Global Valuation Committee, or its delegate, deems relevant and consistent with the principles of fair value measurement.
The Global Valuation Committee, or its delegate, employs various methods for calibrating valuation approaches for investments where an active market does not exist, including regular due diligence of the Master Portfolio’s pricing vendors, regular reviews of key inputs and assumptions, transactional back-testing or disposition analysis to compare unrealized gains and losses to realized gains and losses, reviews of missing or stale prices and large movements in market values and reviews of any market related activity. The pricing of all Fair Valued Investments is subsequently reported to the Board or a committee thereof on a quarterly basis. As a result of the inherent uncertainty in valuation of these investments, the fair values may differ from the values that would have been used had an active market existed.
For investments in equity or debt issued by privately held companies or funds (“Private Company” or collectively, the “Private Companies”) and other Fair Valued Investments, the fair valuation approaches that are used by third party pricing services utilize one or a combination of, but not limited to, the following inputs.
| | |
| | | Standard Inputs Generally Considered By Third Party Pricing Services |
Market approach | | (i) recent market transactions, including subsequent rounds of financing, in the underlying investment or comparable issuers; (ii) recapitalizations and other transactions across the capital structure; and (iii) market multiples of comparable issuers. |
Income approach | | (i) future cash flows discounted to present and adjusted as appropriate for liquidity, credit, and/or market risks; (ii) quoted prices for similar investments or assets in active markets; and (iii) other risk factors, such as interest rates, yield curves, volatilities, prepayment speeds, loss severities, credit risks, recovery rates, liquidation amounts and/or default rates. |
Cost approach | | (i) audited or unaudited financial statements, investor communications and financial or operational metrics issued by the Private Company; (ii) changes in the valuation of relevant indices or publicly traded companies comparable to the Private Company; (iii) relevant news and other public sources; and (iv) known secondary market transactions in the Private Company’s interests and merger or acquisition activity in companies comparable to the Private Company. |
Investments in series of preferred stock issued by Private Companies are typically valued utilizing market approach in determining the enterprise value of the company. Such investments often contain rights and preferences that differ from other series of preferred and common stock of the same issuer. Valuation techniques such as an
| | | | |
| NOTESTO FINANCIAL STATEMENTS | | | 45 | |
Notes to Financial Statements (continued)
option pricing model (“OPM”), a probability weighted expected return model (“PWERM”) or a hybrid of those techniques are used in allocating enterprise value of the company, as deemed appropriate under the circumstances. The use of OPM and PWERM techniques involve a determination of the exit scenarios of the investment in order to appropriately allocate the enterprise value of the company among the various parts of its capital structure.
The Private Companies are not subject to the public company disclosure, timing, and reporting standards as other investments held by the Master Portfolio. Typically, the most recently available information by a Private Company is as of a date that is earlier than the date the Master Portfolio is calculating its NAV. This factor may result in a difference between the value of the investment and the price the Master Portfolio could receive upon the sale of the investment.
Fair Value Hierarchy: Various inputs are used in determining the fair value of investments and derivative financial instruments. These inputs to valuation techniques are categorized into a fair value hierarchy consisting of three broad levels for financial statement purposes as follows:
| | • | | Level 1 — Unadjusted price quotations in active markets/exchanges for identical assets or liabilities that the Master Portfolio has the ability to access |
| | • | | Level 2 — Other observable inputs (including, but not limited to, quoted prices for similar assets or liabilities in markets that are active, quoted prices for identical or similar assets or liabilities in markets that are not active, inputs other than quoted prices that are observable for the assets or liabilities (such as interest rates, yield curves, volatilities, prepayment speeds, loss severities, credit risks and default rates) or other market-corroborated inputs) |
| | • | | Level 3 — Unobservable inputs based on the best information available in the circumstances, to the extent observable inputs are not available (including the Master Portfolio’s own assumptions used in determining the fair value of investments and derivative financial instruments |
The hierarchy gives the highest priority to unadjusted quoted prices in active markets for identical assets or liabilities (Level 1 measurements) and the lowest priority to unobservable inputs (Level 3 measurements). Accordingly, the degree of judgment exercised in determining fair value is greatest for instruments categorized in Level 3. The inputs used to measure fair value may fall into different levels of the fair value hierarchy. In such cases, for disclosure purposes, the fair value hierarchy classification is determined based on the lowest level input that is significant to the fair value measurement in its entirety. Investments classified within Level 3 have significant unobservable inputs used by the Global Valuation Committee in determining the price for Fair Valued Investments. Level 3 investments include equity or debt issued by Private Companies. There may not be a secondary market, and/or there are a limited number of investors. Level 3 investments may also be adjusted to reflect illiquidity and/ornon-transferability, with the amount of such discount estimated by the Global Valuation Committee in the absence of market information.
Changes in valuation techniques may result in transfers into or out of an assigned level within the hierarchy. In accordance with the Master Portfolio’s policy, transfers between different levels of the fair value hierarchy are deemed to have occurred as of the beginning of the reporting period. The categorization of a value determined for investments and derivative financial instruments is based on the pricing transparency of the investments and derivative financial instruments and is not necessarily an indication of the risks associated with investing in those securities.
| 4. | SECURITIES AND OTHER INVESTMENTS |
Asset-Backed and Mortgage-Backed Securities:Asset-backed securities are generally issued as pass-through certificates or as debt instruments. Asset-backed securities issued as pass-through certificates represent undivided fractional ownership interests in an underlying pool of assets. Asset-backed securities issued as debt instruments, which are also known as collateralized obligations, are typically issued as the debt of a special purpose entity organized solely for the purpose of owning such assets and issuing such debt. Asset-backed securities are often backed by a pool of assets representing the obligations of a number of different parties. The yield characteristics of certain asset-backed securities may differ from traditional debt securities. One such major difference is that all or a principal part of the obligations may be prepaid at any time because the underlying assets (i.e., loans) may be prepaid at any time. As a result, a decrease in interest rates in the market may result in increases in the level of prepayments as borrowers, particularly mortgagors, refinance and repay their loans. An increased prepayment rate with respect to an asset-backed security will have the effect of shortening the maturity of the security. In addition, a fund may subsequently have to reinvest the proceeds at lower interest rates. If a fund has purchased such an asset-backed security at a premium, a faster than anticipated prepayment rate could result in a loss of principal to the extent of the premium paid.
For mortgage pass-through securities (the “Mortgage Assets”) there are a number of important differences among the agencies and instrumentalities of the U.S. Government that issue mortgage-related securities and among the securities that they issue. For example, mortgage-related securities guaranteed by Ginnie Mae are guaranteed as to the timely payment of principal and interest by Ginnie Mae and such guarantee is backed by the full faith and credit of the United States. However, mortgage-related securities issued by Freddie Mac and Fannie Mae, including Freddie Mac and Fannie Mae guaranteed mortgage pass-through certificates, which are solely the obligations of Freddie Mac and Fannie Mae, are not backed by or entitled to the full faith and credit of the United States, but are supported by the right of the issuer to borrow from the U.S. Treasury.
Non-agency mortgage-backed securities are securities issued bynon-governmental issuers and have no direct or indirect government guarantees of payment and are subject to various risks.Non-agency mortgage loans are obligations of the borrowers thereunder only and are not typically insured or guaranteed by any other person or entity. The ability of a borrower to repay a loan is dependent upon the income or assets of the borrower. A number of factors, including a general economic downturn, acts of God, terrorism, social unrest and civil disturbances, may impair a borrower’s ability to repay its loans.
Inflation-Indexed Bonds: Inflation-indexed bonds (other than municipal inflation-indexed and certain corporate inflation-indexed bonds) are fixed-income securities whose principal value is periodically adjusted according to the rate of inflation. If the index measuring inflation rises or falls, the principal value of inflation-indexed bonds (other than municipal inflation-indexed and certain corporate inflation-indexed bonds) will be adjusted upward or downward, and consequently the interest payable on these securities (calculated with respect to a larger or smaller principal amount) will be increased or reduced, respectively. Any upward or downward adjustment in the principal amount of an inflation-indexed bond will be included as interest income in the Statement of Operations, even though investors do not receive their principal until maturity. Repayment of the original bond principal upon maturity (as adjusted for inflation) is guaranteed in the case of U.S. Treasury inflation-indexed bonds. For bonds that do not provide a similar guarantee, the adjusted principal value of the bond repaid at maturity may be less than the original principal. With regard to municipal inflation-indexed bonds and certain corporate inflation-indexed bonds, the inflation adjustment is typically reflected in the semi-annual coupon payment. As a result, the principal value of municipal inflation-indexed bonds and such corporate inflation-indexed bonds does not adjust according to the rate of inflation.
| | |
| 46 | | 2018 BLACKROCK ANNUAL REPORTTO SHAREHOLDERS |
Notes to Financial Statements (continued)
Multiple Class Pass-Through Securities: Multiple class pass-through securities, including collateralized mortgage obligations (“CMOs”) and commercial mortgage-backed securities, may be issued by Ginnie Mae, U.S. Government agencies or instrumentalities or by trusts formed by private originators of, or investors in, mortgage loans. In general, CMOs are debt obligations of a legal entity that are collateralized by a pool of residential or commercial mortgage loans or Mortgage Assets. The payments on these are used to make payments on the CMOs or multiple pass-through securities. Multiple class pass-through securities represent direct ownership interests in the Mortgage Assets. Classes of CMOs include interest only (“IOs”), principal only (“POs”), planned amortization classes and targeted amortization classes. IOs and POs are stripped mortgage-backed securities representing interests in a pool of mortgages, the cash flow from which has been separated into interest and principal components. IOs receive the interest portion of the cash flow while POs receive the principal portion. IOs and POs can be extremely volatile in response to changes in interest rates. As interest rates rise and fall, the value of IOs tends to move in the same direction as interest rates. POs perform best when prepayments on the underlying mortgages rise since this increases the rate at which the principal is returned and the yield to maturity on the PO. When payments on mortgages underlying a PO are slower than anticipated, the life of the PO is lengthened and the yield to maturity is reduced. If the underlying Mortgage Assets experience greater than anticipated prepayments of principal, a fund’s initial investment in the IOs may not fully recoup.
Stripped Mortgage-Backed Securities:Stripped mortgage-backed securities are typically issued by the U.S. Government, its agencies and instrumentalities. Stripped mortgage-backed securities are usually structured with two classes that receive different proportions of the interest (IOs) and principal (POs) distributions on a pool of Mortgage Assets. Stripped mortgage-backed securities may be privately issued.
Zero-Coupon Bonds: Zero-coupon bonds are normally issued at a significant discount from face value and do not provide for periodic interest payments. These bonds may experience greater volatility in market value than other debt obligations of similar maturity which provide for regular interest payments.
TBA Commitments:TBA commitments are forward agreements for the purchase or sale of mortgage-backed securities for a fixed price, with payment and delivery on an agreed upon future settlement date. The specific securities to be delivered are not identified at the trade date. However, delivered securities must meet specified terms, including issuer, rate and mortgage terms. When entering into TBA commitments, the fund may take possession of or deliver the underlying mortgage-backed securities but can extend the settlement or roll the transaction. TBA commitments involve a risk of loss if the value of the security to be purchased or sold declines or increases, respectively, prior to settlement date.
In order to better define contractual rights and to secure rights that will help the fund mitigate its counterparty risk, TBA commitments may be entered into by the fund under Master Securities Forward Transaction Agreements (each, an “MSFTA”). An MSFTA typically contains, among other things, collateral posting terms and netting provisions in the event of default and/or termination event. The collateral requirements are typically calculated by netting themark-to-market amount for each transaction under such agreement and comparing that amount to the value of the collateral currently pledged by a fund and the counterparty. Cash collateral that has been pledged to cover the obligations of the fund and cash collateral received from the counterparty, if any, is reported separately in the Statement of Assets and Liabilities as cash pledged as collateral for TBA commitments or cash received as collateral for TBA commitments, respectively.Non-cash collateral pledged by a fund, if any, is noted in the Schedule of Investments. Typically, a fund is permitted to sell,re-pledge or use the collateral it receives; however, the counterparty is not permitted to do so. To the extent amounts due to a fund are not fully collateralized, contractually or otherwise, a fund bears the risk of loss from counterpartynon-performance.
Mortgage Dollar Roll Transactions: The Master Portfolio may sell TBA mortgage-backed securities and simultaneously contract to repurchase substantially similar (i.e., same type, coupon and maturity) securities on a specific future date at an agreed upon price. During the period between the sale and repurchase, a fund is not entitled to receive interest and principal payments on the securities sold. Mortgage dollar roll transactions are treated as purchases and sales and realize gains and losses on these transactions. Mortgage dollar rolls involve the risk that the market value of the securities that the fund is required to purchase may decline below the agreed upon repurchase price of those securities.
Securities Lending:The Master Portfolio may lend its securities to approved borrowers, such as brokers, dealers and other financial institutions. The borrower pledges and maintains with the Master Portfolio collateral consisting of cash, an irrevocable letter of credit issued by a bank, or securities issued or guaranteed by the U.S. Government. The initial collateral received by the Master Portfolio is required to have a value of at least 102% of the current value of the loaned securities for securities traded on U.S. exchanges and a value of at least 105% for all other securities. The collateral is maintained thereafter at a value equal to at least 100% of the current market value of the securities on loan. The market value of the loaned securities is determined at the close of each business day of the Master Portfolio and any additional required collateral is delivered to the Master Portfolio, or excess collateral returned by the Master Portfolio, on the next business day. During the term of the loan, the Master Portfolio is entitled to all distributions made on or in respect of the loaned securities, but does not receive interest income on securities received as collateral. Loans of securities are terminable at any time and the borrower, after notice, is required to return borrowed securities within the standard time period for settlement of securities transactions.
The market value of any securities on loan, all of which were classified as corporate bonds in the Master Portfolio’s Schedule of Investments, and the value of any related collateral are shown separately in the Statement of Assets and Liabilities as a component of investments at value — unaffiliated, and collateral on securities loaned at value, respectively. As of period end, any securities on loan were collateralized by cash and/or U.S. Government obligations. Cash collateral invested by the securities lending agent, BlackRock Institutional Trust Company, N.A. (“BTC”), if any, is disclosed in the Schedule of Investments.
Securities lending transactions are entered into by the Master Portfolio under Master Securities Lending Agreements (each, an “MSLA”), which provide the right, in the event of default (including bankruptcy or insolvency), for thenon-defaulting party to liquidate the collateral and calculate a net exposure to the defaulting party or request additional collateral. In the event that a borrower defaults, the Master Portfolio, as lender, would offset the market value of the collateral received against the market value of the securities loaned. When the value of the collateral is greater than that of the market value of the securities loaned, the lender is left with a net amount payable to the defaulting party. However, bankruptcy or insolvency laws of a particular jurisdiction may impose restrictions on or prohibitions against such a right of offset in the event of an MSLA counterparty’s bankruptcy or insolvency. Under the MSLA, absent an event of default, the borrower can resell orre-pledge the loaned securities, and the Master Portfolio can reinvest cash collateral received in connection with loaned securities. Upon an event of default, the parties’ obligations to return the securities or collateral to the other party are extinguished, and the parties can resell orre-pledge the loaned securities or the collateral received in connection with the loaned securities in order to satisfy the defaulting party’s net payment obligation for all transactions under the MSLA. The defaulting party remains liable for any deficiency.
| | | | |
| NOTESTO FINANCIAL STATEMENTS | | | 47 | |
Notes to Financial Statements (continued)
As of period end, the following table is a summary of the Master Portfolio’s securities lending agreements by counterparty which are subject to offset under an MSLA:
| | | | | | | | | | | | |
| Counterparty | | Securities
Loaned at Value | | | Cash Collateral
Received (a) | | | Net
Amount | |
Citigroup Global Markets Inc. | | $ | 2,433,000 | | | $ | (2,433,000 | ) | | $ | — | |
JP Morgan Securities LLC | | | 18,965,559 | | | | (18,965,559 | ) | | | — | |
Wells Fargo Bank, National Association | | | 7,299 | | | | (7,299 | ) | | | — | |
Wells Fargo Securities LLC | | | 6,975,087 | | | | (6,975,087 | ) | | | — | |
| | | | | | | | | | | | |
| | $ | 28,380,945 | | | $ | (28,380,945 | ) | | $ | — | |
| | | | | | | | | | | | |
| | (a) | Cash collateral with a value of $29,131,108 has been received in connection with securities lending agreements. Collateral received in excess of the value of securities loaned from the individual counterparty is not shown for financial reporting purposes in the table above. | |
The risks of securities lending include the risk that the borrower may not provide additional collateral when required or may not return the securities when due. To mitigate these risks, the Master Portfolio benefits from a borrower default indemnity provided by BlackRock, Inc. (“BlackRock”). BlackRock’s indemnity allows for full replacement of the securities loaned if the collateral received does not cover the value on the securities loaned in the event of borrower default. The Master Portfolio could incur a loss if the value of an investment purchased with cash collateral falls below the market value of loaned securities or if the value of an investment purchased with cash collateral falls below the value of the original cash collateral received.
| 5. | DERIVATIVE FINANCIAL INSTRUMENTS |
The Master Portfolio engages in various portfolio investment strategies using derivative contracts both to increase the returns of the Master Portfolio and/or to manage its exposure to certain risks such as credit risk, equity risk, interest rate risk, foreign currency exchange rate risk, commodity price risk or other risks (e.g., inflation risk). Derivative financial instruments categorized by risk exposure are included in the Schedule of Investments. These contracts may be transacted on an exchange or OTC.
Futures Contracts:Futures contracts are purchased or sold to gain exposure to, or manage exposure to, changes in interest rates (interest rate risk) and changes in the value of equity securities (equity risk) or foreign currencies (foreign currency exchange rate risk).
Futures contracts are agreements between the Master Portfolio and a counterparty to buy or sell a specific quantity of an underlying instrument at a specified price and on a specified date. Depending on the terms of a contract, it is settled either through physical delivery of the underlying instrument on the settlement date or by payment of a cash amount on the settlement date. Upon entering into a futures contract, the Master Portfolio is required to deposit initial margin with the broker in the form of cash or securities in an amount that varies depending on a contract’s size and risk profile. The initial margin deposit must then be maintained at an established level over the life of the contract. Amounts pledged, which are considered restricted, are included in cash pledged for futures contracts in the Statement of Assets and Liabilities.
Securities deposited as initial margin are designated in the Schedule of Investments and cash deposited, if any, is shown as cash pledged for futures contracts in the Statement of Assets and Liabilities. Pursuant to the contract, the Master Portfolio agrees to receive from or pay to the broker an amount of cash equal to the daily fluctuation in market value of the contract (“variation margin”). Variation margin is recorded as unrealized appreciation (depreciation) and, if any, shown as variation margin receivable (or payable) on futures contracts in the Statement of Assets and Liabilities. When the contract is closed, a realized gain or loss is recorded in the Statements of Operations equal to the difference between the notional amount of the contract at the time it was opened and the notional amount at the time it was closed. The use of futures contracts involves the risk of an imperfect correlation in the movements in the price of futures contracts and interest, foreign currency exchange rates or underlying assets.
Forward Foreign Currency Exchange Contracts: Forward foreign currency exchange contracts are entered into to gain or reduce exposure to foreign currencies (foreign currency exchange rate risk).
A forward foreign currency exchange contract is an agreement between two parties to buy and sell a currency at a set exchange rate on a specified date. These contracts help to manage the overall exposure to the currencies in which some of the investments held by the Master Portfolio are denominated and in some cases, may be used to obtain exposure to a particular market.
The contract ismarked-to-market daily and the change in market value is recorded as unrealized appreciation (depreciation) in the Statement of Assets and Liabilities. When a contract is closed, a realized gain or loss is recorded in the Statement of Operations equal to the difference between the value at the time it was opened and the value at the time it was closed.Non-deliverable forward foreign currency exchange contracts are settled with the counterparty in cash without the delivery of foreign currency. The use of forward foreign currency exchange contracts involves the risk that the value of a forward foreign currency exchange contract changes unfavorably due to movements in the value of the referenced foreign currencies. Cash amounts pledged for forward foreign currency exchange contracts are considered restricted and are included in cash pledged as collateral for OTC derivatives in the Statement of Assets and Liabilities.
Options:The Master Portfolio purchases and writes call and put options to increase or decrease its exposure to the risks of underlying instruments, including equity risk, interest rate risk and/or commodity price risk and/or, in the case of options written, to generate gains from options premiums.
A call option gives the purchaser (holder) of the option the right (but not the obligation) to buy, and obligates the seller (writer) to sell (when the option is exercised) the underlying instrument at the exercise or strike price at any time or at a specified time during the option period. A put option gives the holder the right to sell and obligates the writer to buy the underlying instrument at the exercise or strike price at any time or at a specified time during the option period.
Premiums paid on options purchased and premiums received on options written, as well as the daily fluctuation in market value, are included in investments at value – unaffiliated and options written at value, respectively, in the Statement of Assets and Liabilities. When an instrument is purchased or sold through the exercise of an option, the premium is offset against the cost or proceeds of the underlying instrument. When an option expires, a realized gain or loss is recorded in the Statement of Operations
| | |
| 48 | | 2018 BLACKROCK ANNUAL REPORTTO SHAREHOLDERS |
Notes to Financial Statements (continued)
to the extent of the premiums received or paid. When an option is closed or sold, a gain or loss is recorded in the Statement of Operations to the extent the cost of the closing transaction exceeds the premiums received or paid. When a fund writes a call option, such option is typically “covered,” meaning that it holds the underlying instrument subject to being called by the option counterparty. When a fund writes a put option, such option is covered by cash in an amount sufficient to cover the obligation. These amounts, which are considered restricted, are included in cash pledged as collateral for options written in the Statement of Assets and Liabilities.
| | • | | Swaptions — The Master Portfolio purchases and writes options on swaps (“swaptions”) primarily to preserve a return or spread on a particular investment or portion of the Master Portfolio’s holdings, as a duration management technique or to protect against an increase in the price of securities it anticipates purchasing at a later date. The purchaser and writer of a swaption is buying or granting the right to enter into a previously agreed upon interest rate or credit default swap agreement (interest rate risk and/or credit risk) at any time before the expiration of the option. |
| | • | | Foreign currency options — The Master Portfolio purchases and writes foreign currency options, foreign currency futures and options on foreign currency futures to gain or reduce exposure to foreign currencies (foreign currency exchange rate risk). Foreign currency options give the purchaser the right to buy from or sell to the writer a foreign currency at any time before the expiration of the option. |
In purchasing and writing options, the Master Portfolio bears the risk of an unfavorable change in the value of the underlying instrument or the risk that it may not be able to enter into a closing transaction due to an illiquid market. Exercise of a written option could result in the Master Portfolio purchasing or selling a security when it otherwise would not, or at a price different from the current market value.
Swaps:Swap contracts are entered into to manage exposure to issuers, markets and securities. Such contracts are agreements between the Master Portfolio and a counterparty to make periodic net payments on a specified notional amount or a net payment upon termination. Swap agreements are privately negotiated in the OTC market and may be entered into as a bilateral contract (“OTC swaps”) or centrally cleared (“centrally cleared swaps”).
For OTC swaps, any upfront premiums paid and any upfront fees received are shown as swap premiums paid and swap premiums received, respectively, in the Statement of Assets and Liabilities and amortized over the term of the contract. The daily fluctuation in market value is recorded as unrealized appreciation (depreciation) on OTC Swaps in the Statement of Assets and Liabilities. Payments received or paid are recorded in the Statement of Operations as realized gains or losses, respectively. When an OTC swap is terminated, a realized gain or loss is recorded in the Statement of Operations equal to the difference between the proceeds from (or cost of) the closing transaction and the Master Portfolio’s basis in the contract, if any. Generally, the basis of the contract is the premium received or paid.
In a centrally cleared swap, immediately following execution of the swap contract, the swap contract is novated to a central counterparty (the “CCP”) and the Master Portfolio’s counterparty on the swap agreement becomes the CCP. The Master Portfolio is required to interface with the CCP through the broker. Upon entering into a centrally cleared swap, the Master Portfolio is required to deposit initial margin with the broker in the form of cash or securities in an amount that varies depending on the size and risk profile of the particular swap. Securities deposited as initial margin are designated in the Schedule of Investments and cash deposited is shown as cash pledged for centrally cleared swaps in the Statement of Assets and Liabilities. Amounts pledged, which are considered restricted cash, are included in cash pledged for centrally cleared swaps in the Statement of Assets and Liabilities. Pursuant to the contract, the Master Portfolio agrees to receive from or pay to the broker an amount of cash equal to the daily fluctuation in market value of the contract (“variation margin”). Variation margin is recorded as unrealized appreciation (depreciation) and shown as variation margin receivable (or payable) on centrally cleared swaps in the Statement of Assets and Liabilities. Payments received from (paid to) the counterparty, including at termination, are recorded as realized gains (losses) in the Statement of Operations.
| | • | | Credit default swaps — Credit default swaps are entered into to manage exposure to the market or certain sectors of the market, to reduce risk exposure to defaults of corporate and/or sovereign issuers or to create exposure to corporate and/or sovereign issuers to which a Master Portfolio is not otherwise exposed (credit risk). |
The Master Portfolio may either buy or sell (write) credit default swaps on single-name issuers (corporate or sovereign), a combination or basket of single-name issuers or traded indexes. Credit default swaps are agreements in which the protection buyer pays fixed periodic payments to the seller in consideration for a promise from the protection seller to make a specific payment should a negative credit event take place with respect to the referenced entity (e.g., bankruptcy, failure to pay, obligation acceleration, repudiation, moratorium or restructuring). As a buyer, if an underlying credit event occurs, the Master Portfolio will either (i) receive from the seller an amount equal to the notional amount of the swap and deliver the referenced security or underlying securities comprising the index, or (ii) receive a net settlement of cash equal to the notional amount of the swap less the recovery value of the security or underlying securities comprising the index. As a seller (writer), if an underlying credit event occurs, the Master Portfolio will either pay the buyer an amount equal to the notional amount of the swap and take delivery of the referenced security or underlying securities comprising the index or pay a net settlement of cash equal to the notional amount of the swap less the recovery value of the security or underlying securities comprising the index.
| | • | | Total return swaps — Total return swaps are entered into to obtain exposure to a security or market without owning such security or investing directly in such market or to exchange the risk/return of one market (e.g., fixed-income) with another market (e.g., equity or commodity prices) (equity risk, commodity price risk and/or interest rate risk). |
Total return swaps are agreements in which there is an exchange of cash flows whereby one party commits to make payments based on the total return (distributions plus capital gains/losses) of an underlying instrument, or basket or underlying instruments, in exchange for fixed or floating rate interest payments. If the total return of the instrument(s) or index underlying the transaction exceeds or falls short of the offsetting fixed or floating interest rate obligation, the Master Portfolio receives payment from or makes a payment to the counterparty.
| | • | | Interest rate swaps — Interest rate swaps are entered into to gain or reduce exposure to interest rates or to manage duration, the yield curve or interest rate (interest rate risk). |
Interest rate swaps are agreements in which one party pays a stream of interest payments, either fixed or floating, in exchange for another party’s stream of interest payments, either fixed or floating, on the same notional amount for a specified period of time. In more complex interest rate swaps, the notional principal amount may decline (or amortize) over time.
| | | | |
| NOTESTO FINANCIAL STATEMENTS | | | 49 | |
Notes to Financial Statements (continued)
| | • | | Forward swaps — The Master Portfolio enters into forward interest rate swaps and forward total return swaps. In a forward swap, the Master Portfolio and the counterparty agree to make periodic net payments beginning on a specified date or a net payment at termination. |
| | • | | Inflation swaps — Inflation swaps are entered into to gain or reduce exposure to inflation (inflation risk). In an inflation swap, one party makes fixed interest payments on a notional principal amount in exchange for another party’s variable payments based on an inflation index, such as the Consumer Price Index. |
Swap transactions involve, to varying degrees, elements of interest rate, credit and market risk in excess of the amounts recognized in the Statement of Assets and Liabilities. Such risks involve the possibility that there will be no liquid market for these agreements, that the counterparty to the agreements may default on its obligation to perform or disagree as to the meaning of the contractual terms in the agreements, and that there may be unfavorable changes in interest rates and/or market values associated with these transactions.
Master Netting Arrangements: In order to define its contractual rights and to secure rights that will help it mitigate its counterparty risk, the Master Portfolio may enter into an International Swaps and Derivatives Association, Inc. Master Agreement (“ISDA Master Agreement”) or similar agreement with its counterparties. An ISDA Master Agreement is a bilateral agreement between the Master Portfolio and a counterparty that governs certain OTC derivatives and typically contains, among other things, collateral posting terms and netting provisions in the event of a default and/or termination event. Under an ISDA Master Agreement, the Master Portfolio may, under certain circumstances, offset with the counterparty certain derivative financial instruments’ payables and/or receivables with collateral held and/or posted and create one single net payment. The provisions of the ISDA Master Agreement typically permit a single net payment in the event of default including the bankruptcy or insolvency of the counterparty. Bankruptcy or insolvency laws of a particular jurisdiction may restrict or prohibit the right of offset in bankruptcy, insolvency or other events.
Collateral Requirements: For derivatives traded under an ISDA Master Agreement, the collateral requirements are typically calculated by netting themark-to-market amount for each transaction under such agreement and comparing that amount to the value of any collateral currently pledged by the Master Portfolio and the counterparty.
Cash collateral that has been pledged to cover obligations of the Master Portfolio and cash collateral received from the counterparty, if any, is reported separately in the Statement of Assets and Liabilities as cash pledged as collateral and cash received as collateral, respectively.Non-cash collateral pledged by the Master Portfolio, if any, is noted in the Schedule of Investments. Generally, the amount of collateral due from or to a counterparty is subject to a certain minimum transfer amount threshold before a transfer is required, which is determined at the close of business of the Master Portfolio. Any additional required collateral is delivered to/pledged by the Master Portfolio on the next business day. Typically, the counterparty is not permitted to sell,re-pledge or use cash andnon-cash collateral it receives. The Master Portfolio generally agrees not to usenon-cash collateral that it receives but may, absent default or certain other circumstances defined in the underlying ISDA Master Agreement, be permitted to use cash collateral received. In such cases, interest may be paid pursuant to the collateral arrangement with the counterparty. To the extent amounts due to the Master Portfolio from its counterparties are not fully collateralized, it bears the risk of loss from counterpartynon-performance. Likewise, to the extent the Master Portfolio has delivered collateral to a counterparty and stands ready to perform under the terms of its agreement with such counterparty, it bears the risk of loss from a counterparty in the amount of the value of the collateral in the event the counterparty fails to return such collateral. Based on the terms of agreements, collateral may not be required for all derivative contracts.
For financial reporting purposes, the Master Portfolio does not offset derivative assets and derivative liabilities that are subject to netting arrangements, if any, in the Statement of Assets and Liabilities.
| 6. | INVESTMENT ADVISORY AGREEMENT AND OTHER TRANSACTIONS WITH AFFILIATES |
MIP II, on behalf of the Master Portfolio, entered into an Investment Advisory Agreement with the Manager, the Master Portfolio’s investment adviser and an indirect, wholly-owned subsidiary of BlackRock, to provide investment advisory services. The Manager is responsible for the management of Master Portfolio’s portfolio and provides the personnel, facilities, equipment and certain other services necessary to the operations of the Master Portfolio.
For such services, the Master Portfolio pays the Manager a monthly fee at an annual rate equal to the following percentages of the average daily value of the Master Portfolio’s net assets.
| | | | |
| Average Daily Net Assets | | Investment
Advisory Fees | |
First $1 Billion | | | 0.24 | % |
$1 Billion — $3 Billion | | | 0.23 | |
$3 Billion — $5 Billion | | | 0.22 | |
$5 Billion — $10 Billion | | | 0.21 | |
Greater than $10 Billion | | | 0.20 | |
Prior to November 19, 2018, the rates were as follows:
| | | | |
| Average Daily Net Assets | | Investment
Advisory Fees | |
First $1 Billion | | | 0.25 | % |
$1 Billion — $3 Billion | | | 0.24 | |
$3 Billion — $5 Billion | | | 0.23 | |
$5 Billion — $10 Billion | | | 0.22 | |
Greater than $10 Billion | | | 0.21 | |
| | |
| 50 | | 2018 BLACKROCK ANNUAL REPORTTO SHAREHOLDERS |
Notes to Financial Statements (continued)
With respect to the Master Portfolio, the Manager entered into separatesub-advisory agreements with BlackRock International Limited (“BIL”) and BlackRock Fund Advisors (“BFA”) (collectively, the“Sub-Advisers”), each an affiliate of the Manager. The Manager pays each Sub-Adviser for services it provides for that portion of the Master Portfolio for which it acts assub-adviser, a monthly fee that is equal to a percentage of the investment advisory fees paid by the Master Portfolio to the Manager.
Expense Waivers and Reimbursements:The fees and expenses of MIP II’s trustees who are not “interested persons” of MIP II, as defined in the 1940 Act (“Independent Trustees”), counsel to the Independent Trustees and MIP II’s independent registered public accounting firm (together, the “independent expenses”) are paid directly by the Master Portfolio. The Manager has contractually agreed to reimburse the Master Portfolio or provide an offsetting credit against the administration fees paid by the Master Portfolio in an amount equal to these independent expenses through April 30, 2021. For the year ended December 31, 2018, the amount waived was $68,015.
With respect to the Master Portfolio, the Manager voluntarily agreed to waive its investment advisory fees by the amount of investment advisory fees the Master Portfolio pays to the Manager indirectly through its investment in affiliated money market funds (the “affiliated money market fund waiver”). This amount is included in fees waived and/or reimbursed by the Manager in the Statement of Operations. For the year ended December 31, 2018, the amounts waived was $42,613.
The Manager has contractually agreed to waive its investment advisory fee with respect to any portion of the Master Portfolio’s assets invested in affiliated equity and fixed-income mutual funds and affiliated exchange-traded funds that have a contractual management fee through April 30, 2021. The contractual agreement may be terminated upon 90 days’ notice by a majority of the Independent Trustees, or by a vote of a majority of the outstanding voting securities of the the Master Portfolio. This amount is included in fees waived and/or reimbursed by the Manager in the Statement of Operations. For the year ended December 31, 2018, the the Master Portfolio waived $65,954 in investment advisory fees pursuant to this arrangement.
The Master Portfolio has begun to incur expenses in connection with a realignment and consolidation of the boards of trustees of certain BlackRock-advised funds. The Manager has voluntarily agreed to reimburse the Master Portfolio for all or a portion of such expenses, which amounts are included in fees waived and/or reimbursed by the Manager in the Statement of Operations. For the year ended December 31, 2018, the amount reimbursed was $108,222.
Securities Lending:The U.S. Securities and Exchange Commission (“SEC”) has issued an exemptive order which permits BTC, an affiliate of the Manager, to serve as securities lending agent for the Master Portfolio, subject to applicable conditions. As securities lending agent, BTC bears all operational costs directly related to securities lending. The Master Portfolio is responsible for fees in connection with the investment of cash collateral received for securities on loan (the “collateral investment fees”). The cash collateral is invested in a money market fund managed by the Manager or its affiliates. However, BTC has agreed to reduce the amount of securities lending income it receives in order to effectively limit the collateral investment fees the Master Portfolio bears to an annual rate of 0.04%. Such money market fund shares will not be subject to a sales load, distribution fee or service fee. The money market fund in which the cash collateral has been invested may, under certain circumstances, impose a liquidity fee of up to 2% of the value redeemed or temporarily restrict redemptions for up to 10 business days during a 90 day period, in the event that the money market fund’s weekly liquid assets fall below certain thresholds
Securities lending income is equal to the total of income earned from the reinvestment of cash collateral, net of fees and other payments to and from borrowers of securities, and less the collateral investment fees. The Master Portfolio retains a portion of securities lending income and remits a remaining portion to BTC as compensation for its services as securities lending agent.
Pursuant to such agreement, the Master Portfolio retains 80% of securities lending income, and this amount retained can never be less than 70% of the total of securities lending income plus the collateral investment fees. In addition, commencing the business day following the date that the aggregate securities lending income earned across certain funds in the Equity-Liquidity Complex in a calendar year exceeds a specified threshold, the Master Portfolio, pursuant to the securities lending agreement, will retain for the remainder of the calendar year securities lending income in an amount equal to 85% of securities lending income, and this amount retained can never be less than 70% of the total of securities lending income plus the collateral investment fees.
The share of securities lending income earned by the Master Portfolio is shown as securities lending income — affiliated — net in the Statement of Operations. For the year ended December 31, 2018, the Master Portfolio paid BTC $88,228 in total for securities lending agent services and collateral investment fees.
Interfund Lending: In accordance with an exemptive order (the “Order”) from the SEC, the Master Portfolio may participate in a joint lending and borrowing facility for temporary purposes (the “Interfund Lending Program”), subject to compliance with the terms and conditions of the Order, and to the extent permitted by the Master Portfolio’s investment policies and restrictions. The Master Portfolio is currently permitted to borrow and lend under the Interfund Lending Program.
A lending BlackRock fund may lend in aggregate up to 15% of its net assets, but may not lend more than 5% of its net assets to any one borrowing fund through the Interfund Lending Program. A borrowing BlackRock fund may not borrow through the Interfund Lending Program or from any other source more than 33 1/3% of its total assets (or any lower threshold provided for by the fund’s investment restrictions). If a borrowing BlackRock fund’s total outstanding borrowings exceed 10% of its total assets, each of its outstanding interfund loans will be subject to collateralization of at least 102% of the outstanding principal value of the loan. All interfund loans are for temporary or emergency purposes and the interest rate to be charged will be the average of the highest current overnight repurchase agreement rate available to a lending fund and the bank loan rate, as calculated according to a formula established by the Board.
During the year ended December 31, 2018, the Master Portfolio did not participate in the Interfund Lending Program.
Trustees and Officers:Certain trustees and/or officers of the Master Portfolio are trustees and/or officers of BlackRock or its affiliates.
| | | | |
| NOTESTO FINANCIAL STATEMENTS | | | 51 | |
Notes to Financial Statements (continued)
For the year ended December 31, 2018, purchases and sales of investments including paydowns and mortgage dollar rolls and excluding short-term securities and in-kind contributions, were as follows:
| | | | | | | | |
| | | Purchases | | | Sales | |
Non-U.S. Government Securities | | $ | 3,593,121,257 | | | $ | 3,245,233,388 | |
U.S. Government Securities | | | 42,237,935 | | | | 42,059,025 | |
For the year ended December 31, 2018, purchases and sales related to mortgage dollar rolls were $1,401,377,600 and $1,402,795,291, respectively.
The Master Portfolio is classified as a partnership for U.S. federal income tax purposes. As such, each investor in the Master Portfolio is treated as the owner of its proportionate share of net assets, income, expenses and realized and unrealized gains and losses of the Master Portfolio. Therefore, no U.S. federal income tax provision is required. It is intended that the Master Portfolio’s assets will be managed so an investor in the Master Portfolio can satisfy the requirements of Subchapter M of the Internal Revenue Code of 1986, as amended.
The Master Portfolio files U.S. federal and various state and local tax returns. No income tax returns are currently under examination. The statute of limitations on the Master Portfolio’s U.S. federal tax returns generally remains open for each of the four years ended December 31, 2018. The statutes of limitations on the Master Portfolio’s state and local tax returns may remain open for an additional year depending upon the jurisdiction.
Management has analyzed tax laws and regulations and their application to the Master Portfolio as of December 31, 2018, inclusive of the open tax return years, and does not believe that there are any uncertain tax positions that require recognition of a tax liability in the Master Portfolio’s financial statements.
As of December 31, 2018, gross unrealized appreciation and depreciation for investments and derivatives based on cost for U.S. federal income tax purposes were as follows:
| | | | |
Tax cost | | $ | 1,735,964,707 | |
| | | | |
Gross unrealized appreciation | | $ | 28,043,329 | |
Gross unrealized depreciation | | | (49,069,714 | ) |
| | | | |
Net unrealized appreciation (depreciation) | | $ | 21,026,385 | |
| | | | |
MIP II, on behalf of the Master Portfolio, along with certain other funds managed by the Manager and its affiliates (“Participating Funds”), is a party to a364-day, $2.25 billion credit agreement with a group of lenders. Under this agreement, the Master Portfolio may borrow to fund shareholder redemptions. Excluding commitments designated for certain individual funds, the Participating Funds, including the Master Portfolio, can borrow up to an aggregate commitment amount of $1.75 billion at any time outstanding, subject to asset coverage and other limitations as specified in the agreement. The credit agreement has the following terms: a fee of 0.10% per annum on unused commitment amounts and interest at a rate equal to the higher of(a) one-month LIBOR (but, in any event, not less than 0.00%) on the date the loan is made plus 0.80% per annum or (b) the Fed Funds rate (but, in any event, not less than 0.00%) in effect from time to time plus 0.80% per annum on amounts borrowed. The agreement expires in April 2019 unless extended or renewed. Prior to April 19, 2018 the aggregate commitment amount was $2.1 billion and the fee was 0.12% per annum. Participating Funds paid an upfront commitment fee of 0.02% on the total commitment amounts, in addition to administration, legal and arrangement fees, which are included in miscellaneous expenses in the Statement of Operations. These fees were allocated among such funds based upon portions of the aggregate commitment available to them and relative net assets of Participating Funds. During the year ended December 31, 2018, the Master Portfolio did not borrow under the credit agreement.
Many municipalities insure repayment of their bonds, which may reduce the potential for loss due to credit risk. The market value of these bonds may fluctuate for other reasons, including market perception of the value of such insurance, and there is no guarantee that the insurer will meet its obligation.
Inventories of municipal bonds held by brokers and dealers may decrease, which would lessen their ability to make a market in these securities. Such a reduction in market making capacity could potentially decrease the Master Portfolio’s ability to buy or sell bonds. As a result, the Master Portfolio may sell a security at a lower price, sell other securities to raise cash, or give up an investment opportunity, any of which could have a negative impact on performance. If the Master Portfolio needed to sell large blocks of bonds, those sales could further reduce the bonds’ prices and impact performance.
In the normal course of business, the Master Portfolio invests in securities or other instruments and may enter into certain transactions, and such activities subject the Master Portfolio to various risks, including among others, fluctuations in the market (market risk) or failure of an issuer to meet all of its obligations. The value of securities or other instruments may also be affected by various factors, including, without limitation: (i) the general economy; (ii) the overall market as well as local, regional or global political and/or social instability; (iii) regulation, taxation or international tax treaties between various countries; or (iv) currency, interest rate and price fluctuations. The Master Portfolio’s prospectus provides details of the risks to which the Master Portfolio is subject.
The Master Portfolio may be exposed to prepayment risk, which is the risk that borrowers may exercise their option to prepay principal earlier than scheduled during periods of declining interest rates, which would force the Master Portfolio to reinvest in lower yielding securities. The Master Portfolio may also be exposed to reinvestment
| | |
| 52 | | 2018 BLACKROCK ANNUAL REPORTTO SHAREHOLDERS |
Notes to Financial Statements (continued)
risk, which is the risk that income from the Master Portfolio’s portfolio will decline if the Master Portfolio invests the proceeds from matured, traded or called fixed-income securities at market interest rates that are below the Master Portfolio portfolio’s current earnings rate.
The Master Portfolio may be exposed to additional risks when reinvesting cash collateral in money market funds that do not seek to maintain a stable NAV per share of $1.00, which may be subject to redemption gates or liquidity fees under certain circumstances.
Counterparty Credit Risk:The Master Portfolio may be exposed to counterparty credit risk, or the risk that an entity may fail to or be unable to perform on its commitments related to unsettled or open transactions. The Master Portfolio manages counterparty credit risk by entering into transactions only with counterparties that the Manager believes have the financial resources to honor their obligations and by monitoring the financial stability of those counterparties. Financial assets, which potentially expose the Master Portfolio to market, issuer and counterparty credit risks, consist principally of financial instruments and receivables due from counterparties. The extent of the Master Portfolio’s exposure to market, issuer and counterparty credit risks with respect to these financial assets is approximately their value recorded in the Statement of Assets and Liabilities, less any collateral held by the Master Portfolio.
A derivative contract may suffer amark-to-market loss if the value of the contract decreases due to an unfavorable change in the market rates or values of the underlying instrument. Losses can also occur if the counterparty does not perform under the contract.
The Master Portfolio’s risk of loss from counterparty credit risk on OTC derivatives is generally limited to the aggregate unrealized gain less the value of any collateral held by the Master Portfolio.
For OTC options purchased, the Master Portfolio bears the risk of loss in the amount of the premiums paid plus the positive change in market values net of any collateral held by the Master Portfolio should the counterparty fail to perform under the contracts. Options written by the Master Portfolio do not typically give rise to counterparty credit risk, as options written generally obligate the Master Portfolio and not the counterparty, to perform. The Master Portfolio may be exposed to counterparty credit risk with respect to options written to the extent the Master Portfolio deposits collateral with its counterparty to a written option.
With exchange-traded futures and centrally cleared swaps, there is less counterparty credit risk to the Master Portfolio since the exchange or clearinghouse, as counterparty to such instruments, guarantees against a possible default. The clearinghouse stands between the buyer and the seller of the contract; therefore, credit risk is limited to failure of the clearinghouse. While offset rights may exist under applicable law, the Master Portfolio does not have a contractual right of offset against a clearing broker or clearinghouse in the event of a default (including the bankruptcy or insolvency). Additionally, credit risk exists in exchange-traded futures and centrally cleared swaps with respect to initial and variation margin that is held in a clearing broker’s customer accounts. While clearing brokers are required to segregate customer margin from their own assets, in the event that a clearing broker becomes insolvent or goes into bankruptcy and at that time there is a shortfall in the aggregate amount of margin held by the clearing broker for all its clients, typically the shortfall would be allocated on a pro rata basis across all the clearing broker’s customers, potentially resulting in losses to the Master Portfolio.
Concentration Risk:The Master Portfolio invests a significant portion of its assets in fixed-income securities and/or uses derivatives tied to the fixed-income markets. Changes in market interest rates or economic conditions may affect the value and/or liquidity of such investments. Interest rate risk is the risk that prices of bonds and other fixed-income securities will increase as interest rates fall and decrease as interest rates rise. The Master Portfolio may be subject to a greater risk of rising interest rates due to the current period of historically low rates. The Federal Reserve has begun to raise the Federal Funds rate, and each increase results in more pronounced interest rate risk in the current market environment.
The Master Portfolio invests a significant portion of its assets in securities backed by commercial or residential mortgage loans or in issuers that hold mortgage and other asset-backed securities. Investment percentages in these securities are presented in the Schedule of Investments. Changes in economic conditions, including delinquencies and/or defaults on assets underlying these securities, can affect the value, income and/or liquidity of such positions.
Management has evaluated the impact of all subsequent events on the Master Portfolio through the date the financial statements were issued and has determined that there were no subsequent events requiring adjustment or additional disclosure in the financial statements.
| | | | |
| NOTESTO FINANCIAL STATEMENTS | | | 53 | |
| | |
| Report of Independent Registered Public Accounting Firm | | CoreAlpha Bond Master Portfolio |
To the Board of Trustees of
Master Investment Portfolio II and the Investors of CoreAlpha Bond Master Portfolio
Opinion on the Financial Statements
We have audited the accompanying statement of assets and liabilities, including the schedule of investments, of CoreAlpha Bond Master Portfolio (the “Master Portfolio”) as of December 31, 2018, the related statement of operations for the year ended December 31, 2018, the statement of changes in net assets for each of the two years in the period ended December 31, 2018, including the related notes, and the financial highlights for each of the five years in the period ended December 31, 2018 (collectively referred to as the “financial statements”). In our opinion, the financial statements present fairly, in all material respects, the financial position of the Master Portfolio as of December 31, 2018, the results of its operations for the year then ended, the changes in its net assets for each of the two years in the period ended December 31, 2018 and the financial highlights for each of the five years in the period ended December 31, 2018 in conformity with accounting principles generally accepted in the United States of America.
Basis for Opinion
These financial statements are the responsibility of the Master Portfolio’s management. Our responsibility is to express an opinion on the Master Portfolio’s financial statements based on our audits. We are a public accounting firm registered with the Public Company Accounting Oversight Board (United States) (“PCAOB”) and are required to be independent with respect to the Master Portfolio in accordance with the U.S. federal securities laws and the applicable rules and regulations of the Securities and Exchange Commission and the PCAOB.
We conducted our audits of these financial statements in accordance with the standards of the PCAOB. Those standards require that we plan and perform the audit to obtain reasonable assurance about whether the financial statements are free of material misstatement, whether due to error or fraud.
Our audits included performing procedures to assess the risks of material misstatement of the financial statements, whether due to error or fraud, and performing procedures that respond to those risks. Such procedures included examining, on a test basis, evidence regarding the amounts and disclosures in the financial statements. Our audits also included evaluating the accounting principles used and significant estimates made by management, as well as evaluating the overall presentation of the financial statements. Our procedures included confirmation of securities owned as of December 31, 2018 by correspondence with the custodian, transfer agent and brokers; when replies were not received from brokers, we performed other auditing procedures. We believe that our audits provide a reasonable basis for our opinion.
/s/PricewaterhouseCoopers LLP
Philadelphia, Pennsylvania
February 27, 2019
We have served as the auditor of one or more BlackRock investment companies since 2000.
| | |
| 54 | | 2018 BLACKROCK ANNUAL REPORTTO SHAREHOLDERS |
Disclosure of Investment Advisory Agreement andSub-Advisory Agreements
The Board of Trustees of Master Investment Portfolio II (the “Master Fund”) met in person onMay 17-18, 2018 (the “Organizational Meeting”) to consider the initial approval of the investment advisory agreement (the “Advisory Agreement”) between the Master Fund, on behalf of CoreAlpha Bond Master Portfolio (the “Master Portfolio”), a series of the Master Fund, and BlackRock Advisors, LLC (the “Manager”), the Master Fund’s investment advisor. The Board of Trustees of the Master Fund also considered the approval of thesub-advisory agreement between the Manager and BlackRock Fund Advisors (“BFA”) with respect to the Master Portfolio (the “BFASub-Advisory Agreement”) and thesub-advisory agreement between the Manager and BlackRock International Limited (“BIL,” and together with BFA, the“Sub-Advisors”) with respect to the Master Portfolio (the “BILSub-Advisory Agreement,” and together with the BFASub-Advisory Agreement, the“Sub-Advisory Agreements”). BlackRock CoreAlpha Bond Fund (the “Portfolio”), a series of BlackRock Funds VI (the “Fund”), is a “feeder” fund that invests all of its investable assets in the Master Portfolio. Accordingly, the Board of Trustees of the Fund also considered the approval of the Advisory Agreement and theSub-Advisory Agreements with respect to the Master Portfolio. The Manager and theSub-Advisors are referred to herein as “BlackRock.” The Advisory Agreement and theSub-Advisory Agreements are referred to herein as the “Agreements.” For simplicity: (a) the Board of Trustees of the Master Fund and the Board of Trustees of the Fund are referred to herein collectively as the “Board,” and the members are referred to as “Board Members;” and (b) the shareholders of the Portfolio and the interest holders of the Master Portfolio are referred to as “shareholders.”
On September 17, 2018, the Portfolio acquired the assets, subject to the liabilities, of BlackRock CoreAlpha Bond Fund (the “Predecessor Portfolio”), a series of BlackRock Funds III (the “Predecessor Fund”), through a reorganization (the “Reorganization”). The Predecessor Portfolio was a “feeder” fund that invested all of its investable assets in CoreAlpha Bond Master Portfolio (the “Predecessor Master Portfolio”), a series of Master Investment Portfolio (the “Predecessor Master Fund”). The Portfolio has the same investment objectives, strategies and policies, portfolio management team and contractual arrangements, including the same contractual fees and expenses, as the Predecessor Portfolio. As a result of the Reorganization, the Portfolio adopted the performance and financial history of the Predecessor Portfolio. The Advisory Agreement is substantially similar to the advisory agreement (the “Predecessor Advisory Agreement”) between the Predecessor Master Fund, on behalf of the Predecessor Master Portfolio, and the Manager. Similarly, the BFASub-Advisory Agreement is substantially similar to thesub-advisory agreement between the Manager and BFA with respect to the Predecessor Master Portfolio (the “Predecessor BFASub-Advisory Agreement”), and the BILSub-Advisory Agreement is substantially similar to thesub-advisory agreement between the Manager and BIL with respect to the Predecessor Master Portfolio (the “Predecessor BILSub-Advisory Agreement,” and together with the Predecessor BFASub-Advisory Agreement, the “PredecessorSub-Advisory Agreements”). The Predecessor Advisory Agreement and the PredecessorSub-Advisory Agreements are referred to herein collectively as the “Predecessor Agreements.”
Activities and Composition of the Board
On the date of the Organizational Meeting, the Board consisted of thirteen individuals, eleven of whom were not “interested persons” of the Master Fund or the Fund as defined in the Investment Company Act of 1940, as amended (the “1940 Act”) (the “Independent Board Members”). The Board Members are responsible for the oversight of the operations of the Master Fund or the Fund, as pertinent, and perform the various duties imposed on the directors of investment companies by the 1940 Act. The Independent Board Members have retained independent legal counsel to assist them in connection with their duties. The Chair of the Board is an Independent Board Member. The Board has established five standing committees: an Audit Committee, a Governance and Nominating Committee, a Compliance Committee, a Performance Oversight and Contract Committee and an Executive Committee, each of which is chaired by an Independent Board Member and composed of Independent Board Members (except for the Executive Committee, which also has one interested Board Member).
The Agreements
Pursuant to the 1940 Act, the Board is required to consider the initial approval of the Agreements. In connection with this deliberative process, the Board assessed, among other things, the nature, extent and quality of the services to be provided to the Master Portfolio and the Portfolio (and those provided to the Predecessor Master Portfolio and the Predecessor Portfolio) by BlackRock, BlackRock’s personnel and affiliates, including (as applicable): investment management; accounting, administrative and shareholder services; oversight of the Master Portfolio’s and the Portfolio’s (and the Predecessor Master Portfolio’s and Predecessor Portfolio’s) service providers; marketing and promotional services; risk management and oversight; legal and compliance services; and ability to meet applicable legal and regulatory requirements.
Board Considerations in Approving the Agreements
The Approval Process: At the Organizational Meeting, the Board reviewed materials relating to its consideration of the proposed Agreements. The Predecessor Agreements were most recently considered and approved by the board of trustees of the Predecessor Master Fund (the “Predecessor Board”) at in person meetings held on April 19, 2018 (the “April Meeting”) and May17-18, 2018 (the “May Meeting”). The factors considered by the Board Members at the Organizational Meeting in connection with approval of the proposed Agreements were identical to the factors considered by them as members of the Predecessor Board at the April and May Meetings for the Predecessor Agreements. (Accordingly, references below to the “Board” mean both the Board and the Predecessor Board, and references below to the Board Members mean the members of both the Board and the Predecessor Board, unless the context requires otherwise.) These factors included, among other things: (a) the nature, extent and quality of the services to be provided by BlackRock (and those provided by BlackRock to the Predecessor Master Portfolio and the Predecessor Portfolio); (b) the investment performance of the Predecessor Master Portfolio and the Portfolio as compared with a peer group of funds (“Performance Peers”) and other metrics, as applicable; (c) the advisory fee and the estimated cost of the services and estimated profits realized by BlackRock and its affiliates from their relationship with the Master Portfolio, the Portfolio, the Predecessor Master Portfolio and the Predecessor Portfolio; (d) the sharing of potential economies of scale;(e) fall-out benefits to BlackRock and its affiliates as a result of BlackRock’s relationship with the Master Portfolio, the Portfolio, the Predecessor Master Portfolio and the Predecessor Portfolio; and (f) other factors deemed relevant by the Board Members.
In determining whether to approve the Predecessor Agreements, the Board met with the relevant investment advisory personnel from BlackRock and considered all information it deemed reasonably necessary to evaluate the terms of the Predecessor Agreements. These meetings were considered by the Board in evaluating approval of the Agreements. The Board received materials in advance of the Organizational Meeting relating to its consideration of the Agreements, including, among other things, (a) fees and estimated expense ratios of the Master Portfolio and the Portfolio, as applicable, and the fees and expense ratios of the Predecessor Master Portfolio and the Predecessor Portfolio, as applicable, in comparison to the fees and expense ratios of a peer group of funds as determined by Broadridge Financial Solutions, Inc.
| | | | |
| DISCLOSUREOF INVESTMENT ADVISORY AGREEMENTAND SUB-ADVISORY AGREEMENTS | | | 55 | |
Disclosure of Investment Advisory Agreement andSub-Advisory Agreements (continued)
(“Broadridge”) (“Expense Peers”); (b) information regarding BlackRock’s economic outlook for the Predecessor Master Portfolio and the Predecessor Portfolio and its general investment outlook for the markets; (c) information regarding fees paid to service providers that are affiliates of BlackRock; and (d) information outlining the legal duties of the Board under the 1940 Act with respect to the consideration and approval of the Agreements. The Board also received information at prior Board meetings concerning compliance records and regulatory matters relating to BlackRock.
The Board also considered other matters it deemed important to the approval process, such as other payments to be made to BlackRock or its affiliates, securities lending and cash management, services related to the valuation and pricing of the Master Portfolio’s portfolio holdings, and advice from independent legal counsel with respect to the review process and materials submitted for the Board’s review. The Board noted the willingness of BlackRock personnel to engage in open, candid discussions with the Board. The Board did not identify any particular information as determinative, and each Board Member may have attributed different weights to the various items considered.
A. Nature, Extent and Quality of the Services to be Provided by BlackRock: The Board, including the Independent Board Members, considered the nature, extent and quality of services to be provided by BlackRock, including the investment advisory services to be provided to the Master Portfolio and the Portfolio and those provided to the Predecessor Master Portfolio and the Predecessor Portfolio and the resulting performance of the Predecessor Portfolio. Throughout the year, the Board Members compared the Predecessor Portfolio’s performance to the performance of a comparable group of mutual funds, relevant benchmark, and performance metrics, as applicable. The Board met with BlackRock’s senior management personnel responsible for investment activities, including the senior investment officers, in connection with its evaluation of the Predecessor Master Portfolio and the Predecessor Portfolio. The Board also reviewed the materials provided by the Master Portfolio’s portfolio management team discussing the Predecessor Master Portfolio’s performance and the Master Portfolio’s investment objectives, strategies and outlook.
The Board considered, among other factors, with respect to BlackRock: the number, education and experience of investment personnel generally and the Master Portfolio’s portfolio management team; BlackRock’s research capabilities; investments by portfolio managers in the funds they manage; portfolio trading capabilities; use of technology; commitment to compliance; credit analysis capabilities; risk analysis and oversight capabilities; and the approach to training and retaining portfolio managers and other research, advisory and management personnel. The Board also considered BlackRock’s overall risk management program, including the continued efforts of BlackRock and its affiliates to address cybersecurity risks and the role of BlackRock’s Risk & Quantitative Analysis Group. The Board considered BlackRock’s compensation structure with respect to the Master Portfolio’s portfolio management team and BlackRock’s ability to attract and retain high-quality talent and create performance incentives that had been presented in connection with the Board’s evaluation of the Predecessor Agreements.
In addition to investment advisory services, the Board considered the quality of the administrative and othernon-investment advisory services to be provided to the Master Portfolio and the Portfolio (and those provided to the Predecessor Master Portfolio and the Predecessor Portfolio). The Board considered that BlackRock and its affiliates will provide the Master Portfolio (and provided the Predecessor Master Portfolio and the Predecessor Portfolio) with certain administrative, shareholder and other services (in addition to any such services provided to the Master Portfolio and the Portfolio by third parties) and officers and other personnel as are necessary for the operations of the Master Portfolio and the Portfolio. In particular, BlackRock and its affiliates provide the Master Portfolio and the Portfolio with administrative services including, among others: (i) responsibility for disclosure documents, such as the prospectus, the summary prospectus (as applicable), the statement of additional information and periodic shareholder reports; (ii) oversight of daily accounting and pricing; (iii) responsibility for periodic filings with regulators; (iv) overseeing and coordinating the activities of other service providers including, among others, the custodian, fund accountant, transfer agent, and auditor for the Master Portfolio and the Portfolio, as applicable; (v) organizing Board meetings and preparing the materials for such Board meetings; (vi) providing legal and compliance support; (vii) furnishing analytical and other support to assist the Board in its consideration of strategic issues such as the merger, consolidation or repurposing of certainopen-end funds; and (viii) performing administrative functions necessary for the operation of the Master Portfolio and the Portfolio, such as tax reporting, expense management, fulfilling regulatory filing requirements, overseeing the Portfolio’s distribution partners, and shareholder call center and other services. The Board considered the structure and duties of BlackRock’s fund administration, shareholder services, and legal & compliance departments and considered BlackRock’s policies and procedures for assuring compliance with applicable laws and regulations.
B. The Investment Performance of the Predecessor Master Portfolio, the Predecessor Portfolio and BlackRock: The Board, including the Independent Board Members, also reviewed and considered the performance history of the Predecessor Master Portfolio and the Predecessor Portfolio, as applicable. The Board noted that the Predecessor Portfolio’s investment results correspond directly to the investment results of the Predecessor Master Portfolio. In connection with its review of the Predecessor Portfolio’s performance history, the Board had been provided with reports independently prepared by Broadridge, which included a comprehensive analysis of the Predecessor Portfolio’s performance as of December 31, 2017. Broadridge ranks funds in quartiles, ranging from first to fourth, where first is the most desirable quartile position and fourth is the least desirable. In connection with this review, the Board had received and reviewed information regarding the investment performance of the Predecessor Portfolio as compared to its Performance Peers.
In evaluating performance, the Board recognized that the performance data reflects a snapshot of a period as of a particular date and that selecting a different performance period could produce significantly different results. Further, the Board recognized that it is possible that long-term performance can be impacted by even one period of significant outperformance or underperformance, so that a single investment theme has the ability to affect long-term performance disproportionately.
The Board noted that for theone-, three- and five-year periods reported, the Predecessor Portfolio ranked in the second, third, and third quartiles, respectively, against its Performance Peers. The Board and BlackRock reviewed the Predecessor Portfolio’s underperformance during the applicable periods.
C. Consideration of the Advisory/Management Fees and the Estimated Cost of the Services to be Provided and Estimated Profits Realized by BlackRock and its Affiliates from their Relationship with the Master Portfolio, the Portfolio, the Predecessor Master Portfolio and the Predecessor Portfolio: In connection with the initial approval of the Agreement, the Board, including the Independent Board Members, considered that the Master Portfolio’s proposed contractual advisory fee rate was identical to the Predecessor Master Portfolio’s contractual advisory fee rate. The contractual advisory fee rate is shown before taking into account any reimbursements or fee waivers. The Board also considered that the Portfolio’s estimated total net expense ratio was identical to the Predecessor Portfolio’s total expense ratio. The Board also considered the comparison of the Predecessor Portfolio’s actual and contractual advisory fee rate, to those of its Expense Peers. The total expense ratio represents a fund’s total net operating expenses, including any12b-1 or non12b-1 service fees. The total expense ratio gives effect to any expense reimbursements
| | |
| 56 | | 2018 BLACKROCK ANNUAL REPORTTO SHAREHOLDERS |
Disclosure of Investment Advisory Agreement andSub-Advisory Agreements (continued)
or fee waivers that benefit a fund, and the actual advisory fee rate gives effect to any advisory fee reimbursements or waivers that benefit a fund. The Board considered the services provided and the fees charged by BlackRock and its affiliates to other types of clients with similar investment mandates, as applicable, including institutional accounts andsub-advised mutual funds (including mutual funds sponsored by third parties) that had been presented in connection with its evaluation of the Predecessor Agreements.
The Board considered BlackRock’s profitability methodology including an estimated profitability analysis that detailed the revenues earned and the expenses incurred by BlackRock for services provided to the Predecessor Master Portfolio and the Predecessor Portfolio, which would be the same services to be provided to the Master Portfolio and the Portfolio. The Board reviewed BlackRock’s estimated profitability with respect to the Predecessor Master Portfolio and the Predecessor Portfolio and other funds the Board currently oversees for the year ended December 31, 2017 compared to available aggregate estimated profitability data provided for the prior two years. The Board considered, in connection with its review of the Predecessor Agreements, BlackRock’s estimated profitability with respect to certain other U.S. fund complexes managed by the Manager and/or its affiliates including BlackRock’s assumptions and methodology of allocating expenses in the estimated profitability analysis and the inherent limitations in allocating costs among various advisory products. The Board recognized that profitability may be affected by numerous factors including, among other things, fee waivers and expense reimbursements by the Manager, the types of funds managed, precision of expense allocations and business mix. As a result, calculating and comparing profitability at individual fund levels is difficult.
The Board noted that, in general, individual fund or product line profitability of other advisors is not publicly available. In connection with its review of the Predecessor Agreements, the Board reviewed BlackRock’s operating margin, in general, compared to that of certain other publicly-traded asset management firms and considered the differences between BlackRock and these other firms, including the contribution of technology at BlackRock, BlackRock’s expense management, and the relative product mix.
In addition, the Board considered the estimated cost of the services to be provided to the Master Portfolio and the Portfolio based on its review of the estimated cost of the services provided to the Predecessor Master Portfolio and the Predecessor Portfolio by BlackRock, and BlackRock’s and its affiliates’ estimated profits relating to the management and distribution of the Predecessor Master Portfolio and the Predecessor Portfolio and the other funds advised by BlackRock and its affiliates. As part of this analysis, the Board had reviewed BlackRock’s methodology in allocating its costs of managing the Predecessor Master Portfolio and the Predecessor Portfolio, to the Predecessor Master Portfolio or Predecessor Portfolio, as relevant. The Board considered whether BlackRock has the financial resources necessary to attract and retain high quality investment management personnel to perform its obligations under the Agreements and to continue to provide the high quality of services that is expected by the Board Members. The Board further considered factors including but not limited to BlackRock’s commitment of time, assumption of risk, and liability profile in servicing the Master Portfolio, the Portfolio, the Predecessor Master Portfolio and the Predecessor Portfolio in contrast to what is required of BlackRock with respect to other products with similar investment mandates across theopen-end fund, exchange-traded fund,closed-end fund,sub-advised mutual fund, separately managed account, collective investment trust, and institutional separate account product channels, as applicable.
The Board noted that the Predecessor Master Portfolio’s contractual advisory fee rate ranked in the first quartile, and that the actual advisory fee rate and the Predecessor Portfolio’s total expense ratio ranked in the second and first quartiles, respectively, relative to the Predecessor Portfolio’s Expense Peers. The Board also noted that the Master Portfolio has an advisory fee arrangement that includes breakpoints that adjust the fee rate downward as the size of the Master Portfolio increases above certain contractually specified levels. The Board further noted that BlackRock and its affiliates have contractually agreed to reimburse or otherwise compensate the Master Portfolio/Portfolio for the fees and expenses of the Independent Board Members, counsel to the Independent Board Members and the Master Portfolio’s/Portfolio’s independent registered public accounting firm.
D. Economies of Scale: The Board, including the Independent Board Members, considered the extent to which economies of scale might be realized as the assets of the Master Portfolio and the Portfolio increase, including the existence of fee waivers and/or expense caps, as applicable, noting that any contractual fee waivers and expense caps had been approved by the Board. The Board also considered the extent to which the Predecessor Master Portfolio and the Predecessor Portfolio benefited from such economies in a variety of ways and whether there should be changes in the advisory fee rate or breakpoint structure in order to enable the Master Portfolio and the Portfolio to more fully participate in these economies of scale. The Board considered the Predecessor Master Portfolio’s asset levels and, in light of those asset levels, whether the current fee schedule was appropriate for the Master Portfolio. In its consideration, the Board Members took into account the existence of any expense caps and further considered the continuation and/or implementation, as applicable, of such caps.
E. Other Factors Deemed Relevant by the Board Members: The Board, including the Independent Board Members, also took into account other potential ancillary or“fall-out” benefits that BlackRock or its affiliates may derive from BlackRock’s respective relationships with the Master Portfolio and the Portfolio, based on its review of the Predecessor Agreement, including both tangible and intangible benefits, such as BlackRock’s ability to leverage its investment professionals who manage other portfolios and risk management personnel, an increase in BlackRock’s profile in the investment advisory community, and the engagement of BlackRock’s affiliates as service providers to the Master Portfolio and the Portfolio (and the Predecessor Master Portfolio and the Predecessor Portfolio), including for administrative, distribution, securities lending and cash management services. The Board also considered BlackRock’s overall operations and its efforts to expand the scale of, and improve the quality of, its operations. The Board also considered that, subject to applicable law, BlackRock may use and benefit from third party research obtained by soft dollars generated by certain registered fund transactions to assist in managing all or a number of its other client accounts.
In connection with its consideration of the Agreements, the Board also considered information regarding BlackRock’s brokerage and soft dollar practices and reports from BlackRock which included information on brokerage commissions and trade execution practices that it had received in consideration of the Predecessor Agreements.
The Board considered the competitive nature of theopen-end fund marketplace, and that shareholders are able to redeem their Portfolio shares if they believe that the Portfolio’s and/or the Master Portfolio’s fees and expenses are too high or if they are dissatisfied with the performance of the Portfolio.
Conclusion
Following discussion, the Board of the Master Fund, including the Independent Board Members, approved (i) the Advisory Agreement between the Manager and the Master Fund, on behalf of the Master Portfolio, for atwo-year term beginning on the effective date of the Advisory Agreement, (ii) the BFASub-Advisory Agreement
| | | | |
| DISCLOSUREOF INVESTMENT ADVISORY AGREEMENTAND SUB-ADVISORY AGREEMENTS | | | 57 | |
Disclosure of Investment Advisory Agreement andSub-Advisory Agreements (continued)
between the Manager and BFA with respect to the Master Portfolio, for atwo-year term beginning on the effective date of the BFASub-Advisory Agreement and (iii) the BILSub-Advisory Agreement between the Manager and BIL with respect to the Master Portfolio, for atwo-year term beginning on the effective date of the BILSub-Advisory Agreement. Based upon its evaluation of all of the aforementioned factors in their totality, as well as other information, the Board of the Master Fund, including the Independent Board Members, was satisfied that the terms of the Agreements were fair and reasonable and in the best interest of the Master Portfolio and its shareholders. The Board of the Fund, including the Independent Board Members, also considered the approval of the Agreements with respect to the Master Portfolio and found the agreements to be satisfactory. In arriving at its decision to approve the Agreements, the Board of the Master Fund did not identify any single factor or group of factors asall-important or controlling, but considered all factors together, and different Board Members may have attributed different weights to the various factors considered. The Independent Board Members were also assisted by the advice of independent legal counsel in making this determination.
| | |
| 58 | | 2018 BLACKROCK ANNUAL REPORTTO SHAREHOLDERS |
Trustee and Officer Information
| | | | | | | | |
| Independent Trustees (a) |
| | | | | |
Name
Year of Birth (b) | | Position(s) Held
(Length of Service) (c) | | Principal Occupation(s) During Past Five Years | | Number of BlackRock-Advised
Registered Investment Companies
(“RICs”) Consisting of
Investment Portfolios
(“Portfolios”) Overseen | | Public Company and Other
Investment Company
Directorships Held During
Past Five Years |
Rodney D. Johnson 1941 | | Chair of the Board (d) and Trustee
(Since 2009) | | President, Fairmount Capital Advisors, Inc. from 1987 to 2013; Member of the Archdiocesan Investment Committee of the Archdiocese of Philadelphia from 2004 to 2012; Director, The Committee of Seventy (civic) from 2006 to 2012; Director, Fox Chase Cancer Center from 2004 to 2011; Director, The Mainstay(non-profit) since 2016. | | 24 RICs consisting of 138 Portfolios | | None |
Mark Stalnecker 1951 | | Chair Elect of the Board
(Since 2018) (d)
and Trustee
(Since 2015) | | Chief Investment Officer, University of Delaware from 1999 to 2013; Trustee and Chair of the Finance and Investment Committees, Winterthur Museum and Country Estate from 2005 to 2016; Member of the Investment Committee, Delaware Public Employees’ Retirement System since 2002; Member of the Investment Committee, Christiana Care Health System from 2009 to 2017; Member of the Investment Committee, Delaware Community Foundation from 2013 to 2014; Director and Chair of the Audit Committee, SEI Private Trust Co. from 2001 to 2014. | | 24 RICs consisting of 138 Portfolios | | None |
Susan J. Carter 1956 | | Trustee
(Since 2016) | | Director, Pacific Pension Institute from 2014 to 2018; Advisory Board Member, Center for Private Equity and Entrepreneurship at Tuck School of Business since 1997; Senior Advisor, Commonfund Capital, Inc. (“CCI”) (investment adviser) in 2015; Chief Executive Officer, CCI from 2013 to 2014; President & Chief Executive Officer, CCI from 1997 to 2013; Advisory Board Member, Girls Who Invest from 2015 to 2018 and Board Member thereof since 2018; Advisory Board Member, Bridges Fund Management since 2016; Trustee, Financial Accounting Foundation since 2017; Practitioner Advisory Board Member, Private Capital Research Institute (PCRI) since 2017. | | 24 RICs consisting of 138 Portfolios | | None |
Collette Chilton 1958 | | Trustee
(Since 2015) | | Chief Investment Officer, Williams College since 2006; Chief Investment Officer, Lucent Asset Management Corporation from 1998 to 2006. | | 24 RICs consisting of 138 Portfolios | | None |
Neil A. Cotty 1954 | | Trustee
(Since 2016) | | Bank of America Corporation from 1996 to 2015, serving in various senior finance leadership roles, including Chief Accounting Officer, from 2009 to 2015, Chief Financial Officer of Global Banking, Markets and Wealth Management from 2008 to 2009, Chief Accounting Officer from 2004 to 2008, Chief Financial Officer of Consumer Bank from 2003 to 2004, Chief Financial Officer of Global Corporate Investment Bank from 1999 to 2002. | | 24 RICs consisting of 138 Portfolios | | None |
Cynthia A. Montgomery 1952 | | Trustee
(Since 2009) | | Professor, Harvard Business School since 1989; Director, McLean Hospital from 2005 to 2012. | | 24 RICs consisting of 138 Portfolios | | Newell Rubbermaid, Inc. (manufacturing) |
Joseph P. Platt 1947 | | Trustee
(Since 2009) | | General Partner, Thorn Partners, LP (private investments) since 1998; Director, WQED Multi-Media (public broadcastingnot-for-profit) since 2001; Chair, Basic Health International(non-profit) since 2015. | | 24 RICs consisting of 138 Portfolios | | Greenlight Capital Re, Ltd. (reinsurance company); Consol Energy Inc. |
Robert C. Robb, Jr. 1945 | | Trustee
(Since 2009) | | Partner, Lewis, Eckert, Robb and Company (management and financial consulting firm) since 1981 and Principal since 2010. | | 24 RICs consisting of 138 Portfolios | | None |
| | | | |
| TRUSTEEAND OFFICER INFORMATION | | | 59 | |
Trustee and Officer Information (continued)
| | | | | | | | |
| Independent Trustees (a)(continued) |
| | | | | |
Name
Year of Birth (b) | | Position(s) Held
(Length of Service) (c) | | Principal Occupation(s) During Past Five Years | | Number of BlackRock-Advised
Registered Investment Companies
(“RICs”) Consisting of
Investment Portfolios
(“Portfolios”) Overseen | | Public Company and Other
Investment Company
Directorships Held During
Past Five Years |
Kenneth L. Urish 1951 | | Trustee
(Since 2009) | | Managing Partner, Urish Popeck & Co., LLC (certified public accountants and consultants) since 1976; Past-Chairman of the Professional Ethics Committee of the Pennsylvania Institute of Certified Public Accountants and Committee Member thereof since 2007; Member of External Advisory Board, The Pennsylvania State University Accounting Department since founding in 2001; Principal, UP Strategic Wealth Investment Advisors, LLC since 2013; Trustee, The Holy Family Institute from 2001 to 2010; President and Trustee, Pittsburgh Catholic Publishing Associates from 2003 to 2008; Director,Inter-Tel from 2006 to 2007. | | 24 RICs consisting of 138 Portfolios | | None |
Claire A. Walton 1957 | | Trustee
(Since 2016) | | Chief Operating Officer and Chief Financial Officer of Liberty Square Asset Management, LP from 1998 to 2015; General Partner of Neon Liberty Capital Management, LLC since 2003; Director, Boston Hedge Fund Group from 2009 to 2018; Director, Woodstock Ski Runners since 2013; Director, Massachusetts Council on Economic Education from 2013 to 2015. | | 24 RICs consisting of 138 Portfolios | | None |
Frederick W. Winter 1945 | | Trustee
(Since 2009) | | Director, Alkon Corporation since 1992; Dean Emeritus of the Joseph M. Katz School of Business, University of Pittsburgh, Dean and Professor from 1997 to 2005, Professor until 2013. | | 24 RICs consisting of 138 Portfolios | | None |
|
| Interested Trustees (d)(a)(e) |
| | | | | |
Name
Year of Birth (b) | | Position(s) Held
(Length of Service) (c) | | Principal Occupation(s) During Past Five Years | | Number of BlackRock-Advised
Registered Investment Companies
(“RICs”) Consisting of
Investment Portfolios
(“Portfolios”) Overseen | | Public Company and Other
Investment Company
Directorships Held During
Past Five Years |
Robert Fairbairn 1965 | | Trustee
(Since 2018) | | Senior Managing Director of BlackRock, Inc. since 2010; oversees BlackRock’s Strategic Partner Program and Strategic Product Management Group; Member of BlackRock’s Global Executive and Global Operating Committees;Co-Chair of BlackRock’s Human Capital Committee; Member of the Board of Managers of BlackRock Investments, LLC since 2011; Global Head of BlackRock’s Retail and iShares® businesses from 2012 to 2016. | | 127 RICs consisting of 304 Portfolios | | None |
John M. Perlowski 1964 | | Trustee
(Since 2015)
and President and Chief Executive Officer
(Since 2010) | | Managing Director of BlackRock, Inc. since 2009; Head of BlackRock Global Accounting and Product Services since 2009; Advisory Director of Family Resource Network (charitable foundation) since 2009. | | 127 RICs consisting of 304 Portfolios | | None |
(a) The address of each Trustee is c/o BlackRock, Inc., 55 East 52nd Street, New York, NY 10055. |
(b) Independent Trustees serve until their resignation, retirement, removal or death, or until December 31 of the year in which they turn 75. The Board may determine to extend the terms of Independent Trustees on acase-by-case basis, as appropriate. The Board has approved extending the mandatory retirement age for Rodney D. Johnson until December 31, 2018. |
(c) Length of Service includes service as a trustee of BlackRock Funds III/Master Investment Portfolio. In connection with the acquisition of Barclays Global Investors by BlackRock, Inc. (“BlackRock”) in December 2009, certain Independent Trustees were elected to the Board. As a result, although the chart shows certain Independent Trustees as joining the Board in 2009, those Independent Trustees first became members of the boards of other funds advised by BlackRock Advisors, LLC or its affiliates as follows: Rodney D. Johnson, 1995; Cynthia A. Montgomery, 1994; Joseph P. Platt, 1999; Robert C. Robb, Jr., 1999; Kenneth L. Urish, 1999; and Frederick W. Winter, 1999. |
(d) Mr. Stalnecker was approved as Chair Elect of the Board effective January 1, 2018. It is expected that, effective January 1, 2019, Mr. Stalnecker will assume the position of Chair of the Board and Mr. Johnson will retire as Chair of the Board. |
(e) Mr. Fairbairn and Mr. Perlowski are both “interested persons,” as defined in the 1940 Act, of the Trust/MIP II based on their positions with BlackRock and its affiliates. Mr. Fairbairn and Mr. Perlowski are also board members of the BlackRock Equity-Bond Complex and the BlackRockClosed-End Complex. |
| | |
| 60 | | 2018 BLACKROCK ANNUAL REPORTTO SHAREHOLDERS |
Trustee and Officer Information (continued)
| | | | |
| Officers Who Are Not Trustees (a) |
| | | |
Name
Year of Birth (b) | | Position(s) Held
(Length of Service) (c) | | Principal Occupation(s) During Past Five Years |
Thomas Callahan 1968 | | Vice President
(Since 2016) | | Managing Director of BlackRock, Inc. since 2013; Head of BlackRock’s Global Cash Management Business since 2016;Co-Head of the Global Cash Management Business from 2014 to 2016; Deputy Head of the Global Cash Management Business from 2013 to 2014; Member of the Cash Management Group Executive Committee since 2013; Chief Executive Officer of NYSE Liffe U.S. from 2008 to 2013. |
Jennifer McGovern 1977 | | Vice President
(Since 2014) | | Managing Director of BlackRock, Inc. since 2016; Director of BlackRock, Inc. from 2011 to 2015; Head of Product Structure and Oversight for BlackRock’s U.S. Wealth Advisory Group since 2013. |
Neal J. Andrews 1966 | | Chief Financial Officer
(Since 2009) | | Managing Director of BlackRock, Inc. since 2006. |
Jay M. Fife 1970 | | Treasurer
(Since 2009) | | Managing Director of BlackRock, Inc. since 2007. |
Charles Park 1967 | | Chief Compliance Officer
(Since 2014) | | Anti-Money Laundering Compliance Officer for the BlackRock-advised Funds in the Equity-Bond Complex, the Equity-Liquidity Complex and theClosed-End Complex from 2014 to 2015; Chief Compliance Officer of BlackRock Advisors, LLC and the BlackRock-advised Funds in the Equity-Bond Complex, the Equity-Liquidity Complex and theClosed-End Complex since 2014; Principal of and Chief Compliance Officer for iShares® Delaware Trust Sponsor LLC since 2012 and BlackRock Fund Advisors (“BFA”) since 2006; Chief Compliance Officer for theBFA-advised iShares® exchange traded funds since 2006; Chief Compliance Officer for BlackRock Asset Management International Inc. since 2012. |
John MacKessy 1972 | | Anti-Money Laundering Compliance Officer
(Since 2018) | | Director of BlackRock, Inc. since 2017; Global Head of Anti-Money Laundering at BlackRock , Inc. since 2017; Director of AML Monitoring and Investigations Group of Citibank from 2015 to 2017; Global Anti-Money Laundering and Economic Sanctions Officer for MasterCard from 2011 to 2015. |
Benjamin Archibald 1975 | | Secretary
(Since 2012) | | Managing Director of BlackRock, Inc. since 2014; Director of BlackRock, Inc. from 2010 to 2013; Secretary of the iShares® exchange traded funds since 2015; Secretary of the BlackRock-advised mutual funds since 2012. |
(a) The address of each Officer is c/o BlackRock, Inc., 55 East 52nd Street, New York, NY 10055. |
(b) Officers of the Trust/MIP II serve at the pleasure of the Board. |
(c) Length of Service includes service in such capacity for BlackRock Funds III/Master Investment Portfolio. |
Further information about the Trust’s/MIP II’s Trustees and Officers is available in the Trust’s/MIP II’s Statement of Additional Information, which can be obtained without charge bycalling (800) 441-7762.
At a special meeting of shareholders held on November 21, 2018, the Fund’s shareholders and the Master Portfolio’s interestholder elected Trustees who took office on January 1, 2019. The newly elected Trustees include two former Trustees, eight individuals who served as directors/trustees of the funds in the BlackRockClosed-End Complex and one individual who served as a director/trustee of the funds in the BlackRock Equity-Bond Complex. Information regarding the individuals who began serving as Trustees effective January 1, 2019 can be found in the proxy statement for the special meeting of shareholders, which is available on the SEC’s EDGAR Database at http://www.sec.gov.
Investment Adviser and Administrator
BlackRock Advisors, LLC
Wilmington, DE 19809
Sub-Advisers
BlackRock Fund Advisors
San Francisco, CA 94105
BlackRock International Limited
Edinburgh, EH3 8BL
United Kingdom
Accounting Agent and Custodian
State Street Bank and Trust Company
Boston, MA 02111
Transfer Agent
BNY Mellon Investment Servicing (US) Inc.
Wilmington, DE 19809
Distributor
BlackRock Investments, LLC
New York, NY 10022
Independent Registered Public Accounting Firm
PricewaterhouseCoopers LLP
Philadelphia, PA 19103
Legal Counsel
Sidley Austin LLP
New York, NY 10019
Address of the Trust/MIP II
100 Bellevue Parkway
Wilmington, DE 19809
| | | | |
| TRUSTEEAND OFFICER INFORMATION | | | 61 | |
Additional Information
Proxy Results
BlackRock Funds VI
A Special Meeting of Shareholders was held on November 21, 2018 for shareholders of record on September 24, 2018, to elect a Board of Trustees of the Trust. The newly elected Trustees took office effective January 1, 2019.
Shareholders approved the Trustees of BlackRock Funds VI with voting results as follows:
| | | | | | | | |
| | | Votes For | | | Votes Withheld | |
Michael J. Castellano | | | 514,787,987 | | | | 0 | |
Richard E. Cavanagh | | | 514,787,987 | | | | 0 | |
Cynthia L. Egan | | | 514,787,987 | | | | 0 | |
Frank J. Fabozzi | | | 514,787,987 | | | | 0 | |
Robert Fairbairn | | | 514,787,987 | | | | 0 | |
Henry Gabbay | | | 514,787,987 | | | | 0 | |
R. Glenn Hubbard | | | 514,787,987 | | | | 0 | |
W. Carl Kester | | | 514,787,987 | | | | 0 | |
Catherine A. Lynch | | | 514,787,987 | | | | 0 | |
John M. Perlowski | | | 514,787,987 | | | | 0 | |
Karen P. Robards | | | 514,787,987 | | | | 0 | |
The above Trustees, referred to as the BlackRock Fixed-Income Board, have also been elected to serve as trustees for other BlackRock-advised non-index fixed-income mutual funds and all of the BlackRock-advised closed-end funds.
Master Investment Portfolio II
A Special Meeting of Interestholders was held on November 21, 2018 for interestholders of record on September 24, 2018, to elect a Board of Trustees of MIP II. The newly elected Trustees took office effective January 1, 2019.
Interestholders approved the Trustees of MIP II with voting results as follows:
| | | | | | | | | | | | |
| | | Votes For | | | Votes Against | | | Votes Abstained | |
Michael J. Castellano | | | 1,023,184,780 | | | | 0 | | | | 0 | |
Richard E. Cavanagh | | | 1,023,184,780 | | | | 0 | | | | 0 | |
Cynthia L. Egan | | | 1,021,851,492 | | | | 0 | | | | 1,333,289 | |
Frank J. Fabozzi | | | 1,021,851,492 | | | | 0 | | | | 1,333,289 | |
Robert Fairbairn | | | 1,023,184,780 | | | | 0 | | | | 0 | |
Henry Gabbay | | | 1,021,851,492 | | | | 0 | | | | 1,333,289 | |
R. Glenn Hubbard | | | 1,021,851,492 | | | | 0 | | | | 1,333,289 | |
W. Carl Kester | | | 1,021,851,492 | | | | 0 | | | | 1,333,289 | |
Catherine A. Lynch | | | 1,023,184,780 | | | | 0 | | | | 0 | |
John M. Perlowski | | | 1,021,851,492 | | | | 0 | | | | 1,333,289 | |
Karen P. Robards | | | 1,023,184,780 | | | | 0 | | | | 0 | |
| | * | Denotes Trust-wide proposal and voting results. | |
The above Trustees, referred to as the BlackRock Fixed-Income Board, have also been elected to serve as trustees for other BlackRock-advised non-index fixed-income mutual funds and all of the BlackRock-advised closed-end funds.
General Information
Householding
The Fund will mail only one copy of shareholder documents, including prospectuses, annual and semi-annual reports and proxy statements, to shareholders with multiple accounts at the same address. This practice is commonly called “householding” and is intended to reduce expenses and eliminate duplicate mailings of shareholder documents. Mailings of your shareholder documents may be householded indefinitely unless you instruct us otherwise. If you do not want the mailing of these documents to be combined with those for other members of your household, please call the Fund at (800) 441-7762.
Availability of Quarterly Schedule of Investments
The Fund/Master Portfolio file their complete schedule of portfolio holdings with the SEC for the first and third quarters of each fiscal year onForm N-Q. The Fund’s/Master Portfolio’s Forms N-Q are available on the SEC’s website at http://www.sec.gov. The Fund’s/Master Portfolio’s Forms N-Q may also be obtained upon request and without charge by calling (800) 441-7762.
| | |
| 62 | | 2018 BLACKROCK ANNUAL REPORTTO SHAREHOLDERS |
Additional Information (continued)
Availability of Proxy Voting Policies and Procedures
A description of the policies and procedures that the Fund/Master Portfolio uses to determine how to vote proxies relating to portfolio securities is available upon request and without charge (1) by calling (800) 441-7762; (2) athttp://www.blackrock.com; and (3) on the SEC’s website at http://www.sec.gov.
Availability of Proxy Voting Record
Information about how the Fund/Master Portfolio voted proxies relating to securities held in the Fund’s/Master Portfolio’s portfolio during the most recent 12-month period ended June 30 is available upon request and without charge (1) athttp://www.blackrock.com; or by calling (800) 441-7762 and (2) on the SEC’s website at http://www.sec.gov.
BlackRock’s Mutual Fund Family
BlackRock offers a diverse lineup of open-end mutual funds crossing all investment styles and managed by experts in equity, fixed-income and tax-exempt investing. Visithttp://www.blackrock.com for more information.
Shareholder Privileges
Account Information
Call us at (800) 441-7762 from 8:00 AM to 6:00 PM ET on any business day to get information about your account balances, recent transactions and share prices. You can also reach us on the Web athttp://www.blackrock.com.
Automatic Investment Plans
Investor Class shareholders who want to invest regularly can arrange to have $50 or more automatically deducted from their checking or savings account and invested in any of the BlackRock funds.
Systematic Withdrawal Plans
Investor Class shareholders can establish a systematic withdrawal plan and receive periodic payments of $50 or more from their BlackRock funds, as long as their account balance is at least $10,000.
Retirement Plans
Shareholders may make investments in conjunction with Traditional, Rollover, Roth, Coverdell, Simple IRAs, SEP IRAs and 403(b) Plans.
BlackRock Privacy Principles
BlackRock is committed to maintaining the privacy of its current and former fund investors and individual clients (collectively, “Clients”) and to safeguarding their non-public personal information. The following information is provided to help you understand what personal information BlackRock collects, how we protect that information and why in certain cases we share such information with select parties.
If you are located in a jurisdiction where specific laws, rules or regulations require BlackRock to provide you with additional or different privacy-related rights beyond what is set forth below, then BlackRock will comply with those specific laws, rules or regulations.
BlackRock obtains or verifies personal non-public information from and about you from different sources, including the following: (i) information we receive from you or, if applicable, your financial intermediary, on applications, forms or other documents; (ii) information about your transactions with us, our affiliates, or others; (iii) information we receive from a consumer reporting agency; and (iv) from visits to our websites.
BlackRock does not sell or disclose to non-affiliated third parties anynon-public personal information about its Clients, except as permitted by law or as is necessary to respond to regulatory requests or to service Client accounts. These non-affiliated third parties are required to protect the confidentiality and security of this information and to use it only for its intended purpose.
We may share information with our affiliates to service your account or to provide you with information about other BlackRock products or services that may be of interest to you. In addition, BlackRock restricts access to non-public personal information about its Clients to those BlackRock employees with a legitimate business need for the information. BlackRock maintains physical, electronic and procedural safeguards that are designed to protect the non-public personal information of its Clients, including procedures relating to the proper storage and disposal of such information.
| | | | |
| ADDITIONAL INFORMATION | | | 63 | |
Glossary of Terms Used in this Report
| | |
| Currency |
| |
| AUD | | Australian Dollar |
| |
| CAD | | Canadian Dollar |
| |
| EUR | | Euro |
| |
| GBP | | British Pound |
| |
| HKD | | Hong Kong Dollar |
| |
| JPY | | Japanese Yen |
| |
| KRW | | South Korean Won |
| |
| MXN | | Mexican Peso |
| |
| PLN | | Polish Zloty |
| |
| SEK | | Swedish Krona |
| |
| SGD | | Singapore Dollar |
| |
| USD | | United States Dollar |
| |
| ZAR | | South African Rand |
| | |
| Portfolio Abbreviations |
| |
| ABS | | Asset-Backed Security |
| |
| BBR | | Bank Bill Rate |
| |
| CPI | | Consumer Price Index |
| |
| ETF | | Exchange-Traded Fund |
| |
| EURIBOR | | Euro Interbank Offered Rate |
| |
| HIBOR | | Hong Kong Interbank Offered Rate |
| |
| LIBOR | | London Interbank Offered Rate |
| |
| OTC | | Over-the-Counter |
| |
| S&P | | S&P Global Ratings |
| |
| STIBOR | | Stockholm Interbank Offered Rate |
| |
| WIBOR | | Warsaw Interbank Offered Rate |
| | |
| 64 | | 2018 BLACKROCK ANNUAL REPORTTO SHAREHOLDERS |
This report is intended for current holders. It is not authorized for use as an offer of sale or a solicitation of an offer to buy shares of the Fund unless preceded or accompanied by the Fund’s current prospectus. Past performance results shown in this report should not be considered a representation of future performance. Investment returns and principal value of shares will fluctuate so that shares, when redeemed, may be worth more or less than their original cost. Statements and other information herein are as dated and are subject to change.

| | |
| CAB-12/18-AR | |  |
| Item 2 – | Code of Ethics – Each registrant (or each, a “Fund”) has adopted a code of ethics, as of the end of the period covered by this report, applicable to the registrants’ principal executive officer, principal financial officer, principal accounting officer or controller, or persons performing similar functions. During the period covered by this report, the code of ethics was amended to update certain information and to make othernon-material changes. During the period covered by this report, there have been no waivers granted under the code of ethics. The registrants undertake to provide a copy of the code of ethics to any person upon request, without charge, who calls1-800-441-7762. |
| Item 3 – | Audit Committee Financial Expert – Each registrant’s board of directors (the “board of directors”), has determined that (i) the registrant has the following audit committee financial expert serving on its audit committee and (ii) each audit committee financial expert is independent: |
Kenneth L. Urish
Under applicable securities laws, a person determined to be an audit committee financial expert will not be deemed an “expert” for any purpose, including without limitation for the purposes of Section 11 of the Securities Act of 1933, as a result of being designated or identified as an audit committee financial expert. The designation or identification of a person as an audit committee financial expert does not impose on such person any duties, obligations, or liabilities greater than the duties, obligations, and liabilities imposed on such person as a member of the audit committee and board of directors in the absence of such designation or identification.
| Item 4 – | Principal Accountant Fees and Services |
The following table presents fees billed by PricewaterhouseCoopers LLP (“PwC”) in each of the last two fiscal years for the services rendered to the Funds:
| | | | | | | | | | | | | | | | |
| | (a) Audit Fees | | (b) Audit-Related Fees1 | | (c) Tax Fees2 | | (d) All Other Fees |
| Entity Name | | Current
Fiscal Year
End | | Previous
Fiscal Year
End | | Current
Fiscal
Year End | | Previous
Fiscal
Year End | | Current
Fiscal
Year End | | Previous
Fiscal
Year End | | Current
Fiscal
Year End | | Previous
Fiscal
Year End |
| | | | | | | | | |
| BlackRock CoreAlpha Bond Fund | | $11,000 | | $11,023 | | $0 | | $0 | | $8,100 | | $8,066 | | $0 | | $0 |
| | | | | | | | | |
| CoreAlpha Bond Master Portfolio | | $39,500 | | $39,538 | | $0 | | $0 | | $20,700 | | $20,661 | | $0 | | $0 |
The following table presents fees billed by PwC that were required to be approved by each registrant’s audit committee (each a “Committee”) for services that relate directly to the operations or financial reporting of each Fund and that are rendered on behalf of BlackRock Advisors, LLC (the “investment adviser” or “BlackRock”)and entities controlling, controlled by, or under common control with BlackRock (not including anysub-adviser whose role is primarily portfolio management and is subcontracted with or overseen by another investment adviser) that provide ongoing services to each Fund (“Affiliated Service Providers”):
| | | | |
| | | Current Fiscal Year End | | Previous Fiscal Year End |
(b) Audit-Related Fees1 | | $0 | | $0 |
(c) Tax Fees2 | | $0 | | $0 |
(d) All Other Fees3 | | $0 | | $0 |
1 The nature of the services includes assurance and related services reasonably related to the performance of the audit or review of financial statements not included in Audit Fees, including accounting consultations, agreed-upon procedure reports, attestation reports, comfort letters,out-of-pocket expenses and internal control reviews not required by regulators.
2 The nature of the services includes tax compliance and/or tax preparation, including services relating to the filing or amendment of federal, state or local income tax returns, regulated investment company qualification reviews, taxable income and tax distribution calculations.
2
3 Aggregate fees borne by BlackRock in connection with the review of compliance procedures and attestation thereto performed by PwC with respect to all of the registeredclosed-end funds and some of the registeredopen-end funds advised by BlackRock.
(e)(1) Audit CommitteePre-Approval Policies and Procedures:
Each Committee has adopted policies and procedures with regard to thepre-approval of services. Audit, audit-related and tax compliance services provided to the registrant on an annual basis require specificpre-approval by the registrant’s Committee. The Committee also must approve othernon-audit services provided to the registrant and thosenon-audit services provided to the Investment Adviser and Affiliated Service Providers that relate directly to the operations and the financial reporting of the registrant. Certain of thesenon-audit services that the Committee believes are (a) consistent with the SEC’s auditor independence rules and (b) routine and recurring services that will not impair the independence of the independent accountants may be approved by the Committee without consideration on a specificcase-by-case basis (“generalpre-approval”). The term of any generalpre-approval is 12 months from the date of thepre-approval, unless the Committee provides for a different period. Tax or othernon-audit services provided to the registrant which have a direct impact on the operations or financial reporting of the registrant will only be deemedpre-approved provided that any individual project does not exceed $10,000 attributable to the registrant or $50,000 per project. For this purpose, multiple projects will be aggregated to determine if they exceed the previously mentioned cost levels.
Any proposed services exceeding thepre-approved cost levels will require specificpre-approval by the registrant’s Committee, as will any other services not subject to generalpre-approval (e.g., unanticipated but permissible services). The Committee is informed of each service approved subject to generalpre-approval at the next regularly scheduledin-person board meeting. At this meeting, an analysis of such services is presented to the Committee for ratification. The Committee may delegate to the Committee Chairman the authority to approve the provision of and fees for any specific engagement of permittednon-audit services, including services exceedingpre-approved cost levels.
(e)(2) None of the services described in each of Items 4(b) through (d) were approved by either Committee pursuant to the de minimus exception in paragraph (c)(7)(i)(C) of Rule2-01 of RegulationS-X.
(f) Not Applicable
(g) The aggregatenon-audit fees, defined as the sum of the fees shown under “Audit-Related Fees,” “Tax Fees” and “All Other Fees,” paid to the accountant for services rendered by the accountant to the registrant, the Investment Adviser and the Affiliated Service Providers were:
| | | | | | |
| Entity Name | | Current
Fiscal
Year End | | Previous
Fiscal Year
End | | |
| BlackRock CoreAlpha Bond Fund | | $8,100 | | $8,066 |
| CoreAlpha Bond Master Portfolio | | $20,700 | | $20,661 | | |
(h) Each Committee has considered and determined that the provision ofnon-audit services that were rendered to the Investment Adviser and the Affiliated Service Providers that were notpre-approved pursuant to paragraph (c)(7)(ii) of
Rule2-01 of RegulationS-X is compatible with maintaining the principal accountant’s independence.
| Item 5 – | Audit Committee of Listed Registrants – Not Applicable |
(a) The registrants’ Schedules of Investments are included as part of the Report to Stockholders filed under Item 1 of this Form.
3
(b) Not Applicable due to no such divestments during the semi-annual period covered since the previous FormN-CSR filing.
| Item 7 – | Disclosure of Proxy Voting Policies and Procedures forClosed-End Management Investment Companies – Not Applicable |
| Item 8 – | Portfolio Managers ofClosed-End Management Investment Companies – Not Applicable |
| Item 9 – | Purchases of Equity Securities byClosed-End Management Investment Company and Affiliated Purchasers – Not Applicable |
| Item 10 – | Submission of Matters to a Vote of Security Holders – There have been no material changes to these procedures. |
| Item 11 – | Controls and Procedures |
(a) – The registrants’ principal executive and principal financial officers, or persons performing similar functions, have concluded that the registrants’ disclosure controls and procedures (as defined in Rule30a-3(c) under the Investment Company Act of 1940, as amended (the “1940 Act”)) are effective as of a date within 90 days of the filing of this report based on the evaluation of these controls and procedures required by Rule30a-3(b) under the 1940 Act and Rule 15(d)-15(b) under the Securities Exchange Act of 1934, as amended.
(b) – There were no changes in the registrants’ internal control over financial reporting (as defined in Rule30a-3(d) under the 1940 Act) that occurred during the second fiscal quarter of the period covered by this report that have materially affected, or are reasonably likely to materially affect, the registrants’ internal control over financial reporting.
| Item 12 – | Disclosure of Securities Lending Activities forClosed-End Management Investment Companies – Not Applicable to the registrants. |
| Item 13 – | Exhibits attached hereto |
(a)(1) Code of Ethics – See Item 2
(a)(2) Certifications – Attached hereto
(a)(3) Not Applicable
(a)(4) Not Applicable
(b) Certifications – Attached hereto
4
Pursuant to the requirements of the Securities Exchange Act of 1934 and the Investment Company Act of 1940, each registrant has duly caused this report to be signed on its behalf by the undersigned, thereunto duly authorized.
BlackRock Funds VI and Master Investment Portfolio II
| | |
| By: | | /s/ John M. Perlowski |
| | John M. Perlowski |
| | Chief Executive Officer (principal executive officer) of |
| | BlackRock Funds VI and Master Investment Portfolio II |
Date: March 8, 2019
Pursuant to the requirements of the Securities Exchange Act of 1934 and the Investment Company Act of 1940, this report has been signed below by the following persons on behalf of each registrant and in the capacities and on the dates indicated.
| | |
| By: | | /s/ John M. Perlowski |
| | John M. Perlowski |
| | Chief Executive Officer (principal executive officer) of |
| | BlackRock Funds VI and Master Investment Portfolio II |
|
| Date: March 8, 2019 |
| |
| By: | | /s/ Neal J. Andrews |
| | Neal J. Andrews |
| | Chief Financial Officer (principal financial officer) of |
| | BlackRock Funds VI and Master Investment Portfolio II |
Date: March 8, 2019
5