UNITED STATES
SECURITIES AND EXCHANGE COMMISSION
Washington, D.C. 20549
FORMN-CSR
CERTIFIED SHAREHOLDER REPORT OF REGISTERED MANAGEMENT
INVESTMENT COMPANIES
Investment Company Act file number:811-23340
Name of Fund: Managed Account Series II
BlackRock U.S. Mortgage Portfolio
Fund Address: 100 Bellevue Parkway, Wilmington, DE 19809
Name and address of agent for service: John M. Perlowski, Chief Executive Officer, Managed Account
Series II, 55 East 52nd Street, New York, NY 10055
Registrant’s telephone number, including area code: (800)441-7762
Date of fiscal year end: 04/30/2020
Date of reporting period: 04/30/2020
Item 1 – Report to Stockholders
| | |
 | | APRIL 30, 2020 |
Managed Account Series II
| · | | BlackRock U.S. Mortgage Portfolio |
Beginning on January 1, 2021, as permitted by regulations adopted by the Securities and Exchange Commission, paper copies of the Fund’s shareholder reports will no longer be sent by mail, unless you specifically request paper copies of the reports from BlackRock or from your financial intermediary, such as a broker-dealer or bank. Instead, the reports will be made available on a website, and you will be notified by mail each time a report is posted and provided with a website link to access the report.
You may elect to receive all future reports in paper free of charge. If you hold accounts directly with BlackRock, you can call (800)441-7762 to inform BlackRock that you wish to continue receiving paper copies of your shareholder reports. If you hold accounts through a financial intermediary, you can follow the instructions included with this disclosure, if applicable, or contact your financial intermediary to request that you continue to receive paper copies of your shareholder reports. Please note that not all financial intermediaries may offer this service. Your election to receive reports in paper will apply to all funds advised by BlackRock Advisors, LLC, BlackRock Fund Advisors or their affiliates, or all funds held with your financial intermediary, as applicable.
If you already elected to receive shareholder reports electronically, you will not be affected by this change and you need not take any action. You may elect to receive electronic delivery of shareholder reports and other communications by: (i) accessing the BlackRock website at blackrock.com/edelivery and logging into your accounts, if you hold accounts directly with BlackRock, or (ii) contacting your financial intermediary, if you hold accounts through a financial intermediary. Please note that not all financial intermediaries may offer this service.
|
| Not FDIC Insured - May Lose Value - No Bank Guarantee |
The Markets in Review
Dear Shareholder,
The last 12 months have been a time of sudden change in global financial markets, as a long period of growth and positive returns was interrupted in early 2020 by the emergence and spread of the coronavirus. For much of the reporting period, U.S. equities and bonds both delivered impressive returns, despite fears and doubts about the economy that were ultimately laid to rest with unprecedented monetary stimulus and a sluggish yet resolute performance from the U.S. economy. But as the threat from the coronavirus became more apparent throughout February and March 2020, leading countries around the world took economically disruptive countermeasures, causing equity prices to fall sharply. While markets have since recovered some of these losses as countries around the world begin reopening, there is still significant uncertainty surrounding the long-term impact of the pandemic on the global economy.
Returns for most securities were robust for the first three quarters of the reporting period, as investors began to realize that the U.S. economy was maintaining the modest yet steady growth that had characterized this economic cycle. However, oncestay-at-home orders and closures ofnon-essential businesses became widespread, many workers were laid off and unemployment claims spiked. With large portions of the global economy on hold, all types of international equities ended the reporting period with negative performance, while in the U.S. only large-capitalization stocks delivered a slightly positive return.
The performance of different types of fixed-income securities diverged substantially due to a reduced investor appetite for risk. Treasuries benefited from therisk-off environment, and posted healthy returns, as the10-year yield (which is inversely related to bond prices) fell to anall-time low. Investment-grade corporate bonds also delivered a positive return, while high-yield corporates were down due to credit concerns.
The U.S. Federal Reserve (the “Fed”) reduced interest rates three times in 2019, to support slowing economic growth. After the coronavirus outbreak, the Fed instituted two emergency rate cuts, pushing short-term interest rates close to zero. To stabilize credit markets, the Fed also announced a new bond-buying program, as did several other central banks around the world, including the European Central Bank and the Bank of Japan.
Looking ahead, while coronavirus-related disruption is certain to hurt worldwide economic growth, the global expansion is likely to continue once the impact of the outbreak subsides. Nonetheless, there are promising signs that a strong coordinated monetary and fiscal response is underway, both in the United States and abroad. With measures being taken to contain the virus and provide support to impacted businesses and individuals, we anticipate a sharp increase in economic activity as life returns to normal.
Overall, we favor a neutral stance toward risk, given the uncertainty surrounding the economic impact of coronavirus countermeasures. Among equities, we see an advantage in U.S. stocks compared to other developed markets, given the diversity of the U.S. economy and the impressive scope of monetary and fiscal stimulus. In bonds, the swift action taken by the world’s central banks means there are attractive opportunities in credit, and we expect credit spreads to narrow as markets stabilize. Both U.S. Treasuries and sustainable investments can help provide portfolio resilience, and the disruption created by the coronavirus appears to be accelerating the shift toward sustainable investments.
In this environment, investors need to think globally, extend their scope across a broad array of asset classes, and be nimble as market conditions change. We encourage you to talk with your financial advisor and visitblackrock.com for further insight about investing in today’s markets.
Sincerely,

Rob Kapito
President, BlackRock Advisors, LLC

Rob Kapito
President, BlackRock Advisors, LLC
| | | | |
Total Returns as of April 30, 2020 |
| | | 6-Month | | 12-Month |
U.S. large cap equities
(S&P 500®Index) | | (3.16)% | | 0.86% |
U.S. small cap equities
(Russell 2000®Index) | | (15.47) | | (16.39) |
International equities
(MSCI Europe, Australasia,
Far East Index) | | (14.21) | | (11.34) |
Emerging market equities
(MSCI Emerging Markets
Index) | | (10.50) | | (12.00) |
3-month Treasury bills
(ICE BofA3-Month U.S.
Treasury Bill Index) | | 0.85 | | 2.07 |
U.S. Treasury securities
(ICE BofA10-Year U.S.
Treasury Index) | | 10.73 | | 19.78 |
U.S. investment grade bonds
(Bloomberg Barclays U.S. Aggregate Bond Index) | | 4.86 | | 10.84 |
Tax-exempt municipal bonds
(S&P Municipal Bond Index) | | (1.26) | | 2.21 |
U.S. high yield bonds
(Bloomberg Barclays U.S. Corporate High Yield 2% Issuer Capped Index) | | (6.60) | | (4.08) |
Past performance is no guarantee of future results. Index performance is shown for illustrative purposes only. You cannot invest directly in an index. |
| | |
| 2 | | THIS PAGEISNOT PARTOF YOUR FUND REPORT |
Table of Contents

| | |
| Fund Summary as of April 30, 2020 | | BlackRock U.S. Mortgage Portfolio |
Investment Objective
BlackRock U.S. Mortgage Portfolio’s (the “Fund”) investment objective is to seek high total return.
Portfolio Management Commentary
How did the Fund perform?
For the12-month period ended April 30, 2020, the Fund underperformed its benchmark, the Bloomberg Barclays U.S. Mortgage-Backed Securities Index.
What factors influenced performance?
The largest detractor from the Fund’s performance relative to the benchmark during the period was the allocation to securitized assets such as commercial mortgage backed securities (“CMBS”) andnon-agency residential mortgage backed securities (“MBS”).
The largest contributors to the Fund’s performance relative to the benchmark during the period were agency MBS relative value trades. In particular, trading the spread between the yields on agency MBS and U.S. Treasuries during the first quarter of 2020 proved to be beneficial.
Describe recent portfolio activity.
During the reporting period, the Fund reduced exposure to agency MBS passthroughs, while increasing exposure to CMBS andnon-agency MBS. Within CMBS, the Fund increased allocations to AAA conduit and high-quality single asset, single borrower (“SASB”) transactions, as well as to floating rate agency issues. Additionally, the Fund’s allocation tonon-agency MBS was increased.
The Fund held a small percentage of assets in derivatives as a means to manage risk against allocations in MBS and securitized assets. The Fund’s use of derivatives had a negative impact on the Fund’s performance.
Describe portfolio positioning at period end.
Relative to the benchmark, the Fund ended the period modestly underweight to duration and corresponding interest rate sensitivity. The Fund’s main sector allocations included agency MBS, CMBS andnon-agency MBS. The Fund closed the period with a constructive stance on agency MBS relative to the benchmark, with long positions focused in conventional higher coupons as well as lower current production coupons given attractive valuations and the tailwind provided by ongoing Fed purchases. Elsewhere in agency MBS relative value strategies, the Fund held anup-in-coupon bias, avoiding coupons where Fed purchases have been minimal. Within CMBS, the Fund favoredAAA-rated SASB, conduit CMBS and floating rate agency exposures. Withinnon-agency MBS, the Fund’s primary exposure was to AlternativeA-paper and subprime paper.
The views expressed reflect the opinions of BlackRock as of the date of this report and are subject to change based on changes in market, economic or other conditions. These views are not intended to be a forecast of future events and are no guarantee of future results.
| | |
| 4 | | 2020 BLACKROCK ANNUAL REPORT TO SHAREHOLDERS |
| | |
| Fund Summary as of April 30, 2020 (continued) | | BlackRock U.S. Mortgage Portfolio |
PORTFOLIO COMPOSITION
| | | | |
| Asset Type | |
| Percent of
Total Investments |
(a) |
| |
U.S. Government Sponsored Agency Securities | | | 74 | % |
| |
Non-Agency Mortgage-Backed Securities | | | 18 | |
| |
Asset-Backed Securities | | | 8 | |
| (a) | Total Investments exclude short-term securities, options purchased, options written and TBA sale commitments. |
CREDIT QUALITY ALLOCATION
| | | | |
| Credit Rating(a) | |
| Percent of
Total Investments |
(b) |
| |
AAA/Aaa(c) | | | 82 | % |
| |
AA/Aa | | | 1 | |
| |
A | | | — | (d) |
| |
BBB/Baa | | | — | (d) |
| |
BB/Ba | | | 1 | |
| |
B | | | — | (d) |
| |
CCC/Caa | | | 3 | |
| |
CC/Ca | | | 4 | |
| |
C | | | 1 | |
| |
D | | | — | (d) |
| |
NR | | | 8 | |
| (a) | For financial reporting purposes, credit quality ratings shown above reflect the highest rating assigned by either S&P Global Ratings or Moody’s Investors Service if ratings differ. These rating agencies are independent, nationally recognized statistical rating organizations and are widely used. Investment grade ratings are credit ratings of BBB/Baa or higher. Below investment grade ratings are credit ratings of BB/Ba or lower. Investments designated NR are not rated by either rating agency. Unrated investments do not necessarily indicate low credit quality. Credit quality ratings are subject to change. |
| (b) | Total Investments exclude short-term securities, options purchased, options written and TBA sale commitments. |
| (c) | The investment adviser evaluates the credit quality of unrated investments based upon certain factors including, but not limited to, credit ratings for similar investments and financial analysis of sectors, individual investments and/or issuers. Using this approach, the investment adviser has deemed unrated U.S. Government Sponsored Agency Securities and U.S. Treasury Obligations to be of similar credit quality as investments rated AAA/Aaa. |
| (d) | Represents less than 1% of the Fund’s total investments. |
| | |
| Fund Summary as of April 30, 2020 (continued) | | BlackRock U.S. Mortgage Portfolio |
TOTAL RETURN BASED ON A $10,000 INVESTMENT
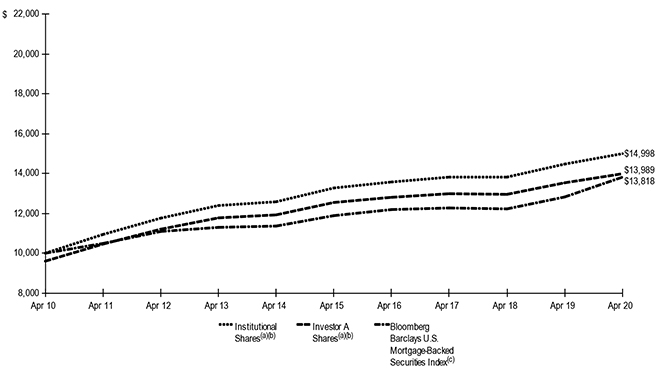
| (a) | Assuming maximum sales charges, if any, transaction costs and other operating expenses, including investment advisory fees. Institutional Shares do not have a sales charge. Prior to December 6, 2010, Investor A Shares performance results are those of Institutional Shares (which have no distribution or service fees) restated to reflect Investor A Share fees. |
| (b) | The Fund invests primarily in mortgage-related securities. Under normal circumstances, the Fund will invest at least 80% of its assets in mortgage-backed securities and other mortgage-related securities that are issued by issuers located in the United States. On September 17, 2018, the Fund acquired all of the assets, subject to the liabilities, of BlackRock U.S. Mortgage Portfolio (the “Predecessor Fund”), a series of Managed Account Series, through atax-free reorganization (the “Reorganization”). The Predecessor Fund is the performance and accounting survivor of the Reorganization. |
| (c) | An unmanaged index that includes the mortgage-backed pass-through securities of Ginnie Mae, Fannie Mae and Freddie Mac that meet certain maturity and liquidity criteria. |
Performance Summary for the Period Ended April 30, 2020
| | | | | | | | | | | | | | | | | | | | | | | | | | | | | | | | | | | | | | | | | | | | |
| | | | | | | | | | | | Average Annual Total Returns (a) | |
| | | | | | | | | | | | 1 Year | | | | | | 5 Years | | | | | | 10 Years | |
| | | Standardized
30-Day Yields | | | Unsubsidized
30-Day Yields | | | 6-Month
Total Returns | | | w/o sales
charge | | | w/sales
charge | | | | | | w/o sales
charge | | | w/sales
charge | | | | | | w/o sales
charge | | | w/sales
charge | |
Institutional | | | 3.26 | % | | | 3.03 | % | | | (0.24 | )% | | | 3.61 | % | | | N/A | | | | | | | | 2.47 | % | | | N/A | | | | | | | | 4.14 | % | | | N/A | |
| | | | | | | | | | | |
Investor A | | | 2.90 | | | | 2.61 | | | | (0.37 | ) | | | 3.35 | | | | (0.78 | )% | | | | | | | 2.20 | | | | 1.37 | % | | | | | | | 3.84 | | | | 3.41 | % |
| | | | | | | | | | | |
Investor C | | | 2.30 | | | | 1.99 | | | | (0.74 | ) | | | 2.58 | | | | 1.58 | | | | | | | | 1.44 | | | | 1.44 | | | | | | | | 3.07 | | | | 3.07 | |
Bloomberg Barclays U.S. Mortgage- Backed Securities Index | | | — | | | | — | | | | 3.84 | | | | 7.77 | | | | N/A | | | | | | | | 3.06 | | | | N/A | | | | | | | | 3.29 | | | | N/A | |
| | (a) | Assuming maximum sales charges, if any. Average annual total returns with and without sales charges reflect reductions for distribution and service fees. See “About Fund Performance” on page 7 for a detailed description of share classes, including any related sales charges and fees, and how performance was calculated for certain share classes. On September 17, 2018, the Fund acquired all of the assets, subject to the liabilities, of BlackRock U.S. Mortgage Portfolio (the “Predecessor Fund”), a series of Managed Account Series, through atax-free reorganization (the “Reorganization”). The Predecessor Fund is the performance and accounting survivor of the Reorganization. | |
N/A – Not applicable as share class and index do not have a sales charge.
Past performance is not indicative of future results. Performance results do not reflect the deduction of taxes that a shareholder would pay on Fund distributions on the redemptions of Fund Shares.
Performance results may include adjustments for financial reporting purpose in accordance with U.S. generally accepted accounting principles.
| | |
| 6 | | 2020 BLACKROCK ANNUAL REPORT TO SHAREHOLDERS |
The Benefits and Risks of Leveraging
The Fund may utilize leverage to seek to enhance returns and net asset value (“NAV”). However, there is no guarantee that these objectives can be achieved in all interest rate environments.
The Fund may utilize leverage by entering into reverse repurchase agreements.
In general, the concept of leveraging is based on the premise that the financing cost of leverage, which is based on short-term interest rates, is normally lower than the income earned by the Fund on its longer-term portfolio investments purchased with the proceeds from leverage. To the extent that the total assets of the Fund (including the assets obtained from leverage) are invested in higher-yielding portfolio investments, the Fund’s shareholders benefit from the incremental net income.
The interest earned on securities purchased with the proceeds from leverage is distributed to the Fund’s shareholders, and the value of these portfolio holdings is reflected in the Fund’s per share NAV. However, in order to benefit shareholders, the return on assets purchased with leverage proceeds must exceed the ongoing costs associated with the leverage. If interest and other ongoing costs of leverage exceed the Fund’s return on assets purchased with leverage proceeds, income to shareholders is lower than if the Fund had not used leverage.
Furthermore, the value of the Fund’s portfolio investments generally varies inversely with the direction of long-term interest rates, although other factors can also influence the value of portfolio investments. As a result, changes in interest rates can influence the Fund’s NAV positively or negatively in addition to the impact on the Fund’s performance from leverage. Changes in the direction of interest rates are difficult to predict accurately, and there is no assurance that the Fund’s leveraging strategy will be successful.
The use of leverage also generally causes greater changes in the Fund’s NAV and dividend rates than comparable portfolios without leverage. In a declining market, leverage is likely to cause a greater decline in the NAV of the Fund’s shares than if the Fund were not leveraged. In addition, the Fund may be required to sell portfolio securities at inopportune times or at distressed values in order to comply with regulatory requirements applicable to the use of leverage or as required by the terms of the leverage instruments, which may cause the Fund to incur losses. The use of leverage may limit the Fund’s ability to invest in certain types of securities or use certain types of hedging strategies. The Fund incurs expenses in connection with the use of leverage, all of which are borne by the Fund’s shareholders and may reduce income.
About Fund Performance
Institutional Shares are not subject to any sales charge. These shares bear no ongoing distribution or service fees and are available only to certain eligible investors.
Investor A Shares are subject to a maximum initial sales charge(front-end load) of 4.00% and a service fee of 0.25% per year (but no distribution fee). Certain redemptions of these shares may be subject to a contingent deferred sales charge (“CDSC”) where no initial sales charge was paid at the time of purchase. These shares are generally available through financial intermediaries. Investor A Shares performance shown prior to the Investor A Shares inception date of December 6, 2010 is that of Institutional Shares (which have no distribution or service fees) and was restated to reflect Investor A Shares fees.
Investor C Shares are subject to a 1.00% CDSC if redeemed within one year of purchase. In addition, these shares are subject to a distribution fee of 0.75% per year and a service fee of 0.25% per year. These shares are generally available through financial intermediaries. These shares automatically convert to Investor A Shares after approximately ten years. Investor C Shares performance shown prior to the Investor C Shares inception date of December 6, 2010 is that of Institutional Shares (which have no distribution or service fees) and was restated to reflect Investor C Shares fees.
Performance information reflects past performance and does not guarantee future results. Current performance may be lower or higher than the performance data quoted. Refer toblackrock.comto obtain performance data current to the most recentmonth-end. Performance results do not reflect the deduction of taxes that a shareholder would pay on Fund distributions or the redemption of Fund shares. Figures shown in the performance tables on the previous page assume reinvestment of all distributions, if any, at net asset value (“NAV”) on theex-dividend date or payable date, as applicable. Investment return and principal value of shares will fluctuate so that shares, when redeemed, may be worth more or less than their original cost. Distributions paid to each class of shares will vary because of the different levels of service, distribution and transfer agency fees applicable to each class, which are deducted from the income available to be paid to shareholders.
BlackRock Advisors, LLC (the “Manager”), the Fund’s investment adviser, has contractually agreed to waive and/or reimburse a portion of the Fund’s expenses. Without such waiver and/or reimbursement, the Fund’s performance would have been lower. With respect to the Fund’s contractual waivers, the Manager is under no obligation to continue waiving and/or reimbursing its fees after the applicable termination date of such agreement. See Note 6 of the Notes to Financial Statements for additional information on waivers and/or reimbursements.
The standardized30-day yield includes the effects of any waivers and/or reimbursements. The unsubsidized30-day yield excludes the effects of any waivers and/or reimbursements.
| | | | |
| THE BENEFITSAND RISKSOF LEVERAGING / ABOUT FUND PERFORMANCE | | | 7 | |
Disclosure of Expenses
Shareholders of the Fund may incur the following charges: (a) transactional expenses, such as sales charges; and (b) operating expenses, including investment advisory fees, service and distribution fees, including12b-1 fees, acquired fund fees and expenses, and other fund expenses. The expense example shown below (which is based on a hypothetical investment of $1,000 invested on November 1, 2019 and held through April 30, 2020) is intended to assist shareholders both in calculating expenses based on an investment in the Fund and in comparing these expenses with similar costs of investing in other mutual funds.
The expense example provides information about actual account values and actual expenses. In order to estimate the expenses a shareholder paid during the period covered by this report, shareholders can divide their account value by $1,000 and then multiply the result by the number corresponding to their share class under the heading entitled “Expenses Paid During the Period.”
The expense example also provides information about hypothetical account values and hypothetical expenses based on the Fund’s actual expense ratio and an assumed rate of return of 5% per year before expenses. In order to assist shareholders in comparing the ongoing expenses of investing in the Fund and other funds, compare the 5% hypothetical examples with the 5% hypothetical examples that appear in shareholder reports of other funds.
The expenses shown in the expense example are intended to highlight shareholders’ ongoing costs only and do not reflect transactional expenses, such as sales charges, if any. Therefore, the hypothetical example is useful in comparing ongoing expenses only, and will not help shareholders determine the relative total expenses of owning different funds. If these transactional expenses were included, shareholder expenses would have been higher.
| | | | | | | | | | | | | | | | | | | | | | | | | | | | | | | | | | | | | | | | | | | | | | | | |
| | | Actual | | | | | Hypothetical (a) | |
| | | | | | | | | Including
Interest
Expense | | | | | | Excluding
Interest
Expense | | | | | | | | | | Including Interest Expense | | | | | | Excluding Interest Expense | |
| | | Beginning
Account Value
(11/01/19) | | | Ending
Account Value
(04/30/20) | | | Expenses
Paid During
the Period (b) | | | | | | Expenses
Paid During
the Period (c) | | | | | Beginning
Account Value
(11/01/19) | | | | | Ending
Account Value
(04/30/20) | | | Expenses
Paid During
the Period (b) | | | | | | Ending
Account Value
(04/30/20) | | | Expenses
Paid During
the Period (c) | |
Institutional | | $ | 1,000.00 | | | $ | 997.60 | | | $ | 2.68 | | | | | | | $ | 2.24 | | | | | $ 1,000.00 | | | | | | $ | 1,022.18 | | | $ | 2.72 | | | | | | | $ | 1,022.63 | | | $ | 2.26 | |
| | | | | | | | | | | | | |
Investor A | | | 1,000.00 | | | | 996.30 | | | | 3.92 | | | | | | | | 3.47 | | | | | 1,000.00 | | | | | | | 1,020.93 | | | | 3.97 | | | | | | | | 1,021.38 | | | | 3.52 | |
| | | | | | | | | | | | | |
Investor C | | | 1,000.00 | | | | 992.60 | | | | 7.63 | | | | | | | | 7.18 | | | | | 1,000.00 | | | | | | | 1,017.21 | | | | 7.72 | | | | | | | | 1,017.65 | | | | 7.27 | |
| (a) | Hypothetical 5% annual return before expenses is calculated by prorating the number of days in the most recent fiscal half year divided by 366. |
| (b) | For each class of the Fund, expenses are equal to the annualized expense ratio for the class (0.54% for Institutional, 0.79% for Investor A and 1.54% for Investor C), multiplied by the average account value over the period, multiplied by 182/366 (to reflect theone-half year period shown). |
| (c) | For each class of the Fund, expenses are equal to the annualized expense ratio for the class (0.45% for Institutional, 0.70% for Investor A and 1.45% for Investor C), multiplied by the average account value over the period, multiplied by 182/366 (to reflect theone-half year period shown). |
Derivative Financial Instruments
The Fund may invest in various derivative financial instruments. These instruments are used to obtain exposure to a security, commodity, index, market, and/or other assets without owning or taking physical custody of securities, commodities and/or other referenced assets or to manage market, equity, credit, interest rate, foreign currency exchange rate, commodity and/or other risks. Derivative financial instruments may give rise to a form of economic leverage and involve risks, including the imperfect correlation between the value of a derivative financial instrument and the underlying asset, possible default of the counterparty to the transaction or illiquidity of the instrument. The Fund’s successful use of a derivative financial instrument depends on the investment adviser’s ability to predict pertinent market movements accurately, which cannot be assured. The use of these instruments may result in losses greater than if they had not been used, may limit the amount of appreciation the Fund can realize on an investment and/or may result in lower distributions paid to shareholders. The Fund’s investments in these instruments, if any, are discussed in detail in the Notes to Financial Statements.
| | |
| 8 | | 2020 BLACKROCK ANNUAL REPORT TO SHAREHOLDERS |
| | |
Schedule of Investments April 30, 2020 | | BlackRock U.S. Mortgage Portfolio (Percentages shown are based on Net Assets) |
| | | | | | | | | | | | |
| Security | | | | | Par
(000) | | | Value | |
|
Asset-Backed Securities — 10.5% | |
Ajax Mortgage Loan Trust(a): | | | | | | | | | | | | |
Series2019-B, Class A, 3.75%, 01/25/59(b) | | | USD | | | | 2,353 | | | $ | 2,369,702 | |
Series2020-A, Class A,
2.37%, 12/25/59(c)(d) | | | | | | | 2,431 | | | | 2,418,064 | |
Series2020-A, Class B,
3.50%, 12/25/59(c)(d) | | | | | | | 233 | | | | 231,436 | |
Series2020-A, Class C, 0.00%, 12/25/59(d) | | | | | | | 630 | | | | 372,771 | |
Bear Stearns Asset-Backed Securities I
Trust(e): | | | | | | | | | | | | |
Series2006-HE8, Class 1A3, (LIBOR USD 1 Month + 0.26%), 0.75%, 10/25/36 | | | | | | | 1,200 | | | | 967,308 | |
Series2007-HE2, Class 22A, (LIBOR USD 1 Month + 0.14%), 0.63%, 03/25/37 | | | | | | | 759 | | | | 706,170 | |
BSPRT Issuer Ltd., Series2018-FL3, Class A, (LIBOR USD 1 Month + 1.05%),
1.86%, 03/15/28(a)(e) | | | | | | | 1,727 | | | | 1,686,318 | |
Carmax Auto Owner Trust, Series2016-3, Class A4, 1.60%, 01/18/22 | | | | | | | 596 | | | | 596,412 | |
Carrington Mortgage Loan Trust, Series 2007- FRE1, Class M1, (LIBOR USD 1 Month + 0.50%), 0.99%, 02/25/37(e) | | | | | | | 1,617 | | | | 851,376 | |
Countrywide Asset-Backed Certificates(e): | | | | | | | | | | | | |
Series2002-BC3, Class M2, (LIBOR USD 1 Month + 1.73%), 2.21%, 05/25/32 | | | | | | | 2,060 | | | | 1,876,924 | |
Series2006-22, Class M1, (LIBOR USD 1 Month + 0.23%), 0.72%, 05/25/47 | | | | | | | 1,851 | | | | 839,876 | |
Series2007-BC3, Class 1A, (LIBOR USD 1 Month + 0.18%), 0.67%, 11/25/47 | | | | | | | 1,141 | | | | 895,593 | |
Credit-Based Asset Servicing & Securitization LLC, Series2007-CB6, Class A4, (LIBOR USD 1 Month + 0.34%),
0.83%, 07/25/37(a)(e) | | | | | | | 2,188 | | | | 1,493,398 | |
CWABS Asset-Backed Certificates Trust, Series2006-18, Class M1, (LIBOR USD 1 Month + 0.30%), 0.79%, 03/25/37(e) | | | | | | | 1,496 | | | | 850,917 | |
CWABS, Inc. Asset-Backed Certificates
Trust(e): | | | | | | | | | | | | |
Series2004-6, Class 2A4, (LIBOR USD 1 Month + 0.90%), 1.39%, 11/25/34 | | | | | | | 16 | | | | 14,579 | |
Series2004-6, Class 2A5, (LIBOR USD 1 Month + 0.78%), 1.27%, 11/25/34 | | | | | | | 605 | | | | 539,003 | |
Dryden XXVIII Senior Loan Fund, Series 2013-28A, Class A1LR, (LIBOR USD 3 Month + 1.20%), 2.89%, 08/15/30(a)(e) | | | | | | | 1,000 | | | | 969,194 | |
Finance of America HECM Buyout, Series2020-HB1, Class M4,
4.05%, 02/25/30(a)(b)(d) | | | | | | | 1,500 | | | | 1,500,000 | |
Litigation Fee Residual Funding LLC, Series2015-1, Class A, 4.00%, 10/30/27(d) | | | | | | | 297 | | | | 296,325 | |
LMREC, Inc., Series 2016-CRE2, Class A, (LIBOR USD 1 Month + 1.70%),
2.63%, 11/24/31(a)(e) | | | | | | | 42 | | | | 41,476 | |
Long Beach Mortgage Loan Trust(e): | | | | | | | | | | | | |
Series2006-7, Class 2A3, (LIBOR USD 1 Month + 0.16%), 0.65%, 08/25/36 | | | | | | | 2,031 | | | | 955,938 | |
Series2006-10, Class 2A2, (LIBOR USD 1 Month + 0.11%), 0.60%, 11/25/36 | | | | | | | 10 | | | | 3,918 | |
Morgan Stanley IXIS Real Estate Capital Trust, Series2006-1, Class A3, (LIBOR USD 1 Month + 0.15%), 0.64%, 07/25/36(e) | | | | | | | 508 | | | | 242,550 | |
Mosaic Solar Loan Trust, Series2019-2A, Class A, 2.88%, 09/20/40(a) | | | | | | | 93 | | | | 90,003 | |
Option One Mortgage Loan Trust, Series 2007- FXD1, Class 2A1, 5.87%, 01/25/37(c) | | | | | | | 1,486 | | | | 1,360,947 | |
Progress Residential Trust, Series 2017-SFR1, Class A, 2.77%, 08/17/34(a) | | | | | | | 418 | | | | 421,602 | |
RASC Series Trust, Series 2006-EMX9, Class 1A4, (LIBOR USD 1 Month + 0.24%), 0.73%, 11/25/36(e) | | | | | | | 1,230 | | | | 766,711 | |
| | | | | | | | | | | | |
| Security | | | | | Par
(000) | | | Value | |
|
| Asset-Backed Securities (continued) | |
Structured Asset Securities Corp. Mortgage Loan Trust, Series 2007-MN1A, Class A1, (LIBOR USD 1 Month + 0.23%), 0.72%, 01/25/37(a)(e) | | | USD | | | | 1,553 | | | $ | 976,360 | |
Towd Point Mortgage Trust, Series2019-SJ2, Class A2, 4.25%, 11/25/58(a)(b) | | | | | | | 2,000 | | | | 2,010,728 | |
| | | | | | | | | | | | |
| | | |
Total Asset-Backed Securities — 10.5%
(Cost: $28,262,168) | | | | | | | | | | | 26,345,599 | |
| | | | | | | | | | | | |
|
Non-Agency Mortgage-Backed Securities — 24.2% | |
|
| Collateralized Mortgage Obligations — 7.8% | |
Alternative Loan Trust: | | | | | | | | | | | | |
Series 2004-12CB, Class 1A1, 5.00%, 07/25/19 | | | | | | | 1 | | | | 817 | |
Series 2006-45T1, Class 2A7, 0.83%, 02/25/37(b) | | | | | | | 2,032 | | | | 1,046,831 | |
Series 2006-OC11, Class 2A2A, 0.66%, 01/25/37(b) | | | | | | | 92 | | | | 89,694 | |
Banc of America Mortgage Trust, Series2005-I, Class 2A5, 3.99%, 10/25/35(b) | | | | | | | 162 | | | | 149,146 | |
BCAP LLC Trust, Series2012-RR3, Class 3A8, 3.61%, 07/26/37(a)(b) | | | | | | | 2,200 | | | | 1,851,591 | |
Bear StearnsALT-A Trust, Series2007-1, Class 1A1, 0.81%, 01/25/47(b) | | | | | | | 1,054 | | | | 837,822 | |
ChaseFlex Trust, Series2007-1, Class 2A7, 6.00%, 02/25/37 | | | | | | | 2,261 | | | | 1,386,381 | |
CHL Mortgage Pass-Through Trust, Series2005-17, Class 1A6, 5.50%, 09/25/35 | | | | | | | 68 | | | | 64,299 | |
CitiMortgage Alternative Loan Trust, Series2007-A5, Class 1A6, 6.00%, 05/25/37 | | | | | | | 982 | | | | 888,903 | |
CSMC Mortgage-Backed Trust, Series2006-8, Class 1A1, 4.50%, 10/25/21 | | | | | | | 7 | | | | 6,221 | |
GSR Mortgage Loan Trust, Series2006-9F, Class 3A1, 6.25%, 10/25/36 | | | | | | | 994 | | | | 951,700 | |
IndyMac INDX Mortgage Loan Trust, Series 2006-AR15, Class A1, 0.61%, 07/25/36(b). | | | | | | | 1,032 | | | | 848,263 | |
RALI Trust, Series2007-QS1, Class 1A5,
1.04%, 01/25/37(b) | | | | | | | 1,775 | | | | 1,257,126 | |
Residential Asset Securitization Trust(b): | | | | | | | | | | | | |
Series 2006-A7CB, Class 2A2, 1.04%, 07/25/36 | | | | | | | 2,741 | | | | 239,460 | |
Series 2006-A7CB, Class 2A6, 50.10%, 07/25/36 | | | | | | | 481 | | | | 1,547,274 | |
RMF Buyout Issuance Trust, Series2020-1, Class M4, 4.19%, 02/25/30(a)(b)(d) | | | | | | | 1,600 | | | | 1,406,368 | |
Seasoned Credit Risk Transfer Trust: | | | | | | | | | | | | |
Series2018-2, Class MA, 3.50%, 11/25/57 | | | | | | | 412 | | | | 438,203 | |
Series2018-3, Class MA, 3.50%, 08/25/57 | | | | | | | 563 | | | | 599,606 | |
Series2018-4, Class MA, 3.50%, 03/25/58 | | | | | | | 1,002 | | | | 1,069,295 | |
Series2019-2, Class MA, 3.50%, 08/25/58 | | | | | | | 344 | | | | 368,558 | |
TVC Mortgage Trust, Series 2020-RTL1, Class A1, 3.47%, 09/25/24(a) | | | | | | | 1,500 | | | | 1,216,430 | |
WaMu Mortgage Pass-Through Trust, Series2007-OA5, Class 2A, 2.24%, 06/25/47(b) | | | | | | | 3,130 | | | | 2,463,773 | |
Washington Mutual Mortgage Pass-Through Certificates WMALT Trust, Series2006-2, Class 2CB, 6.50%, 03/25/36 | | | | | | | 854 | | | | 640,270 | |
| | | | | | | | | | | | |
| | | | | | | | | | | 19,368,031 | |
|
| Commercial Mortgage-Backed Securities — 15.0% | |
1211 Avenue of the Americas Trust, Series 2015-1211, Class A1A2, 3.90%, 08/10/35(a) | | | | | | | 370 | | | | 397,081 | |
225 Liberty Street Trust, Series 2016-225L, Class E, 4.80%, 02/10/36(a)(b) | | | | | | | 635 | | | | 564,507 | |
| | | | |
| SCHEDULE OF INVESTMENTS | | | 9 | |
| | |
Schedule of Investments (continued) April 30, 2020 | | BlackRock U.S. Mortgage Portfolio (Percentages shown are based on Net Assets) |
| | | | | | | | | | | | |
| Security | | | | | Par
(000) | | | Value | |
|
| Commercial Mortgage-Backed Securities (continued) | |
280 Park Avenue Mortgage Trust, Series 2017- 280P, Class E, 2.93%, 09/15/34(a)(b) | | | USD | | | | 560 | | | $ | 516,511 | |
Atrium Hotel Portfolio Trust, Series 2017-ATRM, Class E, 3.86%, 12/15/36(a)(b) | | | | | | | 205 | | | | 146,748 | |
Bancorp Commercial Mortgage Trust (The), Series2018-CR3, Class A,
1.66%, 01/15/33(a)(b) | | | | | | | 19 | | | | 17,465 | |
BANK, Series 2020-BN26, Class A4,
2.40%, 03/15/63 | | | | | | | 575 | | | | 579,986 | |
Benchmark Mortgage Trust: | | | | | | | | | | | | |
Series2019-B15, Class A5, 2.93%, 12/15/72 | | | | | | | 885 | | | | 938,840 | |
Series2020-B16, Class C,
3.66%, 02/15/53(b) | | | | | | | 159 | | | | 112,389 | |
Series2020-B16, Class D,
2.50%, 02/15/53(a) | | | | | | | 206 | | | | 98,811 | |
BX Commercial Mortgage Trust(a)(b): | | | | | | | | | | | | |
Series2019-XL, Class D, 2.26%, 10/15/36 | | | | | | | 1,338 | | | | 1,286,367 | |
Series 2020-BXLP, Class A,
1.61%, 12/15/36 | | | | | | | 615 | | | | 591,071 | |
Series 2020-BXLP, Class F,
2.81%, 12/15/36 | | | | | | | 555 | | | | 519,273 | |
BX Trust(a): | | | | | | | | | | | | |
Series 2019-OC11, Class A,
3.20%, 12/09/41 | | | | | | | 1,410 | | | | 1,403,758 | |
Series 2019-OC11, Class E,
4.08%, 12/09/41(b) | | | | | | | 698 | | | | 579,104 | |
CCRESG Commercial Mortgage Trust, Series 2016-HEAT, Class A, 3.36%, 04/10/29(a) | | | | | | | 950 | | | | 933,436 | |
CD Mortgage Trust, Series2006-CD3, Class AM, 5.65%, 10/15/48 | | | | | | | 1,923 | | | | 1,969,237 | |
CFK Trust, Series2020-MF2, Class B,
2.79%, 03/15/39(a) | | | | | | | 336 | | | | 324,550 | |
Citigroup Commercial Mortgage Trust, Series2018-C5, Class AS, 4.41%, 06/10/51(b) | | | | | | | 500 | | | | 535,420 | |
CityLine Commercial Mortgage Trust, Series 2016-CLNE, Class A, 2.87%, 11/10/31(a)(b) | | | | | | | 400 | | | | 391,488 | |
Commercial Mortgage Trust: | | | | | | | | | | | | |
Series 2014-UBS2, Class A5,
3.96%, 03/10/47 | | | | | | | 345 | | | | 365,078 | |
Series 2015-CR25, Class A3,
3.51%, 08/10/48 | | | | | | | 631 | | | | 662,509 | |
Series 2015-CR25, Class C,
4.69%, 08/10/48(b) | | | | | | | 50 | | | | 43,250 | |
Series 2015-CR26, Class ASB,
3.37%, 10/10/48 | | | | | | | 400 | | | | 414,924 | |
Series 2017-PANW, Class A,
3.24%, 10/10/29(a) | | | | | | | 1,580 | | | | 1,575,127 | |
CSAIL Commercial Mortgage Trust: | | | | | | | | | | | | |
Series2018-C14, Class A4,
4.42%, 11/15/51(b) | | | | | | | 600 | | | | 683,219 | |
Series2019-C16, Class C,
4.24%, 06/15/52(b) | | | | | | | 630 | | | | 480,236 | |
Series2019-C17, Class C, 3.93%, 09/15/52 | | | | | | | 392 | | | | 289,092 | |
Series2020-C19, Class B, 3.48%, 03/15/53 | | | | | | | 355 | | | | 314,286 | |
GRACE Mortgage Trust, Series 2014-GRCE, Class F, 3.71%, 06/10/28(a)(b) | | | | | | | 215 | | | | 213,218 | |
GS Mortgage Securities Corp. II, Series 2005- ROCK, Class A, 5.37%, 05/03/32(a) | | | | | | | 335 | | | | 360,832 | |
GS Mortgage Securities Corp. Trust, Series 2019-SOHO, Class A, 1.71%, 06/15/36(a)(b) | | | | | | | 715 | | | | 682,392 | |
GS Mortgage Securities Trust, Series 2015- GC32, Class D, 3.35%, 07/10/48 | | | | | | | 54 | | | | 27,499 | |
Hudson Yards Mortgage Trust, Series 2019- 30HY, Class D, 3.56%, 07/10/39(a)(b) | | | | | | | 208 | | | | 199,400 | |
IMT Trust, Series 2017-APTS, Class BFX, 3.61%, 06/15/34(a)(b) | | | | | | | 1,250 | | | | 1,187,280 | |
| | | | | | | | | | | | |
| Security | | | | | Par
(000) | | | Value | |
|
| Commercial Mortgage-Backed Securities (continued) | |
JPMDB Commercial Mortgage Securities Trust, Series 2019-COR6, Class A4,
3.06%, 11/13/52 | | | USD | | | | 815 | | | $ | 862,660 | |
JPMorgan Chase Commercial Mortgage Securities Corp., Series 2017-FL10, Class E,
4.71%, 06/15/32(a)(b) | | | | | | | 275 | | | | 252,989 | |
JPMorgan Chase Commercial Mortgage Securities Trust: | | | | | | | | | | | | |
Series2013-C16, Class A4, 4.17%, 12/15/46 | | | | | | | 391 | | | | 414,879 | |
Series 2016-NINE, Class A,
2.95%, 09/06/38(a)(b) | | | | | | | 640 | | | | 652,332 | |
Series2018-AON, Class A, 4.13%, 07/05/31(a) | | | | | | | 610 | | | | 631,410 | |
Series 2020-MKST, Class E,
3.06%, 12/15/36(a)(b) | | | | | | | 690 | | | | 623,927 | |
LCCM Mortgage Trust, Series2014-909, Class A, 3.39%, 05/15/31(a) | | | | | | | 620 | | | | 621,451 | |
MFT Trust(a)(b): | | | | | | | | | | | | |
Series2020-ABC, Class C, 3.48%, 02/06/30 | | | | | | | 292 | | | | 281,984 | |
Series2020-ABC, Class D, 3.48%, 02/06/30 | | | | | | | 170 | | | | 134,767 | |
Morgan Stanley Bank of America Merrill Lynch Trust, Series2015-C26, Class A5,
3.53%, 10/15/48 | | | | | | | 1,103 | | | | 1,155,183 | |
Morgan Stanley Capital I Trust: | | | | | | | | | | | | |
Series 2014-150E, Class A,
3.91%, 09/09/32(a) | | | | | | | 595 | | | | 638,116 | |
Series2017-CLS, Class E,
2.76%, 11/15/34(a)(b) | | | | | | | 675 | | | | 636,312 | |
Series2017-HR2, Class D, 2.73%, 12/15/50 | | | | | | | 555 | | | | 312,633 | |
Series2018-H4, Class A4, 4.31%, 12/15/51 | | | | | | | 600 | | | | 684,535 | |
Series2018-SUN, Class A,
1.71%, 07/15/35(a)(b) | | | | | | | 595 | | | | 545,761 | |
Series2020-L4, Class A3, 2.70%, 02/15/53 | | | | | | | 265 | | | | 272,465 | |
Series2020-L4, Class D, 2.50%, 02/15/53(a) | | | | | | | 506 | | | | 269,451 | |
Natixis Commercial Mortgage Securities Trust, Series2018-FL1, Class A,
1.65%, 06/15/35(a)(b) | | | | | | | 177 | | | | 166,101 | |
One Bryant Park Trust, Series2019-OBP, Class A, 2.52%, 09/15/54(a) | | | | | | | 1,072 | | | | 1,063,793 | |
USDC, Series 2018-USDC, Class E,
4.64%, 05/13/38(a)(b) | | | | | | | 685 | | | | 542,366 | |
Velocity Commercial Capital Loan Trust(a)(b): | | | | | | | | | | | | |
Series2019-3, Class M4, 3.68%, 10/25/49 | | | | | | | 2,068 | | | | 1,683,490 | |
Series2020-1, Class M4, 3.54%, 02/25/50 | | | | | | | 994 | | | | 832,485 | |
Wells Fargo Commercial Mortgage Trust: | | | | | | | | | | | | |
Series2015-C31, Class A4, 3.70%, 11/15/48 | | | | | | | 670 | | | | 714,462 | |
Series 2015-NXS4, Class B,
4.22%, 12/15/48(b) | | | | | | | 650 | | | | 557,558 | |
Series 2016-NXS5, Class B,
5.10%, 01/15/59(b) | | | | | | | 625 | | | | 570,098 | |
Series 2016-NXS5, Class C,
5.14%, 01/15/59(b) | | | | | | | 238 | | | | 198,752 | |
Series 2018-1745, Class A,
3.87%, 06/15/36(a)(b) | | | | | | | 610 | | | | 642,519 | |
Series2018-BXI, Class E,
2.97%, 12/15/36(a)(b) | | | | | | | 93 | | | | 86,012 | |
Series2019-C52, Class C, 3.56%, 08/15/52 | | | | | | | 520 | | | | 371,718 | |
WFRBS Commercial Mortgage Trust: | | | | | | | | | | | | |
Series2014-C21, Class A4, 3.41%, 08/15/47 | | | | | | | 675 | | | | 705,010 | |
Series2014-C22, Class C, 3.91%, 09/15/57(b) | | | | | | | 63 | | | | 53,958 | |
| | |
| 10 | | 2020 BLACKROCK ANNUAL REPORT TO SHAREHOLDERS |
| | |
Schedule of Investments (continued) April 30, 2020 | | BlackRock U.S. Mortgage Portfolio (Percentages shown are based on Net Assets) |
| | | | | | | | | | | | |
| Security | | | | | Par
(000) | | | Value | |
|
| Commercial Mortgage-Backed Securities (continued) | |
Series 2014-LC14, Class A4,
3.77%, 03/15/47 | | | USD | | | | 900 | | | $ | 934,438 | |
| | | | | | | | | | | | |
| | | | | | | | | | | 37,517,999 | |
|
Interest Only Collateralized Mortgage Obligations — 0.7%(b) | |
Alternative Loan Trust, Series 2006-45T1, | | | | | | | | | | | | |
Class 2A8, 6.11%, 02/25/37 | | | | | | | 1,016 | | | | 256,783 | |
GSR Mortgage Loan Trust, Series2007-3F, | | | | | | | | | | | | |
Class 4A2, 6.21%, 05/25/37 | | | | | | | 5,425 | | | | 1,514,347 | |
| | | | | | | | | | | | |
| | | | | | | | | | | 1,771,130 | |
|
Interest Only Commercial Mortgage-Backed Securities — 0.7%(b) | |
BANK, Series 2017-BNK9, Class XA, 0.95%, 11/15/54 | | | | | | | 4,308 | | | | 191,293 | |
Benchmark Mortgage Trust, Series2020-B17, Class XB, 0.65%, 03/15/53 | | | | | | | 15,395 | | | | 591,598 | |
CSAIL Commercial Mortgage Trust: | | | | | | | | | | | | |
Series2018-C14, Class XA,
0.73%, 11/15/51 | | | | | | | 1,296 | | | | 47,189 | |
Series2019-C16, Class XA,
1.73%, 06/15/52 | | | | | | | 3,975 | | | | 421,524 | |
UBS Commercial Mortgage Trust, Series 2019- C17, Class XA, 1.64%, 10/15/52 | | | | | | | 3,314 | | | | 329,097 | |
Wells Fargo Commercial Mortgage Trust, Series2017-C41, Class XA,
1.37%, 11/15/50 | | | | | | | 3,845 | | | | 257,683 | |
| | | | | | | | | | | | |
| | | | | | | | | | | 1,838,384 | |
| | | | | | | | | | | | |
|
TotalNon-Agency Mortgage-Backed Securities — 24.2%
| |
(Cost: $64,898,113) | | | | | | | | | | | 60,495,544 | |
| | | | | | | | | | | | |
|
U.S. Government Sponsored Agency Securities — 97.7% | |
|
Collateralized Mortgage Obligations — 4.3% | |
Federal Home Loan Mortgage Corp., Series 4398, Class ZX, 4.00%, 09/15/54 | | | | | | | 311 | | | | 374,369 | |
Federal Home Loan Mortgage Corp. Variable Rate Notes(e): | | | | | | | | | | | | |
Series 2411, Class FJ, (LIBOR USD 1 Month + 0.35%), 1.16%, 12/15/29 | | | | | | | 4 | | | | 4,005 | |
Series 4901, Class BF, (LIBOR USD 1 Month + 0.40%), 1.21%, 07/25/49 | | | | | | | 902 | | | | 895,001 | |
Federal National Mortgage Association: | | | | | | | | | | | | |
Series2010-134, Class KZ,
4.50%, 12/25/40 | | | | | | | 697 | | | | 782,960 | |
Series2010-141, Class LZ,
4.50%, 12/25/40 | | | | | | | 640 | | | | 724,959 | |
Series2011-8, Class ZA,
4.00%, 02/25/41 | | | | | | | 1,013 | | | | 1,100,231 | |
Series2011-131, Class LZ,
4.50%, 12/25/41 | | | | | | | 423 | | | | 472,069 | |
Series2012-107, Class QZ,
3.50%, 10/25/42 | | | | | | | 391 | | | | 422,482 | |
Series2018-21, Class CA,
3.50%, 04/25/45 | | | | | | | 898 | | | | 928,253 | |
Federal National Mortgage Association Variable Rate Notes, Series2019-39, Class LF, (LIBOR USD 1 Month + 0.45%), 0.94%, 08/25/49(e) | | | | | | | 1,003 | | | | 1,000,375 | |
Government National Mortgage Association: | | | | | | | | | | | | |
Series2009-122, Class PY,
6.00%, 12/20/39 | | | | | | | 94 | | | | 109,026 | |
Series2016-123, Class LM,
3.00%, 09/20/46 | | | | | | | 200 | | | | 226,023 | |
Series2019-5, Class P,
3.50%, 07/20/48 | | | | | | | 746 | | | | 791,561 | |
Series2019-29, Class HY,
3.50%, 03/20/49 | | | | | | | 100 | | | | 112,420 | |
Government National Mortgage Association Variable Rate Notes: | | | | | | | | | | | | |
Series2014-107, Class WX,
6.81%, 07/20/39(b) | | | | | | | 378 | | | | 440,224 | |
Series2019-21, Class FL, (LIBOR USD 1 Month + 0.45%), 1.17%, 02/20/49(e) | | | | | | | 1,172 | | | | 1,169,696 | |
| | | | | | | | | | | | |
| Security | | | | | Par
(000) | | | Value | |
|
| Collateralized Mortgage Obligations (continued) | |
Series2019-89, Class FH, (LIBOR USD 1 Month + 0.40%), 1.12%, 07/20/49(e) | | | USD | | | | 1,185 | | | $ | 1,181,631 | |
| | | | | | | | | | | | |
| | | | | | | | | | | 10,735,285 | |
|
Commercial Mortgage-Backed Securities — 7.1% | |
Federal Home Loan Mortgage Corp. Multifamily Structured Pass-Through Certificates: | | | | | | | | | | | | |
Series K087, Class A2, 3.77%, 12/25/28 | | | | | | | 1,132 | | | | 1,339,033 | |
Series K091, Class A2, 3.51%, 03/25/29 | | | | | | | 913 | | | | 1,063,627 | |
Federal Home Loan Mortgage Corp. Variable Rate Notes(b): | | | | | | | | | | | | |
Series 2019-SB60, Class A10F,
3.31%, 01/25/29 | | | | | | | 887 | | | | 945,284 | |
Series 2019-SB61, Class A10F,
3.17%, 01/25/29 | | | | | | | 725 | | | | 770,108 | |
Series 2020-K737, Class B,
3.30%, 01/25/53(a) | | | | | | | 333 | | | | 324,876 | |
Series K081, Class A2, 3.90%, 08/25/28 | | | | | | | 2,750 | | | | 3,253,463 | |
Series K082, Class A2, 3.92%, 09/25/28 | | | | | | | 2,750 | | | | 3,266,772 | |
Series K084, Class A2, 3.78%, 10/25/28 | | | | | | | 1,225 | | | | 1,436,540 | |
Series W5FX, Class AFX, 3.34%, 04/25/28 | | | | | | | 559 | | | | 615,613 | |
Federal National Mortgage Association ACES, Series2020-M1, Class A2, 2.44%, 09/25/29 | | | | | | | 1,415 | | | | 1,512,138 | |
Federal National Mortgage Association ACES Variable Rate Notes(b): | | | | | | | | | | | | |
Series2018-M4, Class A2, 3.15%, 03/25/28 | | | | | | | 575 | | | | 647,423 | |
Series2018-M14, Class A2, 3.70%, 08/25/28 | | | | | | | 1,320 | | | | 1,531,427 | |
Series2019-M1, Class A2, 3.67%, 09/25/28 | | | | | | | 437 | | | | 504,709 | |
Government National Mortgage Association: | | | | | | | | | | | | |
Series2019-7, Class V, 3.00%, 05/16/35 | | | | | | | 90 | | | | 99,278 | |
Series2019-53, Class V, 2.75%, 08/16/31 | | | | | | | 233 | | | | 250,732 | |
| | | | | | | | | | | | |
| | | | | | | | | | | 17,561,023 | |
|
Interest Only Collateralized Mortgage Obligations — 2.7% | |
Federal Home Loan Mortgage Corp.: | | | | | | | | | | | | |
Series 4062, Class GI, 4.00%, 02/15/41 | | | | | | | 279 | | | | 24,912 | |
Series 4533, Class JI, 5.00%, 12/15/45 | | | | | | | 277 | | | | 51,370 | |
Federal Home Loan Mortgage Corp. Variable Rate Notes(e): | | | | | | | | | | | | |
Series 4119, Class SC, (LIBOR USD 1 Month + 6.15%), 5.34%, 10/15/42 | | | | | | | 1,638 | | | | 304,802 | |
Series 4901, Class CS, (LIBOR USD 1 Month + 6.10%), 5.29%, 07/25/49 | | | | | | | 1,161 | | | | 230,062 | |
Series 4941, Class SH, (LIBOR USD 1 Month + 5.95%), 5.14%, 12/25/49 | | | | | | | 992 | | | | 189,013 | |
Federal National Mortgage Association: | | | | | | | | | | | | |
Series2013-10, Class PI, 3.00%, 02/25/43 | | | | | | | 996 | | | | 87,898 | |
Series2014-68, Class YI, 4.50%, 11/25/44 | | | | | | | 476 | | | | 73,563 | |
Series2015-74, Class IA, 6.00%, 10/25/45 | | | | | | | 1,864 | | | | 369,984 | |
Series2015-77, 6.00%, 10/25/45 | | | | | | | 2,206 | | | | 440,182 | |
Series2017-68, Class IE, 4.50%, 09/25/47 | | | | | | | 1,655 | | | | 250,873 | |
Series2018-63, 3.00%, 09/25/48 | | | | | | | 2,309 | | | | 212,981 | |
Federal National Mortgage Association Variable Rate Notes(e): | | | | | | | | | | | | |
Series2016-60, Class SD, (LIBOR USD 1 Month + 6.10%), 5.61%, 09/25/46 | | | | | | | 1,934 | | | | 394,427 | |
Series2016-78, Class CS, (LIBOR USD 1 Month + 6.10%), 5.61%, 05/25/39 | | | | | | | 2,475 | | | | 492,817 | |
Series2017-70, Class SA, (LIBOR USD 1 Month + 6.15%), 5.66%, 09/25/47 | | | | | | | 1,277 | | | | 280,849 | |
Series2019-5, Class SA, (LIBOR USD 1 Month + 6.10%), 5.61%, 03/25/49 | | | | | | | 1,623 | | | | 331,703 | |
Series2019-25, Class SA, (LIBOR USD 1 Month + 6.05%), 5.56%, 06/25/49 | | | | | | | 5,955 | | | | 1,237,830 | |
| | | | |
| SCHEDULE OF INVESTMENTS | | | 11 | |
| | |
Schedule of Investments (continued) April 30, 2020 | | BlackRock U.S. Mortgage Portfolio (Percentages shown are based on Net Assets) |
| | | | | | | | | | | | |
| Security | | | | | Par
(000) | | | Value | |
|
| Interest Only Collateralized Mortgage Obligations (continued) | |
Series2019-35, Class SA, (LIBOR USD 1 Month + 6.10%), 5.61%, 07/25/49 | | | USD | | | | 851 | | | $ | 166,423 | |
Government National Mortgage Association: | | | | | | | | | | | | |
Series2014-113, Class NI,
5.00%, 07/20/44 | | | | | | | 607 | | | | 113,802 | |
Series2017-139, Class IB,
4.50%, 09/20/47 | | | | | | | 1,304 | | | | 195,291 | |
Series2017-144, Class DI,
4.50%, 09/20/47 | | | | | | | 925 | | | | 129,720 | |
Series2018-89, Class CI,
5.00%, 12/20/47 | | | | | | | 1,282 | | | | 225,963 | |
Series2019-133, Class EI,
4.50%, 04/20/49 | | | | | | | 1,356 | | | | 128,102 | |
Government National Mortgage Association Variable Rate Notes(e): | | | | | | | | | | | | |
Series2010-108, Class SG, (LIBOR USD 1 Month + 6.10%), 5.38%, 09/20/39 | | | | | | | 133 | | | | 8,619 | |
Series2015-64, Class SG, (LIBOR USD 1 Month + 5.60%), 4.88%, 05/20/45 | | | | | | | 3,056 | | | | 503,180 | |
Series2017-101, Class SL, (LIBOR USD 1 Month + 6.20%), 5.48%, 07/20/47 | | | | | | | 983 | | | | 198,866 | |
Series2018-154, Class SW, (LIBOR USD 1 Month + 6.20%), 5.48%, 11/20/48 | | | | | | | 479 | | | | 58,702 | |
| | | | | | | | | | | | |
| | | | | | | | | | | 6,701,934 | |
|
Interest Only Commercial Mortgage-Backed Securities — 2.2% | |
Federal Home Loan Mortgage Corp., Series 2015-K718, Class X2A,
0.10%, 02/25/48(a) | | | | | | | 65,180 | | | | 79,115 | |
Federal Home Loan Mortgage Corp. Multifamily Structured Pass-Through Certificates Variable Rate Notes, Series K722, Class X1, (LIBOR USD 1 Month + 0.00%), 1.44%, 03/25/23(e) | | | | | | | 3,725 | | | | 109,297 | |
Government National Mortgage Association Variable Rate Notes(b): | | | | | | | | | | | | |
Series2013-63, 0.79%, 09/16/51 | | | | | | | 18,940 | | | | 801,561 | |
Series2016-45, 0.98%, 02/16/58 | | | | | | | 6,766 | | | | 412,839 | |
Series2016-67, 1.07%, 07/16/57 | | | | | | | 3,926 | | | | 249,016 | |
Series2016-151, 1.07%, 06/16/58 | | | | | | | 20,592 | | | | 1,410,739 | |
Series2017-53, 0.69%, 11/16/56 | | | | | | | 7,719 | | | | 372,574 | |
Series2017-64, 0.70%, 11/16/57 | | | | | | | 13,181 | | | | 729,498 | |
Series2017-127, 0.73%, 02/16/59 | | | | | | | 11,237 | | | | 663,083 | |
Series2017-171, 0.69%, 09/16/59 | | | | | | | 6,683 | | | | 377,526 | |
Series2020-43, 1.37%, 11/16/61 | | | | | | | 3,904 | | | | 360,217 | |
| | | | | | | | | | | | |
| | | | | | | | | | | 5,565,465 | |
|
Mortgage-Backed Securities — 81.4% | |
Federal Home Loan Mortgage Corp.: | | | | | | | | | | | | |
2.50%, 03/01/30 - 04/01/31 | | | | | | | 1,312 | | | | 1,382,164 | |
3.00%, 09/01/27 - 03/01/47 | | | | | | | 4,956 | | | | 5,289,737 | |
3.50%, 12/01/40 - 01/01/48 | | | | | | | 6,013 | | | | 6,548,097 | |
4.00%, 08/01/40 - 01/01/47 | | | | | | | 1,830 | | | | 2,021,486 | |
4.50%, 07/01/26 - 09/01/48 | | | | | | | 1,356 | | | | 1,495,198 | |
5.00%, 05/01/35 - 02/01/42 | | | | | | | 1,377 | | | | 1,566,752 | |
5.50%, 02/01/35 - 06/01/41 | | | | | | | 695 | | | | 794,236 | |
6.00%, 08/01/28 - 11/01/39 | | | | | | | 26 | | | | 29,638 | |
Federal National Mortgage Association: | | | | | | | | | | | | |
3.00%, 02/01/44 | | | | | | | 668 | | | | 715,077 | |
3.50%, 11/01/46 | | | | | | | 821 | | | | 882,161 | |
4.00%, 01/01/41 | | | | | | | 90 | | | | 98,526 | |
6.00%, 07/01/39 | | | | | | | 510 | | | | 577,979 | |
Federal National Mortgage Association Variable Rate Notes(b): | | | | | | | | | | | | |
3.13%, 09/01/27 | | | | | | | 441 | | | | 490,739 | |
3.16%, 03/01/27 | | | | | | | 673 | | | | 745,580 | |
Government National Mortgage Association: | | | | | | | | | | | | |
2.50%, 05/15/50 - 06/15/50(f) | | | | | | | 2,010 | | | | 2,119,518 | |
3.00%, 02/15/45 - 12/20/46 | | | | | | | 2,701 | | | | 2,884,734 | |
3.00%, 05/15/50(f) | | | | | | | 10,443 | | | | 11,116,747 | |
3.50%, 01/15/42 - 10/20/46 | | | | | | | 5,078 | | | | 5,473,906 | |
3.50%, 05/20/46(g) | | | | | | | 1,805 | | | | 1,941,972 | |
| | | | | | | | | | | | |
| Security | | | | | Par (000) | | | Value | |
|
| Mortgage-Backed Securities (continued) | |
3.50%, 05/15/50 - 06/15/50(f) | | | USD | | | | 7,831 | | | $ | 8,306,182 | |
4.00%, 04/20/39 - 01/15/48 | | | | | | | 2,727 | | | | 2,982,321 | |
4.00%, 05/15/50 - 06/15/50(f) | | | | | | | 9,891 | | | | 10,521,865 | |
4.50%, 09/20/39 - 12/20/49 | | | | | | | 3,620 | | | | 3,959,332 | |
4.50%, 03/15/40(h) | | | | | | | 1,044 | | | | 1,150,406 | |
4.50%, 05/15/50(f) | | | | | | | 34 | | | | 36,375 | |
5.00%, 12/15/34 - 07/20/44 | | | | | | | 1,078 | | | | 1,209,291 | |
5.00%, 10/20/39(g) | | | | | | | 1,295 | | | | 1,451,141 | |
5.50%, 07/15/38 - 12/20/41 | | | | | | | 748 | | | | 845,723 | |
6.50%, 10/15/38 - 02/20/41 | | | | | | | 289 | | | | 336,047 | |
Uniform Mortgage-Backed Securities: | | | | | | | | | | | | |
2.00%, 10/01/31 - 03/01/32 | | | | | | | 1,079 | | | | 1,113,862 | |
2.00%, 05/25/35(f) | | | | | | | 400 | | | | 412,469 | |
2.50%, 04/01/30 - 08/01/32 | | | | | | | 3,911 | | | | 4,114,514 | |
2.50%, 05/25/35 - 05/25/50(f) | | | | | | | 27,943 | | | | 29,116,752 | |
3.00%, 04/01/28 - 03/01/47 | | | | | | | 16,138 | | | | 17,239,111 | |
3.00%, 05/25/35 - 05/25/50(f) | | | | | | | 6,264 | | | | 6,611,337 | |
3.50%, 11/01/27 - 01/01/48 | | | | | | | 17,469 | | | | 18,969,370 | |
3.50%, 05/25/50(f) | | | | | | | 1,177 | | | | 1,243,732 | |
4.00%, 08/01/31 - 08/01/48 | | | | | | | 12,097 | | | | 13,319,596 | |
4.00%, 05/25/50 - 06/25/50(f) | | | | | | | 8,297 | | | | 8,840,277 | |
4.50%, 07/01/24 - 07/01/48 | | | | | | | 4,647 | | | | 5,161,341 | |
4.50%, 05/25/50 - 06/25/50(f) | | | | | | | 14,037 | | | | 15,133,282 | |
5.00%, 01/01/23 - 06/01/39 | | | | | | | 2,198 | | | | 2,488,015 | |
5.50%, 06/01/24 - 03/01/40 | | | | | | | 973 | | | | 1,109,365 | |
5.50%, 05/25/50(f) | | | | | | | 291 | | | | 319,236 | |
6.00%, 12/01/32 - 09/01/40 | | | | | | | 695 | | | | 801,118 | |
6.50%, 09/01/36 - 05/01/40 | | | | | | | 195 | | | | 227,631 | |
| | | | | | | | | | | | |
| | | | | | | | | | | 203,193,938 | |
| | | | | | | | | | | | |
|
Total U.S. Government Sponsored Agency Securities — 97.7% | |
(Cost: $238,499,299) | | | | | | | | 243,757,645 | |
| | | | | | | | | | | | |
| | |
Total Long-Term Investments — 132.4%
(Cost: $331,659,580) | | | | | | | | 330,598,788 | |
| | | | | | | | | | | | |
| | | |
| | | | | | Shares | | | | |
|
Short-Term Securities — 5.7% | |
|
Money Market Funds — 1.1%(i) | |
Dreyfus Treasury Prime Cash Management Institutional Shares, 0.11% | | | | | | | 2,730,663 | | | | 2,730,663 | |
JPMorgan U.S. Treasury Plus Money Market Fund, Agency Class, 0.11% | | | | | | | 39,389 | | | | 39,389 | |
| | | | | | | | | | | | |
| |
Total Money Market Funds — 1.1%
(Cost: $2,770,052) | | | | 2,770,052 | |
| | | | | | | | | | | | |
| | | |
| | | | | | Par
(000) | | | | |
|
U.S. Treasury Obligations — 4.6% | |
| | | |
U.S. Treasury Bills(j): | | | | | | | | | | | | |
0.07%, 06/11/20 | | | | | | | 806 | | | | 805,912 | |
| | |
| 12 | | 2020 BLACKROCK ANNUAL REPORT TO SHAREHOLDERS |
| | |
Schedule of Investments (continued) April 30, 2020 | | BlackRock U.S. Mortgage Portfolio (Percentages shown are based on Net Assets) |
| | | | | | | | |
| Security | | Par (000) | | | Value | |
| | | | | | | | |
|
| U.S. Treasury Obligations (continued) | |
0.11%, 06/23/20 | | | USD 10,619 | | | $ | 10,617,632 | |
| | | | | | | | |
| |
Total U.S. Treasury Obligations — 4.6%
(Cost: $11,423,239) | | | | 11,423,544 | |
| | | | | | | | |
| |
Total Short-Term Securities — 5.7%
(Cost: $14,193,291) | | | | 14,193,596 | |
| | | | | | | | |
| |
Total Options Purchased — 0.0%
(Cost: $76,253) | | | | 581 | |
| | | | | | | | |
| |
Total Investments Before Options Written and TBA Sale Commitments — 138.1%
(Cost: $345,929,124) | | | | 344,792,965 | |
| | | | | | | | |
| |
Total Options Written — (0.4)%
(Premium Received — $184,126) | | | | (1,133,426) | |
| | | | | | | | |
| |
TBA Sale Commitments — (13.8)%(f) | | | | | |
| |
| Mortgage-Backed Securities — (13.8)% | | | | |
Government National Mortgage Association: | | | | | | | | |
2.50%, 05/15/50 | | | 880 | | | | (929,088 | ) |
| | | | | | | | |
| Security | | Par (000) | | | Value | |
|
| Mortgage-Backed Securities (continued) | |
3.50%, 05/15/50 | | | USD 1,951 | | | $ | (2,069,584) | |
4.00%, 05/15/50 | | | 948 | | | | (1,008,508) | |
4.50%, 05/15/50 | | | 824 | | | | (881,551) | |
5.00%, 05/15/50 | | | 871 | | | | (938,914) | |
Uniform Mortgage-Backed Securities: | | | | | | | | |
2.00%, 05/25/35 | | | 400 | | | | (412,469) | |
2.50%, 05/25/35 - 05/25/50 | | | 6,634 | | | | (6,933,740) | |
3.00%, 05/25/35 - 05/25/50 | | | 4,176 | | | | (4,406,489) | |
3.50%, 05/25/35 - 05/25/50 | | | 11,738 | | | | (12,401,900) | |
4.00%, 05/25/35 - 05/25/50 | | | 3,389 | | | | (3,607,244) | |
4.50%, 05/25/50 | | | 437 | | | | (471,141) | |
5.00%, 05/25/50 | | | 367 | | | | (398,884) | |
| | | | | | | | |
Total TBA Sale Commitments — (13.8)%
(Proceeds: $34,392,491) | | | | (34,459,512) | |
| | | | | | | | |
| |
Total Investments Net of Options Written and TBA Sale Commitments — 123.9%
(Cost: $311,352,507) | | | | 309,200,027 | |
| |
Liabilities in Excess of Other Assets — (23.9)% | | | | (59,591,903) | |
| | | | | | | | |
| | |
Net Assets — 100.0% | | | | | | $ | 249,608,124 | |
| | | | | | | | |
| (a) | Security exempt from registration pursuant to Rule 144A under the Securities Act of 1933, as amended. These securities may be resold in transactions exempt from registration to qualified institutional investors. |
| (b) | Variable or floating rate security, which interest rate adjusts periodically based on changes in current interest rates and prepayments on the underlying pool of assets. Rate shown is the rate in effect as of period end. |
| (c) | Step-up bond that pays an initial coupon rate for the first period and then a higher coupon rate for the following periods. Rate as of period end. |
| (d) | Security is valued using significant unobservable inputs and is classified as Level 3 in the fair value hierarchy. |
| (e) | Variable rate security. Security may be issued at a fixed coupon rate, which converts to a variable rate at a specified date. Rate shown is the rate in effect as of period end. |
| (f) | Represents or includes a TBA transaction. |
| (g) | All or a portion of the security has been pledged as collateral in connection with outstanding reverse repurchase agreements. |
| (h) | All or a portion of the security has been pledged as collateral in connection with outstanding TBA commitments. |
| (i) | Annualized7-day yield as of period end. |
| (j) | Rates are discount rates or a range of discount rates as of period end. |
Reverse Repurchase Agreements
| | | | | | | | | | | | | | | | | | | | | | | | |
| Counterparty | | Interest
Rate | | | Trade
Date | | | Maturity
Date | | | Face Value | | | Face Value
Including
Accrued Interest | | | Type ofNon-Cash
Underlying Collateral | | Remaining Contractual
Maturity of the Agreements |
| | | | | | | |
Credit Suisse AG NY Branch | | | 0.34 | % | | | 04/20/20 | | | | 05/20/20 | | | $ | 1,869,966 | | | $ | 1,870,142 | | | U.S. Government Sponsored Agency Securities | | Up to 30 days |
Credit Suisse AG NY Branch | | | 0.34 | | | | 04/20/20 | | | | 05/20/20 | | | | 800,827 | | | | 800,903 | | | U.S. Government Sponsored Agency Securities | | Up to 30 days |
| | | | | | | | | | | | | | | | | | | | | | | | |
| | | | | | | | | | | | | | $ | 2,670,793 | | | $ | 2,671,045 | | | | | |
| | | | | | | | | | | | | | | | | | | | | | | | |
| | | | |
| SCHEDULE OF INVESTMENTS | | | 13 | |
| | |
Schedule of Investments (continued) April 30, 2020 | | BlackRock U.S. Mortgage Portfolio |
Derivative Financial Instruments Outstanding as of Period End
Futures Contracts
| | | | | | | | | | | | | | | | |
| Description | | Number of
Contracts | | | Expiration
Date | | | Notional
Amount (000) | | | Value/ Unrealized
Appreciation
(Depreciation) | |
Long Contracts | | | | | | | | | | | | | | | | |
U.S. Treasury Long Bond | | | 15 | | | | 06/19/20 | | | $ | 2,715 | | | $ | 31,897 | |
U.S. Treasury Ultra Bond | | | 3 | | | | 06/19/20 | | | | 674 | | | | 69,989 | |
U.S. Treasury 2 Year Note | | | 271 | | | | 06/30/20 | | | | 59,736 | | | | 41,540 | |
| | | | | | | | | | | | | | | | |
| | | | | | | | | | | | | | | 143,426 | |
| | | | | | | | | | | | | | | | |
Short Contracts | | | | | | | | | | | | | | | | |
90-day Eurodollar | | | 11 | | | | 06/15/20 | | | | 2,741 | | | | (22,885) | |
U.S. Treasury 10 Year Note | | | 398 | | | | 06/19/20 | | | | 55,347 | | | | (222,141) | |
U.S. Treasury 10 Year Ultra Note | | | 7 | | | | 06/19/20 | | | | 1,099 | | | | (14,158) | |
U.S. Treasury 5 Year Note | | | 40 | | | | 06/30/20 | | | | 5,019 | | | | (4,676) | |
90-day Eurodollar | | | 10 | | | | 09/14/20 | | | | 2,493 | | | | (15,639) | |
90-day Eurodollar | | | 9 | | | | 12/14/20 | | | | 2,243 | | | | (15,112) | |
90-day Eurodollar | | | 9 | | | | 03/15/21 | | | | 2,244 | | | | (11,187) | |
90-day Eurodollar | | | 5 | | | | 06/14/21 | | | | 1,247 | | | | (12,410) | |
90-day Eurodollar | | | 4 | | | | 09/13/21 | | | | 997 | | | | (5,055) | |
90-day Eurodollar | | | 10 | | | | 12/13/21 | | | | 2,493 | | | | (10,214) | |
90-day Eurodollar | | | 4 | | | | 03/14/22 | | | | 997 | | | | (1,355) | |
90-day Eurodollar | | | 5 | | | | 12/19/22 | | | | 1,245 | | | | (6,382) | |
| | | | | | | | | | | | | | | | |
| | | | | | | | | | | | | | | (341,214) | |
| | | | | | | | | | | | | | | | |
| | | | | | | | | | | | | | $ | (197,788) | |
| | | | | | | | | | | | | | | | |
OTC Interest Rate Swaptions Purchased
| | | | | | | | | | | | | | | | | | | | | | | | | | | | | | | | | | |
| | | Paid by the Fund | | Received by the Fund | | | | | | | | | | | | | | |
| Description | | Rate | | | Frequency | | Rate | | | Frequency | | Counterparty | | Expiration
Date | | | Exercise Rate | | | Notional
Amount (000) | | | Value | |
Put | | | | | | | | | | | | | | | | | | | | | | | | | | | | | | | | | | |
10-Year Interest Rate
Swap(a) | | | 2.11 | % | | Semi-Annual | | | 3 month LIBOR | | | Quarterly | | Citibank NA | | | 08/17/20 | | | | 2.11 | % | | | USD | | | | 8,700 | | | $ | 581 | |
| | | | | | | | | | | | | | | | | | | | | | | | | | | | | | | | | | |
| (a) | Forward settling swaption. | |
Exchange-Traded Options Written
| | | | | | | | | | | | | | | | | | | | | | | | |
| Description | | Number of
Contracts | | | Expiration
Date | | | Exercise Price | | | Notional
Amount (000) | | | Value | |
| Call | | | | | | | | | | | | | | | | | | | |
U.S. Treasury 10 Year Note | | | 19 | | | | 05/22/20 | | | USD | | | 133.50 | | | USD | | | 1,900 | | | $ | (105,984) | |
U.S. Treasury 10 Year Note | | | 31 | | | | 05/22/20 | | | USD | | | 136.50 | | | USD | | | 3,100 | | | | (81,375) | |
U.S. Treasury 10 Year Note | | | 55 | | | | 05/22/20 | | | USD | | | 132.50 | | | USD | | | 5,500 | | | | (361,797) | |
| | | | | | | | | | | | | | | | | | | | | | | | |
| | | | | | | | | | | | | | | | | | | | | | $ | (549,156) | |
| | | | | | | | | | | | | | | | | | | | | | | | |
| | |
| 14 | | 2020 BLACKROCK ANNUAL REPORT TO SHAREHOLDERS |
| | |
Schedule of Investments (continued) April 30, 2020 | | BlackRock U.S. Mortgage Portfolio |
OTC Interest Rate Swaptions Written
| | | | | | | | | | | | | | | | | | | | | | | | | | | | | | | | | | |
| | | Paid by the Fund | | Received by the Fund | | Counterparty | | Expiration
Date | | | Exercise Rate | | | Notional
Amount (000) | | | Value | |
| Description | | Rate | | | Frequency | | Rate | | | Frequency |
Call | | | | | | | | | | | | | | | | | | | | | | | | | | | | | | | | | | |
2-Year Interest Rate Swap(a) | | | 3 month LIBOR | | | Quarterly | | | 1.89% | | | Semi-Annual | | Citibank NA | | | 05/01/20 | | | | 1.89 | % | | | USD | | | | 18,000 | | | $ | (571,714) | |
10-Year Interest Rate Swap(a) | | | 3 month LIBOR | | | Quarterly | | | 0.35% | | | Semi-Annual | | Deutsche Bank AG | | | 09/30/20 | | | | 0.35 | | | | USD | | | | 1,900 | | | | (10,810) | |
| | | | | | | | | | | | | | | | | | | | | | | | | | | | | | | | | | |
| | | | | | | | | | | | | | | | | | | | | | | | | | | | | | | | | (582,524) | |
| | | | | | | | | | | | | | | | | | | | | | | | | | | | | | | | | | |
| Put | | | | | | | | | | | | | | | | | | | | | | | | | | | |
2-Year Interest Rate Swap(a) | | | 0.60% | | | Semi-Annual | | | 3 month LIBOR | | | Quarterly | | Deutsche Bank AG | | | 09/25/20 | | | | 0.60 | | | | USD | | | | 16,600 | | | | (1,746) | |
| | | | | | | | | | | | | | | | | | | | | | | | | | | | | | | | | | |
| | | | | | | | | | | | | | | | | | | | | | | | | | | | | | | | $ | (584,270) | |
| | | | | | | | | | | | | | | | | | | | | | | | | | | | | | | | | | |
| (a) | Forward settling swaption. |
Centrally Cleared Interest Rate Swaps
| | | | | | | | | | | | | | | | | | | | | | | | | | | | |
| Paid by the Fund | | Received by the Fund | | | | | | | | | | | | | | | | | |
| Rate | | Frequency | | Rate | | Frequency | | Termination
Date | | | Notional
Amount (000) | | Value | | | Upfront
Premium
Paid
(Received) | | | Unrealized
Appreciation
(Depreciation) | |
| 3 month LIBOR | | Quarterly | | 3.01% | | Semi-Annual | | | 09/30/20 | | | | USD | | | 5,500 | | $ | 59,282 | | | $ | — | | | $ | 59,282 | |
| 3 month LIBOR | | Quarterly | | 2.38% | | Semi-Annual | | | 05/03/21 | | | | USD | | | 6,120 | | | 169,866 | | | | — | | | | 169,866 | |
| 1.65% | | Semi-Annual | | 3 month LIBOR | | Quarterly | | | 08/15/21 | | | | USD | | | 900 | | | (14,932) | | | | — | | | | (14,932) | |
| 1.68% | | Semi-Annual | | 3 month LIBOR | | Quarterly | | | 06/24/22 | | | | USD | | | 5,000 | | | (166,064) | | | | — | | | | (166,064) | |
| 1.72% | | Semi-Annual | | 3 month LIBOR | | Quarterly | | | 06/26/22 | | | | USD | | | 1,300 | | | (44,395) | | | | — | | | | (44,395) | |
| 1.84% | | Semi-Annual | | 3 month LIBOR | | Quarterly | | | 07/18/22 | | | | USD | | | 1,900 | | | (71,405) | | | | — | | | | (71,405) | |
| 3 month LIBOR | | Quarterly | | 1.62% | | Semi-Annual | | | 07/21/22 | | | | USD | | | 6,200 | | | 199,781 | | | | — | | | | 199,781 | |
| 3 month LIBOR | | Quarterly | | 1.63% | | Semi-Annual | | | 07/21/22 | | | | USD | | | 3,500 | | | 113,829 | | | | — | | | | 113,829 | |
| 1.81% | | Semi-Annual | | 3 month LIBOR | | Quarterly | | | 07/25/22 | | | | USD | | | 1,400 | | | (52,131) | | | | — | | | | (52,131) | |
| 1.78% | | Semi-Annual | | 3 month LIBOR | | Quarterly | | | 07/26/22 | | | | USD | | | 3,000 | | | (109,925) | | | | — | | | | (109,925) | |
| 3 month LIBOR | | Quarterly | | 1.60% | | Semi-Annual | | | 08/04/22 | | | | USD | | | 5,900 | | | 169,559 | | | | — | | | | 169,559 | |
| 1.53% | | Semi-Annual | | 3 month LIBOR | | Quarterly | | | 08/08/22 | | | | USD | | | 4,000 | | | (108,125) | | | | — | | | | (108,125) | |
| 3 month LIBOR | | Quarterly | | 1.42% | | Semi-Annual | | | 09/10/22 | | | | USD | | | 1,700 | | | 45,526 | | | | — | | | | 45,526 | |
| 2.85% | | Semi-Annual | | 3 month LIBOR | | Quarterly | | | 12/21/28 | | | | USD | | | 1,000 | | | (202,027) | | | | — | | | | (202,027) | |
| 1.61% | | Semi-Annual | | 3 month LIBOR | | Quarterly | | | 10/01/29 | | | | USD | | | 2,000 | | | (183,002) | | | | — | | | | (183,002) | |
| | | | | | | | | | | | | | | | | | | | | | | | | | | | |
| | | | | | | | | | | | | | | | | | $ | (194,163) | | | $ | — | | | $ | (194,163) | |
| | | | | | | | | | | | | | | | | | | | | | | | | | | | |
OTC Credit Default Swaps — Buy Protection
| | | | | | | | | | | | | | | | | | | | | | | | | | | | | | | | | | | | |
Reference Obligation/
Index | | Financing
Rate Paid
by the Fund | | | Payment
Frequency | | | Counterparty | | | Termination
Date | | | Notional
Amount (000) | | | Value | | | Upfront
Premium
Paid
(Received) | | | Unrealized
Appreciation
(Depreciation) | |
CMBX.NA.9.BBB- | | | 3.00 | % | | | Monthly | | | | JPMorgan Securities LLC | | | | 09/17/58 | | | | USD | | | | 3,100 | | | $ | 849,280 | | | $ | 318,348 | | | $ | 530,932 | |
| | | | | | | | | | | | | | | | | | | | | | | | | | | | | | | | | | | | |
| | | | |
| SCHEDULE OF INVESTMENTS | | | 15 | |
| | |
Schedule of Investments (continued) April 30, 2020 | | BlackRock U.S. Mortgage Portfolio |
OTC Credit Default Swaps — Sell Protection
| | | | | | | | | | | | | | | | | | | | | | | | | | | | | | | | | | | | | | |
| Reference Obligation/Index | | Financing
Rate Received
by the Fund | | | Payment
Frequency | | | Counterparty | | Termination
Date | | | Credit Rating (a) | | | | | | Notional
Amount
(000) (b) | | | Value | | | Upfront
Premium
Paid
(Received)
| | | Unrealized
Appreciation
(Depreciation) | |
CMBX.NA.9.BBB- | | | 3.00 | % | | | Monthly | | | Deutsche Bank AG | | | 09/17/58 | | | | BBB- | | | | USD | | | | 3,100 | | | $ | (849,281) | | | $ | (348,429) | | | $ | (500,852) | |
CMBX.NA.9.BBB- | | | 3.00 | | | | Monthly | | | Goldman Sachs
International | | | 09/17/58 | | | | BBB- | | | | USD | | | | 2,790 | | | | (764,352) | | | | (123,984) | | | | (640,368) | |
| | | | | | | | | | | | | | | | | | | | | | | | | | | | | | | | | | | | | | |
| | | | | | | | | | | | | | | | | | | | | | | | | | | | $ | (1,613,633) | | | $ | (472,413) | | | $ | (1,141,220) | |
| | | | | | | | | | | | | | | | | | | | | | | | | | | | | | | | | | | | | | |
| (a) | Using the rating of the issuer or the underlying securities of the index, as applicable, provided by S&P Global Ratings. | |
| (b) | The maximum potential amount the Fund may pay should a negative credit event take place as defined under the terms of the agreement. | |
The following reference rates, and their values as of period end, are used for security descriptions:
| | | | | | |
| Reference Index | | | | Reference Rate | |
3 month LIBOR | | London Interbank Offered Rate | | | 0.56 | % |
Balances Reported in the Statement of Assets and Liabilities for Centrally Cleared Swaps, OTC Swaps and Options Written
| | | | | | | | | | | | | | | | | | | | |
| | | Swap
Premiums
Paid | | | Swap
Premiums
Received | | | Unrealized
Appreciation | | | Unrealized
Depreciation | | | Value | |
Centrally Cleared Swaps (a) | | $ | — | | | $ | — | | | $ | 757,843 | | | $ | (952,006 | ) | | $ | — | |
OTC Swaps | | | 318,348 | | | | (472,413) | | | | 530,932 | | | | (1,141,220 | ) | | | — | |
Options Written | | | N/A | | | | N/A | | | | 26,464 | | | | (975,764 | ) | | | (1,133,426) | |
| (a) | Includes cumulative appreciation (depreciation) on centrally cleared swaps, as reported in the Schedule of Investments. Only current day’s variation margin is reported within the Statement of Assets and Liabilities and is net of any previously paid (received) swap premium amounts. | |
Derivative Financial Instruments Categorized by Risk Exposure
As of period end, the fair values of derivative financial instruments located in the Statement of Assets and Liabilities were as follows:
| | | | | | | | | | | | | | | | | | | | | | | | | | | | |
| | | Commodity
Contracts | | | Credit
Contracts | | | Equity
Contracts | | | Foreign
Currency
Exchange
Contracts | | | Interest Rate
Contracts | | | Other
Contracts | | | Total | |
Assets — Derivative Financial Instruments | | | | | | | | | | | | | | | | | | | | | | | | | |
Futures contracts | | | | | | | | | | | | | | | | | | | | | | | | | | | | |
Unrealized appreciation on futures contracts (a) | | $ | — | | | $ | — | | | $ | — | | | $ | — | | | $ | 143,426 | | | $ | — | | | $ | 143,426 | |
Options purchased | | | | | | | | | | | | | | | | | | | | | | | | | | | | |
Investments at value — unaffiliated (b) | | | — | | | | — | | | | — | | | | — | | | | 581 | | | | — | | | | 581 | |
Swaps — centrally cleared | | | | | | | | | | | | | | | | | | | | | | | | | | | | |
Unrealized appreciation on centrally cleared swaps (a) | | | — | | | | — | | | | — | | | | — | | | | 757,843 | | | | — | | | | 757,843 | |
Swaps — OTC | | | | | | | | | | | | | | | | | | | | | | | | | | | | |
Unrealized appreciation on OTC swaps; Swap premiums paid | | | — | | | | 849,280 | | | | — | | | | — | | | | — | | | | — | | | | 849,280 | |
| | | | |
| | $ | — | | | $ | 849,280 | | | $ | — | | | $ | — | | | $ | 901,850 | | | $ | — | | | $ | 1,751,130 | |
| | | | |
| | | | | | |
| Liabilities — Derivative Financial Instruments | | | | | | | | | | | | | | | | | | | |
Futures contracts | | | | | | | | | | | | | | | | | | | | | | | | | | | | |
Unrealized depreciation on futures contracts (a) | | | — | | | | — | | | | — | | | | — | | | | 341,214 | | | | — | | | | 341,214 | |
Options written | | | | | | | | | | | | | | | | | | | | | | | | | | | | |
Options written at value | | | — | | | | — | | | | — | | | | — | | | | 1,133,426 | | | | — | | | | 1,133,426 | |
Swaps — centrally cleared | | | | | | | | | | | | | | | | | | | | | | | | | | | | |
Unrealized depreciation on centrally cleared swaps (a) | | | — | | | | — | | | | — | | | | — | | | | 952,006 | | | | — | | | | 952,006 | |
Swaps — OTC | | | | | | | | | | | | | | | | | | | | | | | | | | | | |
Unrealized depreciation on OTC swaps; Swap premiums received | | | — | | | | 1,613,633 | | | | — | | | | — | | | | — | | | | — | | | | 1,613,633 | |
| | | | |
| | $ | — | | | $ | 1,613,633 | | | $ | — | | | $ | — | | | $ | 2,426,646 | | | $ | — | | | $ | 4,040,279 | |
| | | | |
| | |
| 16 | | 2020 BLACKROCK ANNUAL REPORT TO SHAREHOLDERS |
| | |
Schedule of Investments (continued) April 30, 2020 | | BlackRock U.S. Mortgage Portfolio |
| (a) | Net cumulative unrealized appreciation (depreciation) on futures contracts and centrally cleared swaps, if any, are reported in the Schedule of Investments. In the Statement of Assets and Liabilities, only current day’s variation margin is reported in receivables or payables and the net cumulative unrealized appreciation (depreciation) is included in accumulated earnings (loss). | |
| (b) | Includes options purchased at value as reported in the Schedule of Investments. | |
For the year ended April 30, 2020, the effect of derivative financial instruments in the Statement of Operations was as follows:
| | | | | | | | | | | | | | | | | | | | | | | | | | | | |
| | | Commodity
Contracts | | | Credit
Contracts | | | Equity
Contracts | | | Foreign
Currency
Exchange
Contracts | | | Interest Rate
Contracts | | | Other
Contracts | | | Total | |
Net Realized Gain (Loss) from: | | | | | | | | | | | | | | | | | | | | | | | | | | | | |
Futures contracts | | $ | — | | | $ | — | | | $ | — | | | $ | — | | | $ | (2,403,787 | ) | | $ | — | | | $ | (2,403,787) | |
Options purchased (a) | | | — | | | | — | | | | — | | | | — | | | | (238,273 | ) | | | — | | | | (238,273) | |
Options written | | | — | | | | — | | | | — | | | | — | | | | 302,023 | | | | — | | | | 302,023 | |
Swaps | | | — | | | | (464,643 | ) | | | — | | | | — | | | | (3,163,231 | ) | | | — | | | | (3,627,874) | |
| | | | |
| | $ | — | | | $ | (464,643 | ) | | $ | — | | | $ | — | | | $ | (5,503,268 | ) | | $ | — | | | $ | (5,967,911) | |
| | | | |
| | | | | | | |
| Net Change in Unrealized Appreciation | | | | | | | | | | | | | | | | | | | | | |
(Depreciation) on: | | | | | | | | | | | | | | | | | | | | | | | | | | | | |
Futures contracts | | | — | | | | — | | | | — | | | | — | | | | (162,119 | ) | | | — | | | | (162,119) | |
Options purchased (b) | | | — | | | | — | | | | — | | | | — | | | | (32,549 | ) | | | — | | | | (32,549) | |
Options written | | | — | | | | — | | | | — | | | | — | | | | (752,114 | ) | | | — | | | | (752,114) | |
Swaps | | | — | | | | (641,155 | ) | | | — | | | | — | | | | 183,228 | | | | — | | | | (457,927) | |
| | | | |
| | $ | — | | | $ | (641,155 | ) | | $ | — | | | $ | — | | | $ | (763,554 | ) | | $ | — | | | $ | (1,404,709) | |
| | | | |
| (a) | Options purchased are included in net realized gain (loss) from investments — unaffiliated. | |
| (b) | Options purchased are included in net change in unrealized appreciation (depreciation) on investments — unaffiliated. | |
Average Quarterly Balances of Outstanding Derivative Financial Instruments
| | | | |
Futures contracts: | | | | |
Average notional value of contracts — long | | $ | 26,876,827 | |
Average notional value of contracts — short | | | 65,702,510 | |
Options: | | | | |
Average value of option contracts written | | | 150,620 | |
Average notional value of swaption contracts purchased | | | 32,514,500 | |
Average notional value of swaption contracts written | | | 38,500,000 | |
Credit default swaps: | | | | |
Average notional value — buy protection | | | 9,458,250 | |
Average notional value — sell protection | | | 4,106,250 | |
Interest rate swaps: | | | | |
Average notional value — pays fixed rate | | | 46,372,500 | |
Average notional value — receives fixed rate | | | 25,555,000 | |
For more information about the Fund’s investment risks regarding derivative financial instruments, refer to the Notes to Financial Statements.
Derivative Financial Instruments — Offsetting as of Period End
The Fund’s derivative assets and liabilities (by type) were as follows:
| | | | | | | | |
| | | Assets | | | Liabilities | |
Derivative Financial Instruments: | | | | | | | | |
Futures contracts | | $ | 7,163 | | | $ | 49,897 | |
Options (a) | | | 581 | | | | 1,133,426 | |
Swaps — Centrally cleared | | | — | | | | 1,647 | |
Swaps — OTC (b) | | | 849,280 | | | | 1,613,633 | |
| | | | |
Total derivative assets and liabilities in the Statement of Assets and Liabilities | | $ | 857,024 | | | $ | 2,798,603 | |
Derivatives not subject to a Master Netting Agreement or similar agreement (“MNA”) | | | (7,163) | | | | (600,700) | |
| | | | |
Total derivative assets and liabilities subject to an MNA | | $ | 849,861 | | | $ | 2,197,903 | |
| | | | |
| (a) | Includes options purchased at value which is included in Investments at value – unaffiliated in the Statement of Assets and Liabilities and reported in the Schedule of Investments. | |
| (b) | Includes unrealized appreciation (depreciation) on OTC swaps and swap premiums paid/received in the Statement of Assets and Liabilities. | |
| | | | |
| SCHEDULE OF INVESTMENTS | | | 17 | |
| | |
Schedule of Investments (continued) April 30, 2020 | | BlackRock U.S. Mortgage Portfolio |
The following tables present the Fund’s derivative assets and liabilities by counterparty net of amounts available for offset under an MNA and net of the related collateral received and pledged by the Fund:
| | | | | | | | | | | | | | | | | | | | |
| Counterparty | | Derivative Assets Subject to an MNA by
Counterparty | | | Derivatives
Available for Offset (a) | | | Non-cash
Collateral
Received | | | Cash Collateral
Received (b) | | | Net Amount
of Derivative
Assets | |
Citibank NA | | $ | 581 | | | $ | (581) | | | $ | — | | | $ | — | | | $ | — | |
JPMorgan Securities LLC | | | 849,280 | | | | — | | | | — | | | | (849,280) | | | | — | |
| | | | | | | | | | | | | | | | | | | | |
| | $ | 849,861 | | | $ | (581) | | | $ | — | | | $ | (849,280 | ) | | $ | — | |
| | | | | | | | | | | | | | | | | | | | |
| | | | | | | | | | | | | | | | | | | | |
| Counterparty | | Derivative
Liabilities
Subject to
an MNA by
Counterparty | | | Derivatives
Available
for Offset (a) | | | Non-cash
Collateral
Pledged | | | Cash Collateral
Pledged (c) | | | Net Amount of
Derivative
Liabilities(d) | |
Citibank NA | | $ | 571,714 | | | $ | (581) | | | $ | — | | | $ | (515,000) | | | $ | 56,133 | |
Deutsche Bank AG | | | 861,837 | | | | — | | | | — | | | | (861,837) | | | | — | |
Goldman Sachs International | | | 764,352 | | | | — | | | | — | | | | (764,352) | | | | — | |
| | | | | | | | | | | | | | | | | | | | |
| | $ | 2,197,903 | | | $ | (581) | | | $ | — | | | $ | (2,141,189) | | | $ | 56,133 | |
| | | | | | | | | | | | | | | | | | | | |
| (a) | The amount of derivatives available for offset is limited to the amount of derivative assets and/or liabilities that are subject to an MNA. | |
| (b) | Excess of collateral received from the individual counterparty is not shown for financial reporting purposes. | |
| (c) | Excess of collateral pledged to the individual counterparty is not shown for financial reporting purposes. | |
| (d) | Net amount represents the net amount payable due to the counterparty in the event of default. | |
Fair Value Hierarchy as of Period End
Various inputs are used in determining the fair value of investments and derivative financial instruments. For information about the Fund’s policy regarding valuation of investments and derivative financial instruments, refer to the Notes to Financial Statements.
The following tables summarize the Fund’s investments and derivative financial instruments categorized in the disclosure hierarchy:
| | | | | | | | | | | | | | | | |
| | | Level 1 | | | Level 2 | | | Level 3 | | | Total | |
Assets: | | | | | | | | | | | | | | | | |
Investments: | | | | | | | | | | | | | | | | |
Long-Term Investments: | | | | | | | | | | | | | | | | |
Asset-Backed Securities | | $ | — | | | $ | 21,527,003 | | | $ | 4,818,596 | | | $ | 26,345,599 | |
Non-Agency Mortgage-Backed Securities | | | — | | | | 59,089,176 | | | | 1,406,368 | | | | 60,495,544 | |
U.S. Government Sponsored Agency Securities | | | — | | | | 243,757,645 | | | | — | | | | 243,757,645 | |
Short-Term Securities: | | | | | | | | | | | | | | | | |
Money Market Funds | | | 2,770,052 | | | | — | | | | — | | | | 2,770,052 | |
U.S. Treasury Obligations | | | — | | | | 11,423,544 | | | | — | | | | 11,423,544 | |
Options Purchased: | | | | | | | | | | | | | | | | |
Interest rate contracts | | | — | | | | 581 | | | | — | | | | 581 | |
Liabilities: | | | | | | | | | | | | | | | | |
Investments: | | | | | | | | | | | | | | | | |
TBA Sale Commitments | | | — | | | | (34,459,512) | | | | — | | | | (34,459,512) | |
| | | | | | | | | | | | | | | | |
| | $ | 2,770,052 | | | $ | 301,338,437 | | | $ | 6,224,964 | | | $ | 310,333,453 | |
| | | | | | | | | | | | | | | | |
Derivative Financial Instruments (a) | | | | | | | | | | | | | | | | |
Assets: | | | | | | | | | | | | | | | | |
Credit contracts | | $ | — | | | $ | 530,932 | | | $ | — | | | $ | 530,932 | |
Interest rate contracts | | | 143,426 | | | | 757,843 | | | | — | | | | 901,269 | |
Liabilities: | | | | | | | | | | | | | | | | |
Credit contracts | | | — | | | | (1,141,220) | | | | — | | | | (1,141,220) | |
Interest rate contracts | | | (890,370) | | | | (1,536,276) | | | | — | | | | (2,426,646) | |
| | | | | | | | | | | | | | | | |
| | $ | (746,944) | | | $ | (1,388,721) | | | $ | — | | | $ | (2,135,665) | |
| | | | | | | | | | | | | | | | |
| (a) | Derivative financial instruments are swaps, futures contracts and options written. Swaps and futures contracts are valued at the unrealized appreciation (depreciation) on the instrument and options written are shown at value. | |
| | |
| 18 | | 2020 BLACKROCK ANNUAL REPORT TO SHAREHOLDERS |
| | |
Schedule of Investments (continued) April 30, 2020 | | BlackRock U.S. Mortgage Portfolio |
The Fund may hold assets and/or liabilities in which the fair value approximates the carrying amount or face value, including accrued interest, for financial statement purposes. As of period end, Reverse Repurchase Agreements of $2,671,045 are categorized as Level 2 within the disclosure hierarchy.
A reconciliation of Level 3 investments is presented when the Fund had a significant amount of Level 3 investments at the beginning and/or end of the year in relation to net assets. The following table is a reconciliation of Level 3 investments for which significant unobservable inputs were used in determining fair value:
| | | | | | | | | | | | | | | | |
| | | Asset- Backed Securities | | | Non-Agency Mortgage- Backed Securities | | | U.S. Government
Sponsored Agency Securities | | | Total | |
Investments: | | | | | | | | | | | | | | | | |
Assets: | | | | | | | | | | | | | | | | |
Opening balance, as of April 30, 2019 | | $ | 437,562 | | | $ | 385,410 | | | $ | 327,170 | | | $ | 1,150,142 | |
Transfers into level 3 | | | — | | | | — | | | | — | | | | — | |
Transfers out of level 3 | | | — | | | | — | | | | (327,170 | ) | | | (327,170) | |
Accrued discounts/premiums | | | 676 | | | | — | | | | — | | | | 676 | |
Net realized gain | | | 5,711 | | | | — | | | | — | | | | 5,711 | |
Net change in unrealized depreciation (a)(b) | | | (4,212 | ) | | | (190,719 | ) | | | — | | | | (194,931) | |
Purchases | | | 4,726,536 | | | | 1,600,000 | | | | — | | | | 6,326,536 | |
Sales | | | (347,677 | ) | | | (388,323 | ) | | | — | | | | (736,000) | |
| | | | |
Closing balance, as of April 30, 2020 | | $ | 4,818,596 | | | $ | 1,406,368 | | | $ | — | | | $ | 6,224,964 | |
| | | | |
Net change in unrealized depreciation on investments still held at April 30, 2020 (b) | | $ | (4,212 | ) | | $ | (193,631 | ) | | $ | — | | | $ | (197,843) | |
| | | | |
| (a) | Included in the related net change in unrealized appreciation (depreciation) in the Statement of Operations. | |
| (b) | Any difference between net change in unrealized appreciation (depreciation) and net change in unrealized appreciation (depreciation) on investments still held at April 30, 2020 is generally due to investments no longer held or categorized as Level 3 at period end. | |
The Fund’s investments that are categorized as Level 3 were valued utilizing third party pricing information without adjustment. Such valuations are based on unobservable inputs. A significant change in third party information could result in a significantly lower or higher value of such Level 3 investments.
See notes to financial statements.
| | | | |
| SCHEDULE OF INVESTMENTS | | | 19 | |
Statement of Assets and Liabilities
April 30, 2020
| | | | |
| | | BlackRock U.S. Mortgage Portfolio | |
| |
ASSETS | | | | |
Investments at value — unaffiliated (cost — $345,929,124) | | $ | 344,792,965 | |
Cash | | | 984 | |
Cash pledged: | | | | |
Collateral — OTC derivatives | | | 2,447,000 | |
Futures contracts | | | 1,466,000 | |
Centrally cleared swaps | | | 118,150 | |
Receivables: | | | | |
Investments sold | | | 32,875,215 | |
TBA sale commitments | | | 34,392,491 | |
Capital shares sold | | | 365,498 | |
Dividends — unaffiliated | | | 750 | |
Interest — unaffiliated | | | 927,565 | |
From the Manager | | | 10,125 | |
Variation margin on futures contracts | | | 7,163 | |
Swap premiums paid | | | 318,348 | |
Unrealized appreciation on: | | | | |
OTC swaps | | | 530,932 | |
Prepaid expenses | | | 47,005 | |
| | | | |
Total assets | | | 418,300,191 | |
| | | | |
| |
LIABILITIES | | | | |
Cash received: | | | | |
Collateral — OTC derivatives | | | 1,060,000 | |
Collateral — TBA commitments | | | 147,000 | |
Options written at value (premium received $184,126) | | | 1,133,426 | |
TBA sale commitments at value (proceeds $34,392,491) | | | 34,459,512 | |
Reverse repurchase agreements at value | | | 2,671,045 | |
Payables: | | | | |
Investments purchased | | | 126,252,472 | |
Capital shares redeemed | | | 895,751 | |
Income dividend distributions | | | 172,632 | |
Investment advisory fees | | | 39,510 | |
Trustees’ and Officer’s fees | | | 272 | |
Other affiliates | | | 776 | |
Service and distribution fees | | | 9,448 | |
Variation margin on futures contracts | | | 49,897 | |
Variation margin on centrally cleared swaps | | | 1,647 | |
Other accrued expenses | | | 185,046 | |
Swap premiums received | | | 472,413 | |
Unrealized depreciation on: | | | | |
OTC swaps | | | 1,141,220 | |
| | | | |
Total liabilities | | | 168,692,067 | |
| | | | |
| |
NET ASSETS | | $ | 249,608,124 | |
| | | | |
| |
NET ASSETS CONSIST OF | | | | |
Paid-in capital | | $ | 257,175,422 | |
Accumulated loss | | | (7,567,298) | |
| | | | |
NET ASSETS | | $ | 249,608,124 | |
| | | | |
| |
NET ASSET VALUE | | | | |
Institutional— Based on net assets of $221,436,901 and 21,999,459 shares outstanding, unlimited number of shares
authorized, par value $0.001 per share | | $ | 10.07 | |
| | | | |
Investor A— Based on net assets of $21,912,983 and 2,180,889 shares outstanding, unlimited number of shares authorized, par value $0.001
per share | | $ | 10.05 | |
| | | | |
Investor C— Based on net assets of $6,258,240 and 622,694 shares outstanding, unlimited number of shares authorized,
no par value | | $ | 10.05 | |
| | | | |
See notes to financial statements.
| | |
| 20 | | 2020 BLACKROCK ANNUAL REPORT TO SHAREHOLDERS |
Statement of Operations
Year Ended April 30, 2020
| | | | |
| | | BlackRock
U.S. Mortgage
Portfolio | |
| |
INVESTMENT INCOME | | | | |
Dividends — unaffiliated | | $ | 83,238 | |
Interest — unaffiliated | | | 9,088,742 | |
Total investment income | | | 9,171,980 | |
| |
EXPENSES | | | | |
Investment advisory | | | 1,075,894 | |
Transfer agent — class specific | | | 198,215 | |
Service and distribution — class specific | | | 135,378 | |
Registration | | | 79,200 | |
Accounting services | | | 74,583 | |
Professional | | | 61,776 | |
Printing | | | 34,991 | |
Custodian | | | 24,398 | |
Trustees and Officer | | | 775 | |
Miscellaneous | | | 50,559 | |
Total expenses excluding interest expense | | | 1,735,769 | |
Interest expense | | | 606,566 | |
Total expenses | | | 2,342,335 | |
Less: | | | | |
Fees waived and/or reimbursed by the Manager | | | (198,658) | |
Transfer agent fees waived and/or reimbursed — class specific | | | (190,835) | |
Total expenses after fees waived and/or reimbursed | | | 1,952,842 | |
Net investment income | | | 7,219,138 | |
| |
REALIZED AND UNREALIZED GAIN (LOSS) | | | | |
Net realized gain (loss) from: | | | | |
Investments — unaffiliated | | | 9,008,564 | |
Futures contracts | | | (2,403,787) | |
Options written | | | 302,023 | |
Swaps | | | (3,627,874) | |
| | | 3,278,926 | |
Net change in unrealized appreciation (depreciation) on: | | | | |
Investments — unaffiliated | | | (315,279) | |
Futures contracts | | | (162,119) | |
Options written | | | (752,114) | |
Swaps | | | (457,927) | |
| | | (1,687,439) | |
Net realized and unrealized gain | | | 1,591,487 | |
NET INCREASE IN NET ASSETS RESULTING FROM OPERATIONS | | $ | 8,810,625 | |
See notes to financial statements.
Statements of Changes in Net Assets
| | | | | | | | |
| | | BlackRock U.S. Mortgage Portfolio | |
| | | Year Ended April 30, | |
| | | 2020 | | | 2019 | |
| | |
INCREASE (DECREASE) IN NET ASSETS | | | | | | | | |
| | |
OPERATIONS | | | | | | | | |
Net investment income | | $ | 7,219,138 | | | $ | 7,233,031 | |
Net realized gain (loss) | | | 3,278,926 | | | | (3,180,865) | |
Net change in unrealized appreciation (depreciation) | | | (1,687,439) | | | | 6,183,013 | |
Net increase in net assets resulting from operations | | | 8,810,625 | | | | 10,235,179 | |
| | |
DISTRIBUTIONS TO SHAREHOLDERS (a) | | | | | | | | |
Institutional | | | (7,643,396) | | | | (7,159,590) | |
Investor A | | | (782,936) | | | | (1,068,597) | |
Investor C | | | (157,801) | | | | (304,581) | |
Decrease in net assets resulting from distributions to shareholders | | | (8,584,133) | | | | (8,532,768) | |
| | |
CAPITAL SHARE TRANSACTIONS | | | | | | | | |
Net increase in net assets derived from capital share transactions | | | 3,483,605 | | | | 2,202,487 | |
| | |
NET ASSETS | | | | | | | | |
Total increase in net assets | | | 3,710,097 | | | | 3,904,898 | |
Beginning of year | | | 245,898,027 | | | | 241,993,129 | |
End of year | | $ | 249,608,124 | | | $ | 245,898,027 | |
| (a) | Distributions for annual periods determined in accordance with U.S. federal income tax regulations. |
See notes to financial statements.
| | |
| 22 | | 2020 BLACKROCK ANNUAL REPORT TO SHAREHOLDERS |
Financial Highlights
(For a share outstanding throughout each period)
| | | | | | | | | | | | | | | | | | | | |
| | | BlackRock U.S. Mortgage Portfolio | |
| |
| | | Institutional | |
| |
| | | Year Ended April 30, | |
| | | 2020 | | | 2019 | | | 2018 | | | 2017 | | | 2016 | |
| | | | | |
Net asset value, beginning of year | | $ | 10.04 | | | $ | 9.96 | | | $ | 10.31 | | | $ | 10.44 | | | $ | 10.55 | |
Net investment income (a) | | | 0.28 | | | | 0.32 | | | | 0.29 | | | | 0.21 | | | | 0.24 | |
Net realized and unrealized gain (loss) | | | 0.08 | | | | 0.14 | | | | (0.29 | ) | | | (0.02 | ) | | | (0.00 | )(b) |
Net increase from investment operations | | | 0.36 | | | | 0.46 | | | | 0.00 | | | | 0.19 | | | | 0.24 | |
| | | | | |
Distributions (c) | | | | | | | | | | | | | | | | | | | | |
From net investment income | | | (0.33 | ) | | | (0.38 | ) | | | (0.35 | ) | | | (0.32 | ) | | | (0.27 | ) |
From net realized gain | | | — | | | | — | | | | — | | | | — | | | | (0.08 | ) |
Total distributions | | | (0.33 | ) | | | (0.38 | ) | | | (0.35 | ) | | | (0.32 | ) | | | (0.35 | ) |
| | | | | |
Net asset value, end of year | | $ | 10.07 | | | $ | 10.04 | | | $ | 9.96 | | | $ | 10.31 | | | $ | 10.44 | |
| | | | | |
Total Return (d) | | | | | | | | | | | | | | | | | | | | |
Based on net asset value | | | 3.61% | | | | 4.73% | | | | 0.00% | | | | 1.80% | (e) | | | 2.27% | |
| | | | | |
Ratios to Average Net Assets | | | | | | | | | | | | | | | | | | | | |
Total expenses | | | 0.81% | | | | 1.62% | | | | 1.08% | | | | 0.59% | | | | 0.62% | |
| Total expenses after fees waived and/or reimbursed and paid indirectly | | | 0.68% | | | | 1.44% | | | | 0.91% | | | | 0.51% | | | | 0.55% | |
| Total expenses after fees waived and/or reimbursed and paid indirectly and excluding interest expense | | | 0.45% | | | | 0.45% | | | | 0.45% | | | | 0.47% | | | | 0.51% | |
Net investment income | | | 2.73% | | | | 3.26% | | | | 2.82% | | | | 2.04% | | | | 2.31% | |
| | | | | |
Supplemental Data | | | | | | | | | | | | | | | | | | | | |
Net assets, end of year (000) | | $ | 221,437 | | | $ | 211,534 | | | $ | 189,916 | | | $ | 222,745 | | | $ | 206,193 | |
Portfolio turnover rate (f) | | | 1,334% | | | | 1,580% | | | | 1,521% | | | | 1,502% | | | | 2,669% | |
| (a) | Based on average shares outstanding. |
| (b) | Amount is greater than $(0.005) per share. |
| (c) | Distributions for annual periods determined in accordance with U.S. federal income tax regulations. |
| (d) | Where applicable, assumes the reinvestment of distributions. |
| (e) | Includes payment received from a settlement of litigation, which impacted the Fund’s total return. Excluding the payment from a settlement of litigation, the Fund’s total return would have been 1.61%. |
| (f) | Includes mortgage dollar roll transactions (“MDRs”). Additional information regarding portfolio turnover rate is as follows: |
| | | | | | | | | | | | | | | | | | | | |
| | | Year Ended April 30, | |
| | | 2020 | | | 2019 | | | 2018 | | | 2017 | | | 2016 | |
Portfolio turnover rate (excluding MDRs) | | | 860% | | | | 841% | | | | 826% | | | | 887% | | | | 2,104% | |
See notes to financial statements.
Financial Highlights (continued)
(For a share outstanding throughout each period)
| | | | | | | | | | | | | | | | | | | | |
| | | BlackRock U.S. Mortgage Portfolio | |
| |
| | | Investor A | |
| |
| | | Year Ended April 30, | |
| | | 2020 | | | 2019 | | | 2018 | | | 2017 | | | 2016 | |
| | | | | |
Net asset value, beginning of year | | $ | 10.02 | | | $ | 9.94 | | | $ | 10.29 | | | $ | 10.43 | | | $ | 10.53 | |
Net investment income (a) | | | 0.25 | | | | 0.30 | | | | 0.26 | | | | 0.18 | | | | 0.21 | |
Net realized and unrealized gain (loss) | | | 0.09 | | | | 0.14 | | | | (0.28 | ) | | | (0.03 | ) | | | 0.01 | |
Net increase (decrease) from investment operations | | | 0.34 | | | | 0.44 | | | | (0.02 | ) | | | 0.15 | | | | 0.22 | |
| | | | | |
Distributions (b) | | | | | | | | | | | | | | | | | | | | |
From net investment income | | | (0.31 | ) | | | (0.36 | ) | | | (0.33 | ) | | | (0.29 | ) | | | (0.24 | ) |
From net realized gain | | | — | | | | — | | | | — | | | | — | | | | (0.08 | ) |
Total distributions | | | (0.31 | ) | | | (0.36 | ) | | | (0.33 | ) | | | (0.29 | ) | | | (0.32 | ) |
| | | | | |
Net asset value, end of year | | $ | 10.05 | | | $ | 10.02 | | | $ | 9.94 | | | $ | 10.29 | | | $ | 10.43 | |
| | | | | |
Total Return (c) | | | | | | | | | | | | | | | | | | | | |
Based on net asset value | | | 3.35% | | | | 4.47% | | | | (0.25)% | | | | 1.43%(d) | | | | 2.06% | |
| | | | | |
Ratios to Average Net Assets | | | | | | | | | | | | | | | | | | | | |
Total expenses | | | 1.14% | | | | 1.94% | | | | 1.37% | | | | 0.91% | | | | 0.94% | |
Total expenses after fees waived and/or reimbursed and paid
indirectly | | | 0.93% | | | | 1.69% | | | | 1.16% | | | | 0.79% | | | | 0.85% | |
Total expenses after fees waived and/or reimbursed and paid
indirectly and excluding interest expense | | | 0.70% | | | | 0.70% | | | | 0.70% | | | | 0.75% | | | | 0.81% | |
Net investment income | | | 2.50% | | | | 3.01% | | | | 2.56% | | | | 1.75% | | | | 2.04% | |
| | | | | |
Supplemental Data | | | | | | | | | | | | | | | | | | | | |
Net assets, end of year (000) | | $ | 21,913 | | | $ | 26,577 | | | $ | 37,782 | | | $ | 51,429 | | | $ | 77,652 | |
Portfolio turnover rate(e) | | | 1,334% | | | | 1,580% | | | | 1,521% | | | | 1,502% | | | | 2,669% | |
| (a) | Based on average shares outstanding. |
| (b) | Distributions for annual periods determined in accordance with U.S. federal income tax regulations. |
| (c) | Where applicable, excludes the effects of any sales charges and assumes the reinvestment of distributions. |
| (d) | Includes payment received from a settlement of litigation, which impacted the Fund’s total return. Excluding the payment from a settlement of litigation, the Fund’s total return would have been 1.23%. |
| (e) | Includes mortgage dollar roll transactions (“MDRs”). Additional information regarding portfolio turnover rate is as follows: |
| | | | | | | | | | | | | | | | | | | | |
| | | Year Ended April 30, | |
| | | 2020 | | | 2019 | | | 2018 | | | 2017 | | | 2016 | |
Portfolio turnover rate (excluding MDRs) | | | 860% | | | | 841% | | | | 826% | | | | 887% | | | | 2,104% | |
See notes to financial statements.
| | |
| 24 | | 2020 BLACKROCK ANNUAL REPORT TO SHAREHOLDERS |
Financial Highlights (continued)
(For a share outstanding throughout each period)
| | | | | | | | | | | | | | | | | | | | |
| | | BlackRock U.S. Mortgage Portfolio | |
| |
| | | Investor C | |
| |
| | | Year Ended April 30, | |
| | | 2020 | | | 2019 | | | 2018 | | | 2017 | | | 2016 | |
| | | | | |
Net asset value, beginning of year | | $ | 10.02 | | | $ | 9.94 | | | $ | 10.30 | | | $ | 10.43 | | | $ | 10.53 | |
Net investment income(a) | | | 0.18 | | | | 0.22 | | | | 0.18 | | | | 0.10 | | | | 0.13 | |
Net realized and unrealized gain (loss) | | | 0.08 | | | | 0.14 | | | | (0.29 | ) | | | (0.02 | ) | | | 0.01 | |
Net increase (decrease) from investment operations | | | 0.26 | | | | 0.36 | | | | (0.11 | ) | | | 0.08 | | | | 0.14 | |
| | | | | |
Distributions(b) | | | | | | | | | | | | | | | | | | | | |
From net investment income | | | (0.23 | ) | | | (0.28 | ) | | | (0.25 | ) | | | (0.21 | ) | | | (0.16 | ) |
From net realized gain | | | — | | | | — | | | | — | | | | — | | | | (0.08 | ) |
Total distributions | | | (0.23 | ) | | | (0.28 | ) | | | (0.25 | ) | | | (0.21 | ) | | | (0.24 | ) |
| | | | | |
Net asset value, end of year | | $ | 10.05 | | | $ | 10.02 | | | $ | 9.94 | | | $ | 10.30 | | | $ | 10.43 | |
| | | | | |
Total Return(c) | | | | | | | | | | | | | | | | | | | | |
Based on net asset value | | | 2.58% | | | | 3.70% | | | | (1.09)% | | | | 0.77%(d) | | | | 1.30% | |
| | | | | |
Ratios to Average Net Assets | | | | | | | | | | | | | | | | | | | | |
Total expenses | | | 1.89% | | | | 2.69% | | | | 2.12% | | | | 1.64% | | | | 1.66% | |
Total expenses after fees waived and/or reimbursed and paid
indirectly | | | 1.68% | | | | 2.44% | | | | 1.91% | | | | 1.54% | | | | 1.60% | |
Total expenses after fees waived and/or reimbursed and paid
indirectly and excluding interest expense | | | 1.45% | | | | 1.45% | | | | 1.45% | | | | 1.50% | | | | 1.56% | |
Net investment income | | | 1.75% | | | | 2.25% | | | | 1.80% | | | | 1.00% | | | | 1.29% | |
| | | | | |
Supplemental Data | | | | | | | | | | | | | | | | | | | | |
Net assets, end of year (000) | | $ | 6,258 | | | $ | 7,786 | | | $ | 14,295 | | | $ | 21,455 | | | $ | 21,757 | |
Portfolio turnover rate(e) | | | 1,334% | | | | 1,580% | | | | 1,521% | | | | 1,502% | | | | 2,669% | |
| (a) | Based on average shares outstanding. |
| (b) | Distributions for annual periods determined in accordance with U.S. federal income tax regulations. |
| (c) | Where applicable, excludes the effects of any sales charges and assumes the reinvestment of distributions. |
| (d) | Includes payment received from a settlement of litigation, which impacted the Fund’s total return. Excluding the payment from a settlement of litigation, the Fund’s total return would have been 0.58%. |
| (e) | Includes mortgage dollar roll transactions (“MDRs”). Additional information regarding portfolio turnover rate is as follows: |
| | | | | | | | | | | | | | | | | | | | |
| | | Year Ended April 30, | |
| | | 2020 | | | 2019 | | | 2018 | | | 2017 | | | 2016 | |
Portfolio turnover rate (excluding MDRs) | | | 860% | | | | 841% | | | | 826% | | | | 887% | | | | 2,104% | |
See notes to financial statements.
Notes to Financial Statements
Managed Account Series II (the “Trust”) is registered under the Investment Company Act of 1940, as amended (the “1940 Act”), as anopen-end management investment company. The Trust is organized as a Delaware statutory trust. BlackRock U.S. Mortgage Portfolio (the “Fund”) is a series of the Trust. The Fund is classified as diversified.
The Fund offers multiple classes of shares. All classes of shares have identical voting, dividend, liquidation and other rights and are subject to the same terms and conditions, except that certain classes bear expenses related to the shareholder servicing and distribution of such shares. Institutional Shares are sold only to certain eligible investors. Investor A and Investor C Shares bear certain expenses related to shareholder servicing of such shares, and Investor C Shares also bear certain expenses related to the distribution of such shares. Investor A and Investor C Shares are generally available through financial intermediaries. Each class has exclusive voting rights with respect to matters relating to its shareholder servicing and distribution expenditures (except that Investor C shareholders may vote on material changes to the Investor A Shares distribution and service plan).
| | | | | | | | | | | | |
| Share Class | | Initial Sales Charge | | | CDSC | | | Conversion Privilege | |
Institutional Shares | | | No | | | | No | | | | None | |
Investor A Shares | | | Yes | | | | No | (a) | | | None | |
| | | | | | | | | | | To Investor A Shares after | |
Investor C Shares | | | No | | | | Yes | (b) | | | approximately 10 years | |
| (a) | Investor A Shares may be subject to a contingent deferred sales charge (“CDSC”) for certain redemptions where no initial sales charge was paid at the time of purchase. |
| (b) | A CDSC of 1.00% is assessed on certain redemptions of Investor C Shares made within one year after purchase. |
The Fund, together with certain other registered investment companies advised by BlackRock Advisors, LLC (the “Manager”) or its affiliates, is included in a complex ofnon-index fixed-income mutual funds and all BlackRock-advisedclosed-end funds referred to as the BlackRock Fixed-Income Complex.
| 2. | SIGNIFICANT ACCOUNTING POLICIES |
The financial statements are prepared in conformity with accounting principles generally accepted in the United States of America (“U.S. GAAP”), which may require management to make estimates and assumptions that affect the reported amounts of assets and liabilities in the financial statements, disclosure of contingent assets and liabilities at the date of the financial statements and the reported amounts of increases and decreases in net assets from operations during the reporting period. Actual results could differ from those estimates. The Fund is considered an investment company under U.S. GAAP and follows the accounting and reporting guidance applicable to investment companies. Below is a summary of significant accounting policies:
Investment Transactions and Income Recognition: For financial reporting purposes, investment transactions are recorded on the dates the transactions are executed (the “trade dates”). Realized gains and losses on investment transactions are determined on the identified cost basis. Dividend income is recorded on theex-dividend date. Interest income, including amortization and accretion of premiums and discounts on debt securities, is recognized on an accrual basis. Income, expenses and realized and unrealized gains and losses are allocated daily to each class based on its relative net assets.
Segregation and Collateralization: In cases where the Fund enters into certain investments (e.g., dollar rolls,to-be-announced (“TBA”) sale commitments, futures contracts, options written and swaps) or certain borrowings (e.g., reverse repurchase transactions) that would be treated as “senior securities” for 1940 Act purposes, the Fund may segregate or designate on its books and records cash or liquid assets having a market value at least equal to the amount of its future obligations under such investments or borrowings. Doing so allows the investment or borrowings to be excluded from treatment as a “senior security.” Furthermore, if required by an exchange or counterparty agreement, the Fund may be required to deliver/deposit cash and/or securities to/with an exchange, or broker-dealer or custodian as collateral for certain investments or obligations.
Distributions: Distributions from net investment income are declared daily and paid monthly. Distributions of capital gains are recorded on theex-dividend date and made at least annually. The character and timing of distributions are determined in accordance with U.S. federal income tax regulations, which may differ from U.S. GAAP.
Deferred Compensation Plan: Under the Deferred Compensation Plan (the “Plan”) approved by the Board of Trustees of the Trust (the “Board”), the trustees who are not “interested persons” of the Fund, as defined in the 1940 Act (“Independent Trustees”), may defer a portion of their annual complex-wide compensation. Deferred amounts earn an approximate return as though equivalent dollar amounts had been invested in common shares of certain funds in the BlackRock Fixed-Income Complex selected by the Independent Trustees. This has the same economic effect for the Independent Trustees as if the Independent Trustees had invested the deferred amounts directly in certain funds in the BlackRock Fixed-Income Complex.
The Plan is not funded and obligations thereunder represent general unsecured claims against the general assets of the Fund, as applicable. Deferred compensation liabilities are included in the Trustees’ and Officer’s fees payable in the Statement of Assets and Liabilities and will remain as a liability of the Fund until such amounts are distributed in accordance with the Plan.
Recent Accounting Standards: The Fund has adopted Financial Accounting Standards Board Accounting Standards Update2017-08 to amend the amortization period for certain purchased callable debt securities held at a premium. Under the new standard, the Fund has changed the amortization period for the premium on certain purchased callable debt securities withnon-contingent call features to the earliest call date. In accordance with the transition provisions of the standard, the Fund applied the amendments on a modified retrospective basis beginning with the fiscal period ended April 30, 2020. The adjusted cost basis of securities at April 30, 2019 is $305,376,814.
This change in accounting policy has been made to comply with the newly issued accounting standard and had no impact on accumulated earnings (loss) or the net asset value of the Fund.
| | |
| 26 | | 2020 BLACKROCK ANNUAL REPORT TO SHAREHOLDERS |
Notes to Financial Statements (continued)
Indemnifications: In the normal course of business, the Fund enters into contracts that contain a variety of representations that provide general indemnification. The Fund’s maximum exposure under these arrangements is unknown because it involves future potential claims against the Fund, which cannot be predicted with any certainty.
Other: Expenses directly related to the Fund or its classes are charged to the Fund or the applicable class. Other operating expenses shared by several funds, including other funds managed by the Manager, are prorated among those funds on the basis of relative net assets or other appropriate methods. Expenses directly related to the Fund and other shared expenses prorated to the Fund are allocated daily to each class based on its relative net assets or other appropriate methods.
| 3. | INVESTMENT VALUATION AND FAIR VALUE MEASUREMENTS |
Investment Valuation Policies: The Fund’s investments are valued at fair value (also referred to as “market value” within the financial statements) as of the close of trading on the New York Stock Exchange (“NYSE”) (generally 4:00 p.m., Eastern time). U.S. GAAP defines fair value as the price the Fund would receive to sell an asset or pay to transfer a liability in an orderly transaction between market participants at the measurement date. The Fund determines the fair values of its financial instruments using various independent dealers or pricing services under policies approved by the Board. If a security’s market price is not readily available or does not otherwise accurately represent the fair value of the security, the security will be valued in accordance with a policy approved by the Board as reflecting fair value. The BlackRock Global Valuation Methodologies Committee (the “Global Valuation Committee”) is the committee formed by management to develop global pricing policies and procedures and to oversee the pricing function for all financial instruments.
Fair Value Inputs and Methodologies: The following methods and inputs are used to establish the fair value of the Fund’s assets and liabilities:
| | • | | Fixed-income securities for which market quotations are readily available are generally valued using the last available bid prices or current market quotations provided by independent dealers or third party pricing services. Floating rate loan interests are valued at the mean of the bid prices from one or more independent brokers or dealers as obtained from a third party pricing service. Pricing services generally value fixed-income securities assuming orderly transactions of an institutional round lot size, but a fund may hold or transact in such securities in smaller, odd lot sizes. Odd lots may trade at lower prices than institutional round lots. The pricing services may use matrix pricing or valuation models that utilize certain inputs and assumptions to derive values, including transaction data (e.g., recent representative bids and offers), credit quality information, perceived market movements, news, and other relevant information. Certain fixed-income securities, including asset-backed and mortgage related securities may be valued based on valuation models that consider the estimated cash flows of each tranche of the entity, establish a benchmark yield and develop an estimated tranche specific spread to the benchmark yield based on the unique attributes of the tranche. The amortized cost method of valuation may be used with respect to debt obligations with sixty days or less remaining to maturity unless the Manager determines such method does not represent fair value. |
| | • | | Investments inopen-end U.S. mutual funds are valued at NAV each business day. |
| | • | | Futures contracts traded on exchanges are valued at their last sale price. |
| | • | | Exchange-traded options are valued at the mean between the last bid and ask prices at the close of the options market in which the options trade. An exchange-traded option for which there is no mean price is valued at the last bid (long positions) or ask (short positions) price. If no bid or ask price is available, the prior day’s price will be used, unless it is determined that the prior day’s price no longer reflects the fair value of the option.Over-the-counter (“OTC”) options and options on swaps (“swaptions”) are valued by an independent pricing service using a mathematical model, which incorporates a number of market data factors, such as the trades and prices of the underlying instruments. |
| | • | | Swap agreements are valued utilizing quotes received daily by the Fund’s pricing service or through brokers, which are derived using daily swap curves and models that incorporate a number of market data factors, such as discounted cash flows, trades and values of the underlying reference instruments. |
| | • | | To-be-announced (“TBA”) commitments are valued on the basis of last available bid prices or current market quotations provided by pricing services. |
If events (e.g., a company announcement, market volatility or a natural disaster) occur that are expected to materially affect the value of such investments, or in the event that the application of these methods of valuation results in a price for an investment that is deemed not to be representative of the market value of such investment, or if a price is not available, the investment will be valued by the Global Valuation Committee, or its delegate, in accordance with a policy approved by the Board as reflecting fair value (“Fair Valued Investments”). The fair valuation approaches that may be used by the Global Valuation Committee will include market approach, income approach and cost approach. Valuation techniques such as discounted cash flow, use of market comparables and matrix pricing are types of valuation approaches and are typically used in determining fair value. When determining the price for Fair Valued Investments, the Global Valuation Committee, or its delegate, seeks to determine the price that the Fund might reasonably expect to receive or pay from the current sale or purchase of that asset or liability in anarm’s-length transaction. Fair value determinations shall be based upon all available factors that the Global Valuation Committee, or its delegate, deems relevant and consistent with the principles of fair value measurement. The pricing of all Fair Valued Investments is subsequently reported to the Board or a committee thereof on a quarterly basis.
| | | | |
| NOTESTO FINANCIAL STATEMENTS | | | 27 | |
Notes to Financial Statements (continued)
For investments in equity or debt issued by privately held companies or funds (“Private Company” or collectively, the “Private Companies”) and other Fair Valued Investments, the fair valuation approaches that are used by the Global Valuation Committee and third party pricing services utilize one or a combination of, but not limited to, the following inputs.
| | |
| | | Standard Inputs Generally Considered By Third Party Pricing Services |
Market approach | | (i) recent market transactions, including subsequent rounds of financing, in the underlying investment or comparable issuers; (ii) recapitalizations and other transactions across the capital structure; and (iii) market multiples of comparable issuers. |
Income approach | | (i) future cash flows discounted to present and adjusted as appropriate for liquidity, credit, and/or market risks; (ii) quoted prices for similar investments or assets in active markets; and (iii) other risk factors, such as interest rates, yield curves, volatilities, prepayment speeds, loss severities, credit risks, recovery rates, liquidation amounts and/or default rates. |
Cost approach | | (i) audited or unaudited financial statements, investor communications and financial or operational metrics issued by the Private Company; (ii) changes in the valuation of relevant indices or publicly traded companies comparable to the Private Company; (iii) relevant news and other public sources; and (iv) known secondary market transactions in the Private Company’s interests and merger or acquisition activity in companies comparable to the Private Company. |
Investments in series of preferred stock issued by Private Companies are typically valued utilizing market approach in determining the enterprise value of the company. Such investments often contain rights and preferences that differ from other series of preferred and common stock of the same issuer. Valuation techniques such as an option pricing model (“OPM”), a probability weighted expected return model (“PWERM”) or a hybrid of those techniques are used in allocating enterprise value of the company, as deemed appropriate under the circumstances. The use of OPM and PWERM techniques involve a determination of the exit scenarios of the investment in order to appropriately allocate the enterprise value of the company among the various parts of its capital structure.
The Private Companies are not subject to the public company disclosure, timing, and reporting standards as other investments held by the Fund. Typically, the most recently available information by a Private Company is as of a date that is earlier than the date the Fund is calculating its NAV. This factor may result in a difference between the value of the investment and the price the Fund could receive upon the sale of the investment.
Fair Value Hierarchy: Various inputs are used in determining the fair value of investments and derivative financial instruments. These inputs to valuation techniques are categorized into a fair value hierarchy consisting of three broad levels for financial statement purposes as follows:
| | • | | Level 1 — Unadjusted price quotations in active markets/exchanges for identical assets or liabilities that the Fund has the ability to access |
| | • | | Level 2 — Other observable inputs (including, but not limited to, quoted prices for similar assets or liabilities in markets that are active, quoted prices for identical or similar assets or liabilities in markets that are not active, inputs other than quoted prices that are observable for the assets or liabilities (such as interest rates, yield curves, volatilities, prepayment speeds, loss severities, credit risks and default rates) or other market–corroborated inputs) |
| | • | | Level 3 – Unobservable inputs based on the best information available in the circumstances, to the extent observable inputs are not available (including the Global Valuation Committee’s assumptions used in determining the fair value of investments and derivative financial instruments) |
The hierarchy gives the highest priority to unadjusted quoted prices in active markets for identical assets or liabilities (Level 1 measurements) and the lowest priority to unobservable inputs (Level 3 measurements). Accordingly, the degree of judgment exercised in determining fair value is greatest for instruments categorized in Level 3. The inputs used to measure fair value may fall into different levels of the fair value hierarchy. In such cases, for disclosure purposes, the fair value hierarchy classification is determined based on the lowest level input that is significant to the fair value measurement in its entirety. Investments classified within Level 3 have significant unobservable inputs used by the Global Valuation Committee in determining the price for Fair Valued Investments. Level 3 investments include equity or debt issued by Private Companies. There may not be a secondary market, and/or there are a limited number of investors. The categorization of a value determined for investments and derivative financial instruments is based on the pricing transparency of the investments and derivative financial instruments and is not necessarily an indication of the risks associated with investing in those securities.
| 4. | SECURITIES AND OTHER INVESTMENTS |
Asset-Backed and Mortgage-Backed Securities: Asset-backed securities are generally issued as pass-through certificates or as debt instruments. Asset-backed securities issued as pass-through certificates represent undivided fractional ownership interests in an underlying pool of assets. Asset-backed securities issued as debt instruments, which are also known as collateralized obligations, are typically issued as the debt of a special purpose entity organized solely for the purpose of owning such assets and issuing such debt. Asset-backed securities are often backed by a pool of assets representing the obligations of a number of different parties. The yield characteristics of certain asset-backed securities may differ from traditional debt securities. One such major difference is that all or a principal part of the obligations may be prepaid at any time because the underlying assets (i.e., loans) may be prepaid at any time. As a result, a decrease in interest rates in the market may result in increases in the level of prepayments as borrowers, particularly mortgagors, refinance and repay their loans. An increased prepayment rate with respect to an asset-backed security will have the effect of shortening the maturity of the security. In addition, a fund may subsequently have to reinvest the proceeds at lower interest rates. If a fund has purchased such an asset-backed security at a premium, a faster than anticipated prepayment rate could result in a loss of principal to the extent of the premium paid.
For mortgage pass-through securities (the “Mortgage Assets”) there are a number of important differences among the agencies and instrumentalities of the U.S. Government that issue mortgage-related securities and among the securities that they issue. For example, mortgage-related securities guaranteed by Ginnie Mae are guaranteed as to the timely payment of principal and interest by Ginnie Mae and such guarantee is backed by the full faith and credit of the United States. However, mortgage-related securities
| | |
| 28 | | 2020 BLACKROCK ANNUAL REPORTTO SHAREHOLDERS |
Notes to Financial Statements (continued)
issued by Freddie Mac and Fannie Mae, including Freddie Mac and Fannie Mae guaranteed mortgage pass-through certificates, which are solely the obligations of Freddie Mac and Fannie Mae, are not backed by or entitled to the full faith and credit of the United States, but are supported by the right of the issuer to borrow from the U.S. Treasury.
Non-agency mortgage-backed securities are securities issued bynon-governmental issuers and have no direct or indirect government guarantees of payment and are subject to various risks.Non-agency mortgage loans are obligations of the borrowers thereunder only and are not typically insured or guaranteed by any other person or entity. The ability of a borrower to repay a loan is dependent upon the income or assets of the borrower. A number of factors, including a general economic downturn, acts of God, terrorism, social unrest and civil disturbances, may impair a borrower’s ability to repay its loans.
Multiple Class Pass-Through Securities: Multiple class pass-through securities, including collateralized mortgage obligations (“CMOs”) and commercial mortgage-backed securities, may be issued by Ginnie Mae, U.S. Government agencies or instrumentalities or by trusts formed by private originators of, or investors in, mortgage loans. In general, CMOs are debt obligations of a legal entity that are collateralized by a pool of residential or commercial mortgage loans or Mortgage Assets. The payments on these are used to make payments on the CMOs or multiple pass-through securities. Multiple class pass-through securities represent direct ownership interests in the Mortgage Assets. Classes of CMOs include interest only (“IOs”), principal only (“POs”), planned amortization classes and targeted amortization classes. IOs and POs are stripped mortgage-backed securities representing interests in a pool of mortgages, the cash flow from which has been separated into interest and principal components. IOs receive the interest portion of the cash flow while POs receive the principal portion. IOs and POs can be extremely volatile in response to changes in interest rates. As interest rates rise and fall, the value of IOs tends to move in the same direction as interest rates. POs perform best when prepayments on the underlying mortgages rise since this increases the rate at which the principal is returned and the yield to maturity on the PO. When payments on mortgages underlying a PO are slower than anticipated, the life of the PO is lengthened and the yield to maturity is reduced. If the underlying Mortgage Assets experience greater than anticipated prepayments of principal, a fund’s initial investment in the IOs may not fully recoup.
Stripped Mortgage-Backed Securities: Stripped mortgage-backed securities are typically issued by the U.S. Government, its agencies and instrumentalities. Stripped mortgage-backed securities are usually structured with two classes that receive different proportions of the interest (IOs) and principal (POs) distributions on a pool of Mortgage Assets. Stripped mortgage-backed securities may be privately issued.
Forward Commitments, When-Issued and Delayed Delivery Securities: The fund may purchase securities on a when-issued basis and may purchase or sell securities on a forward commitment basis. Settlement of such transactions normally occurs within a month or more after the purchase or sale commitment is made. The fund may purchase securities under such conditions with the intention of actually acquiring them, but may enter into a separate agreement to sell the securities before the settlement date. Since the value of securities purchased may fluctuate prior to settlement, the fund may be required to pay more at settlement than the security is worth. In addition, the fund is not entitled to any of the interest earned prior to settlement. When purchasing a security on a delayed delivery basis, the fund assumes the rights and risks of ownership of the security, including the risk of price and yield fluctuations. In the event of default by the counterparty, the fund’s maximum amount of loss is the unrealized appreciation of unsettled when-issued transactions.
TBA Commitments: TBA commitments are forward agreements for the purchase or sale of mortgage-backed securities for a fixed price, with payment and delivery on an agreed upon future settlement date. The specific securities to be delivered are not identified at the trade date. However, delivered securities must meet specified terms, including issuer, rate and mortgage terms. When entering into TBA commitments, a fund may take possession of or deliver the underlying mortgage-backed securities but can extend the settlement or roll the transaction. TBA commitments involve a risk of loss if the value of the security to be purchased or sold declines or increases, respectively, prior to settlement date.
In order to better define contractual rights and to secure rights that will help a fund mitigate its counterparty risk, TBA commitments may be entered into by a fund under Master Securities Forward Transaction Agreements (each, an “MSFTA”). An MSFTA typically contains, among other things, collateral posting terms and netting provisions in the event of default and/or termination event. The collateral requirements are typically calculated by netting themark-to-market amount for each transaction under such agreement and comparing that amount to the value of the collateral currently pledged by a fund and the counterparty. Cash collateral that has been pledged to cover the obligations of a fund and cash collateral received from the counterparty, if any, is reported separately in the Statement of Assets and Liabilities as cash pledged as collateral for TBA commitments or cash received as collateral for TBA commitments, respectively.Non-cash collateral pledged by a fund, if any, is noted in the Schedule of Investments. Typically, a fund is permitted to sell,re-pledge or use the collateral it receives; however, the counterparty is not permitted to do so. To the extent amounts due to a fund are not fully collateralized, contractually or otherwise, a fund bears the risk of loss from counterpartynon-performance.
Mortgage Dollar Roll Transactions: The fund may sell TBA mortgage-backed securities and simultaneously contract to repurchase substantially similar (i.e., same type, coupon and maturity) securities on a specific future date at an agreed upon price. During the period between the sale and repurchase, a fund is not entitled to receive interest and principal payments on the securities sold. Mortgage dollar roll transactions are treated as purchases and sales and realize gains and losses on these transactions. Mortgage dollar rolls involve the risk that the market value of the securities that a fund is required to purchase may decline below the agreed upon repurchase price of those securities.
Reverse Repurchase Agreements: Reverse repurchase agreements are agreements with qualified third party broker dealers in which a fund sells securities to a bank or broker-dealer and agrees to repurchase the same securities at a mutually agreed upon date and price. A fund receives cash from the sale to use for other investment purposes. During the term of the reverse repurchase agreement, a fund continues to receive the principal and interest payments on the securities sold. Certain agreements have no stated maturity and can be terminated by either party at any time. Interest on the value of the reverse repurchase agreements issued and outstanding is based upon competitive market rates determined at the time of issuance. A fund may utilize reverse repurchase agreements when it is anticipated that the interest income to be earned from the investment of the proceeds of the transaction is greater than the interest expense of the transaction. Reverse repurchase agreements involve leverage risk. If a fund suffers a loss on its investment of the transaction proceeds from a reverse repurchase agreement, a fund would still be required to pay the full repurchase price. Further, a fund remains subject to the risk that the market value of the securities repurchased declines below the repurchase price. In such cases, a fund would be required to return a portion of the cash received from the transaction or provide additional securities to the counterparty.
Cash received in exchange for securities delivered plus accrued interest due to the counterparty is recorded as a liability in the Statement of Assets and Liabilities at face value including accrued interest. Due to the short-term nature of the reverse repurchase agreements, face value approximates fair value. Interest payments made by a fund
| | | | |
| NOTESTO FINANCIAL STATEMENTS | | | 29 | |
Notes to Financial Statements (continued)
to the counterparties are recorded as a component of interest expense in the Statement of Operations. In periods of increased demand for the security, a fund may receive a fee for the use of the security by the counterparty, which may result in interest income to a fund.
For the year ended April 30, 2020, the Fund’s average amount of reverse repurchase agreements and the daily weighted average interest rate was $25,808,915 and 2.09%, respectively.
Reverse repurchase agreements are entered into by a fund under Master Repurchase Agreements (each, an “MRA”), which permit a fund, under certain circumstances, including an event of default (such as bankruptcy or insolvency), to offset payables and/or receivables under the MRA with collateral held and/or posted to the counterparty and create one single net payment due to or from a fund. With reverse repurchase agreements, typically a fund and counterparty under an MRA are permitted to sell,re-pledge, or use the collateral associated with the transaction. Bankruptcy or insolvency laws of a particular jurisdiction may impose restrictions on or prohibitions against such a right of offset in the event of the MRA counterparty’s bankruptcy or insolvency. Pursuant to the terms of the MRA, a fund receives or posts securities and cash as collateral with a market value in excess of the repurchase price to be paid or received by a fund upon the maturity of the transaction. Upon a bankruptcy or insolvency of the MRA counterparty, a fund is considered an unsecured creditor with respect to excess collateral and, as such, the return of excess collateral may be delayed.
As of period end, the following table is a summary of the Fund’s open reverse repurchase agreements by counterparty which are subject to offset under an MRA on a net basis:
| | | | | | | | | | | | | | | | |
| Counterparty | |
| Reverse
Repurchase
Agreements |
| |
| Fair Value of
Non-cash
Collateral
Pledged
Including
Accrued
Interest |
(a) | |
| Cash
Collateral
Pledged |
| | | Net Amount | |
Credit Suisse AG NY Branch | | $ | (2,671,045 | ) | | $ | 2,671,045 | | | $ | — | | | $ | — | |
| | | | | | | | | | | | | | | | |
(a) Collateral with a value of $2,780,208 has been pledged in connection with open reverse repurchase agreements. Excess of collateral pledged to the individual counterparty is not shown for financial reporting purposes.
In the event the counterparty of securities under an MRA files for bankruptcy or becomes insolvent, a fund’s use of the proceeds from the agreement may be restricted while the counterparty, or its trustee or receiver, determines whether or not to enforce a fund’s obligation to repurchase the securities.
| 5. | DERIVATIVE FINANCIAL INSTRUMENTS |
The Fund engages in various portfolio investment strategies using derivative contracts both to increase the returns of the Fund and/or to manage its exposure to certain risks such as credit risk, equity risk, interest rate risk, foreign currency exchange rate risk, commodity price risk or other risks (e.g., inflation risk). Derivative financial instruments categorized by risk exposure are included in the Schedule of Investments. These contracts may be transacted on an exchange or OTC.
Futures Contracts: Futures contracts are purchased or sold to gain exposure to, or manage exposure to, changes in interest rates (interest rate risk) and changes in the value of equity securities (equity risk) or foreign currencies (foreign currency exchange rate risk).
Futures contracts are agreements between the Fund and a counterparty to buy or sell a specific quantity of an underlying instrument at a specified price and on a specified date. Depending on the terms of a contract, it is settled either through physical delivery of the underlying instrument on the settlement date or by payment of a cash amount on the settlement date. Upon entering into a futures contract, the Fund is required to deposit initial margin with the broker in the form of cash or securities in an amount that varies depending on a contract’s size and risk profile. The initial margin deposit must then be maintained at an established level over the life of the contract. Amounts pledged, which are considered restricted, are included in cash pledged for futures contracts in the Statement of Assets and Liabilities.
Securities deposited as initial margin are designated in the Schedule of Investments and cash deposited, if any, are shown as cash pledged for futures contracts in the Statement of Assets and Liabilities. Pursuant to the contract, the Fund agrees to receive from or pay to the broker an amount of cash equal to the daily fluctuation in market value of the contract (“variation margin”). Variation margin is recorded as unrealized appreciation (depreciation) and, if any, shown as variation margin receivable (or payable) on futures contracts in the Statement of Assets and Liabilities. When the contract is closed, a realized gain or loss is recorded in the Statement of Operations equal to the difference between the notional amount of the contract at the time it was opened and the notional amount at the time it was closed. The use of futures contracts involves the risk of an imperfect correlation in the movements in the price of futures contracts and interest, foreign currency exchange rates or underlying assets.
Options: The Fund purchases and writes call and put options to increase or decrease its exposure to the risks of underlying instruments, including equity risk, interest rate risk and/or commodity price risk and/or, in the case of options written, to generate gains from options premiums.
A call option gives the purchaser (holder) of the option the right (but not the obligation) to buy, and obligates the seller (writer) to sell (when the option is exercised) the underlying instrument at the exercise or strike price at any time or at a specified time during the option period. A put option gives the holder the right to sell and obligates the writer to buy the underlying instrument at the exercise or strike price at any time or at a specified time during the option period.
Premiums paid on options purchased and premiums received on options written, as well as the daily fluctuation in market value, are included in investments at value –unaffiliated and options written at value, respectively, in the Statement of Assets and Liabilities. When an instrument is purchased or sold through the exercise of an option, the premium is offset against the cost or proceeds of the underlying instrument. When an option expires, a realized gain or loss is recorded in the Statement of Operations to the extent of the premiums received or paid. When an option is closed or sold, a gain or loss is recorded in the Statement of Operations to the extent the cost of the closing transaction exceeds the premiums received or paid. When the Fund writes a call option, such option is typically “covered,” meaning that it holds the underlying instrument
| | |
| 30 | | 2020 BLACKROCK ANNUAL REPORTTO SHAREHOLDERS |
Notes to Financial Statements (continued)
subject to being called by the option counterparty. When the Fund writes a put option, cash is segregated in an amount sufficient to cover the obligation. These amounts, which are considered restricted, are included in cash pledged as collateral for options written in the Statement of Assets and Liabilities.
| | • | | Swaptions — The Fund purchases and writes options on swaps (“swaptions”) primarily to preserve a return or spread on a particular investment or portion of the Fund’s holdings, as a duration management technique or to protect against an increase in the price of securities it anticipates purchasing at a later date. The purchaser and writer of a swaption is buying or granting the right to enter into a previously agreed upon interest rate or credit default swap agreement (interest rate risk and/or credit risk) at any time before the expiration of the option. |
In purchasing and writing options, the Fund bears the risk of an unfavorable change in the value of the underlying instrument or the risk that it may not be able to enter into a closing transaction due to an illiquid market. Exercise of a written option could result in the Fund purchasing or selling a security when it otherwise would not, or at a price different from the current market value.
Swaps: Swap contracts are entered into to manage exposure to issuers, markets and securities. Such contracts are agreements between the Fund and a counterparty to make periodic net payments on a specified notional amount or a net payment upon termination. Swap agreements are privately negotiated in the OTC market and may be entered into as a bilateral contract (“OTC swaps”) or centrally cleared (“centrally cleared swaps”).
For OTC swaps, any upfront premiums paid and any upfront fees received are shown as swap premiums paid and swap premiums received, respectively, in the Statement of Assets and Liabilities and amortized over the term of the contract. The daily fluctuation in market value is recorded as unrealized appreciation (depreciation) on OTC Swaps in the Statement of Assets and Liabilities. Payments received or paid are recorded in the Statement of Operations as realized gains or losses, respectively. When an OTC swap is terminated, a realized gain or loss is recorded in the Statement of Operations equal to the difference between the proceeds from (or cost of) the closing transaction and the Fund’s basis in the contract, if any. Generally, the basis of the contract is the premium received or paid.
In a centrally cleared swap, immediately following execution of the swap contract, the swap contract is novated to a central counterparty (the “CCP”) and the Fund’s counterparty on the swap agreement becomes the CCP. The Fund is required to interface with the CCP through the broker. Upon entering into a centrally cleared swap, the Fund is required to deposit initial margin with the broker in the form of cash or securities in an amount that varies depending on the size and risk profile of the particular swap. Securities deposited as initial margin are designated in the Schedule of Investments and cash deposited is shown as cash pledged for centrally cleared swaps in the Statement of Assets and Liabilities. Amounts pledged, which are considered restricted cash, are included in cash pledged for centrally cleared swaps in the Statement of Assets and Liabilities. Pursuant to the contract, the Fund agrees to receive from or pay to the broker variation margin. Variation margin is recorded as unrealized appreciation (depreciation) and shown as variation margin receivable (or payable) on centrally cleared swaps in the Statement of Assets and Liabilities. Payments received from (paid to) the counterparty, including at termination, are recorded as realized gains (losses) in the Statement of Operations.
| | • | | Credit default swaps — Credit default swaps are entered into to manage exposure to the market or certain sectors of the market, to reduce risk exposure to defaults of corporate and/or sovereign issuers or to create exposure to corporate and/or sovereign issuers to which a fund is not otherwise exposed (credit risk). |
The Fund may either buy or sell (write) credit default swaps on single-name issuers (corporate or sovereign), a combination or basket of single-name issuers or traded indexes. Credit default swaps are agreements in which the protection buyer pays fixed periodic payments to the seller in consideration for a promise from the protection seller to make a specific payment should a negative credit event take place with respect to the referenced entity (e.g., bankruptcy, failure to pay, obligation acceleration, repudiation, moratorium or restructuring). As a buyer, if an underlying credit event occurs, the Fund will either (i) receive from the seller an amount equal to the notional amount of the swap and deliver the referenced security or underlying securities comprising the index, or (ii) receive a net settlement of cash equal to the notional amount of the swap less the recovery value of the security or underlying securities comprising the index. As a seller (writer), if an underlying credit event occurs, the Fund will either pay the buyer an amount equal to the notional amount of the swap and take delivery of the referenced security or underlying securities comprising the index or pay a net settlement of cash equal to the notional amount of the swap less the recovery value of the security or underlying securities comprising the index.
| | • | | Interest rate swaps — Interest rate swaps are entered into to gain or reduce exposure to interest rates or to manage duration, the yield curve or interest rate (interest rate risk). |
Interest rate swaps are agreements in which one party pays a stream of interest payments, either fixed or floating, in exchange for another party’s stream of interest payments, either fixed or floating, on the same notional amount for a specified period of time. In more complex interest rate swaps, the notional principal amount may decline (or amortize) over time.
Swap transactions involve, to varying degrees, elements of interest rate, credit and market risk in excess of the amounts recognized in the Statement of Assets and Liabilities. Such risks involve the possibility that there will be no liquid market for these agreements, that the counterparty to the agreements may default on its obligation to perform or disagree as to the meaning of the contractual terms in the agreements, and that there may be unfavorable changes in interest rates and/or market values associated with these transactions.
Master Netting Arrangements: In order to define its contractual rights and to secure rights that will help it mitigate its counterparty risk, the Fund may enter into an International Swaps and Derivatives Association, Inc. Master Agreement (“ISDA Master Agreement”) or similar agreement with its counterparties. An ISDA Master Agreement is a bilateral agreement between the Fund and a counterparty that governs certain OTC derivatives and typically contains, among other things, collateral posting terms and netting provisions in the event of a default and/or termination event. Under an ISDA Master Agreement, the Fund may, under certain circumstances, offset with the counterparty certain derivative financial instruments’ payables and/or receivables with collateral held and/or posted and create one single net payment. The provisions of the ISDA Master Agreement typically permit a single net payment in the event of default including the bankruptcy or insolvency of the counterparty. Bankruptcy or insolvency laws of a particular jurisdiction may restrict or prohibit the right of offset in bankruptcy, insolvency or other events.
Collateral Requirements:For derivatives traded under an ISDA Master Agreement, the collateral requirements are typically calculated by netting themark-to-market amount for each transaction under such agreement and comparing that amount to the value of any collateral currently pledged by the Fund and the counterparty.
| | | | |
| NOTESTO FINANCIAL STATEMENTS | | | 31 | |
Notes to Financial Statements (continued)
Cash collateral that has been pledged to cover obligations of the Fund and cash collateral received from the counterparty, if any, is reported separately in the Statement of Assets and Liabilities as cash pledged as collateral and cash received as collateral, respectively.Non-cash collateral pledged by the Fund, if any, is noted in the Schedule of Investments. Generally, the amount of collateral due from or to a counterparty is subject to a certain minimum transfer amount threshold before a transfer is required, which is determined at the close of business of the Fund. Any additional required collateral is delivered to/pledged by the Fund on the next business day. Typically, the counterparty is not permitted to sell,re-pledge or use cash andnon-cash collateral it receives. The Fund generally agrees not to usenon-cash collateral that it receives but may, absent default or certain other circumstances defined in the underlying ISDA Master Agreement, be permitted to use cash collateral received. In such cases, interest may be paid pursuant to the collateral arrangement with the counterparty. To the extent amounts due to the Fund from its counterparties are not fully collateralized, it bears the risk of loss from counterpartynon-performance. Likewise, to the extent the Fund has delivered collateral to a counterparty and stands ready to perform under the terms of its agreement with such counterparty, it bears the risk of loss from a counterparty in the amount of the value of the collateral in the event the counterparty fails to return such collateral. Based on the terms of agreements, collateral may not be required for all derivative contracts.
For financial reporting purposes, the Fund does not offset derivative assets and derivative liabilities that are subject to netting arrangements, if any, in the Statement of Assets and Liabilities.
| 6. | INVESTMENT ADVISORY AGREEMENT AND OTHER TRANSACTIONS WITH AFFILIATES |
Investment Advisory: The Trust, on behalf of the Fund, entered into an Investment Advisory Agreement with the Manager, the Fund’s investment adviser and an indirect, wholly-owned subsidiary of BlackRock, Inc. (“BlackRock”), to provide investment advisory and administrative services. The Manager is responsible for the management of the Fund’s portfolio and provides the personnel, facilities, equipment and certain other services necessary to the operations of the Fund.
For such services, the Fund pays the Manager a monthly fee at an annual rate equal to the following percentages of the average daily value of the Fund’s net assets:
| | | | |
| Average Daily Net Assets | | Investment
Advisory Fees | |
First $1 Billion | | | 0.40 | % |
$1 Billion - $3 Billion | | | 0.38 | |
$3 Billion - $5 Billion | | | 0.36 | |
$5 Billion - $10 Billion | | | 0.35 | |
Greater than $10 Billion | | | 0.34 | |
Service and Distribution Fees: The Trust, on behalf of the Fund, entered into a Distribution Agreement and a Distribution and Service Plan with BlackRock Investments, LLC (“BRIL”), an affiliate of the Manager. Pursuant to the Distribution and Service Plan and in accordance with Rule12b-1 under the 1940 Act, the Fund pays BRIL ongoing service and distribution fees. The fees are accrued daily and paid monthly at annual rates based upon the average daily net assets of the relevant share class of the Fund as follows:
| | | | | | | | |
| | | Service Fees | | | Distribution Fees | |
Investor A | | | 0.25 | % | | | — | % |
Investor C | | | 0.25 | | | | 0.75 | |
BRIL and broker-dealers, pursuant tosub-agreements with BRIL, provide shareholder servicing and distribution services to the Fund. The ongoing service and/or distribution fee compensates BRIL and each broker-dealer for providing shareholder servicing and/or distribution related services to shareholders.
For the year ended April 30, 2020, the following table shows the class specific service and distribution fees borne directly by each share class of the Fund:
| | | | |
| | | Service and
Distribution Fees | |
Investor A | | $ | 65,360 | |
Investor C | | | 70,018 | |
| | | $ | 135,378 | |
Transfer Agent:Pursuant to written agreements, certain financial intermediaries, some of which may be affiliates, provide the Fund withsub-accounting, recordkeeping,sub-transfer agency and other administrative services with respect to servicing of underlying investor accounts. For these services, these entities receive an asset-based fee or an annual fee per shareholder account, which will vary depending on share class and/or net assets. For the year ended April 30, 2020, the Fund paid the following amounts to affiliates of BlackRock in return for these services, which are included in transfer agent - class specific in the Statement of Operations:
| | | | |
Institutional | | $ | 149,778 | |
Investor A | | | 38,309 | |
Investor C | | | 10,128 | |
| | | $ | 198,215 | |
Other Fees: For the year ended April 30, 2020, affiliates earned underwriting discounts, direct commissions and dealer concessions on sales of the Fund’s Investor A Shares of $1,117.
| | |
| 32 | | 2020 BLACKROCK ANNUAL REPORT TO SHAREHOLDERS |
Notes to Financial Statements (continued)
For the year ended April 30, 2020, affiliates received CDSCs as follows:
| | | | |
Investor A | | $ | 398 | |
Investor C | | | 188 | |
Expense Limitations, Waivers, and Reimbursements: The Manager has contractually agreed to waive its investment advisory fee with respect to any portion of the Fund’s assets invested in affiliated equity and fixed-income mutual funds and affiliated exchange-traded funds that have a contractual management fee through August 31, 2020. The contractual agreement may be terminated upon 90 days’ notice by a majority of the trustees who are not “interested persons” of the Fund, as defined in the 1940 Act (“Independent Trustees”), or by a vote of a majority of the outstanding voting securities of the Fund. For the year ended April 30, 2020, there were no fees waived and/or reimbursed by the Manager pursuant to this agreement.
The Manager contractually agreed to waive and/or reimburse fees or expenses in order to limit expenses, excluding interest expense, dividend expense, tax expense, acquired fund fees and expenses, and certain other fund expenses, which constitute extraordinary expenses not incurred in the ordinary course of the Fund’s business (“expense limitation”). The expense limitations as a percentage of average daily net assets are as follows:
| | | | |
Institutional | | | 0.45 | % |
Investor A | | | 0.70 | |
Investor C | | | 1.45 | |
The Manager has agreed not to reduce or discontinue this contractual expense limitation through August 31, 2020, unless approved by the Board, including a majority of Independent Trustees, or by a vote of a majority of the outstanding voting securities of the Fund. For the year ended April 30, 2020, the Manager waived $198,658, which is included in fees waived and/or reimbursed by the Manager in the Statement of Operations. These amounts waived and/or reimbursed are included in fees waived and/ or reimbursed by the Manager, and transfer agent fees waived and/or reimbursed — class specific in the Statement of Operations. For the year ended April 30, 2020, class specific expense waivers and/or reimbursements are as follows:
| | | | |
| | | Transfer Agent Fees
Waived and/or Reimbursed | |
Institutional | | | $ 142,956 | |
Investor A | | | 37,793 | |
Investor C | | | 10,086 | |
| | | | $ 190,835 | |
For the year ended April 30, 2020, the Fund reimbursed the Manager $3,245 for certain accounting services, which is included in accounting services in the Statement of Operations.
Interfund Lending: In accordance with an exemptive order (the “Order”) from the U.S. Securities and Exchange Commission (“SEC”), the Fund may participate in a joint lending and borrowing facility for temporary purposes (the “Interfund Lending Program”), subject to compliance with the terms and conditions of the Order, and to the extent permitted by the Fund’s investment policies and restrictions. The Fund is currently permitted to borrow and lend under the Interfund Lending Program.
A lending BlackRock fund may lend in aggregate up to 15% of its net assets, but may not lend more than 5% of its net assets to any one borrowing fund through the Interfund Lending Program. A borrowing BlackRock fund may not borrow through the Interfund Lending Program or from any other source more than 33 1/3% of its total assets (or any lower threshold provided for by the fund’s investment restrictions). If a borrowing BlackRock fund’s total outstanding borrowings exceed 10% of its total assets, each of its outstanding interfund loans will be subject to collateralization of at least 102% of the outstanding principal value of the loan. All interfund loans are for temporary or emergency purposes and the interest rate to be charged will be the average of the highest current overnight repurchase agreement rate available to a lending fund and the bank loan rate, as calculated according to a formula established by the Board.
During the year ended April 30, 2020, the Fund did not participate in the Interfund Lending Program.
Trustees and Officers:Certain trustees and/or officers of the Trust are directors and/or officers of BlackRock or its affiliates. The Fund reimburses the Manager for a portion of the compensation paid to the Fund’s Chief Compliance Officer, which is included in Trustees and Officer in the Statement of Operations.
For the year ended April 30, 2020, purchases and sales of investments, including paydowns, mortgage dollar rolls and excluding short-term securities, were as follows:
| | | | | | | | |
| | | Purchases | | | Sales | |
Non-U.S. Government Securities | | $ | 4,698,146,029 | | | $ | 4,703,582,555 | |
U.S. Government Securities | | | 5,414,324 | | | | 5,631,013 | |
For the year ended April 30, 2020, purchases and sales related to mortgage dollar rolls were as follows:
| | | | |
Purchases and Sales — MDRs | | | | |
Purchases | | | $1,673,673,030 | |
Sales | | | 1,673,294,458 | |
| | | | |
| NOTESTO FINANCIAL STATEMENTS | | | 33 | |
Notes to Financial Statements (continued)
It is the Fund’s policy to comply with the requirements of the Internal Revenue Code of 1986, as amended, applicable to regulated investment companies, and to distribute substantially all of its taxable income to its shareholders. Therefore, no U.S. federal income tax provision is required.
The Fund files U.S. federal and various state and local tax returns. No income tax returns are currently under examination. The statute of limitations on the Fund’s U.S. federal tax returns generally remains open for each of the four years ended April 30, 2020. The statutes of limitations on the Fund’s state and local tax returns may remain open for an additional year depending upon the jurisdiction.
Management has analyzed tax laws and regulations and their application to the Fund as of April 30, 2020, inclusive of the open tax return years, and does not believe that there are any uncertain tax positions that require recognition of a tax liability in the Fund’s financial statements.
The tax character of distributions paid was as follows:
| | | | | | | | |
| | | |
| | | | 04/30/20 | | | | 04/30/19 | |
Ordinary income | | $ | 8,584,133 | | | $ | 8,532,768 | |
As of period end, the tax components of accumulated loss were as follows:
| | | | |
| | |
Undistributed ordinary income | | $ | 180,999 | |
Non-expiring capital loss carryforwards(a) | | | (5,088,966) | |
Net unrealized losses(b) | | | (2,659,331) | |
| | | | |
| |
| | | $(7,567,298) | |
| | | | |
| (a) | Amounts available to offset future realized capital gains. |
| (b) | The differences between book-basis andtax-basis net unrealized losses were attributable primarily to the tax deferral of losses on wash sales, the realization for tax purposes of unrealized gains/losses on certain futures and options contracts, amortization methods for premiums and discounts on fixed income securities and the accounting for swap agreements. |
During the year ended April 30, 2020, the Fund utilized $1,360,768 of its respective capital loss carryforward.
As of April 30, 2020, gross unrealized appreciation and depreciation for investments and derivatives based on cost for U.S. federal income tax purposes were as follows:
| | | | |
Tax cost | | $ | 346,059,617 | |
| | | | |
| |
Gross unrealized appreciation | | $ | 9,903,634 | |
Gross unrealized depreciation | | | (12,562,965) | |
| | | | |
Net unrealized depreciation | | | $(2,659,331) | |
| | | | |
The Trust, on behalf of the Fund, along with certain other funds managed by the Manager and its affiliates (“Participating Funds”), is a party to a364-day, $2.25 billion credit agreement with a group of lenders. Under this agreement, the Fund may borrow to fund shareholder redemptions. Excluding commitments designated for certain individual funds, the Participating Funds, including the Fund, can borrow up to an aggregate commitment amount of $1.75 billion at any time outstanding, subject to asset coverage and other limitations as specified in the agreement. The credit agreement has the following terms: a fee of 0.10% per annum on unused commitment amounts and interest at a rate equal to the higher of(a) one-month LIBOR (but, in any event, not less than 0.00%) on the date the loan is made plus 0.80% per annum or (b) the Fed Funds rate (but, in any event, not less than 0.00%) in effect from time to time plus 0.80% per annum on amounts borrowed. The agreement expires in April 2021 unless extended or renewed. These fees were allocated among such funds based upon portions of the aggregate commitment available to them and relative net assets of Participating Funds. During the year ended April 30, 2020, the Fund did not borrow under the credit agreement.
In the normal course of business, the Fund invests in securities or other instruments and may enter into certain transactions, and such activities subject the Fund to various risks, including among others, fluctuations in the market (market risk) or failure of an issuer to meet all of its obligations. The value of securities or other instruments may also be affected by various factors, including, without limitation: (i) the general economy; (ii) the overall market as well as local, regional or global political and/or social instability; (iii) regulation, taxation or international tax treaties between various countries; or (iv) currency, interest rate and price fluctuations. Local, regional or global events such as war, acts of terrorism, the spread of infectious illness or other public health issues, recessions, or other events could have a significant impact on the Fund and its investments. The Fund’s prospectus provides details of the risks to which the Fund is subject.
The Fund may be exposed to prepayment risk, which is the risk that borrowers may exercise their option to prepay principal earlier than scheduled during periods of declining interest rates, which would force the Fund to reinvest in lower yielding securities. The Fund may also be exposed to reinvestment risk, which is the risk that income from the Fund’s portfolio will decline if the Fund invests the proceeds from matured, traded or called fixed-income securities at market interest rates that are below the Fund portfolio’s current earnings rate.
| | |
| 34 | | 2020 BLACKROCK ANNUAL REPORT TO SHAREHOLDERS |
Notes to Financial Statements (continued)
Valuation Risk:The price the Fund could receive upon the sale of any particular portfolio investment may differ from the Fund’s valuation of the investment, particularly for securities that trade in thin or volatile markets or that are valued using a fair valuation technique or a price provided by an independent pricing service. Changes to significant unobservable inputs and assumptions (i.e., publicly traded company multiples, growth rate, time to exit) due to the lack of observable inputs may significantly impact the resulting fair value and therefore the Fund’s results of operations. As a result, the price received upon the sale of an investment may be less than the value ascribed by the Fund, and the Fund could realize a greater than expected loss or lesser than expected gain upon the sale of the investment. The Fund’s ability to value its investments may also be impacted by technological issues and/or errors by pricing services or other third party service providers.
An outbreak of respiratory disease caused by a novel coronavirus has developed into a global pandemic and has resulted in closing borders, quarantines, disruptions to supply chains and customer activity, as well as general concern and uncertainty. The impact of this pandemic, and other global health crises that may arise in the future, could affect the economies of many nations, individual companies and the market in general in ways that cannot necessarily be foreseen at the present time. This pandemic may result in substantial market volatility and may adversely impact the prices and liquidity of a fund’s investments. The impact of the pandemic may be short term or may last for an extended period of time.
Counterparty Credit Risk: The Fund may be exposed to counterparty credit risk, or the risk that an entity may fail to or be unable to perform on its commitments related to unsettled or open transactions. The Fund manages counterparty credit risk by entering into transactions only with counterparties that the Manager believes have the financial resources to honor their obligations and by monitoring the financial stability of those counterparties. Financial assets, which potentially expose the Fund to market, issuer and counterparty credit risks, consist principally of financial instruments and receivables due from counterparties. The extent of the Fund’s exposure to market, issuer and counterparty credit risks with respect to these financial assets is approximately their value recorded in the Statement of Assets and Liabilities, less any collateral held by the Fund.
A derivative contract may suffer amark-to-market loss if the value of the contract decreases due to an unfavorable change in the market rates or values of the underlying instrument. Losses can also occur if the counterparty does not perform under the contract.
The Fund’s risk of loss from counterparty credit risk on OTC derivatives is generally limited to the aggregate unrealized gain less the value of any collateral held by the Fund.
For OTC options purchased, the Fund bears the risk of loss in the amount of the premiums paid plus the positive change in market values net of any collateral held by the Fund should the counterparty fail to perform under the contracts. Options written by the Fund do not typically give rise to counterparty credit risk, as options written generally obligate the Fund, and not the counterparty, to perform. The Fund may be exposed to counterparty credit risk with respect to options written to the extent the Fund deposits collateral with its counterparty to a written option.
With exchange-traded options purchased and futures and centrally cleared swaps, there is less counterparty credit risk to the Fund since the exchange or clearinghouse, as counterparty to such instruments, guarantees against a possible default. The clearinghouse stands between the buyer and the seller of the contract; therefore, credit risk is limited to failure of the clearinghouse. While offset rights may exist under applicable law, the Fund does not have a contractual right of offset against a clearing broker or clearinghouse in the event of a default (including the bankruptcy or insolvency). Additionally, credit risk exists in exchange-traded futures and centrally cleared swaps with respect to initial and variation margin that is held in a clearing broker’s customer accounts. While clearing brokers are required to segregate customer margin from their own assets, in the event that a clearing broker becomes insolvent or goes into bankruptcy and at that time there is a shortfall in the aggregate amount of margin held by the clearing broker for all its clients, typically the shortfall would be allocated on a pro rata basis across all the clearing broker’s customers, potentially resulting in losses to the Fund.
Concentration Risk: The Fund invests a significant portion of its assets in fixed-income securities and/or uses derivatives tied to the fixed-income markets. Changes in market interest rates or economic conditions may affect the value and/or liquidity of such investments. Interest rate risk is the risk that prices of bonds and other fixed-income securities will increase as interest rates fall and decrease as interest rates rise. The Fund may be subject to a greater risk of rising interest rates due to the current period of historically low rates.
The Fund invests a significant portion of its assets in securities backed by commercial or residential mortgage loans or in issuers that hold mortgage and other asset-backed securities. Investment percentages in these securities are presented in the Schedule of Investments. Changes in economic conditions, including delinquencies and/or defaults on assets underlying these securities, can affect the value, income and/or liquidity of such positions.
| | | | |
| NOTESTO FINANCIAL STATEMENTS | | | 35 | |
Notes to Financial Statements (continued)
| 11. | CAPITAL SHARE TRANSACTIONS |
Transactions in capital shares for each class were as follows:
| | | | | | | | | | | | | | | | | | | | | | | | |
| | | Year Ended | | | Year Ended | |
| | | 04/30/20 | | | 04/30/19 | |
| | | Shares | | | | | | Amount | | | Shares | | | | | | Amount | |
Institutional | | | | | | | | | | | | | | | | | | | | | | | | |
Shares sold | | | 11,251,329 | | | | | | | $ | 114,733,546 | | | | 9,726,730 | | | | | | | $ | 96,695,283 | |
Shares issued in reinvestment of distributions | | | 584,287 | | | | | | | | 5,957,480 | | | | 531,691 | | | | | | | | 5,286,788 | |
Shares redeemed | | | (10,909,934 | ) | | | | | | | (110,959,706 | ) | | | (8,261,935 | ) | | | | | | | (81,872,764 | ) |
Net increase | | | 925,682 | | | | | | | $ | 9,731,320 | | | | 1,996,486 | | | | | | | $ | 20,109,307 | |
Investor A | | | | | | | | | | | | | | | | | | | | | | | | |
Shares sold and automatic conversion of shares | | | 480,985 | | | | | | | $ | 4,898,896 | | | | 1,458,427 | | | | | | | $ | 14,494,201 | |
Shares issued in reinvestment of distributions | | | 76,128 | | | | | | | | 774,643 | | | | 99,569 | | | | | | | | 988,065 | |
Shares redeemed | | | (1,028,474 | ) | | | | | | | (10,362,770 | ) | | | (2,707,597 | ) | | | | | | | (26,859,830 | ) |
Net decrease | | | (471,361 | ) | | | | | | $ | (4,689,231 | ) | | | (1,149,601 | ) | | | | | | $ | (11,377,564 | ) |
Investor C | | | | | | | | | | | | | | | | | | | | | | | | |
Shares sold | | | 81,769 | | | | | | | $ | 834,019 | | | | 83,674 | | | | | | | $ | 828,972 | |
Shares issued in reinvestment of distributions | | | 15,367 | | | | | | | | 156,349 | | | | 29,946 | | | | | | | | 297,176 | |
Shares redeemed and automatic conversion of shares | | | (251,237 | ) | | | | | | | (2,548,852 | ) | | | (774,999 | ) | | | | | | | (7,655,404 | ) |
Net decrease | | | (154,101 | ) | | | | | | $ | (1,558,484 | ) | | | (661,379 | ) | | | | | | $ | (6,529,256 | ) |
Total Net Increase | | | 300,220 | | | | | | | $ | 3,483,605 | | | | 185,506 | | | | | | | $ | 2,202,487 | |
Management has evaluated the impact of all subsequent events on the Fund through the date the financial statements were issued and has determined that there were no subsequent events requiring adjustment or additional disclosure in the financial statements.
| | |
| 36 | | 2020 BLACKROCK ANNUAL REPORT TO SHAREHOLDERS |
| | |
| Report of Independent Registered Public Accounting Firm | | |
To the Shareholders of BlackRock U.S. Mortgage Portfolio and the Board of Trustees of Managed Account Series II:
Opinion on the Financial Statements and Financial Highlights
We have audited the accompanying statement of assets and liabilities of BlackRock U.S. Mortgage Portfolio of Managed Account Series II (the “Fund”), including the schedule of investments, as of April 30, 2020, the related statement of operations for the year then ended, the statements of changes in net assets for each of the two years in the period then ended, the financial highlights for each of the five years in the period then ended, and the related notes. In our opinion, the financial statements and financial highlights present fairly, in all material respects, the financial position of the Fund as of April 30, 2020, and the results of its operations for the year then ended, the changes in its net assets for each of the two years in the period then ended, and the financial highlights for each of the five years in the period then ended, in conformity with accounting principles generally accepted in the United States of America.
Basis for Opinion
These financial statements and financial highlights are the responsibility of the Fund’s management. Our responsibility is to express an opinion on the Fund’s financial statements and financial highlights based on our audits. We are a public accounting firm registered with the Public Company Accounting Oversight Board (United States) (PCAOB) and are required to be independent with respect to the Fund in accordance with the U.S. federal securities laws and the applicable rules and regulations of the Securities and Exchange Commission and the PCAOB.
We conducted our audits in accordance with the standards of the PCAOB. Those standards require that we plan and perform the audit to obtain reasonable assurance about whether the financial statements and financial highlights are free of material misstatement, whether due to error or fraud. The Fund is not required to have, nor were we engaged to perform, an audit of its internal control over financial reporting. As part of our audits we are required to obtain an understanding of internal control over financial reporting but not for the purpose of expressing an opinion on the effectiveness of the Fund’s internal control over financial reporting. Accordingly, we express no such opinion.
Our audits included performing procedures to assess the risks of material misstatement of the financial statements and financial highlights, whether due to error or fraud, and performing procedures that respond to those risks. Such procedures included examining, on a test basis, evidence regarding the amounts and disclosures in the financial statements and financial highlights. Our audits also included evaluating the accounting principles used and significant estimates made by management, as well as evaluating the overall presentation of the financial statements and financial highlights. Our procedures included confirmation of securities owned as of April 30, 2020, by correspondence with the custodian and brokers; when replies were not received from brokers, we performed other auditing procedures. We believe that our audits provide a reasonable basis for our opinion.
Deloitte & Touche LLP
Boston, Massachusetts
June 22, 2020
We have served as the auditor of one or more BlackRock investment companies since 1992.
Important Tax Information (unaudited)
For the fiscal year ended April 30, 2020, the Fund hereby designates the following maximum amounts allowable as interest-related dividends eligible for exemption from U.S. withholding tax for nonresident aliens and foreign corporations:
| | | | |
| Fund | | Interest-Related Dividends | |
BlackRock U.S. Mortgage Portfolio | | | $ 8,905,611 | |
| | | | |
| REPORTOF INDEPENDENT REGISTERED PUBLIC ACCOUNTING FIRM / IMPORTANT TAX INFORMATION | | | 37 | |
Statement Regarding Liquidity Risk Management Program
The Securities and Exchange Commission adopted Rule22e-4 under the Investment Company Act of 1940, as amended (the “Liquidity Rule”) to promote effective liquidity risk management throughout theopen-end investment company industry, thereby reducing the risk that funds will be unable to meet their redemption obligations and mitigating dilution of the interests of fund shareholders.
The Board of Trustees (the “Board”) of Managed Account Series II, on behalf of BlackRock U.S. Mortgage Portfolio, met on November14-15, 2019 (the “Meeting”) to review the liquidity risk management program (the “Program”) applicable to the BlackRockopen-end funds, excluding money market funds (each, a “Fund”), pursuant to the Liquidity Rule. The Board has appointed BlackRock Advisors, LLC or BlackRock Fund Advisors (“BlackRock”), each an investment adviser to certain Funds, as the program administrator for each Fund’s Program, as applicable. BlackRock has delegated oversight of the Program to the 40 Act Liquidity Risk Management Committee (the “Committee”). At the Meeting, the Committee, on behalf of BlackRock, provided the Board with a report that addressed the operation of the Program and assessed its adequacy and effectiveness of implementation, including the operation of each Fund’s Highly Liquid Investment Minimum (“HLIM”) where applicable, and any material changes to the Program (the “Report”). The Report covered the period from December 1, 2018 through September 30, 2019 (the “Program Reporting Period”).
The Report described the Program’s liquidity classification methodology for categorizing a Fund’s investments (including derivative transactions) into one of four liquidity buckets. It also described BlackRock’s methodology in establishing a Fund’s HLIM and noted that the Committee reviews and ratifies the HLIM assigned to each Fund no less frequently than annually.
The Report noted that the Program complied with the key factors for consideration under the Liquidity Rule for assessing, managing and periodically reviewing a Fund’s liquidity risk, as follows:
A. The Fund’s investment strategy and liquidity of portfolio investments during both normal and reasonably foreseeable stressed conditions: During the Program Reporting Period, the Committee reviewed whether each Fund’s strategy is appropriate for anopen-end fund structure with a focus on Funds with more significant and consistent holdings of less liquid and illiquid assets. The Committee also factored a Fund’s concentration in an issuer into the liquidity classification methodology by taking issuer position sizes into account. Where a Fund participated in borrowings for investment purposes (such as tender option bonds and reverse repurchase agreements), such borrowings were factored into the Program’s calculation of a Fund’s liquidity bucketing. Derivative exposure was also considered in such calculation.
B. Short-term and long-term cash flow projections during both normal and reasonably foreseeable stressed conditions: During the Program Reporting Period, the Committee reviewed historical net redemption activity and used this information as a component to establish each Fund’s reasonably anticipated trading size (“RATS”). Each Fund has adopted anin-kind redemption policy which may be utilized to meet larger redemption requests. The Committee may also take into consideration a Fund’s shareholder ownership concentration (which, depending on product type and distribution channel, may or may not be available), a Fund’s distribution channels, and the degree of certainty associated with a Fund’s short-term and long-term cash flow projections.
C. Holdings of cash and cash equivalents, as well as borrowing arrangements: The Committee considered the terms of the credit facility applicable to the Funds, the financial health of the institution providing the facility and the fact that the credit facility is shared among multiple Funds (including that a portion of the aggregate commitment amount is specifically designated for BlackRock Floating Rate Income Portfolio, a series of BlackRock Funds V). The Committee also considered other types of borrowing available to the Funds, such as the ability to use reverse repurchase agreements and interfund lending, as applicable.
There were no material changes to the Program during the Program Reporting Period. The Report provided to the Board stated that the Committee concluded that based on the operation of the functions, as described in the Report, the Program is operating as intended and is effective in implementing the requirements of the Liquidity Rule.
| | |
| 38 | | 2020 BLACKROCK ANNUAL REPORT TO SHAREHOLDERS |
Trustee and Officer Information
| | | | | | | | |
| Independent Trustees (a) |
| | | | | |
Name Year of Birth(b) | | Position(s) Held (Length of Service)(c) | | Principal Occupation(s) During Past Five Years | | Number of BlackRock-Advised
Registered Investment Companies
(“RICs”) Consisting of Investment
Portfolios (“Portfolios”) Overseen | | Public Company and
Other Investment
Company Directorships
Held During Past Five
Years |
Richard E. Cavanagh 1946 | | Co-Chair of the Board and Trustee
(Since 2019) | | Director, The Guardian Life Insurance Company of America since 1998; Board Chair, Volunteers of America (anot-for-profit organization) from 2015 to 2018 (board member since 2009); Director, Arch Chemicals (chemical and allied products) from 1999 to 2011; Trustee, Educational Testing Service from 1997 to 2009 and Chairman thereof from 2005 to 2009; Senior Advisor, The Fremont Group since 2008 and Director thereof since 1996; Faculty Member/Adjunct Lecturer, Harvard University since 2007 and Executive Dean from 1987 to 1995; President and Chief Executive Officer, The Conference Board, Inc. (global business research organization) from 1995 to 2007. | | 87 RICs consisting of 111 Portfolios | | None |
Karen P. Robards 1950 | | Co-Chair of the Board and Trustee
(Since 2019) | | Principal of Robards & Company, LLC (consulting and private investing) since 1987;Co-founder and Director of the Cooke Center for Learning and Development (anot-for-profit organization) since 1987; Director of Enable Injections, LLC (medical devices) since 2019; Investment Banker at Morgan Stanley from 1976 to 1987. | | 87 RICs consisting of 111 Portfolios | | Greenhill & Co., Inc.; AtriCure, Inc. (medical devices) from 2000 until 2017 |
Michael J. Castellano 1946 | | Trustee
(Since 2019) | | Chief Financial Officer of Lazard Group LLC from 2001 to 2011; Chief Financial Officer of Lazard Ltd from 2004 to 2011; Director, Support Our Aging Religious(non-profit) from 2009 to June 2015 and since 2017; Director, National Advisory Board of Church Management at Villanova University since 2010; Trustee, Domestic Church Media Foundation since 2012; Director, CircleBlack Inc. (financial technology company) since 2015. | | 87 RICs consisting of 111 Portfolios | | None |
Cynthia L. Egan 1955 | | Trustee
(Since 2019) | | Advisor, U.S. Department of the Treasury from 2014 to 2015; President, Retirement Plan Services for T. Rowe Price Group, Inc. from 2007 to 2012; executive positions within Fidelity Investments from 1989 to 2007. | | 87 RICs consisting of 111 Portfolios | | Unum (insurance); The Hanover Insurance Group (insurance); Envestnet (investment platform) from 2013 until 2016 |
Frank J. Fabozzi(d) 1948 | | Trustee
(Since 2019) | | Editor of The Journal of Portfolio Management since 1986; Professor of Finance, EDHEC Business School (France) since 2011; Visiting Professor, Princeton University for the 2013 to 2014 academic year and Spring 2017 semester; Professor in the Practice of Finance, Yale University School of Management from 1994 to 2011 and currently a Teaching Fellow in Yale’s Executive Programs; Board Member, BlackRock Equity-Liquidity Funds from 2014 to 2016; affiliated professor Karlsruhe Institute of Technology from 2008 to 2011; Visiting Professor, Rutgers University for the Spring 2019 semester; Visiting Professor, New York University for the 2019 academic year. | | 88 RICs consisting of 112 Portfolios | | None |
R. Glenn Hubbard 1958 | | Trustee
(Since 2019) | | Dean, Columbia Business School from 2004 to 2019; Faculty member, Columbia Business School since 1988. | | 87 RICs consisting of 111 Portfolios | | ADP (data and information services); Metropolitan Life Insurance Company (insurance); KKR Financial Corporation (finance) from 2004 until 2014 |
W. Carl Kester(d) 1951 | | Trustee
(Since 2019) | | George Fisher Baker Jr. Professor of Business Administration, Harvard Business School since 2008; Deputy Dean for Academic Affairs from 2006 to 2010; Chairman of the Finance Unit, from 2005 to 2006; Senior Associate Dean and Chairman of the MBA Program from 1999 to 2005; Member of the faculty of Harvard Business School since 1981. | | 88 RICs consisting of 112 Portfolios | | None |
Catherine A.
Lynch(d) 1961 | | Trustee
(Since 2019) | | Chief Executive Officer, Chief Investment Officer and various other positions, National Railroad Retirement Investment Trust from 2003 to 2016; Associate Vice President for Treasury Management, The George Washington University from 1999 to 2003; Assistant Treasurer, Episcopal Church of America from 1995 to 1999. | | 88 RICs consisting of 112 Portfolios | | None |
| | | | |
| TRUSTEEAND OFFICER INFORMATION | | | 39 | |
Trustee and Officer Information (continued)
| | | | | | | | |
| Interested Trustees(a)(e) |
| | | | | |
Name Year of Birth(b) | | Position(s) Held (Length of Service)(c) | | Principal Occupation(s) During Past Five Years | | Number of BlackRock-Advised
Registered Investment Companies
(“RICs”) Consisting of Investment
Portfolios (“Portfolios”) Overseen | | Public Company and Other Investment Company Directorships Held During Past Five Years |
Robert Fairbairn 1965 | | Trustee
(Since 2015) | | Vice Chairman of BlackRock, Inc. since 2019; Member of BlackRock’s Global Executive and Global Operating Committees;Co-Chair of BlackRock’s Human Capital Committee; Senior Managing Director of BlackRock, Inc. from 2010 to 2019; oversaw BlackRock’s Strategic Partner Program and Strategic Product Management Group from 2012 to 2019; Member of the Board of Managers of BlackRock Investments, LLC from 2011 to 2018; Global Head of BlackRock’s Retail and iShares® businesses from 2012 to 2016. | | 123 RICs consisting of 261 Portfolios | | None |
John M. Perlowski(d) 1964 | | Trustee
(Since 2015); President and Chief Executive Officer
(Since 2010) | | Managing Director of BlackRock, Inc. since 2009; Head of BlackRock Global Accounting and Product Services since 2009; Advisory Director of Family Resource Network (charitable foundation) since 2009. | | 124 RICs consisting of 262 Portfolios | | None |
| (a) | The address of each Trustee is c/o BlackRock, Inc., 55 East 52nd Street, New York, New York 10055. |
| (b) | Each Independent Trustee holds office until his or her successor is duly elected and qualifies or until his or her earlier death, resignation, retirement, or removal as provided by the Trust’sby-laws or charter or statute, or until December 31 of the year in which he or she turns 75. Trustees who are “ interested persons,” as defined in the Investment Company Act serve until their successor is duly elected and qualifies or until their earlier death, resignation, retirement or removal as provided by the Trust’sby-laws and statute, or until December 31 of the year in which they turn 72. The Board may determine to extend the terms of Independent Trustee on acase-by-case basis, as appropriate. |
| (c) | Following the combination of Merrill Lynch Investment Managers, L.P. (“MLIM”) and BlackRock, Inc. in September 2006, the various legacy MLIM and legacy BlackRock fund boards were realigned and consolidated into three new fund boards in 2007. Certain Independent Trustees first become members of the boards of other legacy MLIM or legacy BlackRock funds as follows: Richard E. Cavanagh, 1994; Frank J. Fabozzi, 1988; R. Glenn Hubbard, 2004; W. Carl Kester, 1995; and Karen P. Robards, 1998. Certain other Independent Trustees became members of the boards of theclosed-end funds in the Fixed-Income Complex as follows: Michael J. Castellano, 2011; Cynthia L. Egan, 2016; and Catherine A. Lynch, 2016. |
| (d) | Dr. Fabozzi, Dr. Kester, Ms. Lynch and Mr. Perlowski are also trustees of the BlackRock Credit Strategies Fund. |
| (e) | Mr. Fairbairn and Mr. Perlowski are both “interested persons,” as defined in the 1940 Act, of the Trust based on their positions with BlackRock, Inc. and its affiliates. Mr. Fairbairn and Mr. Perlowski are also board members of the BlackRock Multi-Assets Complex. |
| | |
| 40 | | 2020 BLACKROCK ANNUAL REPORT TO SHAREHOLDERS |
Trustee and Officer Information (continued)
| | | | |
| Officers Who Are Not Trustees(a) |
| | | |
Name Year of Birth(b) | | Position(s) Held (Length of Service) | | Principal Occupation(s) During Past Five Years |
Jennifer McGovern 1977 | | Vice President
(Since 2014) | | Managing Director of BlackRock, Inc. since 2016; Director of BlackRock, Inc. from 2011 to 2015; Head of Product Development and Oversight for BlackRock’s Strategic Product Management Group since 2019; Head of Product Structure and Oversight for BlackRock’s U.S. Wealth Advisory Group from 2013 to 2019. |
Neal J. Andrews 1966 | | Chief Financial Officer
(Since 2007) | | Chief Financial Officer of the iShares® exchange traded funds from 2019 to 2020; Managing Director of BlackRock, Inc. since 2006. |
Jay M. Fife 1970 | | Treasurer
(Since 2007) | | Managing Director of BlackRock, Inc. since 2007. |
Charles Park 1967 | | Chief Compliance Officer
(Since 2014) | | Anti-Money Laundering Compliance Officer for certain BlackRock-advised Funds from 2014 to 2015; Chief Compliance Officer of BlackRock Advisors, LLC and the BlackRock-advised Funds in the BlackRock Multi-Asset Complex and the BlackRock Fixed-Income Complex since 2014; Principal of and Chief Compliance Officer for iShares® Delaware Trust Sponsor LLC since 2012 and BlackRock Fund Advisors (“BFA”) since 2006; Chief Compliance Officer for theBFA-advised iShares®exchange traded funds since 2006; Chief Compliance Officer for BlackRock Asset Management International Inc. since 2012. |
Lisa Belle 1968 | | Anti-Money Laundering Compliance Officer
(Since 2019) | | Managing Director of BlackRock, Inc. since 2019; Global Financial Crime Head for Asset and Wealth Management of JP Morgan from 2013 to 2019; Managing Director of RBS Securities from 2012 to 2013; Head of Financial Crimes for Barclays Wealth Americas from 2010 to 2012. |
Janey Ahn 1975 | | Secretary
(Since 2019) | | Managing Director of BlackRock, Inc. since 2018; Director of BlackRock, Inc. from 2009 to 2017. |
| (a) | The address of each Officer is c/o BlackRock, Inc., 55 East 52nd Street, New York, New York 10055. |
| (b) | Officers of the Trust serve at the pleasure of the Board. |
Further information about the Trust’s Trustees and Officers is available in the Trust’s Statement of Additional Information, which can be obtained without charge by calling (800)441-7762.
Effective February 19, 2020, Henry Gabbay resigned as a Trustee of the Trust.
Investment Adviser
BlackRock Advisors, LLC
Wilmington, DE 19809
Accounting Agent
JPMorgan Chase Bank, N.A.
New York, NY 10179
Custodian
JPMorgan Chase Bank, N.A.
New York, NY 10179
Transfer Agent
BNY Mellon Investment Servicing (US) Inc.
Wilmington, DE 19809
Independent Registered Public Accounting Firm
Deloitte & Touche LLP
Boston, MA 02116
Distributor
BlackRock Investments, LLC
New York, NY 10022
Legal Counsel
Willkie Farr & Gallagher LLP
New York, NY 10019
Address of the Trust
100 Bellevue Parkway
Wilmington, DE 19809
| | | | |
| TRUSTEEAND OFFICER INFORMATION | | | 41 | |
Additional Information
General Information
Householding
The Fund will mail only one copy of shareholder documents, including prospectuses, annual and semi-annual reports and proxy statements, to shareholders with multiple accounts at the same address. This practice is commonly called “householding” and is intended to reduce expenses and eliminate duplicate mailings of shareholder documents. Mailings of your shareholder documents may be householded indefinitely unless you instruct us otherwise. If you do not want the mailing of these documents to be combined with those for other members of your household, please call the Fund at (800)441-7762.
Availability of Quarterly Schedule of Investments
The Fund files its complete schedule of portfolio holdings with the SEC for the first and third quarters of each fiscal year as an exhibit to its reports on FormN-PORT, and for reporting periods ended prior to March 31, 2019, filed such information on FormN-Q. The Fund’s FormsN-PORT andN-Q are available on the SEC’s website at sec.gov. The Fund’s FormN-Q may also be obtained upon request and without charge by calling (800)441-7762.
Availability of Proxy Voting Policies and Procedures
A description of the policies and procedures that the Fund uses to determine how to vote proxies relating to portfolio securities is available upon request and without charge (1) by calling (800)441-7762; (2) atblackrock.com; and (3) on the SEC’s website at sec.gov.
Availability of Proxy Voting Record
Information about how the Fund voted proxies relating to securities held in the Fund’s portfolio during the most recent12-month period ended June 30 is available upon request and without charge (1) atblackrock.com; or by calling (800)441-7762 and (2) on the SEC’s website at sec.gov.
BlackRock’s Mutual Fund Family
BlackRock offers a diverse lineup ofopen-end mutual funds crossing all investment styles and managed by experts in equity, fixed-income andtax-exempt investing. Visitblackrock.com for more information.
Shareholder Privileges
Account Information
Call us at (800)441-7762 from 8:00 AM to 6:00 PM ET on any business day to get information about your account balances, recent transactions and share prices. You can also visitblackrock.com for more information.
Automatic Investment Plans
Investor class shareholders who want to invest regularly can arrange to have $50 or more automatically deducted from their checking or savings account and invested in any of the BlackRock funds.
Systematic Withdrawal Plans
Investor class shareholders can establish a systematic withdrawal plan and receive periodic payments of $50 or more from their BlackRock funds, as long as their account balance is at least $10,000.
Retirement Plans
Shareholders may make investments in conjunction with Traditional, Rollover, Roth, Coverdell, Simple IRAs, SEP IRAs and 403(b) Plans.
| | |
| 42 | | 2020 BLACKROCK ANNUAL REPORT TO SHAREHOLDERS |
Additional Information (continued)
BlackRock Privacy Principles
BlackRock is committed to maintaining the privacy of its current and former fund investors and individual clients (collectively, “Clients”) and to safeguarding theirnon-public personal information. The following information is provided to help you understand what personal information BlackRock collects, how we protect that information and why in certain cases we share such information with select parties.
If you are located in a jurisdiction where specific laws, rules or regulations require BlackRock to provide you with additional or different privacy-related rights beyond what is set forth below, then BlackRock will comply with those specific laws, rules or regulations.
BlackRock obtains or verifies personalnon-public information from and about you from different sources, including the following: (i) information we receive from you or, if applicable, your financial intermediary, on applications, forms or other documents; (ii) information about your transactions with us, our affiliates, or others; (iii) information we receive from a consumer reporting agency; and (iv) from visits to our websites.
BlackRock does not sell or disclose tonon-affiliated third parties anynon-public personal information about its Clients, except as permitted by law or as is necessary to respond to regulatory requests or to service Client accounts. Thesenon-affiliated third parties are required to protect the confidentiality and security of this information and to use it only for its intended purpose.
We may share information with our affiliates to service your account or to provide you with information about other BlackRock products or services that may be of interest to you. In addition, BlackRock restricts access tonon-public personal information about its Clients to those BlackRock employees with a legitimate business need for the information. BlackRock maintains physical, electronic and procedural safeguards that are designed to protect thenon-public personal information of its Clients, including procedures relating to the proper storage and disposal of such information.
| | | | |
| ADDITIONAL INFORMATION | | | 43 | |
Glossary of Terms Used in this Report
| | |
| Currency | | |
| |
| USD | | United States Dollar |
Portfolio Abbreviations
| | |
| CMBX | | Commercial Mortgage-Backed Securities Index |
| CSMC | | Credit Suisse Mortgage Capital |
| CWABS | | Countrywide Asset-Backed Certificates |
| LIBOR | | London Interbank Offered Rate |
| OTC | | Over-the-counter |
| TBA | | To-be-announced |
| | |
| 44 | | 2020 BLACKROCK ANNUAL REPORT TO SHAREHOLDERS |
Want to know more?
blackrock.com | 800-441-7762
This report is intended for current holders. It is not authorized for use as an offer of sale or a solicitation of an offer to buy shares of the Fund unless preceded or accompanied by the Fund’s current prospectus. Past performance results shown in this report should not be considered a representation of future performance. Investment returns and principal value of shares will fluctuate so that shares, when redeemed, may be worth more or less than their original cost. Statements and other information herein are as dated and are subject to change.
MAS-04/20-AR
| Item 2 – | Code of Ethics – The registrant (or the “Fund”) has adopted a code of ethics, as of the end of the period covered by this report, applicable to the registrant’s principal executive officer, principal financial officer, principal accounting officer or controller, or persons performing similar functions. During the period covered by this report, the code of ethics was amended to update certain information and to make othernon-material changes. During the period covered by this report, there have been no waivers granted under the code of ethics. The registrant undertakes to provide a copy of the code of ethics to any person upon request, without charge, who calls1-800-441-7762. |
| Item 3 – | Audit Committee Financial Expert – The registrant’s board of trustees (the “board of trustees”), has determined that (i) the registrant has the following audit committee financial experts serving on its audit committee and (ii) each audit committee financial expert is independent: |
Michael Castellano
Frank J. Fabozzi
Catherine A. Lynch
Karen P. Robards
The registrant’s board of trustees has determined that Karen P. Robards qualifies as an audit committee financial expert pursuant to Item 3(c)(4) of FormN-CSR.
Ms. Robards has a thorough understanding of generally accepted accounting principles, financial statements and internal control over financial reporting as well as audit committee functions. Ms. Robards has been President of Robards & Company, a financial advisory firm, since 1987. Ms. Robards was formerly an investment banker for more than 10 years where she was responsible for evaluating and assessing the performance of companies based on their financial results. Ms. Robards has over 30 years of experience analyzing financial statements. She also is a member of the audit committee of one publicly held company and anon-profit organization.
Under applicable securities laws, a person determined to be an audit committee financial expert will not be deemed an “expert” for any purpose, including without limitation for the purposes of Section 11 of the Securities Act of 1933, as a result of being designated or identified as an audit committee financial expert. The designation or identification as an audit committee financial expert does not impose on such person any duties, obligations, or liabilities greater than the duties, obligations, and liabilities imposed on such person as a member of the audit committee and board of trustees in the absence of such designation or identification. The designation or identification of a person as an audit committee financial expert does not affect the duties, obligations, or liability of any other member of the audit committee or board of trustees.
| Item 4 – | Principal Accountant Fees and Services |
The following table presents fees billed by Deloitte & Touche LLP (“D&T”) in each of the last two fiscal years for the services rendered to the Fund:
| | | | | | | | | | | | | | | | |
| | | (a) Audit Fees | | (b) Audit-Related Fees1 | | (c) Tax Fees2 | | (d) All Other Fees |
| Entity Name | | Current Fiscal Year End | | Previous Fiscal Year End | | Current Fiscal Year End | | Previous Fiscal Year End | | Current Fiscal Year End | | Previous Fiscal Year End | | Current Fiscal Year End | | Previous Fiscal Year End |
| BlackRock U.S. Mortgage Portfolio | | $31,824 | | $31,824 | | $38 | | $0 | | $15,000 | | $15,400 | | $0 | | $0 |
2
The following table presents fees billed by D&T that were required to be approved by the registrant’s audit committee (the “Committee”) for services that relate directly to the operations or financial reporting of the Fund and that are rendered on behalf of BlackRock Advisors, LLC ( the “Investment Adviser” or “BlackRock”) and entities controlling, controlled by, or under common control with BlackRock (not including anysub-adviser whose role is primarily portfolio management and is subcontracted with or overseen by another investment adviser) that provide ongoing services to the Fund (“Affiliated Service Providers”):
| | | | |
| | | Current Fiscal Year End | | Previous Fiscal Year End |
| (b) Audit-Related Fees1 | | $0 | | $0 |
| (c) Tax Fees2 | | $0 | | $0 |
| (d) All Other Fees3 | | $1,984,000 | | $2,050,500 |
1 The nature of the services includes assurance and related services reasonably related to the performance of the audit or review of financial statements not included in Audit Fees, including accounting consultations, agreed-upon procedure reports, attestation reports, comfort letters,out-of-pocket expenses and internal control reviews not required by regulators.
2 The nature of the services includes tax compliance and/or tax preparation, including services relating to the filing or amendment of federal, state or local income tax returns, regulated investment company qualification reviews, taxable income and tax distribution calculations.
3Non-audit fees of $1,984,000 and $2,050,500 for the current fiscal year and previous fiscal year, respectively, were paid to the Fund’s principal accountant in their entirety by BlackRock, in connection with services provided to the Affiliated Service Providers of the Fund and of certain other funds sponsored and advised by BlackRock or its affiliates for a service organization review and an accounting research tool subscription. These amounts represent aggregate fees paid by BlackRock and were not allocated on a per fund basis.
(e)(1) Audit CommitteePre-Approval Policies and Procedures:
The Committee has adopted policies and procedures with regard to thepre-approval of services. Audit, audit-related and tax compliance services provided to the registrant on an annual basis require specificpre-approval by the Committee. The Committee also must approve othernon-audit services provided to the registrant and thosenon-audit services provided to the Investment Adviser and Affiliated Service Providers that relate directly to the operations and the financial reporting of the registrant. Certain of thesenon-audit services that the Committee believes are (a) consistent with the SEC’s auditor independence rules and (b) routine and recurring services that will not impair the independence of the independent accountants may be approved by the Committee without consideration on a specificcase-by-case basis (“generalpre-approval”). The term of any generalpre-approval is 12 months from the date of thepre-approval, unless the Committee provides for a different period. Tax or othernon-audit services provided to the registrant which have a direct impact on the operations or financial reporting of the registrant will only be deemedpre-approved provided that any individual project does not exceed $10,000 attributable to the registrant or $50,000 per project. For this purpose, multiple projects will be aggregated to determine if they exceed the previously mentioned cost levels.
Any proposed services exceeding thepre-approved cost levels will require specificpre-approval by the Committee, as will any other services not subject to generalpre-approval (e.g., unanticipated but permissible services). The Committee is informed of each service approved subject to generalpre-approval at the next regularly scheduledin-person board meeting. At this meeting, an analysis of such services is presented to the Committee for ratification. The Committee may delegate to the Committee Chairman the authority to approve the provision of and fees for any specific engagement of permittednon-audit services, including services exceedingpre-approved cost levels.
3
(e)(2) None of the services described in each of Items 4(b) through (d) were approved by the Committee pursuant to the de minimis exception in paragraph (c)(7)(i)(C) of Rule2-01 of RegulationS-X.
(f) Not Applicable
(g) The aggregatenon-audit fees, defined as the sum of the fees shown under “Audit-Related Fees,” “Tax Fees” and “All Other Fees,” paid to the accountant for services rendered by the accountant to the registrant, the Investment Adviser and the Affiliated Service Providers were:
| | | | | | | | |
| | | Entity Name | | Current Fiscal Year End | | Previous Fiscal Year End | | |
| | BlackRock U.S. Mortgage Portfolio | | $15,038 | | $15,400 |
Additionally, the amounts billed by D&T in connection with services provided to the Affiliated Service Providers of the Fund and of other funds sponsored and advised by BlackRock or its affiliates during the current and previous fiscal years for a service organization review and an accounting research tool subscription were:
| | | | | | |
| | | Current Fiscal Year End | | Previous Fiscal Year End | | |
| | $1,984,000 | | $2,050,500 |
These amounts represent aggregate fees paid by BlackRock and were not allocated on a per fund basis.
(h) The Committee has considered and determined that the provision ofnon-audit services that were rendered to the Investment Adviser and the Affiliated Service Providers that were notpre-approved pursuant to paragraph (c)(7)(ii) of Rule2-01 of RegulationS-X is compatible with maintaining the principal accountant’s independence.
| Item 5 – | Audit Committee of Listed Registrant – Not Applicable |
(a) The registrant’s Schedule of Investments is included as part of the Report to Stockholders filed under Item 1 of this Form.
(b) Not Applicable due to no such divestments during the semi-annual period covered since the previous FormN-CSR filing.
| Item 7 – | Disclosure of Proxy Voting Policies and Procedures forClosed-End Management Investment Companies – Not Applicable |
| Item 8 – | Portfolio Managers ofClosed-End Management Investment Companies – Not Applicable |
4
| Item 9 – | Purchases of Equity Securities byClosed-End Management Investment Company and Affiliated Purchasers – Not Applicable |
| Item 10 – | Submission of Matters to a Vote of Security Holders – There have been no material changes to these procedures. |
| Item 11 – | Controls and Procedures |
(a) The registrant’s principal executive and principal financial officers, or persons performing similar functions, have concluded that the registrant’s disclosure controls and procedures (as defined in Rule30a-3(c) under the Investment Company Act of 1940, as amended (the “1940 Act”)) are effective as of a date within 90 days of the filing of this report based on the evaluation of these controls and procedures required by Rule30a-3(b) under the 1940 Act and Rule 15d-15(b) under the Securities Exchange Act of 1934, as amended.
(b) There were no changes in the registrant’s internal control over financial reporting (as defined in Rule30a-3(d) under the 1940 Act) that occurred during the period covered by this report that have materially affected, or are reasonably likely to materially affect, the registrant’s internal control over financial reporting.
Item 12 – Disclosure of Securities Lending Activities forClosed-End Management Investment Companies – Not Applicable
Item 13 – Exhibits attached hereto
(a)(1) Code of Ethics – See Item 2
(a)(2) Section 302 Certifications are attached
(a)(3) Not Applicable
(a)(4) Not Applicable
(b) Section 906 Certifications are attached
5
Pursuant to the requirements of the Securities Exchange Act of 1934 and the Investment Company Act of 1940, the registrant has duly caused this report to be signed on its behalf by the undersigned, thereunto duly authorized.
| | |
| Managed Account Series II |
| |
| By: | | /s/ John M. Perlowski |
| | John M. Perlowski |
| | Chief Executive Officer (principal executive officer) of |
| | Managed Account Series II |
Date: July 2, 2020
Pursuant to the requirements of the Securities Exchange Act of 1934 and the Investment Company Act of 1940, this report has been signed below by the following persons on behalf of the registrant and in the capacities and on the dates indicated.
| | |
| By: | | /s/ John M. Perlowski |
| | John M. Perlowski |
| | Chief Executive Officer (principal executive officer) of |
| | Managed Account Series II |
Date: July 2, 2020
| | |
| By: | | /s/ Neal J. Andrews |
| | Neal J. Andrews |
| | Chief Financial Officer (principal financial officer) of |
| | Managed Account Series II |
Date: July 2, 2020
6