UNITED STATES
SECURITIES AND EXCHANGE COMMISSION
Washington, D.C. 20549
FORM 10-K
| | | | | |
| ☒ | ANNUAL REPORT PURSUANT TO SECTION 13 OR 15(d) OF THE SECURITIES EXCHANGE ACT OF 1934 |
| For the fiscal year ended December 29, 2024 |
| OR |
| ☐ | TRANSITION REPORT PURSUANT TO SECTION 13 OR 15(d) OF THE SECURITIES EXCHANGE ACT OF 1934 For the transition period from to |
Commission file number: 001-38686
Utz Brands, Inc.
(Exact name of registrant as specified in its charter)
| | | | | | | | | | | |
| Delaware | | | 85-2751850 |
(State or other jurisdiction
of incorporation) | | | (IRS Employer
Identification No.) |
900 High Street
Hanover, PA 17331
(Address of principal executive offices, including zip code)
Registrant’s telephone number, including area code: (717) 637-6644
Securities registered pursuant to Section 12(b) of the Act:
| | | | | | | | | | | | | | |
| Title of each class | | Trading Symbol(s) | | Name of each exchange on which registered |
| Class A Common Stock, par value $0.0001 per share | | UTZ | | New York Stock Exchange |
Securities registered pursuant to section 12(g) of the Act:
None.
Indicate by check mark if the registrant is a well-known seasoned issuer, as defined in Rule 405 of the Securities Act.
Yes ⌧ No ◻
Indicate by check mark if the registrant is not required to file reports pursuant to Section 13 or Section 15(d) of the Act.
Yes ◻ No ⌧
Indicate by check mark whether the registrant (1) has filed all reports required to be filed by Section 13 or 15(d) of the Securities Exchange Act of 1934 during the preceding 12 months (or for such shorter period that the registrant was required to file such reports), and (2) has been subject to such filing requirements for the past 90 days. Yes ⌧ No ◻
Indicate by check mark whether the registrant has submitted electronically every Interactive Data File required to be submitted pursuant to Rule 405 of Regulation S-T (§ 232.405 of this chapter) during the preceding 12 months (or for such shorter period that the registrant was required to submit such files). Yes ⌧ No ◻
Indicate by check mark whether the registrant is a large accelerated filer, an accelerated filer, a non-accelerated filer, smaller reporting company, or an emerging growth company. See the definitions of “large accelerated filer,” “accelerated filer,” “smaller reporting company,” and “emerging growth company” in Rule 12b-2 of the Exchange Act.
| | | | | | | | | | | |
| | | |
| Large accelerated filer | ☒ | Accelerated filer | ☐ |
| Non-accelerated filer | ☐ | Smaller reporting company | ☐ |
| Emerging growth company | ☐ | | |
If an emerging growth company, indicate by check mark if the registrant has elected not to use the extended transition period for complying with any new or revised financial accounting standards provided pursuant to Section 13(a) of the Exchange Act.☐
Indicate by check mark whether the registrant has filed a report on and attestation to its management’s assessment of the effectiveness of its internal control over financial reporting under Section 404(b) of the Sarbanes-Oxley Act (15 U.S.C. 7262(b)) by the registered public accounting firm that prepared or issued its audit report. x
If securities are registered pursuant to Section 12(b) of the Act, indicate by check mark whether the financial statements of the registrant included in the filing reflect the correction of an error to previously issued financial statements. ☐
Indicated by check mark whether any of those error corrections are restatements that required a recovery analysis of incentive-based compensation received by any of the registrant's executive officers during the relevant recovery periods pursuant to §240.10D-1(b). ☐
Indicate by check mark whether the registrant is a shell company (as defined in Rule 12b-2 of the Exchange Act). Yes ☐ No ⌧
The aggregate market value of the Common Stock held by non-affiliates was $1,115.8 million, as of June 28, 2024.
As of February 18, 2025, 86,061,319 Class A Common Stock, par value $0.0001 per share, and 55,349,000 Class V Common Stock, par value $0.0001 per share, were issued and outstanding.
Documents Incorporated by Reference:
Portions of the registrant’s definitive proxy statement for the registrant’s 2025 annual meeting (the “2025 Proxy Statement”), to be filed within 120 days after the close of the registrant’s fiscal year, are incorporated by reference into Part III of this Annual Report on Form 10-K. Except with respect to information specifically incorporated by reference into the Annual Report, the 2025 Proxy Statement shall not be deemed to be filed as part hereof.
| | | | | | | | |
| Table of Contents |
| | |
| | Page |
| Part I | | |
| Item 1. | | |
| Item 1A. | | |
| Item 1B. | | |
| Item 1C. | | |
| Item 2. | | |
| Item 3. | | |
| Item 4. | | |
| | |
| Part II | | |
| Item 5. | | |
| Item 6. | | |
| Item 7. | | |
| Item 7A. | | |
| Item 8. | | |
| Item 9. | | |
| Item 9A. | | |
| Item 9B. | | |
| Item 9C. | | |
| | |
| Part III | | |
| Item 10. | | |
| Item 11. | | |
| Item 12. | | |
| Item 13. | | |
| Item 14. | | |
| | |
| Part IV | | |
| Item 15. | | |
| Item 16. | | |
CAUTIONARY NOTE REGARDING FORWARD-LOOKING STATEMENTS
This Annual Report on Form 10-K for Utz Brands, Inc. (together with its consolidated subsidiaries, the “Company”) contains “forward-looking statements” within the meaning of the “safe harbor” provisions of the Private Securities Litigation Reform Act of 1995. These forward-looking statements relate to expectations for future financial performance, business strategies or expectations for the Company’s business. Specifically, forward-looking statements may include statements relating to:
•The Company's future financial position, capital structure, indebtedness, business strategy, opportunities and plans and objectives of management for future operations, including with respect to promotional activities and efforts to build sustainable long-term demand for the Company's products;
•The benefits of the Company's acquisitions, dispositions and similar transactions;
•The likelihood of the Company completing contemplated acquisitions, dispositions and similar transactions;
•The future operating and financial performance of the Company;
•Expansion plans and opportunities;
•Cost savings plans and network optimization strategies;
•Transformation of the Company’s supply chain;
•The Company’s product mix;
•The Company’s ability to reduce debt and anticipated interest expense savings;
•The Company’s cost savings plans and logistics optimization efforts;
•The effects of inflation or supply chain disruptions on the Company or its business;
•The benefits of the Company’s productivity initiatives;
•The effects of the Company’s marketing and innovation initiatives; and
•Other statements preceded by, followed by or that include the words “may,” “can,” “should,” “will,” “estimate,” “plan,” “project,” "forecast,” "intend,” "expect,” “anticipate,” “believe,” “seek,” "target” or similar expressions.
These forward-looking statements are based on information available as of the date of this Annual Report on Form 10-K, reflect the Company management’s current expectations, forecasts and assumptions, and involve a number of judgments regarding known and unknown risks, uncertainties, and other factors, many of which are outside the control of the Company and its directors, officers and affiliates. Accordingly, forward-looking statements should not be relied upon as representing the Company’s views as of any subsequent date. The Company does not undertake any obligation to update, add or to otherwise correct any forward-looking statements contained herein to reflect events or circumstances after the date they were made, whether as a result of new information, future events, inaccuracies that become apparent after the date hereof or otherwise, except as may be required under applicable securities laws.
As a result of a number of known and unknown risks and uncertainties, the Company’s results or performance may be materially different from those expressed or implied by these forward-looking statements. Some factors that could cause actual results to differ are set forth under the heading “Risk Factor Summary” below and those described under Part I, Item 1A “Risk Factors” of this Annual Report on Form 10-K.
RISK FACTOR SUMMARY
The Company’s business involves significant risks and uncertainties that make an investment in it speculative and risky. The following is a summary list of the principal risk factors that could materially and adversely affect the Company’s business, financial condition, liquidity and results of operations. These are not the only risks and uncertainties the Company faces, and you should carefully review and consider the full discussion of the Company’s risk factors in the section titled “Risk Factors”, together with the other information in this Annual Report on Form 10-K.
Risks Related to Our Business
•We operate in the highly competitive and increasingly consolidated snack food industry. This consolidation, in tandem with our reliance on key customers and a rise in hard discounters, may limit our ability to obtain favorable contractual terms and protections with customers and maintain our profitability.
•Demand for our products may be adversely affected by changes in consumer preferences and tastes or if we are unable to innovate or market our products effectively. Relatedly, consumers’ loyalty to our brands may change due to factors beyond our control.
•Our reputation or brand image might be impacted as a result of issues or concerns relating to the quality and safety of our products, ingredients or packaging, processing techniques, which in turn could negatively impact our operating results. If our products become adulterated or are mislabeled, we might need to recall those items, and we may experience product liability claims and related losses, as well as damage to our reputation.
•Changes in retail distribution arrangements can result in the loss of retail shelf space and disrupt sales of food products, causing our sales to fall.
•Our DTW delivery network system relies on a significant number of brokers, wholesalers and logistics companies, and our DSD network system and regional third-party distributor network relies on a significant number of independent operators and third-party distributors, and such reliance could affect our ability to effectively and profitably distribute and market products, maintain existing markets and expand business into other geographic markets.
•The evolution of e-commerce retailers and sales channels may adversely affect us.
•Disruption to our manufacturing operations, supply chain or distribution channels could impair our ability to produce or deliver finished products and negatively impact our operating results.
•Our results of operations and profitability may continue to be adversely affected by inflation, including from rising labor costs and the effects of shortages of raw materials, energy, water and other supplies.
•All of our products must be compliant with laws and regulations promulgated by various governmental authorities, and changes in the legal and regulatory environment could limit our business activities, increase our operating costs, reduce demand for our products or result in litigation or other regulatory action. Additionally, potential liabilities and costs from litigation, claims, legal or regulatory proceedings, inquiries or investigations can have an adverse impact.
•We may not be successful in implementing our growth strategy.
•We may be unable to successfully identify and execute acquisitions or dispositions or to successfully integrate acquisitions or carve out dispositions.
•The geographic concentration of our markets may adversely impact us if we are unable to effectively diversify the markets in which we participate.
•We may not be able to attract and retain the highly skilled people we need to support our business.
•Impairment in the carrying value of goodwill or other intangible assets could have an adverse impact on our results.
•Our intellectual property rights are valuable, and any inability to protect them could reduce the value of our products and brands. However, if consumers do not identify with our trademarks or other intellectual property rights, our brand may be significantly and adversely impaired.
•Disruptions, failures or security breaches of our information technology infrastructure could have a negative impact on our operations and subject us to significant losses.
•Climate change or legal, regulatory or market measures to address climate change may negatively affect our business and operations or damage our reputation, and liabilities, claims or new laws or regulations with respect to environmental matters could have a significant negative impact on our business.
•We are subject to increasing focus on ESG issues, including those related to climate change, and any perceived failure by us to meet ESG initiatives may negatively impact our business.
•Our debt instruments contain covenants that impose restrictions on our operations that may adversely affect our ability to operate our business if we fail to meet those covenants or otherwise suffer a default thereunder. Additionally, changes in interest rates may adversely affect our earnings and/or cash flows.
•Any disruptions in the worldwide financial markets may materially and adversely affect our ability to obtain new credit.
•The imposition or proposed imposition of new or increased income or product taxes can adversely affect us.
•Pandemics, epidemics or other disease outbreaks may change or disrupt consumption patterns, supply chains, and production processes, which could materially affect our operations and results of operations.
•We are subject to risks from changes to the trade policies and tariff and import/export regulations by the U.S. and/or other foreign governments.
Risks Related to the Ownership of our Securities
•Resales of shares of our Class A Common Stock could affect the market price of our Class A Common Stock.
•We are a holding company dependent upon distributions made by our subsidiaries to pay taxes, make payments under the TRA (as defined below) and pay dividends.
•Pursuant to the TRA, we are required to make certain payments to certain noncontrolling interest holders of UBH ("Noncontrolling Interest Holders"), and those payments may be substantial. In certain cases, payments under the TRA may exceed the actual tax benefits we realize or be accelerated.
•Delaware law, the Certificate of Incorporation, the Bylaws and certain other agreements contain certain provisions, including anti-takeover provisions, that limit the ability of stockholders to take certain actions and could delay or discourage takeover attempts.
•The Certificate of Incorporation designates the Court of Chancery of the State of Delaware as the sole and exclusive forum for certain types of actions and proceedings that may be initiated by our stockholders.
•Certain of our significant stockholders and UBH members whose interests may differ from those of our other stockholders have the ability to significantly influence our business and management.
•Our private placement warrants may have an adverse effect on the market price of our Class A Common Stock, and the valuation of our private placement warrants could increase the volatility in our earnings results.
PART I
Item 1. Business
Unless the context otherwise requires, all references in this Annual Report on Form 10-K to the “Company,” “we,” “us” or "our” refer to Utz Brands, Inc. and its consolidated subsidiaries. Our core geographies consist of Alabama, Connecticut, Delaware, Louisiana, Maine, Maryland, Massachusetts, Mississippi, New Hampshire, New Jersey, New York, North Carolina, Ohio, Pennsylvania, Rhode Island, South Carolina, Virginia, Vermont, West Virginia, and Washington (our “Core Geographies”), with the rest of the U.S. representing our Expansion geographies (our “Expansion Geographies”).
Overview
We are a leading United States manufacturer of branded salty snacks. We produce a broad offering of salty snacks, including potato chips, tortilla chips, pretzels, cheese snacks, pork skins, pub/party mixes, and other snacks. Our iconic portfolio of authentic, craft, and “better-for-you” (“BFY”) brands, which includes Utz, Zapp’s, On The Border, Golden Flake, and Boulder Canyon, among others, enjoys strong household penetration in the United States, where our products can be found in approximately half of U.S. households as of December 29, 2024. We are the second-largest producer of branded salty snacks in our Core Geographies as of December 29, 2024, based on retail sales, and we have historically expanded our geographic/distribution reach and product portfolio organically and through acquisitions. We were founded in 1921 in Hanover, Pennsylvania, and benefit from more than 100 years of brand awareness and heritage in the salty snack industry.
As of December 29, 2024, we operate eight primary manufacturing facilities with a broad range of capabilities, and our products are distributed nationally to grocery, mass, club, convenience, drug, e-commerce and other retailers through direct shipments, distributors, and approximately 2,500 DSD routes.
Our business benefits from multiple opportunities to deliver attractive long-term profitable growth. Our value creation strategies are focused on driving productivity to enhance margins, reinvesting in marketing and innovation to accelerate revenue growth and continuing to make strategic acquisitions. We believe we are well-positioned for long-term growth in the salty snack industry as we (a) gained a significant amount of new buyers over the past several years, (b) have significant opportunity in our Expansion Geographies and under-penetrated channels, (c) continue to execute productivity efforts that we believe will help to fuel incremental marketing and innovation to accelerate growth in sales relative to our peers, (d) continue to make infrastructure improvements to enable us to continue to scale to greater heights, and (e) continue to make strategic acquisitions that deliver strong synergies and that enhance our competitive positioning. We believe each of these growth avenues represents a sizeable opportunity to expand our net sales. In addition, we further anticipate expanding our margins over the long term through supply chain productivity, revenue management, a higher-margin product mix, and higher margins on incremental sales as we leverage our scalable existing platform.
Recent Acquisitions and Dispositions
The Company has focused on increasing manufacturing and streamlining distribution. In April 2022, the Company purchased a brand new, recently completed snack food manufacturing facility in Kings Mountain, North Carolina from Evans Food Group Ltd. d/b/a Benestar Brands and related affiliates. The Company paid the full cash purchase price of $38.4 million at the closing and concurrently with the facility purchase, the Company sold 2.1 million shares of the Company’s Class A Common Stock for $28.0 million, to affiliates of Benestar in a private placement pursuant to Section 4(a)(2) of the Securities Act of 1933, as amended (the "Securities Act"). During fiscal years 2022, 2023 and 2024, the Company bought out and terminated the contracts of multiple distributors who had previously been providing services to the Company. These transactions were accounted for as asset purchases and contract terminations, respectively, and resulted in expense of $23.0 million, $1.5 million and $2.1 million for the fiscal years ended January 1, 2023, December 31, 2023 and December 29,2024, respectively.
On February 5, 2024, the Company sold certain assets and brands to affiliates of Our Home™, an operating company of BFY brands (“Our Home”). Under the agreement, affiliates of Our Home purchased the Good Health and R.W. Garcia brands, the Lincolnton, NC and Lititz, PA manufacturing facilities and certain related assets, and assumed the Company’s Las Vegas, NV facility lease and manufacturing operations (the "Good Health and R.W. Garcia Sale"), for $167.5 million, subject to customary adjustments.
On April 22, 2024, the Company sold to Our Home its Berlin, PA and Fitchburg, MA manufacturing facilities and certain related assets, including certain inventory (the “Manufacturing Facilities Sale”). The total consideration for the Manufacturing Facilities Sale was $18.5 million, subject to customary adjustments.
The Company and Our Home are operating under transition services agreements related to each of the Good Health and R,W. Garcia Sale and the Manufacturing Facility Sale, which are scheduled to expire during the first half of 2025. In addition, the parties will operate under reciprocal co-manufacturing agreements pursuant to which Our Home will co-manufacture certain of the Company's products and the Company will co-manufacture certain Good Health products. Certain Good Health products will continue to be distributed and sold on the Company's DSD network for Our Home pursuant to a distribution agreement. The Company received approximately $18.7 million in advance from Our Home for certain terms under these agreements, which the Company will recognize through income from operations over the terms of the transition services and co-manufacturing agreements. See Note 2. Divestitures, to our audited consolidated financial statements included under Part II, Item 8 of this Annual Report on Form 10-K (our "Audited Financial Statements"), for further discussion.
During the fiscal year ended December 29, 2024, the Company paid $9.2 million to purchase an indefinite life intangible right for use of a third-party brand name. This intangible is classified as an indefinite life trade name. See Note 5. Goodwill and Intangible Assets, Net to our Audited Financial Statements.
Growth Strategy
We have a long-term growth strategy focusing on various initiatives. Our portfolio strategy is focused on accelerating investments in marketing and innovation to drive top-line growth and achieve share gains in the Salty Snack category. We plan to further penetrate our Expansion Geographies and untapped channels and customers by further expanding our Branded Salty Snacks in Expansion Geographies, as well as maintaining our share in our Core Geographies. We plan to transform our supply chain into a more cost-efficient and flexible system. As part of our long-term growth strategy, we intend to enhance our DSD system of IOs to further improve execution and generate higher returns and strengthen other organizational capabilities while driving out costs. Additionally, we intend to improve our balance sheet flexibility by accelerating cash generation and maintaining a disciplined capital allocation approach, which will reduce leverage while opportunistically pursuing strategic acquisitions and dispositions.
Brands
Our business is managed and reported in one operating segment due to the similar nature of all of the products that the Company sells, the functional alignment of the Company's organizational structure, and the reports that are regularly reviewed by the chief operating decision maker (the “CODM”) for the purpose of assessing performance and allocating resources. However, we strategically manage our portfolio of brands by segregating our sole operating segment into Branded Salty Snacks and Non-Branded & Non-Salty Snacks. Branded Salty Snacks, in aggregate, enjoy a combination of higher growth and margins, greater potential for value-added innovation, and enhanced responsiveness to consumer marketing as compared to Non-Branded & Non-Salty Snacks. As a result, we focus our investment spending and brand-building activities on Branded Salty Snacks while managing Non-Branded & Non-Salty Snacks for cash flow generation to support investment in Branded Salty Snacks and fund other corporate priorities. We periodically assess the designation of brands within these segregations and reclassify brands based on their alignment with the criteria above.
Branded Salty Snacks
Our Branded Salty Snacks are comprised of our Power Four Brands, consisting of our flagship Utz® brand, On The Border®, Zapp’s®, and Boulder Canyon®, along with our Other Brands, including Golden Flake®, TORTIYAHS!®, Hawaiian®, Bachman®, Tim’s Cascade®, Dirty Potato Chips®, TGI Fridays®, and Vitner's®.
Our flagship Utz brand generated retail sales in excess of $850 million in 2024, representing an approximate 7.1% compound annual growth rate ("CAGR") (during 2020 through 2024) and making it one of the 10 largest salty snack brands in the United States by retail sales as of December 29, 2024. Recognized for its iconic logo featuring the “Little Utz Girl” since the 1920s, the Utz brand currently uses the slogan "Family Crafted Flavor Since 1921”. We sell a variety of salty snacks under the Utz brand, including potato chips, pretzels, cheese snacks, pub/party mixes, and seasonal favorites.
Our On The Border brand ("OTB") is a national brand of tortilla chips, salsa and queso. OTB is the #2 unflavored tortilla chip brand in the United States based on annual sales for the fiscal year ended December 29, 2024. The acquisition of OTB strengthened our national geographic footprint, particularly in our Expansion Geographies, and enhanced our presence in the Mass and Club retail channels.
Our Boulder Canyon brand anchors our position in the BFY category of salty snacking, which has been a high-growth category in recent years. Boulder Canyon offers a line of premium BFY potato chips, including those made with olive or avocado oils. In the Natural channel as defined by SPINS, LLC, Boulder Canyon is the #2 potato chip brand, growing 32.7% within the channel in 2024, its “Canyon Cut” rippled avocado oil-based kettle-style chip is the #1 selling salty snack item as of December 29, 2024.
Our Zapp’s brand offers a line of premium kettle-cooked potato chips with bold, authentic flavors steeped in its New Orleans roots, including “Voodoo,” “Hotter ‘N’ Hot Jalapeño,” “Spicy Cajun Crawtators,” and "Cajun Dill Gator-tators,” among others.
Our Other Brands also includes others such as: Hawaiian and Golden Flake pork skins. Hawaiian is a premium kettle chip brand that evokes the feel of the Pacific islands, with exotic flavors like “Sweet Maui Onion,” "Luau BBQ,” "Mango Habanero,” and "Hulapeño.” Our Golden Flake brand, a part of Southern culture since 1923, has a full line of Southern-style pork skins with flavors like “Louisiana Hot Sauce” and "Sweet Heat Barbecue,” which offer great taste and crunch with low carbohydrates.
Non-Branded & Non-Salty Snacks
In fiscal year 2024, our Non-Branded & Non-Salty Snacks included partner brands, private label, co-manufacturing for which we are the manufacturer, Utz branded non-salty snacks such as On The Border® Dips and Salsa, and sales not attributable to specific brands.
Products
We produce a broad range of salty snack foods, including potato chips, tortilla chips, pretzels, cheese snacks, pub/party mixes, pork skins, ready-to-eat popcorn, and other snacks which include salsa and dips. Our products are packaged in a variety of different sizes and configurations, ranging from individual packages to shareable bulk containers. We also sell certain third-party branded products through our distribution network.
We believe our ability to produce a wide range of products differentiates us from some of our competitors whose businesses focus on a particular product type because our broad product assortment enables us to gain greater distribution and shelf space with our customers. Our in-house production capabilities across a range of products also enable us to rapidly respond to evolving consumer needs and preferences and to better create new innovative products to delight consumers. We also believe that our diversified product portfolio results in more predictable and stable financial performance as we are not overly exposed to only one salty snack sub-category.
Recent Developments in Product Innovation
New product innovation is critical in the salty snacks category because consumers both enjoy long-time favorites and like to experiment with new forms, flavors, textures, and ingredients. In particular, our brands have strong competitive positions across an assortment of popular salty snacks, including potato chips, tortilla chips, pretzels, cheese snacks, pub/party mixes, and pork skins.
Investments in new product innovation support three focus areas that are rooted in the consumer and tied to our portfolio and brand strategy: Expanding Positive Choices, Delivering Craveable Flavor, and Capturing Occasions.
Within Expanding Positive Choices, the focus in 2024 was on Boulder Canyon, a brand offering solutions for consumers seeking great tasting BFY snacks via BFY oils such as avocado oil and olive oil. Innovation contributed to the brand’s 32.7% growth in the natural channel in 2024. Within the potato chip segment, Boulder Canyon launched two kettle chips: Spicy Green Chili as an everyday item following a successful 2023 limited time offer (“LTO”) launch and a Buffalo Ranch Boulder Batch LTO. Both flavors capitalized on the hot & spicy trend that continues as the #1 flavor category in salty snacks. Also, within potato chips, Boulder Canyon entered the Wavy/Ripple subcategory with the launch of Boulder Canyon Wavy chips in top category flavors, Sea Salt and Cheddar Sour Cream. Introduced in September 2024 in the Natural Channel, Boulder Canyon Wavy is off to a strong start with both Sea Salt and Cheddar Sour Cream flavors exceeding expectations. Additionally, Boulder Canyon moved beyond potato chips in 2024, entering the cheese snacks sub-category with the introduction of Canyon Poppers. This launch leverages our expertise in cheese snacks and consumer desire for BFY snacks. Two flavors, White Cheddar and Jalapeno Ranch, represent top category flavors, Cheddar and Hot & Spicy.
Within Delivering Craveable Flavor, we addressed consumer desire for flavor exploration with innovation across brands and snacking subcategories. Utz leveraged strength as the #4 brand of pretzels with an over 50% repeat purchase rate and the other positive trends in flavored pretzels, which now represents over 50% of pretzels. Utz has driven 5% growth in the category, due, in part, to the launch of Utz Mixed Minis, a line of seasoned mini pretzels in Garlic Butter, Mike’s Hot Honey and Sea Salt varieties. Within potato chips, Utz leveraged the success of the award-winning Mike’s Hot Honey to offer a Mike’s Extra Hot Honey as a Summer LTO capitalizing on the hot & spicy trend. Zapp’s, a brand that embodies the bold and vibrant flavors of New Orleans, also offered innovation against this focus area. Building on the launch of Zapp’s Sinfully Seasoned Pretzel Stix in 2023, two new flavors were launched in 2024 – Spicy Cajun and Sweet Cinnamon & Sugar. Following up on multiple product awards for Zapp’s Sinfully Seasoned Pretzel Stix in 2023, Zapp’s Spicy Cajun pretzels was named one of the year’s Best New Products by Convenience Store News for 2024. Zapp’s Sinfully Seasoned Pretzel Stix is the #6 brand in the seasoned subcategory in the fifty-two weeks ended as of December 1, 2024. Within potato chips, Zapp’s introduced the Big Cheezy New Orleans Kettle Style potato chips. While cheese flavored potato chips represent 12% of potato chips and are growing, this popular flavor is underrepresented in kettle style chips subcategory at less than 1% sales representing an opportunity for Zapp’s.
Within Capturing Occasions, our focus is expanding usage via variety/multipack innovation to address consumers' preference for portioned packs and seasonal offerings that are designed to attract consumers that are engaging in celebration. In 2024, we introduced a portfolio of variety/multipacks across our Power Four Brands and our Targeted Brands.
Our Approach to Product Innovation
Given our long-standing customer relationships, broad production capabilities, and scalable distribution platform, we plan to continue expanding our presence in certain salty snack sub-categories that we believe are highly synergistic to our existing business. We intend to continue to expand our presence in key salty snack sub-categories through a combination of line extensions of our existing brands, new brand introductions, licensing partnerships with established brands, and/or acquisitions. We believe our expanded presence across key salty snack sub-categories will enhance our competitive position with customers and allow us to leverage our existing manufacturing and distribution infrastructure.
As such, the level of new product innovation and the speed to market with these innovations are critical components of our business. Our innovation process begins with our marketing team, which understands our brands and consumers, and works collaboratively with our research & development and innovation leaders to identify new product opportunities that best suit our brand positions. We develop insights about unsatisfied consumer needs using our market research capabilities, and we track competitive product introductions to ensure appropriate responses. We also collaborate with third-party seasoning and flavor houses to understand the latest trends in consumer flavors and emerging consumer flavor preferences. Going forward, we intend to continue to increase our investments in market research and other resources to generate more consumer insights and new product innovations.
We also utilize our flexible manufacturing and distribution platform to streamline the new product innovation process from idea conception through development and commercialization to market. The strategic location of our primary corporate office adjacent to our largest manufacturing plants facilitates strong coordination between our marketing, sales, research & development, and manufacturing professionals, leveraging the innovation experience of senior management and our in-house innovation leaders. Our broad in-house manufacturing capabilities across different product forms and packaging allow us to develop and commercialize new products quickly, and we have the manufacturing flexibility to handle many types of ingredients, including on-trend BFY oils such as avocado and olive. Our DSD distribution system allows us to efficiently experiment with new products at retail stores driven by the ability to quickly place new items and collect immediate feedback on sell-through trends. Finally, given the importance of in-store presence, we are working with world-class design agency partners to implement new packaging, impactful point-of-sale materials, and retail-ready displays.
Marketing, Advertising, and Consumer Engagement
Our marketing strategy is focused on driving stronger consumer pull for, and building brand equity of, our Branded Salty Snacks. We conduct marketing efforts through three principal sets of activities: (i) consumer marketing and advertising, including digital and eCommerce, social media, sponsorships, and other consumer promotions; (ii) consumer sales incentives including coupons and rebates; and (iii) trade promotions to support features, displays and other merchandising of our products by our customers. Historically we have relied more heavily on sponsorships, trade promotions, and in-store merchandising for consumer engagement; however, we are making shifts of spending more on consumer awareness and brand-building advertising. In fiscal year 2024, we spent approximately $17.8 million related to consumer marketing and advertising and $33.8 million in cooperative advertising. Consistent with our value creation strategies, we intend to continue to increase our investments in digital and social consumer marketing and advertising focused on our Branded Salty Snacks as well as continue to allocate our current mix of media spending toward activities we believe will generate the highest return on investment. We will continue to expand our investments in digital and social media, including as part of our strategy to grow our eCommerce and retailer marketing investments. We believe these marketing strategies will drive long term net sales growth by increasing brand equity, and supporting geographic expansion.
Customers
In fiscal year 2024, our top 10 customers, all of which are retailers, represented approximately 40% of our invoiced sales, and one customer provided in excess of 10% of our net sales in fiscal year 2024. Although orders are processed through purchase orders, as opposed to volume commitments, we have historically benefited from long-term relationships with our key customers, having a sales relationship for more than 20 years on average across our top 15 retail customers.
International
Substantially all of our invoiced sales occurred in the United States in fiscal year 2024, and we are focused on growing our business in the United States. Since substantially all of our business is in the United States, we believe we have more limited exposure to global economic conditions and foreign exchange fluctuations than companies with more substantial international sales and operations.
Competition
Our products primarily compete with other salty snacks but also compete more broadly for certain eating occasions with other snack foods. We believe that the principal competitive factors in the salty snacks industry include taste, convenience, product variety, product quality, price, nutrition, consumer brand awareness, media and promotional activities, in-store merchandising execution, customer service, cost-efficient distribution, and access to retailer shelf space. We believe we compete effectively with respect to each of these factors.
The salty snacking industry is competitive and includes a number of diverse participants. Our principal identified competitors include PepsiCo (Frito Lay), Campbell’s (Snyder’s-Lance), Kellanova (Pringles)(to be acquired by Mars), General Mills, Grupo Bimbo, Hershey’s, Hain Celestial, and Arca Continental (Wise), among others. Our products also compete with private label or retailer-branded salty snacks. However, private label branded salty snacks represented only approximately 6.7% of U.S. category retail sales for the year ended December 29, 2024, less than its approximately 7.0% average share of retail sales since 2019.
Historically, the salty snacks category has benefited from favorable competitive dynamics, including low private label penetration and category leaders who compete primarily via marketing and innovation. Importantly, as of December 29, 2024, we are the #2 brand platform in our Core Geographies, and our brands represent approximately 7% of total salty snacks category retail sales in our Core Geographies based on Circana data. As of December 29, 2024, in our Core Geographies, we have the #2 position in pork skins, pretzels and cheese snacks with 17%, 14% and 7% of sub-category retail sales, respectively. We have the #3 position in potato chips and tortilla chips with 11% and 4% of sub-category retail sales, respectively. We believe we have a strong and defensible position in our Core Geographies with a significant opportunity to enhance our national position by expanding sales in Expansion Geographies (where we represent 2.8% of category retail sales). As of December 29, 2024, we are the #4 salty snack brand platform in the U.S., representing 4.3% of total salty snacks category retail sales.
Notably, in 2024, approximately $2.8 billion of salty snack retail sales were generated by approximately 1,200 smaller competitors, each with retail sales of less than $200 million. We believe this fragmented group of smaller brands provides an attractive opportunity for us to expand our retail sales by either acquiring or gaining share from smaller regional or product-specific competitors.
Supply Chain
Sourcing. The principal ingredients used to manufacture our products include potatoes, oil, flour, wheat, corn, cheese, spices, and seasonings. Our primary packaging materials include flexible films and rigid containers, such as barrels, lids, cartons, and trays. All of our core ingredients are purchased according to rigorous standards to assure food quality and safety. Our principal ingredients are generally available from multiple suppliers but became more difficult to source beginning in 2021 and continuing into 2024 due to ongoing supply chain constraints. We do not source any of our top 10 inputs under any single-supplier arrangement. As such, we have been able to make satisfactory alternative arrangements in the event of this interruption of supply from our suppliers. No single category of direct material purchases represented more than 15% of our Cost of Goods Sold in fiscal year 2024. In addition to raw ingredients and packaging, we source energy and liquid fuels for our manufacturing facilities and in-house distribution assets.
We utilize various buying strategies to mitigate the impact of changes in input prices, including fixed-price forward purchases as well as commodity hedging arrangements with third parties (particularly for energy, vegetable oils, wheat, and corn). A number of external factors such as weather, commodity markets, and governmental or agricultural programs can affect the cost of raw materials used in our products. To provide greater visibility and mitigate risks, we typically look to enter into pricing arrangements covering a meaningful portion of our forecasted purchases over the next three to 18 months. As of December 29, 2024, we estimate that we have entered into pricing arrangements covering approximately 36% of our budgeted direct material needs in fiscal year 2025.
Manufacturing. As of December 29, 2024, we manufacture our products primarily through eight company-operated manufacturing facilities across the United States. These include three legacy Utz facilities and five facilities that were added over the last ten years from acquisition (for more details see Item 2 “Properties” in this Annual Report on Form 10-K for more details). Our facilities have the capacity to produce approximately 500 million pounds of salty snacks annually based on management’s estimate of available capacity, excluding weekly sanitation, over a seven-day work schedule, providing us with significant available capacity to accommodate increased sales. We believe this available capacity across our manufacturing footprint will enable us to leverage existing fixed costs to generate higher margins on incremental organic sales or acquired brands as well as generate potential future cost savings through consolidating our manufacturing footprint. Our manufacturing facilities are well-maintained, and we have a program to ensure appropriate maintenance capital expenditures are undertaken. While we are purposefully shifting toward moving manufacturing in-house, we also continue to utilize several co-manufacturers for certain products, with the most significant being our OTB branded tortilla chips as well as branded salsa and queso. During fiscal 2022, we began investing in talent and process improvements, associated with setting up our integrated business planning (“IBP”) process, which uses supply and demand planning to optimize manufacturing and other supply chain and logistics processes.
Distribution. We offer national distribution of our products through our flexible, hard-to-replicate distribution system that combines DSD, DTW, direct-to-consumer and distributor capabilities. We believe this hybrid system, which we have built and enhanced over nearly a century, offers us flexibility to cost-effectively distribute our products to a wide range of retail locations where salty snacks are sold. Additionally, we believe our distribution system is highly scalable, resulting in the ability to drive higher margins on incremental revenues and enabling us to realize significant cost savings when integrating acquired brands onto our established platform.
We have historically expanded the geographic reach of our distribution network from our Core Geographies, where we benefit from strong brand awareness and heritage, to our Expansion Geographies, where we have expanded both organically and through acquisitions. During the fiscal year ended December 29, 2024, we were able to expand our market share in our Expansion Geographies. We plan to continue to expand our distribution and sales of Branded Salty Snacks in these geographies, supported by our increased brand investments, expansion of our direct-to-customer and DSD distribution capabilities, and potentially through strategic acquisitions.
Direct-to-Warehouse: For a number of our customers, we either ship products directly from our facilities to their distribution centers or allow them to pick-up products directly from our facilities. These customers are then responsible for fulfilling shipments to their own retail stores. The DTW model is often preferred by some of our national mass, club, and grocery customers that have sufficient scale and capabilities to efficiently manage distribution and replenishment for their own retail stores.
Direct-Store-Delivery: We are one of few scaled U.S. salty snack providers with extensive DSD capabilities. Within our DSD system, our IOs pick up products from our manufacturing facilities, distribution centers, storage facilities, or small bins and distribute and sell these products to retail stores within a geographic territory. Our DSD system provides service to both large and small customers, and it provides us a competitive advantage in expanding distribution, increasing shelf space, executing in-store merchandising activities, and ensuring products are fresh and available wherever consumers shop. Our DSD network includes approximately 2,500 routes reaching over 81,500 retail stores in 2024. While we expect to have a small number of routes under the ownership of the Company as we acquire and re-sell routes as part of our normal operations, as of December 29, 2024, substantially all of our DSD routes are managed by IOs. Over the last several years, we have converted from a predominately company-owned route sales professionals ("RSP") model toward the use of IOs. We believe this transition benefits us by creating motivated IOs and a more variable cost structure for our company. (See “Item 7 Management’s Discussion and Analysis of Financial Condition and Results of Operations of Utz Brands Holdings — Recent Developments and Significant Items Affecting Comparability — Independent Operator Conversions” for more details).
Third Party Distributors: We also use third-party distributors in certain regions where their capabilities enhance the cost effectiveness and reach of our overall distribution system. For third-party distributors, we either ship products directly from our facilities to their distribution centers or allow them to pick up products directly from our facilities. The distributors are then responsible for selling our products to our customers and ensuring optimal retail presence within the stores they serve, utilizing both DTW and DSD capabilities. Our third-party distributors operated an additional approximately 500 DSD-style routes, reaching over 15,000 retail stores.
Direct-to-Consumer: We also distribute our products directly to consumers. Our direct-to-consumer shipments primarily originate from orders received via our company website (www.utzsnacks.com) or select third party retailer sites, including Amazon and Sam’s Club, which extend our reach to virtually every household in America. Our direct-to-consumer shipments are delivered from our central warehouse facility to consumers using FedEx, U.S. Postal Service, or other third-party carriers and is an accelerating part of our business, with the channel having grown significantly since 2019.
Food Safety and Quality: Food safety and quality are top priorities and we dedicate substantial resources to ensure that consumers receive consistently safe and high-quality food products. Our products are manufactured in facilities that have programs and controls in place regarding consistent quality and food safety. These comprehensive programs include Safe Quality Food (SQF) certifications and Good Manufacturing Practices (GMPs) that are designed to produce a safe, wholesome product. Our suppliers are required to have similarly robust processes in place and confirm their compliance for shipments of all ingredients to be used in our products. Finally, in addition to real-time product testing during production, we frequently monitor product attributes including taste, aroma, texture, and appearance, and random samples of finished goods are regularly sent to third-party laboratories for testing and verification.
Human Capital Resources
Our values lead the way we work and are rooted in over a century of heritage that focuses on our people. Acting with respect, working collaboratively and in an integrated way, focusing on ownership and accountability, and continuously pursuing excellence are core values that have underpinned our success in attracting, engaging, and developing our associates. Our Board of Directors (“Company Board”), Company Board committees, and Executive Leadership management oversee various associate initiatives including compensation and benefits programs, succession planning, leadership development, and diversity, equity and inclusion. We aim to both attract and engage a qualified workforce through competitive compensation and benefits, training and development opportunities, as well as through listening initiatives designed to uncover opportunities to improve the ways we work.
Inclusivity
We recognize that the diverse perspectives and backgrounds of our associates are vital to maximize our performance, and by embracing a workplace where every associate feels that they are valued and that they can contribute not only to our success, but to their success as well, we believe that we are able to provide high-quality products for our consumers, drive efficiencies for our business and business partners, and improve our results for our stockholders.
To foster a work environment that values all people, Utz partnered with a nationally recognized consulting firm to help develop a comprehensive strategy, which includes various aspects of human resources, including recruiting, training, and leadership development. We developed a three year strategy that is underway that includes various initiatives, projects and actions that have yielded positive results.
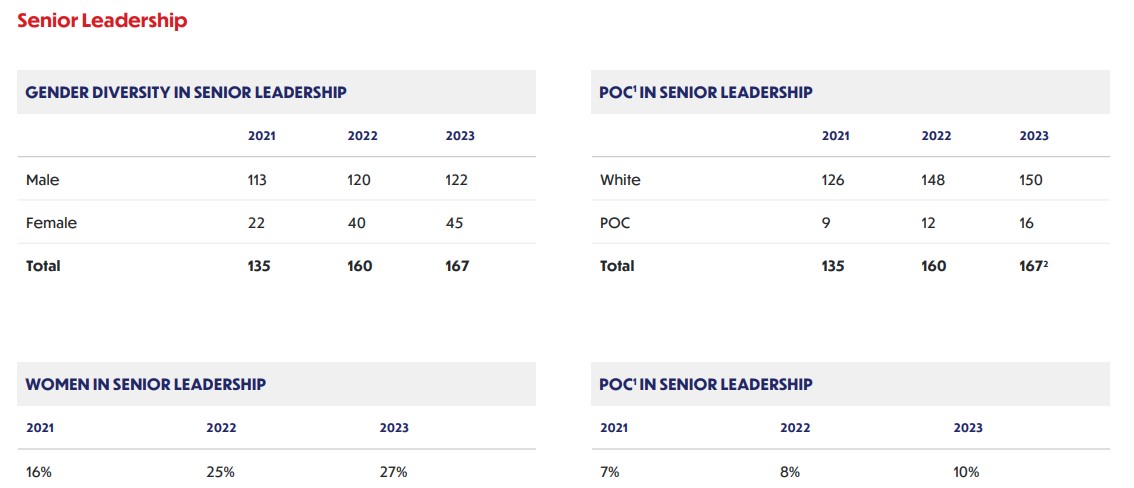
As of our 2023 ESG report published in August 2024, our associate demographics in the U.S. (based on self-reported data from our associates) were:
1 Includes all races except White.
2 One associate did not specify a self-identified race but was included in the total; however, this individual's data was not reflected in either the White or POC categories
Health and Safety
We believe that a safe and healthy workplace is essential and that the safety, health and well-being of our associates is one of our most important responsibilities. Our approach to operational health and safety is based on creating a culture of collective learning to build systems that safeguard all of our associates.
Our health and safety approach is the foundation for keeping our associates and workplaces safe and secure, and is aligned with Occupational Safety and Health Association's ("OSHA") 1910 standards and meet all regulatory requirements. We also look to International Organization for Standardization and other respected standards to inform our approach.
The pillars of our health and safety approach are as follows:
•Associate engagement: Leading indicators are used to both encourage and measure regular safety related activities throughout the organization;
•Training: Safety trainings relevant to each work group’s operation are distributed throughout the organization monthly, quarterly and/or annually;
•Compliance: Regular audits in various formats are used to review and ensure compliance with applicable agency regulations; and
•Performance metrics: Traditional OSHA metrics are maintained on a quarterly and annual basis to measure actual performance and help identify continuous improvement opportunities.
Total Rewards
We have a demonstrated history of investing in our workforce by providing competitive wages and benefits. Our benefits package includes:
•Comprehensive health insurance coverage to associates working 30 hours or more each week;
•Parental leave to all new parents for birth, adoption or foster placement;
•Short term disability to provide partial wage protection for up to 13 weeks;
•Participation in the Employee Stock Purchase Plan;
•Wellness and disease management programs, health advocacy partner and associates assistance programs;
•Health & Wellness Center – free to all Hanover-based associates and dependents covered under the health plan; and
•401(k) plan with competitive company match and profit sharing.
Associate Headcount
As of December 29, 2024, we employed approximately 3,000 full-time associates and 200 part-time associates.
Over the last several years, we have meaningfully reduced our number of full-time associates and our selling, distribution and administrative expenses through our business transformation initiatives, particularly our DSD shift from RSPs to IOs and the associated restructuring of our sales management and corporate organization structure (see “— Supply Chain — Distribution” and "Part II, Item 7, "Management’s Discussion and Analysis of Financial Condition and Results of Operations of Utz Brands Holdings — Recent Developments and Significant Items Affecting Comparability —Independent Operator Conversions” for more information). Additionally, we have reduced the number of associates and operating expenses through several network optimization initiatives that reduced our plant footprint by three plants in fiscal year 2023 and consolidated certain of our transportation and warehousing operations. In the first quarter of fiscal year 2024, we further reduced our number of full-time associates and our selling, distribution and administrative expenses through our business transformation initiatives, including the Good Health and R.W. Garcia Sale and Manufacturing Facilities Sale, which further reduced our plant footprint by an additional five plants.
Sustainability
We recognize the importance of ESG issues for all stakeholders. We use leading ESG and sustainability frameworks and guiding principles, such as the Sustainability Accounting Standards Board ("SASB"), the Task Force on Climate-related Financial Disclosures ("TCFD") and the U.N. Sustainable Development Goals ("SDGs"), as well as stakeholder engagement to inform our ESG program. We recognize our responsibility to uphold the Company’s founding values, which for more than 100 years, have centered on working ethically, responsibly, and with integrity to benefit all of our stakeholders. We consistently look for ways to make a positive difference for our associates, customers and in the communities in which we operate. By collaborating with stakeholders, including associates, consumers, business partners, suppliers, stockholders and customers, we are taking the necessary steps to become a more sustainable company. We believe that it is in our stakeholders’ best interests that we place safety-focused, sustainability-minded, and transparent best practices at the heart of our operations. With this stakeholder framework, in 2020 we formed our ESG Committee, composed of subject matter experts from across our operations, including facilities management, packaging innovation, human resources, corporate governance, legal affairs and communications.
We released our 2023 ESG Report in August 2024, which outlines our strategic priorities for ESG matters and the continued growth of our sustainability program. To learn more about our sustainability goals, progress and initiatives, access the ESG Report by clicking “ESG” on our Investor Relations website at www.investors.utzsnacks.com. See “Available Information” below for additional information regarding our website.
Intellectual Property
We own numerous domestic and foreign trademarks and other proprietary rights that are important to our business. These include the U.S. trademark registrations, which protect certain rights in the following brands: Utz, ON THE BORDER, Zapp’s, Golden Flake, Boulder Canyon, Hawaiian, TORTIYAHS!, Tim’s Cascade, Snyder of Berlin, “Dirty”, Kitchen Cooked, and Bachman and Jax, among others. Depending upon the jurisdiction, trademarks are valid as long as they are used in the regular course of trade and/or their registrations are properly maintained.
We also maintain rights to the domain names www.utzsnacks.com and www.getutz.com, among others.
We believe the protection of our intellectual property, particularly our trademarks, trade dress, trade secrets, copyrights and domain names, is important to our success. We aggressively protect our intellectual property rights by, among other methods, relying on a combination of watch services and enforcement under intellectual property laws and/or through the domain name dispute resolution system.
In addition, from time to time, we may be subject to legal proceedings and claims in the ordinary course of business. We take proactive measures in attempts to avoid infringement of third party marks by conducting trademark clearance searches and taking other industry standard measures. However, this does not prevent third parties from asserting claims against us. We have received, and may in the future continue to receive, claims from third parties asserting, among other things, infringement of their intellectual property rights. The results of any current or future litigation cannot be predicted with certainty and regardless of the outcome, litigation can have an adverse impact on us because of defense and settlement costs, diversion of management resources, and other factors. See Part I, Item 1A, “Risk Factors — Potential liabilities and costs from litigation, claims, legal or regulatory proceedings, inquiries or investigations can have an adverse impact on our business, financial condition or results of operations.” Moreover, future litigation may be necessary to defend ourselves, our partners, and our customers by determining the scope, enforceability, and validity of third-party proprietary rights or to establish our proprietary rights.
We also license certain third-party brand names for use on our products, including the Grillo’s Pickles, and Mike's Hot Honey. We use these trademarks in connection with production and distribution of snack products to be sold under the trademarked labels. Under some of the agreements governing our use of such trademarks, we are required to make guaranteed annual royalty payments. Sales under our trademark licensing agreements represent approximately 1% of our 2024 invoice sales.
In addition, we license certain of our owned brands, including Utz, for use by third parties in certain food categories (such as frozen foods), however these arrangements do not materially impact our results of operations or financial position. Finally, we have historically engaged in certain cross-marketing and/or promotional activities with third parties, thereby increasing the visibility of our brands.
Seasonality
Although the demand for our products is relatively stable throughout the year as compared to other consumer goods, we have experienced in the past, and expect to continue to experience, seasonal fluctuations in our retail sales as a result of consumer and customer spending patterns. Historically, the months of April to September, as well as December have resulted in higher retail sales than average due to increased consumer demand during the spring and summer months and holiday season, as well as significant retailer merchandising and promotions around those times. Additionally, we have historically generated seasonal cash flow from decreases in working capital levels in the fourth quarter and invested cash flow in working capital increases in the first quarter. We expect these historical trends to continue in the future.
Government Regulation and Compliance
We are subject to various laws and regulations in the United States by federal, state and local government authorities. In the United States, the federal agencies governing the manufacture, distribution and advertising of our products include, among others, the Federal Trade Commission (“FTC”); the U.S. Food and Drug Administration (“FDA”); the United States Department of Agriculture (“USDA”); the U.S. Environmental Protection Agency ("EPA"); and the OSHA and similar state and local agencies. Under various statutes, these agencies, among other things, prescribe the requirements and establish the standards for quality and safety and regulate marketing and advertising to consumers.
We are subject to labor and employment laws, laws governing advertising, privacy laws, safety regulations and other laws, including consumer protection regulations that regulate retailers or govern the promotion and sale of merchandise. Our operations, and those of our distributors and suppliers, also are subject to various laws and regulations relating to environmental protection and worker health and safety matters. We monitor these regulatory requirements and our compliance on a regular basis.
Available Information
Our website is www.utzsnacks.com. The information found on, or that can be accessed from or that is hyperlinked to, our website is not part of this Annual Report on Form 10-K. We file or furnish annual, quarterly and current reports, proxy statements and other information with the United States Securities and Exchange Commission (“SEC”). You may obtain a copy of any of these reports, free of charge, from the Investors Relations section of our website as soon as reasonably practicable after we electronically file such material with, or furnish it to, the SEC. The SEC maintains an Internet site that also contains these reports at: www.sec.gov. In addition, paper copies of the Company's annual report will be made available, free of charge, on written request to the Company.
Item 1A. Risk Factors
Our business is subject to numerous risks and uncertainties. You should carefully consider the following risks as well as the other information included in this Annual Report on Form 10-K. We operate in a changing environment that involves numerous known and unknown risks and uncertainties that could materially adversely affect our operations. Any of the following risks could materially and adversely affect our business, financial condition, results of operations or prospects. However, the selected risks described below are not the only risks facing us. Additional risks and uncertainties not currently known to us or those we currently view to be immaterial may also materially and adversely affect our business, financial condition, results of operations or prospects. In such a case, the trading price of our securities could decline, and you may lose all or part of your investment in us.
Risks Related to Our Business
We operate in the highly competitive and increasingly consolidated snack food industry. If we are unable to compete effectively, it may reduce our ability to sell our products to our customers or consumers.
The sales of most of our products are subject to significant competition due to factors including product quality and taste, brand awareness among consumers, access to shelf space at retail customers’ locations, price, advertising and promotion, innovation of on-trend snacks, variety of snacks offered, nutritional content, product packaging and package design. We compete in the snack food market against numerous multinational, regional and local companies, as well as emerging companies, including in the BFY product subcategory, principally on the basis of product taste and quality, but also brand recognition and loyalty, price, marketing, advertising and the ability to satisfy specific consumer dietary needs.
Due to the competitive landscape in the snack food industry, price increases for our products that we initiate or failure to effectively advertise and promote our products may negatively impact our financial results if not properly implemented or accepted by our customers, IOs, third-party distributors or consumers. Substantial advertising and promotional expenditures may also be required to maintain or improve our brands’ market position or to introduce a new product to the market, and participants in our industry may be engaging in new advertising trends or channels which we are not. Historically, we have offered a variety of sales and promotion incentives to our customers, IOs, third-party distributors and consumers, such as price discounts, consumer coupons, volume rebates, cooperative marketing programs, product placement fees and in-store displays, often in connection with seasonal social events, holidays and sporting events. The promotional environment has intensified in recent years, including but not limited to robust promotional launches, and .we have been, and may in the future be, limited in our ability to increase prices or adjust product sizes sufficiently on a timely basis, or at all, in order to offset increased input costs, such as raw materials, packaging, energy, freight, labor, and overhead costs or other expenditures, such as advertising and promotion costs, which has the effect of reducing overall sales volume, revenue and operating profit. In addition, advertising and promotional expenditures may be ineffective if consumers prioritize price over other factors and purchase lower-cost alternatives, such as private label, generic or store branded products.
Our ability to compete may also be dependent on the availability of product category-appropriate snack aisles at our retail customers’ locations and whether our products are placed in the appropriate snack aisle, such as the BFY snack food aisle or in the traditional snack food aisle. An increasing focus on BFY products and other specialty products in the marketplace will likely increase these competitive pressures within the category in future periods. Further, companies in the BFY product segment providing innovative or trendy snack foods often receive investments from private equity, venture capital or other investors, who may be more willing to accept lower product margins or sustained losses in order to gain market share. If such emerging companies are able to attract a loyal consumer base through more innovative or trendier snack foods or offer their snack food products at lower prices than us, our market share and results of operations may be materially and adversely affected.
If our advertising or promotional efforts do not increase brand awareness or sales of our products, our expenses may increase without a corresponding increase in revenue, and our operating profit may be reduced. Additionally, if market prices for certain inputs decline significantly, in some instances we may be required by contract to pay customers the difference or experience customer pressure to reduce the prices for our products, which could lower our revenue and operating profit.
There is continuing consolidation in the snack food industry and in retail outlets for snack foods by other market participants. Although we benefit from the execution of our own acquisition strategy within the snack food industry and with respect to snack distribution channels, ongoing consolidation in the snack food industry and retail outlets by others may prevent us from effectively competing if others in the industry that have greater resources than us or if retail customers or potential retail customers enter into long-term purchase contracts or promotional arrangements. Significant consolidation by others increases the possibility that we could lose one or more major customers, lose existing product authorizations or shelf space at customer locations, or lose market share. For example, our competitors vie for the same shelf placement and may offer incentives to retail customers that we cannot match, particularly as a result of consolidation. Even if we obtain shelf space or preferable shelf placement for any of our brands, our new and existing products may fail to achieve the sales expectations set by our retail customers, potentially causing these retailers to remove our products from the shelf or place them in less favorable locations. Additionally, an increase in the number and quality of private-label products in the product categories in which we compete has reduced available shelf space and could continue to hamper the placement for our branded products, which could adversely affect our sales. To obtain and keep shelf placement for our products, we may need to increase our marketing and advertising spending in order to create consumer awareness, protect and grow our existing market share or to promote new products, which could impact our operating results. We also consistently evaluate our product lines to determine whether it may be necessary to discontinue certain products. Discontinuing product lines may increase our profitability but could reduce our sales and hurt our brand and consumer loyalty, and a reduction in sales of certain of our products could result in a reduction in sales of other of our products.
Our reliance on key customers and consolidation within the retail industry, in tandem with a rise in hard discounters, may limit our ability to obtain favorable contractual terms and protections with customers and maintain our profitability.
Our business relies heavily on maintaining strong relationships with key customers, including wholesale distributors, grocery stores, convenience stores, discount stores, mass merchandisers, membership club stores, hard discounters, specialty retailers, and e-commerce platforms. Given the limited number of retail customers in the U.S. grocery market, the loss of, or a significant reduction in sales to, any key customer can adversely affect our business, financial condition, or results of operations. Any significant dispute, change in the financial condition of a key customer, or reduction in sales to a key customer could have a detrimental impact on our business. Accordingly, our ability to negotiate key terms may be constrained by our need for limited shelf space, our reliance on key customers, and increasing consolidation within the industry. See Customers within Part I, Item 1 Business for further discussion of our exposure to large customers.
As retail customers continue to consolidate and our retail customers grow larger and become more sophisticated, our consolidated retail customers may demand lower pricing and increased promotional programs. If we lower our prices or increase promotional support for our products and are unable to increase the volume of our products sold, our profitability and financial condition may be adversely affected. In addition, our customers offer branded and private label products that compete directly with our products for retail shelf space and consumer purchases. Accordingly, there is a risk that our customers may give higher priority to the products of our competitors. In the future, our customers may not continue to purchase our products or provide our products with adequate levels of promotional support. It is also possible that our customers may replace our branded products with private label products.
Retailers in the grocery industry also often charge product placement fees for access to shelf space and require manufacturers to participate in promotional and advertising arrangements. These arrangements can result in substantial costs for promotion allowances, cooperative advertising, and product or packaging damages. As the retail grocery industry becomes more competitive and consolidated, retailers are increasingly passing on unanticipated promotional and advertising costs to manufacturers and distributors. Additionally, retailers are more frequently taking deductions for damaged, undelivered, or unsold products, or returning unsold products to manufacturers and distributors. These practices can significantly harm our operating results and liquidity. An unresolved disagreement with a retail customer over these charges could disrupt or terminate the customer relationship, leading to an immediate reduction in sales and liquidity. Because of the limited number of retail customers in the U.S. grocery market, the loss of even a single retail customer, a single stock-keeping unit previously maintained by a retail customer, or a customer of one of our significant IOs or third-party distributors, could have a long-term negative impact on our financial condition and net sales.
Furthermore, we do not have many contracts with our customers that require the purchase of a minimum amount of our products. This lack of firm, long-term or short-term volume purchase commitments means we experience periods with no or limited orders, while still incurring fixed costs to maintain our workforce and other expenses. During such periods, we may not be able to find new customers quickly enough, due, in part, to the consolidation in the retail industry, to offset the reduced purchase orders, which could adversely affect our net income. Unanticipated fluctuations in product requirements by our customers could also result in significant fluctuations in our results.
Meanwhile, the rapid expansion of hard discounters, which focus on selling a limited number of predominantly private label items, may reduce our ability to sell products through these retailers and lead to consumer price deflation, affecting our relationships with key traditional retail customers. Failure to respond appropriately to the expansion of hard discounters could reduce our market share and adversely affect our business, financial condition, or results of operations. If hard discounters continue to gain market share from traditional retailers, or if we fail to adapt to the changing retail landscape, our profitability and market share could be significantly impacted.
Demand for our products may be adversely affected by changes in consumer preferences and tastes or if we are unable to innovate or market our products effectively, which could reduce our revenues.
We are a consumer products company operating in highly competitive markets, and we rely on continued demand for our products. To generate revenue and profits, we must sell products that appeal to our customers and consumers. Any significant changes in consumer preferences or any inability on our part to anticipate or react to such changes could result in reduced demand for our products and erosion of our competitive and financial position. Our success depends on our ability to respond to consumer trends regarding food, including increasing concerns of consumers regarding health and wellness, obesity, product attributes and ingredient sourcing and content, as demonstrated through the BFY movement in our industry, and other matters relating to our operations, including packaging and shipping practices. In addition, changes in product category consumption or consumer demographics could result in reduced demand for our products. Consumer preferences may shift due to a variety of factors, including the changes in social trends and activity patterns. Any of these changes may affect consumers’ willingness to purchase our products and negatively impact our financial results.
Our continued success also is dependent on product innovation, such as new flavors and formats, as well as the introduction of BFY products in response to evolving consumer preference. In order to successfully compete within our industry, we must maintain a robust pipeline of new products, and effective advertising and promotional campaigns, marketing programs and product packaging. Although we devote significant resources to meet this goal, we may not be able to continue to develop and launch successful new products or variants of existing products, or to effectively execute advertising and promotional campaigns and marketing programs.
Consumers’ loyalty to our brands may change due to factors beyond our control, which could have a material adverse effect on our business and operating results.
Our business currently depends in large part on repeat purchases by the same consumers, many of whom are based in our Core Geographies where we have built strong regional brands and distribution capabilities. We believe this purchasing pattern is indicative of loyalty to our brands. However, these consumers could stop or materially reduce purchasing our products at any time, including due to changing consumer trends, increasing household debt, negative publicity regarding our brand, real or perceived quality or health issues with our products, an increased preference for BFY brands or other specialty brands by consumers, the availability of premium-branded or lower-priced alternative snack products, or for no reason at all. Loss of consumers’ loyalty to our brands and the resulting decreased sales to consumers could have an adverse effect on our business and operating results.
Our reputation or brand image might be impacted as a result of issues or concerns relating to the quality and safety of our products, ingredients or packaging, processing techniques, which in turn could negatively impact our operating results.
In order to sell our branded products, we need to maintain a good reputation with our stakeholders, including our customers, consumers, IOs, third-party distributors, suppliers, vendors, associates and equity holders, among others. Issues related to the quality and safety of our products, including with respect to the packaging, labeling, and processing of our products, could jeopardize our image and reputation. Demand for our products could also be affected by consumer concerns regarding the health effects of nutrients or ingredients in any of our products or the overall sustainability or impact of our products and their packaging on the environment. Negative publicity related to these types of concerns, or related to product contamination or product tampering, whether valid or not and which may not be in our control, could decrease demand for our products or cause production and delivery disruptions. In addition, negative publicity related to our ESG practices, including any ESG-related goals we may set and our progress toward them, any backlash or other implications from the recent “anti-ESG” movement, and any positions, or perceived positions, taken by us on sensitive social or political issues could also impact our reputation with customers, consumers, IOs, third-party distributors, suppliers, vendors, associates and equityholders, among others. Social media has rapidly exacerbated the speed with which negative information or misinformation is disseminated to the consumer population. Further, the costs associated with these potential actions, as well as the potential impact on our ability to sell our products, could negatively affect our operating results.
If our products become adulterated or are mislabeled, we might need to recall those items, and we may experience product liability claims and related losses, as well as damage to our reputation.
We have in the past and we may, in the future, need to recall some of our products, including any products that we produce for other parties under a private label, in the event that our food safety and quality control procedures are ineffective or fail, our products or packaging become adulterated or are mislabeled, we procure ingredients or packaging from third parties that are or become subject to a recall, government authorities determine that any of our products present a food safety risk, our products are tampered with, or other health risks related to our products or packaging emerge. We may also be liable if the consumption of any of our products cause sickness or injury to consumers. A widespread product recall could result in significant expenses due to the costs of a recall, the destruction of product inventory, losses due to the frustration of our contracts with third parties, or lost sales due to the unavailability of product for a period of time. In addition, if other companies recall or experience negative publicity related to a product in a category in which we compete, consumers might reduce their overall consumption of products in that category.
If we become subject to a significant adverse product liability judgment due to a food safety issue, we may be subject to significant damages and may not be sufficiently indemnified by our suppliers, or able to successfully recover under any such indemnification rights, in the event sickness or injury to consumers is caused by any of our supplier’s fault or error. Moreover, while we maintain product liability insurance and product contamination insurance in amounts we believe to be adequate, claims or liabilities of this sort might be excluded from or in excess of our coverage. A significant product recall or product liability claim could also result in adverse publicity, damage to our reputation, and a loss of consumer confidence in the safety or quality of our products, ingredients or packaging.
Changes in retail distribution arrangements can result in the loss of retail shelf space and disrupt sales of food products, causing our sales to fall.
From time to time, retailers change distribution centers that supply some of their retail stores. If a new distribution center has not previously distributed our products in that region, it may take time for a retailer’s distribution center to begin distributing new products in its region. Even if a retailer approves the distribution of products in a new region, product sales may decline while the transition in distribution takes place. If we do not get approval to have our products offered in a new distribution region or if getting this approval takes longer than anticipated, our sales and operating results may suffer.
Our DTW delivery network system relies on a significant number of brokers, wholesalers and logistics companies. Such reliance could affect our ability to effectively and profitably distribute and market products, maintain existing markets and expand business into other geographic markets.
Our DTW network system relies on a significant number of brokers, wholesalers and logistics companies to deliver our products to approximately 1,300 retailer distribution centers as of the end of our 2024 fiscal year. The ability to maintain a DTW system depends on a number of factors, many of which are outside of our control. Some of these factors include: (i) the level of demand for the brands and products which are available in a particular area surrounding a retailer distribution center; (ii) the ability to price products at levels competitive with those offered by competing producers and at prices that consumers will purchase our products; and (iii) our ability and the ability of third-party logistics companies to deliver products in the quantity and at the time ordered by brokers, wholesalers and retail customers. We may not be able to mitigate the risks related to all or any of these factors in any of our current or prospective geographic areas. To the extent that any of these factors have an adverse effect on our relationships with our brokers, wholesalers or third-party logistics companies, thus limiting maintenance and expansion of the sales market, our revenue and financial results may be adversely impacted.
Identifying new brokers, wholesalers or third-party logistics companies can be time-consuming and any resulting delay may be disruptive and costly to our business. Many of our agreements with our brokers, in particular, are terminable by either us or them after satisfaction of a short notice period. There also is no assurance that we will be able to maintain current distribution relationships or establish and maintain successful relationships with brokers, wholesalers or third-party logistics companies in new geographic distribution areas. We may have to incur significant expenses to attract and maintain brokers, wholesalers or third-party logistics companies in one or more geographic distribution areas. The inability to establish or maintain successful relationships with brokers, wholesalers or third-party logistics companies in a cost-effective manner or at all could result in increased expense or a significant decrease in sales volume through the DTW system and harm our business and financial results.
Our DSD network system and regional third-party distributor network relies on a significant number of IOs and third-party distributors, and such reliance could affect our ability to effectively and profitably distribute and market products, maintain existing markets and expand business into other geographic markets.
At the end of fiscal year 2024, our DSD network and regional third-party distributor network relied on approximately 2,300 IOs and third-party distributors covering approximately 500 DSD-style routes, in addition to our RSPs for the distribution and sale of our branded products and some private label products. In order to purchase from us the exclusive right to deliver our products to retail customers in a specific territory, IOs and third-party distributors must make a commitment of capital or obtain financing to purchase such rights and other equipment to conduct their business. Certain financing arrangements, through third-party lending institutions, are made available to IOs and require us to repurchase the rights granted to an IO in the event the IO defaults on its loan; we are then required to collect any shortfall from the IO to the extent possible. The inability of the IOs to make timely payments on their financing arrangements could require us to make payments on such financing arrangements pursuant to any guarantee agreements we have in place with such IOs’ third-party lenders. If we are required to make payments under such guarantees upon default by our IOs of a significant amount under their financing arrangements, the aggregate amount of such payments could have an adverse effect on our financial results.
The ability to maintain a DSD network and regional third-party distributor network depends on a number of factors, many of which are outside of our control. Some of these factors include: (i) the level of demand for the brands and products which are available in a particular distribution area; (ii) the ability to price products at levels competitive with those offered by competing producers; and (iii) the ability to deliver products in the quantity and at the time ordered by IOs or third-party distributors, and retail customers. There can be no assurance that we will be able to mitigate the risks related to all or any of these factors in any of our current or prospective geographic areas of distribution. To the extent that any of these factors have an adverse effect on our relationships with IOs and third-party distributors, thus limiting maintenance and expansion of the sales market, our revenue and financial results may be adversely impacted.
In addition, we rely on third-party distributors to directly or indirectly promote and sell our products within their assigned distribution areas. We may reimburse third-party distributors for a portion of their costs and expenses incurred in connection with such promotional efforts. If third-party distributors do not efficiently promote our products, we may experience an adverse effect on our financial results.
Identifying new IOs and third-party distributors can be time-consuming, and any resulting delay may be disruptive and costly to the business. There also is no assurance that we will be able to maintain current distribution relationships or establish and maintain successful relationships with IOs or third-party distributors in new geographic distribution areas. There is the possibility that we will have to incur significant expenses to attract and maintain IOs and third-party distributors in one or more geographic distribution areas. The inability to identify, establish and maintain distribution relationships with IOs and third-party distributors in a cost-effective manner or at all could result in increased expense or a significant decrease in sales volume through the DSD network and regional third-party distributor network and harm our business and financial results.
In addition, litigation or one or more adverse rulings by courts or regulatory or governmental bodies regarding our DSD network or third-party distributor network, including actions or decisions that could affect the independent contractor classifications of the IOs, or an adverse judgment against us for actions taken by the IOs could materially and negatively affect our financial condition, results of operations, cash flows, and ability to operate and conduct our business.
The evolution of e-commerce retailers and sales channels may adversely affect our business, financial condition or results of operations.
Our industry has been affected by changes to the retail landscape through sales over the Internet, including the rapid growth in sales through e-commerce websites, mobile commerce applications and subscription services as well as the integration of physical and digital operations among retailers. If we are unable to develop and maintain successful relationships with existing and new e-commerce retailers or otherwise adapt to the growing e-commerce landscape, while simultaneously maintaining relationships with our key customers, IOs and third-party distributors operating in traditional retail channels, we may be disadvantaged in certain channels and with certain customers, IOs, third-party distributors and consumers, which can adversely affect our business, financial condition or results of operations. In addition, the growth in e-commerce may result in consumer price deflation and higher direct-to-consumer costs, which may adversely affect our margins, as well as our relationships with key retail customers and our IOs and third-party distributors. The growth in e-commerce has also encouraged the entry of new competitors and business models, intensifying competition by simplifying distribution and lowering barriers to entry. If e-commerce retailers were to take significant additional market share away from traditional retailers or we fail to adapt to the rapidly changing retail and e-commerce landscapes our ability to maintain and grow our profitability, share of sales or volume, and our business, financial condition or results of operations could be adversely affected.
Disruption to our manufacturing operations, supply chain or distribution channels could impair our ability to produce or deliver finished products and negatively impact our operating results.
Disruption to our manufacturing operations, our supply chain or our distribution channels could result from, among other factors, the following: (i) natural disasters; (ii) pandemics, epidemics or other outbreaks of disease; (iii) adverse developments in crops or other significant ingredient shortfalls, due to factors such as famine or climate conditions affecting agricultural materials; (iv) fires or explosions; (v) terrorism or other acts of violence; (vi) labor strikes or other major labor disruptions; (vii) unavailability of raw or packaging materials; (viii) the operational or financial instability of key suppliers, and other vendors or service providers, including our IOs, third-party distributors, brokers, wholesalers and logistics companies; (ix) government actions or economic or political uncertainties or instability affecting the manufacture, distribution or sale of our products, including the impact of any changes in tariff policy in the U.S. and abroad; (x) power, fuel or water shortages; and (xi) changes requiring unexpected shifts in production planning which could impact our ability to meet product demand in a cost-effective manner. If we are unable, or find that it is not financially feasible, to effectively plan for or mitigate the potential impacts of such disruptive events on our manufacturing operations or supply chain, our financial condition and results of operations could be negatively impacted.
Our results of operations and profitability may continue to be adversely affected by inflation, including from rising labor costs and we may not be able to effectively offset such inflation and volatility.
Many aspects of our business have been, and may continue to be, directly affected by inflationary pressures and volatile commodity and other input costs. Our input costs increased significantly in fiscal years 2021 and 2022; while input costs have since stabilized, many of our ingredients and packaging inputs and logistical costs remain elevated compared to historical levels.
Commodities and ingredients are subject to price volatility which can be caused by commodity market fluctuations, crop yields, seasonal cycles, weather conditions, temperature extremes and natural disasters (including due to the effects of climate change), pest and disease problems, changes in currency exchange rates, imbalances between supply and demand, and government programs and policies among other factors. Many of our ingredients, raw materials and commodities are purchased in the open market, and some are only available from a limited number of suppliers. The prices we pay for such items are subject to fluctuation. While we manage this risk through the use of fixed-price contracts and purchase orders, pricing agreements and derivative instruments, including options and futures, if commodity price changes result in unexpected or significant increases in raw materials and energy costs, we may be unwilling or unable to increase our product prices or unable to effectively hedge against commodity price increases to offset these increased costs without suffering reduced volume, revenue, margins and operating results. In addition, certain of the derivatives used to hedge price risk do not qualify for hedge accounting treatment and, therefore, can result in increased volatility in our net earnings in any given period due to changes in the spot or market prices of the underlying commodities. Volatile fuel costs also translate into unpredictable costs for the products and services we receive from our third-party providers including, but not limited to, distribution costs for our products and packaging costs.
Labor costs are also elevated, in part due to shortages of qualified labor. Our labor costs include the cost of providing associate benefits, including health and welfare, and severance benefits. The annual costs of benefits vary with increased costs of health care and other benefit arrangements. We are continuing to experience a shortage of qualified labor in certain geographies, particularly hourly workers, resulting in increased costs from certain temporary wage actions. Further, we distribute our products and receive materials through the freight transportation market, and reduced trucking capacity due to shortages of drivers can increase costs and reduce service levels due to lack of freight transportation availability. Additionally, an inability to enhance robotic technology to automate processes in our manufacturing and distribution facilities could make us more dependent on a labor force than our competitors, which could increase our exposure to labor shortages. Any substantial increase in these costs negatively impact on our profitability.
While we seek to offset increased input costs with a combination of price increases to our customers, purchasing strategies, cost savings initiatives and operating efficiencies, we may be unable to fully offset our increased costs or unable to do so in a timely manner. Further, if compressed gross profits continue or if we experience a loss of sales due to price increases, we may not be able to undertake future initiatives to drive growth.
Our business, financial condition or results of operations may be adversely affected by shortages of raw materials, energy, water and other supplies.
We and our business partners use various raw materials, energy, water and other supplies in our business. The ingredients that we use in the production of our products (including, among others, fruits, vegetables, nuts and grains) are vulnerable to adverse weather conditions and natural disasters, such as floods, droughts, wildfires, water scarcity, temperature extremes, frosts, earthquakes and pestilences.
Water is a limited resource in many parts of the world. The lack of available water of acceptable quality and increasing pressure to conserve water in areas of scarcity and stress may lead to supply chain disruption; adverse effects on our operations; higher compliance costs; capital expenditures (including additional investments in the development of technologies to enhance water efficiency and reduce water consumption); higher production costs; the cessation of operations at, or relocation of, our facilities or the facilities of our suppliers, contract manufacturers, distributors, joint venture partners or other third parties; or damage to our reputation, any of which could adversely affect our business, financial condition or results of operations.
We rely on local government and municipal agencies to provide several resources, including water, electricity and natural gas, in such quantities and of such quality to be of use as inputs for our products. These local government and municipal agencies are subject to various regulations and political pressures from numerous stakeholders, which may cause them to conserve resources or fail to protect the quality of these resources, at times when we rely on them to timely deliver our products to our customers. If these agencies are unable or unwilling to deliver resources of a suitable quantity or quality we may not be able to deliver products in the quantity and at the time ordered by our customers, IOs, third-party distributors, brokers, wholesalers and retail customers, which may have a material and adverse effect on our results of operations.
As a food manufacturing company, all of our products must be compliant with laws and regulations promulgated by various governmental authorities, and changes in the legal and regulatory environment could limit our business activities, increase our operating costs, reduce demand for our products or result in litigation or other regulatory action.
Our business is required to comply with regulations promulgated by various governmental authorities, including without limitation the laws and regulations of the U.S. federal government, U.S. states and localities where we operate and sell products, and government entities and agencies outside of the U.S. in markets where our products or components thereof may be made, manufactured, or sold. For example, we must comply with various FDA, FTC and USDA rules, including those regarding product manufacturing, food safety, required testing and appropriate labeling of our products. In addition, we rely on independent certification of our non-genetically modified organisms (“GMO”), organic, gluten-free and Kosher products and must comply with the requirements of independent organizations or certification authorities in order to label our products as such. Our products could lose their non-GMO, organic and gluten-free certifications if our raw material suppliers lose their product certifications for those specified claims. We could also lose our Kosher product certification if our production facility or a contract manufacturing plant is found to be in violation of required manufacturing or cleaning processes. The loss of any of these independent certifications, including for reasons outside of our control, could harm our business. We must also comply with state rules and regulations, including Proposition 65 in California, which requires a specific warning on or relating to any product that contains a substance listed by the State of California as having been found to cause cancer or birth defects or other reproductive harm, unless the level of such substance in the product is below a safe harbor level established by the State of California. Interpretation and application of such rules, including potential differences in application on a state-by-state basis, may give rise to uncertainty as to the appropriate labeling and formulation of our products. Failure by any of our co-packers or other suppliers to comply with regulations, or allegations of compliance failure could also affect our operations and exposure to damages.
Additionally, laws and regulations and interpretations thereof that affect our business may change, sometimes dramatically, as a result of a variety of factors, including political, economic or social events. Such changes may involve laws relating to food, drugs, product labeling, advertising and marketing, portion sizes, nutrition, farming, the environment, taxation, consumer protection, anti-corruption, transportation, employment and labor, data privacy and cybersecurity, export controls, pricing, or competition. New laws, regulations or governmental policies and their related interpretations, or changes in any of the foregoing, including taxes or other limitations on the sale of our products, ingredients contained in our products or commodities used in the production of our products, may alter the environment in which we do business and, therefore, may impact our operating results or increase our costs or liabilities.
Potential liabilities and costs from litigation, claims, legal or regulatory proceedings, inquiries or investigations can have an adverse impact on our business, financial condition or results of operations.
We and our subsidiaries are party to a variety of litigation, claims, legal or regulatory proceedings, inquiries and investigations, including but not limited to matters related to our advertising, marketing or commercial practices; product labels; the difference between the actual capacity of a container and the volume of product contained in such container (which is referred to as “slack fill”), claims and ingredients; our intellectual property rights; environmental, privacy, employment, tax and insurance matters; actions relating to the trading of our securities; and matters relating to our compliance with applicable laws and regulations. We evaluate such matters to assess the likelihood of unfavorable outcomes and estimate, if possible, the amount of potential losses and establish reserves as we deem appropriate. These matters are inherently uncertain and there is no guarantee that we will be successful in defending ourselves in these matters, or that our assessment of the materiality of these matters and the likely outcome or potential losses and established reserves will be consistent with the ultimate outcome of such matters. In the event that management’s assessment of actual or potential claims and proceedings proves inaccurate or litigation, claims, proceedings, inquiries or investigations that are material arise in the future, there may be a material adverse effect on our business, financial condition or results of operations. In particular, the resolution of litigation or regulatory matters could require material changes to our operations or result in losses that may be in excess of existing insurance coverage or otherwise not covered by our insurance program. Furthermore, responding to litigation, claims, proceedings, inquiries, and investigations, even those that are ultimately non-meritorious, requires us to incur significant expense and devote significant resources, including the time and attention of our management, and may generate adverse publicity that damages our reputation or brand image, resulting in an adverse impact on our business, financial condition or results of operations.
We may not be successful in implementing our growth strategy, including without limitation, increasing distribution of our products, attracting new consumers to our brands, driving repeat purchase of our products, enhancing our brand recognition, expanding geographically, and introducing new products and product extensions, in each case in a cost-effective manner, on a timely basis, or at all.
Our future success depends in large part on our ability to implement our growth strategy, including without limitation, increasing distribution of our products, attracting new consumers to our brands, driving repeat purchase of our products, enhancing our brand recognition, expanding geographically, and introducing new products and product extensions. Our ability to implement our growth strategy depends, among other things, on our ability to develop new products, identify and acquire additional product lines and businesses, secure shelf space from retail customers, increase customer and consumer awareness of our brands, enter into distribution and other strategic arrangements with third-party retailers and other potential distributors of our products and compete with numerous other companies and products. We cannot assure you that we will be able to successfully implement our growth strategy and continue to maintain growth in our sales. If we fail to implement our growth strategy, our sales and profitability may be adversely affected.
Our continued success depends, to a large extent, on our ability to successfully and cost-effectively develop and innovate our product offerings in response to changing consumer preferences and trends with respect to forms, flavors, textures and ingredients. As such, the level of new product innovation and the speed to market with these innovations are critical components of our business. The development and introduction of new products requires substantial research and development and marketing expenditures, which we may be unable to recover if the new products do not achieve commercial success and gain widespread market acceptance. Such failures may arise if our new products do not reach the market in a timely manner or fail to align with consumer tastes, which may occur for many reasons, including our non-exclusive collaboration with third-party seasoning and flavor houses. Product innovation may also result in increased costs resulting from the use of new manufacturing techniques, capital equipment expenditures, new raw materials and ingredients, new product formulas and possibly new manufacturers. There may also be regulatory restrictions on the production and advertising of our new products, and our new products may cannibalize sales of our existing products. In addition, under-performance of new product launches may damage overall brand credibility with customers and consumers. Further, new products may not achieve success in the marketplace, due to lack of demand, failure to meet consumer tastes or otherwise. If we are unsuccessful in our product innovation efforts and demand for our products declines, our business would be negatively affected.
We may be unable to successfully identify and execute acquisitions or dispositions or to successfully integrate acquisitions or carve out dispositions.
We have periodically acquired other businesses or business assets, and we plan to selectively pursue acquisitions in the future to continue to grow and increase our profitability. Our acquisition strategy is based on identifying and acquiring brands with products that complement our existing products and identifying and acquiring brands in new categories and in new geographies for purposes of expanding our platform of snack foods. Although we regularly evaluate multiple acquisition candidates, we cannot be certain that we will be able to successfully identify suitable acquisition candidates, negotiate acquisitions of identified candidates on terms acceptable to us, or integrate acquisitions that we complete.
Our acquisition strategy involves numerous risks and uncertainties, including intense competition for suitable acquisition targets, which could increase valuations or adversely affect our ability to consummate deals on favorable or acceptable terms, the potential unavailability of financial resources necessary to consummate acquisitions in the future, the risk that we improperly value and price a target, the inability to identify all of the risks and liabilities inherent in a target company notwithstanding our due diligence efforts and the limitations on indemnification or other protections to mitigate those risks, the diversion of management’s attention from the operations of our business and strain on our existing personnel, increased leverage due to additional debt financing that may be required to complete an acquisition, dilution of our stockholder’s net current book value per share if we issue additional equity securities to finance an acquisition, difficulties in identifying suitable acquisition targets or in completing any transactions identified on sufficiently favorable terms and the need to obtain regulatory or other governmental approvals that may be necessary to complete acquisitions.
Any future acquisitions may pose risks associated with entry into new geographic markets, including outside the United States, distribution channels, lines of business or product categories, where we may not have significant or any prior experience and where we may not be as successful or profitable as we are in businesses and geographic regions where we have greater familiarity and brand recognition. Potential acquisitions may also entail significant transaction costs and require a significant amount of management time, even where we are unable to consummate or decide not to pursue a particular transaction.
Even when acquisitions are completed, integration of acquired entities and business lines can involve significant difficulties, such as failure to achieve financial or operating objectives with respect to an acquisition; strain on our personnel, systems and operational and managerial controls and procedures; the need to modify systems or to add management resources; difficulties in the integration and retention of customers or personnel and the integration and effective deployment of operations or technologies; amortization of acquired assets (which would reduce future reported earnings); possible adverse short-term effects on cash flows or operating results; diversion of management’s attention from the operations of our business; integrating personnel with diverse backgrounds and organizational cultures; coordinating sales and marketing functions; and failure to retain key personnel of an acquired business. Failure to manage these acquisition growth risks could have an adverse effect on us.
From time to time, we also evaluate potential dispositions that align with our strategic objectives. The success of these initiatives depends on our ability to identify suitable buyers and negotiate favorable valuation and other risk allocation terms. We also may not be successful in separating any divested assets or businesses, which could have significant operational impacts. Further losses on the divestiture of, or lost operating income from, such assets or businesses may adversely affect our future earnings. Any divestitures also may result in continued financial exposure to the divested businesses following the transaction, such as through indemnification obligations.
The geographic concentration of our markets may adversely impact us if we are unable to effectively diversify the markets in which we participate.
Our legacy business has been heavily concentrated in the Northeast and Mid-Atlantic regions of the United States. In recent years, however, through a series of acquisitions, we have expanded our geographic footprint to include locations across the United States. This expansion, however, is relatively recent and we remain subject to the risks associated with entry into new geographic markets, including failure to achieve financial or operating objectives with respect to the newly expanded regions. See “We may be unable to successfully identify and execute acquisitions or dispositions or to successfully integrate acquisitions or carve out dispositions.” above in this section for a summary of risks associated with our geographic expansion and acquisition strategy. Further, it is possible that the failure to effectively integrate acquired companies based in new geographic markets may frustrate our goal of diversifying our geographic presence, following which we may remain vulnerable to the financial risks associated with the lack of geographical diversity.
We may not be able to attract and retain the highly skilled people we need to support our business.
We depend on the skills and continued service of key personnel, including our experienced management team. In addition, our ability to achieve our strategic and operating goals depends on our ability to identify, hire, train and retain qualified individuals. We also compete with other companies both within and outside of our industry for talented personnel, and we may lose key personnel or fail to attract, train and retain other talented personnel. Any such loss or failure may adversely affect our business or financial results.
Activities related to identifying, recruiting, hiring and integrating qualified individuals may require significant time and expense. We may not be able to locate suitable replacements for key personnel who leave or suffer extended illness or disability, or offer employment to potential replacements on reasonable terms, each of which may adversely affect our business and financial results.
Impairment in the carrying value of goodwill or other intangible assets could have an adverse impact on our financial results.
The net carrying value of goodwill represents the fair value of acquired businesses in excess of identifiable assets and liabilities, and the net carrying value of other intangibles represents the fair value of trademarks, customer relationships, route intangibles and other acquired intangibles. Pursuant to U.S. generally accepted accounting principles (“U.S. GAAP”), we are required to perform impairment tests on our goodwill and indefinite-lived intangible assets annually, or at any time when events occur, which could impact the value of our reporting unit or our indefinite-lived intangibles. These values depend on a variety of factors, including the success of our business, market conditions, earnings growth and expected cash flows. Impairments to goodwill and other intangible assets may be caused by factors outside our control, such as increasing competitive pricing pressures, changes in discount rates based on changes in cost of capital or lower than expected sales and profit growth rates. In addition, if we see the need to consolidate certain brands, we could experience impairment of our trademark intangible assets. There were no adjustments for impairments recorded in fiscal years 2024, 2023 or 2022, apart from an impairment related to our termination of a master distribution right of approximately $2.0 million in fiscal 2022. Significant and unanticipated changes in our business could require additional non-cash charges for impairment in a future period which may significantly affect our financial results in the period of such charge. For additional information regarding impairments to our goodwill and intangible assets, see Goodwill and Indefinite-Lived Intangible Assets under Critical Accounting Policies and Estimates within Item 7. Management's Discussion and Analysis of Financial Condition and Results of Operations and Note 5. Goodwill and Intangible Assets, Net within the Audited Financial Statements.
Our intellectual property rights are valuable, and any inability to protect them could reduce the value of our products and brands. However, if consumers do not identify with our trademarks or other intellectual property rights, our brand may be significantly and adversely impaired.
We consider our intellectual property rights, particularly our trademarks, to be a significant and valuable aspect of our business. We protect our intellectual property rights through a combination of trademark, trade dress, patent, copyright and trade secret protection, contractual agreements and policing of third-party misuses of our intellectual property. Our failure to obtain or adequately protect our intellectual property, including in response to developing artificial intelligence technologies, or any change in law that lessens or removes the current legal protections of our intellectual property may diminish our competitiveness and adversely affect our business and financial results.
Competing intellectual property claims that impact our brands or products may arise unexpectedly. Any litigation or disputes regarding intellectual property may be costly and time-consuming and may divert the attention of our management and key personnel from our business operations. We also may be subject to significant damages or injunctions against development, launch and sale of certain products. Additionally, the continued use of certain of the Company's trademarks is contingent on third-party license agreements, and the termination or cancellation of any such license agreement may negatively impact our business. Any of these occurrences may harm our business and financial results.
While we believe that our trademarks and other intellectual property rights provide our business with significant value, we cannot make any assurances that consumers adequately identify with, or will continue to identify with, our trademarks and other intellectual property rights. If consumers do not identify with our trademarks and other intellectual property rights, our brand may be significantly and adversely impaired.
Disruptions, failures or security breaches of our information technology infrastructure could have a negative impact on our operations and subject us to significant losses.
Information technology is critically important to our business operations. We use information technology to manage all business processes including manufacturing, financial, logistics, sales, marketing and administrative functions. These processes collect, interpret and distribute business data and facilitate communication internally and externally with associates, suppliers, customers and others. Cyberattacks and other cyber incidents are occurring more frequently, are constantly evolving in nature, are becoming more sophisticated and are being made by groups and individuals with a wide range of expertise and motives, including without limitation criminal hackers, hacktivists, state-sponsored institutions, terrorist organizations and individuals or groups participating in organized crime. Such cyberattacks and cyber incidents can take many forms, including without limitation cyber extortion, denial of service, social engineering, such as impersonation attempts to fraudulently induce employees or others to disclose information or unwittingly provide access to systems or data, introduction of viruses or malware, such as ransomware through phishing emails, website defacement or theft of passwords and other credentials.
We and third parties with which we have shared data are, or may become, the target of attempted cyber and other security threats, and we have experienced cybersecurity incidents in the past and may experience them in the future. While we believe our security technology tools and processes provide adequate measures of protection against security breaches and reduce cybersecurity risks and we have business continuity plans designed to respond to other system disruptions, disruptions in or failures of information technology systems are possible and could have a negative impact on our operations or business reputation. Failure of our systems (or the systems of third party systems on which we rely), including failures due to cyber-attacks that would prevent the ability of systems to function as intended, could cause transaction errors, loss of customers and sales, and could have negative consequences to our company, our associates and those with whom we do business. This in turn could have a negative impact on our financial condition and results of operations. In addition, the cost to remediate any damage to our information technology systems suffered as a result of a cyber-attack could be significant. While we currently maintain insurance coverage that, subject to its terms and conditions, is intended to address costs associated with certain aspects of cybersecurity incidents and information technology failures, this insurance coverage may not, depending on the specific facts and circumstances surrounding an incident, cover any or all losses or types of claims that arise from an incident. See Item 1C. Cybersecurity for further discussion of our cybersecurity risk management, governance, and incidents.
Climate change or legal, regulatory or market measures to address climate change may negatively affect our business and operations or damage our reputation.
There is concern that carbon dioxide and other greenhouse gases in the atmosphere have an adverse impact on global temperatures, weather patterns and the frequency and severity of extreme weather and natural disasters. In the event that such climate change has a negative effect on agricultural productivity, we may be subject to decreased availability or less favorable pricing for certain commodities that are necessary for our products, such as potatoes, oil, flour, wheat, corn, cheese, spices, seasonings and packaging materials. Natural disasters and extreme weather conditions, such as a severe drought, hurricane, tornado, earthquake, wildfire or flooding, may disrupt the productivity of our facilities or the operation of our supply chain and unfavorably impact the demand for, or our consumers’ ability to purchase, our products.
Concern over climate change may result in new or increased regional, federal or global legal and regulatory requirements to reduce or mitigate the effects of greenhouse gases. In the event that such regulation is more stringent than current regulatory obligations or the measures that we are currently undertaking to monitor and improve our energy efficiency, we may experience disruptions in, or significant increases in our costs of operation and delivery and be required to make additional investments in facilities and equipment or relocate our facilities. In particular, increasing regulation of fuel emissions can substantially increase the cost of energy, including fuel, required to operate our facilities’ production lines, or transport and distribute our products, thereby substantially increasing the distribution and supply chain costs associated with our products. As a result, the effects of climate change can negatively affect our business and operations. Concern over climate change is also increasingly impacting consumer behavior, including preferences for packaging, shipping and other operational practices that are perceived to reduce or delay the impacts of climate change.
In addition, any failure to achieve our goals with respect to reducing our impact on the environment or perception (whether or not valid) of our failure to act responsibly with respect to the environment or to effectively respond to new, or changes in, legal or regulatory requirements concerning climate change can lead to adverse publicity, resulting in an adverse effect on our business, reputation, financial condition or results of operations.
Liabilities, claims or new laws or regulations with respect to environmental matters could have a significant negative impact on our business.
As with other companies engaged in similar businesses, the nature of our operations exposes us to the risk of liabilities and claims with respect to environmental matters, including those relating to the disposal and release of hazardous substances. Furthermore, our operations are governed by laws and regulations relating to workplace safety and worker health, which, among other things, regulate associate exposure to hazardous chemicals in the workplace. Any material costs incurred in connection with such liabilities or claims could have a material adverse effect on our business, results of operations and financial condition.
The increasing global focus on climate change may lead to new environmental laws and regulations that impact our business. Any such laws or regulations enacted in the future, or any changes in how existing laws or regulations will be enforced, administered or interpreted, may lead to an increase in compliance costs, cause us to change the way we operate or expose us to additional risk of liabilities and claims, which could have a material adverse effect on our business, results of operations and financial condition.
We are subject to increasing focus on ESG issues, including those related to climate change, and any perceived failure by us to meet ESG initiatives may negatively impact our business.
As climate change, land use, water use, deforestation, recyclability or recoverability of packaging, plastic waste, ingredients and other ESG and sustainability concerns become more prevalent, federal, state and local governments, non-governmental organizations and our customers, consumers and investors are increasingly sensitive to these issues. Our reputation can be damaged if we or others in our industry do not act, or are perceived not to act, responsibly with respect to our impact on the environment. This increased focus on sustainability may also result in new laws, regulations and requirements that could cause disruptions in or increased costs associated with developing, manufacturing and distributing our products. We could also lose revenue if our consumers change brands, our customers refuse to buy our products, or investors choose not to invest in our common stock if we do not meet their ESG and sustainability expectations. For example, during 2021, some of our major customers requested we respond to various questionnaires to evaluate our ESG efforts. Efforts to meet these standards could impact our costs, and failure to meet our customers’ expectations could impact our sales and business reputation. While we strive to minimize the environmental impact of our global operations, we may experience reduced demand for our products and loss of customers if we do not meet their ESG expectations, which could result in a material adverse effect on our financial condition and results of operations.
At the same time, stakeholders and regulators have increasingly expressed or pursued opposing views, legislation, and investment expectations with respect to ESG initiatives, including the enactment or proposal of “anti-ESG” legislation or policies. Moreover, we may determine that it is in the best interest of our Company and our stockholders to prioritize other business, social, governance or sustainable investments over the achievement of our current commitments based on economic, regulatory and social factors, business strategy or pressure from investors, activist groups or other stakeholders.
Our debt instruments contain covenants that impose restrictions on our operations that may adversely affect our ability to operate our business if we fail to meet those covenants or otherwise suffer a default thereunder.
Our debt instruments require us to comply with certain covenants before engaging in certain activities and terms which may limit our ability to enter into new acquisitions, licenses, mergers, and to take on new debt and sell assets. The terms of our debt instruments could adversely affect our operations and limit our ability to plan for or respond to changes in our business. These and other terms in the debt instruments have to be monitored closely for compliance and could restrict our ability to grow our business or enter into transactions that we believe will be beneficial to our business. Certain of our debt agreements contain cross-default provisions with other debt, which means that a default under certain of our debt instruments may cause a default under such other debt. If we are unable to comply with covenants and terms in the agreements, commitments by the lenders thereunder may be terminated and the repayment of our indebtedness may be accelerated, and for any debt that is secured, lenders could take possession of the assets securing such debt. As a result, any default under our debt covenants could have a material adverse effect on our financial condition and our ability to meet our obligations.
Changes in interest rates may adversely affect our earnings and/or cash flows.
As of December 29, 2024, we had borrowed an aggregate of $690.1 million subject to variable interest rate terms. In the future, we may have additional debt outstanding with exposure to interest rate risk. As a result, we may be adversely impacted by fluctuating interest rates. Also, as of December 29, 2024, we held derivative instruments whose market values are subject to changes in the Secured Overnight Financing Rate (“SOFR”). These derivative instruments have resulted, and may continue to result, in volatility in our financial results due to interest rate fluctuations.
Disruptions in the worldwide financial markets may materially and adversely affect our ability to obtain new credit.
Instability in financial markets may impact our ability, or increase the cost, to enter into new credit agreements in the future. Additionally, it may weaken the ability of our customers, suppliers, IOs, third-party distributors, banks, insurance companies and other business partners to perform their obligations in the normal course of business, which could expose us to losses or disrupt the supply of inputs we rely upon to conduct our business. If one or more of our key business partners fail to perform as expected or are contracted for any reason, our business could be negatively impacted.
The imposition or proposed imposition of new or increased income or product taxes can adversely affect our business, financial condition or results of operations.
Increases in income tax rates or other changes in income tax laws in the United States or any particular jurisdiction in which we operate can reduce our after-tax income and adversely affect our business, financial condition or results of operations. In particular, changes in the United States tax regime, including changes in how existing tax laws are interpreted or enforced, can adversely affect our business, financial condition or results of operations. An increase in tax rates would also cause a corresponding increase in the Company’s tax receivable agreement ("TRA") liability as the Company is obligated to share 85% of the cash tax savings that are attributable to its increased tax basis in the UBH partnership assets per the 2020 business combination, future exchanges of common limited liability company units of UBH ("Common Company Units") for shares of the Company's stock by the Noncontrolling Interest Holders, and annual TRA Payments, as well as the tax basis step-up that occurred in connection with the acquisition of Kennedy Endeavors, LLC in 2019.
We are also subject to regular reviews, examinations and audits by the Internal Revenue Service ("IRS") and other taxing authorities with respect to income and non-income-based taxes. Economic and political pressures to increase tax revenues in jurisdictions in which we operate, or the adoption of new or reformed tax legislation or regulation, may make resolving tax disputes more difficult and the final resolution of tax audits and any related litigation can differ from our historical provisions and accruals, resulting in an adverse impact on our business, financial condition or results of operations.
Additionally, certain jurisdictions in which our products are made, manufactured, distributed or sold have either imposed, or are considering imposing, new or increased taxes on the manufacture, distribution or sale of our products, ingredients or substances contained in, or attributes of, our products or commodities used in the production of our products. These tax measures, whatever their scope or form, could increase the cost of certain of our products, reduce consumer demand and overall consumption of our products, lead to negative publicity (whether based on scientific fact or not) or leave consumers with the perception (whether or not valid) that our products do not meet their health and wellness needs, resulting in adverse effects on our business, financial condition or results of operations.
Pandemics, epidemics or other disease outbreaks may change or disrupt consumption patterns, supply chains, and production processes, which could materially affect our operations and results of operations.
Pandemics, epidemics or other disease outbreaks could significantly change consumption, production, or distribution patterns for our products, including, without limitation, by causing quarantines, restrictions on public gatherings, economic downturns, disruptions to supply chain logistics, or workforce or travel restrictions. We have developed, and periodically update, our contingency plans to address disruptions such as pandemics, epidemics and other disease outbreaks. However, if in the event of such a disruption our contingency plans are partially or entirely ineffective, our ability to maintain production output could be materially and adversely impacted, which could result in an ability to meet delivery requirements and generate revenue.
We are subject to risks from changes to the trade policies and tariff and import/export regulations by the U.S. and/or other foreign governments.
Changes in the import and export policies, including trade restrictions, new or increased tariffs or quotas, embargoes, sanctions and countersanctions, safeguards or customs restrictions by the U.S. and/or other foreign governments, could require us to change the way we conduct business and adversely affect our financial condition, results of operations, reputation and our relationships with customers, suppliers and employees in the short- or long-term. Though our business is predominantly located within the U.S., certain of our materials, equipment, and other costs may be sourced from outside of the U.S., and changes in laws and policies impacting those countries from which we currently source our materials could adversely affect our business. Additionally, our U.S.-based vendors may be dependent on international sources, and changes in laws and policies impacting countries from which our vendors obtain materials could adversely affect our business.
Risks Related to the Ownership of our Securities.
Resales of shares of our Class A Common Stock could cause the market price of our Class A Common Stock to drop significantly, even if our business is doing well.
We had 83,537,542 shares of Class A Common Stock outstanding as of December 29, 2024, many of which may be freely resold by the holder of such shares or which have been registered by us for resale on a registration statement. We have also registered up to 9,500,000 shares of Class A Common Stock that we may issue under the Utz Brands, Inc. 2020 Omnibus Equity Incentive Plan (as amended, the “2020 Plan”), 1,500,000 shares of Class A Common Stock that we may issue under the Utz Brands, Inc. 2021 Employee Stock Purchase Plan, and 1,557,941 shares of Class A Common Stock that we may issue under the Utz Quality Foods, LLC 2020 Long-Term Incentive Plan. To the extent such shares have vested or vest in the future (and settle into shares, in the case of restricted stock units), they can be freely sold in the public market upon issuance, subject to volume limitations applicable to affiliates.
In addition, we have granted certain registration rights in respect of shares of Class A Common Stock that are obtainable in exchange for common units of UBH held by the Noncontrolling Interest Holders. Furthermore, the exercise of up to 7,200,000 private placement warrants, will increase the number of issued and outstanding shares when exercised, and may reduce the market price of our Class A Common Stock.
Potential sales of shares of Class A Common Stock described above or the perception of such sales may depress the market price of our Class A Common Stock. The price of our Class A Common Stock can also vary due to general economic conditions and forecasts, our general business condition and the release of our financial reports.
We are a holding company and our only material asset is our interest in UBH, and we are accordingly dependent upon distributions made by our subsidiaries to pay taxes, make payments under the TRA and pay dividends.
We are a holding company with no material assets other than our ownership of the Common Company Units and our managing member interest in UBH. As a result, we have no independent means of generating revenue or cash flow. Our ability to pay taxes, make payments under the TRA and pay dividends will depend on the financial results and cash flows of UBH and its subsidiaries and the distributions we receive from UBH. Deterioration in the financial condition, earnings or cash flow of UBH and its subsidiaries for any reason could limit or impair UBH’s ability to pay such distributions. Additionally, to the extent that we need funds and UBH and/or any of its subsidiaries are restricted from making such distributions under applicable law or regulation or under the terms of any financing arrangements, or UBH is otherwise unable to provide such funds, it could materially adversely affect our liquidity and financial condition.
UBH is intended to be treated as a partnership for U.S. federal income tax purposes and, as such, generally will not be subject to any entity-level U.S. federal income tax. Instead, taxable income will be allocated to holders of Common Company Units. Accordingly, we will be required to pay income taxes on our allocable share of any net taxable income of UBH. Under the terms of the Third Amended and Restated Limited Liability Company Agreement of UBH (the “Third Amended and Restated Limited Liability Company Agreement”), UBH is obligated to make tax distributions to holders of Common Company Units (including us) calculated at certain assumed tax rates. In addition to income taxes, we will also incur expenses related to our operations and payment obligations under the TRA, which could be significant. We intend to cause UBH to make ordinary distributions and tax distributions to holders of Common Company Units on a pro rata basis in amounts sufficient to cover all applicable taxes, relevant operating expenses, payments under the TRA and dividends, if any, declared by us. However, as discussed below, UBH’s ability to make such distributions may be subject to various limitations and restrictions including, but not limited to, retention of amounts necessary to satisfy the obligations of UBH and its subsidiaries, restrictions on distributions that would violate UBH’s debt agreements, or any applicable law, or that would have the effect of rendering UBH insolvent. To the extent that we are unable to make payments under the TRA for any reason, such payments will be deferred and will accrue interest until paid; provided, however, that nonpayment for a specified period may constitute a material breach of the TRA and therefore accelerate payments under the TRA, which could be substantial.
We anticipate that the distributions we receive from UBH may, in certain periods, exceed our actual tax liabilities and obligations to make payments under the TRA. The Company Board, in its sole discretion, will make any determination from time to time with respect to the use of any such excess cash so accumulated, which may include, among other uses, to pay dividends on our Class A Common Stock. We will have no obligation to distribute such cash (or other available cash other than any declared dividend) to our stockholders.
Dividends on our Class A Common Stock, if any, will be paid at the discretion of the Company Board, which will consider, among other things, our available cash, available borrowings and other funds legally available therefor, taking into account the retention of any amounts necessary to satisfy our obligations that will not be reimbursed by UBH, including taxes and amounts payable under the TRA and any restrictions in bank financing agreements. Financing arrangements may include restrictive covenants that restrict our ability to pay dividends or make other distributions to our stockholders. In addition, UBH is generally prohibited under Delaware law from making a distribution to a member to the extent that, at the time of the distribution, after giving effect to the distribution, liabilities of UBH exceed the fair value of its assets. UBH’s subsidiaries are generally subject to similar legal limitations on their ability to make distributions to UBH. If UBH does not have sufficient funds to make distributions, our ability to declare and pay cash dividends may also be restricted or impaired.
Pursuant to the TRA, we are required to pay to the Noncontrolling Interest Holders 85% of the tax savings that we realized as a result of increases in tax basis in UBH’s assets as a result of our 2020 business combination, future exchanges of the Common Company Units for shares of Class A Common Stock (or cash) , and certain other tax attributes of UBH, and tax benefits attributable to payments under the TRA, and those payments may be substantial.
The Noncontrolling Interest Holders sold Common Company Units for cash consideration in the 2020 business combination and may in the future exchange their Common Company Units, together with the surrender and cancellation of an equal number of shares of Class V Common Stock, for shares of our Class A Common Stock (or cash) pursuant to the Third Amended and Restated Limited Liability Company Agreement. In addition, we purchased common units and preferred units in the Noncontrolling Interest Holders from third-party members, and the Noncontrolling Interest Holders redeemed such units from us. These sales, purchases, redemptions and exchanges resulted in increases in our allocable share of the tax basis of UBH’s assets. These increases in tax basis may increase tax depreciation and amortization deductions and therefore reduce the amount of income tax that we would otherwise be required to pay in the future had such sales and exchanges never occurred.
In connection with the 2020 business combination, we entered into the TRA, which generally provides for the payment of 85% of the cash tax savings, if any, that we realize as a result of these increases in tax basis, certain other tax attributes of UBH and tax benefits attributable to payments under the TRA. These payments are our obligations and not of UBH. The actual increase in our allocable share of UBH’s tax basis in its assets, as well as the amount and timing of any payments under the TRA, will vary depending upon a number of factors, including the timing of exchanges, the market price of the Class A Common Stock at the time of the exchange, the extent to which such exchanges are taxable and the amount and timing of the recognition of our income. While many of the factors that will determine the amount of payments that we will make under the TRA are outside of our control, we expect that the TRA payments will be substantial and could have a material adverse effect on our financial condition. To the extent that we are unable to make timely payments under the TRA for any reason, the unpaid amounts will be deferred and will accrue interest until paid; however, nonpayment for a specified period may constitute a material breach of the TRA and therefore accelerate payments due under the TRA, as further described below. Furthermore, our future obligation to make payments under the TRA could make us a less attractive target for an acquisition, particularly in the case of an acquirer that cannot use some or all of the tax benefits that may be deemed realized under the TRA.
In certain cases, payments under the TRA may exceed the actual tax benefits we realize or be accelerated.
Payments under the TRA will be based on the tax reporting positions that we determine, and the IRS or another taxing authority may challenge all or any part of the tax basis increases, as well as other tax positions that we take, and a court may sustain such a challenge. In the event that any tax benefits initially claimed by us are disallowed, the Noncontrolling Interest Holders will not be required to reimburse us for any excess payments that may previously have been made under the TRA. Excess TRA payments made to the Noncontrolling Interest Holders will be netted against any future cash payments otherwise required to be made by us, if any, after the determination of such excess. However, a challenge to any tax benefits initially claimed by us may not arise for a number of years following the initial time of such payment or, even if challenged early, such excess cash payment may be greater than the amount of future cash payments that we might otherwise be required to make under the TRA and, as a result, there might not be future cash payments against which to net. As a result, in certain circumstances we could make TRA payments in excess of our actual income tax savings, which could materially impair our financial condition.
Moreover, the TRA provides that, in the event that (i) we exercise our early termination rights under the TRA, (ii) certain changes of control of the Company or UBH occur, (iii) we, in certain circumstances, fail to make a required TRA payment by its final payment date, which non-payment continues until the later of 30 days following receipt by us of written notice thereof and 60 days following such final payment date or (iv) we materially breach any of our material obligations under the TRA other than as described in the foregoing clause (iii), which breach continues without cure for 30 days following receipt by us of written notice thereof and written notice of acceleration is received by us thereafter (except that in the case that the TRA is rejected in a case commenced under bankruptcy laws, no written notice of acceleration is required), in the case of clauses (iii) and (iv), unless certain liquidity exceptions apply, our obligations under the TRA will accelerate and we will be required to make a lump-sum cash payment to the Noncontrolling Interest Holders equal to the present value of all forecasted future payments that would have otherwise been made under the TRA, which lump-sum payment would be based on certain assumptions, including those relating to our future taxable income. The lump-sum payment could be substantial and could exceed the actual tax benefits that we realize subsequent to such payment because such payment would be calculated assuming, among other things, that we would have certain tax benefits available to us and that we would be able to use the potential tax benefits in future years.
There may be a material negative effect on our liquidity if the payments under the TRA exceed the actual income tax savings that we realize. Furthermore, our obligations to make payments under the TRA could also have the effect of delaying, deferring or preventing certain mergers, asset sales, other forms of business combinations or other changes of control.
Delaware law, the Certificate of Incorporation, Bylaws, and certain other agreements contain certain provisions, including anti-takeover provisions that limit the ability of stockholders to take certain actions and could delay or discourage takeover attempts that stockholders may consider favorable.
Our Certificate of Incorporation and the General Corporation Law of the State of Delaware (the “DCL”), contain provisions that could have the effect of rendering more difficult, delaying, or preventing an acquisition deemed undesirable by the Company Board and therefore depress the trading price of our Class A Common Stock. These provisions could also make it difficult for stockholders to take certain actions, including electing directors who are not nominated by the current members of the Company Board or taking other corporate actions, including effecting changes in management. Among other things, the Certificate of Incorporation and Bylaws include provisions regarding:
•A classified board of directors with three-year staggered terms, which could delay the ability of stockholders to change the membership of a majority of the Company Board;
•The ability of the Company Board to issue shares of preferred stock, including “blank check” preferred stock and to determine the price and other terms of those shares, including preferences and voting rights, without stockholder approval, which could be used to significantly dilute the ownership of a hostile acquirer;
•The limitation of the liability of, and the indemnification of, our directors and officers;
•The right of the Company Board to elect a director to fill a vacancy created by the expansion of the Company Board or the resignation, death or removal of a director, which prevents stockholders from being able to fill vacancies on the Company Board;
•The requirement that directors may only be removed from the Company Board for cause;
•The requirement that a special meeting of stockholders may be called only by the Company Board, the chairman of the Company Board or our chief executive officer, which could delay the ability of stockholders to force consideration of a proposal or to take action, including the removal of directors;
•Controlling the procedures for the conduct and scheduling of the Company Board and stockholder meetings;
•The requirement for the affirmative vote of holders of (i) (a) at least 66 2∕3% or 80%, in case of certain provisions, or (b) a majority, in case of other provisions, of the voting power of all of the then outstanding shares of the voting stock, voting together as a single class, to amend, alter, change or repeal certain provisions of our Certificate of Incorporation, and (ii) (a) at least 66 2∕3%, in case of certain provisions, or (b) a majority, in case of other provisions, of the voting power of all of the then outstanding shares of the voting stock, voting together as a single class, to amend, alter, change or repeal certain provisions of our Bylaws, which could preclude stockholders from bringing matters before annual or special meetings of stockholders and delay changes in the Company Board and also may inhibit the ability of an acquirer to effect such amendments to facilitate an unsolicited takeover attempt;
•The ability of the Company Board to amend the Bylaws, which may allow the Company Board to take additional actions to prevent an unsolicited takeover and inhibit the ability of an acquirer to amend the Bylaws to facilitate an unsolicited takeover attempt; and
•Advance notice procedures with which stockholders must comply to nominate candidates to the Company Board or to propose matters to be acted upon at a stockholders’ meeting, which could preclude stockholders from bringing matters before annual or special meetings of stockholders and delay changes in the Company Board and also may discourage or deter a potential acquirer from conducting a solicitation of proxies to elect the acquirer’s own slate of directors or otherwise attempting to obtain control of the Company.
These provisions, alone or together, could delay or prevent hostile takeovers and changes in control or changes in the Company Board or management.
In addition, as a Delaware corporation, we will generally be subject to provisions of Delaware law, including the DGCL. Although we elected not to be governed by Section 203 of the DGCL, certain provisions of the Certificate of Incorporation will, in a manner substantially similar to Section 203 of the DGCL, prohibit certain of our stockholders (other than certain stockholders who are specified in that certain Investor Rights Agreement initially entered into by UBI and certain of its stockholders in connection with the 2020 business combination (as amended, the "Investor Rights Agreement")) who hold 15% or more of our outstanding capital stock from engaging in certain business combination transactions with us for a specified period of time unless certain conditions are met.
Any provision of the Certificate of Incorporation, Bylaws or Delaware law that has the effect of delaying or preventing a change in control could limit the opportunity for stockholders to receive a premium for their shares of our capital stock and could also affect the price that some investors are willing to pay for the our Class A Common Stock or Class V Common Stock (collectively, without duplication, “Common Stock”).
In addition, the provisions of the Investor Rights Agreement and a related standstill agreement provide the stockholders party thereto with certain rights relating to the Company Board and include certain limitations on such stockholders’ solicitations of proxies or seeking to influence any person with respect to voting in favor of any director not nominated pursuant to the Investor Rights Agreement or by our Board, which could also have the effect of delaying or preventing a change in control.
The Certificate of Incorporation designates the Court of Chancery of the State of Delaware as the sole and exclusive forum for certain types of actions and proceedings that may be initiated by our stockholders, which could limit our stockholders’ ability to obtain a favorable judicial forum for disputes with us or our directors, officers or other associates.
The Certificate of Incorporation provides that, unless we consent in writing to the selection of an alternative forum, (i) any derivative action or proceeding brought on behalf of us, (ii) any action asserting a claim of breach of a fiduciary duty owed by any of our current or former directors, officers, other associates, agents or stockholders to us or our stockholders, or any claim for aiding and abetting such alleged breach, (iii) any action asserting a claim against us or any of our current or former directors, officers, other associates, agents or stockholders (a) arising pursuant to any provision of the DGCL, the Certificate of Incorporation (as it may be amended or restated) or the Bylaws or (b) as to which the DGCL confers jurisdiction on the Delaware Court of Chancery or (iv) any action asserting a claim against us or any of our current or former directors, officers, other associates, agents or stockholders governed by the internal affairs doctrine of the law of the State of Delaware shall, as to any action in the foregoing clauses (i) through (iv), to the fullest extent permitted by law, be solely and exclusively brought in the Delaware Court of Chancery; provided, however, that the foregoing shall not apply to any claim (a) as to which the Delaware Court of Chancery determines that there is an indispensable party not subject to the jurisdiction of the Delaware Court of Chancery (and the indispensable party does not consent to the personal jurisdiction of the Court of Chancery within ten days following such determination), (b) which is vested in the exclusive jurisdiction of a court or forum other than the Delaware Court of Chancery, or (c) arising under federal securities laws, including the Securities Act as to which the federal district courts of the United States of America shall, to the fullest extent permitted by law, be the sole and exclusive forum. Notwithstanding the foregoing, the provisions of Article XII of the Certificate of Incorporation will not apply to suits brought to enforce any liability or duty created by the Securities Exchange Act of 1934, as amended (the “Exchange Act”), or any other claim for which the federal district courts of the United States of America shall be the sole and exclusive forum.
Any person or entity purchasing or otherwise acquiring any interest in any shares of our capital stock shall be deemed to have notice of and to have consented to the forum provisions in the Certificate of Incorporation. If any action the subject matter of which is within the scope of the forum provisions is filed in a court other than a court located within the State of Delaware (a “foreign action”) in the name of any stockholder, such stockholder shall be deemed to have consented to: (x) the personal jurisdiction of the state and federal courts located within the State of Delaware in connection with any action brought in any such court to enforce the forum provisions (an “enforcement action”); and (y) having service of process made upon such stockholder in any such enforcement action by service upon such stockholder’s counsel in the foreign action as agent for such stockholder.
This choice-of-forum provision may limit a stockholder’s ability to bring a claim in a judicial forum that it finds favorable for disputes with us or our directors, officers, stockholders, agents or other associates, which may discourage such lawsuits. Alternatively, if a court were to find this provision of the Certificate of Incorporation inapplicable or unenforceable with respect to one or more of the specified types of actions or proceedings, we may incur additional costs associated with resolving such matters in other jurisdictions, which could materially and adversely affect our business, financial condition and results of operations and result in a diversion of the time and resources of our management and the Company Board.
Certain of our significant stockholders and Utz Brands Holdings members whose interests may differ from those of our other stockholders have the ability to significantly influence our business and management.
Pursuant to the Investor Rights Agreement, certain founder members of the Collier Creek partners LLC ("Sponsor"), the sponsor of Collier Creek Holdings ("CCH") and their family members (the “Founder Holders”), the a representative of the Sponsor (the “Sponsor Representative”), the Noncontrolling Interest Holders and the independent directors of CCH at the closing of the 2020 business combination in connection with the 2020 business combination, agreed to nominate, subject to certain step-down provisions, a certain number of Noncontrolling Interest Holders' nominees recommended by the Noncontrolling Interest Holders and Sponsor Nominees recommended by the Sponsor Representative. Further, under the Investor Rights Agreement, since the Company Board increased the number of directors above ten, so long as the Founders Holders or Noncontrolling Interest Holders own at least 75% of the economic interest in us that were held by such party immediately following the 2020 business combination (a “Qualified Party”), at least one representative of such Qualified Party serving on the Company Board must approve each action of the Company Board. Accordingly, the Noncontrolling Interest Holders and the successors to the Sponsor are able to significantly influence the approval of actions requiring Company Board approval through their voting power. Such stockholders will retain significant influence with respect to our management, business plans and policies, including the appointment and removal of our officers. In particular, the Noncontrolling Interest Holders and the successors to the Sponsor could influence whether acquisitions, dispositions and other change of control transactions are approved. Additionally, for so long as the Noncontrolling Interest Holders hold at least 50% of the economic interests held in us and UBH as of closing of the 2020 business combination (without duplication) they will have consent rights over certain material transactions with respect to us and our subsidiaries, including UBH.
The successors to the Sponsor and each of their affiliates engage in a broad spectrum of activities, including investments in the financial services and technology industries. In the ordinary course of their business activities, the successors to the Sponsor and each of their affiliates may engage in activities where their interests conflict with our interests or those of our stockholders. The Certificate of Incorporation provides that none of the successors to the Sponsor, any of their respective affiliates or any director who is not employed by us (including any non-employee director who serves as one of its officers in both director and officer capacities) or his or her affiliates will have any duty to refrain from engaging, directly or indirectly, in the same business activities or similar business activities or lines of business in which we operate. The successors to the Sponsor and any of their respective affiliates also may pursue, in their capacities other than as members of the Company Board, acquisition opportunities that may be complementary to our business, and, as a result, those acquisition opportunities may not be available to us. In addition, the successors to the Sponsor may have an interest in pursuing acquisitions, divestitures and other transactions that, in its judgment, could enhance its investment, even though such transactions might involve risks to you.
Our private placement warrants may have an adverse effect on the market price of our Class A Common Stock, and the valuation of our private placement warrants could increase the volatility in our net income (loss) in our consolidated statements of earnings (loss).
We have in aggregate of 7,200,000 private placement warrants, each exercisable to purchase one Class A Common Stock at $11.50 per share. Under the terms of the warrant agreement, pursuant to which the private placement warrants were issued, the private placement warrants will expire in August of 2025. Such private placement warrants, when exercised, will increase the number of issued and outstanding Class A Common Stock and may reduce the value of the Class A Common Stock. Further, the remeasurement of our private placement warrants is the result of changes in stock price and private placement warrants outstanding at each reporting period. The remeasurement of warrant liabilities represents the mark-to market fair value adjustments to the outstanding private placement warrants. Significant changes in our stock price or the number of private placement warrants outstanding may adversely affect our net income (loss) in our consolidated statements of operations and comprehensive income (loss).
Item 1B. Unresolved Staff Comments
We have received no written comments regarding our periodic or current reports from the staff of the SEC that were issued 180 days or more preceding the end of our 2024 fiscal year and that remain unresolved.
Item 1C. Cybersecurity
Cybersecurity Risk Management
We maintain a cybersecurity risk management program intended to protect the confidentiality, integrity, and availability of our critical information technology systems and information.
Our cybersecurity risk management program is integrated into our overall enterprise risk management program, and shares common methodologies, incident reporting channels and governance processes, as those used in our enterprise risk management program. We designed and continue to assess our cybersecurity program based on the National Institute of Standards and Technology Cybersecurity Framework (“NIST CSF”), which we use as a guide to help us identify, prioritize and manage the cybersecurity risks that could materially affect our business, financial condition or results of operations.
Our cybersecurity risk management program includes a Security Incident Response Plan (“SIRP”). Our SIRP provides the Company with the capability of planning, identifying, containing, and tracking cybersecurity incidents experienced by us or our third party service providers. Our SIRP was established to reduce or minimize the impact of cybersecurity incidents on our networks, IT systems, users or business processes. The execution of our SIRP is led by the Chief Information Officer (“CIO”) in conjunction with our Security Incident Response Team, comprised of network, system administrators and cybersecurity experts, who, in the event of incident, together perform a damage assessment, deliver impact notifications and implement containment procedures depending upon the incident. In addition, we also engage third parties on an as needed basis to assess our cybersecurity practices and procedures.
Our cybersecurity risk management program also includes:
•a multi-layered approach to cybersecurity designed to protect our assets;
•identification of key risk areas through internal reviews and researching trends;
•ongoing mitigation in the areas of human behavior, data breaches, remote work, third party vendors, removable media and emerging threats;
•performance of multiple assessments both internally and externally;
•quarterly mandatory security training for employees as well as monthly phishing tests; and
•multi-factor authentication.
For the fiscal year ended December 29, 2024, we are not aware of any cybersecurity incidents or risks from cybersecurity incidents that have materially affected or were reasonably likely to materially affect our business strategy, results of operations or financial condition. We cannot guarantee that we may not experience any cybersecurity incidents or risks related to cybersecurity incidents in the future.
Cybersecurity Governance
We are committed to protecting our information technology (“IT”) assets and data. This commitment includes the protection of IT assets relevant to our operations, employees, customers and suppliers’ data, intellectual property and our products, among others.
Our Company Board plays a role in overseeing risks associated with cybersecurity threats. The Audit Committee of the Board has been delegated specific responsibility for overseeing the Company’s risk management of cybersecurity. The Audit Committee has appointed a member of the Audit Committee to receive certified cybersecurity training so he can provide specialized guidance to the Board and Company.
Periodically throughout the year, the CIO briefs the Audit Committee and Board on cybersecurity activities and long-term cybersecurity strategies, as well as general cybersecurity trends that could have a material impact on the Company. At any time, the Company Board members may raise concerns regarding the Company’s cybersecurity posture and recommend future changes to controls or procedures.
Our Audit Committee is also responsible for the oversight of risks from cybersecurity threats. Our CIO, Chief Financial Officer, and Security Incident Response Team provide regular updates to the Audit Committee of the Company Board on cybersecurity risks. Through these updates, the Audit Committee receives information on the status of key cybersecurity activities such as email phishing, event logging and data encryption, among others. Information regarding relevant cybersecurity training is provided as well.
Our CIO leads our management team in assessing and managing our response to cybersecurity threats and incidents. Our CIO has a Bachelor of Technology degree in Computer Science with over 30 years of experience in IT, with over five years managing IT Infrastructure and Security. The primary responsibility of the management team with respect to cybersecurity risk is managing our overall cybersecurity risk management program and supervising both our internal cybersecurity personnel and our retained external cybersecurity consultants, and working with all divisional, manufacturing, and functional teams on cybersecurity issues. The management team’s efforts to prevent, detect, mitigate and remediate cybersecurity risks and incidents are enhanced by monthly and quarterly briefings from internal security personnel, by receipt of threat intelligence and other information obtained from governmental, public or private sources, including external consultants, periodic assessments against the NIST CSF and through alerts and reports produced by security tools deployed in our IT environment. In the event a cybersecurity incident meets certain predetermined criteria, the management team along with the Security Incident Response Team would engage the Company Board.
Item 2. Properties
Our corporate headquarters is located at 900 High Street, Hanover, Pennsylvania 17331. We own the property for this corporate office, which includes approximately 44,000 square feet of corporate office space adjacent to one of our manufacturing facilities. In addition, we own other corporate office spaces in Hanover, Pennsylvania, including 1040 High Street with 16,000 square feet of office space, 240 Kindig Lane with 8,000 square feet of office space, and 350 Kindig Lane with 6,000 square feet of office space.
At December 29, 2024, we operated eight primary manufacturing sites located in Algona, Washington; Goodyear, Arizona; Wilkes-Barre, Pennsylvania; Hanover, Pennsylvania; Grand Rapids, Michigan; and Kings Mountain, North Carolina.
At December 29, 2024, we also operated 23 owned warehousing and distribution centers across the United States. These facilities supplement the warehousing and distribution capabilities co-located at our manufacturing facilities to ensure cost efficient delivery and timely access to products by our customers and DSD distributors. In total, we own approximately 32 properties in the United States that include manufacturing locations, warehouses, and office locations.
At December 29, 2024, we leased approximately 200 properties in the United States, which include warehouse locations, offices and small storage bins. We believe that our properties, taken as a whole, are generally well maintained and are adequate for our current and foreseeable business needs. Though we believe that our facilities are sufficient to meet our current needs, we believe that suitable additional space will be available as and when needed to maintain and support our ongoing business needs.
Item 3. Legal Proceedings
From time to time we are subject to legal actions arising from our normal business activities. Although we cannot predict with certainty the ultimate resolution of lawsuits, investigations and claims asserted against us, as of the date of this filing, we do not believe that we are party to any currently pending material legal proceedings, other than ordinary routine litigation incidental to the business, or any such proceedings known to be contemplated by governmental authorities.
Item 4. Mine Safety Disclosures
Not applicable.
PART II
Item 5. Market for Registrant’s Common Equity, Related Stockholder Matters and Issuer Purchases of Equity Securities
Market Information
Our Class A Common Stock is traded on the New York Stock Exchange ("NYSE") under the symbol “UTZ”. As of February 18, 2025, the closing price for our Class A Common Stock was $13.18.
Market price information regarding our Class V Common Stock and Common Company Units is not provided because there is no public market for our Class V Common Stock or our Common Company Units. Subject to certain timing restrictions, one Common Company Unit can be exchanged, together with the forfeiture of one share of Class V Common Stock, for a share of Class A Common Stock.
Holders
As of February 18, 2025, there were 27 holders of record of our Class A Common Stock and two holders of record of our Class V Common Stock. The number of record holders does not include beneficial owners of our securities whose shares are held in the names of various security brokers, dealers, and registered clearing agencies.
Dividends
Our Company Board has adopted a dividend policy, pursuant to which we will make quarterly dividends on the Class A Common Stock, to the extent our Company Board determines that we have available cash, available borrowings and other funds legally available therefor, taking into account the retention of any amounts necessary to satisfy our obligations that will not be reimbursed by Utz Brand Holdings, LLC, an affiliate of the Company ("UBH"), taxes and obligations under the TRA (as defined below), and any restrictions contained in any applicable bank financing agreement by which we or our subsidiaries are bound. We declared $22.6 million, $18.5 million and $17.6 million in cash dividends on our Class A Common Stock in fiscal years 2024, 2023 and 2022, respectively. The annual dividend rate on our Common Stock in fiscal years 2024, 2023 and 2022 was $0.270 per share, $0.228 per share and $0.219 per share, respectively.
Notwithstanding the foregoing, we will have no obligation to distribute such cash (or other available cash other than any declared dividend) to our stockholders. We are a holding company without any direct operations and have no significant assets other than our ownership interest in UBH. Accordingly, our ability to pay dividends depends upon the financial condition, liquidity and results of operations of, and our receipt of dividends, loans or other funds from, our subsidiaries. Our subsidiaries are separate and distinct legal entities and have no obligation to make funds available to us. In addition, there are various statutory, regulatory and contractual limitations and business considerations which impact the extent, if any, to which our subsidiaries may pay dividends, make loans or otherwise provide funds to us. For example, the ability of our subsidiaries to make distributions, loans and other payments to us for the purposes described above and for any other purpose may be limited by the terms of the agreements governing our outstanding indebtedness. The declaration and payment of dividends is also at the discretion of our Company Board and depends on various factors including our results of operations, financial condition, cash requirements, prospects and other factors deemed relevant by our Company Board.
In addition, under Delaware law, our Company Board may declare dividends only to the extent of our surplus (which is defined as total assets at fair market value minus total liabilities, minus statutory capital) or, if there is no surplus, out of our net profits for the then-current and/or immediately preceding fiscal year.
Performance
The following graph compares the total shareholder return from December 29, 2019 through December 29, 2024, of (i) our Class A Common Stock, (ii) the Standard and Poor's 500 Stock Index (“S&P 500 Index”) and (iii) the Standard and Poor’s ("S&P") 1500 Packaged Foods & Meats Index. The stock performance graph and table assume an initial investment of $100 on December 31, 2019, and that all dividends of the S&P 500 Index and S&P 1500 Packaged Food & Meats Index, were reinvested. The performance graph and table are not intended to be indicative of future performance. The performance graph shall not be deemed “soliciting material” or to be “filed” with the SEC for purposes of Section 18 of the Exchange Act or otherwise subject to the liabilities under that Section, and shall not be deemed to be incorporated by reference into any of our filings under the Securities Act or the Exchange Act.
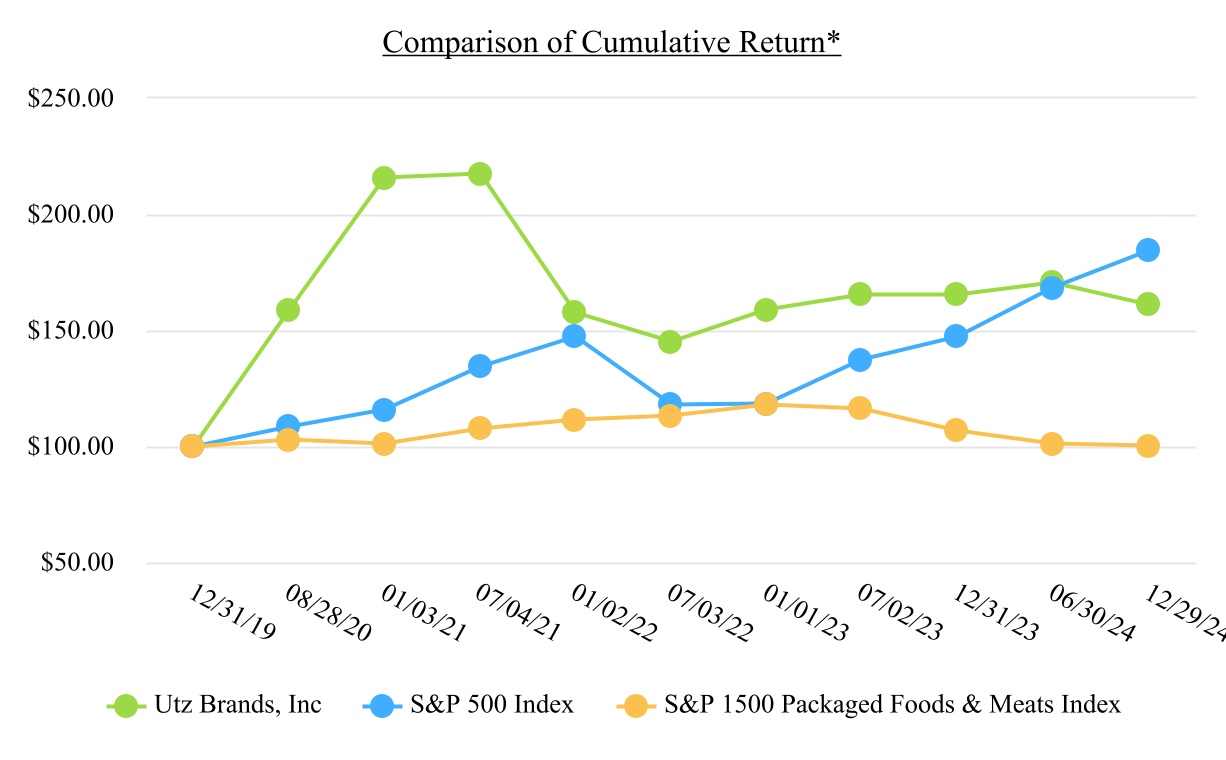
*Assumes $100 was invested on December 31, 2019, trading on the NYSE under the ticker symbol CCH. Prior to our domestication to a Delaware corporation in connection with the business combination on August 28, 2020, these shares were referred to as Class A Ordinary Shares. Subsequent to the business combination, our Class A Common Stock was traded on the NYSE under the ticker symbol UTZ.
Item 6. [Reserved]
Not applicable
Item 7. Management’s Discussion and Analysis of Financial Condition and Results of Operations
The following discussion and analysis of our financial condition and results of operations should be read in conjunction with our Audited Financial Statements and related notes included in Item 8 of this Annual Report on Form 10-K. This discussion contains forward-looking statements that involve risks and uncertainties. Our actual results could differ materially from those discussed below. Factors that could cause or contribute to such differences include, but are not limited to, those identified below and those discussed in Item 1A “Risk Factors” of this Annual Report on Form 10-K.
Our fiscal year end is the Sunday closest to December 31. Our fiscal year 2022 ended January 1, 2023 and was a fifty-two-week fiscal year, our fiscal year 2023 ended December 31, 2023 and was a fifty-two-week fiscal year and our fiscal year 2024 ended December 29, 2024 and was a fifty-two-week fiscal year. Our fiscal quarters are comprised of thirteen weeks each, except for fifty-three-week fiscal periods for which the fourth quarter is comprised of fourteen weeks, and end on the thirteenth Sunday of each quarter (fourteenth Sunday of the fourth quarter, when applicable).
Overview
We were founded in 1921 in Hanover, Pennsylvania and benefit from over 100 years of brand awareness and heritage in the salty snack industry. We are a leading United States manufacturer of branded salty snacks, producing a broad offering of salty snacks, including potato chips, tortilla chips, pretzels, cheese snacks, pork skins, pub/party mixes, and other snacks. Our iconic portfolio of authentic, craft, and better for you ("BFY") brands includes Utz®, ON THE BORDER®, Zapp’s®, Boulder Canyon®, Golden Flake®, Hawaiian® Brand, and TORTIYAHS!®, among others, and enjoys strong household penetration in the United States, where our products can be found in approximately 49% of U.S. households as of December 29, 2024. As of December 29, 2024, we operate eight primary manufacturing facilities across the United States with a broad range of capabilities. Our products are distributed nationally to grocery, mass merchant, club, convenience, drug and other retailers through direct shipments, distributors, and approximately 2,500 direct-store-delivery (“DSD”) routes. We have historically expanded our geographic reach and product portfolio organically and through acquisitions. Based on 2024 retail sales, we are the second-largest producer of branded salty snacks in our collective core geographies where we have acquired strong regional brands and distribution capabilities in recent years.
Key Developments and Trends
Our management team monitors a number of developments and trends that could impact our revenue and profitability objectives.
Growth Strategy - We have a long-term growth strategy focusing on various initiatives and have experienced share gains in our Expansion geographies over the past six consecutive quarters with retail sales and retail volumes being up by 0.9% and 0.4%, respectively, for the fiscal year ended December 29, 2024. Our portfolio strategy is focused on accelerating investments in marketing and innovation to drive top-line growth and achieve share gains in the attractive Salty Snack category. We plan to further penetrate our Expansion Geographies and untapped channels and customers by further expanding our Branded Salty Snacks in Expansion Geographies, as well as maintaining our share in our Core Geographies. Our Core Geographies retail sales and retail volumes were down 1.6% and up 0.6%, respectively, for the fiscal year ended December 29, 2024.
Long-Term Demographics, Consumer Trends, and Demand – We participate in the attractive and growing $39 billion U.S. salty snacks category, within the broader approximately $130 billion market for U.S. snack foods as of December 29, 2024, based on Circana data. The salty snacks category has grown retail sales at an approximate 7.8% compound annual growth rate ("CAGR") during 2020 through 2024 with a major spike in 2020 driven by consumption following the outbreak of the novel coronavirus ("COVID-19") and again from 2022 through 2023 driven by inflation, per Circana. In the last few years snacking occasions have held relatively stable as consumers continue to seek out convenient, delicious snacks for both on-the-go and at-home lifestyles. A 2024 study from Circana cites that 46% of consumers snack three or more times a day, down three points compared to a year ago but with no change versus five years ago. Additionally, the salty snacks category has historically benefited from favorable competitive dynamics, including low private label penetration and category leaders competing primarily through marketing and innovation. We expect these consumer trends to continue to drive consistent retail sales for salty snacks for the foreseeable future.
For the year ended December 29, 2024, U.S. retail sales for salty snacks based on Circana data increased by 0.7% versus the comparable prior year period while our retail sales increased 1.6%. The two year CAGR during 2023 and 2024 was 4.5% for U.S. retail sales of salty snacks, during which time our retail sales increased by 3.6%.
Competition – The salty snack industry is highly competitive and includes many diverse participants. Our products primarily compete with other salty snacks but also compete more broadly for certain eating occasions with other snack foods. We believe that the principal competitive factors in the salty snack industry include taste, convenience, product variety, product quality, price, nutrition, consumer brand awareness, media and promotional activities, in-store merchandising execution, customer service, cost-efficient distribution, and access to retailer shelf space. We believe we compete effectively with respect to each of these factors. Additionally, during 2024, certain competitors began to take certain discrete pricing actions in specific channels, resulting in an environment that has become far more promotional. Such promotions have impacted our sales and, in response, we have increased our promotional activities. We expect these pricing and promotional activity dynamics to continue in the near-term. Within the potato chips subcategory, our share performance was impacted by the softness in our Utz brand due to competitive activity, along with softness in our Zapp’s® and Golden Flake® business. Importantly, Boulder Canyon® gained share led by strong same store velocities in both traditional channels and in the natural channel, with growth of 34.9% and 32.7%, respectively, per Circana.
Operating Costs – Our operating costs include raw materials, labor, manufacturing overhead, selling, distribution, and administrative expenses. We manage these expenses through annual cost saving and productivity initiatives, sourcing and hedging programs, pricing actions, refinancing and tax optimization. Additionally, we maintain ongoing efforts led by our transformation office, to expand our profitability, including implementing significant reductions to our operating cost structure in both supply chain and overhead costs.
Financing Costs and Exposure to Interest Rate Changes – As of December 29, 2024, we had $690.1 million in variable rate indebtedness, down from $851.5 million as of December 31, 2023. The decrease in variable rate debt is primarily due to a $141.0 million payment made in connection with the Good Health and R.W. Garcia Sale (as defined below) and the Manufacturing Facilities Sale (as defined below), each as described in Note 2. Divestitures and Note 4. Property, Plant and Equipment, Net to our Audited Financial Statements, toward the outstanding balance of the Term Loan B (as defined below) and a $17.7 million payment toward the outstanding balance of the loan by City National Bank, which is secured by a majority of the real estate assets of our subsidiaries through September 2032 (the “Real Estate Term Loan”). As of December 29, 2024, our variable rate indebtedness was benchmarked to the Term SOFR Screen Rate (“SOFR”). As of December 29, 2024, we have existing interest rate swaps totaling $581.1 million of debt. Our interest rate hedge strategy has limited some of our exposure to changes in interest rates. We regularly evaluate our variable and fixed-rate debt. We continue to use low-cost, short- and long-term debt to finance our ongoing working capital, capital expenditures and other investments and dividends. Our weighted average interest rate for the fiscal year ended December 29, 2024 was 5.5%, down from 6.3% during the fiscal year ended December 31, 2023. On January 29, 2025, the Company amended its Term Loan B to refinance in full all of the $630.3 million outstanding term loan, reduce the interest rate from SOFR plus the applicable rate of 2.75% to SOFR plus the applicable rate of 2.50% and extend the maturity date from January 20, 2028 to January 29, 2032, as well as make certain other changes. We have used interest rate swaps to help manage some of our exposure to interest rate changes, which can drive cash flow variability related to our debt. Refer to Note 8. Long-Term Debt and Note 9. Derivative Financial Instruments and Purchase Commitments to our Audited Financial Statements for additional information on debt, derivative and purchase commitment activity. The Company has experienced the effect of increased interest rates on the portion of its debt that is not hedged and an increase in interest rates could negatively impact our net income.
Recent Developments and Significant Items Affecting Comparability
Acquisitions and Dispositions
During fiscal year 2022, the Company focused on increasing manufacturing and streamlining distribution. In April 2022, the Company purchased a brand new, recently completed snack food manufacturing facility in Kings Mountain, North Carolina from Evans Food Group Ltd. d/b/a Benestar Brands and related affiliates. The Company paid the full cash purchase price of $38.4 million at the closing and concurrently with the facility purchase, the Company sold 2.1 million shares of the Company’s Class A Common Stock for $28.0 million, to affiliates of Benestar in a private placement pursuant to Section 4(a)(2) of the Securities Act of 1933.
During fiscal years 2024, 2023 and 2022, the Company bought out and terminated the contracts of multiple distributors who had previously been providing services to the Company. These transactions were accounted for as asset purchases and contract terminations, respectively, and resulted in expense of $2.1 million, $1.5 million and $23.0 million for the fiscal years ended December 29, 2024, December 31, 2023 and January 1, 2023, respectively.
On February 5, 2024, the Company sold certain assets and brands to affiliates of Our Home™, an operating company of Better-for-You brands (“Our Home”). Under the agreement, affiliates of Our Home purchased the Good Health and R.W. Garcia brands, the Lincolnton, NC and Lititz, PA manufacturing facilities and certain related assets, and assumed the Company’s Las Vegas, NV facility lease and manufacturing operations (the "Good Health and R.W. Garcia Sale"), for $167.5 million, subject to customary adjustments. See Note 2. Divestitures to our Audited Financial Statements.
On April 22, 2024, the Company sold to Our Home its Berlin, PA and Fitchburg, MA manufacturing facilities and certain related assets, including certain inventory (the “Manufacturing Facilities Sale”). The total consideration for the transactions was $18.5 million, subject to customary adjustments.
The Company and Our Home are operating under transition services agreements related to each of the Good Health and R.W. Garcia Sale and the Manufacturing Facilities Sale, which are scheduled to expire during the first half of 2025. In addition, the parties will operate under reciprocal co-manufacturing agreements pursuant to which Our Home will co-manufacture certain of the Company's products and the Company will co-manufacture certain Good Health products. Certain Good Health products will continue to be distributed and sold on the Company's DSD network for Our Home, pursuant to a distribution agreement. The Company received approximately $18.7 million in advance from Our Home for certain terms under these agreements, which the Company will recognize through income from operations over the terms of the transition services and co-manufacturing agreements.
Product Innovation
Investments in new product innovation support three focus areas that are rooted in the consumer and tied to our portfolio and brand strategy: Expanding Positive Choices, Delivering Craveable Flavor, and Capturing Occasions. Within Expanding Positive Choices, 2024’s focus was on the Boulder Canyon, a brand offering solutions for consumers seeking great tasting BFY snacks via BFY oils such as avocado oil and olive oil. Innovation contributed to the brand’s 32.7% growth in the natural channel in 2024 with the launching of new flavors that capitalized on the hot & spicy trend and by entrance into the cheese snack subcategory. Within Delivering Craveable Flavor, in 2024, we addressed consumer desire for flavor exploration with innovation across brands and snacking subcategories via our seasoned pretzels and new potato chip flavor offerings in both our Utz and Zapp’s brands. Within Capturing Occasions, in 2024, we introduced a portfolio of variety/multipacks across our Power Four Brands and our Targeted Brands.
Supply and Commodity Trends
We regularly monitor worldwide supply and commodity costs so that we can cost-effectively secure ingredients, packaging and fuel required for production. A number of external factors such as weather, which may be impacted in unanticipated ways due to climate change, commodity market conditions, inflationary conditions and the effects of governmental, agricultural or other programs, may affect the cost and availability of raw materials and agricultural materials used in our products. We address commodity costs primarily through the use of buying-forward, which locks in pricing for key materials between three and 18 months in advance. Other methods include hedging, net pricing adjustments to cover longer term cost inflation, and manufacturing and overhead cost control. Our hedging techniques, such as forward contracts, limit the impact of fluctuations in the cost of our principal raw materials; however, we may not be able to fully hedge against commodity cost changes, where there is a limited ability to hedge, and our hedging strategies may not protect us from increases in specific raw material costs. We experienced an increase in pricing in certain commodity trends that continued to rise throughout fiscal year 2022 and have since stabilized during fiscal years 2023 and 2024. Commodity cost increases in commodity trends may adversely impact our net income. Although we have experienced some ingredient cost deflation, we continue to experience rising costs related to fuel and freight rates as well as rising labor costs which have negatively impacted profitability. Transportation costs have been on the rise since early in 2021 and may continue to rise which may also adversely impact net income. The Company looks to offset rising costs through increasing manufacturing and distribution efficiencies as well as through price increases to our customers, although it is unclear whether historic customer sales levels will be maintained at these higher prices (See "Key Developments and Trends - Long-Term Demographics, Consumer Trends, and Demand"). Due to competitive market conditions, planned trade or promotional incentives, or other factors, our pricing actions may also lag supply and commodity cost changes.
While the costs of our principal raw materials fluctuate, we believe there will continue to be an adequate supply of the raw materials we use and that they will generally remain available from numerous sources. Market factors including supply and demand may result in higher costs of sourcing those materials.
Independent Operator Conversions
Our DSD distribution is executed via Company-owned routes operated by RSP, and third-party routes managed by IOs. We have used the IO and RSP models for more than a decade. In fiscal year 2017, we embarked on a multi-year strategy to convert all company-owned RSP routes to the IO model. As of December 29, 2024, substantially all of our DSD routes are managed by IOs. The conversion process involves selling distribution rights to a defined route to an IO. As we convert routes, there is a decrease in the selling, distribution and administrative costs that we previously incurred on RSPs and a corresponding increase in discounts paid to IOs to cover their costs to distribute our product. The net impact is a reduction in selling expenses and a decrease in net sales and gross profit. Conversions also impact our consolidated balance sheet, resulting in cash proceeds to us as a result of selling the route to an IO, or by creating notes receivable related to the sale of the routes. While we expect to have a small number of routes under the ownership of the Company as we acquire and re-sell routes as part of our normal operations, as of December 29, 2024, substantially all of our DSD routes are managed by IOs.
Results of Operations
Overview
The following tables present selected financial data for the fiscal year ended December 29, 2024 and fiscal year ended December 31, 2023.
We have prepared our discussion of the results of operations by comparing the results for the fiscal year ended December 29, 2024 to the results of operations for the fiscal year ended December 31, 2023. Refer to Item 7, Management's Discussion and Analysis of Financial Condition and Results of Operations, in our Annual Report on Form 10-K for the fiscal year ended December 31, 2023, for discussion of the results of operations for the fiscal year ended December 31, 2023, compared to the fiscal year ended January 1, 2023, which is incorporated by reference herein. | | | | | | | | | | | |
| (in millions) | For the Fiscal Year Ended December 29, 2024 | | For the Fiscal Year Ended December 31, 2023 |
| Net sales | $ | 1,409,281 | | | $ | 1,438,237 | |
| Cost of goods sold | 914,504 | | | 981,751 | |
| Gross profit | 494,777 | | | 456,486 | |
| | | |
| Selling, distribution and administrative expenses | | | |
| Selling and distribution | 306,151 | | | 273,923 | |
| Administrative | 129,642 | | | 159,196 | |
| Total selling, distribution, and administrative expenses | 435,793 | | | 433,119 | |
| | | |
| (Loss) gain on sale of assets, net | (78) | | | (7,350) | |
| | | |
| Income from operations | 58,906 | | | 16,017 | |
| | | |
| Other (expense) income | | | |
| Gain on sale of business | 44,015 | | | — | |
| Interest expense | (44,862) | | | (60,590) | |
| Loss on debt extinguishment | (1,273) | | | — | |
| Other income | 2,457 | | | 3,066 | |
| Gain on remeasurement of warrant liability | 10,224 | | | 2,232 | |
| Other expense, net | 10,561 | | | (55,292) | |
| | | |
| Income (loss) before income taxes | 69,467 | | | (39,275) | |
| Income tax expense | 38,730 | | | 757 | |
| Net income (loss) | 30,737 | | | (40,032) | |
| | | |
| Net (income) loss attributable to noncontrolling interest | (14,763) | | | 15,095 | |
| Net income (loss) attributable to controlling interest | $ | 15,974 | | | $ | (24,937) | |
Fiscal Year Ended December 29, 2024 versus Fiscal Year Ended December 31, 2023
Net sales
Net sales were $1,409.3 million for the fiscal year ended December 29, 2024 and $1,438.2 million for the fiscal year ended December 31, 2023. Net sales for the fiscal year ended December 29, 2024 decreased $28.9 million or 2.0% from fiscal year 2023. The Good Health and R.W. Garcia Sale contributed 3.3% to the year-over-year decrease. The remaining change, totaling a 1.3% increase in net sales, was related to favorable volume/mix of 1.5% as further discussed below, offset by 0.2% attributable to lower net price realization as a result of the promotional environment and a decrease of 0.1% related to IO conversions. IO discounts increased from $179.3 million for the fiscal year ended December 31, 2023 to $183.6 million for the fiscal year ended December 29, 2024.
Sales are evaluated based on classification as Branded Salty Snacks or Non-Branded & Non-Salty Snacks. For the fiscal year ended December 29, 2024, excluding prior year sales related to the Good Health and R.W. Garcia Sale and certain IO conversions, Branded Salty Snacks and Non-Branded & Non-Salty Snacks totaled 87% and 13% of our net sales, respectively. For the fiscal year ended December 29, 2024, excluding prior year sales related to the Good Health and R.W. Garcia Sale and certain IO conversions, Branded Salty Snacks and Non-Branded & Non-Salty Snacks net sales increased by 3.7% and decreased by 12.3%, respectively.
Cost of goods sold and Gross profit
Gross profit was $494.8 million for the fiscal year ended December 29, 2024 and $456.5 million for the fiscal year ended December 31, 2023. Our gross profit margin was 35.1% for the fiscal year ended December 29, 2024 versus 31.7% for the fiscal year ended December 31, 2023. The increase in gross profit and gross profit margin was primarily driven by benefits from increased productivity including plant network optimization activities, favorable sales volume/mix and ingredient cost deflation which more than offset supply chain cost inflation, investments to support the Company’s productivity initiatives and slightly lower pricing. Additionally, IO discounts increased to $183.6 million for the fiscal year ended December 29, 2024, from $179.3 million for the fiscal year ended December 31, 2023.
Selling, distribution and administrative expenses
Selling, distribution and administrative expenses were $435.8 million for the fiscal year ended December 29, 2024 and $433.1 million for the fiscal year ended December 31, 2023, an increase of $2.7 million or 0.6%. The increase in selling, distribution, and administrative expense was primarily attributable to increased marketing spend on our Branded Salty Snacks as well as investments in digital and social consumer marketing, higher delivery costs due to outsourcing our private fleet operation, and investments in selling capabilities to support distribution growth in Expansion geographies partially offset by $12.6 million related to the impairment of fixed assets, primarily related to the closure of the manufacturing operation at the Birmingham, Alabama facility during the fiscal year ended December 31, 2023 as discussed in Note 4. Property, Plant and Equipment, Net to our Audited Financial Statements. The Company also recognized a liability and related expense of $4.7 million related to a contract termination with a co-manufacturer, which is recorded in the administrative line in the Consolidated Statement of Operations and Comprehensive Income (Loss) during the fiscal year ended December 31, 2023. This agreement was a continuation of the Company's response to shifting production from a manufacturing facility that was damaged by a natural disaster in 2021. This decrease was partially offset by an increased marketing spend, higher distribution costs, and investments in selling capabilities to support distribution growth in Expansion geographies.
(Loss) Gain on sale of assets
Loss on sale of assets was $0.1 million for the fiscal year ended December 29, 2024 and $7.4 million for the fiscal year ended December 31, 2023. The loss during the fiscal year ended December 31, 2023 was primarily related to the sale of the Company's manufacturing facility in Bluffton, Indiana which generated a loss of $13.4 million, partially offset by gain on sale of land for $4.0 million and the sale of IO routes and other fixed assets.
Other income (expense), net
Other income (expense), net was $10.6 million for the fiscal year ended December 29, 2024 and $(55.3) million for the fiscal year ended December 31, 2023. The increase in other income of $65.8 million for the fiscal year ended December 29, 2024 compared to the fiscal year ended December 31, 2023 was primarily due to the gain on sale of business of $44.0 million relating to the Good Health and R.W. Garcia Sale which occurred on February 5, 2024. See Note 2. Divestitures to our Audited Financial Statements, for further discussion. Interest expense also decreased by $15.7 million, primarily related to the $141.0 million payment on our Term Loan B and the $17.7 million payment on our Real Estate Term Loan during the fiscal year ended December 29, 2024. There was also an increase in the loss on the remeasurement of the warrant liability of $8.0 million and a loss on debt extinguishment of $1.3 million recognized during the fiscal year ended December 29, 2024. See Note 8. Long-Term Debt to our Audited Financial Statements, for further discussion.
Income taxes
Income taxes expense was $38.7 million for the fiscal year ended December 29, 2024 and $0.8 million for the fiscal year ended December 31, 2023. The increase in income tax expense for the fiscal year ended December 29, 2024 compared to the fiscal year ended December 31, 2023 is primarily attributable to the Good Health and R.W. Garcia Sale, which occurred on February 5, 2024. See Note 2. Divestitures to our Audited Financial Statements, for further discussion. The income tax expense increase is also driven by the increase in valuation allowance, which partially offsets a deferred tax asset, which resulted in a $7.6 million income tax expense. See Note 14. Income Taxes, for further discussion.
Non-GAAP Financial Measures
We use non-GAAP financial information and believe it is useful to investors as it provides additional information to facilitate comparisons of historical operating results and identify trends in our underlying operating results, and it also provides additional insight and transparency on how we evaluate the business. We use non-GAAP financial measures to budget, make operating and strategic decisions, and evaluate our performance. We have detailed the non-GAAP adjustments that we make in our non-GAAP definitions below. The adjustments generally fall within the categories of non-cash items, acquisition, divestiture and integration costs and gains, business transformation initiatives, and financing-related costs. We believe the non-GAAP measures should always be considered along with the related U.S. generally accepted accounting principles ("U.S. GAAP") financial measures. We have provided the reconciliations between the U.S. GAAP and non-GAAP financial measures below, and we also discuss our underlying U.S. GAAP results throughout this discussion and analysis of our financial condition and results of operations.
Our primary non-GAAP financial measures are listed below and reflect how we evaluate our current and prior-year operating results. As new events or circumstances arise, these definitions could change. When the definitions change, we will provide the updated definitions and present the related non-GAAP historical results on a comparable basis.
EBITDA and Adjusted EBITDA
We define EBITDA as net income before interest, income taxes, and depreciation and amortization.
We define Adjusted EBITDA as EBITDA further adjusted to exclude certain non-cash items, such as accruals for long-term incentive programs and asset impairments and hedging and purchase commitments adjustments; remeasurement of warrant liabilities; acquisition, divestiture and integration costs and gains; business transformation initiatives; and financing-related costs.
Adjusted EBITDA is one of the key performance indicators we use in evaluating our operating performance and in making financial, operating, and planning decisions. We believe EBITDA and Adjusted EBITDA are useful to investors in the evaluation of Utz’s operating performance compared to other companies in the salty snack industry, as similar measures are commonly used by companies in this industry; however, we caution that other companies may use different definitions from us and such figures may not be directly comparable to our figures. We also report Adjusted EBITDA as a percentage of net sales as an additional measure for investors to evaluate our Adjusted EBITDA margins on net sales.
The following table provides a reconciliation from Net Income (Loss) to EBITDA and Adjusted EBITDA for the fiscal year ended December 29, 2024 and the fiscal year ended December 31, 2023:
| | | | | | | | | | | | | | |
| (dollars in millions) | | For the Fiscal Year Ended December 29, 2024 | | For the Fiscal Year Ended December 31, 2023 |
| Net income (loss) | | $ | 30.7 | | | $ | (40.0) | |
| Net Income as a % of Net Sales | | 2.2 | % | | (2.8) | % |
| Plus non-GAAP adjustments: | | | | |
| Income Tax Expense (Benefit) | | 38.7 | | | 0.8 | |
| Depreciation and Amortization | | 70.9 | | | 79.5 | |
| Interest Expense, Net | | 44.9 | | | 60.6 | |
Interest Income (IO loans)(1) | | (2.1) | | | (2.0) | |
| EBITDA | | 183.1 | | | 98.9 | |
Certain Non-Cash Adjustments(2) | | 21.9 | | | 50.7 | |
Acquisition, Divestiture and Integration(3) | | (23.1) | | | 8.6 | |
Business Transformation Initiatives(4) | | 28.1 | | | 31.0 | |
Financing-Related Costs(5) | | 0.4 | | | 0.2 | |
Gain on remeasurement of warrant liability(6) | | (10.2) | | | (2.2) | |
| Adjusted EBITDA | | 200.2 | | | 187.2 | |
| Adjusted EBITDA as a % of Net Sales | | 14.2 | % | | 13.0 | % |
(1)Interest Income from IO Loans refers to interest income that we earn from IO notes receivable that have resulted from our initiatives to transition from RSP distribution to IO distribution. (“Business Transformation Initiatives”). There is a notes payable recorded that mirrors most IO notes receivable, and the interest expense associated with the notes payable is part of the interest expense, net adjustment.
(2)Certain Non-Cash Adjustments are comprised primarily of the following:
Incentive programs – The Company incurred $17.6 million and $15.5 million of share-based compensation, which was awarded to associates and directors, and compensation expense associated with the 2020 Omnibus Equity Incentive Plan (the “OEIP”) for the fiscal year ended December 29, 2024 and the fiscal year ended December 31, 2023, respectively.
Asset Impairments and Write-Offs — For the fiscal year ended December 31, 2023, the Company recorded an adjustment for a non-cash loss on sale of $13.7 million related to fixed assets for the sale of the Bluffton, Indiana plant, along with $4.7 million related to the termination of the contract that was settled with the sale, and impairments of $12.6 million related to the closure of the Company's manufacturing facilities in Birmingham, Alabama and Gramercy, Louisiana.
Purchase Commitments and Other Adjustments – We have purchase commitments for specific quantities at fixed prices for certain of our products’ key ingredients. To facilitate comparisons of our underlying operating results, this adjustment was made to remove the volatility of purchase commitment related unrealized gains and losses. The adjustment related to purchase commitment and other adjustments, including cloud computing, were $4.3 million and $4.2 million for the fiscal year ended December 29, 2024 and the fiscal year ended December 31, 2023, respectively.
(3)Adjustment for Acquisition, Divestiture and Integration Costs – This is comprised of consulting, transaction services, and legal fees incurred for acquisitions and certain potential acquisitions, in addition to expenses associated with integrating recent acquisitions. Such expenses were $20.9 million for fiscal year ended December 29, 2024. Such expenses were $9.7 million for the fiscal year ended December 31, 2023, as well as $1.1 million of income for the change of liability associated with the TRA for the fiscal year ended December 31, 2023. Also included for the fiscal year ended December 29, 2024 was a gain of $44.0 million related to the Good Health and R.W. Garcia Sale.
(4)Business Transformation Initiatives Adjustment – This adjustment is related to consultancy, professional, and legal fees incurred for specific initiatives and structural changes to the business that do not reflect the cost of normal business operations. In addition, gains and losses realized from the sale of distribution rights to IOs and the subsequent disposal of trucks, severance costs associated with the elimination of RSP positions, and enterprise planning system transition costs, fall into this category. The Company incurred such costs of $28.1 million for the fiscal year ended December 29, 2024 and $31.0 million for the fiscal year ended December 31, 2023.
(5)Financing-Related Costs – These costs include adjustments for various items related to raising debt and equity capital or debt extinguishment costs.
(6)Gains and losses related to the changes in the remeasurement of warrant liabilities are not expected to be settled in cash, and when exercised would result in a cash inflow to the Company with the warrants converting to Class A Common Stock with the liability being extinguished and the fair value of the warrants at the time of exercise being recorded as an increase to equity.
Liquidity and Capital Resources
Sources and Uses of Cash
We believe that the cash provided by our operating activities, revolving credit facility, term loans, and derivative financial instruments will continue to provide sufficient liquidity for our working capital needs, planned capital expenditures and future payments of our contractual, and tax obligations both in the short term and long term. We regularly evaluate our financing strategy to meet our short- and longer-term capital needs. From time-to-time, we may dispose of assets or enter into other cash generating transactions, such as through a sale-leaseback, when we deem beneficial. To date, we have been successful in generating cash and raising financing as needed. However, if a serious economic or credit market crisis ensues or another adverse development arises, it could have a material adverse effect on our liquidity, results of operations and financial condition.
Financing Arrangements
The primary objective of our financing strategy is to maintain a prudent capital structure that provides us flexibility to pursue our growth objectives. We use short-term debt as management determines is reasonable, principally to finance ongoing operations, including our seasonal requirements for working capital (generally accounts receivable, inventory, and prepaid expenses and other current assets, less accounts payable, accrued payroll, and other accrued liabilities), and a combination of equity and long-term debt to finance both our base working capital needs and our non-current assets.
Term Debt and Revolving Credit Facility
Term Debt
On April 17, 2024, the Company amended its Term Loan B to refinance in full all of the $630.3 million outstanding in term loans and reduce the interest rate from SOFR plus the applicable rate of 3.00% plus a credit spread adjustment to SOFR plus the applicable rate of 2.75%, as well as make certain other changes. Other material terms of the Term Loan B, including the January 2028 maturity date, remain unchanged. The Company recorded a loss on debt extinguishment of $1.3 million related to the refinancing of its Term Loan B in its Consolidated Statement of Operations and Comprehensive Income (Loss) for the fiscal year ended December 29, 2024. Subsequently, on January 29, 2025, the Company amended its Term Loan B to refinance in full all of the $630.3 million outstanding term loan, reduce the interest rate from SOFR plus the applicable rate of 2.75% to SOFR plus the applicable rate of 2.50% and extend the maturity date from January 20, 2028 to January 29, 2032, as well as make certain other changes. Other material terms of the Term Loan B remained unchanged.
Revolving Credit Facility
On April 17, 2024, the Company also amended its asset-based revolving credit facility (“ABL facility”) to reduce the rate from SOFR plus the applicable rate ranging from 1.50%-2.00% plus a credit spread adjustment to SOFR plus the applicable rate ranging from 1.50%-2.00%, as well as make certain other changes. Other material terms of the ABL facility, including maturity date, remained unchanged.
As of December 29, 2024 and December 31, 2023, $0.2 million and $0.4 million, respectively, was outstanding under the ABL facility. Availability under the ABL facility is based on a monthly accounts receivable and inventory borrowing base certification, which is net of outstanding letters of credit and amounts borrowed. As of December 29, 2024 and December 31, 2023, $158.7 million and $158.4 million, respectively, was available for borrowing, net of letters of credit. Standby letters of credit in the amount of $10.3 million and $12.2 million were issued as of December 29, 2024 and December 31, 2023, respectively. The standby letters of credit are primarily issued for insurance purposes. Refer to Note 8. Long-Term Debt to our Audited Financial Statements for more information.
Cash Requirements
Our expected future payments at December 29, 2024 primarily consist of:
•Short-term cash requirements related primarily to funding operations (including expenditures for raw materials, labor, manufacturing and distribution, trade and promotions, advertising and marketing, benefit plan obligations and lease expenses) as well as periodic expenditures for acquisitions, shareholder returns (such as dividend payments), property, plant and equipment and any significant non-operating items.
•Cash requirements related to Other Notes Payable and Capital Leases (Refer to Note 8. Long-Term Debt to our Audited Financial Statements).
•Long-term cash requirements primarily related to funding long-term debt repayments and related interest payment on long-term debt (Refer to Note 8. Long-Term Debt to our Audited Financial Statements).
•Long-term cash requirements related to our deferred taxes and TRA (Refer to Note 14. Income Taxes to our Audited Financial Statements).
•Operating lease liabilities (Refer to Note 15. Leases to our Audited Financial Statements).
Off-Balance Sheet Arrangements
Purchase Commitments
The Company has outstanding purchase commitments for specific quantities at fixed prices for certain key ingredients to economically hedge commodity input prices. Refer to Note 9. Derivative Financial Instruments and Purchase Commitments to our Audited Financial Statements.
IO Guarantees Off Balance Sheet
The Company partially guarantees loans made to IOs by Bank of America and two other banks for the purchase of routes, all of which was recorded by the Company as off-balance sheet arrangements. These loans are collateralized by the routes for which the loans are made. Accordingly, the Company has the ability to recover substantially all of the outstanding loan value upon default. Refer to Note 12. Contingencies to our Audited Financial Statements.
Cash Flow
The following table presents net cash provided by operating activities, investing activities, and financing activities for the fiscal year ended December 29, 2024, and fiscal year ended December 31, 2023:
| | | | | | | | | | | | | | | | | | | |
| (in thousands) | | For the Fiscal Year Ended December 29, 2024 | | For the Fiscal Year Ended December 31, 2023 | | | | | |
| Net cash provided by operating activities | | $ | 106,166 | | | $ | 76,640 | | | | | | |
| Net cash provided by (used in) investing activities | | 74,961 | | | (48,492) | | | | | | |
| Net cash (used in) financing activities | | (177,012) | | | (49,055) | | | | | | |
At December 29, 2024, our consolidated cash balance, including cash equivalents, was $56.1 million or $4.1 million higher than at December 31, 2023. Net cash provided by operating activities for the fiscal year ended December 29, 2024 was $106.2 million an increase of $29.5 million from the fiscal year ended December 31, 2023. The increase is largely driven by an increase in cash net income, partially offset by an increase in inventory levels. The increase in prepaid expenses and other assets and the increase in accounts payable and accrued expenses and other includes approximately $30 million impact from the Good Health and R.W. Garcia Sale and Manufacturing Facilities Sale and as well as non-cash impact from entering into an operating lease agreement related to a distribution center that was entered into during fiscal year 2024. See Note 15. Leases to our Audited Financial Statements.
Cash used in investing activities for the fiscal year ended December 29, 2024 was $75.0 million an increase of $123.5 million from the fiscal year ended December 31, 2023. The increase is primarily driven by proceeds from the sale of a business for $167.5 million, the Good Health and R.W. Garcia Sale, proceeds from sale of property and equipment primarily related to the sale of the manufacturing facilities in Birmingham, Alabama, Berlin, Pennsylvania and Fitchburg, Massachusetts and the sale of routes to IOs. These proceeds were partially offset by purchases of property and equipment, notes receivable and purchase of intangibles related to an indefinite life intangible right for the use of a third-party brand name. This compares to the cash used in investing activity of $48.5 million for the fiscal year ended December 31, 2023 primarily driven by purchases of property and equipment.
Net cash used in financing activities was $177.0 million for fiscal year ended December 29, 2024, an increase of $128.0 million primarily driven by the pay down of debt utilizing the proceeds from the Good Health and R.W. Garcia Sale partially and payment of dividends and distributions to noncontrolling interest.
Debt Covenants
The Term Loan B and the ABL facility are collateralized by substantially all of the assets and liabilities of UBH and its subsidiaries excluding the real estate assets secured by the Real Estate Term Loan, including equity interests in certain of UBH’s subsidiaries. The credit agreements contain certain affirmative and negative covenants as to operations and the financial condition of UBH and its subsidiaries. UBH and its subsidiaries were in compliance with their financial covenants as of December 29, 2024. Refer to Note 8. Long-Term Debt to our Audited Financial Statements for more information.
New Accounting Pronouncements
See Note 1. Operations and Summary of Significant Accounting Policies to our Audited Financial Statements.
Application of Critical Accounting Policies and Estimates
General
Our consolidated financial statements have been prepared in accordance with U.S GAAP. While the majority of our revenue, expenses, assets and liabilities are not based on estimates, there are certain accounting principles that require management to make estimates regarding matters that are uncertain and susceptible to change. Critical accounting policies are defined as those policies that are reflective of significant judgments, estimates and uncertainties, which could potentially result in materially different results under different assumptions and conditions. Management regularly reviews the estimates and assumptions used in the preparation of our financial statements for reasonableness and adequacy. Our significant accounting policies are discussed in Note 1. Operations and Summary of Significant Accounting Policies, of our Audited Financial Statements; however, the following discussion pertains to accounting policies we believe are most critical to the portrayal of our financial condition and results of operations and that require significant, difficult, subjective or complex judgments. Other companies in similar businesses may use different estimation policies and methodologies, which may affect the comparability of our financial condition, results of operations and cash flows to those of other companies.
Revenue Recognition
Our revenues primarily consist of the sale of salty snack items that are sold through DSD and direct-to-warehouse distribution methods, either directly to retailers or via distributors. We sell to supermarkets, mass merchandisers, club warehouses, convenience stores and other large-scale retailers, merchants, distributors, brokers, wholesalers, and IOs (which are third party businesses). These revenue contracts generally have a single performance obligation. Revenue, which includes shipping and handling charges billed to the customer, is reported net of variable consideration and consideration payable to customers, including applicable discounts, returns, allowances, trade promotion, consumer coupon redemption, unsaleable product, and other costs. Amounts billed and due from customers are classified as receivables and require payment on a short-term basis and, therefore, we do not have any significant financing components.
We recognize revenue when (or as) performance obligations are satisfied by transferring control of the goods to customers. Control is transferred upon delivery of the goods to the customer. Shipping and/or handling costs that occur before the customer obtains control of the goods are deemed to be fulfillment activities and are accounted for as fulfillment costs. Applicable shipping and handling are included in customer billing and are recorded as revenue as products’ control is transferred to customers. We assess the goods promised in customers’ purchase orders and identify a performance obligation for each promise to transfer a good that is distinct.
We offer various forms of trade promotions and the methodologies for determining these provisions are dependent on local customer pricing and promotional practices, which range from contractually fixed percentage price reductions to provisions based on actual occurrence or performance. Our promotional activities are conducted either through the retail trade or directly with consumers and include activities such as in store displays and events, feature price discounts, consumer coupons, and loyalty programs. The costs of these activities are recognized at the time the related revenue is recorded, which normally precedes the actual cash expenditure. The recognition of these costs therefore requires management judgment regarding the volume of promotional offers that will be redeemed by either the retail trade customer or consumer. These estimates are made using various techniques including historical data on performance of similar promotional programs. Differences between estimated expense and actual redemptions are recognized as a change in management estimate as the actual redemption is incurred.
Distribution Route Purchase and Sale Transactions
We purchase and sell distribution routes as a part of our maintenance of our DSD network. As new IOs are identified, we either sell our existing routes to the IOs or sell routes that were previously purchased by us to the IOs. Gain/loss from the sale of a distribution route is recorded upon the completion of the sale transaction and signing of the relevant documents and is calculated based on the difference between the sale price of the distribution route and the asset carrying value of the distribution route as of the date of sale. We record the distribution routes that we purchase based on the payment that we make to acquire the route as intangible assets and record the purchased distribution routes as indefinite-lived intangible assets under Financial Accounting Standards Board (“FASB”) Accounting Standards Codification (“ASC”) 350, Intangibles – Goodwill and Other. The indefinite lived intangible assets are subject to annual impairment testing.
Goodwill and Indefinite-Lived Intangibles
We allocate the cost of acquired companies to the identifiable tangible and intangible assets acquired and liabilities assumed, with the remaining amount classified as goodwill. The identification and valuation of these intangible assets and the determination of the estimated useful lives at the time of acquisition, as well as the completion of impairment tests, require significant management judgments and estimates. These estimates are made based on, among other factors, review of projected future operating results and business plans, economic projections, anticipated highest and best use of future cash flows and the cost of capital. The use of alternative estimates and assumptions could increase or decrease the estimated fair value of goodwill and other intangible assets, and potentially result in a different impact to our results of operations. Further, changes in business strategy and/or market conditions may significantly impact these judgments and thereby impact the fair value of these assets, which could result in an impairment of the goodwill or intangible assets.
Finite-lived intangible assets consist of distribution/customer relationships, technology, trademarks, trade names and non-compete agreements. These assets are being amortized over their estimated useful lives. Finite-lived intangible assets are tested for impairment only when management has determined that potential impairment indicators are present.
Goodwill and other indefinite-lived intangible assets (including trade names, trademarks, master distribution rights and Company owned routes) are not amortized but are tested for impairment at least annually and whenever events or circumstances change that indicate impairment may have occurred. We test goodwill for impairment at the reporting unit level.
As we have adopted Accounting Standards Update 2017-04, simplifying the Test for Goodwill Impairment, we will record an impairment charge based on the excess of a reporting unit’s carrying amount over our fair value.
ASC 350, Goodwill and Other Intangible Assets also permits an entity to first assess qualitative factors to determine whether it is necessary to perform quantitative impairment tests for goodwill and indefinite-lived intangibles. If an entity believes, as a result of each qualitative assessment, it is more likely than not that goodwill or an indefinite-lived intangible asset is not impaired, a quantitative impairment test is not required.
For the qualitative impairment analysis performed, which took place on the first day of the fourth quarter, we have taken into consideration all the events and circumstances listed in FASB ASC 350, Intangibles—Goodwill and Other and concluded that Goodwill and our intangible assets were not impaired.
Income Taxes
We account for income taxes pursuant to the asset and liability method of ASC 740, Income Taxes, which require us to recognize current tax liabilities or receivables for the amount of taxes we estimate are payable or refundable for the current year, and deferred tax assets and liabilities for the expected future tax consequences attributable to temporary differences between the financial statement carrying amounts and their respective tax bases of assets and liabilities and the expected benefits of net operating loss and credit carryforwards. Deferred tax assets and liabilities are measured using enacted tax rates expected to apply to taxable income in the years in which those temporary differences are expected to be recovered or settled. The effect on deferred tax assets and liabilities of a change in tax rates is recognized in operations in the period enacted. A valuation allowance is provided when it is more likely than not that a portion or all of a deferred tax asset will not be realized. The ultimate realization of deferred tax assets is dependent upon the generation of future taxable income and the reversal of deferred tax liabilities during the period in which related temporary differences become deductible.
Under the terms of the TRA, the Company generally will be required to pay to Noncontrolling Interest Holders 85% of the applicable cash savings, if any, in U.S. federal and state income tax based on its ownership in UBH that the Company is deemed to realize in certain circumstances as a result of the increases in tax basis and certain tax attributes resulting from the business combination which occurred in 2020 with Collier Creek Holdings. This is accounted for in conjunction with the methods used to record income tax described above.
We follow the provisions of ASC 740-10 related to the accounting for uncertainty in income taxes recognized in an enterprise’s financial statements. ASC 740-10 prescribes a comprehensive model for the financial statement recognition, measurement, presentation and disclosure of uncertain tax positions taken or expected to be taken in income tax returns.
The benefit of tax positions taken or expected to be taken in our income tax returns is recognized in the financial statements if such positions are more likely than not of being sustained upon examination by taxing authorities. Differences between tax positions taken or expected to be taken in a tax return and the benefit recognized and measured pursuant to the interpretation are referred to as “unrecognized benefits.” A liability is recognized (or amount of net operating loss carryover or amount of tax refundable is reduced) for an unrecognized tax benefit because it represents an enterprise’s potential future obligation to the taxing authority for a tax position that was not recognized as a result of applying the provisions of ASC 740-10. Interest costs and related penalties related to unrecognized tax benefits are required to be calculated, if applicable. Our policy is to classify assessments, if any, for tax related interest as interest expense and penalties as selling, distribution and administrative expenses. As of each of December 29, 2024, and December 31, 2023, no liability for unrecognized tax benefits was required to be reported. We do not expect any significant changes in our unrecognized tax benefits in the next year.
Business Combinations
We evaluate acquisitions of assets and other similar transactions to assess whether or not the transaction should be accounted for as a business combination or asset acquisition by first applying a screen test to determine if substantially all of the fair value of the gross assets acquired is concentrated in a single identifiable asset or group of similar identifiable assets. If the screen is met, the transaction is accounted for as an asset acquisition. If the screen is not met, further determination is required as to whether or not we have acquired inputs and processes that have the ability to create outputs which would meet the definition of a business. Significant judgment is required in the application of the screen test to determine whether an acquisition is a business combination or an acquisition of assets.
We use the acquisition method in accounting for acquired businesses. Under the acquisition method, our financial statements reflect the operations of an acquired business starting from the completion of the acquisition. The assets acquired and liabilities assumed are recorded at their respective estimated fair values at the date of the acquisition. Any excess of the purchase price over the estimated fair values of the identifiable net assets acquired is recorded as goodwill.
ITEM 7A. QUANTITATIVE AND QUALITATIVE DISCLOSURES ABOUT MARKET RISK
We are exposed to certain commodity, interest rate, and credit risks as part of our ongoing business operations. We may use derivative financial instruments, where appropriate, to manage some of these risks related to interest rates. We do not use derivatives for trading purposes.
Commodity Risk
We purchase certain raw materials that are subject to price volatility caused by weather, market conditions, growing and harvesting conditions, governmental actions and other factors beyond our control. Our most significant raw material requirements include potatoes, oil, flour, wheat, corn, cheese, spices, and seasonings. We also purchase packaging materials that are subject to price volatility. In the normal course of business, in order to mitigate the risks of volatility in commodity markets to which we are exposed, we enter into forward purchase agreements with certain suppliers based on market prices, forward price projections and expected usage levels. A 1% increase in the price of the commodities used within our products and packaging would result in a reduction of our gross profit of approximately $6.0 million.
Interest Rate Risk
Our variable-rate debt obligations incur interest at floating rates based on changes in the SOFR rate. To manage exposure to changing interest rates, we selectively enter into interest rate swap agreements to maintain a desired proportion of fixed to variable-rate debt. These interest rate swap agreements fixed a portion of the interest rate at a predictable level. Interest expense would have been $21.0 million higher without these swaps during the fiscal year ended December 29, 2024. Including the effect of the interest rate swap agreements, the weighted average interest rate was 5.1% and 6.7%, respectively, as of December 29, 2024 and December 31, 2023. A 1% increase in the SOFR rate would have resulted in an additional $2.0 million of interest expense during the fiscal year 2024 based on the unhedged portion of debt.
Credit Risk
We are exposed to credit risks related to our accounts and notes receivable. We perform ongoing credit evaluations of our customers to minimize the potential exposure. We experienced no material credit losses during the fiscal years of 2024 or 2023. During the fiscal years ended December 29, 2024 and December 31, 2023, net bad debt expense was $0.7 million and $1.2 million, respectively. Our reserve for potential future bad debt was $3.3 million as of December 29, 2024 and $2.9 million as of December 31, 2023.
Item 8. Financial Statements and Supplementary Data
| | | | | | | | |
| Index to the Financial Statements | | Page |
| | |
| | |
| | |
| | |
| | |
| | |
| | |
| | |
| | | | | |
| REPORT OF INDEPENDENT REGISTERED PUBLIC ACCOUNTANTS |
Board of Directors and Stockholders
Utz Brands, Inc.
Opinion on the financial statements
We have audited the accompanying consolidated balance sheets of Utz Brands, Inc. (a Delaware corporation) and subsidiaries (the “Company”) as of December 29, 2024 and December 31, 2023, the related consolidated statements of operations and comprehensive income (loss), equity (deficit), and cash flows for each of the three years in the period ended December 29, 2024 and the related notes (collectively referred to as the “consolidated financial statements”). In our opinion, the consolidated financial statements present fairly, in all material respects, the financial position of the Company as of December 29, 2024 and December 31, 2023, and the results of its operations and its cash flows for each of the three years in the period ended December 29, 2024, in conformity with accounting principles generally accepted in the United States of America.
We also have audited, in accordance with the standards of the Public Company Accounting Oversight Board (United States) (“PCAOB”), the Company’s internal control over financial reporting as of December 29, 2024, based on criteria established in the 2013 Internal Control—Integrated Framework issued by the Committee of Sponsoring Organizations of the Treadway Commission (“COSO”), and our report dated February 20, 2025 expressed an unqualified opinion.
Change in accounting principle
As discussed in Note 1 to the consolidated financial statements, the Company has adopted new accounting guidance in 2024 related to the disclosure of segment information in accordance with ASU 2023-07, Segment Reporting (Topic 280). The adoption was retrospectively applied to 2023 and 2022.
Basis for opinion
These consolidated financial statements are the responsibility of the Company’s management. Our responsibility is to express an opinion on the Company’s consolidated financial statements based on our audits. We are a public accounting firm registered with the PCAOB and are required to be independent with respect to the Company in accordance with the U.S. federal securities laws and the applicable rules and regulations of the Securities and Exchange Commission and the PCAOB.
We conducted our audits in accordance with the standards of the PCAOB. Those standards require that we plan and perform the audit to obtain reasonable assurance about whether the financial statements are free of material misstatement, whether due to error or fraud. Our audits included performing procedures to assess the risks of material misstatement of the financial statements, whether due to error or fraud, and performing procedures that respond to those risks. Such procedures included examining, on a test basis, evidence regarding the amounts and disclosures in the financial statements. Our audits also included evaluating the accounting principles used and significant estimates made by management, as well as evaluating the overall presentation of the financial statements. We believe that our audits provide a reasonable basis for our opinion.
Critical audit matters
Critical audit matters are matters arising from the current period audit of the consolidated financial statements that were communicated or required to be communicated to the audit committee and that: (1) relate to accounts or disclosures that are material to the consolidated financial statements and (2) involved our especially challenging, subjective, or complex judgments. We determined that there are no critical audit matters.
/s/ GRANT THORNTON LLP
We have served as the Company’s auditor since 2011.
Philadelphia, Pennsylvania
February 20, 2025
| | | | | |
| REPORT OF INDEPENDENT REGISTERED PUBLIC ACCOUNTANTS |
Board of Directors and Stockholders
Utz Brands, Inc.
Opinion on internal control over financial reporting
We have audited the internal control over financial reporting of Utz Brands, Inc. (a Delaware corporation) and subsidiaries (the “Company”) as of December 29, 2024, based on criteria established in the 2013 Internal Control—Integrated Framework issued by the Committee of Sponsoring Organizations of the Treadway Commission (“COSO”). In our opinion, the Company maintained, in all material respects, effective internal control over financial reporting as of December 29, 2024, based on criteria established in the 2013 Internal Control—Integrated Framework issued by COSO.
We also have audited, in accordance with the standards of the Public Company Accounting Oversight Board (United States) (“PCAOB”), the consolidated financial statements of the Company as of and for the period ended December 29, 2024, and our report dated February 20, 2025 expressed an unqualified opinion on those financial statements.
Basis for opinion
The Company’s management is responsible for maintaining effective internal control over financial reporting and for its assessment of the effectiveness of internal control over financial reporting, included in the accompanying Management’s Report on Internal Control over Financial Reporting. Our responsibility is to express an opinion on the Company’s internal control over financial reporting based on our audit. We are a public accounting firm registered with the PCAOB and are required to be independent with respect to the Company in accordance with the U.S. federal securities laws and the applicable rules and regulations of the Securities and Exchange Commission and the PCAOB.
We conducted our audit in accordance with the standards of the PCAOB. Those standards require that we plan and perform the audit to obtain reasonable assurance about whether effective internal control over financial reporting was maintained in all material respects. Our audit included obtaining an understanding of internal control over financial reporting, assessing the risk that a material weakness exists, testing and evaluating the design and operating effectiveness of internal control based on the assessed risk, and performing such other procedures as we considered necessary in the circumstances. We believe that our audit provides a reasonable basis for our opinion.
Definition and limitations of internal control over financial reporting
A company’s internal control over financial reporting is a process designed to provide reasonable assurance regarding the reliability of financial reporting and the preparation of financial statements for external purposes in accordance with generally accepted accounting principles. A company’s internal control over financial reporting includes those policies and procedures that (1) pertain to the maintenance of records that, in reasonable detail, accurately and fairly reflect the transactions and dispositions of the assets of the company; (2) provide reasonable assurance that transactions are recorded as necessary to permit preparation of financial statements in accordance with generally accepted accounting principles, and that receipts and expenditures of the company are being made only in accordance with authorizations of management and directors of the company; and (3) provide reasonable assurance regarding prevention or timely detection of unauthorized acquisition, use, or disposition of the company’s assets that could have a material effect on the financial statements.
Because of its inherent limitations, internal control over financial reporting may not prevent or detect misstatements. Also, projections of any evaluation of effectiveness to future periods are subject to the risk that controls may become inadequate because of changes in conditions, or that the degree of compliance with the policies or procedures may deteriorate.
/s/ GRANT THORNTON LLP
Philadelphia, Pennsylvania
February 20, 2025
Utz Brands, Inc.
CONSOLIDATED BALANCE SHEETS
December 29, 2024 and December 31, 2023
(In thousands, except share information)
| | | | | | | | | | | | | | |
| | As of
December 29, 2024 | | As of
December 31, 2023 |
| ASSETS | | | | |
| Current Assets | | | | |
| Cash and cash equivalents | | $ | 56,138 | | | $ | 52,023 | |
| Accounts receivable, less allowance of $3,267 and $2,933, respectively | | 119,867 | | | 135,130 | |
| Inventories | | 101,362 | | | 104,666 | |
| Prepaid expenses and other assets | | 35,269 | | | 30,997 | |
| Current portion of notes receivable | | 4,622 | | | 5,237 | |
| Total current assets | | 317,258 | | | 328,053 | |
| Non-current Assets | | | | |
| Assets held for sale | | — | | | 7,559 | |
| Property, plant and equipment, net | | 345,210 | | | 318,881 | |
| Goodwill | | 870,695 | | | 915,295 | |
| Intangible assets, net | | 996,510 | | | 1,063,413 | |
| Non-current portion of notes receivable | | 9,192 | | | 12,413 | |
| Other assets | | 189,547 | | | 101,122 | |
| Total non-current assets | | 2,411,154 | | | 2,418,683 | |
| Total assets | | $ | 2,728,412 | | | $ | 2,746,736 | |
| LIABILITIES AND EQUITY | | | | |
| Current Liabilities | | | | |
| Current portion of term debt | | $ | 16,097 | | | $ | 21,086 | |
| Current portion of other notes payable | | 6,917 | | | 7,649 | |
| Accounts payable | | 150,927 | | | 124,361 | |
| Accrued expenses and other | | 78,281 | | | 77,590 | |
| Current portion of warrant liability | | 33,048 | | | — | |
| Total current liabilities | | 285,270 | | | 230,686 | |
| Non-current portion of term debt | | 752,484 | | | 878,511 | |
| Non-current portion of other notes payable | | 14,985 | | | 19,174 | |
| Non-current accrued expenses and other | | 164,185 | | | 76,720 | |
| Non-current warrant liability | | — | | | 43,272 | |
| Deferred tax liability | | 123,744 | | | 114,690 | |
| Total non-current liabilities | | 1,055,398 | | | 1,132,367 | |
| Total liabilities | | 1,340,668 | | | 1,363,053 | |
| Commitments and contingencies | | | | |
| Equity | | | | |
| Members' equity | | | | |
| Shares of Class A Common Stock, $0.0001 par value; 1,000,000,000 shares authorized; 83,537,542 and 81,187,977 shares issued and outstanding as of December 29, 2024 and December 31, 2023, respectively. | | 8 | | | 8 | |
| Shares of Class V Common Stock, $0.0001 par value; 61,249,000 shares authorized; 57,349,000 and 59,349,000 shares issued and outstanding as of December 29, 2024 and December 31, 2023, respectively. | | 6 | | | 6 | |
| Additional paid-in capital | | 988,510 | | | 944,573 | |
| Accumulated deficit | | (304,663) | | | (298,049) | |
| Accumulated other comprehensive income | | 18,590 | | | 22,958 | |
| Total stockholders’ equity | | 702,451 | | | 669,496 | |
| Noncontrolling interest | | 685,293 | | | 714,187 | |
| Total equity | | 1,387,744 | | | 1,383,683 | |
| Total liabilities and equity | | $ | 2,728,412 | | | $ | 2,746,736 | |
The accompanying notes are an integral part of these consolidated financial statements.
Utz Brands, Inc.
CONSOLIDATED STATEMENTS OF OPERATIONS AND COMPREHENSIVE INCOME (LOSS)
For the fiscal years ended December 29, 2024, December 31, 2023, and January 1, 2023
(In thousands, except share information)
| | | | | | | | | | | | | | | | | |
| (in thousands) | For the Fiscal Year Ended December 29, 2024 | | For the Fiscal Year Ended December 31, 2023 | | For the Fiscal Year Ended January 1, 2023 |
| Net sales | $ | 1,409,281 | | | $ | 1,438,237 | | | $ | 1,408,401 | |
| Cost of goods sold | 914,504 | | | 981,751 | | | 959,344 | |
| Gross profit | 494,777 | | | 456,486 | | | 449,057 | |
| | | | | |
| Selling, distribution and administrative expenses | | | | | |
| Selling and distribution | 306,151 | | | 273,923 | | | 294,061 | |
| Administrative | 129,642 | | | 159,196 | | | 150,343 | |
| Total selling, distribution, and administrative expenses | 435,793 | | | 433,119 | | | 444,404 | |
| | | | | |
| (Loss) gain on sale of assets, net | (78) | | | (7,350) | | | 691 | |
| | | | | |
| Income from operations | 58,906 | | | 16,017 | | | 5,344 | |
| | | | | |
| Other income (expense) | | | | | |
| Gain on sale of business | 44,015 | | | — | | | — | |
| Interest expense | (44,862) | | | (60,590) | | | (44,424) | |
| Loss on debt extinguishment | (1,273) | | | — | | | — | |
| Other income | 2,457 | | | 3,066 | | | 400 | |
| Gain on remeasurement of warrant liability | 10,224 | | | 2,232 | | | 720 | |
| Other income (expense), net | 10,561 | | | (55,292) | | | (43,304) | |
| | | | | |
| Income (loss) before income taxes | 69,467 | | | (39,275) | | | (37,960) | |
| Income tax expense (benefit) | 38,730 | | | 757 | | | (23,919) | |
| Net income (loss) | 30,737 | | | (40,032) | | | (14,041) | |
| | | | | |
| Net (income) loss attributable to noncontrolling interest | (14,763) | | | 15,095 | | | 13,649 | |
| Net income (loss) attributable to controlling interest | $ | 15,974 | | | $ | (24,937) | | | $ | (392) | |
| | | | | |
Earnings (loss) per share of Class A Common Stock: (in dollars) | | | | | |
| Basic | $ | 0.19 | | | $ | (0.31) | | | $ | — | |
| Diluted | $ | 0.19 | | | $ | (0.31) | | | $ | — | |
| Weighted-average shares of Class A Common Stock outstanding: | | | | | |
| Basic | 82,102,876 | | | 81,081,458 | | | 80,093,094 | |
| Diluted | 85,433,980 | | | 81,081,458 | | | 80,093,094 | |
| | | | | |
| Net income (loss) | $ | 30,737 | | | $ | (40,032) | | | $ | (14,041) | |
| Other comprehensive (loss) gain: | | | | | |
| Change in fair value of interest rate swap | (7,478) | | | (13,543) | | | 47,279 | |
| Comprehensive income (loss) | 23,259 | | | (53,575) | | | 33,238 | |
| Net comprehensive (income) loss attributable to noncontrolling interest | (11,653) | | | 20,819 | | | (6,568) | |
| Net comprehensive income (loss) attributable to controlling interest | $ | 11,606 | | | $ | (32,756) | | | $ | 26,670 | |
The accompanying notes are an integral part of these consolidated financial statements.
Utz Brands, Inc.
CONSOLIDATED STATEMENTS OF EQUITY (DEFICIT)
For the fiscal years ended December 29, 2024, December 31, 2023, and January 1, 2023
(In thousands, except share information)
| | | | | | | | | | | | | | | | | | | | | | | | | | | | | | | | | | | | | | | | | | | | | | | | | | | | | | | | | | | | | | |
| | Class A Common Stock | | Class V Common Stock | | Additional Paid-in Capital | | Accumulated (Deficit) | | Accumulated Other Comprehensive Income | | Total Stockholders’ Equity | | Non-controlling Interest | | Total Equity |
| | Shares | | Amount | | Shares | | Amount | | |
| Balance at January 2, 2022 | | 77,644,645 | | | $ | 8 | | | 59,349,000 | | | $ | 6 | | | $ | 912,574 | | | $ | (236,598) | | | $ | 3,715 | | | $ | 679,705 | | | $ | 754,968 | | | $ | 1,434,673 | |
| Payments of tax withholding requirements for employee stock awards | | | | — | | | | | — | | | (6,217) | | | — | | | — | | | (6,217) | | | — | | | (6,217) | |
| Share-based compensation | | 1,132,316 | | | — | | | | | — | | | 10,632 | | | — | | | — | | | 10,632 | | | — | | | 10,632 | |
| Issuance of common stock in connection with private placement sale | | 2,105,373 | | | — | | | | | — | | | 28,000 | | | — | | | — | | | 28,000 | | | — | | | 28,000 | |
| Tax impact arising from capital transactions | | | | — | | | | | — | | | (18,070) | | | — | | | — | | | (18,070) | | | — | | | (18,070) | |
| Net loss | | | | — | | | | | — | | | — | | | (392) | | | — | | | (392) | | | (13,649) | | | (14,041) | |
| Other comprehensive income | | | | — | | | | | — | | | — | | | — | | | 27,062 | | | 27,062 | | | 20,217 | | | 47,279 | |
Cash dividends declared ($0.219 per share of Class A Common Stock) | | | | — | | | | | — | | | — | | | (17,574) | | | — | | | (17,574) | | | — | | | (17,574) | |
| Distribution to noncontrolling interest | | | | — | | | | | — | | | — | | | — | | | — | | | — | | | (12,998) | | | (12,998) | |
| Balance at January 1, 2023 | | 80,882,334 | | | $ | 8 | | | 59,349,000 | | | $ | 6 | | | $ | 926,919 | | | $ | (254,564) | | | $ | 30,777 | | | $ | 703,146 | | | $ | 748,538 | | | $ | 1,451,684 | |
| Payments of tax withholding requirements for employee stock awards | | | | — | | | | | — | | | (589) | | | — | | | — | | | (589) | | | — | | | (589) | |
| Share-based compensation | | 305,643 | | | — | | | | | — | | | 17,069 | | | — | | | — | | | 17,069 | | | — | | | 17,069 | |
| | | | | | | | | | | | | | | | | | | | |
| Tax impact arising from capital transactions | | | | — | | | | | — | | | 1,174 | | | — | | | — | | | 1,174 | | | — | | | 1,174 | |
| Net loss | | | | — | | | | | — | | | | | (24,937) | | | — | | | (24,937) | | | (15,095) | | | (40,032) | |
| Other comprehensive loss | | | | — | | | | | — | | | — | | | — | | | (7,819) | | | (7,819) | | | (5,724) | | | (13,543) | |
Cash dividends declared ($0.228 per share of Class A Common Stock) | | | | — | | | | | — | | | — | | | (18,548) | | | — | | | (18,548) | | | — | | | (18,548) | |
| Distribution to noncontrolling interest | | | | — | | | | | — | | | — | | | — | | | — | | | — | | | (13,532) | | | (13,532) | |
| Balance at December 31, 2023 | | 81,187,977 | | | $ | 8 | | | 59,349,000 | | | $ | 6 | | | $ | 944,573 | | | $ | (298,049) | | | $ | 22,958 | | | $ | 669,496 | | | $ | 714,187 | | | $ | 1,383,683 | |
| | | | | | | | | | | | | | | | | | | | |
| | | | | | | | | | | | | | | | | | | | | | | | | | | | | | | | | | | | | | | | | | | | | | | | | | | | | | | | | | | | | | |
| | Class A Common Stock | | Class V Common Stock | | Additional Paid-in Capital | | Accumulated (Deficit) | | Accumulated Other Comprehensive Income | | Total Stockholders’ Equity | | Non-controlling Interest | | Total Equity |
| | Shares | | Amount | | Shares | | Amount | | |
| Balance at December 31, 2023 | | 81,187,977 | | | $ | 8 | | | 59,349,000 | | | $ | 6 | | | $ | 944,573 | | | $ | (298,049) | | | $ | 22,958 | | | $ | 669,496 | | | $ | 714,187 | | | $ | 1,383,683 | |
| Payments of tax withholding requirements for employee stock awards | | | | — | | | | | — | | | (1,397) | | | — | | | — | | | (1,397) | | | — | | | (1,397) | |
| Share-based compensation | | 349,565 | | | — | | | | | — | | | 18,295 | | | — | | | — | | | 18,295 | | | — | | | 18,295 | |
| Class V to Class A Exchange | | 2,000,000 | | | — | | | (2,000,000) | | | — | | | 24,095 | | | — | | | — | | | 24,095 | | | (24,095) | | | — | |
| Deferred tax impact from divestiture | | | | — | | | | | — | | | 2,944 | | | — | | | — | | | 2,944 | | | 2,146 | | | 5,090 | |
| Special excess cash dividend | | | | — | | | | | — | | | — | | | (2,619) | | | — | | | (2,619) | | | — | | | (2,619) | |
| Net income | | | | — | | | | | — | | | | | 15,974 | | | — | | | 15,974 | | | 14,763 | | | 30,737 | |
| Other comprehensive loss | | | | — | | | | | — | | | — | | | — | | | (4,368) | | | (4,368) | | | (3,110) | | | (7,478) | |
| Cash dividends declared | | | | — | | | | | — | | | — | | | (19,969) | | | — | | | (19,969) | | | — | | | (19,969) | |
| Distribution to noncontrolling interest | | | | — | | | | | — | | | — | | | — | | | — | | | — | | | (13,944) | | | (13,944) | |
| Tax distribution | | | | — | | | | | — | | | — | | | — | | | — | | | — | | | (4,654) | | | (4,654) | |
| Balance at December 29, 2024 | | 83,537,542 | | | $ | 8 | | | 57,349,000 | | | $ | 6 | | | $ | 988,510 | | | $ | (304,663) | | | $ | 18,590 | | | $ | 702,451 | | | $ | 685,293 | | | $ | 1,387,744 | |
The accompanying notes are an integral part of these consolidated financial statements.
Utz Brands, Inc.
CONSOLIDATED STATEMENTS OF CASH FLOWS
For the fiscal years ended December 29, 2024, December 31, 2023, and January 1, 2023
(In thousands) | | | | | | | | | | | | | | | | | | | |
| For the Fiscal Year Ended December 29, 2024 | | For the Fiscal Year Ended December 31, 2023 | | For the Fiscal Year Ended January 1, 2023 | | |
| Cash flows from operating activities | | | | | | | |
| Net income (loss) | $ | 30,737 | | | $ | (40,032) | | | $ | (14,041) | | | |
| Adjustments to reconcile net income (loss) to net cash provided by operating activities: | | | | | | | |
| Impairment and other charges | — | | | 12,575 | | | 4,678 | | | |
| Depreciation and amortization | 70,940 | | | 79,488 | | | 86,801 | | | |
| | | | | | | |
| Gain on sale of business | (44,015) | | | — | | | — | | | |
| Gain on remeasurement of warrant liability | (10,224) | | | (2,232) | | | (720) | | | |
| Loss (gain) on sale of assets | 78 | | | 7,350 | | | (691) | | | |
| Share-based compensation | 18,295 | | | 17,069 | | | 10,632 | | | |
| Loss on debt extinguishment | 1,273 | | | — | | | — | | | |
| Deferred income taxes | 14,145 | | | (8,938) | | | (29,359) | | | |
| Amortization of deferred financing costs | 3,154 | | | 1,556 | | | 1,933 | | | |
| Changes in assets and liabilities: | | | | | | | |
| Accounts receivable, net | 6,782 | | | 1,855 | | | (5,597) | | | |
| Inventories | (4,628) | | | 12,652 | | | (38,490) | | | |
| Prepaid expenses and other assets | (103,459) | | | (14,433) | | | (18,379) | | | |
| Accounts payable and accrued expenses and other | 123,088 | | | 9,730 | | | 51,426 | | | |
| Net cash provided by operating activities | 106,166 | | | 76,640 | | | 48,193 | | | |
| Cash flows from investing activities | | | | | | | |
| Acquisitions, net of cash acquired | — | | | — | | | (75) | | | |
| Purchases of property and equipment | (98,639) | | | (55,724) | | | (87,965) | | | |
| Purchases of intangibles | (9,220) | | | — | | | — | | | |
| Proceeds from sale of property and equipment | 26,640 | | | 9,539 | | | 4,333 | | | |
| Proceeds from sale of business | 167,500 | | | — | | | — | | | |
| Proceeds from sale of routes | 26,658 | | | 28,665 | | | 23,399 | | | |
| Proceeds from the sale of IO notes | 4,912 | | | 5,405 | | | 5,017 | | | |
| Proceeds from insurance claims for capital investments | — | | | 1,700 | | | 3,935 | | | |
| Notes receivable, net | (42,890) | | | (38,077) | | | (24,711) | | | |
| Net cash provided by (used in) investing activities | 74,961 | | | (48,492) | | | (76,067) | | | |
| Cash flows from financing activities | | | | | | | |
| Borrowings on line of credit | 114,500 | | | 71,000 | | | 79,000 | | | |
| Repayments on line of credit | (114,699) | | | (70,632) | | | (115,000) | | | |
| Borrowings on term debt and notes payable | 39,112 | | | 13,113 | | | 124,592 | | | |
| Repayments on term debt and notes payable | (173,742) | | | (29,211) | | | (21,037) | | | |
| Payment of debt issuance cost | (733) | | | (656) | | | (3,660) | | | |
| Payments of tax withholding requirements for employee stock awards | (1,397) | | | (589) | | | (6,217) | | | |
| Proceeds from issuance of shares | — | | | — | | | 28,000 | | | |
| Dividends paid | (21,724) | | | (18,548) | | | (17,157) | | | |
| | | | | | | |
| Distribution to noncontrolling interest | (18,329) | | | (13,532) | | | (9,615) | | | |
| Net cash (used in) provided by financing activities | (177,012) | | | (49,055) | | | 58,906 | | | |
| Net increase (decrease) in cash and cash equivalents | 4,115 | | | (20,907) | | | 31,032 | | | |
| Cash and cash equivalents at beginning of period | 52,023 | | | 72,930 | | | 41,898 | | | |
| Cash and cash equivalents at end of period | $ | 56,138 | | | $ | 52,023 | | | $ | 72,930 | | | |
The accompanying notes are an integral part of these consolidated financial statements.
Utz Brands, Inc.
NOTES TO THE CONSOLIDATED FINANCIAL STATEMENTS
1.OPERATIONS AND SUMMARY OF SIGNIFICANT ACCOUNTING POLICIES
Basis of Presentation – The accompanying consolidated financial statements comprise the financial statements of Utz Brands, Inc. ("UBI") and its wholly owned subsidiaries (collectively, the “Company”). The consolidated financial statements have been prepared in accordance with accounting principles generally accepted in the United States of America ("U.S. GAAP") for financial statements and pursuant to the accounting and disclosure rules and regulations of the U.S. Securities and Exchange Commission (the "SEC"). Noncontrolling interest represents a minority owner’s proportionate share of equity in our consolidated entity Utz Brands Holdings, LLC. All intercompany transactions and balances have been eliminated in combination/consolidation.
Prior Period Revision - Statement of Cash Flows – For the fiscal year ended December 31, 2023, the Company disclosed the borrowings of lines of credit and repayments of lines of credit as separate line items within the financing activities section of the Consolidated Statement of Cash Flows. The Company has corrected these line items for the fiscal year ended January 1, 2023 for comparability purposes and deems the change to those periods to be immaterial.
Operations – The Company has been a premier producer, marketer and distributor of snack food products since 1921. The Company has steadily expanded its distribution channels to where it now sells products to supermarkets, mass merchants, club stores, dollar and discount stores, convenience stores, independent grocery stores, drug stores, food service, vending, military, and other channels in most regions of the United States through routes to market, that include direct-store-delivery (“DSD”), direct to warehouse (“DTW”), and third-party distributors. The Company manufactures and distributes a full line of high-quality salty snack items, such as potato chips, tortilla chips, pretzels, cheese balls, pork skins, party mixes, and popcorn. The Company also sells dips, crackers, dried meat products and other snack food items packaged by other manufacturers.
Cash and Cash Equivalents – The Company considers all highly-liquid investments purchased with an original maturity of three months or less to be cash equivalents. The majority of the Company’s cash is held in financial institutions with insurance provided by the Federal Deposit Insurance Corporation of $250,000 per depositor. At various times, account balances may exceed federally insured limits.
Accounts Receivables and Notes Receivable – Accounts receivable and notes receivable are reported at net realizable value. The net realizable value is based on Company management’s estimate of the amount of receivables that will be collected based on analysis of historical data and trends, as well as review of significant customer accounts. Accounts receivable are considered to be past due when payments are not received within the customer’s credit terms and notes receivables payment due date. The Company's methodology to measure the provision for credit losses requires an estimation of loss rates based upon historical loss experience adjusted for factors that are relevant to determining the expected collectability of accounts receivable and notes receivables. Some of these factors include current market conditions, delinquency trends, aging behavior of receivables, and customer classes, individual customers or individual independent operators (“IOs”) as well as expectations of future credit losses and the customer's or IO's ability to pay.
The Company's estimates are reviewed and revised periodically based on the ongoing evaluation of credit quality indicators. Historically, actual write-offs for uncollectible accounts have not significantly differed from prior estimates. The Company's bad debt expense was $0.7 million and $1.2 million for the fiscal years ended December 29, 2024 and December 31, 2023, respectively.
Inventories – Inventories are stated at the lower of cost (based on a method that approximates first-in, first-out for raw materials and finished goods and weighted average for maintenance inventories) or net realizable value. Inventory write-downs are recorded for shrinkage, damaged, stale and slow-moving items.
Property, Plant and Equipment, net – Property, plant and equipment are stated at cost net of accumulated depreciation. Major additions and betterments are recorded to the asset accounts, while maintenance and repairs, which do not improve or extend the lives of the assets, are charged to expense accounts as incurred. When assets are retired or otherwise disposed of, the cost and related accumulated depreciation are removed from the accounts, and any resulting gain or loss is reflected in operations in the disposal period. Depreciation is determined utilizing the straight-line method over the estimated useful lives of the various assets, which generally range from 2 to 20 years for machinery and equipment, 3 to 10 years for transportation equipment and 8 to 40 years for buildings. Assets held for sale are reported at the lower of the carrying amount or fair value less costs to sell. The Company assesses for impairment on property, plant and equipment upon the occurrence of a triggering event.
Hosting arrangements – Certain of our service contracts have been deemed to be hosting arrangements. Certain costs incurred for the implementation of a hosting arrangement that is a service contract are capitalized and amortized on a straight–line basis over the term of the applicable contract. Amortization begins for each component of the hosting arrangement when the component becomes ready for its intended use. Capitalized implementation costs are presented in Prepaid expenses and other assets and Other assets of the Consolidated Balance Sheets. Amortization expense of the capitalized implementation costs is presented in Administrative in the Consolidated Statements of Operations and Comprehensive Income (Loss).
Income Taxes – The Company accounts for income taxes pursuant to the asset and liability method of Financial Accounting Standards Board (“FASB”) Accounting Standards Codification (“ASC”) 740, Income Taxes, which requires it to recognize current tax liabilities or receivables for the amount of taxes it estimates are payable or refundable for the current year, and deferred tax assets and liabilities for the expected future tax consequences attributable to temporary differences between the financial statement carrying amounts and their respective tax bases of assets and liabilities and the expected benefits of net operating loss and credit carryforwards. Deferred tax assets and liabilities are measured using enacted tax rates expected to apply to taxable income in the years in which those temporary differences are expected to be recovered or settled. The effect on deferred tax assets and liabilities of a change in tax rates is recognized in operations in the period enacted. A valuation allowance is provided when it is more likely than not that a portion or all of a deferred tax asset will not be realized. The ultimate realization of deferred tax assets is dependent upon the generation of future taxable income and the reversal of deferred tax liabilities during the period in which related temporary differences become deductible.
The Company follows the provisions of ASC 740-10 related to the accounting for uncertainty in income taxes recognized in an enterprise’s financial statements. ASC 740-10 prescribes a comprehensive model for the financial statement recognition, measurement, presentation and disclosure of uncertain tax positions taken or expected to be taken in income tax returns.
The benefit of tax positions taken or expected to be taken in the Company’s income tax returns is recognized in the financial statements if such positions are more likely than not of being sustained upon examination by taxing authorities. Differences between tax positions taken or expected to be taken in a tax return and the benefit recognized and measured pursuant to the interpretation are referred to as "unrecognized benefits.” A liability is recognized (or amount of net operating loss carryover or amount of tax refundable is reduced) for an unrecognized tax benefit because it represents an enterprise’s potential future obligation to the taxing authority for a tax position that was not recognized as a result of applying the provisions of ASC 740-10. Interest costs and related penalties related to unrecognized tax benefits are required to be calculated, if applicable. The Company’s policy is to classify assessments, if any, for tax related interest as interest expense and penalties as selling, distribution, general and administrative expenses. As of each of December 29, 2024 and December 31, 2023, no liability for unrecognized tax benefits was required to be reported. The Company does not expect any significant changes in its unrecognized tax benefits in the next fiscal year.
Distribution Route Acquisition and Sale Transactions – The Company acquires and sells distribution routes as a part of the Company’s maintenance of its DSD network. As new IOs are identified, the Company either sells its newly-created or existing Company-managed routes to IOs or sells routes that were previously acquired by the Company to IOs. Gain/loss from the sale of a distribution route is recorded upon the completion of the sale transaction and is calculated based on the difference between the sale price of the distribution route and the asset carrying value of the distribution route as of the date of sale. The Company records intangible assets for distribution routes that it purchases based on the payment that the Company makes to acquire the route and records the purchased distribution routes as indefinite-lived intangible assets under FASB ASC 350, Intangibles – Goodwill and Other. The indefinite lived intangible assets are subject to annual impairment testing.
Goodwill and Other Identifiable Intangible Assets – The Company allocates the cost of acquired companies to the identifiable tangible and intangible assets acquired and liabilities assumed, with the remaining amount classified as goodwill. The identification and valuation of these intangible assets and the determination of the estimated useful lives at the time of acquisition, as well as the completion of impairment tests, require significant management judgments and estimates. These estimates are made based on, among other factors, review of projected future operating results and business plans, economic projections, anticipated highest and best use of future cash flows and the cost of capital. The use of alternative estimates and assumptions could increase or decrease the estimated fair value of goodwill and other intangible assets, and potentially result in a different impact to the Company’s results of operations. Further, changes in business strategy and/or market conditions may significantly impact these judgments and thereby impact the fair value of these assets, which could result in an impairment of the goodwill or intangible assets.
Finite-lived intangible assets consist of distribution/customer relationships, technology, certain master distribution rights and certain trademarks. These assets are being amortized over their estimated useful lives. Finite-lived intangible assets are tested for impairment only when management has determined that potential impairment indicators are present.
Goodwill and other indefinite-lived intangible assets (including certain trademarks, trade names, certain master distribution rights and Company-owned sales routes) are not amortized but are tested for impairment at least annually and whenever events or circumstances change that indicate impairment may have occurred. The Company tests goodwill for impairment at the reporting unit level. The Company has identified the existing snack food operations as its sole reporting unit.
In accordance with the FASB Accounting Standards Update ("ASU”) No. 2017-04, Intangibles - Goodwill and Other ("Topic 350”): Simplifying the Test for Goodwill Impairment, the Company is required to record an impairment charge based on the excess of a reporting unit’s carrying amount over its fair value.
Topic 350 also permits an entity to first assess qualitative factors to determine whether it is necessary to perform quantitative impairment tests for goodwill and indefinite-lived intangibles. If an entity believes, as a result of each qualitative assessment, it is more likely than not that the fair value of goodwill or an indefinite-lived intangible asset exceeds its carrying value then a quantitative impairment test is not required.
For the latest qualitative analysis performed, which took place on the first day of the fourth quarter of 2024, we had taken into consideration all the events and circumstances listed in Topic 350, in addition to other entity-specific factors that have taken place and concluded that Goodwill and our indefinite-lived intangible assets were not impaired.
Share-Based Compensation – Share-based compensation is awarded to associates and directors of the Company and accounted for in accordance with ASC 718, Compensation—Stock Compensation ("ASC 718”). Share-based compensation expense is recognized for equity awards over the vesting period based on their grant-date fair value. The Company uses various forms of long-term incentives including, but not limited to, stock options, restricted stock units ("RSUs”) and performance stock units ("PSUs”). The fair value of stock options is estimated at the date of grant using the Black-Scholes valuation model. The exercise price of each stock option equals or exceeds the estimated fair value of the Company’s stock price on the date of grant. Stock options can generally be exercised over a maximum term of ten years. The grant date fair value of the PSUs is determined using the Monte Carlo simulation model. The grant date fair value of the RSUs is determined using the Company’s closing trading price on the grant date. Share-based compensation expense is included within the same financial statement caption where the recipient’s other compensation is reported. The Company accounts for forfeitures as they occur.
Fair Value of Financial Instruments – Financial instruments held by the Company include cash and cash equivalents, accounts receivable, notes receivable, hedging instruments, warrants, purchase commitments on commodities, accounts payable and debt. The carrying value of all cash and cash equivalents, accounts receivable and accounts payable, and notes receivable approximate their fair value due to their short-term nature. The carrying value of the debt is also estimated to approximate its fair value based upon current market conditions and interest rates. The fair value of the hedging instruments is revalued at each reporting period. The related gains and losses of the hedging instruments are reported in Prepaid expense and other assets and Accounts payable and accrued expenses and other on the Consolidated Statement of Cash Flow. The Company has elected hedge account for its interest rate swaps. Gains and loss related to the interest rate swaps are recognized in Accumulated other comprehensive income, with mark to market adjustments being recognized immediately in earnings.
Self-Insurance – The Company is primarily self-insured, up to certain limits, for employee group health claims. The Company purchases stop-loss insurance, which will reimburse the Company for individual and aggregate claims in excess of certain annual established limits. Operations are charged with the cost of claims reported and an estimate of claims incurred but not reported. Total health care expense under the program was $20.2 million for the fiscal year ended December 29, 2024, $22.2 million for the fiscal year ended December 31, 2023, and $18.7 million for the fiscal year ended January 1, 2023. The reserve for unpaid claims, which includes an estimate of claims incurred but not reported, was $2.2 million and $2.0 million at December 29, 2024 and December 31, 2023, respectively.
The Company is primarily self-insured through large deductible insurance plans for automobile, general liability and workers’ compensation. The Company has utilized a number of different insurance vehicles and programs for these insurable risks and recognizes expenses and reserves in accordance with the provisions of each insurance vehicle/program. The expense associated with automobile, general liability and workers’ compensation insurance programs totaled $10.7 million for the fiscal year ended December 29, 2024, $11.1 million for the fiscal year ended December 31, 2023, and $8.5 million for the fiscal year ended January 1, 2023. The Company also records reserves for unpaid claims and an estimate for claims incurred but not yet reported, including an estimate for the development of any such claim. As of each of December 29, 2024 and December 31, 2023, the Company had reserves totaling $4.1 million for these insurance programs.
Shipping and Handling – The Company records shipping and handling expenses within selling expenses. Shipping and handling expenses for products shipped to customers totaled $50.1 million for the fiscal year ended December 29, 2024, $45.0 million for the fiscal year ended December 31, 2023, and $59.5 million for the fiscal year ended January 1, 2023.
Advertising Costs – Advertising costs are charged to operations when incurred. Advertising expenses totaled $17.8 million for the fiscal year ended December 29, 2024, $12.3 million for the fiscal year ended December 31, 2023, and $9.9 million for the fiscal year ended January 1, 2023. Cooperative advertising, primarily consisting of in-print advertising, point-of-sale displays, and in-store demos, totaled $33.8 million for the fiscal year ended December 29, 2024, $29.8 million for the fiscal year ended December 31, 2023, and $21.6 million for the fiscal year ended January 1, 2023.
Employee Benefits – The Company maintains several contributory 401(k) retirement plans (the "Plans”) for its associates. Profit sharing contributions are made at the discretion of the Board of Directors and expenses recognized related to the profit-sharing contribution were $4.9 million for the fiscal year ended December 29, 2024, $5.5 million for the fiscal year ended December 31, 2023, and $6.3 million for the fiscal year ended January 1, 2023. The Plans provide associates with matching contributions primarily at 20% of their contributions as defined in the Plans. The expense related to the matching contributions was $1.3 million for the fiscal year ended December 29, 2024, $1.7 million for the fiscal year ended December 31, 2023, and $1.4 million for the fiscal year ended January 1, 2023.
Revenue Recognition – The Company’s revenues primarily consist of the sale of salty snack items to customers, including supermarkets, mass merchants, club stores, dollar and discount stores, convenience stores, independent grocery stores, drug stores, food service, vending, military, and other channels. The Company sells its products in most regions of the United States primarily through its DSD network, DTW shipments, and third-party distributors. These revenue contracts generally have a single performance obligation. Revenue, which includes shipping and handling charges billed to the customer, is reported net of variable consideration and consideration payable to customers, including applicable discounts, returns, allowances, trade promotion, consumer coupon redemption, unsaleable product, and other costs, some of which are recorded in Selling and distribution in the Consolidated Statements of Operations and Comprehensive Income (Loss). Amounts billed and due from customers are classified as accounts receivable and require payment on a short-term basis and, therefore, the Company does not have any significant financing components.
The Company recognizes revenue when (or as) performance obligations are satisfied by transferring control of the goods to customers. Control is transferred upon delivery of the goods to the customer. Shipping and/or handling costs that occur before the customer obtains control of the goods are deemed to be fulfillment activities and are accounted for as fulfillment costs. Applicable shipping and handling are included in customer billing and are recorded as revenue as the products’ control is transferred to customers. The Company assesses the goods promised in customer purchase orders and identifies a performance obligation for each promise to transfer a good that is distinct.
The Company offers various forms of trade promotions and the methodologies for determining these provisions are dependent on local customer pricing and promotional practices, which range from contractually fixed percentage price reductions to provisions based on actual occurrence or performance. The Company’s promotional activities are conducted either through the retail trade or directly with consumers and include activities such as in store displays and events, feature price discounts, consumer coupons, and loyalty programs. The costs of these activities are recognized at the time the related revenue is recorded, which normally precedes the actual cash expenditure. The recognition of these costs therefore requires management judgment regarding the volume of promotional offers that will be redeemed by either the retail trade customer or consumer. These estimates are made using various techniques including historical data on performance of similar promotional programs. The Company had reserves in place of $20.8 million as of December 29, 2024, which include adjustments taken by customers of $9.3 million that are awaiting final processing. The Company had reserves in place of $17.4 million as of December 31, 2023, which include adjustments taken by customers of $6.2 million that are awaiting final processing. Differences between estimated expense and actual redemptions are recognized as a change in management estimate as actual redemptions are incurred.
Customer Concentrations – One customer provided in excess of 10% of the Company's net sales during the fiscal years ended December 29, 2024, December 31, 2023 and January 1, 2023 in the amount of 14%, 13% and 12%, respectively. In addition, no customer provided greater than 10% of the Company's accounts receivable at December 29, 2024 and December 31, 2023. One customer provided in excess of 10% of the Company's accounts receivable at January 1, 2023 in the amount of 11%.
Business Combinations – The Company evaluates acquisitions of assets and other similar transactions to assess whether or not the transaction should be accounted for as a business combination or asset acquisition by first applying a screen test to determine if substantially all of the fair value of the gross assets acquired is concentrated in a single identifiable asset or group of similar identifiable assets. If the screen is met, the transaction is accounted for as an asset acquisition. If the screen is not met, further determination is required as to whether or not the Company has acquired inputs and processes that have the ability to create outputs which would meet the definition of a business. Significant judgment is required in the application of the screen test to determine whether an acquisition is accounted for as a business combination or an acquisition of assets.
The Company uses the acquisition method of accounting for acquired businesses. Under the acquisition method, the Company’s financial statements reflect the operations of an acquired business starting from the completion of the acquisition. The assets acquired and liabilities assumed are recorded at their respective estimated fair values at the date of the acquisition. Any excess of the purchase price over the estimated fair values of the identifiable net assets acquired is recorded as goodwill.
Distributor Buyouts - During the fiscal years ended December 29, 2024 and December 31, 2023, the Company bought out and terminated the contracts of multiple third-party distributors who had previously been providing services to the Company. These transactions, which were accounted for as contract terminations and asset purchases, resulted in expense of $2.1 million, $1.5 million and $23.0 million for the fiscal years ended December 29, 2024, December 31, 2023 and January 1, 2023, respectively and are included within selling and distribution on the Consolidated Statement of Operations and Comprehensive Income (Loss) for such periods.
Use of Estimates – Management uses estimates and assumptions in preparing the consolidated financial statements in accordance with U.S. GAAP. Those estimates and assumptions affect the reported amounts of assets and liabilities, the disclosure of contingent assets and liabilities, and the reported revenues and expenses. Some examples, but not a comprehensive list, include sales and promotional allowances, customer returns, allowances for doubtful accounts, inventory valuations, useful lives of fixed assets and related impairment, long-term investments, hedge transactions, goodwill and intangible asset valuations and impairments, incentive compensation, income taxes, self-insurance, contingencies, litigation, and inputs used to calculate deferred tax liabilities, tax valuation allowances, and tax receivable agreements. Actual results could vary materially from the estimates that were used.
Recently Issued Accounting Standards – In November 2024, the FASB issued ASU 2024-03, Income Statement - Reporting Comprehensive Income - Expense Disaggregation Disclosures, to improve financial reporting by requiring that public business entities disclose additional information about specific expense categories in the notes to the financial statements at interim and annual reporting periods. The ASU is effective for annual reporting periods beginning after December 15, 2026 and interim reporting periods beginning after December 15, 2027, with early adoption permitted. The amendments can be applied either prospectively or retrospectively. The Company is currently evaluating the ASU to determine its impact on the Company's Consolidated Statement of Operations and Comprehensive income.
In December 2023, FASB issued ASU 2023-09, Income Taxes: Improvements to Income Tax Disclosures, to amend existing income tax disclosure guidance, primarily requiring more detailed disclosures for income taxes paid and the effective tax rate reconciliation. The ASU is effective for annual reporting periods beginning after December 15, 2024, with early adoption permitted and can be applied on either a prospective or retroactive basis. The Company is currently evaluating the ASU to determine its impact on the Company's income tax disclosures.
In November 2023, the FASB issued ASU 2023-07, Segment Reporting: Improvements to Reportable Segment Disclosures, to improve reportable segment disclosure requirements, primarily through enhanced disclosures about significant segment expenses. Among other changes, the amendments require disclosure of significant segment expenses that are regularly provided to the chief operating decision maker and included within each reported measure of segment profit or loss. The amendments were effective for fiscal years beginning after December 15, 2023, and interim periods within fiscal years beginning after December 15, 2024, and are applied on a retrospective basis. The adoption of this standard resulted in additional financial statement footnote disclosures and are presented in Note 16. Segment Data.
2.DIVESTITURES
On February 5, 2024, the Company sold certain assets and brands to affiliates of Our Home™, an operating company of Better-for-You brands (“Our Home”). Under the agreement, affiliates of Our Home purchased the Good Health and R.W. Garcia brands, the Lincolnton, NC and Lititz, PA manufacturing facilities and certain related assets and assumed the Company’s Las Vegas, NV facility lease and manufacturing operations (the "Good Health and R.W. Garcia Sale") for $167.5 million, subject to customary adjustments.
The following table summarizes the net assets and liabilities included in the Good Health and R.W. Garcia Sale on February 5, 2024:
| | | | | | | | |
| | |
| | |
| | |
| | |
| Property, plant, and equipment net | | $ | 27,483 | |
| Goodwill | | 44,600 | |
| Intangible assets, net | | 44,327 | |
| | |
| | |
| | |
| Net working capital adjustments | | 7,075 | |
| | |
| | |
| | |
| Net assets sold | | $ | 123,485 | |
The Company recognized a gain on the Good Health and R.W. Garcia Sale of $44.0 million. The gain on the Good Health and R.W. Garcia Sale is recognized as Gain on sale of business in the Consolidated Statements of Operations and Comprehensive Income (Loss) for the fiscal year ended December 29, 2024.
On April 22, 2024, the Company sold to Our Home its Berlin, PA and Fitchburg, MA manufacturing facilities and certain related assets, including certain inventory (the “Manufacturing Facilities Sale”). The total consideration for the transactions was $18.5 million, subject to customary adjustments. The Company recognized a gain on the Manufacturing Facilities Sale of $4.3 million included in (Loss) gain in sale of assets, net in the Consolidated Statements of Operations and Comprehensive Income (Loss).
The Company and Our Home are operating under transition services agreements related to each of the Good Health and R.W. Garcia Sale and the Manufacturing Facility Sale, which are scheduled to expire during the first half of 2025. In addition, the parties will operate under reciprocal co-manufacturing agreements pursuant to which Our Home will co-manufacture certain of the Company's products and the Company will co-manufacture certain Good Health products. Certain Good Health products will continue to be distributed and sold on the Company's DSD network for Our Home pursuant to a distribution agreement. The Company received approximately $18.7 million in advance from Our Home for certain terms under these agreements, which the Company will recognize through income from operations over the terms of the transition services and co-manufacturing agreements.
3.INVENTORIES
Inventories consisted of the following:
| | | | | | | | | | | | | | |
| (in thousands) | | As of December 29, 2024 | | As of December 31, 2023 |
| Finished goods | | $ | 66,976 | | | $ | 65,673 | |
| Raw materials | | 27,081 | | | 29,757 | |
| Maintenance parts | | 7,305 | | | 9,236 | |
| Total inventories | | $ | 101,362 | | | $ | 104,666 | |
In connection with the Good Health and R.W. Garcia Sale in February 2024 and the Manufacturing Facilities Sale in April 2024, the Company sold inventory of $6.3 million and $1.6 million, respectively. See Note 2. Divestitures.
4.PROPERTY, PLANT AND EQUIPMENT, NET
Property, plant and equipment, net, consisted of the following:
| | | | | | | | | | | | | | |
| (in thousands) | | As of December 29, 2024 | | As of December 31, 2023 |
| Land | | $ | 25,861 | | | $ | 28,561 | |
| Buildings | | 113,227 | | | 123,603 | |
| Machinery and equipment | | 215,529 | | | 248,886 | |
| Land improvements | | 2,655 | | | 3,887 | |
| Building improvements | | 2,791 | | | 5,163 | |
| Construction-in-progress | | 107,425 | | | 35,533 | |
| | | 467,488 | | | 445,633 | |
| Less: accumulated depreciation | | (122,278) | | | (126,752) | |
| Property, plant and equipment, net | | $ | 345,210 | | | $ | 318,881 | |
On April 28, 2022, certain of the Company's subsidiaries purchased a brand new, recently completed snack food manufacturing facility in Kings Mountain, North Carolina from Evans Food Group Ltd. d/b/a Benestar Brands and related affiliates. The total cash purchase price of the facility was approximately $38.4 million, plus assumed liabilities of $1.3 million. The Company paid the full cash purchase price of $38.4 million at the closing and concurrently with the facility purchase, the Company sold 2.1 million shares of the Company’s Class A Common Stock for $28.0 million, to affiliates of Benestar in a private placement pursuant to Section 4(a)(2) of the Securities Act of 1933, as amended.
During the fiscal year ended January 1, 2023, the Company recorded impairments totaling $2.7 million related to property and equipment damaged in one of the Company's smaller manufacturing facilities by a natural disaster (the "Gramercy, LA Facility"). During the fiscal year ended January 1, 2023, the Company received $3.9 million in insurance proceeds related to a partial settlement of damaged property and equipment, resulting in a gain during fiscal the year ended January 1, 2023 of $1.2 million. As a result of the damage to the facility, the Company has had to shift production to other facilities as well as utilize a co-manufacturer which resulted in additional production and distribution costs. In addition, during the fiscal year ended January 1, 2023, the Company received $6.0 million in proceeds related to a partial settlement of a business interruption insurance claim. During the fiscal year ended December 31, 2023, the Company received an additional $1.7 million in insurance proceeds related to the settlement of damaged property and equipment and additional $1.3 million related to the settlement of the business interruption insurance claim. The Company has recognized receipts of the business interruption insurance as a reduction of Cost of goods sold and the receipts related to the damage to property, plant and equipment within the (Loss) gain on sale of assets, net in the Company's Consolidated Statement of Operations and Comprehensive Income (Loss). The Company recognizes gains from insurance proceeds, at the earliest, after receipt of insurance proceeds. The Company recorded additional impairments for the fiscal year ended December 31, 2023 totaling $1.9 million recorded under Administrative on the Consolidated Statements of Operations and Comprehensive Income (Loss).
During the fiscal year ended December 31, 2023, the Company permanently ceased operations at the Company’s manufacturing facility located in Birmingham, AL (the “Birmingham Facility”), effective in June 2023 (the “Manufacturing Closure”). Golden Flake® and other products that were produced at the Birmingham Facility continue to be produced at other manufacturing facilities. The Manufacturing Closure reduced the Company's workforce by approximately 130 employees, and the Company maintains its distribution center in Birmingham. The Company recorded expense of $8.9 million in connection with the Manufacturing Closure, which included $1.3 million in severance and related costs and $10.6 million of asset impairments related to fixed assets. The severance and related expenses were recorded in the Cost of goods sold line in the Consolidated Statement of Operations and Comprehensive Income (Loss) for the fiscal year ended December 31, 2023. The fixed asset impairments are recorded in the administrative expenses line in the Consolidated Statement of Operations and Comprehensive Income (Loss) for the fiscal year ended December 31, 2023. In addition, during the fiscal year ended December 31, 2023, the Company recognized expense of $1.9 million related to the impairment of property, plant and equipment unrelated to the Manufacturing Closure.
During the fiscal year ended December 29, 2024, the Company sold the Birmingham Facility for proceeds of $6.0 million and the Gramercy, LA Facility for proceeds of $1.8 million. Both of these facilities were classified as Assets held for sale in the Consolidated Balance Sheet at December 31, 2023.
During the fiscal year ended December 31, 2023, the Company completed the sale of the Company's manufacturing facility in Bluffton, Indiana, which resulted in a loss on sale of the assets of $13.4 million. Also, in connection with the sale, the Company recorded $4.7 million of expense related to the termination of a contract that was settled with the sale. Additionally, the Company entered into a supply agreement with the buyer pursuant to which the buyer is obligated to co-manufacture certain products at below-market rates for up to one year. The Company recorded a tolling asset of $0.6 million for the difference between the rate charged and the market rate for these services. If the buyer defaults on its obligations to manufacture any of the committed products, a financial penalty will be assessed based on the contractual terms required in the supply agreement. In a separate transaction, the Company completed the sale of land in Hanover, Pennsylvania to a separate third-party for a gain of $4.0 million.
During the fiscal year ended December 29, 2024, in connection with the Good Health and R.W. Garcia Sale as described in Note 2. Divestitures, the Company sold its Lincolnton, NC and Lititz, PA manufacturing facilities and certain related assets having a net book value of $27.5 million. Also, during the fiscal year ended December 29, 2024, in connection with the Manufacturing Facilities Sale as described in Note 2. Divestitures, the Company sold its Berlin, PA and Fitchburg, MA manufacturing facilities having a net book value of $12.2 million and recognized a gain on the Manufacturing Facilities Sale of $4.3 million.
Depreciation expense was $33.4 million for the fiscal year ended December 29, 2024, $40.5 million for the fiscal year ended December 31, 2023, and $47.8 million for the fiscal year ended January 1, 2023. Depreciation expense is classified in Cost of goods sold, and Selling, distribution, and administrative expenses on the Consolidated Statements of Operations and Comprehensive Income (Loss).
5.GOODWILL AND INTANGIBLE ASSETS, NET
A roll forward of goodwill is as follows:
| | | | | |
| (in thousands) | |
| Balance as January 1, 2023 | $ | 915,295 | |
| Balance as December 31, 2023 | 915,295 | |
| Good Health and R.W. Garcia Sale, Note 2. Divestitures | (44,600) | |
| Balance as December 29, 2024 | $ | 870,695 | |
Intangible assets, net, consisted of the following:
| | | | | | | | | | | | | | | | | |
| (in thousands) | | As of December 29, 2024 | | | As of December 31, 2023 |
| Subject to amortization: | | | | | |
| Distributor/customer relationships | | $ | 647,712 | | | | $ | 677,930 | |
| | | | | |
| Trademarks | | 59,920 | | | | 63,850 | |
| | | | | |
| Amortizable assets, gross | | 707,632 | | | | 741,780 | |
| Accumulated amortization | | (151,878) | | | | (120,405) | |
| Amortizable assets, net | | 555,754 | | | | 621,375 | |
| Not subject to amortization | | | | | |
| Trade names | | 428,733 | | | | 434,513 | |
| IO routes | | 12,023 | | | | 7,525 | |
| Intangible assets, net | | $ | 996,510 | | | | $ | 1,063,413 | |
Previously, the Company was granted certain exclusive distribution rights for certain products manufactured by another manufacturer. During the fiscal year ended January 1, 2023, the Company shifted the relationship with that manufacturer and converted that shelf space to Company-branded products. As a result, the Company recorded impairment expense of $2.0 million and the amortizable master distribution rights decreased by $2.2 million.
During the fiscal year ended December 29, 2024, the Company sold customer relationships and trademarks with carrying values of $26.0 million and $18.3 million, respectively, related to the Good Health and R.W. Garcia Sale. See Note 2. Divestitures, for further discussion. In addition, during the fiscal year ended December 29, 2024, the Company paid $9.2 million to purchase an indefinite life intangible right for use of a third-party brand name. This intangible asset is classified as an indefinite life trade name. There were no other significant changes to intangible assets during the fiscal years ended December 29, 2024 and December 31, 2023 other than those which arise from the normal course of business from the buying and selling of Company-owned route assets and amortization.
Amortization of the distributor/customer relationships, technology, and trademarks amounted to $36.3 million for the fiscal year ended December 29, 2024, and $37.7 million for both of the fiscal years ended December 31, 2023 and January 1, 2023. The expense related to the amortization of intangibles is classified in administrative expenses on the Consolidated Statements of Operations and Comprehensive Income (Loss).
Amortization expense is classified in administrative expenses on the Consolidated Statements of Operations and Comprehensive Income (Loss). Estimated future amortization expense is as follows:
| | | | | | | | |
| (in thousands) | | As of December 29, 2024 |
| 2025 | | $ | 36,071 | |
| 2026 | | 36,071 | |
| 2027 | | 36,071 | |
| 2028 | | 36,071 | |
| 2029 | | 36,071 | |
| Thereafter | | 375,399 | |
| Total | | $ | 555,754 | |
6.NOTES RECEIVABLE
Contracts are executed between the Company and the IOs for the sale of the product distribution route, including a note in favor of the Company, in certain cases. The notes bear interest at rates ranging from 5.00% to 10.55% with terms ranging generally from one to ten years. The notes receivable balances due from IOs at December 29, 2024 and December 31, 2023 totaled $13.8 million and $17.6 million, respectively, and are collateralized by the routes for which the loans are made. The Company also sold certain notes to Bank of America and one other bank. The Company has a corresponding notes payable liability, related to the IOs notes receivables. See Note 8. Long-Term Debt and Note 12. Contingencies.
Other notes receivable totaled $0.1 million as of each of December 29, 2024 and December 31, 2023.
7.ACCRUED EXPENSES AND OTHER
Current accrued expenses and other consisted of the following:
| | | | | | | | | | | | | | |
| (in thousands) | | As of December 29, 2024 | | As of December 31, 2023 |
| Accrued compensation and benefits | | $ | 24,303 | | | $ | 21,466 | |
| Operating right of use liability | | 17,341 | | | 14,992 | |
| Insurance liabilities | | 6,762 | | | 6,811 | |
| Accrued freight and manufacturing related costs | | 3,947 | | | 4,424 | |
| | | | |
| Accrued dividends and distributions | | 8,594 | | | 7,972 | |
| | | | |
| Accrued interest | | 11,086 | | | 13,280 | |
| Deferred transition services and other fees (a) | | 2,002 | | | — | |
| Other accrued expenses | | 4,246 | | | 8,645 | |
| Total accrued expenses and other | | $ | 78,281 | | | $ | 77,590 | |
(a) See Note 2. Divestitures, for further discussion.
Non-current accrued expenses and other consisted of the following:
| | | | | | | | | | | | | | |
| (in thousands) | | As of December 29, 2024 | | As of December 31, 2023 |
Operating right of use liability(1) | | $ | 132,995 | | | $ | 43,928 | |
| Tax Receivable Agreement liability | | 24,272 | | | 24,297 | |
| Supplemental retirement and salary continuation plans | | 6,918 | | | 6,559 | |
| Long-term portion of an interest rate hedge liability | | — | | | 1,936 | |
| Total accrued expenses and other | | $ | 164,185 | | | $ | 76,720 | |
(1) During the fiscal year ended December 29, 2024, the Company entered into an operating lease agreement related to a distribution center in Hanover. See Note 15. Leases.
8.LONG-TERM DEBT
Revolving Credit Facility
UBH has an asset based revolving credit facility (as amended, the “ABL facility”). On September 22, 2022, the ABL facility was amended to further increase the credit limit up to $175.0 million and to replace the interest rate benchmark from London Inter-Bank Rate ("LIBOR") to the Secured Overnight Financing Rate (“SOFR”). On July 20, 2023, the ABL facility was further amended to increase the credit limit to $225.0 million and extend the maturity from October 2023 through the earlier of July 20, 2028, or 91 days prior to the maturity of the Term Loan B (as defined below). The Company incurred fees of $0.7 million in connection with the amendment to the ABL facility. On April 17, 2024, the Company further amended its ABL facility to reduce the rate from SOFR plus the applicable rate ranging from 1.50%-2.00% plus a credit spread adjustment to SOFR plus the applicable rate ranging from 1.50%-2.00%, as well as certain other changes. Other material terms of the ABL facility, including maturity date, remained unchanged.
Availability under the ABL facility is based on monthly accounts receivable and inventory borrowing base certification, which is net of outstanding letters of credit and amounts borrowed. As of December 29, 2024 and December 31, 2023, $158.7 million and $158.4 million, respectively, was available for borrowing, net of letters of credit. The ABL facility is also subject to unused line fees (0.5% at both December 29, 2024 and December 31, 2023) and other fees and expenses.
Standby letters of credit in the amount of $10.3 million and $12.2 million were issued as of December 29, 2024 and December 31, 2023, respectively. The standby letters of credit are primarily issued for insurance purposes.
Term Loans
The Company has a credit agreement with a syndicate of banks, led by Bank of America, N.A. (“Term Loan B”) which had an original outstanding balance of $795.0 million maturing on January 20, 2028. On September 22, 2022, the Company amended its Term Loan B to replace the interest rate benchmark from LIBOR to SOFR. In March 2024, in connection with the Good Health and R.W. Garcia Sale as described in Note 2. Divestitures and Note 4. Property, Plant and Equipment, Net, the Company made a $141.0 million accelerated payment on its Term Loan B. On April 17, 2024, the Company further amended its Term Loan B to refinance in full all of the $630.3 million outstanding term loan and reduce the interest rate from SOFR plus the applicable rate of 3.00% plus a credit spread adjustment to SOFR plus the applicable rate of 2.75%, as well as to make certain other changes. Other material terms of the Term Loan B, including the January 2028 maturity date, remained unchanged. The Company recorded a loss on debt extinguishment of $1.3 million related to the refinancing of its Term Loan B in its Consolidated Statement of Operations and Comprehensive Income (Loss) for the fiscal year ended December 29, 2024. The weighted average interest rate on the Term Loan B debt, including the impact of the interest rate swap (see Note 9. Derivative Financial Instruments and Purchase Commitments), for the fiscal year ended December 29, 2024 and the fiscal year ended December 31, 2023 was 5.14% and 5.74%, respectively.
On October 12, 2022, the Company entered into a loan agreement (the “Real Estate Term Loan”) with City National Bank which was secured by a majority of the Company's real estate assets. The Real Estate Term Loan has a ten-year maturity and amortizes approximately $3.5 million in principal annually, with a balloon payment due at maturity. The Real Estate Term Loan contains a single financial maintenance covenant consisting of a fixed charge coverage ratio that is tested quarterly only during a covenant trigger period consistent with the existing ABL facility. Concurrent with the closing of the Real Estate Term Loan, Utz Quality Foods, LLC entered into an interest rate swap transaction to fix the effective interest rate at approximately 5.93%, as discussed in further detail within Note 9. Derivative Financial Instruments and Purchase Commitments. In September 2023, the Company made an additional $4.4 million payment on its Real Estate Term Loan using net proceeds from the sale of land to a third-party, as discussed within Note 4. Property, Plant and Equipment, Net, as well as cash on hand. In February 2024, in connection with the Good Health and R.W. Garcia Sale as described in Note 2. Divestitures and Note 4. Property, Plant and Equipment, Net, the Company made an additional $8.5 million payment on its Real Estate Term Loan. In April 2024, in connection with the Manufacturing Facilities Sale as described in Note 2. Divestitures and Note 4. Property, Plant and Equipment, Net, the Company made an additional payment of $9.2 million on its Real Estate Term Loan.
The Term Loan B and the ABL facility are collateralized by substantially all of the assets and liabilities of UBH and its subsidiaries excluding the real estate assets secured by the Real Estate Term Loan, including equity interests in certain of UBH’s subsidiaries. The credit agreements contain certain affirmative and negative covenants as to operations and the financial condition of UBH and its subsidiaries. UBH and its subsidiaries were in compliance with its financial covenants as of December 29, 2024.
Term debt and revolving credit facilities consisted of the following:
| | | | | | | | | | | | | | | | | | | | | | | | | | | | | | |
Debt (in thousands) | | | | Principal Balance | | | | Maturity Date | | December 29, 2024 | | December 31, 2023 |
| Term Loan B | | | | $ | 795,000 | | | | | January-28 | | $ | 630,335 | | | $ | 771,335 | |
| | | | | | | | | | | | |
| | | | | | | | | | | | |
| | | | | | | | | | | | |
| Real Estate Loan | | | | 88,140 | | | | | October-32 | | 59,626 | | | 80,184 | |
Equipment loans(1) | | | | 109,625 | | | | | | | 83,530 | | | 56,482 | |
| | | | | | | | | | | | |
ABL facility(2) | | | | | | | | October-27 | | 168 | | | 368 | |
| Net impact of debt issuance costs and original issue discounts | | | | | | | | | | (5,078) | | | (8,772) | |
| Total long-term debt | | | | | | | | | | 768,581 | | | 899,597 | |
| Less: current portion | | | | | | | | | | (16,097) | | | (21,086) | |
| Long term portion of term debt and financing obligations | | | | | | | | | | $ | 752,484 | | | $ | 878,511 | |
(1) Equipment loans have varying maturities from June 2026 to October 2029. The Company has made the following draws upon these agreements: $32.4 million in the fiscal year ended January 1, 2023, $13.1 million in the fiscal year ended December 31, 2023 and $39.1 million in the fiscal year ended December 29, 2024. These draws bear interest ranging from 3.26% through 7.56%.
(2) The Company generally utilizes the prime rate for amounts that the Company expects to pay down within 30 days, the interest rate on the ABL facility as of December 29, 2024 and December 31, 2023, was 8.00% and 9.25%, respectively, under the prime rate. Balances that are expected to be carried longer than 30 days, the interest rate on the ABL facility as of December 29, 2024 was 6.11%.
As of December 29, 2024, the minimum debt repayments under term debt and financing obligations consisted of the following:
| | | | | | | | |
| (in thousands) | | |
| 2025 | | $ | 16,097 |
| 2026 | | 17,043 |
| 2027 | | 15,367 |
| 2028 | | 642,357 |
| 2029 | | 7,922 |
| Thereafter | | 74,873 |
| Total | | $ | 773,659 |
The Term Loan B, the ABL Facility, and the equipment loans are debt of UBH and its’ subsidiaries. There are no material differences between the financial statements of UBI and its consolidated subsidiaries and the financial statements of UBH and its consolidated subsidiaries, except for the warrant liability and associated gain on remeasurement of warrant liability as described in Note 17. Warrants, the TRA described in Note 14. Income Taxes and accrued dividends to stockholders which flow out of UBH.
Other Notes Payable and Capital Leases
During the first fiscal quarter of 2022, the Company bought out and terminated the contracts of multiple distributors who had previously been providing services to the Company. These transactions were accounted for as contract terminations and asset purchases and resulted in expense of $23.0 million for the fiscal year ended January 1, 2023. The outstanding payable balance of these transactions was $0.5 million as of December 31, 2023.
During the first fiscal quarter of 2020, the Company purchased intellectual property that included a deferred purchase price of $0.5 million, of which $0.1 million and $0.2 million was outstanding as of December 29, 2024 and December 31, 2023, respectively.
Amounts outstanding under notes payable consisted of the following:
| | | | | | | | | | | | | | |
| (in thousands) | | As of December 29, 2024 | | As of December 31, 2023 |
| Note payable – IO notes | | $ | 12,095 | | | $ | 16,478 |
Finance lease obligations(1) | | 9,707 | | | 10,145 |
| Other | | 100 | | | 200 |
| Total notes payable | | 21,902 | | | 26,823 |
| Less: current portion | | (6,917) | | | (7,649) |
| Long term portion of notes payable | | $ | 14,985 | | | $ | 19,174 |
(1) See Note 15. Leases for further discussion on our finance lease obligations.
During the fiscal year ended January 1, 2023, the Company sold an additional $5.0 million of notes receivable from IOs for proceeds of $5.0 million to a financial institution. During the fiscal year ended December 31, 2023, the Company sold an additional $5.2 million of notes receivable from IOs for proceeds of $5.4 million to a financial institution. During the fiscal year ended December 29, 2024, the Company sold an additional $4.6 million of notes receivable from IOs for proceeds of $4.9 million to a financial institution. Due to the structure of these transactions, they did not qualify for sale accounting treatment and the Company has recorded the notes payable obligation owed by the IOs to the financial institution on its books; the corresponding notes receivable also remained on the Company’s books. The Company services the loans for the financial institution by collecting principal and interest from the IOs and passing it through to the institution. The underlying notes have various maturity dates through December 2034. The Company partially guarantees the outstanding loans, as discussed in further detail within Note 12. Contingencies. These loans are collateralized by the routes for which the loans are made. Accordingly, the Company has the ability to recover substantially all of the outstanding loan value upon default.
Interest Expense
Interest expense consisted of the following:
| | | | | | | | | | | | | | | | | | | | |
| (in thousands) | | For the Fiscal Year Ended December 29, 2024 | | For the Fiscal Year Ended December 31, 2023 | | For the Fiscal Year Ended January 1, 2023 |
| Company’s ABL facility and other long-term debt | | $ | 40,643 | | | $ | 57,881 | | | $ | 41,231 | |
| Amortization of deferred financing costs | | 3,154 | | | 1,556 | | | 1,933 | |
| IO loans | | 1,065 | | | 1,153 | | | 1,260 | |
| Total interest | | $ | 44,862 | | | $ | 60,590 | | | $ | 44,424 | |
9.DERIVATIVE FINANCIAL INSTRUMENTS AND PURCHASE COMMITMENTS
Derivative Financial Instruments
To reduce the effect of interest rate fluctuations, on December 21, 2021, with an effective date of December 31, 2021, the Company entered into an accreting interest rate swap contract with a counter-party to make a series of payments based on a fixed interest rate of 1.39% and receive a series of payments based on the greater of LIBOR or 0.00%. Both the fixed and floating payment streams were based on a notional amount of $250 million and have accreted to $500 million and are maturing on September 30, 2026. Effective on September 30, 2022, the Company amended the swap contract to reference the 1-month SOFR plus a credit spread adjustment (“CSA”) of 11.448 basis points, as well as setting the new fixed rate to 1.41%; under this amended swap agreement the Company receives a series of payments based on the greater of SOFR plus CSA, or 0.00%.
On October 12, 2022, the Company entered into a 10-year swap contract, with an effective date of November 1, 2022, with a counter-party to make a series of payments based on a fixed interest rate of 3.83% and receive a series of payments based on the greater of the 1-month SOFR or 0.00%. In conjunction with accelerated payments on the Real Estate Term Loan during the fiscal year ended December 29, 2024, discussed within Note 8. Long-Term Debt, the Company determined that $36.7 million of hedged forecasted transactions were not probable of occurring. As such, effective February 1, 2024, the Company de-designated its interest rate hedge accounting on its Real Estate Term Loan and re-designated a new interest hedging relationship totaling $47.0 million. As a result, the Company immediately reclassified $0.3 million of accumulated other comprehensive income to earnings which is reflected as a decrease to interest expense within the Consolidated Statements of Operations and Comprehensive Income (Loss). As of December 29, 2024, $45.5 million and $35.6 million of the notional of the Company's interest rate swap was designated under interest rate hedge accounting and at fair value with mark-to-market adjustments recorded immediately in earnings, respectively. For the fiscal year ended December 29, 2024, the Company recognized $1.1 million as a decrease to interest expense within the Consolidated Statements of Operations and Comprehensive Income (Loss). The balance that the hedge covers is designed to abate as principal payments on the Real Estate Term Loan are made. The Company entered into these transactions to reduce its exposure to changes in cash flows associated with the Real Estate Term Loan and has designated this derivative as a cash flow hedge. The Company assesses hedge effectiveness both at the onset of the hedge and at regular intervals throughout the life of the derivative instrument. If it is probable that the hedged forecasted transaction will not occur, the derivative instrument's gain or loss reported in accumulated other comprehensive income will be reclassified into earnings.
As of December 29, 2024, the effective fixed interest rate on the long-term debt hedged by these contracts was 4.35%. For further treatment of the Company’s interest rate swap, refer to Note 10. Fair Value Measurements.
Warrant Liabilities
The Company has outstanding private placement warrants ("Warrants") which are accounted for as derivative liabilities pursuant to ASC 815-40. See Note 17. Warrants for additional information on our warrant liabilities. A reconciliation of the changes in the warrant liability during the fiscal year ended December 29, 2024 is as follows:
| | | | | | | | |
| (in thousands) | | |
| Fair value of warrant liabilities as of December 31, 2023 | | $ | 43,272 | |
| Gain on remeasurement of warrant liability | | (10,224) | |
| Fair value of warrant liabilities as of December 29, 2024 | | $ | 33,048 | |
Purchase Commitments
The Company has outstanding purchase commitments for specific quantities at fixed prices for certain key ingredients to economically hedge commodity input prices. These purchase commitments totaled $61.1 million as of December 29, 2024 and $66.7 million as of December 31, 2023. The Company accrues for losses on firm purchase commitments in a loss position at the end of each reporting period to the extent that there is an active observable market. The Company has recorded purchase commitment losses totaling $0.5 million for the fiscal year ended December 29, 2024, $3.3 million for the fiscal year ended December 31, 2023, and $0.0 million for the fiscal year ended January 1, 2023, respectively.
10.FAIR VALUE MEASUREMENTS
The Company follows the guidance relating to fair value measurements and disclosures with respect to financial assets and liabilities that are re-measured and reported at fair value each reporting period, and with respect to non-financial assets and liabilities that are not required to be measured at fair value on a recurring basis. The guidance establishes a fair value hierarchy that prioritizes the inputs to the valuation techniques used to measure fair value. The hierarchy gives the highest priority to unadjusted quoted prices in active markets for identical assets or liabilities (Level I) and the lowest priority to unobservable pricing inputs (Level III). A financial asset or liability’s level within the fair value hierarchy is based upon the lowest level of any input that is significant to the fair value measurement in its entirety. The three levels of the fair value hierarchy are described below:
Level I - Valuations are based on unadjusted quoted prices in active markets for identical, unrestricted assets or liabilities;
Level II - Valuations are based on quoted prices for similar instruments in active markets or quoted prices for identical or similar instruments in markets that are not active. Financial assets or liabilities which are included in this category are securities where all significant inputs are observable, either directly or indirectly; and
Level III - Prices or valuations that are unobservable and where there is little, if any, market activity for these financial assets or liabilities. The inputs into the determination of fair value inputs for these investments require significant management judgment or estimation. The availability of observable inputs can vary depending on the financial asset or liability and is affected by a wide variety of factors. To the extent that valuation is based on inputs that are less observable or unobservable in the market, the determination of fair value requires more judgment.
The fair values of the Company’s Level 2 derivative instruments were determined using valuation models that use market observable inputs including interest rate curves and both forward and spot prices for commodities. Derivative assets and liabilities included in Level 2 primarily represent commodity and interest rate swap contracts.
The following table presents the Company’s financial assets and liabilities measured at fair value on a recurring basis based upon the level within the fair value hierarchy in which the fair value measurements fall, as of December 29, 2024:
| | | | | | | | | | | | | | | | | | | | | | | | | | |
| (in thousands) | | Level I | | Level II | | Level III | | Total |
| Assets: | | | | | | | | |
| Cash and cash equivalents | | $ | 56,138 | | | $ | — | | | $ | — | | | $ | 56,138 | |
| Commodity contracts | | — | | | 89 | | | — | | | 89 | |
| Interest rate swaps | | — | | | 25,043 | | | — | | | 25,043 | |
| Total assets | | $ | 56,138 | | | $ | 25,132 | | | $ | — | | | $ | 81,270 | |
| Liabilities: | | | | | | | | |
| Commodity contracts | | $ | — | | | $ | 1,434 | | | $ | — | | | $ | 1,434 | |
| Warrants | | — | | | 33,048 | | | — | | | 33,048 | |
| Debt | | — | | | 768,581 | | | — | | | 768,581 | |
| Total liabilities | | $ | — | | | $ | 803,063 | | | $ | — | | | $ | 803,063 | |
The following table presents the Company’s financial assets and liabilities measured at fair value on a recurring basis based upon the level within the fair value hierarchy in which the fair value measurements fall, as of December 31, 2023:
| | | | | | | | | | | | | | | | | | | | | | | | | | |
| (in thousands) | | Level I | | Level II | | Level III | | Total |
| Assets: | | | | | | | | |
| Cash and cash equivalents | | $ | 52,023 | | | $ | — | | | $ | — | | | $ | 52,023 | |
| Commodity contracts | | — | | | 211 | | | — | | | 211 | |
| Interest rate swaps | | — | | | 33,332 | | | — | | | 33,332 | |
| Total assets | | $ | 52,023 | | | $ | 33,543 | | | $ | — | | | $ | 85,566 | |
| Liabilities: | | | | | | | | |
| Commodity contracts | | — | | | 2,094 | | | — | | | 2,094 | |
| Interest rate swaps | | — | | | 1,936 | | | — | | | 1,936 | |
| Warrants | | — | | | 43,272 | | | — | | | 43,272 | |
| Debt | | — | | | 899,597 | | | — | | | 899,597 | |
| Total liabilities | | $ | — | | | $ | 946,899 | | | $ | — | | | $ | 946,899 | |
11.SHARE-BASED COMPENSATION
For the periods presented, compensation expense included primarily in Selling, distribution, and administrative expense for all types of stock-based compensation programs and the related income tax benefit recognized were as follows:
| | | | | | | | | | | | | | | | | | | | |
| (in thousands) | | For the Fiscal Year Ended December 29, 2024 | | For the Fiscal Year Ended December 31, 2023 | | For the Fiscal Year Ended January 1, 2023 |
| RSUs | | $ | 10,981 | | | $ | 9,705 | | | $ | 5,136 | |
| PSUs | | 5,613 | | | 4,279 | | | 2,253 | |
| Stock options | | 815 | | | 1,281 | | | 1,056 | |
| Pre-tax compensation expense | | $ | 17,409 | | | $ | 15,265 | | | 8,445 | |
| Related income tax benefit | | | | | | (3,452) | |
| Impact to net income | | | | | | $ | 4,993 | |
The tax benefit recognized from the share-based compensation expense is nominal for the fiscal years ended December 29, 2024 and December 31, 2023 due to a valuation allowance.
Unrecognized compensation expense related to nonvested share-based compensation grants was as follows:
| | | | | | | | | | | | | | |
| (in thousands) | | As of December 29, 2024 | | As of December 31, 2023 |
| RSUs | | $ | 7,400 | | | $ | 7,372 | |
| PSUs | | 6,548 | | | 6,800 | |
| Stock options | | 4 | | | 819 | |
| Total | | $ | 13,952 | | | $ | 14,991 | |
Restricted and Performance Share Units
2020 Omnibus Equity Incentive Plan
In 2020, the Company adopted, with stockholder approval, the Utz Brands, Inc. 2020 Omnibus Equity Incentive Plan (as amended, the “2020 Plan”), which provides our executive officers and other participating associates with equity-based, long-term incentives, including RSUs, PSUs and stock options.
Restricted Share Units
Under the 2020 Plan, the Company grants RSUs representing the right to receive one share of the Company’s Class A Common Stock upon vesting, provided that the recipient remains employed with the Company through the vesting and subject to certain forfeiture conditions and restrictions. The RSUs vest according to specific vesting conditions set forth in the RSU award agreements. RSUs that become vested also generally entitle the holder to be credited with dividend equivalent payments in cash, with such dividend equivalents payable when, and to the extent, the RSUs are settled (or such accrued dividend equivalents will be forfeited to the extent the RSUs are forfeited).
Performance Share Units
The Company issues PSUs under the 2020 Plan, which provide the participant with the opportunity to earn shares of the Company’s Class A Common Stock if the Company achieves certain performance goals determined by the administrator of the 2020 Plan. All PSUs granted since the adoption of the 2020 Plan contain vesting based on the Company’s performance with respect to relative total stockholder return. The number of shares subject to the PSUs that vest and are settled at the end of each performance period is based on the Company’s cumulative total stockholder return relative to the total stockholder returns of members of a peer group, which is typically consistent with the peer group used for compensation disclosures.
At the end of the performance period, the Company’s total stockholder return position is ranked relative to the total stockholder returns of each member of the performance peer group that remains within the performance peer group for the entire performance period. The total number of PSUs that vest is based on the ranking of the Company’s total stockholder return relative to the total stockholder return of each of the Company’s peer companies, and ranges from a 200% payout for ranking in the 90th percentile or above to 0% payout for ranking below the 30th percentile with percentiles interpolated between these payouts.
PSUs that become vested also generally entitle the holder to be credited with dividend equivalent payments in cash, with such dividend equivalents payable when, and to the extent, the PSUs are settled (or such accrued dividend equivalents will be forfeited to the extent the PSUs are forfeited).
Because the PSUs vest based on market conditions, Monte Carlo simulation models were used to determine the grant-date fair value of the PSUs. The assumptions used in the Monte Carlo simulation models included weighted average expected terms ranging from 2.8 years to 3.0 years, weighted average expected volatility ranging from 40.0% to 53.6%, and weighted average risk-free rates ranging from 0.2% to 4.0%.
| | | | | | | | | | | | | | | | | | | | |
| PSUs and RSUs | | Number of Units | | Weighted-average grant date fair value for equity awards (per unit) | | Weighted Average Remaining Contractual Term |
| Outstanding at beginning of fiscal year 2024 | | 1,461,766 | | | $ | 18.28 | | | 1.5 Years |
| Granted | | 907,252 | | | 20.12 | | |
| Vested | | (137,692) | | | 20.72 | | |
| Forfeited | | (108,851) | | | 17.78 | | |
| Outstanding at end of fiscal year 2024 | | 2,122,475 | | | $ | 18.93 | | | 0.9 Years |
Stock Options
The Company granted its Executive Leadership Team non-qualified stock options exercisable for Class A Common Stock of the Company, provided that the exercise of such stock options was contingent upon the Company filing a registration statement on Form S-8 with the SEC, which occurred on November 2, 2020. For non-cash, stock-based awards exchanged for employee services, the Company measures stock-based compensation on the grant date, based on the fair value of the award, and recognizes expense over the requisite service period, which for the Company is generally the vesting period. To estimate the fair value of an award, the Company uses the Black-Scholes pricing model. This model requires inputs such as expected term, expected volatility and risk-free interest rate. These inputs are subjective and generally require significant analysis and judgment to develop. For all grants during fiscal year 2022, the Company calculated the expected term based on the simplified method as allowable under ASC 718 due to a lack of sufficient trading history for the Company’s Class A Common Stock. The use of this method effectively assumes that exercise occurs evenly over the period from vesting until expiration, and therefore the expected term is the midpoint between the service period and the contractual term of the award. The Company estimates the volatility of its Class A Common Stock by analyzing its historical volatility and considering volatility data of its peer group and their implied volatility. The Company recognizes forfeitures when they occur.
Stock options issued under the 2020 Plan generally have a maximum contractual life of 10 years from the grant date and must be issued with an exercise price equal to or greater than the fair market value of the shares of Class A Common Stock on the date of grant, as determined by the administrator of the 2020 Plan. Stock options issued under the 2020 Plan are subject to time-based vesting, continued employment, and other conditions outlined in the 2020 Plan with the fair value determined using the Black-Scholes Option Pricing Model.
On January 31, 2022, the Company granted its Executive Leadership Team stock options exercisable for Class A Common Stock of the Company pursuant to the terms set forth above, and 100% of these options vested and became exercisable on December 31, 2024. The Company granted stock options with an aggregate of 377,550 shares of Class A Common Stock underlying such options, on January 31, 2022, and the exercise price of these options is the Company’s closing share price of $15.51 on January 31, 2022. The fair value of each stock option granted was determined to be $6.06 using the Black-Scholes Option Pricing Model based on an expected volatility of 40.0%, expected option term of approximately 6.4 years, and risk-free rate of return of 1.4%. The risk-free rates are based on the implied yield available on U.S. Treasury zero-coupon issues with an equivalent remaining term. In May 2022, an additional 16,923 stock option awards were granted.
| | | | | | | | | | | | | | | | | | | | | | | | | | |
| Stock Options | | Number of Units | | Weighted-Average Grant Date Fair Value for Equity Awards (per unit) | | Weighted Average Remaining Contractual Term | | Aggregate Intrinsic Value(1) |
| Outstanding at beginning of fiscal year 2024 | | 394,473 | | | $ | 6.01 | | | 1.0 Years | | |
| Granted | | — | | | — | | | | | |
| Vested | | — | | | — | | | | | |
| Forfeited | | — | | | — | | | | | |
| Outstanding and exercisable at end of fiscal year 2024 | | 394,473 | | | $ | 6.01 | | | 0.0 Years | | 0.00 |
(1) The aggregate intrinsic value in the above table represents the total pre-tax amount that a participant would receive if the stock option had been exercised on the last day of the respective fiscal period. Stock options with a market value less than its exercise value are not included in the intrinsic value amount.
Employee Stock Purchase Plan
On December 10, 2020, the Board of Directors approved the 2021 Employee Stock Purchase Plan ("ESPP”), subject to stockholder approval. The ESPP was effective January 1, 2021, and any purchase rights that were granted under the ESPP prior to stockholder approval could not be exercised unless and until stockholder approval was obtained.
Under the ESPP, associates are offered the option to purchase discounted shares of Class A Common Stock during offering periods designated by the administrator. Each offering period will be one year, consisting of two six-month purchase periods, commencing on each January 1 and July 1 following the effective date of the ESPP. Shares are purchased on the applicable exercise dates, which is the last trading day of each purchase period. The ESPP permits participants to purchase the Company’s Class A Common Stock at a purchase price of not less than 85% of the lesser of (i) the “fair market value” of a share on the first day of a purchase period, rounded up to the nearest whole cent per share and (ii) the “fair market value” of a share on the purchase date of such purchase period, rounded up to the nearest whole cent per share, subject to limits set by the Internal Revenue Code of 1986, as amended (the “Code”) and the ESPP. The purchase price used was 92.5% in fiscal year ended January 1, 2023 and 95% in each of the fiscal years ended December 31, 2023 and December 29, 2024.
The maximum number of shares of the Company’s Class A Common Stock available for sale under the ESPP shall not exceed in the aggregate 1,500,000 shares and may be unissued shares or treasury shares or shares bought on the market for purposes of the ESPP. As of December 29, 2024, 1,084,561 shares of Class A Common Stock remain available for issuance under the ESPP. For the fiscal year ended December 29, 2024, the Company granted 48,961 shares with a fair value of $0.9 million, and the Company recognized compensation expense of $0.2 million. For the fiscal year ended December 31, 2023, the Company granted 99,788 shares with a fair value of $1.5 million, and the Company recognized compensation expense of $0.3 million. For the fiscal year ended January 1, 2023, the Company granted 138,096 shares with a fair value of $2.0 million, and the Company recognized compensation expense of $0.4 million.
12.CONTINGENCIES
Litigation Matters
The Company is involved in litigation and other matters incidental to the conduct of its business, the results of which, in the opinion of management, are not likely to be material to the Company’s financial condition, results of operations or cash flows.
Guarantees
The Company partially guarantees loans made to IOs by Bank of America for the purchase of routes. The outstanding balance of loans guaranteed that were issued by Bank of America was $63.5 million and $52.8 million at December 29, 2024 and December 31, 2023, respectively, which loans are accounted for as off balance sheet arrangements. As discussed in Note 6. Notes Receivable, the Company also sold notes receivable on its books to Bank of America during the fiscal years ended December 31, 2023 and December 29, 2024, which the Company partially guarantees. The outstanding balance of notes purchased by Bank of America at December 29, 2024 and December 31, 2023 was $11.7 million and $14.8 million, respectively. Due to the structure of the transactions, the sale did not qualify for sale accounting treatment, and as such the Company records the notes payable obligation owed by the IOs to the financial institution on its Consolidated Balance Sheets; the corresponding notes receivable also remain in the Company’s Consolidated Balance Sheets. The maximum amount of future payments the Company could be required to make under these guarantees equates to 25% of the outstanding loan balance on the first day of each calendar year plus 25% of the amount of any new loans issued during such calendar year.
Additionally, the Company guarantees loans for the purchase of routes made by two other banks. The outstanding balance of these loans was $1.5 million and $2.9 million at December 29, 2024 and December 31, 2023, respectively, of which $1.3 million and $2.2 million was included in the Company's Consolidated Balance Sheets at December 29, 2024 and December 31, 2023, respectively. The maximum amount of future payments the Company could be required to make under these guarantees equates to 25% of the outstanding loan balance.
All of the above IO loans are collateralized by the routes for which the loans are made. Accordingly, the Company has the ability to recover substantially all of the outstanding loan value upon default.
13.SUPPLEMENTARY CASH FLOW INFORMATION
| | | | | | | | | | | | | | | | | | | | |
| (in thousands) | | For the Fiscal Year Ended December 29, 2024 | | For the Fiscal Year Ended December 31, 2023 | | For the Fiscal Year Ended January 1, 2023 |
| Cash paid for interest | | $ | 45,027 | | | $ | 46,905 | | | $ | 41,711 | |
| Refunds related to income taxes | | $ | 154 | | | $ | 1,686 | | | $ | 4,663 | |
| Payments for income taxes | | $ | 28,877 | | | $ | 8,820 | | | $ | 6,988 | |
14.INCOME TAXES
The Company is subject to federal and state income taxes with respect to our allocable share of any taxable income or loss of UBH, as well as any standalone income or loss the Company generates. UBH is treated as a partnership for federal income tax purposes, and for most applicable state and local income tax purposes, and generally does not pay income taxes in most jurisdictions. Instead, UBH taxable income or loss is passed through to its members, including the Company. Despite its partnership treatment, UBH is liable for income taxes in those states not recognizing its pass-through status and for certain of its subsidiaries not taxed as pass-through entities. The Company has acquired various domestic entities taxed as corporations, which are now wholly-owned by us or our subsidiaries. Where required or allowed, these subsidiaries also file and pay tax as a consolidated group for federal and state income tax purposes. The Company anticipates this structure to remain in existence for the foreseeable future.
The provision (benefit) for income taxes was as follows:
| | | | | | | | | | | | | | | | | | | | |
| (in thousands) | | For the Fiscal Year Ended December 29, 2024 | | For the Fiscal Year Ended December 31, 2023 | | For the Fiscal Year Ended January 1, 2023 |
| Current: | | | | | | |
| Federal | | $ | 21,382 | | | $ | 7,816 | | | $ | 4,038 | |
| State | | 3,203 | | | 1,879 | | | 1,403 | |
| Total current | | 24,585 | | | 9,695 | | | 5,441 | |
| Deferred: | | | | | | |
| Federal | | 9,973 | | | (7,591) | | | (20,986) | |
| State | | 4,172 | | | (1,347) | | | (8,374) | |
| Total deferred | | 14,145 | | | (8,938) | | | (29,360) | |
| Total | | $ | 38,730 | | | $ | 757 | | | $ | (23,919) | |
A reconciliation of the expected statutory federal tax and the total income tax (benefit) expense was as follows:
| | | | | | | | | | | | | | | | | | | | |
| (in thousands) | | For the Fiscal Year Ended December 29, 2024 | | For the Fiscal Year Ended December 31, 2023 | | For the Fiscal Year Ended January 1, 2023 |
| Federal statutory rate (21%) | | $ | 14,588 | | | $ | (8,248) | | | $ | (7,972) | |
| State income taxes, net of federal benefit | | 5,773 | | | (528) | | | (2,435) | |
| Investment in UBH | | 941 | | | 177 | | | 31 | |
| Noncontrolling interest in UBH | | (1,169) | | | 2,610 | | | 2,792 | |
| Valuation allowance | | 7,556 | | | 5,878 | | | (17,177) | |
| Remeasurement of warrant liability | | (2,147) | | | (469) | | | (151) | |
| Return to provision | | 307 | | | 2 | | | (79) | |
| Gain on Sale to Our Home | | 12,559 | | | — | | | — | |
| Credits | | (27) | | | (41) | | | (201) | |
| IRC §162(m) | | 291 | | | 1,401 | | | 875 | |
| Nondeductible expenses | | 71 | | | 88 | | | 12 | |
| Other | | (13) | | | (113) | | | 386 | |
| | $ | 38,730 | | | $ | 757 | | | $ | (23,919) | |
The tax effect of temporary differences that gave rise to significant components of deferred tax assets and liabilities consisted of the following at December 29, 2024 and December 31, 2023:
| | | | | | | | | | | | | | |
| (in thousands) | | As of December 29, 2024 | | As of December 31, 2023 |
| Deferred Tax Assets: | | | | |
| Accrued expenses | | $ | 452 | | | $ | 427 | |
| Pension, retirement and other benefits | | 408 | | | 419 | |
| Inventories, including uniform capitalization | | 93 | | | 145 | |
| Investment in UBH, operations | | 30,378 | | | 20,943 | |
| Acquisition costs | | 487 | | | 592 | |
| Net operating losses | | 19,104 | | | 23,596 | |
| IRC §163(j) | | 8,661 | | | 12,753 | |
| Credits | | 345 | | | 713 | |
| Charitable contributions | | — | | | 149 | |
| Other deferred tax assets | | 185 | | | 172 | |
| Total gross deferred tax assets | | 60,113 | | | 59,909 | |
| Valuation allowance | | (48,655) | | | (36,947) | |
| Net deferred tax assets | | 11,458 | | | 22,962 | |
| Deferred Tax Liabilities: | | | | |
| Plant and equipment, accelerated depreciation | | (2,571) | | | (6,957) | |
| Intangibles | | (63,393) | | | (66,556) | |
| Investment in UBH, nonreversing | | (68,988) | | | (63,900) | |
| Other deferred tax liabilities | | (250) | | | (239) | |
| Total deferred tax liabilities | | (135,202) | | | (137,652) | |
| Net deferred tax liabilities | | $ | (123,744) | | | $ | (114,690) | |
Net Operating Loss and Tax Credit Carryforward
As of December 29, 2024 and December 31, 2023, the Company and certain subsidiaries had federal net operating loss ("NOL") carryforwards of $82.5 million and $102.2 million, respectively. Of these, $29.1 million will expire, if not utilized, by 2037.
As of December 29, 2024 and December 31, 2023, the Company and certain subsidiaries also had state NOL carryforwards in the amount of $34.2 million and $48.1 million, respectively. The state NOL carryforwards continued to expire in 2024, however, some state NOL's are able to be carried forward indefinitely.
As of December 29, 2024 and December 31, 2023, the Company and certain subsidiaries had federal tax credit carryforwards in the amount of $0.3 million and $0.7 million, respectively.
Utilization of some of the federal and state NOL and credit carryforwards are subject to annual limitations due to the "change in ownership” provisions of the Code and similar state provisions. The annual limitations may result in the expiration of NOL and credit carryforwards before utilization.
Valuation Allowance
The Company recorded a valuation allowance of $48.7 million and $36.9 million at December 29, 2024 and December 31, 2023, respectively. In determining the need for a valuation allowance, the Company assessed the available positive and negative evidence to estimate whether future taxable income would be generated to permit use of the existing deferred tax assets ("DTA's”). As of December 29, 2024, a significant piece of objective negative evidence evaluated was the three-year cumulative loss before taxes. Such objective evidence limits the ability to consider other subjective evidence, such as projections for future growth. The Company determined that there is uncertainty regarding the utilization of certain DTA's such as some of the investment in UBH, federal operating losses subject to annual limitations due to "change in ownership” provisions, and state net operating losses where the Company does not expect to continue to have nexus. Therefore, a valuation allowance has been recorded against the DTA's for which it is more-likely-than-not they will not be realized. The Company has DTA’s related to its investment in the partnership that are expected to be realized in the ordinary course of operations or generate future net operating losses for which a portion will have an indefinite carryforward period. Additionally, the Company has deferred tax liabilities ("DTL’s”) related to its investment in the partnership that will not reverse in the ordinary course of business and will only reverse when the partnership is sold or liquidated. The Company has no intention of disposing of or liquidating the partnership and therefore has not considered the indefinite lived DTL as a source of income to offset other DTA’s. In weighing positive and negative evidence, both objective and subjective, including its three-year cumulative loss and the ability to offset DTA’s with definite lived DTL’s, the Company has recorded a valuation allowance against its DTA’s related to net operating losses and deductible book/tax differences and recorded a DTL primarily related to the book over tax basis in the investment in the partnership that will not reverse in the ordinary course of operations. The Company considered that an indefinite lived DTL may be considered as a source of taxable income for an indefinite lived DTA; however, given our indefinite lived DTL will only reverse upon sale or liquidation, the Company determined that it was more appropriate to record a valuation allowance against a portion of its DTA’s. The amount of DTA considered realizable, however, could be adjusted if estimates of future taxable income during the carryforward period are reduced or increased or if objective negative evidence in the form of cumulative losses is no longer present and additional weight is given to subjective evidence such as projections for growth.
The net change in valuation allowance of $11.8 million was recorded as an increase to income tax expense for $7.6 million and an adjustment to equity for $4.2 million.
As of December 29, 2024, tax years 2021 through 2024 remain open and subject to examination by the Internal Revenue Service and the majority of the states where the Company has nexus, and tax years 2020 through 2024 remain open and subject to examination in selected states that have a four year statute of limitations.
Upon audit, tax authorities may challenge all or part of a tax position. A tax position successfully challenged by a taxing authority could result in an adjustment to our provision for income taxes in the period in which a final determination is made. The Company did not maintain any unrecognized tax benefits as of December 29, 2024 and December 31, 2023.
Tax receivable agreement liability
Pursuant to an election under section 754 of the Code, the Company obtained an increase in its share of the tax basis in the net assets of UBH when it was deemed to purchase units of UBH from a third party then holding common and preferred interests of noncontrolling interests and purchased units of UBH from noncontrolling interests in our business combination in 2020. Following the 2020 business combination, the holders of noncontrolling interests (the "Noncontrolling Interest Holders") have the option to exchange Common limited liability company units of UBH ("Common Company Units") along with the forfeiture of a corresponding number of shares of Class V Common Stock of the Company for corresponding number of shares of Class A Common Stock. The Company intends to treat any such exchanges as direct purchases for U.S. federal income tax purposes, which is expected to further increase its share of the tax basis in the net assets of UBH. The increases in tax basis may reduce the amounts the Company would otherwise pay in the future to various tax authorities. They may also decrease gains (or increase losses) on future dispositions of certain capital assets to the extent tax basis is allocated to those capital assets.
The Company entered into the Tax Receivable Agreement in connection with our business combination in 2020 (the “Tax Receivable Agreement” or “TRA”), which provides for the payment by the Company to Noncontrolling Interest Holders of 85% of the amount of any tax benefits realized as a result of (i) increases in the share of the tax basis in the net assets of UBH resulting from the business combination and any future exchanges by Noncontrolling Interest Holders of shares of Class V Common Stock for shares of Class A Common Stock; (ii) tax basis increases attributable to payments made under the TRA; and (iii) tax amortization deductions attributable to the acquisition of Kennedy Endeavors and the election to treat the transaction as an asset deal for tax purposes (the "TRA Payments"). The rights of each party under the TRA other than the Company are assignable, subject to certain restrictions. The timing and amount of aggregate payments due under the TRA may vary based on a number of factors, including the timing and amount of taxable income generated by the Company each year, as well as the tax rate then applicable, among other factors.
As of December 29, 2024, the Company recorded a TRA liability of $24.4 million, which is reflected as current and non-current accrued expenses in the Consolidated Balance Sheets. The Company has a total liability of $48.3 million related to its projected obligations under the TRA. The total TRA liability includes $24.4 million that relates to the business combination and $23.9 million that relates to equity transactions that occurred during the fourth quarter of 2020, the third quarter of 2021, the third quarter of 2024, and the fourth quarter of 2024. The Company recorded a partial valuation allowance on its DTA, that fully covers the tax basis that originated with the equity transactions that occurred during the aforementioned periods as they are not more likely than not to be realized based on the positive and negative evidence that the Company considered. The Company has not recorded the $23.9 million of TRA liability that relates to the equity transactions that occurred during the prior periods as the liability is not probable under ASC 450 since the related DTA is not more likely than not to be realized as evidenced by the valuation allowance. The Company will continue to monitor positive and negative evidence to analyze its valuation allowance and it believes that sufficient positive evidence may arise to permit the release of a significant portion of its valuation allowance. If that were to occur, it would result in the need to record $23.9 million of additional TRA liability for the prior period equity transactions, which would result in a non-cash charge to pretax results.
15.LEASES
We determine if a contractual arrangement is a lease at inception. Our lease arrangements provide the Company the right to utilize certain specified tangible assets for a period of time in exchange for consideration. Our leases primarily relate to building space, vehicles, and equipment. Our leases generally have remaining terms ranging from one month to twelve years.
We separate non-lease components from vehicles leases and do not separate non-lease components from our building leases for the purposes of measuring our lease liabilities and assets. Our leases consist of operating leases, which are presented within current accrued expenses and other, non-current accrued expenses and other, and finance leases, which are presented within current portion of other notes payable, and non-current portion of other notes payable on our consolidated balance sheets. Leases with an initial term of 12 months or less are not recorded on the balance sheet.
We recognize a lease liability and a right-of-use (“ROU”) asset at the lease commencement date based on the present value of future lease payments. As many of our leases do not provide an implicit rate, we use our incremental borrowing rate based on information available at the commencement date in determining the present value of lease payments.
We recognize operating lease expenses on a straight-line basis over the term of the lease within operating expenses. Expenses associated with our finance leases consist of two components, including interest on our outstanding finance lease obligations and amortization of the related ROU assets. The interest component is recorded in interest expense, and depreciation of the finance lease asset is recognized on a straight-line basis over the term of the lease within Cost of goods sold and Selling expenses, and administrative expenses on the Consolidated Statements of Operations and Comprehensive Income (Loss).
Our leases do not contain material residual value guarantees or material restrictive covenants. Some of our leases include optional renewal periods or termination provisions which we assess at inception to determine the term of the lease, subject to reassessment in certain circumstances.
The following table presents lease expense we have recorded on our Consolidated Statements of Operations and Comprehensive Income (Loss) for the fiscal years ended December 29, 2024, December 31, 2023 and January 1, 2023:
| | | | | | | | | | | | | | | | | | | | |
| (in thousands) | | For the Fiscal Year Ended December 29, 2024 | | For the Fiscal Year Ended December 31, 2023 | | For the Fiscal Year Ended January 1, 2023 |
| Finance lease expense: | | | | | | |
| Amortization of finance ROU asset | | $ | 3,181 | | | $ | 2,973 | | | $ | 2,585 | |
| Interest of finance ROU asset | | 735 | | | 550 | | | 318 | |
| Total finance lease expense | | 3,916 | | | 3,523 | | | 2,903 | |
Operating lease expense (1) | | 29,322 | | | 22,437 | | | 16,679 | |
| Total lease expense | | $ | 33,238 | | | $ | 25,960 | | | $ | 19,582 | |
(1) Included variable and short-term lease expense of $5.2 million and $8.1 million, respectively, for the fiscal year ended December 29, 2024, $4.6 million and $5.3 million, respectively, for the fiscal year ended December 31, 2023 and $3.2 million and $3.8 million, respectively, for the fiscal year ended January 1, 2023.
Finance leases, net, are included in Property, Plant and Equipment, net as follows:
| | | | | | | | | | | | | | | | | |
| (in thousands) | | As of
December 29, 2024 | | | As of
December 31, 2023 |
| Leases | | $ | 19,488 | | | | $ | 17,956 | |
| Less: accumulated depreciation | | 10,029 | | | | 8,007 | |
| Leases, net | | $ | 9,459 | | | | $ | 9,949 | |
Maturities of lease liabilities as of December 29, 2024:
| | | | | | | | | | | | | | | | | | | | |
| (in thousands) | | Operating Leases | | Finance Leases | | Total |
| 2025 | | $ | 27,820 | | | $ | 3,479 | | | $ | 31,299 | |
| 2026 | | 24,823 | | | 3,131 | | | 27,954 | |
| 2027 | | 21,340 | | | 2,636 | | | 23,976 | |
| 2028 | | 17,011 | | | 1,529 | | | 18,540 | |
| 2029 | | 14,086 | | | 318 | | | 14,404 | |
| 2029 and thereafter | | 259,986 | | | — | | | 259,986 | |
| Total undiscounted obligations | | 365,066 | | | 11,093 | | | 376,159 | |
| Less imputed interest | | (214,730) | | | (1,386) | | | (216,116) | |
| Present value of lease obligations | | $ | 150,336 | | | $ | 9,707 | | | $ | 160,043 | |
The following table summarizes supplemental balance sheet information related to leases as of December 29, 2024 and December 31, 2023:
| | | | | | | | | | | | | | | | | | | | | | | | | | |
| | As of December 29, 2024 | | As of December 31, 2023 |
| (in thousands, except lease term and discount rate) | | Operating Leases | | Finance Leases | | Operating Leases | | Finance Leases |
ROU asset, non-current(1)(2) | | $ | 146,891 | | | $ | 9,459 | | | $ | 56,705 | | | $ | 9,949 | |
| | | | | | | | |
| Lease liability, current | | $ | 17,341 | | | $ | 2,853 | | | $ | 14,992 | | | $ | 2,808 | |
| Lease liability, non-current | | 132,995 | | | 6,854 | | | 43,928 | | | 7,337 | |
Total lease liabilities (2) | | $ | 150,336 | | | $ | 9,707 | | | $ | 58,920 | | | $ | 10,145 | |
| | | | | | | | |
Weighted average remaining lease term (in years)(2) | | 18.9 | | 3.4 | | 4.4 | | 3.9 |
Weighted average discount rate (2) | | 7.58 | % | | 7.53 | % | | 4.04 | % | | 5.80 | % |
| | | | | | | | |
(1) Finance ROU assets are reflected within property, plant, and equipment, net on our consolidated balance sheets and operating leases ROU assets are reflected within other assets on our consolidated balance sheets.
(2) During the fiscal year ended December 29, 2024, the Company entered into an operating lease agreement related to a distribution center in Hanover, PA for a term of 29.9 years utilizing an incremental borrowing rate of 8.25%.
The following table presents other information related to leases for the fiscal year ended December 29, 2024, December 31, 2023 and January 1, 2023 (in thousands):
| | | | | | | | | | | | | | | | | | | | |
| | For the Fiscal Year Ended December 29, 2024 | | For the Fiscal Year Ended December 31, 2023 | | For the Fiscal Year Ended January 1, 2023 |
| Cash paid for amounts included in the measurement of lease liabilities: | | | | |
| Operating cash flows from operating leases | | $ | 19,999 | | | $ | 16,717 | | | $ | 12,531 | |
| Operating cash flows from finance leases | | $ | 735 | | | $ | 550 | | | $ | 318 | |
| Financing cash flows from finance leases | | $ | 3,181 | | | $ | 2,973 | | | $ | 2,585 | |
| Leased assets obtained in exchange for new lease liabilities: | | | | | | |
| Operating leases | | $ | 108,308 | | | $ | 26,315 | | | $ | 24,958 | |
| Finance leases | | $ | 3,783 | | | $ | 2,761 | | | $ | 6,379 | |
16.SEGMENT DATA
The Company operates in one reportable segment: the manufacturing, distribution, marketing and sale of snack food products. The Company defines reporting segments as components of an organization for which discrete financial information is available and operating results are evaluated on a regular basis by the chief operating decision maker ("CODM”) in order to assess performance and allocate resources. The CODM is the Chief Executive Officer of the Company. Characteristics of the organization which were relied upon in making the determination that the Company operates in one reportable segment include the similar nature of all of the products that the Company sells, the functional alignment of the Company’s organizational structure, and the reports that are regularly reviewed by the CODM for the purpose of assessing performance and allocating resources. The CODM uses segment income/loss to evaluate income generated from the segment in deciding whether to reinvest profits into the segment or alternatives such as for acquisitions or to pay dividends, and to monitor budget versus actual results.
| | | | | | | | | | | | | | | | | | | | |
| | For the Fiscal Year Ended December 29, 2024 | | For the Fiscal Year Ended December 31, 2023 | | For the Fiscal Year Ended January 1, 2023 |
| Net sales | | $ | 1,409,281 | | | $ | 1,438,237 | | | $ | 1,408,401 | |
| Materials | | 641,043 | | | 670,731 | | | 655,816 | |
| Conversion costs (a) | | 181,747 | | | 220,697 | | | 220,168 | |
| Other cost of goods sold (b) | | 91,714 | | | 90,323 | | | 83,360 | |
| | | | | | |
| | | | | | |
| Gross profit | | 494,777 | | | 456,486 | | | 449,057 | |
| | | | | | |
| Delivery (c) | | 85,578 | | | 72,939 | | | 83,562 | |
| Marketing (d) | | 18,954 | | | 11,295 | | | 10,042 | |
| Selling expenses (e) | | 201,619 | | | 189,689 | | | 200,457 | |
| Administrative expenses (f) | | 129,642 | | | 159,196 | | | 150,343 | |
| | | | | | |
| | | | | | |
| Total selling, distribution, and administrative expenses | | 435,793 | | | 433,119 | | | 444,404 | |
| (Loss) gain on sale of assets, net | | (78) | | | (7,350) | | | 691 | |
| Income from operations | | 58,906 | | | 16,017 | | | 5,344 | |
| | | | | | |
| Gain on sale of business | | 44,015 | | | — | | | — | |
| Interest expense | | (44,862) | | | (60,590) | | | (44,424) | |
| Loss on debt extinguishment | | (1,273) | | | — | | | — | |
| Other income | | 2,457 | | | 3,066 | | | 400 | |
| Gain on remeasurement of warrant liability | | 10,224 | | | 2,232 | | | 720 | |
| Other income (expenses), net | | 10,561 | | | (55,292) | | | (43,304) | |
| | | | | | |
| Income (loss) before income taxes | | 69,467 | | | (39,275) | | | (37,960) | |
| Income tax expense (benefit) | | 38,730 | | | 757 | | | (23,919) | |
| Net income (loss) | | $ | 30,737 | | | $ | (40,032) | | | $ | (14,041) | |
(a) Conversion costs includes direct labor, indirect labor, and overhead expenses.
(b) Other cost of goods sold consists of logistics and other charges.
(c) Delivery charges related to amounts to ship to distribution centers, end customers, and transfer costs between facilities.
(d) Marketing expenses includes customer marketing through traditional media, digital and eCommerce, social media, sponsorships, and other costs such as agency costs, and market research.
(e) Selling costs include people costs, selling operations, co-op advertising and other customer expenses, broker fees, royalties, and other selling related costs.
(f) Administrative expenses costs of administrative people costs, administrative operations, taxes, fees, and other administrative costs, offset by reimbursements from the transaction services agreements entered into as discussed within Note 2. Divestitures.
17.WARRANTS
As of each of December 29, 2024 and December 31, 2023, there were 7,200,000 Warrants outstanding that are exercisable for shares of Class A Common Stock and expire in August 2025.
The Warrants are exercisable on a cashless basis, at the holder’s option, and are non-redeemable by the Company so long as they are held by the initial purchasers or their permitted transferees. If the Warrants are held by someone other than the initial purchasers or their permitted transferees, the Warrants will be redeemable by the Company and exercisable by such holders as set forth in the warrant agreement with respect to such warrants.
The Warrants are accounted for as derivative liabilities in accordance with ASC 815-40, Derivatives and Hedging—Contracts in Entity’s Own Equity, due to certain settlement provisions in the corresponding warrant agreement that do not meet the criteria to be classified in stockholders’ equity. Pursuant to ASC 815-40, the Warrants are classified as a liability at fair value on the Company’s Consolidated Balance Sheet, and the change in the fair value of such liability in each period is recognized as a non-cash gain or loss in the Company’s Consolidated Statements of Operations and Comprehensive Income (Loss). The Warrants are deemed equity instruments for income tax purposes, and accordingly, there is no tax accounting relating to changes in the fair value of the Warrants recognized.
The remeasurement of the warrant liability resulted in a gain of $10.2 million for the fiscal year ended December 29, 2024 and $2.2 million for the fiscal year ended December 31, 2023, and $0.7 million for the fiscal year ended January 1, 2023. Such gains are not attributable to the noncontrolling interest.
18.EQUITY
Class A Common Stock
The Company is authorized to issue 1,000,000,000 shares of Class A Common Stock, par value $0.0001 per share, of which 83,537,542 and 81,187,977 shares were issued and outstanding as of December 29, 2024 and December 31, 2023, respectively.
Class V Common Stock
The Company is also authorized to issue 61,249,000 shares of Class V Common Stock, par value of $0.0001. Each share of Class V Common Stock may be exchanged for one share of Class A Common Stock of the Company upon certain conditions being satisfied. As of December 29, 2024 and December 31, 2023 there were 57,349,000 and 59,349,000 shares of Class V Common Stock outstanding, respectively. On July 9, 2024 and again on November 8, 2024, noncontrolling interests exchanged 1,000,000 Common Company Units together with the surrender and cancellation of the same number of shares of Class V Common Stock for an equal number of shares of Class A Common Stock. The Company did not receive any proceeds as a result of this exchange.
19.EARNINGS PER SHARE
Basic earnings per share is based on the weighted average number of shares of Class A Common Stock issued and outstanding. Diluted earnings per share is based on the weighted average number shares of Class A Common Stock issued and outstanding and the effect of all dilutive common stock equivalents and potentially dilutive share-based awards outstanding. There is no difference in the number of shares used to calculate basic and diluted shares outstanding due to the Company's net loss position. The potentially dilutive securities that would be anti-dilutive due to the Company's net loss are not included in the calculation of diluted net loss per share attributable to controlling interest. The anti-dilutive securities are included in the table below. Refer to Note 11. Share-Based Compensation for further information on the share-based awards considered in the diluted earnings per share computation.
The following tables reconcile the numerators and denominators used in the computations of both basic and diluted earnings per
share:
| | | | | | | | | | | | | | | | | |
| (in thousands, except share data) | For the Fiscal Year Ended December 29, 2024 | | For the Fiscal Year Ended December 31, 2023 | | For the Fiscal Year Ended January 1, 2023 |
| Numerator: | | | | | |
| Net income (loss) attributable to controlling interest | $ | 15,974 | | | $ | (24,937) | | | $ | (392) | |
| Denominator: | | | | | |
| Weighted average Class A Common Stock shares, basic | 82,102,876 | | | 81,081,458 | | | 80,093,094 | |
| Dilutive securities included in diluted earnings per share calculation | | | | | |
| Warrants | 2,423,454 | | | — | | | — | |
| RSUs | 544,916 | | | — | | | — | |
| PSUs | 327,939 | | | — | | | — | |
| Stock options | 34,795 | | | — | | | — | |
| Total dilutive weighted average shares | 85,433,980 | | | 81,081,458 | | | 80,093,094 | |
| Basic earnings per share | $ | 0.19 | | | $ | (0.31) | | | $ | — | |
| Diluted earnings per share | $ | 0.19 | | | $ | (0.31) | | | $ | — | |
| Weighted average Class V Common Stock not subject to earnings per share calculation | 58,725,374 | | | 59,349,000 | | | 59,349,000 | |
| Net (income) loss attributable to noncontrolling interest | $ | (14,763) | | | $ | 15,095 | | | 13,649 | |
The diluted earnings per share computation excludes the effect of certain RSUs and stock options granted to directors and management which convert into, or are exercisable for, shares of Class A Common Stock upon vesting as their inclusion would have been anti-dilutive. Anti-dilutive securities excluded from diluted earnings per share calculation:
| | | | | | | | | | | | | | | | | | | | |
| (in thousands) | | For the Fiscal Year Ended December 29, 2024 | | For the Fiscal Year Ended December 31, 2023 | | For the Fiscal Year Ended January 1, 2023 |
| Warrants | | — | | | 1,882,627 | | | 1,888,256 | |
| RSUs | | 78,105 | | | 271,330 | | | 83,261 | |
| PSUs | | 194,695 | | | 125,958 | | | 62,408 | |
Shares of the Company’s Class V Common Stock do not participate in earnings of the Company and, therefore, are not participating securities. The PSUs, RSUs granted to our directors and certain employees in fiscal year 2020, and 2020 LTIP RSUs were not considered participating securities despite the holders of these stock-based compensation awards being entitled to participate in dividends declared on Class A Common Stock, if and when declared, on a one-to-one per-share basis, because the dividends are only payable upon full vesting of the awards, and as such, the dividend is forfeitable. The net income attributable to the noncontrolling interest was $14.8 million for the fiscal year ended December 29, 2024, net loss attributable to non-controlling interest of $15.1 million for the fiscal year ended December 31, 2023, and net loss attributable to non-controlling interest of $13.6 million for the fiscal year ended January 1, 2023, respectively.
20.SUBSEQUENT EVENTS
On January 29, 2025, the Company amended its Term Loan B to refinance in full all of the $630.3 million outstanding term loan, reduce the interest rate from SOFR plus the applicable rate of 2.75% to SOFR plus the applicable rate of 2.50% and extended the maturity date from January 20, 2028 to January 29, 2032, as well as make certain other changes. Other material terms of the Term Loan B remain unchanged.
In January 2025, noncontrolling interest exchanged an additional 2,000,000 Common Company Units together with the surrender and cancellation of the same number of shares of Class V Common Stock for an equal number of shares of Class A Common Stock. The Company did not receive any proceeds as a result of this exchange.
Item 9. Changes in and Disagreements with Accountants on Accounting and Financial Disclosure
None.
Item 9A. Controls and Procedures
Evaluation of Disclosure Controls and Procedures
We have established disclosure controls and procedures (as defined in Rules 13a-15e) of the Exchange Act, that are designed to provide reasonable assurance that information required to be disclosed in our reports filed or submitted under the Exchange Act is recorded, processed, summarized and reported within the time periods specified in the rules and forms of the SEC, and that information relating to the Company is accumulated and communicated to management, including our Chief Executive Officer and Chief Financial Officer, as appropriate, to allow timely decisions regarding required disclosure. Based on that evaluation, the Chief Executive Officer and Chief Financial Officer have concluded that our current disclosure controls and procedures are effective at a level of reasonable assurance as of December 29, 2024.
Management’s Report on Internal Control Over Financial Reporting
Our management is responsible for establishing and maintaining adequate internal control over our financial reporting, as defined in Exchange Act Rule 13a-15(f). Internal control over financial reporting is a process designed to provide reasonable assurance regarding the reliability of financial reporting and the preparation of financial statements for external purposes in accordance with U.S. GAAP. Internal control over financial reporting includes those policies and procedures that (i) pertain to the maintenance of records that in reasonable detail accurately and fairly reflect the transactions and dispositions of the assets of the Company; (ii) provide reasonable assurance that transactions are recorded as necessary to permit preparation of financial statements in accordance with U.S. GAAP and that receipts and expenditures of the Company are being made only in accordance with authorizations of management and directors of the Company; and (iii) provide reasonable assurance regarding prevention or timely detection of unauthorized acquisition, use, or disposition of the Company’s assets that could have a material effect on the financial statements.
Because of its inherent limitations, internal control over financial reporting may not prevent or detect misstatements. Also, projections of any evaluation of effectiveness to future periods are subject to the risk that controls may become inadequate because of changes in conditions or that the degree of compliance with the policies or procedures may deteriorate.
Management, with the participation of the Chief Executive Officer and Chief Financial Officer, conducted an evaluation of the effectiveness of our internal control over financial reporting based on criteria established in Internal Control – Integrated Framework (2013) by the Committee of Sponsoring Organization of the Treadway Commission. Based on this evaluation, management concluded that our internal control over financial reporting was effective as of December 29, 2024. The effectiveness of the Company’s internal control over financial reporting as of December 29, 2024 has been audited by Grant Thornton LLP, an independent registered public accounting firm, as stated in their report included herein.
Attestation Report of the Registered Public Accounting Firm
The Company's internal control over financial reporting as of December 29, 2024 has been audited by Grant Thornton LLP, an independent registered public accounting firm, as stated in their report which is included in Part II, Item 8 of this Annual Report on Form 10-K.
Changes in Internal Control Over Financial Reporting
There was no change in the Company’s internal control over financial reporting (as defined in Rule 13a-15(f) under the Exchange Act) during its most recent fiscal quarter that has materially affected, or is reasonably likely to materially affect, its internal control over financial reporting.
Item 9B. Other Information
(a)None.
(b)On November 11, 2024, the Roger K. Deromedi Revocable Trust u/a/d 2/11/2000 (the "Revocable Trust"), a trust affiliated with Roger K. Deromedi, the Lead Independent Director of the Company’s Board of Directors, adopted a Rule 10b5-1 trading plan (the “Plan”). The Plan provides for the potential sale of up to 440,243 shares of the Company’s Class A Common Stock held by the Revocable Trust to occur between February 10, 2025 (the first trade date) and November 28, 2025 (the Plan end date). This Plan was entered into during an open insider trading window and is intended to satisfy the affirmative defense of Rule 10b5-1(c) under the Exchange Act and the Company’s policies regarding transactions in the Company’s securities.
Item 9C. Disclosure Regarding Foreign Jurisdictions that Prevent Inspections
Not applicable
PART III
Item 10. Directors, Executive Officers and Corporate Governance
Certain information required by this item is provided below. Other information required by this item will be set forth in our 2025 Proxy Statement under the captions “Corporate Governance” and if applicable, "Delinquent Section 16(a) Reports” to be filed within 120 days after the end of the fiscal year covered by this Annual Report on Form 10-K, and is incorporated herein by reference.
The information regarding executive officers of the Company required by Item 401 of SEC Regulation S-K will be located in our 2025 Proxy Statement in the section entitled “Executive Officers of Utz Brands, Inc.” which information is incorporated herein by reference.
The information required by Item 401 of SEC Regulation S-K concerning the directors and nominees for director of the Company, including a discussion of the specific experience, qualifications, attributes and skills that led the Board to conclude that the director or nominee should serve as a director at this time, will be located in our 2025 Proxy Statement in the section entitled “Proposal No. 1 – Election of Directors,” which information is incorporated herein by reference.
Information regarding the identification of the Audit Committee as a separately-designated standing committee of the Board and information regarding the status of one or more members of the Audit Committee as an “audit committee financial expert” will be located in our 2025 Proxy Statement in the section entitled Corporate Governance - Committees and Meetings of the Board – Board Committees,” and - "Corporate Governance - Committees and Meetings of the Board - Audit Committee," which information is incorporated herein by reference.
Information regarding our Business Code of Conduct and Ethics applicable to our directors, officers and associates will be located in our 2025 Proxy Statement in the Section entitled “Corporate Governance ― Corporate Governance Policies ― Code of Ethics,” which information is incorporated herein by reference.
Information regarding our insider trading policies will be located in our 2025 Proxy Statement in the Section entitled "Corporate Governance - Insider Trading Policy," which information is incorporated herein by reference.
Item 11. Executive Compensation
Information concerning executive compensation will be located in our 2025 Proxy Statement To be filed within 120 days after the end of the fiscal year covered by this Annual Report on Form 10-K, in the section entitled, “Executive and Director Compensation,” which information is incorporated herein by reference.
Item 12. Security Ownership of Certain Beneficial Owners and Management and Related Stockholder Matters
Information concerning ownership of our voting securities by certain beneficial owners, individual nominees for director, the named executive officers, including persons serving as our Chief Executive Officer and Chief Financial Officer, and directors and executive officers as a group, will be located in our 2025 Proxy Statement to be filed within 120 days after the end of the fiscal year covered by this Annual Report on Form 10-K, in the section entitled "Security Ownership of Certain Beneficial Owners and Management,” which information is incorporated herein by reference.
Information regarding all of the Company’s equity compensation plans will be located in our 2025 Proxy Statement in the section entitled “Executive and Director Compensation ― Equity Compensation Plan Information,” which information is incorporated herein by reference to our 2025 Proxy Statement.
Item 13. Certain Relationships and Related Transactions, and Director Independence
Information required by this Item 13 will be included under the heading "Related Party Transactions" and "Corporate Governance - Director Independence" in our 2025 Proxy Statement, which is to be filed within 120 days after the end of the fiscal year covered by this Annual Report on Form 10-K. This information is incorporated by reference into this Annual Report on Form 10-K.
Item 14. Principal Accounting Fees and Services
Information required by this Item 14 will be included under the heading "Proposal No. 3: Ratification of Selection of Independent Registered Public Accounting Firm - Audit, Audit-Related, Tax and All Other Fees” in our 2025 Proxy Statement, which is to be filed within 120 days after the end of the fiscal year covered by this Annual Report on Form 10-K. This information is incorporated by reference into this Annual Report on Form 10-K.
Part IV
Item 15. Exhibits, Financial Statement Schedules
(a) Documents filed as part of the report
1.Financial Statements
The following Consolidated Financial Statements of Utz Brands, Inc. and the Reports of the Independent Registered Public Accounting Firm are included in Part II, Item 8 of this Annual Report on Form 10-K.
| | | | | | | | |
| Index to the Financial Statements | | Page |
| | |
| | |
| | |
| | |
| | |
| | |
| | |
| | |
| | |
| | |
| | |
| | |
| | |
| | |
2. Financial Statement Schedules
All financial statement schedules have been omitted as the information is not required under the related instruction or is not applicable or because the information required is already included in the financial statements or the notes to those financial statements.
3. Exhibits
The exhibits to this report are listed in the exhibit index below.
(b) Exhibits
The following exhibits are being filed herewith:
| | | | | | | | |
| Exhibit | | |
| Number | | Exhibit Description |
| | Business Combination Agreement, dated as of June 5, 2020, by and among Collier Creek Holdings, Series U of UM Partners, LLC, Series R of UM Partners, LLC and Utz Brands Holdings, LLC (incorporated by reference to Exhibit 2.1 of Collier Creek’s Form 8-K (File No. 001-38686), filed with the Commission on June 5, 2020). |
| | Purchase Agreement dated January 31, 2024, by and among GH Pop Holdings LLC, R.W. Garcia Holdings, LLC, Utz Quality Foods, LLC, Condor Snack Foods, LLC, Healthy Snacks Holdco LLC, North Carolina Tortilla Manufacturing LLC, Pennsylvania Tortilla Manufacturing LLC and Best Snacks, LLC (incorporated by reference to Exhibit 2.1 of Utz Brands, Inc.’s Current Report on Form 8-K (File No. 001-38686), filed with the Commission on January 31, 2024). |
| | |
| | |
| | |
| | |
| | |
| | |
| | |
| | |
| | Third Amended and Restated Limited Liability Company Agreement of Utz Brands Holdings, LLC, dated as of August 28, 2020, by and among Utz Brands Holdings, LLC, Utz Brands, Inc., Series U of UM Partners, LLC, Series R of UM Partners, LLC and each other person who is or at any time becomes a member of Utz Brands Holdings, LLC (incorporated by reference to Exhibit 10.1 to Utz Brands, Inc.’s Current Report on Form 8-K (File No. 001-38686), filed with the Commission on September 3, 2020). |
| | | | | | | | |
| | Tax Receivable Agreement, dated August 28, 2020, by and among Utz Brands, Inc., Utz Brands Holdings, LLC, Series U of UM Partners, LLC, Series R of UM Partners, LLC and the TRA Party Representative, incorporated by reference to Exhibit 10.2 to Utz Brands, Inc.’s Current Report on Form 8-K (File No. 001-38686), filed with the Commission on September 3, 2020). |
| | Investor Rights Agreement, dated as of August 28, 2020, by and among Utz Brands, Inc., Series U of UM Partners, LLC, Series R of UM Partners, LLC, the Sponsor Parties and the Sponsor Representative, incorporated by reference to Exhibit 10.3 to Utz Brands, Inc.’s Current Report on Form 8-K (File No. 001-38686), filed with the Commission on September 3, 2020). |
| | |
| | |
| | Standstill Agreement, dated as of August 28, 2020, by and among Utz Brands, Inc., Series U of UM Partners, LLC, Series R of UM Partners, LLC, Collier Creek Partners LLC, certain founder holders and certain beneficial owners and related parties of Series U of UM Partners, LLC and Series R of UM Partners, LLC (incorporated by reference to Exhibit 10.4 to Utz Brands, Inc.’s Current Report on Form 8-K (File No. 001-38686), filed with the Commission on September 3, 2020). |
| | |
| | |
| | |
| | |
| | |
| | |
| | |
| | Bridge Credit Agreement, entered into as of December 14, 2020, among Utz Quality Foods, LLC, Utz Brands Holdings, LLC, Bank of America, N.A., and each lender from time to time party thereto (incorporated by reference to Exhibit 10.1 to Utz Brands, Inc.’s Current Report on Form 8-K (File No. 001-38686) filed with the Commission on December 14, 2020). |
| | Bridge Security Agreement, dated as of December 14, 2020, among Utz Quality Foods, LLC, Utz Brands Holdings, LLC, the other guarantors party thereto and Bank of America, N.A. (incorporated by reference to Exhibit 10.2 to Utz Brands, Inc.’s Current Report on Form 8-K (File No. 001-38686) filed with the Commission on December 14, 2020). |
| | |
| | Loan Agreement dated as of October 12, 2022 by and among Utz Quality Foods, LLC, Kennedy Endeavors, LLC, Condor Snack Foods, LLC, the Lenders from time to time party thereto and City National Bank, a national banking association, as administrative agent (incorporated by reference to Exhibit 10.1 to Utz Brands, Inc.’s Current Report on Form 8-K (File No. 001-38686), filed with the Commission on October 12, 2022). |
| | |
| | | | | | | | |
| | |
| | |
| | |
| | |
| | |
| | |
| | |
| | |
| | |
| | |
| | |
| | |
| | |
| 101.INS* | | XBRL Instance Document. |
| 101.SCH* | | XBRL Taxonomy Extension Schema Document. |
| 101.CAL* | | XBRL Taxonomy Extension Calculation Linkbase Document. |
| 101.DEF* | | XBRL Taxonomy Extension Definition Linkbase Document. |
| 101.LAB* | | XBRL Taxonomy Extension Label Linkbase Document. |
| 101.PRE* | | XBRL Taxonomy Extension Presentation Linkbase Document |
| 104 | | Cover Page Interactive Data File (formatted as Inline XBRL and contained in Exhibit 101) |
| * | | Filed herewith |
| ** | | Furnished herewith |
| + | | Indicates a management or compensatory plan. |
| † | | Schedules to this exhibit have been omitted pursuant to Item 601(a)(5) of Registration S-K. The Registrant hereby agrees to furnish a copy of any omitted schedules to the SEC upon request. |
| | |
Item 16. Form 10-K Summary
None.
SIGNATURES
Pursuant to the requirements of the Securities Exchange Act of 1934, as amended, the registrant has duly caused this report to be signed on its behalf by the undersigned thereunto duly authorized.
Date: February 20, 2025 UTZ BRANDS, INC.
By: /s/ Ajay Kataria
Name: Ajay Kataria
Title: Executive Vice President, Chief Financial Officer
Each person whose individual signature appears below hereby authorizes and appoints Howard Friedman, Ajay Kataria, and Theresa Shea, and each of them, with full power of substitution and resubstitution and full power to act without the other, as his or her true and lawful attorney-in-fact and agent to act in his or her name, place and stead and to execute in the name and on behalf of each person, individually and in each capacity stated below, and to file any and all amendments to this annual report on Form 10-K and to file the same, with all exhibits thereto, and other documents in connection therewith, with the Securities and Exchange Commission, granting unto said attorneys-in-fact and agents, and each of them, full power and authority to do and perform each and every act and thing, ratifying and confirming all that said attorneys-in-fact and agents or any of them or their or his or her substitute or substitutes may lawfully do or cause to be done by virtue thereof.
Pursuant to the requirements of Securities Exchange Act of 1934, this report has been signed below by the following persons on behalf of the Registrant and in the capacities and on the dates indicated.
| | | | | | | | |
| Signature | Title | Date |
| | |
| /s/ Howard Friedman | Director and Chief Executive Officer | February 20, 2025 |
| Howard Friedman | (Principal Executive Officer) | Date |
| | |
| /s/ Ajay Kataria | Executive Vice President, Chief Financial Officer | February 20, 2025 |
| Ajay Kataria | (Principal Financial Officer & Principal Accounting Officer) | Date |
| | |
| /s/ Dylan B. Lissette | Chairperson; Director | February 20, 2025 |
| Dylan B. Lissette | | Date |
| | |
| /s/ Roger K. Deromedi | Lead Independent Director | February 20, 2025 |
| Roger K. Deromedi | | Date |
| | |
| /s/ Craig D. Steeneck | Director; Chair, Audit Committee | February 20, 2025 |
| Craig D. Steeneck | | Date |
| | |
| /s/ John W. Altmeyer | Director; Chair, Nominating and Corporate Governance Committee | February 20, 2025 |
| John W. Altmeyer | | Date |
| | |
| /s/ Timothy P. Brown | Director | February 20, 2025 |
| Timothy P. Brown | | Date |
| | |
| /s/ Christina Choi | Director | February 20, 2025 |
| Christina Choi | | Date |
| | |
| /s/ Antonio F. Fernandez | Director | February 20, 2025 |
| Antonio F. Fernandez | | Date |
| | |
| /s/ Jason K. Giordano | Director; Chair, Compensation Committee | February 20, 2025 |
| Jason K. Giordano | | Date |
| | |
| /s/ B. John Lindeman | Director | February 20, 2025 |
| B. John Lindeman | | Date |
| | |
| /s/ Pamela Stewart | Director | February 20, 2025 |
| Pamela Stewart | | Date |
| | |
| /s/ William Werzyn , Jr. | Director | February 20, 2025 |
| William Werzyn , Jr. | | Date |