Filing pursuant to Rule 425 under the Securities Act of 1933, as amended Filer: Com Hem Holding AB (publ) Subject Company: Com Hem Holding AB Commission File No.: 132-02822
COM HEM
TV
INTERIM REPORT Q2 2018
COM HEM INTERIM REPORT JANUARY-JUNE 2018
ON TRACK TO DELIVER ON FULL YEAR GUIDANCE
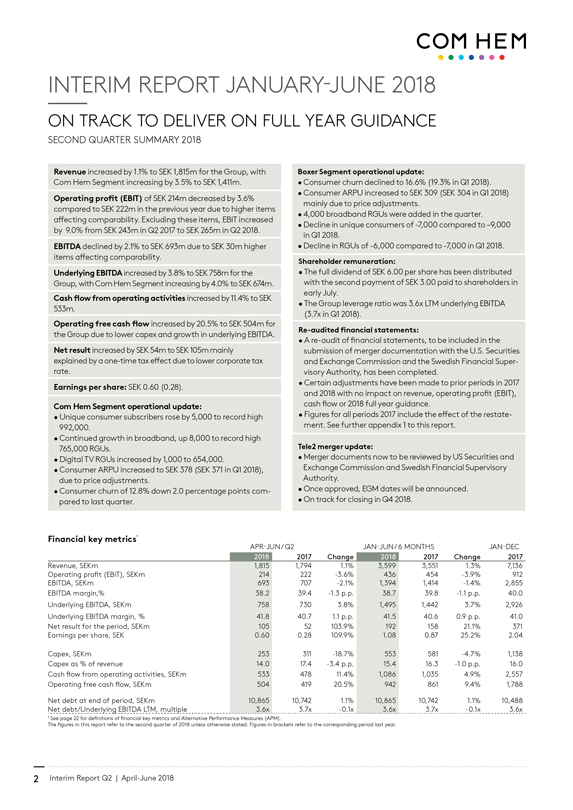
SECOND QUARTER SUMMARY 2018
Revenue increased by 1.1% to SEK 1,815m for the Group, with Com Hem Segment increasing by 3.5% to SEK 1,411m.
Operating profit (EBIT) of SEK 214m decreased by 3.6% compared to SEK 222m in the previous year due to higher items affecting comparability. Excluding these items, EBIT increased by 9.0% from SEK 243m in Q2 2017 to SEK 265m in Q2 2018. EBITDA declined by 2.1% to SEK 693m due to SEK 30m higher items affecting comparability. Underlying EBITDA increased by 3.8% to SEK 758m for the Group, with Com Hem Segment increasing by 4.0% to SEK 674m. Cash flow from operating activities increased by 11.4% to SEK 533m. Operating free cash flow increased by 20.5% to SEK 504m for the Group due to lower capex and growth in underlying EBITDA. Net result increased by SEK 54m to SEK 105m mainly explained by a one-time tax effect due to lower corporate tax rate. Earnings per share: SEK 0.60 (0.28). Com Hem Segment operational update: Unique consumer subscribers rose by 5,000 to record high 992,000. Continued growth in broadband, up 8,000 to record high 765,000 RGUs. Digital TV RGUs increased by 1,000 to 654,000. Consumer ARPU increased to SEK 378 (SEK 371 in Q1 2018), due to price adjustments. Consumer churn of 12.8% down 2.0 percentage points com- pared to last quarter. Boxer Segment operational update: Consumer churn declined to 16.6% (19.3% in Q1 2018). Consumer ARPU increased to SEK 309 (SEK 304 in Q1 2018) mainly due to price adjustments. 4,000 broadband RGUs were added in the quarter. Decline in unique consumers of -7,000 compared to -9,000 in Q1 2018. Decline in RGUs of -6,000 compared to -7,000 in Q1 2018. Shareholder remuneration: The full dividend of SEK 6.00 per share has been distributed with the second payment of SEK 3.00 paid to shareholders in early July. The Group leverage ratio was 3.6x LTM underlying EBITDA (3.7x in Q1 2018). Re-audited financial statements: A re-audit of financial statements, to be included in the submission of merger documentation with the U.S. Securities and Exchange Commission and the Swedish Financial Super- visory Authority, has been completed. Certain adjustments have been made to prior periods in 2017 and 2018 with no impact on revenue, operating profit (EBIT), cash flow or 2018 full year guidance. Figures for all periods 2017 include the effect of the restate- ment. See further appendix 1 to this report. Tele2 merger update: Merger documents now to be reviewed by US Securities and Exchange Commission and Swedish Financial Supervisory Authority. Once approved, EGM dates will be announced. On track for closing in Q4 2018. Financial key metrics APR-JUN / Q2 JAN-JUN / 6 MONTHS JAN-DEC 2018 2017 Change 2018 2017 Change 2017 Revenue, SEKm 1,815 1,794 1.1% 3,599 3,551 1.3% 7,136 Operating profit (EBIT), SEKm 214 222 -3.6% 436 454 -3.9% 912 EBITDA, SEKm 693 707 -2.1% 1,394 1,414 -1.4% 2,855 EBITDA margin,% 38.2 39.4 -1.3 p.p. 38.7 39.8 -1.1 p.p. 40.0 Underlying EBITDA, SEKm 758 730 3.8% 1,495 1,442 3.7% 2,926 Underlying EBITDA margin, % 41.8 40.7 1.1 p.p. 41.5 40.6 0.9 p.p. 41.0 Net result for the period, SEKm 105 52 103.9% 192 158 21.1% 371 Earnings per share, SEK 0.60 0.28 109.9% 1.08 0.87 25.2% 2.04
Capex, SEKm 253 311 -18.7% 553 581 -4.7% 1,138 Capex as % of revenue 14.0 17.4 -3.4 p.p. 15.4 16.3 -1.0 p.p. 16.0 Cash flow from operating activities, SEKm 533 478 11.4% 1,086 1,035 4.9% 2,557 Operating free cash flow, SEKm 504 419 20.5% 942 861 9.4% 1,788 Net debt at end of period, SEKm 10,865 10,742 1.1% 10,865 10,742 1.1% 10,488 Net debt/Underlying EBITDA LTM, multiple 3.6x 3.7x -0.1x 3.6x 3.7x -0.1x 3.6x 1 See page 22 for definitions of financial key metrics and Alternative Performance Measures (APM). The figures in this report refer to the second quarter of 2018 unless otherwise stated. Figures in brackets refer to the corresponding period last year.
2 Interim Report Q2 | April-June 2018
COM HEM
ON TRACK TO DELIVER ON FULL YEAR GUIDANCE
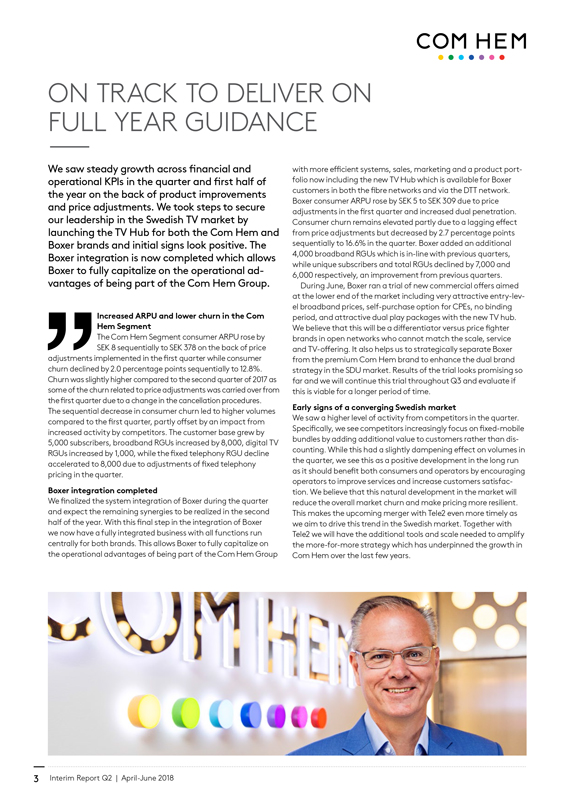
We saw steady growth across financial and operational KPIs in the quarter and first half of the year on the back of product improvements and price adjustments. We took steps to secure our leadership in the Swedish TV market by launching the TV Hub for both the Com Hem and Boxer brands and initial signs look positive. The Boxer integration is now completed which allows Boxer to fully capitalize on the operational advantages of being part of the Com Hem Group.
Increased ARPU and lower churn in the Com
Hem Segment
The Com Hem Segment consumer ARPU rose by
SEK 8 sequentially to SEK 378 on the back of price adjustments implemented in the first quarter while consumer churn declined by 2.0 percentage points sequentially to 12.8%. Churn was slightly higher compared to the second quarter of 2017 as some of the churn related to price adjustments was carried over from the first quarter due to a change in the cancellation procedures.
The sequential decrease in consumer churn led to higher volumes compared to the first quarter, partly offset by an impact from increased activity by competitors. The customer base grew by
5,000 subscribers, broadband RGUs increased by 8,000, digital TV RGUs increased by 1,000, while the fixed telephony RGU decline accelerated to 8,000 due to adjustments of fixed telephony pricing in the quarter.
Boxer integration completed
We finalized the system integration of Boxer during the quarter and expect the remaining synergies to be realized in the second half of the year. With this final step in the integration of Boxer we now have a fully integrated business with all functions run centrally for both brands. This allows Boxer to fully capitalize on the operational advantages of being part of the Com Hem Group with more efficient systems, sales, marketing and a product portfolio now including the new TV Hub which is available for Boxer customers in both the fibre networks and via the DTT network. Boxer consumer ARPU rose by SEK 5 to SEK 309 due to price adjustments in the first quarter and increased dual penetration. Consumer churn remains elevated partly due to a lagging effect from price adjustments but decreased by 2.7 percentage points sequentially to 16.6% in the quarter. Boxer added an additional 4,000 broadband RGUs which is in-line with previous quarters, while unique subscribers and total RGUs declined by 7,000 and 6,000 respectively, an improvement from previous quarters. During June, Boxer ran a trial of new commercial offers aimed at the lower end of the market including very attractive entry-level broadband prices, self-purchase option for CPEs, no binding period, and attractive dual play packages with the new TV hub. We believe that this will be a differentiator versus price fighter brands in open networks who cannot match the scale, service and TV-offering. It also helps us to strategically separate Boxer from the premium Com Hem brand to enhance the dual brand strategy in the SDU market. Results of the trial looks promising so far and we will continue this trial throughout Q3 and evaluate if this is viable for a longer period of time.
Early signs of a converging Swedish market
We saw a higher level of activity from competitors in the quarter. Specifically, we see competitors increasingly focus on fixed-mobile bundles by adding additional value to customers rather than discounting. While this had a slightly dampening effect on volumes in the quarter, we see this as a positive development in the long run as it should benefit both consumers and operators by encouraging operators to improve services and increase customers satisfaction. We believe that this natural development in the market will reduce the overall market churn and make pricing more resilient. This makes the upcoming merger with Tele2 even more timely as we aim to drive this trend in the Swedish market. Together with Tele2 we will have the additional tools and scale needed to amplify the more-for-more strategy which has underpinned the growth in Com Hem over the last few years.
3 Interim Report Q2 | April-June 2018
COM HEM
Strong cash flow growth for the Group
The Com Hem Group increased revenue by 1.1% to SEK 1,815m
with a growth of 3.5% in the Com Hem Segment, offset by a 6.2% decline in Boxer. Underlying EBITDA increased by 3.8% to SEK 758m for the Group with a 4.0% growth in the Com Hem Segment and
1.8% growth in Boxer. Group EBITDA declined by 2.1% to SEK 693m due to a higher level of items affecting comparability from costs associated with the merger with Tele2. Group capex amounted to SEK 253m in the quarter compared to SEK 311m in Q2 2017. Growth in underlying EBITDA and lower capex resulted in a 20.5% growth in operating free cash flow.
The full dividend of SEK 6.00 per share has now been distributed with the second payment of SEK 3.00 paid out in the beginning of July. The share repurchase programme ended in March due to the upcoming merger with Tele2. The Group ended the quarter with
a leverage ratio of 3.6x LTM underlying EBITDA which is within our target of 3.5-4.0x.
Looking ahead
Our focus for the second half of the year will as always be continued efforts to increase customer satisfaction to create sustainable growth. We are upgrading our network in preparation for the 1+ Gbit/s launch to further enhance our superior broadband service and meet increasing customer demand for higher speeds and capacity. The TV Hub, which we believe perfectly matches the TV-viewing habits of today’s consumer, is now being sold by both our main brands and should serve to further enhance customer satisfaction. Meanwhile we focus on developing our boxless TV-offering to turn it into our main product in the future. With the Boxer integration now completed, we can realize the rest of the cost synergies and run a more efficient dual brand strategy in the SDU market. These initiatives will create continued growth and secure delivery of our full year guidance. The merger with Tele2 is on track for a fourth quarter closing and in the meantime we will do everything we can to prepare the combined company to successfully drive fixed-mobile convergence from 2019 and beyond.
Anders Nilsson
CEO
FINANCIAL GUIDANCE - UNCHANGED
FINANCIAL GUIDANCE FOR THE GROUP - 2018 AND MID-TERM
Underlying EBITDA We aim to deliver mid-single digit underlying EBITDA growth for the entire Group annually. We expect growth to be skewed toward the Com Hem Segment in 2018 as we continue necessary efforts to execute on the turnaround of Boxer
Capex We expect Capex for the entire Group to be in the range of SEK 1.0-1.1bn annually
Leverage target We aim to maintain our leverage within the interval of 3.5-4.0x underlying EBITDA LTM
4 Interim Report Q2 | April-June 2018
COM HEM
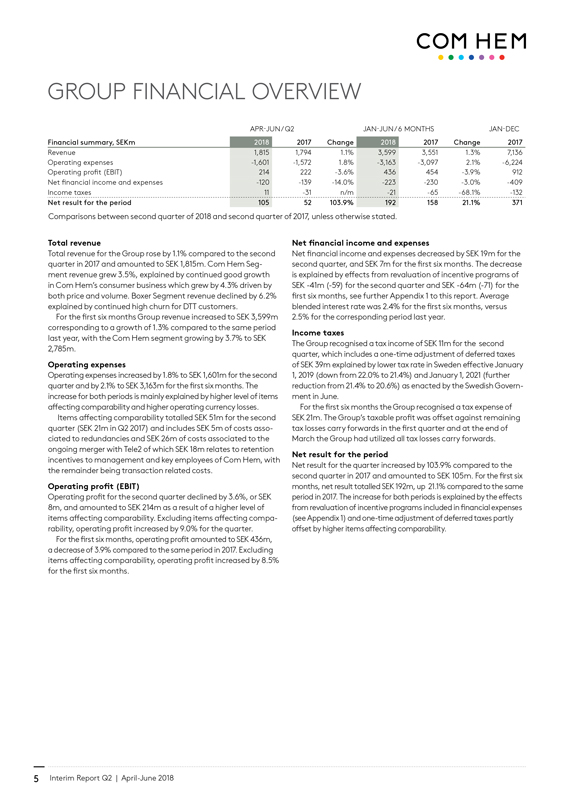
GROUP FINANCIAL OVERVIEW
APR-JUN / Q2 JAN-JUN / 6 MONTHS JAN-DEC
Financial summary, SEKm 2018 2017 Change 2018 2017 Change 2017
Revenue
Operating expenses
Operating profit (EBIT)
Net financial income and expenses
Income taxes 1,815
-1,601
214
-120
11 1,794 1.1%
-1,572 1.8%
222 -3.6%
-139 -14.0%
-31 n/m 3,599
-3,163
436
-223
-21 3,551 1.3% 7,136
-3,097 2.1% -6,224
454 -3.9% 912
-230 -3.0% -409
-65 -68.1% -132
Net result for the period 105 52 103.9% 192 158 21.1% 371
Comparisons between second quarter of 2018 and second quarter of 2017, unless otherwise stated.
Total revenue
Total revenue for the Group rose by 1.1% compared to the second quarter in 2017 and amounted to SEK 1,815m. Com Hem Segment revenue grew 3.5%, explained by continued good growth
in Com Hem’s consumer business which grew by 4.3% driven by both price and volume. Boxer Segment revenue declined by 6.2% explained by continued high churn for DTT customers.
For the first six months Group revenue increased to SEK 3,599m corresponding to a growth of 1.3% compared to the same period last year, with the Com Hem segment growing by 3.7% to SEK
2,785m.
Operating expenses
Operating expenses increased by 1.8% to SEK 1,601m for the second quarter and by 2.1% to SEK 3,163m for the first six months. The increase for both periods is mainly explained by higher level of items affecting comparability and higher operating currency losses.
Items affecting comparability totalled SEK 51m for the second quarter (SEK 21m in Q2 2017) and includes SEK 5m of costs associated to redundancies and SEK 26m of costs associated to the ongoing merger with Tele2 of which SEK 18m relates to retention incentives to management and key employees of Com Hem, with the remainder being transaction related costs.
Operating profit (EBIT)
Operating profit for the second quarter declined by 3.6%, or SEK
8m, and amounted to SEK 214m as a result of a higher level of items affecting comparability. Excluding items affecting comparability, operating profit increased by 9.0% for the quarter.
For the first six months, operating profit amounted to SEK 436m, a decrease of 3.9% compared to the same period in 2017. Excluding items affecting comparability, operating profit increased by 8.5% for the first six months.
Net financial income and expenses
Net financial income and expenses decreased by SEK 19m for the second quarter, and SEK 7m for the first six months. The decrease is explained by effects from revaluation of incentive programs of SEK -41m (-59) for the second quarter and SEK -64m (-71) for the first six months, see further Appendix 1 to this report. Average blended interest rate was 2.4% for the first six months, versus
2.5% for the corresponding period last year.
Income taxes
The Group recognised a tax income of SEK 11m for the second quarter, which includes a one-time adjustment of deferred taxes
of SEK 39m explained by lower tax rate in Sweden effective January
1, 2019 (down from 22.0% to 21.4%) and January 1, 2021 (further reduction from 21.4% to 20.6%) as enacted by the Swedish Government in June.
For the first six months the Group recognised a tax expense of SEK 21m. The Group’s taxable profit was offset against remaining tax losses carry forwards in the first quarter and at the end of March the Group had utilized all tax losses carry forwards.
Net result for the period
Net result for the quarter increased by 103.9% compared to the second quarter in 2017 and amounted to SEK 105m. For the first six months, net result totalled SEK 192m, up 21.1% compared to the same period in 2017. The increase for both periods is explained by the effects from revaluation of incentive programs included in financial expenses (see Appendix 1) and one-time adjustment of deferred taxes partly offset by higher items affecting comparability.
5 Interim Report Q2 | April-June 2018
COM HEM
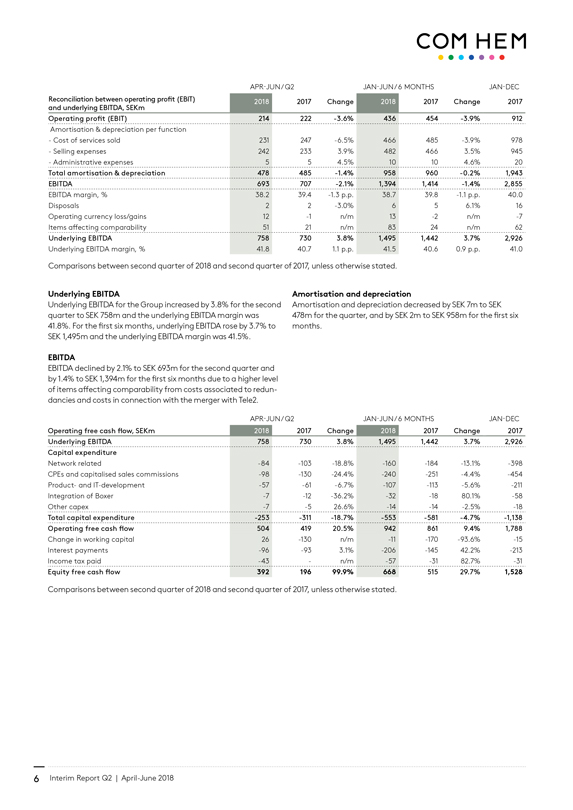
APR-JUN / Q2 JAN-JUN / 6 MONTHS JAN-DEC
Reconciliation between operating profit (EBIT) 2018 2017 Change 2018 2017 Change 2017 and underlying EBITDA, SEKm Operating profit (EBIT) 214 222 -3.6% 436 454 -3.9% 912
Amortisation & depreciation per function
- Cost of services sold 231 247 -6.5% 466 485 -3.9% 978
- Selling expenses 242 233 3.9% 482 466 3.5% 945
- Administrative expenses 5 5 4.5% 10 10 4.6% 20
Total amortisation & depreciation 478 485 -1.4% 958 960 -0.2% 1,943 EBITDA 693 707 -2.1% 1,394 1,414 -1.4% 2,855
EBITDA margin, % 38.2 39.4 -1.3 p.p. 38.7 39.8 -1.1 p.p. 40.0 Disposals 2 2 -3.0% 6 5 6.1% 16 Operating currency loss/gains 12 -1 n/m 13 -2 n/m -7 Items affecting comparability 51 21 n/m 83 24 n/m 62
Underlying EBITDA 758 730 3.8% 1,495 1,442 3.7% 2,926
Underlying EBITDA margin, % 41.8 40.7 1.1 p.p. 41.5 40.6 0.9 p.p. 41.0
Comparisons between second quarter of 2018 and second quarter of 2017, unless otherwise stated.
Underlying EBITDA
Underlying EBITDA for the Group increased by 3.8% for the second quarter to SEK 758m and the underlying EBITDA margin was
41.8%. For the first six months, underlying EBITDA rose by 3.7% to
SEK 1,495m and the underlying EBITDA margin was 41.5%.
EBITDA
EBITDA declined by 2.1% to SEK 693m for the second quarter and by 1.4% to SEK 1,394m for the first six months due to a higher level of items affecting comparability from costs associated to redundancies and costs in connection with the merger with Tele2.
Amortisation and depreciation
Amortisation and depreciation decreased by SEK 7m to SEK
478m for the quarter, and by SEK 2m to SEK 958m for the first six months.
APR-JUN / Q2 JAN-JUN / 6 MONTHS JAN-DEC
Operating free cash flow, SEKm 2018 2017 Change 2018 2017 Change 2017 Underlying EBITDA 758 730 3.8% 1,495 1,442 3.7% 2,926 Capital expenditure
Network related -84 -103 -18.8% -160 -184 -13.1% -398 CPEs and capitalised sales commissions -98 -130 -24.4% -240 -251 -4.4% -454 Product- and IT-development -57 -61 -6.7% -107 -113 -5.6% -211 Integration of Boxer -7 -12 -36.2% -32 -18 80.1% -58 Other capex -7 -5 26.6% -14 -14 -2.5% -18
Total capital expenditure -253 -311 -18.7% -553 -581 -4.7% -1,138 Operating free cash flow 504 419 20.5% 942 861 9.4% 1,788
Change in working capital 26 -130 n/m -11 -170 -93.6% -15 Interest payments -96 -93 3.1% -206 -145 42.2% -213 Income tax paid -43-n/m -57 -31 82.7% -31
Equity free cash flow 392 196 99.9% 668 515 29.7% 1,528
Comparisons between second quarter of 2018 and second quarter of 2017, unless otherwise stated.
6 Interim Report Q2 | April-June 2018
COM HEM
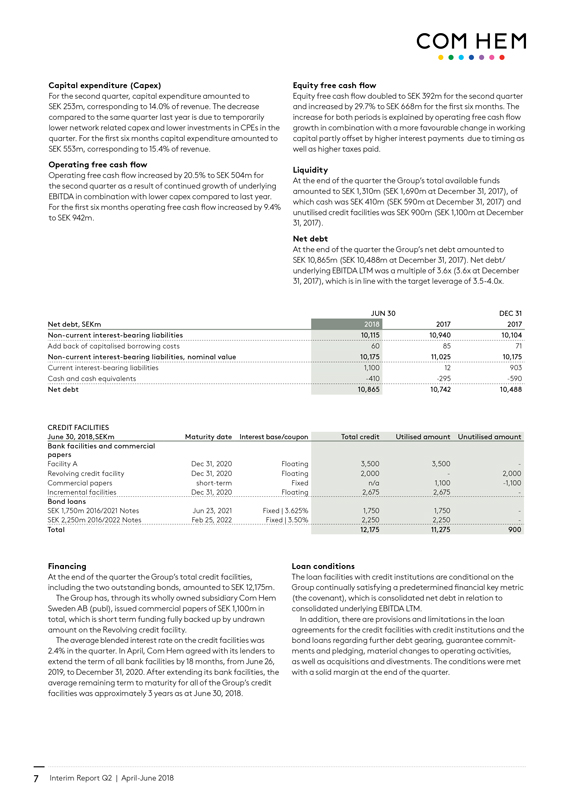
Capital expenditure (Capex)
For the second quarter, capital expenditure amounted to SEK 253m, corresponding to 14.0% of revenue. The decrease compared to the same quarter last year is due to temporarily lower network related capex and lower investments in CPEs in the quarter. For the first six months capital expenditure amounted to SEK 553m, corresponding to 15.4% of revenue.
Operating free cash flow
Operating free cash flow increased by 20.5% to SEK 504m for
the second quarter as a result of continued growth of underlying EBITDA in combination with lower capex compared to last year. For the first six months operating free cash flow increased by 9.4% to SEK 942m.
Equity free cash flow
Equity free cash flow doubled to SEK 392m for the second quarter and increased by 29.7% to SEK 668m for the first six months. The increase for both periods is explained by operating free cash flow growth in combination with a more favourable change in working capital partly offset by higher interest payments due to timing as well as higher taxes paid.
Liquidity
At the end of the quarter the Group’s total available funds amounted to SEK 1,310m (SEK 1,690m at December 31, 2017), of which cash was SEK 410m (SEK 590m at December 31, 2017) and unutilised credit facilities was SEK 900m (SEK 1,100m at December
31, 2017).
Net debt
At the end of the quarter the Group’s net debt amounted to SEK 10,865m (SEK 10,488m at December 31, 2017). Net debt/ underlying EBITDA LTM was a multiple of 3.6x (3.6x at December
31, 2017), which is in line with the target leverage of 3.5-4.0x.
JUN 30 DEC 31 Net debt, SEKm 2018 2017 2017 Non-current interest-bearing liabilities 10,115 10,940 10,104
Add back of capitalised borrowing costs 60 85 71
Non-current interest-bearing liabilities, nominal value 10,175 11,025 10,175
Current interest-bearing liabilities 1,100 12 903 Cash and cash equivalents -410 -295 -590
Net debt 10,865 10,742 10,488
CREDIT FACILITIES
June 30, 2018,SEKm Maturity date Interest base/coupon Total credit Utilised amount Unutilised amount Bank facilities and commercial papers
Facility A Dec 31, 2020 Floating 3,500 3,500 - Revolving credit facility Dec 31, 2020 Floating 2,000 - 2,000 Commercial papers short-term Fixed n/a 1,100 -1,100 Incremental facilities Dec 31, 2020 Floating 2,675 2,675 -
Bond loans
SEK 1,750m 2016/2021 Notes Jun 23, 2021 Fixed | 3.625% 1,750 1,750 -SEK 2,250m 2016/2022 Notes Feb 25, 2022 Fixed | 3.50% 2,250 2,250 -
Total 12,175 11,275 900
Financing
At the end of the quarter the Group’s total credit facilities, including the two outstanding bonds, amounted to SEK 12,175m.
The Group has, through its wholly owned subsidiary Com Hem Sweden AB (publ), issued commercial papers of SEK 1,100m in total, which is short term funding fully backed up by undrawn amount on the Revolving credit facility.
The average blended interest rate on the credit facilities was
2.4% in the quarter. In April, Com Hem agreed with its lenders to extend the term of all bank facilities by 18 months, from June 26,
2019, to December 31, 2020. After extending its bank facilities, the average remaining term to maturity for all of the Group’s credit facilities was approximately 3 years as at June 30, 2018.
Loan conditions
The loan facilities with credit institutions are conditional on the Group continually satisfying a predetermined financial key metric (the covenant), which is consolidated net debt in relation to consolidated underlying EBITDA LTM.
In addition, there are provisions and limitations in the loan agreements for the credit facilities with credit institutions and the bond loans regarding further debt gearing, guarantee commitments and pledging, material changes to operating activities,
as well as acquisitions and divestments. The conditions were met with a solid margin at the end of the quarter.
7 Interim Report Q2 | April-June 2018
COM HEM
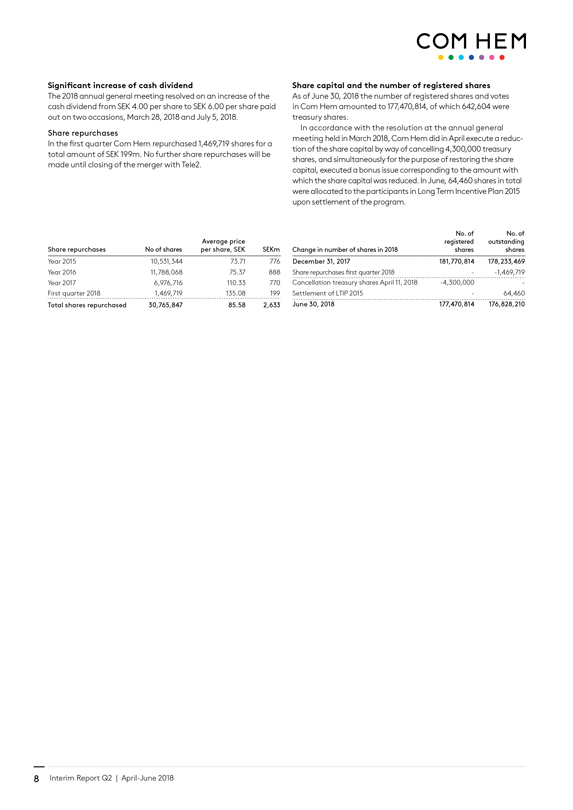
Significant increase of cash dividend
The 2018 annual general meeting resolved on an increase of the cash dividend from SEK 4.00 per share to SEK 6.00 per share paid out on two occasions, March 28, 2018 and July 5, 2018.
Share repurchases
In the first quarter Com Hem repurchased 1,469,719 shares for a total amount of SEK 199m. No further share repurchases will be made until closing of the merger with Tele2.
Share capital and the number of registered shares
As of June 30, 2018 the number of registered shares and votes in Com Hem amounted to 177,470,814, of which 642,604 were treasury shares.
In accordance with the resolution at the annual general meeting held in March 2018, Com Hem did in April execute a reduc- tion of the share capital by way of cancelling 4,300,000 treasury shares, and simultaneously for the purpose of restoring the share capital, executed a bonus issue corresponding to the amount with which the share capital was reduced. In June, 64,460 shares in total were allocated to the participants in Long Term Incentive Plan 2015 upon settlement of the program.
Average price
Share repurchases No of shares per share, SEK SEKm
Year 2015 10,531,344 73.71 776 Year 2016 11,788,068 75.37 888 Year 2017 6,976,716 110.33 770 First quarter 2018 1,469,719 135.08 199
Total shares repurchased 30,765,847 85.58 2,633
No. of No. of registered outstanding Change in number of shares in 2018 shares shares December 31, 2017 181,770,814 178,233,469
Share repurchases first quarter 2018 -1,469,719 Cancellation treasury shares April 11, 2018 -4,300,000 -Settlement of LTIP 2015 - 64,460
June 30, 2018 177,470,814 176,828,210
8 Interim Report Q2 | April-June 2018

COM HEM
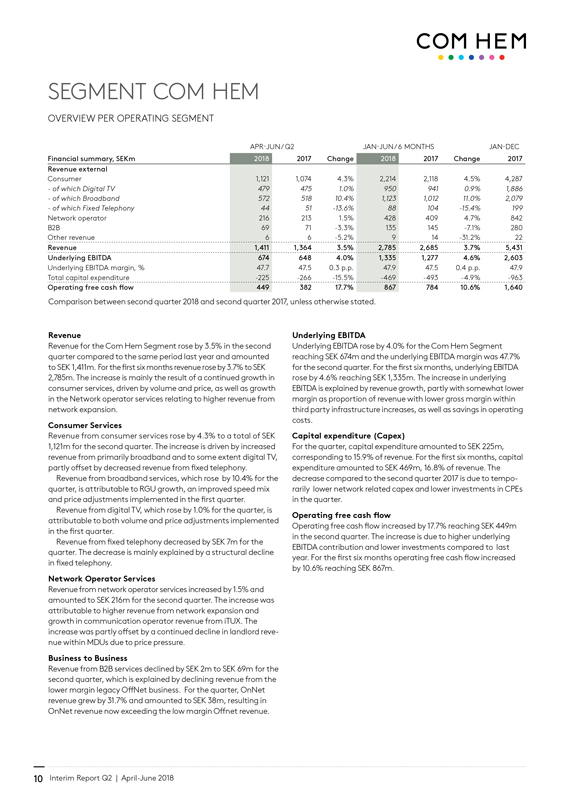
SEGMENT COM HEM
OVERVIEW PER OPERATING SEGMENT
2017 2018
Operational key metrics1 Q1 Q2 Q3 Q4 Q1 Q2 Addressable footprint, thousands 2,324 2,382 2,457 2,628 2,688 2,786
Unique consumer subscribers, thousands 952 961 972 983 987 992 Consumer churn as % of unique consumer subscribers, % 13.6 12.4 12.8 13.6 14.8 12.8
Consumer RGUs thousands
Broadband 713 724 736 750 757 765 Digital TV 644 645 651 655 653 654
- of which high-end set top boxes 251 255 259 264 267 273
Fixed telephony 277 272 269 266 260 252
Total consumer RGUs 1,634 1,642 1,656 1,671 1,670 1,672
Unique B2B subscribers, thousands
OnNet 22 22 23 24 24 25 OffNet 33 30 28 25 24 22
Total unique B2B subscribers 54 53 51 49 48 46 ARPU, SEK
Consumer 368 376 373 373 371 378 B2B 448 445 425 463 455 487
1 For the quarter, and on the last date of each quarter.
Comparison between second quarter 2018 and second quarter 2017, unless otherwise stated.
Addressable footprint
In the second quarter, the Com Hem addressable footprint increased by 98,000 homes to 2,786,000 at the end of the period, of which approximately 1,100,000 are also reached by Boxer. The increase is mainly a result of our expansion into the SDU market where we at the end of June had added some 800,000 addressable households in the Com Hem Segment and an additional approximately 150,000 households unique to Boxer since the start of the expansion programme through the addition of open LANs as well as unbundled Telia fibre.
Unique consumer subscribers
The number of unique consumer subscribers continued to increase in the quarter, up 5,000 to 992,000, explained by strong growth in broadband RGUs.
Consumer churn rate
The churn rate, expressed as the percentage of consumer subscribers, was 12.8% in the second quarter compared to 14.8% for the first quarter. The decrease was expected following the pricing activities in the first quarter.
Consumer RGUs
The number of consumer RGUs was 1,672,000 at the end of
the second quarter, with a continued increase in digital-TV and broadband RGU’s in the quarter offset by declining fixed-telephony RGUs.
The number of broadband RGUs rose by 8,000 in the quarter to an all time high of 765,000. Close to 90% of the entire broadband base now subscribe to a 100 Mbit/s or higher service resulting in
an average speed across the base of 154 Mbit/s.
The number of digital TV RGUs increased by 1,000 during the quarter to a total of 654,000 RGUs, with the number of customers with a high-end set top box (TiVo or TV hub) grew by 7,000 to
273,000, corresponding to 42% of the total digital TV base.
The number of fixed-line telephony RGUs was 252,000, down
8,000 compared with the preceding quarter, which is both due to the underlying decline in the market and smaller pricing activities in the telephony subscriber base during the second quarter.
Consumer ARPU
Consumer ARPU amounted to SEK 378, an increase of SEK 8 compared to the preceding quarter explained by the pricing activities in the first quarter.
Unique B2B subscribers
The number of unique B2B subscribers was 46,000 at the end of the quarter with a continued growth of the high margin OnNet subscribers by 500, offset by a decline in the legacy OffNet business of 2,000 subscribers.
B2B ARPU
B2B ARPU was SEK 487 in the quarter, compared to SEK 455 in the preceding quarter explained by higher ARPU in the growing OnNet subscriber base.
9 Interim Report Q2 | April-June 2018
COM HEM SEGMENT COM HEM
OVERVIEW PER OPERATING SEGMENT
APR-JUN / Q2 JAN-JUN / 6 MONTHS JAN-DEC
Financial summary, SEKm 2018 2017 Change 2018 2017 Change 2017 Revenue external
Consumer 1,121 1,074 4.3% 2,214 2,118 4.5% 4,287
- of which Digital TV 479 475 1.0% 950 941 0.9% 1,886 -of which Broadband 572 518 10.4% 1,123 1,012 11.0% 2,079
- of which Fixed Telephony 44 51 -13.6% 88 104 -15.4% 199
Network operator 216 213 1.5% 428 409 4.7% 842 B2B 69 71 -3.3% 135 145 -7.1% 280 Other revenue 6 6 -5.2% 9 14 -31.2% 22
Revenue 1,411 1,364 3.5% 2,785 2,685 3.7% 5,431 Underlying EBITDA 674 648 4.0% 1,335 1,277 4.6% 2,603
Underlying EBITDA margin, % 47.7 47.5 0.3 p.p. 47.9 47.5 0.4 p.p. 47.9 Total capital expenditure -225 -266 -15.5% -469 -493 -4.9% -963
Operating free cash flow 449 382 17.7% 867 784 10.6% 1,640
Comparison between second quarter 2018 and second quarter 2017, unless otherwise stated.
Revenue
Revenue for the Com Hem Segment rose by 3.5% in the second quarter compared to the same period last year and amounted to SEK 1,411m. For the first six months revenue rose by 3.7% to SEK
2,785m. The increase is mainly the result of a continued growth in consumer services, driven by volume and price, as well as growth in the Network operator services relating to higher revenue from network expansion.
Consumer Services
Revenue from consumer services rose by 4.3% to a total of SEK
1,121m for the second quarter. The increase is driven by increased revenue from primarily broadband and to some extent digital TV, partly offset by decreased revenue from fixed telephony.
Revenue from broadband services, which rose by 10.4% for the quarter, is attributable to RGU growth, an improved speed mix and price adjustments implemented in the first quarter.
Revenue from digital TV, which rose by 1.0% for the quarter, is attributable to both volume and price adjustments implemented in the first quarter.
Revenue from fixed telephony decreased by SEK 7m for the quarter. The decrease is mainly explained by a structural decline in fixed telephony.
Network Operator Services
Revenue from network operator services increased by 1.5% and amounted to SEK 216m for the second quarter. The increase was attributable to higher revenue from network expansion and growth in communication operator revenue from iTUX. The increase was partly offset by a continued decline in landlord revenue within MDUs due to price pressure.
Business to Business
Revenue from B2B services declined by SEK 2m to SEK 69m for the second quarter, which is explained by declining revenue from the lower margin legacy OffNet business. For the quarter, OnNet revenue grew by 31.7% and amounted to SEK 38m, resulting in OnNet revenue now exceeding the low margin Offnet revenue.
Underlying EBITDA
Underlying EBITDA rose by 4.0% for the Com Hem Segment reaching SEK 674m and the underlying EBITDA margin was 47.7% for the second quarter. For the first six months, underlying EBITDA rose by 4.6% reaching SEK 1,335m. The increase in underlying EBITDA is explained by revenue growth, partly with somewhat lower margin as proportion of revenue with lower gross margin within third party infrastructure increases, as well as savings in operating costs.
Capital expenditure (Capex)
For the quarter, capital expenditure amounted to SEK 225m, corresponding to 15.9% of revenue. For the first six months, capital expenditure amounted to SEK 469m, 16.8% of revenue. The decrease compared to the second quarter 2017 is due to temporarily lower network related capex and lower investments in CPEs in the quarter.
Operating free cash flow
Operating free cash flow increased by 17.7% reaching SEK 449m in the second quarter. The increase is due to higher underlying EBITDA contribution and lower investments compared to last year. For the first six months operating free cash flow increased by 10.6% reaching SEK 867m.
10 Interim Report Q2 | April-June 2018
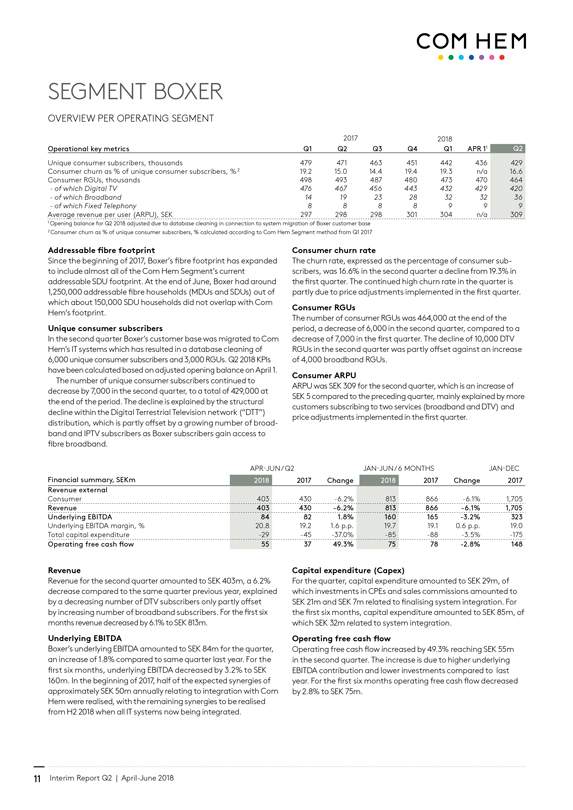
COM HEM
SEGMENT
BOXER OVERVIEW PER OPERATING SEGMENT
2017 2018
Operational key metrics Q1 Q2 Q3 Q4 Q1 APR 11 Q2
Unique consumer subscribers, thousands 479 471 463 451 442 436 429 Consumer churn as % of unique consumer subscribers, % 2 19.2 15.0 14.4 19.4 19.3 n/a 16.6 Consumer RGUs, thousands 498 493 487 480 473 470 464
- of which Digital TV 476 467 456 443 432 429 420 - of which Broadband 14 19 23 28 32 32 36 - of which Fixed Telephony 8 8 8 8 9 9 9
Average revenue per user (ARPU), SEK 297 298 298 301 304 n/a 309
1 Opening balance for Q2 2018 adjusted due to database cleaning in connection to system migration of Boxer customer base
2 Consumer churn as % of unique consumer subscribers, % calculated according to Com Hem Segment method from Q1 2017
Addressable fibre footprint
Since the beginning of 2017, Boxer’s fibre footprint has expanded to include almost all of the Com Hem Segment’s current addressable SDU footprint. At the end of June, Boxer had around
1,250,000 addressable fibre households (MDUs and SDUs) out of which about 150,000 SDU households did not overlap with Com Hem’s footprint.
Unique consumer subscribers
In the second quarter Boxer’s customer base was migrated to Com
Hem’s IT systems which has resulted in a database cleaning of
6,000 unique consumer subscribers and 3,000 RGUs. Q2 2018 KPIs have been calculated based on adjusted opening balance on April 1.
The number of unique consumer subscribers continued to decrease by 7,000 in the second quarter, to a total of 429,000 at the end of the period. The decline is explained by the structural decline within the Digital Terrestrial Television network (“DTT”) distribution, which is partly offset by a growing number of broad-band and IPTV subscribers as Boxer subscribers gain access to fibre broadband.
Consumer churn rate
The churn rate, expressed as the percentage of consumer subscribers, was 16.6% in the second quarter a decline from 19.3% in the first quarter. The continued high churn rate in the quarter is partly due to price adjustments implemented in the first quarter.
Consumer RGUs
The number of consumer RGUs was 464,000 at the end of the period, a decrease of 6,000 in the second quarter, compared to a decrease of 7,000 in the first quarter. The decline of 10,000 DTV RGUs in the second quarter was partly offset against an increase of 4,000 broadband RGUs.
Consumer ARPU
ARPU was SEK 309 for the second quarter, which is an increase of SEK 5 compared to the preceding quarter, mainly explained by more customers subscribing to two services (broadband and DTV) and price adjustments implemented in the first quarter.
APR-JUN / Q2 JAN-JUN / 6 MONTHS JAN-DEC
Financial summary, SEKm 2018 2017 Change 2018 2017 Change 2017 Revenue external
Consumer 403 430 -6.2% 813 866 -6.1% 1,705
Revenue 403 430 -6.2% 813 866 -6.1% 1,705 Underlying EBITDA 84 82 1.8% 160 165 -3.2% 323
Underlying EBITDA margin, % 20.8 19.2 1.6 p.p. 19.7 19.1 0.6 p.p. 19.0 Total capital expenditure -29 -45 -37.0% -85 -88 -3.5% -175
Operating free cash flow 55 37 49.3% 75 78 -2.8% 148
Revenue
Revenue for the second quarter amounted to SEK 403m, a 6.2% decrease compared to the same quarter previous year, explained by a decreasing number of DTV subscribers only partly offset
by increasing number of broadband subscribers. For the first six months revenue decreased by 6.1% to SEK 813m.
Underlying EBITDA
Boxer’s underlying EBITDA amounted to SEK 84m for the quarter, an increase of 1.8% compared to same quarter last year. For the first six months, underlying EBITDA decreased by 3.2% to SEK
160m. In the beginning of 2017, half of the expected synergies of approximately SEK 50m annually relating to integration with Com Hem were realised, with the remaining synergies to be realised from H2 2018 when all IT systems now being integrated.
Capital expenditure (Capex)
For the quarter, capital expenditure amounted to SEK 29m, of which investments in CPEs and sales commissions amounted to SEK 21m and SEK 7m related to finalising system integration. For the first six months, capital expenditure amounted to SEK 85m, of which SEK 32m related to system integration.
Operating free cash flow
Operating free cash flow increased by 49.3% reaching SEK 55m in the second quarter. The increase is due to higher underlying EBITDA contribution and lower investments compared to last year. For the first six months operating free cash flow decreased by 2.8% to SEK 75m.
11 Interim Report Q2 | April-June 2018
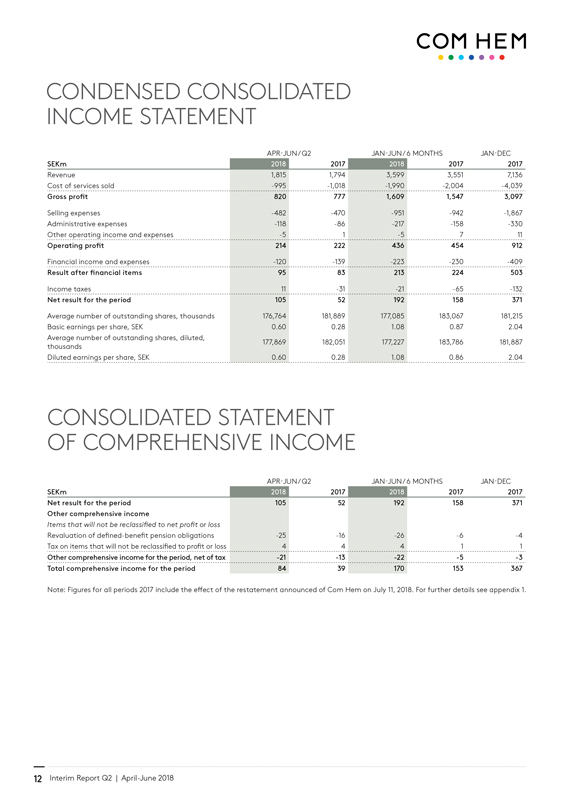
COM HEM CONDENSED CONSOLIDATED INCOME STATEMENT
APR-JUN/Q2 JAN-JUN/6 MONTHS JAN-DEC
SEKm 2018 2017 2018 2017 2017
Revenue 1,815 1,794 3,599 3,551 7,136 Cost of services sold -995 -1,018 -1,990 -2,004 -4,039
Gross profit 820 777 1,609 1,547 3,097
Selling expenses -482 -470 -951 -942 -1,867 Administrative expenses -118 -86 -217 -158 -330 Other operating income and expenses -5 1 -5 7 11
Operating profit 214 222 436 454 912
Financial income and expenses -120 -139 -223 -230 -409
Result after financial items 95 83 213 224 503
Income taxes 11 -31 -21 -65 -132
Net result for the period 105 52 192 158 371
Average number of outstanding shares, thousands 176,764 181,889 177,085 183,067 181,215 Basic earnings per share, SEK 0.60 0.28 1.08 0.87 2.04 Average number of outstanding shares, diluted, thousands 177,869 182,051 177,227 183,786 181,887 Diluted earnings per share, SEK 0.60 0.28 1.08 0.86 2.04
CONSOLIDATED STATEMENT OF COMPREHENSIVE INCOME
APR-JUN/Q2 JAN-JUN/6 MONTHS JAN-DEC
SEKm 2018 2017 2018 2017 2017 Net result for the period 105 52 192 158 371 Other comprehensive income
Items that will not be reclassified to net profit or loss
Revaluation of defined-benefit pension obligations -25 -16 -26 -6 -4 Tax on items that will not be reclassified to profit or loss 4 4 4 1 1
Other comprehensive income for the period, net of tax -21 -13 -22 -5 -3 Total comprehensive income for the period 84 39 170 153 367
Note: Figures for all periods 2017 include the effect of the restatement announced of Com Hem on July 11, 2018. For further details see appendix 1.
12 Interim Report Q2 | April-June 2018
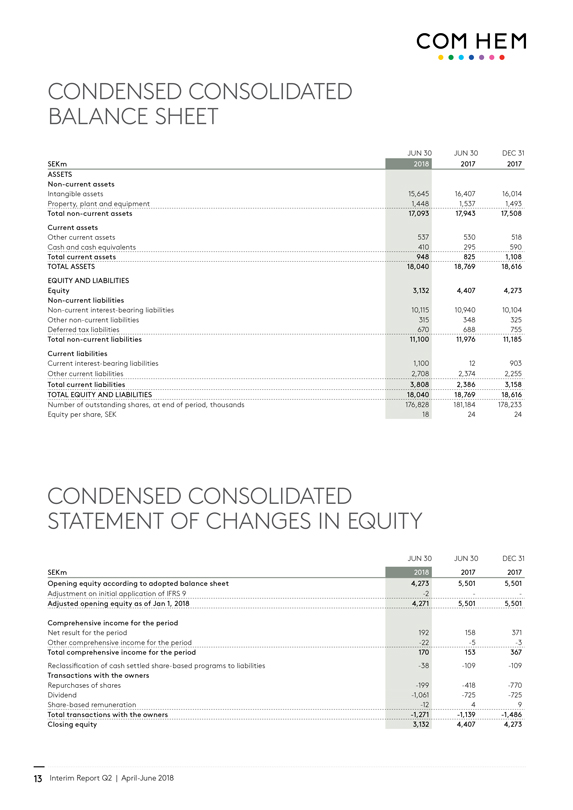
COM HEM CONDENSED CONSOLIDATED BALANCE SHEET
JUN 30 JUN 30 DEC 31
SEKm 2018 2017 2017 ASSETS
Non-current assets
Intangible assets 15,645 16,407 16,014 Property, plant and equipment 1,448 1,537 1,493
Total non-current assets 17,093 17,943 17,508 Current assets
Other current assets 537 530 518 Cash and cash equivalents 410 295 590
Total current assets 948 825 1,108 TOTAL ASSETS 18,040 18,769 18,616 EQUITY AND LIABILITIES
Equity 3,132 4,407 4,273 Non-current liabilities
Non-current interest-bearing liabilities 10,115 10,940 10,104 Other non-current liabilities 315 348 325 Deferred tax liabilities 670 688 755
Total non-current liabilities 11,100 11,976 11,185 Current liabilities
Current interest-bearing liabilities 1,100 12 903 Other current liabilities 2,708 2,374 2,255
Total current liabilities 3,808 2,386 3,158 TOTAL EQUITY AND LIABILITIES 18,040 18,769 18,616
Number of outstanding shares, at end of period, thousands 176,828 181,184 178,233 Equity per share, SEK 18 24 24
CONDENSED CONSOLIDATED STATEMENT OF CHANGES IN EQUITY
JUN 30 JUN 30 DEC 31
SEKm 2018 2017 2017 Opening equity according to adopted balance sheet 4,273 5,501 5,501
Adjustment on initial application of IFRS 9 -2 - -
Adjusted opening equity as of Jan 1, 2018 4,271 5,501 5,501
Comprehensive income for the period
Net result for the period 192 158 371 Other comprehensive income for the period -22 -5 -3
Total comprehensive income for the period 170 153 367
Reclassification of cash settled share-based programs to liabilities -38 -109 -109
Transactions with the owners
Repurchases of shares -199 -418 -770 Dividend -1,061 -725 -725 Share-based remuneration -12 4 9
Total transactions with the owners -1,271 -1,139 -1,486 Closing equity 3,132 4,407 4,273
13 Interim Report Q2 | April-June 2018
COM HEM
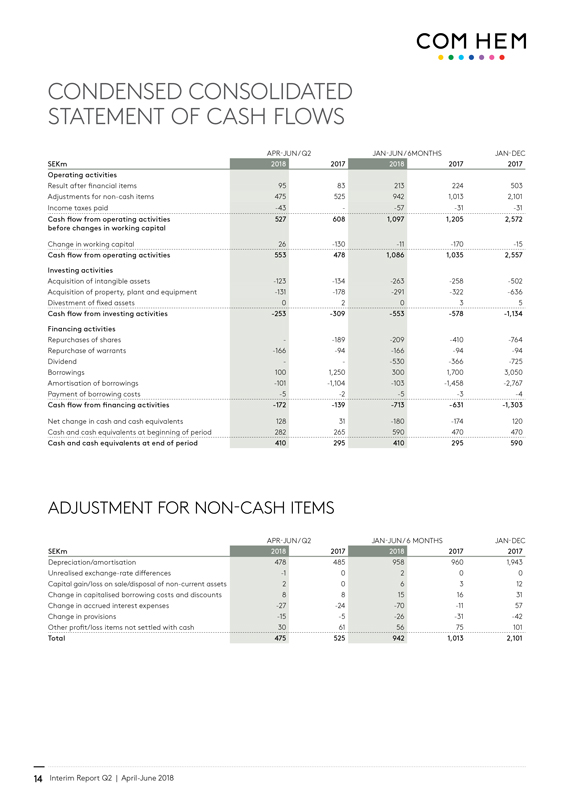
CONDENSED CONSOLIDATED STATEMENT OF CASH FLOWS
APR-JUN / Q2 JAN-JUN / 6MONTHS JAN-DEC
SEKm 2018 2017 2018 2017 2017 Operating activities
Result after financial items 95 83 213 224 503 Adjustments for non-cash items 475 525 942 1,013 2,101 Income taxes paid -43 - 57 -31 -31
Cash flow from operating activities 527 608 1,097 1,205 2,572 before changes in working capital
Change in working capital 26 -130 -11 -170 -15
Cash flow from operating activities 553 478 1,086 1,035 2,557
Investing activities
Acquisition of intangible assets -123 -134 -263 -258 -502 Acquisition of property, plant and equipment -131 -178 -291 -322 -636 Divestment of fixed assets 0 2 0 3 5
Cash flow from investing activities -253 -309 -553 -578 -1,134
Financing activities
Repurchases of shares - -189 -209 -410 -764 Repurchase of warrants -166 -94 -166 -94 -94 Dividend - - -530 -366 -725 Borrowings 100 1,250 300 1,700 3,050 Amortisation of borrowings -101 -1,104 -103 -1,458 -2,767 Payment of borrowing costs -5 -2 -5 -3 -4
Cash flow from financing activities -172 -139 -713 -631 -1,303
Net change in cash and cash equivalents 128 31 -180 -174 120 Cash and cash equivalents at beginning of period 282 265 590 470 470
Cash and cash equivalents at end of period 410 295 410 295 590
ADJUSTMENT FOR NON-CASH ITEMS
APR-JUN / Q2 JAN-JUN / 6 MONTHS JAN-DEC
SEKm 2018 2017 2018 2017 2017
Depreciation/amortisation 478 485 958 960 1,943 Unrealised exchange-rate differences -1 0 2 0 0 Capital gain/loss on sale/disposal of non-current assets 2 0 6 3 12 Change in capitalised borrowing costs and discounts 8 8 15 16 31 Change in accrued interest expenses -27 -24 -70 -11 57 Change in provisions -15 -5 -26 -31 -42 Other profit/loss items not settled with cash 30 61 56 75 101
Total 475 525 942 1,013 2,101
14 Interim Report Q2 | April-June 2018
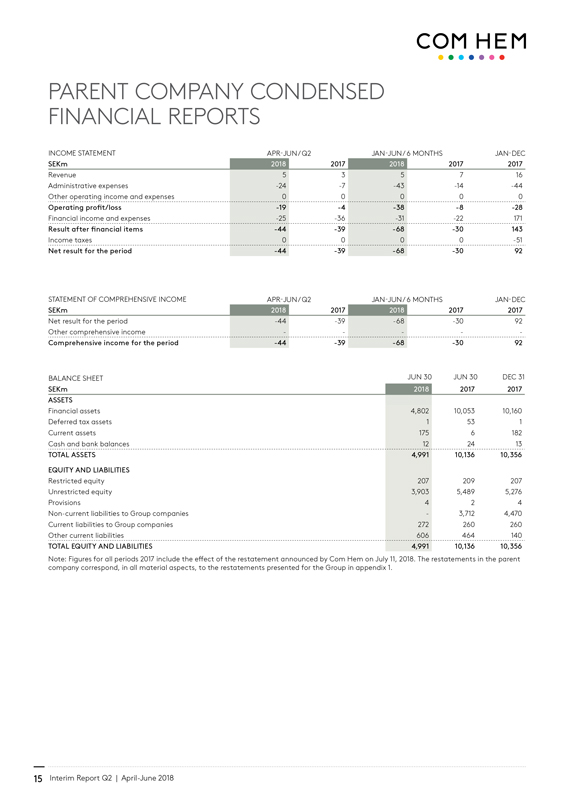
COM HEM PARENT COMPANY CONDENSED FINANCIAL REPORTS
INCOME STATEMENT APR-JUN / Q2 JAN-JUN / 6 MONTHS JAN-DEC
SEKm 2018 2017 2018 2017 2017
Revenue 5 3 5 7 16 Administrative expenses -24 -7 -43 -14 -44 Other operating income and expenses 0 0 0 0 0
Operating profit/loss -19 -4 -38 -8 -28
Financial income and expenses -25 -36 -31 -22 171
Result after financial items -44 -39 -68 -30 143
Income taxes 0 0 0 0 -51
Net result for the period -44 -39 -68 -30 92
STATEMENT OF COMPREHENSIVE INCOME APR-JUN / Q2 JAN-JUN / 6 MONTHS JAN-DEC
SEKm 2018 2017 2018 2017 2017
Net result for the period -44 -39 -68 -30 92 Other comprehensive income - - - - -
Comprehensive income for the period -44 -39 -68 -30 92
BALANCE SHEET JUN 30 JUN 30 DEC 31
SEKm 2018 2017 2017 ASSETS
Financial assets 4,802 10,053 10,160 Deferred tax assets 1 53 1 Current assets 175 6 182 Cash and bank balances 12 24 13
TOTAL ASSETS 4,991 10,136 10,356
EQUITY AND LIABILITIES
Restricted equity 207 209 207 Unrestricted equity 3,903 5,489 5,276 Provisions 4 2 4 Non-current liabilities to Group companies -3,712 4,470 Current liabilities to Group companies 272 260 260 Other current liabilities 606 464 140
TOTAL EQUITY AND LIABILITIES 4,991 10,136 10,356
Note: Figures for all periods 2017 include the effect of the restatement announced by Com Hem on July 11, 2018. The restatements in the parent company correspond, in all material aspects, to the restatements presented for the Group in appendix 1.
15 Interim Report Q2 | April-June 2018
COM HEM OTHER INFORMATION
Com Hem Holding AB (publ) is a Swedish limited liability company (Corp. ID. No. 556858-6613), with its registered office in Stockholm, Sweden. Com Hem’s shares are listed on Nasdaq Stockholm, Large Cap.
Accounting policies
The consolidated financial statements are prepared in accordance with International Financial Reporting Standards (“IFRS”) as adopted by the EU and described in the Group’s 2017 Annual Report and
in appendix 1 to this interim report. The Group and its subsidiaries’ functional currency is the Swedish krona (SEK), which is also the presentation currency of the Group. All amounts have been rounded to the nearest million (SEKm), unless otherwise stated. The interim report for the Group has been prepared in accordance with IAS 34 Interim Financial Reporting and the Annual Accounts Act. Condensed financial statements for the Parent Company have been prepared in accordance with the Annual Accounts Act and RFR 2 Accounting for Legal Entities. Disclosures in accordance
with IAS 34.16A are incorporated in the financial statements and its accompanying notes or in other parts of this interim report.
Changes in accounting policies 2018
The Group has adopted IFRS 9 Financial instruments and IFRS 15
Revenue from Contracts with Customers as of January 1, 2018. The effects of the new standards are stated below.
IFRS 9 contains new requirements for the classification and measurement of financial instruments, introducing an impairment model that is based on expected credit losses instead of losses occurred, and changes of principles for hedge accounting with the purpose among other things as simplification and increasing the consistency with the company´s internal risk management strategy. The standard replaces IAS 39 Financial instruments: Recognition and measurement.
The new impairment model results in earlier recognition
of credit losses in connection to collection of mainly account receivables and other receivables. A provision will is made for all receivables (not only the ones that objectively indicate need for impairment) corresponding to credit losses expected to occur within the remaining period. IFRS 9 has been applied from January
1, 2018, and has resulted in an increase of the credit loss allowance of SEK 2m and a corresponding adjustment of equity including
tax effect.
IFRS 15 is a comprehensive standard for determining the amount of revenue to be recorded and when these revenues are to be recorded. IFRS 15 replaces IAS 18 Revenue, IAS 11 Construction Contracts and IFRIC 13 Customer Loyalty Programmes from 2018. The introduction of IFRS 15 has not had any effects on the Group’s financial statements in addition to increased disclosure requirements. See table disaggregation of revenue below.
New IFRS not yet applied
IFRS 16 Leases will replace the existing IFRSs related to accounting of leases, such as IAS 17 Leases and IFRIC 4 Determining whether an agreement contains a lease. The Group will apply the new standard from January 1, 2019.
IFRS 16 mostly affects lessees and the central effect is that all leasing agreements that today are accounted for as operating lease agreements shall be accounted in a similar way as financial lease agreements provided that they meet the requirements to be reported as a lease in accordance with IFRS 16. The standard provides a single lessee accounting model for all leases unless the lease term is 12 months or less or the underlying asset has a low
value. This means that for operating leases an asset and
liability will have to be recognised, including recognition of depreciation, amortisation and interest, in comparison with today when there is no recognition for a leased asset and related liability, and the rental expense recognized as a straight-line expense. The Group has completed the initial assessment of the potential effects on the financial statements, but has not yet finalised the more detailed analysis. The most significant impact identified so far is that the
Group will need to report new assets and liabilities for its operational leasing agreements relating to infrastructure, which will effect, among other things, the key ratios EBITDA and capex.
Alternative Performance Measures (APM)
The Group applies the guidelines issued by ESMA (European Securities and Markets Authority) on APMs. An APM is understood as a financial measure of historical or future financial performance, financial position, or cash flows, other than a financial measure defined or specified in the applicable financial reporting frame- work. APMs presented in these interim financial statements should not be considered as a substitute for measures of performance in accordance with IFRS and may not be comparable to similarly titled measures by other companies. The APMs presented in the interim report have been reconciled to the most directly reconcilable line items in the financial statements and appears in the sections Group financial overview and overview per operating segment.
Adjustments
Certain financial information and other amounts and percentages presented in this report have been rounded and therefore the tables may not tally. The abbreviation “n/m” (“not meaningful”) is used in this report if the information is not relevant and “n/a” (“not available”) is used if the information is not available.
Fair value of financial instruments
The fair value of the Group’s financial assets and liabilities are estimated to be equal to the carrying amounts except for outstanding notes. The carrying amount for the notes amounts to SEK 3,963m and the fair value was SEK 4,108m.
Related parties
For information regarding related parties, see the Group’s Annual report 2017, page 63. There have been no significant transactions during the year, in excess of paid dividend and repurchase of warrants. Repurchase of warrants from related parties (board members and executive management) occured in April at market value totalling SEK 137m. For more information regarding the repurchase of warrants see section “Incentive programmes” below.
Risks and uncertainties
The Group and the Parent Company have identified a number of operational and financial risks. Operational risks include increased competition, changes to laws and regulations, the ability to retain and attract key employees, substitution from fixed to mobile telephony, technological advances, network and IT infrastructure,
the ability to retain and attract customers, programme content, risks associated with suppliers, corruption and unethical business practices, environment risks and risks associated with responsible procurement. Financial risks include refinancing, liquidity, credit, interest rate, and currency risks. For a detailed description of the significant risk factors for the Group’s future development, see the Group’s 2017
Annual Report. The Group believes that the risk environment has not materially changed from the description in the 2017 Annual Report.
16 Interim Report Q2 | April-June 2018
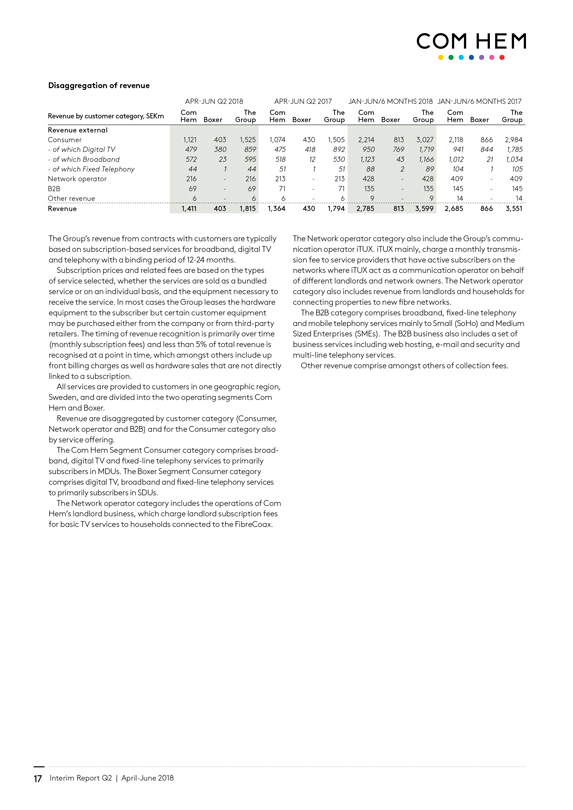
COM HEM Disaggregation of revenue
APR-JUN Q2 2018 APR-JUN Q2 2017 JAN-JUN/6 MONTHS 2018 JAN-JUN/6 MONTHS 2017
Com The Com The Com The Com The Revenue by customer category, SEKm Hem Boxer Group Hem Boxer Group Hem Boxer Group Hem Boxer Group
Revenue external
Consumer 1,121 403 1,525 1,074 430 1,505 2,214 813 3,027 2,118 866 2,984
- of which Digital TV 479 380 859 475 418 892 950 769 1,719 941 844 1,785 - of which Broadband 572 23 595 518 12 530 1,123 43 1,166 1,012 21 1,034
- of which Fixed Telephony 44 1 44 51 1 51 88 2 89 104 1 105
Network operator 216 -216 213 - 213 428 - 428 409- 409 B2B 69- 69 71 - 71 135- 135 145- 145 Other revenue 6- 6 6- 6 9- 9 14- 14
Revenue 1,411 403 1,815 1,364 430 1,794 2,785 813 3,599 2,685 866 3,551
The Group’s revenue from contracts with customers are typically based on subscription-based services for broadband, digital TV and telephony with a binding period of 12-24 months.
Subscription prices and related fees are based on the types of service selected, whether the services are sold as a bundled service or on an individual basis, and the equipment necessary to receive the service. In most cases the Group leases the hardware equipment to the subscriber but certain customer equipment may be purchased either from the company or from third-party retailers. The timing of revenue recognition is primarily over time (monthly subscription fees) and less than 5% of total revenue is recognised at a point in time, which amongst others include up front billing charges as well as hardware sales that are not directly linked to a subscription.
All services are provided to customers in one geographic region, Sweden, and are divided into the two operating segments Com Hem and Boxer.
Revenue are disaggregated by customer category (Consumer, Network operator and B2B) and for the Consumer category also by service offering.
The Com Hem Segment Consumer category comprises broadband, digital TV and fixed-line telephony services to primarily subscribers in MDUs. The Boxer Segment Consumer category comprises digital TV, broadband and fixed-line telephony services to primarily subscribers in SDUs.
The Network operator category includes the operations of Com Hem’s landlord business, which charge landlord subscription fees for basic TV services to households connected to the FibreCoax.
The Network operator category also include the Group’s communication operator iTUX. iTUX mainly, charge a monthly transmission fee to service providers that have active subscribers on the networks where iTUX act as a communication operator on behalf of different landlords and network owners. The Network operator category also includes revenue from landlords and households for connecting properties to new fibre networks.
The B2B category comprises broadband, fixed-line telephony and mobile telephony services mainly to Small (SoHo) and Medium Sized Enterprises (SMEs). The B2B business also includes a set of business services including web hosting, e-mail and security and multi-line telephony services.
Other revenue comprise amongst others of collection fees.
17 Interim Report Q2 | April-June 2018
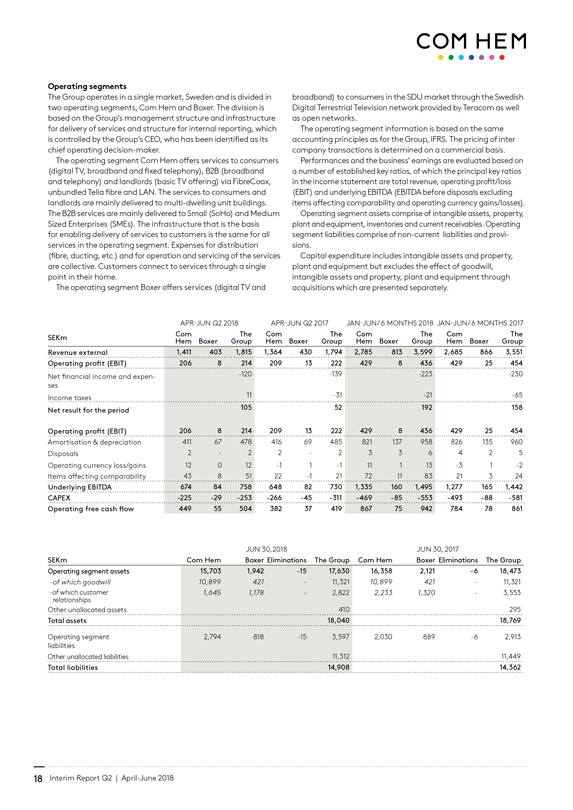
COM HEM Operating segments
The Group operates in a single market, Sweden and is divided in two operating segments, Com Hem and Boxer. The division is based on the Group’s management structure and infrastructure for delivery of services and structure for internal reporting, which is controlled by the Group’s CEO, who has been identified as its chief operating decision-maker.
The operating segment Com Hem offers services to consumers
(digital TV, broadband and fixed telephony), B2B (broadband and telephony) and landlords (basic TV offering) via FibreCoax, unbundled Telia fibre and LAN. The services to consumers and landlords are mainly delivered to multi-dwelling unit buildings.
The B2B services are mainly delivered to Small (SoHo) and Medium
Sized Enterprises (SMEs). The infrastructure that is the basis
for enabling delivery of services to customers is the same for all services in the operating segment. Expenses for distribution
(fibre, ducting, etc.) and for operation and servicing of the services are collective. Customers connect to services through a single point in their home.
The operating segment Boxer offers services (digital TV and
broadband) to consumers in the SDU market through the Swedish Digital Terrestrial Television network provided by Teracom as well as open networks.
The operating segment information is based on the same accounting principles as for the Group, IFRS. The pricing of inter company transactions is determined on a commercial basis.
Performances and the business’ earnings are evaluated based on a number of established key ratios, of which the principal key ratios in the income statement are total revenue, operating profit/loss (EBIT) and underlying EBITDA (EBITDA before disposals excluding items affecting comparability and operating currency gains/losses).
Operating segment assets comprise of intangible assets, property, plant and equipment, inventories and current receivables. Operating segment liabilities comprise of non-current liabilities and provisions.
Capital expenditure includes intangible assets and property, plant and equipment but excludes the effect of goodwill, intangible assets and property, plant and equipment through acquisitions which are presented separately.
APR-JUN Q2 2018 APR-JUN Q2 2017 JAN-JUN/ 6 MONTHS 2018 JAN-JUN/ 6 MONTHS 2017
Com The Com The Com The Com The SEKm Hem Boxer Group Hem Boxer Group Hem Boxer Group Hem Boxer Group Revenue external 1,411 403 1,815 1,364 430 1,794 2,785 813 3,599 2,685 866 3,551 Operating profit (EBIT) 206 8 214 209 13 222 429 8 436 429 25 454
Net financial income and expenses Income taxes -120 -139 -223 -230 11 -31 -21 -65
Net result for the period 105 52 192 158
Operating profit (EBIT) 206 8 214 209 13 222 429 8 436 429 25 454
Amortisation & depreciation 411 67 478 416 69 485 821 137 958 826 135 960 Disposals 2 - 2 2 - 2 3 3 6 4 2 5 Operating currency loss/gains 12 0 12 -1 1 -1 11 1 13 -3 1 -2 Items affecting comparability 43 8 51 22 -1 21 72 11 83 21 3 24
Underlying EBITDA 674 84 758 648 82 730 1,335 160 1,495 1,277 165 1,442 CAPEX -225 -29 -253 -266 -45 -311 -469 -85 -553 -493 -88 -581 Operating free cash flow 449 55 504 382 37 419 867 75 942 784 78 861
JUN 30,2018 JUN 30, 2017
SEKm Com Hem Boxer Eliminations The Group Com Hem Boxer Eliminations The Group Operating segment assets 15,703 1,942 -15 17,630 16,358 2,121 -6 18,473
-of which goodwill 10,899 421 - 11,321 10,899 421 - 11,321 -of which customer 1,645 1,178-2,822 2,233 1,320-3,553 relationships
Other unallocated assets 410 295
Total assets 18,040 18,769
Operating segment 2,794 818 -15 3,597 2,030 889 -6 2,913 liabilities Other unallocated liabilities 11,312 11,449
Total liabilities 14,908 14,362
18 Interim Report Q2 | April-June 2018
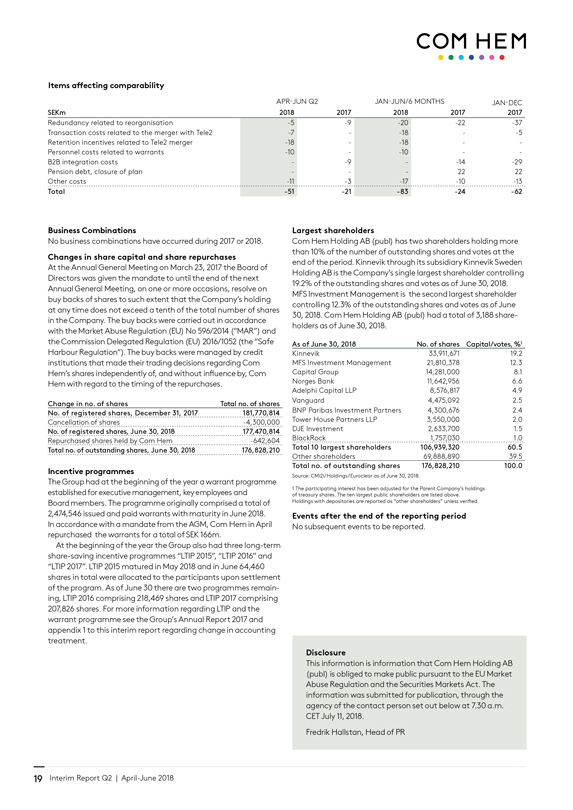
COM HEM Items affecting comparability
APR-JUN Q2 JAN-JUN/6 MONTHS JAN-DEC
SEKm 2018 2017 2018 2017 2017
Redundancy related to reorganisation -5 -9 -20 -22 -37 Transaction costs related to the merger with Tele2 -7 - -18 - -5 Retention incentives related to Tele2 merger -18 - -18 - - Personnel costs related to warrants -10 - -10 - - B2B integration costs - -9 - -14 -29 Pension debt, closure of plan - - - 22 22 Other costs -11 -3 -17 -10 -13
Total -51 -21 -83 -24 -62
Business Combinations
No business combinations have occurred during 2017 or 2018.
Changes in share capital and share repurchases
At the Annual General Meeting on March 23, 2017 the Board of Directors was given the mandate to until the end of the next Annual General Meeting, on one or more occasions, resolve on buy backs of shares to such extent that the Company’s holding
at any time does not exceed a tenth of the total number of shares in the Company. The buy backs were carried out in accordance with the Market Abuse Regulation (EU) No 596/2014 (“MAR”) and the Commission Delegated Regulation (EU) 2016/1052 (the “Safe Harbour Regulation”). The buy backs were managed by credit institutions that made their trading decisions regarding Com Hem’s shares independently of, and without influence by, Com Hem with regard to the timing of the repurchases.
Change in no. of shares Total no. of shares
No. of registered shares, December 31, 2017 181,770,814
Cancellation of shares -4,300,000
No. of registered shares, June 30, 2018 177,470,814
Repurchased shares held by Com Hem -642,604
Total no. of outstanding shares, June 30, 2018 176,828,210
Incentive programmes
The Group had at the beginning of the year a warrant programme established for executive management, key employees and
Board members. The programme originally comprised a total of
2,474,546 issued and paid warrants with maturity in June 2018.
In accordance with a mandate from the AGM, Com Hem in April repurchased the warrants for a total of SEK 166m.
At the beginning of the year the Group also had three long-term share-saving incentive programmes “LTIP 2015”, “LTIP 2016” and “LTIP 2017”. LTIP 2015 matured in May 2018 and in June 64,460 shares in total were allocated to the participants upon settlement of the program. As of June 30 there are two programmes remaining, LTIP 2016 comprising 218,469 shares and LTIP 2017 comprising
207,826 shares. For more information regarding LTIP and the warrant programme see the Group’s Annual Report 2017 and appendix 1 to this interim report regarding change in accounting treatment.
Largest shareholders
Com Hem Holding AB (publ) has two shareholders holding more than 10% of the number of outstanding shares and votes at the end of the period. Kinnevik through its subsidiary Kinnevik Sweden Holding AB is the Company’s single largest shareholder controlling
19.2% of the outstanding shares and votes as of June 30, 2018. MFS Investment Management is the second largest shareholder controlling 12.3% of the outstanding shares and votes as of June 30, 2018. Com Hem Holding AB (publ) had a total of 3,188 shareholders as of June 30, 2018.
As of June 30, 2018 No. of shares Capital/votes, %1
Kinnevik 33,911,671 19.2 MFS Investment Management 21,810,378 12.3 Capital Group 14,281,000 8.1 Norges Bank 11,642,956 6.6 Adelphi Capital LLP 8,576,817 4.9 Vanguard 4,475,092 2.5 BNP Paribas Investment Partners 4,300,676 2.4 Tower House Partners LLP 3,550,000 2.0 DJE Investment 2,633,700 1.5 BlackRock 1,757,030 1.0
Total 10 largest shareholders 106,939,320 60.5
Other shareholders 69,888,890 39.5
Total no. of outstanding shares 176,828,210 100.0
Source: CMi2i/Holdings /Euroclear as of June 30, 2018.
1 The participating interest has been adjusted for the Parent Company’s holdings of treasury shares. The ten largest public shareholders are listed above.
Holdings with depositories are reported as “other shareholders” unless verified.
Events after the end of the reporting period
No subsequent events to be reported.
Disclosure
This information is information that Com Hem Holding AB (publ) is obliged to make public pursuant to the EU Market Abuse Regulation and the Securities Markets Act. The information was submitted for publication, through the agency of the contact person set out below at 7.30 a.m. CET July 11, 2018.
Fredrik Hallstan, Head of PR
19 Interim Report Q2 | April-June 2018
COM HEM Board’s assurance
The Board of Directors and the CEO certify that the Interim Report gives a true and fair overview of the Parent Company’s and Group’s operations, their financial position and results of operations, and describes the material risks and uncertainties facing the Parent Company and other companies in the Group.
Stockholm, July 11, 2018
Monica Caneman
Board member
Eva Lindqvist
Board member
Marianne Bolin
Employee representative
Andrew Barron
Chairman
Thomas Ekman
Board member
Anders Nilsson
Board member and Chief Executive Officer
Tomas Kadura
Employee representative
Review report
Com Hem Holding AB, Corp. id. 556858-6613
Introduction
We have reviewed the condensed interim financial information (the interim report) of Com Hem Holding AB as of June 30, 2018 and the six-month period then ended. The Board of Directors and the Chief Executive Officer are responsible for the preparation and presentation of this interim report in accordance with IAS 34 and the Annual Accounts Act. Our responsibility is to express a conclusion on this interim report based on our review.
Scope of review
We conducted our review in accordance with International Standard on Review Engagements ISRE 2410 Review of Interim Financial Information Performed by the Independent Auditor of the Entity. A review of interim financial information consists of making inquiries, primarily of persons responsible for financial and accounting matters, and applying analytical and other review procedures. A review is substantially less in scope than an audit
conducted in accordance with International Standards on Auditing and other generally accepted auditing practices and consequently does not enable us to obtain assurance that we would become aware of all significant matters that might be identified in an audit. Accordingly, we do not express an audit opinion.
Conclusion
Based on our review, nothing has come to our attention that causes us to believe that the interim report is not prepared, in all material respects, for the Group in accordance with IAS 34 and
the Annual Accounts Act, and for the Parent Company in accordance with the Annual Accounts Act.
Stockholm July 11, 2018
KPMG AB
Tomas Gerhardsson
Authorized Public Accountant
20 Interim Report Q2 | April-June 2018
COM HEM INDUSTRY TERMS
Addressable households Number of households connected to our FibreCoax and FibreLAN networks, third party open networks, and connected and/or passed by fibre in networks unbundled by the Group.
RGUs Revenue generating units, which refer to each subscriber receiving basic or digital TV, broadband or telephony services from Com Hem, Boxer or Phonera.
A customer who has all three services is counted as three
RGUs but one unique subscriber.
ARPU Average monthly revenue per user for the referenced period. ARPU is calculated by dividing the monthly revenue for the respective period by the average number of unique consumer subscribers for that period. The average number of unique consumer subscribers is calculated as the number
of unique consumer subscribers on the first day in the respective period plus the number of unique consumer subscribers on the last day of the respective period, divided by two.
Churn The voluntary or involuntary discontinuance of services by a subscriber. From Q4 2016 cancellations are excluded.
SME Small and medium enterprises. Refers to offices with
10-99 employees.
SoHo Single office/Home office. Refers to offices with
1-9 employees.
Unique consumer subscribers Unique consumer subscribers represent the number of individual end-users who have subscribed for one or more of the Com Hem Group’s digital services (digital TV, broadband and fixed telephony). Com
Hem refers to the end-users receiving services directly through our own, third-party or unbundled networks as unique subscribers, even if the billing relationship for that end-user is with the end-user’s landlord or housing association.
21 Interim Report Q2 | April-June 2018
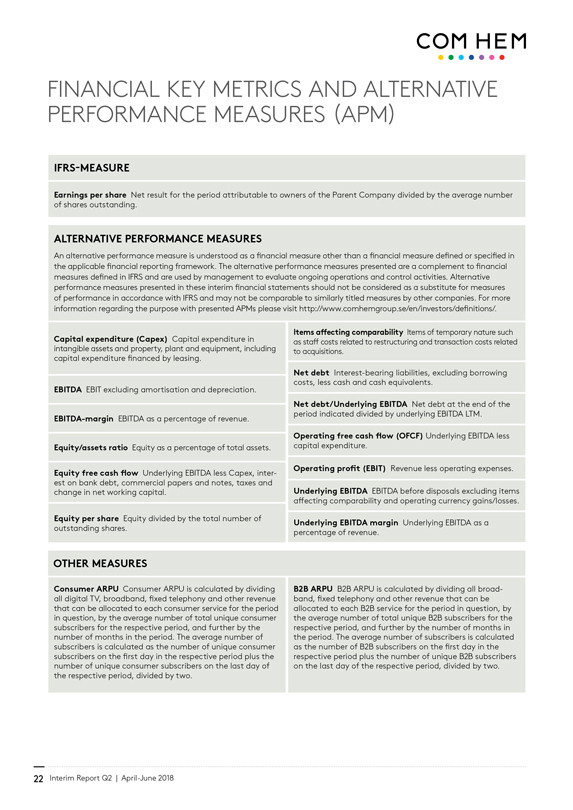
COM HEM FINANCIAL KEY METRICS AND ALTERNATIVE PERFORMANCE MEASURES (APM)
IFRS-MEASURE
Earnings per share Net result for the period attributable to owners of the Parent Company divided by the average number of shares outstanding.
ALTERNATIVE PERFORMANCE MEASURES
An alternative performance measure is understood as a financial measure other than a financial measure defined or specified in the applicable financial reporting framework. The alternative performance measures presented are a complement to financial measures defined in IFRS and are used by management to evaluate ongoing operations and control activities. Alternative performance measures presented in these interim financial statements should not be considered as a substitute for measures of performance in accordance with IFRS and may not be comparable to similarly titled measures by other companies. For more information regarding the purpose with presented APMs please visit http://www.comhemgroup.se/en/investors/definitions/.
Capital expenditure (Capex) Capital expenditure in intangible assets and property, plant and equipment, including capital expenditure financed by leasing.
EBITDA EBIT excluding amortisation and depreciation.
EBITDA-margin EBITDA as a percentage of revenue.
Items affecting comparability Items of temporary nature such as staff costs related to restructuring and transaction costs related to acquisitions.
Net debt Interest-bearing liabilities, excluding borrowing costs, less cash and cash equivalents.
Net debt/Underlying EBITDA Net debt at the end of the period indicated divided by underlying EBITDA LTM.
Equity/assets ratio Equity as a percentage of total assets.
Equity free cash flow Underlying EBITDA less Capex, inter- est on bank debt, commercial papers and notes, taxes and change in net working capital.
Equity per share Equity divided by the total number of outstanding shares.
Operating free cash flow (OFCF) Underlying EBITDA less capital expenditure.
Operating profit (EBIT) Revenue less operating expenses.
Underlying EBITDA EBITDA before disposals excluding items affecting comparability and operating currency gains/losses.
Underlying EBITDA margin Underlying EBITDA as a percentage of revenue.
OTHER MEASURES
Consumer ARPU Consumer ARPU is calculated by dividing all digital TV, broadband, fixed telephony and other revenue that can be allocated to each consumer service for the period in question, by the average number of total unique consumer subscribers for the respective period, and further by the number of months in the period. The average number of subscribers is calculated as the number of unique consumer subscribers on the first day in the respective period plus the number of unique consumer subscribers on the last day of the respective period, divided by two.
B2B ARPU B2B ARPU is calculated by dividing all broad- band, fixed telephony and other revenue that can be allocated to each B2B service for the period in question, by the average number of total unique B2B subscribers for the respective period, and further by the number of months in the period. The average number of subscribers is calculated as the number of B2B subscribers on the first day in the respective period plus the number of unique B2B subscribers on the last day of the respective period, divided by two.
22 Interim Report Q2 | April-June 2018
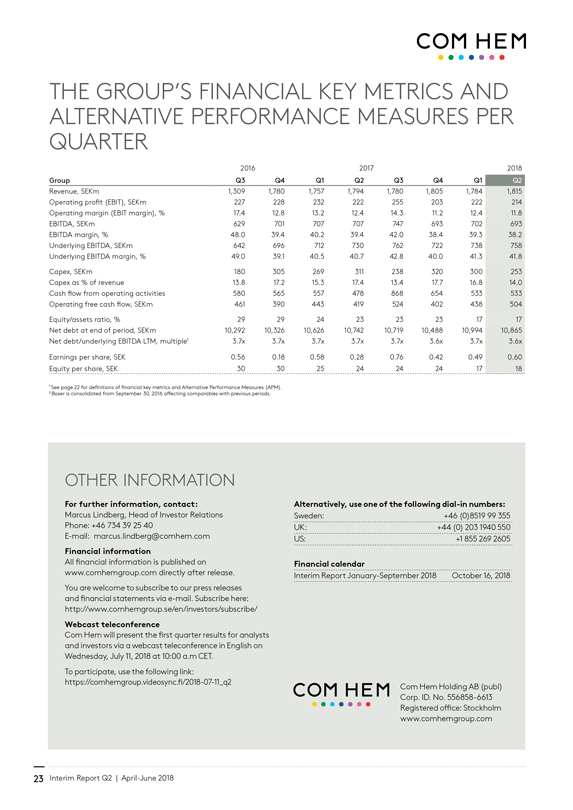
COM HEM THE GROUP’S FINANCIAL KEY METRICS AND ALTERNATIVE PERFORMANCE MEASURES PER QUARTER
2016 2017 2018
Group Q3 Q4 Q1 Q2 Q3 Q4 Q1 Q2
Revenue, SEKm 1,309 1,780 1,757 1,794 1,780 1,805 1,784
Operating profit (EBIT), SEKm 227 228 232 222 255 203 222
Operating margin (EBIT margin), % 17.4 12.8 13.2 12.4 14.3 11.2 12.4
EBITDA, SEKm 629 701 707 707 747 693 702
EBITDA margin, % 48.0 39.4 40.2 39.4 42.0 38.4 39.3
Underlying EBITDA, SEKm 642 696 712 730 762 722 738
Underlying EBITDA margin, % 49.0 39.1 40.5 40.7 42.8 40.0 41.3
Capex, SEKm 180 305 269 311 238 320 300
Capex as % of revenue 13.8 17.2 15.3 17.4 13.4 17.7 16.8
Cash flow from operating activities 580 565 557 478 868 654 533
Operating free cash flow, SEKm 461 390 443 419 524 402 438
Equity/assets ratio, % 29 29 24 23 23 23 17
Net debt at end of period, SEKm 10,292 10,326 10,626 10,742 10,719 10,488 10,994
Net debt/underlying EBITDA LTM, multiple1 3.7x 3.7x 3.7x 3.7x 3.7x 3.6x 3.7x
Earnings per share, SEK 0.56 0.18 0.58 0.28 0.76 0.42 0.49
Equity per share, SEK 30 30 25 24 24 24 17
1,815 214 11.8 693 38.2 758 41.8 253 14.0 533 504 17 10,865 3.6x 0.60 18
1 See page 22 for definitions of financial key metrics and Alternative Performance Measures (APM).
2 Boxer is consolidated from September 30, 2016 affecting comparables with previous periods.
OTHER INFORMATION
For further information, contact:
Marcus Lindberg, Head of Investor Relations
Phone: +46 734 39 25 40
E-mail: marcus.lindberg@comhem.com
Financial information
All financial information is published on www.comhemgroup.com directly after release.
You are welcome to subscribe to our press releases and financial statements via e-mail. Subscribe here: http://www.comhemgroup.se/en/investors/subscribe/
Webcast teleconference
Com Hem will present the first quarter results for analysts and investors via a webcast teleconference in English on Wednesday, July 11, 2018 at 10:00 a.m CET.
To participate, use the following link:
https://comhemgroup.videosync.fi/2018-07-11_q2
Alternatively, use one of the following dial-in numbers:
Sweden: +46 (0)8519 99 355
UK: +44 (0) 203 1940 550
US: +1 855 269 2605
Financial calendar
Interim Report January-September 2018 October 16, 2018
Com Hem Com Hem Holding AB (publ) Corp. ID. No. 556858-6613
Registered office: Stockholm www.comhemgroup.com
23 Interim Report Q2 | April-June 2018
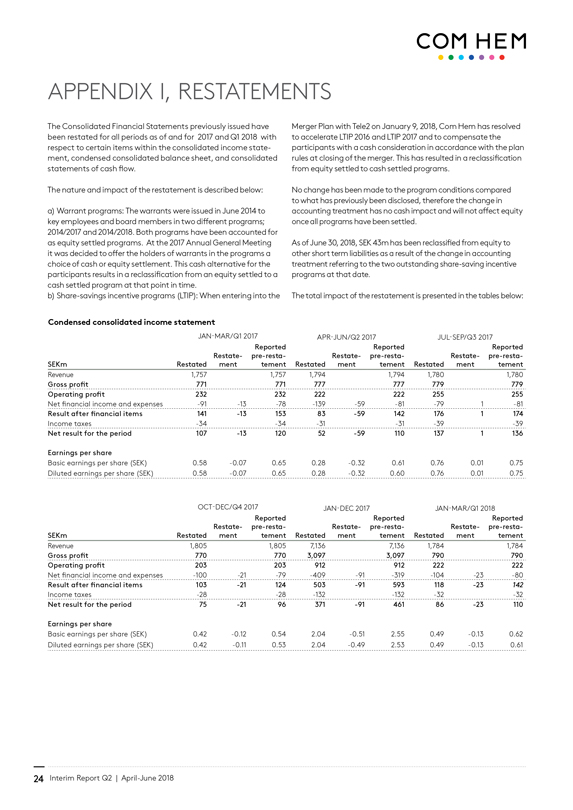
COM HEM APPENDIX I, RESTATEMENTS
The Consolidated Financial Statements previously issued have been restated for all periods as of and for 2017 and Q1 2018 with respect to certain items within the consolidated income statement, condensed consolidated balance sheet, and consolidated statements of cash flow.
The nature and impact of the restatement is described below:
a) Warrant programs: The warrants were issued in June 2014 to key employees and board members in two different programs;
2014/2017 and 2014/2018. Both programs have been accounted for as equity settled programs. At the 2017 Annual General Meeting
it was decided to offer the holders of warrants in the programs a choice of cash or equity settlement. This cash alternative for the participants results in a reclassification from an equity settled to a cash settled program at that point in time.
b) Share-savings incentive programs (LTIP): When entering into the
Merger Plan with Tele2 on January 9, 2018, Com Hem has resolved to accelerate LTIP 2016 and LTIP 2017 and to compensate the participants with a cash consideration in accordance with the plan rules at closing of the merger. This has resulted in a reclassification from equity settled to cash settled programs.
No change has been made to the program conditions compared to what has previously been disclosed, therefore the change in accounting treatment has no cash impact and will not affect equity once all programs have been settled.
As of June 30, 2018, SEK 43m has been reclassified from equity to other short term liabilities as a result of the change in accounting treatment referring to the two outstanding share-saving incentive programs at that date.
The total impact of the restatement is presented in the tables below:
Condensed consolidated income statement
JAN-MAR/Q1 2017 APR-JUN/Q2 2017 JUL-SEP/Q3 2017
SEKm Restated Restatement Reported pre-restatement Restated Restatement Reported pre-restatement Restated Restatement Reported pre-restatement
Revenue 1,757 1,757 1,794 1,794 1,780 1,780
Gross profit 771 771 777 777 779 779
Operating profit 232 232 222 222 255 255
Net financial income and expenses -91 -13 -78 -139 -59 -81 -79 1 -81
Result after financial items 141 -13 153 83 -59 142 176 1 174
Income taxes -34 -34 -31 -31 -39 -39
Net result for the period 107 -13 120 52 -59 110 137 1 136
Earnings per share
Basic earnings per share (SEK) 0.58 -0.07 0.65 0.28 -0.32 0.61 0.76 0.01 0.75
Diluted earnings per share (SEK) 0.58 -0.07 0.65 0.28 -0.32 0.60 0.76 0.01 0.75
OCT-DEC/Q4 2017 JAN-DEC 2017 JAN-MAR/Q1 2018
SEKm Restated Restatement Reported pre-restatement Restated Restatement Reported pre-restatement Restated Restatement Reported pre-restatement
Revenue 1,805 1,805 7,136 7,136 1,784 1,784
Gross profit 770 770 3,097 3,097 790 790
Operating profit 203 203 912 912 222 222
Net financial income and expenses -100 -21 -79 -409 -91 -319 -104 -23 -80
Result after financial items 103 -21 124 503 -91 593 118 -23 142
Income taxes -28 -28 -132 -132 -32 -32
Net result for the period 75 -21 96 371 -91 461 86 -23 110
Earnings per share
Basic earnings per share (SEK) 0.42 -0.12 0.54 2.04 -0.51 2.55 0.49 -0.13 0.62
Diluted earnings per share (SEK) 0.42 -0.11 0.53 2.04 -0.49 2.53 0.49 -0.13 0.61
24 Interim Report Q2 | April-June 2018
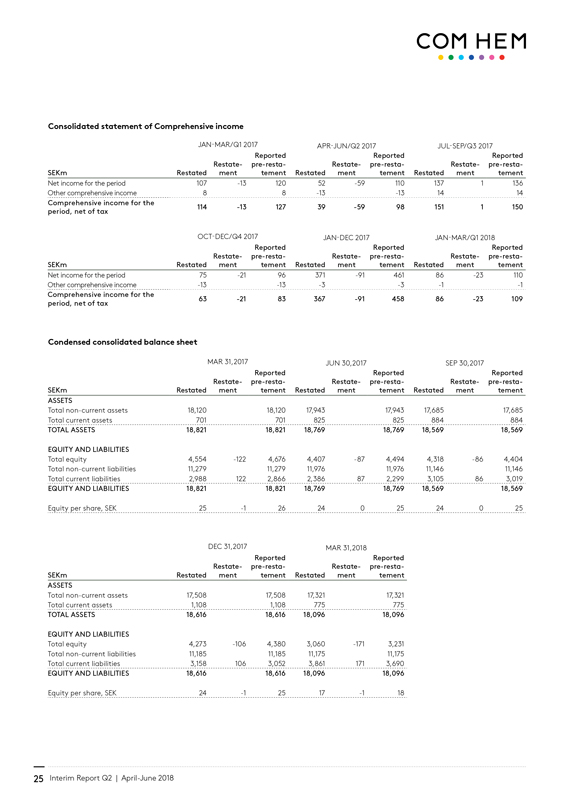
COM HEM Consolidated statement of Comprehensive income
JAN-MAR/Q1 2017 APR-JUN/Q2 2017 JUL-SEP/Q3 2017
SEKm Restated Restatement Reported pre-restatement Restated Restatement Reported pre-restatement Restated Restatement Reported pre-restatement
Net income for the period 107 -13 120 52 -59 110 137 1 136 Other comprehensive income 8 8 -13 -13 14 14
Comprehensive income for the period, net of tax
114 -13 127 39 -59 98 151 1 150
OCT-DEC/Q4 2017 JAN-DEC 2017 JAN-MAR/Q1 2018
SEKm Restated Restatement Reported pre-restatement Restated Restatement Reported pre-restatement Restated Restatement Reported pre-restatement
Net income for the period 75 -21 96 371 -91 461 86 -23 110 Other comprehensive income -13 -13 -3 -3 -1 -1
Comprehensive income for the period, net of tax
63 -21 83 367 -91 458 86 -23 109
Condensed consolidated balance sheet
MAR 31, 2017 JUN 30, 2017 SEP 30, 2017
SEKm Restated Restatement Reported pre-restatement Restated Restatement Reported pre-restatement Restated Restatement Reported pre-restatement ASSETS
Total non-current assets 18,120 18,120 17,943 17,943 17,685 17,685 Total current assets 701 701 825 825 884 884
TOTAL ASSETS 18,821 18,821 18,769 18,769 18,569 18,569
EQUITY AND LIABILITIES
Total equity 4,554 -122 4,676 4,407 -87 4,494 4,318 -86 4,404 Total non-current liabilities 11,279 11,279 11,976 11,976 11,146 11,146 Total current liabilities 2,988 122 2,866 2,386 87 2,299 3,105 86 3,019
EQUITY AND LIABILITIES 18,821 18,821 18,769 18,769 18,569 18,569
Equity per share, SEK 25 -1 26 24 0 25 24 0 25
DEC 31, 2017 MAR 31, 2018
SEKm Restated Restatement Reported pre-restatement Restated Restatement Reported pre-restatement ASSETS
Total non-current assets 17,508 17,508 17,321 17,321 Total current assets 1,108 1,108 775 775
TOTAL ASSETS 18,616 18,616 18,096 18,096
EQUITY AND LIABILITIES
Total equity 4,273 -106 4,380 3,060 -171 3,231 Total non-current liabilities 11,185 11,185 11,175 11,175 Total current liabilities 3,158 106 3,052 3,861 171 3,690
EQUITY AND LIABILITIES 18,616 18,616 18,096 18,096
Equity per share, SEK 24 -1 25 17 -1 18
25 Interim Report Q2 | April-June 2018
COM HEM
IMPORTANT INFORMATION
The information included in this document is provided for informational purposes only and is neither an offer to sell nor a solicitation of an offer to buy shares of Com Hem Holding AB (publ) (“COM HEM”) or Tele2 AB (publ) (“Tele2”). Tele2 has submitted a registration statement on Form F-4 to the Securities and Exchange Commission (the “SEC”) in connection with the planned merger of COM HEM into Tele2 (“Transaction”). Tele2 is expected to mail a merger document, which is part of the registration statement on Form F-4, to security holders of COM HEM in connection with the transaction. This information is not a substitute for the registration statement, merger document or any other offering materials or other documents that Tele2 plans to file with the SEC or send to security holders of COM HEM in connection with the proposed transaction. INVESTORS AND SECURITY HOLDERS OF COM HEM ARE URGED TO READ THE REGISTRATION STATEMENT AND THE MERGER DOCUMENT CAREFULLY WHEN IT BECOMES AVAILABLE. THE REGISTRATION STATEMENT AND THE MERGER DOCUMENT CONTAIN IMPORTANT INFORMATION ABOUT THE TRANSACTION INCLUDING CERTAIN RISKS RELATED TO THE TRANSACTION AND SHOULD BE READ BEFORE ANY DECISION IS MADE WITH RESPECT TO THE TRANSACTION. When the registration statement and merger document become available, investors and security holders will be able to obtain free copies of it through the website maintained by the SEC at www.sec.gov. Free copies of the merger document may also be obtained from COM HEM, by directing a request to Mr. Marcus Lindberg, Head of Investor Relations, e-mail: marcus.lindberg@comhem.com, phone: +46 734 39 25 40 or from Tele2, by directing such request to Mr. Erik Strandin Pers, Head of Investor Relations, e-mail: erik.pers@tele2.com, phone: +46 733 41 41 88.
In addition to the registration statement and merger document, COM HEM and Tele2 file annual, quarterly and special reports and other information with the Swedish Financial Supervisory Authority. You may read and copy any reports, statements or other information filed by COM HEM or Tele2 at: http://www.comhemgroup.se/en/investors/ and http://www.tele2.com/investors/, respectively.
FORWARD LOOKING STATEMENTS
The information in this document may contain forward-looking statements. By their nature, forward-looking statements involve known and unknown risks, uncertainties, assumptions and other factors because they relate to events and depend on circumstances that will occur in the future whether or not outside the control of each respective company or the combined company. Such factors may cause actual results, performance or developments to differ materially from those expressed or implied by such forward-looking statements. Although the management of COM HEM believes that the expectations reflected in any forward-looking statements are reasonable based on information currently available to them, no assurance is given that such forward-looking statements will prove to have been correct. You should not place undue reliance on forward-looking statements. They speak only as at the date thereof and COM HEM undertakes no obligation to update any forward-looking statements. Past performance of COM HEM or Tele2 does not guarantee or predict future performance of the combined company. Moreover, COM HEM, Tele2 and their respective affiliates and their respective officers, employees and agents do not undertake any obligation to review, update or confirm expectations or estimates or to release any revisions to any forward-looking statements to reflect events that occur or circumstances that arise in relation to the content of the presentation. Additionally, there can be no certainty that the Transaction will be completed in the manner and timeframe described in this document, or at all.
NO SOLICITATION
This communication does not constitute notice to an extraordinary general meeting or a merger document, nor shall it constitute an offer to sell or the solicitation or invitation of any offer to buy, acquire or subscribe for, any securities or an inducement to enter into investment activity, nor shall there be any sale of securities in any jurisdiction in which such offer, solicitation or sale would be unlawful prior to registration or qualification under the securities laws of any such jurisdiction.