UNITED STATES
SECURITIES AND EXCHANGE COMMISSION
Washington, D.C. 20549
FORM 20-F
(Mark One)
☐ | REGISTRATION STATEMENT PURSUANT TO SECTION 12(b) OR (g) OF THE SECURITIES EXCHANGE ACT OF 1934 |
OR
☒ | ANNUAL REPORT PURSUANT TO SECTION 13 OR 15(d) OF THE SECURITIES EXCHANGE ACT OF 1934 |
For the fiscal year ended December 31, 2018
OR
☐ | TRANSITION REPORT PURSUANT TO SECTION 13 OR 15(d) OF THE SECURITIES EXCHANGE ACT OF 1934 |
OR
☐ | SHELL COMPANY REPORT PURSUANT TO SECTION 13 OR 15(d) OF THE SECURITIES EXCHANGE ACT OF 1934 |
Date of event requiring this shell company report
for the transition period from to
Commission file number 001-38655
Farfetch Limited
(Exact name of Registrant as specified in its charter)
Not Applicable
(Translation of Registrant’s name into English)
Cayman Islands
(Jurisdiction of incorporation or organization)
The Bower, 211 Old Street
London EC1V 9NR, United Kingdom
(Address of principal executive offices)
James L. Maynard
General Counsel & Senior Vice President Group Legal
Telephone: +44 (0) 20 7549 5400
Farfetch Limited
The Bower, 211 Old Street
London EC1V 9NR, United Kingdom
(Name, Telephone, E-mail and/or Facsimile number and Address of Company Contact Person)
Securities registered or to be registered, pursuant to Section 12(b) of the Act
Title of each class | | Name of each exchange on which registered |
Class A ordinary shares, par value $0.04 per share | | New York Stock Exchange |
Securities registered or to be registered pursuant to Section 12(g) of the Act: None
Securities for which there is a reporting obligation pursuant to Section 15(d) of the Act: None
Indicate the number of outstanding shares of each of the issuer’s classes of capital stock or common stock as of the close of business covered by the annual report. 256,998,920 Class A ordinary shares and 42,858,080 Class B ordinary shares
Indicate by check mark if the registrant is a well-known seasoned issuer, as defined in Rule 405 of the Securities Act. Yes ☐ No ☒
If this report is an annual or transition report, indicate by check mark if the registrant is not required to file reports pursuant to Section 13 or 15(d) of the Securities Exchange Act of 1934. Yes ☐ No ☒
Note—Checking the box above will not relieve any registrant required to file reports pursuant to Section 13 or 15(d) of the Securities Exchange Act of 1934 from their obligations under those Sections.
Indicate by check mark whether the registrant (1) has filed all reports required to be filed by Section 13 or 15(d) of the Securities Exchange Act of 1934 during the preceding 12 months (or for such shorter period that the registrant was required to file such reports), and (2) has been subject to such filing requirements for the past 90 days. Yes ☒ No ☐
Indicate by check mark whether the registrant has submitted electronically every Interactive Data File required to be submitted pursuant to Rule 405 of Regulation S-T (§ 232.405 of this chapter) during the preceding 12 months (or for such shorter period that the registrant was required to submit such files). Yes ☒ No ☐
Indicate by check mark whether the registrant is a large accelerated filer, an accelerated filer, a non-accelerated filer, or an emerging growth company. See the definitions of “large accelerated filer,” “accelerated filer,” and “emerging growth company” in Rule 12b-2 of the Exchange Act.
| | | | | | | |
Large accelerated filer | ☐ | Accelerated filer | ☐ | Non-accelerated filer | ☒ | Emerging growth company | ☒ |
If an emerging growth company that prepares its financial statements in accordance with U.S. GAAP, indicate by check mark if the registrant has elected not to use the extended transition period for complying with any new or revised financial accounting standards † provided pursuant to Section 13(a) of the Exchange Act. ☐
† The term “new or revised financial accounting standard” refers to any update issued by the Financial Accounting Standards Board to its Accounting Standards Codification after April 5, 2012.
Indicate by check mark which basis of accounting the registrant has used to prepare the financial statements included in this filing:
U.S. GAAP ☐ | | International Financial Reporting Standards as issued by the International Accounting Standards Board ☒ | | Other ☐ |
If “Other” has been checked in response to the previous question indicate by check mark which financial statement item the registrant has elected to follow. Item 17 ☐ Item 18 ☐
If this is an annual report, indicate by check mark whether the registrant is a shell company (as defined in Rule 12b-2 of the Exchange Act). Yes ☐ No ☒
TABLE OF CONTENTS
1
2
PRESENTATION OF FINANCIAL AND OTHER INFORMATION
We report under International Financial Reporting Standards (“IFRS”) as issued by the International Accounting Standards Board (the “IASB”). None of the financial statements were prepared in accordance with generally accepted accounting principles in the United States (“U.S.”). We have historically conducted our business through Farfetch.com Limited and its subsidiaries (“Farfetch.com”)., a company incorporated under the laws of the Isle of Man. In connection with our initial public offering consummated on September 25, 2018 (our “IPO”), we carried out reorganization transactions (the “Reorganization Transactions”) whereby Farfetch.com became a wholly owned subsidiary of Farfetch Limited, an exempted company incorporated with limited liability under the Companies Law (2018 Revision) of the Cayman Islands, as amended and restated from time to time (the “Companies Law”). Following the Reorganization Transactions, our business is conducted through Farfetch Limited and its subsidiaries. For additional information about the Reorganization Transactions, see Item 4. “Information on the Company — A. History and Development of the Company — The Reorganization Transactions.”
General Information
Our consolidated financial statements are reported in U.S. Dollars, which are denoted “dollars,” “USD” or “$” throughout this Annual Report (as defined below). Also, throughout this Annual Report:
| • | except where the context otherwise requires or where otherwise indicated, the terms “Farfetch,” the “Company,” “we,” “us,” “our,” “our company” and “our business” refer, prior to the Reorganization Transactions, to Farfetch.com and, after the Reorganization Transactions, to Farfetch Limited, in each case together with its consolidated subsidiaries as a consolidated entity; |
| • | the terms “€” or “euro” refer to the currency introduced at the start of the third stage of European economic and monetary union pursuant to the treaty establishing the European Community, as amended; and |
| • | the terms “pound sterling” or “£” refer to the legal currency of the United Kingdom (“UK”). |
Key Terms and Performance Indicators Used in this Annual Report
Throughout this Annual Report, we use a number of key terms and provide a number of key performance indicators used by management. These performance indicators are discussed in more detail in Item 3. “Key Information — A. Selected Financial Data.”
Additionally, we use other terms in this Annual Report specific to us and our industry, which are defined as follows:
| • | “API” means our application programming interfaces that enable third parties to connect with our platform. |
| • | “Articles” means our amended and restated memorandum and articles of association. |
| • | “brands” means the brands with whom we have a direct contractual relationship to display and sell their products on the Farfetch Marketplace. Please refer to the definition of “Retailers” below for the difference between “brands” and “retailers,” both of which are a source of supply on the Farfetch Marketplace. |
| • | “Farfetch Black & White” means Farfetch Black & White Solutions, our comprehensive modular white-label business to business e-commerce solution for brands and retailers. |
| • | “Farfetch Marketplace,” or our “Marketplace,” is as defined in Item 4. “Information on the Company — B. Business Overview.” |
| • | “Farfetcher” means an employee of Farfetch. |
| • | “first-party sales” means sales on our platform of inventory directly purchased by us. |
| • | “Group” means Farfetch Limited and its consolidated subsidiaries. |
3
| • | “luxury sellers” means the retailers and brands with whom we have a direct contractual relationship to display and sell their products on the Farfetch Marketplace. |
| • | “Marketplace consumer” means a consumer who has completed a purchase on the Farfetch Marketplace. |
| • | “Millennial” means a person born in the years 1980 to 1994. Millennials are also referred to as “Generation Y.” |
| • | “our consumer” means a person who browses and/or purchases luxury fashion products on the Farfetch Marketplace. |
| • | “retailers” means the boutiques and department stores with whom we have a direct contractual relationship to display and sell their products on the Farfetch Marketplace. Retailers buy wholesale from multiple luxury brands to then sell to the end consumer. Brands (1) sell wholesale to retailers; (2) operate concessions within the offline and online stores of retailers; and/or (3) sell to consumers directly through a mono-brand store or website. Both “brands” and “retailers” sell via the Farfetch Marketplace, but the distinction is not apparent to our consumer. |
| • | “stock value” means the combined amount of all stock units available on our Marketplace multiplied by each item’s retail unit price. |
| • | “Third-Party Take Rate” means Platform Services Revenue excluding revenue from first-party sales, as a percentage of GMV excluding GMV from first-party sales and Platform Fulfilment Revenue. Revenue from first-party sales, which is equal to GMV from first-party sales, means revenue derived from sales on our platform of inventory purchased by us. |
4
CAUTIONARY STATEMENT REGARDING FORWARD-LOOKING STATEMENTS
This Annual Report on Form 20-F (“Annual Report”) contains statements that constitute “forward-looking statements” within the meaning of the U.S. Private Securities Litigation Reform Act of 1995. These statements are neither historical facts nor assurances of future performance. Although we believe that these estimates and forward-looking statements are based upon reasonable assumptions, they are subject to numerous risks and uncertainties some of which are beyond our control, and are made in light of information currently available to us.
In some cases, these forward-looking statements can be identified by words or phrases such as “believe,” “may,” “will,” “expect,” “estimate,” “could,” “should,” “anticipate,” “aim,” “intend,” “plan,” “potential,” “continue,” “is/are likely to” or other similar expressions. Forward-looking statements contained in this Annual Report include, but are not limited to, statements about:
| • | our future financial performance, including our revenue, operating expenses and our ability to maintain profitability and our future business and operating results; |
| • | our strategies, plans, objectives and goals; and |
| • | our expectations regarding the development of our industry, market size and the competitive environment in which we operate. |
These forward-looking statements reflect our current views with respect to future events and are not a guarantee of future performance. Actual outcomes may differ materially from the information contained in the forward-looking statements as a result of a number of factors, including, without limitation, the risk factors set forth in Item 3. “Key Information — D. Risk Factors” of this Annual Report, including, but not limited to, the following:
| • | purchasers of luxury products may not choose to shop online in sufficient numbers; |
| • | our ability to generate sufficient revenue to be profitable or to generate positive cash flow on a sustained basis; |
| • | the volatility and difficulty in predicting the luxury fashion industry; |
| • | our reliance on a limited number of retailers and brands for the supply of products on our Marketplace; |
| • | our reliance on retailers and brands to anticipate, identify and respond quickly to new and changing fashion trends, consumer preferences and other factors; |
| • | our reliance on retailers and brands to make products available to our consumers on our Marketplace and to set their own prices for such products; |
| • | fluctuations in exchange rates; |
| • | our reliance on information technologies and our ability to adapt to technological developments; |
| • | our ability to acquire or retain consumers and to promote and sustain the Farfetch brand; |
| • | our ability or the ability of third parties to protect our sites, networks and systems against security breaches, or otherwise to protect our confidential information; |
| • | our ability to successfully launch and monetize new and innovative technology; |
| • | our dependence on highly skilled personnel, including our senior management, data scientists and technology professionals, and our ability to hire, retain and motivate qualified personnel; and |
| • | José Neves, our chief executive officer and Co-Chair of our Board, has considerable influence over important corporate matters due to his ownership of us, and our dual-class voting structure will limit your ability to influence corporate matters, including a change of control. |
The forward-looking statements contained in this Annual Report speak only as of the date of this Annual Report. Except as required by law, we do not undertake to update any forward-looking statement to reflect events or circumstances after that date or to reflect the occurrence of unanticipated events. You should read this Annual Report and the documents that we reference herein and have filed as exhibits hereto completely and with the understanding that our actual future results may be materially different from what we expect.
5
PART I
Item 1. Identity of Directors, Senior Management and Advisers
Not applicable.
Item 2. Offer Statistics and Expected Timetable
Not applicable.
Item 3. Key Information
A. Selected Financial Data
We prepare our consolidated financial statements in accordance with IFRS as issued by the IASB.
The following selected historical consolidated financial data as of and for the years ended December 31, 2016, 2017, and 2018 and for year ended December 31, 2015 has been derived from our audited consolidated financial statements and the notes thereto (our audited consolidated financial statements as of December 31, 2016 and for the fiscal year ended December 31, 2015 are not included in this Annual Report). Our historical results for any prior period are not necessarily indicative of results expected in any future period.
We have historically conducted our business through Farfetch.com and, therefore, our historical financial statements prior to the Reorganization Transactions reflect the result of operations of Farfetch.com and, following the Reorganization Transactions, reflect the results of operations of Farfetch Limited. Farfetch Limited’s financial statements are the same as Farfetch.com’s financial statements, as adjusted for the Reorganization Transactions. Following the Reorganization Transactions, we have retroactively reflected the Reorganization Transactions in Farfetch Limited’s financial statements.
6
The financial data set forth below should be read in conjunction with, and are qualified by reference to Item 5. “Operating and Financial Review and Prospects” and the audited consolidated financial statements and notes thereto included elsewhere in this Annual Report. Our historical results for any prior period do not necessarily indicate our results to be expected for any future period.
| | Year ended December 31, | |
| | 2015 | | | 2016 | | | 2017 | | | 2018 | |
| | (in thousands, except share and per share data) | |
Consolidated Statement of Operations Data: | | | | | | | | | | | | | | | | |
Revenue | | $ | 142,305 | | | $ | 242,116 | | | $ | 385,966 | | | $ | 602,384 | |
Cost of revenue | | | (69,702 | ) | | | (125,238 | ) | | | (181,200 | ) | | | (303,934 | ) |
Gross profit | | | 72,603 | | | | 116,878 | | | | 204,766 | | | | 298,450 | |
Selling, general and administrative expenses | | | (130,073 | ) | | | (205,558 | ) | | | (299,260 | ) | | | (471,766 | ) |
Share of profits of associates | | | - | | | | 18 | | | | 31 | | | | 33 | |
Operating loss | | | (57,470 | ) | | | (88,662 | ) | | | (94,463 | ) | | | (173,283 | ) |
Net finance (costs)/ income | | | (4,265 | ) | | | 7,402 | | | | (17,642 | ) | | | 19,866 | |
Loss before tax | | | (61,735 | ) | | | (81,260 | ) | | | (112,105 | ) | | | (153,417 | ) |
Income tax credit/(expense) | | | 628 | | | | (199 | ) | | | (170 | ) | | | (2,158 | ) |
Loss after tax | | $ | (61,107 | ) | | $ | (81,459 | ) | | $ | (112,275 | ) | | $ | (155,575 | ) |
Loss per share attributable to owners of the parent: | | | | | | | | | | | | | | | | |
Basic and diluted | | $ | (0.35 | ) | | $ | (0.43 | ) | | $ | (0.50 | ) | | $ | (0.59 | ) |
Weighted average shares outstanding: | | | | | | | | | | | | | | | | |
Basic and diluted | | | 171,929,007 | | | | 188,679,490 | | | | 223,465,734 | | | | 264,432,214 | |
Consolidated Statement of Cash Flow Data: | | | | | | | | | | | | | | | | |
Net cash outflow from operating activities | | $ | (37,258 | ) | | $ | (47,079 | ) | | $ | (59,320 | ) | | $ | (116,205 | ) |
Net cash outflow from investing activities | | | (27,571 | ) | | | (16,961 | ) | | | (28,863 | ) | | | (63,538 | ) |
Net cash inflow from financing activities | | $ | 77,414 | | | $ | 161,173 | | | $ | 300,142 | | | $ | 859,526 | |
| | As of December 31, | |
| | 2016 | | | 2017 | | | 2018 | |
| | (in thousands) | |
Consolidated Statement of Financial Position Data: | | | | | | | | | | | | |
Non-current assets | | $ | 64,128 | | | $ | 110,266 | | | $ | 151,983 | |
Current assets | | | 180,904 | | | | 452,792 | | | | 1,199,410 | |
Total assets | | | 245,032 | | | | 563,058 | | | | 1,351,393 | |
Current liabilities | | | 89,425 | | | | 155,890 | | | | 194,158 | |
Non-current liabilities | | | 36,691 | | | | 10,265 | | | | 28,804 | |
Total liabilities | | | 126,116 | | | | 166,155 | | | | 222,962 | |
Share capital and premium | | | 348,832 | | | | 686,972 | | | | 784,294 | |
Total equity | | $ | 118,916 | | | $ | 396,903 | | | $ | 1,128,431 | |
7
| | Year ended December 31, | |
| | 2015 | | | 2016 | | | 2017 | | | 2018 | |
Selected Other Data(1): | | | | | | | | | | | | | | | | |
Consolidated Group: | | | | | | | | | | | | | | | | |
GMV | | $ | 381,809 | | | $ | 585,842 | | | $ | 909,826 | | | $ | 1,407,698 | |
Revenue | | | 142,305 | | | | 242,116 | | | | 385,966 | | | | 602,384 | |
Adjusted Revenue (1) | | | 113,688 | | | | 193,605 | | | | 311,784 | | | | 504,590 | |
Adjusted EBITDA (1) | | | (47,375 | ) | | | (53,380 | ) | | | (58,079 | ) | | | (95,960 | ) |
Adjusted EBITDA Margin (1) | | (41.7%) | | | (27.6%) | | | (18.6%) | | | (19.0%) | |
Platform: | | | | | | | | | | | | | | | | |
Platform GMV | | $ | 374,915 | | | $ | 573,174 | | | $ | 894,392 | | | $ | 1,392,104 | |
Platform Services Revenue (1) | | | 106,794 | | | | 180,937 | | | | 296,350 | | | | 488,995 | |
Platform Gross Profit (1) | | | 69,355 | | | | 111,762 | | | | 196,581 | | | | 291,706 | |
Platform Order Contribution Margin(1) | | 33.0% | | | 35.0% | | | 43.0% | | | 39.8% | |
Third-Party Take Rate | | 30.0% | | | 31.3% | | | 32.9% | | | 32.0% | |
Farfetch Marketplace: | | | | | | | | | | | | | | | | |
Active Consumers | | | 415.7 | | | | 651.7 | | | | 935.8 | | | | 1,353.4 | |
Number of orders | | | 800.5 | | | | 1,259.7 | | | | 1,881.0 | | | | 2,913.0 | |
Average Order Value (actual) | | $ | 586.8 | | | $ | 583.6 | | | $ | 620.0 | | | $ | 618.6 | |
(1) | See “Non-IFRS and Other Financial and Operating Metrics” below. |
Non-IFRS and Other Financial and Operating Metrics
We have included in this Annual Report certain financial measures and metrics not based on IFRS, including Adjusted EBITDA, Adjusted EBITDA Margin, Adjusted Revenue, Platform Services Revenue, Platform Gross Profit, Platform Order Contribution and Platform Order Contribution Margin, as well as operating metrics, including GMV, Platform GMV, Active Consumers, Number of Orders and Average Order Value.
Management uses Adjusted EBITDA, Adjusted EBITDA Margin, Adjusted Revenue, Platform Services Revenue, Platform Gross Profit, Platform Order Contribution, and Platform Order Contribution Margin:
| • | as measurements of operating performance because they assist us in comparing our operating performance on a consistent basis, as they remove the impact of items not directly resulting from our core operations; |
| • | for planning purposes, including the preparation of our internal annual operating budget and financial projections; |
| • | to evaluate the performance and effectiveness of our strategic initiatives; and |
| • | to evaluate our capacity to fund capital expenditures and expand our business. |
Adjusted EBITDA, Adjusted Revenue and Platform Services Revenue may not be comparable to similar measures disclosed by other companies, because not all companies and analysts calculate Adjusted EBITDA and Adjusted Revenue in the same manner. We present Adjusted EBITDA, Adjusted Revenue and Platform Services Revenue because we consider them to be important supplemental measures of our performance, and we believe they are frequently used by securities analysts, investors and other interested parties in the evaluation of companies. Management believes that investors’ understanding of our performance is enhanced by including these non-IFRS financial measures as a reasonable basis for comparing our ongoing results of operations. Many investors are interested in understanding the performance of our business by comparing our results from ongoing operations period over period and would ordinarily add back non-cash expenses such as depreciation, amortization and items that are not part of normal day-to-day operations of our business. By providing these non-IFRS financial measures, together with reconciliations to IFRS, we believe we are enhancing investors’ understanding of our business and our results of operations, as well as assisting investors in evaluating how well we are executing our strategic initiatives.
8
We believe that Platform Gross Profit, Adjusted Platform Gross Profit Margin, Platform Order Contribution and Platform Order Contribution Margin are useful measures in evaluating our operating performance because they take into account demand generation expense and are used by management to analyze the operating performance of our platform for the periods presented. We also believe that Platform Gross Profit, Adjusted Platform Gross Profit Margin, Platform Order Contribution and Platform Order Contribution Margin are useful measures in evaluating our operating performance within our industry because they permit the evaluation of our platform productivity, efficiency and performance.
Items excluded from these non-IFRS measures are significant components in understanding and assessing financial performance. Adjusted EBITDA, Adjusted EBITDA Margin, Adjusted Revenue and Platform Services Revenue have limitations as analytical tools and should not be considered in isolation, or as an alternative to, or a substitute for loss after tax, revenue or other financial statement data presented in our consolidated financial statements as indicators of financial performance. Some of the limitations are:
| • | such measures do not reflect revenue related to fulfilment, which is necessary to the operation of our business; |
| • | such measures do not reflect our expenditures, or future requirements for capital expenditures or contractual commitments; |
| • | such measures do not reflect changes in our working capital needs; |
| • | such measures do not reflect our share based payments, income tax (credit)/expense or the amounts necessary to pay our taxes; |
| • | although depreciation and amortization are eliminated in the calculation of Adjusted EBITDA, the assets being depreciated and amortized will often have to be replaced in the future and such measures do not reflect any costs for such replacements; and |
| • | other companies may calculate such measures differently than we do, limiting their usefulness as comparative measures. |
Due to these limitations, Adjusted EBITDA, Adjusted EBITDA Margin, Adjusted Revenue and Platform Services Revenue should not be considered as measures of discretionary cash available to us to invest in the growth of our business and are in addition to, not a substitute for or superior to, measures of financial performance prepared in accordance with IFRS. In addition, the non-IFRS financial measures we use may differ from the non-IFRS financial measures used by other companies and are not intended to be considered in isolation or as a substitute for the financial information prepared and presented in accordance with IFRS. Furthermore, not all companies or analysts may calculate similarly titled measures in the same manner. We compensate for these limitations by relying primarily on our IFRS results and using these non-IFRS measures only as supplemental measures.
We define our non-IFRS and other financial and operating metrics as follows:
“Active Consumers” means active consumers on the Farfetch Marketplace. A consumer is deemed to be active if they made a purchase on the Farfetch Marketplace within the last 12-month period, irrespective of cancellations or returns. The number of Active Consumers is an indicator of our ability to attract and retain an increasingly large consumer base to our platform and of our ability to convert platform visits into sale orders.
“Adjusted EBITDA” means loss after taxes before net finance costs/(income), income tax (credit)/expense and depreciation and amortization, further adjusted for share based compensation expense, other items (represents items outside the normal scope of our ordinary activities) and share of results of associates. Adjusted EBITDA provides a basis for comparison of our business operations between current, past and future periods by excluding items that we do not believe are indicative of our core operating performance. Adjusted EBITDA may not be comparable to other similarly titled metrics of others.
“Adjusted EBITDA Margin” means Adjusted EBITDA calculated as a percentage of Adjusted Revenue.
“Adjusted Revenue” means revenue less Platform Fulfilment Revenue.
9
“Average Order Value” (“AOV”) means the average value of all orders placed on the Farfetch Marketplace excluding value added taxes.
“Gross Merchandise Value” (“GMV”) means the total dollar value of orders processed. GMV across our platform is inclusive of product value, shipping and duty. It is net of returns, value added taxes and cancellations. GMV does not represent revenue earned by us, although GMV and revenue are correlated.
“In-Store Revenue” means revenue generated in our Browns retail stores.
“Marketplace Order Contribution” means Platform Order Contribution after deducting Platform Order Contribution not derived from the Farfetch Marketplace.
“Number of Orders” means the total number of consumer orders placed on the Farfetch Marketplace, gross of returns and net of cancellations, in a particular period. An order is counted on the day the consumer places the order. The Number of Orders represents an indicator of our ability to generate sales opportunities for luxury sellers through our Marketplace. Analyzed in the context of Active Consumers, the Number of Orders provides an indicator of our ability to attract recurring purchases on our platform and also the effectiveness of our targeted advertising.
“Platform Fulfilment Revenue” means revenue from shipping and customs clearing services that we provide to our consumers, net of consumer promotional incentives, such as free shipping and promotional codes.
“Platform GMV” means GMV excluding In-Store Revenue.
“Platform Gross Profit” means gross profit excluding In-Store Gross Profit.
“Platform Order Contribution” means gross profit after deducting demand generation expense, which includes fees that we pay for our various marketing channels. Platform Order Contribution provides an indicator of our ability to extract consumer value from our demand generation expense, including the costs of retaining existing consumers and our ability to acquire new consumers.
“Platform Order Contribution Margin” means Platform Order Contribution calculated as a percentage of Platform Services Revenue.
“Platform Services Revenue” means Adjusted Revenue less In-Store Revenue. Platform Services Revenue is driven by our Platform GMV, including revenue from first-party sales, and commission from third-party sales. The revenue realized from first-party sales is equal to the GMV of such sales because we act as principal in these transactions, and thus related sales are not commission based. Platform Services Revenue was also referred to as Adjusted Platform Revenue in previous filings with the Securities and Exchange Commission (“SEC”).
10
The following table reconciles Adjusted EBITDA to the most directly comparable IFRS financial measure, which is loss after tax:
| | Year ended December 31, | |
| | 2015 | | | 2016 | | | 2017 | | | 2018 | |
| | (in thousands) | |
Loss after tax | | $ | (61,107 | ) | | $ | (81,459 | ) | | $ | (112,275 | ) | | $ | (155,575 | ) |
Net finance costs/(income) | | | 4,265 | | | | (7,402 | ) | | | 17,642 | | | | (19,866 | ) |
Income tax (credit)/ expense | | | (628 | ) | | | 199 | | | | 170 | | | | 2,158 | |
Depreciation and amortization | | | 3,104 | | | | 6,897 | | | | 10,980 | | | | 23,537 | |
Share-based payments(a) | | | 6,505 | | | | 19,848 | | | | 21,486 | | | | 53,819 | |
Other items(b) | | | 486 | | | | 8,555 | | | | 3,949 | | | | - | |
Share of results of associates | | | - | | | | (18 | ) | | | (31 | ) | | | (33 | ) |
Adjusted EBITDA | | $ | (47,375 | ) | | $ | (53,380 | ) | | $ | (58,079 | ) | | $ | (95,960 | ) |
(a) | Represents share-based payment expense. |
(b) | Represents other items, which are outside the normal scope of our ordinary activities or non-cash, including legal fees directly related to acquisitions of $0.7 Million in 2017 and fair value remeasurement of contingent consideration of $8.5 million in 2016 and $3.3 million in 2017, all of which are included within the general and administrative component of selling, general and administrative expenses. |
The following table reconciles Adjusted Revenue and Platform Services Revenue to the most directly comparable IFRS financial performance measure, which is revenue:
| | Year ended December 31, | |
| | 2015 | | | 2016 | | | 2017 | | | 2018 | |
| | (in thousands) | |
Revenue | | $ | 142,305 | | | $ | 242,116 | | | $ | 385,966 | | | $ | 602,384 | |
Less: Platform Fulfilment Revenue | | | (28,617 | ) | | | (48,511 | ) | | | (74,182 | ) | | | (97,794 | ) |
Adjusted Revenue | | | 113,688 | | | | 193,605 | | | | 311,784 | | | | 504,590 | |
Less: In-Store Revenue | | | (6,894 | ) | | | (12,668 | ) | | | (15,434 | ) | | | (15,595 | ) |
Platform Services Revenue | | $ | 106,794 | | | $ | 180,937 | | | $ | 296,350 | | | $ | 488,995 | |
The following table reconciles Platform Gross Profit and Platform Order Contribution to the most directly comparable IFRS financial performance measure, which is gross profit:
| | Year ended December 31, | |
| | 2015 | | | 2016 | | | 2017 | | | 2018 | |
| | | | | | (in thousands) | |
Gross profit | | $ | 72,603 | | | $ | 116,878 | | | $ | 204,766 | | | $ | 298,450 | |
Less: In-Store Gross Profit(a) | | | (3,248 | ) | | | (5,116 | ) | | | (8,185 | ) | | | (6,744 | ) |
Platform Gross Profit | | | 69,355 | | | | 111,762 | | | | 196,581 | | | | 291,706 | |
Less: Demand generation expense | | | (34,158 | ) | | | (48,381 | ) | | | (69,202 | ) | | | (97,295 | ) |
Platform Order Contribution | | $ | 35,197 | | | $ | 63,381 | | | $ | 127,379 | | | $ | 194,411 | |
(a) | In-Store Gross Profit is In-Store Revenue less the direct cost of goods sold relating to In-Store Revenue. |
B. Capitalization and Indebtedness
Not applicable.
C. Reasons for the Offer and Use of Proceeds
Not applicable.
11
D. Risk Factors
An investment in our Class A ordinary shares involves a high degree of risk. You should carefully consider the risks and uncertainty described below, together with all of the other information in this Annual Report, including our consolidated financial statements and related notes, before deciding to invest in our Class A ordinary shares. Additional risks not presently known to us or that we currently deem immaterial may also impair our business operations. Our business, financial condition or results of operations could be materially and adversely affected by any of these risks. The trading price and value of our Class A ordinary shares could decline due to any of these risks, and you may lose all or part of your investment.
Risks Relating to our Business and Industry
Purchasers of luxury products may not choose to shop online, which would prevent us from growing our business.
Our success will depend, in part, on our ability to attract additional consumers who have historically purchased luxury products through traditional retailers rather than online. The online market for luxury products is significantly less developed than the online market for other goods and services such as books, music, travel and other consumer products. If this market does not gain widespread acceptance, our business may suffer. Furthermore, we may have to incur significantly higher and more sustained advertising and promotional expenditures or offer more incentives than we currently anticipate in order to attract additional online consumers to our Marketplace and convert them into purchasing consumers. Specific factors that could prevent consumers from purchasing luxury products from us include:
| • | concerns about buying luxury products online without a physical storefront, face to face interaction with sales personnel and the ability to physically handle and examine products; |
| • | preference for a more personal experience when purchasing luxury products; |
| • | product offerings that do not reflect current consumer tastes and preferences; |
| • | pricing that does not meet consumer expectations; |
| • | delayed shipments or shipments of incorrect or damaged products; |
| • | inconvenience and costs associated with returning or exchanging items purchased online; |
| • | concerns about the security of online transactions and the privacy of personal information; and |
| • | usability, functionality and features of our Marketplace. |
If the online market for luxury products does not continue to develop and grow, our business will not grow and our results of operations, financial condition and prospects could be materially adversely affected.
We may not be able to generate sufficient revenue to be profitable or to generate positive cash flow on a sustained basis, and our revenue growth rate may decline.
We cannot assure you that we will generate sufficient revenue to offset the cost of maintaining our platform and maintaining and growing our business. Although our revenue grew from $386.0 million for the fiscal year ended December 31, 2017 to $602.4 million for the fiscal year ended December 31, 2018, our revenue growth rate may decline in the future because of a variety of factors, including increased competition and the maturation of our business. We cannot assure you that our revenue will continue to grow or will not decline. You should not consider our historical revenue growth or operating expenses as indicative of our future performance. If our revenue growth rate declines or our operating expenses exceed our expectations, our financial performance will be adversely affected.
Additionally, we also expect our costs to increase in future periods, which could negatively affect our future operating results and ability to achieve and sustain profitability. We expect to continue to expend substantial financial and other resources on acquiring and retaining consumers, our technology infrastructure, research and development, including investments in our research and development team and the development of new features,
12
sales and marketing, international expansion, and general administration, including expenses, related to being a public company. These investments may not result in increased revenue or growth in our business. If we cannot successfully earn revenue at a rate that exceeds the costs associated with our business, we will not be able to achieve or sustain profitability or generate positive cash flow on a sustained basis and our revenue growth rate may decline. If we fail to continue to grow our revenue and overall business, our business, results of operations, financial condition and prospects could be materially adversely affected.
We have experienced losses in the past, and we may experience losses in the future.
We experienced losses after tax of $81.5 million, $112.3 million and $155.6 million in the years ended December 31, 2016, 2017 and 2018, respectively. We may continue to experience losses after tax in the future, and we cannot assure you that we will achieve profitability and may continue to incur significant losses in future periods.
The luxury fashion industry can be volatile and difficult to predict.
As a global platform for luxury fashion, we are subject to variable industry conditions. Consumer demand can quickly change depending on many factors, including the behavior of both online and brick and mortar competitors, promotional activities of competitors, rapidly changing tastes and preferences, frequent introductions of new products and services, advances in technology and the internet and macroeconomic factors, many of which are beyond our control. For example, in the fourth quarter of 2018 luxury retailers demonstrated a higher than expected level of promotional activity, to which we responded by carefully adjusting our approach to promotions during that quarter. With this constantly changing environment, our future business strategies, practices and results may not meet expectations or respond quickly enough to consumer demand, and we may face operational difficulties in adjusting to any changes. Any of these developments could harm our business, results of operations, financial condition and prospects.
We rely on a limited number of retailers and brands for the supply of products that we make available to consumers on our Marketplace.
We rely on a limited number of retailers and brands for the supply of products available on our Marketplace. In the year ended December 31, 2018, 20% of our GMV was from our top ten retailers, excluding Browns. We cannot guarantee that these retailers and brands will always choose to use our Marketplace to sell their products. We also typically enter into one‑year contracts with retailers and brands, and there is no guarantee our retailers and brands will renew these contracts upon expiration, which currently automatically renew every year unless either party serves 90 days’ notice of termination. We cannot control whether a retailer or brand chooses to make any of its supply available on our Marketplace. Further, a small number of entities may, on their own, take actions that adversely affect our business, such as creating their own marketplace that could directly compete with us. Additionally, our business may be adversely affected if our access to products is limited or delayed because of deterioration in our relationships with one or more of our retailers or brands, or if they choose not to sell their products with us for any other reason. If we fail to successfully retain current, as well as acquire new, retailers and brands on our platform, our business, results of operations, financial condition and prospects could be materially adversely affected.
If our brands and retailers fail to anticipate, identify and respond quickly to new and changing fashion trends in consumer preferences, our business could be harmed.
The luxury apparel, footwear and accessories available on our Marketplace are subject to rapidly changing fashion trends and constantly evolving consumer tastes and demands. Our success is dependent on the ability of our retailers and brands to anticipate, identify and respond to the latest fashion trends and consumer demands and to translate such trends and demands into product offerings in a timely manner. The failure of our retailers and brands to anticipate, identify or react swiftly and appropriately to new and changing styles, trends or desired consumer preferences, to accurately anticipate and forecast demand for certain product offerings or to provide relevant and timely product offerings to list on our Marketplace may lead to lower demand for merchandise on our Marketplace, which could cause, among other things, declines in GMV sold through our Marketplace. If our retailers and brands are not able to accurately anticipate, identify, forecast, analyze or respond to changing fashion trends and consumer
13
preferences, we may lose consumers and market share, which could have a material adverse effect on our business, results of operations, financial condition and prospects.
Retailers and brands set their own prices for the products they make available on our Marketplace, which could affect our ability to respond to consumer preferences and trends.
We do not control the pricing strategies of our retailers and brands (other than Browns), which could affect our revenue and our ability to effectively compete on price with the other distribution channels used by our brands and retailers, including e-commerce retailers and brick and mortar stores. Retailers and brands may determine that they can more competitively price their products through other distribution channels and may choose such other channels instead of listing products on our Marketplace. Additionally, retailers and brands often employ different pricing strategies based on the geographical location of consumers, which is accomplished online through geo‑blocking that blocks a consumer’s ability to access certain websites based on geography. European Union legislation, which took effect in December 2018, prohibits geo‑blocking in the European Union. As a result, our consumers registered in the European Union can make purchases at the prices listed in different European geographies irrespective of their country of residence in Europe which could adversely impact our business. In addition, proposed legislation in Europe would require marketplaces to disclose the main parameters they use to rank goods and services on their sites, and any advantage they may give to their own products over others. This could adversely affect our business, results of operations, financial condition and prospects.
Fluctuations in exchange rates may adversely affect our results of operations.
Our financial information is presented in U.S. dollars, which differs to the underlying functional currencies of our subsidiaries, which causes translation risk. We do not hedge translation risk, and therefore, our results of operations have in the past, and will in the future, fluctuate due to movements in exchange rates when the currencies are translated into U.S. dollars. At a subsidiary level, we are also exposed to transactional foreign exchange risk because we earn revenues and incur expenses in a number of different foreign currencies relative to the relevant subsidiary’s functional currency. Movements in exchange rates therefore impact our subsidiaries and thus, our consolidated results and cash flows, which results in transactional foreign currency exposure. We generally hedge a portion of transactional exposure using forward foreign exchange contracts; however, because this is not fully hedged, we are exposed to fluctuations in exchange rates that could harm our business, results of operations, financial condition and prospects.
We rely on information technologies and systems to operate our business and maintain our competitiveness, and any failure to invest in and adapt to technological developments and industry trends could harm our business.
We depend on the use of sophisticated information technologies and systems, including technology and systems used for websites and apps, customer service, supplier connectivity, communications, fraud detection and administration. As our operations grow in size, scope and complexity, we will need to continuously improve and upgrade our systems and infrastructure to offer an increasing number of consumer‑enhanced services, features and functionalities, while maintaining and improving the reliability and integrity of our systems and infrastructure.
Our future success also depends on our ability to adapt our services and infrastructure to meet rapidly evolving consumer trends and demands while continuing to improve our platform’s performance, features and reliability. The emergence of alternative platforms, such as smartphones and tablets, and niche competitors who may be able to optimize such services or strategies, may require us to continue to invest in new and costly technology. We may not be successful, or we may be less successful than our competitors, in developing technologies that operate effectively across multiple devices and platforms and that are appealing to consumers, which would negatively impact our business and financial performance. New developments in other areas, such as cloud computing providers, could also make it easier for competitors to enter our markets due to lower up‑front technology costs. In addition, we may not be able to maintain our existing systems or replace our current systems or introduce new technologies and systems as quickly or cost effectively as we would like. Failure to invest in and adapt to technological developments and industry trends may have a material adverse effect on our business, results of operations, financial condition and prospects.
14
Our efforts to acquire or retain consumers may not be successful, which could prevent us from maintaining or increasing our sales.
If we do not promote and sustain our brand and platform through marketing and other tools, we may fail to build and maintain the critical mass of consumers required to increase our sales. Promoting and positioning our brand and platform will depend largely on the success of our marketing efforts, our ability to attract consumers cost effectively and our ability to consistently provide a high‑quality product and user experience. In order to acquire and retain consumers, we have incurred and will continue to incur substantial expenses related to advertising and other marketing efforts. We also use promotions to drive sales, which may not be effective and may adversely affect our gross margins. Our investments in marketing may not effectively reach potential consumers, potential consumers may decide not to buy through us or the spend of consumers that purchase from us may not yield the intended return on investment, any of which could negatively affect our financial results. The failure of our marketing activities could also adversely affect our ability to attract new, and maintain relationships with, our consumers, retailers and brands, which may have a material adverse effect on our business, results of operations, financial condition and prospects.
We may not succeed in promoting and sustaining our brand, which could have an adverse effect on our future growth and business.
A critical component of our future growth is our ability to promote and sustain our brand, which we believe can be achieved by providing a high‑quality user experience. An important element of our brand promotion strategy is establishing a relationship of trust with our consumers. In order to provide a high‑quality user experience, we have invested and will continue to invest substantial amounts of resources in the development and functionality of our platform, website, technology infrastructure, fulfilment and customer service operations. Our ability to provide a high‑quality user experience is also highly dependent on external factors over which we may have little or no control, including, without limitation, the reliability and performance of our retailers and brands, suppliers and third‑party carriers. If our consumers are dissatisfied with the quality of the products sold on our platform or the customer service they receive and their overall customer experience, or if we or our service providers cannot deliver products to our consumers in a timely manner or at all, our consumers may stop purchasing products from us. We also rely on third parties for information, including product characteristics and availability shown on our Marketplace that may be inaccurate. Our failure to provide our consumers with high‑quality products and high‑quality user experiences for any reason could substantially harm our reputation and adversely impact our efforts to develop Farfetch as a trusted brand, which could have a material adverse effect on our business, results of operations, financial condition and prospects.
Any significant disruption in service on our websites or apps or in our computer systems, some of which are currently hosted by third‑party providers, could damage our reputation and result in a loss of consumers, which would harm our business and results of operations.
Our brand, reputation and ability to attract and retain consumers to use our platform depend upon the reliable performance of our network infrastructure and content delivery processes. We have experienced interruptions in these systems in the past, including server failures that temporarily slowed down or interfered with the performance of our websites and apps, or particular features of our websites and apps, and we may experience interruptions in the future. For example, in December 2018 we had a partial outage on our payment system for 9 hours and 30 minutes, during which only approximately 20% of payments succeeded, and in July 2017, we experienced a full platform outage for one hour and forty‑five minutes. Interruptions in these systems, whether due to system failures, human input errors, computer viruses or physical or electronic break‑ins, and denial‑of‑service attacks on us, third‑party vendors or communications infrastructure, could affect the availability of our services on our platform and prevent or inhibit the ability of consumers to access our websites and apps or complete purchases on our websites and apps. Volume of traffic and activity on our Marketplace spikes on certain days, such as during a “Black Friday” promotion, and any such interruption would be particularly problematic if it were to occur at such a high volume time. Problems with the reliability of our systems could prevent us from earning revenue or commission and could harm our reputation. Damage to our reputation, any resulting loss of consumer, retailer or brand confidence and the cost of remedying these problems could negatively affect our business, results of operations, financial condition and prospects.
15
Substantially all of the communications, network and computer hardware used to operate our website are strategically located, for convenience and regulatory reasons, at facilities in Portugal, the Netherlands, Russia, China and Ireland. Our ability to maintain communications, network, and computer hardware in these countries is, or may in the future be, subject to regulatory review and licensing, and the failure to obtain any required licenses could negatively affect our business. We either lease or own our servers and have service agreements with data center providers. Our systems and operations are vulnerable to damage or interruption from fire, flood, power loss, telecommunications failure, terrorist attacks, acts of war, electronic and physical break‑ins, computer viruses, earthquakes and similar events. The occurrence of any of the foregoing events could result in damage to our systems and hardware or could cause them to fail completely, and our insurance may not cover such events or may be insufficient to compensate us for losses that may occur. Our systems are not completely redundant, so a system failure at one site could result in reduced platform functionality for our consumers, and a total failure of our systems could cause our websites or apps to be inaccessible by some or all of our consumers. Problems faced by our third‑party service providers with the telecommunications network providers with whom they contract or with the systems by which they allocate capacity among their users, including us, could adversely affect the experience of our consumers. Our third‑party service providers could decide to close their facilities without adequate notice. Any financial difficulties, such as bankruptcy or reorganization, faced by our third‑party service providers or any of the service providers with whom they contract may have negative effects on our business, the nature and extent of which are difficult to predict. If our third‑party service providers are unable to keep up with our needs for capacity, this could have an adverse effect on our business. Any errors, defects, disruptions or other performance problems with our services could harm our reputation and may have a material adverse effect on our business, results of operations, financial condition and prospects.
Our failure or the failure of third parties to protect our sites, networks and systems against security breaches, or otherwise to protect our confidential information, could damage our reputation and brand and substantially harm our business and operating results.
We collect, maintain, transmit and store data about our consumers, retailers and brands and others, including credit card information (and other payment information) and other personally identifiable information, as well as other confidential and proprietary information about our business plans and activities.
We also engage third parties that store, process and transmit these types of information on our behalf. We rely on encryption and authentication technology licensed from third parties in an effort to securely transmit confidential and sensitive information, including credit card numbers. Advances in computer capabilities, new technological discoveries or other developments may result in the whole or partial failure of this technology to protect transaction data or other confidential and sensitive information from being breached or compromised. In addition, e-commerce websites are often attacked through compromised credentials, including those obtained through phishing and credential stuffing. Our security measures, and those of our third‑party service providers, may not detect or prevent all attempts to breach our systems, denial‑of‑service attacks, viruses, malicious software, break‑ins, phishing attacks, social engineering, security breaches or other attacks and similar disruptions that may jeopardize the security of information stored in or transmitted by our websites, networks and systems or that we or such third parties otherwise maintain, including payment card systems, which may subject us to fines or higher transaction fees or limit or terminate our access to certain payment methods. We and such third parties may not anticipate or prevent all types of attacks until after they have already been launched. Further, techniques used to obtain unauthorized access to or sabotage systems change frequently and may not be known until launched against us or our third‑party service providers. In addition, security breaches can also occur as a result of non‑technical issues, including intentional or inadvertent breaches by our employees or by third parties. These risks may increase over time as the complexity and number of technical systems and applications we use also increases.
Breaches of our security measures or those of our third‑party service providers or cyber security incidents could result in unauthorized access to our sites, networks and systems; unauthorized access to and misappropriation of consumer information, including consumers’ personal data, or other confidential or proprietary information of ourselves or third parties; viruses, worms, spyware or other malware being served from our sites, networks or systems; deletion or modification of content or the display of unauthorized content on our sites; interruption, disruption or malfunction of operations; costs relating to breach remediation, deployment of additional personnel and protection technologies, response to governmental investigations and media inquiries and coverage; engagement of third‑party experts and consultants; litigation, regulatory action and other potential liabilities. In the past, we have
16
experienced social engineering, phishing, malware and similar attacks and threats of denial‑of‑service attacks; however, such attacks could in the future have a material adverse effect on our operations. If any of these breaches of security should occur, our reputation and brand could be damaged, our business may suffer, we could be required to expend significant capital and other resources to alleviate problems caused by such breaches, and we could be exposed to a risk of loss, litigation or regulatory action and possible liability. We cannot guarantee that recovery protocols and backup systems will be sufficient to prevent data loss. Actual or anticipated attacks may cause us to incur increasing costs, including costs to deploy additional personnel and protection technologies, train employees and engage third‑party experts and consultants. In addition, any party who is able to illicitly obtain a subscriber’s password could access the subscriber’s transaction data or personal information, resulting in the perception that our systems are insecure.
Any compromise or breach of our security measures, or those of our third‑party service providers, could violate applicable privacy, data protection, data security, network and information systems security and other laws and cause significant legal and financial exposure, adverse publicity and a loss of confidence in our security measures, which could have a material adverse effect on our business, results of operations, financial condition and prospects. We continue to devote significant resources to protect against security breaches or we may need to in the future to address problems caused by breaches, including notifying affected subscribers and responding to any resulting litigation, which in turn, diverts resources from the growth and expansion of our business.
We rely on retailers and brands, suppliers, third‑party carriers and transportation providers as part of our fulfilment process, and these third parties may fail to adequately serve our consumers.
We significantly rely on retailers and brands to properly and promptly prepare products ordered by our consumers for shipment. Any failure by these suppliers to timely prepare such products for shipment to our consumers will have an adverse effect on the fulfilment of consumer orders, which could negatively affect the consumer experience and harm our business and results of operations. We also rely upon third‑party carriers and transportation providers for substantially all of our merchandise shipments, including shipments of items from our retailers and brands, to our production facilities for processing, shipments returning these items to our retailers and brands and the shipments to our consumers after purchase. Our shipments are also subject to risks that could increase our distribution costs, including rising fuel costs and events such as employee strikes and inclement weather, which may impact the third party’s ability to provide delivery services that adequately meet our needs. If we needed to change shipping companies, we could face logistical difficulties that could adversely impact deliveries and we would incur costs and expend resources in connection with such change. Moreover, we may not be able to obtain terms as favorable as those received from the independent third‑party transportation providers we currently use, which would increase our costs. Any increase in shipping costs or any other significant shipping difficulties or disruptions or any failure by our retailers, brands or third‑party carriers to deliver high‑quality products to our consumers in a timely manner or to otherwise adequately serve our consumers could damage our reputation and brand and may substantially harm our business, results of operations, financial condition and prospects.
We rely on third parties to drive traffic to our website, and these providers may change their search engine algorithms or pricing in ways that could negatively affect our business, results of operations, financial condition and prospects.
Our success depends on our ability to attract consumers cost effectively. With respect to our marketing channels, we rely heavily on relationships with providers of online services, search engines, social media, directories and other websites and e-commerce businesses to provide content, advertising banners and other links that direct consumers to our websites. We rely on these relationships to provide significant sources of traffic to our website. In particular, we rely on search engines, such as Google, Bing and Yahoo! and the major mobile app stores, as important marketing channels. Search engine companies change their natural search engine algorithms periodically, and our ranking in natural searches may be adversely affected by those changes, as has occurred from time to time. Search engine companies may also determine that we are not in compliance with their guidelines and consequently penalize us in their algorithms as a result. If search engines change or penalize us with their algorithms, terms of service, display and featuring of search results, or if competition increases for advertisements, we may be unable to cost‑effectively drive consumers to our website and apps.
17
Our relationships with our marketing providers are not long term in nature and do not require any specific performance commitments. In addition, many of the parties with whom we have online advertising arrangements provide advertising services to other companies, including retailers with whom we compete. As competition for online advertising has increased, the cost for some of these services has also increased. A significant increase in the cost of the marketing providers upon which we rely could adversely impact our ability to attract consumers cost effectively and harm our business, results of operations, financial condition and prospects.
We face significant competition in the retail industry and may be unsuccessful in competing against current and future competitors.
The retail industry is intensely competitive. Online retail, including on mobile devices and tablets, is rapidly evolving and is subject to changing technology, shifting consumer preferences and tastes and frequent introductions of new products and services. We could face competition from technology enablement companies and luxury sellers. Technology enablement companies are those that enable commerce, such as Shopify or Square, and white‑label service providers that offer end‑to‑end solutions. Luxury sellers are typically either larger more established companies, such as luxury department stores, luxury brand stores or online retailers, or multichannel players that are independent retailers operating brick and mortar stores with an online presence, and these luxury sellers may have longer operating histories, greater brand recognition, existing consumer and supplier relationships and significantly greater financial, marketing and other resources. Additionally, larger competitors seeking to establish an online presence in luxury fashion may be able to devote substantially more resources to website systems development and exert more leverage over the supply chain for luxury products than we can. Larger competitors may also be better capitalized to opportunistically acquire, invest in or partner with other domestic and international businesses. We believe that companies with a combination of technical expertise, brand recognition, financial resources and e-commerce experience also pose a significant threat of developing competing luxury fashion distribution technologies. In particular, if known incumbents in the e-commerce space choose to offer competing services, they may devote greater resources than we have available, have a more accelerated time frame for deployment and leverage their existing user base and proprietary technologies to provide services or a user experience that our consumers may view as superior.
Online retail companies and marketplaces, including emerging start‑ups, may be able to innovate and provide products and services faster than we can, and they may be willing to price their products and services more aggressively in order to gain market share. In addition, traditional brick and mortar based retailers offer consumers the ability to handle and examine products in person and offer a more convenient means of returning and exchanging purchased products. If our competitors are more successful in offering compelling products or in attracting and retaining consumers than we are, our revenue and growth rates could decline.
If we are unable to compete successfully, or if competing successfully requires us to expend significant resources in response to our competitors’ actions, our business, results of operations, financial condition and prospects could be materially adversely affected.
We are subject to governmental regulation and other legal obligations related to privacy, data protection and information security. If we are unable to comply with these, we may be subject to governmental enforcement actions, litigation, fines and penalties or adverse publicity.
We collect personal data and other data from our consumers and prospective consumers. We use this information to provide services and relevant products to our consumers, to support, expand and improve our business, and to tailor our marketing and advertising efforts. We may also share consumers’ personal data with certain third parties as authorized by the consumer or as described in our privacy policy.
As a result, we are subject to governmental regulation and other legal obligations related to the protection of personal data, privacy and information security in certain countries where we do business and there has been and will continue to be a significant increase globally in such laws that restrict or control the use of personal data.
In Europe, where we have significant business operations, the data privacy and information security regime recently underwent a significant change and continues to evolve and is subject to increasingly regulatory scrutiny. The new General Data Protection Regulation (“GDPR”), which came into force on May 25, 2018, implemented
18
more stringent operational requirements for our use of personal data. These more stringent requirements include expanded disclosures to tell our consumers about how we may use their personal data, increased controls on profiling customers and increased rights for customers to access, control and delete their personal data. In addition, there are mandatory data breach notification requirements and significantly increased penalties of the greater of €20 million or 4% of global turnover for the preceding financial year. The UK’s Network and Information Systems Regulations 2018, which came into force on May 10, 2018, apply to us as an online marketplace and place additional network and information systems security obligations on us, as well as mandatory security incident notification in certain circumstances with penalties of up to £17 million.
In recent years, U.S. and European lawmakers and regulators have expressed concern over the use of third‑party cookies and similar technologies for online behavioral advertising, and laws in this area are also under reform. In the European Union, current national laws that implement the ePrivacy Directive will be replaced by an EU regulation known as the ePrivacy Regulation. In the European Union, informed consent is required for the placement of a cookie on a user’s device and for direct electronic marketing, and the GDPR also imposes additional conditions in order to satisfy such consent, such as a prohibition on pre‑checked consents. The draft ePrivacy Regulation retains these additional consent conditions and also imposes the strict opt‑in marketing rules on direct marketing that is “presented” on a web page rather than sent by email, alters rules on third‑party cookies and similar technology and significantly increases penalties for breach of the rules. Regulation of cookies and similar technologies may lead to broader restrictions on our marketing and personalization activities and may negatively impact our efforts to understand users’ internet usage, as well as the effectiveness of our marketing and our business generally. Such regulations may have a negative effect on businesses, including ours, that collect and use online usage information for consumer acquisition and marketing, it may increase the cost of operating a business that collects or uses such information and undertakes online marketing, it may also increase regulatory scrutiny and increase potential civil liability under data protection or consumer protection laws. In response to marketplace concerns about the usage of third‑party cookies and web beacons to track user behaviors, providers of major browsers have included features that allow users to limit the collection of certain data generally or from specified websites, and the ePrivacy Regulations draft also advocates the development of browsers that block cookies by default. These developments could impair our ability to collect user information, including personal data and usage information, that helps us provide more targeted advertising to our current and prospective consumers, which could adversely affect our business, given our use of cookies and similar technologies to target our marketing and personalize the consumer experience.
As the text of the ePrivacy Regulation is still under development, and as further guidance is issued and interpretation of both the ePrivacy Regulation and GDPR develop, we could incur substantial costs to comply with these regulations. The changes could require significant systems changes, limit the effectiveness of our marketing activities, adversely affect our margins, increase costs and subject us to additional liabilities.
In the United States, federal and various state governments have adopted or are considering, laws, guidelines or rules for the collection, distribution, use and storage of information collected from or about consumers or their devices. For example, in June 2018, California enacted the California Consumer Privacy Act (“CCPA”) which is presently going into effect on January 1, 2020. When effective, the new law will, among other things, require new disclosures to California consumers, impose new rules for collecting or using information about minors, and afford consumers new abilities to opt out of certain disclosures of personal information. California legislators have stated that they intend to propose amendments to the CCPA before it goes into effect, and it remains unclear what, if any, modifications will be made to this legislation or how it will be interpreted. The U.S. Congress may also pass a law to pre-empt all or part of the CCPA. As passed, the effects of the CCPA potentially are significant, however, and may require us to modify our data collection or processing practices and policies and to incur substantial costs and expenses in an effort to comply.
In China, the Personal Information Security Specification (“China Specification”) came into force on May 1, 2018. Although the China Specification is not a mandatory regulation, it nonetheless has a key implementing role in relation to China’s Cyber Security Law in respect of protecting personal information in China. Furthermore, it is likely that the China Specification will be relied on by Chinese government agencies as a standard to determine whether businesses have abided by China’s data protection rules. This China Specification has introduced many concepts and protection rules for personal information, such as “Data Controller” from GDPR. From the consent perspective the China Specification and GDPR are similar, but the China Specification has broadened the scope of
19
Personal Sensitive Information (“PSI”) as compared to GDPR (including but not limited to phone number, transaction record and purchase history, bank account, browse history, and e‑ID info such as system account, email address and corresponding password) and thus, the application of explicit consent under the China Specification is more far reaching. Furthermore, under the China Specification, the data controller must provide the purpose of collecting and using subject personal information, as well as business functions of such purpose, and the China Specification requires the data controller to distinguish its core function from additional functions to ensure the data controller will only collect personal information as needed. Our failure to comply with the China Specification could result in governmental enforcement actions, litigation, fines and penalties, which could have a material adverse effect on our business, results of operations, financial condition and prospects.
Many data protection regimes apply based on where a consumer is located, and as we expand and new laws are enacted (such as the recently enacted data protection law in Brazil) or existing laws change, we may be subject to new laws, regulations or standards or new interpretations of existing laws, regulations or standards, including those in the areas of data security, data privacy and regulation of email providers and those that require localization of certain data (such as in Russia, where we have already undertaken localization), which could require us to incur additional costs and restrict our business operations. Any failure or perceived failure by us to comply with rapidly evolving privacy or security laws such as the China Specification, policies (including our own stated privacy policies), legal obligations or industry standards or any security incident that results in the unauthorized release or transfer of personally identifiable information or other personal or consumer data may result in governmental enforcement actions, litigation (including consumer class actions), fines and penalties or adverse publicity and could cause our consumers to lose trust in us, which could have a material adverse effect on our business, results of operations, financial condition and prospects.
Our failure to address risks associated with payment methods, credit card fraud and other consumer fraud, or our failure to control any such fraud, could damage our reputation and brand and may cause our business and results of operations to suffer.
Under current credit card practices, we are liable for fraudulent credit card transactions because we do not obtain a cardholder’s signature. We do not currently carry insurance against this risk. To date, we have experienced minimal losses from credit card fraud, but we face the risk of significant losses from this type of fraud as our net sales increase and as we continue to expand globally. Our failure to adequately control fraudulent credit card transactions could damage our reputation and brand and substantially harm our business, results of operations, financial condition and prospects.
We also accept payments for many of our sales through credit and debit card transactions, which are handled through third‑party payment processors. In particular, for the year ended December 31, 2018, we relied on one third‑party payment processor, which processed, directly and indirectly, more than 80% of our transactions. As a result, we are subject to a number of risks related to credit and debit card payments, including that we pay interchange and other fees, which may increase over time and could require us to either increase the prices we charge for our products or absorb an increase in our costs and expenses. In addition, as part of the payment processing process, our consumers’ credit and debit card information is transmitted to our third‑party payment processors. We may in the future become subject to lawsuits or other proceedings for purportedly fraudulent transactions arising out of the actual or alleged theft of our consumers’ credit or debit card information if the security of our third‑party credit card payment processors are breached. We and our third‑party credit card payment processors are also subject to payment card association operating rules, certification requirements and rules governing electronic funds transfers, which could change or be reinterpreted to make it difficult or impossible for us to comply. If we or our third‑party credit card payment processors fail to comply with these rules or requirements, we may be subject to fines and higher transaction fees and lose our ability to accept credit and debit card payments from our consumers in addition to the consequences that could arise from such action or inaction violating applicable privacy, data protection, data security and other laws as outlined above, and there may be an adverse impact on our business, results of operations, financial condition and prospects.
20
Use of social media, emails and text messages may adversely impact our reputation or subject us to fines or other penalties.
We use social media, emails and text messages as part of our omnichannel approach to marketing. As laws and regulations rapidly evolve to govern the use of these channels, the failure by us, our employees or third parties acting at our direction to abide by applicable laws and regulations in the use of these channels could adversely affect our reputation or subject us to fines or other penalties. In addition, our employees or third parties acting at our direction may knowingly or inadvertently make use of social media in ways that could lead to the loss or infringement of intellectual property, as well as the public disclosure of proprietary, confidential or sensitive personal information of our business, employees, consumers or others. Any such inappropriate use of social media, emails and text messages could also cause reputational damage.
Consumers value readily available information concerning retailers and their goods and services and often act on such information without further investigation and without regard to its accuracy. Our consumers may engage with us online through our social media platforms, including Facebook, Instagram, Pinterest and Twitter, by providing feedback and public commentary about all aspects of our business. Information concerning us or our retailers and brands, whether accurate or not, may be posted on social media platforms at any time and may have a disproportionately adverse impact on our brand, reputation or business. The harm may be immediate without affording us an opportunity for redress or correction and could have a material adverse effect on our business, results of operations, financial condition and prospects.
If we are unable to successfully launch and monetize new and innovative technology, our growth and profitability could be adversely affected.
We are constantly developing new and innovative technology, such as Farfetch Store of the Future. Our ability to monetize these technologies and other new business lines in a timely manner and operate them profitably depends on a number of factors, many of which are beyond our control, including:
| • | our ability to manage the financial and operational aspects of developing and launching new technology, including making appropriate investments in our software systems, information technologies and operational infrastructure; |
| • | our ability to secure required governmental permits and approvals; |
| • | the level of commitment and interest from our actual and potential third‑party innovators; |
| • | our competitors (including our existing retailers and brands who may launch competing technologies) developing and implementing similar or better technology; |
| • | our ability to effectively manage any third‑party challenges to the intellectual property behind our technology; |
| • | our ability to collect, combine and leverage data about our consumers collected online and through our new technology in compliance with data protection laws; and |
| • | general economic and business conditions affecting consumer confidence and spending and the overall strength of our business. |
We may not be able to grow our new technologies or business lines or operate them profitability, and these new and innovative technology initiatives may never generate material revenue. In addition, the substantial management time and resources that our technology development requires may result in disruption to our existing business operations and adversely affect our financial condition, which may decrease our profitability and growth.
Our customer concentration may materially adversely affect our financial condition and results of operations.
For the year ended December 31, 2018, the top 1% of our consumers accounted for approximately 26% of our Marketplace GMV. Accordingly, our revenue, financial condition or results of operations may be unduly affected by fluctuations in the buying patterns of these consumers. If we were to lose the business of some or all of
21
these consumers, it could materially adversely affect our business, results of operations, financial condition and prospects.
Our operating results are subject to seasonal and quarterly variations in our revenue and operating income, and as a result, our quarterly results may fluctuate and could be below expectations.
Our business is seasonal and historically, we have realized a disproportionate amount of our revenue and earnings for the year in the fourth quarter as a result of the holiday season and seasonal promotions, and we expect this to continue in the future. If we experience lower than expected revenue during any fourth quarter, it may have a disproportionately large impact on our operating results and financial condition for that year. Any factors that harm our fourth quarter operating results, including disruptions in our brands’ or retailers’ supply chains or unfavorable economic conditions, could have a disproportionate effect on our results of operations for our entire fiscal year.
In anticipation of increased sales activity during the fourth quarter, we may incur significant additional expenses, including additional marketing and additional staffing in our customer support operations. In addition, we may experience an increase in our net shipping costs due to complimentary upgrades, split‑shipments, and additional long‑zone shipments necessary to ensure timely delivery for the holiday season. At peak periods, there could also be further delays by our retailers and brands in processing orders, which could leave us unable to fulfill consumer orders due to “no stock,” or in packaging a consumer’s order once received, which could lead to lower consumer satisfaction. In the future, our seasonal sales patterns may become more pronounced, may strain our personnel and production activities and may cause a shortfall in net sales as compared with expenses in a given period, which could substantially harm our business, results of operations, financial condition and prospects.
Our quarterly results of operations may also fluctuate significantly as a result of a variety of other factors, including those described above. As a result, historical period‑to‑period comparisons of our sales and operating results are not necessarily indicative of future period‑to‑period results. You should not rely on the results of a single fiscal quarter as an indication of our annual results or our future performance.
We may not accurately forecast income and appropriately plan our expenses.
We base our current and future expense levels on our operating forecasts and estimates of future income. Income and operating results are difficult to forecast because they generally depend on the volume and timing of the orders we receive, which are uncertain. Additionally, our business is affected by general economic and business conditions around the world. A softening in income, whether caused by changes in consumer preferences or a weakening in global economies, may result in decreased revenue levels, and we may be unable to adjust our spending in a timely manner to compensate for any unexpected shortfall in income. This inability could cause our (loss)/income after tax in a given quarter to be (higher)/lower than expected. We also make certain assumptions when forecasting the amount of expense we expect related to our share based payments, which includes the expected volatility of our share price, the expected life of share options granted and the expected rate of share option forfeitures. These assumptions are partly based on historical results. If actual results differ from our estimates, our net income in a given quarter may be lower than expected.
We depend on highly skilled personnel, including senior management and our technology professionals, and if we are unable to retain or motivate key personnel or hire, retain and motivate qualified personnel, our business could be harmed.
We believe our success has depended, and our future success depends, on the efforts and talents of our senior management, particularly José Neves, our founder and chief executive officer, and all of our highly skilled team members, including our software engineers, data scientists and technology professionals. Our future success depends on our continuing ability to attract, develop, motivate and retain highly qualified and skilled employees. In particular, our software engineers and technology professionals are key to designing, maintaining and improving code and algorithms necessary to our business. In addition, members of our Private Client team cater to some of our most important and highest spending consumers. If employees in our Private Client business leave Farfetch, this may impact on the ability of Farfetch to retain customers associated with such Private Client team member.
22
Competition for well‑qualified employees in all aspects of our business, including software engineers and other technology professionals, is intense globally. Our continued ability to compete effectively depends on our ability to attract new employees and to retain and motivate existing employees. If we do not succeed in attracting well‑qualified employees or retaining and motivating existing employees and key senior management, our business, results of operations, financial condition and prospects may be adversely affected.
We may not be able to manage our growth effectively, and such rapid growth may adversely affect our corporate culture.
We have rapidly and significantly expanded our operations and anticipate expanding further as we pursue our growth strategies. Such expansion increases the complexity of our business and places a significant strain on our management, operations, technical systems, financial resources and internal control over financial reporting functions. Our current and planned personnel, systems, procedures and controls may not be adequate to support and effectively manage our future operations, especially as we employ people in 13 geographic locations. We are currently in the process of transitioning certain of our business and financial systems to systems on a scale reflecting the increased size, scope and complexity of our operations, and the process of migrating our legacy systems could disrupt our ability to timely and accurately process information, which could adversely affect our results of operations and cause harm to our reputation. As a result, we may not be able to manage our expansion effectively.
Our entrepreneurial and collaborative culture is important to us, and we believe it has been a major competitive advantage and contributor to our success. We may have difficulties maintaining our culture or adapting it sufficiently to meet the needs of our future and evolving operations as we continue to grow, in particular as we grow internationally. In addition, our ability to maintain our culture as a public company, with the attendant changes in policies, practices, corporate governance and management requirements may be challenging. Failure to maintain our culture could have a material adverse effect on our business, results of operations, financial condition and prospects.
General economic factors, natural disasters or other unexpected events may adversely affect our business, financial performance and results of operations.
Our business, financial performance and results of operations depend significantly on worldwide macroeconomic economic conditions and their impact on consumer spending. Luxury products are discretionary purchases for consumers. Recessionary economic cycles, higher interest rates, volatile fuel and energy costs, inflation, levels of unemployment, conditions in the residential real estate and mortgage markets, access to credit, consumer debt levels, unsettled financial markets and other economic factors that may affect consumer spending or buying habits could materially and adversely affect demand for our products. In addition, volatility in the financial markets has had and may continue to have a negative impact on consumer spending patterns. A reduction in consumer spending or disposable income may affect us more significantly than companies in other industries and companies with a more diversified product offering. In addition, negative national or global economic conditions may materially and adversely affect our suppliers’ financial performance, liquidity and access to capital. This may affect their ability to maintain their inventories, production levels and/or product quality and could cause them to raise prices, lower production levels or cease their operations.
Economic factors such as increased commodity prices, shipping costs, inflation, higher costs of labor, insurance and healthcare, and changes in or interpretations of other laws, regulations and taxes may also increase our cost of sales and our selling, general and administrative expenses, and otherwise adversely affect our financial condition and results of operations. Any significant increases in costs may affect our business disproportionately compared to our competitors. Changes in trade policies or increases in tariffs, including those recently enacted by the United States and proposed by China, may have a material adverse effect on global economic conditions and the stability of global financial markets and may reduce international trade.
Natural disasters and other adverse weather and climate conditions, public health crises, political crises, such as terrorist attacks, war and other political instability or other unexpected events, could disrupt our operations, internet or mobile networks or the operations of one or more of our third‑party service providers. For example, the vast majority of our production processes take place at our facility in Guimarães, Portugal. If any such disaster were
23
to impact this facility, our operations would be disrupted. Such events may also impact consumer discretionary spending. If any of these events occurs, our business could be adversely affected.
We have acquired, and may continue to acquire, other companies or technologies, which could divert management’s attention and otherwise disrupt our operations and harm our operating results. We may fail to acquire companies whose market power or technology could be important to the future success of our business.
We have acquired and may in the future seek to acquire or invest in other companies or technologies that we believe could complement or expand our brand and products, enhance our technical capabilities, or otherwise offer growth opportunities. Pursuit of future potential acquisitions may divert the attention of management and cause us to incur various expenses in identifying, investigating, and pursuing suitable acquisitions, whether or not they are consummated. In addition, we may be unsuccessful in integrating our acquired businesses or any additional business we may acquire in the future, and we may fail to acquire companies whose market power or technology could be important to the future success of our business. For example, we acquired Browns in 2015, Fashion Concierge and Style.com in 2017 and Stadium Goods in 2019. We also signed agreements in 2018 and 2019 to acquire, respectively, CuriosityChina and certain assets relating to JD.com’s luxury fashion offering, Toplife, from JD.com.
We also may not achieve the anticipated benefits from any acquired business due to a number of factors, including:
| • | unanticipated costs or liabilities associated with the acquisition, including costs or liabilities arising from the acquired companies’ failure to comply with intellectual property laws and licensing obligations to which they are subject; |
| • | incurrence of acquisition‑related costs; |
| • | diversion of management’s attention from other business concerns; |
| • | regulatory uncertainties; |
| • | harm to our existing business relationships with retailers and boutiques as a result of the acquisition; |
| • | harm to our brand and reputation; |
| • | the potential loss of key employees; |
| • | use of resources that are needed in other parts of our business; and |
| • | use of substantial portions of our available cash to consummate the acquisition. |
In addition, a significant portion of the purchase price of companies we acquire may be allocated to acquired goodwill, which must be assessed for impairment at least annually. In the future, if our acquisitions do not yield expected returns, we may be required to take charges to our operating results based on this impairment assessment process. Acquisitions also could result in dilutive issuances of equity securities or the incurrence of debt, which could adversely affect our operating results. In addition, if an acquired business fails to meet our expectations, this may have a material adverse effect on our business, results of operations, financial condition and prospects.
We are involved in and may pursue strategic relationships. We may have limited control over such relationships, and these relationships may not provide the anticipated benefits.
We are involved in various strategic relationships, including with JD.com and the Chalhoub Group, which we expect will benefit our business and help us to achieve growth in China and the Middle East, respectively. For example, in February 2019, we entered into agreements to strengthen our strategic relationship with JD.com, which was driven by our aim to expand our presence in China as described in further detail in Item 7. “Major Shareholders and Related Party Transactions — B. Related Party Transactions.” We also may pursue and enter into strategic relationships in the future. Such relationships involve risks, including but not limited to: maintaining good working relationships with the other party; any economic or business interests of the other party that are inconsistent with ours; the other party’s failure to fund its share of capital for operations or to fulfill its other commitments, including providing accurate and timely accounting and financial information to us, which could negatively impact our operating results; loss of key personnel; actions taken by our strategic partners that may not be compliant with
24
applicable rules, regulations and laws; reputational concerns regarding our partners or our leadership; bankruptcy, requiring us to assume all risks and capital requirements related to the relationship, and the related bankruptcy proceedings could have an adverse impact on the relationship; and any actions arising out of the relationship that may result in reputational harm or legal exposure to us. Further, these relationships may not deliver the benefits that were originally anticipated. Any of these factors may have a material adverse effect on our business, results of operations, financial condition and prospects.
A failure to comply with current laws, rules and regulations or changes to such laws, rules and regulations and other legal uncertainties may adversely affect our business, financial performance, results of operations or business growth.
Our business and financial performance could be adversely affected by unfavorable changes in or interpretations of existing laws, rules and regulations or the promulgation of new laws, rules and regulations applicable to us and our businesses, including those relating to the internet and e-commerce, including geo‑blocking and other geographically based restrictions, internet advertising and price display, consumer protection, anti‑corruption, antitrust and competition, economic and trade sanctions, tax, banking, data security, network and information systems security, data protection and privacy. As a result, regulatory authorities could prevent or temporarily suspend us from carrying on some or all of our activities or otherwise penalize us if our practices were found not to comply with applicable regulatory or licensing requirements or any binding interpretation of such requirements. Unfavorable changes or interpretations could decrease demand for our services, limit marketing methods and capabilities, affect our margins, increase costs or subject us to additional liabilities.
For example, there are, and will likely continue to be, an increasing number of laws and regulations pertaining to the internet and e-commerce that may relate to liability for information retrieved from or transmitted over the internet, display of certain taxes and fees, online editorial and consumer‑generated content, user privacy, data security, network and information systems security, behavioral targeting and online advertising, taxation, liability for third‑party activities and the quality of services. Furthermore, the growth and development of e-commerce may prompt calls for more stringent consumer protection laws and more aggressive enforcement efforts, which may impose additional burdens on online businesses generally.
Likewise, the SEC, the U.S. Department of Justice, the U.S. Treasury Department’s Office of Foreign Assets Control (“OFAC”), the U.S. Department of State, as well as other foreign regulatory authorities continue to enforce economic and trade regulations and anti‑corruption laws, across industries. U.S. trade sanctions relate to transactions with designated foreign countries and territories, including Cuba, Iran, North Korea, Syria and the Crimea region of Ukraine (“Crimea”) as well as specially targeted individuals and entities that are identified on U.S. and other government blacklists, and those owned by them or those acting on their behalf. Anti‑corruption laws, including the U.S. Foreign Corrupt Practices Act (the “FCPA”) and the UK Bribery Act (the “Bribery Act”), generally prohibit direct or indirect corrupt payments to government officials and, under certain laws, private persons to obtain or retain business or an improper business advantage. Some of our international operations are conducted in parts of the world where it is common to engage in business practices that are prohibited by these laws.
Although we have policies and procedures in place designed to promote compliance with laws and regulations, which we review and update as we expand our operations in existing and new jurisdictions in order to proportionately address risks of non‑compliance with applicable laws and regulations, our employees, partners, or agents could take actions in contravention of our policies and procedures, or violate applicable laws or regulations. As regulations continue to develop and regulatory oversight continues to focus on these areas, we cannot guarantee that our policies and procedures will ensure compliance at all times with all applicable laws or regulations. In the event our controls should fail or we are found to be not in compliance for other reasons, we could be subject to monetary damages, civil and criminal monetary penalties, withdrawal of business licenses or permits, litigation and damage to our reputation and the value of our brand.
As we expand our operations in existing and new jurisdictions internationally, we will need to increase the scope of our compliance programs to address the risks relating to the potential for violations of the FCPA and the Bribery Act and other anti‑bribery and anti‑corruption laws. Further, the promulgation of new laws, rules and regulations, or the new interpretation of existing laws, rules and regulations, in each case that restrict or otherwise unfavorably impact the ability or manner in which we or our retailers and brands conduct business could require us to change certain aspects of our business, operations and commercial relationships to ensure compliance, which could decrease demand for services, reduce revenue, increase costs or subject us to additional liabilities.
25
We are subject to trade and economic sanctions and export laws that may govern or restrict our business, and we may be subject to fines or other penalties for non‑compliance with those laws.
We are subject to U.S. laws and regulations that may govern or restrict our business and activities in certain countries and with certain persons, including trade and economic sanctions regulations administered by OFAC and the Export Administration Regulations administered by the U.S. Commerce Department’s Bureau of Industry and Security (“BIS”). In March 2018, we determined that certain products purchased on our Marketplace were shipped to addresses associated with Crimea. In December 2014, the United States announced a near complete embargo on exports of items from the United States to Crimea. On April 27, 2018, we submitted an initial voluntary self‑disclosure regarding these shipments to OFAC and BIS, and on October 24, 2018 we submitted our final voluntary self-disclosure report (“Final Disclosure”) outlining the results of our review of this matter. As described in the Final Disclosure, we determined that three products purchased on our Marketplace from retailers or brands in the United States were shipped to parties whose addresses are associated with Crimea and that on one occasion, a retailer on our Marketplace outside the United States shipped what appears to be a U.S.‑origin product to an address associated with Crimea. The combined value of the four shipments at issue in the Final Disclosure was $391.24. Since March 2018 we have put in place measures designed to prevent the fulfilment of orders associated with addresses in Crimea and these measures are described in the Final Disclosure. By letter dated February 25, 2019, the U.S. Commerce Department closed out the matter with the issuance of a Warning Letter and no assessment of a monetary penalty. We cannot predict how long it will take OFAC to complete its review of the Final Disclosure and reach a determination on these shipments to Crimea. If we are found to be in violation of U.S. sanctions or export control laws, in relation to these shipments or other matters in the future, it could result in fines and penalties for us, which could be substantial. Moreover, notwithstanding the safeguards we have put in place to ensure compliance with U.S. sanctions or export control laws, we cannot be certain that these safeguards will be effective in all cases. In the future, additional U.S. trade and economic sanctions regulations, enacted due to geopolitics or otherwise, could restrict our ability to generate revenue in certain other countries, such as Russia, which could adversely affect our business.
We are subject to customs and international trade laws that could require us to modify our current business practices and incur increased costs or could result in a delay in getting products through customs and port operations, which may limit our growth and cause us to suffer reputational damage.
Our business is conducted worldwide, with goods imported from and exported to a substantial number of countries. The vast majority of products sold on our Marketplace are shipped internationally. We are subject to numerous regulations, including customs and international trade laws, that govern the importation and sale of luxury goods. Our consumers in certain countries, such as China and Russia, are also subject to limitations and regulations governing the import of luxury goods. In addition, we face risks associated with trade protection laws, policies and measures and other regulatory requirements affecting trade and investment, including loss or modification of exemptions for taxes and tariffs, imposition of new tariffs and duties and import and export licensing requirements in the countries in which we operate, in particular in China, where trade relations between the United States and China are uncertain and in the United Kingdom, where an exit from the European Union could result in the creation of additional restrictions or regulations concerning our operations in and outside of the United Kingdom. Our failure to comply with import or export rules and restrictions or to properly classify items under tariff regulations and pay the appropriate duties could expose us to fines and penalties. If these laws or regulations were to change or were violated by our management, employees, retailers or brands, we could experience delays in shipments of our goods, be subject to fines or penalties, or suffer reputational harm, which could reduce demand for our services and negatively impact our results of operations.
Legal requirements are frequently changed and subject to interpretation, and we are unable to predict the ultimate cost of compliance with these requirements or their effects on our operations. We may be required to make significant expenditures or modify our business practices to comply with existing or future laws and regulations, which may increase our costs and materially limit our ability to operate our business.
Our business depends on our ability to source and distribute products in a timely manner. As a result, we rely on the free flow of goods through open and operational ports worldwide. Labor disputes or other disruptions at ports create significant risks for our business, particularly if work slowdowns, lockouts, strikes or other disruptions occur. Any of these factors could result in reduced sales or canceled orders, which may limit our growth and damage our
26
reputation and may have a material adverse effect on our business, results of operations, financial condition and prospects.
Governmental control of currency conversion may limit our ability to utilize our cash balances effectively and affect our ability to pay dividends in the future.
We are subject to governmental regulation of currency conversion and transfers, which may particularly affect our subsidiaries in certain jurisdictions. For example, the Chinese government imposes controls on the convertibility of the Renminbi (“RMB”) into foreign currencies and, in certain cases, the remittance of currency out of China. Our revenue is partially derived from sales to consumers in China and earnings from our Chinese operations, and substantially all of our revenue from such sales is denominated in RMB. Shortages in the availability of foreign currency may restrict the ability of our Chinese operations to remit sufficient foreign currency to pay dividends or to make other payments to us, or otherwise to satisfy their foreign currency‑denominated obligations. Under existing Chinese foreign exchange regulations, payments of current account items, including profit distributions, interest payments and expenditures from trade‑related transactions, can be made in foreign currencies without prior approval from China’s State Administration of Foreign Exchange (“SAFE”) by complying with certain procedural requirements. However, for any Chinese company, dividends can be declared and paid only out of the retained earnings of that company under Chinese law. Under Chinese laws, rules and regulations, each of our subsidiaries incorporated in China is required to set aside at least 10% of its net income each year to fund certain statutory reserves until the cumulative amount of such reserves reaches 50% of its registered capital. These reserves, together with the registered capital, are not distributable as cash dividends. As a result of these laws, rules and regulations, our subsidiaries incorporated in China are restricted in their ability to transfer a portion of their respective net assets to their shareholders as dividends, loans or advances.
Furthermore, approval from SAFE or its local branch is required where RMB are to be converted into foreign currencies and remitted out of China to pay capital expenses, such as the repayment of loans denominated in foreign currencies. Without a prior approval from SAFE, cash generated from our operations in China may not be used to pay off debt in a currency other than the RMB owed by entities within China to entities outside China, or make other capital expenditures outside China in a currency other than the RMB.
The Chinese government may also at its discretion restrict access in the future to foreign currencies for current account transactions. In response to the persistent capital outflow in China and RMB’s depreciation against the U.S. dollar in the fourth quarter of 2016, the People’s Bank of China and SAFE have implemented a series of capital control measures over recent months, including stricter vetting procedures for China‑based companies to remit foreign currency for overseas acquisitions, dividend payments and shareholder loan repayments. For instance, on January 26, 2017, SAFE issued the Notice of State Administration of Foreign Exchange on Improving the Review of Authenticity and Compliance to Further Promote Foreign Exchange Control, which stipulates several capital control measures with respect to the outbound remittance of profit from domestic entities to offshore entities, including (1) under the principle of genuine transaction, banks shall check board resolutions regarding profit distribution, the original version of tax filing records and audited financial statements; and (2) domestic entities shall hold income to account for previous years’ losses before remitting the profits. The People’s Republic of China government may continue to strengthen its capital controls, and more restrictions and substantial vetting process may be put in place by SAFE for cross‑border transactions falling under both the current account and the capital account. If the foreign exchange control system prevents us from obtaining sufficient foreign currency to satisfy our currency demands, we may not be able to pay dividends in currencies other than RMB to our shareholders or service and repay our indebtedness when due.
For us to receive dividends from our operations in China, repatriation of funds from China to the United Kingdom will be required under our current structure. Insofar as such repatriation requires the prior approval of SAFE or is deemed to not be in compliance with the authenticity and compliance requirements, we could be delayed, restricted or limited in receiving dividends from our Chinese subsidiaries, which may limit our ability to pay dividends to holders of the Class A ordinary shares or otherwise fund and conduct our business. Moreover, there can be no assurance that the rules and regulations pursuant to which SAFE grants or denies such approval will not change in a way that adversely affects our ability to receive dividends from our Chinese operations, which, in turn, would restrict our ability to pay dividends to our shareholders or otherwise fund and conduct our business.
27
Application of existing tax laws, rules or regulations are subject to interpretation by taxing authorities.
The application of the tax laws of various jurisdictions to our international business activities is subject to interpretation. The taxing authorities of the jurisdictions in which we operate may challenge our methodologies for valuing developed technology or intercompany arrangements, including our transfer pricing, or determine that the manner in which we operate our business does not achieve the intended tax consequences, which could increase our worldwide effective tax rate and adversely affect our financial position and results of operations.
Significant judgment and estimation is required in determining our worldwide tax liabilities. In the ordinary course of our business, there are transactions and calculations, including intercompany transactions and cross‑jurisdictional transfer pricing, for which the ultimate tax determination is uncertain or otherwise subject to interpretation. Tax authorities in any of the countries in which we operate may disagree with our intercompany charges, including the amount of, or basis for, such charges, cross‑jurisdictional transfer pricing or other matters such as the allocation of certain interest expenses and other tax items, and assess additional taxes.
As we operate in numerous taxing jurisdictions, the application of tax laws can be subject to diverging and sometimes conflicting interpretations by tax authorities of these jurisdictions. It is not uncommon for taxing authorities in different countries to have conflicting views, for instance, with respect to, among other things, whether a permanent establishment exists in a particular jurisdiction, the manner in which the arm’s length standard is applied for transfer pricing purposes, or with respect to the valuation of intellectual property. For example, if the taxing authority in one country where we operate were to reallocate income from another country where we operate, and the taxing authority in the second country did not agree with the reallocation asserted by the first country, we could become subject to tax on the same income in both countries, resulting in double taxation. If taxing authorities were to allocate income to a higher tax jurisdiction, subject our income to double taxation or assess interest and penalties, it could increase our tax liability, which could adversely affect our financial position and results of operations.
Although we believe our tax estimates and methodologies are reasonable, a taxing authority’s final determination in the event of a tax audit could materially differ from our historical corporate income tax provisions and accruals, in which case we may be subject to additional tax liabilities, possibly including interest and penalties, which could have a material adverse effect on our cash flows, results of operations, financial condition and prospects. Furthermore, taxing authorities have become more aggressive in their interpretation and enforcement of such laws, rules and regulations over time, as governments are increasingly focused on ways to increase revenues. This has contributed to an increase in audit activity and harsher stances by tax authorities. As such, additional taxes or other assessments may be in excess of our current tax reserves or may require us to modify our business practices to reduce our exposure to additional taxes going forward, any of which may have a material adverse effect on our business, results of operations, financial condition and prospects.
Amendments to existing tax laws, rules or regulations or enactment of new unfavorable tax laws, rules or regulations could have an adverse effect on our business and financial performance.
Many of the underlying laws, rules or regulations imposing taxes and other obligations were established before the growth of the internet and e-commerce. Tax authorities in non‑U.S. jurisdictions and at the U.S. federal, state and local levels are currently reviewing the appropriate treatment of companies engaged in internet commerce and considering changes to existing tax or other laws that could regulate our transmissions and/or levy sales, income, consumption, use or other taxes relating to our activities, and/or impose obligations on us to collect such taxes. For example, in March 2018 the European Commission proposed new rules for taxing digital business activities in the European Union. We cannot predict the effect of current attempts to impose taxes on commerce over the internet. If such tax or other laws, rules or regulations were amended, or if new unfavorable laws, rules or regulations were enacted, the results could increase our tax payments or other obligations, prospectively or retrospectively, subject us to interest and penalties, decrease the demand for our services if we pass on such costs to the consumer, result in increased costs to update or expand our technical or administrative infrastructure or effectively limit the scope of our business activities if we decided not to conduct business in particular jurisdictions. As a result, these changes may have a material adverse effect on our business, results of operations, financial condition and prospects.
28
In addition, various governments and intergovernmental organizations could introduce proposals for tax legislation, or adopt tax laws, that may have a significant adverse effect on our worldwide effective tax rate, or increase our tax liabilities, the carrying value of deferred tax assets, or our deferred tax liabilities. For example, in October 2015, the Organization for Economic Co‑Operation and Development (“OECD”) released a final package of recommended tax measures for member nations to implement in an effort to limit “base erosion and profit shifting” (“BEPS”) by multinational companies. Since then, the OECD has continued to monitor key areas of action and issue additional reports and guidance on implementation of the BEPS recommendations. Multiple jurisdictions, including some of the countries in which we operate, have begun implementing recommended changes aimed at addressing perceived issues within their respective tax systems that may lead to reduced tax liabilities among multinational companies. It is possible that other jurisdictions in which we operate or do business could react to the BEPS initiative or their own concerns by enacting tax legislation that could adversely affect us through increasing our tax liabilities.
In December 2017, the United States enacted significant changes to the U.S. tax system (informally titled the “Tax Cuts and Jobs Act”). Among such significant changes, the Tax Cuts and Jobs Act reduced the marginal U.S. corporate income tax rate from 35% to 21%, limited the deduction for net business interest expense, shifted the United States toward a more territorial tax system, imposed a one‑time tax on accumulated offshore earnings held in cash and illiquid assets, and imposed new taxes to combat erosion of the U.S. federal income tax base. The Treasury Department and the IRS have already issued and are expected to continue to provide guidance on the implementation of the Tax Cuts and Jobs Acts. Based on our evaluation of the Tax Cuts and Jobs Act, we do not expect these changes to have an impact on our business, however, we cannot be certain that additional guidance from the Treasury Department and the IRS or additional changes to other U.S. tax laws, rules or regulations will not impact our business or results of operations in the future
The application of indirect taxes and the impact of managing our business model transition to a commissionaire structure could adversely affect our business and results of operations.
The application of indirect taxes, such as sales and use tax, value‑added tax, provincial taxes, goods and services tax, business tax and gross receipt tax, to our business and to our retailers and brands is a complex and evolving issue. Significant judgment is required to evaluate applicable tax obligations. As a result amounts recorded may be subject to adjustments by the relevant tax authorities. In many cases, the ultimate tax determination is uncertain because it is not clear how new and existing statutes might apply to our business or to the businesses of our retailers and brands. One or more states, the federal government or other countries may seek to impose additional reporting, record‑keeping or indirect tax collection obligations on businesses like ours that facilitate e-commerce. For example, state and local taxing authorities in the United States and taxing authorities in other countries have identified e-commerce platforms as a means to calculate, collect and remit indirect taxes for transactions taking place over the internet. Multiple U.S. states have enacted related legislation and other states are now considering such legislation. Furthermore, the U.S. Supreme Court has held in South Dakota v. Wayfair that a U.S. state may require an online retailer to collect sales taxes imposed by that state, even if the retailer has no physical presence in that state, thus permitting a wider enforcement of such sales tax collection requirements. Such legislation could require us or our retailers and brands to incur substantial costs in order to comply, including costs associated with legal advice, tax calculation, collection, remittance and audit requirements, which could make selling in such markets less attractive and could adversely affect our business.
We have historically operated under a “de‑coupling structure,” meaning that our business model currently involves a supply, which is the sale of goods to end consumers, by our retailers and brands, and then a separate supply by us comprising the shipping of those goods to the end consumers. However, the European Commission and courts in the United Kingdom are currently considering the effectiveness of such a structure from an indirect tax viewpoint. If this leads to a change in legislation or a change in interpretation of current legislation, we could be assessed to additional amounts of value added tax. To provide more certainty, we are transitioning our business model to one in which we will act as an “undisclosed agent” or “commissionaire” of our retailers and brands. For the purposes of calculating value added tax, our end consumers will contract with and be invoiced by us and there will be a supply by us to the end consumer of goods and other related services, although the legal sale of goods will continue to be between our retailers and brands and the end consumer. Such a transition is intended to provide greater certainty to our value added tax accounting position without materially increasing our overall value added tax liabilities.
29
Our ability to achieve our business and financial objectives is subject to risks and uncertainties. Implementing the new business model requires a considerable investment of technical, financial and legal resources. If we are unable to successfully establish our new business model, our business, results of operations, financial condition and prospects could be negatively impacted.
We may be subject to claims that items listed on our website, or their descriptions, are counterfeit, infringing or illegal.
We occasionally receive communications alleging that items listed on our Marketplace infringe third‑party copyrights, trademarks or other intellectual property rights. We have intellectual property complaint and take‑down procedures in place to address these communications. We follow these procedures to review complaints and relevant facts to determine the appropriate action, which may include removal of the item from our website and, in certain cases, discontinuing our relationship with a retailer or brand who repeatedly violates our policies. However, our procedures may not effectively reduce or eliminate our liability. In particular, we may be subject to civil or criminal liability for activities carried out, including products listed, by retailers or brands on our platform.
Regardless of the validity of any claims made against us, we may incur significant costs and efforts to defend against or settle them and such claims could lead to negative publicity and damage to our reputation. If a governmental authority determines that we have aided and abetted the infringement or sale of counterfeit goods, we could face regulatory, civil or criminal penalties. Successful claims by third‑party rights owners could require us to pay substantial damages or refrain from permitting any further listing of the relevant items. These types of claims could force us to modify our business practices, which could lower our revenue, increase our costs or make our Marketplace less user friendly. Moreover, public perception that counterfeit or other unauthorized items are common on our Marketplace, even if factually incorrect, could result in negative publicity and damage to our reputation.
If our retailers and brands experience any recalls, product liability claims, or government, customer or consumer concerns about product safety with respect to products sold on our Marketplace, our reputation and sales could be harmed.
Our retailers and brands are subject to regulation by the U.S. Consumer Product Safety Commission and similar state and international regulatory authorities, and their products sold on our platform could be subject to involuntary recalls and other actions by these authorities. Concerns about product safety, including concerns about the safety of products manufactured in developing countries, could lead our retailers and brands to recall selected products sold on our Marketplace. Recalls and government, customer or consumer concerns about product safety could harm our reputation and reduce sales, either of which could have a material adverse effect on our business, results of operations, financial condition and prospects.
Our global operations involve additional risks, and our exposure to these risks will increase as our business continues to expand.
We operate in a number of jurisdictions and intend to continue to expand our global presence, including in emerging markets. We face complex, dynamic and varied risk landscapes in the markets in which we operate. As we enter countries and markets that are new to us, we must tailor our services and business model to the unique circumstances of such countries and markets, which can be complex, difficult, costly and divert management and personnel resources. In addition, we may face competition in other countries from companies that may have more experience with operations in such countries or with global operations in general. Laws and business practices that favor local competitors or prohibit or limit foreign ownership of certain businesses or our failure to adapt our practices, systems, processes and business models effectively to the consumer and supplier preferences of each country into which we expand, could slow our growth. Certain markets in which we operate have, or certain new markets in which we may operate in the future may have, lower margins than our more mature markets, which could have a negative impact on our overall margins as our revenue from these markets grow over time.
30
In addition to the risks outlined elsewhere in this section, our global operations are subject to a number of other risks, including:
| • | currency exchange restrictions or costs and exchange rate fluctuations; |
| • | exposure to local economic or political instability, threatened or actual acts of terrorism and security concerns in general; |
| • | compliance with various laws and regulatory requirements relating to anti‑corruption, antitrust or competition, economic sanctions, data content, data protection and privacy, consumer protection, employment and labor laws, health and safety, and advertising and promotions; |
| • | differences, inconsistent interpretations and changes in various laws and regulations, including international, national, state and provincial and local tax laws; |
| • | weaker or uncertain enforcement of our contractual and intellectual property rights; |
| • | preferences by local populations for local providers; |
| • | slower adoption of the internet and mobile devices as advertising, broadcast and commerce mediums and the lack of appropriate infrastructure to support widespread internet and mobile device usage in those markets; |
| • | our ability to support new technologies, including mobile devices, that may be more prevalent in certain global markets; |
| • | difficulties in attracting and retaining qualified employees in certain international markets, as well as managing staffing and operations due to increased complexity, distance, time zones, language and cultural differences; and |
| • | uncertainty regarding liability for services and content, including uncertainty as a result of local laws and lack of precedent. |
The United Kingdom’s expected withdrawal from the European Union may have a negative effect on global economic conditions, financial markets and our business.
We are a multinational company with worldwide operations, including significant business operations in Europe. The United Kingdom is due to leave the European Union on March 29, 2019. Negotiations between the United Kingdom and the European Union remain ongoing and are complex, and there can be no assurance regarding the terms (if any) or timing of any resulting agreement. The withdrawal process has created significant uncertainty about the future relationship between the United Kingdom and the European Union, and this may have political consequences not only in the United Kingdom, but also in other European Union member states.
Although the terms upon which the United Kingdom is expected to withdraw from the European Union are still being negotiated, it is possible that such withdrawal could lead to greater restrictions on the free movement of goods, services, people and capital, and increased regulatory complexities. As we are headquartered in the United Kingdom, any such restrictions on the movement of goods and services could have a material adverse effect on our operations. Increased complexities related to the import and export of products, imposition of duties, transfers of personal data and changes in item pricing may impact our consumer experience and have a material adverse effect on our business and results of operations. In addition, a possible restriction on the free movement of people between the United Kingdom and the European Union could have a material adverse effect on us, since we compete in these jurisdictions for well qualified employees in all aspects of our business, including software engineers and other technology professionals. Any impact on our ability to attract new employees and to retain existing employees in their current jurisdictions could decrease our competitiveness and have a material adverse effect on our business and results of operations.
These developments, and their potential consequences, have had and may continue to have a material adverse effect on global economic conditions and the stability of global financial markets and could significantly reduce global market liquidity and restrict the ability of key market participants to operate in certain financial markets. Additionally, asset valuations, currency exchange rates and credit ratings have been and may continue to be
31
subject to increased market volatility. Lack of clarity about future UK laws and regulations, including financial laws and regulations, tax and free trade agreements, immigration and employment laws, could increase costs, depress economic activity, impair our ability to attract and retain qualified personnel and have other adverse consequences. Any of these factors may have a material adverse effect on our business, results of operations, financial condition and prospects.
We may be subject to general litigation, regulatory disputes and government inquiries.
As a growing company with expanding operations, we have in the past faced, and may in the future increasingly face, the risk of claims, lawsuits, government investigations, and other proceedings involving competition and antitrust, intellectual property, privacy, consumer protection, accessibility claims, securities, tax, labor and employment, commercial disputes, services and other matters. The number and significance of these disputes and inquiries have increased as the political and regulatory landscape changes, and as we have grown larger and expanded in scope and geographic reach, and our services have increased in complexity.
We cannot predict the outcome of such disputes and inquiries with certainty. Regardless of the outcome, these can have an adverse impact on us because of legal costs, diversion of management resources, and other factors. Determining reserves for any litigation is a complex and fact‑intensive process that is subject to judgment calls. It is possible that a resolution of one or more such proceedings could require us to make substantial payments to satisfy judgments, fines or penalties or to settle claims or proceedings, any of which could harm our business. These proceedings could also result in reputational harm, criminal sanctions, consent decrees or orders preventing us from offering certain products, or services, or requiring a change in our business practices in costly ways or requiring development of non‑infringing or otherwise altered products or technologies. Litigation and other claims and regulatory proceedings against us could result in unexpected expenses and liabilities, which could have a material adverse effect on our business, results of operations, financial condition and prospects.
We are subject to regulatory activity and antitrust litigation under competition laws.
We are subject to scrutiny by various government agencies, including competition authorities. Some jurisdictions also provide private rights of action for competitors or consumers to assert claims of anti‑competitive conduct. Other companies or government agencies have in the past and may in the future allege that our actions violate the antitrust or competition laws of the European Commission or other countries or otherwise constitute unfair competition. We do not control the pricing strategies of our retailers and brands (other than Browns), and such pricing strategies may be subject to challenges from various government agencies including competition authorities. An increasing number of governments are regulating competition law activities, including increased scrutiny in large markets such as China. Our business partnerships or agreements or arrangements with customers or other companies could give rise to regulatory action or antitrust litigation. In July 2017, Carré Couture, a small European competitor, which was declared bankrupt in May 2018, filed a complaint with the European Commission claiming that our retailer partnership agreements restrict competition because we ask retailers to commit to the relationship and list their inventory with us and not on competing platforms. We have responded to the allegations, and the complaint is pending. Complaints often remain open for a considerable period of time for procedural reasons. The European Commission is under a legal obligation to assess complaints, and unless a complaint is withdrawn, it must reject it by a formal decision where it takes the view that there are no grounds for action. Due to this process, complaints often remain open for several years. Some regulators may perceive our business to be used so broadly that otherwise uncontroversial business practices could be deemed anticompetitive. Certain competition authorities have conducted market studies of our industries. Such claims and investigations, even if without foundation, may be very expensive to defend, involve negative publicity and substantial diversion of management time and effort and could result in significant judgments against us or require us to change our business practices.
Risks Relating to our Intellectual Property
Failure to adequately protect, maintain or enforce our intellectual property rights could substantially harm our business and results of operations.
We rely on a combination of trademark, copyright, confidential information, trade secrets and patent law, and contractual restrictions to protect our intellectual property. The protection offered by these has its limitations.
32
Despite our efforts to protect and enforce our proprietary rights, unauthorized parties have used, and may in the future use, our trademarks or similar trademarks, copy aspects of our website images, features, compilation and functionality or obtain and use information that we consider as proprietary, such as the technology used to operate our website or our content.
We do not have comprehensive registered protection for all of our brands in all jurisdictions around the world. There is no guarantee that our pending trademark applications for any brand will proceed to registration, and even those trademarks that are registered could be challenged by a third party including by way of revocation or invalidity actions. Our competitors have adopted, and other competitors may adopt, service names similar to ours, thereby impeding our ability to build brand identity and possibly diluting our brand and leading to brand dilution or consumer confusion. In addition, there could be potential trade name or trademark ownership or infringement claims brought by owners of other rights, including registered trademarks, in our marks or marks similar to ours, including FARFETCH and BROWNS. Any such claims, brand dilution or consumer confusion related to our brands (including our trademarks) could damage our reputation and brand identity and substantially harm our business and results of operations.
In addition to our registered trademark protection, we have several published and unpublished patent applications in the United Kingdom, Europe and internationally, for aspects of our proprietary technology and we may file further patent applications in the future. There is no guarantee that these will result in issued patents, and even if these proceed to grant, they could be vulnerable to challenge by third parties, or their claims could be narrowed in scope by the issuing patent office such that they no longer adequately protect our proprietary technology. Further, we may decide not to pursue a patent application for an innovation due to the high costs, diversion of management time, and publication of the underlying innovation that arises from an application. The loss of our material intellectual property as a result of any claims or challenges, or the natural expiry of our intellectual property registrations, could have a material adverse effect on our business, results of operations, financial condition and prospects.
Domain names generally are regulated by internet regulatory bodies, and the regulation of domain names is subject to change. Regulatory bodies have and may continue to establish additional top‑level domains, appoint additional domain name registrars or modify the requirements for holding domain names. We may not be able to, or it may not be cost effective to, acquire or maintain all domain names that utilize the name “Farfetch” or other business brands in all of the countries in which we currently conduct or intend to conduct business. If we lose the ability to use a domain name, we could incur significant additional expenses to market our products within that country, including the development of new branding. This could substantially harm our business, results of operations, financial condition and prospects.
We rely on multiple software programmers (as employees or independent consultants) to design our proprietary technologies and photographers (as employees or independent consultants) to capture the products sold on our platform. Although we make every effort to ensure appropriate and comprehensive assignment or license terms are included in the contracts with such third parties, we cannot guarantee that we own or are properly licensed to use all of the intellectual property in such software or images. If we do not have, or lose our ability to use, such software or images, we could incur significant additional expense to remove such assets from our platform or re‑engineer a portion of our technologies.
Litigation or similar proceedings have been necessary in the past and may be necessary in the future to protect, register and enforce our intellectual property rights, to protect our trade secrets and domain names and to determine the validity and scope of the proprietary rights of others. Further, any changes in law or interpretation of any such laws, particularly intellectual property laws, may impact our ability to protect, register or enforce our intellectual property rights. Any litigation or adverse priority proceeding could result in substantial costs and diversion of resources and could substantially harm our business, results of operations, financial condition and prospects.
33
Assertions by third parties of infringement or misappropriation by us of their intellectual property rights or confidential know how could result in significant costs and substantially harm our business and results of operations.
Third parties have, and may in the future, assert that we have infringed or misappropriated their trademarks, copyrights, confidential know how, trade secrets, patents or other intellectual property rights. We cannot predict whether any such assertions or claims arising from such assertions will substantially harm our business and results of operations, whether or not they are successful. If we are forced to defend against any infringement or other claims relating to the trademarks, copyright, confidential know how, trade secrets, patents or other intellectual property rights of third parties, whether they are with or without merit or are determined in our favor, we may face costly litigation or diversion of technical and management personnel. Furthermore, the outcome of a dispute may be that we would need to cease use of some portion of our technology, develop non‑infringing technology, pay damages, costs or monetary settlements or enter into royalty or licensing agreements. Royalty or licensing agreements, if required, may be unavailable on terms acceptable to us, or at all. Any such assertions or litigation could materially adversely affect our business, results of operations, financial condition and prospects.
In 2008 and 2009, a party related to Farfetch founder José Neves (the “Related Party”) executed two agreements (the “KH Licenses”) purporting to license certain know how (the “Know How”) from the Related Party to two third‑party LLPs (the “LLPs”). The Know How was a high level explanation of the Farfetch platform and business model. The 2008 KH License expired in April 2018, and the 2009 KH License expires in April 2019. The KH Licenses did not include a license of any software code. The LLPs granted intra‑group sub‑licenses of the collective Know How under the KH Licenses, which was then further sub‑licensed under two direct “Product and Development and Marketing Support Agreements” with Farfetch in 2008 and 2009, respectively (the “Direct Agreements”), in order for Farfetch to, among other services, develop the code, website architecture and brand that comprised the original Farfetch offering (the “Developed IP”). Under the terms of the Direct Agreements, the third party, rather than Farfetch, owned the Developed IP. In 2011, the licensing structure was amended and the intra‑group sub‑licenses from the LLPs were superseded by licenses of the Know How granted by each of the LLPs to Mr. Neves, who licensed such Know How (by way of a sub‑sub‑license) to Farfetch. Finally in 2011, the Direct Agreements were terminated, and the Developed IP was assigned from the third‑party group to Farfetch.
In 2013, the Related Party executed a “Declaration regarding copyrights and intellectual property rights” (the “Declaration”), which declared that, among other things, between the period November 16, 1996 to February 27, 2010, the Related Party has not created any works or done anything which could originate intellectual property rights (defined to include know how) in connection with any of the entities in the original license chain (including Farfetch); any unknown intellectual property generated by the Related Party and used, licensed or in any other way exploited by those entities (including Farfetch) is transferred in full to Mr. Neves; and the Related Party agrees that any intellectual property in use by the above entities that were to become recognized by a court as belonging to the Related Party shall be transferred to Mr. Neves for €500. On April 29, 2014, Mr. Neves assigned all of his intellectual property rights and know how (including that obtained under the Declaration) to Farfetch.com. While seemingly conclusive, it is possible that the Declaration could be challenged. Although we do not expect our right to use the Know How to be successfully challenged, any such challenge could give rise to: (1) temporary injunctive relief which could restrict the use of such Know How by Farfetch and therefore operations of our business; (2) reputational damage; and/or (3) damages payable by Farfetch to the Related Party for any period of unauthorized use of the Know How following expiry of the KH License(s), any of which could have a material adverse effect on our business, results of operations, financial condition and prospects.
Our use of open source software may pose particular risks to our proprietary software and systems.
We use open source software in our proprietary software and systems and will use open source software in the future. The licenses applicable to our use of open source software may require that source code that is developed using open source software be made available to the public and that any modifications or derivative works to certain open source software continue to be licensed under open source licenses. From time to time, we may face claims from third parties claiming infringement of their intellectual property rights, or demanding the release or license of the open source software or derivative works that we developed using such software (which could include our proprietary source code) or otherwise seeking to enforce the terms of the applicable open source license. These claims could result in litigation and could require us to purchase a costly license, publicly release the affected
34
portions of our source code, be limited in or cease using the implicated software unless and until we can re‑engineer such software to avoid infringement or change the use of, or remove, the implicated open source software. In addition to risks related to license requirements, use of certain open source software can lead to greater risks than use of third‑party commercial software, as open source licensors generally do not provide warranties, indemnities or other contractual protections with respect to the software (for example, non‑infringement or functionality). Our use of open source software may also present additional security risks because the source code for open source software is publicly available, which may make it easier for hackers and other third parties to determine how to breach our website and systems that rely on open source software. Any of these risks could be difficult to eliminate or manage, and, if not addressed, could have a material adverse effect on our business, results of operations, financial condition and prospects.
Risks Relating to Ownership of our Class A Ordinary Shares
Our operating results and Class A ordinary share price may be volatile, and the market price of our Class A ordinary shares may drop below the price you pay.
Our quarterly operating results are likely to fluctuate in the future in response to numerous factors, many of which are beyond our control, including each of the factors set forth above.
In addition, securities markets worldwide have experienced, and are likely to continue to experience, significant price and volume fluctuations. This market volatility, as well as general economic, market or political conditions, could subject the market price of our Class A ordinary shares to wide price fluctuations regardless of our operating performance. Our operating results and the trading price of our Class A ordinary shares may fluctuate in response to various factors, including the risks described above.
These and other factors, many of which are beyond our control, may cause our operating results and the market price and demand for our Class A ordinary shares to fluctuate substantially. Fluctuations in our quarterly operating results could limit or prevent investors from readily selling their Class A ordinary shares and may otherwise negatively affect the market price and liquidity of Class A ordinary shares. In addition, in the past, when the market price of a stock has been volatile, holders of that stock have sometimes instituted securities class action litigation against the company that issued the shares. If any of our shareholders bring a lawsuit against us, we could incur substantial costs defending the lawsuit. Such a lawsuit could also divert the time and attention of our management from our business, which could significantly harm our profitability and reputation.
Our chief executive officer, José Neves, has considerable influence over important corporate matters due to his ownership of us. Our dual‑class voting structure will limit your ability to influence corporate matters and could discourage others from pursuing any change of control transactions that holders of our Class A ordinary shares may view as beneficial.
Our chief executive officer, Mr. Neves, has considerable influence over important corporate matters due to his ownership of us. Our ordinary shares are divided into Class A ordinary shares and Class B ordinary shares. Holders of Class A ordinary shares are entitled to one vote per share in respect of matters requiring the votes of shareholders, while holders of Class B ordinary shares are entitled to 20 votes per share, subject to certain exceptions. Each Class B ordinary share is convertible into one Class A ordinary share at any time by the holder thereof, while Class A ordinary shares are not convertible into Class B ordinary shares under any circumstances. Upon any transfer of Class B ordinary shares by a holder thereof to any person or other entity, other than an affiliate of Mr. Neves, such Class B ordinary shares will be automatically and immediately converted into the equal number of Class A ordinary shares. Due to the disparate voting powers associated with our two classes of ordinary shares, Mr. Neves holds approximately 76.6% of the aggregate voting power of our company. As a result, Mr. Neves has considerable influence over matters such as electing or removing directors, approving any amendments to our Articles and approving material mergers, acquisitions or other business combination transactions. In addition, under our Articles, our board of directors (“Board”) will not be able to form a quorum without Mr. Neves for so long as Mr. Neves remains a director. This concentrated control will limit your ability to influence corporate matters and could also discourage others from pursuing any potential merger, takeover or other change of control transactions, which could have the effect of depriving the holders of our Class A ordinary shares of the opportunity to sell their shares at a premium over the prevailing market price.
35
We are eligible to be treated as an emerging growth company, as defined in the Securities Act, and we cannot be certain if the reduced disclosure requirements applicable to emerging growth companies will make our Class A ordinary shares less attractive to investors because we may rely on these exemptions.
We are eligible to be treated as an emerging growth company, as defined in Section 2(a) of the Securities Act, as modified by the Jumpstart Our Business Startups Act of 2002, and we may take advantage of certain exemptions from various reporting requirements that are applicable to other public companies that are not emerging growth companies, including presenting only limited selected financial data and not being required to comply with the auditor attestation requirements of Section 404 of the Sarbanes‑Oxley Act. As a result, our shareholders may not have access to certain information that they may deem important. We could be an emerging growth company for up to five years, although circumstances could cause us to lose that status earlier, including if our total annual gross revenue exceeds $1.07 billion, if we issue more than $1.00 billion in non‑convertible debt securities during any three‑year period, or if we are a large accelerated filer and the market value of our Class A ordinary shares held by non‑affiliates exceeds $700 million as of the end of any second quarter before that time. We cannot predict if investors will find our Class A ordinary shares less attractive because we may rely on these exemptions. If some investors find our Class A ordinary shares less attractive as a result, there may be a less active trading market for our Class A ordinary shares and our share price may be more volatile.
We qualify as a foreign private issuer and, as a result, we are not subject to U.S. proxy rules and are subject to Exchange Act reporting obligations that, to some extent, are more lenient and less frequent than those of a U.S. domestic public company.
We report under the Exchange Act of 1934, as amendment (“Exchange Act”) as a non‑U.S. company with foreign private issuer status. Because we qualify as a foreign private issuer under the Exchange Act and although we are subject to Cayman laws and regulations with regard to such matters and intend to furnish quarterly financial information to the SEC, we are exempt from certain provisions of the Exchange Act that are applicable to U.S. domestic public companies, including (1) the sections of the Exchange Act regulating the solicitation of proxies, consents or authorizations in respect of a security registered under the Exchange Act, (2) the sections of the Exchange Act requiring insiders to file public reports of their share ownership and trading activities and liability for insiders who profit from trades made in a short period of time and (3) the rules under the Exchange Act requiring the filing with the SEC of quarterly reports on Form 10‑Q containing unaudited financial and other specified information, although we intend to provide selected quarterly information on Form 6‑K. In addition, foreign private issuers are not required to file their annual report on Form 20‑F until 120 days after the end of each fiscal year, while U.S. domestic issuers that are accelerated filers are required to file their annual report on Form 10‑K within 75 days after the end of each fiscal year and U.S. domestic issuers that are large accelerated filers are required to file their annual report on Form 10‑K within 60 days after the end of each fiscal year. Foreign private issuers are also exempt from Regulation FD, which is intended to prevent issuers from making selective disclosures of material information. As a result of all of the above, you may not have the same protections afforded to shareholders of a company that is not a foreign private issuer.
We may lose our foreign private issuer status in the future, which could result in significant additional costs and expenses.
As discussed above, we are a foreign private issuer, and therefore, we are not required to comply with all of the periodic disclosure and current reporting requirements of the Exchange Act. The determination of foreign private issuer status is made annually on the last business day of an issuer’s most recently completed second fiscal quarter, and, accordingly, the next determination will be made with respect to us on June 30, 2019. In the future, we would lose our foreign private issuer status if (1) more than 50% of our outstanding voting securities are owned by U.S. residents and (2) a majority of our directors or executive officers are U.S. citizens or residents, or we fail to meet additional requirements necessary to avoid loss of foreign private issuer status. If we lose our foreign private issuer status, we will be required to file with the SEC periodic reports and registration statements on U.S. domestic issuer forms, which are more detailed and extensive than the forms available to a foreign private issuer. We will also have to mandatorily comply with U.S. federal proxy requirements, and our officers, directors and principal shareholders will become subject to the short‑swing profit disclosure and recovery provisions of Section 16 of the Exchange Act. In addition, we will lose our ability to rely upon exemptions from certain corporate governance requirements under the listing rules of the New York Stock Exchange (“NYSE”). As a U.S. listed public company that is not a foreign
36
private issuer, we will incur significant additional legal, accounting and other expenses that we will not incur as a foreign private issuer, and accounting, reporting and other expenses in order to maintain a listing on a U.S. securities exchange. These expenses will relate to, among other things, the obligation to present our financial information in accordance with U.S. GAAP in the future.
As we are a foreign private issuer and intend to follow certain home country corporate governance practices, our shareholders may not have the same protections afforded to shareholders of companies that are subject to all NYSE corporate governance requirements.
As a foreign private issuer, we have the option to follow certain home country corporate governance practices rather than those of the NYSE, provided that we disclose the requirements we are not following and describe the home country practices we are following. We intend to rely on this “foreign private issuer exemption” with respect to the NYSE requirements to have the audit committee appoint our external auditors, the NYSE rules for shareholder meeting quorums and record dates and the NYSE rules requiring shareholders to approve equity compensation plans and material revisions thereto. We may in the future elect to follow home country practices with regard to other matters. As a result, our shareholders may not have the same protections afforded to shareholders of companies that are subject to all NYSE corporate governance requirements.
As a public reporting company, we are subject to rules and regulations established from time to time by the SEC regarding our internal control over financial reporting. If we fail to put in place appropriate and effective internal controls over financial reporting and disclosure controls and procedures, we may not be able to accurately report our financial results, or report them in a timely manner, which may adversely affect investor confidence in us and, as a result, the value of our Class A ordinary shares.
As a public company, we will be required to report, among other things, control deficiencies that constitute a “material weakness” or changes in internal controls that, or that are reasonably likely to, materially affect internal controls over financial reporting. A “material weakness” is a deficiency, or a combination of deficiencies, in internal control over financial reporting, such that there is a reasonable possibility that a material misstatement of our annual or interim financial statements will not be prevented or detected on a timely basis.
In connection with the audit of the financial year ended December 31, 2017, we identified certain control deficiencies in the design and operation of our internal controls over our financial reporting that constituted material weaknesses. The control deficiencies resulted from (1) our technology access and change control environment not supporting an efficient or effective internal control framework and (2) reliance on manual processes.
Following the identification of these material weaknesses, we have taken steps to address these control deficiencies and continue to implement our remediation plan, which we believe will address their underlying causes. We are executing on our remediation plan for these material weaknesses by establishing more robust processes supporting internal control over financial reporting, implementing formal access and change controls to our systems, and automation of a number of system interfaces to improve our information technology systems. In addition, we have hired and will continue to hire additional accounting, finance and technology personnel. However, these material weaknesses may not be fully remediated until we have operated our business with these controls in place for a sufficient period of time. See Item 15. “Controls and Procedures” for additional information of the identified material weaknesses and related remediation plan.
If we are unable to remediate our material weaknesses and implement and maintain effective internal control over information technology and financial reporting and effective disclosure controls and procedures, or if we fail to meet the other demands that will be placed upon us as a public company, including the requirements of Section 404 of the Sarbanes‑Oxley Act, we may be unable to accurately report our financial results, or report them within the timeframes required by the SEC.
37
As we continue to evaluate and work to improve our internal control over financial reporting, management may determine to take additional measures, modify the remediation plan described above or identify additional control deficiencies or material weaknesses. We cannot assure you that our remediation plan will be sufficient to prevent future material weaknesses from occurring. There is no assurance that we will not identify additional material weaknesses or deficiencies in our internal control over financial reporting in the future.
If our senior management is unable to conclude that we have effective internal control over financial reporting, or to certify the effectiveness of such controls, or if our independent registered public accounting firm cannot render an unqualified opinion on our internal control over financial reporting, when required, or if additional material weaknesses or deficiencies in our internal controls are identified, we could be subject to sanctions or investigations by the NYSE, the SEC or other regulatory authorities, investors may lose confidence in the accuracy and completeness of our financial reports, we may face restricted access to the capital markets and our share price may be adversely affected.
We will continue to incur increased costs as a result of operating as a public company, and our management will be required to continue to devote substantial time to new compliance initiatives and corporate governance practices.
As a public company, and particularly after we are no longer an emerging growth company, we will continue to incur to significant legal, accounting and other expenses that we did not incur as a private company. The Sarbanes‑Oxley Act, the Dodd‑Frank Wall Street Reform and Consumer Protection Act, the listing requirements of the NYSE and other applicable securities rules and regulations impose various requirements on public companies, including establishment and maintenance of effective disclosure and financial controls and corporate governance practices. Our management and other personnel will need to continue to devote a substantial amount of time to these compliance initiatives. Moreover, these rules and regulations will continue to increase our legal and financial compliance costs and will make some activities more time‑consuming and costly. For example, we expect that these rules and regulations may make it more difficult and more expensive for us to obtain director and officer liability insurance, and could also make it more difficult for us to attract and retain qualified members of our Board.
We are continuing to evaluate these rules and regulations and cannot predict or estimate the amount of additional costs we may incur or the timing of such costs. These rules and regulations are often subject to varying interpretations, in many cases due to their lack of specificity, and, as a result, their application in practice may evolve over time as new guidance is provided by regulatory and governing bodies. This could result in continuing uncertainty regarding compliance matters and higher costs necessitated by ongoing revisions to disclosure and governance practices.
As a publicly traded company, we will be required to comply with the SEC’s rules implementing Sections 302 and 404 of the Sarbanes‑Oxley Act, which will require management to certify financial and other information in our quarterly and annual reports and provide an annual management report on the effectiveness of control over financial reporting. Though we are required to disclose material changes in internal control over financial reporting on an annual basis, as a company in transition we will only be required to make our first annual assessment of our internal control over financial reporting pursuant to Section 404 for fiscal year 2019, and management’s report related to such assessment will be included in our Annual Report on Form 20-F for the fiscal year ended December 31, 2019 to be filed in 2020. Additionally, while we remain an emerging growth company, we will not be required to include an attestation report on internal control over financial reporting issued by our independent registered public accounting firm. To achieve compliance with Section 404 within the prescribed period, we will be engaged in a process to document and evaluate our internal control over financial reporting, which is both costly and challenging. In this regard, we will need to continue to dedicate internal resources, potentially engage outside consultants and adopt a detailed work plan to assess and document the adequacy of internal control over financial reporting, continue steps to improve control processes as appropriate, validate through testing that controls are functioning as documented and implement a continuous reporting and improvement process for internal control over financial reporting. We currently have limited accounting personnel and we have begun the process of evaluating the adequacy of our accounting personnel staffing level and other matters related to our internal control over financial reporting. Despite our efforts, there is a risk that we will not be able to conclude, within the prescribed timeframe or at all, that our internal control over financial reporting is effective as required by Section 404. If we identify one or more material weaknesses, it could result in an adverse reaction in the financial
38
markets due to a loss of confidence in the reliability of our financial statements. As a result, the market price of our Class A ordinary shares could be negatively affected, and we could become subject to investigations by the stock exchange on which our securities are listed, the SEC or other regulatory authorities, which could require additional financial and management resources.
We may not pay dividends on our Class A ordinary shares in the future and, consequently, your ability to achieve a return on your investment will depend on the appreciation in the price of our Class A ordinary shares.
We may not pay any cash dividends on our Class A ordinary shares in the future. Any decision to declare and pay dividends in the future will be made at the discretion of our Board and will depend on, among other things, our results of operations, financial condition, cash requirements, contractual restrictions and other factors that our Board may deem relevant. In addition, our ability to pay dividends is, and may be, limited by covenants of existing and any future outstanding indebtedness we or our subsidiaries incur. Therefore, any return on investment in our Class A ordinary shares is solely dependent upon the appreciation of the price of our Class A ordinary shares on the open market, which may not occur. See Item 8. “Consolidated Statements and Other Financial Information – Dividend Policy.”
Our shareholders may face difficulties in protecting their interests because we are a Cayman Islands exempted company.
Our corporate affairs are governed by our Articles, the Companies Law and the common law of the Cayman Islands. The rights of shareholders to take legal action against our directors and us, actions by minority shareholders and the fiduciary responsibilities of our directors to us under Cayman Islands law are to a large extent governed by the common law of the Cayman Islands. The common law of the Cayman Islands is derived in part from judicial precedent in the Cayman Islands as well as from English common law, which has persuasive, but not binding, authority on a court in the Cayman Islands. The rights of our shareholders and the fiduciary responsibilities of our directors under the laws of the Cayman Islands are not as clearly defined as under statutes or judicial precedent in existence in jurisdictions in the United States. Therefore, you may have more difficulty protecting your interests than would shareholders of a corporation incorporated in a jurisdiction in the United States, due to the comparatively less well‑developed Cayman Islands law in this area.
A merger or consolidation may proceed under Cayman Islands law in one of two ways: by a court‑sanctioned scheme of arrangement or by a statutory merger: While Cayman Islands law allows a shareholder objecting to a court‑sanctioned scheme of arrangement to express a view that such scheme of arrangement would not provide fair value for the shareholder’s shares, Cayman Islands statutory and common law in respect of schemes of arrangement does not specifically provide for shareholder appraisal rights in connection with a merger or consolidation effected by a scheme of arrangement of a company that has otherwise received the prescribed shareholder approval. This may make it more difficult for you to assess the value of any consideration you may receive in a merger or consolidation effected by a scheme of arrangement or to require that the acquirer gives you additional consideration if you believe the consideration offered is insufficient. However, in the event of a merger or consolidation consummated under the statutory merger regime, Cayman Islands law does provide a mechanism for a dissenting shareholder to require us to apply to the Grand Court for a determination of the fair value of the dissenter’s shares if it is not possible for the company and the dissenter to agree on a fair price within the time limits prescribed.
Shareholders of Cayman Islands exempted companies, such as ours, have no general rights under Cayman Islands law to inspect corporate records and accounts or to obtain copies of lists of shareholders. Our directors have discretion under our Articles to determine whether or not, and under what conditions, our corporate records may be inspected by our shareholders, but are not obliged to make them available to our shareholders. This may make it more difficult for you to obtain information needed to establish any facts necessary for a shareholder motion or to solicit proxies from other shareholders in connection with a proxy contest.
It should be noted that the Cayman Islands law has no legislation specifically dedicated to the rights of investors in securities, and thus no statutorily defined private causes of action to investors in securities such as those found under the Securities Act or the Exchange Act in the United States. Subject to limited exceptions, under Cayman Islands law, a shareholder may not bring a derivative action against the board of directors. Class actions are
39
not recognized in the Cayman Islands, but groups of shareholders with identical interests may bring representative proceedings, which are similar.
As a result of all of the above, our public shareholders may have more difficulty in protecting their interests in the face of actions taken by our management or members of our Board than they would as public shareholders of a company incorporated in the United States.
Anti‑takeover provisions in our organizational documents may discourage or prevent a change of control, even if an acquisition would be beneficial to our shareholders, which could depress the price of our Class A ordinary shares and prevent attempts by our shareholders to replace or remove our current management.
Our Articles contain provisions that may discourage unsolicited takeover proposals that shareholders may consider to be in their best interests. Our Board may be removed by an ordinary resolution of our shareholders. In addition, Board vacancies may be filled by an affirmative vote of the remaining Board members. Following the conversion of the Class B ordinary shares the directors shall be divided into three classes designated as Class I, Class II and Class III, respectively as determined by the chairman of our Board at the relevant time, and directors will generally be elected to serve staggered three year terms. These provisions may make it more difficult to remove management.
Our Board has the ability to designate the terms of and issue preferred shares without shareholder approval.
Our Articles contain a prohibition on business combinations with any “interested” shareholder for a period of three years after such person becomes an interested shareholder unless (1) there is advance approval of our Board, (2) the interested shareholder owns at least 85% of our voting shares at the time the business combination commences or (3) the combination is approved by shareholders holding at least two‑thirds of the votes attaching to the ordinary shares that are not held by the interested shareholder.
Taken together, these provisions may discourage transactions that otherwise could involve payment of a premium over prevailing market prices for our Class A ordinary shares.
There may be difficulties in enforcing foreign judgments against us, our directors or our management, as well as against the selling shareholders.
Certain of our directors and management and certain of the other parties named in this annual report reside outside the United States. Most of our assets and such persons’ assets are located outside the United States. As a result, it may be difficult or impossible for investors to effect service of process upon us within the United States or other jurisdictions, including judgments predicated upon the civil liability provisions of the U.S. federal securities laws.
In particular, investors should be aware that there is uncertainty as to whether the courts of the Cayman Islands or any other applicable jurisdictions would recognize and enforce judgments of U.S. courts obtained against us or our directors or our management as well as against the selling shareholders predicated upon the civil liability provisions of the securities laws of the United States, or any state in the United States or entertain original actions brought in the Cayman Islands or any other applicable jurisdictions courts against us, our directors or our management, as well as against the selling shareholders predicated upon the securities laws of the United States or any state in the United States.
Farfetch Limited is a holding company with no operations of its own and, as such, it depends on its subsidiaries for cash to fund its operations and expenses, including future dividend payments, if any.
As a holding company, our principal source of cash flow will be distributions or payments from our operating subsidiaries. Therefore, our ability to fund and conduct our business, service our debt and pay dividends, if any, in the future will depend on the ability of our subsidiaries and intermediate holding companies to make upstream cash distributions or payments to us, which may be impacted, for example, by their ability to generate sufficient cash flow or limitations on the ability to repatriate funds whether as a result of currency liquidity
40
restrictions, monetary or exchange controls or otherwise. Our operating subsidiaries and intermediate holding companies are separate legal entities, and although they are directly or indirectly wholly owned and controlled by us, they have no obligation to make any funds available to us, whether in the form of loans, dividends or otherwise. To the extent the ability of any of our subsidiaries to distribute dividends or other payments to us is limited in any way, our ability to fund and conduct our business, service our debt and pay dividends, if any, could be harmed.
If securities or industry analysts do not publish or cease publishing research or reports about us, our business or our market, or if they change their recommendations regarding our Class A ordinary shares adversely, our share price and trading volume of our Class A ordinary shares could decline.
The trading market for our Class A ordinary shares is influenced by the research and reports that industry or securities analysts publish about us, our business, our market or our competitors. If any of the securities or industry analysts who cover us or may cover us in the future change their recommendation regarding our Class A ordinary shares adversely, or provide more favorable relative recommendations about our competitors, the price of our Class A ordinary shares would likely decline. If any securities or industry analyst who covers us or may cover us in the future were to cease coverage of us or fail to regularly publish reports on us, we could lose visibility in the financial markets, which in turn could cause our share price or trading volume of our Class A ordinary shares to decline.
We may be treated as a passive foreign investment company, which could result in material adverse tax consequences for investors in the Class A ordinary shares subject to U.S. federal income tax.
We would be classified as a passive foreign investment company (“PFIC”) for any taxable year if, after the application of certain look‑through rules, either: (1) 75% or more of our gross income for such year is “passive income” as defined in the relevant provisions of the Internal Revenue Code of 1986, as amended (the “Code”), or (2) 50% or more of the value of our assets, determined on the basis of a quarterly average, during such year is attributable to assets that produce or are held for the production of passive income. Based on the currently anticipated market capitalization, and composition of our income, assets and operations, we do not expect to be treated as a PFIC for the taxable year that ended on December 31, 2018, or in the foreseeable future. However, our status as a PFIC in any taxable year requires a factual determination that depends on, among other things, the composition of our income, assets, and activities in each year, and can only be made annually after the close of each taxable year. Therefore, there can be no assurance that we will not be classified as a PFIC for the current taxable year or for any future taxable year. If we are treated as a PFIC for any taxable year during which a U.S. Holder (as defined in “U.S. Federal Income Tax Considerations”) holds the Class A ordinary shares, the U.S. Holder may be subject to material adverse tax consequences upon a sale, exchange, or other disposition of the Class A ordinary shares, or upon the receipt of distributions in respect of the Class A ordinary shares. We cannot provide any assurances that we will assist investors in determining whether we or any of our non‑U.S. subsidiaries are a PFIC for any taxable year. U.S. Holders should consult their tax advisors about the potential application of the PFIC rules to their investment in the Class A ordinary shares. For further discussion, see “U.S. Federal Income Tax Considerations.”
If a United States person is treated as owning at least 10% of our shares, such holder may be subject to adverse U.S. federal income tax consequences.
Depending upon the aggregate value and voting power of our shares that U.S. persons are treated as owning (directly, indirectly, or constructively), we could be treated as a controlled foreign corporation (“CFC”). Additionally, because our group consists of one or more U.S. subsidiaries, under recently-enacted rules, certain of our non‑U.S. subsidiaries could be treated as CFCs, regardless of whether or not we are treated as a CFC (although there is currently a pending legislative proposal to significantly limit the application of these rules). If a U.S. person is treated as owning (directly, indirectly or constructively) at least 10% of the value or voting power of our shares, such person may be treated as a “U.S. shareholder” with respect to each CFC in our group (if any), which may subject such person to adverse U.S. federal income tax consequences. Specifically, a U.S. shareholder of a CFC may be required to annually report and include in its U.S. taxable income its pro rata share of each CFC’s “Subpart F income,” “global intangible low‑taxed income” and investments in U.S. property, whether or not we make any distributions of profits or income of a CFC to such U.S. shareholder. If you are treated as a U.S. shareholder of a CFC, failure to comply with these reporting obligations may subject you to significant monetary penalties and may
41
prevent the statute of limitations with respect to your U.S. federal income tax return for the year for which reporting was due from starting. Additionally, a U.S. shareholder that is an individual would generally be denied certain tax deductions or indirect foreign tax credits that may otherwise be allowable to a U.S. shareholder that is a U.S. corporation. We cannot provide any assurances that we will assist investors in determining whether we or any of our non‑U.S. subsidiaries are treated as CFCs or whether any investor is treated as a U.S. shareholder with respect to any of such CFC, nor do we expect to furnish to any U.S. shareholders information that may be necessary to comply with the aforementioned reporting and tax paying obligations. U.S. investors should consult their own advisors regarding the potential application of these rules to their investment in the Class A ordinary shares.
Item 4. Information on the Company
A. History and Development of the Company
Corporate Information
We were incorporated in the Cayman Islands on May 15, 2018 as an exempted company with limited liability under the Companies Law. Exempted companies are Cayman Islands companies whose operations are conducted mainly outside the Cayman Islands. Our principal executive offices are located at The Bower, 211 Old Street, London EC1V 9NR, United Kingdom. Our telephone number at this address is +44 (0) 20 7549 5400. Prior to our incorporation in the Cayman Islands, we conducted our business through Farfetch.com Limited, incorporated with limited liability under the laws of the Isle of Man with registered number 000657V, and its subsidiaries.
The Reorganization Transactions
In connection with our IPO, we formed Farfetch Limited and effected a reorganization, whereby all holders of warrants over Farfetch.com shares, except a holder of 189,995 warrants that remain outstanding, exercised their warrants into the applicable class of shares, and the outstanding shares of Farfetch.com were exchanged for shares of Farfetch Limited with equivalent rights. Following this exchange, the ordinary shares, the restricted linked ordinary shares and the preference shares held by the shareholders of Farfetch Limited were converted into ordinary shares of Farfetch Limited and subsequently converted into for Class A ordinary shares and Class B ordinary shares, as applicable. Outstanding options of Farfetch.com were also released in exchange for the grant of options with equivalent rights over Class A ordinary shares of Farfetch Limited. As a result of these transactions our business is now conducted through Farfetch Limited and its subsidiaries. We refer to all of these events as the “Reorganization Transactions.”
Private Placement
On June 21, 2017, Kadi Group Holding Limited (“Kadi Group”), a wholly owned subsidiary of JD.com Inc. (“JD.com”), completed the purchase of an equity interest in Farfetch.com. In connection with Kadi Group’s purchase of shares in Farfetch.com, Kadi Group and Farfetch.com entered into a forward purchase agreement, as amended, pursuant to which, subject to certain conditions, we agreed to issue and Kadi Group agreed to subscribe for one‑third of such number of shares (at a price per share equal to the initial public offering price per share) that would result in Kadi Group maintaining its percentage holding, or 13.94%, of our issued and outstanding share capital on a fully diluted basis immediately following our IPO. Kadi Group has agreed not to sell or transfer any of our Class A ordinary shares it held immediately prior to our IPO during the two‑year period commencing from the consummation of our IPO, subject to limited exceptions. We refer to the foregoing as the “concurrent private placement.” See Item 7. “Major Shareholders and Related Party Transactions—B. Related Party Transactions—Relationships with Kadi Group Holding Limited.”
B. Business Overview
Our Mission
Farfetch exists for the love of fashion. We believe in empowering individuality. Our mission is to be the global technology platform for luxury fashion, connecting creators, curators and consumers.
42
Overview
Farfetch is the leading technology platform for the global luxury fashion industry. We operate the only truly global luxury digital marketplace at scale, seamlessly connecting brands, retailers and consumers. We are redefining how fashion is bought and sold through technology, data and innovation. We were founded ten years ago, and through significant investments in technology, infrastructure, people and relationships, we have become a trusted partner to luxury brands and retailers alike.
The global market for personal luxury goods was estimated to be worth $307 billion in 2018 and is expected to reach $446 billion by 2025, according to Bain, and is largely characterized by family‑controlled companies, brand integrity, longstanding relationships and fragmented supply. In addition, luxury sellers require a high‑quality environment in which to sell their merchandise. As a result, these sellers have been cautious in their adoption of emerging commerce technologies.
The global luxury market is evolving, driven by an accelerating shift of consumers to online discovery and purchase, the increasing importance of Millennials and the growth of luxury consumption in China and other emerging markets. We connect a global consumer base to the highly fragmented global supply of luxury fashion, and we have established ourselves as the innovation partner to the luxury industry.
We are a technology company at our core and have created a purpose‑built platform for the luxury fashion industry. Our platform consists of three main components:
| • | Applications. The Farfetch Marketplace is the primary application on our platform. In addition, we continue to build other offerings under our Farfetch Platform Solutions banner, including Farfetch Black & White Solutions and Farfetch Store of the Future. |
| • | Services. We have invested in and developed an integrated service offering, including content creation and end‑to‑end logistics. This enables us to offer the high‑quality environment required by the luxury ecosystem. |
| • | Data. We use our rich data sets and proprietary algorithms to deliver an enhanced consumer experience and create better businesses for retailers and brands. Our data insights drive operational efficiencies that create value for all partners on our platform. |
The Farfetch Marketplace is the first and largest application built on our platform and is currently the source of over 90% of our revenue. We operate the largest digital luxury marketplace in the world. As of December 31, 2018, the Farfetch Marketplace connected over 2.8 million Marketplace consumers in 190 countries to over 1,000 luxury sellers. For consumers, we provide curated access to the highly fragmented supply of luxury merchandise. For luxury sellers, which includes 640 retailers and 382 brands who sell directly on the Farfetch Marketplace, we facilitate connection to the deepest pool of luxury consumers across the world. Aggregating a large number of luxury sellers requires long and careful relationship building and acts as a significant barrier to entry. We have carefully nurtured these relationships for a decade. Our Marketplace model allows us to offer the broadest and deepest selection of luxury fashion available online globally, while incurring minimal inventory risk and without capital‑intensive retail operations.
We are reinventing how consumers discover and engage with luxury fashion. We facilitate the discovery of new brands, provide tools to allow consumers to find the items they are looking for and inspire lovers of fashion around the world. We provide a unique, personalized experience based on our deep understanding of our consumers. Consumers choose our Marketplace because they trust we will deliver a consistent, high‑quality experience from start to finish, while being able to access over 3,200 different brands as of December 31, 2018. The luxury merchandise on our Marketplace is curated in three phases: (1) our rigorous selection of luxury sellers; (2) the expert buying decisions of our retailers, including the individual perspective and combined buying expertise of over 630 boutiques and (3) our optimization of our product mix using data insights and knowledge of the luxury market. We believe that people who love fashion, love Farfetch.
We are redefining commerce for luxury sellers. With access to a global consumer base, combined with an integrated marketing approach, we drive demand for our luxury sellers. Luxury sellers gain deep data insights and
43
real‑time feedback that are valuable in their decision making. They choose our platform because we help them grow their businesses with an enhanced online presence, powerful tools and superior economics, all while retaining control, which is critical to them. By providing a digital storefront, inventory management, a global logistics solution and other tools to help manage their businesses, we are embedding ourselves as both a commerce enabler and an innovation partner. Access to over 2.8 million Marketplace consumers, of which over 1.4 million were Active Consumers as of December 31, 2018, through the Farfetch Marketplace allows luxury sellers to instantly significantly increase their consumer reach, and our platform allows us to be their trusted innovation partner for the future.
We generate income from transactions conducted on our platform, which, together with In-Store Revenue, represents our GMV. We primarily operate a revenue‑share model where we retain commissions and related income from these transactions. Our business has grown significantly, as evidenced by the following:
| • | As of December 31, 2018, we had 1,353,400 Active Consumers, up 44.6% since December 31, 2017. As of December 31, 2017, we had 935,772 Active Consumers, up 43.6% since December 31, 2016. |
| • | Our GMV was $1,407.7 million in 2018, up 54.7% over 2017, and was $909.8 million in 2017, up 55.3% from 2016. |
| • | Our revenue was $602.4 million in 2018, up 56.1% over 2017, and was $386.0 million in 2017, up 59.4% from 2016. |
| • | Our Platform Services Revenue was $489.0 million in 2018, up 65.0% over 2017, and was $296.4 million in 2017, up 63.8% from 2016. |
44
Our Platform
We operate a modular end‑to‑end technology platform purpose built to connect the luxury fashion ecosystem worldwide. Our vision was to create a single operating system that could address the complex demands of consumers and luxury sellers alike. Our platform is designed to deliver the future of luxury retail by addressing the unique challenges faced by each participant in the ecosystem and to offer a transformative luxury experience across both offline and online channels. Our platform is built on an API‑enabled proprietary technology stack, which provides the foundation for the three main components: applications, services and data, as illustrated below.
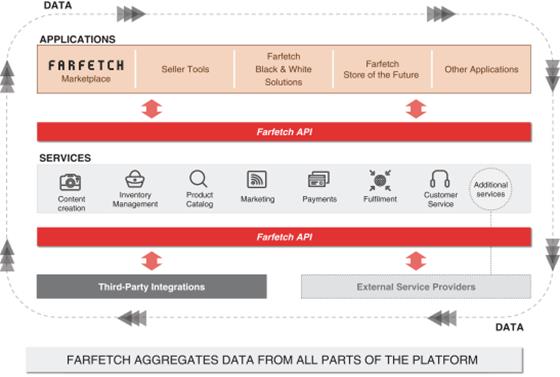
Applications
Farfetch Marketplace. The Farfetch Marketplace is the first and largest application built on our platform and is currently the source of over 90% of our revenue. Our Marketplace connects the two sides of the luxury fashion market: consumers from 190 countries and luxury sellers from 53 countries.
Farfetch Black & White Solutions. Our modular, white‑label e-commerce offering provides retailers and brands with platform services ranging from individual off‑the‑shelf elements to a full‑service branded e-commerce solution. Farfetch Black & White Solutions powers the online shopping experiences of global brands such as JW Anderson, Christopher Kane, Proenza Schouler and Thom Browne.
Farfetch Store of the Future. We believe the future of luxury fashion retail will be defined by the reinvention of the consumer experience by connecting the online and offline retail worlds. We have developed, and continue to evolve, a suite of connected in‑store technologies to provide a digitally enabled, personalized physical shopping experience.
Seller Tools. We have created powerful operational tools that help drive efficiencies for our luxury sellers. These include STORM, an integrated operating tool that enables end‑to‑end management of the online selling experience for our luxury sellers, and FFLINK, an integration platform built to provide a seamless connected retail solution for our luxury sellers.
45
Services
We have invested in and developed an integrated service approach that enables us to offer a consistent luxury environment for all of our platform partners. We achieve this through free and fast content creation to achieve a luxury product presentation, demand generation through our marketing services, secure multi‑currency payment processing and smart supply chain management. We provide consumers with a localized luxury experience, including after‑care in the form of multilingual customer service and free returns processing.
Data
Through our multiple interactions with our luxury sellers and consumers, we develop rich data sets and proprietary algorithms that drive operational efficiencies to create value for all participants on our platform. Our data science capabilities automate decision making through the application of machine learning to guide merchandizing, targeting, curation and feedback. As of December 31, 2018, we had 866 engineers and data scientists developing and enhancing the data interactions on our platform. These insights allow us to deliver an enhanced consumer experience and create operational efficiencies for our platform partners.
Our Strengths
We believe that the following strengths contribute to our success and are differentiating factors:
| • | Visionary, founder‑led management team. We are led by our founder, José Neves, who has a unique combination of knowledge of and passion for the fashion industry and a deep understanding of technology. Our management team’s clear sense of mission, long‑term focus, commitment to our core cultural values and focus on transforming the luxury industry through technology are central to our success. Members of our team have created and grown leading luxury, fashion and technology businesses globally, and they retain a strong entrepreneurial spirit. |
| • | Scalable proprietary technology. We have built a scalable proprietary technology platform, which enables us to grow the reach of our Marketplace efficiently, while supporting the creation and development of new applications. This benefits both the sophistication of the applications we develop, as well as the speed with which we are able to deploy them. |
| • | Unique data capabilities. Our business model allows us to collate large volumes of unique data from touch points throughout the luxury fashion ecosystem. We believe this gives us unparalleled, multi‑dimensional insight into the entire luxury ecosystem. Our team of data scientists and specialist engineers utilize the data to feed our proprietary algorithms to enhance our platform and benefit all platform participants. |
| • | Established partner relationships. We are the partner of choice for the world’s leading brands, boutiques and department stores. These relationships cannot easily be replicated and represent a high barrier to entry. As of December 31, 2018, we partnered with 640 of the world’s leading luxury retailers and 382 brands. These relationships enable us to give our consumers access to unique and scarce inventory, in addition to the widest selection and variety. Our platform relationships extend beyond our Marketplace and include, for example, our multi‑year global innovation partnership with CHANEL. |
| • | The world’s largest selection of luxury. We operate the only luxury digital marketplace at scale. We offer ten times more stock keeping units than the closest competitor to our Marketplace. We achieve this by aggregating supply from a large number of globally distributed sources, offering consumers both breadth and depth of luxury merchandise. |
| • | Fully integrated supply chain operations. We offer comprehensive supply chain capabilities to our platform partners, from content creation to our global fulfilment network, which integrate delivery partners from around the world in a single, efficient interface. Luxury fashion inventory is located across a highly fragmented network of luxury sellers. Our fulfilment network is based on a distributed inventory model, aggregating inventory from multiple stock points of our luxury sellers in real time, giving us the capability to get shipments to consumers quickly and efficiently, due to the proximity of |
46
| | the inventory to the consumer. We have invested significant resources in building and developing this network, and this has created a significant competitive advantage and economies of scale. |
| • | Our marketplace business model. Our model allows us to offer the broadest and deepest selection of luxury fashion available online globally, while incurring minimal inventory risk and without capital‑intensive retail operations. This allows for low capital expenditures, favorable working capital dynamics, minimal inventory holding and an ability to drive stronger future margins than traditional inventory‑taking business models. For the year ended December 31, 2018, our Average Order Value was $618.6, and we had a 32.0% Third‑Party Take Rate. |
| • | Powerful network effects. Interactions among our consumers and luxury sellers on our Marketplace generate strong network effects. More brands, boutiques and department stores on our Marketplace increases the choices available to consumers, and more consumers on our Marketplace increases the potential sales for our luxury sellers through a self‑reinforcing, mutually beneficial network effect. |
| • | Culture of innovation. Innovation is intrinsic to Farfetch. For a decade, we have redefined how the luxury industry engages with consumers and technology. We believe that technology will continue to enable a better luxury ecosystem, and we will continue to pioneer innovation, for example by executing our vision for Augmented Retail, including Farfetch Store of the Future. In addition, our open architecture allows other innovators to build on our platform. As a result of our investment and reputation, we expect that third parties will continue to seek out Farfetch as their innovation partner, providing us with further opportunity to extend our platform. |
Our Growth Strategies
The key elements of our growth strategies include:
| • | Improving consumer economics and growing our consumer base |
Increasing the lifetime value of existing consumers. We have cultivated our consumer base and have strong consumer loyalty. We are committed to ensuring that through our curated supply, as well as our comprehensive approach to data and analytics, we are able to offer our existing consumers more of the merchandise that they want. We will continue to refine our approach to data analytics, allowing us to further optimize and improve our marketing approach and consumer experience, so that existing consumers visit the Farfetch Marketplace more often, convert more efficiently and have higher Average Order Values.
Attracting new consumers. We are focused on growing our consumer base in all markets, with a particular emphasis on emerging markets including China, the Middle East, Latin America and Eastern Europe. Our expansion strategy includes offering consumers global access to luxury products that are tailored to local market trends and tastes, along with localized interfaces. For example, the rapidly growing luxury industry in China represents a major opportunity for us, and we have invested locally to support growth. As of December 31, 2018, we had 209 Farfetchers in Shanghai and Hong Kong, and our platform was able to deliver local language and payment systems. We are currently one of a small number of global technology platforms to have full access to the Chinese market, which is predicted to represent 46% of personal luxury goods sales in 2025, according to Bain. As another example, we have a strategic partnership with the Chalhoub Group in the Middle East to further our expansion in that region.
| • | Increasing product supply and our luxury seller base |
Increasing supply from existing luxury sellers. We can further increase the depth of our supply from our existing luxury seller base. We believe sellers will sell more of their inventory on our platform if we continue to offer a compelling value proposition, such as data‑led insights, access to relevant demand and technological innovation, and we aim to continue developing these offerings.
Adding brands, boutiques, department stores and other partners. We plan to further increase the number of luxury sellers in order to expand the assortment and availability of merchandise on our Marketplace. In addition to adding brands and boutiques, we plan to continue to add department stores and new types of retailers to participate on our Marketplace.
47
Expanding into new categories and offerings. We aim to enhance our product offering for consumers and create additional opportunities for sellers on our platform by expanding into other luxury categories and offerings, such as the expansion of our offering to include watches and fine jewelry in 2018 and our investment in the streetwear category via our acquisition of Stadium Goods in January 2019. Streetwear has been one of the fastest growing categories on our Marketplace and Stadium Goods, a player in the $70 billion premium sportswear market, is largely incremental to our business. Our ability to expand into adjacent categories within the personal luxury goods market will enable us to increase our penetration of a large and robust total addressable market.
| • | Investing in new technologies and innovation. We will continue to invest in people, product and infrastructure to drive technological innovation in the luxury industry. This includes continuing to enhance our Marketplace for all participants through the application of data science and machine‑learning technologies to facilitate further personalization and inspiring moments for consumers. We will also continue to grow Farfetch Black & White Solutions and further develop and monetize Farfetch Store of the Future. We aim to continue to be the innovation partner of choice for the luxury industry, developing new ways for the fashion ecosystem to evolve. We will supplement the growth of our internal service offerings with external third‑party providers that can build on our platform to offer complementary services to our consumers and luxury sellers. |
| • | Building the Farfetch brand. While we have established a significant position in the fashion industry, we have an opportunity to increase market share by growing our brand awareness. We believe that with continued investment in brand marketing, data‑led insights and effective consumer targeting, we can expand and strengthen our reach. |
Our Products
We aspire to build technology products that meet the varied and evolving needs and wants of luxury consumers, retailers and brands.
The Farfetch Marketplace—Farfetch.com and our iOS and Android apps
We have a global consumer base that expects a seamless user experience. Consumers are able to engage with us across our website and mobile apps for both iOS and Android devices, including on our iOS app developed specifically for our consumers in China. Our Marketplace is supported by 21 localized sites in 14 local languages, offering features such as a user-friendly home page, browse function, product detail, wishlist and consumer account management.
We have a multi-disciplinary search team including data scientists and machine-learning engineers who work to better understand intent, leveraging these insights to identify the type of merchandise that is most meaningful to our consumers, and consequently strengthening our proprietary metadata. The browsing function is underpinned by a real-time stock management system, filling search results with higher volume stock to ensure availability. In addition, we are developing visual merchandising tools to train the algorithms used by our merchandising team, so our system becomes more intelligent and our processes become more scalable, trending toward an increasingly personalized experience.
Our consumers are driven by a desire to discover new products and trends. We have a “New In” section of our site, that provide consumers with access to products that just went live on our Marketplace. Our recommendation engine applies strategies ranging from look-alike algorithms on out of stock pages to collaborative filtering options to surface what similar consumers are viewing throughout our catalog.
The objective of our app is to enable our global consumers to shop effortlessly using their mobile devices, wherever, whenever. Our app, available in 14 languages on iOS and Android, enables consumers to search by designer, category or keyword, shop via daily new arrivals or discover products through highly personalized and dynamic recommendations. We regularly improve our app user experience, adding features such as: personalization; “Shop the Look;” new payment methods, including Apple Pay and WeChat Pay; touch ID and Facebook Connect for easy login; order tracking; geo-targeted shipping services; enhanced search with suggestions and personalized
48
search recommendations; in-app messaging capabilities and push notifications. In addition, the Farfetch Private Client app offers certain consumers bespoke functionality and exclusive access to fashion products and services. We believe that the increase in popularity of our app demonstrates the changing dynamics of consumers’ shopping behavior. For the year ended December 31, 2018, our app accounted for 23% of total visits to our Marketplace.
Farfetch Platform Solutions
In February 2019, we announced that we were uniting our portfolio of business-to-business platform products and services, under the banner Farfetch Platform Solutions. Farfetch Platform Solutions will incorporate Black & White Solutions, Farfetch Store of the Future and CuriosityChina, to simplify our enterprise offering to the luxury industry.
Farfetch Platform Solutions’ mission is to offer luxury brands and retailers a suite of products and services leveraging the Farfetch platform ecosystem to build their own branded digital businesses.
Farfetch Black & White Solutions
Farfetch Black & White Solutions is our package of white-label solutions for luxury fashion brands and retailers. We deliver a global, multi-channel e-commerce offering that enables retailers and brands to seamlessly transact online with their consumers, while also allowing them to focus on the creative aspects of their businesses. These solutions are built on our platform, providing the same capabilities and scale as our Marketplace, and benefitting from the improvements to and the innovation of our platform. We enable the specific business goals of our partners by creating a modular package of solutions from which they can choose from specific bundles of products and services or a full end-to-end e-commerce experience.
By building on our fully API-enabled platform, Farfetch Black & White Solutions allows for a flexible front-end suite of products, comprised of global websites and apps. Our back-end infrastructure allows retailers and brands to synchronize their websites with in-store and warehouse inventory, both from mono-brand stores and other suppliers in their distribution network, and facilitate in-store pick-up and consumer returns. Farfetch Black & White Solutions seamlessly facilitates payments and enables cross-border and international shipping to customers. Our modular approach provides retailers and brands the optionality of a more flexible solution depending on their e-commerce goals. A retailer or brand could select all of our front-end suite of products or a combination of our integrated solutions, all powered by our back-end infrastructure. In addition, we offer services, which include, among others, digital marketing, consulting, localization, production and warehousing. All of these are modular services that can complement the front-end suite of products or can stand alone. Monetization of individual products and services is negotiated and may include any combination of build fees, revenue share, agency fees or consultancy fees.
In February 2019, we announced a strategic partnership with Harrods to provide global e-commerce platform. The partnership will see Harrods use and benefit from all of the core components of Farfetch Black & White Solutions, including e-commerce management, operations support, international logistics support, and technical support.
Augmented Retail and Farfetch Store of the Future
We believe the future of luxury fashion retail will be defined by the reinvention of the consumer experience, through online and offline integrations. We call this vision Augmented Retail, taking the magic of the physical store experience and bringing it together with the advantages of the online and digital experience, underpinned by the use of data.
Our Augmented Retail vision begins with the consumer in mind. Consumers enjoy the experience of being in store, building a relationship with the sales associate and experiencing merchandise in the luxury store setting, yet technology has meant that consumers now expect ultra-personalized experiences, both in their real and digital lives, and expect those worlds to be seamlessly connected. Our Augmented Retail vision reflects the retail experience of the future by giving retailers visibility of their consumers’ preferences, both in store and online, enabling them to
49
enhance the services they can offer. With this in mind, we have developed a range of services and technologies to progress innovation in the luxury industry.
In April 2017, we unveiled our Augmented Retail vision and launched Farfetch Store of the Future, a technology-powered retail operating system. This suite of technologies aims to improve retail productivity by capturing consumer data and enhancing interactions between consumers and sales associates, both in store and when the consumer interacts with the retailer or brand online. The open innovation approach to our operating system means that retailers and brands can also use third-party technologies on our platform. This allows for a uniquely tailored offering to each brand or retailer in keeping with their in-store and online strategy. Our Farfetch Store of the Future technology launched in Thom Browne’s London and New York stores in February and March 2018, respectively, and in Browns East in May 2018. In February 2018, we announced a multi-year global innovation partnership with CHANEL, through which we will work together to develop a range of digital initiatives to deliver a superior consumer experience both online and offline.
Management Tools for Luxury Sellers
We provide tools and solutions that enable our luxury sellers to maximize their businesses on our Marketplace and provide real-time visibility of inventory. These tools include:
| • | STORM. STORM provides luxury sellers with a number of capabilities designed to drive their success on our Marketplace, including data management, inventory management, analytics and key performance indicators, order management and fulfilment, consumer profiles and omnichannel fulfilment. |
| • | FFLINK. FFLINK is the API layer that allows our partners to integrate our platform with their own systems or other third-party e-commerce solutions, such as Magento, Shopify, Cegid, Teamwork Retail, Lightspeed and Retail Pro. |
Our Technology
Technology is at the core of our strategy, powering our operational capabilities and the sustainable scalability of our platform. We believe that continuous investment in our technology has given us a competitive advantage and enabled fast innovation.
While building, maintaining and optimizing our platform, we apply the following key principles:
| • | API-first design. All the complexity of our business logic is accessible via a variety of APIs. When addressing a new functionality, we consider the questions and actions our platform should address and the most intuitive API design. Only after this assessment do we execute implementation details. This approach focuses our team on delivering the most sustainable solution with the best business outcome. |
| • | Multi-tenancy. Our platform is built for multi-tenancy and multi-client use. This allows the same infrastructure and services architecture to support both our Marketplace and other applications, such as Farfetch Black & White Solutions and Farfetch Store of the Future. The architecture design provides security, data isolation and support for individual tenant configurations. |
| • | Modularity. Our platform’s internal services have a modular design, allowing us to evolve individual system boundaries independently or replace components via integration with external modules. |
| • | Flexibility. The ability to integrate with other platforms is key to our design. Our platform has the flexibility to either be part of other systems or allow other systems to be part of ours. |
Our platform architecture enables the following:
| • | Cross-device experiences. By making features available through our platform API rather than on a specific device, we enable the possibility of sharing experiences across multiple devices, allowing, for example, consumers to start browsing and adding items to their “Shopping Bag” on a laptop and complete checkout on a mobile device. Maintenance of features is also done on the platform level, which maximizes efficiency. |
50
| • | Technology and team organization. The control of our systems design and architecture supports increased agility in our teams’ growth and organization. We rationally scale our organization and technology, clustering teams around business areas with their specific domain languages and building small nimble teams within each area as new services are created, in order to break down the complexity. This model has enabled us to keep start-up like structures that can quickly adapt and react to new challenges. |
| • | Innovation velocity. By having our business logic available via a centralized API-enabled platform, we can quickly make new platform innovations available to all applications and explore new scenarios at the consumer experience level, leveraging past learnings and experience embedded into our platform. |
| • | Provider agnostic. We designed our platform to be independent of any specific infrastructure provider, allowing us to scale across multiple cloud providers or self-managed data centers. We can also run scenarios under containerization, which allows us to run applications within a contained environment or in one operating system but in isolation from one another, or non-containerization, where each application can run within its own or multiple containers and each application runs simultaneously on the same computer. Making such options available as part of our design allows us to manage infrastructure costs. |
| • | Point of delivery. Our systems and infrastructure are designed to operate across multiple geo-distributed points of delivery. They are built using technologies that provide horizontal scalability, high-availability and data management. |
Open Source Technologies
We use open source technologies and continuously assess existing and proven open source frameworks that can be used to accelerate our deliveries and focus on the added value to the business. We license technology, content and other intellectual property from technology providers and partners when a commercial license and support are available, which can provide added value and operating efficiencies to our business and integrate through our API enabled platform.
Open Innovation Framework
We have developed a robust framework around innovation as a way to prioritize our efforts and focus on potential opportunities that are consistent with our mission:
| • | Our innovation. Our teams innovate on a daily basis, and we provide an environment that inspires and encourages ideas from all Farfetchers to ensure the best are elevated and come to fruition. |
| • | Corporate development. We routinely evaluate acquisitions and collaboration opportunities that will expand our business and further our strategic objectives and mission. |
| • | Platform engagement. We enable external businesses to build on our platform in order to offer complementary products and services to our consumers and platform partners. These businesses engage with us via our API and make use of the modular services we offer to grow their own businesses. |
| • | Dream Assembly. This is our accelerator program that provides commerce technology startups with access to our mentorship, networking and support. It is designed to accelerate the growth of these startups and enhance the luxury ecosystem. |
Browns
Browns is an iconic British fashion and luxury goods retailer with a heritage of introducing new fashion labels and pioneering luxury fashion since the 1970s. As an example of its ability to identify new fashion talent, Browns purchased the entire design school graduation collection of then unknown designer John Galliano, championed other young designers such as Hussein Chalayan and Alexander McQueen from the outset of their careers and, more recently, was the first to stock Christopher Kane.
51
Browns operates two retail stores in London and also leverages our platform applications. Ownership of Browns enables us to understand the fashion ecosystem through the lens of a boutique. In addition to enhancing our credibility in fashion, Browns also serves the critical mission of pioneering innovations developed under our Augmented Retail strategy, including providing a luxury fashion boutique environment to test Farfetch Store of the Future technology.
Our Global End-to-End Operations
We provide consumers with a localized luxury experience. Our core operations areas are smart supply chain management and luxury customer care.
Smart Supply Chain Management
Content Creation. The first step in our supply chain operations is content creation. In-house content creation allows us to achieve a luxury product presentation with a consistent look and feel, with short lead times and low cost. Our content creation process includes styling, photographing, photo-editing and content management. Our studios are the heart of the process, where teams of professional stylists, models and photographers create product images. We also develop original content, including tailored merchandise descriptions, convenient size and fit information and detailed measurements information to provide the best consumer experience, maximize sales and minimize returns.
We operate four strategically located production centers in Guimarães (Portugal), Los Angeles, São Paulo and Hong Kong, processing over 578,000 products and producing approximately 3.1 million unique luxury images during 2018. As of the third quarter 2018, our largest production center can process over 5,000 items per day at peak times.
Fulfilment. We have invested significant resources in developing our fully integrated logistics network. We have developed smart supply chain algorithms that are built around deep information sharing and aligned through shared incentives, which make our supply chain scalable, capital efficient and highly agile.
Fulfilment is executed by our luxury sellers and includes picking and packing the merchandise in Farfetch-branded packaging and booking the pick-up for onward delivery to the consumer. We prioritize effective fulfilment to 190 countries, building a robust process enabled by technology and strong collaboration among our internal teams, our luxury sellers and our distribution delivery carriers.
Once an order is packed, the merchandise is distributed to our consumers. We have the global expertise to handle the complexity of a vast network of routes and we have extensive knowledge of how to manage and optimize the complexities and intricacies of each country combination, including duties and bureaucracies.
We offer a number of delivery options including: standard and premium delivery; click and collect, which allows consumers to receive their shipment at their choice of local boutique or pick-up point; same-day delivery from selected luxury sellers in 18 of our largest cities globally; and F90 store to door delivery in 90 minutes from a number of luxury sellers in Berlin, Dubai, Hong Kong, London, Los Angeles, Madrid, Miami, Milan, New York, Paris, São Paulo and Tokyo. We also offer a free returns service on all our orders from a place and at a time selected by our consumer.
Sales and Marketing
Our integrated marketing framework represents a core competency that we regard as essential to the success of our Marketplace model. We are focused on continuing to build brand recognition and a demand generation engine that connects our consumers with the world’s best luxury sellers. Through driving high consumer demand, we create a better proposition for our luxury sellers.
Over the last three years, we have invested heavily in building a talented in‑house marketing team, while also developing proprietary technologies that enable us to build data‑driven and highly‑personalized campaigns that can scale globally.
52
How We Drive Demand
Data‑Driven Approach
We collect and utilize a broad range of data from multiple touch points in the luxury fashion ecosystem. This allows us to identify audience segments that are highly engaged in the luxury fashion category, which enables us to focus both brand and performance marketing campaigns on those we believe have a high propensity to purchase. Marketing costs are allocated across our global digital media portfolio using advanced internal bidding algorithms, which are tuned to optimize return on investment.
We employ a scientific approach to marketing. We use our data insights to continuously optimize and improve our marketing and product experiences to be responsive to our consumers’ needs and provide them with a great consumer experience. Our relentless focus on data‑driven testing enables us to innovate and optimize at a fast pace.
We have an audience‑focused, rather than channel‑focused, approach to both brand and performance marketing, which we manage as one integrated program. We use our rich audience insights to identify prospective consumers who we believe have an interest in, and a propensity to buy, luxury fashion. We have built our own marketing technology platform to deploy integrated campaigns that span the entire communications funnel, from awareness to consideration to purchase and retention. We leverage the audience targeting capabilities provided by our online media partners and other non‑online sources, and we carefully monitor campaign reach based on propensity to buy and overall engagement with the category. The efficiencies gained from effective audience targeting allow us to build high frequency campaigns that drive awareness of our brand proposition.
We use sophisticated media mix measurement and modelling techniques to evaluate marketing performance, and we match our investment in audience and media to the predicted lifetime value that we believe each segment will generate, optimizing on a market‑by‑market basis.
Global Scale
Our marketing team is comprised of a broad range of capabilities and disciplines and is responsible for the development of all global performance and brand marketing campaigns. From a demand generation perspective, we manage active marketing campaigns across 190 countries and utilize a hub and spoke operating model that enables us to scale and rapidly deploy new campaigns across all markets, while also localizing messaging and creative assets.
Our global approach enables us to make faster decisions as we can run more tests at scale and determine outcomes faster. In addition, our local teams in Brazil, China, Japan, Russia, the United Arab Emirates and the United States are responsible for working with local media channels and partners and localizing global creative concepts while also running local initiatives that bring our brand personality to life.
Consumer Acquisition
We principally acquire consumers through online channels, including paid and organic search, metasearch, affiliate partnerships, display advertising and social channels. We have channel experts who work with dedicated analysts, data scientists and engineers. We have invested significant resources to establish systems that optimize paid search, and our team is highly skilled at developing programs and algorithms to maximize our return on paid search.
Retention and Loyalty
We focus on building continuous dialogue with our consumers given their levels of engagement with luxury shopping. We do this by creating inspiring content and developing personalized and tailored product recommendations, which we distribute via email, push notifications, social media, display advertising and directly on our platform. We launched ACCESS, Farfetch’s new loyalty program, for a limited global test group and for customers in the UK in the third and fourth quarter of 2018, respectively. ACCESS provides customers with
53
benefits and rewards based on their annual spend on our Marketplace. We plan to roll the program out in additional countries in the first half of 2019.
Farfetch Private Client
Farfetch Private Client caters to some of our most important and highest spending consumers. Our Private Client proposition is to make our Marketplace the only place these valuable consumers need to go for all of their luxury fashion needs.
We offer high‑end services such as a dedicated personal shopper, priority customer service line and Fashion Concierge services. Fashion Concierge allows Farfetch Private Client consumers to access exclusive merchandise and to source products from non‑Farfetch sellers via their stylists. We also provide Farfetch Private Client consumers exclusive benefits, such as pre‑order options, access to special items, early access to coveted items and sales, a Farfetch Private Client app and free shipping on all items.
Security and Data Protection
We are committed to the security of our consumers’ experience with Farfetch. We undertake administrative and technical measures to protect our systems and the consumer data those systems process and store. We have developed policies and procedures designed to manage data security risks. We employ technical security defenses, we monitor servers and systems, and we use technical measures such as data encryption. We also use third parties to assist in our security practices and prevent and detect fraud.
Competition
We operate in a competitive industry, and consumers have the option to purchase both online and offline. While we believe that we do not have any direct competition with our Marketplace, we have indirect competitors in two primary categories:
Technology enablement companies:
| • | Technology companies that may attract sellers by enabling commerce, such as Shopify or Square; and |
| • | White‑label service providers, which offer end‑to‑end solutions. |
Luxury sellers:
| • | Online luxury retailers that buy and hold inventory and typically ship from a small number of centralized warehouses; |
| • | Multichannel players, which are independent retailers that developed their online channel following the success of their physical retail operations; |
| • | Niche multi‑brand and streetwear sites; |
| • | Luxury department stores; and |
Our Strategy in China and Relationship with JD.com
The rapidly growing luxury industry in China represents a major opportunity for us, and we have invested locally to support growth. As of December 31, 2018, we had 209 Farfetchers in Shanghai and Hong Kong, and our platform was able to deliver local language and payment systems. To further expand our presence in the luxury industry in China, in July 2018 we entered into an agreement for the acquisition of CuriosityChina, a domestic technology company with particular expertise in social customer relationship management and digital marketing for luxury fashion brands.
On June 21, 2017, we entered into a strategic partnership with JD.com. As part of this relationship, Farfetch leverages JD.com’s local logistics network, consumer payment solutions, technology capabilities, and its marketing
54
resources, including its WeChat partnership. We believe that this relationship will give us valuable insight into the Chinese market, while reinforcing our position as a global market leader in this region.
In February 2019, we expanded our strategic partnership with JD.com in order to provide the ‘Premier Luxury Gateway to China’ for luxury brands. As part of this transaction, JD.com’s luxury e-commerce platform, Toplife, will merge into Farfetch China. In addition, Farfetch will gain a ‘Level 1’ entry point on the JD.com app, providing JD.com’s customers with access to Farfetch’s network of more than 1,000 luxury brand and boutique partners.
Our Intellectual Property
Our intellectual property, including copyrights and trademarks, is an important component of our business. We have registered trademarks in various international jurisdictions for “FARFETCH” and “BROWNS,” among other brands. Our intellectual property portfolio includes numerous domain names for websites that we use in our business. We have several published and unpublished patent applications in the United Kingdom, Europe and internationally, which, if issued, would cover aspects of our proprietary technology, and the software code underlying our proprietary technology is also likely protected by copyright.
We control access to, use and distribution of our intellectual property through license agreements, confidentiality procedures, non‑disclosure agreements with third parties and our employment and contractor agreements. We rely on contractual provisions with suppliers and luxury sellers to protect our proprietary technology, brands and creative assets. We use a third‑party enforcement tool to monitor online image copyright infringement across domains, social media and mobile applications for “BROWNS” and “FARFETCH.” We also use a trademark watch service for the “FARFETCH” and “BROWNS” marks, which notifies us of potentially conflicting trademark applications, and we have registered “FARFETCH” and “BROWNSFASHIONSTORE” with a global domain name watch service and various domain name protected lists to alert us to third party domain name registrations that could potentially be infringing or cybersquatting.
Government Regulation
We use consumer data to perform the services available on our platform and conduct marketing activities, which may involve sharing consumer information with a third party, such as advertisers. Our activities involving the use of consumer data are subject to consumer protection, data protection and unfair and deceptive practices laws in jurisdictions in which we operate. In addition, as we accept credit cards transactions, we must comply with the Payment Card Industry Data Security Standards. The United States and European Union as well as other countries in which we operate are increasingly regulating certain activities on the internet and e-commerce, including the use of information retrieved from or transmitted over the internet, are increasingly focused on ensuring user privacy and information security, which will potentially limit behavioral targeting and online advertising, and are imposing new or additional rules regarding the taxation of internet products and services, the quality of products and services as well as the liability for third‑party activities. Moreover, the applicability to the internet of existing laws governing issues such as intellectual property ownership and infringement is uncertain and evolving.
In particular, we are subject to an evolving set of data privacy laws in the United States, European Union Brazil and other jurisdictions. As of May 25, 2018, the new EU data protection regime became applicable and provides for a number of changes to the previous regime, including more onerous requirements on companies that process personal data, including, for example, expanded disclosures to tell our consumers about how personal information is to be used, increased rights for consumers to access, control the use of and delete their data and object to marketing and profiling. Certain breaches of the new regime may impose fines up to the greater of €20 million or 4% of the global turnover on a group basis. In addition, specific EU legislation regulating privacy online, including the use of cookies and similar technologies and online targeted advertising, is also under reform. In the United States, in June 2018, California enacted the CCPA, which is presently going into effect on January 1, 2020. Unless amended or pre-empted by federal law, when effective, the new law will, among other things, require new disclosures to California consumers, afford consumers new abilities to opt out of certain disclosures of personal information and new rights of data access and deletions, and impose significant fines and penalties for violations of privacy or data security provisions.
55
Many governmental authorities in the markets in which we operate are also considering alternative legislative and regulatory proposals that would increase regulation on internet advertising. It is impossible to predict whether new taxes or regulations will be imposed on our business and whether or how we might be affected.
In many jurisdictions in which we operate, operational licenses are required. In certain jurisdictions, including China, these licenses must be reviewed annually.
C. Organizational structure
Please refer to note 20 to our audited consolidated financial statements for the years ended December 31, 2018, 2017 and 2016 included elsewhere in this Annual Report for a listing of the company’s significant subsidiaries, including name, country of incorporation, and proportion of ownership interest.
D. Property, Plant and Equipment
Our Facilities
As of December 31, 2018, we had offices in Braga, Dubai, Hong Kong, Lisbon, London, Los Angeles, Moscow, New Delhi, New York, Porto, São Paulo, Shanghai and Tokyo, and production centers in Guimarães, Los Angeles, São Paulo and Hong Kong. In addition, Browns leases retail properties in London.
Our London office is our corporate headquarters, housing our central support functions, and is leased for a term of 12 years expiring in December 2027. It covers an aggregate of approximately 36,000 square feet, divided over three floors. In addition, we recently leased approximately 30,000 square feet of office space in London, adjacent to our London headquarters, pursuant to a lease that expires in 2027.
Item 4A. Unresolved Staff Comments
None.
56
Item 5. Operating and Financial Review and Prospects
You should read the following discussion in conjunction with the section entitled “Selected Consolidated Financial and Operating Data,” our historical consolidated financial statements and the related notes included elsewhere in this Annual Report. This discussion contains forward-looking statements and involves numerous risks and uncertainties, including, but not limited to, those described in Item 3. “Key Information—Selected Financial Data.” Actual results could differ materially from those contained in any forward-looking statements.
On May 15, 2018, Farfetch Limited was incorporated under the laws of the Cayman Islands to become the holding company of Farfetch.com Limited and its subsidiaries pursuant to the Reorganization Transactions. Farfetch Limited has engaged solely in operations and activities incidental to its formation, the Reorganization Transactions and the initial public offering of our Class A ordinary shares. Accordingly, financial information for Farfetch Limited and a discussion and analysis of its results of operations and financial condition for the period of its operations prior to the Reorganization Transactions would not be meaningful and are not presented. Following the Reorganization Transactions, the historical consolidated financial statements of Farfetch Limited will include the historical consolidated financial results of Farfetch Limited and its consolidated subsidiaries for all periods presented. When we refer to the “Consolidated Group” or “Group,” we are referring to Farfetch Limited and its consolidated subsidiaries.
Our Business Model
We generate income from transactions between sellers and consumers conducted on our platform. Transactions generate GMV, which we collect and remit to sellers after deducting our income, which is based on a revenue-share model. This represents the majority of our income.
Our revenue is the combination of three streams:
| • | Platform Services Revenue, which primarily includes commissions based on Third-Party Take Rate. To a lesser extent, we generate revenue from the sale of inventory on the platform that is directly purchased by our Browns boutiques and sold online where revenue is equal to the GMV of such sales. |
| • | Platform Fulfilment Revenue, which comes from shipping and customs clearing services that we provide to our consumers in relation to fulfilling transactions on our platform, net of consumer promotional incentives, such as free shipping and promotional codes, against this revenue. |
| • | In-Store Revenue, which is the revenue generated in Browns retail stores. |
We focus on Platform Services Revenue, as we think this best represents the economic value being generated by the platform.
For the year ended December 31, 2018, our revenue was $602.4 million, being:
| • | $489.0 million of Platform Services Revenue; |
| • | $97.8 million of Platform Fulfilment Revenue; and |
| • | $15.6 million of In-Store Revenue. |
Platform Gross Profit represents Platform Services Revenue and Platform Fulfilment Revenue less our cost of revenue, which is transaction processing fees, customs duties, shipping costs, packaging and other direct order related costs. Platform Gross Profit as a percentage of Platform Services Revenue reflects the value of platform transactions before demand generation expense.
For the year ended December 31, 2018, Platform GMV was $1,392.1 million, including $97.8 million of Platform Fulfilment Revenue.
57
Platform GMV is generated by the Farfetch Marketplace, which contributed over 90% of Platform GMV for the year ended December 31, 2018. Platform GMV is also generated by Farfetch Black & White Solutions, our modular white-label e-commerce solution that provides brands and retailers with services ranging from a full-service branded e-commerce solution to individual off-the-shelf components.
Browns is an iconic British fashion and luxury goods boutique. Browns operates two retail stores in London and also leverages applications on our platform. Ownership of Browns enables us to understand the fashion ecosystem through the lens of a boutique. In addition to enhancing our credibility in fashion, Browns also serves the critical mission of pioneering innovations developed under our Augmented Retail strategy, including providing a luxury fashion boutique environment to test our Farfetch Store of the Future technology. For the year ended December 31, 2018, Browns generated $15.6 million of In-Store Revenue.
Over time, we plan to monetize other aspects of our platform. The first example of our Augmented Retail strategy is Farfetch Store of the Future, a suite of technologies that aims to improve retail productivity by capturing consumer data and enhancing interactions between consumers and sales associates, both in store and when the consumer interacts with the retailer or brand offline. We believe the future of luxury fashion retail will be defined by the reinvention of the consumer experience through online and offline integrations, and we are investing in innovation to achieve this vision.
Factors Affecting our Financial Condition and Results of Operations
Our financial condition and results of operations have been, and will continue to be, affected by a number of important factors, including the following:
Growth and Quality of our Luxury Supply
Our business model allows us to offer consumers the broadest and deepest selection of luxury, with a high stock value while incurring minimal inventory risk, by combining supply from a large number of globally distributed luxury sellers. Our success depends on the participation of these luxury sellers on the Farfetch Marketplace, their highly curated range of products and our ability to effectively sell these goods.
We have a rigorous framework to assess retailers and brands. Boutique selection is based on their brand assortment, category focus, market reputation and strength of buying. Brand selection is based on demand and trends, so that we offer our consumers access to the best, most current and most desirable products.
As of December 31, 2018, we had 1,022 luxury sellers on the Farfetch Marketplace, of which 640 were retailers and 382 were brands who sell directly on our Marketplace.
The selection of merchandise for sale on the Farfetch Marketplace must meet the needs of constantly evolving consumer tastes and adapt to rapidly changing fashion trends. Therefore, our success is also dependent on the ability of our luxury sellers to anticipate, identify and translate changing fashion trends and consumer demands into timely and appropriately curated product offerings. We constantly provide our partners with fashion insight that comes from our analysis of browsing, sales and returns data trends across the Farfetch Marketplace, as well as the offline sales data points that come from our real-time integrations with our luxury sellers.
The breadth and depth of inventory available through the Farfetch Marketplace is reflected in our stock value. Brands and designers typically have two primary seasonal collections per year, spring/summer and fall/winter.
We expect to continue to grow the stock value and stock units on our Marketplace from existing luxury sellers, adding luxury sellers from new geographies, large multi-brand retailers and new brands.
58
Growth, Engagement and Retention of Our Active Consumers
Platform GMV and revenue grow as a result of acquiring and retaining Active Consumers, increasing the Number of Orders.
As of December 31, 2018, we had 1,353,400 Active Consumers, up from 935,772 as of December 31, 2017. The Number of Orders for the year ended December 31, 2018 was 2.9 million, up from 1.9 million for the year ended December 31, 2017.
We have been able to grow Platform GMV from both new and existing consumers since launching the Farfetch Marketplace in 2008. While we continue to acquire new consumers, the share of Platform GMV from existing consumers has also increased over time, indicating our ability to retain existing consumers.
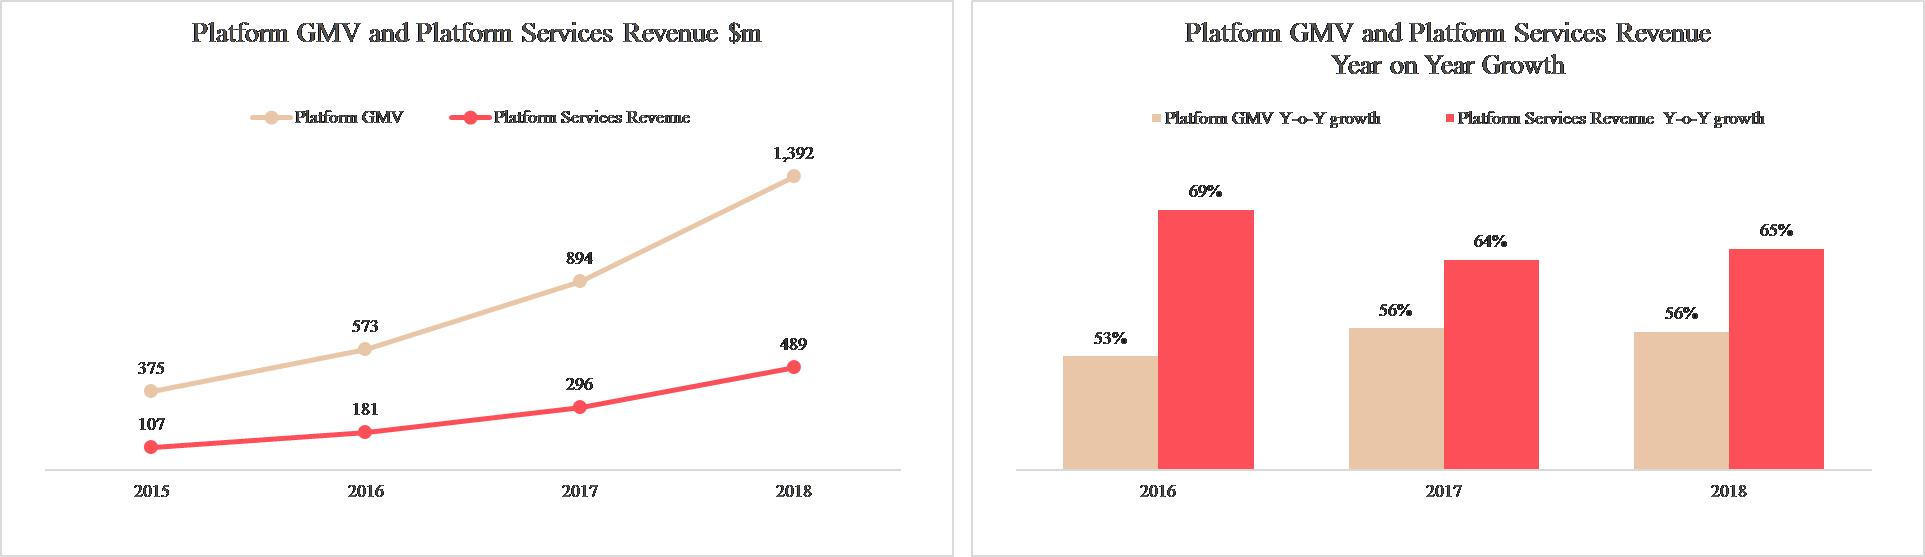
We define new consumers as those who placed their first order on our Marketplace.
We expect growth in new consumers to be driven by further penetration of the luxury consumer market, including growing our business in emerging markets, such as China, the Middle East, Latin America and Eastern Europe.
Cost of Consumer Acquisition and Engagement
Our financial performance also depends on the expenses we incur to attract and retain consumers.
Demand generation expense consists primarily of fees that we pay our various media and affiliate partners. We will continue to invest in consumer acquisition and retention while the underlying consumer unit economics indicate the return on investment is strong. While we expect these expenses to increase as we continue to grow, we expect such expenses to decrease as a percentage of Adjusted Revenue over time as we continue to improve the efficiency of our demand generation activities and the percentage of our business related to existing consumers increases. In particular, we continue to gain efficiencies in our performance marketing spend by leveraging the large volume of product performance data that we have available to enhance our media bidding decisions across paid search, meta-search and online display. We also expanded our network of active media partners, which extended our audience reach and further diversified its overall media mix.
We also generate highly attractive consumer economics. While we are continuously focused on adding new Active Consumers to the Farfetch Marketplace, we are also focused on increasing their purchase frequency and Average Order Value after their initial purchase, while lowering retention expenditure. As a result, our existing consumers have typically generated a higher Platform Order Contribution Margin over time.
59
Fulfilment
To facilitate and grow our platform, we provide fulfilment services to Marketplace consumers and receive revenue from the provision of these services, which is by and large a pass-through cost with no economic benefit to us, and therefore we calculate our Adjusted Revenue excluding Platform Fulfilment Revenue. We offer our platform partners access to a fully integrated logistics network, which enables them to ship to consumers in 190 countries. This is an essential part of the consumer proposition and provides an unparalleled luxury experience. We have developed a comprehensive cross-border network for delivery, provided by leading third-party partners globally, which also provides Marketplace consumers with a free, simple and efficient returns process.
Scaling our Global Platform
We will continue to invest in our smart supply chain management and luxury customer care to provide our consumers with a differentiated global product offering but localized consumer experience. Our end-to-end operations include in-house content creation to achieve a luxury product presentation, localized interfaces, multilingual customer service, secure payment methods and seamless customs clearance and tariffs navigation. While we expect our operational expenses to increase as we continue to grow, we expect such expenses to decrease as a percentage of Adjusted Revenue over time as we continue to achieve economies of scale and deliver operating leverage.
Investments in Technology
We will continue to invest in people, product and infrastructure to maintain and grow our platform. Our technology expense in the twelve months ended December 31, 2018 was $68.2 million, up 115.8% from $31.6 million in the twelve months ended December 31, 2017. Our technology expense has increased as we continue to recruit additional personnel and to develop our technology expertise across the full spectrum of engineering, architecture, infrastructure, data engineering, integrations, security, agile and project management, and information systems and planning. As of December 31, 2018, we had 1,241 full-time data scientists, engineers and product employees, representing 38.4% of our total headcount. We have adjusted the pace of our increase in technology headcount, by using outsourcing to create a flexible and adaptable workforce to meet fluctuations in development needs. We expect to increase our total number of data scientists and engineers, to approximately 1,500 people by the end of 2019.
In 2019 we announced a strategic partnership with Harrods partnership. We plan to spend an additional $10m on technology to accelerate the existing plans which we believe will allow us to continue to capture and expand the reach of our platform and generate future growth driving technological innovation in the luxury industry.
These investments will generate losses in the near term and could therefore delay our ability to achieve overall profitability or reduce our profitability in the near term.
60
Innovation and investment
We will continue to invest in sustainable growth as a priority over short term profitability where we see opportunities to advance our strategic objectives. These opportunities have and may include acquisitions, investments in our customers, and investments to deliver Farfetch Platform Solutions including technology and other resources.
Whilst these investments may result in lower profitability through impacting our blended commission rates and incremental costs which may lower our EBTIDA margins, they allow us to both widen and leverage our platform and expand our customer base and offering.
During 2018, we continued to innovate and invest in our existing consumers launching our loyalty program ACCESS which we believe will increase consumer engagement and ‘spend per consumer”. This is a key investment in our loyal consumers which we expect to impact our Contribution Margin, but we believe will deliver significant returns in the medium-term by differentiating Farfetch as the preferred destination for luxury fashion online.
In February 2019, we announced the acquisition of Toplife, JD.com’s luxury platform. As part of this agreement, Farfetch will gain ‘Level 1’ Access on the JD.com mobile app. Level 1 Access is a prominent entry-point button on the homescreen of the JD.com app. This will provide JD.com’s 300 million customers with instant access to more than 3,000 brands via Farfetch’s network of more than 1,000 luxury brand and boutique partners.
Previously, in 2018, Farfetch strengthened its China business through its agreement to acquire CuriosityChina, a leading integrated marketing and social commerce company. With the acquisitions of CuriosityChina and Toplife, Farfetch will now offer the full suite of Farfetch’s technology and logistics platform to brands wanting to reach luxury consumers in China.
Other Factors Affecting Our Performance
Results of our operations are impacted by a number of other factors, including seasonality and foreign exchange fluctuations:
Seasonality. Our business is seasonal in nature, broadly reflecting traditional retail seasonality patterns through the calendar year. As such, GMV and revenue have been historically higher in the fourth calendar quarter of each year than in other quarters. We believe seasonality may continue to impact our quarterly results.
Foreign currency fluctuations. The global nature of our platform business means that we earn revenue and incur expenses in a number of different currencies. Movements in exchange rates therefore impact our results and cash flows. Foreign exchange exposure is created by the currency received, determined by the consumer’s location, and the currency we pay to the retailer and brand as determined by their location. This results in transactional foreign currency exposure. Our general policy is to hedge this transactional exposure using forward foreign exchange contracts. We do not hedge translation risk.
61
Key Operating and Financial Metrics
The key operating and financial metrics we use are set forth below. The following table sets forth our key performance indicators for the years ended December 31, 2016, 2017 and 2018.
| | Year ended December 31, | |
| | 2016 | | | 2017 | | | 2018 | |
| | (in thousands, unless stated otherwise) | |
Consolidated Group: | | | | | | | | | | | | |
GMV(1) | | $ | 585,842 | | | $ | 909,826 | | | $ | 1,407,698 | |
Revenue | | | 242,116 | | | | 385,966 | | | | 602,384 | |
Adjusted Revenue(1) | | | 193,605 | | | | 311,784 | | | | 504,590 | |
Technology Expense(2) | | | 12,269 | | | | 31,611 | | | | 68,224 | |
Adjusted EBITDA(1) | | | (53,380 | ) | | | (58,079 | ) | | | (95,960 | ) |
Adjusted EBITDA Margin(1) | | (27.6%) | | | (18.6%) | | | (19.0%) | |
Platform: | | | | | | | | | | | | |
Platform GMV(1) | | $ | 573,174 | | | $ | 894,392 | | | $ | 1,392,104 | |
Platform Revenue | | | | | | | | | | | | |
Platform Services Revenue(1) | | | 180,937 | | | | 296,350 | | | | 488,995 | |
Platform Fulfilment Revenue(1) | | | 48,511 | | | | 74,182 | | | | 97,794 | |
Platform Gross Profit(1) | | | 111,762 | | | | 196,581 | | | | 291,706 | |
Platform Order Contribution Margin(1) | | 35.0% | | | 43.0% | | | 39.8% | |
Third-Party Take Rate(3) | | 31.3% | | | 32.9% | | | | 32.0 | % |
Farfetch Marketplace: | | | | | | | | | | | | |
Active Consumers(3) | | | 651.7 | | | | 935.8 | | | | 1,353.4 | |
Number of Orders(3) | | | 1,259.7 | | | | 1,881.0 | | | | 2,913.0 | |
Average Order Value (actual)(3) | | $ | 583.6 | | | $ | 620.0 | | | $ | 618.6 | |
(1) | See Item 3. “Key Information — A. Selected Financial Data — Non-IFRS and Other Financial and Other Operating Metrics” for a definition, explanation and, as applicable, reconciliation these measures. |
(2) | Technology Expense consists of technology research and of development, staffing costs and other IT costs, including software licensing. We have a policy of capitalizing development staffing costs when intangible asset recognition criteria are met, and therefore, these capitalized costs are not included in technology expense. These are subsequently amortized and included as depreciation and amortization. Other technology related costs are expensed as incurred. |
(3) | See “Presentation of Financial and Other Information — Key Terms and Performance Indicators Used in this Annual Report” for a definition and explanation of these terms. |
Components of our Results of Operations
Revenue. We generate revenue through commissions on sales through the Farfetch Marketplace and on services rendered to our consumers and sellers, including those offered via our Marketplace and Farfetch Black & White Solutions. We also generate revenue through the sale of goods via Browns retail stores.
Our primary source of service revenue is from the provision of platform services. We act as an arranger through connecting sellers to consumers. We are also responsible for providing fulfilment services, which includes the provision of shipping services to the consumers and packaging materials and credit card processing to sellers. When we act as a commercial intermediary between sellers and final consumers, revenue recognized represents commission earned for operation of the Farfetch Marketplace, including fulfilment services. The services rendered also include payment and other related services provided by us. Our commission generated on sales is based on the contractual agreement we have with each seller, where we earn a percentage based on the value of sales conducted through the Farfetch Marketplace. Our commission is a blended commission because it is attributable to a mix of the different types of services that we provide. We recognize commissions and non-shipping service revenue when the goods are dispatched to the consumer by the sellers. A provision for expected returns is made against this. As we provide shipping services to the consumer, shipping revenue is recognized on delivery to the consumer. Promotional incentives may be periodically offered to consumers. When we bear the costs of promotional incentives, these costs are recognized as deductions to revenue.
62
Revenue from the sale of goods is net of returns and allowances, trade discounts and volume rebates. Revenue is recognized when the performance obligation is satisfied, which is when the goods are received by the consumer. Included within sales of goods is a provision for expected returns, discounts and rebates.
Cost of Revenue. Cost of revenue includes shipping costs, duties, credit card fees and packaging. The components of cost of revenue are variable in nature and fluctuate with changes in revenue.
Selling, General and Administrative. Our selling, general and administrative expenses primarily consist of demand generation, technology expense, salaries, bonuses, benefits and share based compensation for our employees, and outside consulting, legal and accounting services, as well as facilities and other overhead costs. Our demand generation expense consists primarily of fees that we pay for our various marketing channels such as search engine marketing, search engine optimization, display, digital advertising and affiliate marketing to drive consumer acquisition and retention. We expect that our selling, general and administrative expenses will increase for the foreseeable future as we grow our business.
Depreciation and Amortization. Depreciation and amortization includes the depreciation of property, plant and equipment, capitalized leasehold improvements and amortization of technology and other intangible assets, alongside any loss on the disposal of property, plant and equipment and any asset impairments.
Segment Reporting
We have determined our operating segments on the same basis that we use to evaluate performance internally. Our operating segments are: (1) Farfetch Marketplace, (2) Farfetch Black and White, (3) Farfetch Store of the Future and (4) Browns stores. Farfetch Marketplace represents over 90% of revenue; therefore, we are presenting only one reportable operating segment being the consolidated view of all operating segments noted above.
A. Operating Results
The following tables shows our consolidated results of operations for the years ended December 31, 2016, 2017 and 2018 and as a percentage of revenue.
| | Year ended December 31, | |
| | 2016 | | | 2017 | | | 2018 | |
| | (in thousands) | |
Revenue | | $ | 242,116 | | | $ | 385,966 | | | $ | 602,384 | |
Cost of revenue | | | (125,238 | ) | | | (181,200 | ) | | | (303,934 | ) |
Gross profit | | | 116,878 | | | | 204,766 | | | | 298,450 | |
Selling, general and administrative | | | (205,558 | ) | | | (299,260 | ) | | | (471,766 | ) |
Share of profits of associates | | | 18 | | | | 31 | | | | 33 | |
Operating loss | | | (88,662 | ) | | | (94,463 | ) | | | (173,283 | ) |
Net finance income/(costs) | | | 7,402 | | | | (17,642 | ) | | | 19,866 | |
Loss before tax | | | (81,260 | ) | | | (112,105 | ) | | | (153,417 | ) |
Income tax expense | | | (199 | ) | | | (170 | ) | | | (2,158 | ) |
Loss after tax | | $ | (81,459 | ) | | $ | (112,275 | ) | | $ | (155,575 | ) |
63
| | Year ended December 31, | |
| | 2016 | | | 2017 | | | 2018 | |
Revenue | | | 100.0 | % | | | 100.0 | % | | | 100.0 | % |
Cost of revenue | | | (51.7 | ) | | | (46.9 | ) | | | (50.5 | ) |
Gross profit | | | 48.3 | | | | 53.1 | | | | 49.5 | |
Selling, general and administrative | | | (84.9 | ) | | | (77.4 | ) | | | (78.3 | ) |
Share of profits of associates | | | 0.0 | | | | 0.0 | | | | 0.0 | |
Operating loss | | | (36.6 | ) | | | (24.3 | ) | | | (28.8 | ) |
Net finance income/(costs) | | | 3.1 | | | | (4.6 | ) | | | 3.3 | |
Loss before tax | | | (33.5 | ) | | | (28.9 | ) | | | (25.5 | ) |
Income tax expense | | | (0.1 | ) | | | (0.1 | ) | | | (0.4 | ) |
Loss after tax | | | (33.6 | %) | | | (29.0 | %) | | | (25.9 | %) |
Comparison of Year Ended December 31, 2017 and 2018
Revenue
| | Year ended December 31, | | | | | | | | | |
| | 2017 | | | 2018 | | | $ Change | | | % Change | |
| | (in thousands) | | | | | | | | | |
Revenue | | $ | 385,966 | | | $ | 602,384 | | | $ | 216,418 | | | | 56.1 | % |
Less: Platform Fulfilment Revenue | | | (74,182 | ) | | | (97,794 | ) | | | (23,612 | ) | | | (31.8 | %) |
Adjusted Revenue | | $ | 311,784 | | | $ | 504,590 | | | $ | 192,806 | | | | 61.8 | % |
Revenue for the year ended December 31, 2018 increased by $216.4 million, or 56.1%, compared to the year ended December 31, 2017. Adjusted Revenue for the year ended December 31, 2018 increased by $192.8 million, or 61.8%, compared to the year ended December 31, 2017. This was a function of growth in GMV of 54.7% partially offset by a decrease in Third-Party Take Rate from 32.9% to 32.0% driven by changes in mix of supply between sellers with differing take-rates. Growth in GMV was primarily driven by the Number of Orders increasing by 54.9% to approximately 2.9 million. This was driven by growth in Active Consumers from 935,772 to 1,353,400 (an increase of 44.6%) over the same period, which reflects our marketing efforts to generate continued growth in demand from existing consumers across international markets together with an increase in new consumer orders. AOV decreased by only 0.2% and has therefore had a minimal impact. We also had an increase in supply as the number of luxury sellers grew significantly during 2018. In-Store Revenue also increased from $15.4 million to $15.6 million, an increase of 1.3%. Platform Fulfilment Revenue accounted for 16.2% of revenue in 2018, down from 19.2% in 2017.
Cost of revenue, gross profit and gross profit margin
| | Year ended December 31, | | | | | | | | | |
| | 2017 | | | 2018 | | | $ Change | | | % Change | |
| | (in thousands) | | | | | | | | | |
Cost of revenue | | $ | (181,200 | ) | | $ | (303,934 | ) | | $ | (122,734 | ) | | | (67.7 | %) |
Gross profit | | | 204,766 | | | | 298,450 | | | | 93,684 | | | | 45.8 | % |
Gross profit margin | | | 53.1 | % | | | 49.5 | % | | | | | | | | |
Cost of revenue for the year ended December 31, 2018 increased by $122.7 million, or (67.7%), compared to the year ended December 31, 2017, which was primarily driven by the increases in cost of goods associated with first-party sales, as well as the increase in delivery, packaging and transaction processing expenditures as a result of the increased Number of Orders.
64
Our gross profit margin decreased from 53.1% to 49.5% for the year ended December 31, 2017 to the year ended December 31, 2018, which was driven by an increased mix of first-party sales, which have a different gross margin profile than our third-party business; and the impact of retail pricing and inventory optimization on first-party gross margin.
Selling, general and administrative expenses
Selling, general and administrative expenses consisted of the following components:
| | Year ended December 31, | | | | | | | % of Adjusted Revenue | |
| | 2017 | | | 2018 | | | % Change | | | 2017 | | | 2018 | |
| | (in thousands) | | | | | | | | | | | | | |
Demand generation expense | | $ | (69,202 | ) | | $ | (97,295 | ) | | | (40.6 | %) | | | (22.2 | %) | | | (19.3 | %) |
Technology expense | | | (31,611 | ) | | | (68,224 | ) | | | (115.8 | ) | | | (10.1 | ) | | | (13.5 | ) |
Depreciation and amortization | | | (10,980 | ) | | | (23,537 | ) | | | (114.4 | ) | | | (3.5 | ) | | | (4.7 | ) |
Share based payments | | | (21,486 | ) | | | (53,819 | ) | | | (150.5 | ) | | | (6.9 | ) | | | (10.7 | ) |
General and administrative | | | (165,981 | ) | | | (228,891 | ) | | | (37.9 | ) | | | (53.2 | ) | | | (45.4 | ) |
Total | | $ | (299,260 | ) | | $ | (471,766 | ) | | | (57.6 | %) | | | (96.0 | %) | | | (93.5 | %) |
Demand generation expense
| | Year ended December 31, | | | | | | | | | |
| | 2017 | | | 2018 | | | $ Change | | | % Change | |
| | (in thousands) | | | | | | | | | |
Demand generation expense | | $ | (69,202 | ) | | $ | (97,295 | ) | | $ | (28,093 | ) | | | (40.6 | %) |
Demand generation expense for the year ended December 31, 2018 increased by $28.1 million, or (40.6%), compared to the year ended December 31, 2017. The expenditures related to existing markets and our continued international expansion into emerging markets across all channels. Whilst we continue to invest in consumer engagement, we have gained efficiencies in our demand generation spend by leveraging data insights to be more targeted in our digital marketing approach, together with scaling marketing operations across the 200 countries in which we have consumers. We have also automated campaign management and set-up, thereby reducing the amount of time it takes to promote new products added to the platform. Demand generation expense declined as a percentage of Adjusted Revenue, from (22.2%) in 2017 to (19.3%) in 2018. Although demand generation expense as a percentage of Adjusted Revenue declined, Platform Order Contribution Margin fell over the same period, from 43.0% in 2017 to 39.8% in 2018 due to the shift in mix towards first-party Platform GMV and lower first-party Platform gross profit margins.
Technology expense
| | Year ended December 31, | | | | | | | | | |
| | 2017 | | | 2018 | | | $ Change | | | % Change | |
| | (in thousands) | | | | | | | | | |
Technology expense | | $ | (31,611 | ) | | $ | (68,224 | ) | | $ | (36,613 | ) | | | (115.8 | %) |
Capitalized development costs | | | (18,997 | ) | | | (50,978 | ) | | | (31,981 | ) | | | (168.3 | %) |
Total cash investment in technology | | $ | (50,608 | ) | | $ | (119,202 | ) | | $ | (68,594 | ) | | | (135.5 | %) |
Technology expense for the year ended December 31, 2018 increased by $36.6 million, compared to the year ended December 31, 2017, which was primarily driven by an increase in technology staff headcount from 802 to 1,241 during 2018, as we continued to develop new technologies and enhance our platform. Total cash spend
65
amounted to $119.2 million during 2018, $51.0 million of which was capitalized, as compared to a total of $50.6 million during 2017, $19.0 million of which was capitalized.
Depreciation and amortization
| | Year ended December 31, | | | | | | | | | |
| | 2017 | | | 2018 | | | $ Change | | | % Change | |
| | (in thousands) | | | | | | | | | |
Depreciation and amortization | | $ | (10,980 | ) | | $ | (23,537 | ) | | $ | (12,557 | ) | | | (114.4 | %) |
Depreciation and amortization expense for the year ended December 31, 2018 increased by $12.6 million, or (114.4%), compared to the year ended December 31, 2017, which was primarily driven by an increase in our amortization expenses. Amortization increased because of our continued technology investment, in which we capitalize qualifying technology development costs and amortize them over a three-year period. The increase in depreciation primarily related to the depreciation of leasehold improvements to our offices.
Share based payments
| | Year ended December 31, | | | | | | | | | |
| | 2017 | | | 2018 | | | $ Change | | | % Change | |
| | (in thousands) | | | | | | | | | |
Share based payments | | $ | (21,486 | ) | | $ | (53,819 | ) | | $ | (32,333 | ) | | | (150.5 | %) |
Share based payments for the year ended December 31, 2018 increased by $32.3 million, or (150.5%), compared to the year ended December 31, 2017, which was primarily driven by the increase in share price following the IPO in September 2018 and the associated impact on cash settled share options and provisions for employment related taxes. These are remeasured at each reporting date whereas the equity settled plans are measured at the grant date. The movement year on year is driven by the remeasurement of cash settled options from the share price as at December 31, 2017 to the share price as at December 31, 2018. Other contributing factors include an increase in headcount and grants made at IPO.
General and administrative expense
| | Year ended December 31, | | | | | | | | | |
| | 2017 | | | 2018 | | | $ Change | | | % Change | |
| | (in thousands) | | | | | | | | | |
General and administrative | | $ | (165,981 | ) | | $ | (228,891 | ) | | $ | (62,910 | ) | | | (37.9 | %) |
General and administrative expense for the year ended December 31, 2018 increased by $62.9 million, or (37.9%), compared to the year ended December 31, 2017, which was primarily driven by an increase in headcount, excluding technology staff which are included in the technology expense above, from 1,367 to 1,991, an increase of 45.6%. We increased non-technology headcount across a number of areas to support the growth and infrastructure of the business. In addition, we continued to expand geographically, increasing our global workforce across 12 office locations during 2018. Other increases were due to facilities and office costs and other fixed overhead costs. During 2018, we also continued to invest more in Farfetch brand building activities. General and administrative costs as a percentage of Adjusted Revenue decreased from (53.2%) to (45.4%) as we leveraged the benefits from prior year investment to support our growth.
66
Adjusted EBITDA
| | Year ended December 31, | | | | | | | | | |
| | 2017 | | | 2018 | | | $ Change | | | % Change | |
| | (in thousands) | | | | | | | | | |
Adjusted EBITDA | | $ | (58,079 | ) | | $ | (95,960 | ) | | $ | (37,881 | ) | | | (65.2 | %) |
% of Adjusted Revenue | | | (18.6 | %) | | | (19.0 | %) | | | | | | | | |
Adjusted EBITDA loss for the year ended December 31, 2018 increased by $37.9 million, or (65.2%), compared to the year ended December 31, 2017. This was primarily driven by increased investment in demand generation and technology expenses to support continued growth in GMV and Adjusted Revenue. There was also an increase in general and administrative expenses as we continued to scale our business.
Comparison of Year Ended December 31, 2016 and 2017
Revenue
| | Year ended December 31, | | | | | | | | | |
| | 2016 | | | 2017 | | | $ Change | | | % Change | |
| | (in thousands) | | | | | | | | | |
Revenue | | $ | 242,116 | | | $ | 385,966 | | | $ | 143,850 | | | | 59.4 | % |
Less: Platform Fulfilment Revenue | | | (48,511 | ) | | | (74,182 | ) | | | (25,671 | ) | | | (52.9 | ) |
Adjusted Revenue | | $ | 193,605 | | | $ | 311,784 | | | $ | 118,179 | | | | 61.0 | % |
Revenue for the year ended December 31, 2017 increased by $143.9 million, or 59.4%, compared to the year ended December 31, 2016. Adjusted Revenue for the year ended December 31, 2017 increased by $118.2 million, or 61.0%, compared to the year ended December 31, 2016. This was a function of growth in GMV of 55.3% and increased Third-Party Take Rate from 31.3% to 32.9%. Growth in GMV was primarily driven by the Number of Orders increasing by 49.3% to approximately 1.9 million. This was driven by growth in Active Consumers from 651,674 to 935,772 (an increase of 43.6%) over the same period, which was due to continued growth in demand from existing consumers across international markets together with an increase in new consumer orders.
We also had an increase in supply as the number of luxury sellers grew significantly during 2017. Growth in Third-Party Take Rate was a result of improved commercial terms with our platform partners. In addition to the growth in the number of consumers, AOV grew by 6.2% to $620.0. In-Store Revenue also increased from $12.7 million to $15.4 million, an increase of 21.3%, due to strong consumer engagement and new incentives for sales associates. Platform Fulfilment Revenue accounted for 19.2% of revenue in 2017, down from 20.0% in 2016.
Cost of revenue, gross profit and gross profit margin
| | Year ended December 31, | | | | | | | | | |
| | 2016 | | | 2017 | | | $ Change | | | % Change | |
| | (in thousands) | | | | | | | | | |
Cost of revenue | | $ | (125,238 | ) | | $ | (181,200 | ) | | $ | (55,962 | ) | | | (44.7 | %) |
Gross profit | | | 116,878 | | | | 204,766 | | | | 87,888 | | | | 75.2 | |
Gross profit margin | | | 48.3 | % | | | 53.1 | % | | | | | | | | |
Cost of revenue for the year ended December 31, 2017 increased by $56.0 million, or (44.7%), compared to the year ended December 31, 2016, which was primarily driven by the increase in delivery, packaging and transaction processing expenditures as a result of the increased Number of Orders.
67
Our gross profit margin improved from 48.3% to 53.1% for the year ended December 31, 2016 to the year ended December 31, 2017, which was primarily driven by an increase in blended commissions on sales generated through our Marketplace and scale efficiencies of fulfilment expenditures.
Selling, general and administrative expenses
Selling, general and administrative expenses consisted of the following components:
| | Year ended December 31, | | | | | | | % of Adjusted Revenue | |
| | 2016 | | | 2017 | | | % Change | | | 2016 | | | 2017 | |
| | (in thousands) | | | | | | | | | | | | | |
Demand generation expense | | $ | (48,381 | ) | | $ | (69,202 | ) | | | (43.0 | %) | | | (25.0 | %) | | | (22.2 | %) |
Technology expense | | | (12,269 | ) | | | (31,611 | ) | | | (157.6 | ) | | | (6.3 | ) | | | (10.1 | ) |
Depreciation and amortization | | | (6,897 | ) | | | (10,980 | ) | | | (59.2 | ) | | | (3.6 | ) | | | (3.5 | ) |
Share based payments | | | (19,848 | ) | | | (21,486 | ) | | | (8.3 | ) | | | (10.3 | ) | | | (6.9 | ) |
General and administrative | | | (118,163 | ) | | | (165,981 | ) | | | (40.5 | ) | | | (61.0 | ) | | | (53.2 | ) |
Total | | $ | (205,558 | ) | | $ | (299,260 | ) | | | (45.6 | %) | | | (106.2 | %) | | | (96.0 | %) |
Demand generation expense
| | Year ended December 31, | | | | | | | | | |
| | 2016 | | | 2017 | | | $ Change | | | % Change | |
| | (in thousands) | | | | | | | | | |
Demand generation expense | | $ | (48,381 | ) | | $ | (69,202 | ) | | $ | (20,821 | ) | | | (43.0 | %) |
Demand generation expense for the year ended December 31, 2017 increased by $20.8 million, or (43.0%), compared to the year ended December 31, 2016. The expenditures related to existing markets and our continued international expansion into emerging markets across all channels. We gained efficiencies in our demand generation spend by scaling marketing operations across the 190 markets in which we have consumers and by automating campaign management and set up, thereby reducing the amount of time it takes to promote new products added to the platform. Demand generation expense declined as a percentage of Adjusted Revenue, from (25.0%) in 2016 to (22.2%) in 2017, resulting in an increase in Platform Order Contribution Margin over the same period, from 35.0% in 2016 to 43.0% in 2017.
Technology expense
| | Year ended December 31, | | | | | | | | | |
| | 2016 | | | 2017 | | | $ Change | | | % Change | |
| | (in thousands) | | | | | | | | | |
Technology expense | | $ | (12,269 | ) | | $ | (31,611 | ) | | $ | (19,342 | ) | | | (157.6 | %) |
Capitalized development costs | | | (12,586 | ) | | | (18,997 | ) | | | (6,411 | ) | | | (50.9 | ) |
Total cash investment in technology | | $ | (24,855 | ) | | $ | (50,608 | ) | | $ | (25,753 | ) | | | (103.6 | %) |
Technology expense for the year ended December 31, 2017 increased by $19.3 million, compared to the year ended December 31, 2016, which was primarily driven by an increase in technology staff headcount from 494 to 802 during 2017, as we continued to develop new technologies and maintain and improve our platform. Total cash spend amounted to $50.6 million during 2017, $19.0 million of which was capitalized, as compared to a total of $24.9 million during 2016, $12.6 million of which was capitalized.
68
Depreciation and amortization
| | Year ended December 31, | | | | | | | | | |
| | 2016 | | | 2017 | | | $ Change | | | % Change | |
| | (in thousands) | | | | | | | | | |
Depreciation and amortization | | $ | (6,897 | ) | | $ | (10,980 | ) | | $ | (4,083 | ) | | | (59.2 | %) |
Depreciation and amortization expense for the year ended December 31, 2017 increased by $4.1 million, or (59.2%), compared to the year ended December 31, 2016, which was primarily driven by an increase in our amortization expenses. Amortization increased because of our continued technology investment, in which we capitalize qualifying technology development costs and amortize them over a three-year period. The increase in depreciation primarily related to the depreciation of leasehold improvements to our offices.
Share based payments
| | Year ended December 31, | | | | | | | | | |
| | 2016 | | | 2017 | | | $ Change | | | % Change | |
| | (in thousands) | | | | | | | | | |
Share based payments | | $ | (19,848 | ) | | $ | (21,486 | ) | | $ | (1,638 | ) | | | (8.3 | %) |
Share based payments for the year ended December 31, 2017 increased by $1.6 million, or (8.3%), compared to December 31, 2016, which was primarily driven by an increase in the number of options granted because of an increased headcount.
General and administrative expense
| | Year ended December 31, | | | | | | | | | |
| | 2016 | | | 2017 | | | $ Change | | | % Change | |
| | (in thousands) | | | | | | | | | |
General and administrative | | $ | (118,163 | ) | | $ | (165,981 | ) | | $ | (47,818 | ) | | | (40.5 | %) |
General and administrative expense for the year ended December 31, 2017 increased by $47.8 million, or (40.5%), compared to the year ended December 31, 2016, which was primarily driven by an increase in headcount, excluding technology staff which are included in the technology expense above, from 906 to 1,367, an increase of 50.9%. We increased non-technology headcount across a number of areas to support the growth of the business. In addition, we continued to expand geographically, increasing our global workforce across 12 office locations during 2017. Other increases were due to facilities and office costs and other fixed overhead costs. During 2017, we also invested more in Farfetch brand building activities. General and administrative costs as a percentage of Adjusted Revenue decreased from (61.0%) to (53.2%) as we leveraged the benefits from prior year investment to support our growth.
Adjusted EBITDA
| | Year ended December 31, | | | | | | | | | |
| | 2016 | | | 2017 | | | $ Change | | | % Change | |
| | (in thousands) | | | | | | | | | |
Adjusted EBITDA | | $ | (53,380 | ) | | $ | (58,079 | ) | | $ | (4,699 | ) | | | (8.8 | %) |
% of Adjusted Revenue | | | (27.6 | %) | | | (18.6 | %) | | | | | | | | |
69
Adjusted EBITDA loss for the year ended December 31, 2017 increased by $4.7 million, or (8.8%), compared to the year ended December 31, 2016. This was primarily driven by increased investment in demand generation and technology expenses to support continued growth in GMV and Adjusted Revenue. There was also an increase in general and administrative expenses as we continued to scale our business. Although there was an increased Adjusted EBITDA loss compared to the year ended December 31,2016, we have leveraged operational synergies where our selling, general and administrative expenses have grown at a slower rate than Adjusted Revenue. This is demonstrated by the reduction in Adjusted EBITDA loss as a percentage of Adjusted Revenue from (27.6%) for the year ended December 31, 2016 compared to (18.6%) to for year ended December 31, 2017.
Changes in Accounting Policies and Disclosures
Amendments to Standards That Are Mandatorily Effective for the Current Year
During the year ended December 31, 2018, the Group has applied the below amendments to IFRSs issued by the IASB that are mandatorily effective for an accounting period that began on or after January 1, 2018. Their adoption has not had any material impact on the disclosures or on the amounts reported in these financial statements.
| • | IFRS 9 Financial Instruments (effective January 1, 2018) |
| • | IFRS 2 (amendments) Classification and Measurement of Share based Payment Transactions (effective January 1, 2018) |
The adoption of IFRS 9 and IFRS 2 (amendments) did not have a material impact on our reported assets and liabilities and profit or loss.
IFRS 15 was early adopted by the Group on January 1, 2017.
New and Revised Standards in Issue But Not Yet Effective
At the date of authorization of the financial statements, we have not applied the following new and revised standards that have been issued but are not yet effective:
| • | IFRS 16 Leases (effective January 1, 2019) |
IFRS 16 will require lease liabilities and right of use assets for leases to be recognized on the Statement of Financial Position. We have completed an impact assessment. This assessment indicates that there will be a significant impact on the value of non-current assets and lease liabilities as the leases for office, production and retail space are currently accounted for as operating leases. For the current level of operating lease commitments refer to the contractual obligations table above. There will be an immaterial impact on the reported results for the year.
See Note 2.4 to our consolidated financial statements included in this Annual Report.
Critical Accounting Estimates and Judgments
Our consolidated financial statements are prepared in conformity with IFRS, as issued by the IASB. In preparing our audited consolidated financial statements, we make assumptions, judgments and estimates that can have a significant impact on amounts reported in our consolidated financial statements. We base our assumptions, judgments and estimates on historical experience and various other factors that we believe to be reasonable under the circumstances. Actual results could differ materially from these estimates under different assumptions or conditions. We regularly reevaluate our assumptions, judgments and estimates. Our critical accounting estimates and judgments are described in Note 3 to our audited consolidated financial statements included elsewhere in this Annual Report.
70
B. Liquidity and Capital Resources
General
As of December 31, 2018, we had cash and cash equivalents of $1,044.8 million. Our cash and cash equivalents consist primarily of cash in bank accounts and deposits in money market funds.
Since our inception, we have financed our operations primarily through equity issuances and cash generated from our operating activities. Our primary requirements for liquidity and capital are to finance working capital, capital expenditures and general corporate purposes. We believe that our sources of liquidity and capital will be sufficient to meet our business needs in the next 12 months. Our capital expenditure consists primarily of technology development costs, computer equipment and the fit out and improvements to our offices.
The following table shows summary consolidated cash flow information for the periods presented.
| | Year ended December 31, | |
| | 2016 | | | 2017 | | | 2018 | |
| | (in thousands) | |
Net cash outflow from operating activities | | $ | (47,079 | ) | | $ | (59,320 | ) | | $ | (116,205 | ) |
Net cash outflow from investing activities | | | (16,961 | ) | | | (28,863 | ) | | | (63,538 | ) |
Net cash inflow from financing activities | | | 161,173 | | | | 300,142 | | | | 859,526 | |
Net increase in cash and cash equivalents | | $ | 97,133 | | | $ | 211,959 | | | $ | 679,783 | |
Net Cash Outflow From Operating Activities
Net cash outflow from operating activities increased to $116.2 million in the year ended December 31, 2018 from $59.3 million in the year ended December 31, 2017, an increase of $56.9 million, or 96.0%. The increase was primarily due to an increase in the loss after tax from $112.3 million to $155.6 million.
Net cash outflow from operating activities increased to $59.3 million in the year ended December 31, 2017 from $47.1 million in the year ended December 31, 2016, an increase of $12.2 million, or 26.0%, primarily due to an increase in the loss after tax from $81.5 million to $112.3 million, which was partially offset by favorable net working capital and foreign exchange movements. Favorable working capital movements are a function of our business model, in which we collect cash from consumers on average 45 days before we remit to the sellers.
Net Cash Outflow From Investing Activities
Net cash outflow from investing activities increased to $63.5 million in the year ended December 31, 2018, from $28.9 million in the year ended December 31, 2017, an increase of $34.6 million, or 119.7%. The increase was primarily due to our continued investment in technology development (increasing from $19.0 million to 51.0 million over the period) as discussed above. In line with headcount growth, we have increased investments in office facilities and computer equipment spend, increasing from $12.6 million to $21.1 million over the line period.
Net cash outflow from investing activities increased to $28.9 million in the year ended December 31, 2017, from $17.0 million in the year ended December 31, 2016, an increase of $11.9 million, or 70.2%, primarily due to our continued investment in technology development (increasing from $12.6 million to $19.0 million over the period) as discussed above. In line with headcount growth, we have increased investments in office facilities and computer equipment spend, increasing from $6.0 million to $12.6 million over the period.
Net Cash Inflow From Financing Activities
The increase in cash from financing activities was primarily driven by our IPO in the third fiscal quarter of 2018 which raised $775.7 million, net of issue costs. Other contributing factors include the series G funding round follow-on where the company raised $82.3 million, net of issue costs.
71
Share Based Payments
Employees receive remuneration in the form of share based payments in the from either equity or cash settled depending on the scheme. For further details, See Note 2.3 (o), “Summary of significant accounting policies” to our audited consolidated financial statements included elsewhere in this Annual Report for further detail.
C. Research and Development, Patents and Licenses, etc.
See Note 10 to our consolidated financial statements included in this Annual Report.
D. Trend Information
Other than as disclosed elsewhere in this Annual Report, we are not aware of any trends, uncertainties, demands, commitments or events since December 31, 2018 that are reasonably likely to have a material adverse effect on our revenues, income, profitability, liquidity or capital resources, or that would cause the disclosed financial information to be not necessarily indicative of future operating results or financial conditions.
E. Off-Balance Sheet Arrangements
In the ordinary course of business, we enter into operating lease commitments and capital commitments. These transactions are recognized in the consolidated financial statements in accordance with IFRS, as issued by the IASB, and are more fully disclosed therein.
As of December 31, 2018, we had not entered into any other off-balance sheet transactions.
F. Tabular Disclosure of Contractual Obligations
The following table sets forth our contractual obligations as of December 31, 2018:
| | Payments due by period | |
Contractual Obligations | | Total | | | Less than 1 year | | | 1-3 years | | | 3-5 years | | | more than 5 years | |
Operating Lease Obligations | | $ | 103,034 | | | $ | 15,820 | | | $ | 26,599 | | | $ | 22,584 | | | $ | 38,031 | |
Total | | $ | 103,034 | | | $ | 15,820 | | | $ | 26,599 | | | $ | 22,584 | | | $ | 38,031 | |
G. Safe Harbor
See the section entitled "Cautionary Statement Regarding Forward-Looking Statements" at the beginning of this Annual Report.
72
Item 6. Directors, Senior Management and Employees
A. Directors and Senior Management
Executive Officers and Board Members
The following table presents information about our current executive officers and Board, including their ages as of February 28, 2019:
Name | | Age | | Position |
Executive Officers | | | | |
José Neves | | 44 | | Chief Executive Officer and Co-Chair of the Board |
Elliot Jordan | | 43 | | Chief Financial Officer |
Andrew Robb | | 42 | | Chief Operating Officer |
Board Members | | | | |
Frederic Court(2) | | 49 | | Board Member |
Dana Evan(1)(2) | | 59 | | Board Member |
Jon Kamaluddin(1) | | 45 | | Board Member |
Dr. Jon Jainwen Liao, PhD(4) | | 51 | | Board Member |
Natalie Massenet(3) | | 53 | | Co-Chair of the Board |
Jonathan Newhouse | | 66 | | Board Member |
Danny Rimer(2)(3) | | 48 | | Board Member |
Michael A. Risman(1) | | 50 | | Board Member |
David Rosenblatt(2)(3) | | 50 | | Board Member |
(1) | Member of the audit committee. |
(2) | Member of the compensation committee. |
(3) | Member of the nominating and corporate governance committee. |
(4) | Dr. Jon Jainwen Liao, Ph.D. joined our board in February 2019, following the departure of Mr. Liu. |
The current business addresses for our executive officers and Board is c/o Farfetch Limited, The Bower, 211 Old Street, London EC1V 9NR, United Kingdom.
Executive Officers
José Neves is our founder and has served as our Chief Executive Officer since 2008. He is also Co-Chair of our Board. Mr. Neves has been involved in luxury fashion since the mid-1990s when he launched footwear business SWEAR. Mr. Neves later founded SIX London, and in 2001, Mr. Neves opened the B-Store, which won the British Fashion Award for Retailer of the Year in 2006. Mr. Neves served on the British Fashion Council board from 2016 to 2018. Mr. Neves currently serves on the boards of several private companies. Mr. Neves studied Economics at the Universidade do Porto in Portugal.
Elliot Jordan has served as our Chief Financial Officer since 2015. Prior to joining us, Mr. Jordan was Director of Finance at ASOS.com, before which he held various senior finance roles at J Sainsbury plc. Mr. Jordan holds a degree from the University of Waikato and is a qualified chartered accountant with the Chartered Accountants of Australia and New Zealand.
Andrew Robb has served as our Chief Operating Officer since 2010, before which he was the Managing Director of Cocosa.com. Prior to that, Mr. Robb held management positions at eBay and Peoplesound.com. Mr. Robb holds a degree from the University of Oxford and an MBA from INSEAD.
Board Members
Frederic Court has served as a non-executive director since April 2010. Mr. Court is the founder and managing partner of Felix Capital, a venture capital firm he launched in 2015. Mr. Court also has been a General Partner at Advent Ventures since 2001 with a global focus on investment opportunities in consumer internet, mobile and software. Mr. Court brings over 20 years’ experience in entrepreneurial investment in the technology industry.
73
Mr. Court currently serves on the boards of several private companies. Mr. Court holds a degree from ESSEC Business School in Paris.
Dana Evan has served as a non-executive director since April 2015. Ms. Evan is a venture partner at Icon Ventures and has invested in and served on the boards of companies in the internet, technology and media sectors since 2007. Between 1996 and 2007, Ms. Evan served as Chief Financial Officer of VeriSign, Inc. Ms. Evan brings over 25 years of executive leadership experience in global finance and operations management in the technology and media sectors. Ms. Evan currently serves on the boards of Survey Monkey Inc., Domo Inc., Box, Inc. and Proofpoint, Inc. Ms. Evan also serves on the boards of several private technology companies. Ms. Evan has also served on the board of directors of Criteo S.A. from 2013 to 2017, Fusion-IO from 2011 to 2014, Everyday Health Inc. until it was acquired by Ziff Davis, LLC in December 2016, Fusion-IO, Inc., which was acquired by SanDisk in August 2014 and Omniture, Inc., until it was acquired by Adobe Systems Inc. in 2009. Ms. Evan holds a degree from the University of Santa Clara and is a Certified Public Accountant (inactive).
Jon Kamaluddin has served as a non-executive director since June 2015. Mr. Kamaluddin brings over 16 years of executive experience in creative consumer brands and related enabling-technologies investment, e-commerce and technology. Mr. Kamaluddin served as a member of the board of ASOS PLC between 2004 and 2013, while spending five years as the Financial Director and the company Secretary before moving to the International Director position. Mr. Kamaluddin currently serves on the board of BCA Marketplace Plc, where he also serves as Chairman of the audit committee, and serves on the boards of several private companies as well. He is also Chairman of the board of a private company. Mr. Kamaluddin holds a degree from the University of Bristol. Mr. Kamaluddin is a Fellow of the Institute of Chartered Accountants in England and Wales.
Dr. Jon Jainwen Liao, Ph.D. has served as a non-executive director since February 2019. Dr. Liao is Chief Strategy Officer of JD.com and oversees the development of JD’s global strategy, innovation, and corporate development. Prior to joining JD.com in April 2017, Dr. Liao served as Professor of Strategy and Innovation and Associate Dean at Cheung Kong Graduate School of Business. Dr. Liao currently serves on the board of several companies, including 361 Degrees International Limited, China United Network Communications Limited and Yonghui Superstores Co., Ltd., among others. Dr. Liao holds a Ph.D. in Business Administration from Southern Illinois University, a master of arts in Foreign Economics and Management from Renmin University of China and a bachelor of science in Industrial Engineering from Northeastern University.
Dame Natalie Massenet, DBE has served as a non-executive director and Co-Chair of our Board since February 2017. Ms. Massenet is currently the Co-Managing Partner of Imaginary Ventures, whose portfolio companies include Everlane, Reformation and Good American. In 2000, Ms. Massenet founded and launched her e-commerce venture, Net-A-Porter, a luxury fashion online retailer. Ms. Massenet served as Executive Chairman until September 2015, when she stepped down following the YOOX and Net-a-Porter merger. Ms. Massenet currently serves on the board of Mothers for Mothers and previously served on the British Fashion Council as Chairman from 2012 to 2017. In 2009, Ms. Massenet was awarded an MBE and, in January 2016, she was made a Dame Commander of the Order of the British Empire. Both awards were in recognition of her contributions to the United Kingdom fashion and retail industries. Ms. Massenet holds a degree from University of California, Los Angeles.
Jonathan Newhouse has served as a non-executive director since July 2017. Mr. Newhouse has been Chairman of Condé Nast International, a media holding company, since 1991 and serves on the management board of Condé Nast U.S. Mr. Newhouse currently serves on the boards and committees of numerous Condé Nast International’s group and publication companies, including Tatler Publishing Company Limited and Interculture Communications Inc. Mr. Newhouse previously served as Executive Vice President of The New Yorker in the mid-1980s and then publisher of Details Magazine. Mr. Newhouse is also a founder and director of Child Priority Foundation, an Italy-based charitable organization, which was started in 2001. Mr. Newhouse was honored as Officer in the Order of Arts and Letters of France in 2008, and in 2017 was granted an honorary fellowship from Shenkar College in Tel Aviv, honoring him for his achievements and contribution to the fashion and publishing industries. Mr. Newhouse attended Yale College.
Danny Rimer has served as an observer since 2011 and as a non-executive director since February 2015. Mr. Rimer has been a general partner at Index Ventures, a venture capital firm, since 2002. Mr. Rimer currently serves as non-executive director on the boards of several private companies. From 2008 to 2015, Mr. Rimer served
74
on the boards of Boku and British Sky Broadcasting Group plc, and from 2012 to 2015, he served on the board of Etsy Inc. Mr. Rimer also previously held board positions with Betfair, Dropbox and Skype. He was appointed an Officer of the Order of the British Empire (OBE) in 2017 for services to business and charity. Mr. Rimer holds a degree from Harvard University.
Michael A. Risman has served as a non-executive director since April 2014. Mr. Risman is Managing Partner and a founding member of Vitruvian Partners, having co-founded the firm in 2006. Prior to Vitruvian, Mr. Risman spent ten years at Apax Partners where he was a Global Equity Partner and led their Information Technology Investment Team in Europe. Between 2012 and 2016, Mr. Risman served as a non-executive director of Just Eat plc, and he previously served on the board of Dialog Semiconductor Plc. Mr. Risman currently serves on the boards of several private companies as non-executive director. Mr. Risman has a degree from the University of Cambridge and an MBA from Harvard Business School.
David Rosenblatt has served as non-executive director since May 2017. Since 2011, Mr. Rosenblatt has served as the Chief Executive Officer of 1stdibs.com and also serves on their board of directors. From 2004 through 2008, Mr. Rosenblatt served as the Chief Executive Officer of DoubleClick. Following Mr. Rosenblatt’s sale of DoubleClick to Google in 2007, he served as Google’s President of Display Advertising until 2009. Mr. Rosenblatt currently serves on the boards of Twitter and IAC/InterActive Corp, where he also serves on the Compensation Committee. He has previously served on the board of Narrative Science, Inc. and was Chairman and co-founder of Group Commerce, Inc. Mr. Rosenblatt has a degree from Yale University and an MBA from the Stanford University Graduate School of Business.
Director Nomination and Appointment Rights
In connection with Kadi Group’s purchase of shares of Farfetch.com, Kadi Group and José Neves entered into a commitment agreement, as amended, pursuant to which Mr. Neves agreed to exercise all voting rights held directly or indirectly by him in favor of any shareholder resolution proposing to appoint Mr. Liu, the Chairman and Chief Executive Officer and controlling shareholder of JD.com, a former director on our Board, as a director of the Company and to use all reasonable endeavors to seek commitment from certain other investors to support Mr. Liu remaining as a director of the Company. In February 2019, the parties entered into an amended and restated commitment agreement providing that Dr. Liao or another senior executive of JD.com designated by JD.com serve on our board, provided that Dr. Liao or such other JD.com designee be recommended for such Board service by our nominating and corporate governance committee. The amended and restated commitment agreement is otherwise substantively similar to the original commitment agreement and provides that Mr. Neves will exercise all voting rights held by him in favor of any shareholder resolution proposing to appoint Dr. Liao, or other designated JD.com senior executive as a director of the Company and to use all reasonable endeavors to seek commitment from certain other investors to support Dr. Liao remaining as a director of the Company. This obligation is conditional on JD.com holding no less than 33,658,328 Class A ordinary shares (subject to appropriate adjustment for any share split, consolidation or similar event). See Item 7. “Major Shareholders and Related Party Transactions—B. Related party transactions.”
B. Compensation
Compensation
We set out below the amount of compensation paid and benefits in kind provided by us or our subsidiaries to our executive officers and members of our Board for services in all capacities to us or our subsidiaries for the year ended December 31, 2018, as well as the amount contributed by us or our subsidiaries to retirement benefit plans for our executive officers and members of our Board.
Executive Officer and Board Member Compensation
The compensation for each of our executive officers is comprised of the following elements: base salary, an annual incentive tied to achievement of company and individual performance, contractual benefits, and pension contributions. Total cash compensation paid and benefits in kind provided to our executive officers and members of our Board for the year ended December 31, 2018 was $1.5 million. In addition, our executive officers and members
75
of our Board were granted an aggregate of 8,445,000 shares subject to stock options in the year ended December 31, 2018.
IPO Equity Awards
At the time of our IPO, we granted restricted stock units (A) to be settled in 875,000 and 89,015 Class A ordinary shares to José Neves and David Rosenblatt, respectively, and (B) to be settled in 10,000 Class A ordinary shares to each of Dana Evan and Jon Kamaluddin, in each case under the 2018 Plan (as defined below). These grants vest in installments over time, subject to continued employment or service, as applicable.
Executive Officer Employment Agreements and Board Member Service Agreements
Our executive officers each currently have an employment agreement providing for employment for an indefinite period of time, subject to a six‑month (in the case of Mr. Jordan and Mr. Robb) or twelve‑month (in the case of Mr. Neves) notice period upon termination of employment by either the executive or us, other than terminations for gross misconduct.
We have also entered into written service agreements with each of Dana Evan, Jonathan Kamaluddin, David Rosenblatt and Natalie Massenet, providing for an indefinite period of service and the grant of equity awards. These agreements provide for a three‑month notice period upon termination of service by either party (other than terminations for misconduct), but do not provide for any other benefits upon a termination of service. We have not entered into written employment or service agreements with any of our other non‑employee directors in connection with such person’s service in such capacity. However, we may in the future enter into employment or service agreements with such individuals, the terms of which may provide for, among other things, cash or equity based compensation and benefits.
Long-Term Incentive Plans
Farfetch.com Limited Enterprise Management Incentive Scheme
The Farfetch.com Limited Enterprise Management Incentive Scheme (the “EMI Plan”) allows for the grant of options to purchase Farfetch.com ordinary shares to eligible directors or employees of Farfetch.com or its subsidiaries. The EMI Plan is administered by our Board whose decisions on all disputes and matters concerning the interpretation of the rules are final. Options granted under the EMI Plan are governed by the rules of the EMI Plan, an option agreement entered into with each participant, and Schedule 5 of the Income Tax (Earnings and Pensions) Act 2003. Each of the options granted under the EMI Plan is fully vested and we expect the grants to be exercised prior to completion of this offering. The EMI Plan is closed to any new grants.
Farfetch.com Limited Share Option Scheme
The Farfetch.com Limited Share Option Scheme (the “Share Option Plan”) allows for the grant of options to purchase Farfetch.com ordinary shares to eligible directors or employees of Farfetch.com or our subsidiaries. The Share Option Plan is administered by our Board whose decisions on all disputes and matters concerning the interpretation of the rules are final. Options granted under the Share Option Plan are governed by the rules of the Share Option Plan and an option agreement entered into with each participant. The options generally vest over four years from the date of grant of the option, subject to the participant’s continued employment by us. The Share Option Plan is closed to any new grants.
Farfetch.com Limited 2015 Long-Term Incentive Plan
The Farfetch.com Limited 2015 Long-Term Incentive Plan (the “LTIP”) allows for the grant of options to purchase Farfetch.com ordinary shares, restricted shares and linked awards to eligible directors or employees of us or our subsidiaries. The LTIP is administered by our Board whose decisions on all disputes and matters concerning the interpretation of the rules are final. No restricted shares have been granted under the LTIP. Options granted pursuant to the LTIP vest over four years subject to the participant’s continued employment by us.
76
Pursuant to the LTIP, we entered into linked award deeds (the “Linked Award Deeds”) with certain employees, which provide the employee with the simultaneous award of an option to purchase ordinary shares and the issuance of restricted linked Class A ordinary shares (together a, “Linked Award”). The restricted Class A ordinary shares are not transferable.
The restricted linked ordinary shares held by an employee converted into restricted Class A ordinary shares immediately prior to the Initial Public Offering in September 2018. On each occasion that the employee proposes to realize the Linked Awards, a formula (as set out in the applicable Linked Award Deed) is applied to calculate how many linked shares will cease to be subject to restrictions on transfer to deliver to the employee the “in-the-money value” of the Linked Award (i.e., market value of our Class A ordinary shares less the exercise price). If the in-the-money value of the vested Linked Award is delivered by the release of linked shares, the options purported to be exercised will lapse. To the extent the employee does not hold a sufficient number of linked shares to deliver the in-the-money value of the Linked Award being exercised, then the option will be exercised over Class A ordinary shares. As at December 31, 2018, there were 9,128,689 restricted linked Class A ordinary shares.
Additional Individual Option Schemes
We have entered into letter agreements with certain employees in connection with the recent acquisition of Fashion Concierge UK Limited (“Fashion Concierge”). Pursuant to such letter agreements, certain employees will receive a grant of our shares if they (1) are employed (and have not yet served or been served a notice of termination) on the third anniversary of their employment commencement date with us or (2) cease employment prior to the third anniversary of their employment commencement date with us due to a good leaver termination. The employees receive an additional grant of shares pursuant to such letter agreements, (the “Conditional Share Issuance”) if (1) they are employed (and have not yet served or been served a notice of termination) on December 31, 2020, or prior to this date, ceased to be employed due to a good leaver termination and (2) for the 2020 financial year a minimum weighted average commission of 7% has been achieved by Fashion Concierge. The number of shares issued under the Conditional Share Issuance varies depending on the net transaction value achieved by Fashion Concierge for the 2020 financial year.
2018 Farfetch Employee Equity Plan
We have adopted the 2018 Farfetch Employee Equity Plan (the “2018 Plan”), under which we may grant cash and equity-based incentive awards in order to attract, motivate and retain the talent for which we compete. The material terms of the 2018 Plan, are summarized below.
Eligibility and Administration. Our employees, consultants and directors, are eligible to receive awards under the 2018 Plan. The 2018 Plan is administered by our Board with respect to awards to non-employee directors and by the compensation committee with respect to other participants, each of which may delegate its duties and responsibilities to committees of our directors and/or officers (referred to collectively as the plan administrator below), subject to certain limitations that may be imposed under stock exchange rules. The plan administrator has the authority to make all determinations and interpretations under, prescribe all forms for use with, and adopt rules for the administration of, the 2018 Plan, subject to its express terms and conditions. The plan administrator also sets the terms and conditions of all awards under the 2018 Plan, including any vesting and vesting acceleration conditions.
Limitation on Awards and Shares Available. The aggregate number of our Class A ordinary shares that is available for issuance under awards granted pursuant to the 2018 Plan is equal to the sum of (i) 27,500,112 Class A ordinary shares and (ii) an annual increase on the first day of each year beginning in 2019 and ending in 2028, equal to the lesser of (A) 5% of the Class A ordinary shares outstanding (on an as-converted basis) on the last day of the immediately preceding fiscal year and (B) such smaller number of Class A ordinary shares as determined by our Board, provided, however, no more than 98,209,661 shares may be issued upon the exercise of incentive share options. The shares may be authorized but unissued shares, or shares purchased in the open market. If an award under the 2018 Plan is forfeited, expires or is settled for cash, any shares subject to such award may, to the extent of such forfeiture, expiration or cash settlement, be used again for new grants under the 2018 Plan. However, the following shares may not be used again for grant under the 2018 Plan: (1) shares tendered or withheld to satisfy grant or exercise price or tax withholding obligations associated with an award; (2) shares subject to a share
77
appreciation right, or SAR, that are not issued in connection with the share settlement of the SAR on its exercise; and (3) shares purchased on the open market with the cash proceeds from the exercise of options.
Awards granted under the 2018 Plan upon the assumption of, or in substitution for, awards authorized or outstanding under a qualifying equity plan maintained by an entity with which we enter into a merger or similar corporate transaction will not reduce the shares available for grant under the 2018 Plan. The maximum amount of the grant date fair value of equity-based awards and the amount of any cash-based awards granted to a non-employee director pursuant to the 2018 Plan during any calendar year will be $1,000,000, increased to $1,500,000 in the fiscal year of his or her initial service as a non-employee director.
Awards. The 2018 Plan provides for the grant of share options, including incentive share options (“ISOs”) and nonqualified share options (“NSOs”) restricted shares, dividend equivalents, share payments, restricted share units (“RSUs”), performance shares, other incentive awards, share appreciation rights (“SARs”) and cash awards. No determination has been made as to the types or amounts of awards that will be granted to specific individuals pursuant to the 2018 Plan. Certain awards under the 2018 Plan may constitute or provide for a deferral of compensation, subject to Section 409A of the Code, which may impose additional requirements on the terms and conditions of such awards. All awards under the 2018 Plan will be set forth in award agreements, which will detail all terms and conditions of the awards, including any applicable vesting and payment terms and post- termination exercise limitations. Awards other than cash awards generally will be settled in Class A ordinary shares, but the plan administrator may provide for cash settlement of any award.
Certain Transactions. The plan administrator has broad discretion to take action under the 2018 Plan, as well as make adjustments to the terms and conditions of existing and future awards, to prevent the dilution or enlargement of intended benefits and facilitate necessary or desirable changes in the event of certain transactions and events affecting our Class A ordinary shares, such as share dividends, share splits, mergers, acquisitions, consolidations and other corporate transactions. In addition, in the event of certain non-reciprocal transactions with our shareholders known as “equity restructurings,” the plan administrator will make equitable adjustments to the 2018 Plan and outstanding awards. In the event of a change in control of our Company (as defined in the 2018 Plan), to the extent that the surviving entity declines to continue, convert, assume or replace outstanding awards, then all such awards will become fully vested and exercisable in connection with the transaction. Upon or in anticipation of a change of control, the plan administrator may cause any outstanding awards to terminate at a specified time in the future and give the participant the right to exercise such awards during a period of time determined by the plan administrator in its sole discretion. Individual award agreements may provide for additional accelerated vesting and payment provisions.
Non-U.S. Participants. The plan administrator may modify award terms, establish subplans and/or adjust other terms and conditions of awards, subject to the share limits described above, in order to facilitate grants of awards subject to the laws and/or stock exchange rules of countries outside of the United States.
Claw-Back Provisions, Transferability, and Participant Payments. All awards will be subject to the provisions of any claw- back policy implemented by us to the extent set forth in such claw-back policy and/or in the applicable award agreement. With limited exceptions for estate planning, domestic relations orders, certain beneficiary designations and the laws of descent and distribution, awards under the 2018 Plan are generally non-transferable prior to vesting, and are exercisable only by the participant. With regard to tax withholding, exercise price and purchase price obligations arising in connection with awards under the 2018 Plan, the plan administrator may, in its discretion, accept cash or check, our Class A ordinary shares that meet specified conditions, a “market sell order” or such other consideration as it deems suitable.
Plan Amendment and Termination. Our Board may amend or terminate the 2018 Plan at any time; except in connection with certain changes in our capital structure. No award may be granted pursuant to the 2018 Plan after the tenth anniversary of the date on which our Board adopts the 2018 Plan.
Section 162(m) Reliance Period. The 2018 Plan provides that to the maximum extent permitted under applicable law, all awards granted pursuant to the 2018 Plan shall be interpreted to qualify for any post-public offering reliance period deduction limit exception set forth in U.S. Treasury Regulation 1.162-27(f) (or any successor thereto). Under current law, for newly public companies, Section 162(m) offers a transition relief period during which time the $1,000,000 deduction limitation does not apply to certain plans or arrangements that existed
78
before the Company became publicly held. A company may generally rely on this transition relief period until the earliest of (i) the expiration of the plan; (ii) the material modification of the plan; (iii) the issuance of all employer share and other compensation allocated under the plan; or (iv) the first meeting of shareholders at which directors are to be elected that occurs after the close of the third calendar year following the calendar year in which the initial public offering occurs or, in the case of a private company that becomes publicly held without an initial public offering, the first calendar year following the calendar year in which the company becomes publicly held.
Indemnification
Our executive officers and Board members have the benefit of indemnification provisions in our Articles. These provisions give our executive officers and Board members the right, to the fullest extent permitted by law, to recover from us amounts, including but not limited to litigation expenses, and any damages they are ordered to pay, in relation to acts or omissions in the performance of their duties.
Insofar as indemnification of liabilities arising under the Securities Act may be permitted to executive officers and Board members or persons controlling us pursuant to the foregoing provisions, we have been informed that, in the opinion of the SEC, such indemnification is against public policy as expressed in the Securities Act and is therefore unenforceable.
C. Board Practices
Board of Directors
We currently have ten directors, eight of whom have been determined by the Board to qualify as “independent” pursuant to the rules of the NYSE. Mr. Neves and Ms. Massenet are the Co-Chairs of our Board. Directors can be appointed and removed and/or replaced by an ordinary resolution of the shareholders. In addition, directors may be appointed either to fill a vacancy arising from the resignation of a former director or as an addition to the existing Board by the affirmative vote of a simple majority of the directors present and voting at a Board meeting, which shall include the affirmative vote of Mr. Neves for as long as he is a director. A director may also be removed by notice from all of the other directors, which shall require the affirmative vote of Mr. Neves for as long as he is a director. Each of our directors holds office until he or she resigns, retires by rotation or is recused from office.
Board Committee Composition
The Board has established an audit committee; a compensation committee; and a nominating and corporate governance committee.
Audit Committee
The audit committee currently consists of Jon Kamaluddin, Dana Evan and Mike Risman, with Jon Kamaluddin serving as Chair. The audit committee consist exclusively of members of our Board who are financially literate, and each of Mr. Kamaluddin, Ms. Evan and Mr. Risman has been determined to qualify as an “audit committee financial expert” as defined by the SEC. Our Board has determined that Mr. Kamaluddin , Ms. Evan and Mr. Risman each satisfy the “independence” requirements set forth in Rule 10A-3 under the Exchange Act and has determined that the simultaneous service by Ms. Evan on the audit committee of four other public companies would not impair her ability to effectively serve on our audit committee. The audit committee is governed by a charter that complies with NYSE rules.
The audit committee is responsible for:
| • | recommending the appointment of the independent auditor to the general meeting of shareholders; |
| • | the appointment, compensation, retention and oversight of any accounting firm engaged for the purpose of preparing or issuing an audit report or performing other audit services; |
79
| • | pre-approving the audit services and non-audit services to be provided by our independent auditor before the auditor is engaged to render such services; |
| • | evaluating the independent auditor’s qualifications, performance and independence on at least an annual basis; |
| • | reviewing and discussing with the Board and the independent auditor our annual audited financial statements and quarterly earnings release prior to the filing of our annual report and the public disclosure of our quarterly earnings release; |
| • | reviewing our compliance with laws and regulations, including any initiatives or major litigation or investigations against us that may have a material impact on our financial statements, and assessing our risk management, compliance procedures and hiring of independent auditor employees; and |
| • | approving or ratifying any related person transaction (as defined in our related person transaction policy) in accordance with our related person transaction policy. |
The audit committee meets as often as one or more members of the audit committee deem necessary, but in any event meets at least four times per year. The audit committee meets at least once per year with our independent registered public accounting firm, without our executive officers being present.
Compensation Committee
The compensation committee currently consists of Dana Evan, Danny Rimer, Frederic Court and David Rosenblatt with Dana Evan serving as Chair. Under SEC and NYSE rules, there are heightened independence standards for members of the compensation committee, including a prohibition against the receipt of any compensation from us other than standard Board fees. All of the members of our compensation committee members meet this heightened standard.
The compensation committee is responsible for:
| • | identifying, reviewing and approving corporate goals and objectives relevant to executive officer compensation; |
| • | analyzing the possible outcomes of the variable remuneration components and how they may affect the remuneration of our executive officers; |
| • | evaluating each executive officer’s performance in light of such goals and objectives and determining each executive officer’s compensation based on such evaluation; |
| • | determining any long-term incentive component of each executive officer’s compensation in line with the remuneration policy and reviewing our executive officer compensation and benefits policies generally; and |
| • | reviewing and assessing risks arising from our compensation policies and practices for our employees and whether any such risks are reasonably likely to have a material adverse effect on us. |
Nominating and Corporate Governance Committee
The nominating and corporate governance committee currently consists of Natalie Massenet, David Rosenblatt and Danny Rimer with Natalie Massenet serving as Chair.
The nominating and corporate governance committee is responsible for:
| • | identifying individuals qualified to become members of the Board and ensuring these individuals have the requisite expertise with sufficiently diverse and independent backgrounds; |
| • | reviewing and evaluating the composition, function and duties of our Board; |
| • | recommending nominees for selection to our Board and its corresponding committees; |
80
| • | making recommendations to the board as to determinations of Board member independence; |
| • | leading the Board in a self-evaluation, at least annually, to determine whether it and its committees are functioning effectively; |
| • | overseeing and recommending for adoption by the general meeting of shareholders the compensation for our Board members; and |
| • | developing and recommending to the Board our rules governing the Board and code of business conduct and ethics and reviewing and reassessing the adequacy of such rules governing the Board and Code of Business Conduct and Ethics and recommending any proposed changes to the Board. |
Duties of Board Members and Conflicts of Interest
Under Cayman Islands law, our directors have a duty to act in good faith and in what they consider to be in the best interests of the Company. Our directors are required to exhibit, in the performance of their duties, both the degree of skill that may reasonably be expected to have from a subjective perspective determined by reference to each such director’s knowledge and experience, and the skill and care objectively to be expected from a person occupying office as a director. In fulfilling their duty of care to the Company, our directors must ensure compliance with our Articles. In certain limited circumstances, a shareholder has the right to seek damages if a duty owed by our directors is breached.
Under our Articles, directors who are in any way, whether directly or indirectly, interested in a contract or proposed contract with our Company must declare the nature of their interest at a meeting of the Board or by notice in writing to the members of the Board. If the majority of the Board determines that there is a conflict of any director (or their affiliates) with the general business of the Company, then the Board may determine to exclude such director from all further discussions of the Board and receipt of information, until such time as it is determined by the Board that the director is no longer in such conflict. Subject to the foregoing, a director may vote in respect of any contract or proposed contract notwithstanding his interest; provided that, in exercising any such vote, such director’s duties remain as described above.
D. Employees
Our People
As of December 31, 2018, we had a total of 3,232 Farfetchers, which included 177 Browns employees, and we had an additional 343 people working pursuant to freelance and consultancy contracts. Our Farfetchers are based in 13 countries, and 47% of our employees were female and 53% were male as of December 31, 2018. The table below sets out the number of Farfetchers excluding Browns employees, by geography:
Geography | | As of December 31, | |
| | 2018 | |
Portugal | | | 1,855 | |
United Kingdom | | | 718 | |
United States | | | 172 | |
Mainland China | | | 173 | |
Brazil | | | 130 | |
Japan | | | 57 | |
Russia | | | 49 | |
Hong Kong | | | 36 | |
United Arab Emirates | | | 28 | |
India | | | 7 | |
Italy | | | 5 | |
Mexico | | | 1 | |
Australia | | | 1 | |
Total | | | 3,232 | |
81
As of December 31, 2018, approximately 38% of our workforce consisted of technology and product specialists. The remainder was focused on all other business areas, including marketing, operations, production and other commercial and support functions. The table below sets out the number of employees, by category, as of December 31, 2018, 2017 and 2016:
Department | | As of December 31, | | | As of December 31, | | | As of December 31, | |
| | 2016 | | | 2017 | | | 2018 | |
Technology and Product | | | 494 | | | | 802 | | | | 1,241 | |
Operations | | | 487 | | | | 759 | | | | 1,017 | |
Browns | | | - | | | | 133 | | | | 177 | |
Marketing | | | 159 | | | | 157 | | | | 207 | |
Commercial | | | 93 | | | | 114 | | | | 146 | |
People | | | 50 | | | | 100 | | | | 125 | |
Finance and Legal | | | 62 | | | | 95 | | | | 130 | |
Other | | | 47 | | | | 127 | | | | 189 | |
Total | | | 1,392 | | | | 2,287 | | | | 3,232 | |
We believe that we maintain a good working relationship with our people, and we have not experienced any significant labor disputes or any difficulty in recruiting staff for our operations. Our employees are not represented by any collective bargaining agreements or labor unions, other than our employees in Brazil who are represented by two state-level labor unions, as required by law.
E. Share Ownership
For information regarding the share ownership of directors and officers, see “Item 7. Major Shareholders and Related Party Transactions – A. Major Shareholders.” For information as to our equity incentive plans, see “Item 6. Director, Senior Management and Employees – B. Compensation – Long-Term Incentive Plans.”
Item 7. Major Shareholders and Related Party Transactions
A. Major Shareholders
The following table sets forth information relating to the beneficial ownership of our Class A ordinary shares and Class B ordinary shares as of January 31, 2019, for:
| (a) | each person, or group of affiliated persons, known by us to beneficially own 5% or more of our outstanding Class A ordinary shares or Class B ordinary shares; |
| (b) | each of our executive officers and our Board; and |
| (c) | all of our executive officers and our Board as a group. |
For further information regarding material transactions between us and principal shareholders, see “Related party transactions” below.
The number of Class A ordinary shares and/or Class B ordinary shares beneficially owned by each entity, person, executive officer or Board member is determined in accordance with the rules of the SEC, and the information is not necessarily indicative of beneficial ownership for any other purpose. Under such rules, beneficial ownership includes any shares over which the individual has sole or shared voting power or investment power as well as any shares that the individual has the right to acquire within 60 days of January 31, 2019 through the exercise of any option, warrant or other right and the vesting of restricted linked ordinary shares. Except as otherwise indicated, and subject to applicable community property laws, the persons named in the table have sole voting and investment power with respect to all Class A ordinary shares or Class B ordinary shares held by that person.
82
Unless otherwise indicated below, the address for each beneficial owner listed is c/o Farfetch Limited, The Bower, 211 Old Street, London EC1V 9NR, United Kingdom.
| | Class A ordinary shares | | | Class B ordinary shares | | | Combined | |
Name of beneficial owner | | Number | | | Percent | | | Number | | | Percent | | | voting power (1) | |
Holders of 5% or Greater | | | | | | | | | | | | | | | | | | | | |
Kadi Group Holding Limited(2) | | | 42,366,665 | | | | 16.0 | % | | - | | | - | | | | 3.8 | % |
Index Ventures V (Jersey), L.P.(3) | | | 28,359,930 | | | | 10.7 | % | | - | | | - | | | | 2.5 | % |
Advent Private Equity Fund(4) | | | 24,559,309 | | | | 9.3 | % | | - | | | - | | | | 2.2 | % |
Farhold (Luxembourg)(5) | | | 22,047,241 | | | | 8.3 | % | | - | | | - | | | | 2.0 | % |
Advance Publications(6) | | | 14,838,410 | | | | 5.6 | % | | - | | | - | | | | 1.3 | % |
| | | | | | | | | | | | | | | | | | | | |
Executive Officers and Directors | | | | | | | | | | | | | | | | | | | | |
José Neves(7) | | | 1,696,377 | | | * | | | | 42,858,080 | | | | 100 | % | | | 76.6 | % |
Elliot Jordan(8) | | | 733,435 | | | * | | | - | | | - | | | * | |
Andrew Robb(9) | | | 1,812,910 | | | * | | | - | | | - | | | * | |
Frederic Court(10) | | | - | | | * | | | - | | | - | | | * | |
Dana Evan | | | 634,570 | | | * | | | - | | | - | | | * | |
Jon Kamaluddin(11) | | | 445,390 | | | * | | | - | | | - | | | * | |
Dr. Jon Jainwen Liao, Ph.D.(12) | | | - | | | * | | | - | | | - | | | * | |
Natalie Massenet(13) | | | 775,635 | | | * | | | - | | | - | | | * | |
Jonathan Newhouse(14) | | | - | | | * | | | - | | | - | | | * | |
Danny Rimer(15) | | | - | | | * | | | - | | | - | | | * | |
Mike Risman(16) | | | - | | | * | | | - | | | - | | | * | |
David Rosenblatt | | | 122,750 | | | * | | | - | | | - | | | * | |
Executive officers and directors as a group (12 persons)(17) | | | 6,221,067 | | | | 2.4 | % | | | 42,858,080 | | | | 100 | % | | | 77.0 | % |
* | Indicates beneficial ownership of less than 1% of the total outstanding Class A ordinary shares. |
(1) | The percentage reported under "Combined Voting Power" represents the voting power with respect to all of our Class A and Class B ordinary shares outstanding as of January 31, 2019, voting as a single class. Holders of our Class A ordinary shares are entitled to one vote per share, and holders of our Class B ordinary shares are entitled to 20 votes per share. |
(2) | Based on information reported on Schedule 13G and filed on November 27, 2018, Kadi Group Holding Limited holds 42,366,665 Class A ordinary shares. Kadi Group Holding Limited is a wholly owned subsidiary of JD.com, Inc., which exercises voting and investment power over the Class A ordinary shares held by Kadi Group Holding Limited and may be deemed to beneficially own these Class A ordinary shares. JD.com is controlled by its founder, Chairman and Chief Executive Officer, Richard Liu, who may be deemed to beneficially own the Class A ordinary shares held by Kadi Group Holding Limited. The business address of Kadi Group Holding Limited is Geneva Place, Waterfront Drive, P.O. Box 3469, Road Town, Tortola, British Virgin Islands. |
(3) | Based on information reported on Schedule 13G and filed on February 12, 2019, Index Ventures V (Jersey), L.P. holds 27,780,375 Class A ordinary shares, Yucca (Jersey) SLP holds 354,500 Class A ordinary shares and Index Ventures V Parallel Entrepreneur Fund (Jersey) L.P. holds 225,055 Class A ordinary shares. Index Venture Associates V Limited (“IVA V”) is the general partner of each of Index Ventures V (Jersey) L.P. and Index Ventures V Parallel Entrepreneur Fund (Jersey) L.P. (together, the “Index V Funds”) and may be deemed to beneficially own the Class A shares held by the Index V Funds. Yucca (Jersey) SLP administers the investment vehicle that is contractually required to mirror the Index V Funds’ investments, therefore, IVA V may be deemed to beneficially own the Class A ordinary shares held by Yucca (Jersey) SLP. The principal address of the Index V Funds and Yucca (Jersey) SLP is 44 Esplanade, St Helier, Jersey JE4 9WG, Channel Islands. |
(4) | Based on information reported on Schedule 13G and filed on February 14, 2019, Advent Private Equity Fund IV holds 23,416,685 Class A ordinary shares, Advent Industry LP holds 908,514 Class A ordinary shares and Advent Management IV Limited Partnership holds 234,110 Class A ordinary shares (together, the "Advent Funds"). Advent Venture Partners, LLP is the management company for the Advent Funds and may be deemed to beneficially own the Class A ordinary shares held by such funds. Leslie Gabb, Frederic Court, Shahzad Malik, Rajesh Parekh, Peter Bains and Michael Chalfen, as the partners of Advent Venture Partners, LLP, may be deemed to share beneficial ownership of the Class A ordinary shares held by the Advent Funds. The address of Advent Venture Partners LLP is, 27 Beak Street, London W1F 9RU, United Kingdom. |
(5) | Based on information reported on Schedule 13G filed on February 13, 2019, Farhold (Luxembourg) S.à r.l. holds 22,047,241 Class A ordinary shares. Farhold (Luxembourg) S.à r.l is wholly owned by Vitruvian II Luxembourg S.à r.l, which is wholly owned by VIP II Nominees Limited in its capacity as nominee for various partnership funds (the "VIP II Funds"). Vitruvian Partners LLP is the general partner and investment manager of the VIP II Funds and is the sole shareholder of VIP II Nominees Limited and may be deemed to beneficially own the shares held by Farhold (Luxembourg) S.à r.l. The business address of Farhold (Luxembourg) S.à r.l. is 1, rue Hildegard von Bingen, L-1282, Luxembourg. |
(6) | Based on information reported on Schedule 13G filed on February 13, 2019, Condé Nast International Ltd holds 13,545,660 Class A ordinary shares, Advance Magazine Publishers Inc. holds 647,090 Class A ordinary shares and CN Commerce Ltd. holds 645,660 Class A ordinary shares. Advance Publications, Inc. exercises voting and investment power over the Class A ordinary shares held by Condé Nast International Ltd, Advance Magazine Publishers Inc. and CN Commerce Ltd and may be deemed to have beneficial ownership of these Class A ordinary shares. Advance Publications, Inc. is controlled by members of the Newhouse family. The business address for Advance Publications, Inc. is 1 World Trade Center, New York, New York 10007. |
(7) | Includes 42,858,080 Class B ordinary shares held by TGF Participations Limited, of which José Neves is the only named beneficiary. José Neves exercises voting and investment power over the Class B ordinary shares held by TGF Participations Limited and may be deemed to have beneficial ownership of all of these Class B ordinary shares. The business address of TGF Participations Limited is Grosvenor House, 66-67 Athol Street, Douglas, Isle of Man IM1 1JE. |
(8) | Represents for Mr. Jordan 661,888 Class A ordinary shares underlying vested options and 71,547 restricted linked ordinary shares that are currently exercisable. |
83
(9) | Includes for Mr. Robb 237,252 restricted linked ordinary shares that are currently exercisable. |
(10) | Mr. Court holds no shares directly. M . Court is the founder and managing partner of Felix Capital, which manages funds that collectively own 580,180 Class A ordinary shares. Mr. Court is a General Partner at Advent Ventures, which manages funds that beneficially own Class A ordinary shares. See footnote 4 above. |
(11) | Includes for Mr. Kamaluddin 117,572 Class A ordinary shares underlying vested options and 327,818 restricted linked ordinary shares that are currently exercisable. |
(12) | Dr. Liao is an employee of JD.com but disclaims beneficial ownership of the shares beneficially owned by JD.com. |
(13) | Represents for Ms. Massenet (a) 150,000 Class A ordinary shares held directly, (b) 476,625 Class A ordinary shares underlying vested options and (c) 149,010 shares held by Imaginary Venture Capital Partners I, LP, over which Ms. Massenet has shared voting power. |
(14) | Mr. Newhouse holds no shares directly. Mr. Newhouse is Chairman of Condé Nast International. See footnote 6 above. |
(15) | Mr. Rimer holds no shares directly. Mr. Rimer is a partner within the Index Ventures group. Advisors within the Index Ventures group provide advice to the Index Funds. Mr. Rimer is involved in making recommendations to the Index Funds but does not hold voting or dispositive power over the Class A ordinary shares held by the Index Funds. See footnote 3 above. |
(16) | Mr. Risman holds no shares directly. Mr. Risman is the Managing Partner and founding member of Vitruvian Partners LLP, which manages funds that own Class A ordinary shares. See footnote 5 above. |
(17) | Includes 6,072,057 Class A ordinary shares underlying vested options and options that will vest within 60 days of January 31, 2019. |
B. Related Party Transactions
The following is a description of our related party transactions since January 1, 2016.
Registration Rights Agreement
On July 21, 2017, we entered into a Registration Rights Agreement with Kadi Group, Condé Nast International Ltd, Advance Magazine Publishers Inc., CN Commerce Ltd, Index Ventures V (Jersey), L.P., Index Ventures V Parallel Entrepreneur Fund (Jersey), L.P., Yucca (Jersey) SLP, Farhold (Luxembourg) S.A.R.L., DST Global IV, L.P., Sebatik Investments Limited, TGF Participations Limited, Republic Technologies Pte td, Advent Private Equity Fund IV, Advent Industry L.P., Advent Management IV Limited Partnership, Newsight Investment Holdings I Ltd, Newsight Investment Holdings II Ltd and Legendre Holding 51 SAS, pursuant to which such investors have certain demand registration rights, short-form registration rights and piggyback registration rights in respect of any Class A ordinary shares and related indemnification rights from us, subject to customary restrictions and exceptions. All fees, costs and expenses of registrations, other than underwriting discounts and commissions, are expected to be borne by us.
Relationship with Kadi Group Holding Limited and JD.com
On June 21, 2017, Kadi Group completed a purchase of 6,834,172 Series G Preferred Shares of Farfetch.com for approximately $330.8 million and 1,366,834 shares of various classes from our shareholders that were re-designated into Series G Preferred Shares for approximately $66.2 million.
Kadi Group is a wholly owned subsidiary of JD.com. Mr. Liu, the Chairman and Chief Executive Officer and controlling shareholder of JD.com, previously served as one of our non-executive directors, and Dr. Liao is JD.com’s Chief Strategy Officer.
Forward Purchase Agreement
In connection with Kadi Group’s purchase of shares in Farfetch.com, Kadi Group and Farfetch.com entered into a forward purchase agreement, as amended, pursuant to which we agreed to issue and Kadi Group agreed to subscribe for one-third of such number of shares upon our initial public offering (at a price per share equal to the initial price per share in this offering) that would result in Kadi Group maintaining its percentage holding of our issued and outstanding share capital on a fully diluted basis immediately following this offering. Kadi Group may assign this right to purchase to any of its affiliates.
84
Payment Processing Agreement
On April 18, 2018, we entered into a Cross-Border Foreign Exchange Payment Agreement with Chinabank Payment Technology Co. Ltd. (“Chinabank Payment”) (the “Payment Processing Agreement”), pursuant to which Chinabank Payment provides cross-border payment collection services to Farfetch UK Limited on its Chinese e-commerce platforms of Farfetch.cn and Farfetch.com/cn. For providing such payment collection service, Chinabank Payment charges us a transaction fee. The Payment Processing Agreement has an initial term of 24 months and will automatically renew for successive 12-month terms unless either party has served a written notice 90 days prior to the other to terminate. The Payment Processing Agreement is terminable by either party if the other party breaches such agreement on at least five occasions in any three-month period.
Commitment Agreement
In connection with Kadi Group’s purchase of shares of Farfetch.com, Kadi Group and José Neves entered into a commitment agreement, as amended, pursuant to which Mr. Neves agreed to exercise all voting rights held directly or indirectly by him in favor of any shareholder resolution proposing to appoint Richard Liu as a director of the Company and to use all reasonable endeavors to seek commitment from certain other investors to support Mr. Liu remaining as a director of the Company. In February 2019, the parties amended and restated this commitment agreement to provide that Dr. Liao or another senior executive of JD.com designated by JD.com serve on our Board, provided that Dr. Liao or such other JD.com designee be recommended for such Board service by our nominating and corporate governance committee. The amended and restated commitment agreement is otherwise substantively similar to the original commitment agreement and provides that Mr. Neves will exercise all voting rights held by him in favor of any shareholder resolution proposing to appoint Dr. Liao as a director of the Company and to use all reasonable endeavors to seek commitment from certain other investors to support Dr. Liao remaining as a director of the Company. This obligation is conditional on JD.com holding no less than 33,658,328 Class A ordinary shares (subject to appropriate adjustment for any share split consolidation or similar event).
Asset Purchase Agreement and Merchant Agreement
On 26 February 2019, we entered into an Asset Purchase Agreement (the “APA”) with Shanghai Yuanmai Trading Co., Ltd. as the Seller and Beijing Jingdong Century Trade Co., Ltd. as the Guarantor, pursuant to which we agreed to purchase “Level 1 Access” to the JD.com app, Toplife customer data, certain intellectual property and certain fixed assets from the Seller in exchange for $50 million in cash. We are also responsible for certain costs associated with the Toplife business after deal closing, up to a cap of $3 million.
In connection with the purchase of the Toplife assets pursuant to the APA described above, on 26 February 2019, we also entered into a Merchant Agreement with JD.com International Limited (the “MA”), to create a flagship store operated by FF on the JD Haitun platform (a “FF JD Store”). JD.com International Limited has agreed to grant the FF JD Store “Level 1 Access” (i.e. a prominent position on the JD customer interface for specified categories of luxury goods) to the JD.com app with exposure to 3-4 million JD premium customers for a period of 4 years, subject to certain key performance indicators linked to gross value of sales.
Relationship with Condé Nast
On February 14, 2013, Condé Nast International Limited (“CNI”) completed the purchase of an 8.37% equity position of Farfetch.com for $11,999,996. On April 29, 2014 and February 13, 2015, CNI purchased further equity of Farfetch.com, resulting in an equity position of 8.18%. On June 13, 2017, Farfetch.com issued further equity to Advance Magazine Publishers Inc. (“Advance Magazine”) and CN Commerce Ltd (“CN Commerce,” together with CNI and Advance Magazine, “Conde Nast”) in connection with the Asset Purchase Agreement summarized below. Each of Advance Magazine and CN Commerce is an affiliate of CNI.
Asset Purchase Agreement
On June 12, 2017, we entered into an asset purchase agreement (as amended, the “Asset Purchase Agreement”), pursuant to which we purchased certain assets of the Style.com business (the “Style.com Assets”) from Advance Magazine and CN Commerce, including trademarks, domain names and a customer database. The
85
consideration for the purchase of the Style.com Assets, which completed on June 13, 2017, was $12,411,000, which was satisfied by the issuance of shares in the capital of Farfetch.com at a price per share of $48.40. The Asset Purchase Agreement contains customary warranties in relation to the Style.com Assets from Advance Magazine and CN Commerce and an indemnity in our favor in respect of pre-completion liabilities with regards to the Style.com Assets and the business of Style.com.
Collaboration Agreement
In connection with the purchase of the Style.com Assets, we entered into a collaboration agreement with Advance Magazine dated June 13, 2017 (the “Collaboration Agreement”), to create a content-to-commerce solution by connecting Conde Nast, a provider of online and offline lifestyle content, to brands and retailers on the Farfetch Marketplace through an online affiliate program. Pursuant to the Collaboration Agreement, Advance Magazine provides us with certain services, including generation of promotional posts on social media networks and providing content for the purpose of referring customers to the Farfetch Marketplace. In consideration for such services, Advance Magazine earns a commission from the aggregate value of transactions concluded following the referral of a customer to the Farfetch Marketplace from any website run by Advance Magazine or its affiliate companies. The Collaboration Agreement has an initial term of five years.
Commercial Agreements
We currently have various commercial agreements with affiliate companies of Conde Nast in the ordinary course of our business, which are on customary terms and which enable us to advertise our business or gain further exposure through advertisements and content in publications produced by the Conde Nast group, such as Vogue magazine. These agreements are on arms’ length terms, for fixed short-term periods and/or one-off in nature.
Relationship with Platforme International Limited
Mr. Neves, the founder, Chief Executive Officer and a director of the Company, is also a director of, and holds a beneficial ownership interest in, Platforme International Limited (“Platforme”).
E-Commerce Services Agreements
In October 2015, we entered into a Farfetch Black & White e-commerce services agreement with Platforme for the development and hosting of the “Swear” branded website. Further, in the second quarter of 2017, we entered into several of our standard e-commerce services agreements with Platforme, pursuant to which we make available for sale, on the Farfetch Marketplace, products from each of Platforme’s “Swear,” “MySwear” and “B Store” businesses. The agreements have all been entered into on our standard terms.
Relationship with ASAP54.com Limited
Mr. Neves holds a beneficial ownership interest in ASAP54.com Limited (“ASAP54”). Daniela Cecilio, Mr. Neves’ wife, is also a director of and holds a beneficial ownership interest in ASAP54.
Share Purchase Agreement
On October 31, 2017, we entered into an agreement with ASAP54 for the purchase of the entire issued share capital of Fashion Concierge UK Limited (and its wholly owned subsidiary, Fashion Concierge, LDA), a company that runs an e-commerce solution, sourcing luxury items on behalf of Farfetch Private Client consumers (the “Share Purchase Agreement”). The consideration for the purchase was $2,183,000, which was satisfied through the issuance of shares of Farfetch.com at a price per share of $48.40. The Share Purchase Agreement contains customary warranties and indemnities in favor of Farfetch.
86
Relationship with Daniela Cecilio
Consultancy Agreement
Following the purchase of Fashion Concierge UK Limited, we entered into a consultancy agreement with Ms. Cecilio, founder of the Fashion Concierge business, on December 21, 2017 (the “DC Consultancy Agreement”). Pursuant to the DC Consultancy Agreement, Ms. Cecilio will provide consultancy services. The DC Consultancy Agreement had a fixed term of 12 months, and was ended in line with late agreement on November 9, 2018.
Share Incentive Agreement
Pursuant to the DC Consultancy Agreement, we entered into a share incentive agreement with Ms. Cecilio on January 15, 2018 (the “Share Incentive Agreement”), pursuant to which, Ms. Cecilio could earn up to 104,780 shares in the capital of Farfetch Limited.
Relationship with Natalie Massenet
Natalie Massenet is a shareholder and a member of our Board.
Consultancy Agreement
We entered into a consultancy agreement with Natalie Massenet effective as of August 1, 2018, (the “NM Consultancy Agreement”). Pursuant to the NM Consultancy Agreement, Ms. Massenet provides consultancy services in relation to assisting with overall strategy, innovation initiatives, being a brand ambassador at specific events and liaising with the Chief Executive Officer and Chief Commercial Officer with brands specific to our initiatives. For providing such services, Ms. Massenet is eligible to receive an annual retainer of $120,000 under the NM Consultancy Agreement. The NM Consultancy Agreement is terminable by either party upon three months’ notice.
Related Party Transaction Policy
Our Board has adopted a written related party transaction policy to set forth the policies and procedures for the review and approval or ratification of related person transactions. This policy covers, with certain exceptions set forth in Item 404 of Regulation S-K under the Securities Act, any transaction, arrangement or relationship, or any series of similar transactions, arrangements or relationships, in which we were or are to be a participant, where the amount involved exceeds $120,000 and a related person had or will have a direct or indirect material interest, including, without limitation, purchases of goods or services by or from the related person or entities in which the related person has a material interest, indebtedness, guarantees of indebtedness and employment by us of a related person.
C. Interests of Experts and Counsel
Not applicable.
Item 8. Financial Information
A. Consolidated Statements and Other Financial Information
Consolidated Financial Statements
See Item 18. "Financial Statements."
Legal and Arbitration Proceedings
From time to time, we may be involved in various claims and legal proceedings relating to claims arising out of our operations. We are not currently a party to any material legal proceedings (including any such proceedings that are pending or threatened of which we are aware).
87
Dividend Policy
We do not anticipate paying any cash dividends on our ordinary shares in the foreseeable future. We intend to retain all available funds and any future earnings to fund the development and expansion of our business. However, if we do pay a cash dividend on our ordinary shares in the future, we will pay such dividend out of our profits or share premium (subject to solvency requirements) as permitted under Cayman Islands law.
The amount of any future dividend payments we may make will depend on, among other factors, our strategy, future earnings, financial condition, cash flow, working capital requirements, capital expenditures and applicable provisions of our Articles. Any profits or share premium we declare as dividends will not be available to be reinvested in our operations.
Moreover, we are a holding company that does not conduct any business operations of our own. As a result, we are dependent upon cash dividends, distributions and other transfers from our subsidiaries to make dividend payments.
Any dividends we declare on our shares will be in respect of both our Class A ordinary shares and Class B ordinary shares and will be distributed such that a holder of one of our Class B ordinary shares will receive the same amount of the dividends that are received by a holder of one of our Class A ordinary shares. We will not declare any dividend with respect to the Class A ordinary shares without declaring a dividend on the Class B ordinary shares, and vice versa.
We have not paid dividends in the years ended December 31, 2016, 2017 and 2018.
B. Significant Changes
None.
Item 9. The Offer and Listing
A. Offer and Listing Details
Our Class A ordinary shares commenced trading on the NYSE on September 21, 2018. Prior to this, no public market existed for our Class A ordinary shares. Our Class B ordinary shares are not listed to trade on any securities market.
Price History of Stock
Ordinary shares listed on the New York Stock Exchange
Our shares were approved for listing on the NYSE on September 21, 2018. Prior to this listing, no public market existed for our ordinary shares.
B. Plan of Distribution
Not applicable.
C. Markets
Our Class A ordinary shares commenced trading on the NYSE on September 21, 2018 under the symbol “FTCH.”
D. Selling Shareholders
Not Applicable.
88
E. Dilution
Not applicable
F. Expenses of the Issue
Not applicable.
Item 10. Additional Information
A. Share Capital
Not applicable.
B. Memorandum and Articles of Association
A copy of our amended and restated memorandum and articles of association is attached as Exhibit 1.1 to this Annual Report. The information called for by this Item has been reported previously in our Registration Statement on Form F‑1 (File No. 333‑226929), filed with the SEC on August 20, 2018, as amended, under the heading “Description of Share Capital and Articles of Association,” and is incorporated by reference into this Annual Report.
C. Material Contracts
Except as otherwise disclosed in this Annual Report (including the Exhibits), we are not currently, nor have we been for the past two years, party to any material contract, other than contracts entered into in the ordinary course of business.
D. Exchange Controls
There are no Cayman Islands exchange control regulations that would affect the import or export of capital or the remittance of dividends, interest or other payments to non-resident holders of our shares.
E. Taxation
The following summary contains a description of certain of certain Cayman Islands, UK and U.S. federal income tax consequences of the acquisition, ownership and disposition of Class A ordinary shares. The summary is based upon the tax laws of the Cayman Islands and regulations thereunder, on the tax laws of the United Kingdom and the regulations thereunder, and on the tax laws of the United States and regulations thereunder as of the date hereof, which are subject to change.
Cayman Islands Tax Considerations
The following discussion is a summary of the material Cayman Islands tax considerations relating to the purchase, ownership and disposition of our Class A ordinary shares. There is, at present, no direct taxation in the Cayman Islands and interest, dividends and gains payable to us will be received free of all Cayman Islands taxes. We have received an undertaking from the Government of the Cayman Islands to the effect that, for a period of thirty years from the date of the undertaking, no law that thereafter is enacted in the Cayman Islands imposing any tax or duty to be levied on profits, income or on gains or appreciation, or any tax in the nature of estate duty or inheritance tax, will apply to any property comprised in or any income arising under the Company, or to the shareholders thereof, in respect of any such property or income.
No stamp duty in the Cayman Islands is payable in respect of the issue of any Class A ordinary shares or an instrument of transfer in respect of a Class A ordinary share.
89
United Kingdom Tax Considerations
The following discussion is a summary of the material United Kingdom tax considerations relating to the purchase, ownership and disposition of our Class A ordinary shares.
The following statements are of a general nature and do not purport to be a complete analysis of all potential UK tax consequences of acquiring, holding and disposing of Class A ordinary shares. They are based on current UK tax law and on the current published practice of Her Majesty’s Revenue and Customs (“HMRC”) (which may not be binding on HMRC), as of the date of this Annual Report, all of which are subject to change, possibly with retrospective effect. They are intended to address only certain UK tax consequences for holders of Class A ordinary shares who are tax resident in (and only in) the UK, and in the case of individuals, domiciled in (and only in) the UK (except where expressly stated otherwise) who are the absolute beneficial owners of the Class A ordinary shares and any dividends paid on them and who hold the Class A ordinary shares as investments (other than in an individual savings account or a self-invested personal pension). They do not address the UK tax consequences which may be relevant to certain classes of holders of Class A ordinary shares such as traders, brokers, dealers, banks, financial institutions, insurance companies, investment companies, collective investment schemes, tax-exempt organizations, trustees, persons connected with us or our group, persons holding their Class A ordinary shares as part of hedging or conversion transactions, holders of Class A ordinary shares who have (or are deemed to have) acquired their Class A ordinary shares by virtue of an office or employment, and holders of Class A ordinary shares who are or have been our officers or employees or a company forming part of our group. The statements do not apply to any holder of Class A ordinary shares who either directly or indirectly holds or controls 10% or more of our share capital (or class thereof), voting power or profits.
The following is intended only as a general guide and is not intended to be, nor should it be considered to be, legal or tax advice to any particular prospective subscriber for, or purchaser of, Class A ordinary shares. Accordingly, prospective subscribers for, or purchasers of, Class A ordinary shares who are in any doubt as to their tax position regarding the acquisition, ownership and disposition of Class A ordinary shares or who are subject to tax in a jurisdiction other than the UK should consult their own tax advisers.
The Company
It is the intention of the directors to conduct our affairs so that our central management and control is exercised in the UK. As a result, we are expected to be treated as resident in the UK for UK tax purposes. Accordingly, we expect to be subject to UK taxation on our income and gains, except where an exemption applies.
Taxation of Dividends
Withholding Tax
We will not be required to withhold UK tax at source when paying dividends. The amount of any liability to UK tax on dividends paid by us will depend on the individual circumstances of a holder of Class A ordinary shares.
Income Tax
An individual holder of Class A ordinary shares who is resident for tax purposes in the UK may, depending on his or her particular circumstances, be subject to UK tax on dividends received from the Company. Dividend income is treated as the top slice of the total income chargeable to UK income tax. An individual holder of Class A ordinary shares who is not resident for tax purposes in the UK should not be chargeable to UK income tax on dividends received from us unless he or she carries on (whether solely or in partnership) any trade, profession or vocation in the UK through a branch or agency to which the Class A ordinary shares are attributable. There are certain exceptions for trading in the UK through independent agents, such as some brokers and investment managers.
All dividends received by a UK resident individual holder of Class A ordinary shares from us or from other sources will form part of the holder’s total income for income tax purposes and will constitute the top slice of that income. A nil rate of income tax will apply to the first £2,000 of taxable dividend income received by the holder of
90
Class A ordinary shares in a tax year. Income within the nil rate band will be taken into account in determining whether income in excess of the nil rate band falls within the basic rate, higher rate or additional rate tax bands. Where the dividend income is above the £2,000 dividend allowance, the first £2,000 of the dividend income will be charged at the nil rate and any excess amount will be taxed at 7.5% to the extent that the excess amount falls within the basic rate tax band, 32.5% to the extent that the excess amount falls within the higher rate tax band and 38.1% to the extent that the excess amount falls within the additional rate tax band.
Corporation Tax
Corporate holders of Class A ordinary shares which are resident for tax purposes in the UK should not be subject to UK corporation tax on any dividend received from us so long as the dividends qualify for exemption (as is likely) and certain conditions are met (including anti-avoidance conditions). Corporate holders of Class A ordinary shares who are not resident in the UK will not generally be subject to UK corporation tax on dividends unless they are carrying on a trade, profession or vocation in the UK through a permanent establishment in connection with which the Class A ordinary shares are used, held, or acquired.
A holder of Class A ordinary share who is resident outside the UK may be subject to non-UK taxation on dividend income under local law.
Taxation of Capital Gains
UK Resident Holders of Class A Ordinary Shares
A disposal or deemed disposal of Class A ordinary shares by an individual or corporate holder of Class A ordinary shares who is tax resident in the UK may, depending on the holder’s circumstances and subject to any available exemptions or reliefs, give rise to a chargeable gain or allowable loss for the purposes of UK taxation of chargeable gains.
Any chargeable gain (or allowable loss) will generally be calculated by reference to the consideration received for the disposal of Class A ordinary shares less the allowable cost to the holder of acquiring such Class A ordinary shares.
The applicable tax rates for individual holders of Class A ordinary shares realizing a gain on the disposal of Class A ordinary shares is, broadly, 10% for basic rate taxpayers and 20% for higher and additional rate taxpayers.
Non-UK Resident Holders of Class A Ordinary Shares
Holders of Class A ordinary shares who are not resident in the UK and, in the case of an individual holder, not temporarily non-resident, should not be liable for UK tax on capital gains realized on a sale or other disposal of Class A ordinary shares unless (i) such shares are used, held or acquired for the purposes of a trade, profession or vocation carried on in the UK through a branch or agency or, in the case of a corporate holder, through a permanent establishment or (ii) based on current draft legislation, in respect of disposals made on or after April 6, 2019, the Company derives 75% or more of its gross value from UK land. Holders of Class A ordinary shares who are not resident in the UK may be subject to non-UK taxation on any gain under local law.
Generally, an individual holder of Class A ordinary shares who has ceased to be resident in the UK for tax purposes for a period of five years or less and who disposes of Class A ordinary shares during that period may be liable on their return to the UK to UK taxation on any capital gain realized (subject to any available exemption or relief).
UK Stamp Duty (“stamp duty”) and UK Stamp Duty Reserve Tax (“SDRT”)
The following statements are intended as a general guide to the current position relating to stamp duty and SDRT and apply to any holders of Class A ordinary shares irrespective of their place of tax residence.
No stamp duty will be payable on the issue of Class A ordinary shares.
91
Stamp duty will in principle be payable on any instrument of transfer of Class A ordinary shares that is executed in the UK or that relates to any property situated, or to any matter or thing done or to be done, in the UK. An exemption from stamp duty is available on an instrument transferring Class A ordinary shares where the amount or value of the consideration is £1,000 or less and it is certified on the instrument that the transaction effected by the instrument does not form part of a larger transaction or series of transactions in respect of which the aggregate amount or value of the consideration exceeds £1,000. Holders of Class A ordinary shares should be aware that, even where an instrument of transfer is in principle subject to stamp duty, stamp duty is not required to be paid unless it is necessary to rely on the instrument for legal purposes, for example to register a change of ownership or in litigation in a UK court.
Provided that Class A ordinary shares are not registered in any register maintained in the UK by or on behalf of us and are not paired with any shares issued by a UK incorporated company, the issue or transfer of (or agreement to transfer) Class A ordinary shares will not be subject to SDRT. We currently do not intend that any register of Class A ordinary shares will be maintained in the UK.
U.S. Federal Income Tax Considerations
The following general summary describes the material U.S. federal income tax consequences to U.S. Holders (defined below) of owning and disposing of our Class A ordinary shares. It does not purport to be a comprehensive discussion of all the tax considerations relevant to U.S. Holders.
The discussion below applies only to U.S. Holders that hold the Class A ordinary shares as capital assets within the meaning of Section 1221 of the U.S. Internal Revenue Code of 1986, as amended (the “Code”) (generally, property held for investment). The discussion below is based on the Code, existing and, in some cases, proposed U.S. Treasury Regulations, as well as judicial and administrative interpretations thereof, all as of the date of this Annual Report. All of the foregoing authorities are subject to change or differing interpretation, which change or differing interpretation could apply retroactively and could affect the tax consequences described below. This summary does not address any alternative minimum tax considerations, any estate or gift tax consequences or any state, local, or non-U.S. tax consequences, nor does it address the Medicare contribution tax on net investment income.
The following discussion does not address the tax consequences to any particular investor and does not describe all of the tax consequences to persons in special tax situations such as, but not limited to:
| • | regulated investment companies; |
| • | real estate investment trusts; |
| • | traders that elect to use a mark to market method of accounting; |
| • | tax-exempt entities (including private foundations); |
| • | qualified retirement plans, individual retirement accounts and other tax-deferred accounts; |
| • | U.S. tax expatriates and certain former citizens and long-term residents of the United States; |
| • | persons holding Class A ordinary shares as part of a straddle, hedging, constructive sale, conversion or integrated transaction; |
| • | persons that directly, indirectly, or constructively own 10% or more of the total voting power or value of all of the Company’s outstanding stock; |
92
| • | persons that are resident or ordinarily resident in or have a permanent establishment in a jurisdiction outside the United States; |
| • | persons who acquired Class A ordinary shares pursuant to the exercise of any employee share option or otherwise as compensation; |
| • | persons subject to special tax accounting rules as a result of any item of gross income with respect to the Class A ordinary shares being taken into account in an applicable financial statement; |
| • | persons holding Class A ordinary shares through partnerships or other pass-through entities; or |
| • | U.S. Holders whose “functional currency” is not the U.S. dollar. |
THE SUMMARY OF U.S. FEDERAL INCOME TAX CONSEQUENCES SET OUT BELOW IS FOR GENERAL INFORMATION ONLY. PROSPECTIVE PURCHASERS ARE URGED TO CONSULT THEIR TAX ADVISORS ABOUT THE APPLICATION OF THE U.S. FEDERAL TAX RULES TO THEIR PARTICULAR CIRCUMSTANCES, AS WELL AS THE STATE, LOCAL AND NON-U.S. TAX CONSEQUENCES TO THEM OF THE ACQUISITION, OWNERSHIP AND DISPOSITION OF OUR CLASS A ORDINARY SHARES.
The discussion below of the U.S. federal income tax consequences to “U.S. Holders” applies to a holder that is a beneficial owner of the Class A ordinary shares and is, for U.S. federal income tax purposes,
| • | an individual who is a citizen or resident of the United States as determined under U.S. federal income tax rules |
| • | a corporation (or other entity taxable as a corporation for U.S. federal income tax purposes) created or organized in or under the laws of the United States, any State or the District of Columbia; |
| • | an estate whose income is subject to U.S. federal income taxation regardless of its source; or |
| • | a trust that (1) is subject to the supervision of a court within the United States and the control of one or more U.S. persons or (2) has a valid election in effect under applicable U.S. Treasury Regulations to be treated as a U.S. person. |
The tax treatment of an entity or arrangement taxable as a partnership for U.S. federal income tax purposes that holds Class A ordinary shares generally will depend on such partner’s status and the activities of the partnership. Prospective purchasers that are entities or arrangements treated as partnerships for U.S. federal income tax purposes, or partners in such partnerships, should consult their tax advisers concerning the U.S. federal income tax consequences to them and of the acquisition, ownership and disposition of Class A ordinary shares by the partnership.
Dividends
Subject to the passive foreign investment company (“PFIC”) rules discussed below, the gross amount of distributions made by us with respect to the Class A ordinary shares generally will be includable in a U.S. Holder’s gross income as foreign-source dividend income in the year actually or constructively received by such U.S. Holder, but only to the extent that such distributions are paid out of our current or accumulated earnings and profits as determined under U.S. federal income tax principles. Distributions to a U.S. Holder in excess of current and accumulated earnings and profits will be treated as a non-taxable return of capital to the extent of the U.S. Holder’s basis in the Class A ordinary shares and thereafter as capital gain. In the event we make distributions to U.S. Holders of ordinary shares, we may or may not calculate our earnings and profits under U.S. federal income tax principles. If we do not do so, any distribution may be required to be regarded as a dividend, even if that distribution would otherwise be treated as a non-taxable return of capital or as capital gain. U.S. Holders should therefore assume that all cash distributions will be reported as ordinary dividend income. The amount of any distribution of property other than cash will be the fair market value of that property on the date of distribution. U.S. Holders should consult their own tax advisors to determine whether and to what extent they will be entitled to foreign tax credits in respect of any dividend income received.
93
With respect to non-corporate U.S. Holders (including individuals, estates, and trusts), dividends received with respect to our Class A ordinary shares may be considered “qualified dividend income” subject to lower capital gains rates, provided that (1) the Class A ordinary shares are readily tradable on an established securities market in the United States, (2) we are not a PFIC (as discussed below) for either our taxable year in which the dividend was paid or the preceding taxable year and (3) certain holding period requirements are met. In this regard, the Class A ordinary shares will generally be considered to be readily tradable on an established securities market in the United States if they are listed on the NYSE, as we intend the Class A ordinary shares will be. U.S. Holders should consult their own tax advisors regarding the availability of the lower rate for the dividends paid with respect to the Class A ordinary shares.
Dividends paid by us with respect to the Class A ordinary shares will generally constitute foreign-source “passive category income” and will not be eligible for the dividends-received deduction generally allowed to corporate U.S. Holders in respect of dividends received from U.S. corporations.
Sale or Other Disposition of Shares
Subject to the PFIC rules discussed below, upon a sale or other disposition of the Class A ordinary shares, a U.S. Holder generally will recognize a capital gain or loss for U.S. federal income tax purposes in an amount equal to the difference between the amount realized and the U.S. Holder’s adjusted tax basis in such Class A ordinary shares. A U.S. Holder’s adjusted tax basis in shares generally will be such U.S. Holder’s purchase price for the shares, unless we make distributions in excess of its current and accumulated earnings and profits. Any such gain or loss generally will be U.S.-source gain or loss and will be treated as long-term capital gain or loss if the U.S. Holder’s holding period in the Class A ordinary shares exceeds one year. Non-corporate U.S. Holders (including individuals) generally will be subject to U.S. federal income tax on long-term capital gain at preferential rates. The deductibility of capital losses is subject to significant limitations.
Passive Foreign Investment Company
We will be classified as a PFIC within the meaning of Section 1297 of the Code, for any taxable year if either: (1) at least 75% of the gross income of the Company is “passive income” for purposes of the PFIC rules or (2) at least 50% of the value of our assets (determined on the basis of a quarterly average) produce or are held for the production of passive income. Passive income for this purpose generally includes dividends, interest, royalties, rents and gains from commodities and securities transactions. For this purpose, we will be treated as owning the proportionate share of the assets, and earning the proportionate share of the income, of any other corporation in which we own, directly or indirectly, 25% or more measured by value of the stock. Under the PFIC rules, if we were considered a PFIC at any time that a U.S. Holder holds Class A ordinary shares, we would continue to be treated as a PFIC with respect to such holder’s investment unless (1) the Company ceases to be a PFIC and (2) the U.S. Holder has made a “deemed sale” election under the PFIC rules.
Based on the currently anticipated market capitalization and composition of our income, assets, and operations, the Company does not expect to be treated as a PFIC for U.S. federal income tax purposes for the taxable year that ended on December 31, 2018 or in the foreseeable future. However, the market capitalization and the expected income, assets and operations in the future could be significantly different from what is currently anticipated. In addition, the PFIC determination must be made annually after the close of each taxable year. Therefore there can be no assurance that we will not be classified as a PFIC for the current taxable year or for any future taxable year.
If we are considered a PFIC for any taxable year that a U.S. Holder holds Class A ordinary shares, any gain recognized by the U.S. Holder on a sale or other disposition of the Class A ordinary shares, as well as the amount of any “excess distribution” (defined below) received by the U.S. Holder, would be allocated ratably over the U.S. Holder’s holding period for the Class A ordinary shares. The amounts allocated to the taxable year of the sale or other disposition (or the taxable year of receipt, in the case of an excess distribution) and to any year before we became a PFIC would be taxed as ordinary income. The amount allocated to each other taxable year would be subject to tax at the highest rate in effect for individuals or corporations, as appropriate, for that taxable year, and an interest charge would be imposed on the amount allocated to that taxable year. For the purposes of these rules, an excess distribution is the amount by which any distribution received by a U.S. Holder on its Class A ordinary shares
94
exceeds 125% of the average of the annual distributions on the Class A ordinary shares received during the preceding three years or the U.S. Holder’s holding period, whichever is shorter. Additionally, dividends paid by us would not be eligible for the reduced rate of tax described above under “—Dividends” if we are a PFIC in its taxable year in which the dividend is paid or the immediately preceding taxable year.
If we are treated as a PFIC with respect to a U.S. Holder for any taxable year, certain elections may be available to the U.S. Holder that would result in alternative treatments, such as mark-to-market treatment or treatment as a qualified electing fund (“QEF”), of the Class A ordinary shares. However, we cannot provide any assurances that we will assist investors in determining whether we or any of our non-U.S. subsidiaries are a PFIC for any taxable year, nor do we expect that we will prepare or provide to U.S. Holders a “PFIC annual information statement,” which would enable a U.S. Holder to make a QEF election.
If we are treated as a PFIC with respect to a U.S. Holder for any taxable year, the U.S. Holder will be deemed to own shares in any of our subsidiaries that are also PFICs and generally be subject to the treatment described above with respect to any distribution on or disposition of such shares. An election for mark-to-market treatment, however, would likely not be available with respect to any such subsidiaries.
If we are considered a PFIC, a U.S. Holder will also be subject to information reporting requirements on an annual basis. U.S. Holders should consult their own tax advisors about the potential application of the PFIC rules to an investment in the Class A ordinary shares.
U.S. Information Reporting and Backup Withholding
Dividend payments with respect to the Class A ordinary shares and proceeds from the sale or other disposition of the Class A ordinary shares may be subject to information reporting to the IRS. In addition, a U.S. Holder (other than exempt U.S. Holders who establish their exempt status, if required) may be subject to backup withholding, currently at a 24% rate, on dividend payments and proceeds from the sale or other taxable disposition of Class A ordinary shares made within the United States or through certain U.S.-related financial intermediaries.
Backup withholding will not apply, however, to a U.S. Holder who furnishes a correct taxpayer identification number and makes any other required certification or who is otherwise exempt from backup withholding. U.S. Holders who are required to establish their exempt status may be required to provide such certification on IRS Form W-9. U.S. Holders should consult their tax advisors regarding the application of the U.S. information reporting and backup withholding rules.
Backup withholding is not an additional tax. Amounts withheld as backup withholding may be credited against a U.S. Holder’s U.S. federal income tax liability, and such holder may obtain a refund of any excess amounts withheld under the backup withholding rules by timely filing the appropriate claim for refund with the IRS and furnishing any required information.
Information Reporting by U.S. Holders
Certain U.S. Holders who are individuals and certain entities holding specified foreign financial assets, including our Class A ordinary shares, with an aggregate value in excess of the applicable dollar threshold, may be required to report information relating to the Class A ordinary shares, subject to certain exceptions (including an exception for Class A ordinary shares held in accounts maintained by certain U.S. financial institutions), for each year in which they hold such shares. U.S. Holders should consult their tax advisors regarding their reporting obligations with respect to their ownership and disposition of the Class A ordinary shares.
FATCA
Provisions under Sections 1471 through 1474 of the Code and applicable U.S. Treasury Regulations commonly referred to as “FATCA” generally impose 30% withholding on certain “withholdable payments” and, subject to the proposed regulations discussed below, may impose such withholding on “foreign passthru payments” made by a “foreign financial institution” (each as defined in the Code) that has entered into an agreement with the U.S. Internal Revenue Service to perform certain diligence and reporting obligations with respect to the foreign
95
financial institution’s U.S.-owned accounts. Under recently proposed regulations, any withholding on foreign passthru payments would apply to passthru payments made on or after the date that is two years after the date of publication in the Federal Register of applicable final regulations defining foreign passthru payments. Although these recent regulations are not final, taxpayers generally may rely on them until final regulations are issued.
The United States has entered into an intergovernmental agreement (“IGA”) with the Cayman Islands, which modifies the FATCA withholding regime described above. It is not yet clear how foreign passthru payments will be addressed under FATCA. The Company could be subject to these diligence, reporting and withholding obligations if it were treated as a financial institution under FATCA or the Cayman IGA. Prospective investors should consult their tax advisors regarding the potential impact of FATCA, the Cayman IGA and any non-U.S. legislation implementing FATCA, on their investment in the Class A ordinary shares.
THE DISCUSSION ABOVE IS A GENERAL SUMMARY. IT DOES NOT COVER ALL TAX MATTERS THAT MAY BE IMPORTANT TO YOU. EACH PROSPECTIVE PURCHASER SHOULD CONSULT ITS OWN TAX ADVISOR ABOUT THE TAX CONSEQUENCES OF AN INVESTMENT IN CLASS A ORDINARY SHARES UNDER THE INVESTOR’S OWN CIRCUMSTANCES.
F. Dividends and Paying Agents
Not applicable
G. Statement by Experts
Not applicable.
H. Documents on Display
We are required to make certain filings with the SEC. The SEC maintains an Internet website that contains reports, proxy statements and other information about issuers, like us, that file electronically with the SEC. The address of that site is www.sec.gov.
We also make available on our website, free of charge, our annual reports on Form 20-F and the text of our reports on Form 6-K, including any amendments to these reports, as well as certain other SEC filings, as soon as reasonably practicable after they are electronically filed with or furnished to the SEC. Our website address is www.farfetchinvestors.com. The information contained on our website is not incorporated by reference in this document.
I. Subsidiary Information
Not applicable.
Item 11. Quantitative and Qualitative Disclosures About Market Risk
Market Risk
Our operations are exposed to a variety of financial risks that include foreign exchange and liquidity risk. We review and agree policies for managing these risks, which are then implemented by our finance department. Please refer to note 28 to our audited consolidated financial statements for the years ended 31 December 2018 and 2017 included elsewhere in this Annual Report for a fuller quantitative and qualitative discussion on the market risks to which we are subject and our policies with respect to managing those risks. The policies are summarized below:
The Group’s activities expose it primarily to the financial risk of changes in foreign currency exchange rates. The Group enters into derivative financial instruments to manage its exposure to foreign currency risk.
Foreign currency risk is the risk that the fair value or future cash flows of an exposure will fluctuate because of changes in foreign exchange rates.
96
The Group uses forward currency contracts to hedge its foreign currency risks. Where the criteria for hedge accounting are not met, derivative financial instruments are initially recognized at fair value on the date on which a derivative contract is entered into and are subsequently remeasured at fair value with movements recorded to the statement of operations. Derivatives are carried as financial assets when the fair value is positive and as financial liabilities when the fair value is negative. Where all relevant criteria are met, hedge accounting is applied to minimize earnings volatility.
Liquidity risk
The Group monitors its liquidity risk to maintain a balance between continuity of funding and flexibility. This helps the Group achieve timely fulfilment of its obligations while sustaining the growth of the business.
Item 12. Description of Securities Other than Equity Securities
Not applicable.
97
PART II
Item 13. Defaults, Dividend Arrearages and Delinquencies
None.
Item 14. Material Modifications to the Rights of Security Holders and Use of Proceeds
On September 20, 2018, in connection with our IPO, we amended and restated our memorandum and articles of association. A copy of our amended and restated memorandum and articles of association is being filed as Exhibit 1.1 to this Annual Report. See Item 10. “Additional Information—B. Memorandum and Articles of Association.”
Use of Proceeds
On September 25, 2018, we completed an IPO of our Class A ordinary shares, in which we sold at an initial public offering price of $20.00 per share, 40,246,453 Class A ordinary shares (including 6,636,562 Class A ordinary shares that were subject to the underwriters’ option to purchase additional shares), and the selling shareholders sold 10,633,858 Class A ordinary shares (including 6,636,562 Class A ordinary shares that were subject to the underwriters’ option to purchase additional shares). The shares offered and sold in the IPO were registered under the Securities Act pursuant to our Registration Statement on Form F 1 (File No. 333 2226929), which was declared effective by the SEC on September 20, 2018.
The offering did not terminate until after the sale of all 50,880,311 Class A ordinary shares registered on the registration statement. The aggregate offering price for the shares registered and sold was approximately $1,017.6 million. Goldman Sachs & Co. LLC, J.P. Morgan Securities LLC, Allen & Company LLC and UBS Securities LLC acted as representatives of the several underwriters.
The IPO generated proceeds to us of approximately $758.6 million, net of underwriting discounts and commissions of approximately $46.3 million and other offering expenses of approximately $11.9 million. The IPO generated proceeds to the selling stockholders of approximately $200.4 million, net of underwriting discounts and commissions of approximately $12.2 million. We paid out of Company proceeds all of our and the selling shareholders’ fees, costs and expenses in connection with the IPO (excluding, in the case of the selling shareholders, underwriting discounts and commissions and similar brokers’ fees and transfer taxes).
No offering expenses were paid directly or indirectly to any of our directors or officers (or their associates), persons owning 10% or more of our ordinary shares or any other affiliates.
There has been no material change in the expected use of the net proceeds from our IPO as described in our final prospectus filed with the SEC on September 24, 2018 pursuant to Rule 424(b).
Item 15. Controls and Procedures
Evaluation of Disclosure Controls and Procedures
We maintain disclosure controls and procedures (as that term is defined in Rules 13a-15(e) and 15d-15(e) under the Securities Exchange Act of 1934, as amended (“Exchange Act”)) that are designed to ensure that information required to be disclosed in the Company’s reports under the Exchange Act is recorded, processed, summarized and reported within the time periods specified in the SEC’s rules and forms and that such information is accumulated and communicated to our management, including our Chief Executive Officer and Chief Financial Officer, as appropriate, to allow timely decisions regarding required disclosures. Any controls and procedures, no matter how well designed and operated, can provide only reasonable assurance of achieving the desired control objectives. Our management, with the participation of our Chief Executive Officer and Chief Financial Officer, has evaluated the effectiveness of the design and operation of our disclosure controls and procedures as of December 31, 2018. Based upon that evaluation, our Chief Executive Officer and Chief Financial Officer concluded that, as a result of the material weaknesses in our internal control over financial reporting described below, the design and operation of our disclosure controls and procedures were not effective, as of December 31, 2018.
98
Management's Annual Report on Internal Control over Financial Reporting
This Annual Report does not include a report of management’s assessment regarding internal control over financial reporting due to a transition period established by rules of the SEC for newly public companies. This Annual Report also does not include an attestation report of our independent registered public accounting firm due to a transition period established by rules of the SEC for newly public companies. Additionally, our independent registered public accounting firm will not be required to opine on the effectiveness of our internal control over financial reporting until we are no longer an emerging growth company.
Changes in Internal Control over Financial Reporting
Except as described below, there were no changes in our internal controls over financial reporting (as such term is defined in Rules 13a-15(f) and 15d-15(f) under the Securities Exchange Act) that occurred during the period covered by this Annual Report that have materially affected, or are reasonably likely to materially affect, our internal control over financial reporting.
Ongoing Remediation of Material Weakness in Internal Control over Financial Reporting
As previously disclosed in our Registration Statement on Form F-1 (File No. 333-226929), which was declared effective by the SEC on September 20, 2018, we identified certain control deficiencies in the design and operation of our internal control over financial reporting in connection with our 2017 audit that constituted material weaknesses. The control deficiencies resulted from (1) our technology access and change control environment not supporting an efficient or effective internal control framework and (2) reliance on manual processes.
A material weakness is a deficiency, or a combination of deficiencies, in internal control over financial reporting, such that there is a reasonable possibility that a material misstatement of the company’s annual or interim consolidated financial statements may not be prevented or detected on a timely basis.
Based on the criteria established in Internal Control - Integrated Framework (2013) issued by the Committee of Sponsoring Organizations (COSO) of the Treadway Commission we have implemented and continue to implement control procedures to strengthen our internal control over financial reporting. Specifically, we have revised and continue to revise information technology controls covering identity service, change and audit management together with the automation of a number of previously manual processes. In addition, we have hired and will continue to hire additional accounting, finance and technology personnel.
Although we have made enhancements to our control procedures in this area, the material weaknesses will not be remediated until the necessary controls have been fully implemented and operating effectively. See Item 3. “Key Information – D. Risk Factors — Risks Related to Ownership of our Class A Ordinary Shares — As a public reporting company, we are subject to rules and regulations established from time to time by the SEC regarding our internal control over financial reporting. If we fail to put in place appropriate and effective internal controls over financial reporting and disclosure controls and procedures, we may not be able to accurately report our financial results, or report them in a timely manner, which may adversely affect investor confidence in us and, as a result, the value of our Class A ordinary shares.”
Item 16. [Reserved]
Item 16A. Audit Committee Financial Expert
Our Board has determined that Mr. Kamaluddin, Ms. Evan and Mr. Risman each satisfy the “independence” requirements set forth in Rule 10A‑3 under the Exchange Act. Our board of directors has also determined that each of Mr. Kamaluddin, Ms. Evan and Mr. Risman is considered an “audit committee financial expert” as defined in Item 16A of Form 20‑F under the Exchange Act.
99
Item 16B. Code of Ethics
We have adopted a Code of Conduct that applies to all our employees, officers and directors, including our principal executive, principal financial and principal accounting officers. Our Code of Conduct addresses, among other things, competition and fair dealing, conflicts of interest, financial matters and external reporting, company funds and assets, confidentiality and corporate opportunity requirements and the process for reporting violations of the Code of Conduct, employee misconduct, conflicts of interest or other violations. Our Code of Conduct and Ethics is intended to meet the definition of "code of ethics" under Item 16B of 20-F under the Exchange Act.
We intend to disclose on our website any amendment to, or waiver from, a provision of our Code of Conduct that applies to our directors or executive officers to the extent required under the rules of the SEC or the NYSE. Our Code of Conduct is available on our website at www.farfetchinvestors.com. The information contained on our website is not incorporated by reference in this Annual Report.
Item 16C. Principal Accounting Fees and Services
PricewaterhouseCoopers LLP ("PwC") acted as our independent auditor for the fiscal years ended December 31, 2018, 2017 and 2016. The table below sets out the total amount billed to us by PwC, for services performed in the years ended December 31, 2018, 2017 and 2016, and breaks down these amounts by category of service:
| | 2016 | | | 2017 | | | 2018 | |
| | $'000 | | | $'000 | | | $'000 | |
Audit Fees | | | 253 | | | | 437 | | | | 1,028 | |
Audit Related Fees | | | - | | | | 575 | | | | 886 | |
Tax Fees | | | 107 | | | | 10 | | | | 6 | |
All Other Fees | | | 51 | | | | 73 | | | | 232 | |
Total | | | 411 | | | | 1,095 | | | | 2,152 | |
Audit Fees
Audit fees for the years ended December 31, 2018, 2017 and 2016 were related to the audit of our consolidated and subsidiary financial statements and other audit or interim review services provided in connection with statutory and regulatory filings or engagements.
Audit Related Fees
Audit related fees for the years ended December 31, 2017 and 2018 relate to services in connection with our IPO transaction.
Tax Fees
Tax fees for the years ended December 31, 2018, 2017 and 2016 were related to tax compliance and tax planning services.
All Other Fees
All other fees in the years ended December 31, 2018, 2017 and 2016 related to services in connection with non-audit compliance and review work.
Pre-Approval Policies and Procedures
The advance approval of the Audit Committee or members thereof, to whom approval authority has been delegated, is required for all audit and non-audit services provided by our auditors.
100
All services provided by our auditors are approved in advance by either the Audit Committee or members thereof, to whom authority has been delegated, in accordance with the Audit Committee's pre-approval policy.
Item 16D. Exemptions from the Listing Standards for Audit Committees
Not applicable.
Item 16E. Purchases of Equity Securities by the Issuer and Affiliated Purchasers
None.
Item 16F. Change in Registrant’s Certifying Accountant
None.
Item 16G. Corporate Governance
Our Class A ordinary shares are listed on the NYSE. We believe the following to be the significant differences between our corporate governance practices and those applicable to U.S. companies under the NYSE listing standards. In general, under the NYSE, foreign private issuers, as defined under the Exchange Act, are permitted to follow home country corporate governance practices instead of the corporate governance practices of the New York Stock Exchange. Accordingly, we follow certain corporate governance practices of our home country, the Cayman Islands, in lieu of certain of the corporate governance requirements of the NYSE.
We are a “foreign private issuer” (as such term is defined in Rule 3b–4 under the Exchange Act), and our Class A ordinary shares are listed on the NYSE. Under the NYSE rules, NYSE listed companies that are foreign private issuers are permitted to follow home country practice in lieu of the corporate governance provisions specified by the NYSE with limited exceptions. In addition, under the NYSE rules, listed companies of which more than 50% of the voting power for the election of directors is held by an individual, group or other entity are not required to have a majority of independent directors, as defined by NYSE rules, or to comply with certain other requirements. Because Mr. Neves beneficially owns more than 50% of the voting power of the Company, the Company is a “controlled company” within the meaning of the rules of the NYSE.
Under the NYSE rules, U.S. domestic listed, non-controlled companies are required to have a majority independent board, which is not required under the Companies Law of the Cayman Islands, our home country. In addition, the NYSE rules require U.S. domestic listed, non-controlled companies to have a compensation committee and a nominating and corporate governance committee, each composed entirely of independent directors, which are not required under our home country laws.
We currently follow and intend to continue to follow the foregoing governance practices and not avail ourselves of the exemptions afforded to foreign private issuers or controlled companies under the NYSE rules. We may in the future, however, decide to use other foreign private issuer exemptions with respect to some or all of the other NYSE listing requirements. Following our home country governance practices may provide less protection than is accorded to investors under the NYSE listing requirements applicable to domestic issuers.
The NYSE rules also require shareholder approval for certain matters, such the opportunity to vote on equity compensation plans and material revisions to those plans, which is not required under the Cayman Islands law. We intend to follow home country law in determining whether shareholder approval is required.
Item 16H. Mine Safety Disclosure
Not applicable.
101
PART III
Item 17. Financial Statements
We have provided financial statements pursuant to Item 18.
Item 18. Financial Statements
The audited consolidated financial statements as required under Item 18 are attached hereto starting on page F-1 of this Annual Report. The audit report of PricewaterhouseCoopers LLP, independent registered public accounting firm, is included herein preceding the audited consolidated financial statements.
102
Item 19. Exhibits
List all exhibits filed as part of the registration statement or annual report, including exhibits incorporated by reference.
Exhibit No. | | Description |
| | |
1.1 | | Form of Amended and Restated Memorandum and Articles of Association of the Registrant as currently in effect (incorporated by reference to Exhibit 3.1 to the Company’s Registration Statement on Form F-1 (File No. 333-226929) filed with the SEC on August 20, 2018). |
| | |
2.1 | | Registration Rights Agreement, dated as of July 21, 2017 by and among Farfetch.com Limited and certain shareholders of Farfetch.com Limited (incorporated by reference to Exhibit 4.1 to the Company’s Registration Statement on Form F-1 (File No. 333-226929) filed with the SEC on August 20, 2018). |
| | |
2.2 | | Deed of Amendment related to the Commitment Agreement, dated as of August 8, 2018 by and among Kadi Group Holding Limited, José Neves and TGF Participations Limited (incorporated by reference to Exhibit 4.2 to the Company’s Registration Statement on Form F-1 (File No. 333-226929) filed with the SEC on August 20, 2018). |
| | |
2.3 | | Form of Class A Ordinary Share Certificate (incorporated by reference to Exhibit 4.3 to the Company’s Registration Statement on Form F-1 (File No. 333-226929) filed with the SEC on August 20, 2018). |
| | |
4.1 | | Form of Indemnification Agreement (incorporated by reference to Exhibit 10.1 to the Company’s Registration Statement on Form F-1 (File No. 333-226929) filed with the SEC on August 20, 2018).† |
| | |
4.2 | | Amended and Restated Rules of the Farfetch.com Limited Enterprise Management Incentive Scheme, adopted July 17, 2013 (incorporated by reference to Exhibit 10.2 to the Company’s Registration Statement on Form F-1 (File No. 333-226929) filed with the SEC on August 20, 2018).† |
| | |
4.3 | | Rules of the Farfetch.com Limited Share Option Scheme, adopted July 18, 2013 (incorporated by reference to Exhibit 10.3 to the Company’s Registration Statement on Form F-1 (File No. 333-226929) filed with the SEC on August 20, 2018).† |
| | |
4.4 | | Farfetch.com Limited 2015 Long-Term Incentive Plan, adopted February 13, 2015 (incorporated by reference to Exhibit 10.4 to the Company’s Registration Statement on Form F-1 (File No. 333-226929) filed with the SEC on August 20, 2018).† |
| | |
4.5 | | Asset Purchase Agreement, dated as of June 12, 2017, among Farfetch.com Limited, Farfetch UK Limited, Advance Magazine Publishers Inc. and CN Commerce Ltd. (incorporated by reference to Exhibit 10.5 to the Company’s Registration Statement on Form F-1 (File No. 333-226929) filed with the SEC on August 20, 2018). |
| | |
4.6 | | Collaboration Agreement, dated as of June 13, 2017, between Farfetch.com Limited, Farfetch UK Limited and Advance Magazine Publishers Inc. (incorporated by reference to Exhibit 10.6 to the Company’s Registration Statement on Form F-1 (File No. 333-226929) filed with the SEC on August 20, 2018). |
| | |
4.7 | | Side Letter to the Asset Purchase Agreement, dated as of July 7, 2017, between Farfetch.com Limited, Farfetch UK Limited, Advance Magazine Publishers Inc. and CN Commerce Ltd. (incorporated by reference to Exhibit 10.7 to the Company’s Registration Statement on Form F-1 (File No. 333-226929) filed with the SEC on August 20, 2018). |
| | |
4.8 | | Share Purchase Agreement, dated as of October 31, 2017, between Farfetch UK Limited, ASAP54.com Limited and Daniela Cecilio (incorporated by reference to Exhibit 10.8 to the Company’s Registration Statement on Form F-1 (File No. 333-226929) filed with the SEC on August 20, 2018). |
| | |
4.9 | | Consultancy Agreement, dated as of December 21, 2017, between Farfetch Limited UK, DCN Consultancy Services Limited and Daniela Cecilio (incorporated by reference to Exhibit 10.9 to the Company’s Registration Statement on Form F-1 (File No. 333-226929) filed with the SEC on August 20, 2018). |
| | |
103
Exhibit No. | | Description |
| | |
4.10 | | Payment Processing Agreement, dated as of April 18, 2018, between Chinabank Payment Technology Co. Ltd. and Farfetch UK Limited (incorporated by reference to Exhibit 10.10 to the Company’s Registration Statement on Form F-1 (File No. 333-226929) filed with the SEC on August 20, 2018). |
| | |
4.11 | | Amended and Restated Forward Purchase Agreement, dated as of August 8, 2018, between Farfetch.com Limited and Kadi Group Holding Limited (incorporated by reference to Exhibit 10.11 to the Company’s Registration Statement on Form F-1 (File No. 333-226929) filed with the SEC on August 20, 2018). |
| | |
4.12 | | Consultancy Agreement, dated August 15, 2018, between Farfetch UK Limited and Natalie Massenet (incorporated by reference to Exhibit 10.12 to the Company’s Registration Statement on Form F-1 (File No. 333-226929) filed with the SEC on August 20, 2018).† |
| | |
4.13 | | Form of 2018 Farfetch Employee Equity Plan (incorporated by reference to Exhibit 4.6 to the Company’s Registration Statement on Form S-8 (Filed No. 333-227536) filed with the SEC on September 26, 2018).† |
| | |
4.14 | | Acquisition Agreement, dated as of December 12, 2018 between Stadium Goods and Farfetch Limited. |
| | |
4.15 | | Amended and Restated Commitment Agreement, dated as of February 27, 2019 between Kadi Group Holding Limited and José Neves. |
| | |
8.1 | | List of subsidiaries. |
| | |
12.1 | | Principal Executive Officer Certification Pursuant to Section 302 of the Sarbanes-Oxley Act of 2002. |
| | |
12.2 | | Principal Financial Officer Certification Pursuant to Section 302 of the Sarbanes-Oxley Act of 2002. |
| | |
13.1 | | Principal Executive Officer Certification Pursuant to Section 906 of the Sarbanes-Oxley Act of 2002. |
| | |
13.2 | | Principal Financial Officer Certification Pursuant to Section 906 of the Sarbanes-Oxley Act of 2002. |
| | |
15.1 | | Consent of PricewaterhouseCoopers LLP, independent registered public accounting firm. |
| | |
101.INS | | XBRL Instance Document. |
| | |
101.SCH | | XBRL Taxonomy Extension Schema Document. |
| | |
101.CAL | | XBRL Taxonomy Extension Calculation Linkbase Document. |
| | |
101.DEF | | XBRL Taxonomy Definition Linkbase Document. |
| | |
101.LAB | | XBRL Taxonomy Extension Label Linkbase Document. |
| | |
101.PRE | | XBRL Taxonomy Extension Presentation Linkbase Document |
† This document has been identified as a management contract or compensatory plan or arrangement.
Certain agreements filed as exhibits to this report contain representations and warranties that the parties thereto made to each other. These representations and warranties have been made solely for the benefit of the other parties to such agreements and may have been qualified by certain information that has been disclosed to the other parties to such agreements and that may not be reflected in such agreements. In addition, these representations and warranties may be intended as a way of allocating risks among parties if the statements contained therein prove to be incorrect, rather than as actual statements of fact. Accordingly, there can be no reliance on any such representations and warranties as characterizations of the actual state of facts. Moreover, information concerning the subject matter of any such representations and warranties may have changed since the date of such agreements.
104
SIGNATURES
The registrant hereby certifies that it meets all of the requirements for filing on Form 20-F and that it has duly caused and authorized the undersigned to sign this annual report on its behalf.
| | Farfetch Limited |
| | | |
Date: March 1, 2019 | | By: | /s/ José Neves |
| | | José Neves |
| | | Chief Executive Officer |
105
INDEX TO CONSOLIDATED FINANCIAL STATEMENTS
Report of Independent Registered Public Accounting Firm | F-1 |
| |
Consolidated statements of operations for the years ended December 31, 2018, 2017 and 2016 | F-2 |
| |
Consolidated statements of comprehensive loss for the years ended December 31, 2018, 2017 and 2016 | F-3 |
| |
Consolidated statements of financial position as of December 31, 2018, 2017 and 2016 | F-4 |
| |
Consolidated statements of changes in equity for the years ended December 31, 2018, 2017 and 2016 | F-5 |
| |
Consolidated statements of Cash Flows for the years ended December 31, 2018, 2017 and 2016 | F-6 |
| |
Notes to Consolidated Financial Statements | F-7 |
Report of Independent Registered Public Accounting Firm
To the Board of Directors and Shareholders of Farfetch Limited
Opinion on the Financial Statements
We have audited the accompanying consolidated statements of financial position of Farfetch Limited and its subsidiaries (the “Company”) as of December 31, 2018 and 2017, and the related consolidated statements of operations, comprehensive loss, changes in equity and cash flows for each of the three years in the period ended December 31, 2018, including the related notes (collectively referred to as the “consolidated financial statements”). In our opinion, the consolidated financial statements present fairly, in all material respects, the financial position of the Company as of December 31, 2018 and 2017, and the results of its operations and its cash flows for each of the three years in the period ended December 31, 2018 in conformity with International Financial Reporting Standards as issued by the International Accounting Standards Board.
Basis for Opinion
These consolidated financial statements are the responsibility of the Company’s management. Our responsibility is to express an opinion on the Company’s consolidated financial statements based on our audits. We are a public accounting firm registered with the Public Company Accounting Oversight Board (United States) (PCAOB) and are required to be independent with respect to the Company in accordance with the U.S. federal securities laws and the applicable rules and regulations of the Securities and Exchange Commission and the PCAOB.
We conducted our audits of these consolidated financial statements in accordance with the standards of the PCAOB. Those standards require that we plan and perform the audit to obtain reasonable assurance about whether the consolidated financial statements are free of material misstatement, whether due to error or fraud.
Our audits included performing procedures to assess the risks of material misstatement of the consolidated financial statements, whether due to error or fraud, and performing procedures that respond to those risks. Such procedures included examining, on a test basis, evidence regarding the amounts and disclosures in the consolidated financial statements. Our audits also included evaluating the accounting principles used and significant estimates made by management, as well as evaluating the overall presentation of the consolidated financial statements. We believe that our audits provide a reasonable basis for our opinion.
/s/PricewaterhouseCoopers LLP
London, United Kingdom
March 1, 2019
We have served as the Company's auditor since 2015.
F-1
Consolidated statements of operations
for the year ended December 31,
(in $ thousands, except share and per share data)
| | Note | | 2016 | | | 2017 | | | 2018 | |
Revenue | | 4 | | | 242,116 | | | | 385,966 | | | | 602,384 | |
Cost of revenue | | | | | (125,238 | ) | | | (181,200 | ) | | | (303,934 | ) |
Gross profit | | | | | 116,878 | | | | 204,766 | | | | 298,450 | |
Selling, general and administrative expenses | | 8 | | | (205,558 | ) | | | (299,260 | ) | | | (471,766 | ) |
Share of profits of associates | | | | | 18 | | | | 31 | | | | 33 | |
Operating loss | | | | | (88,662 | ) | | | (94,463 | ) | | | (173,283 | ) |
Net finance income/ (costs) | | 9 | | | 7,402 | | | | (17,642 | ) | | | 19,866 | |
Loss before tax | | 10 | | | (81,260 | ) | | | (112,105 | ) | | | (153,417 | ) |
Income tax expense | | 11 | | | (199 | ) | | | (170 | ) | | | (2,158 | ) |
Loss after tax | | | | | (81,459 | ) | | | (112,275 | ) | | | (155,575 | ) |
Attributable to: | | | | | | | | | | | | | | |
Equity holders of the parent | | | | | (81,414 | ) | | | (112,275 | ) | | | (155,575 | ) |
Non-controlling interests | | 21 | | | (45 | ) | | - | | | | - | |
| | | | | (81,459 | ) | | | (112,275 | ) | | | (155,575 | ) |
Loss per share attributable to owners of the parent | | | | | | | | | | | | | | |
Basic and diluted | | 12 | | | (0.43 | ) | | | (0.50 | ) | | | (0.59 | ) |
Weighted-average shares outstanding | | | | | | | | | | | | | | |
Basic and diluted | | | | | 188,679,490 | | | | 223,465,734 | | | | 264,432,214 | |
The accompanying notes are an integral part of these consolidated financial statements
F-2
Consolidated statements of comprehensive loss
for the year ended December 31,
(in $ thousands)
| | Note | | | 2016 | | | 2017 | | | 2018 | |
Loss for the year | | | | | | | (81,459 | ) | | | (112,275 | ) | | | (155,575 | ) |
Other comprehensive (loss)/income | | | | | | | | | | | | | | | | |
Items that may be subsequently reclassified to consolidated statement of operations | | | | | | | | | | | | | | | | |
Exchange differences on translation of foreign operations | | | | | | | (27,322 | ) | | | 33,504 | | | | (24,142 | ) |
Gains on cash flow hedges | | | | | | | - | | | | - | | | | 436 | |
Other comprehensive (loss)/income for the year, net of tax | | | | | | | (27,322 | ) | | | 33,504 | | | | (23,706 | ) |
Total comprehensive loss for the year, net of tax | | | | | | | (108,781 | ) | | | (78,771 | ) | | | (179,281 | ) |
Attributable to: | | | | | | | | | | | | | | | | |
Equity holders of the parent | | | | | | | (108,736 | ) | | | (78,771 | ) | | | (179,281 | ) |
Non-controlling interests | | | 21 | | | | (45 | ) | | | - | | | | - | |
| | | | | | | (108,781 | ) | | | (78,771 | ) | | | (179,281 | ) |
The accompanying notes are an integral part of these consolidated financial statements
F-3
Consolidated statements of financial position
(in $ thousands)
| | Note | | | December 31, 2017 | | | December 31, 2018 | |
Non-current assets | | | | | | | | | | | | |
Trade and other receivables | | | 14 | | | | 9,193 | | | | 10,458 | |
Intangible assets | | | 15 | | | | 74,041 | | | | 103,345 | |
Property, plant and equipment | | | 16 | | | | 26,696 | | | | 37,528 | |
Investments | | | 17 | | | | 278 | | | | 566 | |
Investments in associates | | | 17 | | | | 58 | | | | 86 | |
Total non-current assets | | | | | | | 110,266 | | | | 151,983 | |
Current assets | | | | | | | | | | | | |
Inventories | | | 13 | | | | 50,610 | | | | 60,954 | |
Trade and other receivables | | | 14 | | | | 18,180 | | | | 93,670 | |
Cash and cash equivalents | | | | | | | 384,002 | | | | 1,044,786 | |
Total current assets | | | | | | | 452,792 | | | | 1,199,410 | |
Total assets | | | | | | | 563,058 | | | | 1,351,393 | |
Equity and liabilities | | | | | | | | | | | | |
Equity | | | | | | | | | | | | |
Share capital | | | 18 | | | | 9,298 | | | | 11,994 | |
Share premium | | | 18 | | | | 677,674 | | | | 772,300 | |
Merger reserve | | | 18 | | | | - | | | | 783,529 | |
Foreign exchange reserve | | | 19 | | | | 633 | | | | (23,509 | ) |
Other reserves | | | 19 | | | | 38,475 | | | | 67,474 | |
Accumulated losses | | | 19 | | | | (329,177 | ) | | | (483,357 | ) |
Equity attributable to owners of the parent | | | | | | | 396,903 | | | | 1,128,431 | |
Non-controlling interests | | | 21 | | | | - | | | | - | |
Total equity | | | | | | | 396,903 | | | | 1,128,431 | |
Non-current liabilities | | | | | | | | | | | | |
Provisions | | | 24 | | | | 5,142 | | | | 13,462 | |
Other liabilities | | | 29 | | | | 5,123 | | | | 15,342 | |
Total non-current liabilities | | | | | | | 10,265 | | | | 28,804 | |
Current liabilities | | | | | | | | | | | | |
Trade and other payables | | | 22 | | | | 136,744 | | | | 194,158 | |
Other liabilities | | | 28 | | | | 19,146 | | | | - | |
Total current liabilities | | | | | | | 155,890 | | | | 194,158 | |
Total liabilities | | | | | | | 166,155 | | | | 222,962 | |
Total equity and liabilities | | | | | | | 563,058 | | | | 1,351,393 | |
The accompanying notes are an integral part of these consolidated financial statements
F-4
Consolidated statements of changes in equity
(in $ thousands)
| | Note | | | Share capital | | | Share premium | | | Merger reserve | | | Foreign exchange reserve | | | Other reserves | | | Accumulated losses | | | Equity attributable to the parent | | | Non- controlling interest | | | Total equity | |
Balance at December 31, 2015 | | | | | | | 6,832 | | | | 186,582 | | | | - | | | | (6,771 | ) | | | 4,109 | | | | (128,475 | ) | | | 62,277 | | | | 7,234 | | | | 69,511 | |
Changes in equity | | | | | | | | | | | | | | | | | | | | | | | | | | | | | | | | | | | | | | | | |
Issue of share capital, net of transaction costs | | | | | | | 1,012 | | | | 154,406 | | | | - | | | | - | | | | - | | | | - | | | | 155,418 | | | | - | | | | 155,418 | |
Total comprehensive loss | | | | | | | - | | | | - | | | | - | | | | (27,322 | ) | | | - | | | | (81,414 | ) | | | (108,736 | ) | | | (45 | ) | | | (108,781 | ) |
Issue of warrants | | | | | | | - | | | | - | | | | - | | | | - | | | | 409 | | | | - | | | | 409 | | | | - | | | | 409 | |
Share based payment – equity settled | | | | | | | - | | | | - | | | | - | | | | - | | | | 15,339 | | | | - | | | | 15,339 | | | | - | | | | 15,339 | |
Transactions with non- controlling interests | | | | | | | - | | | | - | | | | - | | | | 1,222 | | | | - | | | | (7,012 | ) | | | (5,790 | ) | | | (7,190 | ) | | | (12,980 | ) |
Balance at December 31, 2016 | | | | | | | 7,844 | | | | 340,988 | | | | - | | | | (32,871 | ) | | | 19,857 | | | | (216,901 | ) | | | 118,917 | | | | (1 | ) | | | 118,916 | |
Changes in equity | | | | | | | | | | | | | | | | | | | | | | | | | | | | | | | | | | | | | | | | |
Issue of share capital, net of transaction costs | | | 18 | | | | 1,454 | | | | 336,686 | | | | - | | | | - | | | | 2,161 | | | | - | | | | 340,301 | | | | - | | | | 340,301 | |
Total comprehensive Income/ (loss) | | | | | | | - | | | | - | | | | - | | | | 33,504 | | | | - | | | | (112,275 | ) | | | (78,771 | ) | | | - | | | | (78,771 | ) |
Share based payment – equity settled | | | | | | | - | | | | - | | | | - | | | | - | | | | 16,457 | | | | - | | | | 16,457 | | | | - | | | | 16,457 | |
Transactions with non- controlling interests | | | | | | | - | | | | - | | | | - | | | | - | | | | - | | | | (1 | ) | | | (1 | ) | | | 1 | | | | - | |
Balance at December 31, 2017 | | | | | | | 9,298 | | | | 677,674 | | | | - | | | | 633 | | | | 38,475 | | | | (329,177 | ) | | | 396,903 | | | | - | | | | 396,903 | |
Changes in equity | | | | | | | | | | | | | | | | | | | | | | | | | | | | | | | | | | | | | | | | |
Capital reorganization | | | | | | | 652 | | | | (677,674 | ) | | | 783,529 | | | | - | | | | - | | | | - | | | | 106,507 | | | | - | | | | 106,507 | |
Issue of share capital, net of transaction costs | | | 18 | | | | 2,044 | | | | 772,300 | | | | - | | | | - | | | | - | | | | - | | | | 774,344 | | | | - | | | | 774,344 | |
Total comprehensive (loss)/ income | | | | | | | - | | | | - | | | | - | | | | (24,142 | ) | | | 436 | | | | (155,575 | ) | | | (179,281 | ) | | | - | | | | (179,281 | ) |
Share based payment – equity settled | | | | | | | - | | | | - | | | | - | | | | - | | | | 28,563 | | | | 1,395 | | | | 29,958 | | | | - | | | | 29,958 | |
Transactions with non- controlling interests | | | | | | | - | | | | - | | | | - | | | | - | | | | - | | | | - | | | | - | | | | - | | | | - | |
Balance at December 31, 2018 | | | | | | | 11,994 | | | | 772,300 | | | | 783,529 | | | | (23,509 | ) | | | 67,474 | | | | (483,357 | ) | | | 1,128,431 | | | | - | | | | 1,128,431 | |
The accompanying notes are an integral part of these consolidated financial statements
F-5
Consolidated statements of cash flows
for the year ended December 31,
(in $ thousands)
| | Note | | | 2016 | | | 2017 | | | 2018 | |
Cash flows from operating activities | | | | | | | | | | | | | | | | |
Loss before tax | | | | | | | (81,260 | ) | | | (112,105 | ) | | | (153,417 | ) |
Adjustments for: | | | | | | | | | | | | | | | | |
Depreciation | | | 16 | | | | 2,451 | | | | 3,648 | | | | 7,338 | |
Amortization | | | 15 | | | | 4,446 | | | | 7,332 | | | | 16,199 | |
Impairment of non-current assets | | | | | | | 43 | | | | - | | | | - | |
Non-cash employee benefits expense - share based payments | | | | | | | 15,339 | | | | 16,578 | | | | 53,819 | |
Net loss on sale of non-current assets | | | | | | | 261 | | | | 42 | | | | 1,028 | |
Share of profits of associates | | | | | | | (15 | ) | | | (35 | ) | | | (33 | ) |
Net finance income | | | | | | | (204 | ) | | | (1,261 | ) | | | (19,866 | ) |
Net exchange differences | | | | | | | 2,073 | | | | 12,196 | | | | 7,621 | |
Issue of warrants | | | | | | | 409 | | | | - | | | | - | |
(Increase)/decrease in the fair value of derivatives | | | | | | | (288 | ) | | | 44 | | | | (506 | ) |
Changes in working capital | | | | | | | | | | | | | | | | |
Increase in receivables | | | | | | | (9,524 | ) | | | (598 | ) | | | (72,151 | ) |
Increase in inventories | | | | | | | (6,308 | ) | | | (35,163 | ) | | | (10,345 | ) |
Increase in payables | | | | | | | 19,463 | | | | 47,406 | | | | 57,432 | |
Changes in other assets and liabilities | | | | | | | | | | | | | | | | |
Increase in non-current receivables | | | | | | | (619 | ) | | | (3,826 | ) | | | (1,265 | ) |
Increase in other liabilities | | | | | | | 7,973 | | | | 7,365 | | | | - | |
Increase in provisions | | | | | | | - | | | | - | | | | (701 | ) |
Interest paid | | | | | | | (1,222 | ) | | | (591 | ) | | | (536 | ) |
Income taxes paid | | | | | | | (97 | ) | | | (352 | ) | | | (822 | ) |
Net cash outflow from operating activities | | | | | | | (47,079 | ) | | | (59,320 | ) | | | (116,205 | ) |
Cash flows from investing activities | | | | | | | | | | | | | | | | |
Acquisition of subsidiary, net of cash acquired | | | 5 | | | | - | | | | 195 | | | | - | |
Payments for property, plant and equipment | | | | | | | (6,012 | ) | | | (12,616 | ) | | | (21,137 | ) |
Payment for intangible assets | | | | | | | (12,586 | ) | | | (18,997 | ) | | | (50,978 | ) |
Interest received | | | | | | | 1,637 | | | | 2,833 | | | | 8,865 | |
Payment for equity investments | | | | | | | - | | | | (278 | ) | | | (288 | ) |
Net cash outflow from investing activities | | | | | | | (16,961 | ) | | | (28,863 | ) | | | (63,538 | ) |
Cash flows from financing activities | | | | | | | | | | | | | | | | |
Payment for acquisition of non-controlling interest | | | | | | | (5,028 | ) | | | - | | | | - | |
Proceeds from issue of shares, net of issue costs | | | | | | | 146,869 | | | | 322,097 | | | | 859,526 | |
Repayment of loan notes | | | 23 | | | | (47 | ) | | | (21,955 | ) | | | - | |
Proceeds from issue of loan notes, net of issue costs | | | 23 | | | | 19,379 | | | | - | | | | - | |
Net cash inflow from financing activities | | | | | | | 161,173 | | | | 300,142 | | | | 859,526 | |
Net increase in cash and cash equivalents | | | | | | | 97,133 | | | | 211,959 | | | | 679,783 | |
Cash and cash equivalents at the beginning of the financial year | | | | | | | 72,579 | | | | 150,032 | | | | 384,002 | |
Effects of exchange rate changes on cash and cash equivalents | | | | | | | (19,680 | ) | | | 22,011 | | | | (18,999 | ) |
Cash and cash equivalents at end of year | | | | | | | 150,032 | | | | 384,002 | | | | 1,044,786 | |
The accompanying notes are an integral part of these consolidated financial statements
F-6
Notes to the consolidated financial statements
Farfetch Limited (the “Company”) is an exempted company incorporated with limited liability under the Companies Law (2018 Revision) of the Cayman Islands, as amended and restated from time to time (the “Companies Law”). The principal place of business is The Bower, 211 Old Street, London, EC1V 9NR, United Kingdom. Farfetch Limited and its subsidiary undertakings (the “Group”) is principally engaged in the following:
| • | providing an online marketplace at Farfetch.com (and related suffixes) for retailers and brands to be able to offer their products for sale to the public (including associated services such as ‘production’, logistics, customer services and payment processing); |
| • | web design, build and development for retailers and brands to enable them to offer their products to the public; and |
| • | operation of the Browns London fashion boutique. |
Summary of impact of Group restructure and Initial Public Offering (IPO)
On September 21, 2018, the Company commenced trading its shares on the New York Stock Exchange. In preparation for this Initial Public Offering, “IPO” the Group was restructured. The steps to restructure the Group had the effect of Farfetch Limited being inserted above Farfetch.com Limited as the holder of the Farfetch.com Limited share capital. The reorganization transactions have been treated as a capital reorganization. In accordance with International Financial Reporting Standards, historic earnings per share calculations and the balance sheet as of December 31, 2017 have been restated retrospectively to reflect the capital structure of the new parent rather than that of the former parent, Farfetch.com Limited.
The Group is presented as if Farfetch Limited has always owned Farfetch.com Limited. The comparative statement of operations and statement of financial position are presented in line with the previously presented Farfetch.com Limited position. The comparative and current period consolidated reserves of the Group are adjusted to reflect the statutory share capital and share premium of Farfetch Limited. A merger reserve arose as a result of the restructuring of the Group and represents the difference between the equity of the acquired company (Farfetch.com Limited) and the investment by the acquiring company (Farfetch Limited).
The steps taken to restructure the Group were as follows. On September 18, 2018, all holders of warrants over Farfetch.com shares, except a holder of 189,995 warrants that remains outstanding, exercised their warrants into the applicable class of shares and the outstanding shares of Farfetch.com and were exchanged for shares of Farfetch Limited with equivalent rights. Following the exchange, the £0.10 British Pound Sterling dominated ordinary shares and the preference shares held by the shareholders of Farfetch Limited were converted into United States Dollar denominated $0.20 ordinary shares of Farfetch Limited and subsequently exchanged, one for five, for $0.04 Class A ordinary shares and Class B ordinary shares, as applicable. Outstanding options of Farfetch.com were released in exchange for the grant of options with equivalent rights over Class A ordinary shares of Farfetch Limited
These financial statements were authorized for issue on March 1, 2019.
2. | Significant accounting policies |
The consolidated financial statements of the Group have been prepared in accordance with International Financial Reporting Standards (“IFRS”) as issued by the International Accounting Standards Board (“IASB”).
The consolidated financial statements have been prepared under the historical cost convention unless otherwise stated.
F-7
Notes to the consolidated financial statements (continued)
The consolidated financial statements are presented in United States dollars (“United States Dollars” or “USD” or “$”). All values are rounded to the nearest thousand dollars, except where indicated. The tables in these notes are shown in USD thousands, except where indicated.
The consolidated financial statements provide comparative information in respect of the previous periods.
2.2. | Basis of consolidation |
The consolidated financial statements comprise the financial statements of the Group and its subsidiaries. Control is achieved when the Group is exposed, or has rights, to variable returns from its involvement with the investee and has the ability to affect those returns through its power over the investee.
Generally, there is a presumption that a majority of voting rights results in control. To support this presumption and when the Group has less than a majority of the voting or similar rights of an investee, the Group considers all relevant facts and circumstances in assessing whether it has power over an investee, including:
| • | The contractual arrangement with the other vote holders of the investee; |
| • | Rights arising from other contractual arrangements; and |
| • | The Group’s voting rights and potential voting rights. |
The Group re-assesses whether or not it controls an investee if facts and circumstances indicate that there are changes to one or more of the three elements of control. Consolidation of a subsidiary begins when the Group obtains control over the subsidiary and ceases when the Group loses control of the subsidiary. Assets, liabilities, income and expenses of a subsidiary acquired or disposed of during the year are included in the consolidated financial statements from the date the Group gains control until the date the Group ceases to control the subsidiary. Profit or loss and each component of other comprehensive income (“OCI”) are attributed to the equity holders of the parent of the Group and to the non-controlling interests. When necessary, adjustments are made to the financial statements of subsidiaries to bring their accounting policies into line with the Group’s accounting policies. All intra-group assets and liabilities, equity, income, expenses and cash flows relating to transactions between members of the Group are eliminated in full on consolidation. A change in the ownership interest of a subsidiary, without a loss of control, is accounted for as an equity transaction.
2.3. | Summary of significant accounting policies |
a) | Business combinations and goodwill |
Business combinations are accounted for using the acquisition method. The cost of an acquisition is measured as the aggregate of the consideration transferred measured at acquisition date fair value and the amount of any non-controlling interests in the acquiree. For each business combination, the Group measures the non-controlling interests in the acquiree at the proportionate share of the acquiree’s identifiable net assets.
When the Group acquires a business, it assesses the financial assets and liabilities assumed for appropriate classification and designation in accordance with the contractual terms, economic circumstances and pertinent conditions as at the acquisition date.
Any contingent consideration to be transferred by the Group is recognized at fair value at the acquisition date. Contingent consideration classified as an asset or liability that is a financial instrument and is measured at fair value with changes in fair value recognized in profit or loss.
Goodwill is initially measured at cost, being the excess of the aggregate of the consideration transferred and the amount recognized for non-controlling interests over the net identifiable assets acquired and liabilities assumed which are measured at fair value at the date of acquisition.
After initial recognition, goodwill is measured at cost less any accumulated impairment losses. For the purpose of impairment testing, goodwill acquired in a business combination is, from the acquisition date, allocated
F-8
Notes to the consolidated financial statements (continued)
to each of the Group’s cash-generating units (“CGU”) that are expected to benefit from the combination, irrespective of whether other assets or liabilities of the acquiree are assigned to those units. Annual impairment testing is performed at every reporting date being December 31. Refer to note 2.3 m) for the Group’s policy on the impairment of non-financial assets.
b) | Investment in associates |
The Group recognizes an associate when the Group has a significant influence over that entity. Significant influence is the power to participate in the financial and operating policy decisions of the investee, but is not control or joint control over those policies. The Group’s investment in its associate, Farfetch Finance Limited, is accounted for using the equity method.
Under the equity method of accounting, the investments are initially recognized at cost and adjusted thereafter to recognize the Group’s share of the post-acquisition profits or losses of the investee in profit or loss, and the Group’s share of movements in other comprehensive income of the investee in other comprehensive income.
c) | Current versus non-current classification |
The Group presents assets and liabilities in the statement of financial position based on current/non-current classification.
An asset is current when it is:
| • | Expected to be realized or intended to be sold or consumed in the normal operating cycle; |
| • | Held primarily for the purpose of trading; |
| • | Expected to be realized within twelve months after the reporting period; or |
| • | Cash or cash equivalent unless restricted from being exchanged or used to settle a liability for at least twelve months after the reporting period. |
All other assets are classified as non-current.
A liability is current when:
| • | It is expected to be settled in the normal operating cycle; |
| • | It is held primarily for the purpose of trading; |
| • | It is due to be settled within twelve months after the reporting period; or |
| • | There is no unconditional right to defer the settlement of the liability for at least twelve months after the reporting period. |
The Group classifies all other liabilities as non-current.
This section outlines the Group policies applicable to financial instruments that are recognized and measured at fair value in the financial statements.
Fair value is the price that would be received to sell an asset or paid to transfer a liability in an orderly transaction between market participants at the measurement date. The fair value measurement is based on the presumption that the transaction to sell the asset or transfer the liability takes place either:
| • | In the principal market for the asset or liability; or |
| • | In the absence of a principal market, in the most advantageous market for the asset or liability. |
F-9
Notes to the consolidated financial statements (continued)
The principal or the most advantageous market must be accessible by the Group.
The fair value of an asset or a liability is measured using the assumptions that market participants would use when pricing the asset or liability, assuming that market participants act in their economic best interest.
The Group uses valuation techniques that are appropriate in the circumstances and for which sufficient data is available to measure fair value, maximizing the use of relevant observable inputs and minimizing the use of unobservable inputs.
All assets and liabilities for which fair value is measured or disclosed in the financial statements are categorized within the fair value hierarchy, described as follows, based on the lowest level input that is significant to the fair value measurement as a whole:
| • | Level 1: Quoted (unadjusted) market prices in active markets for identical assets or liabilities |
| • | Level 2: Valuation techniques for which the lowest level input that is significant to the fair value measurement is directly or indirectly observable |
| • | Level 3: Valuation techniques for which the lowest level input that is significant to the fair value measurement is unobservable |
For assets and liabilities that are recognized in the financial statements on a recurring basis, the Group determines whether transfers have occurred between levels in the hierarchy by re-assessing categorization (based on the lowest level input that is significant to the fair value measurement as a whole) at the end of each reporting period.
Revenue is recognized in accordance with the five-step model under IFRS 15, which was early adopted by the Group on January 1, 2017 on a fully retrospective basis:
| 1. | identifying the contracts with customers; |
| 2. | identifying the separate performance obligations; |
| 3. | determining the transaction price; |
| 4. | allocating the transaction price to the separate performance obligations; and |
| 5. | recognizing revenue when each performance obligation is satisfied. |
Retailing of goods
Revenue, where the Group acts as a principal, is recognized when the performance obligation is satisfied which is when the goods are received by the customer. Included within sales of goods is a provision for expected returns, discounts and rebates. Where these are not known, the Group uses historical data and patterns to calculate an estimate.
Rendering of services
The Group primarily acts as a commercial intermediary between sellers, being the brands and boutiques, and end consumers and earns a commission for this service.
For these arrangements, the sellers determine the transaction price of the goods sold on the website, being the purchase price paid by the consumer, with the Group acting as an agent for the sellers and the related revenue is recognized on a net basis. The Group also charges fees to sellers for activities related to providing this service, such as packaging, credit card processing, settlement of duties, and other transaction processing activities. These activities are not considered separate promises to the customer, and the related fees are therefore recognized concurrently with commissions at the time the performance obligation to facilitate the transaction between the seller
F-10
Notes to the consolidated financial statements (continued)
and end consumer is satisfied, which is when the goods are dispatched to the end consumer by the seller. A provision is made for commissions that would be refunded if the end consumer returns the goods, and the Group uses historical data and patterns to estimate its return provision. There are no significant payment terms with the Group taking payment in full from the consumer’s chosen payment method at the time the goods are dispatched by the seller.
The Group also provides delivery services to end consumers, with the Group setting the transaction price, for goods purchased on its platform. For these services, the Group acts as the principal and recognizes as revenue amounts charged to end consumers net of any promotional incentives and discounts. Revenue for these services is recognized on delivery of goods to the end consumer, which represents the point in time at which the Group’s performance obligation is satisfied. No provision for returns is made as delivery revenue is not subject to refund. Promotional incentives, which include basket promo-code discounts, may periodically be offered to end consumers. These are treated as a deduction to revenue. Cash is collected by the Group from the end consumer using payment service providers. Within two months of the transactions, this is remitted to the relevant seller (net of commission and recoveries). Such amounts are presented within trade and other payables, unless the relevant seller is in a net receivable position and is therefore classified within trade and other receivables.
f) | Current and deferred tax |
Current tax is the expected tax payable based on the taxable profit for the period, and the tax laws that have been enacted or substantively enacted by the reporting date. Management periodically evaluates positions taken in tax returns with respect to situations in which applicable tax regulation is subject to interpretation. It establishes provisions where appropriate on the basis of amounts expected to be paid to the tax authorities.
Deferred tax is recognized on differences between the carrying amounts of assets and liabilities in the financial statements and the corresponding tax bases used in the computation of taxable profit, and is accounted for using the balance sheet liability method. Deferred tax liabilities are generally recognized for all taxable temporary differences and deferred tax assets are recognized to the extent that it is probable that taxable profits will be available against which deductible temporary differences can be utilized. Such assets and liabilities are not recognized if the temporary difference arises from goodwill or from the initial recognition (other than in a business combination) of other assets and liabilities in a transaction that affects neither the tax profit nor the accounting profit. Current and deferred tax is charged or credited in the statement of operations, except when it relates to items charged or credited directly to equity, in which case the current or deferred tax is also recognized directly in equity.
The carrying amount of deferred tax assets is reviewed at each reporting date and reduced to the extent that it is no longer probable that sufficient taxable profits will be available to allow all or part of the asset to be recovered. Deferred tax is calculated at the tax rates and in accordance with laws that are expected to apply in the period/jurisdiction when/where the liability is settled or the asset is realized.
Deferred tax assets and liabilities are offset where there is a legally enforceable right to offset current tax assets against current tax liabilities and when the deferred tax assets and liabilities relate to income taxes levied by the same taxation authority on either the taxable entity or different taxable entities and where there is an intention to settle the balances on a net basis.
The Group’s consolidated financial statements are presented in United States Dollars. For each entity the Group determines the functional currency and items included in the financial statements of each entity are measured using that functional currency. The functional currency of the Company is United States Dollars.
h) | Foreign currency translation |
Transactions in foreign currencies are initially recorded by the Group’s entities at their respective functional currency spot rates at the date the transaction first qualifies for recognition. Monetary assets and liabilities
F-11
Notes to the consolidated financial statements (continued)
denominated in foreign currencies are translated at the functional currency spot rates of exchange at the reporting date. Differences arising on settlement or translation of monetary items are recognized in profit or loss.
Non-monetary items that are measured in terms of historical cost in a foreign currency are translated using the exchange rates at the dates of the initial transactions. Non-monetary items measured at fair value in a foreign currency are translated using the exchange rates at the date when the fair value is determined. The gain or loss arising on translation of non-monetary items measured at fair value is treated in line with the recognition of the gain or loss on the change in fair value of the item (i.e., translation differences on items whose fair value gain or loss is recognized in OCI or profit or loss are also recognized in OCI or profit or loss, respectively).
On consolidation, the assets and liabilities of foreign operations are translated into United States Dollars at the rate of exchange prevailing at the reporting date and their statements of profit or loss are translated at average exchange rates. The exchange differences arising on translation for consolidation are recognized in OCI.
i) | Property, plant and equipment |
Property, plant and equipment is stated at cost, net of accumulated depreciation and accumulated impairment losses, if any. All repair and maintenance costs are recognized in profit or loss as incurred.
Items of property, plant and equipment are depreciated with an expense recognized in depreciation and amortization expense on a straight-line basis over their useful life.
The useful lives of these items are assessed as follows:
Leasehold improvements | | Over the life of the lease |
Fixtures and fittings | | Three to ten years |
Motor vehicles | | Four to eight years |
Computer equipment | | Three to ten years |
The residual values, useful lives and methods of depreciation of property, plant and equipment are reviewed at each financial year end and adjusted prospectively, if appropriate.
The determination of whether an arrangement is (or contains) a lease is based on the substance of the arrangement at the inception of the lease. The arrangement is, or contains, a lease if fulfilment of the arrangement is dependent on the use of a specific asset or assets and the arrangement conveys a right to use the asset or assets, even if that right is not explicitly specified in an arrangement.
Intangible assets acquired separately are measured on initial recognition at cost. The cost of intangible assets acquired in a business combination is their fair value at the date of acquisition. Following initial recognition, intangible assets are carried at cost less any accumulated amortization and accumulated impairment losses. Internally generated intangibles, excluding capitalized development costs, are not capitalized and the related expenditure is reflected in profit or loss in the period in which the expenditure is incurred. The useful lives of intangible assets are assessed as either finite or indefinite.
Intangible assets with finite lives are amortized over the useful economic life and assessed for impairment whenever there is an indication that the intangible asset may be impaired. The amortization period and the amortization method for an intangible asset with a finite useful life are reviewed at least at the end of each reporting period. Changes in the expected useful life or the expected pattern of consumption of future economic benefits embodied in the asset are considered to modify the amortization period or method, as appropriate, and are treated as changes in accounting estimates. The amortization expense on intangible assets with finite lives is recognized in the statement of operations in the expense category that is consistent with the function of the intangible assets. Other than goodwill, there are no intangible assets with indefinite useful lives.
F-12
Notes to the consolidated financial statements (continued)
Goodwill is not amortized but is reviewed for impairment at least annually. For the purpose of impairment testing, goodwill is allocated to the relevant CGUs which are tested for impairment annually. If the recoverable amount of the cash-generating unit is less than the carrying amount of the unit, the impairment loss is allocated first to reduce the carrying amount of any goodwill allocated to the unit and then to the other assets of the unit pro-rata on the basis of the carrying amount of each asset in the unit. On disposal of a cash-generating unit, the attributable amount of goodwill is included in the determination of the profit or loss on disposal. Refer to note 2.3 m) for the Group’s policy on the impairment of non-financial assets.
Research and development costs
Research costs are expensed as incurred. Development expenditures on an individual project are recognized as an intangible asset when the Group can demonstrate:
| • | The technical feasibility of completing the intangible asset so that the asset will be available for use or sale; |
| • | Its intention to complete and its ability and intention to use or sell the asset; |
| • | How the asset will generate future economic benefits; |
| • | The availability of resources to complete the asset; and |
| • | The ability to measure reliably the expenditure during development. |
Following initial recognition of the development expenditure as an asset, the asset is carried at cost less any accumulated amortization and accumulated impairment losses. Amortization of the asset begins when development is complete and the asset is available for use. It is amortized over the period of expected future benefit. Amortization is recorded in administrative expenses. Development intangible assets under the course of construction are tested for impairment annually or more frequently if events or changes in circumstance indicate that they might be impaired. Once placed into service the asset is tested for impairment whenever events or changes in circumstance indicate that the carrying amount may not be recoverable.
Subsequent costs
Subsequent costs are only capitalized when there is an increase in the anticipated future economic benefit attributable to the assets in question. All other subsequent costs are recorded in the statement of operations for the year in which they are incurred.
Amortization
Amortization is charged to depreciation and amortization expense on a straight-line basis over the estimated useful life of the intangible assets, from the time that the assets are available for use. The useful lives of these items are assessed as follows:
Development costs | | Three years |
Brand, trademarks & domain names | | Five to ten years |
Customer relationships | | Three to five years |
Inventories are carried at the lower of cost and the net realizable value based on market performance, including the relative ancillary selling costs. The cost of inventories, calculated according to the weighted average cost method for each category of goods, includes purchase costs and costs incurred to bring the inventories to their present location and condition. In order to represent the value of inventories appropriately in the statement of financial position, and to take into account impairment losses due to obsolete materials and slow inventory movement, obsolescence provisions have been directly deducted from the carrying amount of the inventories.
F-13
Notes to the consolidated financial statements (continued)
l) | Financial instruments—initial recognition and subsequent measurement |
A financial instrument is any contract that gives rise to a financial asset of one entity and a financial liability or equity instrument of another entity.
Financial assets
The Groups financial assets comprise cash and cash equivalents, receivables and derivative financial instruments. Derivative financial instruments are comprised of forward exchange contracts, which are measured at fair value through profit or loss, unless they are formally designated and measured as cash flow hedges.
Trade receivables are generally accounted for at amortized cost. The Group assesses on a forward looking basis the expected credit losses associated with its debt instruments carried at amortised cost.
Financial assets through profit or loss are measured initially at fair value with transaction costs taken directly to the consolidated statement of operations. Subsequently, the financial assets are remeasured, and gains and losses are recognized in the consolidated statement of operations.
Financial liabilities
The Group’s financial liabilities comprise trade and other payables, interest bearing loans and borrowings, contingent consideration and foreign exchange contracts.
Trade and other payables are held at amortized cost.
All interest bearing loans and borrowings are initially recognized at fair value net of issue costs associated with the borrowing. After initial recognition, interest bearing loans and borrowings are subsequently measured at amortized cost using the effective interest rate method.
Contingent consideration and foreign exchange contracts are measured initially at fair value through profit or loss with transaction costs taken directly to the consolidated statement of operations. Subsequently, the fair values are remeasured and gains and losses from changes therein are recognized in the consolidated statement of operations.
Derivatives and hedging activities
Derivatives are initially recognized at fair value on the date a derivative contract is entered into and are subsequently remeasured to their fair value at the end of each reporting period.
Where the derivative is not designated as a hedge, subsequent changes in the fair value are recognized in profit or loss. Such derivatives are classified as a current asset or liability.
The group designates certain derivatives as cash flow hedges to hedge particular risks associated with the cash flows of recognized assets and liabilities and highly probable forecast transactions.
At inception of the hedge relationship, the Group documents the economic relationship between hedging instruments and hedged items including whether changes in the cash flows of the hedging instruments are expected to offset changes in the cash flows of hedged items. The Group documents its risk management objective and strategy for undertaking its hedge transactions. Currently the Group has only designated cash flow hedges.
The effective portion of changes in the fair value of derivatives that are designated and qualify as cash flow hedges is recognized in the cash flow hedge reserve within equity. The gain or loss relating to the ineffective portion is recognized immediately in profit or loss.
When a hedging instrument matures, any gains or losses held in the cash flow hedge reserve are recycled to profit or loss.
F-14
Notes to the consolidated financial statements (continued)
If the a hedge no longer meets the criteria for hedge accounting, or the forecast transaction is no longer likely to occur, the cumulative gain or loss reported in equity is immediately reclassified to profit or loss.
m) | Impairment of non-financial assets |
The Group assesses, at each reporting date, whether there is an indication that an asset may be impaired. If any indication exists, or when annual impairment testing for an asset is required, the Group estimates the asset’s recoverable amount. An asset’s recoverable amount is the higher of an asset’s or CGU’s fair value less costs of disposal and its value in use. The recoverable amount is determined for an individual asset, unless the asset does not generate cash inflows that are largely independent of those from other assets or groups of assets. When the carrying amount of an asset or CGU exceeds its recoverable amount, the asset is considered impaired and is written down to its recoverable amount.
In assessing value in use, the estimated future cash flows are discounted to their present value using a pre-tax discount rate that reflects current market assessments of the time value of money and the risks specific to the asset. In determining fair value less costs of disposal, recent market transactions are taken into account.
The Group bases its impairment calculation on detailed budgets which are prepared separately for each of the Group’s CGUs to which the individual assets are allocated. These budgets and forecast calculations cover a period of five years. Impairment losses of continuing operations, are recognized in the statement of operations in expense categories consistent with the function of the impaired asset.
For assets excluding goodwill, an assessment is made at each reporting date to determine whether there is an indication that previously recognized impairment losses no longer exist or have decreased. If such indication exists, the Group estimates the asset’s or CGU’s recoverable amount.
Goodwill and intangible assets are tested for impairment annually as at December 31 and when circumstances indicate that the carrying value may be impaired. Impairment is determined for goodwill by assessing the recoverable amount of each CGU (or group of CGUs) to which the goodwill relates. When the recoverable amount of the CGU is less than its carrying amount, an impairment loss is recognized. Impairment losses relating to goodwill cannot be reversed in future periods.
Provisions are recognized when the Group has a present obligation (legal or constructive) as a result of a past event, it is probable that an outflow of resources embodying economic benefits will be required to settle the obligation and a reliable estimate can be made of the amount of the obligation.
Employees (including senior executives) of the Group receive remuneration in the form of share based payments, whereby employees render services as consideration. The consideration is either equity or cash settled depending on the scheme.
Equity-settled transactions
The cost of equity-settled transactions is determined by the fair value at the date when the grant is made using an appropriate valuation model. That cost is recognized, together with a corresponding increase in other capital reserves in equity, over the period in which the performance and/or service conditions are fulfilled in employee benefits expense. The cumulative expense recognized for equity-settled transactions at each reporting date until the vesting date reflects the extent to which the vesting period has expired and the Group’s best estimate of the number of equity instruments that will ultimately vest. The statement of operations expense or credit for a period represents the movement in cumulative expense recognized as at the beginning and end of that period.
No expense is recognized for awards that do not ultimately vest.
F-15
Notes to the consolidated financial statements (continued)
Cash-settled transactions
For cash-settled share-based payments, a liability is recognized for the goods or services acquired, measured initially at the fair value of the liability. At each balance sheet date until the liability is settled, and at the date of settlement, the fair value of the liability is remeasured, with any changes in fair value recognized in profit or loss for the year.
Employment related taxes
Where the Group has an obligation to settle employment related taxes on share based payments received by employees, these are provided for based on the intrinsic value of the vested share options at the end of the reporting period.
p) | Cash and cash equivalents |
For the purpose of presentation in the statement of cash flows, cash and cash equivalents includes cash on hand, deposits held at call with financial institutions, other short-term, highly liquid investments with original maturities of three months or less that are readily convertible to known amounts of cash and which are subject to an insignificant risk of changes in value, and bank overdrafts.
As of December 31, 2018 the Group’s cash and cash equivalents balance consists of $49,935,000 of cash held in banks (2017: $38,904,000) and $994,851,000 of cash equivalents (2017: $345,098,000). Cash and cash equivalent consists of $739,330,000 money market funds (2017: $274,971,000), $225,209,000 of short-term deposits (2017: $45,415,000) and $30,312,000 held by payment service providers ($24,712,000). The Group has classified amounts held in money market funds as cash equivalents because those funds are short term in nature, highly liquid, readily convertible to known amounts of cash, and subject to an insignificant risk of changes in value. The Group has determined this classification is appropriate because each of these EU-regulated funds are valued on a Constant Net Asset Value basis and have the highest credit rating available.
2.4. | Changes in accounting policies and disclosures |
Amendments to IFRSs that are mandatorily effective for the current year
In the year ended December 31, 2018, the Group has applied the below amendments to IFRSs issued by the IASB that are mandatorily effective for an accounting period that began on or after January 1, 2018. Their adoption has not had any material impact on the disclosures or on the amounts reported in these financial statements.
IFRS 9 Financial Instruments | | The Group has adopted IFRS 9 for the first time in the current year. The application of the standard has had no material impact on the Group’s consolidated financial statements. Due to the nature of the Group’s financial assets and liabilities there has been no material changes to the Group’s accounting policies as a result of adopting IFRS 9. |
| |
IFRS 2 (amendments) Classification and Measurement of Share-based Payment Transactions | | The Group has adopted the amendments to IFRS 2 for the first time in the current year. The amendments address the measurement of cash-settled share-based payments, the classification of share-based payments settled net of tax withholdings, and the accounting for a modification of a share-based payment from cash-settled to equity-settled. The application of these amendments has had no impact on the Group’s consolidated financial statements. |
New and revised IFRSs in issue but not yet effective
At the date of authorization of these financial statements, the Group has not applied the following new and revised IFRSs that have been issued but are not yet effective:
IFRS 16 | | Leases (effective January 1, 2019) |
F-16
Notes to the consolidated financial statements (continued)
IFRS 16 was issued in January 2016. It will result in almost all leases being recognized on the balance sheet by lessees as the distinction between operating and finance leases is removed. Under the new standard, an asset (the right to use the leased item) and a financial liability to pay rentals are recognized. The only exceptions are short-term and low-value leases.
The Group has set up a project team which has reviewed all of the Group’s leasing arrangements over the last year in light of the new lease accounting rules in IFRS 16. The standard will affect primarily the accounting for the Group’s operating leases. The Group does not act as a lessor and therefore no impact is expected in relation to lessor accounting.
As at the reporting date, the Group has non-cancellable operating lease commitments of $103,034,000, see note 26. The Group expects to recognize right-of-use assets of approximately $75,908,000 on 1 January 2019, and lease liabilities of $77,385,000 (after adjustments for prepayments and accrued lease payments recognized as at 31 December 2018).
The Group will apply the standard from its mandatory adoption date of 1 January 2019. The Group intends to apply the modified retrospective transition approach and will not restate comparative amounts for the year prior to first-time adoption. All right-of-use assets will be measured at the amount of the lease liability on adoption (adjusted for any prepaid or accrued lease expenses).
3. | Critical accounting judgments and key sources of estimation uncertainty |
The preparation of the Group’s consolidated financial statements requires management to make judgments, estimates and assumptions that affect the reported amounts of revenues, expenses, assets and liabilities, and the accompanying disclosures, and the disclosure of contingent liabilities. Uncertainty about these assumptions and estimates could result in outcomes that require a material adjustment to the carrying amount of assets or liabilities affected in future periods.
Below is a summary of the critical measurement processes and the key assumptions used by management in applying accounting policies with regard to the future, and which could have significant effects on carrying amounts stated in the consolidated financial statements, or for which there is a risk that significant adjustments may be made to the carrying amount of assets and liabilities in subsequent years.
Critical judgements in applying group accounting policies
Intangible assets—development costs
a) Cost capitalization
Amounts capitalized include the total cost of any external products or services and internal labor costs directly attributable to the development of the asset. Management judgment is involved in determining the appropriate internal costs to capitalize and the amounts involved.
b) Useful life
The useful life is determined by management at the time the asset is brought into its intended use and is regularly reviewed for appropriateness. The useful life represents management’s view of the expected period over which the Group will receive benefits.
Recognition of a deferred tax asset
The Group has accumulated significant unutilized trading tax losses (note 25). A deferred tax asset in respect of these losses can only be recognized when it is probable that future taxable profits will be available to utilize these against. No net deferred tax asset has been recognized in respect of these trading losses because there is uncertainty on the timing of future profitability in the near future. The Group reviews this assessment on an annual basis.
F-17
Notes to the consolidated financial statements (continued)
Key sources of estimation uncertainty
Impairment of non-financial assets
Impairment exists when the carrying value of an asset CGU exceeds its recoverable amount, which is the higher of its fair value less costs of disposal and its value in use. The fair value less costs of disposal calculation is based on available data from binding sales transactions, conducted at arm’s length, for similar assets or observable market prices less incremental costs for disposing of the asset. The value in use calculation is based on a discounted cash flow (“DCF”) model. The cash flows are derived from the budget for the next five years. The recoverable amount is sensitive to the discount rate used for the DCF model as well as the expected future cash inflows and outflows and the growth rate used for extrapolation purposes. These estimates are most relevant to goodwill recognized by the Group.
Share based payments
Estimating the fair value of share options requires the determination of the most appropriate valuation model, which is dependent on the terms and conditions of the grant. The Group uses the Black Scholes Valuation Model to estimate the fair value of each grant. This estimate also requires determination of the most appropriate inputs to the valuation model including the expected life of the share option, volatility and dividend yield. These inputs, and the volatility assumption in particular, are considered to be highly complex and subjective. Because the Group’s shares have been publicly traded for a short period of time, it lacks sufficient company-specific historical and implied volatility information for its shares. Therefore, it estimates expected share price volatility based on the historical volatility of publicly traded peer companies and expects to continue to do so until such time as it has adequate historical data regarding the volatility of its own traded share price. .
Inventory provisions
Inventory is carried at the lower of cost and net realizable value which requires an estimation of the products’ future selling prices. Judgment is required in determining any write-down for slow-moving or obsolete inventory.
Revenue by type of good or service
| | 2016 | | | 2017 | | | 2018 | |
In-store revenue | | | 12,668 | | | | 15,434 | | | | 15,595 | |
Platform services revenue | | | 180,937 | | | | 296,350 | | | | 488,995 | |
Platform fulfilment revenue | | | 48,511 | | | | 74,182 | | | | 97,794 | |
| | | 242,116 | | | | 385,966 | | | | 602,384 | |
In-store
The Group has a single performance obligation in respect in-store revenue, which is the sale of finished goods.
Platform services
Within platform services, the Group primarily acts as a commercial intermediary between sellers and end consumers and earns a commission for this service. Commission revenue is recognized on a net basis in the statement of operations because the Group acts as an agent in these arrangements. Revenue in relation to these obligations within Platform Services Revenue which have not been satisfied at the end of the reporting period is $1,651,000 (2017: 1,067,000, 2016: $330,000) and is expected to be recognized in under 90 days from the end of the reporting period. In 2018, $1,067,000 (2017: $330,000, 2016: $165,000) of revenue deferred in 2017 (2016, 2015) was recognized as revenue.
F-18
Notes to the consolidated financial statements (continued)
In other arrangements, the Group sells its own goods on the platform where the Group is the principal, and therefore related revenues are recognized on a gross basis. Revenue on the sale of these goods is recognized when the goods are received by the end consumer. For finished goods that have been ordered on the platform but not yet delivered to the end consumer at the end of the reporting period, revenue is deferred until delivery. At December 31, 2018, these deferred amounts were $2,015,000 (2017: $1,135,000, 2016: $741,000), which the Group expects to recognize within 30 days of period end. In 2018, $1,135,000 (2017: $741,000, 2016: $nil) of revenue deferred in 2017 (2016, 2015) was recognized as revenue.
Platform service revenue also includes fees charged to sellers for other activities, such as packaging, credit card processing, and other transaction processing activities.
At checkout, end consumers are charged for delivery, if applicable, in addition to the price of goods in their basket (refer to Platform fulfilment below for a discussion of delivery services). The Group is responsible for the collection of cash from end consumers with payment typically taken in advance of completing its performance obligations.
In arrangements where the Group acts as an agent, cash collections are remitted net to the sellers generally within two months of collection.
Platform fulfilment
The Group also provides delivery services for products sold on the platform, for which revenues are recognized when the products are delivered to the end consumers. Revenues for delivery services are stated net of promotional incentives and discounts. Platform fulfilment revenue also includes fees charged to sellers for the settlement of duties which are recognized concurrently with commissions.
As discussed above, the promise with respect to delivery services is satisfied only when the goods are delivered. Within Platform Fulfilment Revenue, where the delivery performance obligation has not been satisfied at the end of the reporting period, revenue of $479,000 (2017: $436,000, 2016: $407,000) has been deferred and is expected to be recognized in under 90 days from the end of the reporting period. The transaction price for this performance obligation is the delivery costs charged to the consumer as described above. In 2018 $436,000 (2017: $407,000, 2016: $153,000) of revenue deferred in 2017 (2016, 2015) was recognized as revenue.
There were no receivables from contracts with customers (2016 and 2017: none).
Further detail can be found in note 2.3 e) to the financial statements.
Acquisition in 2016
There were no business combinations in 2016.
Acquisitions in 2017
Fashion Concierge UK Limited
On October 31, 2017, Farfetch UK Limited, a wholly owned subsidiary of the Parent, acquired 100% of the issued share capital of Fashion Concierge UK Limited and its subsidiary F&C Fashion Concierge, LDA (“Fashion Concierge UK Limited”). The primary reason for the acquisition is for the Group to enhance its private client offering. Details of the purchase consideration, the net assets acquired and goodwill are as follows:
| | 2017 | |
Purchase consideration | | | | |
Ordinary shares issued | | | 2,183 | |
Total purchase consideration | | | 2,183 | |
F-19
Notes to the consolidated financial statements (continued)
The fair value of the 45,000 shares issued as 100% of the consideration paid for Fashion Concierge UK Limited ($2,183,000) was estimated based upon the Company’s most recent funding round as of the date of the acquisition.
Net cash inflow arising on acquisition
| | 2017 | |
Cash and cash equivalent balances acquired | | | 195 | |
Cash consideration | | | - | |
Net cash inflow | | | 195 | |
The ordinary shares issued are non-cash investing activities
The Group recognized the following assets and liabilities upon the Fashion Concierge UK Limited acquisition:
| | 2017 | |
Intangible assets | | | 1 | |
Tangible assets | | | 4 | |
Trade receivables | | | 301 | |
Cash and cash equivalents | | | 195 | |
Trade payables | | | (1,341 | ) |
Total net identified liabilities acquired | | | (840 | ) |
Goodwill | | | 3,023 | |
Total goodwill acquired | | | 3,023 | |
Net assets acquired | | | 2,183 | |
The goodwill represents the synergies that Farfetch is expected to generate.
Revenues and profit contribution
The results of operations for each of the acquisitions have been included in the Group’s consolidated statements of operations since the respective dates of acquisitions. Actual and pro forma revenue and results of operations for the acquisitions have not been presented because they do not have a material impact to the consolidated revenue and results of operations, either individually or in aggregate.
Acquisition related costs
Acquisition-related costs of $123,000 are included in selling, general and administrative expenses.
F-20
Notes to the consolidated financial statements (continued)
Style.com
On June 12, 2017, Farfetch UK Limited, a wholly owned subsidiary of the Parent, acquired 100% of the business of Style.com, a luxury e-commerce retailer, from Conde Nast. The primary reason for the acquisition was for the Group to leverage customer relationships, the Style.com domain name authority and content to enhance the Group’s marketplace business. Details of the purchase consideration, the assets acquired and goodwill are as follows:
| | 2017 | |
Purchase consideration | | | | |
Ordinary shares issued | | | 12,411 | |
Total purchase consideration | | | 12,411 | |
The fair value of the 258,265 shares issued as 100% of the consideration paid for Style.com Limited ($12,411,000) was estimated based upon the Company’s most recent funding round as of the date of the acquisition. The ordinary shares issued are non-cash investing activities.
The Group recognized the following assets and liabilities upon acquisition:
| | 2017 | |
Inventories | | | 1,856 | |
Total net identified assets acquired | | | 1,856 | |
Goodwill | | | 7,050 | |
Customer relationships | | | 1,178 | |
Trademarks and domain name | | | 3,046 | |
Deferred tax liability | | | (719 | ) |
Total goodwill and identifiable intangible assets acquired | | | 10,555 | |
Net assets acquired | | | 12,411 | |
The trademarks and domain name are amortized over ten years and the customer relationships are amortized over three years.
The goodwill is attributable to the Style.com reputation and the expected synergies and efficiencies generated by the business combination. It will not be deductible for tax purposes.
There was no cashflow impact with purchase consideration being the issue of shares and there being no cash acquired.
Acquisition related costs
Acquisition-related costs of $557,000 are included in selling, general and administrative expenses.
The results of operations for each of the acquisitions have been included in the Group’s consolidated statements of operations since the respective dates of acquisitions. Actual and pro forma revenue and results of operations for the acquisitions have not been presented because they do not have a material impact to the consolidated revenue and results of operations, either individually or in aggregate.
Acquisitions in 2018
There were no business combinations in 2018.
F-21
Notes to the consolidated financial statements (continued)
6. | Segmental and geographical information |
The Group has identified four operating segments. This assessment is based on information reported to the Group’s Chief Executive for the purpose of assessing segmental performance and resource allocation.
These are the Marketplace (which operates the Farfetch.com marketplace website and app), Farfetch Black & White Solutions (a white label website solution for luxury brands), Stores (operation of the Browns luxury boutiques) and Store of the Future (provision of technology solutions to retail outlets). The Marketplace represents over 90% of the Group’s revenue, results and assets. As such the Group has presented only one reportable segment.
Geographical information
The Group operates a platform that connects retailers and brands, which provide supply, with consumers, who provide demand. Therefore, the Group believes it is relevant to disclose geographical revenue information on both a supply basis, determined by location of the Farfetch contracting entity, and on a demand basis, determined by location of consumer.
The Group’s UK revenue, based on location of the Farfetch contracting entity, was $492,495,000 (2017: $335,345,000, 2016: $208,857,000).
The Group’s revenue from external customers, based on consumer ship-to location, and information about its segment assets by geographical location are detailed below:
| | 2016 | | | 2017 | | | 2018 | |
Revenue from external customers | | | | | | | | | | | | |
Americas | | | 77,608 | | | | 111,349 | | | | 175,060 | |
Europe, Middle East and Africa | | | 92,885 | | | | 156,507 | | | | 240,662 | |
Asia Pacific | | | 71,623 | | | | 118,110 | | | | 186,662 | |
| | | 242,116 | | | | 385,966 | | | | 602,384 | |
| | 2017 | | | 2018 | |
Non-current assets | | | | | | | | |
Americas | | | 4,046 | | | | 6,089 | |
United Kingdom | | | 53,594 | | | | 118,374 | |
Europe, Middle East and Africa | | | 45,596 | | | | 21,500 | |
Asia Pacific | | | 7,030 | | | | 6,020 | |
| | | 110,266 | | | | 151,983 | |
For the year ended December 31, 2018, the Group revised its methodology for determining the geographical location of revenue from being based on customer shipping location to customer billing location. In addition, the Group previously disclosed first-party sales based on the location of the seller. The Group has revised this to being based on the customer billing location which is consistent with third-party based sales. Revenue by geographical location for the year ended December 31, 2016 and 2017 has been revised to reflect this change in methodology.
No single customer amounted for more than 10% of Group revenues (2017: none, 2016: none).
F-22
Notes to the consolidated financial statements (continued)
7. | Employees and directors |
| | 2016 | | | 2017 | | | 2018 | |
Wages and salaries | | | 60,455 | | | | 88,164 | | | | 140,298 | |
Social security costs | | | 9,626 | | | | 12,783 | | | | 24,976 | |
Other pension costs | | | 360 | | | | 898 | | | | 1,391 | |
Share based payments (equity settled) | | | 17,256 | | | | 16,667 | | | | 34,668 | |
Share based payments (cash settled) | | | 1,178 | | | | 3,807 | | | | 10,355 | |
Share based payments (employment related taxes) | | | 1,414 | | | | 1,012 | | | | 8,796 | |
| | | 90,289 | | | | 123,331 | | | | 220,484 | |
8. | Selling, general and administrative expenses |
Included within selling, general and administrative expenses are:
| | 2016 | | | 2017 | | | 2018 | |
Demand generation expenses | | | 48,381 | | | | 69,202 | | | | 97,295 | |
Technology | | | 12,269 | | | | 31,611 | | | | 68,224 | |
Depreciation and amortization | | | 6,897 | | | | 10,980 | | | | 23,537 | |
Share based payments | | | 19,848 | | | | 21,486 | | | | 53,819 | |
9. | Finance income and costs |
| | 2016 | | | 2017 | | | 2018 | |
Unrealised exchange gains | | | 7,643 | | | | - | | | | 9,143 | |
Deposit account interest | | | 1,359 | | | | 2,510 | | | | 6,859 | |
Other interest income | | | 278 | | | | 323 | | | | 4,401 | |
Finance income | | | 9,280 | | | | 2,833 | | | | 20,403 | |
Unrealised exchange losses | | | - | | | | (18,902 | ) | | | - | |
Interest on borrowings | | | (1,473 | ) | | | (1,572 | ) | | | - | |
Other interest expense | | | (29 | ) | | | (1 | ) | | | (537 | ) |
Warrants issued | | | (376 | ) | | | - | | | | | |
Finance costs | | | (1,878 | ) | | | (20,475 | ) | | | (537 | ) |
Net finance income/ (costs) | | | 7,402 | | | | (17,642 | ) | | | 19,866 | |
Loss before tax items include:
| | Note | | | 2016 | | | 2017 | | | 2018 | |
Employee benefits | | | 7 | | | | 90,289 | | | | 123,331 | | | | 220,484 | |
Operating leases | | | | | | | 12,322 | | | | 18,162 | | | | 19,244 | |
Research and development costs expensed | | | | | | | 4,972 | | | | 5,102 | | | | 12,455 | |
Loss on disposal of non-current assets | | | | | | | 261 | | | | 42 | | | | 1,028 | |
Depreciation—Property, plant & equipment (note 16) | | | | | | | 2,451 | | | | 3,648 | | | | 7,338 | |
Amortization—Intangible assets (note 15) | | | | | | | 4,446 | | | | 7,332 | | | | 16,199 | |
Auditors’ remuneration | | | | | | | 411 | | | | 1,095 | | | | 2,152 | |
F-23
Notes to the consolidated financial statements (continued)
| | 2016 | | | 2017 | | | 2018 | |
Current tax: | | | | | | | | | | | | |
Corporate tax | | | 182 | | | | 805 | | | | 2,208 | |
Prior year adjustments | | | 17 | | | | 132 | | | | (50 | ) |
Total current tax | | | 199 | | | | 937 | | | | 2,158 | |
Total deferred tax | | | - | | | | (767 | ) | | | - | |
Income tax expense | | | 199 | | | | 170 | | | | 2,158 | |
b) | Reconciliation of income tax expense to tax payable |
The tax on the Group’s loss before tax differs from the theoretical amount that would arise using the weighted average tax rate applicable to profit of the consolidated entities as follows:
| | 2016 | | | 2017 | | | 2018 | |
Loss before tax | | | (81,260 | ) | | | (112,105 | ) | | | (153,417 | ) |
Tax at the UK tax rate of 19.00% (2017: 19.25%, 2016: 20.00%) | | | (16,252 | ) | | | (21,580 | ) | | | (29,149 | ) |
Tax effects of: | | | | | | | | | | | | |
Impairment of intangible assets | | | 46 | | | | - | | | | - | |
Sundry temporary differences | | | 268 | | | | (599 | ) | | | - | |
Sundry permanent differences | | | 1,945 | | | | 1,965 | | | | 4,355 | |
Entertaining | | | 272 | | | | 27 | | | | 37 | |
Loss utilisation | | | - | | | | (85 | ) | | | (334 | ) |
Taxes paid overseas and rate difference | | | 42 | | | | (144 | ) | | | (599 | ) |
Foreign exchange rate differences | | | 306 | | | | 192 | | | | (6 | ) |
Unrecognized deferred tax asset arising from timing differences relating to: | | | | | | | | | | | | |
Share based payment | | | 2,913 | | | | 3,722 | | | | (4,327 | ) |
Non-current assets | | | 208 | | | | 463 | | | | 361 | |
Prior year adjustments | | | 17 | | | | 132 | | | | (50 | ) |
Losses carried forward | | | 10,434 | | | | 16,077 | | | | 31,870 | |
Income tax expense | | | 199 | | | | 170 | | | | 2,158 | |
The Finance Act 2015 reduced the main rate of UK Corporation Tax, “CT” from 20% to 19% for the 2017 tax year, with the rate set at 19% for the 2018 and 2019 tax years. The Finance Act 2016 has set the CT rate for the 2020 tax year as 17%. Consequently the Group has used a tax rate of 19.00% for the 2018 financial year.
There is no income tax relating to the components presented within other comprehensive income.
F-24
Notes to the consolidated financial statements (continued)
Basic loss per share is computed using the weighted-average number of outstanding shares during the period. Diluted loss per share is computed using the weighted-average number of outstanding shares and excludes all potential shares outstanding during the period, as their inclusion would be anti-dilutive. The Group’s potential shares consist of incremental shares issuable upon the assumed exercise of share options and warrants, and the incremental shares issuable upon the assumed vesting of unvested share awards. The calculation of loss per share is as follows:
| | 2016 | | | 2017 | | | 2018 | |
In $ thousands, except share and per share data | | | | | | | | | | | | |
Basic and diluted | | | | | | | | | | | | |
Loss attributable to owners of the parent | | | (81,414 | ) | | | (112,275 | ) | | | (155,575 | ) |
Shares used in calculation | | | | | | | | | | | | |
Weighted-average shares outstanding | | | 188,679,490 | | | | 223,465,734 | | | | 264,432,214 | |
Basic and diluted loss per share attributable to owners of the parent | | | (0.43 | ) | | | (0.50 | ) | | | (0.59 | ) |
Potential dilutive securities that are not included in the diluted per share calculations because they would be anti-dilutive are as follows:
| | 2016 | | | 2017 | | | 2018 | |
Employee options | | | 5,462 | | | | 6,675 | | | | 14,649 | |
Warrants | | | 3,142 | | | | 3,303 | | | | 125 | |
Contingently issuable shares | | - | | | | 994 | | | - | |
| | 2017 | | | 2018 | |
Finished goods | | | 50,610 | | | | 60,954 | |
| | | 50,610 | | | | 60,954 | |
The total cost of inventory recognized as an expense in the consolidated profit or loss was $87,416,000 (2017: $55,192,000). The total provision against inventory in order to write down the balance to the net recoverable value was $4,182,000 (2017: $1,162,000).
14. | Trade and other receivables |
| | 2017 | | | 2018 | |
Current | | | | | | | | |
Other receivables | | | 5,294 | | | | 48,285 | |
Sales taxes | | | 5,307 | | | | 10,352 | |
Prepayments and accrued income | | | 7,394 | | | | 34,342 | |
Derivative financial assets (note 28) | | | 185 | | | | 691 | |
| | | 18,180 | | | | 93,670 | |
Non-current | | | | | | | | |
Other receivables | | | 9,193 | | | | 10,458 | |
| | | 9,193 | | | | 10,458 | |
The carrying amount of other receivables approximates their fair value. The maximum credit risk at the balance sheet date is considered to be equivalent to the carrying value of other receivables.
F-25
Notes to the consolidated financial statements (continued)
| | Goodwill | | | Brand, trademarks & domain names | | | Customer relationships | | | Development costs | | | Total | |
Cost | | | | | | | | | | | | | | | | | | | | |
At December 31, 2016 | | | 25,503 | | | | 3,555 | | | | 1,030 | | | | 17,785 | | | | 47,873 | |
Additions | | | 10,073 | | | | 3,046 | | | | 1,178 | | | | 18,997 | | | | 33,294 | |
Transfers | | | - | | | | 139 | | | | - | | | | (139 | ) | | | - | |
Foreign exchange movements | | | 2,873 | | | | 549 | | | | 176 | | | | 2,294 | | | | 5,892 | |
At December 31, 2017 | | | 38,449 | | | | 7,289 | | | | 2,384 | | | | 38,937 | | | | 87,059 | |
Additions | | | - | | | | - | | | | - | | | | 50,978 | | | | 50,978 | |
Transfers | | | - | | | | - | | | | - | | | | 166 | | | | 166 | |
Foreign exchange movements | | | (2,406 | ) | | | (443 | ) | | | (145 | ) | | | (4,602 | ) | | | (7,596 | ) |
At December 31, 2018 | | | 36,043 | | | | 6,846 | | | | 2,239 | | | | 85,479 | | | | 130,607 | |
Accumulated amortization | | | | | | | | | | | | | | | | | | | | |
At December 31, 2016 | | | - | | | | (689 | ) | | | (256 | ) | | | (3,985 | ) | | | (4,930 | ) |
Amortization for year | | | - | | | | (745 | ) | | | (272 | ) | | | (6,315 | ) | | | (7,332 | ) |
Transfers | | | - | | | | (67 | ) | | | - | | | | 67 | | | | - | |
Foreign exchange movements | | | - | | | | (103 | ) | | | (37 | ) | | | (616 | ) | | | (756 | ) |
At December 31, 2017 | | | - | | | | (1,604 | ) | | | (565 | ) | | | (10,849 | ) | | | (13,018 | ) |
Amortization for year | | | - | | | | (459 | ) | | | (1,057 | ) | | | (14,683 | ) | | | (16,199 | ) |
Transfers | | | - | | | | - | | | | - | | | | - | | | | - | |
Foreign exchange movements | | | - | | | | 123 | | | | 96 | | | | 1,736 | | | | 1,955 | |
At December 31, 2018 | | | - | | | | (1,940 | ) | | | (1,526 | ) | | | (23,796 | ) | | | (27,262 | ) |
Net book value | | | | | | | | | | | | | | | | | | | | |
At December 31, 2017 | | | 38,449 | | | | 5,685 | | | | 1,819 | | | | 28,088 | | | | 74,041 | |
At December 31, 2018 | | | 36,043 | | | | 4,906 | | | | 713 | | | | 61,683 | | | | 103,345 | |
Included within development costs is $205,000 (2017: $666,000) of assets that are under the course of construction. Amortization of this will commence once they have been brought into use.
Development costs relate to capitalized development expenses relating to development of internal software and developments of the Farfetch websites.
Additions to goodwill, brands, trademarks & domain names and customer relationships in 2017 arose due to business combinations. See note 5.
Amortization for all intangible assets is all recorded in selling, general and administrative expenses.
Goodwill reflects the amount of consideration in excess of the fair value of net assets of business combinations. The Group tests goodwill annually for impairment, or more frequently if there are indications that goodwill might be impaired. Goodwill has been allocated to the following CGUs. For details regarding additions to goodwill refer to note 5.
| | 2017 | | | 2018 | |
CGU* | | | | | | | | |
Marketplace | | | 17,916 | | | | 16,368 | |
Browns – Platform | | | 20,533 | | | | 19,675 | |
| | | 38,449 | | | | 36,043 | |
* | Only two of the Group’s CGUs have goodwill allocated. |
F-26
Notes to the consolidated financial statements (continued)
The recoverable amounts of the CGUs are determined from value in use calculations. The key assumptions for the value in use calculations are those regarding the discount rates, growth rates and expected changes to selling prices and direct costs during the period. Management estimates discount rates using pre-tax rates that reflect current market assessments of the time value of money and the risks specific to the CGUs and the group of units. The growth rates are based on industry growth forecasts.
The Group prepares cash flow forecasts derived from the most recent financial budgets approved by management for the next five years.
The key assumptions for the value in use calculations are the long term growth rate applied to year five onwards and the discount rates. The Group extrapolates the cash flows in the fifth year based on an estimated growth rate of 2% (2017: 2%). This rate does not exceed the average long-term growth rate for the relevant markets. The pre-tax rate used to discount the forecast cash flows ranges from 9.7% to 11.8% (2017: 10.9% to 12.3%). The pre-tax discount rate applied is derived from a market participant’s weighted average cost of capital. The assumptions used in the calculation of the Group’s weighted average cost of capital are benchmarked to externally available data.
Management has performed sensitivities on key assumptions and based upon these believe that there are no reasonably possible changes that could create an impairment.
16. | Property, plant and equipment |
| | Leasehold improvements | | | Fixtures and fittings | | | Motor vehicles | | | Computer equipment | | | Totals | |
Cost | | | | | | | | | | | | | | | | | | | | |
At December 31, 2016 | | | 14,612 | | | | 2,211 | | | | 162 | | | | 4,319 | | | | 21,304 | |
Additions | | | 7,717 | | | | 3,230 | | | | - | | | | 2,000 | | | | 12,947 | |
Disposals | | | (249 | ) | | | (175 | ) | | | (39 | ) | | | (364 | ) | | | (827 | ) |
Transfers | | | - | | | | (177 | ) | | | - | | | | 177 | | | | - | |
Foreign exchange movements | | | 1,373 | | | | 427 | | | | 19 | | | | 431 | | | | 2,250 | |
At December 31, 2017 | | | 23,453 | | | | 5,516 | | | | 142 | | | | 6,563 | | | | 35,674 | |
Additions | | | 16,086 | | | | 2,083 | | | | - | | | | 3,318 | | | | 21,487 | |
Disposals | | | (1,489 | ) | | | (211 | ) | | | (28 | ) | | | (61 | ) | | | (1,789 | ) |
Transfers | | | (1,156 | ) | | | 889 | | | | - | | | | 101 | | | | (166 | ) |
Foreign exchange movements | | | (1,830 | ) | | | (501 | ) | | | (5 | ) | | | (525 | ) | | | (2,861 | ) |
At December 31, 2018 | | | 35,064 | | | | 7,776 | | | | 109 | | | | 9,396 | | | | 52,345 | |
Accumulated depreciation | | | | | | | | | | | | | | | | | | | | |
At December 31, 2016 | | | (2,260 | ) | | | (971 | ) | | | (115 | ) | | | (2,163 | ) | | | (5,509 | ) |
Depreciation for year | | | (1,674 | ) | | | (972 | ) | | | (14 | ) | | | (988 | ) | | | (3,648 | ) |
Disposals | | | 249 | | | | 171 | | | | 28 | | | | 337 | | | | 785 | |
Transfers | | | (98 | ) | | | 61 | | | | - | | | | 37 | | | | - | |
Foreign exchange movements | | | (225 | ) | | | (151 | ) | | | (11 | ) | | | (219 | ) | | | (606 | ) |
At December 31, 2017 | | | (4,008 | ) | | | (1,862 | ) | | | (112 | ) | | | (2,996 | ) | | | (8,978 | ) |
Depreciation for year | | | (4,091 | ) | | | (1,196 | ) | | | (14 | ) | | | (2,037 | ) | | | (7,338 | ) |
Disposals | | | 562 | | | | 136 | | | | 28 | | | | 35 | | | | 761 | |
Transfers | | | - | | | | 11 | | | | - | | | | (11 | ) | | | - | |
Foreign exchange movements | | | 375 | | | | 129 | | | | 4 | | | | 230 | | | | 738 | |
At December 31, 2018 | | | (7,162 | ) | | | (2,782 | ) | | | (94 | ) | | | (4,779 | ) | | | (14,817 | ) |
Net book value | | | | | | | | | | | | | | | | | | | | |
At December 31, 2017 | | | 19,445 | | | | 3,654 | | | | 30 | | | | 3,567 | | | | 26,696 | |
At December 31, 2018 | | | 27,902 | | | | 4,994 | | | | 15 | | | | 4,617 | | | | 37,528 | |
F-27
Notes to the consolidated financial statements (continued)
Included within leasehold improvements and computer equipment is respectively $6,312,000 and $nil ($6,312,000 and $nil) of assets that are under the course of construction. Depreciation will commence once they have been brought into use.
Depreciation for all property, plant and equipment is all recorded in selling, general and administrative expenses.
Equity investments
In 2018 the Group held minor equity interests worth $566,000 (2017: $278,000). Equity investments are carried at fair value.
Investments in associates
The table below illustrates the summarized financial information of the Group’s investment in Farfetch Finance Limited (“the associate”). The Group holds 25% of issued capital of the associate. The principal activity of the associate is the provision of trade finance and it is incorporated in England & Wales. The associate is accounted for using the equity method.
| | Share of associates net assets | |
At December 31, 2016 | | | 23 | |
Share of profit after tax | | | 35 | |
At December 31, 2017 | | | 58 | |
Share of profit after tax | | | 28 | |
At December 31, 2018 | | | 86 | |
18. | Share capital and share premium |
Ordinary shares issued and fully paid as at December 31, 2018
Number of shares | | | Class | | Par value $ | | | Share capital | | | Share premium | | | Merger reserve | | | Total | |
| 256,998,920 | | | Class A ordinary shares | | | 0.04 | | | | 10,280 | | | | 726,791 | | | | 783,529 | | | | 1,520,600 | |
| 42,858,080 | | | Class B ordinary shares | | | 0.04 | | | | 1,714 | | | | 45,509 | | | | - | | | | 47,223 | |
| 299,857,000 | | | | | | | | | | 11,994 | | | | 772,300 | | | | 783,529 | | | | 1,567,823 | |
During 2018, 67,410,405 shares were issued. All were fully paid and newly issued Class A ordinary shares principally relating to the IPO and concurrent private placement in September 2018 where 41,608,088 Class A ordinary shares were issued. The nominal value of all shares issued is $0.04 each. Transaction costs related to the IPO and recognized directly in equity amount to $11,914,000. Additionally, 14,961,544 shares in respect of warrants and share options were exercised as prior to the IPO and 361,343 share options were exercised following the IPO. In January 2018, there was a series G funding round follow-on where 8,502,500 Class A ordinary shares were issued. Transaction costs recognized directly in equity amount to $36,000. The Browns earn-out was also settled through the issue of 1,976,930 shares in April 2018 which had previously been recognized as a financial liability as the number of shares was variable based on the earn-out mechanism, rather than being a cash-settled liability.
Prior to the IPO, the Group was restructured. The merger reserve resulted from the restructuring. Further detail can be found in note 1.
F-28
Notes to the consolidated financial statements (continued)
Ordinary shares issued and fully paid as at December 31, 2017
Number of shares | | | Class | | Par value $ | | | Share capital | | | Share premium | | | Merger reserve | | | Total | |
| 189,588,515 | | | Class A ordinary shares | | | 0.04 | | | | 7,584 | | | | 632,165 | | | | - | | | | 639,749 | |
| 42,858,080 | | | Class B ordinary shares | | | 0.04 | | | | 1,714 | | | | 45,509 | | | | - | | | | 47,223 | |
| 232,446,595 | | | | | | | | | | 9,298 | | | | 677,674 | | | | - | | | | 686,972 | |
In the year ended December 31, 2017, 36,346,645 shares were issued. All were fully paid. Of these shares, 34,222,510 were newly issued Class A ordinary share from the series G funding round and the remainder 2,124,135 were Class A ordinary shares. The nominal value of all shares issued is $0.04 each. Transaction costs recognized directly in equity amounted to $414,000.
Each ordinary share and preferred share shall rank equally for any dividends paid. On a liquidation event the holder of preferred shares will have the priority on the available assets. Each ordinary and class of preferred shares shall rank equally in relation to voting rights.
| | | | | | Other reserves | | | | | |
| | Foreign exchange reserve | | | Warrant reserve | | | Changes in ownership | | | Share based payments | | | Cashflow hedge reserve | | | Merger relief reserve | | | Accumulated losses | |
At December 31, 2015 | | | (6,771 | ) | | | 338 | | | | (8,666 | ) | | | 12,437 | | | | - | | | | - | | | | (128,475 | ) |
Loss for the year | | | - | | | | - | | | | - | | | | - | | | | - | | | | - | | | | (81,414 | ) |
Movement in foreign exchange reserve | | | (27,322 | ) | | | - | | | | - | | | | - | | | | - | | | | - | | | | - | |
Warrants issued | | | - | | | | 409 | | | | - | | | | - | | | | - | | | | - | | | | - | |
Transactions with non-controlling interests | | | 1,222 | | | | - | | | | - | | | | - | | | | - | | | | - | | | | - | |
Share based payments - equity settled | | | - | | | | - | | | | - | | | | 15,339 | | | | - | | | | - | | | | (7,012 | ) |
At December 31, 2016 | | | (32,871 | ) | | | 747 | | | | (8,666 | ) | | | 27,776 | | | | - | | | | - | | | | (216,901 | ) |
Loss for the year | | | - | | | | - | | | | - | | | | - | | | | - | | | | - | | | | (112,275 | ) |
Movement in foreign exchange reserve | | | 33,504 | | | | - | | | | - | | | | - | | | | - | | | | - | | | | - | |
Transactions with non-controlling interests | | | - | | | | - | | | | - | | | | - | | | | - | | | | 2,161 | | | | - | |
Share based payments - equity settled | | | - | | | | - | | | | - | | | | 16,457 | | | | - | | | | - | | | | (1 | ) |
At December 31, 2017 | | | 633 | | | | 747 | | | | (8,666 | ) | | | 44,233 | | | | - | | | | 2,161 | | | | (329,177 | ) |
Loss for the year | | | - | | | | - | | | | - | | | | - | | | | - | | | | - | | | | (155,575 | ) |
Movement in foreign exchange reserve | | | (24,142 | ) | | | - | | | | - | | | | - | | | | - | | | | - | | | | - | |
Movement in cash flow hedge reserve | | | - | | | | - | | | | - | | | | - | | | | 436 | | | | - | | | | - | |
Share based payments - equity settled | | | - | | | | - | | | | - | | | | 28,563 | | | | - | | | | - | | | | 1,395 | |
At December 31, 2018 | | | (23,509 | ) | | | 747 | | | | (8,666 | ) | | | 72,796 | | | | 436 | | | | 2,161 | | | | (483,357 | ) |
The foreign exchange reserve represents the cumulative exchange differences on the translation of the Group’s overseas subsidiaries into the Group’s presentational currency.
The warrant reserve represents the cumulative expense of the shares to be issued where the Group has issued warrants.
The changes in ownership reserve represents transactions with former non-controlling interests of the Group.
The share based payment reserve represents the Group’s cumulative equity settled share option expense. On exercise, the cumulative share option expense is reclassified to accumulated losses.
F-29
Notes to the consolidated financial statements (continued)
The cash flow hedge reserve is used to recognize the effective portion of gains or losses on derivatives that are designated and qualify as cash flow hedges.
The merger relief reserve represents the excess over nominal share capital where there has been share consideration as part of a business combination.
Accumulated losses represent the cumulative gains and losses recorded in the statement of operations.
At December 31, 2018, the Company’s subsidiaries were as follows:
Direct Holdings | | | | | | | | |
Company name | | Country of incorporation | | % equity interest | | Principal activities |
| | | | 2017 | | 2018 | | |
Farfetch.com Limited | | Isle of Man | | 100 | | 100 | | Holding company |
F-30
Notes to the consolidated financial statements (continued)
Indirect Holdings | | | | | | | | |
Company name | | Country of incorporation | | % equity interest | | Principal activities |
| | | | 2017 | | 2018 | | |
Farfetch UK Limited | | England & Wales | | 100 | | 100 | | Marketing, providing editorial and merchant services |
FFBR importacao e exportacao LTDA* | | Brazil | | 100 | | 100 | | Import & Export Agent for Farfetch |
Farfetch.com Brasil Servicos LTDA** | | Brazil | | 100 | | 100 | | E-commerce, marketing and editorial services |
Farfetch.com US LLC | | USA | | 100 | | 100 | | E-commerce and marketing |
Farfetch-Portugal Unipessoal LDA | | Portugal | | 100 | | 100 | | Back office support |
Farfetch HK Holdings Limited | | Hong Kong | | 100 | | 100 | | Holding Company |
Browns (South Molton Street) Limited | | England & Wales | | 100 | | 100 | | Retail |
Farfetch Japan Co Ltd | | Japan | | 100 | | 100 | | E-commerce and marketing |
LASO.CO.LTD | | Japan | | 100 | | 100 | | E-commerce and marketing |
Farfetch China (HK Holdings) Limited | | Hong Kong | | 100 | | 100 | | Holding company |
Farfetch (Shanghai) E-Commerce Co. Ltd | | China | | 100 | | 100 | | E-commerce services |
Farfetch HK Production Limited | | Hong Kong | | 100 | | 100 | | E-commerce and marketing |
Farfetch Store of the Future Limited | | England & Wales | | 100 | | 100 | | Dormant |
Fashion Concierge UK Limited | | England & Wales | | 100 | | 100 | | E-commerce services |
F&C Fashion Concierge, LDA | | Portugal | | 100 | | 100 | | Dormant |
Farfetch Black & White Limited | | England & Wales | | 100 | | 100 | | E-commerce services |
Farfetch International Limited | | Isle of Man | | 100 | | 100 | | Holding company |
Farfetch México, S.A de C.V*** | | Mexico | | 100 | | 100 | | Back office support |
Fashion Concierge Powered By Farfetch, LLC | | USA | | 100 | | 100 | | E-commerce services |
Farfetch India Private Limited**** | | India | | 100 | | 100 | | Back office support |
Farfetch Middle East FZE | | UAE | | 100 | | 100 | | Back office support |
Farfetch Italia S.R.L. | | Italy | | 100 | | 100 | | Back office support |
Farfetch Australia Pty Ltd | | Australia | | 100 | | 100 | | Back office support |
Farfetch US Holdings, INC | | USA | | 100 | | 100 | | Holding Company |
Fashion Concierge HK Limited | | Hong Kong | | 100 | | 100 | | E-commerce services |
Farfetch Finance Limited | | England & Wales | | 25 | | 25 | | Finance |
Yankee Merger Sub, LLC | | USA | | 100 | | 100 | | Merger Company for acquisition |
* | Owned by Farfetch.com Limited (99.9%) and Farfetch UK Limited (0.1%) |
** | Owned by Farfetch.com Limited (99.9995%) and Farfetch UK Limited (0.0005%) |
*** | Owned by Farfetch.com Limited (1%) and Farfetch UK Limited (99%) |
**** | Owned by Farfetch.com Limited (0.1%) and Farfetch UK Limited (99.9%) |
21. | Non-controlling interests |
On January 11, 2017, the Group acquired the remaining 0.1% of FFBR importação e exportação Ltda that it did not already own.
F-31
Notes to the consolidated financial statements (continued)
The effect of changes in the ownership interest of the Group on the equity attributable to owners of the company during the year and prior year is summarized as follows:
| | 2017 | | | 2018 | |
Balance brought forward | | | (1 | ) | | | - | |
Transactions with non-controlling interests | | | 1 | | | | - | |
Loss attributable to non-controlling interests | | | - | | | | - | |
| | | - | | | | - | |
22. | Trade and other payables |
| | 2017 | | | 2018 | |
Trade payables | | | 73,992 | | | | 96,176 | |
Other payables | | | 713 | | | | 350 | |
Social security and other taxes | | | 6,646 | | | | 6,194 | |
Income tax payable | | | 666 | | | | 1,514 | |
Accruals and deferred revenue | | | 54,727 | | | | 89,924 | |
| | | 136,744 | | | | 194,158 | |
During 2016, the Group issued warrants, which are linked to the $20m of Promissory notes issued in 2016, which were subsequently repaid in 2017.
Date of issue | | Number of shares | | | Warrant price | | | Expiration date |
October 3, 2016 | | | 122,935 | | | $ | 6.15 | | | 12 years from issue date |
August 1, 2016 | | | 33,530 | | | $ | 6.15 | | | 12 years from issue date |
December 23, 2016 | | | 33,530 | | | $ | 6.15 | | | 12 years from issue date |
As at December 31, 2018, all warrants above remain unexercised.
| | Dilapidations provision | | | Share based payments employment taxes provision | | | Total | |
| | 2017 | | | 2018 | | | 2017 | | | 2018 | | | 2017 | | | 2018 | |
At January 1 | | | 1,834 | | | | 2,165 | | | | 2,101 | | | | 2,977 | | | | 3,935 | | | | 5,142 | |
Additional provision in the year | | | 406 | | | | 1,263 | | | | 1,012 | | | | 6,614 | | | | 1,418 | | | | 7,877 | |
Transfer from trade and other payables | | | - | | | | - | | | | - | | | | 2,182 | | | | - | | | | 2,182 | |
Release of provision in the year | | | - | | | | (815 | ) | | | - | | | | - | | | | - | | | | (815 | ) |
Foreign exchange | | | (75 | ) | | | (98 | ) | | | (136 | ) | | | (826 | ) | | | (211 | ) | | | (924 | ) |
At December 31 | | | 2,165 | | | | 2,515 | | | | 2,977 | | | | 10,947 | | | | 5,142 | | | | 13,462 | |
The dilapidations provision reflects the best estimate of the cost to restore leasehold property in line with the Group’s contractual obligations. Based on a detailed analysis the Group has estimated a liability of $2,515,000 (2017: $2,165,000). In estimating the liability the Group has made assumptions which are based on past experience. Assuming the leases are not extended, the Group expects the economic outflows to match the contractual end date of Group leases. The Group leases have an average length of six years with an average of four years remaining.
F-32
Notes to the consolidated financial statements (continued)
The share based payments employment taxes provision reflects the best estimate of the cost to settle employment related taxes on the Group share based payments based on the most recent share price and the number of share options expected to vest where the Group has an obligation to settle employment related taxes. The Group has estimated a liability of $10,947,000 (2017: $2,977,000).When a share option is exercised, the liability for employment related taxes crystalizes. During 2018, $2,182,000 (2017: $nil) was transferred from provisions to trade and other payables. As at December 31, 2018 none of the amount in trade and other payables had been utilized (2017: $nil). We expect the provision to be fully utilized in 9.54 years (2017: 8.00 years) being the weighted average remaining contracted life of options outstanding at year end. It is likely that this provision will be utilized over a shorter period. However, this is dependent on when the option holder exercises which the Group is not in control of.
As a result of the purchase price allocation exercise arising from the acquisition of Style.com a deferred tax liability of $719,000 has been recognized in 2017 as a temporary difference. Refer to note 5.
Deferred tax liabilities | | Note | | | 2017 | | | 2018 | |
At January 1 | | | | | | | 493 | | | | 1,079 | |
Deferred tax recognized on acquisition | | | 5 | | | | 719 | | | | - | |
Foreign exchange | | | | | | | 91 | | | | (52 | ) |
Released to profit or loss | | | | | | | (224 | ) | | | (282 | ) |
At December 31 | | | | | | | 1,079 | | | | 745 | |
Deferred tax assets | | 2017 | | | 2018 | |
At January 1 | | | 493 | | | | 1,079 | |
Deferred tax recognized | | | 719 | | | | - | |
Foreign exchange | | | 91 | | | | (52 | ) |
Released to profit or loss | | | (224 | ) | | | (282 | ) |
At December 31 | | | 1,079 | | | | 745 | |
Deferred tax, net | | | | | | | | |
At December 31 | | | - | | | | - | |
A deferred tax asset has been recognized in 2017 following the acquisition of Style.com (note 5) equal to and to fully offset the deferred tax liability.
Deferred tax assets have been offset against deferred tax liabilities because they are in the same jurisdiction.
F-33
Notes to the consolidated financial statements (continued)
Unrecognized deferred tax assets
Unutilized trading tax losses
The Group has accumulated unutilized tax losses carried forward as at December 31, 2018 of $382m (2017: $232m). A net deferred tax asset is only recognized where it can be shown that it is probable that future taxable profits will be available against which the Group can utilize the asset. Subject to specific legislation regarding changes in ownership and the nature of trade, trading losses are available to be either carried forward indefinitely or for a significant time period.
| | Local currency | | 2017 | | | 2017 | | | 2018 | | | 2018 | |
| | | | Local ‘m | | | $’m | | | Local ‘m | | | $’m | |
UK trading losses | | GBP | | | 136 | | | | 184 | | | | 259 | | | | 331 | |
US Net Operating Losses (“NOL”) | | USD | | | 29 | | | | 29 | | | | 34 | | | | 34 | |
Brazil trading losses | | BRL | | | 42 | | | | 13 | | | | 49 | | | | 13 | |
Japan trading losses | | JPY | | | 463 | | | | 4 | | | | 274 | | | | 2 | |
Hong Kong trading losses | | HKD | | | 16 | | | | 2 | | | | 14 | | | | 2 | |
| | | | | 686 | | | | 232 | | | | 630 | | | | 382 | |
UK trading losses are available to be carried forward indefinitely. Legislation has been introduced with effect from April 1, 2017 whereby losses arising after April 1, 2017 can be set against total profits of the company. The amount of total profits that can be offset by brought forward losses is restricted to the first £5m of profits, and an additional 50% of profits that exceed £5.0m.
US Net Operating Losses as at December 31, 2017 ($29m) are available to be carried forward for a period of 20 years. The carry forward NOLs start to expire in different years, the first of which is December 31, 2030. NOLs generated after January 1,2018 ($5m) have an indefinite carry forward period but are subject to an 80% limitation per year.
Brazilian, Japanese and Hong Kong trading losses as at December 31, 2018 are available to be carried forward indefinitely but utilization of losses in respect of Brazil and Japan are restricted to 30% and 50% respectively against taxable income in future taxable periods.
Unutilized future tax deductions on employee share option gains
The Group has an unrecognized gross deferred tax asset of approximately $212m in respect of a future tax deduction on share options that are unexercised as at 31 December 2018 that when exercised will result in a gain and a potential deduction for corporation tax purposes. A net deferred tax asset is only recognized where it can be shown that it is probable that future taxable profits will be available against which the Group can utilize the asset.
26. | Commitments and guarantees |
Consolidated
Future minimum lease payments under non-cancellable operating leases as at the year end were:
| | 2017 | | | 2018 | |
No later than one year | | | 11,929 | | | | 15,820 | |
Later than one year not later than three years | | | 20,297 | | | | 26,599 | |
Later than three year not later than five years | | | 11,251 | | | | 22,584 | |
Later than five years | | | 22,656 | | | | 38,031 | |
| | | 66,133 | | | | 103,034 | |
F-34
Notes to the consolidated financial statements (continued)
The Group’s operating leases relate to motor vehicles and property leases for the various office, production and retail stores that the Group has. There is no contingent rent (2017: none). Several leases have a right to renew at the end of the lease term.
There are no contingent liabilities (2017: none).
27. | Related party disclosures |
Platforme International Limited is a related party of J M F Neves. The Group generated commission of $557,000 (2017: $248,000) from Platforme International Limited. The Group had a $13,000 receivable in 2018 (2017: $70,000 receivable).
Total compensation and benefits in kind (excluding share-based payments) to key management personnel amounted to $1,284,000 (2017: $1,200,000). In addition to this, there was share based payment compensation of $7,869,000 (2017: $1,900,000).
Conde Nast is a related party by virtue of its shareholding in the Group. The Group incurred marketing expenditure of $346,000 (2017: nil) and had a $19,000 payable in 2018 (2017: nil).
Until October 21, 2017, when Fashion Concierge UK Limited was acquired, see note 5, the Group made sales totaling, $110,000 to Fashion Concierge UK Limited. This was a related party of J M F Neves.
The acquisition of the business of Style.com (note 5) was a related party transaction because the former owners of Style.com Conde Nast, are also a shareholder of the Group. Jonathan Newhouse, the current chairman and chief executive of Conde Nast International is also a director of Farfetch.com Limited.
The Group’s ultimate controlling party is J M F Neves by virtue of holding the majority of voting rights in the Group.
28. | Financial instruments and financial risk management |
The Group manages its capital to ensure that entities in the Group will be able to continue as going concerns. All debt has been settled in 2017. The capital structure of the Group throughout 2017 consisted of net cash (borrowings disclosed in note 23) and equity of the Group (comprising issued capital, reserves, accumulated losses and non-controlling interests as disclosed in notes 18, 19 and 21). At December 31, 2017 and 31 December 2018, the capital structure consisted solely of equity. The Group is not subject to any externally imposed capital requirements.
The Group is exposed to risks which arise from the probability of changes in the fair value of the future cash flows deriving from a financial instrument due to fluctuations in market prices. The Group has identified two principal risks being market risk (foreign exchange) and liquidity risk.
Where all relevant criteria are met, hedge accounting is applied to remove the accounting mismatch between the hedging instrument and the hedged item. This will effectively result in recognizing inventory at the fixed foreign currency rate for the hedged purchases.
Details of the significant accounting policies and methods adopted (including the criteria for recognition, the basis of measurement and the bases for recognition of income and expenses) for each class of financial asset, financial liability and equity instrument are disclosed in note 2.
F-35
Notes to the consolidated financial statements (continued)
Categories of financial instruments
Financial assets
| | Amortized cost | | | Amortized cost | |
| | 2017 | | | 2018 | |
Current | | | | | | | | |
Other receivables | | | 5,294 | | | | 48,285 | |
Cash and cash equivalents | | | 384,002 | | | | 1,044,786 | |
Non-current | | | | | | | | |
Other receivables | | | 9,193 | | | | 10,458 | |
Total | | | 398,489 | | | | 1,103,529 | |
| | | | | | | | |
| | 2017 | | | 2018 | |
Foreign currency forwards - held at FVTPL | | | 185 | | | | 255 | |
Foreign currency forwards - held as cash flow hedges | | | - | | | | 436 | |
Derivative financial assets | | | 185 | | | | 691 | |
Financial liabilities
| | Amortized cost | | | Amortized cost | |
| | 2017 | | | 2018 | |
Trade payables | | | 73,992 | | | | 96,176 | |
Other payables | | | 713 | | | | 350 | |
Total | | | 74,705 | | | | 96,526 | |
| | Fair value through profit or loss | | | Fair value through profit or loss | |
| | 2017 | | | 2018 | |
Contingent consideration | | | 19,146 | | | | - | |
| | | 19,146 | | | | - | |
Financial risk management objectives
The Group’s Corporate Treasury function provides services to the business, co-ordinates access to domestic and international financial markets and monitors and manages the financial risks relating to the operations of the Group through internal risk reports which analyze exposures by degree and magnitude of risks. These risks include market risk (including currency risk, interest rate risk and price risk), credit risk, liquidity risk and cash flow interest rate risk.
The Group seeks to minimize the effects of these risks, where appropriate, by using derivative financial instruments to hedge these risk exposures. The use of financial derivatives is governed by the Group’s policies approved by the board of directors, which provide written principles on foreign exchange risk, interest rate risk, credit risk and the use of derivatives. The Group does not enter into or trade financial instruments, including derivative financial instruments, for speculative purposes.
F-36
Notes to the consolidated financial statements (continued)
Market risk
The Group’s activities expose it primarily to the financial risk of changes in foreign currency exchange rates (see table below). The Group enters into derivative financial instruments to manage its exposure to foreign currency risk.
Foreign currency risk is the risk that the fair value or future cash flows of an exposure will fluctuate because of changes in foreign exchange rates.
The Group uses forward currency contracts to hedge its foreign currency risks. Where the criteria for hedge accounting are not met, derivative financial instruments are initially recognized at fair value on the date on which a derivative contract is entered into and are subsequently remeasured at fair value with movements recorded to the statement of operations. Derivatives are carried as financial assets when the fair value is positive and as financial liabilities when the fair value is negative. Where all relevant criteria are met, hedge accounting is applied to minimize earnings volatility.
| | Financial assets/(liabilities) at fair value through profit or loss | |
| | 2017 | | | 2018 | | | 2017 | | | 2018 | |
Derivative financial asset/(liability) | | | 226 | | | | 691 | | | | (41 | ) | | | - | |
Liquidity risk
The Group monitors its liquidity risk to maintain a balance between continuity of funding and flexibility. This helps the Group achieve timely fulfilment of its obligations while sustaining the growth of the business.
The table below analyses the Group’s financial liabilities into relevant groupings based on the remaining period from the reporting date to the contractual maturity date. Amounts due within 12 months equal their carrying balances, as the impact of discounting is not significant.
All derivative financial instruments have a maturity of less than 12 months.
| | Less than one year | | | Less than one year | |
| | 2017 | | | 2018 | |
Trade and other payables | | | 74,705 | | | | 96,526 | |
Contingent consideration | | | 19,146 | | | | - | |
Total | | | 93,851 | | | | 96,526 | |
| | More than one year | | | More than one year | |
| | 2017 | | | 2018 | |
Contingent consideration | | | - | | | | - | |
Borrowings | | | - | | | | - | |
| | | - | | | | - | |
Credit risk
Credit risk is the risk that financial loss arises from the failure of a customer to meet its obligations under a contract. Due to the nature of operations the Group does not have significant exposure to credit risk.
The Group applies the IFRS 9 simplified approach to measuring expected credit losses which uses a lifetime expected loss allowance for all trade and other receivables. The Group applies a loss allowance to trade and other receivables. As at December 31, 2018 all trade and other receivables were considered current being due within 30 days. The expected loss rate the Group applies for trade and other receivables is 0.5%.
F-37
Notes to the consolidated financial statements (continued)
The expected loss rates are based on the payment profiles of sales over a period of 36 month before 31 December 2018 or 1 January 2018 respectively and the corresponding historical credit losses experienced within this period which were not significant. The historical loss rates are adjusted to reflect current and forward looking information on macroeconomic factors affecting the ability of the customers to settle the receivables. The Group has identified the GDP and the unemployment rate of the countries in which it sells its goods and services to be the most relevant factors, and accordingly adjusts the historical loss rates based on expected changes in these factors.
The majority of the Group’s cash and cash equivalents balance is held in money market funds which are regulated by securities and market authorities. These consist of AAA rated mutual investment funds which are permitted to diversify portfolio investments through high quality debt securities meeting regulatory mandated requirements. As such, the Group is not exposed to any material credit risk in relation to the cash and cash equivalents balance.
Capital risk management
The Group’s objective when managing capital is to safeguard the Group’s ability to provide returns for members and benefits for other stakeholders and to maintain an optimal capital structure to reduce the cost of capital. At December 31, 2018, the Group does not hold any restricted cash (2017: $nil).
The Group is not subject to any externally imposed capital requirements. The capital structure is as follows:
| | 2017 | | | 2018 | |
Total borrowings | | | - | | | | - | |
Less: cash and cash equivalents | | | (384,002 | ) | | | (1,044,786 | ) |
Net cash | | | (384,002 | ) | | | (1,044,786 | ) |
Total equity | | | 396,903 | | | | 1,128,431 | |
Total capital | | | 12,901 | | | | 83,645 | |
The main purpose of the Group’s financial instruments is to finance the Group’s operations.
The main risks from the Group’s financial instruments are currency riskand liquidity risk. The Board reviews and agrees policies, which have remained substantially unchanged for the year under review, for managing these risks.
Fair value hierarchy
Financial instruments carried at fair value are categorized into the below levels, reflecting the significance of the inputs used in estimating the fair values:
Level 1: Quoted prices (unadjusted) in active markets for identical instruments;
Level 2: Valuation techniques based on observable inputs, other than quoted prices included within level 1, that are observable either directly or indirectly from market data;
Level 3: Valuation techniques using significant unobservable inputs, this category includes all instruments where the valuation technique includes inputs not based on observable data and the unobservable inputs have a significant effect on the instrument’s valuation.
F-38
Notes to the consolidated financial statements (continued)
The Group recognizes the following financial instruments at fair value:
| • | derivative financial instruments, measured using a level 2 valuation method; and |
| • | contingent consideration, measured using a level 2 valuation method. |
The valuation of contingent consideration in 2017 was based upon the share price of the Group, which is deemed to be observable. As there was no quoted price the share price applied was from the most recent, pre-IPO, funding round, being Series G. The Group recognized net losses of $3,313,000 in 2017 when remeasuring the above to their fair values.
Financial instruments sensitivity analysis
In managing currency risk the Group aims to reduce the impact of short term fluctuations on its earnings. At the end of each reporting year, the effects of hypothetical changes in currency are as follows.
Foreign exchange rate sensitivity analysis
The table below shows the Group’s sensitivity to United States dollars strengthening/weakening by 10%:
| | Increase/ (decrease) in profit or loss | | | Increase/ (decrease) in profit or loss | |
| | 2017 | | | 2018 | |
10% appreciation of United States dollars | | | 7,576 | | | | 29,169 | |
10% depreciation of United States dollars | | | (9,260 | ) | | | (35,651 | ) |
This analysis is based on foreign currency exchange rate variances that the Group considered to be reasonably possible at the end of the reporting year. The analysis assumes that all other variables, in particular interest rates, remain constant.
29. | Share options equity and cash settled |
The Group has four equity settled share option plans (section a) and a cash settled share option plan (section b).
a. Equity settled
During the year ended December 31, 2018, the Group had four equity settled share based payment plans which are described below.
Type of arrangement | | EMI approved share option plan | | | Unapproved share option plan | | | LTIP 2015 plan | | | LTIP 2018 plan | |
Date of first grant | | November 1, 2011 | | | July 1, 2011 | | | September 9, 2015 | | | September 20, 2018 | |
Number granted | | | 5,505,600 | | | | 11,332,835 | | | | 38,174,980 | | | | 3,465,915 | |
Contractual life | | 10 years | | | 10 years | | | 10 years | | | 10 years | |
Vesting conditions | | Varying tranches of options vesting upon defined years of service | | | Varying tranches of options vesting upon defined years of service | | | Varying tranches of options vesting upon defined years of service with certain awards having non-market conditions | | | Varying tranches of options and Restricted Stock Units (RSU) vesting upon defined years of service | |
F-39
Notes to the consolidated financial statements (continued)
Movements on the share options were as follows:
| | 2016 | | | 2017 | | | 2018 | |
| | Number of options | | | Number of options | | | Number of options | |
Options at beginning of year | | | 16,611,310 | | | | 17,522,365 | | | | 32,307,010 | |
Options granted | | | 6,128,555 | | | | 15,666,155 | | | | 18,209,410 | |
Options exercised | | | (2,510,570 | ) | | | (198,525 | ) | | | (3,032,571 | ) |
Options forfeited | | | (2,706,930 | ) | | | (682,985 | ) | | | (3,265,035 | ) |
| | | 17,522,365 | | | | 32,307,010 | | | | 44,218,814 | |
Options exercisable at end of year | | | 10,214,900 | | | | 12,551,425 | | | | 16,830,409 | |
Weighted average exercise prices were as follows:
| | 2016 | | | 2017 | | | 2018 | |
Options at beginning of year | | $ | 0.76 | | | $ | 2.01 | | | $ | 4.43 | |
Options granted | | $ | 3.34 | | | $ | 7.10 | | | $ | 9.84 | |
Options forfeited | | $ | 0.57 | | | $ | 6.71 | | | $ | 7.31 | |
Options exercised | | $ | 0.08 | | | $ | 0.08 | | | $ | 2.38 | |
Options at end of year | | $ | 2.01 | | | $ | 4.43 | | | $ | 6.15 | |
Options exercisable at year end | | $ | 1.08 | | | $ | 1.59 | | | $ | 2.33 | |
Weighted average remaining contracted life of options outstanding at year end | | 7.67 years | | | 8.00 years | | | 9.54 years | |
| | 2016 | | | 2017 | | | 2018 | |
| | Number of options | | | Number of options | | | Number of options | |
Exercise price of options outstanding at year end | | | | | | | | | | | | |
$0.00 to $0.08 | | | 6,090,695 | | | | 5,868,735 | | | | 4,416,525 | |
$0.09 to $0.56 | | | 5,581,825 | | | | 5,581,825 | | | | 2,126,540 | |
$0.57 to $3.52 | | | 5,002,505 | | | | 6,302,505 | | | | 4,595,104 | |
$3.53 to $5.73 | | | 847,340 | | | | 8,589,445 | | | | 6,257,690 | |
$5.74 to $7.39 | | | - | | | | 5,964,500 | | | | 7,890,495 | |
$7.40 to $20.00 | | | - | | | | - | | | | 18,932,460 | |
| | | 17,522,365 | | | | 32,307,010 | | | | 44,218,814 | |
Weighted average fair value of options granted in year | | $ | 2.43 | | | $ | 2.41 | | | $ | 4.17 | |
Weighted average share price at the date of exercise for options exercised during the year ended December 31, 2018 was $20.00 (2017: $9.42).
Inputs in the Black Scholes model for share options granted during the year and prior year were as follows:
| | 2016 | | | 2017 | | | 2018 | |
Black Scholes model | | | | | | | | | | | | |
Weighted average share price | | $ | 6.15 | | | $ | 9.87 | | | $ | 11.83 | |
Weighted average exercise price | | $ | 3.34 | | | $ | 7.10 | | | $ | 9.84 | |
Average expected volatility | | 20% | | | 20% | | | 23% | |
Expected life | | 4 years | | | 4 years | | | 4 years | |
Risk free rate | | 1.40% | | | 1.85% | | | 2.75% | |
Expected dividends | | $nil | | | $nil | | | $nil | |
Expected volatility was determined with reference to historical volatility of publicly traded peer companies.
F-40
Notes to the consolidated financial statements (continued)
The expected life in the model has been adjusted, based on management’s best estimate, for the effects of non-transferability, exercise restrictions, and behavioral considerations.
The Group recognized total expenses of $34,668,000, $16,667,000 and $17,256,000 related to equity-settled share based payment transactions in 2018, 2017 and 2016 respectively.
b. Cash settled
Since 2016 the Group issues to certain employees share appreciation rights (“SAR”s) that require the Group to pay the intrinsic value of the SAR to the employee at the date of exercise. The Group has recorded liabilities of $15,342,000 in 2018 ($5,123,000 in 2017) through the grant of 769,000 SARs (2017: 222,696 SARs).
The fair value of the SARs is determined by using the Black Scholes model using the same assumptions noted in the above table for the Group’s equity-settled share based payments. The fair value of the liability is then reassessed at each reporting date. Included in the 2018 expense of $10,355,000 (2017: $3,807,000, 2016: $1,178,000), is a revaluation gain of $6,079,000 (2017: gain of $2,071,000). The total intrinsic value at December 31, 2018 was $19,425,000 (2017: $7,362,000) of which $8,722,000 is fully vested (2017: $2,965,000).
30. | Events after the reporting year |
On January 4, 2019, Farfetch Limited completed the acquisition of 100% of outstanding shares of Stadium Goods, the premier sneaker and streetwear marketplace with total consideration of $240,200,000. The Group expects to benefit from Stadium Goods’ brand, access to supply, and a team which will join the Group, bringing with them a strong passion for, and knowledge of, luxury streetwear. The consideration payable by the Group is in the form of cash and Farfetch Limited shares. The consideration payable was split as $150,200,000 of cash, and 4,641,554 Class A Ordinary Shares with a value of $90,000,000 based on the Farfetch share price at the acquisition date.
The transaction will be accounted for as a business combination under IFRS 3. Of the $90,000,000 share consideration, $58,100,000 includes a service condition for certain members of the Stadium Goods management team remaining with the Group over a four-year period. This does not satisfy the IFRS 3 definition of consideration and will be recognized as an expense in the statement of operations over the four-year service period as a share-based payment expense. Therefore, under IFRS 3, the consideration is $182,100,000 consisting of $150,200,000 cash consideration and $31,900,000 share consideration, none of which is contingent on future performance or service conditions.
Based on our preliminary purchase price allocation, which we expect to complete in Q1 2019 following finalization of the work, the total accounting consideration of $182,100,000, relates to the following: Net identified liabilities acquired of $8,900,000, comprising $2,400,000 of non-current assets, $(100,000) of net working capital, $800,000 of inventory, and $12,000,000 of provisions for withholding and sales taxes. $221,400,000 is allocated to goodwill and identifiable intangible assets acquired, comprising goodwill of $104,500,000 and the Stadium Goods Brand name of $116,900,000. Finally, there is a deferred tax liability of $30,400,000 in respect of the brand name.
Goodwill consists of expected synergies to be achieved by combining the operations of Stadium Goods with the Group, as well as other intangible assets that do not qualify for separate recognition under IFRS 3. Goodwill is not expected to be deductible for tax purposes.
In January 2019, the functional currency of Farfetch UK Limited, the Group’s primary trading entity, changed from pound sterling to U.S dollar. This was a result of a gradual change in the primary economic environment in which Farfetch UK Limited operates driven by the growth of consumers where the Group receives U.S. Dollars in settlement. This is combined with an increase in costs influenced by movements in the U.S dollar. The Group’s corporate treasury function continually monitors the Group’s exposure to foreign currencies movements, as described in note 28. Following the gradual change described above, the Group determined that, whilst Farfetch UK Limited is exposed to movements in several key currencies including U.S dollars, euros and
F-41
Notes to the consolidated financial statements (continued)
pound sterling, on reviewing Farfetch UK Limited’s expected receipts and expenses, U.S dollars had become the dominant currency from January 2019. This has hence triggered a change in functional currency.
On February 26, 2019, the Group entered into an Asset Purchase Agreement with Shanghai Yuanmai Trading Co., Ltd. to purchase “Level 1 Access” to the JD.com app, Toplife customer data, certain intellectual property and certain non-current assets for cash consideration of $50 million. The transaction will be accounted for as a business combination under IFRS 3 with the assets acquired constituting a business as defined by IFRS 3. Given the timing of the transaction, the Group is still finalizing the purchase price allocation and expects this to be completed by the end of the first quarter 2019. JD.com is a related party of the Group by virtue of the shareholding it has in the Group. Richard Liu, the founder, Chairman and Chief Executive Officer of JD.com, is a former director of the Board of Farfetch Limited. Dr. Jon Jainwen Liao, the Chief Strategy Officer of JD.com joined the board of Farfetch Limited in February 2019, following the departure of Richard Liu.
There have been no other events after the reporting year.
F-42