UNITED STATES
SECURITIES AND EXCHANGE COMMISSION
Washington, D.C. 20549
FORM N-CSR
CERTIFIED SHAREHOLDER REPORT OF REGISTERED MANAGEMENT INVESTMENT COMPANIES
Investment Company Act file number (811-23377)
Tidal ETF Trust
(Exact name of registrant as specified in charter)
898 N. Broadway, Suite 2
Massapequa, New York 11758
(Address of principal executive offices) (Zip code)
Eric W. Falkeis
Tidal ETF Trust
898 N. Broadway, Suite 2
Massapequa, New York 11758
(Name and address of agent for service)
(844) 986-7676
Registrant’s telephone number, including area code
Date of fiscal year end: August 31
Date of reporting period: August 31, 2021
Item 1. Reports to Stockholders.
Leatherback Long/Short Alternative Yield ETF
Ticker: LBAY
Annual Report
August 31, 2021
Leatherback Long/Short Alternative Yield ETF
This report is not authorized for distribution to prospective investors in the Fund unless preceded or accompanied by an effective prospectus.
Leatherback Long/Short Alternative Yield ETF
Dear Shareholders,
Leatherback Asset Management, LLC launched the Leatherback Long/Short Alternative Yield ETF (the “Fund”) on November 16, 2020. The Fund’s investment objective is to seek capital appreciation and income.
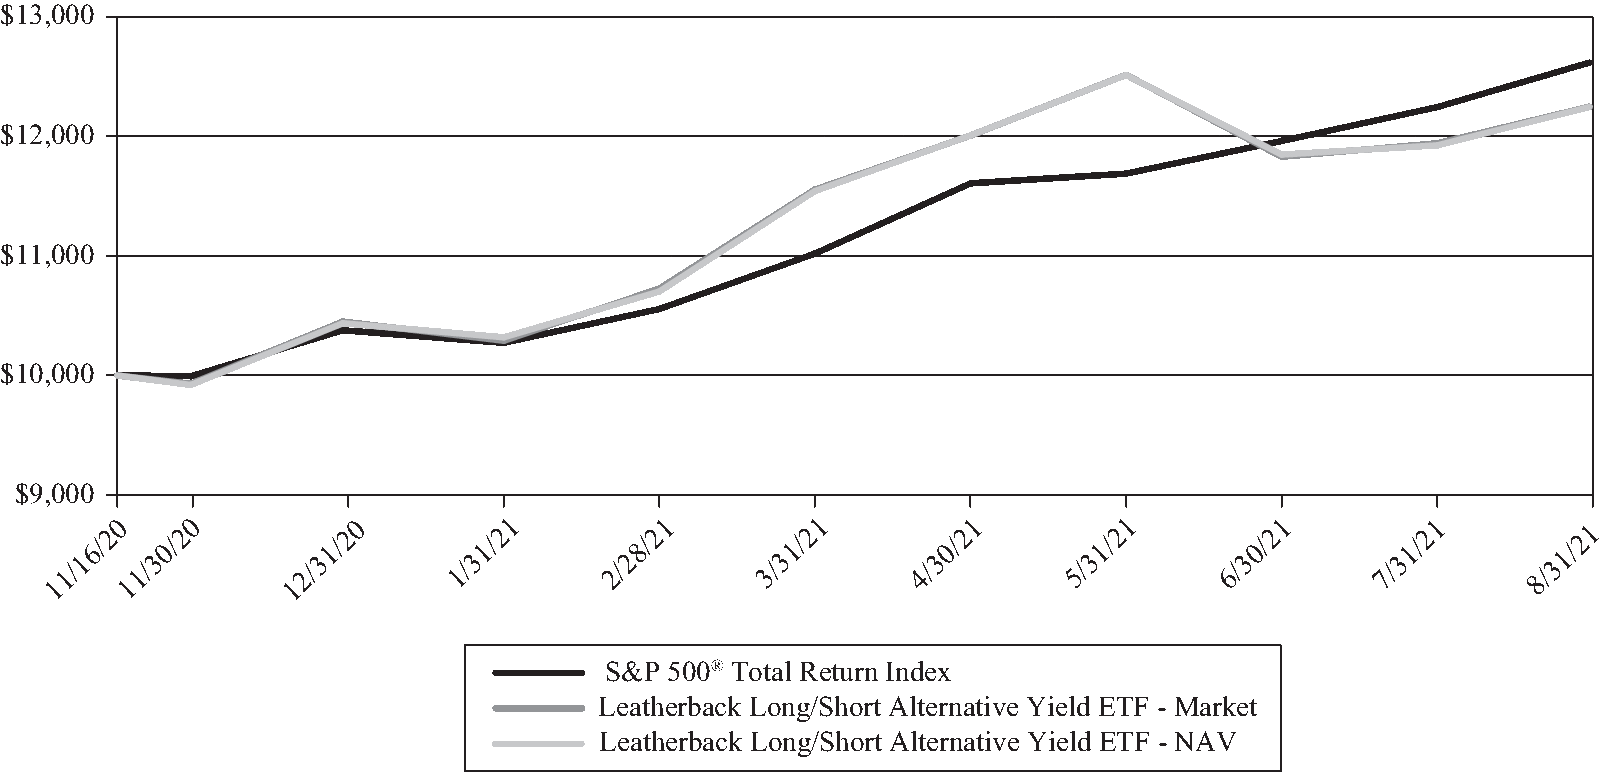
Since inception through the period ended August 31, 2021, the Fund generated a total return of 22.46% (NAV) and 22.49% (Market). This compares to the 26.17% total return of the benchmark, the S&P 500® Total Return Index. The Fund’s NAV has appreciated by $3.92 and the Fund has returned $0.54 in distributions. As of August 31, 2021, the Fund had long exposure of 125.89% and short exposure of -27.66%, resulting in a net exposure of 98.23%.
The beginning of 2021 has been eventful and provided a multitude of opportunities for our long/short investment strategy.
•We ended last year with the beginning of the much-anticipated COVID-19 vaccine rollout, which was brought to market earlier than many experts had expected. With the approval process for multiple alternatives being completed and several vaccines available, we saw the trajectory of immunizations increase exponentially. Coupling the rate of infection with vaccine deliveries, a reopening of segments of the country and broader global economy took shape earlier than anticipated. Notably, we were long positions that we felt would benefit for a re-opening of the economy, and, conversely, short companies that we thought could decline in price. Long positions included several banks where credit quality improved as the economy strengthened. Short positions included consumer-related names that pulled forward demand during the pandemic.
•In January 2021, we witnessed several weeks of market volatility and a short-selling narrative in the headlines, with short-sellers being cast as the villain. There were suspected short-squeezes taking place in a handful of out-of-favor but now high-profile names. S&P 500 stock short interest continues to remain very low which we believe is a constructive setup for our long/short strategy.
•During February and into March 2021, headlines of the consumer starting to step back out in force were accompanied by a rise in interest rates, albeit still at historically low levels. The Federal Reserve and Bond Market participants seemed to be at a temporary impasse over inflation expectations and the telegraphed tapering of open market operations, which was keeping U.S. Treasury yields in a range. Equity markets responded to these trends in kind with sector rotation and a recalibration of valuations. Financial stocks benefited where we have long exposure.
•The discussion had turned to inflationary pressures during the second quarter of 2021, and how this paradigm would potentially impact the economy on a going forward basis. The counterpart in the discussion was what the tenor of these pressures would be, which has been referred to by the Federal Reserve as transitory. In late June 2021, we then saw the Federal Open Market Committee (“FOMC”) convey to market participants that they would begin discussing reducing, or tapering, open market purchases. This meeting seemed to cause the changes we saw in February 2021 through early June 2021 to reverse course. We viewed this as temporary and added to several high conviction long positions on weakness.
•In July 2021, we saw renewed interest in the rising prices of consumer goods and producer input costs, current and expected employment metrics, and discussions surrounding the overall direction of economic growth. The dichotomy between the number of Americans that are without a job compared to the amount of available job openings was the riddle of the day that required solving.
•In August 2021, the U.S. equity market sector appeared to maintain repositioning back-and-forth off the back of the June FOMC meeting. Interest rates, as reflected by rates on U.S. Treasury borrowings, remained in a range with a continued focus on which direction would be next. Market participants began to be mindful of how the next FOMC meeting would go, and if inflation and employment would prompt the Fed to act on the tapering discussion, as well as how the upcoming debt ceiling tango would play out.
These themes have led to opportunities in both the long and short space. Presently, we maintain several long positions that we view as attractively valued on both an absolute and relative basis. These names also generate income via dividends, many of which we believe have opportunities to grow these payouts. On the short side of the book, we maintain shorts in high valuation companies with, in our opinion, limited prospects to near-term profitability. As we wrap up the month of August 2021 and our first annual report, we want to thank our corporate and investor partners. We look forward to future dialogue and working together to continue changing the game.
For any questions about the Fund please reach out to us at (833) 417-0090. You may also visit our website at www.leatherbackam.com or reach us via email at info@leatherbackam.com.
Leatherback Asset Management
Leatherback Long/Short Alternative Yield ETF
The performance data quoted represents past performance. Past performance does not guarantee future results. The investment return and principal value of an investment will fluctuate so that an investor’s shares, when sold or redeemed, may be worth more or less than their original cost and current performance may be lower or higher than the performance quoted. Performance current to the most recent month-end can be obtained by calling (833) 417-0090.
A fund’s net asset value (“NAV”) per share is the sum of all its assets less any liabilities, divided by the number of shares outstanding. The market price is the most recent price at which the fund was traded.
As with all exchange-traded funds, Fund shares may be bought and sold in the secondary market at market prices. The market price normally should approximate the Fund’s NAV per share, but the market price sometimes may be higher or lower than the NAV. The Fund is newer with a limited operating history. There are a limited number of financial institutions authorized to buy and sell shares directly with the Fund; and there may be a limited number of other liquidity providers in the marketplace. There is no assurance that Fund shares will trade at any volume, or at all, on any stock exchange. Low trading activity may result in shares trading at a material discount to NAV.
“Long” and “short” are investment terms used to describe ownership of securities. To buy securities is to “go long.” The opposite of going long is “selling short.” Short selling is an advanced trading strategy that involves selling a borrowed security. Short sellers make a profit if the price of the security goes down and they are able to buy the security at a lower amount than the price at which they sold the security short.
The S&P 500® Total Return Index is an index of 500 large-capitalization companies selected by Standard & Poor’s Financial Services LLC.
Since the Fund is actively-managed it does not seek to replicate the performance of a specified index. The Fund therefore may have higher portfolio turnover and trading costs than index-based funds. The Fund may invest in other funds, and in so doing will incur the expenses and risks of those funds.
The Fund uses short sales and derivatives (forwards, futures, swaps, and options), both of which may involve substantial risk. The loss on a short sale is in principle unlimited since there is no upward limit on the price of a shorted asset. The potential loss from a derivative may be greater than the amount invested due to counter-party default; illiquidity; or other factors. The Fund may hold illiquid assets (e.g., certain business development companies), to the extent permitted under the Investment Company Act of 1940, as amended, which may cause a loss if the Fund is unable to sell an asset at a beneficial time or price.
The Fund is distributed by Foreside Fund Services, LLC.
Leatherback Long/Short Alternative Yield ETF
PERFORMANCE SUMMARY (Unaudited)
| | | | |
Total Return for the period ended August 31, 2021: | | Since Inception
(11/16/2020) | | Ending Value
(8/31/2021) |
Leatherback Long/Short Alternative Yield ETF - NAV | | 22.46% | | $12,246 |
Leatherback Long/Short Alternative Yield ETF - Market | | 22.49% | | 12,249 |
S&P 500® Total Return Index | | 26.17% | | 12,617 |
This chart illustrates the performance of a hypothetical $10,000 investment made on November 16, 2020 (commencement of operations), and is not intended to imply any future performance. The returns shown do not reflect the deduction of taxes that a shareholder would pay on fund distributions or the redemption of fund shares. The chart assumes reinvestment of capital gains, dividends, and return of capital, if applicable, for a fund and dividends for an index.
Performance data quoted represents past performance and does not guarantee future results. The investment return and principal value of an investment will fluctuate so that an investor’s shares, when redeemed, may be worth more or less than their original cost. Current performance of the Fund may be lower or higher than the performance quoted. Performance data current to the most recent month end may be obtained by calling (833) 417-0090. The Fund’s gross expense ratio is 1.09% (as of the Fund’s most recently filed Prospectus).
Leatherback Long/Short Alternative Yield ETF
| | | |
ALLOCATION OF PORTFOLIO HOLDINGS at August 31, 2021 (Unaudited) |
| |
Sector | % of Total
Investments |
Financial | | 36.8 | % |
Consumer (Non-Cyclical) | | 19.6 | |
Basic Materials | | 13.0 | |
Industrial | | 8.3 | |
Consumer (Cyclical) | | 6.5 | |
Energy | | 5.7 | |
Communications | | 4.6 | |
Cash & Cash Equivalents (1) | | 3.3 | |
Utilities | | 2.2 | |
| | 100.0 | % |
| | | |
ALLOCATION OF SECURITIES SOLD SHORT at August 31, 2021 (Unaudited) |
| | | |
Sector | % of Total
Securities
Sold Short |
Consumer (Cyclical) | | 50.8 | % |
Financial | | 24.6 | |
Communications | | 11.4 | |
Technology | | 8.5 | |
Consumer (Non-Cyclical) | | 4.7 | |
| | 100.0 | % |
(1)Represents cash, short-term investments and liabilities in excess of other assets.
Leatherback Long/Short Alternative Yield ETF
The accompanying notes are an integral part of these financial statements.
| | | | | |
SCHEDULE OF INVESTMENTS at August 31, 2021 | |
| | | | | |
| | | | |
| Shares | | Value | |
Common Stocks — 122.0% | | | | |
| | | | |
Aerospace & Defense — 3.2% | | | | |
Raytheon Technologies Corp(1) | 2,234 | | $189,354
| |
| | | | |
Agriculture — 5.0% | | | | |
Bunge Ltd.(1) | 3,977 | | 301,099 | |
| | | | |
Banks — 8.3% | | | | |
Comerica, Inc.(1) | 3,539 | | 261,568 | |
Popular, Inc.(1) | 3,066 | | 232,832 | |
| | | 494,400 | |
| | | | |
Building Materials — 4.3% | | | | |
Carrier Global Corp.(1) | 4,461 | | 256,954 | |
| | | | |
Chemicals — 6.8% | | | | |
Dow, Inc.(1)(2) | 3,514 | | 221,031 | |
Nutrien Ltd.(1) | 3,054 | | 185,347 | |
| | | 406,378 | |
| | | | |
Commercial Services — 3.3% | | | | |
H&R Block, Inc.(1) | 7,753 | | 198,864 | |
| | | | |
Diversified Financial Services — 6.7% | | | | |
The Charles Schwab Corp.(1) | 2,394 | | 174,403 | |
WisdomTree Investments, Inc.(1) | 35,522 | | 224,144 | |
| | | 398,547 | |
| | | | |
Energy - Alternate Sources — 2.8% | | | | |
NextEra Energy Partners L.P.(1) | 2,095 | | 167,453 | |
| | | | |
Entertainment — 2.5% | | | | |
Vail Resorts, Inc.(1) | 498 | | 151,815 | |
| | | | |
Food — 3.0% | | | | |
Lamb Weston Holdings, Inc.(1) | 2,722 | | 177,338 | |
| | | | |
Forest Products & Paper — 3.0% | | | | |
International Paper Co.(1) | 2,969 | | 178,407 | |
| | | | |
Healthcare — Products — 3.5% | | | | |
Zimmer Biomet Holdings, Inc. | 1,415 | | 212,887 | |
| | | | |
Home Builders — 2.8% | | | | |
Thor Industries, Inc.(1) | 1,468 | | 166,515 | |
| | | | |
Insurance — 7.9% | | | | |
MGIC Investment Corp.(1)(2) | 11,989 | | 183,072 | |
Old Republic International Corp.(1) | 11,048 | | 287,248 | |
| | | 470,320 | |
| | | | |
| | | | |
| Shares | | Value | |
Common Stocks — 122.0% (Continued) | | | |
| | | | |
Investment Companies — 6.1% | | | | |
Ares Capital Corp.(1) | 9,115 | | $181,389
| |
Golub Capital BDC, Inc.(1) | 11,626 | | 182,644 | |
| | | 364,033 | |
| | | | |
Media — 3.6% | | | | |
Comcast Corp. - Class A(1) | 3,534 | | 214,443 | |
| | | | |
Mining — 7.1% | | | | |
Newmont Corp.(1) | 4,499 | | 260,897 | |
Rio Tinto PLC - ADR(1)(2) | 2,180 | | 163,653 | |
| | | 424,550 | |
| | | | |
Oil & Gas — 4.7% | | | | |
Exxon Mobil Corp.(1) | 5,129 | | 279,633 | |
| | | | |
Packaging & Containers — 3.3% | | | | |
Packaging Corp. of America(1)(2) | 1,316 | | 199,637 | |
| | | | |
Pharmaceuticals — 10.6% | | | | |
AbbVie, Inc.(1) | 1,854 | | 223,926 | |
Bristol-Myers Squibb Co.(1) | 2,659 | | 177,781 | |
Viatris, Inc.(1) | 16,104 | | 235,601 | |
| | | 637,308 | |
| | | | |
Real Estate Investment Trusts (REITs) — 15.2% | | | |
AGNC Investment Corp.(1) | 11,629 | | 297,354 | |
American Campus Communities, Inc.(1) | 3,899 | | 198,264 | |
American Tower Corp.(1) | 825 | | 241,040 | |
PotlatchDeltic Corp.(1)(2) | 3,344 | | 173,721 | |
| | | 910,379 | |
| | | | |
Retail — 3.1% | | | | |
Walgreens Boots Alliance, Inc.(1) | 3,631 | | 184,273 | |
| | | | |
Telecommunications — 2.4% | | | | |
Verizon Communications, Inc.(1) | 2,567 | | 141,185 | |
| | | | |
Water — 2.8% | | | | |
American Water Works Co., Inc.(1) | 936 | | 170,586 | |
| | | | |
Total Common Stocks | | | | |
(Cost $6,428,547) | | | 7,296,358 | |
| | | | |
Convertible Preferred Stocks — 3.9% | | | | |
| | | | |
Real Estate Investment Trusts (REITs) — 3.9% | | | |
EPR Properties | 8,842 | | 230,953 | |
5.750%(3) | | | | |
| | | | |
Total Convertible Preferred Stocks | | | | |
(Cost $209,301) | | | 230,953 | |
| | | | |
Leatherback Long/Short Alternative Yield ETF
The accompanying notes are an integral part of these financial statements.
| | | | |
| Shares | | Value | |
Short-Term Investments — 1.3% | | | | |
| | | | |
Money Market Funds — 1.3% | | | | |
First American Government
Obligations Fund - Class X, 0.030%(4) | 76,352 | | $76,352
| |
| | | | |
Total Short-Term Investments | | | | |
(Cost $76,352) | | | 76,352 | |
| | | | |
Investments Purchased with Collateral from
Securities Lending — 3.0% | |
Mount Vernon Liquid Assets Portfolio, LLC, 0.090%(4) | 182,723 | | 182,723 | |
| | | | |
Total Investments Purchased with Collateral From Securities Lending | | | | |
(Cost $182,723) | | | 182,723 | |
| | | | |
Total Investments in Securities — 130.2% | | | |
(Cost $6,896,923) | | | 7,786,386 | |
Liabilities in Excess of Other
Assets — (30.2)% | | | (1,807,359 | ) |
| | | | |
Total Net Assets —- 100.0% | | | $5,979,027
| |
| |
ADR | American Depositary Receipt |
(1) | All or a portion of the shares of this security have been committed as collateral for securities sold short. |
(2) | This security or a portion of this security was out on loan as of August 31, 2021. Total loaned securities had a value of $177,667 or 3.0% of net assets as of August 31, 2021. The remaining contractual maturity of all of the securities lending transactions is overnight and continuous. |
(3) | Perpetual maturity. |
(4) | The rate shown is the annualized seven-day effective yield as of August 31, 2021. |
| | | | | |
SCHEDULE OF INVESTMENTS at August 31, 2021 (Continued) | |
| | | | | |
Leatherback Long/Short Alternative Yield ETF
The accompanying notes are an integral part of these financial statements.
| | | | | |
SCHEDULE OF SECURITIES SOLD SHORT at August 31, 2021(1) | |
| | | | | |
| | | | |
| Shares | | Value | |
Common Stocks — 27.7% | | | | |
| | | | |
Auto Manufacturers — 3.0% | | | | |
NIO, Inc. - Class A - ADR | 1,850 | | $72,723
| |
Tesla, Inc. | 144 | | 105,944 | |
| | | 178,667 | |
| | | | |
Banks — 1.5% | | | | |
SVB Financial Group | 160 | | 89,520 | |
| | | | |
Computers — 1.2% | | | | |
Logitech International S.A. | 701 | | 71,747 | |
| | | | |
Diversified Financial Services — 3.9% | | | | |
BlackRock, Inc. | 88 | | 83,010 | |
Focus Financial Partners, Inc. - Class A | 1,619 | | 83,994 | |
Stifel Financial Corp. | 943 | | 65,161 | |
| | | 232,165 | |
| | | | |
Entertainment — 3.0% | | | | |
DraftKings, Inc. - Class A | 1,875 | | 111,169 | |
SeaWorld Entertainment, Inc. | 1,437 | | 70,686 | |
| | | 181,855 | |
| | | | |
Food — 1.3% | | | | |
Utz Brands, Inc. - Class A | 3,960 | | 76,903 | |
| | | | |
Insurance — 1.4% | | | | |
Trupanion, Inc. | 931 | | 85,261 | |
| | | | |
Internet — 3.2% | | | | |
Netflix, Inc. | 171 | | 97,331 | |
Shopify, Inc. - Class A | 60 | | 91,487 | |
| | | 188,818 | |
| | | | |
Leisure Time — 3.1% | | | | |
Peloton Interactive, Inc. - Class A | 811 | | 81,254 | |
YETI Holdings, Inc. | 1,033 | | 102,618 | |
| | | 183,872 | |
| | | | |
Retail — 4.9% | | | | |
CarMax, Inc. | 652 | | 81,637 | |
Carvana Co. - Class A | 219 | | 71,845 | |
Dave & Buster’s Entertainment, Inc. | 1,726 | | 64,587 | |
Ollie’s Bargain Outlet Holdings, Inc. | 1,058 | | 76,578 | |
| | | 294,647 | |
| | | | |
| | | | |
| Shares | | Value | |
Common Stocks — 27.7% | | | | |
| | | | |
Software — 1.2% | | | | |
Zoom Video Communications, Inc. - Class A | 240 | | $69,480
| |
| | | | |
Total Common Stocks | | | | |
(Cost $(1,592,319)) | | | 1,652,935 | |
| | | | |
Total Securities Sold Short — 27.7% | | | | |
(Proceeds $1,592,319) | | | $1,652,935
| |
| |
ADR | American Depositary Receipt |
(1) | Non-income producing security. |
Leatherback Long/Short Alternative Yield ETF
The accompanying notes are an integral part of these financial statements.
| | | |
STATEMENT OF ASSETS AND LIABILITIES at August 31, 2021 |
| | | |
Assets: | | | |
Investments in securities, at value (Cost $6,896,923) (Note 2)(1) | | $7,786,386
| |
Collateral at broker for securities sold short | | 17,465 | |
Receivables: | | | |
Dividends and interest | | 30,722 | |
Securities lending (Note 5) | | 11 | |
Total assets | | 7,834,584 | |
| | | |
Liabilities: | | | |
Collateral received from securities loaned (Note 5) | | 182,723 | |
Securities sold short (Proceeds $1,592,319) (Note 2) | | 1,652,935 | |
Payables: | | | |
Distributions | | 15,000 | |
Dividends on securities sold short | | 141 | |
Management fees (Note 4) | | 4,758 | |
Total liabilities | | 1,855,557 | |
Net Assets | | $5,979,027
| |
| | | |
Components of Net Assets: | | | |
Paid-in capital | | $5,187,552
| |
Total distributable (accumulated) earnings (losses) | | 791,475 | |
Net assets | | $5,979,027
| |
| | | |
Net Asset Value (unlimited shares authorized): | | | |
Net assets | | $5,979,027
| |
Shares of beneficial interest issued and outstanding | | 250,000 | |
Net asset value | | $23.92
| |
(1)Includes loaned securities with a value of $177,667.
Leatherback Long/Short Alternative Yield ETF
The accompanying notes are an integral part of these financial statements.
| | | |
STATEMENT OF OPERATIONS For the Period Ended August 31, 2021(1) | |
| | | |
Investment Income: | | | |
Dividend income (net of foreign withholding tax of $1,097) | | $159,710
| |
Interest income | | 251 | |
Securities lending income (Note 5) | | 51 | |
Total investment income | | 160,012 | |
| | | |
Expenses: | | | |
Management fees (Note 4) | | 36,941 | |
Total expenses before dividends on securities sold short and interest | | 36,941 | |
Dividends on securities sold short | | 1,660 | |
Interest | | 9,320 | |
Net expenses | | 47,921 | |
Net investment income (loss) | | 112,091 | |
| | | |
Realized and Unrealized Gain (Loss) on Investments, Securities Sold Short, and Options Written: | | | |
Net realized gain (loss) on: | | | |
Investments | | 253,264 | |
Securities sold short | | (285,771 | ) |
Options written | | 7,544 | |
Change in net unrealized appreciation/depreciation on: | | | |
Investments | | 889,463 | |
Securities sold short | | (60,616 | ) |
Net realized and unrealized gain (loss) on investments, securities sold short, and options written | | 803,884 | |
Net increase (decrease) in net assets resulting from operations | | $915,975
| |
(1)The Fund commenced operations on November 16, 2020. The information presented is from November 16, 2020 to August 31, 2021.
Leatherback Long/Short Alternative Yield ETF
The accompanying notes are an integral part of these financial statements.
| | | |
STATEMENT OF CHANGES IN NET ASSETS | |
| | | |
| | Period Ended August 31, 2021(1) | |
| | | |
Increase (Decrease) in Net Assets From: | | | |
| | | |
Operations: | | | |
Net investment income (loss) | | $112,091
| |
Net realized gain (loss) on investments, securities sold short, and options written | | (24,963 | ) |
Change in net unrealized appreciation/depreciation on investments and securities sold short | | 828,847 | |
Net increase (decrease) in net assets resulting from operations | | 915,975 | |
| | | |
Distributions to Shareholders: | | | |
Net distributions to shareholders | | (124,500 | ) |
| | | |
Capital Share Transactions: | | | |
Net increase (decrease) in net assets derived from net change in outstanding shares(2) | | 5,187,552 | |
Total increase (decrease) in net assets | | 5,979,027 | |
| | | |
Net Assets: | | | |
Beginning of period | | — | |
End of period | | $5,979,027
| |
(1)The Fund commenced operations on November 16, 2020. The information presented is from November 16, 2020 to August 31, 2021.
(2)Summary of share transactions is as follows:
| | | | | |
| | Period Ended
August 31, 2021(1) |
| | Shares | | Value |
Shares sold | | 250,000 | | $5,187,552
| |
Shares redeemed | | — | | — | |
Net increase (decrease) | | 250,000 | | $5,187,552
| |
Leatherback Long/Short Alternative Yield ETF
The accompanying notes are an integral part of these financial statements.
| | | |
FINANCIAL HIGHLIGHTS For a capital share outstanding throughout the period | |
| | | |
| | Period Ended
August 31, 2021(1) | |
Net asset value, beginning of period | | $20.00
| |
| | | |
Income (Loss) from Investment Operations: | | | |
Net investment income (loss)(2) | | 0.52 | |
Net realized and unrealized gain (loss) on investments | | 3.94 | |
Total from investment operations | | 4.46 | |
| | | |
Less Distributions: | | | |
From net investment income | | (0.54 | ) |
Total distributions | | (0.54 | ) |
| | | |
Net asset value, end of period | | $23.92
| |
Total return(3)(4) | | 22.46 | % |
| | | |
Ratios / Supplemental Data: | | | |
Net assets, end of period (millions) | | $6.0
| |
Portfolio turnover rate(3) | | 47 | % |
Ratio of expenses to average net assets(5)(6) | | 1.23 | % |
Ratio of net investment income (loss) to average net assets(5)(7) | | 2.88 | % |
(1)The Fund commenced operations on November 16, 2020. The information presented is from November 16, 2020 to August 31, 2021.
(2)Calculated using average shares outstanding method.
(3)Not annualized.
(4)The total return is based on the Fund’s net asset value. Additional performance information is presented in the Performance Summary.
(5)Annualized.
(6)The ratio of expenses to average net assets includes dividends and interest on securities sold short. The expense ratio excluding dividends and interest on securities sold short is 0.95% for the period ended August 31, 2021.
(7)The net investment income (loss) ratios include dividends and interest on securities sold short.
Leatherback Long/Short Alternative Yield ETF
|
NOTES TO FINANCIAL STATEMENTS August 31, 2021 |
|
NOTE 1 – ORGANIZATION |
The Fund is a non-diversified series of shares of beneficial interest of Tidal ETF Trust (the “Trust”). The Trust was organized as a Delaware statutory trust on June 4, 2018 and is registered with the Securities and Exchange Commission (the “SEC”) under the Investment Company Act of 1940, as amended (the “1940 Act”), as an open-end management investment company and the offering of the Fund’s shares is registered under the Securities Act of 1933, as amended. The Fund is an investment company and accordingly follows the investment company accounting and reporting guidance of the Financial Accounting Standards Board (“FASB”) Accounting Standard Codification Topic 946 “Financial Services—Investment Companies.” The Fund commenced operations on November 16, 2020.
The investment objective of the Fund is to seek capital appreciation and income.
|
NOTE 2 – SIGNIFICANT ACCOUNTING POLICIES |
The following is a summary of significant accounting policies consistently followed by the Fund. These policies are in conformity with accounting principles generally accepted in the United States of America (“U.S. GAAP”).
A.Security Valuation. Equity securities, which may include Real Estate Investment Trusts (“REITs”), Business Development Companies (“BDCs”), and Master Limited Partnerships (“MLPs”), listed on a securities exchange, market or automated quotation system for which quotations are readily available (except for securities traded on the NASDAQ Stock Market, LLC (“NASDAQ”)), including securities traded over the counter, are valued at the last quoted sale price on the primary exchange or market (foreign or domestic) on which they are traded on the valuation date (or at approximately 4:00 p.m. EST if a security’s primary exchange is normally open at that time), or, if there is no such reported sale on the valuation date, at the most recent quoted bid price or mean between the most recent quoted bid and ask prices for long and short positions. For a security that trades on multiple exchanges, the primary exchange will generally be considered the exchange on which the security is generally most actively traded. For securities traded on NASDAQ, the NASDAQ Official Closing Price will be used. Prices of securities traded on the securities exchange will be obtained from recognized independent pricing agents (“Independent Pricing Agents”) each day that the Fund is open for business.
Exchange-traded options are valued at the composite price, using the National Best Bid and Offer quotes (“NBBO”). NBBO consists of the highest bid price and lowest ask price across any of the exchanges on which an option is quoted, thus providing a view across the entire U.S. options marketplace. Composite option pricing calculates the mean of the highest bid price and lowest ask price across the exchanges where the option is traded.
For securities for which quotations are not readily available, a fair value will be determined by the Valuation Committee using the Fair Value Procedures approved by the Trust’s Board of Trustees (the “Board”). When a security is “fair valued,” consideration is given to the facts and circumstances relevant to the particular situation, including a review of various factors set forth in the Fair Value Procedures adopted by the Board. Fair value pricing is an inherently subjective process, and no single standard exists for determining fair value. Different funds could reasonably arrive at different values for the same security. The use of fair value pricing by a fund may cause the net asset value of its shares to differ significantly from the net asset value that would be calculated without regard to such considerations.
As described above, the Fund utilizes various methods to measure the fair value of its investments on a recurring basis. U.S. GAAP establishes a hierarchy that prioritizes inputs to valuation methods. The three levels of inputs are:
Level 1 –Unadjusted quoted prices in active markets for identical assets or liabilities that the Fund has the ability to access.
Level 2 –Observable inputs other than quoted prices included in Level 1 that are observable for the asset or liability, either directly or indirectly. These inputs may include quoted prices for the identical instrument on an inactive market, prices for similar instruments, interest rates, prepayment speeds, credit risk, yield curves, default rates and similar data.
Level 3 –Unobservable inputs for the asset or liability, to the extent relevant observable inputs are not available; representing the Fund’s own assumptions about the assumptions a market participant would use in valuing the asset or liability and would be based on the best information available.
Leatherback Long/Short Alternative Yield ETF
The availability of observable inputs can vary from security to security and is affected by a wide variety of factors, including, for example, the type of security, whether the security is new and not yet established in the marketplace, the liquidity of markets, and other characteristics particular to the security. To the extent that valuation is based on models or inputs that are less observable or unobservable in the market, the determination of fair value requires more judgment. Accordingly, the degree of judgment exercised in determining fair value is greatest for instruments categorized in Level 3.
The inputs used to measure fair value may fall into different levels of the fair value hierarchy. In such cases, for disclosure purposes, the level in the fair value hierarchy within which the fair value measurement falls in its entirety, is determined based on the lowest level input that is significant to the fair value measurement in its entirety.
The following is a summary of the inputs used to value the Fund’s investments as of August 31, 2021:
| | | | | | | | | | |
Investments in Securities | | Investments
Measured at
Net Asset
Value | | Level 1 | | Level 2 | | Level 3 | | Total |
Common Stocks(1) | | $—
| | $7,296,358
| | $—
| | $—
| | $7,296,358
|
Preferred Stocks(1) | | — | | 230,953 | | — | | — | | 230,953 |
Short-Term Investments | | — | | 76,352 | | — | | — | | 76,362 |
Investments Purchased With Collateral From Securities Lending(2) | 182,723 | | — | | — | | — | | 182,723 |
Total Investments in Securities | | $182,723
| | 7,603,663 | | $—
| | $—
| | $7,786,386
|
| | | | | | | | | | |
Securities Sold Short | | | | Level 1 | | Level 2 | | Level 3 | | Total |
Common Stocks(1) | | $—
| | $1,652,935
| | $—
| | $—
| | $1,652,935
|
Total Securities Sold Short | | $—
| | $1,652,935
| | $—
| | $—
| | $1,652,935
|
(1)See Schedule of Investments for the industry breakout.
(2)Certain investments that are measured at fair value using the net asset value per share (or its equivalent) practical expedient have not been categorized in the fair value hierarchy. The fair value amounts presented in the table are intended to permit reconciliation of the fair value hierarchy to the amounts presented in the Schedule of Investments.
The Fund has adopted financial reporting rules and regulations that require enhanced disclosure regarding derivatives and hedging activity intending to improve financial reporting of derivative instruments by enabling investors to understand how an entity uses derivatives, how derivatives are accounted for, and how derivative instruments affect an entity’s results of operations and financial position.
The Fund may invest in options on equities and stock indices that may be used to modify or hedge the Fund’s exposure to a particular investment market related risk, as well as to manage the volatility of the Fund. The following table shows the effects of derivative instruments on the financial statements.
Statement of Assets and Liabilities
The Fund did not hold derivative instruments as of the period ended August 31, 2021.
Statement of Operations
The effect of derivative instruments on the Statement of Operations for the period ended August 31, 2021:
| | | | | | |
Instrument | | Location of Gain (Loss) on
Derivatives
Recognized in Income | | Realized Gain (Loss) on
Derivatives
Recognized in Income | | Change in Unrealized
Appreciation/Depreciation
on Derivatives Recognized
in Income |
Equity Contracts – Call Options
Written | | Net Realized Gain (Loss) on
Options Written | | $7,544 | | $ — |
|
NOTES TO FINANCIAL STATEMENTS August 31, 2021 (Continued) |
Leatherback Long/Short Alternative Yield ETF
B.Federal Income Taxes. The Fund has elected to be taxed as a “regulated investment company” and intends to distribute substantially all taxable income to its shareholders and otherwise comply with the provisions of the Internal Revenue Code applicable to regulated investment companies. Therefore, no provision for federal income taxes or excise taxes has been made.
In order to avoid imposition of the excise tax applicable to regulated investment companies, the Fund intends to declare as dividends in each calendar year at least 98.0% of its net investment income (earned during the calendar year) and at least 98.2% of its net realized capital gains (earned during the twelve months ended October 31) plus undistributed amounts, if any, from prior years.
As of August 31, 2021, the Fund did not have any tax positions that did not meet the threshold of being sustained by the applicable tax authority. Generally, tax authorities can examine all the tax returns filed for the last three years. The Fund identifies its major tax jurisdiction as U.S. Federal and the Commonwealth of Delaware; however, the Fund is not aware of any tax positions for which it is reasonably possible that the total amounts of unrecognized tax benefits will change materially.
C.Securities Transactions and Investment Income. Investment securities transactions are accounted for on the trade date. Gains and losses realized on sales of securities are determined on a specific identification basis. Discounts/premiums on debt securities purchased are accreted/amortized over the life of the respective securities using the effective interest method. Dividend income is recorded on the ex-dividend date. Dividends received from REITs generally are comprised of ordinary income, capital gains, and may include return of capital. Debt income is recorded on an accrual basis. Other non-cash dividends are recognized as investment income at the fair value of the property received. Withholding taxes on foreign dividends have been provided for in accordance with the Trust’s understanding of the applicable country’s tax rules and rates.
D.Options Contracts. The Fund may invest in options contracts that may be used to modify or hedge the Fund’s exposure to a particular investment market related risk, as well as to manage the volatility of the Fund. When the Fund purchases an option, an amount equal to the premium paid by the Fund is recorded as an investment and is subsequently adjusted to the current value of the option purchased. If an option expires on the stipulated expiration date or if the Fund enters into a closing sale transaction, a gain or loss is realized. If a call option is exercised, the cost of the security acquired is increased by the premium paid for the call. If a put option is exercised, a gain or loss is realized from the sale of the underlying security, and the proceeds from such sale are decreased by the premium originally paid. Options are non-income producing securities.
E. Distributions to Shareholders. Distributions to shareholders from net investment income, if any, for the Fund are declared and paid at least monthly. Distributions to shareholders from net realized gains on securities, if any, for the Fund normally are declared and paid on an annual basis. Distributions are recorded on the ex-dividend date.
F. Use of Estimates. The preparation of financial statements in conformity with U.S. GAAP requires management to make estimates and assumptions that affect the reported amounts of assets and liabilities at the date of the financial statements and the reported amount of revenue and expenses during the reporting period. Actual results could differ from those estimates.
G. Share Valuation. The NAV per share of the Fund is calculated by dividing the sum of the value of the securities held by the Fund, plus cash or other assets, minus all liabilities by the total number of shares outstanding for the Fund, rounded to the nearest cent. The Fund’s shares will not be priced on the days on which the New York Stock Exchange (“NYSE”) is closed for trading.
H. Guarantees and Indemnifications. In the normal course of business, the Fund enters into contracts with service providers that contain general indemnification clauses. The Fund’s maximum exposure under these arrangements is unknown as this would involve future claims that may be made against the Fund that have not yet occurred. However, based on experience, the Fund expects the risk of loss to be remote.
I.Illiquid Securities. Pursuant to Rule 22e-4 under the 1940 Act, the Fund has adopted a Board-approved Liquidity Risk Management Program (“the Program”) that requires, among other things, that the Fund limit its illiquid investments that are assets to no more than 15% of the value of the Fund’s net assets. An illiquid investment is any security that the Fund reasonably expects cannot be sold or disposed of in current market conditions in seven calendar days or less without the sale or disposition significantly changing the market value of the investment. If the Fund should be in a position where the value of illiquid investments held by the Fund exceeds 15% of the Fund’s net assets, the Fund will take such steps as set forth in the Program.
|
NOTES TO FINANCIAL STATEMENTS August 31, 2021 (Continued) |
Leatherback Long/Short Alternative Yield ETF
J.Reclassification of Capital Accounts. U.S. GAAP requires that certain components of net assets relating to permanent differences be reclassified between financial and tax reporting. These reclassifications have no effect on net assets or NAV per share. For the period ended August 31, 2021, no adjustments were made for the Fund.
|
NOTE 3 – PRINCIPAL INVESTMENT RISKS |
A.Associated Risks of Short Selling. The Fund may make short sales of securities, which involves selling a security it does not own in anticipation that the price of the security will decline. Short sales may involve substantial risk and leverage. Short sales expose the Fund to the risk that it will be required to buy (“cover”) the security sold short when the security has appreciated in value or is unavailable, thus resulting in a loss to the Fund. Short sales also involve the risk that losses may exceed the amount invested and may be unlimited.
B.Convertible Securities Risk. Convertible securities rank senior to the issuer’s common stock, but may be subordinate to senior debt obligations. In part, the total return for a convertible security may depend upon the performance of the underlying stock into which it can be converted. Synthetic convertibles may respond differently to market fluctuations than traditional convertible securities. They are also subject to counterparty risk.
C.Depositary Receipt Risk. Depositary receipts involve risks similar to those associated with investments in foreign securities and certain additional risks. Depositary receipts listed on U.S. exchanges are issued by banks or trust companies, and entitle the holder to all dividends and capital gains that are paid out on the underlying foreign shares (“Underlying Shares”). When the Fund invests in depositary receipts as a substitute for an investment directly in the Underlying Shares, the Fund is exposed to the risk that the depositary receipts may not provide a return that corresponds precisely with that of the Underlying Shares.
D.Equity Market Risk. The equity securities held in the Fund’s portfolio may experience sudden, unpredictable drops in value or long periods of decline in value. This may occur because of factors that affect securities markets generally or factors affecting specific issuers, industries, or sectors in which the Fund invests. Common stocks, such as those held by the Fund, are generally exposed to greater risk than other types of securities, such as preferred stock and debt obligations, because common stockholders generally have inferior rights to receive payment from issuers. Securities in the Fund’s portfolio may underperform in comparison to securities in the general financial markets, a particular financial market, or other asset classes, due to a number of factors, including inflation (or expectations for inflation), interest rates, global demand for particular products or resources, natural disasters or events, pandemic diseases, terrorism, regulatory events, or government controls.
E.Exchange Traded Fund (“ETF”) Risks.
•Authorized Participants, Market Makers, and Liquidity Providers Concentration Risk. The Fund has a limited number of financial institutions that are authorized to purchase and redeem Shares directly from the Fund (known as “Authorized Participants” or “APs”). In addition, there may be a limited number of market makers and/or liquidity providers in the marketplace. To the extent either of the following events occur, Shares may trade at a material discount to NAV and possibly face delisting: (i) APs exit the business or otherwise become unable to process creation and/or redemption orders and no other APs step forward to perform these services; or (ii) market makers and/or liquidity providers exit the business or significantly reduce their business activities and no other entities step forward to perform their functions.
•Cash Redemption Risk. The Fund’s investment strategy may require it to redeem Shares for cash or to otherwise include cash as part of its redemption proceeds. For example, the Fund may not be able to redeem in-kind certain securities held by the Fund (e.g., TBA transactions, short positions, derivative instruments, and bonds that cannot be broken up beyond certain minimum sizes needed for transfer and settlement). In such a case, the Fund may be required to sell or unwind portfolio investments to obtain the cash needed to distribute redemption proceeds. This may cause the Fund to recognize a capital gain that it might not have recognized if it had made a redemption in-kind. As a result, the Fund may pay out higher annual capital gain distributions than if the in-kind redemption process was used.
•Costs of Buying or Selling Shares. Due to the costs of buying or selling Shares, including brokerage commissions imposed by brokers and bid-ask spreads, frequent trading of Shares may significantly reduce investment results and an investment in Shares may not be advisable for investors who anticipate regularly making small investments.
|
NOTES TO FINANCIAL STATEMENTS August 31, 2021 (Continued) |
Leatherback Long/Short Alternative Yield ETF
•Shares May Trade at Prices Other Than NAV. As with all ETFs, Shares may be bought and sold in the secondary market at market prices. Although it is expected that the market price of Shares will approximate the Fund’s NAV, there may be times when the market price of Shares is more than the NAV intra-day (premium) or less than the NAV intra-day (discount) due to supply and demand of Shares or during periods of market volatility. This risk is heightened in times of market volatility, periods of steep market declines, and periods when there is limited trading activity for Shares in the secondary market, in which case such premiums or discounts may be significant.
•Trading. Although Shares are listed on a national securities exchange, such as NYSE Arca, Inc. (the “Exchange”) and may be traded on U.S. exchanges other than the Exchange, there can be no assurance that Shares will trade with any volume, or at all, on any stock exchange. In stressed market conditions, the liquidity of Shares may begin to mirror the liquidity of the Fund’s underlying portfolio holdings, which can be significantly less liquid than Shares.
F.Non-Diversification Risk. Although the Fund intends to invest in a variety of securities and instruments, the Fund is considered to be non-diversified, which means that it may invest a greater percentage of its assets in the securities of a single issuer or a smaller number of issuers than if it were a diversified fund. As a result, the Fund may be more exposed to the risks associated with and developments affecting an individual issuer or a smaller number of issuers that a fund that invests more widely. This may increase the Fund’s volatility and cause the performance of a relatively smaller number of issuers to have a greater impact on the Fund’s performance.
G.Options Risk. Options enable the Fund to purchase exposure that is significantly greater than the premium paid. Consequently, the value of such options can be volatile, and a small investment in options can have a large impact on the performance of the Fund. The Fund risks losing all or part of the cash paid (premium) for purchasing options. Even a small decline in the value of a reference asset underlying call options or a small increase in the value of a reference asset underlying put options can result in the entire investment in such options being lost. Additionally, the value of the option may be lost if the Sub-Adviser (as defined herein) fails to exercise such option at or prior to its expiration.
H.Preferred Securities Risk. Preferred stocks are subject to the risks of equity securities generally and also risks associated with fixed-income securities, such as interest rate risk. A company’s preferred stock, which may pay fixed or variable rates of return, generally pays dividends only after the company makes required payments to creditors, including vendors, depositors, counterparties, holders of its bonds and other fixed-income securities. As a result, the value of a company’s preferred stock will react more strongly than bonds and other debt to actual or perceived changes in the company’s financial condition or prospects. Preferred stock may be less liquid than many other types of securities, such as common stock, and generally has limited or no voting rights. In addition, preferred stock is subject to the risks that a company may defer or not pay dividends, and, in certain situations, may call or redeem its preferred stock or convert it to common stock. To the extent that the Fund invests a substantial portion of its assets in convertible preferred stocks, declining common stock values may also cause the value of the Fund’s investments to decline.
I.REIT Risk. A REIT is a company that owns or finances income-producing real estate. Through its investments in REITs, the Fund is subject to the risks of investing in the real estate market, including decreases in property revenues, increases in interest rates, increases in property taxes and operating expenses, legal and regulatory changes, a lack of credit or capital, defaults by borrowers or tenants, environmental problems and natural disasters.
|
NOTE 4 – COMMITMENTS AND OTHER RELATED PARTY TRANSACTIONS |
Toroso Investments, LLC (the “Adviser”) serves as investment adviser to the Fund pursuant to an investment advisory agreement between the Adviser and the Trust, on behalf of the Fund (the “Advisory Agreement”), and, pursuant to the Advisory Agreement, provides investment advice to the Fund and oversees the day-to-day operation of the Fund, subject to the direction and control of the Board. The Adviser is also responsible for trading portfolio securities on behalf of the Fund, including selecting broker-dealers to execute purchase and sales transactions, subject to the supervision of the Board.
Pursuant to the Advisory Agreement, the Fund pays the Adviser a unitary management fee (the “Management Fee”) based on the average daily net assets of the Fund at the annualized rate of 0.95%. Out of the Management Fee, the Adviser is obligated to pay or arrange for the payment of substantially all expenses of the Fund, including the cost of transfer agency, custody, fund administration, and all other related services necessary for the Fund to operate. Under the Advisory Agreement, the Adviser has agreed to pay all expenses incurred by the Fund except for interest charges on any borrowings, dividends and other expenses on securities sold short,
|
NOTES TO FINANCIAL STATEMENTS August 31, 2021 (Continued) |
Leatherback Long/Short Alternative Yield ETF
taxes, brokerage commissions and other expenses incurred in placing orders for the purchase and sale of securities and other investment instruments, acquired fund fees and expenses, accrued deferred tax liability, extraordinary expenses, distribution fees and expenses paid by the Fund under any distribution plan adopted pursuant to Rule 12b-1 under the 1940 Act, and the Management Fee payable to the Adviser (collectively, “Excluded Expenses”). The Management Fees incurred are paid monthly to the Adviser.
Leatherback Asset Management, LLC (the “Sub-Adviser”) serves as sub-adviser to the Fund, pursuant to a sub-advisory agreement between the Adviser and the Sub-Adviser with respect to the Fund (the “Sub-Advisory Agreement”). Pursuant to the Sub-Advisory Agreement, the Sub-Adviser is responsible for the day-to-day management of the Fund’s portfolio, including determining the securities purchased and sold by the Fund, subject to the supervision of the Adviser and the Board. The Sub-Adviser is paid a fee by the Adviser, which is calculated and paid monthly, at an annual rate of 0.75% of the Fund’s average daily net assets. The Sub-Adviser has agreed to assume the Adviser’s obligation to pay all expenses incurred by the Fund, except for the sub-advisory fee payable to the Sub-Adviser and Excluded Expenses. Such expenses incurred by the Fund and paid by the Sub-Adviser include fees charged by Tidal, as defined below.
Tidal ETF Services LLC (“Tidal”), an affiliate of the Adviser, serves as the Fund’s administrator and, in that capacity, performs various administrative and management services for the Fund. Tidal coordinates the payment of Fund-related expenses and manages the Trust’s relationships with its various service providers.
U.S. Bancorp Fund Services, LLC, doing business as U.S. Bank Global Fund Services (“Fund Services”), serves as the Fund’s sub-administrator, fund accountant and transfer agent. In those capacities Fund Services performs various administrative and accounting services for the Fund. Fund Services prepares various federal and state regulatory filings, reports and returns for the Fund, including regulatory compliance monitoring and financial reporting; prepares reports and materials to be supplied to the Board; and monitors the activities of the Fund’s custodian. U.S. Bank N.A. (the “Custodian”), an affiliate of Fund Services, serves as the Fund’s custodian. The Custodian acts as the securities lending agent (the “Securities Lending Agent”) for the Fund.
Foreside Fund Services, LLC (the “Distributor”) acts as the Fund’s principal underwriter in a continuous public offering of the Fund’s shares.
Certain officers and a trustee of the Trust are affiliated with the Adviser and Fund Services. Neither the affiliated trustee or the Trust’s officers receive compensation from the Fund.
|
NOTE 5 – SECURITIES LENDING |
The Fund may lend up to 33 1/3% of the value of the securities in its portfolio to brokers, dealers and financial institutions (but not individuals) under terms of participation in a securities lending program administered by the Securities Lending Agent. The securities lending agreement requires that loans are collateralized at all times in an amount equal to at least the market value of the securities loaned by the Fund. The Fund receives compensation in the form of fees and earned interest on the cash collateral. Due to timing issues of when a security is recalled from loan, the financial statements may differ in presentation. The amount of fees depends on a number of factors including the type of security and length of the loan. The Fund continues to receive interest payments or dividends on the securities loaned during the borrowing period. Gain or loss in the value of securities loaned that may occur during the term of the loan will be for the account of the Fund. The Fund has the right under the terms of the securities lending agreements to recall the securities from the borrower on demand.
As of August 31, 2021, the market value of the securities on loan and payable on collateral received for securities lending were as follows:
| | | | |
Market Value of
Securities on Loan | | Payable on
Collateral Received | | Percentage of Net Assets
of Securities on Loan |
$177,667 | | $182,723 | | 3.0% |
The cash collateral is invested in the Mount Vernon Liquid Assets Portfolio, LLC, of which the investment objective is to seek to maximize income to the extent consistent with the preservation of capital and liquidity and maintain a stable NAV of $1.00.Although risk is mitigated by the collateral, the Fund could experience a delay in recovering its securities and possible loss of income or value if the borrower fails to return the borrowed securities. In addition, the Fund bears the risk of loss associated with the investment of cash collateral received.
|
NOTES TO FINANCIAL STATEMENTS August 31, 2021 (Continued) |
Leatherback Long/Short Alternative Yield ETF
During the period ended August 31, 2021, the Fund loaned securities that were collateralized by cash. The cash collateral received was invested in the Mount Vernon Liquid Assets Portfolio, LLC as listed in the Fund’s Schedule of Investments. Securities lending income is disclosed in the Fund’s Statement of Operations.
The Fund is not subject to a master netting agreement with respect to the Fund’s participation in securities lending; therefore, no additional disclosures regarding netting arrangements are required.”
|
NOTE 6 – PURCHASES AND SALES OF SECURITIES |
For the period ended August 31, 2021, the cost of purchases and proceeds from the sales or maturities of securities, excluding short-term investments and U.S. government securities were $9,316,447 and $2,907,794, respectively.
There were no purchases or sales of long-term U.S. Government securities for the period ended August 31, 2021.
|
NOTE 7 – INCOME TAXES AND DISTRIBUTIONS TO SHAREHOLDERS |
The tax character of distributions paid during the period ended August 31, 2021 is as follows:
| | |
Distributions paid from: | | August 31, 2021 |
Ordinary income | | $124,500 |
As of the period ended August 31, 2021, the components of accumulated earnings/(losses) on a tax basis were as follows:
| | | |
Cost of investments(1) | | $5,390,984 | |
Gross tax unrealized appreciation | | 1,094,167 | |
Gross tax unrealized depreciation | | (351,700 | ) |
Net tax unrealized appreciation (depreciation) | | 742,467 | |
Undistributed ordinary income (loss) | | 33,041 | |
Undistributed long-term capital gain (loss) | | 15,967 | |
Total distributable earnings | | 49,008 | |
Other accumulated gain (loss) | | — | |
Total accumulated gain (loss) | | $791,475 | |
(1)The difference between book and tax-basis cost of investments was attributable primarily to the treatment of wash sales.
Net capital losses incurred after October 31 and net investment losses incurred after December 31, and within the taxable year, are deemed to arise on the first business day of the Fund’s next taxable year. As of August 31, 2021, the Fund had no late year losses and no short-term capital loss carryovers.
|
NOTE 8 – SHARE TRANSACTIONS |
Shares of the Fund are listed and traded on the Exchange. Market prices for the shares may be different from their NAV. The Fund issues and redeems shares on a continuous basis at NAV generally in large blocks of shares, called (“Creation Units”). Creation Units are issued and redeemed principally in-kind for securities included in a specified universe. Once created, shares generally trade in the secondary market at market prices that change throughout the day. Except when aggregated in Creation Units, shares are not redeemable securities of the Fund. Creation Units may only be purchased or redeemed by Authorized Participants. An Authorized Participant is either (i) a broker-dealer or other participant in the clearing process through the Continuous Net Settlement System of the National Securities Clearing Corporation or (ii) a Depository Trust Company participant and, in each case, must have executed a Participant Agreement with the Distributor. Most retail investors do not qualify as Authorized Participants nor have the resources to buy and sell whole Creation Units. Therefore, they are unable to purchase or redeem the shares directly from the Fund. Rather, most retail investors may purchase shares in the secondary market with the assistance of a broker and are subject to customary brokerage commissions or fees.
|
NOTES TO FINANCIAL STATEMENTS August 31, 2021 (Continued) |
Leatherback Long/Short Alternative Yield ETF
The Fund currently offers one class of shares, which has no front-end sales load, no deferred sales charge, and no redemption fee. A fixed transaction fee is imposed for the transfer and other transaction costs associated with the purchase or sale of Creation Units. The standard fixed transaction fee for the Fund is $250, payable to the Custodian. The fixed transaction fee may be waived on certain orders if the Fund’s Custodian has determined to waive some or all of the costs associated with the order or another party, such as the Adviser, has agreed to pay such fee. In addition, a variable fee may be charged on all cash transactions or substitutes for Creation Units of up to a maximum of 2% of the value of the Creation Units subject to the transaction. Variable fees are imposed to compensate the Fund for transaction costs associated with the cash transactions. Variable fees received by the Fund, if any, are disclosed in the capital shares transactions section of the Statements of Changes in Net Assets. The Fund may issue an unlimited number of shares of beneficial interest, with no par value. All shares of the Fund have equal rights and privileges.
|
NOTE 9 – COVID-19 PANDEMIC |
U.S. and international markets have experienced significant periods of volatility in recent years and months due to a number of economic, political and global macro factors including the impact of the novel coronavirus (COVID-19) as a global pandemic, which has resulted in public health issues, growth concerns in the U.S. and overseas, layoffs in the private sector, rising unemployment claims, changed travel and social behaviors, and reduced consumer spending. The recovery from the effects of COVID-19 is uncertain and may last for an extended period of time. These developments as well as other events could result in further market volatility and negatively affect financial asset prices, the liquidity of certain securities and the normal operations of securities exchanges and other markets. As a result, the risk environment remains elevated. The Adviser will monitor developments and seek to manage the Fund in a manner consistent with the Fund’s investment objective but there can be no assurance that it will be successful in doing so.
|
NOTE 10 – SUBSEQUENT EVENTS |
In preparing these financial statements, the Fund has evaluated events and transactions for potential recognition or disclosure through the date the financial statements were issued. The Fund has determined that there were no subsequent events that would need to be disclosed in the Fund’s financial statements.
|
NOTES TO FINANCIAL STATEMENTS August 31, 2021 (Continued) |
Leatherback Long/Short Alternative Yield ETF
|
Report of Independent Registered Public Accounting Firm |
To the Shareholders of
Leatherback Long/Short Alternative Yield ETF and
The Board of Trustees of
Tidal ETF Trust
Opinion on the Financial Statements
We have audited the accompanying statement of assets and liabilities of the Leatherback Long/Short Alternative Yield ETF (the “Fund”), a series of Tidal ETF Trust (the “Trust”), including the schedule of investments, as of August 31, 2021, the related statement of operations, the statement of changes in net assets and the financial highlights for the period November 16, 2020 (commencement of operations) to August 31, 2021, and the related notes (collectively referred to as the “financial statements”). In our opinion, the financial statements present fairly, in all material respects, the financial position of the Fund as of August 31, 2021, the results of its operations, the changes in its net assets and the financial highlights for the period November 16, 2020 to August 31, 2021, in conformity with accounting principles generally accepted in the United States of America.
Basis for Opinion
These financial statements are the responsibility of the Fund’s management. Our responsibility is to express an opinion on the Fund’s financial statements based on our audit. We are a public accounting firm registered with the Public Company Accounting Oversight Board (United States) (“PCAOB”) and are required to be independent with respect to the Fund in accordance with the U.S. federal securities laws and the applicable rules and regulations of the Securities and Exchange Commission and the PCAOB. We have served as the auditor of one or more of the funds in the Trust since 2018.
We conducted our audit in accordance with the standards of the PCAOB. Those standards require that we plan and perform the audit to obtain reasonable assurance about whether the financial statements are free of material misstatement, whether due to error or fraud. The Fund is not required to have, nor were we engaged to perform, an audit of its internal control over financial reporting. As part of our audit, we are required to obtain an understanding of internal control over financial reporting, but not for the purpose of expressing an opinion on the effectiveness of the Fund’s internal control over financial reporting. Accordingly, we express no such opinion.
Our audit included performing procedures to assess the risks of material misstatement of the financial statements, whether due to error or fraud, and performing procedures that respond to those risks. Such procedures included examining, on a test basis, evidence regarding the amounts and disclosures in the financial statements. Our audit also included evaluating the accounting principles used and significant estimates made by management, as well as evaluating the overall presentation of the financial statements. Our procedures included confirmation of securities owned as of August 31, 2021, by correspondence with the custodian and broker. We believe that our audit provides a reasonable basis for our opinion.
TAIT, WELLER & BAKER LLP
Philadelphia, Pennsylvania
October 28, 2021
Leatherback Long/Short Alternative Yield ETF
|
EXPENSE EXAMPLE For the Period Ended August 31, 2021 (Unaudited) |
As a shareholder of the Fund, you incur two types of costs: (1) transaction costs, including brokerage commissions paid on purchases and sales of the Fund’s shares, and (2) ongoing costs, including management fees of the Fund. The example is intended to help you understand your ongoing costs (in dollars) of investing in the Fund and to compare these costs with the ongoing costs of investing in other funds. The example is based on an investment of $1,000 invested at the beginning of the period and held for the entire period indicated, which is from March 1, 2021 to August 31, 2021.
Actual Expenses
The first line of the following table provides information about actual account values and actual expenses. To the extent the Fund invests in shares of other investment companies as part of its investment strategy, you will indirectly bear your proportionate share of any fees and expenses charged by the underlying funds in which the Fund invests, in addition to the expenses of the Fund. Actual expenses of the underlying funds are expected to vary among the various underlying funds. These expenses are not included in the example. The example includes, but is not limited to, unitary fees. However, the example does not include portfolio trading commissions and related expenses, interest expense or dividends on short positions taken by the Fund. You may use the information in this line, together with the amount you invested, to estimate the expenses that you paid over the period. Simply divide your account value by $1,000 (for example, an $8,600 account value divided by $1,000 = 8.6), then, multiply the result by the number in the first line under the heading entitled “Expenses Paid During the Period’’ to estimate the expenses you paid on your account during this period.
Hypothetical Example for Comparison Purposes
The second line of the following table provides information about hypothetical account values and hypothetical expenses based on the Fund’s actual expense ratio and an assumed rate of return of 5% per year before expenses, which is not the Fund’s actual return. The hypothetical account values and expenses may not be used to estimate the actual ending account balance or expenses you paid for the period. You may use this information to compare the ongoing costs of investing in the Fund and other funds. To do so, compare this 5% hypothetical example with the 5% hypothetical examples that appear in the shareholder reports of the other funds. Please note that the expenses shown in the table are meant to highlight your ongoing costs only and do not reflect any transactional costs, such as brokerage commissions paid on purchases and sales of the Fund’s shares. Therefore, the second line of the following table is useful in comparing ongoing costs only and will not help you determine the relative total costs of owning different funds. If these transactional costs were included, your costs would have been higher.
| | | | | | |
| | Beginning
Account Value
March 1, 2021 | | Ending
Account Value
August 31, 2021 | | Expenses Paid
During the Period
March 1, 2021 –
August 31, 2021(1) |
Actual(2) | | $1,000.00
| | $1,144.20
| | $6.81
|
Hypothetical (5% annual return before expenses)(3) | | $1,000.00
| | $1,018.85
| | $6.41
|
(1)Expenses are equal to the Fund’s annualized net expense ratio for the most recent six-month period of 1.26%, multiplied by the average account value over the period, multiplied by 184/365 (to reflect the most recent six-month period).
(2)Excluding dividend and interest expense on securities sold short, your actual cost of investment in the Fund would be $5.13 and the Fund’s annualized expense ratio would be 0.95%.
(3)Excluding dividend and interest expense on securities sold short, your hypothetical cost of investment in the Fund would be $4.84 and the Fund’s annualized expense ratio would be 0.95%.
Leatherback Long/Short Alternative Yield ETF
|
Trustees and Executive Officers (Unaudited) |
| | | | | |
Name, Address
and Year of Birth | Position
Held with
the Trust | Term of
Office and
Length of
Time Served | Principal
Occupation(s)
During Past 5 Years | Number of Portfolios in Fund Complex Overseen by Trustee | Other Directorships
Held by Trustee
During Past 5 Years |
Independent Trustees(1) |
Mark H.W. Baltimore c/o Tidal ETF Services, LLC 898 N. Broadway, Suite 2 Massapequa, New York 11758 Born: 1967 | Trustee | Indefinite
term; since 2018 | Co-Chief Executive Officer, Global Rhino, LLC (asset management consulting firm) (since 2018); Chief Business Development Officer, Joot (asset management compliance services firm) (since 2019); Chief Executive Officer, Global Sight, LLC (asset management distribution consulting firm) (2016–2018); Head of Global Distribution Services, Foreside Financial Group, LLC (broker-dealer) (2016); Managing Director, Head of Global Distribution Services, Beacon Hill Fund Services (broker-dealer) (2015–2016). | 27 | None |
Dusko Culafic c/o Tidal ETF Services, LLC 898 N. Broadway, Suite 2 Massapequa,
New York 11758 Born: 1958 | Trustee | Indefinite
term; since 2018 | Retired (since 2018); Senior Operational Due Diligence Analyst, Aurora Investment Management, LLC (2012–2018). | 27 | None |
Eduardo Mendoza c/o Tidal ETF Services, LLC 898 N. Broadway, Suite 2 Massapequa,
New York 11758 Born: 1966 | Trustee | Indefinite
term; since 2018 | Executive Vice President - Head of Capital Markets & Corporate Development, Credijusto (financial technology company) (since 2017); Founding Partner / Capital Markets & Head of Corporate Development, SQN Latina (specialty finance company) (2016–2017). | 27 | None |
Interested Trustee and Executive Officer |
Eric W. Falkeis(2) c/o Tidal ETF Services, LLC 898 N. Broadway, Suite 2 Massapequa,
New York 11758 Born: 1973 | President, Principal Executive Officer, Trustee, Chairman, and Secretary | President and Principal Executive Officer since 2019, Indefinite term; Trustee, Chairman, and Secretary since 2018, Indefinite term | Chief Executive Officer, Tidal ETF Services LLC (since 2018); Chief Operating Officer (and other positions), Rafferty Asset Management, LLC (2013–2018) and Direxion Advisors, LLC (2017–2018). | 27 | Independent Director, Muzinich BDC, Inc. (since 2019); Trustee, Professionally Managed Portfolios (27 series) (since 2011); Interested Trustee, Direxion Funds, Direxion Shares ETF Trust, and Direxion Insurance Trust (2014–2018). |
Leatherback Long/Short Alternative Yield ETF
|
Trustees and Executive Officers (Unaudited) (Continued) |
| | | | | |
Name, Address
and Year of Birth | Position
Held with
the Trust | Term of
Office and
Length of
Time Served | Principal
Occupation(s)
During Past 5 Years | Number of Portfolios in Fund Complex Overseen by Trustee | Other Directorships
Held by Trustee
During Past 5 Years |
Executive Officers |
Daniel H. Carlson c/o Tidal ETF Services, LLC 898 N. Broadway, Suite 2 Massapequa,
New York 11758 Born: 1955 | Treasurer, Principal Financial Officer, Principal Accounting Officer, and AML Compliance Officer | Indefinite
term; since 2018 | Chief Financial Officer, Chief Compliance Officer, and Managing Member, Toroso Investments, LLC (since 2012). | Not Applicable | Not Applicable |
William H. Woolverton, Esq. c/o Cipperman Compliance Services, LLC 480 E. Swedesford Road, Suite 220 Wayne, PA 19087 Born: 1951 | Chief Compliance Officer | Indefinite
term; since 2021 | Senior Compliance Advisor, Cipperman Compliance Services, LLC (since 2020); Operating Partner, Altamont Capital Partners (private equity firm) (2021 to present); Managing Director and Head of Legal – US, Waystone (global governance solutions) (2016 to 2019). | Not Applicable | Not Applicable |
Aaron J. Perkovich c/o U.S. Bancorp Fund Services, LLC 615 East Michigan Street Milwaukee,
Wisconsin 53202 Born: 1973 | Assistant Treasurer | Indefinite
term; since 2018 | Vice President, U.S. Bancorp Fund Services, LLC (since 2006). | Not Applicable | Not Applicable |
Cory R. Akers c/o U.S. Bancorp Fund Services, LLC 615 East Michigan Street Milwaukee,
Wisconsin 53202 Born: 1978 | Assistant Secretary | Indefinite
term; since 2019 | Assistant Vice President, U.S. Bancorp Fund Services, LLC (since 2006). | Not Applicable | Not Applicable |
(1)All Independent Trustees of the Trust are not “interested persons” of the Trust as defined under the 1940 Act (“Independent Trustees”).
(2)Mr. Falkeis is considered an “interested person” of the Trust due to his positions as President, Principal Executive Officer, Chairman and Secretary of the Trust, and Chief Executive Officer of Tidal ETF Services LLC, an affiliate of the Adviser.
Leatherback Long/Short Alternative Yield ETF
|
QUALIFIED DIVIDEND INCOME/DIVIDENDS RECEIVED DEDUCTION (Unaudited) |
For the period ended August 31, 2021, certain dividends paid by the Fund may be subject to a maximum tax rate of 20%, as provided for by the Jobs and Growth Tax Relief Reconciliation Act of 2003 and the Tax Cuts and Jobs Act of 2017.
The percentage of dividends declared from ordinary income designated as qualified dividend income for the period ended August 31, 2021 was 82.98%.
For corporate shareholders, the percent of ordinary income distributions qualifying for the corporate dividends received deduction for the period ended August 31, 2021 was 63.52%.
The percentage of taxable ordinary income distributions that are designated as short-term capital gain distribution under Internal Revenue Section 871(k)(2)(c) for the period ended August 31, 2021 was 0.00%.
|
INFORMATION ABOUT PROXY VOTING (Unaudited) |
A description of the policies and procedures that the Fund uses to determine how to vote proxies relating to portfolio securities is available upon request without charge, by calling (833) 417-0090 or by accessing the Fund’s website at www.leatherbackam.com. Furthermore, you can obtain the description on the SEC’s website at www.sec.gov.
Information regarding how the Fund voted proxies relating to portfolio securities during the most recent 12-month period ended June 30 is available upon request without charge by calling (833) 417-0090 or by accessing the SEC’s website at www.sec.gov.
|
INFORMATION ABOUT THE PORTFOLIO HOLDINGS (Unaudited) |
The Fund’s portfolio holdings are posted on the Fund’s website daily at www.leatherbackam.com. The Fund files its complete schedule of portfolio holdings with the SEC for its first and third fiscal quarters on Part F of Form N-PORT. The Fund’s Part F of Form N-PORT is available without charge, upon request, by calling (833) 417-0090. Furthermore, you can obtain the Part F of Form N-PORT on the SEC’s website at www.sec.gov.
|
FREQUENCY DISTRIBUTION OF PREMIUMS AND DISCOUNTS (Unaudited) |
Information regarding how often shares of the Fund trade on the Exchange at a price above (i.e., at a premium) or below (i.e., at a discount) to its daily NAV is available, without charge, on the Fund’s website at www.leatherbackam.com.
|
INFORMATION ABOUT THE FUND’S TRUSTEES (Unaudited) |
The Statement of Additional Information (“SAI”) includes additional information about the Fund’s Trustees and is available without charge, upon request, by calling (833) 417-0090. Furthermore, you can obtain the SAI on the SEC’s website at www.sec.gov or the Fund’s website at www.leatherbackam.com.
Investment Adviser
Toroso Investments, LLC
898 N. Broadway, Suite 2
Massapequa, New York 11758
Investment Sub-Adviser
Leatherback Asset Management, LLC
2000 PGA Boulevard, Suite 4440
Palm Beach Gardens, Florida 33408
Independent Registered Public Accounting Firm
Tait, Weller & Baker LLP
Two Liberty Place
50 South 16th Street, Suite 2900
Philadelphia, Pennsylvania 19102
Legal Counsel
Godfrey & Kahn, S.C.
833 East Michigan Street, Suite 1800
Milwaukee, Wisconsin 53202
Custodian
U.S. Bank N.A. Custody Operations
1555 North RiverCenter Drive, Suite 302
Milwaukee, Wisconsin 53212
Fund Administrator
Tidal ETF Services, LLC
898 N. Broadway, Suite 2
Massapequa, New York 11758
Transfer Agent, Fund Accountant and Fund Sub-Administrator
U.S. Bancorp Fund Services, LLC
615 East Michigan Street
Milwaukee, Wisconsin 53202
Distributor
Foreside Fund Services, LLC
Three Canal Plaza, Suite 100
Portland, Maine 04101
| | |
Fund Information |
Fund | Ticker | CUSIP |
Leatherback Long/Short Alternative Yield ETF | LBAY | 886364850 |
Item 1. Reports to Stockholders.
(a) [Insert full text of semi-annual or annual report here]
Item 2. Code of Ethics.
The registrant has adopted a code of ethics that applies to the registrant’s principal executive officer and principal financial officer. The registrant has not made any amendments to its code of ethics during the period covered by this report. The registrant has not granted any waivers from any provisions of the code of ethics during the period covered by this report.
A copy of the registrant’s Code of Ethics is filed herewith.
Item 3. Audit Committee Financial Expert.
The registrant’s Board of Trustees of the Trust has determined that there is at least one audit committee financial expert serving on its audit committee. Mr. Dusko Culafic is the “audit committee financial expert” and is considered to be “independent” as each term is defined in Item 3 of Form N-CSR.
Item 4. Principal Accountant Fees and Services.
The registrant has engaged its principal accountant to perform audit services, audit-related services, tax services and other services during the past fiscal year. “Audit services” refer to performing an audit of the registrant’s annual financial statements or services that are normally provided by the accountant in connection with statutory and regulatory filings or engagements for those fiscal years. “Audit-related services” refer to the assurance and related services by the principal accountant that are reasonably related to the performance of the audit. “Tax services” refer to professional services rendered by the principal accountant for tax compliance, tax advice, and tax planning. There were no “Other services” provided by the principal accountant. The following table details the aggregate fees billed or expected to be billed for the last fiscal year for audit fees, audit-related fees, tax fees and other fees by the principal accountant.
Leatherback Long/Short Alternative Yield ETF
| FYE 08/31/2021 | FYE 08/31/2020 |
(a) Audit Fees | $12,500 | N/A |
(b) Audit-Related Fees | N/A | N/A |
(c) Tax Fees | $2,500 | N/A |
(d) All Other Fees | N/A | N/A |
(e)(1) The audit committee has adopted pre-approval policies and procedures that require the audit committee to pre-approve all audit and non-audit services of the registrant, including services provided to any entity affiliated with the registrant.
(e)(2) The percentage of fees billed by Tait Weller & Baker LLP applicable to non-audit services pursuant to waiver of pre-approval requirement were as follows:
Non-Audit Related Fees | FYE 08/31/2021 | FYE 08/31/2020 |
Registrant | N/A | N/A |
Registrant’s Investment Adviser | N/A | N/A |
(f) All of the principal accountant’s hours spent on auditing the registrant’s financial statements were attributed to work performed by full-time permanent employees of the principal accountant.
(g) The following table indicates the non-audit fees billed or expected to be billed by the registrant’s accountant for services to the registrant and to the registrant’s investment adviser (and any other controlling entity, etc.—not sub-adviser) for the last two year:
Non-Audit Related Fees | FYE 08/31/2021 | FYE 08/31/2020 |
Registrant | N/A | N/A |
Registrant’s Investment Adviser | N/A | N/A |
(h) The audit committee of the Board of Trustees has considered whether the provision of non-audit services that were rendered to the registrant’s investment adviser is compatible with maintaining the principal accountant’s independence and has concluded that the provision of such non-audit services by the accountant has not compromised the accountant’s independence.
(i) Not applicable.
(j) Not applicable.
Item 5. Audit Committee of Listed Registrants.
The registrant is an issuer as defined in Rule 10A-3 under the Securities Exchange Act of 1934, (the “Act”) and has a separately-designated standing audit committee established in accordance with Section 3(a)(58)(A) of the Act. The independent members of the committee are as follows: Dusko Culafic, Eduardo Mendoza, and Mark H.W. Baltimore.
(b) Not applicable.
Item 6. Investments.
(a) Schedule of Investments is included as part of the report to shareholders filed under Item 1 of this Form.
(b) Not applicable.
Item 7. Disclosure of Proxy Voting Policies and Procedures for Closed-End Management Investment Companies.
Not applicable to open-end investment companies.
Item 8. Portfolio Managers of Closed-End Management Investment Companies.
Not applicable to open-end investment companies.
Item 9. Purchases of Equity Securities by Closed-End Management Investment Company and Affiliated Purchasers.
Not applicable to open-end investment companies.
Item 10. Submission of Matters to a Vote of Security Holders.
There have been no material changes to the procedures by which shareholders may recommend nominees to the registrant’s board of Trustees.
Item 11. Controls and Procedures.
(a) | The Registrant’s President/Principal Executive Officer and Treasurer/Principal Financial Officer have reviewed the Registrant’s disclosure controls and procedures (as defined in Rule 30a-3(c) under the Investment Company Act of 1940 (the “Act”)) as of a date within 90 days of the filing of this report, as required by Rule 30a-3(b) under the Act and Rules 13a-15(b) or 15d-15(b) under the Securities Exchange Act of 1934. Based on their review, such officers have concluded that the disclosure controls and procedures are effective in ensuring that information required to be disclosed in this report is appropriately recorded, processed, summarized and reported and made known to them by others within the Registrant and by the Registrant’s service provider. |
(b) | There were no changes in the Registrant’s internal control over financial reporting (as defined in Rule 30a-3(d) under the Act) that occurred during the period covered by this report that have materially affected, or are reasonably likely to materially affect, the Registrant’s internal control over financial reporting. |
Item 12. Disclosure of Securities Lending Activities for Closed-End Management Investment Companies
Not applicable to open-end investment companies.
Item 13. Exhibits.
(2) A separate certification for each principal executive officer and principal financial officer pursuant to Section 302 of the Sarbanes-Oxley Act of 2002. Filed herewith.
(3) Any written solicitation to purchase securities under Rule 23c-1 under the Act sent or given during the period covered by the report by or on behalf of the registrant to 10 or more persons. Not applicable to open-end investment companies.
(4) Change in the registrant’s independent public accountant. There was no change in the registrant’s independent public accountant for the period covered by this report.
SIGNATURES
Pursuant to the requirements of the Securities Exchange Act of 1934 and the Investment Company Act of 1940, the registrant has duly caused this report to be signed on its behalf by the undersigned, thereunto duly authorized.
(Registrant) | Tidal ETF Trust |
By (Signature and Title) | /s/ Eric W. Falkeis |
| Eric W. Falkeis, President/Principal Executive Officer |
Pursuant to the requirements of the Securities Exchange Act of 1934 and the Investment Company Act of 1940, this report has been signed below by the following persons on behalf of the registrant and in the capacities and on the dates indicated.
By (Signature and Title)* | /s/ Eric W. Falkeis |
| Eric W. Falkeis, President/Principal Executive Officer |
By (Signature and Title)* | �� /s/ Daniel Carlson |
| Daniel Carlson, Treasurer/Principal Financial Officer |
* Print the name and title of each signing officer under his or her signature.