UNITED STATES
SECURITIES AND EXCHANGE COMMISSION
Washington, D.C. 20549
FORM N-CSR
CERTIFIED SHAREHOLDER REPORT OF REGISTERED
MANAGEMENT INVESTMENT COMPANIES
Investment Company Act file number (811-23377)
Tidal ETF Trust
(Exact name of registrant as specified in charter)
898 N. Broadway, Suite 2
Massapequa, New York 11758
(Address of principal executive offices) (Zip code)
Eric W. Falkeis
Tidal ETF Trust
898 N. Broadway, Suite 2
Massapequa, New York 11758
(Name and address of agent for service)
(844) 986-7676
Registrant's telephone number, including area code
Date of fiscal year end: September 30
Date of reporting period: September 30, 2021
Item 1. Reports to Stockholders.
(a)
GOTHAM ETF
of
Tidal ETF Trust
Gotham Enhanced 500 ETF (GSPY)
ANNUAL REPORT
September 30, 2021
GOTHAM ENHANCED 500 ETF
ANNUAL REPORT
AS OF SEPTEMBER 30, 2021
Table of Contents | |
Shareholder Letter | 1 |
Performance Data | 3 |
Fund Expense Disclosure | 4 |
Portfolio Holdings Summary Table | 5 |
Portfolio of Investments | 6 |
Financial Statements: | |
Statement of Assets and Liabilities | 14 |
Statement of Operations | 15 |
Statement of Changes in Net Assets | 16 |
Financial Highlights | 17 |
Notes to Financial Statements | 18 |
Report of Independent Registered Public Accounting Firm | 26 |
Trustees and Executive Officers | 27 |
Other Information | 30 |
This report is not authorized for distribution to prospective investors in the Fund unless preceded or accompanied by an effective prospectus.
Gotham Enhanced 500 ETF
Shareholder Letter
September 30, 2021
(Unaudited)
Gotham Enhanced 500 ETF (GSPY)
● | The Gotham Enhanced 500 ETF (GSPY) is an actively managed ETF that buys all 500 stocks in the S&P 500 Index but reweights them, buying more of the ones we think are cheaper and less of the ones we believe are more expensive. Gotham’s investment process puts an emphasis on companies with strong cash flow generation and operating fundamentals. |
● | GSPY currently1 trades at 21x Gotham’s proprietary free cash flow metric2 (vs. 29x for the S&P 500 Index) and has a higher aggregate return on tangible capital than the S&P 500 Index. |
● | As of 9/30/21, the five largest positions in the strategy were MSFT, AAPL, AMZN, GOOGL and FB. The strategy is slightly overweight Information Technology and Industrials, while being slightly underweight Financials. |
● | Since Inception on 12/28/2020, GSPY returned +15.53% for the period ending 9/30/21, whereas the S&P 500 Index, the Fund’s benchmark index, returned +16.59% over the same time period. Both the S&P 500 Value and Growth Indexes also returned +16.60%. |
● | GSPY is nearing $100mm3 in assets and Gotham is excited about the opportunity set for its first ETF. |
● | Top contributors and detractors (where applicable) by sector and stock positions are below: |
Sector Contributors/Detractors
Average | Average | |
Largest Contributors |
|
|
Information Technology | 4.35% | 27.47% |
Communication Services | 2.56% | 12.71% |
Largest Detractors | No sector was a detractor for the period. | |
Stock Contributors/Detractors
Average | Average | |
Largest Contributors |
|
|
Alphabet Inc | 1.86% | 4.55% |
Microsoft Corp | 1.66% | 6.11% |
Largest Detractors |
|
|
Verizon Communications Inc | -0.08% | 1.33% |
United Parcel Service Inc | -0.08% | 0.48% |
Past performance does not guarantee future results.
Must be preceded or accompanied by a prospectus.
The risks of investing in GSPY are described in the prospectus.
The Gotham Enhanced 500 ETF (GSPY) is distributed by Foreside Fund Services, LLC.
1 | As of 11/10/2021 |
2 | Gotham’s proprietary cash flow metric is used to compare companies in a consistently meaningful way. Gotham’s analyst team utilizes consistent research principles to discern the pre-tax, unlevered cash flow of a business relative to its enterprise value. This information is updated throughout the year to account for company performance. The metrics for any one company or portfolio can change daily to reflect either new information and/or changing stock price. |
3 | $94.13mm as of 10/31/2021 |
1
Gotham Enhanced 500 ETF
Important Information
The Fund covered by this report compares its performance to the S&P 500® Total Return Index. An index does not reflect operational and transactional costs which apply to an ETF. It is not possible to invest directly in an index.
There is no guarantee that the Fund’s investment strategy will be successful. Shares may trade at a premium or discount to their NAV in the secondary market. These variations may be greater when markets are volatile or subject to unusual conditions. A high portfolio turnover rate increases transaction costs, which may increase the Fund’s expenses. The Fund is newer and has a limited operating history. You can lose money on your investment in the Fund. Diversification does not ensure profit or protect against loss in declining markets. Fund holdings and sector allocations are subject to change and should not be considered a recommendation to buy or sell any security. For a complete list of portfolio holdings, please refer to the Schedule of Investments provided in this report.
Before investing you should carefully consider the Fund’s investment objectives, risks, charges, and expenses. This and other information are in the prospectus. A prospectus may be obtained by visiting www.gothametfs.com/gspy. Please read the prospectus carefully before you invest.
2
Gotham Enhanced 500 ETF
Annual Report
Performance Data
September 30, 2021
(Unaudited)
Average Total Returns for the Periods Ended September 30, 2021 | ||||
3 Month(1) | 6 Month(1) | 9 Month(1) | Since | |
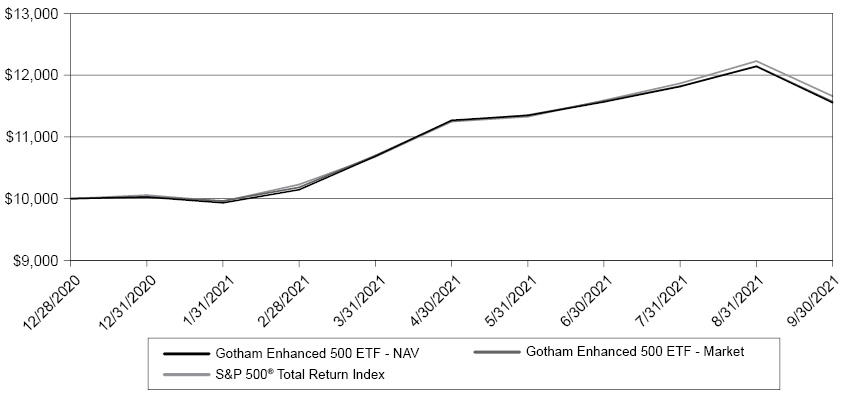
Gotham Enhanced 500 ETF - NAV | (0.12)% | 8.11% | 15.23% | 15.53% |
Gotham Enhanced 500 ETF - Market | (0.07)% | 8.14% | 15.36% | 15.70% |
S&P 500® Total Return Index | 0.58% | 9.18% | 15.92% | 16.59% |
(1) | Not annualized. |
This chart illustrates the performance of a hypothetical $10,000 investment made on December 28, 2020 (commencement of operations), and is not intended to imply any future performance. The returns shown do not reflect the deduction of taxes that a shareholder would pay on fund distributions or the redemption of fund shares. The returns reflect fee waivers in effect for the NAV return. In the absence of such waivers, total return would be reduced. The chart assumes reinvestment of capital gains, dividends, and return of capital, if applicable, for a fund and dividends for an index.
Performance data quoted represents past performance and does not guarantee future results. The investment return and principal value of an investment will fluctuate so that an investor’s shares, when redeemed, may be worth more or less than their original cost. Current performance of the Gotham Enhanced 500 ETF (the “Fund”) may be lower or higher than the performance quoted. Performance data current to the most recent month end may be obtained by calling (855) 998-4779. The Fund’s gross expense ratio is 0.65% and net expense ratio is 0.50% as of the Fund’s prospectus dated November 9, 2020. The Fund’s investment adviser has agreed to waive a portion of its management fees for the Fund to limit the Fund’s Total Annual Fund Operating Expenses After Fee Waiver to 0.50% until at least December 31, 2023.
3
Gotham Enhanced 500 ETF
Fund Expense Disclosure
September 30, 2021
(Unaudited)
As a shareholder of the Fund, you incur two types of costs: (1) transaction costs, including brokerage commissions paid on purchases and sales of the Fund’s shares, and (2) ongoing costs, including management fees of the Fund. The example is intended to help you understand your ongoing costs (in dollars) of investing in the Fund and to compare these costs with the ongoing costs of investing in other funds. The example is based on an investment of $1,000 invested at the beginning of the period and held for the entire period indicated, which is from April 1, 2021 to September 30, 2021.
Actual Expenses
The first line of the following table provides information about actual account values and actual expenses. To the extent the Fund invests in shares of other investment companies as part of its investment strategy, you will indirectly bear your proportionate share of any fees and expenses charged by the underlying funds in which the Fund invests in addition to the expenses of the Fund. Actual expenses of the underlying funds are expected to vary among the various underlying funds. These expenses are not included in the example. The example includes, but is not limited to, unitary fees. However, the example does not include portfolio trading commissions and related expenses. You may use the information in this line, together with the amount you invested, to estimate the expenses that you paid over the period. Simply divide your account value by $1,000 (for example, an $8,600 account value divided by $1,000 = 8.6), then, multiply the result by the number in the first line under the heading entitled “Expenses Paid During the Period’’ to estimate the expenses you paid on your account during this period.
Hypothetical Example for Comparison Purposes
The second line of the following table provides information about hypothetical account values and hypothetical expenses based on the Fund’s actual expense ratio and an assumed rate of return of 5% per year before expenses, which is not the Fund’s actual return. The hypothetical account values and expenses may not be used to estimate the actual ending account balance or expenses you paid for the period. You may use this information to compare the ongoing costs of investing in the Fund and other funds. To do so, compare this 5% hypothetical example with the 5% hypothetical examples that appear in the shareholder reports of the other funds. Please note that the expenses shown in the table are meant to highlight your ongoing costs only and do not reflect any transactional costs, such as brokerage commissions paid on purchases and sales of the Fund’s shares. Therefore, the second line of the following table is useful in comparing ongoing costs only and will not help you determine the relative total costs of owning different funds. If these transactional costs were included, your costs would have been higher.
Beginning | Ending | Expenses Paid | |
Actual | $ 1,000.00 | $ 1,081.10 | $ 2.61 |
Hypothetical (5% annual return before expenses) | $ 1,000.00 | $ 1,022.56 | $ 2.54 |
(1) | Expenses are equal to the Fund’s annualized expense ratio for the most recent six-month period of 0.50%, multiplied by the average account value over the period, multiplied by 183/365 (to reflect the most recent six-month period). |
4
Gotham Enhanced 500 ETF
Portfolio Holdings Summary Table
September 30, 2021
(Unaudited)
SECTOR: | % of Net | |||
Technology | 22.8 | % | ||
Consumer (Non-cyclical) | 20.5 | |||
Communications | 19.7 | |||
Financial | 11.5 | |||
Consumer (Cyclical) | 10.7 | |||
Industrial | 9.1 | |||
Energy | 2.8 | |||
Basic Materials | 1.8 | |||
Utilities | 0.9 | |||
Cash & Cash Equivalents (1) | 0.2 | |||
Total | 100.0 | % | ||
(1) | Represents cash, short-term investments, and liabilities in excess of other assets. |
The accompanying notes are an integral part of the financial statements.
5
Gotham Enhanced 500 ETF
Portfolio of Investments
September 30, 2021
Number | Value | |||||||
Common Stocks — 99.8% | ||||||||
Advertising — 0.2% | ||||||||
The Interpublic Group of Company, Inc. (2) | 2,280 | $ | 83,608 | |||||
Omnicom Group, Inc. | 1,368 | 99,125 | ||||||
| 182,733 | ||||||||
Aerospace & Defense — 1.6% | ||||||||
The Boeing Co. (1) | 456 | 100,293 | ||||||
General Dynamics Corp. | 1,403 | 275,030 | ||||||
Howmet Aerospace, Inc. | 855 | 26,676 | ||||||
L3Harris Technologies, Inc. | 158 | 34,798 | ||||||
Lockheed Martin Corp. | 1,545 | 533,179 | ||||||
Northrop Grumman Corp. | 746 | 268,672 | ||||||
Raytheon Technologies Corp. | 1,020 | 87,679 | ||||||
Teledyne Technologies, Inc. (1) | 30 | 12,887 | ||||||
TransDigm Group, Inc. (1) | 43 | 26,857 | ||||||
| 1,366,071 | ||||||||
Agriculture — 1.7% | ||||||||
Altria Group, Inc. | 10,216 | 465,032 | ||||||
Archer-Daniels-Midland Co. | 3,192 | 191,552 | ||||||
Philip Morris International, Inc. | 8,607 | 815,858 | ||||||
| 1,472,442 | ||||||||
Airlines — 0.1% | ||||||||
Alaska Air Group, Inc. | 81 | 4,747 | ||||||
American Airlines Group, Inc. (2) | 451 | 9,254 | ||||||
Delta Air Lines, Inc. (1) | 456 | 19,430 | ||||||
Southwest Airlines Co. (2) | 381 | 19,595 | ||||||
United Airlines Holdings, Inc. (1)(2) | 203 | 9,657 | ||||||
| 62,683 | ||||||||
Apparel — 0.4% | ||||||||
Hanesbrands, Inc. | 520 | 8,923 | ||||||
Nike, Inc. - Class B | 1,064 | 154,525 | ||||||
PVH Corp. | 344 | 35,360 | ||||||
Ralph Lauren Corp. - Class A | 421 | 46,748 | ||||||
Tapestry, Inc. | 1,520 | 56,270 | ||||||
Under Armour, Inc. - Class C (1) | 2,588 | 45,342 | ||||||
VF Corp. | 58 | 3,885 | ||||||
| 351,053 | ||||||||
Auto Manufacturers — 2.1% | ||||||||
Cummins, Inc. | 311 | 69,838 | ||||||
Ford Motor Co. (1) | 23,051 | 326,402 | ||||||
General Motors Co. | 8,456 | 445,716 | ||||||
PACCAR, Inc. | 272 | 21,466 | ||||||
Tesla, Inc. (1) | 1,230 | 953,841 | ||||||
| 1,817,263 | ||||||||
Number | Value | |||||||
Common Stocks — (Continued) | ||||||||
Auto Parts & Equipment — 0.0% (3) | ||||||||
Aptiv PLC (1) | 181 | $ | 26,963 | |||||
BorgWarner, Inc. | 203 | 8,772 | ||||||
| 35,735 | ||||||||
Banks — 3.1% | ||||||||
Bank of America Corp. | 6,646 | 282,123 | ||||||
The Bank of New York Mellon Corp. | 556 | 28,823 | ||||||
Citigroup, Inc. | 1,421 | 99,726 | ||||||
Citizens Financial Group, Inc. | 252 | 11,839 | ||||||
Comerica, Inc. | 91 | 7,326 | ||||||
Fifth Third Bancorp (2) | 676 | 28,689 | ||||||
First Republic Bank | 114 | 21,988 | ||||||
The Goldman Sachs Group, Inc. | 1,011 | 382,188 | ||||||
Huntington Bancshares, Inc. | 987 | 15,259 | ||||||
JPMorgan Chase & Co. | 4,251 | 695,846 | ||||||
KeyCorp | 608 | 13,145 | ||||||
M&T Bank Corp. | 84 | 12,545 | ||||||
Morgan Stanley | 5,675 | 552,234 | ||||||
Northern Trust Corp. | 138 | 14,878 | ||||||
The PNC Financial Services Group, Inc. | 278 | 54,388 | ||||||
Regions Financial Corp. | 608 | 12,957 | ||||||
State Street Corp. | 231 | 19,570 | ||||||
SVB Financial Group (1) | 55 | 35,578 | ||||||
Truist Financial Corp. | 912 | 53,489 | ||||||
U.S. Bancorp | 1,216 | 72,279 | ||||||
Wells Fargo & Co. | 5,716 | 265,280 | ||||||
Zions Bancorp N.A. | 142 | 8,788 | ||||||
| 2,688,938 | ||||||||
Beverages — 1.5% | ||||||||
Brown-Forman Corp. - Class B | 304 | 20,371 | ||||||
The Coca-Cola Co. | 15,072 | 790,828 | ||||||
Constellation Brands, Inc. - Class A | 1,107 | 233,234 | ||||||
Molson Coors Brewing Co. - Class B (2) | 1,317 | 61,082 | ||||||
Monster Beverage Corp. (1) | 355 | 31,535 | ||||||
PepsiCo, Inc. | 934 | 140,483 | ||||||
| 1,277,533 | ||||||||
Biotechnology — 1.4% | ||||||||
Amgen, Inc. | 451 | 95,905 | ||||||
Biogen, Inc. (1) | 118 | 33,393 | ||||||
Bio-Rad Laboratories, Inc. - Class A (1) | 25 | 18,649 | ||||||
Corteva, Inc. | 587 | 24,701 | ||||||
Gilead Sciences, Inc. | 7,366 | 514,515 | ||||||
Illumina, Inc. (1) | 333 | 135,068 | ||||||
Incyte Corp. (1) | 58 | 3,989 | ||||||
The accompanying notes are an integral part of the financial statements.
6
Gotham Enhanced 500 ETF
Portfolio of Investments (Continued)
September 30, 2021
Number | Value | |||||||
Common Stocks — (Continued) | ||||||||
Biotechnology — (Continued) | ||||||||
Moderna, Inc. (1) | 277 | $ | 106,606 | |||||
Regeneron Pharmaceuticals, Inc. (1) | 281 | 170,056 | ||||||
Vertex Pharmaceuticals, Inc. (1) | 589 | 106,839 | ||||||
| 1,209,721 | ||||||||
Building Materials — 0.4% | ||||||||
Carrier Global Corp. | 679 | 35,145 | ||||||
Fortune Brands Home & Security, Inc. | 109 | 9,747 | ||||||
Johnson Controls International PLC (2) | 4,187 | 285,051 | ||||||
Martin Marietta Materials, Inc. | 49 | 16,742 | ||||||
Masco Corp. | 199 | 11,055 | ||||||
Vulcan Materials Co. | 101 | 17,085 | ||||||
| 374,825 | ||||||||
Chemicals — 1.1% | ||||||||
Air Products and Chemicals, Inc. | 147 | 37,648 | ||||||
Albemarle Corp. | 77 | 16,861 | ||||||
Celanese Corp. | 74 | 11,147 | ||||||
CF Industries Holdings, Inc. | 336 | 18,756 | ||||||
Dow, Inc. | 4,324 | 248,890 | ||||||
DuPont de Nemours, Inc. | 58 | 3,943 | ||||||
Eastman Chemical Co. | 760 | 76,562 | ||||||
Ecolab, Inc. (2) | 246 | 51,321 | ||||||
FMC Corp. | 101 | 9,248 | ||||||
International Flavors & Fragrances, Inc. | 202 | 27,011 | ||||||
Linde PLC | 355 | 104,150 | ||||||
LyondellBasell Industries NV | 1,925 | 180,661 | ||||||
The Mosaic Co. | 2,131 | 76,119 | ||||||
PPG Industries, Inc. | 186 | 26,600 | ||||||
The Sherwin-Williams Co. | 210 | 58,743 | ||||||
| 947,660 | ||||||||
Commercial Services — 2.0% | ||||||||
Automatic Data Processing, Inc. | 2,348 | 469,412 | ||||||
Cintas Corp. | 92 | 35,021 | ||||||
Equifax, Inc. | 100 | 25,342 | ||||||
FleetCor Technologies, Inc. (1) | 66 | 17,244 | ||||||
Gartner, Inc. (1) | 490 | 148,901 | ||||||
Global Payments, Inc. | 25 | 3,940 | ||||||
IHS Markit Ltd. | 307 | 35,802 | ||||||
MarketAxess Holdings, Inc. | 30 | 12,621 | ||||||
Moody’s Corp. | 125 | 44,389 | ||||||
Nielsen Holdings PLC | 207 | 3,972 | ||||||
PayPal Holdings, Inc. (1) | 2,918 | 759,293 | ||||||
Quanta Services, Inc. | 109 | 12,406 | ||||||
Robert Half International, Inc. | 455 | 45,650 | ||||||
Rollins, Inc. | 304 | 10,740 | ||||||
Number | Value | |||||||
Common Stocks — (Continued) | ||||||||
Commercial Services — (Continued) | ||||||||
S&P Global, Inc. (2) | 188 | $ | 79,879 | |||||
United Rentals, Inc. (1) | 58 | 20,354 | ||||||
Verisk Analytics, Inc. | 100 | 20,027 | ||||||
| 1,744,993 | ||||||||
Computers — 8.2% | ||||||||
Accenture PLC - Class A | 1,951 | 624,164 | ||||||
Apple, Inc. | 37,196 | 5,263,234 | ||||||
Cognizant Technology Solutions Corp. | 1,164 | 86,381 | ||||||
DXC Technology Co. | 1,533 | 51,524 | ||||||
Fortinet, Inc. (1) | 129 | 37,673 | ||||||
Hewlett Packard Enterprise Co. | 801 | 11,414 | ||||||
HP, Inc. | 7,448 | 203,777 | ||||||
International Business Machines Corp. | 4,655 | 646,719 | ||||||
Leidos Holdings, Inc. | 92 | 8,844 | ||||||
NetApp, Inc. | 1,263 | 113,367 | ||||||
Seagate Technology Holdings PLC | 1,267 | 104,553 | ||||||
Western Digital Corp. | 203 | 11,457 | ||||||
| 7,163,107 | ||||||||
Cosmetics & Personal Care — 0.9% | ||||||||
Colgate-Palmolive Co. | 3,659 | 276,547 | ||||||
The Estee Lauder Companies, Inc. - Class A | 260 | 77,982 | ||||||
The Procter & Gamble Co. | 2,968 | 414,926 | ||||||
| 769,455 | ||||||||
Distribution & Wholesale — 0.3% | ||||||||
Copart, Inc. (1) | 152 | 21,086 | ||||||
Fastenal Co. | 456 | 23,534 | ||||||
LKQ Corp. (1) | 1,672 | 84,135 | ||||||
Pool Corp. | 32 | 13,901 | ||||||
W.W. Grainger, Inc. | 333 | 130,889 | ||||||
| 273,545 | ||||||||
Diversified Financial Services — 4.3% | ||||||||
American Express Co. | 883 | 147,929 | ||||||
Ameriprise Financial, Inc. | 117 | 30,902 | ||||||
BlackRock, Inc. (2) | 872 | 731,312 | ||||||
Capital One Financial Corp. | 470 | 76,126 | ||||||
Cboe Global Markets, Inc. | 77 | 9,537 | ||||||
The Charles Schwab Corp. | 2,441 | 177,802 | ||||||
CME Group, Inc. - Class A | 240 | 46,411 | ||||||
Discover Financial Services | 1,311 | 161,056 | ||||||
Franklin Resources, Inc. | 2,858 | 84,940 | ||||||
Intercontinental Exchange, Inc. | 375 | 43,058 | ||||||
Invesco Ltd. | 2,584 | 62,300 | ||||||
Mastercard, Inc. - Class A | 2,219 | 771,502 | ||||||
Nasdaq, Inc. | 134 | 25,865 | ||||||
Raymond James Financial, Inc. | 535 | 49,370 | ||||||
The accompanying notes are an integral part of the financial statements.
7
Gotham Enhanced 500 ETF
Portfolio of Investments (Continued)
September 30, 2021
Number | Value | |||||||
Common Stocks — (Continued) | ||||||||
Diversified Financial Services — (Continued) | ||||||||
Synchrony Financial | 459 | $ | 22,436 | |||||
T. Rowe Price Group, Inc. | 1,267 | 249,219 | ||||||
Visa, Inc. - Class A (2) | 4,775 | 1,063,631 | ||||||
The Western Union Co. | 192 | 3,882 | ||||||
| 3,757,278 | ||||||||
Electric — 0.8% | ||||||||
The AES Corp. | 514 | 11,735 | ||||||
Alliant Energy Corp. | 152 | 8,509 | ||||||
Ameren Corp. (2) | 203 | 16,443 | ||||||
American Electric Power Co., Inc. | 338 | 27,439 | ||||||
CenterPoint Energy, Inc. (2) | 343 | 8,438 | ||||||
CMS Energy Corp. | 195 | 11,647 | ||||||
Consolidated Edison, Inc. | 229 | 16,623 | ||||||
Dominion Energy, Inc. | 626 | 45,711 | ||||||
DTE Energy Co. | 129 | 14,411 | ||||||
Duke Energy Corp. | 553 | 53,967 | ||||||
Edison International | 229 | 12,703 | ||||||
Entergy Corp. | 133 | 13,208 | ||||||
Evergy, Inc. | 152 | 9,454 | ||||||
Eversource Energy | 229 | 18,723 | ||||||
Exelon Corp. (2) | 735 | 35,530 | ||||||
FirstEnergy Corp. | 462 | 16,456 | ||||||
NextEra Energy, Inc. | 1,388 | 108,986 | ||||||
NRG Energy, Inc. | 1,375 | 56,141 | ||||||
Pinnacle West Capital Corp. | 51 | 3,690 | ||||||
PPL Corp. | 4,312 | 120,219 | ||||||
Public Service Enterprise Group, Inc. | 332 | 20,219 | ||||||
Sempra Energy | 205 | 25,932 | ||||||
The Southern Co. | 685 | 42,449 | ||||||
WEC Energy Group, Inc. | 203 | 17,905 | ||||||
Xcel Energy, Inc. | 437 | 27,312 | ||||||
| 743,850 | ||||||||
Electrical Components & Equipment — 0.4% | ||||||||
AMETEK, Inc. | 182 | 22,570 | ||||||
Emerson Electric Co. | 3,457 | 325,649 | ||||||
Generac Holdings, Inc. (1) | 42 | 17,164 | ||||||
| 365,383 | ||||||||
Electronics — 0.7% | ||||||||
Agilent Technologies, Inc. | 204 | 32,136 | ||||||
Allegion PLC | 51 | 6,741 | ||||||
Amphenol Corp. | 404 | 29,585 | ||||||
Fortive Corp. | 762 | 53,774 | ||||||
Garmin Ltd. | 716 | 111,309 | ||||||
Honeywell International, Inc. | 548 | 116,330 | ||||||
Keysight Technologies, Inc. (1) | 118 | 19,386 | ||||||
Mettler-Toledo International, Inc. (1) | 19 | 26,170 | ||||||
Number | Value | |||||||
Common Stocks — (Continued) | ||||||||
Electronics — (Continued) | ||||||||
TE Connectivity Ltd. | 1,559 | $ | 213,926 | |||||
Trimble, Inc. (1) | 200 | 16,450 | ||||||
Waters Corp. (1) | 42 | 15,007 | ||||||
| 640,814 | ||||||||
Energy - Alternate Sources — 0.0% (3) | ||||||||
Enphase Energy, Inc. (1) | 77 | 11,548 | ||||||
Engineering & Construction — 0.1% | ||||||||
Jacobs Engineering Group, Inc. | 451 | 59,771 | ||||||
Entertainment — 0.1% | ||||||||
Caesars Entertainment, Inc. (1)(2) | 126 | 14,147 | ||||||
Live Nation Entertainment, Inc. (1)(2) | 152 | 13,852 | ||||||
Penn National Gaming, Inc. (1)(2) | 907 | 65,721 | ||||||
| 93,720 | ||||||||
Environmental Control — 0.2% | ||||||||
Pentair PLC | 927 | 67,328 | ||||||
Republic Services, Inc. | 252 | 30,255 | ||||||
Waste Management, Inc. (2) | 304 | 45,406 | ||||||
| 142,989 | ||||||||
Food — 1.4% | ||||||||
Campbell Soup Co. | 261 | 10,912 | ||||||
Conagra Brands, Inc. | 374 | 12,667 | ||||||
General Mills, Inc. | 475 | 28,414 | ||||||
The Hershey Co. | 1,164 | 197,007 | ||||||
Hormel Foods Corp. | 364 | 14,924 | ||||||
The J.M. Smucker Co. | 85 | 10,203 | ||||||
Kellogg Co. (2) | 266 | 17,003 | ||||||
The Kraft Heinz Co. (2) | 7,078 | 260,612 | ||||||
The Kroger Co. | 662 | 26,765 | ||||||
Lamb Weston Holdings, Inc. | 96 | 5,892 | ||||||
McCormick & Co., Inc. | 181 | 14,666 | ||||||
Mondelez International, Inc. | 7,300 | 424,714 | ||||||
Sysco Corp. | 404 | 31,714 | ||||||
Tyson Foods, Inc. - Class A | 2,183 | 172,326 | ||||||
| 1,227,819 | ||||||||
Forest Products & Paper — 0.0% (3) | ||||||||
International Paper Co. | 2,351 | 131,468 | ||||||
Gas — 0.0% (3) | ||||||||
Atmos Energy Corp. | 87 | 7,673 | ||||||
NiSource, Inc. | 211 | 5,113 | ||||||
| 12,786 | ||||||||
Hand & Machine Tools — 0.3% | ||||||||
Snap-on, Inc. | 304 | 63,521 | ||||||
Stanley Black & Decker, Inc. | 935 | 163,915 | ||||||
| 227,436 | ||||||||
The accompanying notes are an integral part of the financial statements.
8
Gotham Enhanced 500 ETF
Portfolio of Investments (Continued)
September 30, 2021
Number | Value | |||||||
Common Stocks — (Continued) | ||||||||
Healthcare - Products — 2.2% | ||||||||
Abbott Laboratories | 4,017 | $ | 474,528 | |||||
ABIOMED, Inc. (1) | 38 | 12,370 | ||||||
Align Technology, Inc. (1) | 51 | 33,937 | ||||||
Baxter International, Inc. | 355 | 28,553 | ||||||
Boston Scientific Corp. (1) | 965 | 41,871 | ||||||
The Cooper Companies, Inc. | 39 | 16,119 | ||||||
Danaher Corp. | 1,623 | 494,106 | ||||||
DENTSPLY SIRONA, Inc. | 143 | 8,301 | ||||||
Edwards Lifesciences Corp. (1) | 456 | 51,624 | ||||||
Henry Schein, Inc. (1) | 92 | 7,007 | ||||||
Hologic, Inc. (1) | 1,349 | 99,570 | ||||||
IDEXX Laboratories, Inc. (1) | 68 | 42,289 | ||||||
Intuitive Surgical, Inc. (1) | 77 | 76,550 | ||||||
Medtronic PLC | 1,066 | 133,623 | ||||||
PerkinElmer, Inc. | 522 | 90,457 | ||||||
ResMed, Inc. | 96 | 25,301 | ||||||
STERIS PLC | 51 | 10,418 | ||||||
Stryker Corp. | 304 | 80,171 | ||||||
Teleflex, Inc. | 38 | 14,309 | ||||||
Thermo Fisher Scientific, Inc. | 313 | 178,826 | ||||||
West Pharmaceutical Services, Inc. | 61 | 25,897 | ||||||
Zimmer Biomet Holdings, Inc. | 126 | 18,441 | ||||||
| 1,964,268 | ||||||||
Healthcare - Services — 2.4% | ||||||||
Anthem, Inc. | 788 | 293,766 | ||||||
Catalent, Inc. (1) | 152 | 20,227 | ||||||
Centene Corp. (1) | 456 | 28,413 | ||||||
Charles River Laboratories International, Inc. (1) | 43 | 17,745 | ||||||
DaVita, Inc. (1) | 84 | 9,766 | ||||||
HCA Healthcare, Inc. | 2,010 | 487,867 | ||||||
Humana, Inc. | 100 | 38,915 | ||||||
IQVIA Holdings, Inc. (1) | 143 | 34,254 | ||||||
Laboratory Corp. of America Holdings (1) | 556 | 156,481 | ||||||
Quest Diagnostics, Inc. | 681 | 98,956 | ||||||
UnitedHealth Group, Inc. | 2,414 | 943,246 | ||||||
Universal Health Services, Inc. - Class B | 51 | 7,057 | ||||||
| 2,136,693 | ||||||||
Home Builders — 0.1% | ||||||||
D.R. Horton, Inc. | 229 | 19,229 | ||||||
Lennar Corp. - Class A | 685 | 64,171 | ||||||
NVR, Inc. (1) | 4 | 19,176 | ||||||
PulteGroup, Inc. | 152 | 6,980 | ||||||
| 109,556 | ||||||||
Home Furnishings — 0.1% | ||||||||
Leggett & Platt, Inc. | 181 | 8,116 | ||||||
Number | Value | |||||||
Common Stocks — (Continued) | ||||||||
Home Furnishings — (Continued) | ||||||||
Whirlpool Corp. (2) | 355 | $ | 72,370 | |||||
| 80,486 | ||||||||
Household Products & Wares — 0.2% | ||||||||
Avery Dennison Corp. | 463 | 95,938 | ||||||
Church & Dwight Co., Inc. (2) | 152 | 12,551 | ||||||
The Clorox Co. | 77 | 12,752 | ||||||
Kimberly-Clark Corp. | 266 | 35,229 | ||||||
| 156,470 | ||||||||
Housewares — 0.0% (3) | ||||||||
Newell Brands, Inc. (2) | 331 | 7,328 | ||||||
Insurance — 2.8% | ||||||||
Aflac, Inc. | 456 | 23,771 | ||||||
The Allstate Corp. | 203 | 25,844 | ||||||
American International Group, Inc. | 639 | 35,075 | ||||||
Aon PLC | 319 | 91,161 | ||||||
Arthur J. Gallagher & Co. | 1,134 | 168,569 | ||||||
Assurant, Inc. | 51 | 8,045 | ||||||
Berkshire Hathaway, Inc. - Class B (1) | 5,514 | 1,504,991 | ||||||
Brown & Brown, Inc. | 1,275 | 70,699 | ||||||
Chubb Ltd. | 304 | 52,738 | ||||||
Cincinnati Financial Corp. (2) | 100 | 11,422 | ||||||
Everest Re Group Ltd. | 32 | 8,025 | ||||||
Globe Life, Inc. | 96 | 8,547 | ||||||
The Hartford Financial Services Group, Inc. | 235 | 16,509 | ||||||
Lincoln National Corp. | 100 | 6,875 | ||||||
Loews Corp. | 152 | 8,197 | ||||||
Marsh & McLennan Companies, Inc. | 1,674 | 253,494 | ||||||
MetLife, Inc. | 608 | 37,532 | ||||||
Principal Financial Group, Inc. | 152 | 9,789 | ||||||
The Progressive Corp. | 395 | 35,704 | ||||||
Prudential Financial, Inc. | 306 | 32,191 | ||||||
The Travelers Companies, Inc. | 168 | 25,538 | ||||||
W.R. Berkley Corp. | 100 | 7,318 | ||||||
Willis Towers Watson PLC | 101 | 23,478 | ||||||
| 2,465,512 | ||||||||
Internet — 14.4% | ||||||||
Alphabet, Inc. - Class A (1) | 1,659 | 4,435,370 | ||||||
Amazon.com, Inc. (1) | 1,367 | 4,490,650 | ||||||
Booking Holdings, Inc. (1) | 32 | 75,964 | ||||||
CDW Corp. | 109 | 19,840 | ||||||
eBay, Inc. | 2,217 | 154,458 | ||||||
Etsy, Inc. (1)(2) | 100 | 20,796 | ||||||
Expedia Group, Inc. - Class A | 96 | 15,735 | ||||||
F5 Networks, Inc. (1) | 62 | 12,324 | ||||||
The accompanying notes are an integral part of the financial statements.
9
Gotham Enhanced 500 ETF
Portfolio of Investments (Continued)
September 30, 2021
Number | Value | |||||||
Common Stocks — (Continued) | ||||||||
Internet — (Continued) | ||||||||
Facebook, Inc. - Class A (1) | 7,713 | $ | 2,617,715 | |||||
Match Group, Inc. (1) | 191 | 29,985 | ||||||
Netflix, Inc. (1) | 1,010 | 616,443 | ||||||
NortonLifeLock, Inc. | 455 | 11,512 | ||||||
Twitter, Inc. (1) | 1,824 | 110,151 | ||||||
VeriSign, Inc. (1) | 77 | 15,786 | ||||||
| 12,626,729 | ||||||||
Iron & Steel — 0.2% | ||||||||
Nucor Corp. (2) | 1,747 | 172,062 | ||||||
Leisure Time — 0.0% (3) | ||||||||
Carnival Corp. (2) | 708 | 17,707 | ||||||
Norwegian Cruise Line Holdings Ltd. (1)(2) | 249 | 6,651 | ||||||
Royal Caribbean Cruises Ltd. | 152 | 13,520 | ||||||
| 37,878 | ||||||||
Lodging — 0.1% | ||||||||
Hilton Worldwide Holdings, Inc. (1) | 223 | 29,460 | ||||||
Las Vegas Sands Corp. | 109 | 3,989 | ||||||
Marriott International, Inc. (1) | 218 | 32,284 | ||||||
MGM Resorts International | 398 | 17,174 | ||||||
Wynn Resorts Ltd. (2) | 77 | 6,526 | ||||||
| 89,433 | ||||||||
Machinery - Construction & Mining — 0.4% | ||||||||
Caterpillar, Inc. | 1,864 | 357,832 | ||||||
Machinery - Diversified — 0.4% | ||||||||
Deere & Co. (2) | 240 | 80,417 | ||||||
Dover Corp. | 737 | 114,603 | ||||||
IDEX Corp. | 51 | 10,554 | ||||||
Ingersoll Rand, Inc. (1) | 1,309 | 65,987 | ||||||
Otis Worldwide Corp. | 304 | 25,013 | ||||||
Rockwell Automation, Inc. | 100 | 29,404 | ||||||
Westinghouse Air Brake Technologies Corp. (2) | 122 | 10,518 | ||||||
Xylem, Inc. | 134 | 16,573 | ||||||
| 353,069 | ||||||||
Media — 1.2% | ||||||||
Charter Communications, Inc. - Class A (1)(2) | 420 | 305,575 | ||||||
Comcast Corp. - Class A | 3,648 | 204,033 | ||||||
Discovery, Inc. - Class A (1)(2) | 456 | 11,573 | ||||||
DISH Network Corp. - Class A (1)(2) | 2,988 | 129,858 | ||||||
Fox Corp. - Class A | 3,306 | 132,604 | ||||||
News Corp. - Class A | 456 | 10,730 | ||||||
ViacomCBS, Inc. - Class B | 491 | 19,399 | ||||||
Number | Value | |||||||
Common Stocks — (Continued) | ||||||||
Media — (Continued) | ||||||||
The Walt Disney Co. | 1,216 | $ | 205,711 | |||||
| 1,019,483 | ||||||||
Mining — 0.4% | ||||||||
Freeport-McMoRan, Inc. | 8,854 | 288,021 | ||||||
Newmont Corp. | 608 | 33,014 | ||||||
| 321,035 | ||||||||
Miscellaneous Manufacturers — 2.0% | ||||||||
3M Co. | 3,375 | 592,043 | ||||||
A.O. Smith Corp. | 124 | 7,573 | ||||||
Eaton Corp PLC | 311 | 46,435 | ||||||
General Electric Co. | 5,834 | 601,077 | ||||||
Illinois Tool Works, Inc. | 249 | 51,451 | ||||||
Parker-Hannifin Corp. | 760 | 212,511 | ||||||
Textron, Inc. | 1,282 | 89,496 | ||||||
Trane Technologies PLC | 1,179 | 203,554 | ||||||
| 1,804,140 | ||||||||
Office & Business Equipment — 0.0% (3) | ||||||||
Zebra Technologies Corp. (1) | 68 | 35,049 | ||||||
Oil & Gas — 2.4% | ||||||||
APA Corp. | 2,164 | 46,374 | ||||||
Cabot Oil & Gas Corp. | 304 | 6,615 | ||||||
Chevron Corp. | 3,459 | 350,916 | ||||||
ConocoPhillips | 912 | 61,806 | ||||||
Devon Energy Corp. | 621 | 22,052 | ||||||
Diamondback Energy, Inc. | 100 | 9,467 | ||||||
EOG Resources, Inc. | 3,209 | 257,586 | ||||||
Exxon Mobil Corp. | 11,292 | 664,195 | ||||||
Hess Corp. | 1,736 | 135,599 | ||||||
Marathon Oil Corp. | 4,435 | 60,626 | ||||||
Marathon Petroleum Corp. | 3,717 | 229,748 | ||||||
Occidental Petroleum Corp. | 5,458 | 161,448 | ||||||
Phillips 66 (2) | 291 | 20,379 | ||||||
Pioneer Natural Resources Co. | 143 | 23,811 | ||||||
Valero Energy Corp. | 252 | 17,784 | ||||||
| 2,068,406 | ||||||||
Oil & Gas Services — 0.1% | ||||||||
Baker Hughes Co. - Class A | 620 | 15,333 | ||||||
Halliburton Co. | 689 | 14,896 | ||||||
Schlumberger NV | 1,078 | 31,952 | ||||||
| 62,181 | ||||||||
Packaging & Containers — 0.1% | ||||||||
Amcor PLC | 1,216 | 14,093 | ||||||
Ball Corp. | 203 | 18,264 | ||||||
Packaging Corp. of America | 74 | 10,171 | ||||||
Sealed Air Corp. (2) | 121 | 6,630 | ||||||
Westrock Co. (2) | 880 | 43,850 | ||||||
| 93,008 | ||||||||
The accompanying notes are an integral part of the financial statements.
10
Gotham Enhanced 500 ETF
Portfolio of Investments (Continued)
September 30, 2021
Number | Value | |||||||
Common Stocks — (Continued) | ||||||||
Pharmaceuticals — 6.9% | ||||||||
AbbVie, Inc. | 9,992 | $ | 1,077,837 | |||||
AmerisourceBergen Corp. | 163 | 19,470 | ||||||
Becton Dickinson and Co. | 195 | 47,935 | ||||||
Bristol-Myers Squibb Co. | 1,643 | 97,216 | ||||||
Cardinal Health, Inc. | 195 | 9,645 | ||||||
Cigna Corp. | 1,968 | 393,915 | ||||||
CVS Health Corp. | 7,499 | 636,365 | ||||||
Dexcom, Inc. (1)(2) | 77 | 42,108 | ||||||
Eli Lilly & Co. (2) | 659 | 152,262 | ||||||
Johnson & Johnson | 8,466 | 1,367,259 | ||||||
McKesson Corp. | 926 | 184,626 | ||||||
Merck & Co., Inc. | 8,533 | 640,914 | ||||||
Organon & Co. | 1,436 | 47,086 | ||||||
Pfizer, Inc. | 28,689 | 1,233,914 | ||||||
Viatris, Inc. | 787 | 10,664 | ||||||
Zoetis, Inc. | 323 | 62,707 | ||||||
| 6,023,923 | ||||||||
Pipelines — 0.4% | ||||||||
Kinder Morgan, Inc. | 10,568 | 176,803 | ||||||
ONEOK, Inc. | 2,541 | 147,352 | ||||||
The Williams Companies, Inc. | 1,117 | 28,975 | ||||||
| 353,130 | ||||||||
Real Estate — 0.0% (3) | ||||||||
CBRE Group, Inc. (1) | 266 | 25,898 | ||||||
Real Estate Investment Trusts (REITs) — 1.3% | ||||||||
Alexandria Real Estate Equities, Inc. | 305 | 58,276 | ||||||
American Tower Corp. | 1,003 | 266,206 | ||||||
AvalonBay Communities, Inc. | 92 | 20,391 | ||||||
Boston Properties, Inc. | 100 | 10,835 | ||||||
Crown Castle International Corp. | 978 | 169,507 | ||||||
Digital Realty Trust, Inc. | 191 | 27,590 | ||||||
Duke Realty Corp. | 229 | 10,962 | ||||||
Equinix, Inc. | 70 | 55,309 | ||||||
Equity Residential | 229 | 18,531 | ||||||
Essex Property Trust, Inc. | 51 | 16,307 | ||||||
Extra Space Storage, Inc. | 88 | 14,783 | ||||||
Federal Realty Investment Trust (2) | 51 | 6,018 | ||||||
Healthpeak Properties, Inc. | 348 | 11,651 | ||||||
Host Hotels & Resorts, Inc. | 456 | 7,447 | ||||||
Iron Mountain, Inc. | 152 | 6,605 | ||||||
Kimco Realty Corp. | 419 | 8,694 | ||||||
Mid-America Apartment Communities, Inc. | 75 | 14,006 | ||||||
Prologis, Inc. | 499 | 62,590 | ||||||
Public Storage | 114 | 33,869 | ||||||
Realty Income Corp. | 249 | 16,150 | ||||||
Number | Value | |||||||
Common Stocks — (Continued) | ||||||||
Real Estate Investment Trusts — (REITs (Continued) | ||||||||
Regency Centers Corp. (2) | 100 | $ | 6,733 | |||||
SBA Communications Corp. | 247 | 81,651 | ||||||
Simon Property Group, Inc. | 220 | 28,593 | ||||||
UDR, Inc. | 199 | 10,543 | ||||||
Ventas, Inc. | 229 | 12,643 | ||||||
Vornado Realty Trust | 100 | 4,201 | ||||||
Welltower, Inc. (2) | 277 | 22,825 | ||||||
Weyerhaeuser Co. (2) | 4,402 | 156,579 | ||||||
| 1,159,495 | ||||||||
Retail — 7.2% | ||||||||
Advance Auto Parts, Inc. | 409 | 85,436 | ||||||
AutoZone, Inc. (1) | 120 | 203,759 | ||||||
Bath & Body Works, Inc. (1) | 1,491 | 93,978 | ||||||
Best Buy Co., Inc. | 1,583 | 167,339 | ||||||
CarMax, Inc. (1) | 100 | 12,796 | ||||||
Chipotle Mexican Grill, Inc. (1) | 22 | 39,985 | ||||||
Costco Wholesale Corp. | 298 | 133,906 | ||||||
Darden Restaurants, Inc. | 130 | 19,691 | ||||||
Dollar General Corp. | 181 | 38,397 | ||||||
Dollar Tree, Inc. (1) | 40 | 3,829 | ||||||
Domino’s Pizza, Inc. | 32 | 15,263 | ||||||
The Gap, Inc. | 1,968 | 44,674 | ||||||
Genuine Parts Co. | 811 | 98,318 | ||||||
The Home Depot, Inc. | 4,062 | 1,333,392 | ||||||
Lowe’s Companies, Inc. | 3,682 | 746,930 | ||||||
McDonald’s Corp. | 1,661 | 400,484 | ||||||
O’Reilly Automotive, Inc. (1) | 391 | 238,924 | ||||||
Ross Stores, Inc. | 243 | 26,451 | ||||||
Starbucks Corp. | 802 | 88,469 | ||||||
Target Corp. | 2,765 | 632,549 | ||||||
The TJX Companies, Inc. | 811 | 53,510 | ||||||
Tractor Supply Co. (2) | 77 | 15,601 | ||||||
Ulta Beauty, Inc. (1) | 312 | 112,607 | ||||||
Walgreens Boots Alliance, Inc. | 608 | 28,606 | ||||||
Walmart, Inc. | 10,593 | 1,476,452 | ||||||
Yum! Brands, Inc. | 1,668 | 204,013 | ||||||
| 6,315,359 | ||||||||
Savings & Loans — 0.0% (3) | ||||||||
People’s United Financial, Inc. | 229 | 4,001 | ||||||
Semiconductors — 4.3% | ||||||||
Advanced Micro Devices, Inc. (1) | 811 | 83,452 | ||||||
Analog Devices, Inc. | 292 | 48,904 | ||||||
Applied Materials, Inc. | 5,246 | 675,318 | ||||||
Broadcom, Inc. | 294 | 142,569 | ||||||
Intel Corp. | 22,128 | 1,178,980 | ||||||
IPG Photonics Corp. (1) | 51 | 8,078 | ||||||
KLA Corp. | 357 | 119,420 | ||||||
Lam Research Corp. | 808 | 459,873 | ||||||
The accompanying notes are an integral part of the financial statements.
11
Gotham Enhanced 500 ETF
Portfolio of Investments (Continued)
September 30, 2021
Number | Value | |||||||
Common Stocks — (Continued) | ||||||||
Semiconductors — (Continued) | ||||||||
Microchip Technology, Inc. | 190 | $ | 29,163 | |||||
Micron Technology, Inc. (2) | 4,410 | 313,022 | ||||||
Monolithic Power Systems, Inc. | 30 | 14,540 | ||||||
NVIDIA Corp. | 1,672 | 346,372 | ||||||
NXP Semiconductors NV | 217 | 42,504 | ||||||
Qorvo, Inc. (1) | 100 | 16,719 | ||||||
QUALCOMM, Inc. | 898 | 115,824 | ||||||
Skyworks Solutions, Inc. | 100 | 16,478 | ||||||
Teradyne, Inc. | 117 | 12,773 | ||||||
Texas Instruments, Inc. | 743 | 142,812 | ||||||
Xilinx, Inc. | 152 | 22,951 | ||||||
| 3,789,752 | ||||||||
Shipbuilding — 0.0% (3) | ||||||||
Huntington Ingalls Industries, Inc. | 22 | 4,247 | ||||||
Software — 10.3% | ||||||||
Activision Blizzard, Inc. | 52 | 4,024 | ||||||
Adobe, Inc. (1) | 1,082 | 622,929 | ||||||
Akamai Technologies, Inc. (1) | 100 | 10,459 | ||||||
ANSYS, Inc. (1) | 208 | 70,814 | ||||||
Autodesk, Inc. (1) | 498 | 142,015 | ||||||
Broadridge Financial Solutions, Inc. | 77 | 12,831 | ||||||
Cadence Design Systems, Inc. (1) | 625 | 94,650 | ||||||
Cerner Corp. | 235 | 16,572 | ||||||
Citrix Systems, Inc. | 81 | 8,697 | ||||||
Electronic Arts, Inc. | 659 | 93,743 | ||||||
Fidelity National Information Services, Inc. | 33 | 4,015 | ||||||
Fiserv, Inc. (1)(2) | 456 | 49,476 | ||||||
Intuit, Inc. | 184 | 99,270 | ||||||
Jack Henry & Associates, Inc. | 51 | 8,367 | ||||||
Microsoft Corp. | 20,400 | 5,751,168 | ||||||
MSCI, Inc. | 66 | 40,150 | ||||||
Oracle Corp. (2) | 7,528 | 655,915 | ||||||
Paychex, Inc. | 2,031 | 228,386 | ||||||
Paycom Software, Inc. (1) | 51 | 25,283 | ||||||
PTC, Inc. (1) | 77 | 9,224 | ||||||
Roper Technologies, Inc. | 240 | 107,071 | ||||||
salesforce.com, Inc. (1) | 2,211 | 599,667 | ||||||
ServiceNow, Inc. (1) | 452 | 281,266 | ||||||
Synopsys, Inc. (1) | 343 | 102,698 | ||||||
Take-Two Interactive Software, Inc. (1) | 27 | 4,160 | ||||||
Tyler Technologies, Inc. (1) | 32 | 14,677 | ||||||
| 9,057,527 | ||||||||
Number | Value | |||||||
Common Stocks — (Continued) | ||||||||
Telecommunications — 4.0% | ||||||||
Arista Networks, Inc. (1) | 51 | $ | 17,526 | |||||
AT&T, Inc. | 32,482 | 877,339 | ||||||
Cisco Systems, Inc. | 24,277 | 1,321,397 | ||||||
Corning, Inc. (2) | 4,715 | 172,050 | ||||||
Juniper Networks, Inc. | 256 | 7,045 | ||||||
Lumen Technologies, Inc. (2) | 760 | 9,417 | ||||||
Motorola Solutions, Inc. | 112 | 26,020 | ||||||
T-Mobile US, Inc. (1) | 912 | 116,517 | ||||||
Verizon Communications, Inc. | 17,211 | 929,566 | ||||||
| 3,476,877 | ||||||||
Textiles — 0.1% | ||||||||
Mohawk Industries, Inc. (1) | 456 | 80,894 | ||||||
Toys, Games & Hobbies — 0.0% (3) | ||||||||
Hasbro, Inc. | 91 | 8,119 | ||||||
Transportation — 2.5% | ||||||||
C.H. Robinson Worldwide, Inc. | 104 | 9,048 | ||||||
CSX Corp. | 12,505 | 371,899 | ||||||
Expeditors International of Washington, Inc. | 954 | 113,650 | ||||||
FedEx Corp. | 18 | 3,947 | ||||||
J.B. Hunt Transport Services, Inc. | 77 | 12,876 | ||||||
Kansas City Southern (2) | 58 | 15,697 | ||||||
Norfolk Southern Corp. | 1,130 | 270,353 | ||||||
Old Dominion Freight Line, Inc. | 91 | 26,024 | ||||||
Union Pacific Corp. | 2,920 | 572,349 | ||||||
United Parcel Service, Inc. - Class B | 4,334 | 789,221 | ||||||
| 2,185,064 | ||||||||
Water — 0.0% (3) | ||||||||
American Water Works Co., Inc. | 121 | 20,454 | ||||||
TOTAL COMMON STOCKS | ||||||||
(Cost $87,587,057) | 87,617,977 | |||||||
SHORT-TERM INVESTMENTS — 0.2% | ||||||||
MONEY MARKET FUNDS — 0.2% | ||||||||
First American Government Obligations Fund - Class X, 0.026% (4) | 152,674 | 152,674 | ||||||
TOTAL SHORT-TERM INVESTMENTS | ||||||||
(Cost $152,674) | 152,674 | |||||||
The accompanying notes are an integral part of the financial statements.
12
Gotham Enhanced 500 ETF
Portfolio of Investments (Concluded)
September 30, 2021
Number | Value | |||||||
INVESTMENTS PURCHASED WITH COLLATERAL FROM SECURITIES LENDING — 4.3% | ||||||||
Mount Vernon Liquid Assets Portfolio, LLC, 0.090% (4) | 3,780,082 | $ | 3,780,082 | |||||
TOTAL INVESTMENTS PURCHASED WITH COLLATERAL FROM SECURITIES LENDING | ||||||||
(Cost $3,780,082) | 3,780,082 | |||||||
TOTAL INVESTMENTS IN SECURITIES — 104.3% | ||||||||
(Cost $91,519,813) | 91,550,733 | |||||||
LIABILITIES IN EXCESS OF OTHER ASSETS — (4.3%) | (3,752,212 | ) | ||||||
TOTAL NET ASSETS — 100.0% | $ | 87,798,521 | ||||||
(1) | Non-income producing security. |
(2) | This security or a portion of this security was out on loan as of September 30, 2021. Total loaned securities had a value of $3,631,593 or 4.1% of net assets as of September 30, 2021. The remaining contractual maturity of all of the securities lending transactions is overnight and continuous. |
(3) | Does not round to 0.1% or (0.1)%, as applicable. |
(4) | The rate shown is the annualized seven-day effective yield as of September 30, 2021. |
The accompanying notes are an integral part of the financial statements.
13
Gotham Enhanced 500 ETF
Statement of Assets and Liabilities
September 30, 2021
Assets: | ||||
Investments in securities, at value (Cost $91,519,813) (Note 2) (1) | $ | 91,550,733 | ||
Receivables: | ||||
Investment securities sold | 2,819,978 | |||
Dividends and interest receivable | 51,360 | |||
Securities lending income, net (Note 5) | 117 | |||
Total assets | 94,422,188 | |||
Liabilities: | ||||
Collateral received for securities loaned (Note 5) | 3,780,082 | |||
Payables: | ||||
Investment securities purchased | 2,814,230 | |||
Management fees (Note 4) | 29,355 | |||
Total liabilities | 6,623,667 | |||
Net Assets | $ | 87,798,521 | ||
Components of Nets Assets: | ||||
Paid-in capital | $ | 87,630,485 | ||
Total distributable (accumulated) earnings (losses) | 168,036 | |||
Net assets | $ | 87,798,521 | ||
Net Asset Value (unlimited shares authorized): | ||||
Net assets | $ | 87,798,521 | ||
Shares of beneficial interest issued and outstanding | 3,800,000 | |||
Net asset value | $ | 23.10 |
(1) | Includes loaned securities with a value of $3,631,593. |
The accompanying notes are an integral part of the financial statements.
14
Gotham Enhanced 500 ETF
Statement of Operations
For the Period Ended September 30, 2021 (1)
Investment Income: | ||||
Dividend income(2) | $ | 375,941 | ||
Securities lending income (Note 5) | 675 | |||
Interest income | 12 | |||
Total investment income | 376,628 | |||
Expenses: | ||||
Management fees (Note 4) | 156,351 | |||
Total expenses | 156,351 | |||
Less: Management fee wavier (Note 4) | (36,081 | ) | ||
Net expenses | 120,270 | |||
Net investment income (loss) | 256,358 | |||
Realized and Unrealized Gain (Loss) on Investments: | ||||
Net realized gain (loss) on investments | (119,242 | ) | ||
Change in net unrealized appreciation/depreciation on investments | 30,920 | |||
Net realized and unrealized gain (loss) on investments | (88,322 | ) | ||
Net increase (decrease) in net assets resulting from operations | $ | 168,036 |
(1) | The Fund commenced operations on December 28, 2020. The information presented is from December 28, 2020 to September 30, 2021. |
(2) | Net of dividend tax withheld of $68. |
The accompanying notes are an integral part of the financial statements.
15
Gotham Enhanced 500 ETF
Statement of Changes in Net Assets
Period Ended | ||||
Increase (Decrease) in Net Assets From: | ||||
Operations: | ||||
Net investment income (loss) | $ | 256,358 | ||
Net realized gain (loss) on investments | (119,242 | ) | ||
Change in net unrealized appreciation/depreciation on investments | 30,920 | |||
Net increase (decrease) in net assets resulting from operations | 168,036 | |||
Distributions to Shareholders: | ||||
Net distributions to shareholders | — | |||
Capital Share Transaction: | ||||
Net increase (decrease) in net assets derived from net change in outstanding shares (2) | 87,630,485 | |||
Total increase (decrease) in net assets | 87,798,521 | |||
Net Assets: | ||||
Beginning of period | — | |||
End of period | $ | 87,798,521 | ||
(1) | The Fund commenced operations on December 28, 2020. The information presented is from December 28, 2020 to September 30, 2021. |
(2) | Summary of share transactions is as follows: |
Period Ended | ||||||||
Shares | Value | |||||||
Shares sold | 3,800,000 | $ | 87,630,485 | |||||
Shares redeemed | — | — | ||||||
Net increase (decrease) | 3,800,000 | $ | 87,630,485 | |||||
The accompanying notes are an integral part of the financial statements.
16
Gotham Enhanced 500 ETF
Financial Highlights
Period Ended | ||||
Net asset value, beginning of period | $ | 20.00 | ||
Income from Investment Operations: | ||||
Net investment income (loss) (2) | 0.19 | |||
Net realized and unrealized gain (loss) on investments | 2.91 | |||
Total from investment operations | 3.10 | |||
Less Distributions: | ||||
From net investment income | — | |||
Total distributions | — | |||
Net asset value, end of period | $ | 23.10 | ||
Total Return (3)(4) | 15.53 | % | ||
Rations/ Supplemental Data: | ||||
Net assets, end of period (millions) | $ | 87.8 | ||
Portfolio turnover rate (3) | 36 | % | ||
Ratio of expenses to average net assets | ||||
Before management fees waived (5) | 0.65 | % | ||
After management fees waived (5) | 0.50 | % | ||
Ratio of net investment income (loss) to average net assets | ||||
Before management fees waived (5) | 0.92 | % | ||
After management fees waived (5) | 1.07 | % | ||
(1) | The Fund commenced operations on December 28, 2020. The information presented is from December 28, 2020 to September 30, 2021. |
(2) | Calculated using average shares outstanding method. |
(3) | Not annualized. |
(4) | The total return is based on the Fund’s net asset value. Additional performance information is presented in the Performance Data. |
(5) | Annualized. |
The accompanying notes are an integral part of the financial statements.
17
Gotham Enhanced 500 ETF
Notes to Financial Statements
September 30, 2021
Note 1 – Organizational
The Fund is a diversified series of shares of beneficial interest of Tidal ETF Trust (the “Trust”). The Trust was organized as a Delaware statutory trust on June 4, 2018 and is registered with the Securities and Exchange Commission (the “SEC”) under the Investment Company Act of 1940, as amended (the “1940 Act”), as an open-end management investment company and the offering of the Fund’s shares is registered under the Securities Act of 1933, as amended. The Fund is an investment company and accordingly follows the investment company accounting and reporting guidance of the Financial Accounting Standards Board (“FASB”) Accounting Standard Codification Topic 946 “Financial Services—Investment Companies.” The Fund commenced operations on December 28, 2020.
The investment objective of the Fund is to seek long-term capital appreciation.
Note 2 – Significant Accounting Policies
The following is a summary of significant accounting policies consistently followed by the Fund. These policies are in conformity with accounting principles generally accepted in the United States of America (“U.S. GAAP”).
A. | Security Valuation. Equity securities listed on a securities exchange, market or automated quotation system for which quotations are readily available (except for securities traded on the NASDAQ Stock Market, LLC (“NASDAQ”)), including securities traded over the counter, are valued at the last quoted sale price on the primary exchange or market (foreign or domestic) on which they are traded on the valuation date (or at approximately 4:00 p.m. EST if a security’s primary exchange is normally open at that time), or, if there is no such reported sale on the valuation date, at the most recent quoted bid price or mean between the most recent quoted bid and ask prices for long and short positions. For a security that trades on multiple exchanges, the primary exchange will generally be considered the exchange on which the security is generally most actively traded. For securities traded on NASDAQ, the NASDAQ Official Closing Price will be used. Prices of securities traded on the securities exchange will be obtained from recognized independent pricing agents (“Independent Pricing Agents”) each day that the Fund is open for business. |
For securities for which quotations are not readily available, a fair value will be determined by the Valuation Committee using the Fair Value Procedures approved by the Trust’s Board of Trustees (the “Board”). When a security is “fair valued,” consideration is given to the facts and circumstances relevant to the particular situation, including a review of various factors set forth in the Fair Value Procedures adopted by the Board. Fair value pricing is an inherently subjective process, and no single standard exists for determining fair value. Different funds could reasonably arrive at different values for the same security. The use of fair value pricing by a fund may cause the net asset value of its shares to differ significantly from the net asset value that would be calculated without regard to such considerations.
As described above, the Fund utilizes various methods to measure the fair value of its investments on a recurring basis. U.S. GAAP establishes a hierarchy that prioritizes inputs to valuation methods. The three levels of inputs are:
Level 1 – | Unadjusted quoted prices in active markets for identical assets or liabilities that the Fund has the ability to access. |
Level 2 – | Observable inputs other than quoted prices included in Level 1 that are observable for the asset or liability, either directly or indirectly. These inputs may include quoted prices for the identical instrument on an inactive market, prices for similar instruments, interest rates, prepayment speeds, credit risk, yield curves, default rates and similar data. |
Level 3 – | Unobservable inputs for the asset or liability, to the extent relevant observable inputs are not available; representing the Fund’s own assumptions about the assumptions a market participant would use in valuing the asset or liability and would be based on the best information available. |
18
Gotham Enhanced 500 ETF
Notes to Financial Statements (Continued)
September 30, 2021
The availability of observable inputs can vary from security to security and is affected by a wide variety of factors, including, for example, the type of security, whether the security is new and not yet established in the marketplace, the liquidity of markets, and other characteristics particular to the security. To the extent that valuation is based on models or inputs that are less observable or unobservable in the market, the determination of fair value requires more judgment. Accordingly, the degree of judgment exercised in determining fair value is greatest for instruments categorized in Level 3.
The inputs used to measure fair value may fall into different levels of the fair value hierarchy. In such cases, for disclosure purposes, the level in the fair value hierarchy within which the fair value measurement falls in its entirety, is determined based on the lowest level input that is significant to the fair value measurement in its entirety.
The following is a summary of the inputs used to value the Fund’s investments as of September 30, 2021:
Investments in Securities | Investments | Level 1 | Level 2 | Level 3 | Total | |||||||||||||||
Common Stocks (1) | $ | — | $ | 87,617,977 | $ | — | $ | — | $ | 87,617,977 | ||||||||||
Short-Term Investments | — | 152,674 | — | — | 152,674 | |||||||||||||||
Investments Purchased With Collateral From Securities Lending (2) | 3,780,082 | — | — | — | 3,780,082 | |||||||||||||||
Total Investments in Securities | $ | 3,780,082 | $ | 87,770,651 | $ | — | $ | — | $ | 91,550,733 | ||||||||||
(1) | See Schedule of Investments for the industry breakout. |
(2) | Certain investments that are measured at fair value using the net asset value per share (or its equivalent) practical expedient have not been categorized in the fair value hierarchy. The fair value amounts presented in the table are intended to permit reconciliation of the fair value hierarchy to the amounts presented in the Schedule of Investments. |
B. | Federal Income Taxes. The Fund has elected to be taxed as a “regulated investment company” and intends to distribute substantially all taxable income to its shareholders and otherwise comply with the provisions of the Internal Revenue Code applicable to regulated investment companies. Therefore, no provision for federal income taxes or excise taxes has been made. |
In order to avoid imposition of the excise tax applicable to regulated investment companies, the Fund intends to declare as dividends in each calendar year at least 98.0% of its net investment income (earned during the calendar year) and at least 98.2% of its net realized capital gains (earned during the twelve months ended October 31) plus undistributed amounts, if any, from prior years.
As of September 30, 2021, the Fund did not have any tax positions that did not meet the threshold of being sustained by the applicable tax authority. Generally, tax authorities can examine all the tax returns filed for the last three years. The Fund identifies its major tax jurisdiction as U.S. Federal and the Commonwealth of Delaware; however, the Fund is not aware of any tax positions for which it is reasonably possible that the total amounts of unrecognized tax benefits will change materially.
C. | Securities Transactions and Investment Income. Investment securities transactions are accounted for on the trade date. Gains and losses realized on sales of securities are determined on a specific identification basis. Discounts/premiums on debt securities purchased are accreted/amortized over the life of the respective securities using the effective interest method. Dividend income is recorded on the ex-dividend date. Debt income |
19
Gotham Enhanced 500 ETF
Notes to Financial Statements (Continued)
September 30, 2021
is recorded on an accrual basis. Other non-cash dividends are recognized as investment income at the fair value of the property received. Withholding taxes on foreign dividends have been provided for in accordance with the Trust’s understanding of the applicable country’s tax rules and rates.
D. | Foreign Currency. Investment securities and other assets and liabilities denominated in foreign currencies are translated into U.S. dollar amounts at the date of valuation. Purchases and sales of investment securities and income and expense items denominated in foreign currencies are translated into U.S. dollar amounts on the respective dates of such transactions. |
The Fund does not isolate that portion of the results of operations resulting from changes in foreign exchange rates on investments from the fluctuations arising from changes in market prices of securities held. Such fluctuations are included with the net realized and unrealized gain or loss from investments.
The Fund reports net realized foreign exchange gains or losses that arise from sales of foreign currencies, currency gains or losses realized between the trade and settlement dates on securities transactions, and the difference between the amounts of dividends, interest, and foreign withholding taxes recorded on the Fund’s books and the U.S. dollar equivalent of the amounts actually received or paid. Net unrealized foreign exchange gains and losses arise from changes in the fair values of assets and liabilities, other than investments in securities at period end, resulting from changes in exchange rates.
E. | Distributions to Shareholders. Distributions to shareholders from net investment income, if any, for the Fund are declared and paid at least annually. Distributions to shareholders from net realized gains on securities, if any, for the Fund normally are declared and paid on an annual basis. Distributions are recorded on the ex-dividend date. |
F. | Use of Estimates. The preparation of financial statements in conformity with U.S. GAAP requires management to make estimates and assumptions that affect the reported amounts of assets and liabilities at the date of the financial statements and the reported amount of revenue and expenses during the reporting period. Actual results could differ from those estimates. |
G. | Share Valuation. The net asset value (“NAV”) per share of the Fund is calculated by dividing the sum of the value of the securities held by the Fund, plus cash or other assets, minus all liabilities by the total number of shares outstanding for the Fund, rounded to the nearest cent. The Fund’s shares will not be priced on the days on which the New York Stock Exchange (“NYSE”) is closed for trading. |
H. | Guarantees and Indemnifications. In the normal course of business, the Fund enters into contracts with service providers that contain general indemnification clauses. The Fund’s maximum exposure under these arrangements is unknown as this would involve future claims that may be made against the Fund that have not yet occurred. However, based on experience, the Fund expects the risk of loss to be remote. |
I. | Illiquid Securities. Pursuant to Rule 22e-4 under the 1940 Act, the Fund has adopted a Board-approved Liquidity Risk Management Program (“LRMP”) that requires, among other things, that the Fund limit its illiquid investments that are assets to no more than 15% of the value of the Fund’s net assets. An illiquid investment is any security that the Fund reasonably expects cannot be sold or disposed of in current market conditions in seven calendar days or less without the sale or disposition significantly changing the market value of the investment. If the Fund should be in a position where the value of illiquid investments held by the Fund exceeds 15% of the Fund’s net assets, the Fund will take such steps as set forth in the LRMP. |
20
Gotham Enhanced 500 ETF
Notes to Financial Statements (Continued)
September 30, 2021
J. | Reclassification of Capital Accounts. U.S. GAAP requires that certain components of net assets relating to permanent differences be reclassified between financial and tax reporting. These reclassifications have no effect on net assets or NAV per share. These differences are primarily due to adjustments for redemptions in-kind. For the period ended September 30, 2021, there were no adjustments that needed to be made to the Fund. |
The Fund may realize net capital gains resulting from in-kind redemptions, in which shareholders exchange Fund shares for securities held by the Fund rather than for cash. Because such gains are not taxable to the Fund, and are not distributed to shareholders, they would be reclassified from undistributed gains to paid-in-capital. During the period ended September 30, 2021, the Fund did not realize any net capital gains resulting from in-kind redemptions.
Note 3 – Principal Investment Risks
A. | Equity Market Risk. The equity securities held in the Fund’s portfolio may experience sudden, unpredictable drops in value or long periods of decline in value. This may occur because of factors that affect securities markets generally or factors affecting specific issuers, industries, or sectors in which the Fund invests. Common stocks, such as those held by the Fund, are generally exposed to greater risk than other types of securities, such as preferred stock and debt obligations, because common stockholders generally have inferior rights to receive payment from issuers. Securities in the Fund’s portfolio may underperform in comparison to securities in the general financial markets, a particular financial market, or other asset classes, due to a number of factors. Factors that could impact the market value of an equity security include a company’s business performance investor perceptions, stock market trends and general economic conditions. |
B. | Exchanged Traded Fund (“ETF”) Risk. |
● | Authorized Participants, Market Makers, and Liquidity Providers Concentration Risk. The Fund has a limited number of financial institutions that are authorized to purchase and redeem Shares directly from the Fund (known as “Authorized Participants” or “APs”). In addition, there may be a limited number of market makers and/or liquidity providers in the marketplace. To the extent either of the following events occur, Shares may trade at a material discount to NAV and possibly face delisting: (i) APs exit the business or otherwise become unable to process creation and/or redemption orders and no other APs step forward to perform these services; or (ii) market makers and/or liquidity providers exit the business or significantly reduce their business activities and no other entities step forward to perform their functions. |
● | Costs of Buying or Selling Shares. Due to the costs of buying or selling Shares, including brokerage commissions imposed by brokers and bid-ask spreads, frequent trading of Shares may significantly reduce investment results and an investment in Shares may not be advisable for investors who anticipate regularly making small investments. |
● | Shares May Trade at Prices Other Than NAV. As with all ETFs, Shares may be bought and sold in the secondary market at market prices. Although it is expected that the market price of Shares will approximate the Fund’s NAV, there may be times when the market price of Shares is more than the NAV intra-day (premium) or less than the NAV intra-day (discount) due to supply and demand of Shares or during periods of market volatility. This risk is heightened in times of market volatility, periods of steep market declines, and periods when there is limited trading activity for Shares in the secondary market, in which case such premiums or discounts may be significant. |
● | Trading. Shares are listed on the NYSE Arca, Inc. (the “Exchange”), and although Shares may be traded on U.S. exchanges other than the Exchange, there can be no assurance that Shares will trade with any volume, or at all, on any stock exchange. In stressed market conditions, the liquidity of Shares may begin to mirror the liquidity of the Fund’s underlying portfolio holdings, which can be significantly less liquid than Shares. |
21
Gotham Enhanced 500 ETF
Notes to Financial Statements (Continued)
September 30, 2021
C. | Large-Capitalization Investing Risk The securities of large-capitalization companies may be relatively mature compared to smaller companies and therefore subject to slower growth during times of economic expansion. Large-capitalization companies may also be unable to respond quickly to new competitive challenges, such as changes in technology and consumer tastes. |
D. | Value Style Risk. The Sub-Adviser (defined below) intends to buy securities, on behalf of the Fund, that it believes are undervalued. Investing in “value” stocks presents the risk that the stocks may never reach what the Sub-Adviser believes are their full market values, either because the market fails to recognize what the Sub-Adviser considers to be the companies’ true business values or because the Sub-Adviser misjudges those values. In addition, value stocks may fall out of favor with investors and underperform other stocks (such as growth stocks) during given periods. |
Note 4 – Commitments and Other Related Party Transactions
Toroso Investments, LLC (the “Adviser”) serves as investment adviser to the Fund pursuant to an investment advisory agreement between the Adviser and the Trust, on behalf of the Fund (the “Advisory Agreement”), and, pursuant to the Advisory Agreement, has overall responsibility for the general management and administration of the Fund. The Adviser provides oversight of the Sub-Adviser (defined below), monitoring of the Sub-Adviser’s buying and selling of securities for the Fund, and review of the Sub-Adviser’s performance.
Pursuant to the Advisory Agreement, the Fund pays the Adviser a unitary management fee (the “Management Fee”) based on the average daily net assets of the Fund as follows:
Management Fee | Management Fee |
0.65% | 0.50% |
The Adviser has contractually agreed to a reduced unitary Management Fee of 0.50% until at least December 31, 2023 (the “Fee Waiver Agreement”). The Fee Waiver Agreement may be terminated only by, or with the consent of, the Board. Any waived Management Fees are not able to be recouped by the Adviser under the Fee Waiver Agreement. Management Fees for the period ended September 30, 2021 are disclosed in the Statement of Operations.
Out of the Management Fee, the Adviser is obligated to pay or arrange for the payment of substantially all expenses of the Fund, including the cost of transfer agency, custody, fund administration, and all other related services necessary for the Fund to operate. Under the Advisory Agreement, the Adviser has agreed to pay all expenses incurred by the Fund except for interest charges on any borrowings, dividends and other expenses on securities sold short, taxes, brokerage commissions and other expenses incurred in placing orders for the purchase and sale of securities and other investment instruments, acquired fund fees and expenses, accrued deferred tax liability, extraordinary expenses, distribution fees and expenses paid by the Fund under any distribution plan adopted pursuant to Rule 12b-1 under the 1940 Act, and the Management Fee payable to the Adviser (collectively, “Excluded Expenses”). The Management Fees incurred are paid monthly to the Adviser.
Gotham Asset Management, LLC (the “Sub-Adviser”), serves as sub-adviser to the Fund, pursuant to a sub-advisory agreement between the Adviser and the Sub-Adviser with respect to the Fund (the “Sub-Advisory Agreement”). Pursuant to the Sub-Advisory Agreement, the Sub-Adviser is responsible for the day-to-day management of the Fund’s portfolio, including determining the securities purchased and sold by the Fund, subject to the supervision of the Adviser and the Board. The Sub-Adviser is also responsible for trading portfolio securities for the Fund, including selecting broker-dealers to execute purchase and sale transactions, or directing such trading to be effected by the Adviser. The Sub-Adviser is paid a fee by the Adviser, which is calculated and paid monthly, at an annual rate of 0.50% of the Fund’s average daily net assets.
22
Gotham Enhanced 500 ETF
Notes to Financial Statements (Continued)
September 30, 2021
Under the Sub-Advisory Agreement, the Sub-Adviser has agreed to assume the Adviser’s obligation to pay all expenses incurred by the Fund except for the sub-advisory fee payable to the Sub-Adviser and Excluded Expenses. Such expenses incurred by the Fund and paid by the Sub-Adviser include fees charged by Tidal (defined below), which is an affiliate of the Adviser.
Tidal ETF Services LLC (“Tidal”), an affiliate of the Adviser, serves as the Fund’s administrator and, in that capacity, performs various administrative and management services for the Fund. Tidal coordinates the payment of Fund-related expenses and manages the Trust’s relationships with its various service providers.
U.S. Bancorp Fund Services, LLC, doing business as U.S. Bank Global Fund Services (“Fund Services”), serves as the Fund’s sub-administrator, fund accountant and transfer agent. In those capacities, Fund Services performs various administrative and accounting services for the Fund. Fund Services prepares various federal and state regulatory filings, reports and returns for the Fund, including regulatory compliance monitoring and financial reporting; prepares reports and materials to be supplied to the Board; and monitors the activities of the Fund’s custodian. U.S. Bank N.A. (the “Custodian”), an affiliate of Fund Services, serves as the Fund’s custodian. The Custodian acts as the securities lending agent (the “Securities Lending Agent”) for the Fund.
Foreside Fund Services, LLC (the “Distributor”) acts as the Fund’s principal underwriter in a continuous public offering of the Fund’s shares.
Certain officers and a trustee of the Trust are affiliated with the Adviser and Fund Services. Neither the affiliated trustee nor the Trust’s officers receive compensation from the Fund.
Note 5 – Securities Lending
The Fund may lend up to 33 1/3% of the value of the securities in its portfolio to brokers, dealers and financial institutions (but not individuals) under terms of participation in a securities lending program administered by the Securities Lending Agent. The securities lending agreement requires that loans are collateralized at all times in an amount equal to at least the market value of the securities loaned by the Fund. The Fund receives compensation in the form of fees and earned interest on the cash collateral. Due to timing issues of when a security is recalled from loan, the financial statements may differ in presentation. The amount of fees depends on a number of factors including the type of security and length of the loan. The Fund continues to receive interest payments or dividends on the securities loaned during the borrowing period. Gain or loss in the value of securities loaned that may occur during the term of the loan will be for the account of the Fund. The Fund has the right under the terms of the securities lending agreements to recall the securities from the borrower on demand.
As of September 30, 2021, the market value of the securities on loan and payable on collateral received for securities lending were as follows:
Fund | Market Value | Payable on | Percentage |
Gotham Enhanced 500 ETF | $3,631,593 | $3,780,082 | 4.1% |
As of September 30, 2021, the Fund had loaned securities and received cash collateral for the loans. The cash collateral is invested in the Mount Vernon Liquid Assets Portfolio, LLC of which the investment objective is to seek to maximize income to the extent consistent with the preservation of capital and liquidity and maintain a stable NAV of $1.00. Although risk is mitigated by the collateral, the Fund could experience a delay in recovering its securities and possible loss of income or value if the borrower fails to return the borrowed securities. In addition, the Fund bears the risk of loss associated with the investment of cash collateral received.
23
Gotham Enhanced 500 ETF
Notes to Financial Statements (Continued)
September 30, 2021
During the period ended September 30, 2021, the Fund loaned securities that were collateralized by cash. The cash collateral received was invested in the Mount Vernon Liquid Assets Portfolio, LLC as listed in the Fund’s Schedule of Investments. Securities lending income is disclosed in the Fund’s Statement of Operations.
The Funds are not subject to a master netting agreement with respect to each Fund’s participation in securities lending; therefore, no additional disclosures regarding netting arrangements are required.
Note 6 – Purchase and Sales of Securities
For the period ended September 30, 2021, the cost of purchases and proceeds from the sales or maturities of securities, excluding short-term investments, U.S. government securities, and in-kind transactions were $18,394,634 and $12,717,809, respectively.
For the period ending September 30, 2021, there were no purchases or sales of long term U.S. Government securities.
For the period ended September 30, 2021, in-kind transactions associated with creations and redemptions for the funds were $82,032,747 and $0, respectively.
Note 7 – Income Taxes And Distributions To Shareholders
The tax character of distributions paid during the period ended September 30, 2021 is as follows:
Distributions paid from: | September 30, |
Ordinary income | $ — |
As of the period ended September 30, 2021, the components of accumulated earnings/(losses) on a tax basis were as follows:
Cost of investments (1) | $ | 91,663,705 | ||
Gross tax unrealized appreciation | 2,678,927 | |||
Gross tax unrealized depreciation | (2,791,899 | ) | ||
Net tax unrealized appreciation (depreciation) | (112,972 | ) | ||
Undistributed ordinary income (loss) | 279,396 | |||
Undistributed long-term capital gain (loss) | 1,612 | |||
Total distributable earnings | 281,008 | |||
Other accumulated gain (loss) | — | |||
Total accumulated gain (loss) | $ | 168,036 |
(1) | The difference between book and tax-basis cost of investments was attributable primarily to the treatment of wash sales. |
Net capital losses incurred after October 31 and net investment losses incurred after December 31, and within the taxable year, are deemed to arise on the first business day of the Fund’s next taxable year. As of September 30, 2021, the Fund had no late year losses and had no short-term capital loss carryovers.
Note 8 – Share Transactions
Shares of the Fund are listed and traded on the Exchange. Market prices for the shares may be different from their NAV. The Fund issues and redeems shares on a continuous basis at NAV generally in large blocks of shares (“Creation Units”). Creation Units are issued and redeemed principally in-kind for securities included in a specified universe. Once
24
Gotham Enhanced 500 ETF
Notes to Financial Statements (Concluded)
September 30, 2021
created, shares generally trade in the secondary market at market prices that change throughout the day. Except when aggregated in Creation Units, shares are not redeemable securities of the Fund. Creation Units may only be purchased or redeemed by Authorized Participants. An Authorized Participant is either (i) a broker-dealer or other participant in the clearing process through the Continuous Net Settlement System of the National Securities Clearing Corporation or (ii) a Depository Trust Company participant and, in each case, must have executed a Participant Agreement with the Distributor. Most retail investors do not qualify as Authorized Participants nor have the resources to buy and sell whole Creation Units. Therefore, they are unable to purchase or redeem the shares directly from the Fund. Rather, most retail investors may purchase shares in the secondary market with the assistance of a broker and are subject to customary brokerage commissions or fees.
The Fund currently offers one class of shares, which has no front-end sales load, no deferred sales charge, and no redemption fee. A fixed transaction fee is imposed for the transfer and other transaction costs associated with the purchase or sale of Creation Units. The standard fixed transaction fee for the Fund is $500, payable to the Custodian. The fixed transaction fee may be waived on certain orders if the Fund’s Custodian has determined to waive some or all of the costs associated with the order or another party, such as the Adviser, has agreed to pay such fee. In addition, a variable fee may be charged on all cash transactions or substitutes for Creation Units of up to a maximum of 2% and for Redemption Units of up to a maximum of 2%, respectively, of the value of the Creation Units and Redemption Units subject to the transaction. Variable fees received by the Fund, if any, are disclosed in the capital shares transactions section of the Statements of Changes in Net Assets. The Fund may issue an unlimited number of shares of beneficial interest, with no par value. All shares of the Fund have equal rights and privileges.
Note 9 – COVID-19 Pandemic
U.S. and international markets have experienced significant periods of volatility in recent years and months due to a number of economic, political and global macro factors including the impact of the novel coronavirus (COVID-19) as a global pandemic, which has resulted in public health issues, growth concerns in the U.S. and overseas, layoffs, rising unemployment claims, changed travel and social behaviors, and reduced consumer spending. The recovery from the effects of COVID-19 is uncertain and may last for an extended period of time. These developments as well as other events could result in further market volatility and negatively affect financial asset prices, the liquidity of certain securities and the normal operations of securities exchanges and other markets. As a result, the risk environment remains elevated. The Adviser will monitor developments and seek to manage the Fund in a manner consistent with the Fund’s investment objective but there can be no assurance that it will be successful in doing so.
Note 10 – Subsequent Events
In preparing these financial statements, the Fund has evaluated events and transactions for potential recognition or disclosure through the date the financial statements were issued. Management has determined that there are no subsequent events that would need to be disclosed in the Fund’s financial statements.
25
Gotham Enhanced 500 ETF
Report of Independent Registered Public Accounting Firm
To the Shareholders of
Gotham Enhanced 500 ETF and The Board of Trustees of
Tidal ETF Trust
Opinion on the Financial Statements
We have audited the accompanying statement of assets and liabilities of Gotham Enhanced 500 ETF (the “Fund”), a series of Tidal ETF Trust (the “Trust”), including the schedule of investments, as of September 30, 2021, the related statement of operations, the statement of changes in net assets and the financial highlights for the period December 28, 2020 (commencement of operations) to September 30, 2021, and the related notes (collectively referred to as the “financial statements”). In our opinion, the financial statements present fairly, in all material respects, the financial position of the Fund as of September 30, 2021, the results of its operations, the changes in its net assets and the financial highlights for the period December 28, 2020 to September 30, 2021, in conformity with accounting principles generally accepted in the United States of America.
Basis for Opinion
These financial statements are the responsibility of the Fund’s management. Our responsibility is to express an opinion on the Fund’s financial statements based on our audit. We are a public accounting firm registered with the Public Company Accounting Oversight Board (United States) (“PCAOB”) and are required to be independent with respect to the Fund in accordance with the U.S. federal securities laws and the applicable rules and regulations of the Securities and Exchange Commission and the PCAOB. We have served as the auditor of one or more of the funds in the Trust since 2018.
We conducted our audit in accordance with the standards of the PCAOB. Those standards require that we plan and perform the audit to obtain reasonable assurance about whether the financial statements are free of material misstatement, whether due to error or fraud. The Fund is not required to have, nor were we engaged to perform, an audit of its internal control over financial reporting. As part of our audit, we are required to obtain an understanding of internal control over financial reporting, but not for the purpose of expressing an opinion on the effectiveness of the Fund’s internal control over financial reporting. Accordingly, we express no such opinion.
Our audit included performing procedures to assess the risks of material misstatement of the financial statements, whether due to error or fraud, and performing procedures that respond to those risks. Such procedures included examining, on a test basis, evidence regarding the amounts and disclosures in the financial statements. Our audit also included evaluating the accounting principles used and significant estimates made by management, as well as evaluating the overall presentation of the financial statements. Our procedures included confirmation of securities owned as of September 30, 2021, by correspondence with the custodian and brokers, or through other appropriate auditing procedures when replies from brokers were unable to be obtained. We believe that our audit provides a reasonable basis for our opinion.
TAIT, WELLER & BAKER LLP | |
Philadelphia, Pennsylvania |

26
Gotham Enhanced 500 ETF
Trustees and Executive Officers
(Unaudited)
Name, Address and | Position | Term of Office and Length of Time Served | Principal Occupation(s) During Past 5 Years | Number of Portfolios | Other Directorships Held by Trustee During Past 5 Years |
Independent Trustees (1) | |||||
Mark H.W. Baltimore c/o Tidal ETF Services, LLC 898 N. Broadway, Suite 2 Massapequa, New York 11758 Born: 1967 | Trustee | Indefinite term; since 2018 | Co-Chief Executive Officer, Global Rhino, LLC (asset management consulting firm) (since 2018); Chief Business Development Officer, Joot (asset management compliance services firm) (since 2019); Chief Executive Officer, Global Sight, LLC (asset management distribution consulting firm) (2016-2018); Head of Global Distribution Services, Foreside Financial Group, LLC (broker-dealer) (2016); Managing Director, Head of Global Distribution Services, Beacon Hill Fund Services (broker-dealer) (2015–2016). | 28 | None |
Dusko Culafic c/o Tidal ETF Services, LLC 898 N. Broadway, Suite 2 Massapequa, New York 11758 Born: 1958 | Trustee | Indefinite term; since 2018 | Retired (since 2018); Senior Operational Due Diligence Analyst, Aurora Investment Management, LLC (2012–2018). | 28 | None |
Eduardo Mendoza c/o Tidal ETF Services, LLC 898 N. Broadway, Suite 2 Massapequa, New York 11758 Born: 1966 | Trustee | Indefinite term; since 2018 | Executive Vice President - Head of Capital Markets & Corporate Development, Credijusto (financial technology company) (since 2017); Founding Partner / Capital Markets & Head of Corporate Development, SQN Latina (specialty finance company) (2016–2017). | 28 | None |
27
Gotham Enhanced 500 ETF
Trustees and Executive Officers (Continued)
(Unaudited)
Name, Address and | Position | Term of Office and Length of Time Served | Principal Occupation(s) During Past 5 Years | Number of Portfolios | Other Directorships Held by Trustee During Past 5 Years |
Interested Trustee and Executive Officer | |||||
Eric W. Falkeis (2) c/o Tidal ETF Services, LLC 898 N. Broadway, Suite 2 Massapequa, New York 11758 Born: 1973 | President, Principal Executive Officer, Trustee, Chairman, and Secretary | President and Principal Executive Officer since 2019, Indefinite term; Trustee, Chairman, and Secretary since 2018, Indefinite term | Chief Executive Officer, Tidal ETF Services LLC (since 2018); Chief Operating Officer (and other positions), Rafferty Asset Management, LLC (2013-2018) and Direxion Advisors, LLC (2017-2018). | 28 | Independent Director, Muzinich BDC, Inc. (since 2019); Trustee, Professionally Managed Portfolios (27 series) (since 2011); Interested Trustee, Direxion Funds, Direxion Shares ETF Trust, and Direxion Insurance Trust (2014–2018). |
Executive Officers | |||||
Daniel H. Carlson c/o Tidal ETF Services, LLC 898 N. Broadway, Suite 2 Massapequa, New York 11758 Born: 1955 | Treasurer, Principal Financial Officer, Principal Accounting Officer, and AML Compliance Officer | Indefinite term; since 2018 | Chief Financial Officer, Chief Compliance Officer, and Managing Member, Toroso Investments, LLC (since 2012). | Not Applicable | Not Applicable |
28
Gotham Enhanced 500 ETF
Trustees and Executive Officers (Continued)
(Unaudited)
Name, Address and | Position | Term of Office and Length of Time Served | Principal Occupation(s) During Past 5 Years | Number of Portfolios | Other Directorships Held by Trustee During Past 5 Years |
William H. Woolverton, Esq. c/o Cipperman Compliance Services, LLC 480 E. Swedesford Road, Suite 220 Wayne, PA 19087 Born: 1951 | Chief Compliance Officer | Indefinite term; since 2021 | Senior Compliance Advisor, Cipperman Compliance Services, LLC (since 2020); Operating Partner, Altamont Capital Partners (private equity firm) (2021 to present); Managing Director and Head of Legal – US, Waystone (global governance solutions) (2016 to 2019). | Not Applicable | Not Applicable |
Aaron J. Perkovich c/o U.S. Bancorp Fund Services, LLC Milwaukee, Wisconsin 53202 Born: 1973 | Assistant Treasurer | Indefinite term; since 2018 | Vice President, U.S. Bancorp Fund Services, LLC (since 2006). | Not Applicable | Not Applicable |
Cory R. Akers c/o U.S. Bancorp Fund Services, LLC Milwaukee, Wisconsin 53202 Born: 1978 | Assistant Secretary | Indefinite term; since 2019 | Assistant Vice President, U.S. Bancorp Fund Services, LLC (since 2006). | Not Applicable | Not Applicable |
(1) | All Independent Trustees of the Trust are not “interested persons” of the Trust as defined under the 1940 Act (“Independent Trustees”). |
(2) | Mr. Falkeis is considered an “interested person” of the Trust due to his positions as President, Principal Executive Officer, Chairman and Secretary of the Trust, and Chief Executive Officer of Tidal ETF Services LLC, an affiliate of the Adviser. |
29
Gotham Enhanced 500 ETF
Other Information
(Unaudited)
Qualified Dividend Income/Dividends Received Deduction (Unaudited)
For the year ended September 30, 2021, certain dividends paid by the Fund may be subject to a maximum tax rate of 20%, as provided for by the Jobs and Growth Tax Relief Reconciliation Act of 2003 and the Tax Cuts and Jobs Act of 2017.
The percentage of dividends declared from ordinary income designated as qualified dividend income for the period ended September 30, 2021 was 0.00%.
For corporate shareholders, the percent of ordinary income distributions qualifying for the corporate dividends received deduction for the period ended September 30, 2021, was 0.00%.
The percentage of taxable ordinary income distributions that are designated as short-term capital gain distribution under Internal Revenue Section 871(k)(2)(c) for the period ended September 30, 2021, was 0.00%.
Information About Proxy Voting (Unaudited)
A description of the policies and procedures that the Fund uses to determine how to vote proxies relating to portfolio securities is available upon request without charge, by calling (855) 998-4779 or by accessing the Fund’s website at www.GothamETFs.com/GSPY. Furthermore, you can obtain the description on the SEC’s website at www.sec.gov.
Information regarding how the Fund voted proxies relating to portfolio securities during the most recent 12-month period ended June 30 is available upon request without charge by calling (855) 998-4779 or by accessing the SEC’s website at www.sec.gov.
Information About the Portfolio Holdings (Unaudited)
The Fund’s portfolio holdings are posted on the Fund’s website daily at www.GothamETFs.com/GSPY. The Fund files its complete schedule of portfolio holdings with the SEC for its first and third fiscal quarters on Part F of Form N-PORT. The Fund’s Part F of Form N-PORT is available without charge, upon request, by calling (855) 998-4779. Furthermore, you can obtain the Part F of Form N-PORT on the SEC’s website at www.sec.gov.
Frequency Distribution of Premiums and Discounts (Unaudited)
Information regarding how often shares of the Fund trade on the exchange at a price above (i.e., at a premium) or below (i.e., at a discount) to its daily NAV is available, without charge, on the Fund’s website at www.GothamETFs.com/GSPY.
Information About the Fund’s Trustees (Unaudited)
The Statement of Additional Information (“SAI”) includes additional information about the Fund’s Trustees and is available without charge, upon request, by calling (855) 998-4779. Furthermore, you can obtain the SAI on the SEC’s website at www.sec.gov or the Fund’s website at www.GothamETFs.com/GSPY.
30
[THIS PAGE INTENTIONALLY LEFT BLANK]
[THIS PAGE INTENTIONALLY LEFT BLANK]
[THIS PAGE INTENTIONALLY LEFT BLANK]
Investment Adviser
Toroso Investments, LLC
898 N. Broadway, Suite 2
Massapequa, New York 11758
Investment Sub-Adviser
Gotham Asset Management, LLC
535 Madison Avenue, 30th Floor
New York, New York 10022
Independent Registered Public Accounting Firm
Tait, Weller & Baker LLP
Two Liberty Place
50 South 16th Street, Suite 2900
Philadelphia, Pennsylvania 19102
Legal Counsel
Godfrey & Kahn, S.C.
833 East Michigan Street, Suite 1800
Milwaukee, Wisconsin 53202
Custodian
U.S. Bank N.A. Custody Operations
1555 North RiverCenter Drive, Suite 302
Milwaukee, Wisconsin 53212
Fund Administrator
Tidal ETF Services, LLC
898 N. Broadway, Suite 2
Massapequa, New York 11758
Transfer Agent, Fund Accountant and Fund Sub-Administrator
U.S. Bancorp Fund Services, LLC
615 East Michigan Street
Milwaukee, Wisconsin 53202
Distributor
Foreside Fund Services, LLC
Three Canal Plaza, Suite 100
Portland, Maine 04101
Fund Information | ||
Fund | Ticker | CUSIP |
Gotham Enhanced 500 ETF | GSPY | 886364835 |
| (b) | Not applicable. |
Item 2. Code of Ethics.
The registrant has adopted a code of ethics that applies to the registrant’s principal executive officer and principal financial officer. The registrant has not made any amendments to its code of ethics during the period covered by this report. The registrant has not granted any waivers from any provisions of the code of ethics during the period covered by this report.
A copy of the registrant’s Code of Ethics is filed herewith.
Item 3. Audit Committee Financial Expert.
The registrant’s Board of Trustees of the Trust has determined that there is at least one audit committee financial expert serving on its audit committee. Mr. Dusko Culafic is the “audit committee financial expert” and is considered to be “independent” as each term is defined in Item 3 of Form N-CSR.
Item 4. Principal Accountant Fees and Services.
The registrant has engaged its principal accountant to perform audit services, audit-related services, tax services and other services during the past fiscal year. “Audit services” refer to performing an audit of the registrant's annual financial statements or services that are normally provided by the accountant in connection with statutory and regulatory filings or engagements for those fiscal years. “Audit-related services” refer to the assurance and related services by the principal accountant that are reasonably related to the performance of the audit. “Tax services” refer to professional services rendered by the principal accountant for tax compliance, tax advice, and tax planning. There were no “Other services” provided by the principal accountant. The following table details the aggregate fees billed or expected to be billed for the last fiscal year for audit fees, audit-related fees, tax fees and other fees by the principal accountant.
Gotham Enhanced 500 ETF
| FYE 09/30/2021 | FYE 09/30/2020 | |
| Audit Fees | $12,500 | N/A |
| Audit-Related Fees | N/A | N/A |
| Tax Fees | $2,500 | N/A |
| All Other Fees | N/A | N/A |
The audit committee has adopted pre-approval policies and procedures that require the audit committee to pre-approve all audit and non-audit services of the registrant, including services provided to any entity affiliated with the registrant.
The percentage of fees billed by Tait Weller & Baker LLP applicable to non-audit services pursuant to waiver of pre-approval requirement were as follows:
| Non-Audit Related Fees | FYE 09/30/2021 | FYE 09/30/2020 |
| Registrant | N/A | N/A |
| Registrant’s Investment Adviser | N/A | N/A |
All of the principal accountant’s hours spent on auditing the registrant’s financial statements were attributed to work performed by full-time permanent employees of the principal accountant.
The following table indicates the non-audit fees billed or expected to be billed by the registrant’s accountant for services to the registrant and to the registrant’s investment adviser (and any other controlling entity, etc.—not sub-adviser) for the last year. The audit committee of the board of trustees/directors has considered whether the provision of non-audit services that were rendered to the registrant's investment adviser is compatible with maintaining the principal accountant's independence and has concluded that the provision of such non-audit services by the accountant has not compromised the accountant’s independence.
| Non-Audit Related Fees | FYE 09/30/2021 | FYE 09/30/2020 |
| Registrant | N/A | N/A |
| Registrant’s Investment Adviser | N/A | N/A |
Item 5. Audit Committee of Listed Registrants.
The registrant is an issuer as defined in Rule 10A-3 under the Securities Exchange Act of 1934, (the “Act”) and has a separately-designated standing audit committee established in accordance with Section 3(a)(58)(A) of the Act. The independent members of the committee are as follows: Dusko Culafic, Eduardo Mendoza, and Mark H.W. Baltimore.
Item 6. Investments.
(a) Schedule of Investments is included as part of the report to shareholders filed under Item 1 of this Form.
(b) Not applicable.
Item 7. Disclosure of Proxy Voting Policies and Procedures for Closed-End Management Investment Companies.
Not applicable to open-end investment companies.
Item 8. Portfolio Managers of Closed-End Management Investment Companies.
Not applicable to open-end investment companies.
Item 9. Purchases of Equity Securities by Closed-End Management Investment Company and Affiliated Purchasers.
Not applicable to open-end investment companies.
Item 10. Submission of Matters to a Vote of Security Holders.
There have been no material changes to the procedures by which shareholders may recommend nominees to the registrant’s board of Trustees.
Item 11. Controls and Procedures.
| (a) | The Registrant’s President/Principal Executive Officer and Treasurer/Principal Financial Officer have reviewed the Registrant's disclosure controls and procedures (as defined in Rule 30a-3(c) under the Investment Company Act of 1940 (the “Act”)) as of a date within 90 days of the filing of this report, as required by Rule 30a-3(b) under the Act and Rules 13a-15(b) or 15d-15(b) under the Securities Exchange Act of 1934. Based on their review, such officers have concluded that the disclosure controls and procedures are effective in ensuring that information required to be disclosed in this report is appropriately recorded, processed, summarized and reported and made known to them by others within the Registrant and by the Registrant’s service provider. |
| (b) | There were no changes in the Registrant's internal control over financial reporting (as defined in Rule 30a-3(d) under the Act) that occurred during the period covered by this report that have materially affected, or are reasonably likely to materially affect, the Registrant's internal control over financial reporting. |
Item 12. Disclosure of Securities Lending Activities for Closed-End Management Investment Companies
Not applicable to open-end investment companies.
Item 13. Exhibits.
| (a) | (1) Any code of ethics or amendment thereto, that is the subject of the disclosure required by Item 2, to the extent that the registrant intends to satisfy Item 2 requirements through filing an exhibit. Filed herewith. |
(2) A separate certification for each principal executive officer and principal financial officer pursuant to Section 302 of the Sarbanes-Oxley Act of 2002. Filed herewith.
(3) Any written solicitation to purchase securities under Rule 23c-1 under the Act sent or given during the period covered by the report by or on behalf of the registrant to 10 or more persons. Not applicable to open-end investment companies.
(4) Change in the registrant’s independent public accountant. There was no change in the registrant’s independent public accountant for the period covered by this report.
| (b) | Certifications pursuant to Section 906 of the Sarbanes-Oxley Act of 2002. Furnished herewith. |
SIGNATURES
Pursuant to the requirements of the Securities Exchange Act of 1934 and the Investment Company Act of 1940, the registrant has duly caused this report to be signed on its behalf by the undersigned, thereunto duly authorized.
| (Registrant) | Tidal ETF Trust | |
| By (Signature and Title) | /s/ Eric W. Falkeis | |
| Eric W. Falkeis, President/Principal Executive Officer | ||
| Date | 12/7/2021 |
Pursuant to the requirements of the Securities Exchange Act of 1934 and the Investment Company Act of 1940, this report has been signed below by the following persons on behalf of the registrant and in the capacities and on the dates indicated.
| By (Signature and Title)* | /s/ Eric W. Falkeis | |
| Eric W. Falkeis, President/Principal Executive Officer | ||
| Date | 12/7/2021 | |
| By (Signature and Title)* | /s/ Daniel Carlson | |
| Daniel Carlson, Treasurer/Principal Financial Officer | ||
| Date | 12/8/2021 |
* Print the name and title of each signing officer under his or her signature.