UNITED STATES
SECURITIES AND EXCHANGE COMMISSION
Washington, D.C. 20549
FORM N-CSR
CERTIFIED SHAREHOLDER REPORT OF REGISTERED MANAGEMENT INVESTMENT COMPANIES
Investment Company Act file number (811-23377)
Tidal ETF Trust
(Exact name of registrant as specified in charter)
234 West Florida Street, Suite 203
Milwaukee, Wisconsin 53204
(Address of principal executive offices) (Zip code)
Eric W. Falkeis
Tidal ETF Trust
234 West Florida Street, Suite 203
Milwaukee, Wisconsin 53204
(Name and address of agent for service)
(844) 986-7700
Registrant’s telephone number, including area code
Date of fiscal year end: September 30
Date of reporting period: September 30, 2023
Item 1. Reports to Stockholders.
Gotham Enhanced 500 ETF (GSPY)
Gotham 1000 Value ETF (GVLU)
Annual Report
September 30, 2023
This report is not authorized for distribution to prospective investors in the Funds unless preceded or accompanied by an effective prospectus.
Gotham Enhanced 500 ETF (“GSPY”)
•GSPY is an actively managed ETF that buys all 500 stocks in the S&P 500® Index but reweights them, buying more of the ones we think are cheaper and less of the ones we believe are more expensive. Gotham’s investment process puts an emphasis on companies with strong cash flow generation and operating fundamentals.
•GSPY currently1 trades at 19x Gotham’s proprietary free cash flow metric (vs. 23x for the S&P 500® Index) and earns higher returns on tangible capital than the benchmark.
•As of 9/30/23, the five largest positions in the strategy were MSFT, AAPL, GOOGL, AMZN and META. The strategy was overweight Communication Services, Energy, Information Technology, Industrials, and Health Care, and underweight the rest of the sectors.
•Over the trailing 12 months ending 9/30/23, GSPY returned 22.01% (NAV), whereas the S&P 500® Index returned 21.62% over the same time period.
•GSPY has over $345mm2 in assets and we are excited about the opportunity set for our first ETF.
•Top contributors and detractors (where applicable) by sector and stock positions are below:
Sector Contributors/Detractors
| | |
| Average Contribution | Average Exposure |
Largest Contributors | | |
Information Technology | 10.10% | 27.22% |
Communication Services | 4.22% | 11.16% |
Largest Detractors | |
Utilities | -0.08% | 1.11% |
Real Estate | -0.04% | 2.25% |
Stock Contributors/Detractors
| | |
| Average Contribution | Average Exposure |
Largest Contributors | | |
Microsoft Corp | 2.43% | 6.83% |
Alphabet Inc | 1.71% | 4.25% |
Largest Detractors | |
CVS Health Corp | -0.23% | 0.76% |
Pfizer Inc | -0.19% | 1.11% |
Past performance does not guarantee future results.
Must be preceded or accompanied by a prospectus.
The risks of investing in GSPY and GVLU are described in their prospectus.
1As of 11/15/2023. Companies for which there is not applicable data to calculate Gotham’s proprietary free cash flow yield, primarily financial companies, have been excluded.
2$345.4mm as of 11/15/2023
Gotham 1000 Value ETF (“GVLU”)
•GVLU is an actively managed ETF consisting of 400-600 securities selected from a universe of the largest 1,400 U.S. securities, weighted towards those stocks priced at the largest discount to Gotham’s assessment of value. Gotham’s investment process puts an emphasis on companies with strong cash flow generation and operating fundamentals.
•GVLU has a position weighted Gotham proprietary free cash flow yield of 10.7% that is more than double the Russell 1000 Index with incrementally better operating fundamentals.
•Over the trailing 12 months ending 9/30/23, GVLU returned 21.37% (NAV), whereas the Russell 1000 Value Index returned 14.44% over the same time period.
•GVLU has over $135mm3 in assets and we are excited about the opportunity set for this “deep” value-oriented ETF.
•Top contributors and detractors (where applicable) by sector and stock positions are below:
Sector Contributors/Detractors
| | |
| Average Contribution | Average Exposure |
Largest Contributors | | |
Industrials | 4.50% | 16.22% |
Energy | 3.74% | 14.73% |
Largest Detractors | |
Communication Services | -0.56% | 4.91% |
Stock Contributors/Detractors
| | |
| Average Contribution | Average Exposure |
Largest Contributors | | |
Builders FirstSource Inc | 0.42% | 0.44% |
Super Micro Computer Inc | 0.34% | 0.15% |
Largest Detractors | |
Lumen Technologies | -0.65% | 0.36% |
Vermilion Energy Inc | -0.24% | 0.27% |
Past performance does not guarantee future results.
Must be preceded or accompanied by a prospectus.
The risks of investing in GSPY and GVLU are described in their prospectus.
3 $135.9mm as of 11/15/2023
|
SHAREHOLDER LETTER (Continued) |
|
SHAREHOLDER LETTER (Continued) |
Important Information
The Gotham Enhanced 500 ETF (GSPY) compares its performance to the S&P 500® Index. The Gotham 1000 Value ETF (GVLU) compares its performance to the Russell 1000 Value Index. Returns for both indexes include the reinvestment of income. An index does not reflect operational and transactional costs which apply to an ETF. It is not possible to invest directly in an index.
The S&P 500® Index is a commonly followed equity index and is generally considered a barometer of the U.S. equity market. The Russell 1000 Index tracks the performance of the largest 1,000 US public companies. The Russell 1000 Value Index measures the performance of those Russell 1000 companies with lower price/book ratios and lower predicted and historical growth rates.
There is no guarantee that the either fund’s investment strategy will be successful. Shares may trade at a premium or discount to their NAV in the secondary market. These variations may be greater when markets are volatile or subject to unusual conditions. A high portfolio turnover rate increases transaction costs, which may increase a fund’s expenses. The funds are newer and have a limited operating history. You can lose money on your investment in the fund(s). Diversification does not ensure profit or protect against loss in declining markets. Fund holdings and sector allocations are subject to change and should not be considered a recommendation to buy or sell any security. For a complete list of portfolio holdings, please refer to the Schedule of Investments provided in this report.
“Gotham free cash flow yield” and “Gotham return on tangible capital estimates” are based on Gotham’s proprietary methodology. Gotham’s proprietary free cash flow yield and proprietary return on tangible capital metrics are used to compare companies in a consistently meaningful way. Gotham’s analyst team uses some discretion in calculating a company’s pre-tax cash flow, return on capital as well as enterprise value. This information is updated throughout the year to account for company performance. The metrics for any one company or portfolio can change daily to reflect either new information and/or changing stock price. The aggregate cash flow and return on capital metrics combine the metrics for the individual companies held by the fund or index. Gotham free cash flow yield and Gotham return on tangible capital are position-weighted averages that take each company’s Gotham free cash flow yield or Gotham return on tangible capital divided by its adjusted enterprise value. Gotham free cash flow yield and Gotham return on tangible capital do not represent income received by the fund, nor income received by shareholders in the fund.
Fund holdings and sector allocations are subject to change and are not a recommendation to buy or sell any security. Please see the Schedule of Investments for a complete list of fund holdings.
|
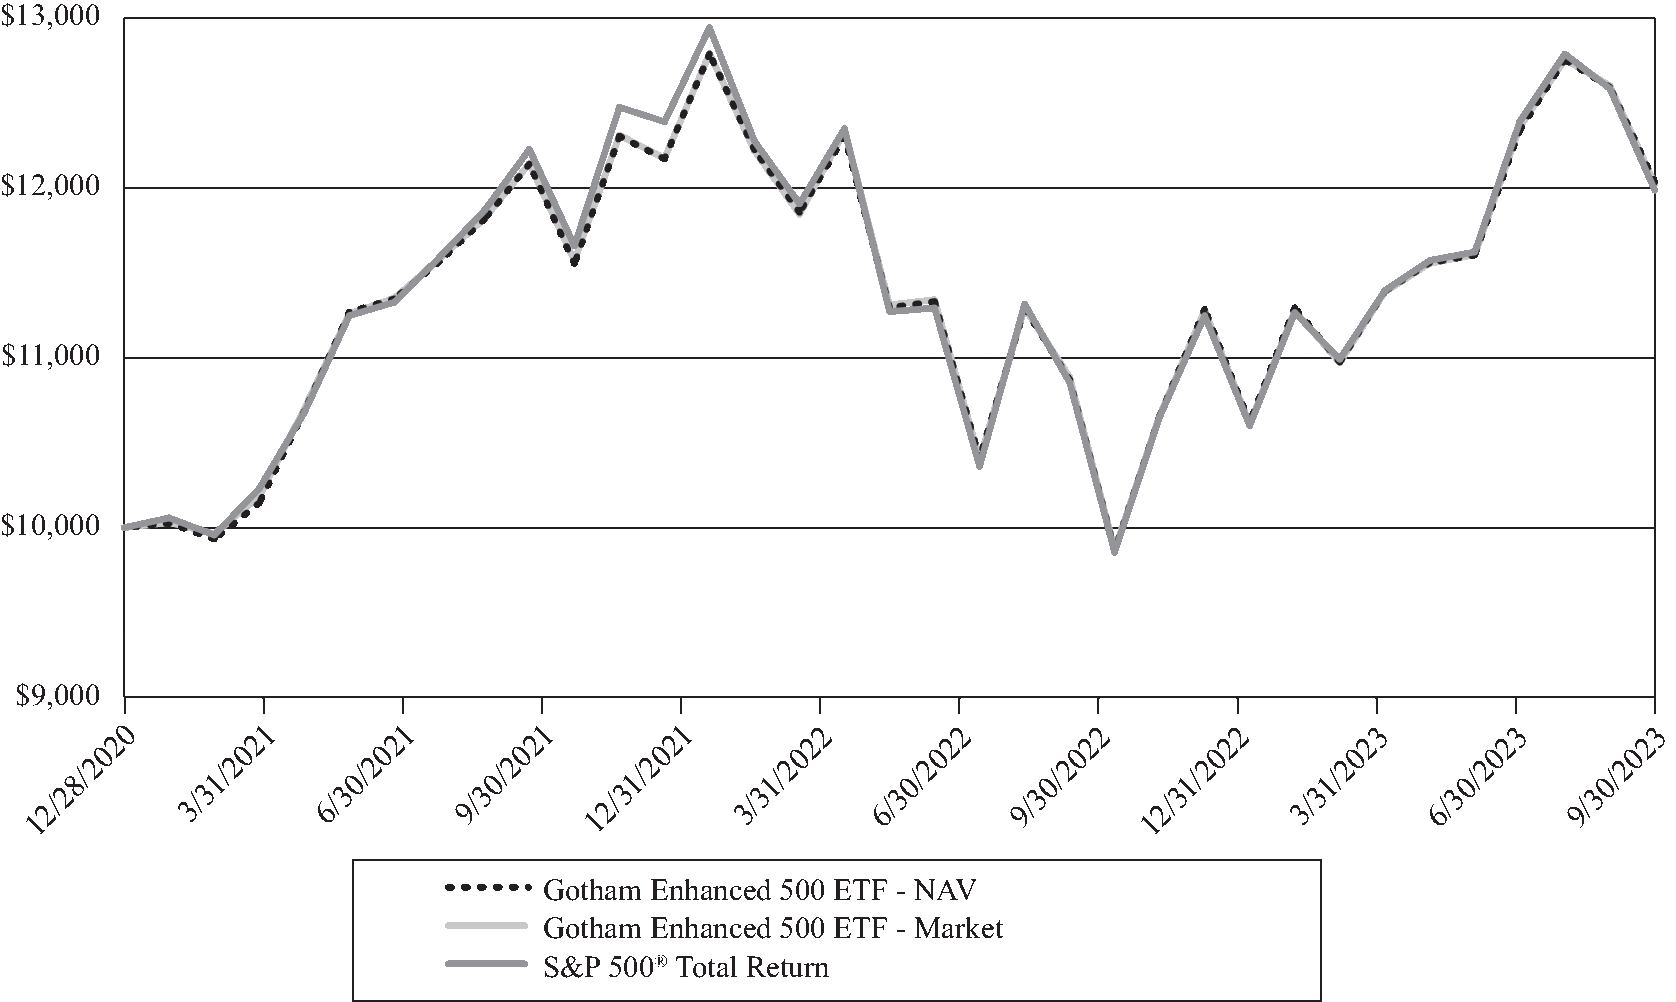
PERFORMANCE DATA at September 30, 2023 (Unaudited) |
| | | | | | |
Average Total Returns for the Periods Ended September 30, 2023 | | 1 Year | | Since Inception
(12/28/20)
(Annualized) | | Ending Value
(9/30/2023) |
Gotham Enhanced 500 ETF - NAV | | 22.01% | | 6.95% | | $12,035 |
Gotham Enhanced 500 ETF - Market | | 21.82% | | 6.92% | | 12,024 |
S&P 500® Total Return Index | | 21.62% | | 6.79% | | 11,985 |
This chart illustrates the performance of a hypothetical $10,000 investment made on December 28, 2020 (commencement of operations) and is not intended to imply any future performance. The returns shown do not reflect the deduction of taxes that a shareholder would pay on fund distributions or the redemption of fund shares. The returns reflect fee waivers in effect for the NAV return. In the absence of such waivers, total return would be reduced. The chart assumes reinvestment of capital gains, dividends, and return of capital, if applicable, for a fund and dividends for an index.
Performance data quoted represents past performance and does not guarantee future results. The investment return and principal value of an investment will fluctuate so that an investor’s shares, when redeemed, may be worth more or less than their original cost. Current performance of the Gotham Enhanced 500 ETF (the “Fund”) may be lower or higher than the performance quoted. Performance data current to the most recent month end may be obtained by calling (855) 998-4779. The Fund’s gross expense ratio is 0.65% and net expense ratio is 0.50% as of the Fund’s prospectus dated January 28, 2023. The Fund’s investment adviser has agreed to waive a portion of its management fees for the Fund to limit the Fund’s Total Annual Fund Operating Expenses After Fee Waiver to 0.50% until at least January 31, 2025.
Shares are bought and sold at market price, not net asset value (NAV), and are not individually redeemable from the fund. NAV represents the value of each share’s portion of the Fund’s underlying assets and cash at the end of the trading day. Market price returns reflect the midpoint of the bid/ask spread as of the close of trading on the exchange where Fund shares are listed.
|
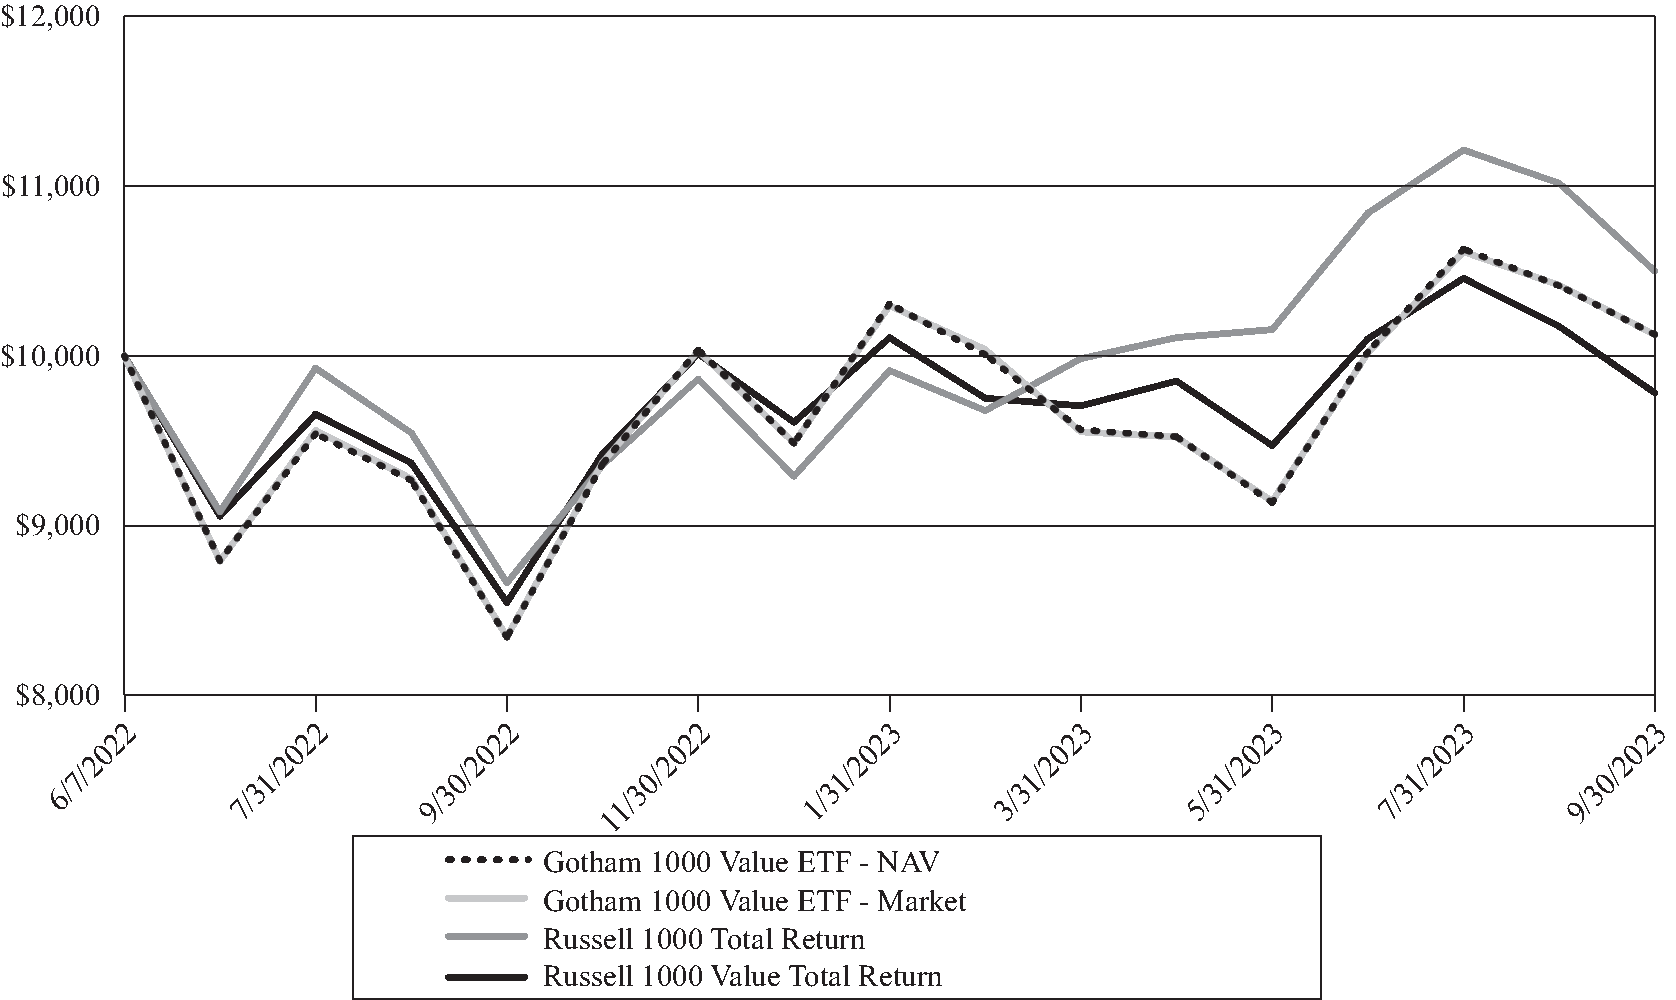
PERFORMANCE DATA at September 30, 2023 (Unaudited) |
| | | | | | |
Average Total Returns for the Periods Ended September 30, 2023 | | 1 Year | | Since Inception
(6/7/22) | | Ending Value
(9/30/2023) |
Gotham 1000 Value ETF - NAV | | 21.37% | | 0.95% | | $10,125 |
Gotham 1000 Value ETF - Market | | 21.33% | | 0.94% | | 10,124 |
Russell 1000 Total Return Index | | 21.19% | | 3.77% | | 10,498 |
Russell 1000 Value Total Return Index | | 14.44% | | -1.67% | | 9,781 |
This chart illustrates the performance of a hypothetical $10,000 investment made on June 7, 2022 (commencement of operations) and is not intended to imply any future performance. The returns shown do not reflect the deduction of taxes that a shareholder would pay on fund distributions or the redemption of fund shares. The returns reflect fee waivers in effect for the NAV return. In the absence of such waivers, total return would be reduced. The chart assumes reinvestment of capital gains, dividends, and return of capital, if applicable, for a fund and dividends for an index.
Performance data quoted represents past performance and does not guarantee future results. The investment return and principal value of an investment will fluctuate so that an investor’s shares, when redeemed, may be worth more or less than their original cost. Current performance of the Gotham 1000 Value ETF (the “Fund”) may be lower or higher than the performance quoted. Performance data current to the most recent month end may be obtained by calling (855) 998-4779. The Fund’s gross expense ratio is 0.65% and net expense ratio is 0.50% as of the Fund’s prospectus dated January 28, 2023. The Fund’s investment adviser has agreed to waive a portion of its management fees for the Fund to limit the Fund’s Total Annual Fund Operating Expenses After Fee Waiver to 0.50% until at least January 31, 2025.
Shares are bought and sold at market price, not net asset value (NAV), and are not individually redeemable from the fund. NAV represents the value of each share’s portion of the Fund’s underlying assets and cash at the end of the trading day. Market price returns reflect the midpoint of the bid/ask spread as of the close of trading on the exchange where Fund shares are listed.
The accompanying notes are an integral part of these financial statements.
| | | | | |
Sector: | % of Net Assets |
Technology | | | 25.8 | % | |
Consumer, Non-cyclical | | | 20.7 | | |
Communications | | | 18.6 | | |
Financial | | | 11.1 | | |
Consumer, Cyclical | | | 9.3 | | |
Industrial | | | 8.2 | | |
Energy | | | 4.2 | | |
Basic Materials | | | 1.1 | | |
Utilities | | | 0.8 | | |
Cash & Cash Equivalents(1) | | | 0.2 | | |
Total | | | 100.0 | % | |
(1)Represents cash, short-term investments, investments purchased with collateral from securities lending, and liabilities in excess of other assets.
|
PORTFOLIO ALLOCATIONS at September 30, 2023 (Unaudited) |
The accompanying notes are an integral part of these financial statements.
| | | | | |
Sector: | | % of Net Assets |
Consumer, Non-cyclical | | | 20.6 | % | |
Industrial | | | 19.3 | | |
Consumer, Cyclical | | | 18.9 | | |
Energy | | | 13.5 | | |
Financial | | | 9.1 | | |
Communications | | | 6.0 | | |
Technology | | | 5.7 | | |
Basic Materials | | | 5.6 | | |
Utilities | | | 1.1 | | |
Cash & Cash Equivalents(1) | | | 0.2 | | |
Total | | | 100.0 | % | |
(1)Represents cash, short-term investments, investments purchased with collateral from securities lending, and liabilities in excess of other assets.
|
PORTFOLIO ALLOCATIONS at September 30, 2023 (Unaudited) |
The accompanying notes are an integral part of these financial statements.
| | | | | | | |
| | Shares | | Value | |
Common Stocks — 99.8% | | | | | |
Advertising — 0.2% | | | | | |
Omnicom Group, Inc. | | 3,758 | | $279,896
| |
The Interpublic Group of Company, Inc. (1) | | 7,280 | | 208,645 | |
| | | | | | 488,541 | |
Aerospace & Defense — 1.7% | | | | | |
General Dynamics Corp. | | 5,227 | | 1,155,010 | |
Howmet Aerospace, Inc. | | 1,098 | | 50,782 | |
L3Harris Technologies, Inc. | | 521 | | 90,717 | |
Lockheed Martin Corp. | | 4,805 | | 1,965,053 | |
Northrop Grumman Corp. | | 1,160 | | 510,620 | |
RTX Corp. | | 3,847 | | 276,869 | |
The Boeing Co. (2) | | 1,529 | | 293,079 | |
TransDigm Group, Inc. (1)(2) | | 741 | | 624,759 | |
| | | | | | 4,966,889 | |
Agriculture — 1.9% | | | | | |
Altria Group, Inc. | | 40,700 | | 1,711,435 | |
Archer-Daniels-Midland Co. | | 11,049 | | 833,315 | |
Bunge Ltd. | | 2,559 | | 277,012 | |
Philip Morris International, Inc. | | 29,798 | | 2,758,699 | |
| | | | | | 5,580,461 | |
Airlines — 0.2% | | | | | |
Alaska Air Group, Inc. (2) | | 311 | | 11,532 | |
American Airlines Group, Inc. (2) | | 13,535 | | 173,383 | |
Delta Air Lines, Inc. | | 12,255 | | 453,435 | |
Southwest Airlines Co. | | 1,588 | | 42,987 | |
United Airlines Holdings, Inc. (2) | | 768 | | 32,487 | |
| | | | | | 713,824 | |
Apparel — 0.3% | | | | | |
Nike, Inc. - Class A | | 4,070 | | 389,173 | |
Ralph Lauren Corp. - Class A | | 1,261 | | 146,390 | |
Tapestry, Inc. (1)(2) | | 4,605 | | 132,394 | |
VF Corp. | | 8,064 | | 142,491 | |
| | | | | | 810,448 | |
Auto Manufacturers — 2.1% | | | | | |
Cummins, Inc. | | 350 | | 79,961 | |
Ford Motor Co. | | 76,575 | | 951,061 | |
General Motors Co. | | 31,511 | | 1,038,918 | |
PACCAR, Inc. | | 10,306 | | 876,216 | |
Tesla, Inc. (2) | | 13,271 | | 3,320,670 | |
| | | | | | 6,266,826 | |
Auto Parts & Equipment — 0.1% | | | |
Aptiv PLC (2) | | 713 | | 70,295 | |
BorgWarner, Inc. | | 4,469 | | 180,413 | |
| | | | | | 250,708 | |
| | | | | | | |
| | Shares | | Value | |
Common Stocks — 99.8% (Continued) | | | |
Banks — 2.9% | | | | | |
Bank of America Corp. | | 60,519 | | $1,657,010
| |
Citigroup, Inc. | | 6,060 | | 249,248 | |
Citizens Financial Group, Inc. | | 3,660 | | 98,088 | |
Comerica, Inc. | | 999 | | 41,509 | |
Fifth Third Bancorp | | 5,152 | | 130,500 | |
Huntington Bancshares, Inc. | | 3,883 | | 40,383 | |
JPMorgan Chase & Co. | | 22,300 | | 3,233,946 | |
KeyCorp | | 7,088 | | 76,267 | |
M&T Bank Corp. | | 1,241 | | 156,925 | |
Morgan Stanley | | 5,271 | | 430,483 | |
Northern Trust Corp. | | 1,575 | | 109,431 | |
Regions Financial Corp. | | 2,694 | | 46,337 | |
State Street Corp. | | 1,089 | | 72,919 | |
The Bank of New York Mellon Corp. | | 3,554 | | 151,578 | |
The Goldman Sachs Group, Inc. | | 1,093 | | 353,662 | |
The PNC Financial Services Group, Inc. | | 3,026 | | 371,502 | |
Truist Financial Corp. | | 10,081 | | 288,417 | |
U.S. Bancorp | | 11,620 | | 384,157 | |
Wells Fargo & Co. | | 11,767 | | 480,800 | |
Zions Bancorp N.A. (1) | | 1,207 | | 42,112 | |
| | | | | | 8,415,274 | |
Beverages — 2.3% | | | | | |
Brown-Forman Corp. - Class A | | 1,272 | | 73,382 | |
Constellation Brands, Inc. - Class 1 | | 452 | | 113,601 | |
Keurig Dr Pepper, Inc. | | 26,748 | | 844,434 | |
Molson Coors Brewing Co. - Class B (1) | | 4,123 | | 262,182 | |
Monster Beverage Corp. (2) | | 2,755 | | 145,877 | |
PepsiCo, Inc. | | 10,134 | | 1,717,105 | |
The Coca-Cola Co. | | 62,256 | | 3,485,091 | |
| | | | | | 6,641,672 | |
Biotechnology — 1.3% | | | | | |
Amgen, Inc. | | 2,716 | | 729,952 | |
Biogen, Inc. (2) | | 388 | | 99,720 | |
Bio-Rad Laboratories, Inc. - Class A (2) | | 73 | | 26,167 | |
Corteva, Inc. | | 1,752 | | 89,632 | |
Gilead Sciences, Inc. | | 26,244 | | 1,966,726 | |
Illumina, Inc. (2) | | 1,187 | | 162,951 | |
Incyte Corp. (2) | | 1,679 | | 96,996 | |
|
SCHEDULE OF INVESTMENTS at September 30, 2023 |
The accompanying notes are an integral part of these financial statements.
|
SCHEDULE OF INVESTMENTS at September 30, 2023 (Continued) |
| | | | | | | |
| | Shares | | Value | |
Common Stocks — 99.8% (Continued) | | | |
Biotechnology — 1.3% (Continued) | | | |
Moderna, Inc. (2) | | 1,025 | | $105,872
| |
Regeneron Pharmaceuticals, Inc. (2) | 316 | | 260,055 | |
Vertex Pharmaceuticals, Inc. (2) | | 670 | | 232,986 | |
| | | | | | 3,771,057 | |
Building Materials — 0.6% | | | | | |
Carrier Global Corp. (1) | | 11,809 | | 651,857 | |
Johnson Controls International PLC | | 13,026 | | 693,113 | |
Martin Marietta Materials, Inc. | | 139 | | 57,057 | |
Masco Corp. | | 4,308 | | 230,263 | |
Mohawk Industries, Inc. (2) | | 178 | | 15,274 | |
Trane Technologies PLC | | 596 | | 120,934 | |
Vulcan Materials Co. | | 284 | | 57,374 | |
| | | | | | 1,825,872 | |
Chemicals — 0.6% | | | | | |
Air Products and Chemicals, Inc. | 592 | | 167,773 | |
Albemarle Corp. | | 294 | | 49,992 | |
Celanese Corp. | | 268 | | 33,639 | |
CF Industries Holdings, Inc. | | 3,783 | | 324,354 | |
Dow, Inc. | | 1,882 | | 97,036 | |
DuPont de Nemours, Inc. | | 1,242 | | 92,641 | |
Eastman Chemical Co. | | 317 | | 24,320 | |
Ecolab, Inc. | | 747 | | 126,542 | |
FMC Corp. | | 326 | | 21,832 | |
International Flavors & Fragrances, Inc. | | 681 | | 46,424 | |
Linde PLC | | 1,288 | | 479,587 | |
LyondellBasell Industries NV | | 868 | | 82,200 | |
PPG Industries, Inc. | | 626 | | 81,255 | |
The Mosaic Co. | | 962 | | 34,247 | |
The Sherwin-Williams Co. | | 671 | | 171,138 | |
| | | | | | 1,832,980 | |
Commercial Services — 0.8% | | | | | |
Automatic Data Processing, Inc. | | 1,728 | | 415,722 | |
Cintas Corp. | | 230 | | 110,632 | |
CoStar Group, Inc. (2) | | 1,055 | | 81,119 | |
Equifax, Inc. | | 302 | | 55,320 | |
FleetCor Technologies, Inc. (2) | | 555 | | 141,714 | |
Gartner, Inc. (2) | | 211 | | 72,502 | |
Global Payments, Inc. | | 748 | | 86,312 | |
MarketAxess Holdings, Inc. | | 93 | | 19,868 | |
Moody’s Corp. | | 572 | | 180,849 | |
PayPal Holdings, Inc. (2) | | 9,396 | | 549,290 | |
Quanta Services, Inc. | | 325 | | 60,798 | |
Robert Half, Inc. | | 311 | | 22,790 | |
| | | | | | | |
| | Shares | | Value | |
Common Stocks — 99.8% (Continued) | | | |
Commercial Services — 0.8% (Continued) | | | |
Rollins, Inc. | | 1,304 | | $48,678
| |
S&P Global, Inc. | | 909 | | 332,158 | |
United Rentals, Inc. | | 154 | | 68,464 | |
Verisk Analytics, Inc. | | 337 | | 79,613 | |
| | | | | | 2,325,829 | |
Computers — 8.3% | | | | | |
Accenture PLC - Class A | | 4,795 | | 1,472,593 | |
Apple, Inc. | | 119,873 | | 20,523,456 | |
Cognizant Technology Solutions Corp. | | 3,822 | | 258,902 | |
DXC Technology Co. (1)(2) | | 564 | | 11,748 | |
EPAM Systems, Inc. (2) | | 437 | | 111,737 | |
Fortinet, Inc. (2) | | 1,841 | | 108,030 | |
Hewlett Packard Enterprise Co. | | 28,796 | | 500,187 | |
HP, Inc. | | 22,456 | | 577,119 | |
International Business
Machines Corp. | | 2,441 | | 342,472 | |
Leidos Holdings, Inc. | | 356 | | 32,809 | |
NetApp, Inc. | | 4,030 | | 305,796 | |
Seagate Technology
Holdings PLC (1) | | 555 | | 36,602 | |
Western Digital Corp. (2) | | 824 | | 37,599 | |
| | | | | | 24,319,050 | |
Cosmetics & Personal Care — 1.5% | | | |
Colgate-Palmolive Co. | | 15,798 | | 1,123,396 | |
Kenvue, Inc. | | 36,671 | | 736,354 | |
The Estee Lauder Companies, Inc. | 925 | | 133,709 | |
The Procter & Gamble Co. | | 16,704 | | 2,436,445 | |
| | | | | | 4,429,904 | |
Distribution & Wholesale — 0.4% | | | |
Copart, Inc. (1)(2) | | 2,156 | | 92,902 | |
Fastenal Co. | | 1,523 | | 83,217 | |
LKQ Corp. | | 5,099 | | 252,451 | |
Pool Corp. | | 105 | | 37,391 | |
W.W. Grainger, Inc. | | 993 | | 686,997 | |
| | | | | | 1,152,958 | |
Diversified Financial Services — 3.7% | | | |
American Express Co. | | 2,018 | | 301,065 | |
Ameriprise Financial, Inc. | | 772 | | 254,513 | |
BlackRock, Inc. | | 1,317 | | 851,427 | |
Capital One Financial Corp. (1) | | 1,212 | | 117,625 | |
Cboe Global Markets, Inc. | | 779 | | 121,688 | |
CME Group, Inc. - Class A | | 2,707 | | 541,995 | |
Discover Financial Services | | 732 | | 63,413 | |
Franklin Resources, Inc. | | 11,213 | | 275,615 | |
The accompanying notes are an integral part of these financial statements.
|
SCHEDULE OF INVESTMENTS at September 30, 2023 (Continued) |
| | | | | | | |
| | Shares | | Value | |
Common Stocks — 99.8% (Continued) | | | |
Diversified Financial Services — 3.7% (Continued) | |
Intercontinental Exchange, Inc. | | 4,291 | | $472,096
| |
Invesco Ltd. | | 3,477 | | 50,486 | |
Mastercard, Inc. - Class A | | 7,216 | | 2,856,887 | |
Nasdaq, Inc. | | 11,123 | | 540,467 | |
Raymond James Financial, Inc. | | 613 | | 61,564 | |
Synchrony Financial (1) | | 1,318 | | 40,291 | |
T. Rowe Price Group, Inc. | | 1,829 | | 191,807 | |
The Charles Schwab Corp. | | 9,833 | | 539,832 | |
Visa, Inc. - Class A (1) | | 15,715 | | 3,614,607 | |
| | | | | | 10,895,378 | |
Electric — 0.8% | | | | | |
Alliant Energy Corp. | | 664 | | 32,171 | |
Ameren Corp. | | 716 | | 53,578 | |
American Electric Power Co., Inc. | 1,357 | | 102,074 | |
CenterPoint Energy, Inc. | | 1,701 | | 45,672 | |
CMS Energy Corp. | | 761 | | 40,417 | |
Consolidated Edison, Inc. | | 891 | | 76,207 | |
Constellation Energy Corp. | | 841 | | 91,736 | |
Dominion Energy, Inc. | | 2,201 | | 98,319 | |
DTE Energy Co. | | 544 | | 54,008 | |
Duke Energy Corp. | | 2,069 | | 182,610 | |
Edison International | | 1,027 | | 64,999 | |
Entergy Corp. | | 554 | | 51,245 | |
Evergy, Inc. | | 611 | | 30,978 | |
Eversource Energy | | 898 | | 52,219 | |
Exelon Corp. | | 2,627 | | 99,274 | |
FirstEnergy Corp. | | 1,534 | | 52,432 | |
NextEra Energy, Inc. | | 5,289 | | 303,007 | |
NRG Energy, Inc. | | 699 | | 26,925 | |
PG&E Corp. (2) | | 15,745 | | 253,967 | |
Pinnacle West Capital Corp. | | 278 | | 20,483 | |
PPL Corp. | | 1,922 | | 45,282 | |
Public Service Enterprise
Group, Inc. | | 1,295 | | 73,698 | |
Sempra Energy | | 1,669 | | 113,542 | |
The AES Corp. | | 1,778 | | 27,026 | |
The Southern Co. | | 2,856 | | 184,840 | |
WEC Energy Group, Inc. | | 823 | | 66,293 | |
Xcel Energy, Inc. | | 1,438 | | 82,282 | |
| | | | | | 2,325,284 | |
Electrical Components & Equipment — 0.5% | | | |
AMETEK, Inc. | | 2,522 | | 372,651 | |
Emerson Electric Co. | | 10,997 | | 1,061,980 | |
Generac Holdings, Inc. (1)(2) | | 156 | | 16,998 | |
| | | | | | 1,451,629 | |
| | | | | | | |
| | Shares | | Value | |
Common Stocks — 99.8% (Continued) | | | |
Electronics — 0.8% | | | | | |
Agilent Technologies, Inc. | | 782 | | $87,443
| |
Allegion plc | | 1,681 | | 175,160 | |
Amphenol Corp. | | 1,715 | | 144,043 | |
Fortive Corp. | | 2,670 | | 198,007 | |
Garmin Ltd. | | 3,650 | | 383,980 | |
Honeywell International, Inc. | | 1,770 | | 326,990 | |
Keysight Technologies, Inc. (2) | | 694 | | 91,823 | |
Mettler-Toledo International, Inc. (2) | 55 | | 60,944 | |
TE Connectivity Ltd. | | 6,022 | | 743,898 | |
Trimble, Inc. (2) | | 674 | | 36,302 | |
| | | | | | 2,248,590 | |
Energy — Alternate Sources — 0.1% | | | |
Enphase Energy, Inc. (2) | | 290 | | 34,843 | |
First Solar, Inc. (2) | | 262 | | 42,337 | |
SolarEdge Technologies, Inc. (1)(2) | 426 | | 55,171 | |
| | | | | | 132,351 | |
Engineering & Construction — 0.0% (4) | | | |
Jacobs Solutions, Inc. | | 313 | | 42,725 | |
| | | | | | | |
Entertainment — 0.1% | | | | | |
Caesars Entertainment, Inc. (2) | | 4,778 | | 221,460 | |
Live Nation Entertainment, Inc. (1)(2) | 614 | | 50,987 | |
| | | | | | 272,447 | |
Environmental Control — 0.4% | | | | | |
Pentair PLC | | 3,143 | | 203,509 | |
Republic Services, Inc. | | 6,059 | | 863,468 | |
Waste Management, Inc. | | 1,073 | | 163,568 | |
| | | | | | 1,230,545 | |
Food — 2.0% | | | | | |
Campbell Soup Co. | | 6,756 | | 277,537 | |
Conagra Brands, Inc. | | 9,133 | | 250,427 | |
General Mills, Inc. | | 11,095 | | 709,969 | |
Hormel Foods Corp. (1) | | 1,437 | | 54,649 | |
Kellogg Co. | | 7,714 | | 459,060 | |
Lamb Weston Holdings, Inc. | | 322 | | 29,772 | |
McCormick & Co., Inc. (1) | | 716 | | 54,158 | |
Mondelez International, Inc. | | 26,046 | | 1,807,592 | |
Sysco Corp. | | 9,645 | | 637,052 | |
The Hershey Co. | | 545 | | 109,044 | |
The J.M. Smucker Co. | | 2,363 | | 290,436 | |
The Kraft Heinz Co. | | 27,528 | | 926,042 | |
The Kroger Co. | | 3,066 | | 137,204 | |
Tyson Foods, Inc. - Class A | | 1,011 | | 51,045 | |
| | | | | | 5,793,987 | |
The accompanying notes are an integral part of these financial statements.
|
SCHEDULE OF INVESTMENTS at September 30, 2023 (Continued) |
| | | | | | | |
| | Shares | | Value | |
Common Stocks — 99.8% (Continued) | | | |
Forest Products & Paper — 0.0% (4) | | | |
International Paper Co. | | 927 | | $32,881
| |
| | | | | | | |
Gas — 0.0% (4) | | | | | |
Atmos Energy Corp. (1) | | 345 | | 36,546 | |
NiSource, Inc. | | 1,104 | | 27,247 | |
| | | | | | 63,793 | |
Hand & Machine Tools — 0.1% | | | | | |
Snap-on, Inc. | | 1,050 | | 267,813 | |
Stanley Black & Decker, Inc. | | 378 | | 31,593 | |
| | | | | | 299,406 | |
Healthcare — Products — 2.1% | | | | | |
Abbott Laboratories | | 13,311 | | 1,289,170 | |
Align Technology, Inc. (2) | | 191 | | 58,316 | |
Baxter International, Inc. (1) | | 1,314 | | 49,590 | |
Bio-Techne Corp. | | 384 | | 26,139 | |
Boston Scientific Corp. (2) | | 3,466 | | 183,005 | |
Danaher Corp. | | 5,670 | | 1,406,727 | |
DENTSPLY SIRONA, Inc. | | 657 | | 22,443 | |
Edwards Lifesciences Corp. (2) | | 1,599 | | 110,779 | |
GE HealthCare Technologies, Inc. | 9,424 | | 641,209 | |
Hologic, Inc. (2) | | 4,689 | | 325,417 | |
IDEXX Laboratories, Inc. (1)(2) | | 186 | | 81,332 | |
Insulet Corp. (2) | | 167 | | 26,635 | |
Intuitive Surgical, Inc. (2) | | 791 | | 231,201 | |
Medtronic PLC | | 3,525 | | 276,219 | |
ResMed, Inc. | | 2,299 | | 339,953 | |
Revvity, Inc. | | 310 | | 34,317 | |
STERIS PLC | | 246 | | 53,977 | |
Stryker Corp. | | 854 | | 233,373 | |
Teleflex, Inc. | | 116 | | 22,784 | |
The Cooper Companies, Inc. | | 109 | | 34,663 | |
Thermo Fisher Scientific, Inc. | | 1,021 | | 516,800 | |
Waters Corp. (2) | | 149 | | 40,857 | |
West Pharmaceutical Services, Inc. | 182 | | 68,288 | |
Zimmer Biomet Holdings, Inc. | | 556 | | 62,394 | |
| | | | | | 6,135,588 | |
Healthcare — Services — 2.2% | | | | | |
Catalent, Inc. (2) | | 440 | | 20,033 | |
Centene Corp. (2) | | 12,329 | | 849,221 | |
Charles River Laboratories International, Inc. (2) | | 125 | | 24,497 | |
DaVita, Inc. (2) | | 1,747 | | 165,144 | |
Elevance Health, Inc. | | 1,387 | | 603,928 | |
HCA Healthcare, Inc. | | 5,223 | | 1,284,754 | |
| | | | | | | |
| | Shares | | Value | |
Common Stocks — 99.8% (Continued) | | | |
Healthcare — Services — 2.2% (Continued) | |
Humana, Inc. | | 853 | | $415,002
| |
IQVIA Holdings, Inc. (2) | | 495 | | 97,391 | |
Laboratory Corp of America Holdings | | 1,688 | | 339,372 | |
Molina Healthcare, Inc. (2) | | 1,277 | | 418,716 | |
Quest Diagnostics, Inc. | | 311 | | 37,898 | |
UnitedHealth Group, Inc. | | 3,799 | | 1,915,418 | |
Universal Health Services, Inc. - Class D | | 1,330 | | 167,221 | |
| | | | | | 6,338,595 | |
Home Builders — 0.3% | | | | | |
D.R. Horton, Inc. | | 2,854 | | 306,719 | |
Lennar Corp. - Class A (1) | | 2,181 | | 244,774 | |
NVR, Inc. (2) | | 8 | | 47,707 | |
PulteGroup, Inc. | | 4,343 | | 321,599 | |
| | | | | | 920,799 | |
Home Furnishings — 0.0% (4) | | | | | |
Whirlpool Corp. | | 152 | | 20,322 | |
| | | | | | | |
Household Products & Wares — 0.4% | | | |
Avery Dennison Corp. | | 200 | | 36,534 | |
Church & Dwight Co., Inc. | | 676 | | 61,942 | |
Kimberly-Clark Corp. | | 7,339 | | 886,918 | |
The Clorox Co. | | 2,371 | | 310,743 | |
| | | | | | 1,296,137 | |
Insurance — 3.3% | | | | | |
Aflac, Inc. | | 1,593 | | 122,263 | |
American International Group, Inc. | 1,899 | | 115,079 | |
Aon PLC | | 544 | | 176,376 | |
Arch Capital Group Ltd. (2) | | 8,258 | | 658,245 | |
Arthur J Gallagher & Co. | | 1,763 | | 401,841 | |
Assurant, Inc. | | 140 | | 20,101 | |
Berkshire Hathaway, Inc. -
Class A (2) | | 18,180 | | 6,368,454 | |
Brown & Brown, Inc. | | 5,840 | | 407,866 | |
Chubb Ltd. | | 1,090 | | 226,916 | |
Cincinnati Financial Corp. | | 408 | | 41,734 | |
Everest Group Ltd. | | 104 | | 38,654 | |
Globe Life, Inc. (1) | | 271 | | 29,466 | |
Loews Corp. | | 753 | | 47,672 | |
Marsh & McLennan
Companies, Inc. | | 1,290 | | 245,487 | |
MetLife, Inc. | | 2,025 | | 127,393 | |
Principal Financial Group, Inc. | | 661 | | 47,638 | |
Prudential Financial, Inc. | | 1,000 | | 94,890 | |
The accompanying notes are an integral part of these financial statements.
|
SCHEDULE OF INVESTMENTS at September 30, 2023 (Continued) |
| | | | | | | |
| | Shares | | Value | |
Common Stocks — 99.8% (Continued) | | | |
Insurance — 3.3% (Continued) | |
The Allstate Corp. | | 684 | | $76,204
| |
The Hartford Financial Services Group, Inc. | | 803 | | 56,941 | |
The Progressive Corp. | | 1,326 | | 184,712 | |
The Travelers Companies, Inc. | | 604 | | 98,639 | |
W.R. Berkley Corp. | | 682 | | 43,300 | |
Willis Towers Watson PLC | | 279 | | 58,300 | |
| | | | | | 9,688,171 | |
Internet — 12.9% | | | | | |
Airbnb, Inc. - Class A (2) | | 1,447 | | 198,543 | |
Alphabet, Inc. - Class A (2) | | 106,860 | | 13,983,700 | |
Amazon.com, Inc. (2) | | 94,308 | | 11,988,433 | |
Booking Holdings, Inc. (2) | | 691 | | 2,131,009 | |
CDW Corp. | | 361 | | 72,835 | |
eBay, Inc. | | 12,192 | | 537,545 | |
Etsy, Inc. (1)(2) | | 277 | | 17,889 | |
Expedia Group, Inc. - Class A (2) | | 388 | | 39,991 | |
F5, Inc. (2) | | 160 | | 25,782 | |
Gen Digital, Inc. | | 14,308 | | 252,965 | |
Match Group, Inc. (2) | | 743 | | 29,107 | |
Meta Platforms, Inc. - Class A (2) | | 23,655 | | 7,101,468 | |
Netflix, Inc. (2) | | 3,405 | | 1,285,728 | |
Palo Alto Networks, Inc. (2) | | 784 | | 183,801 | |
VeriSign, Inc. (2) | | 220 | | 44,557 | |
| | | | | | 37,893,353 | |
Iron & Steel — 0.4% | | | | | |
Nucor Corp. | | 5,124 | | 801,137 | |
Steel Dynamics, Inc. | | 3,849 | | 412,690 | |
| | | | | | 1,213,827 | |
Leisure Time — 0.0% (4) | | | | | |
Carnival Corp. (2) | | 2,705 | | 37,113 | |
Norwegian Cruise Line Holdings Ltd. (2) | | 1,094 | | 18,029 | |
Royal Caribbean Cruises Ltd. (2) | | 543 | | 50,032 | |
| | | | | | 105,174 | |
Lodging — 0.6% | | | | | |
Hilton Worldwide Holdings, Inc. | | 690 | | 103,624 | |
Las Vegas Sands Corp. | | 1,809 | | 82,925 | |
Marriott International, Inc. | | 5,841 | | 1,148,107 | |
MGM Resorts International | | 7,442 | | 273,568 | |
Wynn Resorts Ltd. | | 2,095 | | 193,599 | |
| | | | | | 1,801,823 | |
Machinery — Construction & Mining — 1.1% | |
Caterpillar, Inc. | | 11,696 | | 3,193,008 | |
| | | | | | | |
| | Shares | | Value | |
Common Stocks — 99.8% (Continued) | | | |
Machinery — Diversified — 0.4% | | | |
Deere & Co. | | 776 | | $292,847
| |
Dover Corp. | | 344 | | 47,991 | |
IDEX Corp. | | 187 | | 38,900 | |
Ingersoll Rand, Inc. | | 1,079 | | 68,754 | |
Nordson Corp. | | 146 | | 32,583 | |
Otis Worldwide Corp. | | 7,878 | | 632,682 | |
Rockwell Automation, Inc. | | 260 | | 74,326 | |
Westinghouse Air Brake Technologies Corp. | | 447 | | 47,503 | |
Xylem, Inc. | | 548 | | 49,884 | |
| | | | | | 1,285,470 | |
Media — 1.8% | | | | | |
Charter Communications, Inc. - Class A (1)(2) | | 1,151 | | 506,233 | |
Comcast Corp. - Class A | | 87,408 | | 3,875,671 | |
FactSet Research Systems, Inc. | | 93 | | 40,665 | |
Fox Corp. - Class B | | 10,760 | | 335,712 | |
News Corp. - Class A | | 1,775 | | 35,606 | |
The Walt Disney Co. (2) | | 4,768 | | 386,446 | |
ViacomCBS, Inc. - Class A (1) | | 1,707 | | 22,020 | |
Warner Bros Discovery, Inc. (1)(2) | | 18,482 | | 200,715 | |
| | | | | | 5,403,068 | |
Mining — 0.1% | | | | | |
Freeport-McMoRan, Inc. (1) | | 3,780 | | 140,956 | |
Newmont Corp. | | 2,098 | | 77,521 | |
| | | | | | 218,477 | |
Miscellaneous Manufacturers — 1.4% | | | |
3M Co. | | 1,476 | | 138,183 | |
A.O. Smith Corp. - Class A | | 3,123 | | 206,524 | |
Axon Enterprise, Inc. (2) | | 158 | | 31,440 | |
Eaton Corp PLC | | 899 | | 191,739 | |
General Electric Co. | | 7,364 | | 814,090 | |
Illinois Tool Works, Inc. | | 5,789 | | 1,333,265 | |
Parker-Hannifin Corp. | | 2,459 | | 957,830 | |
Teledyne Technologies, Inc. (2) | | 115 | | 46,987 | |
Textron, Inc. | | 3,779 | | 295,291 | |
| | | | | | 4,015,349 | |
Office & Business Equipment — 0.0% (4) | | | |
Zebra Technologies Corp. (2) | | 165 | | 39,027 | |
| | | | | | | |
Oil & Gas — 3.6% | | | | | |
APA Corp. (1) | | 5,636 | | 231,640 | |
Chevron Corp. | | 16,559 | | 2,792,179 | |
ConocoPhillips | | 3,233 | | 387,313 | |
The accompanying notes are an integral part of these financial statements.
|
SCHEDULE OF INVESTMENTS at September 30, 2023 (Continued) |
| | | | | | | |
| | Shares | | Value | |
Common Stocks — 99.8% (Continued) | | | |
Oil & Gas — 3.6% (Continued) | |
Coterra Energy, Inc. (1) | | 2,024 | | $54,749
| |
Devon Energy Corp. | | 1,721 | | 82,092 | |
Diamondback Energy, Inc. | | 499 | | 77,285 | |
EOG Resources, Inc. | | 1,557 | | 197,365 | |
EQT Corp. | | 960 | | 38,957 | |
Exxon Mobil Corp. | | 33,760 | | 3,969,501 | |
Hess Corp. | | 690 | | 105,570 | |
Marathon Oil Corp. | | 1,422 | | 38,038 | |
Marathon Petroleum Corp. | | 8,840 | | 1,337,846 | |
Occidental Petroleum Corp. | | 2,465 | | 159,929 | |
Phillips 66 | | 7,918 | | 951,348 | |
Pioneer Natural Resources Co. | | 611 | | 140,255 | |
Valero Energy Corp. | | 945 | | 133,916 | |
| | | | | | 10,697,983 | |
Oil & Gas Services — 0.4% | | | | | |
Baker Hughes Co. | | 22,282 | | 787,000 | |
Halliburton Co. | | 2,402 | | 97,281 | |
Schlumberger NV | | 3,304 | | 192,623 | |
| | | | | | 1,076,904 | |
Packaging & Containers — 0.2% | | | |
Amcor PLC | | 27,776 | | 254,428 | |
Ball Corp. (1) | | 811 | | 40,372 | |
Packaging Corp. of America | | 1,708 | | 262,264 | |
Sealed Air Corp. | | 386 | | 12,684 | |
Westrock Co. | | 768 | | 27,494 | |
| | | | | | 597,242 | |
Pharmaceuticals — 6.3% | | | | | |
AbbVie, Inc. | | 14,346 | | 2,138,415 | |
Becton Dickinson & Co. | | 748 | | 193,380 | |
Bristol-Myers Squibb Co. | | 15,610 | | 906,004 | |
Cardinal Health, Inc. | | 5,398 | | 468,654 | |
Cencora, Inc. | | 4,106 | | 738,957 | |
CVS Health Corp. | | 29,028 | | 2,026,735 | |
Dexcom, Inc. (2) | | 915 | | 85,370 | |
Eli Lilly & Co. | | 2,173 | | 1,167,184 | |
Henry Schein, Inc. (2) | | 340 | | 25,245 | |
Johnson & Johnson | | 29,783 | | 4,638,702 | |
McKesson Corp. | | 706 | | 307,004 | |
Merck & Co., Inc. | | 9,783 | | 1,007,160 | |
Organon & Co. | | 4,892 | | 84,925 | |
Pfizer, Inc. | | 77,302 | | 2,564,107 | |
The Cigna Group | | 6,721 | | 1,922,677 | |
Viatris, Inc. | | 3,207 | | 31,621 | |
Zoetis, Inc. (1) | | 1,210 | | 210,516 | |
| | | | | | 18,516,656 | |
| | | | | | | |
| | Shares | | Value | |
Common Stocks — 99.8% (Continued) | | | |
Pipelines — 0.1% | | | | | |
Kinder Morgan, Inc. | | 8,713 | | $144,461
| |
ONEOK, Inc. | | 1,172 | | 74,340 | |
Targa Resources Corp. | | 605 | | 51,861 | |
The Williams Companies, Inc. | | 2,845 | | 95,848 | |
| | | | | | 366,510 | |
Private Equity — 0.1% | | | | | |
Blackstone, Inc. (1) | | 1,629 | | 174,531 | |
| | | | | | | |
Real Estate — 0.0% (4) | | | | | |
CBRE Group, Inc. (2) | | 861 | | 63,593 | |
| | | | | | | |
Real Estate Investment Trusts (REITs) — 1.1% | |
Alexandria Real Estate
Equities, Inc. (1) | | 445 | | 44,544 | |
American Tower Corp. | | 3,565 | | 586,264 | |
AvalonBay Communities, Inc. | | 363 | | 62,342 | |
Boston Properties, Inc. | | 387 | | 23,019 | |
Camden Property Trust | | 285 | | 26,955 | |
Crown Castle, Inc. | | 3,320 | | 305,540 | |
Digital Realty Trust, Inc. | | 753 | | 91,128 | |
Equinix, Inc. | | 223 | | 161,956 | |
Equity Residential | | 1,004 | | 58,945 | |
Essex Property Trust, Inc. | | 167 | | 35,419 | |
Extra Space Storage, Inc. | | 351 | | 42,675 | |
Federal Realty Investment Trust | | 234 | | 21,207 | |
Healthpeak Properties, Inc. | | 1,419 | | 26,053 | |
Host Hotels & Resorts, Inc. | | 1,987 | | 31,931 | |
Invitation Homes, Inc. | | 1,614 | | 51,148 | |
Iron Mountain, Inc. | | 675 | | 40,129 | |
Kimco Realty Corp. (1) | | 1,752 | | 30,818 | |
Mid-America Apartment Communities, Inc. | | 288 | | 37,051 | |
Prologis, Inc. | | 2,439 | | 273,680 | |
Public Storage | | 433 | | 114,104 | |
Realty Income Corp. | | 12,969 | | 647,672 | |
Regency Centers Corp. | | 419 | | 24,905 | |
SBA Communications Corp. | | 826 | | 165,340 | |
Simon Property Group, Inc. | | 840 | | 90,745 | |
UDR, Inc. | | 907 | | 32,353 | |
Ventas, Inc. | | 1,056 | | 44,489 | |
VICI Properties, Inc. | | 2,651 | | 77,144 | |
Welltower, Inc. (1) | | 1,118 | | 91,587 | |
Weyerhaeuser Co. | | 1,910 | | 58,561 | |
| | | | | | 3,297,704 | |
The accompanying notes are an integral part of these financial statements.
|
SCHEDULE OF INVESTMENTS at September 30, 2023 (Continued) |
| | | | | | | |
| | Shares | | Value | |
Common Stocks — 99.8% (Continued) | | | |
Retail — 5.1% | | | | | |
AutoZone, Inc. (2) | | 342 | | $868,677
| |
Bath & Body Works, Inc. | | 614 | | 20,753 | |
Best Buy Co., Inc. | | 4,969 | | 345,196 | |
CarMax, Inc. (1)(2) | | 394 | | 27,868 | |
Chipotle Mexican Grill, Inc. (2) | | 61 | | 111,742 | |
Costco Wholesale Corp. | | 1,062 | | 599,987 | |
Darden Restaurants, Inc. | | 321 | | 45,974 | |
Dollar General Corp. | | 576 | | 60,941 | |
Dollar Tree, Inc. (2) | | 597 | | 63,551 | |
Domino’s Pizza, Inc. | | 89 | | 33,712 | |
Genuine Parts Co. | | 371 | | 53,565 | |
Lowe’s Companies, Inc. | | 8,692 | | 1,806,545 | |
McDonald’s Corp. | | 8,422 | | 2,218,692 | |
O’Reilly Automotive, Inc. (2) | | 589 | | 535,318 | |
Ross Stores, Inc. | | 5,399 | | 609,817 | |
Starbucks Corp. | | 3,039 | | 277,369 | |
Target Corp. | | 1,208 | | 133,569 | |
The Home Depot, Inc. | | 9,368 | | 2,830,635 | |
The TJX Companies, Inc. | | 18,833 | | 1,673,877 | |
Tractor Supply Co. (1) | | 272 | | 55,230 | |
Ulta Beauty, Inc. (2) | | 331 | | 132,218 | |
Walgreens Boots Alliance, Inc. | | 16,561 | | 368,317 | |
Walmart, Inc. | | 7,198 | | 1,151,176 | |
Yum! Brands, Inc. | | 6,276 | | 784,123 | |
| | | | | | 14,808,852 | |
Semiconductors — 6.3% | | | | | |
Advanced Micro Devices, Inc. (2) | | 3,695 | | 379,920 | |
Analog Devices, Inc. | | 1,306 | | 228,668 | |
Applied Materials, Inc. | | 16,082 | | 2,226,553 | |
Broadcom, Inc. | | 5,118 | | 4,250,908 | |
Intel Corp. | | 11,051 | | 392,863 | |
KLA Corp. | | 2,625 | | 1,203,983 | |
Lam Research Corp. | | 2,583 | | 1,618,947 | |
Microchip Technology, Inc. | | 10,484 | | 818,276 | |
Micron Technology, Inc. | | 8,376 | | 569,819 | |
Monolithic Power Systems, Inc. | | 115 | | 53,130 | |
NVIDIA Corp. | | 12,409 | | 5,397,791 | |
NXP Semiconductors NV | | 687 | | 137,345 | |
ON Semiconductor Corp. (1)(2) | | 946 | | 87,931 | |
Qorvo, Inc. (2) | | 258 | | 24,631 | |
QUALCOMM, Inc. | | 2,924 | | 324,739 | |
Skyworks Solutions, Inc. | | 3,273 | | 322,685 | |
Teradyne, Inc. (1) | | 386 | | 38,778 | |
Texas Instruments, Inc. | | 2,420 | | 384,804 | |
| | | | | | 18,461,771 | |
| | | | | | | |
| | Shares | | Value | |
Common Stocks — 99.8% (Continued) | | | |
Shipbuilding — 0.0% (4) | | | | | |
Huntington Ingalls Industries, Inc. | 99 | | $20,253
| |
| | | | | | | |
Software — 11.2% | | | | | |
Activision Blizzard, Inc. | | 6,919 | | 647,826 | |
Adobe, Inc. (2) | | 3,463 | | 1,765,784 | |
Akamai Technologies, Inc. (2) | | 393 | | 41,870 | |
ANSYS, Inc. (2) | | 663 | | 197,276 | |
Autodesk, Inc. (2) | | 1,622 | | 335,608 | |
Broadridge Financial Solutions, Inc. | 2,261 | | 404,832 | |
Cadence Design Systems, Inc. (2) | | 2,063 | | 483,361 | |
Ceridian HCM Holding, Inc. (2) | | 355 | | 24,087 | |
Electronic Arts, Inc. | | 5,203 | | 626,441 | |
Fair Isaac Corp. (2) | | 60 | | 52,112 | |
Fidelity National Information Services, Inc. | | 4,532 | | 250,484 | |
Fiserv, Inc. (2) | | 4,673 | | 527,862 | |
Intuit, Inc. | | 726 | | 370,942 | |
Jack Henry & Associates, Inc. | | 550 | | 83,127 | |
Microsoft Corp. | | 66,990 | | 21,152,093 | |
MSCI, Inc. | | 200 | | 102,616 | |
Oracle Corp. | | 6,326 | | 670,050 | |
Paychex, Inc. | | 975 | | 112,447 | |
Paycom Software, Inc. (1) | | 142 | | 36,816 | |
PTC, Inc. (2) | | 245 | | 34,712 | |
Roper Technologies, Inc. | | 816 | | 395,172 | |
Salesforce, Inc. (2) | | 16,615 | | 3,369,190 | |
ServiceNow, Inc. (2) | | 546 | | 305,192 | |
Synopsys, Inc. (2) | | 1,158 | | 531,487 | |
Take-Two Interactive
Software, Inc. (2) | | 1,301 | | 182,647 | |
Tyler Technologies, Inc. (2) | | 102 | | 39,386 | |
| | | | | | 32,743,420 | |
Telecommunications — 3.7% | | | | | |
Arista Networks, Inc. (2) | | 701 | | 128,935 | |
AT&T, Inc. | | 160,950 | | 2,417,469 | |
Cisco Systems, Inc. | | 92,612 | | 4,978,821 | |
Corning, Inc. | | 2,168 | | 66,059 | |
Juniper Networks, Inc. | | 6,115 | | 169,936 | |
Motorola Solutions, Inc. | | 447 | | 121,691 | |
T-Mobile US, Inc. | | 4,999 | | 700,110 | |
Verizon Communications, Inc. | | 71,346 | | 2,312,324 | |
| | | | | | 10,895,345 | |
Toys, Games & Hobbies — 0.0% (4) | | | |
Hasbro, Inc. | | 371 | | 24,538 | |
| | | | | | | |
The accompanying notes are an integral part of these financial statements.
|
SCHEDULE OF INVESTMENTS at September 30, 2023 (Continued) |
| | | | | | | |
| | Shares | | Value | |
Common Stocks — 99.8% (Continued) | | | |
Transportation — 1.0% | | | | | |
C.H. Robinson Worldwide, Inc. | | 2,600 | | $223,938
| |
CSX Corp. | | 5,367 | | 165,035 | |
Expeditors International of Washington, Inc. | | 3,371 | | 386,418 | |
FedEx Corp. | | 4,821 | | 1,277,179 | |
J.B. Hunt Transport Services, Inc. (1) | | 259 | | 48,827 | |
Norfolk Southern Corp. | | 602 | | 118,552 | |
Old Dominion Freight Line, Inc. | | 250 | | 102,285 | |
Union Pacific Corp. | | 1,608 | | 327,437 | |
United Parcel Service, Inc. - Class B | | 2,288 | | 356,630 | |
| | | | | | 3,006,301 | |
Water — 0.0% (4) | | | | | |
American Water Works Co., Inc. | | 447 | | 55,352 | |
| | | | | | | |
Total Common Stocks | | | | | |
(Cost $287,301,006) | | | | 292,956,452 | |
| | | | | | | |
Short-Term Investments — 0.2% | | | |
| | | | | | | |
Money Market Funds — 0.2% | | | | | |
First American Government Obligations Fund, Class X, 5.261% (3) | | 452,844 | | 452,844 | |
| | | | | | | |
Total Short-Term Investments | | | | | |
(Cost $452,844) | | | | 452,844 | |
| | | | | | | |
Investments Purchased with Collateral
from Securities Lending — 2.2% | |
Mount Vernon Liquid Assets Portfolio, LLC, 5.580% (3) | | 6,470,612 | | 6,470,612 | |
| | | | | | | |
Total Investments Purchased with Collateral
from Securities Lending | |
(Cost $6,470,612) | | | | 6,470,612 | |
| | | | | | | |
Total Investments in Securities — 102.2% | | | |
(Cost $294,224,462) | | | | 299,879,908 | |
Liabilities in Excess of Other Assets — (2.2)% | | (6,389,733 | ) |
Total Net Assets — 100.0% | | | | $293,490,175
| |
(1)This security or a portion of this security was out on loan as of September 30, 2023. Total loaned securities had a value of $6,314,257 or 2.2% of net assets as of September 30, 2023. The remaining contractual maturity of all of the securities lending transactions is overnight and continuous.
(2)Non-income producing security.
(3)The rate shown is the annualized seven-day effective yield as of September 30, 2023.
(4)Does not round to 0.1% or (0.1)%, as applicable.
The accompanying notes are an integral part of these financial statements.
| | | | | | | |
| | Shares | | Value | |
Common Stocks — 99.8% | | | | | |
Advertising — 0.7% | | | | | |
Omnicom Group, Inc. | | 6,799 | | $506,390
| |
The Interpublic Group of Company, Inc. (1) | | 13,370 | | 383,184 | |
| | | | | | 889,574 | |
Aerospace & Defense — 0.3% | | | | | |
Curtiss-Wright Corp. | | 16 | | 3,130 | |
General Dynamics Corp. | | 581 | | 128,384 | |
Lockheed Martin Corp. | | 798 | | 326,350 | |
| | | | | | 457,864 | |
Agriculture — 1.3% | | | | | |
Altria Group, Inc. | | 14,179 | | 596,227 | |
Archer-Daniels-Midland Co. | | 5,728 | | 432,006 | |
Bunge Ltd. | | 5,338 | | 577,839 | |
Philip Morris International, Inc. | | 1,092 | | 101,097 | |
| | | | | | 1,707,169 | |
Airlines — 0.4% | | | | | |
American Airlines Group, Inc. (2) | | 29,237 | | 374,526 | |
Delta Air Lines, Inc. | | 5,453 | | 201,761 | |
| | | | | | 576,287 | |
Apparel — 2.9% | | | | | |
Capri Holdings Ltd. (2) | | 10,152 | | 534,097 | |
Carter’s, Inc. (1) | | 7,903 | | 546,492 | |
Crocs, Inc. (2) | | 5,573 | | 491,706 | |
Ralph Lauren Corp. - Class A | | 2,764 | | 320,873 | |
Skechers U.S.A., Inc. - Class A (2) | 3,842 | | 188,066 | |
Steven Madden Ltd. (1) | | 14,654 | | 465,558 | |
Tapestry, Inc. (1)(2) | | 17,113 | | 491,999 | |
Urban Outfitters, Inc. (1)(2) | | 17,195 | | 562,104 | |
VF Corp. | | 21,209 | | 374,763 | |
| | | | | | 3,975,658 | |
Auto Manufacturers — 0.4% | | | | | |
General Motors Co. | | 15,284 | | 503,914 | |
| | | | | | | |
Auto Parts & Equipment — 1.0% | | | |
Adient PLC (2) | | 9,146 | | 335,658 | |
Allison Transmission
Holdings, Inc. | | 8,841 | | 522,150 | |
BorgWarner, Inc. | | 14,063 | | 567,723 | |
| | | | | | 1,425,531 | |
Banks — 4.6% | | | | | |
Ameris Bancorp | | 204 | | 7,832 | |
Associated Banc-Corp | | 1,160 | | 19,848 | |
Bank of America Corp. | | 8,784 | | 240,506 | |
| | | | | | | |
| | Shares | | Value | |
Common Stocks — 99.8% (Continued) | | | |
Banks — 4.6% (Continued) | |
Bank OZK (1) | | 5,531 | | $205,034
| |
Cadence Bank (1) | | 7,935 | | 168,381 | |
Cathay General Bancorp | | 6,221 | | 216,242 | |
Citigroup, Inc. | | 1,681 | | 69,140 | |
Citizens Financial Group, Inc. | | 3,645 | | 97,686 | |
Columbia Banking System, Inc. | | 1,841 | | 37,372 | |
Comerica, Inc. | | 5,666 | | 235,422 | |
Cullen/Frost Bankers, Inc. | | 820 | | 74,792 | |
CVB Financial Corp. | | 1,579 | | 26,164 | |
East West Bancorp, Inc. | | 3,533 | | 186,224 | |
Fifth Third Bancorp | | 3,639 | | 92,176 | |
First BanCorp/Puerto R co. | | 17,931 | | 241,351 | |
First Citizens BancShares, Inc. - Class A | | 11 | | 15,181 | |
Fulton Financial Corp. | | 1,622 | | 19,642 | |
Hancock Whitney Corp. | | 11,628 | | 430,120 | |
Huntington Bancshares, Inc. | | 31,288 | | 325,395 | |
Independent Bank Corp. | | 4,897 | | 240,394 | |
International Bancshares Corp. | | 2,867 | | 124,256 | |
KeyCorp | | 7,895 | | 84,950 | |
Old National Bancorp/IN | | 11,957 | | 173,855 | |
Pinnacle Financial Partners, Inc. | | 3,333 | | 223,444 | |
Prosperity Bancshares, Inc. | | 914 | | 49,886 | |
Regions Financial Corp. | | 8,161 | | 140,369 | |
SouthState Corp. | | 4,729 | | 318,545 | |
Synovus Financial Corp. | | 4,555 | | 126,629 | |
Texas Capital Bancshares, Inc. (2) | | 5,464 | | 321,830 | |
The Bank of Nova Scotia (1) | | 3,107 | | 141,648 | |
The PNC Financial Services Group, Inc. | | 3,112 | | 382,060 | |
The Toronto-Dominion Bank | | 2,950 | | 177,767 | |
Truist Financial Corp. | | 10,231 | | 292,709 | |
UMB Financial Corp. | | 3,696 | | 229,337 | |
Valley National Bancorp | | 20,631 | | 176,601 | |
Western Alliance Bancorp | | 3,062 | | 140,760 | |
Wintrust Financial Corp. | | 213 | | 16,082 | |
Zions Bancorp N.A. | | 7,441 | | 259,617 | |
| | | | | | 6,329,247 | |
Beverages — 0.8% | | | | | |
Coca-Cola Consolidated, Inc. | | 767 | | 488,058 | |
Keurig Dr Pepper, Inc. | | 3,921 | | 123,786 | |
Molson Coors Brewing Co. - Class B (1) | | 3,834 | | 243,804 | |
National Beverage Corp. (2) | | 1,365 | | 64,182 | |
|
SCHEDULE OF INVESTMENTS at September 30, 2023 |
The accompanying notes are an integral part of these financial statements.
|
SCHEDULE OF INVESTMENTS at September 30, 2023 (Continued) |
| | | | | | | |
| | Shares | | Value | |
Common Stocks — 99.8% (Continued) | | | |
Beverages — 0.8% (Continued) | |
PepsiCo, Inc. | | 164 | | $27,788
| |
The Coca-Cola Co. | | 3,518 | | 196,938 | |
| | | | | | 1,144,556 | |
Biotechnology — 1.9% | | | | | |
Amgen, Inc. | | 1,130 | | 303,699 | |
Biogen, Inc. (2) | | 985 | | 253,155 | |
Bio-Rad Laboratories, Inc. - Class A (2) | | 1,520 | | 544,844 | |
Exelixis, Inc. (2) | | 3,307 | | 72,258 | |
Gilead Sciences, Inc. | | 4,924 | | 369,004 | |
Halozyme Therapeutics, Inc. (2) | | 5,294 | | 202,231 | |
Horizon Therapeutics PLC (2) | | 65 | | 7,520 | |
Incyte Corp. (2) | | 2,180 | | 125,938 | |
United Therapeutics Corp. (2) | | 2,641 | | 596,523 | |
Vertex Pharmaceuticals, Inc. (2) | | 403 | | 140,139 | |
| | | | | | 2,615,311 | |
Building Materials — 3.0% | | | | | |
Armstrong World Industries, Inc. | 4,896 | | 352,512 | |
Boise Cascade Co. | | 3,027 | | 311,902 | |
Builders FirstSource, Inc. (1)(2) | | 4,268 | | 531,323 | |
Eagle Materials, Inc. | | 2,308 | | 384,328 | |
Fortune Brands Innovations, Inc. | | 8,079 | | 502,191 | |
Hayward Holdings, Inc. (2) | | 8,175 | | 115,267 | |
Johnson Controls International PLC | 413 | | 21,976 | |
Louisiana-Pacific Corp. | | 188 | | 10,391 | |
Masco Corp. | | 3,139 | | 167,780 | |
MDU Resources Group, Inc. | | 31,613 | | 618,983 | |
Owens Corning | | 1,356 | | 184,972 | |
Simpson Manufacturing Co., Inc. | 2,082 | | 311,904 | |
UFP Industries, Inc. | | 5,716 | | 585,318 | |
| | | | | | 4,098,847 | |
Chemicals — 3.6% | | | | | |
Cabot Corp. | | 6,044 | | 418,668 | |
CF Industries Holdings, Inc. | | 7,440 | | 637,906 | |
Dow, Inc. | | 1,082 | | 55,788 | |
Eastman Chemical Co. | | 2 | | 153 | |
HB Fuller Co. | | 3,041 | | 208,643 | |
Huntsman Corp. | | 16,288 | | 397,427 | |
Innospec, Inc. | | 1,208 | | 123,458 | |
International Flavors & Fragrances, Inc. | | 2,720 | | 185,422 | |
LyondellBasell Industries NV | | 958 | | 90,723 | |
NewMarket Corp. | | 1,214 | | 552,418 | |
Nutrien Ltd. (1) | | 1,269 | | 78,373 | |
Olin Corp. | | 9,214 | | 460,516 | |
| | | | | | | |
| | Shares | | Value | |
Common Stocks — 99.8% (Continued) | | | |
Chemicals — 3.6% (Continued) | |
Quaker Chemical Corp. | | 709 | | $113,440
| |
RPM International, Inc. | | 368 | | 34,890 | |
The Mosaic Co. | | 11,321 | | 403,028 | |
Valvoline, Inc. | | 20,327 | | 655,342 | |
Westlake Corp. (1) | | 3,616 | | 450,807 | |
| | | | | | 4,867,002 | |
Coal — 1.6% | | | | | |
Alpha Metallurgical
Resources, Inc. (1) | | 1,835 | | 476,605 | |
Arch Resources, Inc. - Class A (1) | | 4,023 | | 686,565 | |
CONSOL Energy, Inc. | | 7,613 | | 798,680 | |
Teck Resources Ltd. - Class A | | 1,006 | | 43,348 | |
Warrior Met Coal, Inc. | | 3,039 | | 155,232 | |
| | | | | | 2,160,430 | |
Commercial Services — 3.1% | | | | | |
ABM Industries, Inc. | | 4,165 | | 166,642 | |
ADT, Inc. | | 53,598 | | 321,588 | |
AMN Healthcare Services, Inc. (1)(2) | 6,202 | | 528,286 | |
API Group Corp. (2) | | 11,834 | | 306,856 | |
ASGN, Inc. (2) | | 2,130 | | 173,978 | |
Colliers International Group, Inc. - SVS | | 1,752 | | 166,878 | |
Euronet Worldwide, Inc. (2) | | 1,282 | | 101,765 | |
FleetCor Technologies, Inc. (2) | | 686 | | 175,163 | |
Gartner, Inc. (2) | | 85 | | 29,207 | |
Graham Holdings Co. - Class A | | 576 | | 335,808 | |
Grand Canyon Education, Inc. (2) | | 1,821 | | 212,839 | |
Insperity, Inc. | | 4,194 | | 409,334 | |
John Wiley & Sons, Inc. - Class A | 893 | | 33,193 | |
RB Global, Inc. | | 147 | | 9,188 | |
Robert Half, Inc. | | 5,726 | | 419,601 | |
Service Corp. International | | 2,346 | | 134,050 | |
The Brink’s Co. | | 2,633 | | 191,261 | |
TriNet Group, Inc. (1)(2) | | 4,467 | | 520,316 | |
WEX, Inc. (1)(2) | | 210 | | 39,499 | |
| | | | | | 4,275,452 | |
Computers — 2.9% | | | | | |
Accenture PLC - Class A | | 475 | | 145,877 | |
Amdocs Ltd. | | 5,270 | | 445,262 | |
CACI International, Inc. (2) | | 344 | | 107,992 | |
CGI, Inc. - Class A (2) | | 2,298 | | 226,330 | |
Crane NXT Co. | | 832 | | 46,234 | |
Dell Technologies, Inc. - Class A | | 5,797 | | 399,413 | |
Hewlett Packard Enterprise Co. | | 12,641 | | 219,574 | |
HP, Inc. | | 15,121 | | 388,610 | |
The accompanying notes are an integral part of these financial statements.
| | | | | | | |
| | Shares | | Value | |
Common Stocks — 99.8% (Continued) | | | |
Computers — 2.9% (Continued) | |
Insight Enterprises, Inc. (1)(2) | | 4,975 | | $723,863
| |
Maximus, Inc. | | 3,037 | | 226,803 | |
NCR Corp. (2) | | 9,220 | | 248,664 | |
NetApp, Inc. | | 3,483 | | 264,290 | |
Science Applications International Corp. | | 3,293 | | 347,543 | |
Seagate Technology
Holdings PLC (1) | | 3,293 | | 217,174 | |
| | | | | | 4,007,629 | |
Cosmetics & Personal Care — 0.2% | | | |
Colgate-Palmolive Co. | | 1,151 | | 81,848 | |
Kenvue, Inc. | | 9,492 | | 190,599 | |
| | | | | | 272,447 | |
Distribution & Wholesale — 1.3% | | | |
Core & Main, Inc. - Class A (2) | | 7,330 | | 211,470 | |
Fastenal Co. | | 1,511 | | 82,561 | |
LKQ Corp. | | 4,967 | | 245,916 | |
Pool Corp. (1) | | 933 | | 332,241 | |
Resideo Technologies, Inc. (2) | | 11,102 | | 175,412 | |
Rush Enterprises, Inc. - Class B | | 10,896 | | 444,884 | |
W.W. Grainger, Inc. | | 151 | | 104,468 | |
WESCO International, Inc. | | 821 | | 118,076 | |
| | | | | | 1,715,028 | |
Diversified Financial Services — 0.8% | | | |
Affiliated Managers Group, Inc. | | 918 | | 119,652 | |
Ally Financial, Inc. | | 1,713 | | 45,703 | |
Capital One Financial Corp. (1) | | 161 | | 15,625 | |
Discover Financial Services | | 1,839 | | 159,313 | |
Enact Holdings, Inc. | | 5,432 | | 147,913 | |
Franklin Resources, Inc. (1) | | 456 | | 11,208 | |
Intercorp Financial Services, Inc. | 884 | | 19,908 | |
Nelnet, Inc. - Class A | | 21 | | 1,876 | |
OneMain Holdings, Inc. | | 117 | | 4,690 | |
Radian Group, Inc. | | 3,153 | | 79,172 | |
Synchrony Financial (1) | | 3,382 | | 103,388 | |
The Charles Schwab Corp. | | 2,040 | | 111,996 | |
The Western Union Co. | | 15,544 | | 204,870 | |
| | | | | | 1,025,314 | |
Electric — 0.9% | | | | | |
ALLETE, Inc. | | 6,799 | | 358,987 | |
Otter Tail Corp. (1) | | 2,616 | | 198,607 | |
Vistra Corp. | | 19,441 | | 645,052 | |
| | | | | | 1,202,646 | |
| | | | | | | |
| | Shares | | Value | |
Common Stocks — 99.8% (Continued) | | | |
Electrical Components & Equipment — 1.8% | | | |
Acuity Brands, Inc. 1.50% | | 3,223 | | $548,909
| |
Belden, Inc. | | 102 | | 9,848 | |
Emerson Electric Co. | | 5,074 | | 489,996 | |
Encore Wire Corp. (1) | | 3,529 | | 643,901 | |
Energizer Holdings, Inc. | | 8,535 | | 273,462 | |
EnerSys | | 4,707 | | 445,612 | |
Littelfuse, Inc. | | 119 | | 29,431 | |
| | | | | | 2,441,159 | |
Electronics — 2.8% | | | | | |
Agilent Technologies, Inc. | | 1,361 | | 152,187 | |
Allegion PLC | | 290 | | 30,218 | |
Amphenol Corp. | | 12 | | 1,008 | |
Arrow Electronics, Inc. (2) | | 2,989 | | 374,342 | |
Atkore, Inc. (1)(2) | | 2,692 | | 401,620 | |
Brady Corp. | | 10,021 | | 550,353 | |
Celestica, Inc. - SVS (2) | | 6,919 | | 169,654 | |
Garmin Ltd. | | 2,941 | | 309,393 | |
Honeywell International, Inc. | | 137 | | 25,309 | |
Hubbell, Inc. | | 2 | | 627 | |
Jabil, Inc. | | 4,155 | | 527,228 | |
Keysight Technologies, Inc. (2) | | 1,209 | | 159,963 | |
Sensata Technologies Holding PLC | 847 | | 32,034 | |
SYNNEX Corp. | | 4,700 | | 469,342 | |
TE Connectivity Ltd. | | 926 | | 114,389 | |
Vishay Intertechnology, Inc. | | 15,767 | | 389,760 | |
Vontier Corp. | | 4,370 | | 135,120 | |
| | | | | | 3,842,547 | |
Engineering & Construction — 1.2% | | | |
AECOM | | 597 | | 49,575 | |
Arcosa, Inc. | | 3,295 | | 236,910 | |
Comfort Systems USA, Inc. | | 2,640 | | 449,882 | |
EMCOR Group, Inc. | | 694 | | 146,011 | |
Frontdoor, Inc. (2) | | 9,989 | | 305,564 | |
TopBuild Corp. (2) | | 1,691 | | 425,456 | |
| | | | | | 1,613,398 | |
Entertainment — 0.6% | | | | | |
International Game
Technology PLC | | 4,873 | | 147,749 | |
Penn Entertainment, Inc. (2) | | 14,545 | | 333,808 | |
SeaWorld Entertainment, Inc. (2) | | 3,898 | | 180,283 | |
Vail Resorts, Inc. | | 325 | | 72,114 | |
Warner Music Group Corp. - Class A | | 1,650 | | 51,810 | |
| | | | | | 785,764 | |
|
SCHEDULE OF INVESTMENTS at September 30, 2023 (Continued) |
The accompanying notes are an integral part of these financial statements.
| | | | | | | |
| | Shares | | Value | |
Common Stocks — 99.8% (Continued) | | | |
Environmental Control — 0.2% | | | | | |
Republic Services, Inc. | | 1,746 | | $248,822
| |
Stericycle, Inc. (2) | | 1,076 | | 48,108 | |
| | | | | | 296,930 | |
Food — 4.9% | | | | | |
Albertsons Companies, Inc. | | 20,539 | | 467,262 | |
Cal-Maine Foods, Inc. (1) | | 12,207 | | 591,063 | |
Campbell Soup Co. (1) | | 10,655 | | 437,707 | |
Conagra Brands, Inc. | | 5,444 | | 149,274 | |
General Mills, Inc. | | 5,107 | | 326,797 | |
Grocery Outlet Holding Corp. (2) | | 5,045 | | 145,548 | |
Hormel Foods Corp. (1) | | 8,435 | | 320,783 | |
Ingredion, Inc. | | 5,795 | | 570,228 | |
Kellogg Co. | | 8,502 | | 505,954 | |
Mondelez International, Inc. | | 259 | | 17,975 | |
Sprouts Farmers Market, Inc. (1)(2) | 5,535 | | 236,898 | |
Sysco Corp. | | 7,651 | | 505,349 | |
The J.M. Smucker Co. | | 5,481 | | 673,670 | |
The Kraft Heinz Co. | | 13,723 | | 461,642 | |
The Kroger Co. | | 12,208 | | 546,308 | |
The Simply Good Foods Co. (1)(2) | | 5,469 | | 188,790 | |
US Foods Holding Corp. (1)(2) | | 13,096 | | 519,911 | |
| | | | | | 6,665,159 | |
Forest Products & Paper — 0.0% (4) | | | |
International Paper Co. | | 837 | | 29,688 | |
| | | | | | | |
Gas — 0.3% | | | | | |
Southwest Gas Holdings, Inc. | | 5,672 | | 342,646 | |
| | | | | | | |
Hand & Machine Tools — 0.2% | | | | | |
Snap-on, Inc. | | 907 | | 231,340 | |
Stanley Black & Decker, Inc. (1) | | 821 | | 68,619 | |
| | | | | | 299,959 | |
Healthcare — Products — 1.3% | | | | | |
Avantor, Inc. (2) | | 7,717 | | 162,674 | |
Baxter International, Inc. | | 1,226 | | 46,269 | |
DENTSPLY SIRONA, Inc. | | 2 | | 68 | |
GE HealthCare Technologies, Inc. | 2,879 | | 195,887 | |
Hologic, Inc. (2) | | 165 | | 11,451 | |
Integra LifeSciences Holdings Corp. (2) | | 1,351 | | 51,595 | |
Lantheus Holdings, Inc. (1)(2) | | 7,847 | | 545,210 | |
Patterson Companies, Inc. | | 14,721 | | 436,331 | |
| | | | | | | |
| | Shares | | Value | |
Common Stocks — 99.8% (Continued) | | | |
Healthcare — Products — 1.3% (Continued) | | | |
Revvity, Inc. | | 2,687 | | $297,451
| |
Zimmer Biomet Holdings, Inc. | | 697 | | 78,217 | |
| | | | | | 1,825,153 | |
Healthcare — Services — 2.7% | | | | | |
Amedisys, Inc. (2) | | 3,543 | | 330,916 | |
Centene Corp. (2) | | 9,099 | | 626,739 | |
Chemed Corp. | | 111 | | 57,687 | |
DaVita, Inc. (2) | | 5,460 | | 516,134 | |
Elevance Health, Inc. | | 901 | | 392,313 | |
HCA Healthcare, Inc. | | 183 | | 45,014 | |
Humana, Inc. | | 996 | | 484,574 | |
Laboratory Corp. of America Holdings | | 1,926 | | 387,222 | |
Molina Healthcare, Inc. (2) | | 1,472 | | 482,654 | |
UnitedHealth Group, Inc. | | 445 | | 224,365 | |
Universal Health Services, Inc. - Class D | | 1,323 | | 166,341 | |
| | | | | | 3,713,959 | |
Home Builders — 1.3% | | | | | |
Cavco Industries, Inc. (2) | | 658 | | 174,804 | |
Installed Building Products, Inc. (1) | 2,300 | | 287,247 | |
LCI Industries (1) | | 3,682 | | 432,340 | |
Skyline Champion Corp. (1)(2) | | 6,137 | | 391,050 | |
Thor Industries, Inc. | | 4,528 | | 430,749 | |
| | | | | | 1,716,190 | |
Home Furnishings — 0.5% | | | | | |
Dolby Laboratories, Inc. - Class A | | 5,304 | | 420,395 | |
Leggett & Platt, Inc. | | 11,718 | | 297,754 | |
| | | | | | 718,149 | |
Household Products & Wares — 1.2% | | | |
Helen of Troy Ltd. (1)(2) | | 3,936 | | 458,780 | |
Kimberly-Clark Corp. | | 3,384 | | 408,956 | |
Spectrum Brands Holdings, Inc. | | 7,144 | | 559,732 | |
The Clorox Co. | | 1,441 | | 188,858 | |
| | | | | | 1,616,326 | |
Housewares — 0.5% | | | | | |
Newell Brands, Inc. | | 20,202 | | 182,424 | |
The Scotts Miracle-Gro Co. (1) | | 8,841 | | 456,903 | |
| | | | | | 639,327 | |
Insurance — 3.4% | | | | | |
American Equity Investment Life Holding Co. | | 1,510 | | 80,996 | |
American Financial Group, Inc. | | 1,065 | | 118,929 | |
|
SCHEDULE OF INVESTMENTS at September 30, 2023 (Continued) |
The accompanying notes are an integral part of these financial statements.
| | | | | | | |
| | Shares | | Value | |
Common Stocks — 99.8% (Continued) | | | |
Insurance — 3.4% (Continued) | | | |
American International Group, Inc. | 1,289 | | $78,113
| |
Axis Capital Holdings Ltd. | | 6,547 | | 369,054 | |
CNA Financial Corp. | | 336 | | 13,222 | |
Equitable Holdings, Inc. | | 17,628 | | 500,459 | |
Essent Group Ltd. | | 4,794 | | 226,708 | |
Globe Life, Inc. | | 1,326 | | 144,176 | |
Loews Corp. | | 9,595 | | 607,459 | |
Manulife Financial Corp. | | 721 | | 13,180 | |
Markel Group, Inc. (2) | | 316 | | 465,307 | |
MGIC Investment Corp. | | 30,974 | | 516,956 | |
Reinsurance Group of America, Inc. | 966 | | 140,254 | |
RenaissanceRe Holdings Ltd. | | 668 | | 132,211 | |
RLI Corp. (1) | | 4,705 | | 639,362 | |
Ryan Specialty Holdings, Inc. - Class A (1)(2) | | 4,151 | | 200,908 | |
Unum Group | | 3,269 | | 160,802 | |
W.R. Berkley Corp. | | 4,652 | | 295,356 | |
| | | | | | 4,703,452 | |
Internet — 1.0% | | | | | |
Alphabet, Inc. - Class A (2) | | 5 | | 654 | |
Booking Holdings, Inc. (2) | | 32 | | 98,686 | |
CDW Corp. | | 729 | | 147,083 | |
eBay, Inc. | | 8,547 | | 376,837 | |
F5, Inc. (2) | | 940 | | 151,472 | |
Gen Digital, Inc. | | 17,245 | | 304,892 | |
GoDaddy, Inc. - Class A (2) | | 622 | | 46,327 | |
Match Group, Inc. (2) | | 5,802 | | 227,293 | |
Perficient, Inc. (2) | | 319 | | 18,457 | |
VeriSign, Inc. (2) | | 184 | | 37,266 | |
| | | | | | 1,408,967 | |
Iron & Steel — 1.7% | | | | | |
Cleveland-Cliffs, Inc. (1)(2) | | 24,406 | | 381,466 | |
Commercial Metals Co. | | 9,031 | | 446,222 | |
Nucor Corp. | | 3,127 | | 488,906 | |
Reliance Steel & Aluminum Co. | | 1,605 | | 420,879 | |
Steel Dynamics, Inc. | | 5,251 | | 563,012 | |
| | | | | | 2,300,485 | |
Leisure Time — 1.0% | | | | | |
BRP, Inc. - SVS | | 2,013 | | 152,706 | |
Brunswick Corp. | | 3,550 | | 280,450 | |
Harley-Davidson, Inc. | | 8,593 | | 284,085 | |
Planet Fitness, Inc. - Class A (2) | | 4,272 | | 210,097 | |
Polaris, Inc. (1) | | 3,552 | | 369,905 | |
YETI Holdings, Inc. (1)(2) | | 2,528 | | 121,900 | |
| | | | | | 1,419,143 | |
| | | | | | | |
| | Shares | | Value | |
Common Stocks — 99.8% (Continued) | | | |
Lodging — 1.2% | | | | | |
Boyd Gaming Corp. | | 7,524 | | $457,685
| |
Choice Hotels International, Inc. (1) | 1,587 | | 194,423 | |
Hilton Worldwide Holdings, Inc. | | 1,550 | | 232,779 | |
Marriott International, Inc. | | 1,857 | | 365,012 | |
MGM Resorts International | | 605 | | 22,240 | |
Wyndham Hotels & Resorts, Inc. | 2,992 | | 208,064 | |
Wynn Resorts Ltd. | | 1,686 | | 155,803 | |
| | | | | | 1,636,006 | |
Machinery — Construction & Mining — 0.5% | | | |
Caterpillar, Inc. | | 1,226 | | 334,698 | |
Terex Corp. | | 5,091 | | 293,343 | |
| | | | | | 628,041 | |
Machinery — Diversified — 1.3% | | | |
Applied Industrial
Technologies, Inc. | | 1,757 | | 271,650 | |
Crane Co. (1) | | 6,275 | | 557,471 | |
CSW Industrials, Inc. | | 703 | | 123,194 | |
Esab Corp. | | 3,907 | | 274,350 | |
Gates Industrial Corp. PLC (2) | | 34,287 | | 398,072 | |
Ingersoll Rand, Inc. | | 627 | | 39,952 | |
Nordson Corp. | | 267 | | 59,586 | |
Otis Worldwide Corp. | | 201 | | 16,142 | |
| | | | | | 1,740,417 | |
Media — 2.8% | | | | | |
Cable One, Inc. | | 568 | | 349,684 | |
Charter Communications, Inc. - Class A (1)(2) | | 559 | | 245,859 | |
Comcast Corp. - Class A | | 7,486 | | 331,929 | |
Endeavor Group Holdings, Inc. - Class A | | 27,465 | | 546,553 | |
Fox Corp. - Class B | | 20,177 | | 629,522 | |
News Corp. - Class A | | 3,742 | | 75,065 | |
Nexstar Media Group, Inc. (1) | | 3,900 | | 559,143 | |
Sirius XM Holdings, Inc. (1) | | 84,980 | | 384,110 | |
TEGNA, Inc. | | 43,047 | | 627,195 | |
The New York Times Co. - Class A | 1,237 | | 50,964 | |
| | | | | | 3,800,024 | |
Metal Fabricate & Hardware — 1.5% | | | |
Advanced Drainage Systems, Inc. (1) | 4,326 | | 492,429 | |
Mueller Industries, Inc. (1) | | 7,445 | | 559,566 | |
The Timken Co. | | 2,360 | | 173,436 | |
Valmont Industries, Inc. | | 1,823 | | 437,903 | |
Worthington Industries, Inc. | | 6,299 | | 389,404 | |
| | | | | | 2,052,738 | |
|
SCHEDULE OF INVESTMENTS at September 30, 2023 (Continued) |
The accompanying notes are an integral part of these financial statements.
| | | | | | | |
| | Shares | | Value | |
Common Stocks — 99.8% (Continued) | | | |
Mining — 0.3% | | | | | |
Barrick Gold Corp. | | 833 | | $12,120
| |
Franco-Nevada Corp. | | 218 | | 29,101 | |
Freeport-McMoRan, Inc. | | 272 | | 10,143 | |
Kinross Gold Corp. | | 40,676 | | 185,483 | |
Southern Copper Corp. | | 1,618 | | 121,819 | |
| | | | | | 358,666 | |
Miscellaneous Manufacturers — 1.2% | | | |
3M Co. | | 291 | | 27,243 | |
A.O. Smith Corp. - Class A | | 4,424 | | 292,559 | |
Carlisle Companies, Inc. | | 1,688 | | 437,631 | |
Donaldson Co., Inc. | | 5,181 | | 308,995 | |
EnPro Industries, Inc. | | 635 | | 76,956 | |
General Electric Co. | | 3,590 | | 396,874 | |
Illinois Tool Works, Inc. | | 233 | | 53,662 | |
Teledyne Technologies, Inc. (2) | | 77 | | 31,461 | |
| | | | | | 1,625,381 | |
Oil & Gas — 10.3% | | | | | |
APA Corp. (1) | | 7,988 | | 328,307 | |
California Resources Corp. (1) | | 13,445 | | 753,054 | |
Canadian Natural Resources Ltd. (1) | 4,465 | | 288,752 | |
Chesapeake Energy Corp. (1) | | 6,157 | | 530,918 | |
Chevron Corp. | | 3,329 | | 561,336 | |
Civitas Resources, Inc. (1) | | 5,333 | | 431,280 | |
CNX Resources Corp. (1)(2) | | 12,911 | | 291,530 | |
ConocoPhillips | | 4,609 | | 552,158 | |
Coterra Energy, Inc. (1) | | 19,962 | | 539,972 | |
Crescent Point Energy Corp. | | 20,817 | | 172,781 | |
CVR Energy, Inc. (1) | | 17,309 | | 589,025 | |
Devon Energy Corp. | | 3,759 | | 179,304 | |
Enerplus Corp. | | 21,025 | | 370,671 | |
EOG Resources, Inc. | | 3,888 | | 492,843 | |
EQT Corp. | | 14,165 | | 574,816 | |
Exxon Mobil Corp. | | 4,593 | | 540,045 | |
Helmerich & Payne, Inc. | | 11,930 | | 502,969 | |
HF Sinclair Corp. | | 13,395 | | 762,577 | |
Imperial Oil Ltd. | | 6,962 | | 428,790 | |
Kosmos Energy Ltd. (2) | | 1,966 | | 16,082 | |
Magnolia Oil & Gas Corp. - Class A | | 6,854 | | 157,025 | |
Marathon Petroleum Corp. | | 4,069 | | 615,802 | |
Murphy Oil Corp. (1) | | 8,798 | | 398,989 | |
Occidental Petroleum Corp. (1) | | 8,252 | | 535,390 | |
Ovintiv, Inc. | | 2,250 | | 107,033 | |
Patterson-UTI Energy, Inc. | | 29,298 | | 405,484 | |
Phillips 66 | | 4,845 | | 582,127 | |
| | | | | | | |
| | Shares | | Value | |
Common Stocks — 99.8% (Continued) | | | |
Oil & Gas — 10.3% (Continued) | | | | | |
Pioneer Natural Resources Co. | | 1,349 | | $309,663
| |
Range Resources Corp. (1) | | 19,200 | | 622,272 | |
Southwestern Energy Co. (2) | | 76,940 | | 496,263 | |
Suncor Energy, Inc. | | 4,857 | | 166,984 | |
Valero Energy Corp. (1) | | 4,314 | | 611,337 | |
Weatherford International PLC (2) | 1,712 | | 154,645 | |
| | | | | | 14,070,224 | |
Oil & Gas Services — 0.7% | | | | | |
Baker Hughes Co. | | 5,334 | | 188,397 | |
ChampionX Corp. | | 11,314 | | 403,005 | |
Liberty Energy, Inc. | | 18,290 | | 338,731 | |
TechnipFMC PLC (1) | | 93 | | 1,891 | |
| | | | | | 932,024 | |
Packaging & Containers — 1.4% | | | |
Amcor PLC | | 22,973 | | 210,433 | |
AptarGroup, Inc. | | 158 | | 19,756 | |
Berry Global Group, Inc. | | 6,644 | | 411,330 | |
Graphic Packaging Holding Co. | | 13,561 | | 302,139 | |
Greif, Inc. - Class A | | 4,418 | | 295,167 | |
Packaging Corp of America | | 2,364 | | 362,992 | |
Sonoco Products Co. | | 6,595 | | 358,438 | |
| | | | | | 1,960,255 | |
Pharmaceuticals — 3.2% | | | | | |
AbbVie, Inc. | | 2,496 | | 372,054 | |
BellRing Brands, Inc. (2) | | 62 | | 2,556 | |
Bristol-Myers Squibb Co. | | 5,924 | | 343,829 | |
Cardinal Health, Inc. | | 959 | | 83,260 | |
Cencora, Inc. | | 621 | | 111,761 | |
CVS Health Corp. | | 7,626 | | 532,447 | |
Harmony Biosciences
Holdings, Inc. (1)(2) | | 2,819 | | 92,379 | |
Jazz Pharmaceuticals PLC (2) | | 3,731 | | 482,941 | |
Johnson & Johnson | | 1,772 | | 275,989 | |
McKesson Corp. | | 300 | | 130,455 | |
Merck & Co., Inc. | | 929 | | 95,641 | |
Option Care Health, Inc. (2) | | 5,390 | | 174,366 | |
Organon & Co. | | 2,747 | | 47,688 | |
Pfizer, Inc. | | 15,615 | | 517,950 | |
Prestige Consumer Healthcare, Inc. (2) | | 4,549 | | 260,157 | |
The Cigna Group | | 1,247 | | 356,729 | |
Viatris, Inc. | | 42,139 | | 415,491 | |
| | | | | | 4,295,693 | |
|
SCHEDULE OF INVESTMENTS at September 30, 2023 (Continued) |
The accompanying notes are an integral part of these financial statements.
|
SCHEDULE OF INVESTMENTS at September 30, 2023 (Continued) |
| | | | | | | |
| | Shares | | Value | |
Common Stocks — 99.8% (Continued) | | | |
Pipelines — 0.9% | | | | | |
Cheniere Energy, Inc. | | 4,198 | | $696,700
| |
Enbridge, Inc. | | 6,946 | | 230,538 | |
Equitrans Midstream Corp. | | 3,455 | | 32,373 | |
Kinder Morgan, Inc. | | 10,334 | | 171,338 | |
ONEOK, Inc. | | 2,491 | | 158,004 | |
| | | | | | 1,288,953 | |
Real Estate — 0.1% | | | | | |
Howard Hughes Holdings, Inc. (2) | 1,224 | | 90,735 | |
| | | | | | | |
Retail — 7.8% | | | | | |
Abercrombie & Fitch Co. (1)(2) | | 5,111 | | 288,107 | |
Academy Sports &
Outdoors, Inc. (1) | | 6,566 | | 310,375 | |
American Eagle Outfitters, Inc. | | 27,600 | | 458,436 | |
Asbury Automotive Group, Inc. (2) | 1,928 | | 443,575 | |
AutoNation, Inc. (1)(2) | | 3,299 | | 499,469 | |
AutoZone, Inc. (1)(2) | | 77 | | 195,579 | |
Beacon Roofing Supply, Inc. (2) | | 6,698 | | 516,885 | |
Best Buy Co., Inc. | | 4,321 | | 300,180 | |
BJ’s Wholesale Club Holdings, Inc. (2) | | 2,231 | | 159,226 | |
CarMax, Inc. (1)(2) | | 4,118 | | 291,266 | |
Casey’s General Stores, Inc. | | 52 | | 14,119 | |
Dick’s Sporting Goods, Inc. (1) | | 3,048 | | 330,952 | |
Dillard’s, Inc. - Class B (1) | | 1,221 | | 403,919 | |
Domino’s Pizza, Inc. | | 635 | | 240,532 | |
FirstCash Holdings, Inc. | | 1,165 | | 116,943 | |
GMS, Inc. (2) | | 5,916 | | 378,446 | |
Group 1 Automotive, Inc. (1) | | 887 | | 238,346 | |
Kohl’s Corp. | | 6,769 | | 141,878 | |
Lithia Motors, Inc. - Class B (1) | | 2,022 | | 597,157 | |
Lowe’s Companies, Inc. | | 1,592 | | 330,881 | |
Macy’s, Inc. (1) | | 14,385 | | 167,010 | |
McDonald’s Corp. | | 191 | | 50,317 | |
MSC Industrial Direct Co., Inc. - Class A | | 6,199 | | 608,432 | |
Murphy USA, Inc. (1) | | 1,553 | | 530,707 | |
Nordstrom, Inc. (1) | | 26,772 | | 399,974 | |
Ollie’s Bargain Outlet
Holdings, Inc. (1)(2) | | 1,403 | | 108,283 | |
O’Reilly Automotive, Inc. (2) | | 2 | | 1,818 | |
Penske Automotive Group, Inc. (1) | 669 | | 111,763 | |
Restaurant Brands
International, Inc. (1) | 2,778 | | 185,070 | |
RH (2) | | 386 | | 102,043 | |
The Gap, Inc. (1) | | 54,674 | | 581,185 | |
| | | | | | | |
| | Shares | | Value | |
Common Stocks — 99.8% (Continued) | | | |
Retail — 7.8% (Continued) | | | | | |
The Home Depot, Inc. | | 992 | | $299,743
| |
The TJX Companies, Inc. | | 1,094 | | 97,235 | |
The Wendy’s Co. | | 13,105 | | 267,473 | |
Ulta Beauty, Inc. (2) | | 681 | | 272,025 | |
Williams-Sonoma, Inc. (1) | | 2,813 | | 437,140 | |
Yum! Brands, Inc. | | 1,047 | | 130,812 | |
| | | | | | 10,607,301 | |
Savings & Loans — 0.2% | | | | | |
New York Community
Bancorp, Inc. | | 73 | | 828 | |
Pacific Premier Bancorp, Inc. | | 9,507 | | 206,872 | |
| | | | | | 207,700 | |
Semiconductors — 1.6% | | | | | |
Applied Materials, Inc. | | 2,272 | | 314,559 | |
Broadcom, Inc. | | 3 | | 2,492 | |
Diodes, Inc. (2) | | 4,750 | | 374,490 | |
IPG Photonics Corp. (2) | | 2,685 | | 272,635 | |
KLA Corp. | | 414 | | 189,885 | |
Lam Research Corp. | | 378 | | 236,919 | |
Microchip Technology, Inc. | | 3,226 | | 251,789 | |
NXP Semiconductors NV | | 177 | | 35,386 | |
ON Semiconductor Corp. (1)(2) | | 13 | | 1,208 | |
Qorvo, Inc. (2) | | 90 | | 8,592 | |
QUALCOMM, Inc. | | 546 | | 60,639 | |
Skyworks Solutions, Inc. | | 4,071 | | 401,360 | |
Teradyne, Inc. (1) | | 50 | | 5,023 | |
Texas Instruments, Inc. | | 20 | | 3,180 | |
| | | | | | 2,158,157 | |
Software — 1.2% | | | | | |
Broadridge Financial Solutions, Inc. | 126 | | 22,560 | |
Concentrix Corp. | | 6,560 | | 525,522 | |
Dropbox, Inc. - Class A (2) | | 3,370 | | 91,765 | |
Electronic Arts, Inc. | | 2,087 | | 251,275 | |
Paychex, Inc. | | 1,027 | | 118,444 | |
Salesforce, Inc. (2) | | 931 | | 188,788 | |
SS&C Technologies Holdings, Inc. | 6,718 | | 352,964 | |
Teradata Corp. (2) | | 107 | | 4,817 | |
Verra Mobility Corp. (2) | | 1,229 | | 22,982 | |
| | | | | | 1,579,117 | |
Telecommunications — 1.4% | | | | | |
AT&T, Inc. | | 26,609 | | 399,667 | |
Cisco Systems, Inc. | | 6,354 | | 341,591 | |
Extreme Networks, Inc. (2) | | 795 | | 19,247 | |
Juniper Networks, Inc. | | 11,767 | | 327,005 | |
The accompanying notes are an integral part of these financial statements.
| | | | | | | |
| | Shares | | Value | |
Common Stocks — 99.8% (Continued) | | | |
Telecommunications — 1.4% (Continued) | | | |
T-Mobile US, Inc. | | 3,272 | | $458,244
| |
Verizon Communications, Inc. | | 17,383 | | 563,383 | |
| | | | | | 2,109,137 | |
Toys, Games & Hobbies — 0.1% | | | |
Hasbro, Inc. | | 946 | | 62,569 | |
Mattel, Inc. (2) | | 613 | | 13,504 | |
| | | | | | 76,073 | |
Transportation — 3.8% | | | | | |
C.H. Robinson Worldwide, Inc. | | 7,046 | | 606,872 | |
Canadian National Railway Co. | | 1,527 | | 165,420 | |
CSX Corp. | | 9,805 | | 301,504 | |
Expeditors International of Washington, Inc. | | 5,074 | | 581,633 | |
FedEx Corp. | | 793 | | 210,081 | |
Forward Air Corp. | | 4,057 | | 278,878 | |
Hub Group, Inc. - Class A (2) | | 6,226 | | 488,990 | |
Knight-Swift Transportation Holdings, Inc. | | 1,837 | | 92,125 | |
Landstar System, Inc. | | 2,921 | | 516,842 | |
Matson, Inc. | | 5,981 | | 530,634 | |
Norfolk Southern Corp. | | 1,045 | | 205,792 | |
TFI International, Inc. | | 4,216 | | 541,377 | |
Union Pacific Corp. | | 890 | | 181,231 | |
United Parcel Service, Inc. - Class B | | 1,915 | | 298,491 | |
XPO, Inc. (1)(2) | | 3,006 | | 224,428 | |
| | | | | | 5,224,298 | |
Total Common Stocks | | | | | |
(Cost $132,848,846) | | | | 136,069,247 | |
| | | | | |
Short-Term Investments — 0.2% | | | |
| | | | | |
Money Market Funds — 0.2% | | | | | |
First American Government Obligations Fund, Class X, 5.261% (3) | | 209,917 | | 209,917 | |
| | | | | |
Total Short-Term Investments | | | | | |
(Cost $209,917) | | | | 209,917 | |
| | | | | |
| | | | | | | |
| | Shares | | Value | |
Investments Purchased with Collateral
from Securities Lending — 17.4% | |
Mount Vernon Liquid Assets Portfolio, LLC, 5.580% (3) | | 23,745,850 | | $23,745,850
| |
Total Investments Purchased with
Collateral from Securities Lending | | | |
(Cost $23,745,850) | | | | 23,745,850 | |
| | | | | | | |
Total Investments in Securities — 117.4% | | | |
(Cost $156,804,613) | | | | 160,025,014 | |
Liabilities in Excess of Other Assets — (17.4)% | | (23,672,013 | ) |
Total Net Assets — 100.0% | | | | $136,353,001
| |
SVSSubordinate Voting Shares
(1)This security or a portion of this security was out on loan as of September 30, 2023. Total loaned securities had a value of $23,045,287 or 16.9% of net assets as of September 30, 2023. The remaining contractual maturity of all of the securities lending transactions is overnight and continuous.
(2)Non-income producing security.
(3)The rate shown is the annualized seven-day effective yield as of September 30, 2023.
(4)Does not round to 0.1% or (0.1)%, as applicable.
|
SCHEDULE OF INVESTMENTS at September 30, 2023 (Continued) |
The accompanying notes are an integral part of these financial statements.
|
STATEMENTS OF ASSETS AND LIABILITIES at September 30, 2023 |
| | | | | |
| | Gotham
Enhanced 500
ETF | | Gotham
1000 Value
ETF | |
| | | | | |
Assets: | | | | | |
Investments in securities, at value (Cost $294,224,462 and $156,804,613, respectively) (Note 2) | | $299,879,908
| (1) | $160,025,014
| (2) |
Cash | | 182 | | 223,747 | |
Receivables: | | | | | |
Investment securities sold | | 3,468,059 | | 3,181,538 | |
Dividends and interest receivable | | 247,342 | | 146,863 | |
Securities lending income, net (Note 5) | | 1,473 | | 6,824 | |
Total assets | | 303,596,964 | | 163,583,986 | |
| | | | | |
Liabilities: | | | | | |
Collateral received for securities loaned (Note 5) | | 6,470,612 | | 23,745,850 | |
Payables: | | | | | |
Investment securities purchased | | 3,512,053 | | 1,410,822 | |
Fund shares redeemed | | — | | 2,016,640 | |
Management fees (Note 4) | | 124,124 | | 57,673 | |
Total liabilities | | 10,106,789 | | 27,230,985 | |
Net Assets | | $293,490,175
| | $136,353,001
| |
| | | | | |
Components of Net Assets: | | | | | |
Paid-in capital | | $308,481,806
| | $134,158,742
| |
Total distributable (accumulated) earnings (losses) | | (14,991,631 | ) | 2,194,259 | |
Net assets | | $293,490,175
| | $136,353,001
| |
| | | | | |
Net Asset Value (unlimited shares authorized): | | | | | |
Net assets | | $293,490,175
| | $136,353,001
| |
Shares of beneficial interest issued and outstanding | | 12,375,000 | | 6,800,000 | |
Net asset value | | $23.72
| | $20.05
| |
(1)Includes loaned securities with a value of $6,314,257.
(2)Includes loaned securities with a value of $23,045,287.
The accompanying notes are an integral part of these financial statements.
| | | | | |
| | Gotham
Enhanced 500
ETF | | Gotham
1000 Value
ETF | |
| | | | | |
Investment Income: | | | | | |
Dividend income (net of witholding tax of $2,348 and $39,915, respectively | | $5,197,016
| | $2,474,229
| |
Securities lending income, net (Note 5) | | 27,135 | | 66,510 | |
Interest income | | 17,336 | | 6,832 | |
Total investment income | | 5,241,487 | | 2,547,571 | |
| | | | | |
Expenses: | | | | | |
Management fees (Note 4) | | 1,876,747 | | 725,146 | |
Total expenses | | 1,876,747 | | 725,146 | |
Less: Management fee waiver (Note 4) | | (433,095 | ) | (167,341 | ) |
Net expenses | | 1,443,652 | | 557,805 | |
Net investment income (loss) | | 3,797,835 | | 1,989,766 | |
| | | | | |
Realized and Unrealized Gain (Loss): | | | | | |
Net realized gain (loss): | | | | | |
Investments | | 1,696,811 | | 2,212,161 | |
Foreign currency transactions | | — | | (54 | ) |
Change in net unrealized appreciation/depreciation on: | | | | | |
Investments | | 49,766,835 | | 6,866,544 | |
Net realized and unrealized gain (loss) on investments | | 51,463,646 | | 9,078,651 | |
Net increase (decrease) in net assets resulting from operations | | $55,261,481
| | $11,068,417
| |
|
STATEMENTS OF OPERATIONS For the Year Ended September 30, 2023 |
The accompanying notes are an integral part of these financial statements.
| | | | | |
| | Year Ended
September 30,
2023 | | Year Ended
September 30,
2022 | |
| | | | | |
Increase (Decrease) in Net Assets From: | | | | | |
| | | | | |
Operations: | | | | | |
Net investment income (loss) | | $3,797,835
| | $2,778,084
| |
Net realized gain (loss) | | 1,696,811 | | (9,445,576 | ) |
Change in net unrealized appreciation/depreciation | | 49,766,835 | | (44,142,309 | ) |
Net increase (decrease) in net assets resulting from operations | | 55,261,481 | | (50,809,801 | ) |
| | | | | |
Distributions to Shareholders: | | | | | |
Net distributions to shareholders | | (3,481,219 | ) | (616,760 | ) |
| | | | | |
Capital Share Transactions: | | | | | |
Net increase (decrease) in net assets derived from net change in outstanding shares(1) | | (20,553,987 | ) | 225,891,940 | |
Total increase (decrease) in net assets | | 31,226,275 | | 174,465,379 | |
| | | | | |
Net Assets: | | | | | |
Beginning of year | | 262,263,900 | | 87,798,521 | |
End of year | | $293,490,175
| | $262,263,900
| |
(1)Summary of share transactions is as follows:
| | | | | | | | | |
| | Year Ended
September 30, 2023 | | Year Ended
September 30, 2022 | |
| | Shares | | Value | | Shares | | Value | |
Shares sold | | 1,400,000 | | $33,201,310
| | 9,525,000 | | $225,891,940
| |
Shares redeemed | | (2,350,000 | ) | (53,755,310 | ) | — | | — | |
Variable fees | | | | 13 | | | | — | |
Net increase (decrease) | | (950,000 | ) | $(20,553,987
| ) | 9,525,000 | | $225,891,940
| |
|
STATEMENTS OF CHANGES IN NET ASSETS |
The accompanying notes are an integral part of these financial statements.
|
STATEMENTS OF CHANGES IN NET ASSETS |
| | | | | |
| | Year Ended
September 30,
2023 | | Period Ended
September 30,
2022(1) | |
| | | | | |
Increase (Decrease) in Net Assets From: | | | | | |
| | | | | |
Operations: | | | | | |
Net investment income (loss) | | $1,989,766
| | $147,651
| |
Net realized gain (loss) | | 2,212,107 | | (316,005 | ) |
Change in net unrealized appreciation/depreciation | | 6,866,544 | | (3,646,140 | ) |
Net increase (decrease) in net assets resulting from operations | | 11,068,417 | | (3,814,494 | ) |
| | | | | |
Distributions to Shareholders: | | | | | |
Net distributions to shareholders | | (432,542 | ) | — | |
| | | | | |
Capital Share Transactions: | | | | | |
Net increase (decrease) in net assets derived from net change in outstanding shares (2) | | 92,348,935 | | 37,182,685 | |
Total increase (decrease) in net assets | | 102,984,810 | | 33,368,191 | |
| | | | | |
Net Assets: | | | | | |
Beginning of year/period | | 33,368,191 | | — | |
End of year/period | | $136,353,001
| | $33,368,191
| |
(1)The Fund commenced operations on June 7, 2022. The information presented is from June 7, 2022 to September 30, 2022.
(2)Summary of share transactions is as follows:
| | | | | | | | | |
| | Year Ended
September 30, 2023 | | Period Ended
September 30, 2022 (1) | |
| | Shares | | Value | | Shares | | Value | |
Shares sold | | 5,750,000 | | $111,175,695
| | 2,000,000 | | $37,182,555
| |
Shares redeemed | | (950,000 | ) | (18,826,760 | ) | — | | — | |
Variable fees | | — | | — | | — | | 130 | |
Net increase (decrease) | | 4,800,000 | | $92,348,935
| | 2,000,000 | | $37,182,685
| |
The accompanying notes are an integral part of these financial statements.
| | | | | | | |
| | Year Ended
September 30, 2023 | | Year Ended
September 30, 2022 | | Period Ended
September 30, 2021(1) | |
| | | | | | | |
Net asset value, beginning of year/period | | $19.68
| | $23.10
| | $20.00
| |
| | | | | | | |
Income (Loss) from Investment Operations: | | | | | | | |
Net investment income (loss)(2) | | 0.30 | | 0.28 | | 0.19 | |
Net realized and unrealized gain (loss) on investments(3) | | 4.00 | | (3.64 | ) | 2.91 | |
Total from investment operations | | 4.30 | | (3.36 | ) | 3.10 | |
| | | | | | | |
Less Distributions: | | | | | | | |
From net investment income | | (0.26 | ) | (0.06 | ) | — | |
Total distributions | | (0.26 | ) | (0.06 | ) | — | |
| | | | | | | |
Net asset value, end of year/period | | $23.72
| | $19.68
| | $23.10
| |
Total Return(5) | | 22.01 | % | (14.62 | )% | 15.53 | %(4) |
| | | | | | | |
Rations/ Supplemental Data: | | | | | | | |
Net assets, end of period/year (millions) | | $293.5
| | $262.3
| | $87.8
| |
Portfolio turnover rate(6) | | 134% | | 59 | % | 36% | (4) |
Ratio of expenses to average net assets | | | | | | | |
Before management fees waived | | 0.65% | | 0.65 | % | 0.65% | (7) |
After management fees waived | | 0.50% | | 0.50 | % | 0.50% | (7) |
Ratio of net investment income (loss) to average net assets | | | | | | | |
Before management fees waived | | 1.17% | | 1.05 | % | 0.92% | (7) |
After management fees waived | | 1.32% | | 1.20 | % | 1.07% | (7) |
(1)The Fund commenced operations on December 28, 2020. The information presented is from December 28, 2020 to September 30, 2021.
(2)Calculated using average shares outstanding method.
(3)Net realized and unrealized gain (loss) per share in the caption are balancing amounts necessary to reconcile the change in the net asset value per share for the period, and may not reconcile with the aggregate gain (loss) in the Statement of Operations due to share transactions for the period.
(4)Not annualized.
(5)The total return is based on the Fund’s net asset value. Additional performance information is presented in the Performance Summary.
(6)Excludes the impact of in-kind transactions.
(7)Annualized.
The accompanying notes are an integral part of these financial statements.
| | | | | |
| | Year Ended
September 30, 2023 | | Period Ended
September 30,
2022(1) | |
| | | | | |
Net asset value, beginning of year/period | | $16.68
| | $20.00
| |
| | | | | |
Income (Loss) from Investment Operations: | | | | | |
Net investment income (loss)(2) | | 0.35 | | 0.13 | |
Net realized and unrealized gain (loss) on investments(3) | | 3.20 | | (3.45 | ) |
Total from investment operations | | 3.55 | | (3.32 | ) |
| | | | | |
Less Distributions: | | | | | |
From net investment income | | (0.18 | ) | — | |
Total distributions | | (0.18 | ) | — | |
| | | | | |
Net asset value, end of year/period | | $20.05
| | $16.68
| |
Total Return(5) | | 21.37 | % | (16.58 | )%(4) |
| | | | | |
Rations/ Supplemental Data: | | | | | |
Net assets, end of period (millions) | | $136.4
| | $33.4
| |
Portfolio turnover rate(6) | | 155 | % | 52 | %(4) |
Ratio of expenses to average net assets | | | | | |
Before management fees waived | | 0.65 | % | 0.65 | %(7) |
After management fees waived | | 0.50 | % | 0.50 | %(7) |
Ratio of net investment income (loss) to average net assets | | | | | |
Before management fees waived | | 1.63 | % | 2.07 | %(7) |
After management fees waived | | 1.78 | % | 2.22 | %(7) |
(1)The Fund commenced operations on June 7, 2022. The information presented is from June 7, 2022 to September 30, 2022.
(2)Calculated using average shares outstanding method.
(3)Net realized and unrealized gain (loss) per share in the caption are balancing amounts necessary to reconcile the change in the net asset value per share for the period, and may not reconcile with the aggregate gain (loss) in the Statement of Operations due to share transactions for the period.
(4)Not annualized.
(5)The total return is based on the Fund’s net asset value. Additional performance information is presented in the Performance Summary.
(6)Excludes the impact of in-kind transactions.
(7)Annualized.
The Gotham Enhanced 500 ETF and Gotham 1000 Value ETF are each diversified series of shares (each, a “Fund,” and collectively, the “Funds”) of beneficial interest of Tidal ETF Trust (the “Trust”). The Trust was organized as a Delaware statutory trust on June 4, 2018 and is registered with the Securities and Exchange Commission (the “SEC”) under the Investment Company Act of 1940, as amended (the “1940 Act”), as an open-end management investment company and the offering of each Fund’s shares is registered under the Securities Act of 1933, as amended. The Trust is governed by the Board of Trustees (the “Board”). Tidal Investments LLC (f/k/a Toroso Investments, LLC) (“Tidal Investments” or the “Adviser”), a Tidal Financial Group company, serves as investment adviser to the Funds and Gotham Asset Management, LLC (“Gotham” or the “Sub-Adviser”) serves as investment sub-adviser to the Funds. Each Fund is an investment company and accordingly follows the investment company accounting and reporting guidance of the Financial Accounting Standards Board (“FASB”) Accounting Standard Codification Topic 946 “Financial Services—Investment Companies.” The Gotham Enhanced 500 ETF commenced operations on December 28, 2020 and the Gotham 1000 Value ETF commenced operations on June 7, 2022.
The investment objective of each Fund is to seek long-term capital appreciation.
|
Note 2 – Significant Accounting Policies |
The following is a summary of significant accounting policies consistently followed by the Funds. These policies are in conformity with accounting principles generally accepted in the United States of America (“U.S. GAAP”).
A.Security Valuation. Equity securities, which may include Real Estate Investment Trusts (“REITs”), Business Development Companies (“BDCs”), and Master Limited Partnerships (“MLPs”), listed on a securities exchange, market or automated quotation system for which quotations are readily available (except for securities traded on the NASDAQ Stock Market, LLC (“NASDAQ”)), including securities traded over the counter, are valued at the last quoted sale price on the primary exchange or market (foreign or domestic) on which they are traded on the valuation date (or at approximately 4:00 p.m. EST if a security’s primary exchange is normally open at that time), or, if there is no such reported sale on the valuation date, at the most recent quoted bid price or mean between the most recent quoted bid and ask prices for long and short positions. For a security that trades on multiple exchanges, the primary exchange will generally be considered the exchange on which the security is generally most actively traded. For securities traded on NASDAQ, the NASDAQ Official Closing Price will be used. Prices of securities traded on the securities exchange will be obtained from recognized independent pricing agents (“Independent Pricing Agents”) each day that the Funds are open for business.
Options are valued at the last quoted sales price. If there is no such reported sale on the valuation date, both long and short positions are valued at the mean between the most recent quoted bid and ask prices.
Under Rule 2a-5 of the 1940 Act, a fair value will be determined for securities for which quotations are not readily available by the Valuation Designee (as defined in Rule 2a-5) in accordance with the Pricing and Valuation Policy and Fair Value Procedures, as applicable, of the Adviser, subject to oversight by the Board. When a security is “fair valued,” consideration is given to the facts and circumstances relevant to the particular situation, including a review of various factors set forth in the Adviser’s Pricing and Valuation Policy and Fair Value Procedures, as applicable. Fair value pricing is an inherently subjective process, and no single standard exists for determining fair value. Different funds could reasonably arrive at different values for the same security. The use of fair value pricing by a Fund may cause the net asset value (“NAV”) of its shares to differ significantly from the NAV that would be calculated without regard to such considerations.
As described above, the Funds utilize various methods to measure the fair value of their investments on a recurring basis. U.S. GAAP establishes a hierarchy that prioritizes inputs to valuation methods. The three levels of inputs are:
Level 1 – Unadjusted quoted prices in active markets for identical assets or liabilities that the Funds have the ability to access.
Level 2 –
Observable inputs other than quoted prices included in Level 1 that are observable for the asset or liability, either directly or indirectly. These inputs may include quoted prices for the identical instrument on an inactive market, prices for similar instruments, interest rates, prepayment speeds, credit risk, yield curves, default rates and similar data.
|
NOTES TO FINANCIAL STATEMENTS September 30, 2023 |
|
NOTES TO FINANCIAL STATEMENTS September 30, 2023 (Continued) |
Level 3 –
Unobservable inputs for the asset or liability, to the extent relevant observable inputs are not available; representing the Funds’ own assumptions about the assumptions a market participant would use in valuing the asset or liability and would be based on the best information available.
The availability of observable inputs can vary from security to security and is affected by a wide variety of factors, including, for example, the type of security, whether the security is new and not yet established in the marketplace, the liquidity of markets, and other characteristics particular to the security. To the extent that valuation is based on models or inputs that are less observable or unobservable in the market, the determination of fair value requires more judgment. Accordingly, the degree of judgment exercised in determining fair value is greatest for instruments categorized in Level 3.
The inputs used to measure fair value may fall into different levels of the fair value hierarchy. In such cases, for disclosure purposes, the level in the fair value hierarchy within which the fair value measurement falls in its entirety, is determined based on the lowest level input that is significant to the fair value measurement in its entirety.
The following is a summary of the inputs used to value each Fund’s investments as of September 30, 2023:
Gotham Enhanced 500 ETF
| | | | | | | | | | |
Investments in Securities | | Investments
Measured at
Net Asset Value | | Level 1 | | Level 2 | | Level 3 | | Total |
Common Stocks (1) | | $—
| | $292,956,452
| | $—
| | $—
| | $292,956,452
|
Short-Term Investments | | — | | 452,844 | | — | | — | | 452,844 |
Investments Purchased With Collateral From Securities Lending (2) | | 6,470,612 | | — | | — | | — | | 6,470,612 |
Total Investments in Securities | | $6,470,612
| | $293,409,296
| | $—
| | $—
| | $299,879,908
|
Gotham 1000 Value ETF
| | | | | | | | | | |
Investments in Securities | | Investments
Measured at
Net Asset Value | | Level 1 | | Level 2 | | Level 3 | | Total |
Common Stocks (1) | | $—
| | $136,069,247
| | $—
| | $—
| | $136,069,247
|
Short-Term Investments | | — | | 209,917 | | — | | — | | 209,917 |
Investments Purchased With Collateral From Securities Lending (2) | | 23,745,850 | | — | | — | | — | | 23,745,850 |
Total Investments in Securities | | $23,745,850
| | $136,279,164
| | $—
| | $—
| | $160,025,014
|
(1)See Schedule of Investments for the industry breakout.
(2)Certain investments that are measured at fair value using the net asset value per share (or its equivalent) practical expedient have not been categorized in the fair value hierarchy. The fair value amounts presented in the table are intended to permit reconciliation of the fair value hierarchy to the amounts presented in the Schedule of Investments.
B.Federal Income Taxes. Each Fund has elected to be taxed as a “regulated investment company” and intends to distribute substantially all taxable income to its shareholders and otherwise comply with the provisions of the Internal Revenue Code applicable to regulated investment companies. Therefore, no provision for federal income taxes or excise taxes has been made.
In order to avoid imposition of the excise tax applicable to regulated investment companies, each Fund intends to declare as dividends in each calendar year at least 98.0% of its net investment income (earned during the calendar year) and at least 98.2% of its net realized capital gains (earned during the twelve months ended October 31) plus undistributed amounts, if any, from prior years.
|
NOTES TO FINANCIAL STATEMENTS September 30, 2023 (Continued) |
As of September 30, 2023, the Funds did not have any tax positions that did not meet the threshold of being sustained by the applicable tax authority. Generally, tax authorities can examine all the tax returns filed for the last three years. Each Fund identifies its major tax jurisdiction as U.S. Federal and the Commonwealth of Delaware; however, the Funds are not aware of any tax positions for which it is reasonably possible that the total amounts of unrecognized tax benefits will change materially.
C.Securities Transactions and Investment Income. Investment securities transactions are accounted for on the trade date. Gains and losses realized on sales of securities are determined on a specific identification basis. Discounts/premiums on debt securities purchased are accreted/amortized over the life of the respective securities using the effective interest method. Dividend income is recorded on the ex-dividend date. Debt income is recorded on an accrual basis. Other non-cash dividends are recognized as investment income at the fair value of the property received. Withholding taxes on foreign dividends have been provided for in accordance with the Trust’s understanding of the applicable country’s tax rules and rates. If a Fund’s distributions exceed its earnings and profits, all or a portion of the distributions made for a taxable year may be recharacterized as a return of capital to shareholders. A return of capital distribution will generally not be taxable but will reduce each shareholder’s cost basis in a Fund and result in a higher capital gain or lower capital loss when the shares of a Fund (“Shares”) on which the distribution was received are sold. After a shareholder’s basis in the Shares has been reduced to zero, distributions in excess of earnings and profits will be treated as gain from the sale of the shareholder’s Shares.
A REIT is a corporation or business trust (that would otherwise be taxed as a corporation) which meets the definitional requirements of the Internal Revenue Code of 1986, as amended (the “Code”). The Code permits a qualifying REIT to deduct from taxable income the dividends paid, thereby effectively eliminating corporate level federal income tax. To meet the definitional requirements of the Code, a REIT must, among other things: invest substantially all of its assets in interests in real estate (including mortgages and other REITs), cash and government securities; derive most of its income from rents from real property or interest on loans secured by mortgages on real property; and, in general, distribute annually 90% or more of its taxable income (other than net capital gains) to shareholders.
D.Foreign Currency. Investment securities and other assets and liabilities denominated in foreign currencies are translated into U.S. dollar amounts at the date of valuation. Purchases and sales of investment securities and income and expense items denominated in foreign currencies are translated into U.S. dollar amounts on the respective dates of such transactions.
The Funds do not isolate that portion of the results of operations resulting from changes in foreign exchange rates on investments from the fluctuations arising from changes in market prices of securities held. Such fluctuations are included with the net realized and unrealized gain or loss from investments.
The Funds report net realized foreign exchange gains or losses that arise from sales of foreign currencies, currency gains or losses realized between the trade and settlement dates on securities transactions, and the difference between the amounts of dividends, interest, and foreign withholding taxes recorded on the Funds’ books and the U.S. dollar equivalent of the amounts actually received or paid. Net unrealized foreign exchange gains and losses arise from changes in the fair values of assets and liabilities, other than investments in securities at period end, resulting from changes in exchange rates.
E.Distributions to Shareholders. Distributions to shareholders from net investment income, if any, for the Funds are declared and paid at least annually. Distributions to shareholders from net realized gains on securities, if any, for the Funds normally are declared and paid on an annual basis. Distributions are recorded on the ex-dividend date.
F.Use of Estimates. The preparation of financial statements in conformity with U.S. GAAP requires management to make estimates and assumptions that affect the reported amounts of assets and liabilities and disclosure of contingent assets and liabilities at the date of the financial statements and the reported amounts of increases and decreases in net assets from operations during the reporting period. Actual results could differ from those estimates.
G.Share Valuation. The NAV per share of each Fund is calculated by dividing the sum of the value of the securities held by each Fund, plus cash or other assets, minus all liabilities by the total number of shares outstanding for each Fund, rounded to the nearest cent. Each Fund’s shares will not be priced on the days on which the New York Stock Exchange (“NYSE”) is closed for trading.
H.Guarantees and Indemnifications. In the normal course of business, the Funds enter into contracts with service providers that contain general indemnification clauses. The Funds’ maximum exposure under these arrangements is unknown as this would involve future claims that may be made against the Funds that have not yet occurred. However, based on experience, the Funds expect the risk of loss to be remote.
|
NOTES TO FINANCIAL STATEMENTS September 30, 2023 (Continued) |
I.Illiquid Securities. Pursuant to Rule 22e-4 under the 1940 Act, the Funds have adopted a Board-approved Liquidity Risk Management Program (the “Program”) that requires, among other things, that each Fund limit its illiquid investments that are assets to no more than 15% of the value of each Fund’s net assets. An illiquid investment is any security that a Fund reasonably expects cannot be sold or disposed of in current market conditions in seven calendar days or less without the sale or disposition significantly changing the market value of the investment. If either Fund should be in a position where the value of illiquid investments held by a Fund exceeds 15% of that Fund’s net assets, that Fund will take such steps as set forth in the Program.
J.Recently Issued Accounting Pronouncements.
•In June 2022, the FASB issued Accounting Standards Update 2022-03, which amends Fair Value Measurement (Topic 820): Fair Value Measurement of Equity Securities Subject to Contractual Sale Restrictions (“ASU 2022-03”). ASU 2022-03 clarifies guidance for fair value measurement of an equity security subject to a contractual sale restriction and establishes new disclosure requirements for such equity securities. ASU 2022-03 is effective for fiscal years beginning after December 15, 2023 and for interim periods within those fiscal years, with early adoption permitted. Management is currently evaluating the impact, if any, of these amendments on the financial statements.
•In December 2022, the FASB issued an Accounting Standards Update, ASU 2022- 06, Reference Rate Reform (Topic 848) – Deferral of the Sunset Date of Topic 848 (“ASU 2022-06). ASU 2022-06 is an amendment to ASU 2020-04, which provided optional guidance to ease the potential accounting burden due to the discontinuation of the LIBOR and other interbank-offered based reference rates and which was effective as of March 12, 2020 through December 31, 2022. ASU 2022-06 extends the effective period through December 31, 2024. The Funds are currently evaluating the impact, if any, of applying ASU 2022-06.
K.Reclassification of Capital Accounts. U.S. GAAP requires that certain components of net assets relating to permanent differences be reclassified between financial and tax reporting. These reclassifications have no effect on net assets or NAV per share. These differences are primarily due to adjustments for redemptions in-kind. For the period year September 30, 2023, the following table shows the reclassifications made.
| | | | |
| | Paid-In Capital | | Total Distributable (Accumulated) Earnings (Losses) |
Gotham Enhanced 500 ETF | | $15,513,368 | | $(15,513,368) |
Gotham 1000 Value ETF | | $4,627,122 | | $(4,627,122) |
During the year ended September 30, 2023, the Gotham Enhanced 500 ETF realized $15,513,368, and the Gotham 1000 Value ETF realized $4,627,122, in net capital gains resulting from in-kind redemptions, in which Authorized Participants exchange Fund shares for securities held by the Funds rather than for cash. Because such losses are not taxable to the Funds, and are not distributed to shareholders, they have been reclassified from accumulated gains to paid-in capital.
L.Other Regulatory Matters. In October 2022, the Securities and Exchange Commission (the “SEC”) adopted a final rule relating to Tailored Shareholder Reports for Mutual Funds and Exchange-Traded Funds; Fee information in Investment Company Advertisements. The rule and form amendments will, among other things, require the funds to transmit concise and visually engaging shareholder reports that highlight key information. The amendments will require that funds tag information in a structured data format and that certain more in-depth information be made available online and available for delivery free of charge to investors on request. The amendments became effective January 24, 2023. There is an 18-month transition period after the effective date of the amendment.
|
Note 3 – Principal Investment Risks |
A.Equity Market Risk. The equity securities held in each Fund’s portfolio may experience sudden, unpredictable drops in value or long periods of decline in value. This may occur because of factors that affect securities markets generally or factors affecting specific issuers, industries, or sectors in which the Funds invest. Common stocks, such as those held by the Funds, are generally exposed to greater risk than other types of securities, such as preferred stock and debt obligations, because common stockholders generally have inferior rights to receive payment from issuers. Securities in each Fund’s portfolio may underperform in
|
NOTES TO FINANCIAL STATEMENTS September 30, 2023 (Continued) |
comparison to securities in the general financial markets, a particular financial market, or other asset classes, due to a number of factors. Factors that could impact the market value of an equity security include a company’s business performance, investor perceptions, stock market trends and general economic conditions.
B.General Market Risk. Securities markets and individual securities may increase or decrease in value. Security prices may fluctuate widely over short or extended periods in response to market or economic news and conditions, and securities markets also tend to move in cycles. If there is a general decline in the securities markets, it is possible your investment may lose value regardless of the individual results of the companies in which the Funds invest. The magnitude of up and down price or market fluctuations over time is sometimes referred to as “volatility”, and it can be significant. In addition, different asset classes and geographic markets may experience periods of significant correlation with each other. As a result of this correlation, the securities and markets in which the Funds invest may experience volatility due to market, economic, political or social events and conditions that may not readily appear to directly relate to such securities, the securities’ issuer or the markets in which they trade.
C.Value Style Risk. The Sub-Adviser intends to buy securities, on behalf of the Funds, that it believes are undervalued. Investing in “value” stocks presents the risk that the stocks may never reach what the Sub-Adviser believes are their full market values, either because the market fails to recognize what the Sub-Adviser considers to be the companies’ true business values or because the Sub-Adviser misjudges those values. In addition, value stocks may fall out of favor with investors and underperform other stocks (such as growth stocks) during given periods. The Funds’ performance may be negatively affected if the Sub-Adviser determines (or otherwise needs) to sell a value stock before the market recognizes the stock’s full value.
D.Database Error Risk. The investment strategies used by the Sub-Adviser, rely on proprietary databases and third-party data sources. Data entries made by the Sub-Adviser’s team of financial analysts or third parties may contain errors, as may the database system used to store such data. Any errors in the underlying data sources, data entry or database may result in the Funds acquiring or selling investments based on incorrect information.
E.Systems Risk. The Funds depend on the Sub-Adviser to develop and implement appropriate systems to provide sub-advisory services. The Sub-Adviser relies extensively on computer programs and systems to implement and monitor each Fund’s investment strategy. As a result, there is a risk of human or technological errors affecting the portfolio construction process and order origination, including errors in programming (e.g., “bugs” and classic coding errors), modeling, design, translational errors and compatibility issues with data sets and among systems. There can be no guarantee that such defects or issues will be identified in time to avoid a material adverse effect on the Funds.
F.High Portfolio Turnover Risk. The Funds may actively and frequently trade all or a significant portion of the securities in its portfolio. A high portfolio turnover rate increases transaction costs, which may increase each Fund’s expenses. Frequent trading may also cause adverse tax consequences for investors in the Funds due to an increase in short-term capital gains.
G.Large-Capitalization Investing Risk The securities of large-capitalization companies may be relatively mature compared to smaller companies and therefore subject to slower growth during times of economic expansion. Large-capitalization companies may also be unable to respond quickly to new competitive challenges, such as changes in technology and consumer tastes.
H.Mid-Capitalization Investing Risk (Gotham 1000 Value ETF Only). The securities of mid-capitalization companies may be more vulnerable to adverse issuer, market, political, or economic developments than securities of large-capitalization companies. The securities of mid-capitalization companies generally trade in lower volumes and are subject to greater and more unpredictable price changes than large-capitalization stocks or the stock market as a whole.
I.Management Risk. The Funds are actively-managed and may not meet their investment objectives based on the Sub-Adviser’s success or failure to implement investment strategies for the Funds.
J.Exchanged Traded Fund (“ETF”) Risks.
•Authorized Participants, Market Makers, and Liquidity Providers Concentration Risk. The Trust is registered with the U.S. Securities and Exchange Commission (“SEC”) under the Investment Company Act of 1940, as amended (together with the rules and regulations adopted thereunder, as amended, the “1940 Act”), as an open-end management investment company and the offering of each Fund’s shares (“Shares”) is registered under the Securities Act of 1933, as amended (the “Securities Act”).The Funds have a limited number of financial institutions that are authorized to purchase and redeem Shares directly from the Funds (known as “Authorized Participants” or “APs”).In addition, there may be a limited number of market
|
NOTES TO FINANCIAL STATEMENTS September 30, 2023 (Continued) |
makers and/or liquidity providers in the marketplace. To the extent either of the following events occur, Shares may trade at a material discount to NAV and possibly face delisting: (i) APs exit the business or otherwise become unable to process creation and/or redemption orders and no other APs step forward to perform these services; or (ii) market makers and/or liquidity providers exit the business or significantly reduce their business activities and no other entities step forward to perform their functions.
•Costs of Buying or Selling Shares. Due to the costs of buying or selling Shares, including brokerage commissions imposed by brokers and bid-ask spreads, frequent trading of Shares may significantly reduce investment results and an investment in Shares may not be advisable for investors who anticipate regularly making small investments.
•Shares May Trade at Prices Other Than NAV. As with all ETFs, Shares may be bought and sold in the secondary market at market prices. Although it is expected that the market price of Shares will approximate a Fund’s NAV, there may be times when the market price of Shares is more than the NAV intra-day (premium) or less than the NAV intra-day (discount) due to supply and demand of Shares or during periods of market volatility. This risk is heightened in times of market volatility, periods of steep market declines, and periods when there is limited trading activity for Shares in the secondary market, in which case such premiums or discounts may be significant.
•Trading. Shares are listed on the NYSE Arca, Inc. (the “Exchange”), and although Shares may be traded on U.S. exchanges other than the Exchange, there can be no assurance that Shares will trade with any volume, or at all, on any stock exchange. In stressed market conditions, the liquidity of Shares may begin to mirror the liquidity of the Funds’ underlying portfolio holdings, which can be significantly less liquid than Shares.
|
Note 4 – Commitments and Other Related Party Transactions |
The Adviser serves as investment adviser to the Funds pursuant to an investment advisory agreement between the Adviser and the Trust, on behalf of the Funds (the “Advisory Agreement”), and, pursuant to the Advisory Agreement, provides investment advice to the Funds and oversees the day-to-day operations of the Funds, subject to oversight of the Board. The Adviser provides oversight of the Sub-Adviser (defined below) and review of the Sub-Adviser’s performance. The Adviser is also responsible for trading portfolio securities for the Funds, including selecting broker-dealers to execute purchase and sale transactions, subject to supervision of the Board.
Pursuant to the Advisory Agreement, each Fund pays the Adviser a unitary management fee (the “Management Fee”) based on the average daily net assets of the Funds as follows:
| | | | |
Fund | | Management Fee | | Management Fee
After Waiver |
Gotham Enhanced 500 ETF | | 0.65% | | 0.50% |
Gotham 1000 Value ETF | | 0.65% | | 0.50% |
The Adviser has contractually agreed to a reduced unitary Management Fee for the Gotham Enhanced 500 ETF and the Gotham 1000 Value ETF to 0.50% until at least January 31, 2025 (the “Fee Waiver Agreements”). The Fee Waiver Agreements may be terminated only by, or with the consent of, the Board. Any waived Management Fees are not able to be recouped by the Adviser under the Fee Waiver Agreements. Management Fees for the year ended September 30, 2023 are disclosed in the Statements of Operations.
Out of each Management Fee, the Adviser is obligated to pay or arrange for the payment of substantially all expenses of the Funds, including the cost of transfer agency, custody, fund administration, and all other related services necessary for the Funds to operate. Under the Advisory Agreement, the Adviser has agreed to pay all expenses incurred by the Funds except for interest charges on any borrowings, dividends and other expenses on securities sold short, taxes, brokerage commissions and other expenses incurred in placing orders for the purchase and sale of securities and other investment instruments, acquired fund fees and expenses, accrued deferred tax liability, extraordinary expenses, distribution fees and expenses paid by the Funds under any distribution plan adopted pursuant to Rule 12b-1 under the 1940 Act (collectively, “Excluded Expenses”).The Management Fees incurred are paid monthly to the Adviser.
The Sub-Adviser serves as sub-adviser to the Funds, pursuant to a sub-advisory agreement between the Adviser and the Sub-Adviser with respect to the Funds (the “Sub-Advisory Agreement”). Pursuant to the Sub-Advisory Agreement, the Sub-Adviser is responsible for responsible for the day-to-day management of the Funds’ portfolios, including determining the securities purchased and sold by the Funds, subject to the supervision of the Adviser and the Board. The Sub-Adviser is paid a fee by the Adviser, which is calculated and paid monthly, at an annual rate of 0.50% of each Fund’s average daily net assets.
|
NOTES TO FINANCIAL STATEMENTS September 30, 2023 (Continued) |
Under the Sub-Advisory Agreement, the Sub-Adviser has agreed to assume the Adviser’s obligation to pay all expenses incurred by the Funds except for the sub-advisory fee payable to the Sub-Adviser and Excluded Expenses. Such expenses incurred by the Funds and paid by the Sub-Adviser include fees charged by Tidal (defined below), which is the Funds’ administrator and an affiliate of the Adviser. For assuming the payment obligations for the Funds, the Adviser has agreed to pay the Sub-Adviser the profits, if any, generated by the each Fund’s Management Fee.
Tidal ETF Services LLC (“Tidal”), a Tidal Financial Group company and an affiliate of the Adviser, serves as the Funds’ administrator and, in that capacity, performs various administrative and management services for the Funds. Tidal coordinates the payment of Fund-related expenses and manages the Trust’s relationships with its various service providers.
U.S. Bancorp Fund Services, LLC, doing business as U.S. Bank Global Fund Services (“Fund Services”), serves as the Funds’ sub-administrator, fund accountant and transfer agent. In those capacities, Fund Services performs various administrative and accounting services for the Funds. Fund Services prepares various federal and state regulatory filings, reports and returns for the Funds, including regulatory compliance monitoring and financial reporting; prepares reports and materials to be supplied to the Board; and monitors the activities of the Funds’ custodian. U.S. Bank N.A. (the “Custodian”), an affiliate of Fund Services, serves as the Funds’ custodian. The Custodian acts as the securities lending agent for each of the Funds.
Foreside Fund Services, LLC (the “Distributor”) acts as the Funds’ principal underwriter in a continuous public offering of the Funds’ shares.
Certain officers and a trustee of the Trust are affiliated with the Adviser. Neither of the affiliated trustee or the Trust’s officers receive compensation from the Funds.
|
Note 5 – Securities Lending |
Each Fund may lend up to 33 1/3% of the value of the securities in its portfolio to brokers, dealers and financial institutions (but not individuals) under terms of participation in a securities lending program administered by the Securities Lending Agent. The securities lending agreement requires that loans are collateralized at all times in an amount equal to at least the market value of the securities loaned by the Funds. The Funds receive compensation in the form of fees and earned interest on the cash collateral. Due to timing issues of when a security is recalled from loan, the financial statements may differ in presentation. The amount of fees depends on a number of factors including the type of security and length of the loan. The Funds continue to receive interest payments or dividends on the securities loaned during the borrowing period. Gain or loss in the value of securities loaned that may occur during the term of the loan will be for the account of the Funds. The Funds have the right under the terms of the securities lending agreements to recall the securities from the borrower on demand.
As of September 30, 2023, the market value of the securities on loan and payable on collateral received for securities lending were as follows:
| | | | | | | |
Fund | | Market Value of
Securities on Loan | | Payable on
Collateral
Received | | Percentage of
Net Assets of
Securities on Loan |
Gotham Enhanced 500 ETF | | $6,314,257
| | $6,470,612
| | 2.2% | |
Gotham 1000 Value ETF | | 23,045,287 | | 23,745,850 | | 16.9% | |
As of September 30, 2023, the Funds had loaned securities and received cash collateral for the loans. The cash collateral is invested in the Mount Vernon Liquid Assets Portfolio, LLC of which the investment objective is to seek to maximize income to the extent consistent with the preservation of capital and liquidity and maintain a stable NAV of $1.00. Although risk is mitigated by the collateral, the Funds could experience a delay in recovering their securities and possible loss of income or value if the borrower fails to return the borrowed securities. In addition, the Funds bear the risk of loss associated with the investment of cash collateral received.
During the year ended September 30, 2023, the Funds loaned securities that were collateralized by cash. The cash collateral received was invested in in the Mount Vernon Liquid Assets Portfolio, LLC as listed in each Fund’s Schedules of Investments. Securities lending income is disclosed in the Funds’ Statements of Operations.
The Funds are not subject to a master netting agreement with respect to Funds’ participation in securities lending; therefore, no additional disclosures regarding netting arrangements are required.
|
NOTES TO FINANCIAL STATEMENTS September 30, 2023 (Continued) |
|
Note 6 – Purchase and Sales of Securities |
For the year ended September 30, 2023, the cost of purchases and proceeds from the sales or maturities of securities, excluding short-term investments, U.S. government securities, and in-kind transactions were as follows:
| | | | |
Fund | | Purchases | | Sales |
Gotham Enhanced 500 ETF | | $388,866,718
| | $386,027,800
|
Gotham 1000 Value ETF | | 174,012,916 | | 169,837,471 |
For the year ended September 30, 2023, there were no purchases or sales of long-term U.S. government securities.
For the year ended September 30, 2023, in-kind transactions associated with creations and redemptions for the Funds were as follows:
| | | | |
Fund | | Purchases | | Sales |
Gotham Enhanced 500 ETF | | $30,486,400
| | $53,444,974
|
Gotham 1000 Value ETF | | 108,052,852 | | 18,405,573 |
|
Note 7 – Income Taxes And Distributions To Shareholders |
The tax character of distributions paid during the year ended September 30, 2023 and the periods ended September 30, 2022 were as follows:
| | | | | | |
Fund | | Distributions
paid from: | | September 30,
2023 | | September 30,
2022 |
Gotham Enhanced 500 ETF | | Ordinary income | | $3,481,219
| | $614,820
|
Gotham Enhanced 500 ETF | | Capital Gains | | — | | 1,940 |
Gotham 1000 Value ETF | | Ordinary income | | 429,999 | | — |
Gotham 1000 Value ETF | | Capital Gains | | 2,543 | | — |
As of September 30, 2023, the components of the distributable (accumulated) earnings (losses) on a tax basis were as follows:
| | | | | |
| | Gotham
Enhanced 500 ETF | | Gotham
1000 Value ETF | |
Cost of investments (1) | | $303,105,121
| | $158,690,930
| |
Gross tax unrealized appreciation | | 21,788,093 | | 10,504,612 | |
Gross tax unrealized depreciation | | (25,013,306 | ) | (9,170,524 | ) |
Net tax unrealized appreciation (depreciation) | | (3,225,213 | ) | 1,334,088 | |
Undistributed ordinary income (loss) | | 2,759,253 | | 1,827,933 | |
Undistributed long-term capital gain (loss) | | — | | — | |
Total distributable earnings | | 2,759,253 | | 1,827,933 | |
Other accumulated gain (loss) | | (14,525,671 | ) | (967,762 | ) |
Total accumulated gain (loss) | | (14,991,631 | ) | 2,194,259 | |
(1)The difference between book and tax-basis cost of investments was attributable primarily to the treatment of wash sales.
Net capital losses incurred after October 31 (post-October losses) and net investment losses incurred after December 31 (late year losses), and within the taxable year, may be elected to be deferred to the first business day of each Fund’s next taxable year. As of September 30, 2023, the Funds have not elected to defer any post-October or late year losses. As of September 30, 2023, the Gotham Enhanced 500 ETF had short-term and long-term capital loss carryovers of $(8,693,476) and $(5,832,195), and the Gotham 1000 Value ETF had short-term and long-term capital loss carryovers of $(967,762) and $-, respectively, which do not expire.
|
NOTES TO FINANCIAL STATEMENTS September 30, 2023 (Continued) |
|
Note 8 – Share Transactions |
Shares of the Funds are listed and traded on the Exchange. Market prices for the shares may be different from their NAV. The Funds issue and redeem shares on a continuous basis at NAV generally in large blocks of shares (“Creation Units”). Creation Units are issued and redeemed principally in-kind for securities included in a specified universe. Once created, shares generally trade in the secondary market at market prices that change throughout the day. Except when aggregated in Creation Units, shares are not redeemable securities of the Funds. Creation Units may only be purchased or redeemed by Authorized Participants. An Authorized Participant is either (i) a broker-dealer or other participant in the clearing process through the Continuous Net Settlement System of the National Securities Clearing Corporation or (ii) a Depository Trust Company participant and, in each case, must have executed a Participant Agreement with the Distributor. Most retail investors do not qualify as Authorized Participants nor have the resources to buy and sell whole Creation Units. Therefore, they are unable to purchase or redeem the shares directly from the Funds. Rather, most retail investors may purchase shares in the secondary market with the assistance of a broker and are subject to customary brokerage commissions or fees.
The Funds currently offer one class of shares, which has no front-end sales load, no deferred sales charge, and no redemption fee. A fixed transaction fee is imposed for the transfer and other transaction costs associated with the purchase or sale of Creation Units. The standard fixed transaction fee for the Funds is $500, payable to the Custodian. The fixed transaction fee may be waived on certain orders if the Funds’ Custodian has determined to waive some or all of the costs associated with the order or another party, such as the Adviser, has agreed to pay such fee. In addition, a variable fee may be charged on all cash transactions or substitutes for Creation Units of up to a maximum of 2% and for Redemption Units of up to a maximum of 2% of the value of the Creation Units and Redemption Units subject to the transaction. Variable fees received by the Funds, if any, are disclosed in the capital shares transactions section of the Statements of Changes in Net Assets. The Funds may issue an unlimited number of shares of beneficial interest, with no par value. All shares of the Funds have equal rights and privileges.
|
Note 9 – Recent Market Events |
U.S. and international markets have experienced and may continue to experience significant periods of volatility in recent years and months due to a number of economic, political and global macro factors including rising inflation, uncertainty regarding central banks’ interest rate increases, the possibility of a national or global recession, trade tensions, political events, the war between Russia and Ukraine and the impact of the coronavirus (COVID-19) global pandemic. The global recovery from COVID-19 may last for an extended period of time. As a result of continuing political tensions and armed conflicts, including the war between Ukraine and Russia, the U.S. and the European Union imposed sanctions on certain Russian individuals and companies, including certain financial institutions, and have limited certain exports and imports to and from Russia. The war has contributed to recent market volatility and may continue to do so.These developments, as well as other events, could result in further market volatility and negatively affect financial asset prices, the liquidity of certain securities and the normal operations of securities exchanges and other markets, despite government efforts to address market disruptions. Continuing market volatility as a result of recent market conditions or other events may have adverse effects on your account.
|
Note 10 – Subsequent Events |
In preparing these financial statements, the Funds have evaluated events and transactions for potential recognition or disclosure through the date the financial statements were issued. The Funds have determined that there are no subsequent events that would need to be disclosed in the Funds’ financial statements.
|
REPORT OF INDEPENDENT REGISTERED PUBLIC ACCOUNTING FIRM |
To the Shareholders of
Gotham Enhanced 500 ETF and
Gotham 1000 Value ETF and
The Board of Trustees of
Tidal ETF Trust
Opinion on the Financial Statements
We have audited the accompanying statements of assets and liabilities of Gotham Enhanced 500 ETF and Gotham 1000 Value ETF (collectively the “Funds”), each a series of Tidal ETF Trust (the “Trust”), including the schedules of investments, as of September 30, 2023, the related statements of operations, statements of changes in net assets, and the financial highlights for each of the periods indicated in the table below, and the related notes (collectively referred to as the “financial statements”). In our opinion, the financial statements present fairly, in all material respects, the financial position of the Funds as of September 30, 2023, and the results of their operations, the changes in their net assets and the financial highlights for the periods indicated in the table below, in conformity with accounting principles generally accepted in the United States of America.
| | | | | | |
Individual Funds
Constituting
Tidal ETF Trust | | Statement Of Operations | | Statements Of Changes In Net Assets | | Financial Highlights |
Gotham Enhanced 500 ETF | | For the year ended
September 30, 2023 | | For each of the two years ended September 30, 2023 | | For each of the two years ended September 30, 2023 and for the period December 28, 2020 (commencement of operations) to September 30, 2021 |
Gotham 1000 Value ETF | | For the year ended
September 30, 2023 | | For the year ended September 30, 2023 and for the period June 7, 2022 (commencement of operations) to September 30, 2022 | | For the year ended September 30, 2023 and for the period June 7, 2022 (commencement of operations) to September 30, 2022 |
Basis for Opinion
These financial statements are the responsibility of the Funds’ management. Our responsibility is to express an opinion on the Funds’ financial statements based on our audits. We are a public accounting firm registered with the Public Company Accounting Oversight Board (United States) (“PCAOB”) and are required to be independent with respect to the Funds in accordance with the U.S. federal securities laws and the applicable rules and regulations of the Securities and Exchange Commission and the PCAOB. We have served as the auditor of one or more of the funds in the Trust since 2018.
We conducted our audits in accordance with the standards of the PCAOB. Those standards require that we plan and perform the audits to obtain reasonable assurance about whether the financial statements are free of material misstatement, whether due to error or fraud. The Funds are not required to have, nor were we engaged to perform, an audit of their internal control over financial reporting. As part of our audits, we are required to obtain an understanding of internal control over financial reporting, but not for the purpose of expressing an opinion on the effectiveness of the Funds’ internal control over financial reporting. Accordingly, we express no such opinion.
Our audits included performing procedures to assess the risks of material misstatement of the financial statements, whether due to error or fraud, and performing procedures that respond to those risks. Such procedures included examining, on a test basis, evidence regarding the amounts and disclosures in the financial statements. Our audits also included evaluating the accounting principles used and significant estimates made by management, as well as evaluating the overall presentation of the financial statements. Our procedures included confirmation of securities owned as of September 30, 2023 by correspondence with the custodian and brokers or through other appropriate auditing procedures when replies from brokers were unable to be obtained. We believe that our audits provide a reasonable basis for our opinion.
TAIT, WELLER & BAKER LLP
Philadelphia, Pennsylvania
November 29, 2023
As a shareholder of the Funds, you incur two types of costs: (1) transaction costs, including brokerage commissions paid on purchases and sales of the Funds’ shares, and (2) ongoing costs, including management fees of the Funds. The examples are intended to help you understand your ongoing costs (in dollars) of investing in the Fund and to compare these costs with the ongoing costs of investing in other funds. The example is based on an investment of $1,000 invested at the beginning of the period and held for the entire period indicated, which is from April 1, 2023 to September 30, 2023.
Actual Expenses
The first line of the following tables provides information about actual account values and actual expenses. The examples include, but are not limited to, unitary fees. However, the examples do not include portfolio trading commissions and related expenses. You may use the information in this line, together with the amount you invested, to estimate the expenses that you paid over the period. Simply divide your account value by $1,000 (for example, an $8,600 account value divided by $1,000 = 8.6), then, multiply the result by the number in the first line under the heading entitled “Expenses Paid During the Period’’ to estimate the expenses you paid on your account during this period.
Hypothetical Example for Comparison Purposes
The second line of the following tables provides information about hypothetical account values and hypothetical expenses based on the Funds’ actual expense ratios and an assumed rate of return of 5% per year before expenses, which is not the Funds’ actual returns. The hypothetical account values and expenses may not be used to estimate the actual ending account balance or expenses you paid for the period. You may use this information to compare the ongoing costs of investing in the Funds and other funds. To do so, compare this 5% hypothetical example with the 5% hypothetical examples that appear in the shareholder reports of the other funds. Please note that the expenses shown in the tables are meant to highlight your ongoing costs only and do not reflect any transactional costs, such as brokerage commissions paid on purchases and sales of Fund shares. Therefore, the second line of the following tables is useful in comparing ongoing costs only and will not help you determine the relative total costs of owning different funds. If these transactional costs were included, your costs would have been higher.
Gotham Enhanced 500 ETF
| | | | | |
| Beginning
Account Value
April 1, 2023 | | Ending
Account Value
September 30, 2023 | | Expenses Paid
During the Period
April 1, 2023 –
September 30, 2023(1) |
Actual | $1,000.00
| | $1,056.40
| | $2.58
|
Hypothetical (5% annual return before expenses) | $1,000.00
| | $1,022.56
| | $2.54
|
(1)Expenses are equal to the Fund’s annualized net expense ratio for the most recent six-month period of 0.50% (fee waivers in effect), multiplied by the average account value over the period, multiplied by 183/365 (to reflect the most recent six-month period).
Gotham 1000 Value ETF
| | | | | |
| Beginning
Account Value
April 1, 2023 | | Ending
Account Value
September 30, 2023 | | Expenses Paid
During the Period
April 1, 2023 –
September 30, 2023(1) |
Actual | $1,000.00
| | $1,058.60
| | $2.58
|
Hypothetical (5% annual return before expenses) | $1,000.00
| | $1,022.56
| | $2.54
|
(1)Expenses are equal to the Fund’s annualized net expense ratio for the most recent period of 0.50% (fee waivers in effect), multiplied by the average account value over the period, multiplied by 183/365 (to reflect the most recent six-month period).
|
EXPENSE EXAMPLES For the Six-Months Ended September 30, 2023 (Unaudited) |
|
TRUSTEES AND EXECUTIVE OFFICERS (Unaudited) |
| | | | | | | | | | |
Name, Address
and Year of Birth | | Position
Held with
the Trust | | Term of
Office and
Length of
Time Served | | Principal
Occupation(s)
During Past 5 Years | | Number of
Portfolios in
Fund Complex
Overseen by
Trustee(3) | | Other Directorships
Held by Trustee
During Past 5 Years |
Independent Trustees (1) |
Mark H.W. Baltimore c/o Tidal ETF Services, LLC 234 West Florida Street, Suite 203 Milwaukee, Wisconsin 53204 Born: 1967 | | Trustee | | Indefinite term; since 2018 | | Co-Chief Executive Officer, Global Rhino, LLC (asset management consulting firm) (since 2018); Chief Business Development Officer, Joot (asset management compliance services firm) (since 2019); Chief Executive Officer, Global Sight, LLC (asset management distribution consulting firm) (2016 to 2018). | | 42 | | None |
Dusko Culafic c/o Tidal ETF Services, LLC 234 West Florida Street, Suite 203 Milwaukee, Wisconsin 53204 Born: 1958 | | Trustee | | Indefinite term; since 2018 | | Retired (since 2018); Senior Operational Due Diligence Analyst, Aurora Investment Management, LLC (2012 to 2018). | | 42 | | None |
Eduardo Mendoza c/o Tidal ETF Services, LLC 234 West Florida Street, Suite 203 Milwaukee, Wisconsin 53204 Born: 1966 | | Trustee | | Indefinite term; since 2018 | | Chief Financial Officer (since 2022), Executive Vice President - Head of Capital Markets & Corporate Development (since 2019), Advisor (2017 to 2019), Credijusto (financial technology company). | | 42 | | None |
Interested Trustee and Executive Officer |
Eric W. Falkeis (2) c/o Tidal ETF Services, LLC 234 West Florida Street, Suite 203 Milwaukee, Wisconsin 53204 Born: 1973 | | President, Principal Executive Officer, Interested Trustee, and Chairman | | President and Principal Executive Officer since 2019, Indefinite term; Interested Trustee, and Chairman, since 2018, Indefinite term | | Chief Executive Officer, Tidal ETF Services LLC (since 2018); Chief Operating Officer (and other positions), Rafferty Asset Management, LLC (2013 to 2018) and Direxion Advisors, LLC (2017 to 2018). | | 42 | | Trustee, Tidal Trust II (32 series) (since 2022); Independent Director, Muzinich BDC, Inc. (since 2019); Trustee, Professionally Managed Portfolios (27 series) (since 2011); Interested Trustee, Direxion Funds, Direxion Shares ETF Trust, and Direxion Insurance Trust (2014–2018). |
|
TRUSTEES AND EXECUTIVE OFFICERS (Unaudited) (Continued) |
| | | | | | | | | | |
Name, Address
and Year of Birth | | Position
Held with
the Trust | | Term of
Office and
Length of
Time Served | | Principal
Occupation(s)
During Past 5 Years | | Number of
Portfolios in
Fund Complex
Overseen by
Trustee(3) | | Other Directorships
Held by Trustee
During Past 5 Years |
Executive Officers |
Aaron J. Perkovich c/o Tidal ETF Services, LLC 234 West Florida Street, Suite 203 Milwaukee, Wisconsin 53204 Born: 1973 | | Treasurer, Principal Financial Officer, and Principal Accounting Officer | | Indefinite term; since 2022 | | Head of Fund Administration (since 2023), Fund Administration Manager (2022 to 2023), Tidal ETF Services LLC; Assistant Director – Investments, Mason Street Advisors, LLC (2021 to 2022); Vice President, U.S. Bancorp Fund Services, LLC (2006 to 2021). | | Not Applicable | | Not
Applicable |
William H. Woolverton, Esq c/o Tidal ETF Services, LLC 234 West Florida Street, Suite 203 Milwaukee, Wisconsin 53204 Born: 1951 | | Chief Compliance Officer and AML Compliance Officer | | AML Compliance Officer since 2023, Indefinite term; Chief Compliance Officer since 2021, Indefinite term | | Chief Compliance Officer (since 2023), Compliance Advisor (2022 to 2023), Tidal Investments LLC; Chief Compliance Officer, Tidal ETF Services LLC (since 2022); Senior Compliance Advisor, Cipperman Compliance Services, LLC (2020 to 2022); Operating Partner, Altamont Capital Partners (private equity firm) (since 2021); Managing Director and Head of Legal - US, Waystone (global governance solutions) (2016 to 2019). | | Not Applicable | | Not
Applicable |
Ally L. Mueller c/o Tidal ETF Services, LLC 234 West Florida Street, Suite 203 Milwaukee, Wisconsin 53204 Born: 1979 | | Vice President | | Indefinite term; since 2023 | | Head of ETF Launches and Client Success (since 2023), Head of ETF Launches and Finance Director (2019 to 2023), Tidal ETF Services LLC. | | Not Applicable | | Not
Applicable |
Lissa M. Richter c/o Tidal ETF Services, LLC 234 West Florida Street, Suite 203 Milwaukee, Wisconsin 53204 Born: 1979 | | Secretary | | Indefinite term; since 2023 | | ETF Regulatory Manager (since 2021), Tidal ETF Services LLC; Senior Paralegal, Rafferty Asset Management, LLC (2013 to 2020); Senior Paralegal, Officer, U.S Bancorp Fund Services LLC (2005 to 2013). | | Not Applicable | | Not
Applicable |
Melissa Breitzman c/o Tidal ETF Services, LLC 234 West Florida Street, Suite 203 Milwaukee, Wisconsin 53204 Born: 1983 | | Assistant Treasurer | | Indefinite term; since 2023 | | Fund Administration Manager, Tidal ETF Services LLC (since 2023); Assistant Vice President, U.S Bancorp Fund Services, LLC (2005 to 2023). | | Not Applicable | | Not
Applicable |
(1)All Independent Trustees of the Trust are not “interested persons” of the Trust as defined under the 1940 Act (“Independent Trustees”).
(2)Mr. Falkeis is considered an “interested person” of the Trust due to his positions as President, Principal Executive Officer, Chairman, and Chief Executive Officer of Tidal ETF Services LLC, a Tidal Financial Group company and an affiliate of the Adviser.
(3)The Trust, as of the date of this shareholder report, offers for sale to the public 36 of the 42 funds registered with the SEC.
|
Basis for Trustees’ Approval of Investment Advisory and Sub-Advisory Agreements (Unaudited) |
The Board of Trustees (the “Board” or the “Trustees”) of Tidal ETF Trust (the “Trust”) met at a meeting held on September 19, 2023 to consider the renewal of the Investment Advisory Agreement (the “Advisory Agreement”) between the Trust, on behalf of the Gotham Enhanced 500 ETF (the “Fund”), a series of the Trust, and Toroso Investments, LLC, the Fund’s investment adviser (the “Adviser”). Prior to this meeting, the Board requested and received materials to assist them in considering the renewal of the Advisory Agreement. The materials provided contained information with respect to the factors enumerated below, including a copy of the Advisory Agreement, a memorandum prepared by outside legal counsel to the Trust and Independent Trustees discussing in detail the Trustees’ fiduciary obligations and the factors they should assess in considering the renewal of the Advisory Agreement, due diligence materials relating to the Adviser (including the due diligence response completed by the Adviser with respect to a specific request letter from outside legal counsel to the Trust and Independent Trustees, the Adviser’s Form ADV, select ownership, organizational, financial and insurance information for the Adviser, biographical information of the Adviser’s key management and compliance personnel, detailed comparative information regarding the unitary advisory fee for the Fund, and information regarding the Adviser’s compliance program) and other pertinent information. Based on their evaluation of the information provided, the Trustees, by a unanimous vote (including a separate vote of the Trustees who are not “interested persons,” as that term is defined in the Investment Company Act of 1940, as amended (the “Independent Trustees”)), approved the renewal of the Advisory Agreement for an additional one-year term.
Discussion of Factors Considered
In considering the renewal of the Advisory Agreement and reaching their conclusions, the Trustees reviewed and analyzed various factors that they determined were relevant, including the factors enumerated below.
1.Nature, Extent and Quality of Services Provided. The Board considered the nature, extent and quality of the Adviser’s overall services provided to the Fund as well as its specific responsibilities in all aspects of day-to-day investment management of the Fund, including trade execution and recommendations with respect to the hiring, termination, or replacement of sub-advisers to the Fund. The Board considered the qualifications, experience and responsibilities of the Adviser’s investment management team, including Michael Venuto and Charles Ragauss, who each serve as a portfolio manager to the Fund, as well as the responsibilities of other key personnel of the Adviser involved in the daytoday activities of the Fund. The Board reviewed due diligence information provided by the Adviser, including information regarding the Adviser’s compliance program, its compliance personnel and compliance record, as well as the Adviser’s cybersecurity program and business continuity plan. The Board noted that the Adviser does not manage any other accounts that utilize a strategy similar to that employed by the Fund.
The Board also considered other services provided to the Fund, such as monitoring adherence to the Fund’s investment strategy and restrictions, oversight of Gotham Asset Management, LLC (“Gotham” or the “Sub-Adviser”), the Fund’s sub-adviser, and other service providers to the Fund, monitoring compliance with various Fund policies and procedures and with applicable securities regulations, and monitoring the extent to which the Fund achieves its investment objective as an actively-managed ETF. The Board noted that the Adviser is responsible for trade execution for the Fund and the Sub-Adviser is responsible for portfolio investment decisions for the Fund, subject to the supervision of the Adviser. The Board also noted that, during the review period, the Fund changed its principal investment strategy to reflect that the Fund is rebalanced daily by the Sub-Adviser.
The Board concluded that the Adviser had sufficient quality and depth of personnel, resources, investment methods and compliance policies and procedures essential to performing its duties under the Advisory Agreement and managing the Fund and that the nature, overall quality and extent of the management services provided to the Fund, as well as the Adviser’s compliance program, were satisfactory.
2.Investment Performance of the Fund and the Adviser. The Board considered the investment performance of the Fund and the Adviser. The Board also considered the Fund’s performance against its benchmark index and peer group. The Board also considered that because the portfolio investment decision-making for the Fund is performed by the Sub-Adviser, the Fund’s performance is not the direct result of investment decisions made by the Adviser.
The Board discussed the performance of the Fund on an absolute basis, in comparison to its benchmark index (the S&P 500 TR Index), and in comparison to a peer group of funds based on comparative information prepared by Fund Services utilizing data provided by Morningstar Direct (a peer group of U.S. large blend funds) (the “Morningstar Peer Group”). The Board noted that the Fund slightly underperformed the S&P 500 TR Index for the year-to-date, one-year and since inception periods ended June 30, 2023. The Board also noted that the Fund had outperformed the Morningstar Peer Group average over the year-to-date and one-year periods ended July 31, 2023.
After considering all of the information the Board concluded that the performance of the Fund was satisfactory under current market conditions and that the Adviser has the necessary expertise and resources in providing investment advisory services in accordance with the Fund’s investment objective and strategies. Although past performance is not a guarantee or indication of future results, the Board determined that the Fund and its shareholders were likely to benefit from the Adviser’s continued management.
3.Cost of Services Provided and Profits Realized by the Adviser. The Board considered the cost of services and the structure of the Adviser’s advisory fee, including a review of comparative expenses, expense components and peer group selection. The Board took into consideration that the advisory fee for the Fund was a “unitary fee,” meaning that the Fund pays no expenses other than the advisory fee and certain other costs such as interest, brokerage, and extraordinary expenses and, to the extent it is implemented, fees pursuant to the Fund’s Rule 12b1 Plan. The Board noted that the Adviser continues to be responsible for compensating the Fund’s other service providers and paying the Fund’s other expenses out of its own fees and resources, subject to the Sub-Adviser’s contractual agreement to assume such obligation in exchange for the profits, if any, generated by the Fund’s unitary fee. The Board also noted that the Adviser has contractually agreed to an advisory fee waiver that reduces the Fund’s unitary fee from 0.65% to 0.50% of the Fund’s average daily net assets through at least January 31, 2024. The Board also considered the overall profitability of the Adviser and examined the level of profits accrued to the Adviser from the fees payable under the Advisory Agreement. The Board considered that the Fund’s advisory fee of 0.65% was above the Morningstar Peer Group average of 0.52% and that the Fund’s net expense ratio of 0.50% was below the Morningstar Peer Group average of 0.52%.
The Board concluded that the Fund’s expense ratio and the advisory fee were fair and reasonable in light of the comparative performance, advisory fee and expense information and the investment management services provided to the Fund by the Adviser given the nature of the Fund’s investment strategy. The Board also evaluated, based on a profitability analysis prepared by the Adviser, the fees received by the Adviser and its affiliates from their relationship with the Fund, and concluded that the fees had not been, and currently were not, excessive, and while the Fund was not yet profitable to the Adviser, the Adviser had adequate financial resources to support its services to the Fund from the revenues of its overall investment advisory business.
4.Extent of Economies of Scale as the Fund Grows. The Board compared the Fund’s expenses relative to its Morningstar Peer Group and discussed realized and potential economies of scale. The Board considered the potential economies of scale that the Fund might realize under the structure of the advisory fee. The Board noted that the advisory fee did not contain any breakpoint reductions as the Fund’s assets grow in size, but that the Adviser would evaluate future circumstances that may warrant breakpoints in the fee structure.
5.Benefits Derived from the Relationship with the Fund. The Board considered the direct and indirect benefits that could be received by the Adviser and its affiliates from association with the Fund. The Board concluded that the benefits the Adviser may receive, such as greater name recognition or the ability to attract additional investor assets, appear to be reasonable and in many cases may benefit the Fund.
Conclusion. Based on the Board’s deliberations and its evaluation of the information described above, with no single factor determinative of a conclusion, the Board, including the Independent Trustees, unanimously concluded that: (a) the terms of the Advisory Agreement are fair and reasonable; (b) the advisory fee is reasonable in light of the services that the Adviser provides to the Fund; and (c) the approval of the renewal of the Advisory Agreement for an additional one-year term was in the best interests of the Fund and its shareholders.
At the meeting held on September 19, 2023, the Board also considered the renewal of the sub-advisory agreement (the “Sub-Advisory Agreement”) for the Fund, entered into between the Adviser and Gotham. Prior to this meeting, the Board requested and received materials to assist them in considering the renewal of the Sub-Advisory Agreement. The materials provided contained information with respect to the factors enumerated below, including a copy of the Sub-Advisory Agreement, a memorandum prepared by outside legal counsel to the Trust and the Independent Trustees discussing in detail the Trustees’ fiduciary obligations and the factors they should assess in considering the renewal of the Sub-Advisory Agreement, due diligence materials prepared by the Sub-Adviser (including the due diligence response completed by the Sub-Adviser with respect to a specific request letter from outside legal counsel to the Trust and the Independent Trustees, the Sub-Adviser’s Form ADV, select ownership, organizational, financial and insurance information for the Sub-Adviser, biographical information of key management and compliance personnel, and the Sub-Adviser’s compliance manual and code of ethics) and other pertinent information. Based on their evaluation of the information provided, the Trustees, by a unanimous vote (including a separate vote of the Independent Trustees), approved the renewal of the Sub-Advisory Agreement for an additional one-year term.
|
Basis for Trustees’ Approval of Investment Advisory and Sub-Advisory Agreements (Unaudited) (Continued) |
Discussion of Factors Considered
In considering the renewal of the Sub-Advisory Agreement and reaching their conclusions, the Trustees reviewed and analyzed various factors that they determined were relevant, including the factors enumerated below.
1.Nature, Extent and Quality of Services Provided. The Board considered the nature, extent and quality of Gotham’s overall services provided to the Fund as well as its specific responsibilities in aspects of day-to-day investment management of the Fund. The Board considered the qualifications, experience and responsibilities of Joel Greenblatt and Robert Goldstein who each serve as a portfolio manager for the Fund, as well as the responsibilities of other key personnel of Gotham involved in the day-to-day activities of the Fund. The Board reviewed the due diligence information provided by Gotham, including information regarding Gotham’s compliance program, its compliance personnel and compliance record, as well as Gotham’s cybersecurity program and business continuity plan. The Board noted that Gotham manages the Gotham Enhanced S&P 500 Index Fund, an open-end mutual fund that utilizes a strategy similar to the strategy employed by the Fund.
The Board also considered other services provided to the Fund, such as monitoring adherence to the Fund’s investment strategies and restrictions, monitoring compliance with various Fund policies and procedures and with applicable securities regulations, monitoring the extent to which the Fund meets its investment objective as an actively-managed ETF and quarterly reporting to the Board. The Board noted that Gotham is responsible for the Fund’s investment selection, subject to oversight by the Adviser.
The Board concluded that Gotham had sufficient quality and depth of personnel, resources, investment methods and compliance policies and procedures essential to performing its duties under the Gotham Sub-Advisory Agreement and managing the Fund and that the nature, overall quality and extent of the management services provided to the Fund, as well as Gotham’s compliance program, were satisfactory.
2.Investment Performance of the Fund and the Sub-Adviser. In considering Fund performance, the Board noted that Gotham is responsible for selecting investments for the Fund. Accordingly, the Board discussed the performance of the Fund on an absolute basis, in comparison to its benchmark index (the S&P 500 TR Index), and in comparison to a peer group of funds based on comparative information prepared by Fund Services utilizing data provided by Morningstar Direct (a peer group of U.S. large blend funds) (the “Morningstar Peer Group”). The Board noted that the Fund slightly underperformed the S&P 500 TR Index for the year-to-date, one-year and since inception periods ended June 30, 2023. The Board also noted that the Fund had outperformed the Morningstar Peer Group average over the year-to-date and one-year periods ended July 31, 2023.
After considering all of the information, the Board concluded that the performance of the Fund was satisfactory under current market conditions and that Gotham has the necessary expertise and resources in providing investment advisory services in accordance with the Fund’s investment objective and strategies. Although past performance is not a guarantee or indication of future results, the Board determined that the Fund and its shareholders were likely to benefit from Gotham’s continued management.
3.Cost of Services Provided and Profits Realized by the Sub-Adviser. The Board considered the structure of the sub-advisory fees paid by the Adviser to Gotham under the Gotham Sub-Advisory Agreement. The Board noted that the Adviser represented to the Board that the sub-advisory fees payable under the Gotham Sub-Advisory Agreement were reasonable in light of the services performed by Gotham. Since the sub-advisory fees are paid by the Adviser, the overall advisory fees paid by the Fund are not directly affected by the sub-advisory fees paid to Gotham. Consequently, the Board did not consider the cost of services provided by Gotham or profitability from its relationship with the Fund to be material factors for consideration given that Gotham is not affiliated with the Adviser and, therefore, the sub-advisory fees paid to Gotham were negotiated on an arm’s-length basis. Based on all of these factors, the Board concluded that the sub-advisory fees paid to Gotham by the Adviser reflected appropriate allocations of the advisory fees and were reasonable in light of the services provided by Gotham.
4.Extent of Economies of Scale as the Fund Grows. Since the sub-advisory fees payable to Gotham are not paid by the Fund, the Board did not consider whether the sub-advisory fees should reflect any realized or potential economies of scale that might be realized as the Fund’s assets increase.
5.Benefits Derived from the Relationship with the Fund. The Board considered the direct and indirect benefits that could be received by Gotham from its association with the Fund. The Board concluded that the benefits Gotham may receive, such as greater name recognition or the ability to attract additional investor assets, appear to be reasonable and in many cases may benefit the Fund.
|
Basis for Trustees’ Approval of Investment Advisory and Sub-Advisory Agreements (Unaudited) (Continued) |
Conclusion. Based on the Board’s deliberations and its evaluation of the information described above, with no single factor determinative of a conclusion, the Board, including the Independent Trustees, unanimously concluded that: (a) the terms of the Gotham Sub-Advisory Agreement are fair and reasonable; (b) the sub-advisory fees are reasonable in light of the services that Gotham provides to the Fund; and (c) the approval of the renewal of the Gotham Sub-Advisory Agreement for an additional one-year term was in the best interests of the Fund and its shareholders.
|
Basis for Trustees’ Approval of Investment Advisory and Sub-Advisory Agreements (Unaudited) (Continued) |
In accordance with Rule 22e-4 under the Investment Company Act of 1940, as amended (“Rule 22e-4”), Tidal ETF Trust (the “Trust”), on behalf of its series, the Gotham 500 Enhanced ETF and Gotham 1000 Value ETF (the “Funds”), has adopted and implemented a liquidity risk management program (the “Program”). The Program seeks to promote effective liquidity risk management for the Fund and to protect the Funds shareholders from dilution of their interests. The Trust’s Board of Trustees (the “Board”) has approved the designation of Toroso Investments, LLC, each Fund’s investment adviser, as the program administrator (the “Program Administrator”). The Program Administrator has further delegated administration of the Program to a member of its compliance team. The Program Administrator has also delegated certain responsibilities under the Program to the investment sub-adviser of the Funds; however, the Program Administrator remains responsible for the overall administration and operation of the Program. The Program Administrator is required to provide a written annual report to the Board regarding the adequacy and effectiveness of the Program, including the operation of the highly liquid investment minimum, if applicable, and any material changes to the Program.
On August 24, 2023, the Board reviewed the Program Administrator’s written annual report for the period October 1, 2022 through June 30, 2023 (the “Report”). The Program assesses liquidity risk under both normal and reasonably foreseeable stressed market conditions. The risk is managed by monitoring the degree of liquidity of a fund’s investments, limiting the amount of illiquid investments and utilizing various risk management tools and facilities available to a fund, among other means. The Trust has engaged the services of ICE Data Services, Inc., a third-party vendor, to provide daily portfolio investment classification services to assist in the Program Administrator’s assessment. The Report noted that no highly liquid investment minimum is required for the Funds because the Funds qualify as In-Kind ETFs (as defined under Rule 22e-4). The Report noted that there were no breaches of the restrictions on acquiring or holding greater than 15% illiquid investments of the Fund during the review period. The Report confirmed that each Fund’s investment strategies remained appropriate for an open-end fund and that the Funds were able to meet requests for redemptions without significant dilution of remaining investors’ interests in the Funds. The Report noted that no material changes had been made to the Program during the review period. The Program Administrator determined that the Program complies with the requirements of Rule 22e-4 and is reasonably designed and operating effectively.
|
STATEMENT REGARDING LIQUIDITY RISK MANAGEMENT PROGRAM (Unaudited) |
QUALIFIED DIVIDEND INCOME/DIVIDENDS RECEIVED DEDUCTION (Unaudited)
For the year ended September 30, 2023, certain dividends paid by the Funds may be subject to a maximum tax rate of 23.8%, as provided for by the Jobs and Growth Tax Relief Reconciliation Act of 2003. The percentage of dividends declared from ordinary income designated as qualified dividend income was as follows:
| |
Gotham Enhanced 500 ETF | 100% |
Gotham 1000 Value ETF | 74.84% |
For corporate shareholders, the percent of ordinary income distributions qualifying for the corporate dividends received deduction for the year ended September 30, 2023 was as follows:
| |
Gotham Enhanced 500 ETF | 100% |
Gotham 1000 Value ETF | 69.23% |
The percentage of taxable ordinary income distributions that are designated as short-term capital gain distribution under Internal Revenue Section 871(k)(2)(c) for the year ended September 30, 2023 was as follows:
| |
Gotham Enhanced 500 ETF | 0% |
Gotham 1000 Value ETF | 28.13% |
INFORMATION ABOUT PROXY VOTING (Unaudited)
A description of the policies and procedures that the Funds use to determine how to vote proxies relating to portfolio securities is available upon request without charge, by calling (855) 998-4779 or by accessing the Funds’ website at www.GothamETFs.com.Furthermore, you can obtain the description on the SEC’s website at www.sec.gov.
Information regarding how the Funds voted proxies relating to portfolio securities during the most recent 12-month period ended June 30 is available upon request without charge by calling (855) 998-4779 or by accessing the SEC’s website at www.sec.gov.
INFORMATION ABOUT THE PORTFOLIO HOLDINGS (Unaudited)
The Funds’ portfolio holdings are posted on the Funds’ website daily at www.GothamETFs.com.The Funds file their complete schedules of portfolio holdings with the SEC for their first and third fiscal quarters on Part F of Form N-PORT. Each Fund’s Part F of Form N-PORT are available without charge, upon request, by calling (855) 998-4779.Furthermore, you can obtain the Part F of Form N-PORT on the SEC’s website at www.sec.gov.
FREQUENCY DISTRIBUTION OF PREMIUMS AND DISCOUNTS (Unaudited)
Information regarding how often shares of the Funds trade on the exchange at a price above (i.e., at a premium) or below (i.e., at a discount) to its daily NAV is available, without charge, on the Funds’ website at www.GothamETFs.com.
INFORMATION ABOUT THE FUNDS’ TRUSTEES (Unaudited)
The Statement of Additional Information (“SAI”) includes additional information about the Funds’ Trustees and is available without charge, upon request, by calling (855) 998-4779.Furthermore, you can obtain the SAI on the SEC’s website at www.sec.gov or the Funds’ website at www.GothamETFs.com.
|
ADDITIONAL INFORMATION (Unaudited) |
Investment Adviser
Tidal Investments LLC
234 West Florida Street, Suite 203
Milwaukee, Wisconsin 53204
Investment Sub-Adviser
Gotham Asset Management, LLC
535 Madison Avenue, 30th Floor
New York, New York 10022
Independent Registered Public Accounting Firm
Tait, Weller & Baker LLP
Two Liberty Place
50 South 16th Street, Suite 2900
Philadelphia, Pennsylvania 19102
Legal Counsel
Godfrey & Kahn, S.C.
833 East Michigan Street, Suite 1800
Milwaukee, Wisconsin 53202
Custodian
U.S. Bank N.A.
1555 North RiverCenter Drive, Suite 302
Milwaukee, Wisconsin 53212
Fund Administrator
Tidal ETF Services, LLC
234 West Florida Street, Suite 203
Milwaukee, WI 53204
Transfer Agent, Fund Accountant and Fund Sub-Administrator
U.S. Bancorp Fund Services, LLC
615 East Michigan Street
Milwaukee, Wisconsin 53202
Distributor
Foreside Fund Services, LLC
Three Canal Plaza, Suite 100
Portland, Maine 04101
| | |
Fund Information |
Fund | Ticker | CUSIP |
Gotham Enhanced 500 ETF | GSPY | 886364835 |
Gotham 1000 Value ETF | GVLU | 886364520 |
Item 2. Code of Ethics.
The registrant has adopted a code of ethics that applies to the registrant’s principal executive officer and principal financial officer. The registrant has not made any amendments to its code of ethics during the period covered by this report. The registrant has not granted any waivers from any provisions of the code of ethics during the period covered by this report.
A copy of the registrant’s Code of Ethics is filed herewith.
Item 3. Audit Committee Financial Expert.
The registrant’s Board of Trustees of the Trust has determined that there is at least one audit committee financial expert serving on its audit committee. Mr. Dusko Culafic is the “audit committee financial expert” and is considered to be “independent” as each term is defined in Item 3 of Form N-CSR.
Item 4. Principal Accountant Fees and Services.
The registrant has engaged its principal accountant to perform audit services, audit-related services, tax services and other services during the past fiscal year. “Audit services” refer to performing an audit of the registrant’s annual financial statements or services that are normally provided by the accountant in connection with statutory and regulatory filings or engagements for those fiscal years. “Audit-related services” refer to the assurance and related services by the principal accountant that are reasonably related to the performance of the audit. “Tax services” refer to professional services rendered by the principal accountant for tax compliance, tax advice, and tax planning. There were no “Other services” provided by the principal accountant. The following table details the aggregate fees billed or expected to be billed for the last fiscal year for audit fees, audit-related fees, tax fees and other fees by the principal accountant.
Gotham Enhanced 500 ETF
| | FYE 09/30/2023 | FYE 09/30/2022 |
| Audit Fees | $13,125 | $12,500 |
| Audit-Related Fees | N/A | N/A |
| Tax Fees | $2,625 | $2,500 |
| All Other Fees | N/A | N/A |
Gotham 1000 Value ETF
| | FYE 09/30/2023 | FYE 09/30/2022 |
| Audit Fees | $13,125 | $12,500 |
| Audit-Related Fees | N/A | N/A |
| Tax Fees | $2,625 | $2,500 |
| All Other Fees | N/A | N/A |
(e)(1) The audit committee has adopted pre-approval policies and procedures that require the audit committee to pre-approve all audit and non-audit services of the registrant, including services provided to any entity affiliated with the registrant.
(e)(2) The percentage of fees billed by Tait, Weller & Baker LLP applicable to non-audit services pursuant to waiver of pre-approval requirement were as follows:
| | FYE 09/30/2023 | FYE 09/30/2022 |
| Audit-Related Fees | 0% | 0% |
| Tax Fees | 0% | 0% |
| All Other Fees | 0% | 0% |
(f) All of the principal accountant’s hours spent on auditing the registrant’s financial statements were attributed to work performed by full-time permanent employees of the principal accountant.
(g) The following table indicates the non-audit fees billed or expected to be billed by the registrant’s accountant for services to the registrant and to the registrant’s investment adviser (and any other controlling entity, etc.—not sub-adviser) for the last two years.
| Non-Audit Related Fees | FYE 09/30/2023 | FYE 09/30/2022 |
| Registrant | N/A | N/A |
| Registrant’s Investment Adviser | N/A | N/A |
(h) The audit committee of the board of trustees/directors has considered whether the provision of non-audit services that were rendered to the registrant’s investment adviser is compatible with maintaining the principal accountant’s independence and has concluded that the provision of such non-audit services by the accountant has not compromised the accountant’s independence.
(i) The registrant has not been identified by the U.S. Securities and Exchange Commission as having filed an annual report issued by a registered public accounting firm branch or office that is located in a foreign jurisdiction where the Public Company Accounting Oversight Board is unable to inspect or completely investigate because of a position taken by an authority in that jurisdiction.
(j) The registrant is not a foreign issuer.
Item 5. Audit Committee of Listed Registrants.
| (a) | The registrant is an issuer as defined in Rule 10A-3 under the Securities Exchange Act of 1934, (the “Act”) and has a separately-designated standing audit committee established in accordance with Section 3(a)(58)(A) of the Act. The independent members of the committee are as follows: Dusko Culafic, Eduardo Mendoza, and Mark H.W. Baltimore. |
(b) Not applicable.
Item 6. Investments.
(a) Schedule of Investments is included as part of the report to shareholders filed under Item 1 of this Form.
(b) Not applicable.
Item 7. Disclosure of Proxy Voting Policies and Procedures for Closed-End Management Investment Companies.
Not applicable to open-end investment companies.
Item 8. Portfolio Managers of Closed-End Management Investment Companies.
Not applicable to open-end investment companies.
Item 9. Purchases of Equity Securities by Closed-End Management Investment Company and Affiliated Purchasers.
Not applicable to open-end investment companies.
Item 10. Submission of Matters to a Vote of Security Holders.
There have been no material changes to the procedures by which shareholders may recommend nominees to the registrant’s board of Trustees.
Item 11. Controls and Procedures.
| (a) | The Registrant’s President/Principal Executive Officer and Treasurer/Principal Financial Officer have reviewed the Registrant’s disclosure controls and procedures (as defined in Rule 30a-3(c) under the Investment Company Act of 1940 (the “Act”)) as of a date within 90 days of the filing of this report, as required by Rule 30a-3(b) under the Act and Rules 13a-15(b) or 15d-15(b) under the Securities Exchange Act of 1934. Based on their review, such officers have concluded that the disclosure controls and procedures are effective in ensuring that information required to be disclosed in this report is appropriately recorded, processed, summarized and reported and made known to them by others within the Registrant and by the Registrant’s service provider. |
| (b) | There were no changes in the Registrant’s internal control over financial reporting (as defined in Rule 30a-3(d) under the Act) that occurred during the period covered by this report that have materially affected, or are reasonably likely to materially affect, the Registrant’s internal control over financial reporting. |
Item 12. Disclosure of Securities Lending Activities for Closed-End Management Investment Companies
Not applicable to open-end investment companies.
Item 13. Exhibits.
(2) A separate certification for each principal executive officer and principal financial officer pursuant to Section 302 of the Sarbanes-Oxley Act of 2002. Filed herewith.
(3) Any written solicitation to purchase securities under Rule 23c-1 under the Act sent or given during the period covered by the report by or on behalf of the registrant to 10 or more persons. Not applicable to open-end investment companies.
(4) Change in the registrant’s independent public accountant. There was no change in the registrant’s independent public accountant for the period covered by this report.
SIGNATURES
Pursuant to the requirements of the Securities Exchange Act of 1934 and the Investment Company Act of 1940, the registrant has duly caused this report to be signed on its behalf by the undersigned, thereunto duly authorized.
| | (Registrant) | Tidal ETF Trust | |
| | By (Signature and Title) | /s/ Eric W. Falkeis | |
| | | Eric W. Falkeis, President/Principal Executive Officer | |
Pursuant to the requirements of the Securities Exchange Act of 1934 and the Investment Company Act of 1940, this report has been signed below by the following persons on behalf of the registrant and in the capacities and on the dates indicated.
| | By (Signature and Title)* | /s/ Eric W. Falkeis | |
| | | Eric W. Falkeis, President/Principal Executive Officer | |
| | By (Signature and Title)* | /s/ Aaron J. Perkovich | |
| | | Aaron J. Perkovich, Treasurer/Principal Financial Officer | |
* Print the name and title of each signing officer under his or her signature.