Item 2. Code of Ethics.
The registrant has adopted a code of ethics that applies to the registrant’s principal executive officer and principal financial officer. The registrant has not made any substantive amendments to its code of ethics during the period covered by this report. The registrant has not granted any waivers from any provisions of the code of ethics during the period covered by this report.
A copy of the registrant’s Code of Ethics is filed herewith.
Item 3. Audit Committee Financial Expert.
The registrant’s Board of Trustees of the Trust has determined that there are at least two audit committee financial expert serving on its audit committee. Mr. Dusko Culafic and Mr. Eduardo Mendoza are the “audit committee financial experts” and are considered to be “independent” as each term is defined in Item 3 of Form N-CSR.
Item 4. Principal Accountant Fees and Services.
The registrant has engaged its principal accountant to perform audit services, audit-related services, tax services and other services during the past two fiscal years. “Audit services” refer to performing an audit of the registrant’s annual financial statements or services that are normally provided by the accountant in connection with statutory and regulatory filings or engagements for the fiscal year. “Audit-related services” refer to the assurance and related services by the principal accountant that are reasonably related to the performance of the audit. “Tax services” refer to professional services rendered by the principal accountant for tax compliance, tax advice, and tax planning. There were no “Other services” provided by the principal accountant. The following table details the aggregate fees billed or expected to be billed for each of the last two fiscal years for audit fees, audit-related fees, tax fees and other fees by the principal accountant.
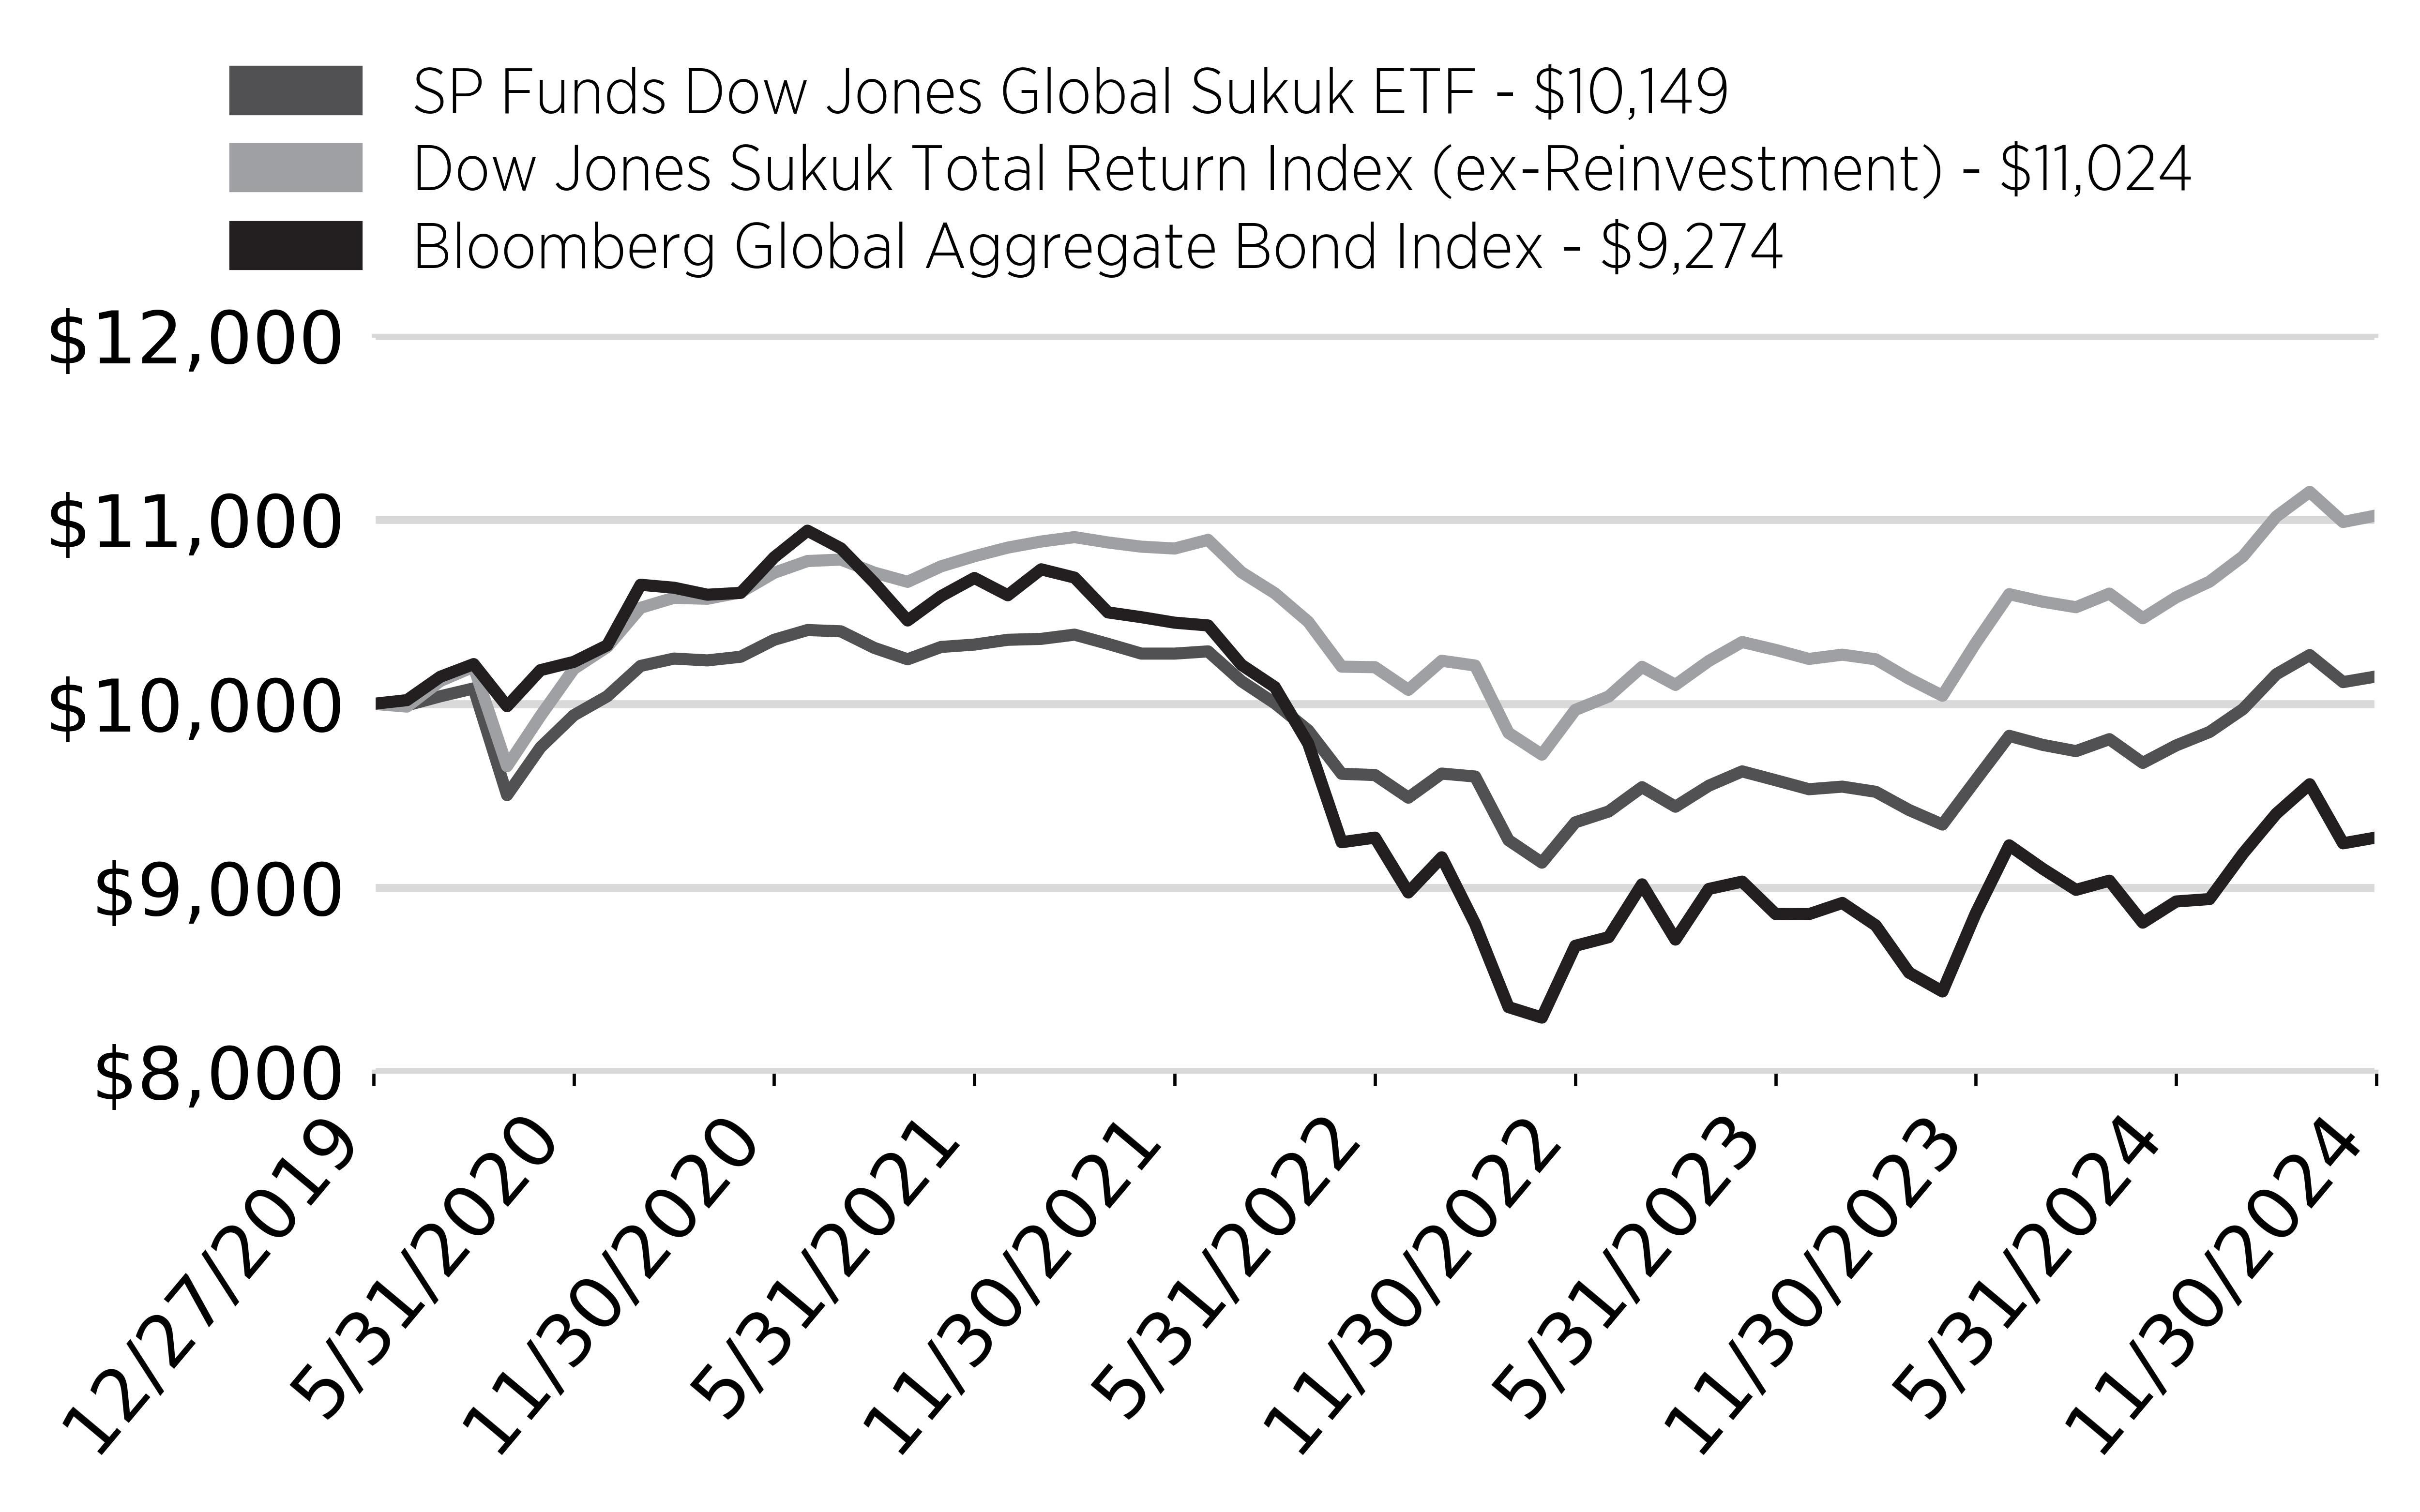
SP Funds Dow Jones Global Sukuk ETF
| | FYE 11/30/2024 | FYE 11/30/2023 |
| ( a ) Audit Fees | $13,125 | $13,125 |
| ( b ) Audit-Related Fees | N/A | N/A |
| ( c ) Tax Fees | $2,625 | $2,625 |
| ( d ) All Other Fees | N/A | N/A |
SP Funds S&P 500 Sharia Industry Exclusions ETF
| | FYE 11/30/2024 | FYE 11/30/2023 |
| ( a ) Audit Fees | $13,125 | $13,125 |
| ( b ) Audit-Related Fees | N/A | N/A |
| ( c ) Tax Fees | $2,625 | $2,625 |
| ( d ) All Other Fees | N/A | N/A |
SP Funds S&P Global REIT Sharia ETF
| | FYE 11/30/2024 | FYE 11/30/2023 |
| ( a ) Audit Fees | $13,125 | $13,125 |
| ( b ) Audit-Related Fees | N/A | N/A |
| ( c ) Tax Fees | $2,625 | $2,625 |
| ( d ) All Other Fees | N/A | N/A |
(e)(1) The audit committee has adopted pre-approval policies and procedures that require the audit committee to pre-approve all audit and non-audit services of the registrant, including services provided to any entity affiliated with the registrant.
(e)(2) The percentage of fees billed by Tait Weller & Baker LLP applicable to non-audit services pursuant to waiver of pre-approval requirement were as follows:
| | FYE 11/30/2024 | FYE 11/30/2023 |
| Audit-Related Fees | 0% | 0% |
| Tax Fees | 0% | 0% |
| All Other Fees | 0% | 0% |
(f) All of the principal accountant’s hours spent on auditing the registrant’s financial statements were attributed to work performed by full-time permanent employees of the principal accountant.
(g) The following table indicates the non-audit fees billed or expected to be billed by the registrant’s accountant for services to the registrant and to the registrant’s investment adviser (and any other controlling entity, etc.—not sub-adviser) for the last two years.
| Non-Audit Related Fees | FYE 11/30/2024 | FYE 11/30/2023 |
| Registrant | N/A | N/A |
| Registrant’s Investment Adviser | N/A | N/A |
(h) The audit committee of the board of trustees/directors has considered whether the provision of non-audit services that were rendered to the registrant’s investment adviser is compatible with maintaining the principal accountant’s independence and has concluded that the provision of such non-audit services by the accountant has not compromised the accountant’s independence.
(i) The registrant has not been identified by the U.S. Securities and Exchange Commission as having filed an annual report issued by a registered public accounting firm branch or office that is located in a foreign jurisdiction where the Public Company Accounting Oversight Board is unable to inspect or completely investigate because of a position taken by an authority in that jurisdiction.
(j) The registrant is not a foreign issuer.
Item 5. Audit Committee of Listed Registrants.
(a) The registrant is an issuer as defined in Rule 10A-3 under the Securities Exchange Act of 1934, (the “Act”) and has a separately-designated standing audit committee established in accordance with Section 3(a)(58)(A) of the Act. The independent members of the committee are as follows: Dusko Culafic, Eduardo Mendoza, and Mark H.W. Baltimore.
(b) Not applicable
Item 6. Investments.
| (a) | Schedule of Investments is included within the financial statements filed under Item 7 of this Form. |
Item 7. Financial Statements and Financial Highlights for Open-End Investment Companies.

Financial Statements
November 30, 2024
Tidal ETF Trust
| ● | SP Funds Dow Jones Global Sukuk ETF | | SPSK | | NYSE Arca, Inc. |
| ● | SP Funds S&P 500 Sharia Industry Exclusions ETF | | SPUS | | NYSE Arca, Inc. |
| ● | SP Funds S&P Global REIT Sharia ETF | | SPRE | | NYSE Arca, Inc. |
SP Funds ETFs
Table of Contents
| | SP Funds Dow Jones |
| Schedule of Investments | Global Sukuk ETF |
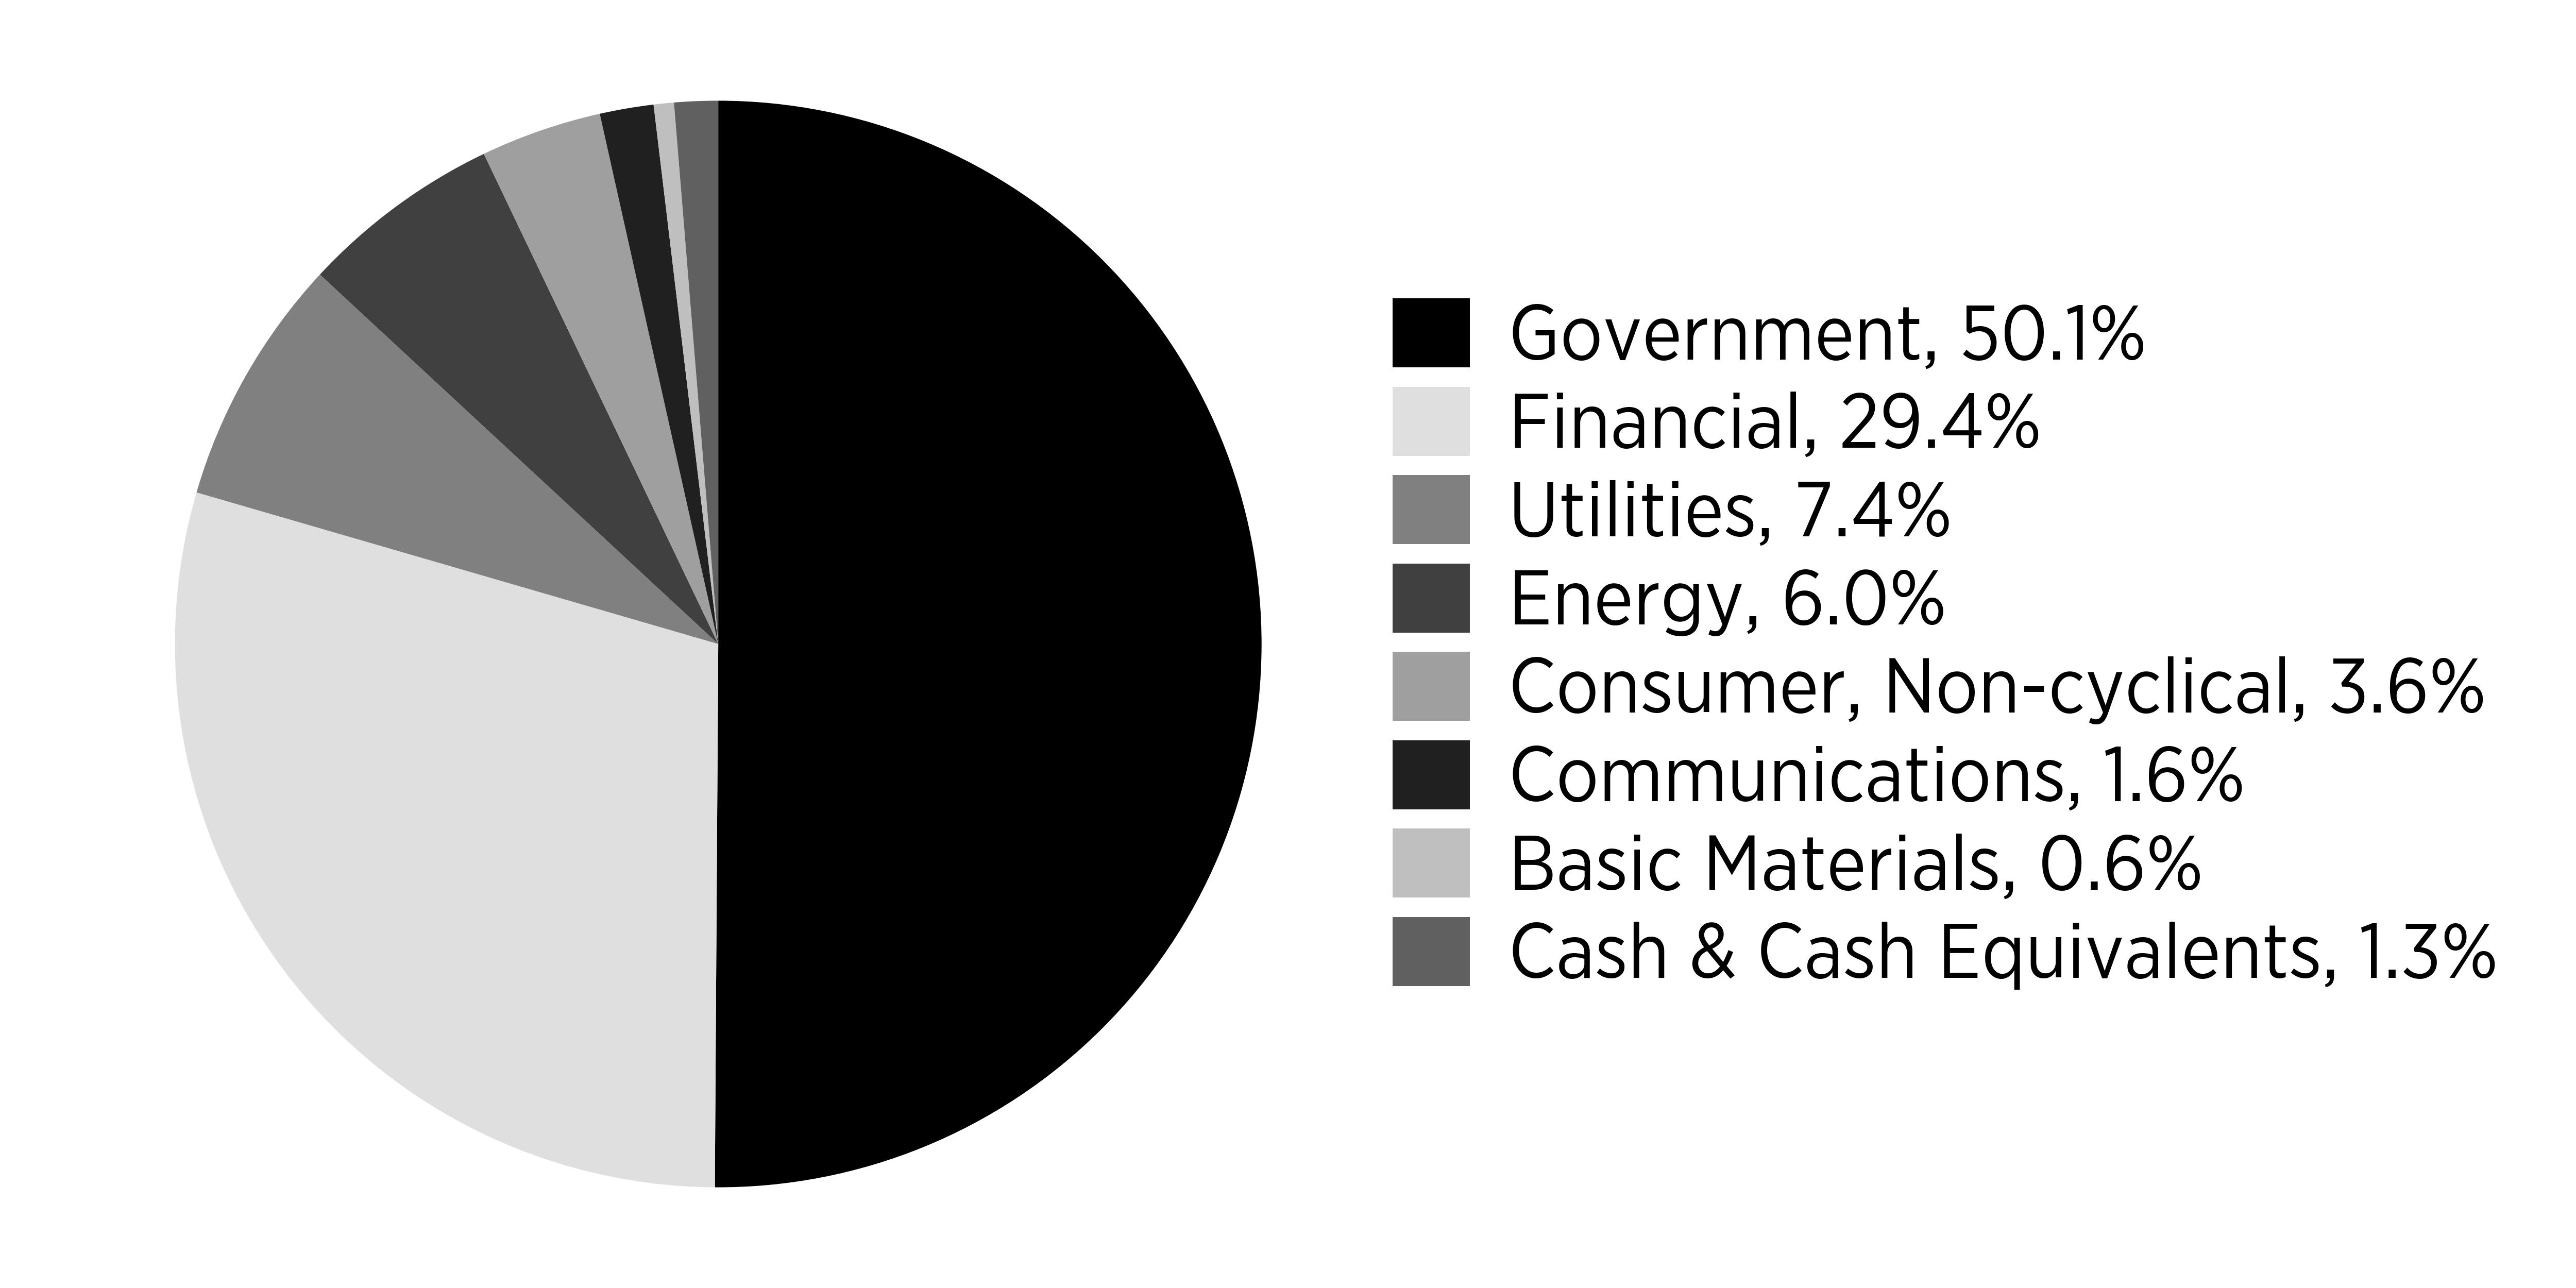
| FOREIGN GOVERNMENT SUKUK - 50.1% | | Par | | | Value | |
| Multi-National - 10.1% | | | | | | | | |
| ICDPS Sukuk Ltd., 4.95%, 02/14/2029 | | $ | 1,100,000 | | | $ | 1,104,425 | |
| Isdb Trust Services No. 2 SARL | | | | | | | | |
| 1.26%, 03/31/2026 | | | 4,800,000 | | | | 4,600,368 | |
| 1.44%, 10/21/2026 | | | 3,327,000 | | | | 3,142,310 | |
| 3.21%, 04/28/2027 | | | 3,400,000 | | | | 3,310,265 | |
| 4.75%, 10/27/2027 | | | 2,000,000 | | | | 2,017,776 | |
| 4.60%, 03/14/2028 | | | 3,900,000 | | | | 3,929,026 | |
| 4.91%, 10/03/2028 | | | 3,700,000 | | | | 3,773,783 | |
| 4.75%, 05/15/2029 | | | 3,700,000 | | | | 3,766,504 | |
| 4.05%, 10/15/2029 | | | 1,000,000 | | | | 984,784 | |
| | | | | | | | 26,629,241 | |
| | | | | | | | | |
| Sovereign - 40.0%(a) | | | | | | | | |
| Hong Kong Sukuk 2017 Ltd., 3.13%, 02/28/2027 | | | 2,000,000 | | | | 1,954,357 | |
| KSA Sukuk Ltd. | | | | | | | | |
| 3.63%, 04/20/2027 | | | 8,600,000 | | | | 8,411,927 | |
| 5.25%, 06/04/2027 | | | 2,500,000 | | | | 2,535,176 | |
| 5.27%, 10/25/2028 | | | 4,900,000 | | | | 5,000,438 | |
| 4.30%, 01/19/2029 | | | 4,000,000 | | | | 3,945,822 | |
| 4.27%, 05/22/2029 | | | 5,700,000 | | | | 5,613,344 | |
| 2.97%, 10/29/2029 | | | 4,900,000 | | | | 4,511,158 | |
| 5.25%, 06/04/2030 | | | 2,900,000 | | | | 2,950,968 | |
| 2.25%, 05/17/2031 | | | 3,900,000 | | | | 3,339,911 | |
| 4.51%, 05/22/2033 | | | 5,700,000 | | | | 5,550,731 | |
| 5.25%, 06/04/2034 | | | 4,500,000 | | | | 4,612,448 | |
| Malaysia Sovereign Sukuk Bhd., 4.24%, 04/22/2045 | | | 900,000 | | | | 837,550 | |
| Malaysia Sukuk Global Bhd. | | | | | | | | |
| 3.18%, 04/27/2026 | | | 1,850,000 | | | | 1,816,050 | |
| 4.08%, 04/27/2046 | | | 950,000 | | | | 857,721 | |
| Malaysia Wakala Sukuk Bhd. | | | | | | | | |
| 2.07%, 04/28/2031 | | | 1,650,000 | | | | 1,439,802 | |
| 3.08%, 04/28/2051 | | | 950,000 | | | | 708,791 | |
| Perusahaan Penerbit SBSN Indonesia III | | | | | | | | |
| 4.55%, 03/29/2026 | | | 3,400,000 | | | | 3,405,671 | |
| 1.50%, 06/09/2026 | | | 2,500,000 | | | | 2,385,206 | |
| 4.15%, 03/29/2027 | | | 3,900,000 | | | | 3,850,422 | |
| 4.40%, 06/06/2027 | | | 3,500,000 | | | | 3,469,438 | |
| 4.40%, 03/01/2028 | | | 3,400,000 | | | | 3,361,910 | |
| 5.40%, 11/15/2028 | | | 1,900,000 | | | | 1,936,858 | |
| 4.45%, 02/20/2029 | | | 2,500,000 | | | | 2,462,499 | |
| 5.10%, 07/02/2029 | | | 1,500,000 | | | | 1,512,937 | |
| 2.80%, 06/23/2030 | | | 2,000,000 | | | | 1,792,624 | |
| 2.55%, 06/09/2031 | | | 2,000,000 | | | | 1,738,869 | |
| 4.70%, 06/06/2032 | | | 3,000,000 | | | | 2,949,545 | |
| 5.60%, 11/15/2033 | | | 2,000,000 | | | | 2,078,211 | |
| 5.20%, 07/02/2034 | | | 2,000,000 | | | | 2,023,178 | |
| 3.80%, 06/23/2050 | | | 1,400,000 | | | | 1,095,693 | |
| 3.55%, 06/09/2051 | | | 1,400,000 | | | | 1,041,453 | |
| 5.50%, 07/02/2054 | | | 1,200,000 | | | | 1,206,659 | |
| ROP Sukuk Trust, 5.05%, 06/06/2029 | | | 2,100,000 | | | | 2,121,259 | |
| Sharjah Sukuk Program Ltd. | | | | | | | | |
| 3.85%, 04/03/2026 | | | 2,000,000 | | | | 1,963,415 | |
| 2.94%, 06/10/2027 | | | 2,000,000 | | | | 1,887,634 | |
| 4.23%, 03/14/2028 | | | 2,400,000 | | | | 2,331,618 | |
| The accompanying notes are an integral part of these financial statements. | 1 |
| | SP Funds Dow Jones |
| Schedule of Investments | Global Sukuk ETF |
| 3.23%, 10/23/2029 | | | 2,040,000 | | | | 1,858,037 | |
| 3.89%, 04/04/2030 | | | 1,400,000 | | | | 1,309,700 | |
| 3.20%, 07/13/2031 | | | 1,600,000 | | | | 1,407,546 | |
| 6.09%, 03/19/2034 | | | 1,800,000 | | | | 1,888,791 | |
| 5.43%, 04/17/2035 | | | 750,000 | | | | 747,392 | |
| | | | | | | | 105,912,759 | |
| TOTAL FOREIGN GOVERNMENT SUKUK (Cost $134,284,713) | | | | | | | 132,542,000 | |
| | | | | | | | | |
| CORPORATE SUKUK - 48.6% | | | | | | | | |
| Banks - 16.1% | | | | | | | | |
| Adib Sukuk Co. II Ltd., 5.70%, 11/15/2028 | | | 1,100,000 | | | | 1,131,869 | |
| Al Rajhi Sukuk Ltd. | | | | | | | | |
| 4.75%, 04/05/2028 | | | 2,200,000 | | | | 2,197,198 | |
| 5.05%, 03/12/2029 | | | 1,900,000 | | | | 1,918,264 | |
| AUB Sukuk Ltd., 2.62%, 09/09/2026 | | | 1,200,000 | | | | 1,145,418 | |
| Banque Saudi Fransi, 4.75%, 05/31/2028 | | | 1,900,000 | | | | 1,890,905 | |
| BBG Sukuk Ltd., 4.56%, 10/09/2029 | | | 750,000 | | | | 747,246 | |
| Boubyan Sukuk Ltd., 3.39%, 03/29/2027 | | | 1,000,000 | | | | 969,025 | |
| BSF Sukuk Co. Ltd., 5.00%, 01/25/2029 | | | 1,400,000 | | | | 1,406,468 | |
| DIB Sukuk Ltd. | | | | | | | | |
| 2.95%, 01/16/2026 | | | 2,600,000 | | | | 2,539,950 | |
| 1.96%, 06/22/2026 | | | 2,000,000 | | | | 1,907,042 | |
| 2.74%, 02/16/2027 | | | 1,400,000 | | | | 1,333,785 | |
| 5.49%, 11/30/2027 | | | 1,600,000 | | | | 1,625,899 | |
| 4.80%, 08/16/2028 | | | 2,000,000 | | | | 1,993,235 | |
| 5.24%, 03/04/2029 | | | 1,900,000 | | | | 1,920,143 | |
| EI Sukuk Co. Ltd. | | | | | | | | |
| 2.08%, 11/02/2026 | | | 1,000,000 | | | | 948,180 | |
| 5.43%, 05/28/2029 | | | 1,500,000 | | | | 1,538,184 | |
| Fab Sukuk Co. Ltd. | | | | | | | | |
| 1.41%, 01/14/2026 | | | 1,400,000 | | | | 1,346,861 | |
| 2.59%, 03/02/2027 | | | 1,000,000 | | | | 958,913 | |
| 4.58%, 01/17/2028 | | | 1,000,000 | | | | 999,111 | |
| 4.78%, 01/23/2029 | | | 1,600,000 | | | | 1,598,972 | |
| KFH Sukuk Co., 5.01%, 01/17/2029 | | | 2,100,000 | | | | 2,106,762 | |
| QIB Sukuk Ltd. | | | | | | | | |
| 5.58%, 11/22/2028 | | | 1,700,000 | | | | 1,759,075 | |
| 4.49%, 09/17/2029 | | | 1,600,000 | | | | 1,588,652 | |
| QIIB Senior Oryx Ltd., 5.25%, 01/24/2029 | | | 1,600,000 | | | | 1,637,791 | |
| SIB Sukuk Co. III Ltd., 5.25%, 07/03/2029 | | | 1,050,000 | | | | 1,066,270 | |
| SNB Sukuk Ltd. | | | | | | | | |
| 2.34%, 01/19/2027 | | | 1,600,000 | | | | 1,521,713 | |
| 5.13%, 02/27/2029 | | | 1,700,000 | | | | 1,713,653 | |
| Warba Sukuk Ltd., 5.35%, 07/10/2029 | | | 1,050,000 | | | | 1,063,654 | |
| | | | | | | | 42,574,238 | |
| | | | | | | | | |
| Chemicals - 0.6% | | | | | | | | |
| Equate Sukuk Spc Ltd., 5.00%, 09/05/2031 | | | 1,450,000 | | | | 1,460,380 | |
| | | | | | | | | |
| Commercial Services - 3.0% | | | | | | | | |
| D.P. World Crescent Ltd. | | | | | | | | |
| 4.85%, 09/26/2028 | | | 2,000,000 | | | | 1,990,699 | |
| 3.88%, 07/18/2029 | | | 2,000,000 | | | | 1,908,946 | |
| 3.75%, 01/30/2030 | | | 1,000,000 | | | | 944,755 | |
| DP World Crescent Ltd., 5.50%, 09/13/2033 | | | 3,000,000 | | | | 3,056,160 | |
| | | | | | | | 7,900,560 | |
| The accompanying notes are an integral part of these financial statements. | 2 |
| | SP Funds Dow Jones |
| Schedule of Investments | Global Sukuk ETF |
| Diversified Financial Services - 1.0% | | | | | | |
| AIR Lease Corp. Sukuk Ltd., 5.85%, 04/01/2028 | | | 1,200,000 | | | | 1,224,417 | |
| DAE Sukuk Difc Ltd., 3.75%, 02/15/2026 | | | 1,400,000 | | | | 1,377,531 | |
| | | | | | | | 2,601,948 | |
| | | | | | | | | |
| Electric - 7.4% | | | | | | | | |
| Saudi Electricity Global Sukuk Co. 2, 5.06%, 04/08/2043 | | | 2,000,000 | | | | 1,912,903 | |
| Saudi Electricity Global Sukuk Co. 3, 5.50%, 04/08/2044 | | | 2,000,000 | | | | 1,990,264 | |
| Saudi Electricity Global Sukuk Co. 4, 4.72%, 09/27/2028 | | | 2,400,000 | | | | 2,401,332 | |
| Saudi Electricity Global Sukuk Co. 5, 2.41%, 09/17/2030 | | | 1,200,000 | | | | 1,049,716 | |
| Saudi Electricity Sukuk Programme Co. | | | | | | | | |
| 4.94%, 02/13/2029 | | | 1,600,000 | | | | 1,609,912 | |
| 4.63%, 04/11/2033 | | | 2,300,000 | | | | 2,276,489 | |
| 5.19%, 02/13/2034 | | | 2,700,000 | | | | 2,737,084 | |
| 5.68%, 04/11/2053 | | | 2,900,000 | | | | 2,866,885 | |
| TNB Global Ventures Capital Bhd. | | | | | | | | |
| 3.24%, 10/19/2026 | | | 1,400,000 | | | | 1,359,539 | |
| 4.85%, 11/01/2028 | | | 1,400,000 | | | | 1,404,614 | |
| | | | | | | | 19,608,738 | |
| | | | | | | | | |
| Food - 0.6% | | | | | | | | |
| Almarai Co. JSC, 5.23%, 07/25/2033 | | | 1,500,000 | | | | 1,536,990 | |
| | | | | | | | | |
| Investment Companies – 8.1% | | | | | | | | |
| Aercap Sukuk Ltd., 4.50%, 10/03/2029 | | | 750,000 | | | | 726,686 | |
| Dua Capital Ltd. | | | | | | | | |
| 1.66%, 05/11/2026 | | | 800,000 | | | | 764,087 | |
| 2.78%, 05/11/2031 | | | 1,200,000 | | | | 1,064,834 | |
| Khazanah Global Sukuk Bhd., | | | | | | | | |
| 4.69%, 06/01/2028 | | | 1,500,000 | | | | 1,500,300 | |
| 4.48%, 09/05/2029 | | | 1,000,000 | | | | 990,665 | |
| Mdgh Sukuk Ltd., 4.96%, 04/04/2034 | | | 1,900,000 | | | | 1,918,141 | |
| Senaat Sukuk Ltd., 4.76%, 12/05/2025 | | | 600,000 | | | | 598,247 | |
| Suci Second Investment Co. | | | | | | | | |
| 4.38%, 09/10/2027 | | | 2,950,000 | | | | 2,906,758 | |
| 6.00%, 10/25/2028 | | | 4,300,000 | | | | 4,468,884 | |
| 5.17%, 03/05/2031 | | | 4,000,000 | | | | 4,066,110 | |
| 6.25%, 10/25/2033 | | | 2,400,000 | | | | 2,609,739 | |
| | | | | | | | 21,614,451 | |
| | | | | | | | | |
| Oil & Gas - 4.8% | | | | | | | | |
| EDO Sukuk Ltd. | | | | | | | | |
| 5.66%, 07/03/2031 | | | 750,000 | | | | 760,335 | |
| 5.88%, 09/21/2033 | | | 500,000 | | | | 515,500 | |
| SA Global Sukuk Ltd. | | | | | | | | |
| 1.60%, 06/17/2026 | | | 4,000,000 | | | | 3,809,420 | |
| 4.25%, 10/02/2029 | | | 1,200,000 | | | | 1,176,720 | |
| 2.69%, 06/17/2031 | | | 5,800,000 | | | | 5,107,625 | |
| 4.75%, 10/02/2034 | | | 1,200,000 | | | | 1,188,751 | |
| | | | | | | | 12,558,351 | |
| | | | | | | | | |
| Pipelines - 1.2% | | | | | | | | |
| TMS Issuer SARL, 5.78%, 08/23/2032 | | | 3,000,000 | | | | 3,079,542 | |
| | | | | | | | | |
| Real Estate - 4.2% | | | | | | | | |
| Aldar Investment Properties Sukuk Ltd. | | | | | | | | |
| 4.88%, 05/24/2033 | | | 1,000,000 | | | | 987,703 | |
| 5.50%, 05/16/2034 | | | 1,000,000 | | | | 1,030,056 | |
| The accompanying notes are an integral part of these financial statements. | 3 |
| | SP Funds Dow Jones |
| Schedule of Investments | Global Sukuk ETF |
| Aldar Sukuk No. 2 Ltd., 3.88%, 10/22/2029 | | | 1,000,000 | | | | 953,396 | |
| Emaar Sukuk Ltd. | | | | | | | | |
| 3.64%, 09/15/2026 | | | 1,600,000 | | | | 1,564,238 | |
| 3.88%, 09/17/2029 | | | 1,000,000 | | | | 956,404 | |
| 3.70%, 07/06/2031 | | | 1,000,000 | | | | 931,848 | |
| Esic Sukuk Ltd., 5.83%, 02/14/2029 | | | 1,400,000 | | | | 1,428,021 | |
| MAF Sukuk Ltd. | | | | | | | | |
| 4.64%, 05/14/2029 | | | 1,200,000 | | | | 1,186,644 | |
| 3.93%, 02/28/2030 | | | 1,200,000 | | | | 1,143,962 | |
| 5.00%, 06/01/2033 | | | 1,000,000 | | | | 1,000,695 | |
| | | | | | | | 11,182,967 | |
| | | | | | | | | |
| Telecommunications - 1.6% | | | | | | | | |
| Axiata SPV2 Bhd. | | | | | | | | |
| 4.36%, 03/24/2026 | | | 1,000,000 | | | | 992,624 | |
| 2.16%, 08/19/2030 | | | 1,000,000 | | | | 864,821 | |
| Saudi Telecom Co., 3.89%, 05/13/2029 | | | 2,400,000 | | | | 2,338,611 | |
| | | | | | | | 4,196,056 | |
| TOTAL CORPORATE SUKUK (Cost $128,803,341) | | | | | | | 128,314,221 | |
| | | | | | | | | |
| TOTAL INVESTMENTS - 98.7% (Cost $263,088,054) | | | | | | | 260,856,221 | |
| Other Assets in Excess of Liabilities - 1.3% | | | | | | | 3,440,126 | |
| TOTAL NET ASSETS - 100.0% | | | | | | $ | 264,296,347 | |
Percentages are stated as a percent of net assets.
SPV2 - Special-Purpose Vehicle2
| (a) | To the extent that the Fund invests more heavily in a particular industry or sector of the economy, its performance will be especially sensitive to developments that significantly affect those industries or sectors. |
| The accompanying notes are an integral part of these financial statements. | 4 |
| | SP Funds S&P 500 Sharia |
| Schedule of Investments | Industry Exclusions ETF |
| | | | | | | |
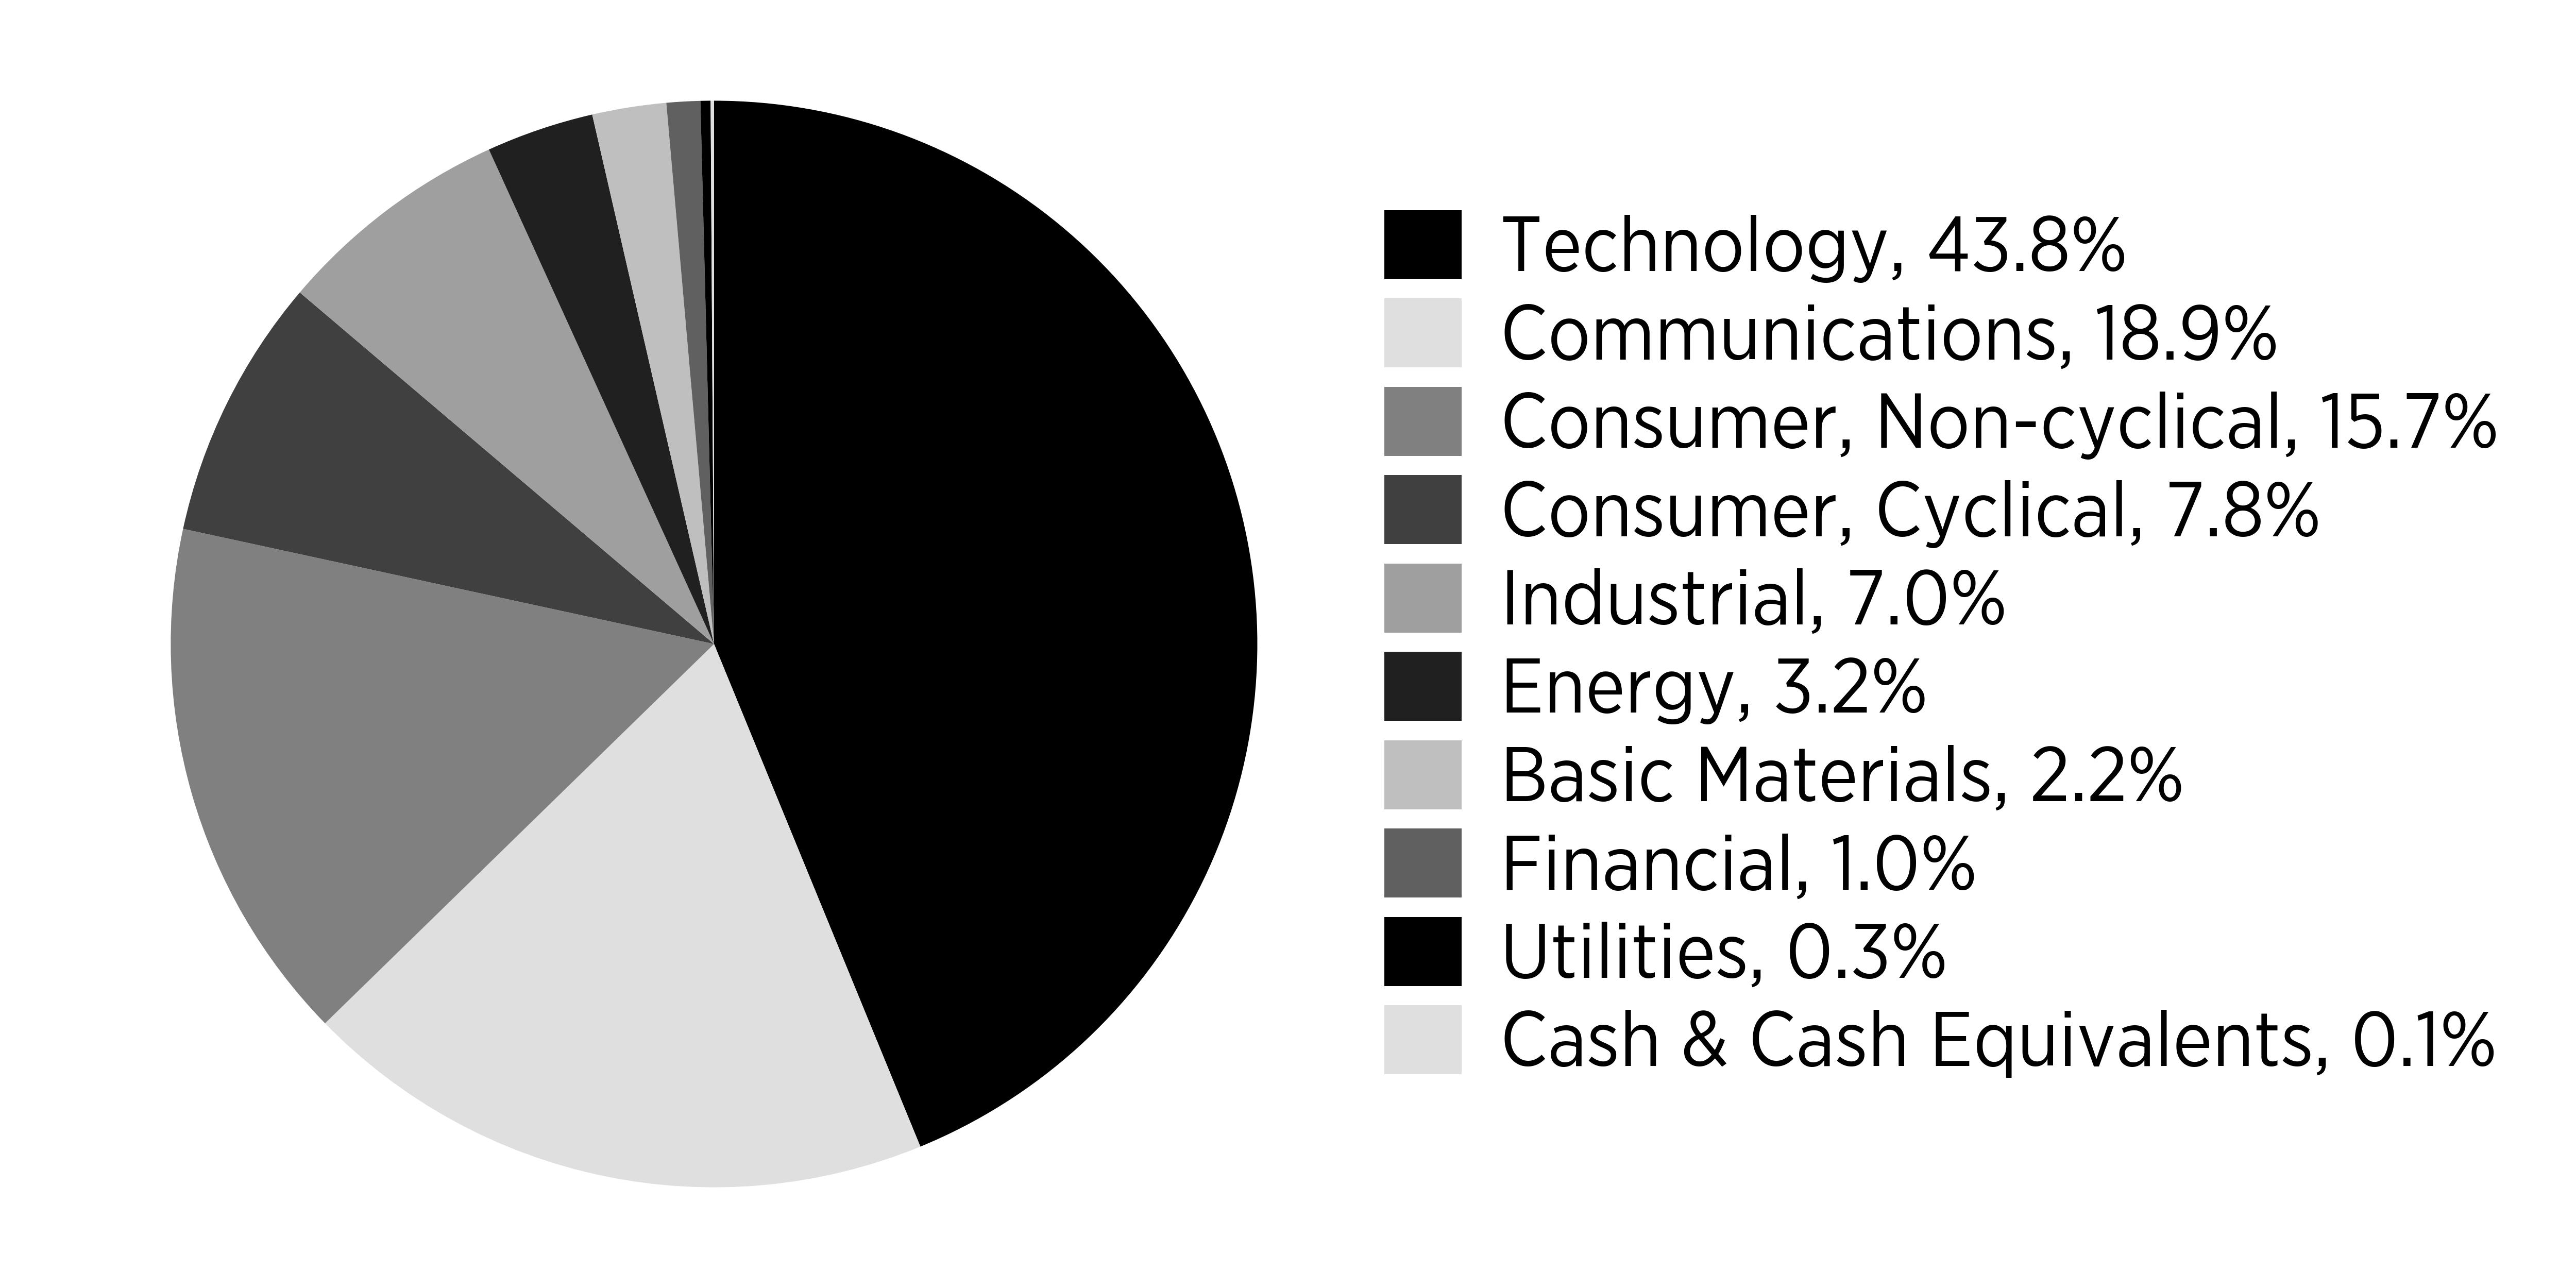
| COMMON STOCKS - 98.9% | | Shares | | | Value | |
| Agriculture - 0.1% | | | | | | | | |
| Archer-Daniels-Midland Co. | | | 13,916 | | | $ | 759,814 | |
| | | | | | | | | |
| Apparel - 0.4% | | | | | | | | |
| Deckers Outdoor Corp. (a) | | | 4,436 | | | | 869,278 | |
| Nike, Inc. - Class B | | | 34,966 | | | | 2,754,272 | |
| Ralph Lauren Corp. | | | 1,162 | | | | 268,887 | |
| | | | | | | | 3,892,437 | |
| | | | | | | | | |
| Auto Manufacturers - 3.2% | | | | | | | | |
| Cummins, Inc. | | | 3,983 | | | | 1,493,784 | |
| Tesla, Inc. (a) | | | 80,755 | | | | 27,873,396 | |
| | | | | | | | 29,367,180 | |
| | | | | | | | | |
| Auto Parts & Equipment - 0.0%(b) | | | | | | | | |
| Aptiv PLC (a) | | | 7,726 | | | | 429,025 | |
| | | | | | | | | |
| Beverages - 0.9% | | | | | | | | |
| Keurig Dr Pepper, Inc. | | | 32,761 | | | | 1,069,647 | |
| Monster Beverage Corp. (a) | | | 20,520 | | | | 1,131,267 | |
| PepsiCo, Inc. | | | 39,977 | | | | 6,534,241 | |
| | | | | | | | 8,735,155 | |
| | | | | | | | | |
| Biotechnology - 0.9% | | | | | | | | |
| Biogen, Inc. (a) | | | 4,231 | | | | 679,626 | |
| Corteva, Inc. | | | 20,146 | | | | 1,253,887 | |
| Gilead Sciences, Inc. | | | 36,228 | | | | 3,353,988 | |
| Incyte Corp. (a) | | | 4,649 | | | | 346,769 | |
| Regeneron Pharmaceuticals, Inc. (a) | | | 3,083 | | | | 2,312,928 | |
| | | | | | | | 7,947,198 | |
| | | | | | | | | |
| Building Materials - 0.8% | | | | | | | | |
| Builders FirstSource, Inc. (a) | | | 3,380 | | | | 630,269 | |
| Johnson Controls International PLC | | | 19,439 | | | | 1,630,154 | |
| Martin Marietta Materials, Inc. | | | 1,778 | | | | 1,066,800 | |
| Masco Corp. | | | 6,349 | | | | 511,475 | |
| Mohawk Industries, Inc. (a) | | | 1,517 | | | | 210,605 | |
| Trane Technologies PLC | | | 6,562 | | | | 2,731,236 | |
| Vulcan Materials Co. | | | 3,839 | | | | 1,106,131 | |
| | | | | | | | 7,886,670 | |
| | | | | | | | | |
| Chemicals - 1.7% | | | | | | | | |
| Air Products and Chemicals, Inc. | | | 6,466 | | | | 2,161,778 | |
| Albemarle Corp. | | | 3,411 | | | | 367,365 | |
| CF Industries Holdings, Inc. | | | 5,281 | | | | 473,494 | |
| DuPont de Nemours, Inc. | | | 12,151 | | | | 1,015,702 | |
| Ecolab, Inc. | | | 7,366 | | | | 1,832,440 | |
| Linde PLC | | | 13,990 | | | | 6,449,250 | |
| PPG Industries, Inc. | | | 6,782 | | | | 843,477 | |
| The Mosaic Co. | | | 9,267 | | | | 245,205 | |
| The Sherwin-Williams Co. | | | 6,759 | | | | 2,686,027 | |
| | | | | | | | 16,074,738 | |
| | | | | | | | | |
| Commercial Services - 0.5% | | | | | | | | |
| Cintas Corp. | | | 9,985 | | | | 2,254,513 | |
| The accompanying notes are an integral part of these financial statements. | 5 |
| | SP Funds S&P 500 Sharia |
| Schedule of Investments | Industry Exclusions ETF |
| Equifax, Inc. | | | 3,600 | | | | 941,616 | |
| Quanta Services, Inc. | | | 4,279 | | | | 1,474,201 | |
| Rollins, Inc. | | | 8,171 | | | | 411,247 | |
| | | | | | | | 5,081,577 | |
| | | | | | | | | |
| Computers - 12.8% | | | | | | | | |
| Accenture PLC - Class A | | | 18,231 | | | | 6,606,368 | |
| Apple, Inc. | | | 442,529 | | | | 105,025,408 | |
| Cognizant Technology Solutions Corp. - Class A | | | 14,420 | | | | 1,160,666 | |
| EPAM Systems, Inc. (a) | | | 1,648 | | | | 401,980 | |
| Fortinet, Inc. (a) | | | 18,475 | | | | 1,756,049 | |
| Gartner, Inc. (a) | | | 2,237 | | | | 1,158,609 | |
| HP, Inc. | | | 28,473 | | | | 1,008,798 | |
| NetApp, Inc. | | | 5,974 | | | | 732,651 | |
| Super Micro Computer, Inc. (a) | | | 14,648 | | | | 478,111 | |
| | | | | | | | 118,328,640 | |
| | | | | | | | | |
| Cosmetics & Personal Care - 1.8% | | | | | | | | |
| Colgate-Palmolive Co. | | | 23,777 | | | | 2,297,571 | |
| Kenvue, Inc. | | | 55,739 | | | | 1,342,195 | |
| The Estee Lauder Company, Inc. - Class A | | | 6,774 | | | | 488,541 | |
| The Procter & Gamble Co. | | | 68,515 | | | | 12,281,999 | |
| | | | | | | | 16,410,306 | |
| | | | | | | | | |
| Distribution & Wholesale - 0.6% | | | | | | | | |
| Copart, Inc. (a) | | | 25,483 | | | | 1,615,367 | |
| Fastenal Co. | | | 16,665 | | | | 1,392,527 | |
| LKQ Corp. | | | 7,654 | | | | 300,726 | |
| Pool Corp. | | | 1,111 | | | | 418,947 | |
| W.W. Grainger, Inc. | | | 1,288 | | | | 1,552,478 | |
| | | | | | | | 5,280,045 | |
| | | | | | | | | |
| Electric - 0.3% | | | | | | | | |
| Constellation Energy Corp. | | | 9,110 | | | | 2,337,262 | |
| | | | | | | | | |
| Electrical Components & Equipment - 0.9% | | | | | | | | |
| AMETEK, Inc. | | | 6,731 | | | | 1,308,372 | |
| Eaton Corp. PLC | | | 11,583 | | | | 4,348,490 | |
| Emerson Electric Co. | | | 16,734 | | | | 2,218,928 | |
| Generac Holdings, Inc. (a) | | | 1,751 | | | | 329,538 | |
| | | | | | | | 8,205,328 | |
| | | | | | | | | |
| Electronics - 1.5% | | | | | | | | |
| Allegion PLC | | | 2,527 | | | | 355,903 | |
| Amphenol Corp. - Class A | | | 35,047 | | | | 2,546,164 | |
| Fortive Corp. | | | 10,189 | | | | 808,293 | |
| Garmin Ltd. | | | 4,474 | | | | 951,172 | |
| Honeywell International, Inc. | | | 19,047 | | | | 4,436,618 | |
| Hubbell, Inc. | | | 1,554 | | | | 714,980 | |
| Jabil, Inc. | | | 3,296 | | | | 447,696 | |
| Keysight Technologies, Inc. (a) | | | 5,071 | | | | 866,330 | |
| Mettler-Toledo International, Inc. (a) | | | 610 | | | | 763,232 | |
| TE Connectivity PLC | | | 8,844 | | | | 1,336,505 | |
| Trimble, Inc. (a) | | | 7,106 | | | | 518,525 | |
| | | | | | | | 13,745,418 | |
| | | | | | | | | |
| Energy - Alternate Sources - 0.1% | | | | | | | | |
| The accompanying notes are an integral part of these financial statements. | 6 |
| Schedule of Investments | SP Funds S&P 500 Sharia Industry Exclusions ETF |
| November 30, 2024 | | | | | | |
| | | | | | | |
| Enphase Energy, Inc. (a) | | | 3,936 | | | | 280,833 | |
| First Solar, Inc. (a) | | | 3,110 | | | | 619,730 | |
| | | | | | | | 900,563 | |
| Engineering & Construction - 0.1% | | | | | | | | |
| Jacobs Solutions, Inc. | | | 3,642 | | | | 514,360 | |
| | | | | | | | | |
| Environmental Control - 0.5% | | | | | | | | |
| Pentair PLC | | | 4,811 | | | | 524,351 | |
| Republic Services, Inc. | | | 5,933 | | | | 1,295,174 | |
| Veralto Corp. | | | 7,189 | | | | 777,778 | |
| Waste Management, Inc. | | | 10,627 | | | | 2,425,294 | |
| | | | | | | | 5,022,597 | |
| Food - 0.6% | | | | | | | | |
| General Mills, Inc. | | | 16,194 | | | | 1,073,014 | |
| Kellanova | | | 7,804 | | | | 634,387 | |
| Lamb Weston Holdings, Inc. | | | 4,173 | | | | 322,323 | |
| McCormick & Co., Inc. | | | 7,330 | | | | 574,745 | |
| Mondelez International, Inc. - Class A | | | 38,871 | | | | 2,524,671 | |
| The Hershey Co. | | | 4,289 | | | | 755,422 | |
| | | | | | | | 5,884,562 | |
| Healthcare - Products - 4.7% | | | | | | | | |
| Abbott Laboratories | | | 50,636 | | | | 6,014,038 | |
| Agilent Technologies, Inc. | | | 8,484 | | | | 1,170,537 | |
| Align Technology, Inc. (a) | | | 2,040 | | | | 474,851 | |
| Bio-Techne Corp. | | | 4,584 | | | | 345,450 | |
| Boston Scientific Corp. (a) | | | 42,857 | | | | 3,885,416 | |
| Danaher Corp. | | | 18,702 | | | | 4,482,682 | |
| Edwards Lifesciences Corp. (a) | | | 17,531 | | | | 1,250,837 | |
| GE HealthCare Technologies, Inc. | | | 13,294 | | | | 1,106,327 | |
| Hologic, Inc. (a) | | | 6,752 | | | | 536,784 | |
| IDEXX Laboratories, Inc. (a) | | | 2,388 | | | | 1,007,139 | |
| Insulet Corp. (a) | | | 2,037 | | | | 543,431 | |
| Intuitive Surgical, Inc. (a) | | | 10,315 | | | | 5,590,730 | |
| Medtronic PLC | | | 37,330 | | | | 3,230,538 | |
| ResMed, Inc. | | | 4,267 | | | | 1,062,568 | |
| STERIS PLC | | | 2,867 | | | | 628,045 | |
| Stryker Corp. | | | 9,974 | | | | 3,911,304 | |
| Teleflex, Inc. | | | 1,368 | | | | 263,819 | |
| The Cooper Cos., Inc. (a) | | | 5,789 | | | | 604,719 | |
| Thermo Fisher Scientific, Inc. | | | 11,110 | | | | 5,884,189 | |
| Waters Corp. (a) | | | 1,718 | | | | 660,949 | |
| West Pharmaceutical Services, Inc. | | | 2,107 | | | | 686,208 | |
| Zimmer Biomet Holdings, Inc. | | | 5,919 | | | | 663,520 | |
| | | | | | | | 44,004,081 | |
| Healthcare - Services - 0.1% | | | | | | | | |
| Charles River Laboratories International, Inc. (a) | | | 1,495 | | | | 297,595 | |
| Labcorp Holdings, Inc. | | | 2,436 | | | | 587,466 | |
| Molina Healthcare, Inc. (a) | | | 1,696 | | | | 505,238 | |
| | | | | | | | 1,390,299 | |
| Home Builders - 0.2% | | | | | | | | |
| D.R. Horton, Inc. | | | 8,532 | | | | 1,440,031 | |
| PulteGroup, Inc. | | | 6,030 | | | | 815,678 | |
| | | | | | | | 2,255,709 | |
| The accompanying notes are an integral part of these financial statements. | 7 |
| Schedule of Investments | SP Funds S&P 500 Sharia Industry Exclusions ETF |
November 30, 2024
| Household Products & Wares - 0.3% | | | | | | |
| Avery Dennison Corp. | | | 2,337 | | | | 481,305 | |
| Church & Dwight Co., Inc. | | | 7,142 | | | | 786,548 | |
| Kimberly-Clark Corp. | | | 9,800 | | | | 1,365,630 | |
| The Clorox Co. | | | 3,603 | | | | 602,314 | |
| | | | | | | | 3,235,797 | |
| Internet - 17.4% | | | | | | | | |
| Alphabet, Inc. - Class A | | | 170,532 | | | | 28,811,382 | |
| Alphabet, Inc. - Class C | | | 139,794 | | | | 23,833,479 | |
| Amazon.com, Inc. (a) | | | 271,880 | | | | 56,521,133 | |
| Booking Holdings, Inc. | | | 974 | | | | 5,066,729 | |
| CDW Corp. | | | 3,883 | | | | 683,136 | |
| eBay, Inc. | | | 14,228 | | | | 900,490 | |
| F5, Inc. (a) | | | 1,687 | | | | 422,341 | |
| Meta Platforms, Inc. - Class A | | | 63,584 | | | | 36,517,563 | |
| Palo Alto Networks, Inc. (a) | | | 9,416 | | | | 3,651,713 | |
| Uber Technologies, Inc. (a) | | | 61,143 | | | | 4,399,850 | |
| VeriSign, Inc. (a) | | | 2,435 | | | | 455,783 | |
| | | | | | | | 161,263,599 | |
| Iron & Steel - 0.2% | | | | | | | | |
| Nucor Corp. | | | 6,898 | | | | 1,067,051 | |
| Steel Dynamics, Inc. | | | 4,169 | | | | 605,631 | |
| | | | | | | | 1,672,682 | |
| Machinery - Diversified - 0.8% | | | | | | | | |
| Dover Corp. | | | 3,995 | | | | 822,571 | |
| IDEX Corp. | | | 2,198 | | | | 506,925 | |
| Ingersoll Rand, Inc. | | | 11,738 | | | | 1,222,747 | |
| Nordson Corp. | | | 1,575 | | | | 411,059 | |
| Otis Worldwide Corp. | | | 11,699 | | | | 1,204,763 | |
| Rockwell Automation, Inc. | | | 3,294 | | | | 972,191 | |
| Westinghouse Air Brake Technologies Corp. | | | 5,090 | | | | 1,021,156 | |
| Xylem, Inc. | | | 7,068 | | | | 895,869 | |
| | | | | | | | 7,057,281 | |
| Mining - 0.3% | | | | | | | | |
| Freeport-McMoRan, Inc. | | | 41,818 | | | | 1,848,356 | |
| Newmont Corp. | | | 33,391 | | | | 1,400,418 | |
| | | | | | | | 3,248,774 | |
| Miscellaneous Manufacturers - 0.8% | | | | | | | | |
| 3M Co. | | | 16,069 | | | | 2,145,693 | |
| A.O. Smith Corp. | | | 3,491 | | | | 260,045 | |
| Illinois Tool Works, Inc. | | | 7,863 | | | | 2,182,140 | |
| Parker-Hannifin Corp. | | | 3,738 | | | | 2,627,440 | |
| | | | | | | | 7,215,318 | |
| Office & Business Equipment - 0.1% | | | | | | | | |
| Zebra Technologies Corp. - Class A (a) | | | 1,494 | | | | 608,058 | |
| | | | | | | | | |
| Oil & Gas - 2.7% | | | | | | | | |
| ConocoPhillips | | | 33,799 | | | | 3,661,784 | |
| Coterra Energy, Inc. | | | 21,509 | | | | 574,720 | |
| The accompanying notes are an integral part of these financial statements. | 8 |
| Schedule of Investments | SP Funds S&P 500 Sharia Industry Exclusions ETF |
| November 30, 2024 | | | | | | |
| | | | | | | |
| Devon Energy Corp. | | | 18,214 | | | | 691,221 | |
| EOG Resources, Inc. | | | 16,548 | | | | 2,205,186 | |
| Exxon Mobil Corp. | | | 129,309 | | | | 15,253,290 | |
| Hess Corp. | | | 8,042 | | | | 1,183,622 | |
| Valero Energy Corp. | | | 9,317 | | | | 1,295,808 | |
| | | | | | | | 24,865,631 | |
| Oil & Gas Services - 0.4% | | | | | | | | |
| Baker Hughes Co. | | | 28,911 | | | | 1,270,638 | |
| Halliburton Co. | | | 25,689 | | | | 818,452 | |
| Schlumberger NV | | | 41,323 | | | | 1,815,733 | |
| | | | | | | | 3,904,823 | |
| Packaging & Containers - 0.1% | | | | | | | | |
| Packaging Corp. of America | | | 2,597 | | | | 646,263 | |
| | | | | | | | | |
| Pharmaceuticals - 5.8% | | | | | | | | |
| AbbVie, Inc. | | | 51,407 | | | | 9,403,883 | |
| Becton Dickinson & Co. | | | 8,406 | | | | 1,865,291 | |
| Cardinal Health, Inc. | | | 7,095 | | | | 867,293 | |
| Cencora, Inc. | | | 5,080 | | | | 1,277,874 | |
| Dexcom, Inc. (a) | | | 11,659 | | | | 909,285 | |
| Eli Lilly & Co. | | | 22,993 | | | | 18,287,483 | |
| Henry Schein, Inc. (a) | | | 3,685 | | | | 283,929 | |
| Johnson & Johnson | | | 70,066 | | | | 10,860,931 | |
| McKesson Corp. | | | 3,771 | | | | 2,370,073 | |
| Merck & Co., Inc. | | | 73,776 | | | | 7,498,593 | |
| | | | | | | | 53,624,635 | |
| Retail - 3.4% | | | | | | | | |
| AutoZone, Inc. (a) | | | 491 | | | | 1,556,244 | |
| Best Buy Co., Inc. | | | 5,707 | | | | 513,630 | |
| Genuine Parts Co. | | | 4,048 | | | | 513,003 | |
| Lowe’s Company, Inc. | | | 16,584 | | | | 4,517,979 | |
| Lululemon Athletica, Inc. (a) | | | 3,339 | | | | 1,070,684 | |
| O’Reilly Automotive, Inc. (a) | | | 1,679 | | | | 2,087,366 | |
| Ross Stores, Inc. | | | 9,707 | | | | 1,503,323 | |
| Target Corp. | | | 13,460 | | | | 1,780,893 | |
| The Home Depot, Inc. | | | 28,858 | | | | 12,383,834 | |
| The TJX Company, Inc. | | | 32,894 | | | | 4,134,447 | |
| Tractor Supply Co. | | | 3,133 | | | | 888,738 | |
| Ulta Beauty, Inc. (a) | | | 1,383 | | | | 534,723 | |
| | | | | | | | 31,484,864 | |
| Semiconductors - 17.2% | | | | | | | | |
| Advanced Micro Devices, Inc. (a) | | | 47,103 | | | | 6,461,354 | |
| Analog Devices, Inc. | | | 14,436 | | | | 3,147,770 | |
| Applied Materials, Inc. | | | 24,091 | | | | 4,208,939 | |
| Broadcom, Inc. | | | 135,480 | | | | 21,958,598 | |
| KLA Corp. | | | 3,907 | | | | 2,527,946 | |
| Lam Research Corp. | | | 37,939 | | | | 2,802,933 | |
| Microchip Technology, Inc. | | | 15,606 | | | | 1,063,861 | |
| Micron Technology, Inc. | | | 32,271 | | | | 3,160,944 | |
| Monolithic Power Systems, Inc. | | | 1,413 | | | | 802,075 | |
| NVIDIA Corp. | | | 716,006 | | | | 98,987,830 | |
| NXP Semiconductors NV | | | 7,409 | | | | 1,699,402 | |
| ON Semiconductor Corp. (a) | | | 12,464 | | | | 886,440 | |
| The accompanying notes are an integral part of these financial statements. | 9 |
| Schedule of Investments | SP Funds S&P 500 Sharia Industry Exclusions ETF |
| November 30, 2024 | | | | | | |
| | | | | | | |
| Qorvo, Inc. (a) | | | 2,759 | | | | 190,509 | |
| QUALCOMM, Inc. | | | 32,419 | | | | 5,139,384 | |
| Skyworks Solutions, Inc. | | | 4,645 | | | | 406,856 | |
| Teradyne, Inc. | | | 4,745 | | | | 521,950 | |
| Texas Instruments, Inc. | | | 26,568 | | | | 5,340,965 | |
| | | | | | | | 159,307,756 | |
| Software - 13.7% | | | | | | | | |
| Adobe, Inc. (a) | | | 12,897 | | | | 6,653,949 | |
| Akamai Technologies, Inc. (a) | | | 4,409 | | | | 414,534 | |
| ANSYS, Inc. (a) | | | 2,534 | | | | 889,687 | |
| Autodesk, Inc. (a) | | | 6,268 | | | | 1,829,629 | |
| Cadence Design Systems, Inc. (a) | | | 7,968 | | | | 2,444,662 | |
| Fair Isaac Corp. (a) | | | 705 | | | | 1,674,396 | |
| Microsoft Corp. | | | 216,347 | | | | 91,614,301 | |
| Paycom Software, Inc. | | | 1,410 | | | | 327,007 | |
| PTC, Inc. (a) | | | 3,496 | | | | 699,410 | |
| Roper Technologies, Inc. | | | 3,114 | | | | 1,763,894 | |
| Salesforce, Inc. | | | 28,198 | | | | 9,305,058 | |
| ServiceNow, Inc. (a) | | | 5,987 | | | | 6,282,997 | |
| Synopsys, Inc. (a) | | | 4,458 | | | | 2,489,749 | |
| Tyler Technologies, Inc. (a) | | | 1,238 | | | | 778,913 | |
| | | | | | | | 127,168,186 | |
| Telecommunications - 1.5% | | | | | | | | |
| Arista Networks, Inc. (a) | | | 7,491 | | | | 3,039,998 | |
| Cisco Systems, Inc. | | | 117,258 | | | | 6,942,846 | |
| Corning, Inc. | | | 22,549 | | | | 1,097,460 | |
| Juniper Networks, Inc. | | | 9,574 | | | | 343,898 | |
| Motorola Solutions, Inc. | | | 4,850 | | | | 2,423,545 | |
| | | | | | | | 13,847,747 | |
| Transportation - 1.5% | | | | | | | | |
| C.H. Robinson Worldwide, Inc. | | | 3,404 | | | | 359,394 | |
| CSX Corp. | | | 56,427 | | | | 2,062,407 | |
| Expeditors International of Washington, Inc. | | | 4,100 | | | | 498,724 | |
| J.B. Hunt Transport Services, Inc. | | | 2,338 | | | | 442,139 | |
| Norfolk Southern Corp. | | | 6,575 | | | | 1,813,714 | |
| Old Dominion Freight Line, Inc. | | | 5,485 | | | | 1,234,893 | |
| Union Pacific Corp. | | | 17,726 | | | | 4,336,843 | |
| United Parcel Service, Inc. - Class B | | | 21,314 | | | | 2,892,736 | |
| | | | | | | | 13,640,850 | |
| TOTAL COMMON STOCKS (Cost $710,617,385) | | | | | | | 917,245,228 | |
| | | | | | | | | |
| REAL ESTATE INVESTMENT TRUSTS - 1.0% | | | | | | | | |
| AvalonBay Communities, Inc. | | | 4,126 | | | | 971,054 | |
| Camden Property Trust | | | 3,098 | | | | 389,728 | |
| Equinix, Inc. | | | 2,762 | | | | 2,710,848 | |
| Equity Residential | | | 9,926 | | | | 760,927 | |
| Mid-America Apartment Communities, Inc. | | | 3,392 | | | | 556,831 | |
| Prologis, Inc. | | | 26,948 | | | | 3,146,987 | |
| Weyerhaeuser Co. | | | 21,165 | | | | 682,783 | |
| TOTAL REAL ESTATE INVESTMENT TRUSTS (Cost $8,350,409) | | | | | | | 9,219,158 | |
| The accompanying notes are an integral part of these financial statements. | 10 |
| Schedule of Investments | SP Funds S&P 500 Sharia Industry Exclusions ETF |
| November 30, 2024 | | | | | | |
| | | | | | | |
| RIGHTS – 0.0%(b) | | | | | | |
| Healthcare - Products - 0.0% | | | | | | | | |
| ABIOMED, Inc. - CVR(a)(c) | | | 405 | | | | 0 | |
| TOTAL RIGHTS (Cost $0) | | | | | | | 0 | |
| | | | | | | | | |
| TOTAL INVESTMENTS - 99.9% (Cost $718,967,794) | | | | | | | 926,464,386 | |
| Other Assets in Excess of Liabilities - 0.1% | | | | | | | 1,239,332 | |
| TOTAL NET ASSETS - 100.0% | | | | | | $ | 927,703,718 | |
Percentages are stated as a percent of net assets.
CVR – Contingent Value Rights
PLC - Public Limited Company
| (a) | Non-income producing security. |
| (b) | Represents less than 0.05% of net assets. |
| (c) | Fair value determined using significant unobservable inputs in accordance with procedures established by and under the supervision of the Adviser, acting as Valuation Designee. These securities represented $0 or 0.0% of net assets as of November 30, 2024. |
| The accompanying notes are an integral part of these financial statements. | 11 |
| Schedule of Investments | SP Funds S&P Global REIT Sharia ETF |
November 30, 2024
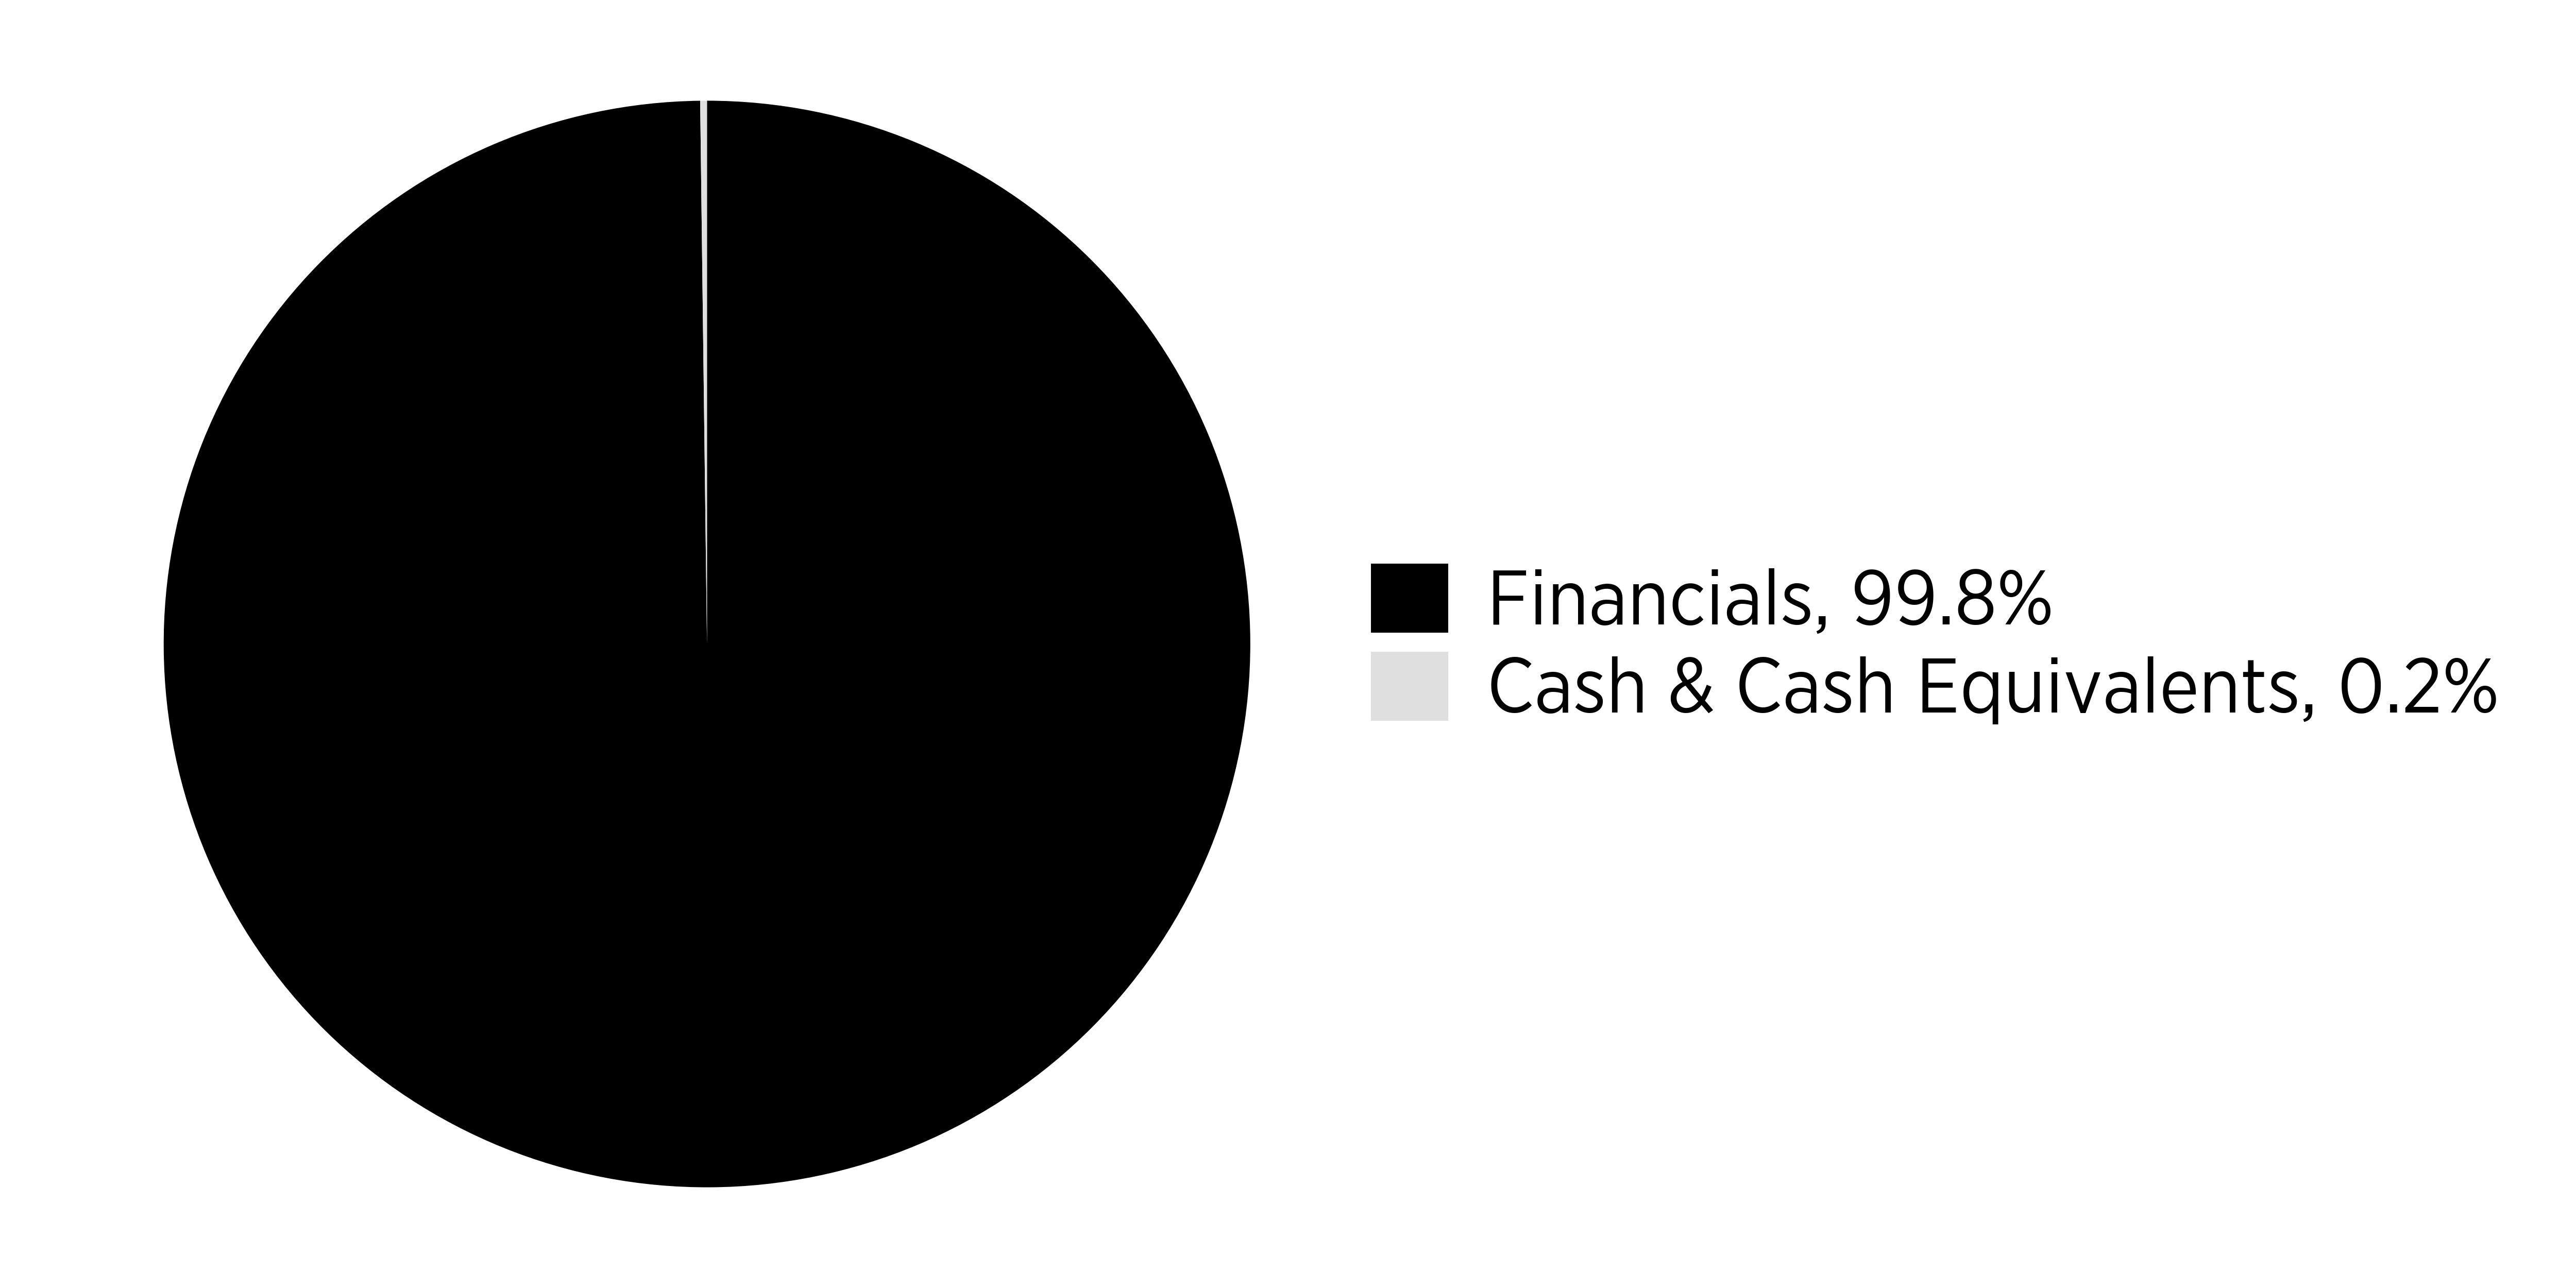
| REAL ESTATE INVESTMENT TRUSTS - 99.6% | | Shares | | | Value | |
| Arena REIT | | | 263,475 | | | $ | 710,592 | |
| AvalonBay Communities, Inc. | | | 73,754 | | | | 17,358,004 | |
| Avrupakent Gayrimenkul Yatirim Ortakligi AS | | | 56,786 | | | | 94,917 | |
| Axis Real Estate Investment Trust | | | 944,812 | | | | 367,722 | |
| BWP Trust | | | 376,825 | | | | 832,185 | |
| Camden Property Trust | | | 61,675 | | | | 7,758,715 | |
| Charter Hall Group | | | 320,260 | | | | 3,279,711 | |
| Citicore Energy REIT Corp. | | | 1,768,794 | | | | 92,007 | |
| CubeSmart | | | 150,716 | | | | 7,469,485 | |
| Dexus Industria REIT | | | 143,929 | | | | 252,221 | |
| EastGroup Properties, Inc. | | | 32,879 | | | | 5,662,093 | |
| Equinix, Inc. | | | 20,794 | | | | 20,408,895 | |
| Equity LifeStyle Properties, Inc. | | | 104,946 | | | | 7,485,798 | |
| Equity Residential | | | 100,651 | | | | 7,715,906 | |
| First Industrial Realty Trust, Inc. | | | 89,441 | | | | 4,780,621 | |
| Goodman Group | | | 781,638 | | | | 19,303,664 | |
| IGB Real Estate Investment Trust | | | 952,148 | | | | 447,692 | |
| IMPACT Growth Real Estate Investment Trust | | | 424,172 | | | | 138,515 | |
| Innovative Industrial Properties, Inc. | | | 19,148 | | | | 2,087,515 | |
| Kizilbuk Gayrimenkul Yatirim Ortakligi AS (a) | | | 70,982 | | | | 61,778 | |
| Lotus’s Retail Growth Freehold And Leasehold Property Fund | | | 1,034,957 | | | | 383,234 | |
| Mid-America Apartment Communities, Inc. | | | 47,126 | | | | 7,736,204 | |
| MREIT, Inc. | | | 755,522 | | | | 177,042 | |
| Ozak Gayrimenkul Yatirim Ortakligi (a) | | | 265,757 | | | | 98,492 | |
| Parkway Life Real Estate Investment Trust | | | 262,094 | | | | 742,891 | |
| PotlatchDeltic Corp. | | | 48,532 | | | | 2,176,175 | |
| Prologis, Inc. | | | 162,860 | | | | 19,018,791 | |
| Rayonier, Inc. | | | 90,617 | | | | 2,887,964 | |
| Rexford Industrial Realty, Inc. | | | 148,046 | | | | 6,229,776 | |
| RL Commercial REIT, Inc. | | | 2,898,731 | | | | 291,677 | |
| Terreno Realty Corp. | | | 65,488 | | | | 3,970,537 | |
| Torunlar Gayrimenkul Yatirim Ortakligi AS | | | 101,403 | | | | 169,056 | |
| Weyerhaeuser Co. | | | 243,190 | | | | 7,845,309 | |
| TOTAL REAL ESTATE INVESTMENT TRUSTS (Cost $139,664,662) | | | | | | | 158,035,184 | |
| | | | | | | | | |
| COMMON STOCKS - 0.2% | | | | | | | | |
| Private Equity - 0.2% | | | | | | | | |
| Servet Gayrimenkul Yatirim Ortakligi AS (a) | | | 9,843 | | | | 79,639 | |
| Ziraat Gayrimenkul Yatirim Ortakligi AS | | | 602,866 | | | | 228,814 | |
| TOTAL COMMON STOCKS (Cost $245,748) | | | | | | | 308,453 | |
| | | | | | | | | |
| TOTAL INVESTMENTS - 99.8% (Cost $139,910,410) | | | | | | | 158,343,637 | |
| Other Assets in Excess of Liabilities - 0.2% | | | | | | | 385,332 | |
| TOTAL NET ASSETS - 100.0% | | | | | | $ | 158,728,969 | |
Percentages are stated as a percent of net assets.
REIT - Real Estate Investment Trust
(a) Non-income producing security.
| The accompanying notes are an integral part of these financial statements. | 12 |
| Statements of Assets and Liabilities | SP Funds ETFs |
November 30, 2024
| | | SP Funds Dow Jones Global Sukuk ETF | | | SP Funds S&P 500 Sharia Industry Exclusions ETF | | | SP Funds S&P Global REIT Sharia ETF | |
| ASSETS: | | | | | | | | | |
| Investments, at value (Note 2) | | $ | 260,856,221 | | | $ | 926,464,386 | | | $ | 158,343,637 | |
| Receivable for investments sold | | | 2,866,795 | | | | — | | | | — | |
| Interest receivable | | | 2,596,276 | | | | — | | | | — | |
| Cash | | | 1,113,718 | | | | 788,229 | | | | 293,981 | |
| Dividends receivable | | | — | | | | 775,704 | | | | 157,379 | |
| Dividend tax reclaims receivable | | | — | | | | 1,832 | | | | 1,013 | |
| Foreign currency, at value | | | — | | | | — | | | | 1,378 | |
| Prepaid expenses and other assets | | | — | | | | — | | | | 898 | |
| Total assets | | | 267,433,010 | | | | 928,030,151 | | | | 158,798,286 | |
| | | | | | | | | | | | | |
| LIABILITIES: | | | | | | | | | | | | |
| Payable for investments purchased | | | 3,018,078 | | | | — | | | | — | |
| Payable to adviser (Note 4) | | | 118,585 | | | | 326,433 | | | | 69,317 | |
| Total liabilities | | | 3,136,663 | | | | 326,433 | | | | 69,317 | |
| NET ASSETS | | $ | 264,296,347 | | | $ | 927,703,718 | | | $ | 158,728,969 | |
| | | | | | | | | | | | | |
| NET ASSETS CONSISTS OF: | | | | | | | | | | | | |
| Paid-in capital | | $ | 264,612,956 | | | $ | 730,652,377 | | | $ | 152,241,199 | |
| Total distributable earnings/(accumulated losses) | | | (316,609 | ) | | | 197,051,341 | | | | 6,487,770 | |
| Total net assets | | $ | 264,296,347 | | | $ | 927,703,718 | | | $ | 158,728,969 | |
| | | | | | | | | | | | | |
| Net assets | | $ | 264,296,347 | | | $ | 927,703,718 | | | $ | 158,728,969 | |
| Shares issued and outstanding | | | 14,600,000 | | | | 21,625,000 | | | | 7,400,000 | |
| Net asset value per share | | $ | 18.10 | | | $ | 42.90 | | | $ | 21.45 | |
| | | | | | | | | | | | | |
| COST: | | | | | | | | | | | | |
| Investments, at cost | | $ | 263,088,054 | | | $ | 718,967,794 | | | $ | 139,910,410 | |
| Foreign currency, at cost | | $ | — | | | $ | — | | | $ | 1,525 | |
| The accompanying notes are an integral part of these financial statements. | 13 |
| Statements of Operations | SP Funds ETFs |
For the Year Ended November 30, 2024
| | | SP Funds Dow Jones Global Sukuk ETF | | | SP Funds S&P 500 Sharia Industry Exclusions ETF | | | SP Funds S&P Global REIT Sharia ETF | |
| INVESTMENT INCOME: | | | | | | | | | |
| Dividend income | | $ | — | | | $ | 5,822,852 | | | $ | 3,102,432 | |
| Less: Dividend withholding taxes | | | — | | | | (3,138 | ) | | | (28,029 | ) |
| Sukuk income | | | 9,078,084 | | | | — | | | | — | |
| Total investment income | | | 9,078,084 | | | | 5,819,714 | | | | 3,074,403 | |
| | | | | | | | | | | | | |
| EXPENSES: | | | | | | | | | | | | |
| Investment advisory fee (Note 4) | | | 1,129,963 | | | | 2,668,431 | | | | 636,885 | |
| Total expenses | | | 1,129,963 | | | | 2,668,431 | | | | 636,885 | |
| NET INVESTMENT INCOME | | | 7,948,121 | | | | 3,151,283 | | | | 2,437,518 | |
| | | | | | | | | | | | | |
| REALIZED AND UNREALIZED GAIN | | | | | | | | | | | | |
| Net realized loss from: | | | | | | | | | | | | |
| Investments | | | (520,216 | ) | | | (7,698,307 | ) | | | (4,625,312 | ) |
| Foreign currency transactions | | | — | | | | — | | | | (18,467 | ) |
| Net realized loss | | | (520,216 | ) | | | (7,698,307 | ) | | | (4,643,779 | ) |
| Net change in unrealized appreciation on: | | | | | | | | | | | | |
| Investments | | | 3,704,396 | | | | 156,967,856 | | | | 23,367,386 | |
| Foreign currency translation | | | — | | | | — | | | | (201 | ) |
| Net change in unrealized appreciation | | | 3,704,396 | | | | 156,967,856 | | | | 23,367,185 | |
| Net realized and unrealized gain | | | 3,184,180 | | | | 149,269,549 | | | | 18,723,406 | |
| NET INCREASE IN NET ASSETS RESULTING FROM OPERATIONS | | $ | 11,132,301 | | | $ | 152,420,832 | | | $ | 21,160,924 | |
| The accompanying notes are an integral part of these financial statements. | 14 |
| Statements of Changes in Net Assets | SP Funds ETFs |
| | | | | | | | | | | | | |
| | | SP Funds Dow Jones Global Sukuk ETF | | | SP Funds S&P 500 Sharia Industry Exclusions ETF | |
| | | Year ended November 30, 2024 | | | Year ended November 30, 2023 | | | Year ended November 30, 2024 | | | Year ended November 30, 2023 | |
| OPERATIONS: | | | | | | | | | | | | | | | | |
| Net investment income | | $ | 7,948,121 | | | $ | 3,457,731 | | | $ | 3,151,283 | | | $ | 2,072,202 | |
| Net realized loss | | | (520,216 | ) | | | (473,537 | ) | | | (7,698,307 | ) | | | (1,136,881 | ) |
| Net change in unrealized appreciation/(depreciation) | | | 3,704,396 | | | | (1,040,662 | ) | | | 156,967,856 | | | | 46,084,935 | |
| Net increase in net assets from operations | | | 11,132,301 | | | | 1,943,532 | | | | 152,420,832 | | | | 47,020,256 | |
| | | | | | | | | | | | | | | | | |
| DISTRIBUTIONS TO SHAREHOLDERS: | | | | | | | | | | | | | | | | |
| Distributions to shareholders | | | (5,756,705 | ) | | | (2,373,600 | ) | | | (3,139,234 | ) | | | (2,081,082 | ) |
| Return of capital | | | — | | | | — | | | | (1,552,247 | ) | | | (566,368 | ) |
| Total distributions to shareholders | | | (5,756,705 | ) | | | (2,373,600 | ) | | | (4,691,481 | ) | | | (2,647,450 | ) |
| | | | | | | | | | | | | | | | | |
| CAPITAL TRANSACTIONS: | | | | | | | | | | | | | | | | |
| Subscriptions | | | 107,934,082 | | | | 85,916,855 | | | | 427,344,387 | | | | 134,572,228 | |
| Redemptions | | | — | | | | — | | | | (854,060 | ) | | | — | |
| ETF transaction fees (Note 8) | | | 37,138 | | | | 27,699 | | | | — | | | | — | |
| Net increase in net assets from capital transactions | | | 107,971,220 | | | | 85,944,554 | | | | 426,490,327 | | | | 134,572,228 | |
| | | | | | | | | | | | | | | | | |
| NET INCREASE IN NET ASSETS | | | 113,346,816 | | | | 85,514,486 | | | | 574,219,678 | | | | 178,945,034 | |
| | | | | | | | | | | | | | | | | |
| NET ASSETS: | | | | | | | | | | | | | | | | |
| Beginning of the year | | | 150,949,531 | | | | 65,435,045 | | | | 353,484,040 | | | | 174,539,006 | |
| End of the year | | $ | 264,296,347 | | | $ | 150,949,531 | | | $ | 927,703,718 | | | $ | 353,484,040 | |
| | | | | | | | | | | | | | | | | |
| SHARES TRANSACTIONS | | | | | | | | | | | | | | | | |
| Subscriptions | | | 6,025,000 | | | | 4,850,000 | | | | 10,875,000 | | | | 4,425,000 | |
| Redemptions | | | — | | | | — | | | | (25,000 | ) | | | — | |
| Total increase in shares outstanding | | | 6,025,000 | | | | 4,850,000 | | | | 10,850,000 | | | | 4,425,000 | |
| The accompanying notes are an integral part of these financial statements. | 15 |
| Statements of Changes in Net Assets | SP Funds ETFs |
| | | SP Funds S&P Global REIT Sharia ETF | |
| | | Year ended November 30, 2024 | | | Year ended November 30, 2023 | |
| OPERATIONS: | | | | | | | | |
| Net investment income | | $ | 2,437,518 | | | $ | 1,022,265 | |
| Net realized loss | | | (4,643,779 | ) | | | (3,655,309 | ) |
| Net change in unrealized appreciation/(depreciation) | | | 23,367,185 | | | | (130,689 | ) |
| Net increase/(decrease) in net assets from operations | | | 21,160,924 | | | | (2,763,733 | ) |
| | | | | | | | | |
| DISTRIBUTIONS TO SHAREHOLDERS: | | | | | | | | |
| Distributions to shareholders | | | (3,312,054 | ) | | | (1,158,718 | ) |
| Return of capital | | | (1,544,676 | ) | | | (1,471,032 | ) |
| Total distributions to shareholders | | | (4,856,730 | ) | | | (2,629,750 | ) |
| | | | | | | | | |
| CAPITAL TRANSACTIONS: | | | | | | | | |
| Subscriptions | | | 67,339,690 | | | | 48,081,853 | |
| Redemptions | | | — | | | | (6,861,610 | ) |
| Net increase in net assets from capital transactions | | | 67,339,690 | | | | 41,220,243 | |
| | | | | | | | | |
| NET INCREASE IN NET ASSETS | | | 83,643,884 | | | | 35,826,760 | |
| | | | | | | | | |
| NET ASSETS: | | | | | | | | |
| Beginning of the year | | | 75,085,085 | | | | 39,258,325 | |
| End of the year | | $ | 158,728,969 | | | $ | 75,085,085 | |
| | | | | | | | | |
| SHARES TRANSACTIONS | | | | | | | | |
| Subscriptions | | | 3,350,000 | | | | 2,450,000 | |
| Redemptions | | | — | | | | (350,000 | ) |
| Total increase in shares outstanding | | | 3,350,000 | | | | 2,100,000 | |
| The accompanying notes are an integral part of these financial statements. | 16 |
| Financial Highlights | SP Funds ETFs |
For a share outstanding throughout the years/period presented
SP Funds Dow Jones Global Sukuk ETF
| | | | | | Year ended November 30, | | | | | | Period ended | |
| | | | | | | | | | | | | | | November 30, | |
| | | 2024 | | | 2023 | | | 2022 | | | 2021 | | | 2020(a) | |
| PER SHARE DATA: | | | | | | | | | | | | | | | | | | | | |
| | | | | | | | | | | | | | | | | | | | | |
| Net asset value, beginning of period | | $ | 17.60 | | | $ | 17.57 | | | $ | 19.76 | | | $ | 20.41 | | | $ | 20.00 | |
| | | | | | | | | | | | | | | | | | | | | |
| INVESTMENT OPERATIONS: | | | | | | | | | | | | | | | | | | | | |
| Net investment income(b) | | | 0.69 | | | | 0.57 | | | | 0.35 | | | | 0.27 | | | | 0.30 | |
| Net realized and unrealized gain (loss) on investments(c) | | | 0.34 | | | | (0.16 | ) | | | (2.09 | ) | | | (0.42 | ) | | | 0.39 | |
| Total from investment operations | | | 1.03 | | | | 0.41 | | | | (1.74 | ) | | | (0.15 | ) | | | 0.69 | |
| | | | | | | | | | | | | | | | | | | | | |
| LESS DISTRIBUTIONS FROM: | | | | | | | | | | | | | | | | | | | | |
| Net investment income | | | (0.53 | ) | | | (0.38 | ) | | | (0.36 | ) | | | (0.26 | ) | | | (0.28 | ) |
| Return of capital | | | — | | | | — | | | | (0.09 | ) | | | (0.24 | ) | | | — | |
| Total distributions | | | (0.53 | ) | | | (0.38 | ) | | | (0.45 | ) | | | (0.50 | ) | | | (0.28 | ) |
| | | | | | | | | | | | | | | | | | | | | |
| ETF transaction fees per share | | | 0.00 | (d) | | | — | | | | — | | | | — | | | | — | |
| Net asset value, end of period | | $ | 18.10 | | | $ | 17.60 | | | $ | 17.57 | | | $ | 19.76 | | | $ | 20.41 | |
| | | | | | | | | | | | | | | | | | | | | |
| TOTAL RETURN(e) | | | 5.87 | % | | | 2.46 | % | | | -8.92 | % | | | -0.73 | % | | | 3.48 | %(f) |
| | | | | | | | | | | | | | | | | | | | | |
| SUPPLEMENTAL DATA AND RATIOS: | | | | | | | | | | | | | | | | | | | | |
| Net assets, end of period (in thousands) | | $ | 264,296 | | | $ | 150,950 | | | $ | 65,435 | | | $ | 37,542 | | | $ | 31,123 | |
| Ratio of expenses to average net assets(g) | | | 0.55 | %(h) | | | 0.59 | % | | | 0.59 | %(i) | | | 0.65 | % | | | 0.65 | % |
| Ratio of net investment income to average net assets(g) | | | 3.87 | % | | | 3.23 | % | | | 1.91 | % | | | 1.32 | % | | | 1.61 | % |
| Portfolio turnover rate(e)(j) | | | 15 | % | | | 19 | % | | | 9 | % | | | 28 | % | | | 15 | % |
| (a) | Inception date of the Fund was December 27, 2019. |
| (b) | Net investment income per share has been calculated based on average shares outstanding during the year. |
| (c) | Realized and unrealized gains and losses per share in the caption are balancing amounts necessary to reconcile the change in net asset value per share for the years, and may not reconcile with the aggregate gains and losses in the Statements of Operations due to share transactions for the year. |
| (d) | Amount represents less than $0.005 per share. |
| (e) | Not annualized for periods less than one year. |
| (f) | Net increase from payments by affiliates on the disposal of investments due to trade error added 0.11% to this return. |
| (g) | Annualized for periods less than one year. |
| (h) | Effective December 1, 2023, the Fund’s management fee was reduced from 0.59% to 0.55%. |
| (i) | Effective November 30, 2021, the Fund’s management fee was reduced from 0.65% to 0.59%. |
| (j) | Portfolio turnover rate excludes in-kind transactions. |
| The accompanying notes are an integral part of these financial statements. | 17 |
| Financial Highlights | SP Funds ETFs |
For a share outstanding throughout the years/period presented
SP Funds S&P 500 Sharia Industry Exclusions ETF
| | | | | | Year ended November 30, | | | | | | Period ended | |
| | | | | | | | | | | | | | | November 30, | |
| | | 2024 | | | 2023 | | | 2022 | | | 2021 | | | 2020(a) | |
| PER SHARE DATA: | | | | | | | | | | | | | | | | | | | | |
| | | | | | | | | | | | | | | | | | | | | |
| Net asset value, beginning of period | | $ | 32.81 | | | $ | 27.49 | | | $ | 32.48 | | | $ | 24.26 | | | $ | 20.00 | |
| | | | | | | | | | | | | | | | | | | | | |
| INVESTMENT OPERATIONS: | | | | | | | | | | | | | | | | | | | | |
| Net investment income(b) | | | 0.21 | | | | 0.25 | | | | 0.25 | | | | 0.17 | | | | 0.22 | |
| Net realized and unrealized gain (loss) on investments(c) | | | 10.18 | | | | 5.38 | | | | (4.83 | ) | | | 8.36 | | | | 4.25 | |
| Total from investment operations | | | 10.39 | | | | 5.63 | | | | (4.58 | ) | | | 8.53 | | | | 4.47 | |
| | | | | | | | | | | | | | | | | | | | | |
| LESS DISTRIBUTIONS FROM: | | | | | | | | | | | | | | | | | | | | |
| Net investment income | | | (0.20 | ) | | | (0.24 | ) | | | (0.25 | ) | | | (0.18 | ) | | | (0.21 | ) |
| Net realized gains | | | — | | | | — | | | | (0.07 | ) | | | (0.13 | ) | | | — | |
| Return of capital | | | (0.10 | ) | | | (0.07 | ) | | | (0.09 | ) | | | — | | | | — | |
| Total distributions | | | (0.30 | ) | | | (0.31 | ) | | | (0.41 | ) | | | (0.31 | ) | | | (0.21 | ) |
| Net asset value, end of period | | $ | 42.90 | | | $ | 32.81 | | | $ | 27.49 | | | $ | 32.48 | | | $ | 24.26 | |
| | | | | | | | | | | | | | | | | | | | | |
| TOTAL RETURN(d) | | | 31.77 | % | | | 20.62 | % | | | -14.17 | % | | | 35.40 | % | | | 22.58 | % |
| | | | | | | | | | | | | | | | | | | | | |
| SUPPLEMENTAL DATA AND RATIOS: | | | | | | | | | | | | | | | | | | | | |
| Net assets, end of period (in thousands) | | $ | 927,704 | | | $ | 353,484 | | | $ | 174,539 | | | $ | 123,430 | | | $ | 38,821 | |
| | | | | | | | | | | | | | | | | | | | | |
| Ratio of expenses to average net assets(e) | | | 0.45 | %(f) | | | 0.49 | % | | | 0.49 | % | | | 0.49 | % | | | 0.49 | % |
| Ratio of net investment income to average net assets(e) | | | 0.53 | % | | | 0.82 | % | | | 0.89 | % | | | 0.60 | % | | | 1.06 | % |
| Portfolio turnover rate(d)(g) | | | 18 | % | | | 5 | % | | | 4 | % | | | 18 | % | | | 46 | % |
| (a) | Inception date of the Fund was December 17, 2019. |
| (b) | Net investment income per share has been calculated based on average shares outstanding during the year. |
| (c) | Realized and unrealized gains and losses per share in the caption are balancing amounts necessary to reconcile the change in net asset value per share for the years, and may not reconcile with the aggregate gains and losses in the Statements of Operations due to share transactions for the year. |
| (d) | Not annualized for periods less than one year. |
| (e) | Annualized for periods less than one year. |
| (f) | Effective December 1, 2023, the Fund’s management fee was reduced from 0.49% to 0.45%. |
| (g) | Portfolio turnover rate excludes in-kind transactions. |
| The accompanying notes are an integral part of these financial statements. | 18 |
| Financial Highlights | SP Funds ETFs |
For a share outstanding throughout the years/period presented
SP Funds S&P Global REIT Sharia ETF
| | | Year ended November 30, | | | Period ended | |
| | | | | | | | | | | | November 30, | |
| | | 2024 | | | 2023 | | | 2022 | | | 2021(a) | |
| PER SHARE DATA: | | | | | | | | | | | | | | | | |
| | | | | | | | | | | | | | | | | |
| Net asset value, beginning of period | | $ | 18.54 | | | $ | 20.13 | | | $ | 25.63 | | | $ | 20.00 | |
| | | | | | | | | | | | | | | | | |
| INVESTMENT OPERATIONS: | | | | | | | | | | | | | | | | |
| Net investment income(b) | | | 0.43 | | | | 0.32 | | | | 0.36 | | | | 0.26 | |
| Net realized and unrealized gain (loss) on investments(c) | | | 3.32 | | | | (1.11 | ) | | | (4.99 | ) | | | 6.04 | |
| Total from investment operations | | | 3.75 | | | | (0.79 | ) | | | (4.63 | ) | | | 6.30 | |
| | | | | | | | | | | | | | | | | |
| LESS DISTRIBUTIONS FROM: | | | | | | | | | | | | | | | | |
| Net investment income | | | (0.57 | ) | | | (0.35 | ) | | | (0.38 | ) | | | (0.29 | ) |
| Net realized gains | | | — | | | | — | | | | — | | | | (0.15 | ) |
| Return of capital | | | (0.27 | ) | | | (0.45 | ) | | | (0.49 | ) | | | (0.23 | ) |
| Total distributions | | | (0.84 | ) | | | (0.80 | ) | | | (0.87 | ) | | | (0.67 | ) |
| Net asset value, end of period | | $ | 21.45 | | | $ | 18.54 | | | $ | 20.13 | | | $ | 25.63 | |
| | | | | | | | | | | | | | | | | |
| TOTAL RETURN(d) | | | 20.65 | % | | | -3.92 | % | | | -18.39 | % | | | 31.98 | % |
| | | | | | | | | | | | | | | | | |
| SUPPLEMENTAL DATA AND RATIOS: | | | | | | | | | | | | | | | | |
| Net assets, end of period (in thousands) | | $ | 158,729 | | | $ | 75,085 | | | $ | 39,258 | | | $ | 23,068 | |
| Ratio of expenses to average net assets(e) | | | 0.55 | %(f) | | | 0.59 | %(g) | | | 0.69 | % | | | 0.69 | % |
| Ratio of net investment income to average net assets(e) | | | 2.10 | % | | | 1.69 | % | | | 1.59 | % | | | 1.19 | % |
| Portfolio turnover rate(d)(h) | | | 46 | % | | | 29 | % | | | 50 | % | | | 79 | % |
| (a) | Inception date of the Fund was December 29, 2020. |
| (b) | Net investment income per share has been calculated based on average shares outstanding during the year. |
| (c) | Realized and unrealized gains and losses per share in the caption are balancing amounts necessary to reconcile the change in net asset value per share for the years, and may not reconcile with the aggregate gains and losses in the Statements of Operations due to share transactions for the year. |
| (d) | Not annualized for periods less than one year. |
| (e) | Annualized for periods less than one year. |
| (f) | Effective December 1, 2023, the Fund’s management fee was reduced from 0.59% to 0.55%. |
| (g) | Effective December 1, 2022, the Fund’s management fee was reduced from 0.69% to 0.59%. |
| (h) | Portfolio turnover rate excludes in-kind transactions. |
| The accompanying notes are an integral part of these financial statements. | 19 |
| Notes to the Financial Statements | SP Funds ETFs |
November 30, 2024
The SP Funds Dow Jones Global Sukuk ETF (the “Sukuk ETF”), the SP Funds S&P 500 Sharia Industry Exclusions ETF (the “Sharia ETF”), and the SP Funds S&P Global REIT ETF (the “Global REIT ETF”) (each a “Fund”, and collectively, the “Funds”) are each a series of shares of beneficial interest of Tidal ETF Trust (the “Trust”). The Sukuk ETF is a diversified series and each of the Sharia ETF and the Global REIT ETF is a non-diversified series of the Trust. The Sukuk ETF commenced operations as a non-diversified series, however, the Fund continuously operated as diversified for three years and as of December 27, 2022, is now classified as diversified. The Trust was organized as a Delaware statutory trust on June 4, 2018 and is registered with the Securities and Exchange Commission under the Investment Company Act of 1940, as amended (the “1940 Act”), as an open-end management investment company and the offering of each Fund’s shares (“Shares”) is registered under the Securities Act of 1933, as amended. The Trust is governed by the Board of Trustees (the “Board”). Tidal Investments LLC (“Tidal Investments” or the “Adviser”), a Tidal Financial Group company, serves as investment adviser to the Funds and ShariaPortfolio, Inc. (the “Sub-Adviser”) serves as sub-adviser to the Funds. Each Fund is an investment company and accordingly follows the investment company accounting and reporting guidance of the Financial Accounting Standards Board (“FASB”) Accounting Standards Codification Topic 946 “Financial Services—Investment Companies.” The Sharia ETF commenced operations on December 17, 2019, the Sukuk ETF commenced operations on December 27, 2019 and the Global REIT ETF commenced operations on December 29, 2020.
The investment objective of the Sukuk ETF is to seek to track the performance, before fees and expenses, of the Dow Jones Sukuk Total Return (ex-Reinvestment) Index (the “Sukuk Index”). The investment objective of the Sharia ETF is to seek to track the performance, before fees and expenses, of the S&P 500 Shariah Industry Exclusions Index (the “Sharia Index”) . The investment objective of the Global REIT ETF is to seek to track the performance, before fees and expenses, of the S&P Global All Equity REIT Sharia Capped Index (the “Global REIT Index”).
| NOTE 2 – SIGNIFICANT ACCOUNTING POLICIES |
The following is a summary of significant accounting policies consistently followed by the Funds. These policies are in conformity with accounting principles generally accepted in the United States of America (“U.S. GAAP”).
| A. | Security Valuation. Equity securities, which may include Real Estate Investment Trusts (“REITs”), Business Development Companies (“BDCs”), and Master Limited Partnerships (“MLPs”), listed on a securities exchange, market or automated quotation system for which quotations are readily available (except for securities traded on the Nasdaq Stock Market, LLC (the “NASDAQ”)), including securities traded over-the-counter, are valued at the last quoted sale price on the primary exchange or market (foreign or domestic) on which they are traded on the valuation date (or at approximately 4:00 p.m. EST if a security’s primary exchange is normally open at that time), or, if there is no such reported sale on the valuation date, at the most recent quoted bid price or mean between the most recent quoted bid and ask prices for long and short positions. For a security that trades on multiple exchanges, the primary exchange will generally be considered the exchange on which the security is generally most actively traded. For securities traded on NASDAQ, the NASDAQ Official Closing Price will be used. Prices of securities traded on the securities exchange will be obtained from recognized independent pricing agents each day that the Funds are open for business. |
Sukuk securities are valued by using an evaluated mean of the bid and ask prices provided by independent pricing agents. The Independent Pricing Agents may employ methodologies that utilize actual market transactions (if the security is actively traded), broker-dealer supplied valuations, or other methodologies designed to identify the market value for such securities. In arriving at valuations, such methodologies generally consider factors such as security prices, yields, maturities, call features, ratings and developments relating to specific securities.
Under Rule 2a-5 of the 1940 Act, a fair value will be determined for securities for which quotations are not readily available by the Valuation Designee (as defined in Rule 2a-5) in accordance with the Pricing and Valuation Policy and Fair Value Procedures, as applicable, of the Adviser, subject to oversight by the Board. When a security is “fair valued,” consideration is given to the facts and circumstances relevant to the particular situation, including a review of various factors set forth in the Adviser’s Pricing and Valuation Policy and Fair Value Procedures, as applicable. Fair value pricing is an inherently subjective process, and no single standard exists for determining fair value. Different funds could reasonably arrive at different values for the same security. The use of fair value pricing by a fund may cause the net asset value (“NAV”) of its shares to differ significantly from the NAV that would be calculated without regard to such considerations.
| Notes to the Financial Statements | SP Funds ETFs |
November 30, 2024
As described above, the Funds utilize various methods to measure the fair value of their investments on a recurring basis. U.S. GAAP establishes a hierarchy that prioritizes inputs to valuation methods. The three levels of inputs are:
Level 1 – Unadjusted quoted prices in active markets for identical assets or liabilities that the Funds have the ability to access.
Level 2 – Observable inputs other than quoted prices included in Level 1 that are observable for the asset or liability, either directly or indirectly. These inputs may include quoted prices for the identical instrument on an inactive market, prices for similar instruments, interest rates, prepayment speeds, credit risk, yield curves, default rates and similar data.
Level 3 – Unobservable inputs for the asset or liability, to the extent relevant observable inputs are not available; representing the Funds’ own assumptions about the assumptions a market participant would use in valuing the asset or liability and would be based on the best information available.
The availability of observable inputs can vary from security to security and is affected by a wide variety of factors, including, for example, the type of security, whether the security is new and not yet established in the marketplace, the liquidity of markets, and other characteristics particular to the security. To the extent that valuation is based on models or inputs that are less observable or unobservable in the market, the determination of fair value requires more judgment. Accordingly, the degree of judgment exercised in determining fair value is greatest for instruments categorized in Level 3.
The inputs used to measure fair value may fall into different levels of the fair value hierarchy. In such cases, for disclosure purposes, the level in the fair value hierarchy within which the fair value measurement falls in its entirety, is determined based on the lowest level input that is significant to the fair value measurement in its entirety.
The following is a summary of the inputs used to value each Fund’s investments as of November 30, 2024:
| | | Sukuk ETF | |
| Investments | | Level 1 | | | Level 2 | | | Level 3 | | | Total | |
| Foreign Government Sukuk | | $ | — | | | $ | 132,542,000 | | | $ | — | | | $ | 132,542,000 | |
| Corporate Sukuk | | | — | | | | 128,314,221 | | | | — | | | | 128,314,221 | |
| Total Investments | | $ | — | | | $ | 260,856,221 | | | $ | — | | | $ | 260,856,221 | |
| | | Sharia ETF | |
| Investments | | Level 1 | | | Level 2 | | | Level 3 | | | Total | |
| Common Stocks | | $ | 917,245,228 | | | $ | — | | | $ | — | | | $ | 917,245,228 | |
| Real Estate Investment Trusts | | | 9,219,158 | | | | — | | | | — | | | | 9,219,158 | |
| Rights | | | — | | | | — | | | | 0 | | | | 0 | |
| Total Investments | | $ | 926,464,386 | | | $ | — | | | $ | 0 | | | $ | 926,464,386 | |
| | | Global REIT ETF | |
| Investments | | Level 1 | | | Level 2 | | | Level 3 | | | Total | |
| Real Estate Investment Trusts | | $ | 157,651,950 | | | $ | 383,234 | | | $ | — | | | $ | 158,035,184 | |
| Common Stocks | | | 308,453 | | | | — | | | | — | | | | 308,453 | |
| Total Investments | | $ | 157,960,403 | | | $ | 383,234 | | | $ | — | | | $ | 158,343,637 | |
Refer to the Schedules of Investments for further disaggregation of investment categories.
| Notes to the Financial Statements | SP Funds ETFs |
November 30, 2024
The following is a reconciliation of Level 3 investments for the Sharia ETF for which significant unobservable inputs were used to determine fair value:
| | | Rights(a) | |
| Balance as of November 30, 2023 | | $ | 0 | |
| Accrued discounts/premiums | | | — | |
| Realized gain (loss) | | | — | |
| Change in unrealized appreciation/depreciation | | | — | |
| Purchases | | | — | |
| Sales | | | — | |
| Transfer into and/or out of Level 3 | | | — | |
| Balance as of November 30, 2024 | | $ | 0 | |
| | | | | |
| Change in unrealized appreciation/depreciation during the period for Level 3 investments held at November 30, 2024: | | $ | — | |
| (a) | The securities (Rights) are classified as Level 3 securities due to a lack of market activity. |
| B. | Federal Income Taxes. Each Fund has elected to be taxed as a “regulated investment company” and intends to distribute substantially all taxable income to its shareholders and otherwise comply with the provisions of the Internal Revenue Code applicable to regulated investment companies. Therefore, no provision for federal income taxes or excise taxes has been made. |
In order to avoid imposition of the excise tax applicable to regulated investment companies, the Funds intend to declare as dividends in each calendar year at least 98.0% of its net investment income (earned during the calendar year) and at least 98.2% of its net realized capital gains (earned during the twelve months ended October 31) plus undistributed amounts, if any, from prior years. As a registered investment company, each Fund is subject to a 4% excise tax that is imposed if a Fund does not distribute by the end of any calendar year at least the sum of (i) 98% of its ordinary income (not taking into account any capital gain or loss) for the calendar year and (ii) 98.2% of its capital gain in excess of its capital loss (adjusted for certain ordinary losses) for a one year period generally ending on October 31 of the calendar year (unless an election is made to use the fund’s fiscal year). The Funds generally intend to distribute income and capital gains in the manner necessary to minimize (but not necessarily eliminate) the imposition of such excise tax. The Funds may retain income or capital gains and pay excise tax when it is determined that doing so is in the best interest of shareholders. Management, in consultation with the Board of Trustees, evaluates the costs of the excise tax relative to the benefits of retaining income and capital gains, including that such undistributed amounts (net of the excise tax paid) remain available for investment by the Funds and are available to supplement future distributions. Tax expense is disclosed in the Statements of Operations, if applicable.
As of November 30, 2024, the Funds did not have any tax positions that did not meet the threshold of being sustained by the applicable tax authority. Generally, tax authorities can examine all the tax returns filed for the last three years. The Funds identify their major tax jurisdiction as U.S. Federal and the Commonwealth of Delaware; however, the Funds are not aware of any tax positions for which it is reasonably possible that the total amounts of unrecognized tax benefits will change materially. The Funds recognize interest and penalties, if any, related to unrecognized tax benefits on uncertain tax positions as income tax expense in the Statements of Operations.
| C. | Securities Transactions and Investment Income. Investment securities transactions are accounted for on the trade date. Gains and losses realized on sales of securities are determined on a specific identification basis. Discounts/premiums on sukuk securities purchased are accreted/amortized over the life of the respective securities using the effective interest method. Dividend income is recorded on the ex-dividend date. Dividends received from REITs generally are comprised of ordinary income, capital gains, and may include return of capital. Sukuk income is recorded on an accrual basis. Other non-cash dividends are recognized as investment income at the fair value of the property received. Withholding taxes on foreign dividends have been provided for in accordance with the Funds’ understanding of the applicable country’s tax rules and rates. |
| D. | Foreign Currency. Investment securities and other assets and liabilities denominated in foreign currencies are translated into U.S. dollar amounts at the date of valuation. Purchases and sales of investment securities and income and expense items denominated in foreign currencies are translated into U.S. dollar amounts on the respective dates of such transactions. |
| Notes to the Financial Statements | SP Funds ETFs |
November 30, 2024
The Funds does not isolate that portion of the results of operations resulting from changes in foreign exchange rates on investments from the fluctuations arising from changes in market prices of securities held. Such fluctuations are included with the net realized and unrealized gain or loss from investments.
The Funds reports net realized foreign exchange gains or losses that arise from sales of foreign currencies, currency gains or losses realized between the trade and settlement dates on securities transactions, and the difference between the amounts of dividends, interest, and foreign withholding taxes recorded on the Funds’ books and the U.S. dollar equivalent of the amounts actually received or paid. Net unrealized foreign exchange gains and losses arise from changes in the fair values of assets and liabilities, other than investments in securities at period end, resulting from changes in exchange rates.
| E. | Distributions to Shareholders. Distributions to shareholders from net investment income, if any, for the Funds are declared and paid at least monthly. Distributions to shareholders from net realized gains on securities, if any, for the Funds normally are declared and paid on an annual basis. Distributions are recorded on the ex-dividend date. |
| F. | Use of Estimates. The preparation of financial statements in conformity with U.S. GAAP requires management to make estimates and assumptions that affect the reported amounts of assets and liabilities and disclosure of contingent assets and liabilities at the date of the financial statements and the reported amount of increases and decreases in net assets from operations during the reporting period. Actual results could differ from those estimates. |
| G. | Share Valuation. The NAV per share of each Fund is calculated by dividing the sum of the value of the securities held by the Fund, plus cash or other assets, minus all liabilities by the total number of shares outstanding for the Fund, rounded to the nearest cent. The Funds’ shares will not be priced on the days on which the New York Stock Exchange (“NYSE”) is closed for trading. |
| H. | Guarantees and Indemnifications. In the normal course of business, the Funds enter into contracts with service providers that contain general indemnification clauses. The Funds’ maximum exposure under these arrangements is unknown as this would involve future claims that may be made against the Funds that have not yet occurred. However, based on experience, the Funds expect the risk of loss to be remote. |
| I. | Illiquid Securities. Pursuant to Rule 22e-4 under the 1940 Act, the Funds have adopted a Board-approved Liquidity Risk Management Program (the “Program”) that requires, among other things, that each Fund limit its illiquid investments that are assets to no more than 15% of the value of the Fund’s net assets. An illiquid investment is any security that a Fund reasonably expects cannot be sold or disposed of in current market conditions in seven calendar days or less without the sale or disposition significantly changing the market value of the investment. If a Fund should be in a position where the value of illiquid investments held by the Fund exceeds 15% of the Fund’s net assets, the Fund will take such steps as set forth in the Program. |
| J. | Reclassification of Capital Accounts. U.S. GAAP requires that certain components of net assets relating to permanent differences be reclassified between financial and tax reporting. These reclassifications are primarily due to adjustments for redemptions in-kind. These reclassifications have no effect on net assets or NAV per share. For the year ended November 30, 2024, the following reclassification adjustments were made: |
| Fund | | Paid-In Capital | | | Total Distributable Earnings/(Accumulated Losses) | |
| | | | | | | | | |
| Sukuk ETF | | $ | — | | | $ | — | |
| | | | | | | | | |
| Sharia ETF | | | 440,563 | | | | (440,563 | ) |
| | | | | | | | | |
| Global REIT ETF | | | 180,523 | | | | (180,523 | ) |
The Funds may realize net capital gains resulting from in-kind redemptions, in which shareholders exchange Fund shares for securities held by the Funds rather than for cash. Because such gains are not taxable to the Funds, and are not distributed to shareholders, they have been reclassified from accumulated gains to paid-in capital. During the year ended November 30, 2024, the Sukuk ETF and Global REIT ETF did not realize any net capital gains and the Sharia ETF realized $428,514 in net capital gains resulting from in-kind redemptions.
| Notes to the Financial Statements | SP Funds ETFs |
November 30, 2024
| NOTE 3 – PRINCIPAL INVESTMENT RISKS |
| A. | Concentration Risk. Each Fund’s investments will be concentrated in an industry or group of industries to the extent the Index is so concentrated. In such event, the value of Shares of the Funds may rise and fall more than the value of Shares that invest in securities of companies in a broader range of industries. |
| ● | Concentration in REITs (Global REIT ETF Only). The Fund concentrates in REITs. A REIT is a company that owns or finances income-producing real estate and meets certain requirements under the Internal Revenue Code of 1986, as amended (the “Code”), as more fully described in the Fund’s Statement of Additional Information (“SAI”). Through its investments in REITs, the Fund is subject to the risks of investing in the real estate market, including decreases in property revenues, increases in interest rates, increases in property taxes and operating expenses, legal and regulatory changes, a lack of credit or capital, defaults by borrowers or tenants, environmental problems and natural disasters. |
REITs are subject to additional risks, including those related to adverse governmental actions; declines in property value and the real estate market; the potential failure to qualify for tax-free pass through of income; and exemption from registration as an investment company. REITs are dependent upon specialized management skills and may invest in relatively few properties, a small geographic area, or a small number of property types. As a result, investments in REITs may be volatile. To the extent the Fund invests in REITs concentrated in specific geographic areas or property types, the Fund may be subject to a greater loss as a result of adverse developments affecting such area or property types. REITs are pooled investment vehicles with their own fees and expenses and the Fund will indirectly bear a proportionate share of those fees and expenses.
| B. | Currency Risk (Global REIT ETF Only). The Fund’s exposure to foreign currencies subjects the Fund to the risk that those currencies will decline in value relative to the U.S. Dollar. Currency rates in foreign countries may fluctuate significantly over short periods of time for any number of reasons, including changes in interest rates and the imposition of currency controls or other political developments in the U.S. or abroad. |
| C. | Debt Securities Risk (Sukuk ETF Only). |
| ● | Credit Risk (Sukuk ETF Only). Debt securities are subject to the risk of an issuer’s (or other party’s) failure or inability to meet its obligations under the security. Multiple parties may have obligations under a debt security. An issuer or borrower may fail to pay principal and interest when due. A guarantor, insurer or credit support provider may fail to provide the agreed upon protection. A counterparty to a transaction may fail to perform its side of the bargain. An intermediary or agent interposed between the investor and other parties may fail to perform the terms of its service. Also, performance under a debt security may be linked to the obligations of other persons who may fail to meet their obligations. The credit risk associated with a debt security could increase to the extent that the Fund’s ability to benefit fully from its investment in the security depends on the performance by multiple parties of their respective contractual or other obligations. The market value of a debt security is also affected by the market’s perception of the creditworthiness of the issuer. |
| ● | Interest Rate Risk (Sukuk ETF Only). The income generated by debt securities owned by the Fund will be affected by changing interest rates. Generally, the value of fixed income securities will change inversely with changes in interest rates. As interest rates rise, the market value of fixed income securities tends to decrease. Conversely, as interest rates fall, the market value of fixed income securities tends to increase. Securities with longer durations tend to be more sensitive to changes in interest rates, usually making them more volatile than securities with shorter durations. Falling interest rates may cause an issuer to redeem or “call” a security before its stated maturity, which may result in the Fund having to reinvest the proceeds in lower yielding securities. Rising interest rates across the U.S. and international financial systems may result in fixed-income markets becoming more volatile. A rise in rates tends to have a greater impact on the prices of longer term or duration securities. Interest rates have recently been historically low, so the Fund faces a heightened risk that rates may rise. |
| Notes to the Financial Statements | SP Funds ETFs |
November 30, 2024
| D. | Emerging Markets Risk (Sukuk ETF and Global REIT ETF Only). Investments in emerging market securities impose risks different from, or greater than, risks of investing in foreign developed countries, including: smaller market capitalization; significant price volatility; and restrictions on foreign investment. Emerging market countries may have relatively unstable governments and may present the risk of nationalization of businesses, expropriation, and confiscatory taxation, or, in certain instances, reversion to closed market, centrally planned economies. Emerging market economies may also experience more severe downturns. The currencies of emerging market countries may experience significant declines against the U.S. dollar, and devaluation may occur subsequent to investments in these currencies by the Funds. Inflation and rapid fluctuations in inflation rates have had, and may continue to have, negative effects on the economies and securities markets of certain emerging market countries. In addition, less information may be available about companies in emerging markets than in developed markets because such emerging markets companies may not be subject to accounting, auditing and financial reporting standards or to other regulatory practices required by U.S. companies which may lead to potential errors in index data, index computation and/or index construction. Such conditions may impact the ability of the Funds to buy, sell or otherwise transfer securities; adversely affect the trading market and price for such securities; and/or cause the Funds to decline in value. |
| E. | Equity Market Risk (Sharia ETF and Global REIT ETF Only). The Funds will invest in common stocks directly or indirectly through ETFs. Common stocks are generally exposed to greater risk than other types of securities, such as preferred stock and debt obligations, because common stockholders generally have inferior rights to receive payment from specific issuers. The equity securities held in the Funds’ portfolio may experience sudden, unpredictable drops in value or long periods of decline in value. This may occur because of factors that affect securities markets generally or factors affecting specific issuers, industries, or sectors in which the Funds invest. Common stock, such as those held by the Funds, are generally exposed to greater risk than other types of securities, such as preferred stock and debt obligations, because common stockholders generally have inferior rights to receive payment from issuers. |
| F. | Exchange Traded Fund (“ETF”) Risks. |
| ● | Authorized Participants, Market Makers, and Liquidity Providers Concentration Risk. The Funds have a limited number of financial institutions that are authorized to purchase and redeem Shares directly from the Funds (known as “Authorized Participants” or “APs”). In addition, there may be a limited number of market makers and/or liquidity providers in the marketplace. To the extent either of the following events occur, Shares may trade at a material discount to NAV and possibly face delisting: (i) APs exit the business or otherwise become unable to process creation and/or redemption orders and no other APs step forward to perform these services; or (ii) market makers and/or liquidity providers exit the business or significantly reduce their business activities and no other entities step forward to perform their functions. |
| ● | Cash Redemption Risk (Sukuk ETF Only). The Fund’s investment strategy may require it to redeem Shares for cash or to otherwise include cash, the prices of non-U.S. securities and instruments can be more volatile. In addition, the Fund will be subject to risks as part of its redemption proceeds. For example, the Fund may not be able to redeem in-kind certain securities held by the Fund (e.g., sukuk that cannot be broken up beyond certain minimum sizes needed for transfer and settlement). In such a case, the Fund may be required to sell or unwind portfolio investments to obtain the cash needed to distribute redemption proceeds. This may cause the Fund to recognize a capital gain that it might not have recognized if it had made a redemption in-kind. As a result, the Fund may pay out higher annual capital gain distributions than if the in-kind redemption process was used. |
| ● | Costs of Buying or Selling Shares. Due to the costs of buying or selling shares of the Funds, including brokerage commissions imposed by brokers and bid-ask spreads, frequent trading of shares of the Funds may significantly reduce investment results and an investment in shares of the Funds may not be advisable for investors who anticipate regularly making small investments. |
| ● | Shares May Trade at Prices Other Than NAV. As with all ETFs, Shares may be bought and sold in the secondary market at market prices. Although it is expected that the market price of Shares will approximate a Fund’s NAV, there may be times when the market price of Shares is more than the NAV intra-day (premium) or less than the NAV intra-day (discount) due to supply and demand of Shares or during periods of market volatility. This risk is heightened in times of market volatility, periods of steep market declines, and periods when there is limited trading activity for Shares in the secondary market, in which case such premiums or discounts may be significant. Because securities held by the Funds may trade on foreign exchanges that are closed when the Funds’ primary listing exchange is open, the Funds are likely to experience premiums and discounts greater than those of ETFs holding only domestic securities. |
| ● | Trading. Although Shares are listed on a national securities exchange, such as the NYSE Arca, Inc. (the “Exchange”), and may be traded on U.S. exchanges other than the Exchange, there can be no assurance that Shares will trade with any volume, or at all, on any stock exchange. In stressed market conditions, the liquidity of Shares may begin to mirror the liquidity of the Funds’ underlying portfolio holdings, which can be significantly less liquid than Shares. Also, in stressed market conditions, the market for Shares may become less liquid in response to deteriorating liquidity in the markets for each Funds’ underlying portfolio holdings. These adverse effects on liquidity for Shares, in turn, could lead to wider bid/ask spreads and differences between the market price of Shares and the underlying value of those Shares. |
| Notes to the Financial Statements | SP Funds ETFs |
November 30, 2024
| G. | Foreign Government Risk (Sukuk ETF Only). The Fund’s investment in securities issued by foreign governments or their agencies or instrumentalities (sovereign debt), including those that issue sukuk through a secondary issuing vehicle, differs from debt obligations issued by private entities in that, generally, remedies for defaults must be pursued in the courts of the defaulting party. Legal recourse is therefore limited. The foreign sovereign debt securities the Fund purchases involve specific risk, including that (i) the governmental entity that controls the repayment of sovereign debt may not be willing or able to repay the principal and/or interest when it becomes due because of political constraints, cash flow problems, and other national economic factors; (ii) governments may default on their sovereign debt, which may require holders of such sovereign debt to participate in debt rescheduling or additional lending to defaulting governments; and (iii) there are no bankruptcy proceedings by which defaulted sovereign debt may be collected in whole or in part. These and other factors can make investments in the Fund more volatile and potentially less liquid than other types of investments that track an index of domestic securities. |
| H. | Foreign Securities Risks (Global REIT ETF Only). Investments in securities or other instruments of non-U.S. issuers involve certain risks not involved in domestic investments and may experience more rapid and extreme changes in value than investments in securities of U.S. companies. Financial markets in foreign countries often are not as developed, efficient, or liquid as financial markets in the United States, and therefore, the prices of non-U.S. securities and instruments can be more volatile. In addition, the Fund will be subject to risks associated with adverse political and economic developments in foreign countries, which may include the imposition of economic sanctions. Generally, there is less readily available and reliable information about non-U.S. issuers due to less rigorous disclosure or accounting standards and regulatory practices. |
| I. | Geographic Investment Risk (Sukuk ETF Only). To the extent the Fund invests a significant portion of its assets in the securities of companies of a single country or region, it is more likely to be impacted by events or conditions affecting that country or region. |
| ● | Risks of Investing in Saudi Arabia (Sukuk ETF Only). The ability of foreign investors to invest in Saudi Arabian issuers is new and untested. Such ability could be restricted or revoked by the Saudi Arabian government at any time, and unforeseen risks could materialize due to foreign ownership in such securities. The economy of Saudi Arabia is dominated by petroleum exports. A sustained decrease in petroleum prices could have a negative impact on all aspects of the economy. Investments in securities of Saudi Arabian issuers involves risks not typically associated with investments in securities of issuers in more developed countries that may negatively affect the value of the Fund’s investments. Such heightened risks may include, among others, expropriation and/or nationalization of assets, restrictions on and government intervention in international trade, confiscatory taxation, political instability, including authoritarian and/or military involvement in governmental decision making, armed conflict, crime and instability as a result of religious, ethnic and/or socioeconomic unrest. There remains the possibility that instability in the larger Middle East region could adversely impact the economy of Saudi Arabia, and there is no assurance of political stability in Saudi Arabia. |
| ● | Risks of Investing in the United Arab Emirates (Sukuk ETF Only). The economy of the United Arab Emirates (“UAE”) is dominated by petroleum exports. A sustained decrease in commodity prices, particularly oil and natural gas, could have a negative impact on all aspects of the UAE economy. The non-oil UAE economy, which is concentrated in Dubai’s service sector, could be affected by declines in tourism, real estate, banking and re-export trade. The UAE and the governments of the individual emirates exercise substantial influence over many aspects of the private sector. Governmental actions could have a significant effect on economic conditions in the UAE, which could adversely affect the value of the Fund. In addition, recent political instability and protests in North Africa and the Middle East have caused significant disruptions to many industries. Continued political and social unrest in these areas may adversely affect the value of the Fund. |
| J. | Market Capitalization Risk. |
| ● | Large-Capitalization Investing (Sharia ETF and Global REIT ETF Only). The securities of large-capitalization companies may be relatively mature compared to smaller companies and therefore subject to slower growth during times of economic expansion. Large-capitalization companies may also be unable to respond quickly to new competitive challenges, such as changes in technology and consumer tastes. |
| ● | Mid-Capitalization Investing (Global REIT ETF Only). The securities of mid-capitalization companies may be more vulnerable to adverse issuer, market, political, or economic developments than securities of large-capitalization companies. The securities of mid-capitalization companies generally trade in lower volumes and are subject to greater and more unpredictable price changes than large-capitalization stocks or the stock market as a whole. |
| Notes to the Financial Statements | SP Funds ETFs |
November 30, 2024
| ● | Small-Capitalization Investing (Global REIT ETF Only). The securities of small-capitalization companies may be more vulnerable to adverse issuer, market, political, or economic developments than securities of large- or mid-capitalization companies. The securities of small-capitalization companies generally trade in lower volumes and are subject to greater and more unpredictable price changes than large- or mid-capitalization stocks or the stock market as a whole. There is typically less publicly available information concerning smaller-capitalization companies than for larger, more established companies. |
| K. | Models and Data Risk. The composition of the Index is heavily dependent on proprietary quantitative models as well as information and data supplied by third parties (“Models and Data”). When Models and Data prove to be incorrect or incomplete, any decisions made in reliance thereon may lead to the inclusion or exclusion of securities from the Index universe that would have been excluded or included had the Models and Data been correct and complete. If the composition of the Index reflects such errors, the Funds’ portfolio can be expected to also reflect the errors. |
| L. | Non-Diversification Risk (Sharia ETF and Global REIT ETF Only). Because each Fund is “non-diversified,” it may invest a greater percentage of its assets in the securities of a single issuer or a smaller number of issuers than if it was a diversified fund. As a result, a decline in the value of an investment in a single issuer or a smaller number of issuers could cause each Fund’s overall value to decline to a greater degree than if the Funds held a more diversified portfolio. |
| M. | Passive Investment Risk. The Funds invest in the securities included in, or representative of, its respective Index regardless of their investment merit. Each Fund does not attempt to outperform its respective Index or take defensive positions in declining markets. As a result, a Fund’s performance may be adversely affected by a general decline in the market segments relating to its respective Index. |
| N. | Sector Risk. To the extent a Fund invests more heavily in particular sectors of the economy, its performance will be especially sensitive to developments that significantly affect those sectors. |
| ● | Consumer Discretionary Sector Risk (Sharia ETF Only). The Fund may invest in companies in the consumer discretionary sector, and therefore the performance of the Fund could be negatively impacted by events affecting this sector. The success of consumer product manufacturers and retailers is tied closely to the performance of domestic and international economies, interest rates, exchange rates, competition, consumer confidence, changes in demographics and consumer preferences. Companies in the consumer discretionary sector depend heavily on disposable household income and consumer spending and may be strongly affected by social trends and marketing campaigns. These companies may be subject to severe competition, which may have an adverse impact on their profitability. |
| ● | Information Technology Sector Risk (Sharia ETF Only). The Fund may invest in companies in the information technology sector, and therefore the performance of the Fund could be negatively impacted by events affecting this sector. Market or economic factors impacting information technology companies and companies that rely heavily on technological advances could have a significant effect on the value of the Fund’s investments. The value of stocks of information technology companies and companies that rely heavily on technology is particularly vulnerable to rapid changes in technology product cycles, rapid product obsolescence, government regulation and competition, both domestically and internationally, including competition from foreign competitors with lower production costs. Stocks of information technology companies and companies that rely heavily on technology, especially those of smaller, less-seasoned companies, tend to be more volatile than the overall market. Information technology companies are heavily dependent on patent and intellectual property rights, the loss or impairment of which may adversely affect profitability. |
| ● | Financials Sector Risk (Sukuk ETF). Performance of companies in the financials sector may be adversely impacted by many factors, including, among others, government regulations, economic conditions, credit rating downgrades, changes in interest rates, and decreased liquidity in credit markets. Companies in the financial services sector may also be negatively impacted by disruptions in the banking industry. The impact of more stringent capital requirements, recent or future regulation of any individual financial company or of the financials sector as a whole cannot be predicted. In recent years, cyber attacks and technology malfunctions and failures have become increasingly frequent in this sector and have caused significant losses to companies in this sector, which may negatively impact the Funds. |
| Notes to the Financial Statements | SP Funds ETFs |
November 30, 2024
| O. | Sharia-Compliant Investing Risk. Islamic religious law, commonly known as “Sharia,” has certain restrictions regarding finance and commercial activities permitted for Muslims, including interest restrictions and prohibited industries, which reduces the size of the overall universe in which the Funds can invest. The strategy to reduce the investable universe may limit investment opportunities and adversely affect each Fund’s performance, especially in comparison to a more diversified fund. Because Islamic principles preclude the use of interest-paying instruments, cash reserves do not earn income. |
| P. | Sukuk Risk (Sukuk ETF only). Sukuk are financial certificates that are similar to conventional bonds but are structured to comply with Sharia law and its investments principles, which, among other things, prohibit charging or paying interest. Sukuk involve many of the same risks that conventional bonds incur such as credit risk and interest rate risk. In addition to these risks, there are certain risks specific to sukuk. Sukuk represent undivided shares in the ownership of certificates, and such certificates are linked to a specific investment activity, such as an underlying asset or contractual payment obligations of the issuer. Because no collateral is pledged as security for sukuk, purchasers of sukuk are subject to the risk that an issuer may not meet its payment obligations or that an underlying asset may not perform as expected or lose value. While the sukuk market has grown significantly in recent years, there may be times when the market is illiquid and it is difficult for the Fund to make an investment in or dispose of sukuk. |
| Q. | Tax Risk (Global REIT ETF Only). To qualify for the favourable tax treatment generally available to regulated investment companies, the Fund must satisfy certain diversification requirements. In particular, the Fund generally may not acquire a security if, as a result of the acquisition, (i) more than 50% of the value of the Fund’s assets would be invested in (a) issuers in which the Fund has, in each case, invested more than 5% of the Fund’s assets or (b) issuers more than 10% of whose outstanding voting securities are owned by the Fund or (ii) more than 25% of the value of the Fund’s assets would be invested in (a) the securities of any one issuer. Given the concentration of the Global REIT Index in a relatively small number of securities, it may not always be possible for the Fund to fully implement a replication strategy or a representative sampling strategy while satisfying these diversification requirements. The Fund’s efforts to satisfy the diversification requirements may affect the Fund’s execution of its investment strategy and may cause the Fund’s return to deviate from that of the Global REIT Index, and the Fund’s efforts to replicate or represent the Global REIT Index may cause it inadvertently to fail to satisfy the diversification requirements. If the Fund were to fail to satisfy the diversification requirements, it could incur penalty taxes and be forced to dispose of certain assets, or it could fail to qualify as a regulated investment company. If the Fund were to fail to qualify as a regulated investment company, it would be taxed in the same manner as an ordinary corporation, and distributions to its shareholders would not be deductible by the Fund in computing its taxable income. |
| R. | Tracking Error Risk. As with all index funds, the performance of a Fund and its Index may differ from each other for a variety of reasons. For example, a Fund incurs operating expenses and portfolio transaction costs not incurred by the Index. In addition, a Fund may not be fully invested in the securities of the Index at all times or may hold securities not included in the Index. |
| S. | Underlying Index Risk. Neither the Adviser nor the Index Provider is able to guarantee the continuous availability or timeliness of the production of the Index. The calculation and dissemination of the Index values may be delayed if the information technology or other facilities of the Index Provider, calculation agent, data providers and/or relevant stock exchange malfunction for any reason. A significant delay may cause trading in shares of a Fund to be suspended. Errors in Index data, computation and/or the construction in accordance with its methodology may occur from time to time and may not be identified and corrected by the Index Provider, calculation agent or other applicable party for a period of time or at all, which may have an adverse impact on the Funds and their shareholders. |
| NOTE 4 – COMMITMENTS AND OTHER RELATED PARTY TRANSACTIONS |
The Adviser serves as investment adviser to the Funds pursuant to an investment advisory agreement between the Trust and the Adviser with respect to the Funds (the “Advisory Agreement”) and, pursuant to the Advisory Agreement, has overall responsibility for the general management and administration of the Funds, subject to the direction and oversight of the Board. The Adviser is also responsible for trading portfolio securities for the Funds, including selecting broker-dealers to execute purchase and sale transactions, subject to the supervision of the Board. The Adviser provides oversight of the Sub-Adviser and review of the Sub-Adviser’s performance.
| Notes to the Financial Statements | SP Funds ETFs |
November 30, 2024
Pursuant to the Advisory Agreement, each Fund pays the Adviser a unitary management fee (the “Investment Advisory Fee”) based on the average daily net assets of the Fund as follows:
| Fund | | Investment Advisory Fee | |
| Sukuk ETF | | | 0.55 | %(a) |
| Sharia ETF | | | 0.45 | %(b) |
| Global REIT ETF | | | 0.55 | %(c) |
| (a) | Effective December 1, 2023, the Fund’s Investment Advisory Fee was reduced from 0.59% to 0.55%. |
| (b) | Effective December 1, 2023, the Fund’s Investment Advisory Fee was reduced from 0.49% to 0.45%. |
| (c) | Effective December 1, 2023, the Fund’s Investment Advisory Fee was reduced from 0.59% to 0.55%. |
Out of the Investment Advisory Fees, the Adviser is obligated to pay or arrange for the payment of substantially all expenses of the Funds, including the cost of sub-advisory transfer agency, custody, fund administration, and all other related services necessary for the Funds to operate. Under the Advisory Agreement, the Adviser has agreed to pay, or require the Sub-Adviser to pay, all expenses incurred by the Funds except for interest charges on any borrowings, dividends and other expenses on securities sold short, taxes, brokerage commissions and other expenses incurred in placing orders for the purchase and sale of securities and other investment instruments, acquired fund fees and expenses, accrued deferred tax liability, extraordinary expenses, and distribution fees and expenses paid by the Funds under any distribution plan adopted pursuant to Rule 12b-1 under the 1940 Act (collectively, “Excluded Expenses”) and the Investment Advisory Fees payable to the Adviser. The Investment Advisory Fees incurred are paid monthly to the Adviser. The Investment Advisory Fees for the year ended November 30, 2024 are disclosed in the Statements of Operations.
The Sub-Adviser serves as the investment sub-adviser to the Funds, pursuant to a sub-advisory agreement between the Adviser and the Sub-Adviser with respect to the Funds (the “Sub-Advisory Agreement”). Pursuant to the Sub-Advisory Agreement, the Sub-Adviser is responsible for ensuring the Funds follow the character of each applicable Index and providing advice with regard to the interpretation of and compliance with Sharia principles.
Pursuant to the Sub-Advisory Agreement, the Adviser pays the Sub-Adviser a fee for the services and facilities the Sub-Adviser provides (the “Sub-Advisory Fee”) based on the average daily net assets of each Fund as follows:
| Fund | | Sub-Advisory Fee |
| Sukuk ETF | | 0.02% |
| Sharia ETF | | 0.02% |
| Global REIT ETF | | 0.02% under $500 million in assets under management; |
| | | 0.01% on assets under management over $500 million |
The Sub-Advisory Fees incurred are paid monthly to the Sub-Adviser by the Adviser. The Adviser has entered into an agreement with SP Funds Management, LLC (“SP Funds Management”) an affiliate of the Sub-Adviser, pursuant to which SP Funds Management has agreed to assume the Adviser’s obligation to pay all expenses incurred by the Funds. For assuming each Fund’s payment obligations, the Adviser has agreed to pay SP Funds Management, the profits, if any, generated by each Fund’s Investment Advisory Fees, less a contractual fee retained by the Adviser. Expenses incurred by the Funds and paid by SP Funds Management include fees charged by Tidal (defined below), which is the Funds’ administrator and an affiliate of the Adviser.
Tidal ETF Services LLC (“Tidal”), a Tidal Financial Group company and an affiliate of the Adviser, serves as the Funds’ administrator and, in that capacity, performs various administrative and management services for the Funds. Tidal coordinates the payment of Fund-related expenses and manages the Trust’s relationships with its various service providers. As compensation for the services it provides, Tidal receives a fee based on the Fund’s average daily net assets, subject to a minimum annual fee. Tidal also is entitled to certain out-of-pocket expenses for the services mentioned above.
U.S. Bancorp Fund Services, LLC, doing business as U.S. Bank Global Fund Services (“Fund Services”), serves as the Funds’ sub-administrator, fund accountant and transfer agent. In those capacities, Fund Services performs various administrative and accounting services for the Funds. Fund Services prepares various federal and state regulatory filings, reports and returns for the Funds, including regulatory compliance monitoring and financial reporting; prepares reports and materials to be supplied to the Board; and monitors the activities of the Funds’ custodian. U.S. Bank N.A. (the “Custodian”), an affiliate of Fund Services, serves as the Funds’ custodian.
Foreside Fund Services, LLC (the “Distributor”), acts as the Funds’ principal underwriter in a continuous public offering of the Funds’ shares.
| Notes to the Financial Statements | SP Funds ETFs |
November 30, 2024
Certain officers and a trustee of the Trust are affiliated with the Adviser. Neither the affiliated trustee nor the Trust’s officers receive compensation from the Funds.
| NOTE 5 – PURCHASES AND SALES OF SECURITIES |
For the year ended November 30, 2024, the cost of purchases and proceeds from the sales or maturities of securities, excluding short-term investments, U.S. government securities, and in-kind transactions were as follows:
| Fund | | Purchases | | | Sales | |
| Sukuk ETF | | $ | 138,779,665 | | | $ | 29,816,582 | |
| Sharia ETF | | | 119,186,278 | | | | 107,650,301 | |
| Global REIT ETF | | | 53,243,587 | | | | 54,314,933 | |
For the year ended November 30, 2024, there were no purchases or sales of long-term U.S. government securities.
For the year ended November 30, 2024, in-kind transactions associated with creations and redemptions for the Funds were as follows:
| Fund | | Purchases | | | Sales | |
| Sukuk ETF | | $ | — | | | $ | — | |
| Sharia ETF | | | 413,829,025 | | | | 832,485 | |
| Global REIT ETF | | | 66,317,822 | | | | — | |
| NOTE 6 – DISTRIBUTIONS TO SHAREHOLDERS |
The tax character of distributions paid during the year ended November 30, 2024, were as follows:
| Distributions paid from: | | Sukuk ETF | | | Sharia ETF | | | Global REIT ETF | |
| Ordinary income | | $ | 5,756,705 | | | $ | 3,139,234 | | | $ | 3,312,054 | |
| Return of capital | | | — | | | | 1,552,247 | | | | 1,544,676 | |
| Total distributions paid | | $ | 5,756,705 | | | $ | 4,691,481 | | | $ | 4,856,730 | |
The tax character of distributions paid during the year ended November 30, 2023, were as follows:
| Distributions paid from: | | Sukuk ETF | | | Sharia ETF | | | Global REIT ETF | |
| Ordinary income | | $ | 2,373,600 | | | $ | 2,081,082 | | | $ | 1,158,718 | |
| Return of capital | | | — | | | | 566,368 | | | | 1,471,032 | |
| Total distributions paid | | $ | 2,373,600 | | | $ | 2,647,450 | | | $ | 2,629,750 | |
| Notes to the Financial Statements | SP Funds ETFs |
November 30, 2024
As of the year ended November 30, 2024, the components of distributable earnings/(accumulated losses) on a tax basis were as follows:
| | | Sukuk ETF | | | Sharia ETF | | | Global REIT ETF | |
| Investments, at cost(a) | | $ | 263,226,866 | | | $ | 727,731,127 | | | $ | 145,086,878 | |
| Gross tax unrealized appreciation | | | 1,510,398 | | | | 222,523,587 | | | | 20,943,916 | |
| Gross tax unrealized depreciation | | | (3,881,043 | ) | | | (23,790,328 | ) | | | (7,687,340 | ) |
| Net tax unrealized appreciation (depreciation) | | | (2,370,645 | ) | | | 198,733,259 | | | | 13,256,576 | |
| Undistributed ordinary income (loss) | | | 3,275,547 | | | | — | | | | — | |
| Undistributed long-term capital gain (loss) | | | — | | | | — | | | | — | |
| Total distributable earnings | | | 3,275,547 | | | | — | | | | — | |
| Other accumulated gain (loss) | | | (1,221,511 | ) | | | (1,681,918 | ) | | | (6,768,806 | ) |
| Total distributable earnings/(accumulated losses) | | $ | (316,609 | ) | | $ | 197,051,341 | | | $ | 6,487,770 | |
| (a) | The difference between book and tax-basis unrealized appreciation was attributable primarily to the treatment of wash sales. |
Net capital losses incurred after November 30 and net investment losses incurred after December 31, and within the taxable year, may be elected to be deferred to the first business day of each Fund’s next taxable year. As of the fiscal year ended November 30, 2024, the Funds had no late year losses and the Sukuk ETF, Sharia ETF, and Global REIT ETF had short-term capital loss carryovers of $452,861, $0, and $2,442,095, respectively, which do not expire. The Sukuk ETF, Sharia ETF, and Global REIT ETF also had long-term capital loss carryovers of $768,650, $1,681,918, and $4,326,711, respectively, which do not expire.
U.S. Bank N.A. has made available to the Global REIT ETF a credit facility pursuant to a Loan Agreement for temporary or extraordinary purposes. Credit facility details for the year ended November 30, 2024, are as follows:
| Maximum available credit | | $ | 50,000,000 | |
| Largest amount outstanding on an individual day | | $ | 217,000 | |
| Average daily loan outstanding, when in use | | $ | 181,143 | |
| Credit facility outstanding as of November 30, 2024 | | | — | |
| Average interest rate, when in use | | | 8.50 | % |
| Interest rate terms | | | Prime | |
| Interest rate as of November 30, 2024 | | | 7.75 | % |
| Expiration date | | | June 25, 2025 | |
Interest expense incurred for the year ended November 30, 2024 is disclosed in the Statements of Operations, if applicable.
The credit facility is an uncommitted, senior secured 364-day umbrella line of credit used for the benefit of certain funds in the Trust. The maximum available credit is disclosed at the Trust level. The Fund’s ability to borrow is therefore limited by borrowings of other funds within the Trust which are party to the agreement and to one-third of the Fund’s total assets.
| NOTE 8 – SHARE TRANSACTIONS |
Shares of the Funds are listed and traded on the Exchange. Market prices for the shares may be different from their NAV. The Funds issue and redeem shares on a continuous basis at NAV generally in large blocks of shares, called Creation Units. Creation Units are issued and redeemed principally in-kind for securities included in a specified universe. Once created, shares generally trade in the secondary market at market prices that change throughout the day. Except when aggregated in Creation Units, shares are not redeemable securities of the Funds. Creation Units may only be purchased or redeemed by Authorized Participants. An Authorized Participant is either (i) a broker-dealer or other participant in the clearing process through the Continuous Net Settlement System of the National Securities Clearing Corporation or (ii) a Depository Trust Company participant and, in each case, must have executed a Participant Agreement with the Distributor. Most retail investors do not qualify as Authorized Participants nor have the resources to buy and sell whole Creation Units. Therefore, they are unable to purchase or redeem the shares directly from the Funds. Rather, most retail investors may purchase shares in the secondary market with the assistance of a broker and are subject to customary brokerage commissions or fees.
| Notes to the Financial Statements | SP Funds ETFs |
November 30, 2024
Each Fund currently offers one class of shares, which has no front-end sales load, no deferred sales charge, and no redemption fee. A fixed transaction fee is imposed for the transfer and other transaction costs associated with the purchase or sale of Creation Units. The standard fixed transaction fee for the Funds is $500, payable to the Custodian. The fixed transaction fee may be waived on certain orders if the Funds’ Custodian has determined to waive some or all of the costs associated with the order or another party, such as the Adviser, has agreed to pay such fee. In addition, a variable fee may be charged on all cash transactions or substitutes for Creation Units and Redemption Units of up to a maximum of 2% of the value of the Creation Units and Redemption Units subject to the transaction. Variable fees are imposed to compensate the Funds for transaction costs associated with the cash transactions. Variable fees received by the Funds, if any, are disclosed in the capital shares transactions section of the Statements of Changes in Net Assets. The Funds may issue an unlimited number of shares of beneficial interest, with no par value. All shares of the Funds have equal rights and privileges.
| NOTE 9 – RECENT MARKET EVENTS |
U.S. and international markets have experienced and may continue to experience significant periods of volatility in recent years and months due to a number of economic, political and global macro factors including rising inflation, uncertainty regarding central banks’ interest rates, the possibility of a national or global recession, trade tensions, political events, the war between Russia and Ukraine, and significant conflict between Israel and Hamas in the Middle East. As a result of continuing political tensions and armed conflicts, including the war between Ukraine and Russia, the U.S. and the European Union imposed sanctions on certain Russian individuals and companies, including certain financial institutions, and have limited certain exports and imports to and from Russia. The war has contributed to recent market volatility and may continue to do so. The Middle East conflict has led to significant loss of life, damaged infrastructure and escalated tensions both in the region and globally. These developments, as well as other events, could result in further market volatility and negatively affect financial asset prices, the liquidity of certain securities and the normal operations of securities exchanges and other markets, despite government efforts to address market disruptions. As a result, the risk environment remains elevated.
| NOTE 10 – SUBSEQUENT EVENTS |
In preparing these financial statements, management has evaluated events and transactions for potential recognition or disclosure through the date the financial statements were issued. Effective December 16, 2024, the Sukuk ETF’s Investment Advisory Fee was reduced from 0.55% to 0.50% of the Fund’s average daily net assets and the Global REIT ETF’s Investment Advisory Fee was also reduced from 0.55% to 0.50% of the Fund’s average daily net assets.
Report of Independent
Registered Public Accounting Firm | SP Funds ETFs |
November 30, 2024
REPORT OF INDEPENDENT REGISTERED PUBLIC ACCOUNTING FIRM
To the Shareholders of
SP Funds S&P 500 Sharia Industry Exclusions ETF,
SP Funds Dow Jones Global Sukuk ETF and
SP Funds S&P Global REIT Sharia ETF
The Board of Trustees of
Tidal ETF Trust
Opinion on the Financial Statements
We have audited the accompanying statements of assets and liabilities of SP Funds S&P 500 Sharia Industry Exclusions ETF (“Sharia ETF”), SP Funds Dow Jones Global Sukuk ETF (“Sukuk ETF”) and SP Funds S&P Global REIT Sharia ETF (“REIT ETF”) (collectively the “Funds”), each a series of Tidal ETF Trust (the “Trust”), including the schedules of investments, as of November 30, 2024, and with respect to Sharia ETF, the related statement of operations for the year then ended, the statement of changes in net assets for each of the two years then ended and the financial highlights for each of the four years then ended and for the period December 17, 2019 (commencement of operations) to November 30, 2020, with respect to Sukuk ETF, the related statement of operations for the year then ended, the statement of changes in net assets for each of the two years then ended and the financial highlights for each of the four years then ended and for the period December 27, 2019 (commencement of operations) to November 30, 2020 and with respect to REIT ETF, the related statement of operations for the year then ended, the statement of changes in net assets for each of the two years then ended and the financial highlights for each of the three years then ended and for the period December 29, 2020 (commencement of operations) through November 30, 2021, and the related notes (collectively referred to as the “financial statements”). In our opinion, the financial statements present fairly, in all material respects, the financial position of the Funds as of November 30, 2024, and the results of their operations, the changes in their net assets and the financial highlights for the periods stated above, in conformity with accounting principles generally accepted in the United States of America.
Basis for Opinion
These financial statements are the responsibility of the Funds’ management. Our responsibility is to express an opinion on the Funds’ financial statements based on our audits. We are a public accounting firm registered with the Public Company Accounting Oversight Board (United States) (“PCAOB”) and are required to be independent with respect to the Funds in accordance with the U.S. federal securities laws and the applicable rules and regulations of the Securities and Exchange Commission and the PCAOB. We have served as the auditor of one or more of the funds in the Trust since 2018.
We conducted our audits in accordance with the standards of the PCAOB. Those standards require that we plan and perform the audits to obtain reasonable assurance about whether the financial statements are free of material misstatement, whether due to error or fraud. The Funds are not required to have, nor were we engaged to perform, an audit of their internal control over financial reporting. As part of our audits we are required to obtain an understanding of internal control over financial reporting, but not for the purpose of expressing an opinion on the effectiveness of the Funds’ internal control over financial reporting. Accordingly, we express no such opinion.
Our audits included performing procedures to assess the risks of material misstatement of the financial statements, whether due to error or fraud, and performing procedures that respond to those risks. Such procedures included examining, on a test basis, evidence regarding the amounts and disclosures in the financial statements. Our audits also included evaluating the accounting principles used and significant estimates made by management, as well as evaluating the overall presentation of the financial statements. Our procedures included confirmation of securities owned as of November 30, 2024 by correspondence with the custodian and brokers or through other appropriate auditing procedures when replies from brokers were unable to be obtained. We believe that our audits provide a reasonable basis for our opinion.
| |  |
| | |
| | TAIT, WELLER & BAKER LLP |
Philadelphia, Pennsylvania
January 29, 2025
| Other Non-Audited Information | SP Funds ETFs |
November 30, 2024
QUALIFIED DIVIDEND INCOME/DIVIDENDS RECEIVED DEDUCTION
For the year ended November 30, 2024, certain dividends paid by the Funds may be subject to a maximum tax rate of 23.8%, as provided for by the Jobs and Growth Tax Relief Reconciliation Act of 2003 and the Tax Cuts and Jobs Act of 2017. The percentage of dividends declared from ordinary income designated as qualified dividend income was as follows:
| Sukuk ETF | | | 0.00 | % |
| Sharia ETF | | | 100.00 | % |
| Global REIT ETF | | | 8.83 | % |
For corporate shareholders, the percent of ordinary income distributions qualifying for the corporate dividends received deduction for the year ended November 30, 2024, was as follows:
| Sukuk ETF | | | 0.00 | % |
| Sharia ETF | | | 100.00 | % |
| Global REIT ETF | | | 0.10 | % |
The percentage of taxable ordinary income distributions that are designated as short-term capital gain distributions under Internal Revenue Section 871(k)(2)(c) for the year ended November 30, 2024, was as follows:
| Sukuk ETF | | | 0.00 | % |
| Sharia ETF | | | 0.00 | % |
| Global REIT ETF | | | 0.00 | % |
| (b) | Financial Highlights are included within the financial statements filed under Item 7(a) of this Form.” |
Item 8. Changes in and Disagreements with Accountants for Open-End Investment Companies.
There have been no changes in or disagreements with the Funds’ accountants.
Item 9. Proxy Disclosure for Open-End Investment Companies.
There were no matters submitted to a vote of shareholders during the period covered by the report.
Item 10. Remuneration Paid to Directors, Officers, and Others of Open-End Investment Companies.
See Item 7(a). Under the Investment Advisory Agreement, in exchange for a single unitary management fee from each Fund, the Adviser has agreed to pay all expenses incurred by the Fund, including Trustee compensation, except for certain excluded expenses.
Item 11. Statement Regarding Basis for Approval of Investment Advisory Contract.
The Board of Trustees (the “Board” or the “Trustees”) of Tidal ETF Trust (the “Trust”) met at a meeting held on September 18, 2024 to consider the renewal of the Investment Advisory Agreement (the “Advisory Agreement”) between the Trust, on behalf of the SP Funds Dow Jones Global Sukuk ETF (the “SPSK ETF”), the SP Funds S&P 500 Sharia Industry Exclusions ETF (the “SPUS ETF”), and the SP Funds S&P Global REIT Sharia ETF (the “SPRE ETF”) (each, a “Fund,” and collectively, the “Funds”), each a series of the Trust, and Tidal Investments LLC, the Funds’ investment adviser (the “Adviser”). Prior to this meeting, the Board requested and received materials to assist them in considering the renewal of the Advisory Agreement. The materials provided contained information with respect to the factors enumerated below, including a copy of the Advisory Agreement, a memorandum prepared by outside legal counsel to the Trust and Independent Trustees discussing in detail the Trustees’ fiduciary obligations and the factors they should assess in considering the renewal of the Advisory Agreement, due diligence materials relating to the Adviser (including the due diligence response completed by the Adviser with respect to a specific request letter from outside legal counsel to the Trust and Independent Trustees, the Adviser’s Form ADV, select ownership, organizational, financial and insurance information for the Adviser, biographical information of the Adviser’s key management and compliance personnel, detailed comparative information regarding the unitary advisory fees for the Funds, and information regarding the Adviser’s compliance program) and other pertinent information. Based on their evaluation of the information provided, the Trustees, by a unanimous vote (including a separate vote of the Trustees who are not “interested persons,” as that term is defined in the Investment Company Act of 1940, as amended (the “Independent Trustees”)), approved the renewal of the Advisory Agreement for an additional one-year term.
Discussion of Factors Considered
In considering the renewal of the Advisory Agreement and reaching their conclusions, the Trustees reviewed and analyzed various factors that they determined were relevant, including the factors enumerated below.
| | 1. | Nature, Extent and Quality of Services Provided. The Board considered the nature, extent and quality of the Adviser’s overall services provided to the Funds as well as its specific responsibilities in all aspects of day-to-day investment management of the Funds, including trade execution and recommendations with respect to the hiring, termination or replacement of sub- advisers to the Funds. The Board considered the qualifications, experience and responsibilities of the Adviser’s investment management team, including Michael Venuto and Charles Ragauss, who each serve as a portfolio manager to the Funds, as well as the responsibilities of other key personnel of the Adviser involved in the day-to-day activities of the Funds. The Board reviewed due diligence information provided by the Adviser, including information regarding the Adviser’s compliance program, its compliance personnel and compliance record, as well as the Adviser’s cybersecurity program and business continuity plan. The Board noted that the Adviser does not manage any other accounts that utilize a strategy similar to that employed by each of the Funds. |
The Board also considered other services provided to the Funds, such as monitoring adherence to each Fund’s investment strategy and restrictions, oversight of ShariaPortfolio, Inc. (“ShariaPortfolio” or the “Sub-Adviser”), the Funds’ sub-adviser, and other service providers to the Funds, monitoring compliance with various Fund policies and procedures and with applicable securities regulations, and monitoring the extent to which each Fund achieves its investment objective as a passively-managed ETF. The Board noted that each Fund is designed to track the performance of an underlying index and that the Adviser is responsible for portfolio management and trade execution for each Fund and the Sub-Adviser serves a limited role ensuring Sharia compliance for each Fund.
The Board concluded that the Adviser had sufficient quality and depth of personnel, resources, investment methods, and compliance policies and procedures essential to performing its duties under the Advisory Agreement and managing the Funds and that the nature, overall quality and extent of the management services provided to the Funds, as well as the Adviser’s compliance program, were satisfactory.
| | 2. | Investment Performance of the Funds and the Adviser. The Board considered the investment performance of each Fund and the Adviser. The Board noted that each Fund was designed to track the performance of an index and considered the extent to which each Fund tracked its respective underlying index, before fees and expenses, in addition to the performance of the Fund against its respective benchmark index and respective select peer groups. |
The Board considered the performance of the SPUS ETF on an absolute basis, in comparison to its underlying index (the S&P 500 Shariah Industry Exclusions Index), and in comparison to its benchmark index (the S&P 500 Total Return Index). The Board also considered comparative information prepared by the Adviser, in partnership with AltaVista Research, LLC, a third-party ETF research firm, comparing the Fund to a peer group of ETFs within the Fund’s designated Morningstar category (a peer group of U.S. large growth funds) (the “SPUS Peer Group”), as well as a peer group of ETFs representing a subset of the SPUS Peer Group based on select criteria (the “SPUS Select Peer Group”). The Board considered the SPUS ETF’s performance versus its underlying index and noted factors that contributed to any tracking error. The Board noted that the SPUS ETF outperformed the S&P 500 Total Return Index over the year-to-date, one-year, three-year and since inception periods ended June 30, 2024. The Board also considered that the Fund’s performance was in-line with the SPUS Peer Group median and trailed the SPUS Peer Group average over the one-year period ended August 2, 2024, but outperformed the SPUS Peer Group median and average over the three-year period ended August 2, 2024. The Board also noted that the Fund ranked 65 out of 102 funds in the SPUS Peer Group for the one-year period ended August 2, 2024, and ranked three out of 74 funds in the SPUS Peer Group for the three-year period ended August 2, 2024.
The Board considered the performance of the SPSK ETF on an absolute basis, in comparison to its underlying index (the Dow Jones Sukuk Total Return (ex- Reinvestment) Index) and in comparison to its benchmark index (the Bloomberg Global Aggregate Bond Index (the “Bloomberg Index”)). The Board also considered comparative information prepared by the Adviser, in partnership with AltaVista Research, LLC, a third-party ETF research firm, comparing the Fund to a peer group of ETFs within the Fund’s designated Morningstar category (a peer group of U.S. global bond funds) (the “SPSK Peer Group”), as well as a peer group of ETFs representing a subset of the SPSK Peer Group based on select criteria (the “SPSK Select Peer Group”). The Board considered the SPSK ETF’s performance versus its underlying index and noted factors that contributed to any tracking error. The Board noted that the SPSK ETF outperformed the Bloomberg Index over the year-to-date, one-year, three-year and since inception periods ended June 30, 2024. The Board also considered that the SPSK ETF outperformed the SPSK Peer Group median and average for the one-year and three-year periods ended August 2, 2024. The Board also noted that the Fund ranked fourth out of nine funds in the SPSK Peer Group for the one-year period ended August 2, 2024, and ranked first out of nine funds in the SPSK Peer Group for the three- year period ended August 2, 2024.
The Board considered the performance of the SPRE ETF on an absolute basis, in comparison to its underlying index (the S&P Global All Equity REIT Shariah Capped Index) and in comparison to its benchmark index (the S&P 500 Total Return Index). The Board also considered comparative information prepared by the Adviser, in partnership with AltaVista Research, LLC, a third-party ETF research firm, comparing the Fund to a peer group of ETFs within the Fund’s designated Morningstar category (a peer group of U.S. real estate funds) (the “SPRE Peer Group”), as well as a peer group of ETFs representing a subset of the SPRE Peer Group based on select criteria (the “SPRE Select Peer Group”). The Board considered the SPRE ETF’s performance versus its underlying index and noted factors that contributed to any tracking error. The Board noted that the Global REIT underperformed the S&P 500 Total Return Index over the year-to-date, one-year, three-year and since inception periods ended June 30, 2024. The Board considered that the SPSK ETF’s performance trailed the SPRE Peer Group median and average for the one-year and three-year periods ended August 2, 2024. The Board also noted that the Fund ranked 26 out of 38 funds in the SPRE Peer Group for the one-year period ended August 2, 2024, and ranked 23 out of 31 funds in the SPRE Peer Group for the three-year period ended August 2, 2024.
After considering all of the information, the Board concluded that the performance of each Fund was satisfactory under current market conditions and that the Adviser has the necessary expertise and resources in providing investment advisory services in accordance with each Fund’s investment objective and strategies. Although past performance is not a guarantee or indication of future results, the Board determined that each Fund and its shareholders were likely to benefit from the Adviser’s continued management.
| | 3. | Cost of Services Provided and Profits Realized by the Adviser. The Board considered the cost of services and the structure of the Adviser’s advisory fees, including a review of comparative expenses, expense components and peer group selection for each Fund. The Board took into consideration that the advisory fee was a “unitary fee,” meaning that each Fund pays no expenses other than the advisory fee and certain other costs such as interest, brokerage, and extraordinary expenses and, to the extent it is implemented, fees pursuant to each Fund’s Rule 12b-1 Plan. The Board noted that the Adviser continues to be responsible for compensating the Trust’s other service providers and paying each Fund’s other expenses out of its own fee and resources, subject to the contractual agreement by an affiliate of the Sub-Adviser to assume such obligation in exchange for the profits, if any, generated by each Fund’s unitary fees. The Board also considered the overall profitability of the Adviser and examined the level of profits accrued to the Adviser from the fees payable under the Advisory Agreement. |
The Board noted that the SPUS ETF’s advisory fee of 0.45% (which was reduced from 0.49% effective December 1, 2023) was in line with the SPUS Peer Group and SPUS Select Peer Group averages of 0.455% and 0.452%, respectively, and the Fund’s expense ratio of 0.45% was below the SPUS Peer Group and SPUS Select Peer Group averages of 0.488% and 0.496%, respectively.
The Board noted that the SPSK ETF’s advisory fee of 0.55% (which was reduced from 0.59% effective December 1, 2023) was above the SPSK Peer Group and SPSK Select Peer Group averages of 0.388% and 0.35%, respectively, and the Fund’s expense ratio of 0.55% was above the SPSK Peer Group and SPSK Select Peer Group averages of 0.388% and 0.35%, respectively.
The Board noted that the Global REIT’s advisory fee of 0.55% (which was reduced from 0.59% effective December 1, 2023) was above the SPRE Peer Group and SPRE Select Peer Group averages of 0.447% and 0.474%, respectively, and the Fund’s expense ratio of 0.55% was above the SPRE Peer Group and SPRE Select Peer Group averages of 0.441% and 0.482%, respectively.
The Board concluded that each Fund’s expense ratio and advisory fee were fair and reasonable in light of the comparative performance, advisory fee and expense information and the investment management services provided to the Fund by the Adviser given the nature of the Fund’s strategies. The Board also evaluated, based on a profitability analysis prepared by the Adviser, the fees received by the Adviser and its affiliates and the profits realized by the Adviser from its relationship with each Fund, and concluded that the fees had not been, and currently were not, excessive, and the Adviser had adequate financial resources to support its services to each Fund from the revenues of its overall investment advisory business.
| | 4. | Extent of Economies of Scale as each Fund Grows. The Board compared each Fund’s expenses relative to its peer groups and discussed realized and potential economies of scale. The Board considered the potential economies of scale that each Fund might realize under the structure of the advisory fees. The Board noted the advisory fees did not contain any breakpoint reductions as each Fund’s assets grow in size, but that the Adviser would evaluate future circumstances that may warrant breakpoints in the fee structures. |
| | 5. | Benefits Derived from the Relationship with the Funds. The Board considered the direct and indirect benefits that could be received by the Adviser and its affiliates from association with the Funds. The Board concluded that the benefits the Adviser may receive, such as greater name recognition or the ability to attract additional investor assets, appear to be reasonable and in many cases may benefit the Funds. |
Conclusion. Based on the Board’s deliberations and its evaluation of the information described above, with no single factor determinative of a conclusion, the Board, including the Independent Trustees, unanimously concluded that: (a) the terms of the Advisory Agreement are fair and reasonable; (b) the advisory fees are reasonable in light of the services that the Adviser provides to each of the Funds; and (c) the approval of renewal of the Advisory Agreement for an additional one-year term was in the best interests of each Fund and its shareholders.
At the meeting held on September 18, 2024, the Board also considered the renewal of the sub-advisory agreement (the “Sub-Advisory Agreement”) for the Funds, entered into between the Adviser and ShariaPortfolio. Prior to this meeting, the Board requested and received materials to assist them in considering the renewal of the Sub-Advisory Agreement. The materials provided contained information with respect to the factors enumerated below, including a copy of the Sub-Advisory Agreement, a memorandum prepared by outside legal counsel to the Trust and the Independent Trustees discussing in detail the Trustees’ fiduciary obligations and the factors they should assess in considering the renewal of the Sub-Advisory Agreement, due diligence materials prepared by the Sub-Adviser (including the due diligence response completed by the Sub-Adviser with respect to a specific request letter from outside legal counsel to the Trust and the Independent Trustees, the Sub-Adviser’s Form ADV, select ownership, organizational, financial and insurance information for the Sub-Adviser, biographical information of key management and compliance personnel, and the Sub-Adviser’s compliance manual and code of ethics) and other pertinent information. Based on their evaluation of the information provided, the Trustees, by a unanimous vote (including a separate vote of the Independent Trustees), approved the renewal of the Sub-Advisory Agreement for an additional one-year term.
Discussion of Factors Considered
In considering the renewal of the Sub-Advisory Agreement and reaching their conclusions, the Trustees reviewed and analyzed various factors that they determined were relevant, including the factors enumerated below.
| | 1. | Nature, Extent and Quality of Services Provided. The Board considered the nature, extent and quality of ShariaPortfolio’s overall services provided to the Funds, as well as its specific responsibilities in aspects of day-to-day investment management of the Funds. The Board considered the qualifications, experience and responsibilities of Naushad Virji, who serves as a portfolio manager for each Fund, as well as the responsibilities of other key personnel of ShariaPortfolio involved in the day-to-day activities of the Funds. The Board reviewed the due diligence information provided by ShariaPortfolio, including information regarding ShariaPortfolio’s compliance program, its compliance personnel (and engagement with a third-party compliance consultant) and compliance record, as well as ShariaPortfolio’s cybersecurity program and business continuity plan, and its engagement with an independent third-party Sharia advisor. The Board noted that ShariaPortfolio does not manage any other accounts that utilize a strategy similar to that employed by each Fund. |
The Board also considered other services provided to the Funds by ShariaPortfolio. The Board noted that ShariaPortfolio is responsible for ensuring Sharia compliance on behalf of each Fund, subject to oversight by the Adviser, and that ShariaPortfolio monitors the extent to which each Fund meets its investment objective as a passively-managed ETF.
The Board concluded that ShariaPortfolio had sufficient quality and depth of personnel, resources, investment methods and compliance policies and procedures essential to performing its duties under the Sub-Advisory Agreement and managing the Funds and that the nature, overall quality and extent of the management services provided to the Funds, as well as ShariaPortfolio’s compliance program, were satisfactory.
| | 2. | Investment Performance of the Funds and the Sub-Adviser. In considering Fund performance, the Board noted ShariaPortfolio’s limited role of ensuring Sharia compliance in the management of each Fund, and therefore concluded that performance of the Funds was not a relevant factor for consideration. The Board also noted that each Fund was designed to track the performance of an index and that the performance for each Fund was not a direct result of investment decisions made by the Adviser or ShariaPortfolio. |
| | 3. | Cost of Services Provided and Profits Realized by the Sub-Adviser. The Board considered the structure of the sub-advisory fees paid by the Adviser to ShariaPortfolio under the Sub-Advisory Agreement. The Board noted that the Adviser represented to the Board that the sub- advisory fees payable under the Sub-Advisory Agreement were reasonable in light of the services performed by ShariaPortfolio. Since the sub-advisory fees are paid by the Adviser, the overall advisory fees paid by each of the Funds are not directly affected by the sub-advisory fees paid to ShariaPortfolio. Consequently, the Board did not consider the cost of services provided by ShariaPortfolio or profitability from its relationship with the Funds to be material factors for consideration given that ShariaPortfolio is not affiliated with the Adviser and, therefore, the sub-advisory fees paid to ShariaPortfolio were negotiated on an arm’s-length basis. Based on all of these factors, the Board concluded that the sub-advisory fees paid to ShariaPortfolio by the Adviser reflected appropriate allocations of the advisory fees and were reasonable in light of the services provided by ShariaPortfolio. |
| | | |
| | 4. | Extent of Economies of Scale as the Funds Grow. Since the sub-advisory fees payable to ShariaPortfolio are not paid by each Fund, the Board did not consider whether the sub-advisory fees should reflect any realized or potential economies of scale that might be realized as the Fund’s assets increase. |
| | 5. | Benefits Derived from the Relationship with the Funds. The Board considered the direct and indirect benefits that could be received by ShariaPortfolio from its association with the Funds. The Board concluded that the benefits ShariaPortfolio may receive, such as greater name recognition or the ability to attract additional investor assets, appear to be reasonable and in many cases may benefit the Funds. |
Conclusion. Based on the Board’s deliberations and its evaluation of the information described above, with no single factor determinative of a conclusion, the Board, including the Independent Trustees, unanimously concluded that: (a) the terms of the Sub-Advisory Agreement are fair and reasonable; (b) the sub-advisory fees are reasonable in light of the services that ShariaPortfolio provides to each Fund; and (c) the approval of the renewal of the Sub-Advisory Agreement for an additional one-year term was in the best interests of each Fund and its shareholders.
Item 12. Disclosure of Proxy Voting Policies and Procedures for Closed-End Management Investment Companies.
Not applicable to open-end investment companies.
Item 13. Portfolio Managers of Closed-End Management Investment Companies.
Not applicable to open-end investment companies.
Item 14. Purchases of Equity Securities by Closed-End Management Investment Company and Affiliated Purchasers.
Not applicable to open-end investment companies.
Item 15. Submission of Matters to a Vote of Security Holders.
Not Applicable.
Item 16. Controls and Procedures.
| (a) | The Registrant’s President/Principal Executive Officer and Treasurer/Principal Financial Officer have reviewed the Registrant’s disclosure controls and procedures (as defined in Rule 30a-3(c) under the Investment Company Act of 1940 (the “Act”)) as of a date within 90 days of the filing of this report, as required by Rule 30a-3(b) under the Act and Rules 13a-15(b) or 15d-15(b) under the Securities Exchange Act of 1934. Based on their review, such officers have concluded that the disclosure controls and procedures are effective in ensuring that information required to be disclosed in this report is appropriately recorded, processed, summarized and reported and made known to them by others within the Registrant and by the Registrant’s service provider. |
| (b) | There were no changes in the Registrant’s internal control over financial reporting (as defined in Rule 30a-3(d) under the Act) that occurred during the period covered by this report that have materially affected, or are reasonably likely to materially affect, the Registrant’s internal control over financial reporting. |
Item 17. Disclosure of Securities Lending Activities for Closed-End Management Investment Companies
Not applicable to open-end investment companies.
Item 18. Recovery of Erroneously Awarded Compensation.
(a) Not Applicable
(b) Not Applicable
Item 19. Exhibits.
(2) Any policy required by the listing standards adopted pursuant to Rule 10D-1 under the Exchange Act (17 CFR 240.10D-1) by the registered national securities exchange or registered national securities association upon which the registrant’s securities are listed. Filed herewith.
(3) A separate certification for each principal executive officer and principal financial officer pursuant to Section 302 of the Sarbanes-Oxley Act of 2002. Filed herewith.
(4) Any written solicitation to purchase securities under Rule 23c-1 under the Act sent or given during the period covered by the report by or on behalf of the registrant to 10 or more persons. Not applicable.
(5) Change in the registrant’s independent public accountant. Provide the information called for by Item 4 of Form 8-K under the Exchange Act (17 CFR 249.308). Unless otherwise specified by Item 4, or related to and necessary for a complete understanding of information not previously disclosed, the information should relate to events occurring during the reporting period. Not applicable.
SIGNATURES
Pursuant to the requirements of the Securities Exchange Act of 1934 and the Investment Company Act of 1940, the registrant has duly caused this report to be signed on its behalf by the undersigned, thereunto duly authorized.
| (Registrant) | Tidal ETF Trust | |
| By (Signature and Title)* | /s/ Eric W. Falkeis | |
| | Eric W. Falkeis, President/Principal Executive Officer | |
Pursuant to the requirements of the Securities Exchange Act of 1934 and the Investment Company Act of 1940, this report has been signed below by the following persons on behalf of the registrant and in the capacities and on the dates indicated.
| By (Signature and Title)* | /s/ Eric W. Falkeis | |
| | Eric W. Falkeis, President/Principal Executive Officer | |
| By (Signature and Title)* | /s/ Aaron J. Perkovich | |
| | Aaron J. Perkovich, Treasurer/Principal Financial Officer | |
* Print the name and title of each signing officer under his or her signature.