Table of Contents
Confidential Treatment Requested Pursuant to 17 C.F.R. Section 200.83
As confidentially submitted to the Securities and Exchange Commission on July 18, 2018
This revised draft registration statement has not been publicly filed with the Securities and Exchange Commission
and all information herein remains strictly confidential.
Registration No. 333-
UNITED STATES
SECURITIES AND EXCHANGE COMMISSION
Washington, D.C. 20549
Form S-1
REGISTRATION STATEMENT
UNDER
THE SECURITIES ACT OF 1933
Zekelman Industries, Inc.
(Exact name of registrant as specified in its charter)
| Delaware | 3317 | 20-4467287 | ||
(State or other jurisdiction of incorporation or organization) | (Primary Standard Industrial Classification Code Number) | (I.R.S. Employer Identification Number) |
Michael P. McNamara
Executive Vice President and General Counsel
Zekelman Industries, Inc.
227 West Monroe Street, Suite 2600
Chicago, Illinois 60606
(312)275-1600
(Name, Address, including Zip Code, and Telephone Number, including Area Code, of Agent for Service)
Copies to:
John M. Gherlein John J. Harrington Baker & Hostetler LLP 127 Public Square, Suite 2000 Cleveland, Ohio 44114-1214 (216)621-0200 | Patrick H. Shannon Latham & Watkins LLP 555 Eleventh Street, NW, Suite 1000 Washington, D.C. 20004-1304 (202)637-2200 |
Approximate date of commencement of proposed sale to the public:
As soon as practicable after the effective date hereof.
If any of the securities being registered on this Form are to be offered on a delayed or continuous basis pursuant to Rule 415 under the Securities Act of 1933, check the following box. ☐
If this Form is filed to register additional securities for an offering pursuant to Rule 462(b) under the Securities Act, check the following box and list the Securities Act registration statement number of the earlier effective registration statement for the same offering. ☐
If this Form is a post-effective amendment filed pursuant to Rule 462(c) under the Securities Act, check the following box and list the Securities Act registration number of the earlier effective registration statement for the same offering. ☐
If this Form is a post-effective amendment filed pursuant to Rule 462(d) under the Securities Act, check the following box and list the Securities Act registration number of the earlier effective registration statement for the same offering. ☐
Indicate by check mark whether the registrant is a large accelerated filer, an accelerated filer, anon-accelerated filer, smaller reporting company, or an emerging growth company. See the definitions of “large accelerated filer,” “accelerated filer,” “smaller reporting company,” and “emerging growth company” inRule 12b-2 of the Exchange Act. (Check one):
| Large accelerated filer | ☐ | Accelerated filer | ☐ | |||
| Non-accelerated filer | ☒ (Do not check if a smaller reporting company) | Smaller reporting company | ☐ | |||
| Emerging growth company | ☐ | |||||
If an emerging growth company, indicate by check mark if the registrant has elected not to use the extended transition period with any new or revised accounting standards provided pursuant to Section 7(a)(2)(B) of the Securities Act. ☐
Table of Contents
Confidential Treatment Requested Pursuant to 17 C.F.R. Section 200.83
CALCULATION OF REGISTRATION FEE
| ||||
Title of Each Class of Securities to Be Registered | Proposed Maximum Aggregate Offering Price(1)(2) | Amount of Registration Fee | ||
Class A Subordinate Voting Stock, $0.01 par value per share | $ | $ | ||
| ||||
| ||||
| (1) | Includes offering price of shares that the underwriters have the option to purchase. |
| (2) | Estimated solely for the purpose of calculating the amount of the registration fee pursuant to Rule 457(o) under the Securities Act of 1933, as amended. |
The registrant hereby amends this registration statement on such date or dates as may be necessary to delay its effective date until the registrant shall file a further amendment which specifically states that this registration statement shall thereafter become effective in accordance with Section 8(a) of the Securities Act of 1933, as amended, or until this registration statement shall become effective on such date as the Commission, acting pursuant to said Section 8(a), may determine.
Table of Contents
Confidential Treatment Requested Pursuant to 17 C.F.R. Section 200.83
The information in this preliminary prospectus is not complete and may be changed. These securities may not be sold until the registration statement filed with the Securities and Exchange Commission is effective. This preliminary prospectus is not an offer to sell nor does it seek an offer to buy these securities in any jurisdiction where the offer or sale is not permitted.
Subject To Completion. Dated , 2018.
| Shares |

Zekelman Industries, Inc.
Class A Subordinate Voting Stock
This is an initial public offering of shares of the Class A subordinate voting stock of Zekelman Industries, Inc.
Zekelman Industries, Inc. is offering to sell shares of Class A subordinate voting stock in this offering. The selling stockholders identified in this prospectus are offering to sell an additional shares of Class A subordinate voting stock. We will not receive any of the proceeds from the sale of the shares being sold by the selling stockholders.
In addition to shares of Class A subordinate voting stock, we will have shares of Class B multiple voting stock outstanding following this offering. Shares of our Class A subordinate voting stock and Class B multiple voting stock are identical, except with respect to voting and conversion. Each share of Class A subordinate voting stock is entitled to one vote per share, and each share of Class B multiple voting stock is entitled to ten votes per share and is convertible into one share of Class A subordinate voting stock in the circumstances described in this prospectus. In addition, we will have a class of Special Voting Shares that will be issued to the holders of Exchangeable Shares in one of our subsidiaries, and the number of Special Voting Shares issued and outstanding in our capital stock at any given time will always correspond on aone-for-one basis with the number of Exchangeable Shares issued and outstanding in such subsidiary. Together, the Special Voting Shares and the Exchangeable Shares are intended to be the voting and economic equivalent of shares of Class B multiple voting stock. See “Description of Capital Stock—Special Voting Shares and Exchangeable Shares.”
Following this offering, the outstanding shares of Class B multiple voting stock and Special Voting Shares will represent approximately % of the voting power of our outstanding capital stock and will be beneficially owned by members of the Zekelman family. As a result, we will be a “controlled company” within the meaning of the corporate governance rules of the .
Prior to this offering, there has been no public market for the Class A subordinate voting stock. It is currently estimated that the initial public offering price per share will be between $ and $ . We intend to apply to list the Class A subordinate voting stock on the under the symbol “ ” and on the Toronto Stock Exchange under the symbol “ ”. Listing will be subject to us fulfilling all the original listing requirements of and the Toronto Stock Exchange. Neither the nor the Toronto Stock Exchange has conditionally approved our listing application and there is no assurance that either or both of the or the Toronto Stock Exchange will approve our listing application.
See “Risk Factors” beginning on page 27 to read about factors you should consider before buying shares of our Class A subordinate voting stock.
Neither the Securities and Exchange Commission nor any other regulatory body has approved or disapproved of these securities or passed upon the accuracy or adequacy of this prospectus. Any representation to the contrary is a criminal offense.
| Per share | Total | |||||||
Initial public offering price | $ | $ | ||||||
Underwriting discounts(1) | $ | $ | ||||||
Proceeds, before expenses, to Zekelman Industries, Inc. | $ | $ | ||||||
Proceeds, before expenses, to Selling Stockholders | $ | $ | ||||||
| (1) | See the section titled “Underwriting” for a description of the compensation payable to the underwriters. |
To the extent that the underwriters sell more than shares of Class A subordinate voting stock, the underwriters have the option to purchase up to an additional shares from us and the selling stockholders at the initial public offering price less the underwriting discount.
The underwriters expect to deliver the shares against payment in New York, New York, on or about , 2018.
| Goldman Sachs & Co. LLC | BofA Merrill Lynch | |||
| BMO Capital Markets | Credit Suisse | |||
| GMP Securities | KeyBanc Capital Markets | PNC Capital Markets LLC | ||
| Stifel | BTIG | William Blair |
Prospectus dated , 2018.
Table of Contents
Confidential Treatment Requested Pursuant to 17 C.F.R. Section 200.83
Prospectus
| 1 | ||||
| 27 | ||||
| 49 | ||||
| 51 | ||||
| 52 | ||||
| 53 | ||||
| 55 | ||||
| 57 | ||||
Management’s Discussion and Analysis of Financial Condition and Results of Operations | 61 | |||
| 87 | ||||
| 107 | ||||
| 114 | ||||
| 125 | ||||
| 128 | ||||
| 130 | ||||
| 139 | ||||
| 141 | ||||
| 146 | ||||
| 152 | ||||
| 152 | ||||
| 152 | ||||
| F-1 |
Through and including , 2018 (the 25th day after the date of this prospectus), all dealers effecting transactions in these securities, whether or not participating in this offering, may be required to deliver a prospectus. This is in addition to a dealer’s obligation to deliver a prospectus when acting as an underwriter and with respect to an unsold allotment or subscription.
Neither we, the selling stockholders, nor any of the underwriters have authorized anyone to provide any information or to make any representations other than those contained in this prospectus or in any free writing prospectuses we have prepared. Neither we, the selling stockholders, nor any of the underwriters take responsibility for, and can provide no assurance as to the reliability of, any other information that others may give you. This prospectus is an offer to sell only the shares offered hereby, but only under circumstances and in jurisdictions where it is lawful to do so. The information contained in this prospectus is current only as of its date, regardless of the time of delivery of this prospectus or of any sale of our Class A subordinate voting stock.
For investors outside the United States: Neither we, the selling stockholders, nor any of the underwriters have done anything that would permit our initial public offering or possession or distribution of this prospectus in any jurisdiction where action for that purpose is required, other than in the United States and Canada. Persons outside the United States or Canada who come into possession of this prospectus must inform themselves about, and observe any restrictions relating to, the offering of the shares of our Class A subordinate voting stock and the distribution of this prospectus outside the United States or Canada.
| i |
Table of Contents
Confidential Treatment Requested Pursuant to 17 C.F.R. Section 200.83
Market and Industry Data
This prospectus contains estimates and information concerning our industry and market position that are based on industry publications and reports, management’s knowledge and experience in the markets in which our business operates, internal research and information obtained from customers, suppliers, trade and business organizations. This information involves a number of assumptions and limitations, and you are cautioned not to give undue weight to these estimates. We have not independently verified the accuracy or completeness of the data contained in industry publications and reports. The markets in which we operate are subject to a high degree of uncertainty and risk due to a variety of factors, including those described in the section titled “Risk Factors.” These and other factors could cause results to differ materially from those expressed in these publications and reports.
With respect to our estimates of United States and Canada market share as a producer of specified product categories, we note the following:
| • | standard pipe production share estimates include standard, fence and sprinkler pipe products to conform to the methodology of certain industry sources, but exclude galvanized continuous welded (“CW”) pipe sold for value-added processing and distribution into electrical conduit end markets; and |
| • | electrical conduit production share estimates include the aforementioned galvanized CW pipe. |
References to industrial steel pipe and tube products exclude seamless pipe and tube products and oil country tubular goods (“OCTG”).
Corporate Information, Trademarks and Tradenames
This prospectus contains registered and unregistered trademarks and service marks of Zekelman Industries, Inc. and its affiliates, as well as trademarks and service marks of third parties. Solely for convenience, these trademarks and service marks are referenced without the®,™ or similar symbols, but such references are not intended to indicate, in any way, that we or our affiliates will not assert, to the fullest extent under applicable law, our or their rights to these trademarks and service marks. All brand names, trademarks and service marks appearing in this prospectus are the property of their respective holders.
Basis of Presentation
In this prospectus, unless we indicate otherwise or the context requires, “we,” “us,” “our,” “Zekelman Industries” and the “Company” refer to Zekelman Industries, Inc. and its consolidated subsidiaries.
Our fiscal year is a 52 or 53 week period ending on the last Saturday in September. Our fiscal year 2017 ended September 30, 2017 and consisted of 53 weeks. Our fiscal year 2016 ended September 24, 2016 and consisted of 52 weeks. Our fiscal year 2015 ended September 26, 2015 and consisted of 52 weeks. References in this prospectus to each of these fiscal years refer to the applicable 53 week or 52 week period. Unless otherwise noted, references to a year refer to a calendar year.
References herein to the “LTM Period” refer to the 53 weeks ended March 31, 2018. See “Prospectus Summary—Summary Consolidated Financial and Other Data.”
Numerical figures included in this prospectus have been subject to rounding adjustments. Accordingly, numerical figures shown as totals in various tables may not be arithmetic aggregations of the figures that precede them.
| ii |
Table of Contents
Confidential Treatment Requested Pursuant to 17 C.F.R. Section 200.83
Non-GAAP Financial Measures
In this prospectus, we present EBITDA and Adjusted EBITDA, as well as other operating measures derived from Adjusted EBITDA. These are supplemental measures that are not required by, or presented in accordance with, accounting principles generally accepted in the United States (“GAAP”). They are not measurements of our financial performance under GAAP and should not be considered as alternatives to operating income, income from continuing operations, net income (loss) or any other performance measure derived in accordance with GAAP or as an alternative to cash flows provided by operating activities as a measure of our liquidity.
We define EBITDA as income from continuing operations plus net interest expense, provision (benefit) for income taxes, depreciation and amortization of intangibles. We define Adjusted EBITDA as EBITDA adjusted for certain items that arenon-recurring,non-cash and/ortransaction-related expenses or that otherwise may vary from period to period in a way that we believe may not correlate with or be indicative of core operating performance in a particular period. See “Prospectus Summary—Summary Consolidated Financial and OtherData—Non-GAAP Reconciliation” for more information regarding the items for which we have made adjustments.
In general, we believe EBITDA and Adjusted EBITDA are useful indicators of our operating performance for the following reasons:
| • | EBITDA and Adjusted EBITDA are widely used by investors to measure a company’s operating performance without regard to items, such as interest expense, provision for income taxes and depreciation and amortization, that can vary substantially from company to company depending upon their financing and accounting methods, the book value of their assets, their capital structures and the method by which their assets were acquired; |
| • | Securities analysts and ratings agencies may also use EBITDA and Adjusted EBITDA as supplemental measures to evaluate the performance of our business; and |
| • | Our management uses Adjusted EBITDA for certain planning and budgeting purposes, for assessing compliance with covenants in our debt agreements (although the calculations under our debt agreements may differ from those presented herein), and for determining a portion of the compensation of our executive officers. |
EBITDA and Adjusted EBITDA, however, do not represent and should not be considered alternatives to operating income, income from continuing operations, net income (loss), cash provided by operating activities or any other measure of financial performance calculated and presented in accordance with GAAP. Our Adjusted EBITDA may not be comparable to similar measures reported by other companies because other companies may not calculate Adjusted EBITDA in the same manner as we do. Although we use Adjusted EBITDA for the purposes described above, it has significant limitations as an analytical tool because it excludes certain material costs. For example, it does not include net interest expense, which has been a necessary element of our costs. Because we use capital assets, depreciation expense is a necessary element of our costs and our ability to generate revenue. In addition, the omission of amortization expense associated with ourfinite-lived intangible assets further limits its usefulness. Adjusted EBITDA also does not include the expense recognition of certain income taxes, which is a necessary element of our operations. Because Adjusted EBITDA does not account for certain expenses, management does not view it in isolation or as a primary performance measure. Rather, it is viewed together with GAAP measures, such as operating income, income from continuing operations, net income (loss) and net sales, to measure operating performance.
| iii |
Table of Contents
Confidential Treatment Requested Pursuant to 17 C.F.R. Section 200.83
This summary highlights selected information that is presented in greater detail elsewhere in this prospectus. This summary does not contain all of the information you should consider before deciding to invest in our Class A subordinate voting stock. You should read this entire prospectus carefully, including “Risk Factors” and “Management’s Discussion and Analysis of Financial Condition and Results of Operations” and our consolidated financial statements and the related notes included elsewhere in this prospectus, before making an investment decision.
Company Overview
We are a leading North American manufacturer of industrial steel pipe and tube products with over 100 years of operating experience. We believe we are the largest producer by volume of Hollow Structural Sections (“HSS” or “structural tubing”) and electrical conduit products in the United States and Canada on a combined basis, and the largest producer by volume of standard pipe products in the United States. We are headquartered in Chicago, Illinois and have 13 pipe and tube production facilities in seven U.S. states and one Canadian province, with total production of approximately 2.1 million tons from our continuing operations for the LTM Period. We offer a broad array of products marketed under the Atlas, Wheatland, Sharon Tube, Western Tube & Conduit and Picoma brands. For the LTM Period, we sold over 9,800 distinct pipe and tube products to approximately 2,000 customers. We manufacture our products using a variety of raw materials, the most significant of which is Hot Rolled Coil (“HRC”). We believe we are the largest consumer of HRC by volume in the United States and Canada.
The majority of our products are used in infrastructure andnon-residential construction applications. We also supply products for use in the fabrication, automotive, oil and gas, agricultural and industrial equipment and retail end markets. We manufacture many of our products to operate under specialized conditions, including inload-bearing,high-pressure, corrosive andhigh-temperature environments.
We generate revenue primarily in the United States, which accounted for approximately 86% of our net sales from continuing operations for the LTM Period, with the remainder generated primarily in Canada. For the LTM Period, we generated $2.4 billion of net sales from continuing operations, $197.0 million of income from continuing operations and $408.5 million of Adjusted EBITDA.
Since 2006, we have completed six strategic acquisitions, including most recently the acquisitions of Western Tube & Conduit Corporation (“Western Tube”) and the operating assets and certain liabilities of American Tube Manufacturing, Inc. (“American Tube”) in February 2017. Our acquisitions have enabled us to scale our business by offering a more comprehensive range of industrial steel pipe and tube products and broadened our geographic footprint. Following each acquisition, we have successfully integrated acquired product lines, rationalized manufacturing facilities, reduced costs and improved quality control, as well as reduced working capital by applyingjust-in-time inventory management and leveraging our skilled manufacturing and supply chain management processes across the acquired facilities. These six acquisitions also substantially increased our manufacturing scale and consolidated our raw material consumption, which has allowed us to obtain more favorable terms with suppliers.
We intend to continue to expand our leading market positions and scale through a variety of growth initiatives, and to respond to and capitalize on strong demand for our products. We have identified a number of projects to both optimize existing production capacity by increasing utilization across our portfolio of manufacturing facilities, and build new capacity at our existing locations. We also believe that our industry leading scale and advantaged geographic footprint, together with our sophisticated logistics and information sharing systems and manufacturing facilities’ production
| 1 |
Table of Contents
Confidential Treatment Requested Pursuant to 17 C.F.R. Section 200.83
flexibility, uniquely position us to optimize our capacity by rapidly responding to improving market conditions. In addition to these organic growth initiatives, we maintain and monitor a pipeline of potential acquisition targets.
Our Product Offerings
We offer a comprehensive range of products to provide the benefits of a“one-stop shop” to approximately 2,000 steel pipe and tube customers. We manufacture products withvalue-added features, such as galvanizing, color coating, bending, threading and coupling. We also provide customized product solutions and we believe we are the only North American manufacturer of certain products such as CW pipe products and14”-16” square and rectangular-shaped structural tubing. We believe that our broad product offerings differentiate us and benefit our customers by allowing them to consolidate their purchases across product lines, manage inventory more efficiently and reduce lead times.
We have three reportable segments: Atlas (structural tubing), Electrical, Fence and Mechanical or “EFM” (electrical conduit, fittings and couplings, fence pipe and mechanical tubing), and Pipe (standard pipe and fire sprinkler pipe). In addition to these three reportable segments, our consolidated financial results include an “All Other” category which includes our drawn over mandrel (“DOM”) tubing and energy tubular product lines and other non-core activities that are not material enough to require separate disclosure, as well as unallocated corporate costs.
We sell structural tubing under the Atlas brand. We sell electrical conduit, fence pipe and mechanical tubing under the Wheatland and Western Tube & Conduit brands, and fittings and couplings under the Picoma and Wheatland brands. We sell standard pipe, fire sprinkler pipe and energy tubulars under the Wheatland brand. We sell DOM tubing under the Sharon Tube brand.
| 2 |
Table of Contents
Confidential Treatment Requested Pursuant to 17 C.F.R. Section 200.83
Reportable Segment | Brand(s) | Percent of net sales from continuing operations (LTM Period) | Selected Key | Application / Uses | ||||
| Atlas | Atlas | 48% | • Structural tubing/HSS | • Broad range of construction and architectural applications, including pilings
• Structural component for vehicles
• Agricultural and industrial equipment
• Highway guardrails, signage and other structures | ||||
|
|
|
|
| ||||
| EFM | Wheatland / Western Tube & Conduit, Picoma | 27% | • Electrical conduit | • To encase electrical wires in residential, commercial and industrial construction applications | ||||
• Fittings and couplings | • Connectors for electrical conduit products | |||||||
• Fence pipe | • Residential, industrial, commercial, military and high security applications to support the wire body of a fence | |||||||
• Mechanical tubing | • Construction and assembly of a wide range of applications such as playground equipment, solar panel support systems and greenhouse framing | |||||||
|
|
|
|
| ||||
| Pipe | Wheatland | 15% | • Standard pipe | • Primarily plumbing and heating applications for thelow-pressure conveyance of water, gas, air, steam and other fluids | ||||
• Fire sprinkler pipe | • Fire suppression purposes to transport water to sprinkler heads innon-residential construction sprinkler systems | |||||||
|
|
|
|
| ||||
| All Other | Sharon Tube, Wheatland | 10% | • DOM tubing | • Primarily for fluid power applications such as hydraulic cylinders and hydraulic lines and for certain automotive components | ||||
• Energy tubulars | • Primarily used in the oil and gas industry as key components of drilling, exploration and production processes of oil and natural gas and for the transportation of these resources over both short and long distances | |||||||
• Othernon-core | ||||||||
| 3 |
Table of Contents
Confidential Treatment Requested Pursuant to 17 C.F.R. Section 200.83
Illustrative Uses of Our Products

Our Steel Pipe and Tube Manufacturing Facilities and Processes
We operate 13 pipe and tube manufacturing facilities, of which 12 are owned and one is leased. One of these facilities, located in Sharon, Pennsylvania, is currently idled, and may be restarted if market conditions are supportive. Our manufacturing facilities are located in the United States in the Midwest / Great Lakes region, the Southeast, and in California, as well as in Ontario, Canada. The facilities are strategically located in close proximity to our primary steel suppliers and to our customers, which minimizes potential disruption to deliveries of raw materials and allows us to optimize freight costs, lower our inventory levels and reduce lead times for our customers. We believe we employ some of the most advanced technical capabilities in the steel pipe and tube industry, including modern,high-speed, quick change pipe and tube mills.
| 4 |
Table of Contents
Confidential Treatment Requested Pursuant to 17 C.F.R. Section 200.83
Steel Pipe and Tube Production Capabilities(1)
Location | LTM Production (kt) | Production Capacity (kt) | Atlas | EFM | Pipe | Other | ||||||||||||||||||
Harrow, ON | 484 | 662 | ✓ | ✓ | ||||||||||||||||||||
Chicago, IL (HSS) | 424 | 494 | ✓ | |||||||||||||||||||||
Blytheville, AR | 48 | 328 | ✓ | ✓ | ||||||||||||||||||||
Plymouth, MI | 172 | 169 | ✓ | |||||||||||||||||||||
Birmingham, AL | 96 | 100 | ✓ | |||||||||||||||||||||
Wheatland, PA (Council Avenue) | 234 | 255 | ✓ | ✓ | ||||||||||||||||||||
Chicago, IL (Pipe) | 197 | 250 | ✓ | ✓ | ✓ | |||||||||||||||||||
Warren, OH | 219 | 230 | ✓ | ✓ | ✓ | |||||||||||||||||||
Long Beach, CA | 101 | 150 | ✓ | ✓ | ||||||||||||||||||||
Wheatland, PA (Church Street) / Niles, OH | 66 | 120 | ✓ | ✓ | ✓ | |||||||||||||||||||
Cambridge, OH | 16 | 17 | ✓ | |||||||||||||||||||||
Sharon, PA (idled) (Mill Street) | — | 75 | ✓ | ✓ | ||||||||||||||||||||
|
|
|
| |||||||||||||||||||||
Total: | 2,057 | 2,850 | ||||||||||||||||||||||
|
|
|
| |||||||||||||||||||||
| (1) | Continuing operations only. |
Our Production Footprint
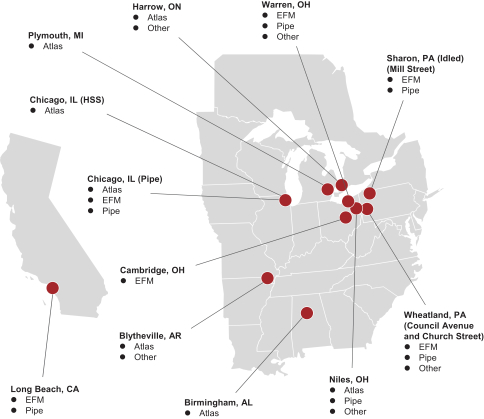
Note: Excludes facilities in Thomasville, Alabama and Welland, Ontario that are currently idled and held for sale. Also excludes Winnipeg, Manitoba warehouse andZ-Modular facilities.
| 5 |
Table of Contents
Confidential Treatment Requested Pursuant to 17 C.F.R. Section 200.83
We employ twopipe-milling technologies—electric resistance weld (“ERW”) and CW:
| • | Electric Resistance Weld. ERW pipe iscold-formed fromflat-rolled strip steel and electrically welded into a tubular shape. Approximately 88% of our continuing operations volume is produced using the ERW process. |
| • | Continuous Weld. CW pipe is formed fromflat-rolled strip steel that has been heated in a naturalgas-powered furnace operating at temperatures of up to 2,500 degrees Fahrenheit and welded into a tubular shape with a blast of oxygen. This process creates products that are optimal for bending and threading. |
In addition topipe-milling, we employ a broad array of finishing techniques, including DOM,in-line galvanizing,hot-dip galvanizing, heat treating, threading, roll grooving, coupling and color coating.
Our Customers
Our main customers include metal service centers, plumbing distributors, pipe, valve and fitting distributors, electrical wholesalers, retail home improvement centers, large scale construction fabricators, piling contractors, original equipment manufacturers (“OEMs”), rack fabricators, fire sprinkler fabricators, fence supply houses and oil and gas end users as well as distributors.
We have had relationships with many of our customers for more than 20 years. We sell to a broad customer base and are not dependent on any single customer, with our largest customer representing approximately 9% of our total tons sold and 7% of our total net sales from continuing operations for the LTM Period. Our top ten customers represented approximately 31% of our total tons sold and 26% of our total net sales from continuing operations for the LTM Period.
We have developed a proprietary vendor managed inventory program called Automated Inventory Management (“AIM”) for use by our larger metal service center structural tubing customers. This program provides customers with an optimized inventory management solution by giving us direct access to distributor sales and stock levels. Customer use of the AIM program is high for our structural tubing business, and we are in the process of rolling this program out to customers of our other product lines as well. We believe our AIM program is an important source of competitive advantage and commercial differentiation, as well as a means of enhancing order flow regularity.
Our Suppliers and Raw Material Input
Our primary raw material input is HRC and we believe we are the largest consumer of HRC by volume in the United States and Canada. We purchase our HRC from a variety of sources and consolidate purchases among our top suppliers to improve cost and delivery terms. For the LTM Period, we purchased 71% of our HRC from domestic producers and the remainder from foreign supply sources, primarily Canadian suppliers. We maintain flexibility to purchase raw materials from a variety of sources based on price, availability and end-user specifications. For example, we maintain active relationships with other suppliers to ensure alternative sources of supply. We have also developed supply programs with certain of our key suppliers that we believe provide us with reduced lead times for steel purchases relative to our competitors. For several years we have also purchased a significant portion of our raw materials from suppliers that are able to certify that their product is “made and melted” in the United States in order to satisfy the requirements of certain end users. We believe our scale is a key competitive advantage, as we are able to leverage our purchasing volume and market insights to obtain more favorable terms from our suppliers and drive procurement savings.
| 6 |
Table of Contents
Confidential Treatment Requested Pursuant to 17 C.F.R. Section 200.83
Our Industry and Competition
We operate in the industrial steel pipe and tube products industry, which historically has been a highly fragmented industry. Our competitors include Allied Tube & Conduit (Atkore International), Independence Tube (Nucor Corp.), Southland Tube (Nucor Corp.), Republic Conduit (Nucor Corp.), TMK IPSCO (OAO TMK), Bull Moose Tube, EXL Tube, Maruichi Leavitt Pipe & Tube and many smaller, primarily local family-owned manufacturers. We compete primarily on the basis of price, quality, delivery terms and customer service. In recent years, we and certain of our competitors have been active in acquiring smaller industrial steel pipe and tube products companies within our industry.
The largest drivers of domestic consumption for steel pipe and tube products are thenon-residential construction, infrastructure, OCTG and general industrial markets. Recent improvements in demand for our products suggest that key end markets are continuing to strengthen, withnon-residential construction spend estimated to continue to increase over the next few years as shown in the graph below (left). Additionally, the Architecture Billings Index, a measure of non-residential construction activity, has reflected increased architectural billings for 20 of the past 24 months, as of March 31, 2018, as shown in the graph below (right).
| TotalNon-Residential Put in Place Est. for the United States ($ in billions)(1) | Architecture Billings Index(2) | |
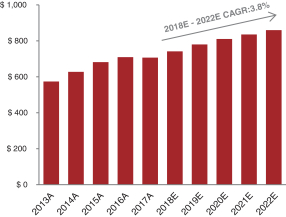 | 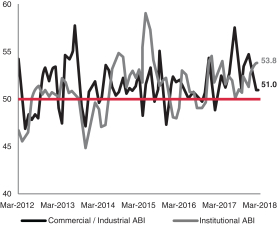 | |
| Source: United States Census and FMI Forecasts as of Q1 2018 | Source: The American Institute of Architects |
| (1) | Includes Construction Put in Place forNon-Residential Buildings andNon-Building Structures. |
| (2) | Values in excess of 50 indicate reported increase in architecture billing activity by survey participants. |
Foreign Competition
Historically, foreign competition has been most significant in the standard pipe and energy tubular markets, with foreign production excluding Canada estimated to represent 47% and 53%, respectively, of volumes of tons sold in the United States for the LTM Period. Because many of our customers’ product applications require domestically manufactured pipe and tube components, and since imported products and our product portfolio in particular, must be shipped long distances via ocean freight at a high cost and at risk of product damage, we believe domestically produced standard pipe and energy tubular products will remain competitive with imported products, independent of certain trade case actions described in greater detail below. More specifically, while we face competition from foreign manufacturers, we believe that recent developments, particularly the implementation of trade sanctions
| 7 |
Table of Contents
Confidential Treatment Requested Pursuant to 17 C.F.R. Section 200.83
against unfairly traded steel in connection with Section 232 of the Trade Expansion Act of 1962 (“Section 232”), meaningfully enhance our competitive positioning relative to foreign sources of supply. We believe that the implementation of trade relief in connection with Section 232 (and trade deals negotiated in connection therewith) will cause foreign production to account for a lesser share of total volumes sold in the United States for the foreseeable future.
Independent of the implementation of trade sanctions in connection with Section 232, our competitive position relative to imports historically has benefited from the implementation and enforcement of trade cases related specifically to our products, in particular our standard pipe products. For example, over the past several years, there have been trade actions taken by the United States Department and Commerce (“DOC”) and the United States International Trade Commission (“ITC”) with respect to imports that compete with our standard pipe products. In 2012, the ITC implemented duties on CW pipe from eight countries, and in early 2018 the ITC extended these duties for another five years, issuing preliminary margins ranging from approximately 9% to 38%. In addition, in early 2018, the DOC announced the preliminary results of antidumping duty orders on imports of line pipe from South Korea. The preliminary duty rates range from approximately 2% to 19%. Final duty determinations are expected to be implemented by the end of calendar year 2018. If final duty determinations are made by the DOC and the ITC, duties will be in effect for five years, subject to extension for another five years.
Our structural tubing and electrical conduit markets face less competition from imports.For our structural tubing businesswe believe our quick rolling cycles, high levels of product availability and custom product qualities enhance our competitive position relative to foreign sources of supply. We estimate that foreign-produced structural tubing products accounted for approximately 7% of the volume of such products sold in the United States and Canada for the LTM Period. For our electrical conduit business we believe imports are limited due primarily to the light wall dimensions of electrical conduit, which leaves the product particularly susceptible to ocean freight damage. In general, our business systems, AIM, and our full offering of product lines allow us to compete against imports by affording customers the ability to experience rapid inventory turnover which in turn minimizes potential price fluctuations and reduces the customers’ working capital needs.
Steel Market Dynamics
The market price of our products is closely related to the price of HRC. The price of benchmark HRC is primarily affected by the demand for steel and the cost of raw materials. Robust global growth, along with steel production capacity rationalization in China and raw material price increases, has caused HRC prices to strengthen since 2016, from $386/ton on January 1, 2016 to $651/ton on January 1, 2018. More recently, trade case actions on the part of the United States government have also impacted HRC prices. On March 1, 2018, President Trump announced that his administration would implement trade actions against unfairly traded steel in connection with Section 232. Since January 1, 2018, HRC prices have increased by $204/ton, to $855/ton as of March 31, 2018.
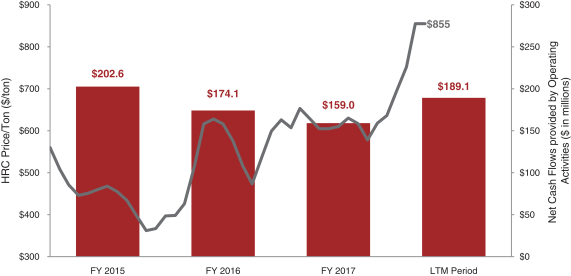
While the volatility of HRC has resulted in corresponding volatility in the prices of our products, we seek to pass HRC price increases on to our customers. We sell our products on a non-contractual spot basis, which has allowed us to successfully limit our commodity price exposure through our price negotiation, raw material procurement and inventory management program.Although the price of our products closely relates to the price of HRC, there may be a time lag between when changes in prices charged by our suppliers take effect and the point when we can implement corresponding changes in the prices of our products. Our successful track record in managing underlying commodity price exposure is evident in our financial performance over the last several years, during which we have successfully grown Adjusted EBITDA per ton throughout a period of HRC price volatility as evidenced by the chart below.
| 8 |
Table of Contents
Confidential Treatment Requested Pursuant to 17 C.F.R. Section 200.83
HRC Price Volatility and Adjusted EBITDA / Ton(1)
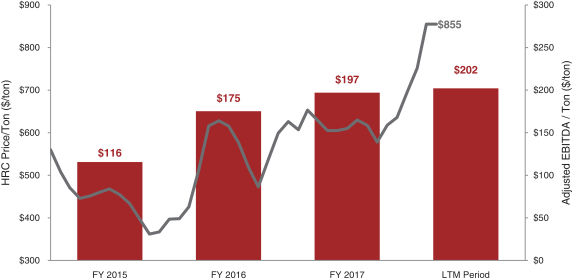
| (1) | See “Non-GAAP Financial Measures” and “Summary Consolidated Financial and Other Data—Non-GAAP Reconciliation” for more information about our use of Adjusted EBITDA and derivative operating measures such as Adjusted EBITDA per ton, as well as a reconciliation to income from continuing operations. In the periods presented in the above table, income from continuing operations was $5.8 million in fiscal year 2015, $85.1 million in fiscal year 2016, $163.3 million in fiscal year 2017 and $197.0 million in the LTM Period. |
Underlying HRC price volatility is also mitigated through the counter-cyclical nature of our working capital flows, with increases in working capital when HRC prices rise and releases of working capital when HRC prices fall, resulting in relative stability in our net cash flows provided by operating activities.
HRC Price Volatility and Net Cash Flows provided by Operating Activities
| 9 |
Table of Contents
Confidential Treatment Requested Pursuant to 17 C.F.R. Section 200.83
Our Competitive Strengths
We believe that the following competitive strengths enhance our market position:
A Leading Producer in North America. We believe we are the largest producer by volume of structural tubing and electrical conduit products in the United States and Canada on a combined basis, and the largest producer by volume of standard pipe products in the United States.
| �� |
| LTM Period | ||||||
| Estimated Share (1) | Tons (kt) (2) | Closest Competitors | |||||
Structural tubing | 29% | 1,206 | Independence Tube (Nucor), Southland Tube (Nucor), | |||||
|
| Maruichi Leavitt Pipe & Tube | ||||||
Electrical conduit | 48% | 259 | Allied Tube & Conduit (Atkore International), | |||||
|
| Republic Conduit (Nucor) | ||||||
Standard pipe | 20% | 385 | Bull Moose Tube, EXL Tube, foreign producers | |||||
Source: National Electrical Manufacturers Association (“NEMA”), Preston Pipe & Tube Report, Metal Service Center Institute (“MSCI”) and management estimates.
| (1) | For structural tubing and electrical conduit, estimated share is for the United States and Canada on a combined basis. For standard pipe, estimated share is for the United States. |
| (2) | Represents our shipments in the LTM period. |
Advantaged Manufacturing Footprint. We believe our network of facilities gives us an advantaged manufacturing footprint in the United States and Canada, with an operating presence in the Midwest / Great Lakes region, the Southeast and the West Coast. Our strategically located facilities are in close proximity to our primary steel suppliers and to our customers in each of our key regions, which minimizes potential disruption to deliveries of raw materials and allows us to realize freight cost savings, while also lowering our inventory levels and reducing lead times and freight costs for our customers. Our network of strategically located facilities also allows us to be more responsive than competitors in leveraging and capitalizing on market and growth opportunities within each of the regions in which we operate. We have solidified our industry advantaged footprint through selective acquisitions, where we believe we have a demonstrated track record of successfully acquiring and integrating businesses, as well as investing organically.
Important Supplier to Our Customers and End Markets. With our product diversity, quality and reliability, we are able to serve as a“one-stop shop” for many of our customers with numerous customer relationships of over 20 years in length. Our manufacturing and distribution advantages and quick turnaround times from order to shipment create high customer retention rates. Moreover, our product mix, sophisticated logistics, information technology systems, including an SAP enterprise resource planning system, and specialized manufacturing capabilities allow us to effectively bundle shipments, thereby reducing transportation costs and lead times. We produce over 9,800 distinct pipe and tube products in a broad range of sizes and shapes and we believe we are the only North American manufacturer of certain products such as CW pipe products and14”-16” square and rectangular-shaped structural tubing. Consequently, we are an important supplier for the majority of our steel service centers and major distributor customers and the end markets that they serve.
| 10 |
Table of Contents
Confidential Treatment Requested Pursuant to 17 C.F.R. Section 200.83
Efficient Operations with Significant Scale and Purchasing Power. We have total annual production capacity of approximately 2.9 million tons from continuing operations and have continuously invested in equipment, processes and training to increase throughput, yields and efficiencies. Our scale also benefits our procurement of raw materials. As we believe we are the largest consumer of HRC by volume in the United States and Canada, we believe we are able to leverage our scale to drive procurement savings. Our manufacturing scale and raw material consumption also allow us to aggregate purchasing and obtain more favorable terms from our suppliers. Over the past several years, management has implemented cost and production efficiency initiatives, while managing capital expenditures to optimize physical assets. These improvements have enabled us to successfully and profitably satisfy growing demand in the end markets related to products we sell.
Low Cost and Highly Variable Cost Structure. Our scale and flexible manufacturing base enable us to maintain a highly variable cost structure, with variable costs accounting for 82% of total costs for the LTM Period, of which steel accounts for 61% of total costs. We believe this cost structure, which is underpinned by our industry leading scale and network of facilities located in close proximity to suppliers and customers, is among the lowest compared to our competitors in the United States and Canada. The following chart illustrates the key components of our highly variable cost structure.
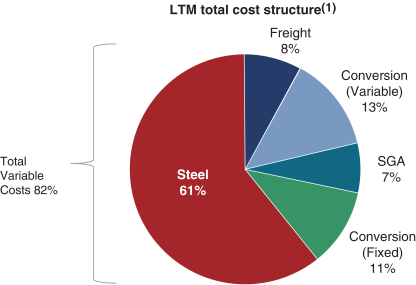
| (1) | Total Variable Costs include Steel, Freight and Conversion (Variable). |
Experienced and Proven Management Team. Our senior management team has decades of leadership experience in the industrial steel pipe and tube industry and other relevant industrial sectors. We believe our senior management team is supported by a strong executive and operating leadership organization, including our corporate vice presidents and production facility leaders, who are seasoned operators with valuable insight into and deep knowledge of the industrial steel pipe and tube market. Our Executive Chairman and Chief Executive Officer (“CEO”), Barry Zekelman, has served in leadership capacities at Zekelman Industries and its predecessors for over 30 years. Barry Zekelman is supported by a team of operating executives with over 100 cumulative years of steel tube and pipe sector experience, who have managed the business through steel price cycles, shifting macroeconomic climates and different capital structures.
| 11 |
Table of Contents
Confidential Treatment Requested Pursuant to 17 C.F.R. Section 200.83
Growth Strategy
We intend to expand our leading market positions and scale through organic and inorganic growth initiatives. At present, we have identified a number of projects to both optimize existing production capacity at minimal incremental capital cost, and to modernize and build new capacity at our existing locations to respond to and capitalize on market opportunities. Specifically, we believe that the continued recovery of non-residential construction and infrastructure end-market demand supports production capacity optimization initiatives. For example, between 2010 and 2018 (based on annualized data as of the end April 2018), HSS consumption in the United States and Canada on a combined basis has grown at an average annual rate of approximately 5%, from 2.6 million tons to 3.9 million tons, based on market research from MSCI. Growth in the consumption of HSS has been driven by recovery of non-residential construction and infrastructure spend, as well as increased penetration and acceptance of products using HSS relative to competing building products. We believe that demand for products using HSS will continue to remain strong for the foreseeable future, and we believe our portfolio of highly efficient structural mills, which feature quick change capabilities, are well positioned to capitalize on this market strength through specific optimization initiatives described in further detail below. In addition to the HSS market opportunity, we believe that our structural mills are well positioned to flexibly produce a variety of other steel pipe and tube products with modest incremental capital expenditure. For example, this flexibility enables us to produce energy tubulars, fence and mechanical products and certain types of standard pipe products. As we respond to and capitalize on opportunities in the market as part of our growth strategy, we have primarily focused our investment in optimizing, modernizing and building new capacity in our Atlas structural tube facilities, though also have identified opportunities in our other businesses as well.
In addition to these organic growth opportunities, we maintain and monitor a pipeline of potential acquisition targets. We believe we have a demonstrated track record of successfully acquiring and integrating businesses.
We Intend to Grow by Optimizing and Modernizing Capacity to Capitalize on Market Opportunities.
For the LTM Period, we estimate that utilization levels for our key business segments were70-75% for Atlas (inclusive of our Blytheville, Arkansas manufacturing facility, which we are currently in the process of restarting and modernizing),75-80% for EFM and80-85% for Pipe (inclusive of our currently idled Mill Street manufacturing facility in Sharon, Pennsylvania). We believe that strong demand for our products and sustained strength in our products’ end markets present us with a number of opportunities to flexibly grow production and sales by increasing utilization across our portfolio of manufacturing facilities. We also believe that our industry leading scale and advantaged geographic footprint, together with our sophisticated logistics and information sharing systems and manufacturing facilities’ production flexibility, uniquely position us to optimize our capacity by rapidly responding to improving market conditions. Strength in end-market demand for domestically produced products is further supported by the anticipated favorable competitive impact to our business from the implementation of trade actions against unfairly traded steel and steel products in connection with Section 232.
Within our Atlas business, we are in the process of increasing utilization and optimizing production capacity to respond to current and anticipated market conditions. Specific capacity optimization initiatives that are currently underway include:
| • | We are restarting and modernizing our previously idled Blytheville, Arkansas manufacturing facility in response to strong and growing end-market demand for structural tubing products in the Southeast and Southwest regions of the United States. |
| 12 |
Table of Contents
Confidential Treatment Requested Pursuant to 17 C.F.R. Section 200.83
| • | In connection with the restart of our Blytheville facility, we intend to optimize and geographically rationalize production of certain structural tubing products at our Chicago, Illinois HSS mill. |
| • | In response to market conditions in Canada, we have begun the construction of a new HSS mill at our Harrow, Ontario operation. |
Within our other business units, we have also identified a number of opportunities to optimize production and increase utilization in response to anticipated demand in our key markets and geographies. Specific initiatives include:
| • | Within our EFM business, we are in the process of optimizing the mix at our Chicago, Illinois Pipe facility and our Long Beach, California facility by increasing output of fence products with a more differentiated market position and potential higher operating margin. |
| • | We are in the process of optimizing mix at our Warren, Ohio manufacturing facility and producing more energy tubular products by increasing utilization of existing capacity at little incremental capital cost in response to growing demand for domestically produced energy tubular products due to higher drilling activity in the United States and Canadian oil and gas end market and improving competitive dynamics for energy tubular products relative to foreign imports. |
| • | Within our Pipe business, although no decision has been made, we have the opportunity to restart our Mill Street manufacturing facility in Sharon, Pennsylvania, which was previously idled in fiscal year 2015. We believe that if the Mill Street facility is restarted, we would have the opportunity to shift over production of small diameter pipe from our Council Avenue facility in Wheatland, Pennsylvania, which would position our Council Avenue facility to increase production of larger diameter products. |
A summary of selected optimization and modernization initiatives and other identified opportunities is included in the following table.
Summary of Selected Potential Capacity Optimization Initiatives
Manufacturing Facility | Reportable | Description | Production Capacity (kt) | Estimated Start-up Costs ($ in millions) | Anticipated Completion | |||||||||||
Blytheville(1) | Atlas | In-Process Restart | 120 | 2019 | ||||||||||||
Blytheville(2) | Atlas | Restart & Mill Modernization | 270 | 2019 | ||||||||||||
Subtotal: | 390 | $ | 30 | |||||||||||||
Harrow | Atlas | New Mill Addition | 80 | $ | 13 | 2019 | ||||||||||
Mill Street(3) | Pipe | Idled, Potential Restart | 75 | $ | 5 | 2019 | ||||||||||
Council Avenue(3)(4) | Pipe | Potential Mix Shift Optimization | 55 | — | 2019 | |||||||||||
| (1) | Inclusive of 48 kt of production during the LTM Period and current production capacity of 120 kt. |
| (2) | Inclusive of 62 kt increase in production capacity relative to current production capacity of 208 kt. Increase in production capacity due to mill modernization. |
| (3) | No decision has been made yet with respect to this project. |
| (4) | Represents 130 kt of potential incremental production capacity, net of 75 kt of production capacity shifted to Mill Street. |
We also have the Opportunity to Grow by Building New Capacity to Capitalize on Market Opportunities.
Alongside our efforts to optimize our existing capacity, we have also identified opportunities to profitably add additional production capacity to enhance our operating footprint and grow our positions in certain markets. Specifically, for our structural tubing and related piling products, we believe there is an
| 13 |
Table of Contents
Confidential Treatment Requested Pursuant to 17 C.F.R. Section 200.83
opportunity to add further capacity at our Blytheville manufacturing facility, particularly for the production of the largest diameter structural tubing products which are commonly used in infrastructure projects outside of the United States, but have had limited domestic acceptance to date. Within the United States, demand for these large diameter structural tubing products historically has been satisfied by imports, primarily from Japan, although we believe domestic demand for these products has also been minimal due to limited availability of supply. We now believe that market conditions may be supportive of adding domestic production capacity for these products, given the anticipated increase in infrastructure spend in the United States. We also believe that trade actions on unfairly traded steel in connection with Section 232 could enhance the competitive positioning of potential domestic production. Additional investments in finishing line equipment could also be made to supply large diameter pipeline products to meet demand in the energy tubular market. While no final construction decisions have been made, we estimate that the construction of a new large diameter structural tubing mill at our Blytheville manufacturing facility with annual production capacity of up to 400 kt would cost approximately $125 million, with first production within24-36 months from project approval.
We have Made an Investment in the Fast-Growing Business of Permanent Modular Construction.
We are in the early stages of building a new business, calledZ-Modular, to take advantage of what we believe to be attractive market trends in modular construction. The permanent modular construction industry is a growing segment within the overall commercial construction market, representing 3.2% of the total construction spend in North America in 2016 (up from 2.4% in North America in 2014). According to the Modular Building Institute, the modular construction market reported estimated revenues of approximately $3 billion in 2016, up 50% from estimated revenues of $2 billion in 2011. The market is anticipated to continue experiencing robust growth based on the growth of the industry’s six key markets—multifamily housing, retail / commercial, education, healthcare, institutional and assembly and office and administrative.Z-Modular designs, manufactures and installs permanent modular buildings using our patented VectorBloc system of construction. We believe the VectorBloc system of construction is the most precise structural connection system available and offers best in class in quality,build-out efficiency and total project cost. As of March 31, 2018, we have made a modest cumulative investment of $5.2 million in property, plant and equipment and intangible assets to prove out our concepts, establish optimal manufacturing methods and establish a commercially viable product line. We anticipate additional modest capital investments in the near-term, including fiscal year 2019, as we continue to establish the business. Over the long-term, the nature and extent of our investments will be dictated by the development of the market and opportunities that may arise.
Business Strategy
Our primary objective is to create value by sustaining growth in earnings and cash flows from operating activities over various economic cycles. To achieve this objective, we strive to improve our cost structure, provide high quality service and products, expand our product offerings and increase our market share.
Expand Leading Market Positions. We believe that our leading market position and scale are our most compelling competitive strengths. Our management team is focused on expanding market share, which we believe will generate operating leverage and improved financial performance. We believe this can be accomplished through acquisitions and organic initiatives, including offering new products, serving additional end markets and increasing customer penetration and geographic coverage. As part of our business strategy, we evaluate acquisition opportunities from time to time.
Optimize Our Portfolio and Product Mix to be Responsive to Market Conditions. We seek to maintain flexibility to adjust our product mix and rapidly respond to changing market conditions. While prioritizing our highest margin products, we regularly evaluate our portfolio of assets to ensure
| 14 |
Table of Contents
Confidential Treatment Requested Pursuant to 17 C.F.R. Section 200.83
that our offerings are responsive to prevailing market conditions. Our recent restart of our Blytheville, Arkansas manufacturing facility and the ongoing construction of additional production capacity at our Harrow, Ontario manufacturing facility reflect our continued focus on responding to our markets’ needs. We will continue to assess and pursue other similar opportunities to utilize, optimize and grow production capacity to capitalize on market opportunities.
Provide Superior Quality Products and Customer Service. Our products play a critical role in a variety of construction, infrastructure, equipment and safety applications. Our emphasis on manufacturing processes, quality control testing and product development helps us deliver ahigh-quality product to our customers. We focus on providing superior customer service through our geographic manufacturing footprint and continued development of our proprietary, vendor managed AIM system, as well as our experienced customer service teams and sales forces. We also seek to provide high-quality customer service through continued warehouse optimization, including increased digitization and automation of certain systems to debottleneck loading and dispatch logistics and improve truck availability. We believe that superior warehouse, transportation and shipping logistics represents a key point of commercial differentiation relative to our competitors.
Focus on Efficient Manufacturing and Cost Management. We strive for continued operational excellence with the goal of providinghigh-quality products at competitive prices. Our operating personnel continually examine costs and profitability by product, plant and region. Our goal is to maximize operational benchmarks by leveraging skilled manufacturing and supply chain management processes.
Focus on Key Supplier Relationships. We believe that our relationships with our key suppliers provide a competitive advantage in serving our customers. We have developed purchasing programs that we believe improve our access to raw materials and reduce our lead times. Our ability to provide our suppliers with accurate information regarding our future demands is critical to this relationship. In doing so, we are focused on accurate demand planning and have invested in systems to enhance this function.
Execute Pricing Strategy to Pass through Underlying Costs. We believe we have a long track record of managing underlying commodity price exposure through our price negotiation, raw material procurement and inventory management program. In addition to managing underlying commodity prices, more recently we have had success in sharing transportation costs with our customers through our product pricing strategies, particularly for our electrical conduit products. We believe there is opportunity to implement this pricing strategy for our other products as well.
Our History
The Zekelman family founded our largest business, Atlas Tube (“Atlas Tube” or “Atlas”), in 1984, and has a long history of successful leadership in the steel pipe and tube industry. Barry Zekelman, our Executive Chairman and CEO, and his brothers, Alan Zekelman and Clayton Zekelman, members of our Board of Directors, assumed leadership of Atlas from their father in 1986 and led it through a period of robust growth. Since 1986, our Company has grown from a single structural tubing manufacturing facility located in Harrow, Ontario with annual sales of less than $1.5 million, to a leading North American manufacturer of industrial steel pipe and tube products, with 13 pipe and tube production facilities across seven U.S. states and one Canadian province with total production of approximately 2.1 million tons from our continuing operations and net sales from continuing operations of $2.4 billion for the LTM Period.
Zekelman Industries has grown both through organic investment as well as selective strategic acquisitions. In 2006, Atlas merged with the John Maneely Company, a predecessor company founded
| 15 |
Table of Contents
Confidential Treatment Requested Pursuant to 17 C.F.R. Section 200.83
in 1877 that was acquired by The Carlyle Group (“Carlyle”) earlier in 2006. Upon consummation of the merger, the Company was renamed JMC Steel Group, Inc. (“JMC Steel”). Subsequent to this merger, Barry Zekelman served as Chief Operating Officer (“COO”) of JMC Steel between 2006 and 2008, during which time he completed the acquisition and integration of Sharon Tube Company. In 2008, Barry Zekelman was named CEO, a position which he held until March 2010, at which point he was appointed as our Executive Chairman. In fiscal year 2011, we and Barry Zekelman purchased a portion of the outstanding stock that was held by Carlyle. Barry Zekelman returned to the CEO position of JMC Steel in February 2013. In fiscal year 2014, we repurchased all remaining outstanding stock held by Carlyle. Effective April 28, 2016, we changed our name from JMC Steel Group, Inc. to Zekelman Industries, Inc. to better reflect the broad nature of our business and the reputation of the Zekelman family in steel pipe and tube markets. During fiscal year 2017, we successfully completed the acquisition and integration of both Western Tube and American Tube.
Selected Risks Associated with Our Business
Our business is subject to numerous risks and uncertainties, including those highlighted in “Risk Factors” immediately following this prospectus summary. Some of these risks include:
| • | Demand for our products is impacted by general economic conditions in the United States, Canada and globally, as well as conditions in thenon-residential construction, infrastructure and other end markets that our products are used in; |
| • | We generally do not obtain long-term purchase commitments from customers or long-term supply commitments from steel, transportation and other suppliers; |
| • | Our business is significantly impacted by the price and supply of steel, primarily HRC, which has been volatile; |
| • | Our business could be impacted in a number of ways by United States, Canadian and global trade and tariff actions, and the effects of recent and future actions are unpredictable; |
| • | We sell our products in competitive markets and must successfully compete based on price, delivery and other attributes; |
| • | Levels of imports of steel that impact steel prices generally, and of steel products that compete with our products can impact our business; |
| • | We have grown our business through acquisitions in the past, and we may be unable to continue to successfully execute and integrate acquisitions; |
| • | We face risks and challenges associated with resuming production at idled facilities and with our planned and potential construction and production optimization and modernization activities; |
| • | We are subject to significant environmental, health and safety laws and other regulations; and |
| • | Our multiple class structure will have the effect of concentrating voting control with entities controlled by members of the Zekelman family. |
Corporate Information
Zekelman Industries was incorporated in the state of Delaware on February 13, 2006 and changed its name from JMC Steel Group, Inc. to Zekelman Industries, Inc. on April 28, 2016. Our principal headquarters is located at 227 West Monroe Street, Suite 2600, Chicago, IL 60606. Our telephone number is (312)275-1600. Our website is www.zekelman.com. Information contained on our website is not a part of this prospectus and the inclusion of our website address in this prospectus is an inactive textual reference only.
| 16 |
Table of Contents
Confidential Treatment Requested Pursuant to 17 C.F.R. Section 200.83
Our Structure and Principal Stockholders
Prior to this offering, our outstanding capital stock consists of common stock (the“Pre-IPO Voting Common Stock”),non-voting common stock (the“Pre-IPONon-Voting Common Stock”) and special voting shares (the “Special Voting Shares”) that correspond on aone-for-one basis with exchangeable shares (the “Exchangeable Shares”) in one of our subsidiaries. Barry Zekelman, our Chairman and CEO, and Alan Zekelman and Clayton Zekelman, members of our Board of Directors, indirectly own all outstanding shares of our capital stock through holding companies.
In connection with this offering, we will take the following actions to reorganize our capital structure immediately prior to the consummation of this offering (these actions are collectively referred to in this prospectus as the “Reorganization”):
| • | We will amend and restate our certificate of incorporation to create authorized shares of Class A subordinate voting stock and authorized shares of Class B multiple voting stock, each with such terms and conditions as are described under “Description of Capital Stock—Class A Subordinate Voting Stock and Class B Multiple Voting Stock” in this prospectus; |
| • | Each outstanding share ofPre-IPO Voting Common Stock andPre-IPONon-Voting Common Stock will be reclassified into a share of Class B multiple voting stock and our amended and restated certificate of incorporation will no longer provide for any authorizedPre-IPO Voting Common Stock andPre-IPONon-Voting Common Stock; and |
| • | The terms of our Special Voting Shares and Exchangeable Shares will be amended to reflect the reorganization transactions described above and otherwise to have such terms and conditions as are described under “Description of Capital Stock—Special Voting Shares and Exchangeable Shares” in this prospectus. |
After the Reorganization, but before giving effect to this offering, Barry Zekelman, Alan Zekelman and Clayton Zekelman will continue to indirectly own all outstanding shares of our capital stock.
Following this offering, Barry Zekelman, Alan Zekelman and Clayton Zekelman will continue to own a controlling interest in us and will indirectly own all outstanding shares of our Class B multiple voting stock and Special Voting Shares, representing approximately % of the voting power of our outstanding capital stock. Because the shares of our Class B multiple voting stock and our Special Voting Shares have ten votes per share, so long as members of the Zekelman family and their permitted transferees hold at least 15% of our outstanding capital stock, they will collectively continue to control the outcome of matters submitted to our stockholders for approval. Once the outstanding shares of our Class B multiple voting stock (plus the number of shares of Class B multiple voting stock issuable pursuant to Exchangeable Shares then outstanding) represent less than 15% of the outstanding shares of our Class A subordinate voting stock and Class B multiple voting stock (plus the number of shares of issuable pursuant to Exchangeable Shares then outstanding), all shares of Class B multiple voting stock will automatically convert into shares of our Class A subordinate voting stock and we will then have only a single class of common stock entitled to one vote per share. See “Principal and Selling Stockholders” and “Description of Capital Stock.”
We intend to effect a stock split prior to launching this offering. Following the stock split, all share and per share amounts in this prospectus will be retroactively adjusted to reflect this stock split.
| 17 |
Table of Contents
Confidential Treatment Requested Pursuant to 17 C.F.R. Section 200.83
The Offering
Class A subordinate voting stock offered by us | shares (or shares if the underwriters exercise their option to purchase additional shares in full) |
Class A subordinate voting stock offered by the selling stockholders | shares (or shares if the underwriters exercise their option to purchase additional shares in full) |
Class A subordinate voting stock to be outstanding after this offering | shares (or shares if the underwriters exercise their option to purchase additional shares in full) |
Class B multiple voting stock to be outstanding after this offering or issuable upon exchange of Exchangeable Shares | shares (includes shares issuable upon exchange of Exchangeable Shares) |
Use of proceeds | We estimate that the net proceeds to us from the sale of shares of our Class A subordinate voting stock in this offering will be approximately $ (or approximately $ million if the underwriters’ option to purchase additional shares of our Class A subordinate voting stock is exercised in full), based upon the assumed initial public offering price of $ per share, which is the midpoint of the estimated offering price range set forth on the cover page of this prospectus, and after deducting estimated underwriting discounts and commissions and estimated offering expenses payable by us. |
| We intend to use approximately $ of the net proceeds of this offering to repay a portion of our outstanding indebtedness. We intend to use the remaining net proceeds we receive from this offering for general corporate purposes, including working capital, operating expenses and capital expenditures. Additionally, we may use a portion of the remaining net proceeds we receive from this offering to acquire businesses, assets, equipment, products, services or technologies. However, we do not have agreements or commitments for any material acquisitions at this time. We cannot specify with certainty the particular uses of the remaining net proceeds that we will receive from this offering. Accordingly, we will have broad discretion in using these proceeds. |
| 18 |
Table of Contents
Confidential Treatment Requested Pursuant to 17 C.F.R. Section 200.83
| We will not receive any of the proceeds from the sale of Class A subordinate voting stock in this offering by the selling stockholders. See “Use of Proceeds” for additional information. |
Voting rights | Shares of our Class A subordinate voting stock are entitled to one vote per share. |
| Shares of our Class B multiple voting stock and Special Voting Shares are entitled to ten votes per share. |
| For so long as the Exchangeable Shares are exchangeable for shares of our Class B multiple voting stock, holders of our Special Voting Shares will be entitled to ten votes for each share held. Upon the automatic conversion of our Class B multiple voting stock into shares of Class A subordinate voting stock on the Automatic Conversion Date (as defined herein), the Exchangeable Shares will be exchangeable for shares of our Class A subordinate voting stock only, and thereafter holders of our Special Voting Shares will be entitled to only one vote for each share. |
| Holders of our Class A subordinate voting stock, Class B multiple voting stock and Special Voting Shares will generally vote together as a single class, unless otherwise required by law. The holders of our outstanding Class B multiple voting stock and Special Voting Shares will represent approximately % of the voting power of our outstanding capital stock following this offering and are owned by entities controlled by members of the Zekelman family. As a result, these entities will have the ability to control the outcome of matters submitted to our stockholders for approval, including the election of our directors and the approval of any change in control transaction. See “Principal and Selling Stockholders” and “Description of Capital Stock” for additional information. |
Conversion rights | Shares of Class A subordinate voting stock are not convertible into any other class of stock, including Class B multiple voting stock. Shares of Class B multiple voting stock are convertible into Class A subordinate voting stock on a one-for-one basis at the option of the holder. In addition, our Class B multiple voting stock will automatically convert into Class A subordinate voting stock in certain circumstances. See “Description of Capital Stock.” |
| 19 |
Table of Contents
Confidential Treatment Requested Pursuant to 17 C.F.R. Section 200.83
Dividend policy | Following the completion of this offering, our Board of Directors may, in its discretion, elect to pay cash dividends. See “Dividend Policy.” |
Proposed trading symbols | “ ” on the . |
| “ ” on the Toronto Stock Exchange. |
Controlled company | Upon completion of this offering, entities controlled by members of the Zekelman family will continue to own a controlling interest in us. Therefore, we expect to be a “controlled company” within the meaning of the corporate governance rules of the . |
Risk factors | Investing in our Class A subordinate voting stock involves a high degree of risk. See “Risk Factors” beginning on page 27 of this prospectus for a discussion of factors you should carefully consider before investing in our Class A subordinate voting stock. |
The number of shares of our Class A subordinate voting stock and Class B multiple voting stock that will be outstanding after this offering gives effect to, in addition to the issuance of the shares of Class A subordinate voting stock offered by us in this offering, the exchange of Exchangeable Shares for shares of Class A subordinate voting stock offered by selling stockholders in this offering and the exercise of options, at a weighted-average exercise price of $ per share, to purchase shares of Class A subordinate stock offered by selling stockholders in this offering, and excludes the following:
| • | shares of Class A subordinate voting stock issuable upon exercise of outstanding stock options with a weighted average exercise price of $ per share after giving effect to the Reorganization and this offering; and |
| • | shares of Class A subordinate voting stock available for future issuance pursuant to awards that may be granted under our 2018 Equity Plan (as defined herein) that we expect to adopt in connection with this offering. |
Except as otherwise indicated, all information in this prospectus assumes:
| • | the completion of the Reorganization; |
| • | the filing and effectiveness of our amended and restated certificate of incorporation and the effectiveness of our amended and restated bylaws, each of which will occur immediately prior to the completion of this offering; |
| • | no exercise of outstanding stock options subsequent to , 2018 (other than in connection with this offering by selling stockholders); and |
| • | no exercise by the underwriters of their option to purchase up to an additional shares of our Class A subordinate voting stock. |
In this prospectus, other than in our consolidated financial statements and the related notes, references to the number of outstanding stock options, the class of shares for which they are exercisable and the exercise prices of such options have been adjusted to give effect to the Reorganization.
| 20 |
Table of Contents
Confidential Treatment Requested Pursuant to 17 C.F.R. Section 200.83
In various places in this prospectus, such as “Dilution,” and “Principal and Selling Stockholders,” as so indicated, we have presented information based on the assumption that all Exchangeable Shares have been exchanged for shares of Class B multiple voting stock and the corresponding Special Voting Shares have been cancelled without consideration. We have presented information in this way because, together, the Exchangeable Shares and Special Voting Shares are intended to be the economic and voting equivalent of shares of Class B multiple voting stock and therefore we believe this information is useful to investors in understanding our capital structure. However, this presentation is not intended to convey any information about when or if the Exchangeable Shares will actually be exchanged. See “Description of Capital Stock—Special Voting Shares and Exchangeable Shares.”
We intend to effect a stock split prior to launching this offering. Following the stock split, all share and per share amounts in this prospectus will be retroactively adjusted to reflect this stock split.
| 21 |
Table of Contents
Confidential Treatment Requested Pursuant to 17 C.F.R. Section 200.83
Summary Consolidated Financial and Other Data
The following tables set forth summary consolidated financial and other data.
The summary consolidated financial information presented below under the captions “Statement of operations data,” “Other financial data” and “Statement of cash flows data” for the fiscal years ended September 30, 2017, September 24, 2016 and September 26, 2015 has been derived from our consolidated financial statements that have been audited by Ernst & Young LLP, our independent registered public accounting firm, and are included elsewhere in this prospectus.
The summary interim consolidated financial information presented below under the captions “Statement of operations data,” “Other financial data” and “Statement of cash flows data” for the 26 weeks ended March 31, 2018 and March 25, 2017, and the summary consolidated financial information presented below under the caption “Balance sheet data” as of March 31, 2018 have been derived from our unaudited interim consolidated financial statements that are included elsewhere in this prospectus and which have been prepared on the same basis as our audited consolidated financial statements. In the opinion of management, the interim data reflects all adjustments, consisting of normal and recurring adjustments, necessary for a fair presentation of results for these periods and such data has been prepared on the same basis as the audited financial information. Interim results may not be indicative of full year results and historical results may not necessarily be indicative of results that may be expected for any future period.
We have also presented summary unaudited consolidated financial information for the 53 weeks ended March 31, 2018 (this period is referred to in this prospectus as the “LTM Period”). All summary unaudited consolidated financial information presented below for the LTM Period has been derived from the mathematical combination of (1) the audited consolidated financial information for the fiscal year ended September 30, 2017 and (2) the unaudited interim consolidated financial information for the 26 weeks ended March 31, 2018, less (3) the unaudited interim consolidated financial information for the 26 weeks ended March 25, 2017. We have presented this financial data because we believe it provides our investors with useful information to assess our recent performance.
| 22 |
Table of Contents
Confidential Treatment Requested Pursuant to 17 C.F.R. Section 200.83
The summary consolidated financial data presented below should be read in conjunction with “Selected Historical Consolidated Financial and Other Data,” “Capitalization,” “Management’s Discussion and Analysis of Financial Condition and Results of Operations” and the consolidated financial statements and related notes included elsewhere in this prospectus.
| 26 Weeks Ended March 31, 2018 | 26 Weeks Ended March 25, 2017 | LTM Period March 31, 2018 | Year Ended September 30, 2017 | Year Ended September 24, 2016 | Year Ended September 26, 2015 | |||||||||||||||||||
| (unaudited) | (unaudited) | (unaudited) | ||||||||||||||||||||||
| (in thousands, except share, per share and per ton amounts) | ||||||||||||||||||||||||
Statement of operations data: | ||||||||||||||||||||||||
Net sales | $ | 1,198,601 | $ | 916,675 | $ | 2,377,181 | $ | 2,095,255 | $ | 1,554,491 | $ | 1,712,547 | ||||||||||||
Cost of sales | 937,404 | 710,018 | 1,885,086 | 1,657,700 | 1,200,215 | 1,466,797 | ||||||||||||||||||
|
|
|
|
|
|
|
|
|
|
|
| |||||||||||||
Gross profit | 261,197 | 206,657 | 492,095 | 437,555 | 354,276 | 245,750 | ||||||||||||||||||
Expenses: | ||||||||||||||||||||||||
Selling, general and administrative expenses | 86,402 | 69,614 | 168,105 | 151,317 | 130,214 | 123,103 | ||||||||||||||||||
Transaction costs | — | 731 | — | 731 | — | — | ||||||||||||||||||
Exit and restructuring costs | 108 | 1,372 | 609 | 1,873 | 1,970 | 8,771 | ||||||||||||||||||
|
|
|
|
|
|
|
|
|
|
|
| |||||||||||||
Total operating expenses | 86,510 | 71,717 | 168,714 | 153,921 | 132,184 | 131,874 | ||||||||||||||||||
|
|
|
|
|
|
|
|
|
|
|
| |||||||||||||
Operating income | 174,687 | 134,940 | 323,381 | 283,634 | 222,092 | 113,876 | ||||||||||||||||||
Other expense (income), net: | ||||||||||||||||||||||||
Interest expense, net | 42,441 | 46,624 | 87,956 | 92,139 | 95,931 | 98,511 | ||||||||||||||||||
Other expense (income), net | 4,682 | 1,702 | (4,161 | ) | (7,141 | ) | 25,074 | 14,242 | ||||||||||||||||
|
|
|
|
|
|
|
|
|
|
|
| |||||||||||||
Total other expense, net | 47,123 | 48,326 | 83,795 | 84,998 | 121,005 | 112,753 | ||||||||||||||||||
|
|
|
|
|
|
|
|
|
|
|
| |||||||||||||
Income from continuing operations before income taxes | 127,564 | 86,614 | 239,586 | 198,636 | 101,087 | 1,123 | ||||||||||||||||||
Provision (benefit) for income taxes | 22,148 | 14,866 | 42,622 | 35,340 | 16,008 | (4,637 | ) | |||||||||||||||||
|
|
|
|
|
|
|
|
|
|
|
| |||||||||||||
Income from continuing operations | 105,416 | 71,748 | 196,964 | 163,296 | 85,079 | 5,760 | ||||||||||||||||||
|
|
|
|
|
|
|
|
|
|
|
| |||||||||||||
(Loss) income from discontinued operations, net of income taxes | (714 | ) | 355 | (2,891 | ) | (1,822 | ) | (16,580 | ) | (69,430 | ) | |||||||||||||
|
|
|
|
|
|
|
|
|
|
|
| |||||||||||||
Net income (loss) | $ | 104,702 | $ | 72,103 | $ | 194,073 | $ | 161,474 | $ | 68,499 | $ | (63,670 | ) | |||||||||||
|
|
|
|
|
|
|
|
|
|
|
| |||||||||||||
Net income (loss) available to common stockholders—basic(1) | $ | 15,168 | $ | 10,390 | $ | 28,265 | $ | 23,487 | $ | 10,048 | $ | (9,844 | ) | |||||||||||
|
|
|
|
|
|
|
|
|
|
|
| |||||||||||||
Net income (loss) available to common stockholders—diluted(1) | $ | 90,397 | $ | 63,398 | $ | 168,315 | $ | 141,316 | $ | 59,277 | $ | (61,073 | ) | |||||||||||
|
|
|
|
|
|
|
|
|
|
|
| |||||||||||||
Earnings (loss) per common share—basic(1): | ||||||||||||||||||||||||
Continuing operations | $ | 635.20 | $ | 430.07 | $ | 1,193.07 | $ | 987.94 | $ | 517.27 | $ | 35.44 | ||||||||||||
Discontinued operations | (4.25 | ) | 2.13 | (17.32 | ) | (10.94 | ) | (99.30 | ) | (444.92 | ) | |||||||||||||
|
|
|
|
|
|
|
|
|
|
|
| |||||||||||||
Net income (loss) | $ | 630.95 | $ | 432.20 | $ | 1,175.75 | $ | 977.00 | $ | 417.97 | $ | (409.48 | ) | |||||||||||
|
|
|
|
|
|
|
|
|
|
|
| |||||||||||||
Earnings (loss) per common share—diluted(1): | ||||||||||||||||||||||||
Continuing operations | $ | 620.49 | $ | 430.07 | $ | 1,164.71 | $ | 974.29 | $ | 503.39 | $ | 28.59 | ||||||||||||
Discontinued operations | (4.25 | ) | 2.13 | (17.32 | ) | (10.94 | ) | (99.30 | ) | (444.92 | ) | |||||||||||||
|
|
|
|
|
|
|
|
|
|
|
| |||||||||||||
Net income (loss) | $ | 616.24 | $ | 432.20 | $ | 1,147.39 | $ | 963.35 | $ | 404.09 | $ | (416.33 | ) | |||||||||||
|
|
|
|
|
|
|
|
|
|
|
| |||||||||||||
Weighted average common shares outstanding—basic | 24,040 | 24,040 | 24,040 | 24,040 | 24,040 | 24,040 | ||||||||||||||||||
|
|
|
|
|
|
|
|
|
|
|
| |||||||||||||
Weighted average common shares outstanding—diluted | 146,692 | 146,692 | 146,692 | 146,692 | 146,692 | 146,692 | ||||||||||||||||||
|
|
|
|
|
|
|
|
|
|
|
| |||||||||||||
| 23 |
Table of Contents
Confidential Treatment Requested Pursuant to 17 C.F.R. Section 200.83
| 26 Weeks Ended March 31, 2018 | 26 Weeks Ended March 25, 2017 | LTM Period March 31, 2018 | Year Ended September 30, 2017 | Year Ended September 24, 2016 | Year Ended September 26, 2015 | |||||||||||||||||||
| (unaudited) | (unaudited) | (unaudited) | ||||||||||||||||||||||
| (in thousands, except share, per share and per ton amounts) | ||||||||||||||||||||||||
Net income (loss) available tonon-voting common stockholders—basic and diluted(1) | $ | 4,630 | $ | 4,046 | $ | 8,454 | $ | 7,870 | $ | 2,636 | $ | (5,110 | ) | |||||||||||
|
|
|
|
|
|
|
|
|
|
|
| |||||||||||||
Earnings (loss) pernon-voting common share—basic and diluted(1): | ||||||||||||||||||||||||
Continuing operations | $ | 498.86 | $ | 430.07 | $ | 920.45 | $ | 851.66 | $ | 380.89 | $ | (100.96 | ) | |||||||||||
Discontinued operations | (4.25 | ) | 2.13 | (17.32 | ) | (10.94 | ) | (99.30 | ) | (444.92 | ) | |||||||||||||
|
|
|
|
|
|
|
|
|
|
|
| |||||||||||||
Net income (loss) | $ | 494.61 | $ | 432.20 | $ | 903.13 | $ | 840.72 | $ | 281.59 | $ | (545.88 | ) | |||||||||||
|
|
|
|
|
|
|
|
|
|
|
| |||||||||||||
Weighted averagenon-voting common shares outstanding—basic and diluted | 9,361 | 9,361 | 9,361 | 9,361 | 9,361 | 9,361 | ||||||||||||||||||
|
|
|
|
|
|
|
|
|
|
|
| |||||||||||||
| Other financial data: | ||||||||||||||||||||||||
Adjusted EBITDA | $ | 218,335 | $ | 179,136 | $ | 408,520 | $ | 369,321 | $ | 292,224 | $ | 193,969 | ||||||||||||
Adjusted EBITDA margin | 18.2 | % | 19.5 | % | 17.2 | % | 17.6 | % | 18.8 | % | 11.3 | % | ||||||||||||
Tons sold (kt) | 1,013 | 867 | 2,021 | 1,874 | 1,667 | 1,678 | ||||||||||||||||||
Adjusted EBITDA per ton | $ | 215.53 | $ | 206.62 | $ | 202.14 | $ | 197.08 | $ | 175.30 | $ | 115.60 | ||||||||||||
Statement of cash flows data: | ||||||||||||||||||||||||
Net cash provided by operating activities | $ | 55,289 | $ | 25,249 | $ | 189,085 | $ | 159,045 | $ | 174,124 | $ | 202,607 | ||||||||||||
Net cash used in investing activities | $ | (31,463 | ) | $ | (216,384 | ) | $ | (56,296 | ) | $ | (241,217 | ) | $ | (38,379 | ) | $ | (47,942 | ) | ||||||
Net cash (used in) provided by financing activities | $ | (6,993 | ) | $ | 178,769 | $ | (111,884 | ) | $ | 73,878 | $ | (134,333 | ) | $ | (147,726 | ) | ||||||||
Capital expenditures | $ | (31,482 | ) | $ | (24,043 | ) | $ | (54,254 | ) | $ | (46,815 | ) | $ | (38,398 | ) | $ | (47,114 | ) | ||||||
| (1) | Following this offering, our Class A subordinate voting stock and Class B multiple voting stock will have identical economic rights and both net income (loss) available to common stockholders and earnings (loss) per common share will be calculated to account for both classes. We expect to no longer present separate line items for two classes of common stock as we have historically. |
| 24 |
Table of Contents
Confidential Treatment Requested Pursuant to 17 C.F.R. Section 200.83
| As of March 31, 2018 | ||||||||
| Actual | Pro Forma As Adjusted(1) | |||||||
(unaudited) (in thousands) | ||||||||
Balance sheet data: | ||||||||
Cash and cash equivalents | $ | 41,564 | ||||||
Operating working capital(2) | $ | 539,787 | ||||||
Total assets, including amounts held for sale | $ | 2,368,548 | ||||||
Total debt, including current portion | $ | 1,315,874 | ||||||
Total liabilities, including amounts held for sale | $ | 1,804,572 | ||||||
Total stockholders’ equity | $ | 563,976 | ||||||
| (1) | The pro forma as adjusted column gives effect to the Reorganization, this offering and the application of the net proceeds thereof described in “Use of Proceeds” and “Capitalization.” |
| (2) | Operating working capital is a financial metric used by management, calculated as accounts receivable, net, plus inventories, net, less accounts payable. |
Non-GAAP Reconciliation
The following table includes a reconciliation of Adjusted EBITDA to income from continuing operations. For more information about our use of Adjusted EBITDA, see“Non-GAAP Financial Measures.”
| 26 Weeks Ended March 31, 2018 | 26 Weeks Ended March 25, 2017 | LTM Period March 31, 2018 | Year Ended September 30, 2017 | Year Ended September 24, 2016 | Year Ended September 26, 2015 | |||||||||||||||||||
| (in thousands, except per ton amounts) | ||||||||||||||||||||||||
Income from continuing operations | $ | 105,416 | $ | 71,748 | $ | 196,964 | $ | 163,296 | $ | 85,079 | $ | 5,760 | ||||||||||||
Interest expense, net | 42,441 | 46,624 | 87,956 | 92,139 | 95,931 | 98,511 | ||||||||||||||||||
Provision (benefit) for income taxes | 22,148 | 14,866 | 42,622 | 35,340 | 16,008 | (4,637 | ) | |||||||||||||||||
Depreciation and amortization of intangibles | 38,353 | 34,405 | 78,919 | 74,971 | 67,509 | 64,422 | ||||||||||||||||||
|
|
|
|
|
|
|
|
|
|
|
| |||||||||||||
EBITDA from continuing operations | 208,358 | 167,643 | 406,461 | 365,746 | 264,527 | 164,056 | ||||||||||||||||||
|
|
|
|
|
|
|
|
|
|
|
| |||||||||||||
Exit and restructuring activities(a) | 108 | 1,372 | 609 | 1,873 | 1,970 | 8,771 | ||||||||||||||||||
Foreign currency losses (gains) on intercompany borrowings(b) | 5,955 | 3,611 | (6,897 | ) | (9,241 | ) | (2,172 | ) | 20,551 | |||||||||||||||
Stock-based compensation expense(c) | 3,764 | 522 | 4,276 | 1,034 | 3,076 | 4,011 | ||||||||||||||||||
Inventory valuation amortization(d) | — | 5,415 | 2,783 | 8,198 | — | — | ||||||||||||||||||
Transaction costs(e) | — | 731 | — | 731 | — | — | ||||||||||||||||||
Debt modification costs(f) | — | 1,587 | 1,138 | 2,725 | 5,480 | — | ||||||||||||||||||
Bargain purchase gain(g) | — | (1,745 | ) | — | (1,745 | ) | — | — | ||||||||||||||||
Loss (gain) on extinguishment of debt(h) | — | — | — | — | 19,343 | (4,480 | ) | |||||||||||||||||
Impairment of consumable supplies inventory(i) | — | — | — | — | — | 1,047 | ||||||||||||||||||
Other(j) | 150 | — | 150 | — | — | 13 | ||||||||||||||||||
|
|
|
|
|
|
|
|
|
|
|
| |||||||||||||
Adjusted EBITDA | $ | 218,335 | $ | 179,136 | $ | 408,520 | $ | 369,321 | $ | 292,224 | $ | 193,969 | ||||||||||||
|
|
|
|
|
|
|
|
|
|
|
| |||||||||||||
Adjusted EBITDA margin(k) | 18.2 | % | 19.5 | % | 17.2 | % | 17.6 | % | 18.8 | % | 11.3 | % | ||||||||||||
|
|
|
|
|
|
|
|
|
|
|
| |||||||||||||
Adjusted EBITDA per ton(l) | $ | 215.53 | $ | 206.62 | $ | 202.14 | $ | 197.08 | $ | 175.30 | $ | 115.60 | ||||||||||||
|
|
|
|
|
|
|
|
|
|
|
| |||||||||||||
| 25 |
Table of Contents
Confidential Treatment Requested Pursuant to 17 C.F.R. Section 200.83
| (a) | Exit and Restructuring Activities: Represents expenses, including employee-related costs, defined benefit plan curtailment and other charges, lease termination costs and impairment charges, associated with idled or closed facilities and other exit costs. |
| (b) | Foreign Currency Losses (Gains) on Intercompany Borrowings: Represents foreign currency losses (gains) related to intercompany loans denominated in currencies other than the functional currencies of the related entities. |
| (c) | Stock-based Compensation Expense: Represents thenon-cash compensation expense related to stock options. |
| (d) | Inventory Valuation Amortization: Represents the purchase price adjustment to write up to estimated fair value the inventory acquired in connection with the acquisitions of Western Tube and American Tube. The amounts were amortized to cost of sales as the inventory was sold in periods subsequent to each of the transaction’s closing dates. |
| (e) | Transaction Costs: Represents professional service fees incurred in connection with the acquisitions of Western Tube and American Tube. |
| (f) | Debt Modification Costs: Represents the costs related to the February 2017 and August 2017 amendments of our Senior Secured Term Loan Credit Facility (as amended, the “Term Loan Facility”) and a portion of our overall costs related to the June 2016 amendment and restatement of our Term Loan Facility, which were required to be expensed immediately as the related outstanding and new term debt was deemed to be modified as opposed to extinguished under the applicable accounting guidance. |
| (g) | Bargain Purchase Gain: Represents a gain resulting from the Western Tube acquisition as the estimated fair value of the net assets acquired exceeded the purchase price. |
| (h) | Loss (Gain) on Extinguishment of Debt: Represents the loss related to our debt refinancing in June 2016 and gains related to purchases of our formerly outstanding unsecured senior notes in the open market at a price below par. |
| (i) | Impairment of Consumable Supplies Inventory: Represents consumable supplies inventory impairments that were recorded within cost of sales. |
| (j) | Other: Primarily represents legal and due diligence costs related to uncompleted transactions. |
| (k) | Adjusted EBITDA Margin: Calculated as Adjusted EBITDA divided by net sales. |
| (l) | Adjusted EBITDA Per Ton: Calculated as Adjusted EBITDA divided by tons sold. |
| 26 |
Table of Contents
Confidential Treatment Requested Pursuant to 17 C.F.R. Section 200.83
Investing in our Class A subordinate voting stock involves a high degree of risk. You should consider carefully the risks and uncertainties described below, together with all of the other information in this prospectus, including the section titled “Management’s Discussion and Analysis of Financial Condition and Results of Operations” and our consolidated financial statements and related notes, before making a decision to invest in our Class A subordinate voting stock. Our business, results of operations, financial condition or prospects could also be harmed by risks and uncertainties that are not presently known to us or that we currently believe are not material. If any of the risks actually occur, our business, results of operations, financial condition and prospects could be materially and adversely affected. In that event, the market price of our Class A subordinate voting stock could decline, and you could lose all or part of your investment.
Risks Related to Our Business
Our business, results of operations and financial condition may be materially and adversely affected by general economic conditions.
Many aspects of our business, including the demand for our products, are affected by United States, Canadian and global economic conditions. General economic conditions and predictions regarding future economic conditions also affect our financial results. A decrease in demand for our products, customer defaults on payments for our products, or other adverse effects resulting from an economic downturn, may cause us to fail to achieve our anticipated financial results. General economic factors beyond our control that affect our business and end markets include interest rates, recession, inflation, deflation, spending in thenon-residential and infrastructure construction and oil and gas end markets, consumer credit availability, consumer debt levels, performance of housing markets, energy costs, tax rates and policy, domestic and foreign trade policies, unemployment rates, commencement or escalation of war or hostilities, the threat or possibility of war, terrorism or other global or national unrest, political or financial instability and other matters that influence spending by our customers. Increasing volatility in financial markets may cause these factors to change with a greater degree of frequency or increase in magnitude. In the past, a negative growth economic environment has had a detrimental impact on our business, results of operations and financial condition, and a return to a negative growth economic environment may have similarly detrimental effects on our business, results of operations and financial condition.
A substantial decrease in the price of steel could significantly lower our profitability.
Our products are manufactured from steel, primarily HRC, and as a result, our business is significantly affected by the price and supply of steel. When steel prices are lower, the prices that we charge customers for products may decline, which affects our gross profit. At times, pricing and availability of steel can be volatile due to numerous factors beyond our control, including general domestic and international economic conditions, global capacity, import levels, fluctuations in the costs of raw materials necessary to produce steel, sales levels, competition, consolidation of steel producers, labor costs, import duties and tariffs and foreign currency exchange rates. This volatility can significantly affect the availability and cost of steel. Because of this historical volatility, we are unable to predict whether the significant increases in steel prices over the past few years will continue or be sustained, and our business could be adversely affected if the trend reversed and steel prices declined, especially if the decline was significant or sudden. When steel prices decline, customer demands for lower prices and our competitors’ responses to those demands could result in lower sale prices, lower volume, and consequently, lower profitability.
If steel prices rise, we may be unable to pass along the cost increases to our customers.
We maintain inventories of steel to accommodate the lead time requirements of the products we produce for our customers. Accordingly, we purchase steel in an effort to maintain our inventory at
| 27 |
Table of Contents
Confidential Treatment Requested Pursuant to 17 C.F.R. Section 200.83
levels that we believe to be appropriate to satisfy the anticipated needs of our customers based upon historic buying practices and market conditions. If steel prices rise, demand for our products, the actions of our competitors and other factors will influence whether we will be able to pass such steel cost increases on to our customers. If we are unsuccessful in passing such steel cost increases to our customers, our profitability will decrease. There could also be a time lag between when changes in prices we pay to purchase steel from suppliers are effective and the point when we can implement corresponding changes under our sales price lists with our customers. As a result, we have unhedged exposure to fluctuations in raw materials prices, as we may temporarily bear the additional cost of higher prices while negotiating new purchase prices. Further, although we seek to pass through prices to our customers, we are not always able to do so. In periods of significant or rapid increases in steel prices, it could be especially challenging to pass on our increased costs in a complete or timely manner.
We may be unable to compete successfully with other companies in our industry.
We sell products in competitive markets. Our revenues and earnings could be adversely affected by competitive actions such as price reductions, improved delivery and other actions by competitors. Our business, results of operations and financial condition could be materially and adversely affected to the extent that our competitors are successful in reducing our customers’ purchases of products from us or by decreasing prices in our market place. Competition could also cause us to lower our prices, which could reduce our profitability.
Increased imports of steel products into the United States and Canada could negatively affect demand for our products and adversely impact our business and profitability.
We compete against imported steel products in our markets, and new domestic or international competitors could enter our geographic and product markets. Our foreign competitors may have lower labor and raw material costs, lower environmental and other standards, and some are owned, controlled and/or subsidized by their governments, which allows their production and pricing decisions to be influenced by political and economic policy considerations as well as prevailing market conditions. These factors and significant global overcapacity in recent years have led to high levels of steel imports. Increases in levels of imported steel products to the United States and Canada could reduce future market prices and negatively affect demand for our products, which would adversely impact our business, results of operations and financial condition.
Trade cases, tariffs, quotas, revisions to trading regimes or other systems of regulation could have adverse and unintended consequences within the steel and tube industry or our target end markets.
There is no assurance that the ongoing implementation of trade sanctions against unfairly traded steel in connection with Section 232 of the Trade Expansion Act of 1962 (“Section 232”) or other duties on imports of certain steel products will be continued in the future or that they will not have unintended consequences. If these sanctions and other duties are delayed, reduced or rescinded, or significant exemptions are granted, imports of steel products may continue to increase or remain at high levels and continue to create competitive and pricing challenges for our business. We are also unable to predict how other countries will respond to the recent actions under Section 232 or future trade actions or the effects that any retaliatory actions might have on market conditions within both the steel and steel pipe and tube industry, our target end markets and in the North American economy generally. In addition to these trade sanction and duty issues, there is uncertainty about certain bilateral or multi-lateral trade agreements and treaties upon which we rely, particularly the North American Free Trade Agreement (“NAFTA”). Despite recent negotiations, it remains unclear whether significant changes will be made to NAFTA, it will be replaced or even terminated. If NAFTA is revised or replaced in a manner that restricts trade between the United States and Canada, or is terminated entirely, our business could
| 28 |
Table of Contents
Confidential Treatment Requested Pursuant to 17 C.F.R. Section 200.83
be adversely affected. Given the ongoing and developing nature of these issues, we cannot provide any assurance as to the ultimate impact to our business.
We generally do not obtain long-term volume purchase commitments from customers and, therefore, cancellations, reductions in production quantities and delays in production by our customers could reduce our operating results and cash flows.
We generally do not obtain firm, long-term purchase commitments from our customers. Customers may cancel, reduce or delay their orders for various reasons, including planned changes in their inventory levels. Order cancellations, reductions or delays by a significant customer or by a group of customers have harmed and could continue to harm our operating results and cash flows. In addition, we make significant decisions, including determinations regarding the level of business we will seek and accept, production schedules, component procurement commitments, personnel needs and other resource requirements, based on our estimates of customer requirements. The short-term nature of our customers’ commitments and the likelihood of rapid changes in demand for their products impair our ability to estimate our future customer requirements accurately. As a consequence of the above factors, many of which are beyond our control and difficult to predict, our ability to plan is limited and our operating results and cash flows may vary significantly from our expectations.
Our customers are increasingly looking to rely on a smaller number of suppliers to meet their product needs. If we are not able to provide them with a particular product, they may transfer their purchases to one of our competitors.
We sell our products primarily through distributors. The distribution channels for our products have experienced, and are continuing to experience, extensive consolidation. One of the results of this consolidation is that many distributors prefer to source multiple products from a more limited number of suppliers. Based on the range of products we currently produce, our customers may need to go to multiple sources to obtain all of their product needs. If our customers are able to locate a supplier with a broader product offering, they may choose to purchase some or all of their product needs from that supplier rather than from us, which could adversely affect our business, results of operations and financial condition. In addition, we may need to make significant investments to continue to broaden our product offerings and remain competitive if the market continues to consolidate or to otherwise meet customer demands, and there can be no assurance such investments would be successful.
Thenon-residential construction industry is cyclical and affects market conditions for our products.
Many of our products are used innon-residential construction and, therefore, our net sales and earnings are strongly influenced bynon-residential construction activity, which historically has been cyclical. In the past, a slow-growth economic environment has affected thenon-residential construction industry and, therefore, has caused a decline in the demand for our products. A return to a slow-growth or recessionary environment, or a decline or stagnation of growth innon-residential construction activity, would adversely affect our business.
We face risks related to our suppliers, including cost increases and a reliance on steel made in the United States, which may adversely affect our profitability and our business.
We may face supply cost increases due to, among other things, increases in the cost of raw materials or transportation. Our inability to pass the cost increases on to our customers could have a material adverse effect on our business, results of operations and financial condition. If supply costs increase, our customers may elect to purchase smaller amounts of products or may purchase products from our domestic or foreign competitors. In addition, to the extent that competition leads to reduced purchases of products from us or a reduction of our prices, and such reductions occur concurrently
| 29 |
Table of Contents
Confidential Treatment Requested Pursuant to 17 C.F.R. Section 200.83
with increases in the prices for selected raw materials which we use in our operations, including steel, the adverse effects described above would likely be exacerbated and could result in a prolonged downturn in profitability.
We purchase most of our steel from a limited number of steel suppliers. Termination of one or more of our relationships with any of these major suppliers could have a negative effect on our business if we were unable to obtain steel at comparable prices from other sources in a timely manner or at all.
The number of available steel suppliers could be reduced in the future by industry consolidation or bankruptcies. A smaller number of suppliers increases the risk of supply disruption due to factors such as mill outages, labor issues, strikes or planned reductions of steel production. We have no long-term supply commitments with our steel suppliers. Interruptions or reductions in our supply of steel could make it difficult to satisfy our customers’ delivery requirements for our products. Much of the steel we purchase is made in the United States. Our heavy reliance on United States steel suppliers may adversely affect our business, results of operations and financial condition if our United States steel supply is disrupted or becomes subject to cost increases.
The loss of third party transportation providers upon whom we depend, or conditions negatively affecting the transportation industry, could increase our costs or cause a disruption in our operations.
We depend upon third party transportation providers for delivery of products to our customers. Strikes, slowdowns, transportation disruptions or other conditions in the transportation industry including, but not limited to, shortages of truck drivers, disruptions in rail service, increases in fuel prices, adverse weather conditions and traffic delays at the United States or Canadian borders could increase our costs and disrupt our operations and our ability to service our customers on a timely basis.
We may not be able to accurately forecast demand for our products.
We order raw materials and supplies and plan production based on discussions with our customers and internal forecasts of demand. If we are unable to accurately forecast demand for our products, in terms of both overall volume and specific products, we may experience delayed product shipments and customer dissatisfaction which could have an adverse impact on our business, results of operations and financial condition.
Changes in our customer and product mix could cause our gross margin percentage to fluctuate.
From time to time, we may experience changes in our customer mix and in our product mix. Changes in our customer mix may result from geographic expansion, daily selling activities within current geographic markets and targeted selling activities to new customer segments. Changes in our product mix may result from marketing activities to existing customers and needs communicated to us from existing and prospective customers. If customers begin to require more lower-margin products from us and fewer higher-margin products, our business, results of operations and financial condition may be adversely affected.
We may be unable to successfully execute or effectively integrate strategic acquisitions.
We selectively pursue strategic acquisitions, which may involve numerous risks and uncertainties, including competition for suitable acquisition targets, the potential unavailability or unfavorable terms of debt, equity or other financing sources necessary to consummate an acquisition and increased
| 30 |
Table of Contents
Confidential Treatment Requested Pursuant to 17 C.F.R. Section 200.83
financial leverage due to the additional debt financing that may be required to complete an acquisition. Upon completion of an acquisition, the integration of newly acquired entities may involve significant difficulties, such as the failure to achieve cost savings or other financial or operating objectives and/or the failure to implement our information systems in a timely and appropriate manner, and may divert management’s attention from the ongoing operations of our business. Additionally, we may face difficulties in integrating and retaining customers. The failure to manage acquisition growth risks could have a material adverse effect on our business, results of operations and financial condition.
We are subject to strict environmental, health and safety laws and regulations that could lead to significant liabilities.
We are subject to a variety of federal, state, local, foreign and provincial environmental, health and safety laws and regulations, including those governing the discharge of pollutants into the air or water, the management, storage and disposal of, or exposure to, hazardous substances and wastes, the responsibility to investigate and clean up contamination, and occupational health and safety. Fines and penalties may be imposed fornon-compliance with applicable environmental, health and safety requirements and the failure to have or to comply with the terms and conditions of required permits. The failure by us to comply with applicable environmental, health and safety requirements or the release of hazardous materials could result in fines, penalties, enforcement actions, third party claims for property damage and personal injury, requirements to clean up property or to pay for the costs of cleanup, or regulatory or judicial orders requiring corrective measures, including the installation of pollution control equipment or other remedial actions.
Under certain laws and regulations, such as the Comprehensive Environmental Response, Compensation, and Liability Act of 1980, as amended (“CERCLA”), the obligation to investigate and remediate contamination at a facility may be imposed on current and former owners or operators or on persons who may have sent waste to that facility for disposal. Liability under these laws and regulations may be without regard to fault or to the legality of the activities giving rise to the contamination. If we become subject to litigation against us under the CERCLA or its state or provincial equivalents, we could incur material costs to investigate and remediate contamination at our current and former facilities. Moreover, we may incur liabilities in connection with environmental conditions currently unknown to us relating to our existing, prior or future sites or operations, or those of predecessor companies whose liabilities we may have assumed or acquired.
In addition, environmental, health and safety laws and regulations applicable to our business and the business of our customers, and the interpretation or enforcement of these laws and regulations, are constantly evolving and it is impossible to predict accurately the effect that changes in these laws and regulations, or their interpretation or enforcement, may have upon our business, results of operations or financial condition. Legislation and regulations limiting emissions of greenhouse gases are at various stages of consideration and implementation, and if fully implemented, could negatively impact the market for and costs of our products. Should environmental laws and regulations, or their interpretation or enforcement, become more stringent, our costs could increase, which may have a material adverse effect on our business, results of operations and financial condition.
We rely upon third parties for our supply of energy resources consumed in the manufacture and transport of our products.
We purchase part of our natural gas and electricity on a spot-market basis. The prices for and availability of electricity and natural gas are subject to volatile market conditions. These market conditions are often affected by political and economic factors beyond our control, such as supply and demand for fuel, greenhouse gas regulation or legislation and imposition of further taxes on energy, any of which could lead to an increase in energy prices. Disruptions in the supply of energy resources could temporarily impair both our and our customers’ ability to manufacture products. Further,
| 31 |
Table of Contents
Confidential Treatment Requested Pursuant to 17 C.F.R. Section 200.83
increases in energy costs that cannot be passed on to our customers, or changes in costs relative to energy costs paid by competitors, have adversely affected, and may continue to adversely affect, our profitability. Although we have secured some of our natural gas and electricity under fixed price commitments or long-term contracts with suppliers, future increases in fuel and utility prices, or disruptions in energy supply, may have an adverse effect on our financial position, results of operations and financial condition.
Additionally, our operating costs increase when energy or freight costs rise. During periods of increasing energy and freight costs, we might not be able to fully recover our operating cost increases through price increases without reducing demand for our products. In addition, we are dependent on third party freight carriers to transport many of our products, all of which are dependent on fuel to transport our products. The prices for and availability of electricity, natural gas, oil, diesel fuel and other energy resources are subject to volatile market conditions. These market conditions often are affected by political and economic factors beyond our control. Disruptions in the supply of energy resources could temporarily impair the ability to manufacture products for customers and may result in the decline of freight carrier capacity in our geographic markets, or make freight carriers unavailable. Further, increases in energy or freight costs that cannot be passed on to customers, or changes in costs relative to energy and freight costs paid by competitors, has adversely affected, and may continue to adversely affect, our profitability.
We may not have adequate insurance for potential liabilities, including liabilities arising from litigation.
In the ordinary course of business, we have in the past and may in the future become the subject of various claims, lawsuits and administrative proceedings seeking damages or other remedies concerning our operations, products, employees and other matters. Some of these claims may relate to the activities of businesses that we have acquired, even though these activities may have occurred prior to our acquisition of such businesses. Defects in the products we make could result in death, personal injury, property damage, pollution or damage to equipment and facilities. Actual or claimed defects in the products we make may give rise to claims against us for losses and expose us to claims for damages.
We maintain insurance to cover certain of our potential losses. It is possible, however, that judgments could be rendered against us in cases in which we would be uninsured or beyond the amounts that we currently have reserved or anticipate incurring for such matters. Even a partially uninsured claim, if successful and of significant size, could have a material adverse effect on our business, results of operations and financial condition. Furthermore, we may not be able to continue to obtain insurance on commercially reasonable terms in the future, and we may incur losses from interruptions of our business that exceed our insurance coverage. Finally, in cases where we maintain insurance coverage, our insurers may raise various objections and exceptions to coverage which could make uncertain the timing and amount of any possible insurance recovery.
We may be subject to personal injury, product liability and environmental claims involving allegedly defective products.
Certain of the products we manufacture are used in potentially hazardous applications that can result in personal injury, product liability and environmental claims. A catastrophic occurrence at a location where our products are used may result in us being named as a defendant in lawsuits asserting potentially large claims and applicable law may render us liable for damages without regard to negligence or fault. There is no assurance that our insurance coverage will be adequate to cover the claims and our insurance does not provide coverage for all liabilities.
| 32 |
Table of Contents
Confidential Treatment Requested Pursuant to 17 C.F.R. Section 200.83
Our operations present significant risk of injury or death.
Because of the nature of industrial activities conducted at our facilities, there exists a risk of injury or death to our employees or other visitors, notwithstanding the substantial safety precautions we take. Our operations are subject to regulation by national, state and local agencies responsible for employee health and safety, which have from time to time levied fines against us for certain isolated incidents. While such fines have not been material and we have in place policies designed to minimize such risks and certain insurance policies to help avoid material adverse costs, we may nevertheless be unable to avoid material liabilities for any employee death or injury that may occur in the future, and any such incidents may materially adversely impact our reputation.
We may face risks related to labor shortages, labor costs and collective bargaining agreements, which may negatively impact our business, results of operations and financial condition.
Labor shortages and increased labor costs could negatively impact our business. A shortage of skilled labor or qualified sales personnel could pose a risk to achieving optimal labor productivity and competitive costs, which could adversely affect our profitability. In the event that we experience a shortage of skilled labor or qualified sales personnel or we are unable to train the necessary number of skilled laborers, there could be an adverse impact on our labor productivity and costs and our ability to expand production which could have a material adverse effect on our business, results of operations and financial condition.
In addition, a substantial portion of our work force is covered by collective bargaining agreements. Generally, collective bargaining agreements that expire may be terminated after notice by the union. After termination, the union may authorize a strike, work stoppage or other slowdown. A strike, work stoppage or other slowdown by the employees covered by one or more of the collective bargaining agreements could have a material adverse effect on our operating results. There can be no assurance that we will succeed in concluding collective bargaining agreements with the unions to replace those that expire. Failure to renew or reach acceptable new collective bargaining agreements could result in work stoppages or other labor disruptions, which could adversely affect our business, results of operations and financial condition.
If we lose any of our key personnel, we may be unable to effectively manage our business or continue our growth.
Our future performance depends to a significant degree upon the continued contributions of our management team, particularly our executive leadership team, and our ability to attract, hire, train and retain qualified managerial personnel. The loss or unavailability to us of any member of our management team could have a material adverse effect on our business, results of operations and financial condition to the extent we are unable to timely find an adequate replacement. We face competition for these professionals from our competitors, our customers and other companies operating in our industry. We may be unsuccessful in attracting, hiring, training and retaining qualified personnel, and our business, results of operations and financial condition could be materially and adversely affected under such circumstances.
Our products have a limited marketing area due to the cost of product transportation.
Our products have limited geographic markets, which may adversely affect our ability to grow our net sales. Because of the size and weight of steel pipe and tubing and the resulting costs of transportation and price competition, it is generally not cost effective for us to ship these products beyond a certain distance. Combined with customers’ short lead-time requirements, this limits the market for our products and our ability to grow net sales and exposes us to risks associated with economic and end market conditions in those areas. If the geographic markets we serve experience
| 33 |
Table of Contents
Confidential Treatment Requested Pursuant to 17 C.F.R. Section 200.83
economic challenges, or concentration of end market industries migrates away from those areas, our business could be adversely affected and we could be required to make significant investments to attempt to reach new markets.
We are subject to business interruptions that may materially adversely affect our business.
Our operations may be materially adversely affected by events such as explosions, fires, natural disasters, inclement weather, accidents, equipment failures, information technology systems and process failures, electrical blackouts or outages, transportation interruptions and supply interruptions. Our manufacturing processes depend on production mills and related equipment, which are occasionally out of service as a result of mechanical failures. We may experience extended plant shutdowns or periods of reduced production as a result of equipment failures. Interruptions in our production capabilities will increase production costs and reduce our net sales and earnings. Furthermore, any interruption in production capability may require us to make capital expenditures to remedy the situation, which could have a negative effect on our cash flows. In addition to equipment failures, our facilities are also subject to the risk of catastrophic loss due to unanticipated events such as fires, loss of energy, explosions, natural disasters and adverse weather conditions. Any of these events may interfere with our ability to produce or ship our products and our business, results of operations and financial condition could be materially and adversely affected.
We face risks associated with our information technology and cybersecurity threats.
We rely on information technology systems in all aspects of our business, including manufacturing and transportation of our products, management of supplier and customer relationships and various corporate, human resources and finance functions. We also collect and store sensitive data, and our suppliers and other service providers may also collect and store sensitive data about us. As a result, we face risks of technology failures, cyberattacks and other vulnerabilities. Cybersecurity threats have increased in number and sophistication. We may need to incur significant costs to maintain the reliability and security of our systems and data, and there can be no assurance we will be successful. If we experience a failure or interruption in the functioning of our information technology systems, whether due to technology or infrastructure failure, natural disaster, cyberattack or otherwise, we could be unable to meet our customer requirements and our reputation, results of operation and financial condition could be adversely affected. Furthermore, if we suffer a loss of or unauthorized access to sensitive data, whether through cyberattack or other breach or failure of our systems, we could face regulatory actions and litigation costs, as well as reputational damage, and our business, results of operations and financial condition could be adversely affected.
International markets expose us to certain risks.
We conduct operations outside of the United States. For the LTM Period, international sales represented approximately 14% of our net sales from continuing operations, the majority of which was generated in Canada. These international operations expose us to certain risks, including:
| • | local economic conditions; |
| • | inflation; |
| • | changes in or interpretations of foreign regulations; |
| • | exposure to currency fluctuations; |
| • | the status of trade agreements and potential imposition of trade or foreign exchange restrictions or increased tariffs; |
| • | changes and limits in export and import controls; |
| • | difficulty in staffing, developing and managing foreign operations; |
| 34 |
Table of Contents
Confidential Treatment Requested Pursuant to 17 C.F.R. Section 200.83
| • | potentially longer payment cycles; |
| • | national and regional labor strikes; |
| • | increased costs in maintaining international manufacturing and marketing efforts; and |
| • | changes in taxation. |
These risks could have a material adverse effect on our business and results of operations and financialcondition.
We are subject to currency fluctuations from our international sales, which can negatively impact our reported earnings.
We sell our products in Canada and other countries around the world. Approximately 14% of our LTM Period net sales from continuing operations were generated by export demand or foreign markets and were often denominated in foreign currencies, mainly the Canadian dollar. Because our financial statements are denominated in U.S. dollars, fluctuations in currency exchange rates between the U.S. dollar and the Canadian dollar have and will continue to have an impact on our reported earnings. If the U.S. dollar weakens or strengthens versus the Canadian dollar, the result will be an increase or decrease in our reported net sales and earnings, respectively. Currency fluctuations have affected our financial performance in the past and may affect our financial performance in any given period.
We also face risks arising from the imposition of foreign exchange controls and currency devaluations, and these actions could have a material adverse effect on our results of operations and financial condition in any given period.
Our international operations require us to comply with anti-corruption laws and regulations of the United States government and various international jurisdictions in which we do business, and violations of these laws and regulations could materially adversely affect our reputation, business, financial condition and results of operations.
Doing business on an international basis requires us, our subsidiaries, and our joint ventures to comply with the laws and regulations of the United States government and various international jurisdictions, and the failure to successfully comply with these rules and regulations may expose us and our subsidiaries to liabilities. These laws and regulations apply to companies, individual directors, officers, employees and agents, and may restrict our operations, trade practices, investment decisions and partnering activities. In particular, our international operations are subject to U.S. and foreign anti-corruption laws and regulations, such as the Foreign Corrupt Practices Act (“FCPA”). The FCPA prohibits us from providing anything of value to foreign officials for the purposes of influencing official decisions or obtaining or retaining business or otherwise obtaining favorable treatment, and requires us to maintain adequate record-keeping and internal accounting practices to accurately reflect our transactions.
As part of our business, we and our subsidiaries may deal with state-owned business enterprises, the employees and representatives of which may be considered foreign officials for purposes of the FCPA. In addition, some of our international operations may be subject to legal and regulatory regimes that differ from those in the United States. We maintain policies and procedures designed to assist us and our subsidiaries and our respective employees in complying with our code of conduct and applicable laws and regulations. However, we cannot assure you that our policies and procedures have been or will be effective to prevent us, our subsidiaries or our respective employees from violating any laws and regulations.
We are exposed to the risk and consequences of violations of anti-corruption laws. Violations of these legal requirements are punishable by criminal fines and imprisonment, civil penalties,
| 35 |
Table of Contents
Confidential Treatment Requested Pursuant to 17 C.F.R. Section 200.83
disgorgement of profits, injunctions and/or debarment from government contracts as well as other remedial measures, and could materially adversely affect our reputation, business, financial condition and results of operations.
We may need additional capital in the future and it may not be available on acceptable terms.
We may require more capital in the future to:
| • | fund our operations, including working capital requirements; |
| • | finance investments in equipment and infrastructure needed to maintain and expand our manufacturing capabilities; |
| • | enhance and expand the range of products we offer; and |
| • | respond to potential strategic opportunities, such as investments, acquisitions and international expansion. |
We cannot assure you that additional financing will be available on terms favorable to us, or at all. The terms of available financing may place limits on our financial and operating flexibility. If adequate funds are not available on acceptable terms, we may be forced to reduce our operations or delay, limit or abandon expansion opportunities. Moreover, even if we are able to continue our operations, restrictions imposed upon us by our financing sources or the failure to obtain additional financing could reduce our competitiveness.
If we were to lose order volumes from any of our largest customers, our sales volumes, net sales and cash flows would be reduced.
Our business is exposed to risks related to customer concentration. Our ten largest customers accounted for approximately 31% of our tons sold and 26% of our total net sales from continuing operations for the LTM Period. Although no individual customer accounted for more than 9% of our tons sold or 7% of our total net sales from continuing operations for the LTM Period, a significant downturn in the business or financial condition of one or more of our significant customers exposes us to the risk of default on contractual agreements and trade receivables. If we are unable to successfully maintain our sales relationships with our customers on terms as favorable as our existing relationships, or a material deterioration in or termination of these customer relationships occurs, and if we are not successful in replacing business lost from such customers, our business, results of operations and financial condition could be materially and adversely affected.
We are incurring and will continue to incur facility carrying costs when production capacity is temporarily idled and we face increased costs and other risks as we resume production at idled facilities.
In the past we have idled production facilities in response to economic conditions and customer demand. From the date of idling the facilities through the restart date (if applicable), we have continued to incur certain facility carrying costs which could not be eliminated even though the facilities were idled, resulting in overall higherper-unit production costs. Furthermore, in the past we have transferred raw materials to operating locations and delayed discretionary repair and maintenance and other expenditures at facilities that have been idled to minimize costs and preserve liquidity during the idling period. As we restart previously idled manufacturing facilities, as we have recently done in Blytheville, Arkansas, and are considering doing at our Mill Street facility in Sharon, Pennsylvania, we incur increased costs to replenish raw material inventories, prepare the previously idled facilities for operation, perform the required repair and maintenance, complete capital projects and prepare employees to return to work and safely resume production responsibilities. We also face risks in restarting facilities related to the availability of labor, the condition of previously idled equipment and
| 36 |
Table of Contents
Confidential Treatment Requested Pursuant to 17 C.F.R. Section 200.83
the potential for unanticipated events that could create additional costs or delays. When we idle or restart a facility, we may also make other investments to other facilities to optimize and rationalize our production mix across our facilities and markets. Decisions to restart and optimize facilities are based on various assumptions about future market conditions and demand, and there can be no assurance that these assumptions will prove accurate and that investments in restarting and optimizing facilities will be successful.
We face risks associated with construction and production optimization and modernization activities.
As described in “Business—Growth Strategy,” we are planning or considering various construction and other investments to our facilities to grow and optimize and modernize capacity. There are risks and uncertainties inherent in these activities, such as delays, cost overruns, accidents and regulatory and permitting issues, so there can be no assurance that these activities will be successful or that they will not adversely affect our results of operations or financial condition. In addition, even when these activities are completed as planned, it may take a significant amount of time for the new production capacity to be fully operational. If the market conditions change in unanticipated ways or we overestimate end-user demand, we may not be able to realize the potential benefits of these activities or achieve a satisfactory return on our investments.
Disruptions in the financial markets could have adverse effects on us, our customers and our suppliers, as access to liquidity may be negatively impacted by disruptions in the credit markets, leading to increased funding costs or unavailability of credit.
In the normal course of our business, we access credit markets for general corporate purposes, which may include repayment of indebtedness, acquisitions, additions to working capital, capital expenditures and investments in our subsidiaries. Although we believe we have sufficient liquidity to meet our current needs, our access to and the cost of capital could be negatively impacted by disruptions in the credit markets. In the past, global credit markets have experienced significant dislocations and liquidity disruptions, and uncertainty in the credit markets may make financing terms for borrowers unattractive or unavailable. These factors may make it more difficult or expensive for us to access credit markets to meet our needs. In addition, these factors may make it more difficult for our suppliers to meet demand for their products or for prospective customers to commence new projects, as customers and suppliers may experience increased costs of debt financing or difficulties in obtaining debt financing. Past disruptions in the financial markets have had adverse effects on other areas of the economy and have led to slowdowns in general economic activity that have negatively affected our businesses. These disruptions may have other unknown adverse effects. Based on these conditions, our profitability and our ability to execute our business strategy may be adversely affected.
We have significant obligations under our employee defined benefit plans and may be required to make plan contributions in excess of current estimates.
There is a significant unfunded liability related to our employee defined benefit plans. See “Note 13—Benefit Plans” to our consolidated annual financial statements included in this prospectus for additional information with respect to these plans and their funded status. Significant changes to the assets and/or the liabilities related to these obligations as a result of changes in actuarial estimates, asset performance, interest rates or benefit changes, among other factors, could have a material impact on our financial condition and results of operations. In addition, the amounts and timing of the contributions we expect to make to our defined benefit plans reflect a number of actuarial and other estimates and assumptions with respect to our expected plan funding obligations. The actual amounts and timing of our plan contributions will depend upon a number of factors and may change from our current assumptions.
In addition, we may at any time be required to make additional accelerated plan contributions up to the full amount of our unfunded liability under our defined benefit pension plans in the United States
| 37 |
Table of Contents
Confidential Treatment Requested Pursuant to 17 C.F.R. Section 200.83
in the event the Pension Benefit Guaranty Corporation (“PBGC”) institutes proceedings to terminate the plan or in order to prevent the PBGC from doing so. The PBGC may institute proceedings to terminate a defined benefit pension plan for a number of reasons, including if it determines that a plan will be unable to pay benefits when due or if the possiblelong-run loss to the PBGC with respect to a plan may reasonably be expected to increase unreasonably if the plan is not terminated.
Our financial condition may be adversely affected to the extent that we are required to make any additional contributions to any of our defined benefit pension plans in excess of our assumptions.
At times in the past we have recognized substantial impairment charges, and we may be required to recognize additional impairment charges in the future.
Pursuant to GAAP, we are required to periodically assess the carrying value of our goodwill, other intangible assets and other long-lived assets for impairment. Disruptions to our business, end market conditions and protracted economic weakness, unexpected significant declines in operating results of reporting units, divestitures and market capitalization declines may result in additional charges for goodwill and other asset impairments.
We believe that our remaining goodwill, other intangible assets and other long-lived asset balances as of March 31, 2018 are properly valued and no additional impairments are believed to exist at this time. However, fair value determinations require considerable judgment and are sensitive to changes in underlying assumptions. Additional impairments could occur in future periods whether or not connected to our annual impairment analyses. Future impairment charges could materially affect our reported earnings in the periods of such charges and could adversely affect our results of operations and financial condition.
Regulations regarding carbon dioxide emissions, and unfavorable allocation of rights to emit carbon dioxide or other air emission related issues, as well as other environmental laws and regulations, could have a material adverse effect on our business, financial condition and results of operations.
Legislative and regulatory efforts to limit or reduce carbon dioxide and other greenhouse gas emissions could directly or indirectly affect us, our suppliers or our customers. Substantial quantities of greenhouse gases are released as a consequence of our operations. Compliance with regulations governing such emissions tend to become more stringent over time and could lead to a need for us to further reduce such greenhouse gas emissions, to purchase rights to emit from third parties, or to make other changes to our business, all of which could result in significant additional costs or could reduce demand for our products. In addition, we are a significant purchaser of energy. Legislation and regulations limiting emissions of greenhouse gases are at various stages of consideration and implementation and, if fully implemented, could negatively impact the market for and costs of our products. Existing and future regulations relating to the emission of carbon dioxide by our energy suppliers could result in materially increased energy costs for our operations, and we may be unable to pass along these increased energy costs to our customers, which could have a material adverse effect on our business, financial condition and results of operations.
A deterioration in our financial condition or a downgrade of our ratings by a credit rating agency could increase our borrowing costs, lead to our inability to access liquidity facilities, and adversely affect our business relationships.
A deterioration in our financial condition or a downgrade of our credit ratings could adversely affect our financing, limit access to the capital or credit markets or our liquidity facilities, or otherwise adversely affect the availability of new financing on favorable terms or at all, result in more restrictive covenants in agreements governing the terms of any future indebtedness that we incur, increase our borrowing costs, or otherwise impair our business, financial condition and results of operations.
| 38 |
Table of Contents
Confidential Treatment Requested Pursuant to 17 C.F.R. Section 200.83
A deterioration in our financial condition or a downgrade of our credit ratings for any reason could also increase our borrowing costs and have an adverse effect on our business relationships with customers, suppliers and hedging counterparties. Because financial strength and credit ratings are important to the availability and pricing of hedging and trading activities, any downgrade of our credit ratings or changes to our level of indebtedness may make it more difficult or costly for us to engage in these activities in the future. Our indebtedness could materially adversely affect our ability to invest in or fund our operations, limit our ability to react to changes in the economy or our industry or force us to take alternative measures.
Divestitures and discontinued operations could negatively impact our business, and contingent liabilities from business units that we sell could adversely affect our financial results.
We regularly review our operations for businesses which may no longer be aligned with our strategic initiatives and long-term objectives. In some instances, such as the classification of our EnergeX net assets and operations in Thomasville, Alabama and Welland, Ontario as “held for sale” and discontinued operations, respectively, we may discontinue certain of our operations and incur exit and restructuring costs in connection with such decision.
Divestitures pose risks and challenges that could negatively impact our business. For example, when we decide to sell a business, we may be unable to do so on satisfactory terms and within our anticipated timeframe, and even after reaching a definitive agreement to sell a business, the sale may be subject to satisfaction ofpre-closing conditions, which may not be satisfied, as well as regulatory and governmental approvals, which may prevent us from completing a transaction on acceptable terms or at all. In addition, the impact of the divestiture on our net sales and net earnings may be larger than projected, which could distract management, and disputes may arise with buyers.
Dispositions may also involve continued financial involvement, as we may be required to retain responsibility for, or agree to indemnify buyers against, contingent liabilities related to businesses sold, such as lawsuits, tax liabilities, product liability claims, pension liability, liabilities for other postemployment benefits or environmental matters. Under these types of arrangements, performance by the divested businesses or other conditions outside our control could affect our future financial results.
We are subject to tax filing requirements and audits in multiple jurisdictions, and additional income tax liabilities in excess of current estimates may negatively impact our business, results of operations and financial condition.
We operate within multiple taxing jurisdictions and are subject to tax filing requirements and audits within these jurisdictions. As of March 31, 2018, our U.S. federal tax returns are open to Internal Revenue Service (“IRS”) examination for fiscal years 2014 through 2016. With limited exceptions, we are also open to various state and local income tax examinations for fiscal years 2008 through 2016. In addition to the ongoing audits noted below, as of March 31, 2018, our Canadian federal tax returns are open to Canada Revenue Agency (“CRA”) examination for fiscal years 2015 through 2017.
During fiscal year 2013, the CRA International Audit section commenced an audit of our fiscal years 2009 through 2011. During fiscal year 2014, the CRA commenced a full scope audit of our fiscal years 2011 and 2012. Certain parts of their full scope audit were completed during fiscal years 2016 and 2017, while other aspects are ongoing. In fiscal year 2017, the CRA commenced a full scope audit of our fiscal years 2013 and 2014. We are unable to predict the potential range of tax impacts at this time.
We establish contingent liabilities for possible assessments by taxing authorities resulting from our reserve for unrecognized tax benefits including, but not limited to, deductibility of certain expenses
| 39 |
Table of Contents
Confidential Treatment Requested Pursuant to 17 C.F.R. Section 200.83
and other state and local tax matters. Tax examinations are often complex, as tax authorities may disagree with the treatment of items reported by us and may require several years to resolve. These accrued liabilities represent provisions for taxes that are reasonably expected to be incurred on the basis of available information but which are not certain. However, we may be assessed tax liabilities in excess of our current estimates, which may negatively impact our business, results of operations and financial condition.
In the United States, the Tax Cuts and Jobs Act (“Tax Reform”) was signed into law on December 22, 2017. We are still in process of evaluating the income tax effect of certain provisions included in the Tax Reform. As of March 31, 2018, we have reflected the impact of the Tax Reform on our first half of fiscal year 2018 results based on certain assumptions and the best available information, including making a provisional adjustment to our net deferred tax liability based on the new lower income tax rates and recognizing a provisional amount for the mandatory repatriation tax liability imposed under the Tax Reform. The final impact of the Tax Reform may differ from current estimates due to the issuance of technical corrections and additional interpretive guidance, changes in assumptions made by us, and actions we may take as a result of the Tax Reform.
We may not be able to successfully develop and implement new technology initiatives and other strategic investments in a timely manner.
We have invested in, and are involved with, a number of technology and process initiatives. Being at the forefront of technological development is important to remain competitive. Even if we are successful in implementing future technological development initiatives, we may not be able to bring them to market as planned before our competitors or at all, and the initiatives may end up costing more than expected. As a result, the costs and benefits from our investments in new technologies and the impact on our financial results may vary from present expectations.
Our inability to sufficiently or completely protect our intellectual property rights could adversely affect our business, prospects, financial condition and results of operations.
Our ability to compete effectively will depend on our ability to maintain the proprietary nature of the intellectual property used in our businesses. These intellectual property rights consist largely of trade-secrets andknow-how. We rely on a combination of trade secrets andnon-disclosure and other contractual agreements and technical measures to protect our rights in our intellectual property. We also depend upon confidentiality agreements with our officers, directors, employees, consultants and subcontractors, as well as collaborative partners, to maintain the proprietary nature of our intellectual property. These measures may not afford us sufficient or complete protection, and others may independently develop intellectual property similar to ours, otherwise avoid our confidentiality agreements or produce technology that would adversely affect our business, prospects, financial condition and results of operations.
Risks Related to Our Indebtedness
Our indebtedness could adversely affect our ability to raise additional capital to fund our operations, limit our ability to react to changes in the economy or our industry, expose us to interest rate risk to the extent of our variable rate debt and prevent us from meeting our debt obligations.
As of March 31, 2018, we had $1.3 billion of total indebtedness on a consolidated basis (excluding $29.1 million of letters of credit). In addition, we had $275.9 million of borrowing capacity available under our Senior Secured Revolving Credit Facility (as amended, the “Revolving Credit Facility”) (after giving effect to letters of credit). On a pro forma as adjusted basis giving effect to this offering and the application of a portion of the net proceeds thereof as described in “Use of Proceeds” and “Capitalization,” our total indebtedness on a consolidated basis as of March 31, 2018 would have been $ .
| 40 |
Table of Contents
Confidential Treatment Requested Pursuant to 17 C.F.R. Section 200.83
Our indebtedness could:
| • | limit our ability to obtain additional financing for working capital, capital expenditures, acquisitions, general corporate purposes or other purposes; |
| • | require us to dedicate a substantial portion of our annual cash flow for the next several years to the payment of interest on the indebtedness; |
| • | expose us to the risk of increased interest rates (as over the term of our debt, the interest cost on a significant portion of our indebtedness is subject to changes in interest rates); |
| • | place us at a competitive disadvantage compared to certain of our competitors who have less debt; |
| • | hinder our ability to adjust rapidly to changing market conditions; |
| • | limit our ability to secure adequate bank financing in the future with reasonable terms and conditions; |
| • | increase our vulnerability to and limit our flexibility in planning for, or reacting to, a potential downturn in general economic conditions impacting one or more of our businesses; and |
| • | limit our ability to pay dividends. |
In addition, the agreements governing our 9.875% Senior Secured Notes due 2023 (the “Senior Secured Notes”), Term Loan Facility and Revolving Credit Facility contain affirmative and negative covenants that limit our ability to engage in activities that may be in our long-term best interests. Our failure to comply with those covenants could result in an event of default which, if not cured or waived, could result in the acceleration of all of our debts.
Despite current indebtedness levels and restrictive covenants, we and our subsidiaries may incur additional indebtedness in the future. This could further exacerbate the risks associated with our substantial financial leverage.
The terms of the agreements governing our Senior Secured Notes, Term Loan Facility and Revolving Credit Facility will permit us to incur a substantial amount of additional debt, including secured debt. If new debt is added to our current debt levels, the risks that we now face as a result of our leverage would intensify.
To service our indebtedness, we will require a significant amount of cash and our ability to generate cash depends on many factors beyond our control. Our ability to refinance our indebtedness, should the need arise, also depends on many factors beyond our control.
Our ability to make cash payments on and to refinance our indebtedness, and to fund planned capital expenditures, will depend on our ability to generate significant operating cash flow in the future. This, to a significant extent, is subject to general economic, financial, competitive, legislative, regulatory and other factors that are beyond our control.
Our business may not generate sufficient cash flows from operating activities and future borrowings may not be available under our existing debt arrangements in an amount sufficient to enable us to pay our indebtedness or to fund our other liquidity needs. In such circumstances, we may need to refinance all or a portion of our indebtedness on or before maturity. We may not be able to refinance any of our indebtedness on commercially reasonable terms or at all. If we cannot service our indebtedness, we may have to take actions such as selling assets, seeking additional equity or reducing or delaying capital expenditures, strategic acquisitions, investments and alliances. Such actions, if necessary, may not be effected on commercially reasonable terms or at all. The agreements governing our Senior Secured Notes, Term Loan Facility and Revolving Credit Facility will restrict our ability to sell assets and use the proceeds from such sales.
| 41 |
Table of Contents
Confidential Treatment Requested Pursuant to 17 C.F.R. Section 200.83
If we are unable to generate sufficient cash flow or are otherwise unable to obtain funds necessary to meet required payments of principal, premium, if any, and interest on our indebtedness, or if we otherwise fail to comply with the various covenants in the instruments governing our indebtedness, we could be in default under the terms of the agreements governing such indebtedness. In the event of such default, the holders of our indebtedness could elect to declare all the funds borrowed thereunder to be due and payable, together with accrued and unpaid interest, the lenders under our Revolving Credit Facility could elect to terminate their commitments thereunder, cease making further loans and institute foreclosure proceedings against our assets, and we could be forced into bankruptcy or liquidation. If our operating performance declines, we may in the future need to obtain waivers from our lenders to avoid being in default. If we breach our covenants under our debt arrangements and seek a waiver, we may not be able to obtain a waiver from the required lenders. If this occurs, we would be in default, the lenders could exercise their rights, as described above, and we could be forced into bankruptcy or liquidation.
Borrowing availability under our Revolving Credit Facility is subject to a borrowing base limitation that fluctuates from time to time and is subject to redetermination.
Our availability under our Revolving Credit Facility could decline if the value of our borrowing base (which is calculated based on a percentage of our eligible inventory and accounts receivable) declines, the administrative agent imposes reserves in its discretion, our borrowings under the Revolving Credit Facility increase or for other reasons. The value of our borrowing base could decline if the value of our eligible inventory or accounts receivable declines due to economic or market conditions, due to working capital practices or for other reasons. If our borrowing availability is less than our outstanding borrowings under the facility, we would be required to repay borrowings and/or cash collateralize letters of credit sufficient to eliminate the deficit.
Risks Related to the Offering and Ownership of Our Class A Subordinate Voting Stock
The multiple class structure to be contained in our amended and restated certificate of incorporation will have the effect of concentrating voting control with members of the Zekelman family and limiting your ability to influence corporate matters.
Our Class B multiple voting stock has ten votes per share and our Class A subordinate voting stock has one vote per share. Entities controlled by members of the Zekelman family, including our Chairman and CEO, Barry Zekelman, and our directors Alan Zekelman and Clayton Zekelman, through ownership of shares of Class B multiple voting stock and Special Voting Shares, will together hold approximately % of the voting power of our outstanding capital stock following this offering. In addition, members of the Zekelman family will have certain director nomination rights as described under “Certain Relationships and Related Party Transactions—Stockholders Agreement.” Therefore, members of the Zekelman family will have significant influence over our management and affairs and over all matters requiring stockholder approval, including election of directors and significant corporate transactions, for the foreseeable future.
In addition, because of the10-to-1 voting ratio between our Class B multiple voting stock and Class A subordinate voting stock, the holders of Class B multiple voting stock and Special Voting Shares collectively will continue to be able to control all matters submitted to our stockholders for approval even if their stock holdings represent substantially less than 50% of the outstanding shares of our common stock. This concentrated control will limit your ability to influence corporate matters for the foreseeable future, and, as a result, the market price of our Class A subordinate voting stock could be adversely affected.
As directors, members of the Zekelman family owe fiduciary duties to our stockholders and must act in good faith in a manner they reasonably believe to be in the best interests of our stockholders. As
| 42 |
Table of Contents
Confidential Treatment Requested Pursuant to 17 C.F.R. Section 200.83
stockholders, irrespective of their controlling stockholder status, members of the Zekelman family are entitled to vote their shares in their own interests, which may differ from or conflict with the interests of our other stockholders. We cannot anticipate in what form such differing or conflicting interests may arise, and so long as these principal stockholders continue to own a significant amount of our outstanding capital stock, they will continue to have the ability to strongly influence or effectively control our decisions.
Future transfers by holders of Class B multiple voting stock, other than permitted transfers to or among family members and entities they control or to other permitted holders, will result in those shares converting to Class A subordinate voting stock, which will have the effect, over time, of increasing the relative voting power of those holders of Class B multiple voting stock who retain their Class B multiple voting stock. See “Description of Capital Stock—Class A Subordinate Voting Stock and Class B Multiple Voting Stock—Conversion of Class B Multiple Voting Stock.”
There has been no prior market for our Class A subordinate voting stock. An active market may not develop or be sustainable and investors may not be able to resell their shares at or above the initial public offering price.
There has been no public market for our Class A subordinate voting stock prior to this offering. The initial public offering price for our Class A subordinate voting stock will be determined through negotiations between the underwriters, the selling stockholders and us and may vary from the market price of our Class A subordinate voting stock following this offering. If you purchase shares of our Class A subordinate voting stock in this offering, you may not be able to resell those shares at or above the initial public offering price. An active or liquid market in our Class A subordinate voting stock may not develop after this offering or, if it does develop, it may not be sustainable.
Our stock price may be volatile, and you may be unable to sell your shares of Class A subordinate voting stock at or above the initial public offering price, if at all.
The initial public offering price for the shares of our Class A subordinate voting stock will be determined through negotiations between us, the selling stockholders and representatives of the underwriters and may not be indicative of prices that will prevail in the trading market. The market price of our Class A subordinate voting stock could be subject to wide fluctuations in response to many risk factors listed in this section, and others beyond our control, including:
| • | actual or anticipated fluctuations in our financial condition and operating results or those of similar companies; |
| • | changes in our projected operational and financial results or those of similar companies; |
| • | changes in laws or regulations applicable to us or our industry; |
| • | the commencement or conclusion of legal proceedings that involve us; |
| • | actual or anticipated changes in our growth rate relative to our competitors; |
| • | announcements of new products or services by us or our competitors; |
| • | announcements by us or our competitors of significant acquisitions, strategic partnerships, joint ventures or capital-raising activities or commitments; |
| • | additions or departures of key personnel; |
| • | issuance of new or updated research or reports by securities analysts; |
| • | the use by investors or analysts of third party data regarding our business that may not reflect our financial performance; |
| • | fluctuations in the valuation of companies perceived by investors to be comparable to us; |
| 43 |
Table of Contents
Confidential Treatment Requested Pursuant to 17 C.F.R. Section 200.83
| • | sales of our Class A subordinate voting stock; |
| • | share price and volume fluctuations attributable to inconsistent trading volume levels of our shares; |
| • | investor response to our multiple class structure; |
| • | the expiration of contractuallock-up agreements; and |
| • | general economic and market conditions. |
Furthermore, the stock markets frequently experience extreme price and volume fluctuations that affect the market prices of equity securities of many companies. These fluctuations often have been unrelated or disproportionate to the operating performance of those companies. These broad market and industry fluctuations, as well as general economic, political and market conditions such as recessions, elections, interest rate changes or international currency fluctuations, may negatively impact the market price of our Class A subordinate voting stock. If the market price of our Class A subordinate voting stock after this offering does not exceed the initial public offering price, you may not realize any return on your investment in us and may lose some or all of your investment. In the past, companies that have experienced volatility in the market price of their stock have been subject to securities class action litigation. We may be the target of this type of litigation in the future. Securities litigation against us could result in substantial costs and divert our management’s attention from other business concerns, which could harm our business.
We will have broad discretion in the use of proceeds from this offering and may invest or spend the proceeds in ways with which you do not agree and in ways that may not yield a return.
Our management has broad discretion to spend the proceeds from this offering and you may not agree with the way the proceeds are spent. The failure of our management to apply these proceeds effectively could result in unfavorable returns. This could adversely affect our business, causing the price of our Class A subordinate voting stock to decline.
Purchasers in this offering will experience immediate and substantial dilution in the book value of their investment.
The initial public offering price of our Class A subordinate voting stock is substantially higher than the net tangible book value per share of our Class A subordinate voting stock. Therefore, if you purchase our Class A subordinate voting stock in this offering, your interest will be diluted immediately to the extent of the difference between the initial public offering price per share of our Class A subordinate voting stock and the net tangible book value per share of our Class A subordinate voting stock after this offering. See “Dilution.”
Future sales and issuances of our capital stock or rights to purchase capital stock could result in additional dilution of the percentage ownership of our stockholders and could cause our stock price to decline.
We may issue additional securities following the closing of this offering. Future sales and issuances of our capital stock or rights to purchase our capital stock could result in substantial dilution to our existing stockholders. We may sell Class A subordinate voting stock, convertible securities and other equity securities in one or more transactions at prices and in a manner as we may determine from time to time. If we sell any such securities in subsequent transactions, investors may be materially diluted. New investors in such subsequent transactions could gain rights, preferences and privileges senior to those of holders of our Class A subordinate voting stock.
| 44 |
Table of Contents
Confidential Treatment Requested Pursuant to 17 C.F.R. Section 200.83
If securities or industry analysts do not publish research or publish unfavorable research about our business, our stock price and trading volume could decline.
Equity research analysts do not currently provide research coverage of our Class A subordinate voting stock, and we cannot assure you that any equity research analysts will adequately provide research coverage of our Class A subordinate voting stock after this offering. A lack of adequate research coverage may adversely affect the liquidity and market price of our Class A subordinate voting stock. To the extent we obtain equity research analyst coverage, we will not have any control of the analysts or the content and opinions included in their reports. The price of our Class A subordinate voting stock could decline if one or more equity research analysts downgrade our stock or issue other unfavorable commentary or research. If one or more equity research analysts cease coverage of our company, or fail to publish reports on us regularly, demand for our stock could decrease, which in turn could cause our stock price or trading volume to decline.
Substantial future sales of shares of our Class A subordinate voting stock could cause the market price of our Class A subordinate voting stock to decline.
Sales of a substantial number of shares of our Class A subordinate voting stock in the public market following the closing of this offering, or the perception that these sales might occur, could depress the market price of our Class A subordinate voting stock and could impair our ability to raise capital through the sale of additional equity securities. We are unable to predict the effect that such sales may have on the prevailing market price of our Class A subordinate voting stock. See “Shares Eligible for Future Sale.”
In connection with this offering, we and our executive officers, directors and existing stockholders have entered into lock-up agreements that prevent the sale or transfer of shares of our Class A subordinate voting stock for up to 180 days after the date of this prospectus, subject to waiver by Goldman Sachs & Co. LLC and customary exceptions. Following the expiration of the lock-up period, certain of such holders (including members of the Zekelman family) will enter into a registration rights agreement with us that will confer upon such holders the right, subject to certain conditions, to require us to register the sale of these shares under the federal securities laws. If this right is exercised, holders of all shares subject to a registration rights agreement will be entitled to participate in such registration. By exercising their registration rights, and selling a large number of shares, these holders could cause the prevailing market price of our common stock to decline. Approximately % of the shares of our Class A subordinate voting stock and % of the shares of our Class B subordinate voting stock outstanding following the Reorganization are subject to a registration rights agreement. See “Shares Eligible For Future Sale—Registration Rights” and “Certain Relationships and Related Party Transactions—Registration Rights Agreement”.
We will be a “controlled company” within the meaning of the rules of the , and, as a result, we will qualify for, and intend to rely on, exemptions from certain corporate governance requirements. You will not have the same protections afforded to stockholders of companies that are subject to such requirements.
Upon the completion of this offering, members of the Zekelman family will continue to control a majority of the voting power of our outstanding capital stock. As a result, we will be a “controlled company” under the corporate governance listing standards of the . As a controlled company, we are exempt from the obligation to comply with certain corporate governance requirements, including the requirements:
| • | that our Board of Directors consists of a majority of independent directors; |
| 45 |
Table of Contents
Confidential Treatment Requested Pursuant to 17 C.F.R. Section 200.83
| • | that we have a corporate governance and nominating committee that is composed entirely of independent directors with a written charter addressing the committee’s purpose and responsibilities; and |
| • | that we have a compensation committee that is composed entirely of independent directors with a written charter addressing the committee’s purpose and responsibilities. |
Accordingly, our stockholders will not have the same protections afforded to stockholders of companies that are subject to all of the ’s corporate governance requirements, which could make our Class A subordinate voting stock less attractive to investors or otherwise harm our stock price.
We will incur costs and demands upon management as a result of complying with the laws and regulations affecting public companies in the United States, which may harm our business.
We have historically operated as a private company and have not been subject to the same financial and other reporting and corporate governance requirements as a public company. After this offering, we will be required to file annual, quarterly and other reports with the U.S. Securities and Exchange Commission (“SEC”). We will need to prepare and timely file financial statements that comply with SEC reporting requirements. We will also be subject to other reporting and corporate governance requirements under the listing standards of the , the Sarbanes-Oxley Act and the Dodd-Frank Wall Street Reform and Consumer Protection Act, which will impose significant compliance costs and obligations upon us. The changes necessitated by becoming a public company will require a significant commitment of additional resources and management oversight, which will increase our operating costs. These changes will also place significant additional demands on our finance and accounting staff, which may not have prior public company experience or experience working for a newly public company, and on our financial accounting and information systems, and we may need to, in the future, hire additional accounting and financial staff with appropriate public company reporting experience and technical accounting knowledge. Other expenses associated with being a public company include increases in auditing, accounting and legal fees and expenses, investor relations expenses, increased directors’ fees and director and officer liability insurance costs, registrar and transfer agent fees and listing fees, as well as other expenses. As a public company, we will be required, among other things, to:
| • | prepare and file periodic reports, and distribute other stockholder communications, in compliance with the federal securities laws and the rules; |
| • | define and expand the roles and the duties of our Board of Directors and its committees; |
| • | institute more comprehensive compliance, investor relations and internal audit functions; and |
| • | evaluate and maintain our system of internal control over financial reporting, and report on management’s assessment thereof, in compliance with rules and regulations of the SEC and the Public Company Accounting Oversight Board. |
In particular, as a public company, the Sarbanes-Oxley Act will require us to document and test the effectiveness of our internal control over financial reporting in accordance with an established internal control framework, and to report on our conclusions as to the effectiveness of our internal controls. Likewise, our independent registered public accounting firm will be required to provide an attestation report on the effectiveness of our internal control over financial reporting pursuant to Section 404(b) of the Sarbanes-Oxley Act. In addition, we will be required under the Securities Exchange Act of 1934 (“Exchange Act”) to maintain and evaluate the effectiveness of our disclosure controls and procedures. Any failure to implement required new or improved controls, or difficulties encountered in their implementation, could harm our operating results or cause us to fail to meet our reporting obligations. If we are unable to conclude that we have effective internal control over financial
| 46 |
Table of Contents
Confidential Treatment Requested Pursuant to 17 C.F.R. Section 200.83
reporting, investors could lose confidence in the reliability of our financial statements. This could result in a decrease in the value of our Class A subordinate voting stock. Failure to comply with the Sarbanes-Oxley Act could potentially subject us to sanctions or investigations by the SEC or other regulatory authorities.
We may not pay dividends on our Class A subordinate voting stock.
Following the completion of this offering, our Board of Directors may elect, in its discretion, to pay cash dividends on our Class A subordinate voting stock. However, no decision has been made with respect to the amount and timing of dividend payments, if any. The continued operation and expansion of our business, and servicing our indebtedness, will require substantial funding. Accordingly, we cannot assure you that we will pay dividends in the future. Any determination to pay dividends in the future will be at the discretion of our Board of Directors and will depend upon results of operations, financial condition, contractual restrictions, restrictions imposed by applicable law and other factors our Board of Directors deems relevant. Under our debt agreements, we are currently restricted from paying cash dividends or making other restricted payments over certain amounts as computed and defined in our agreements, and we expect these restrictions to continue in the future. Our ability to pay dividends may also be restricted by the terms of any future credit agreement or any future debt or preferred equity securities of ours or of our subsidiaries. Accordingly, if you purchase shares in this offering, realization of a gain on your investment may depend solely on the appreciation of the price of our Class A subordinate voting stock, which may never occur.
Provisions in our corporate charter documents and under Delaware law may prevent or frustrate attempts by our stockholders to change our management or hinder efforts to acquire a controlling interest in us, and the market price of our Class A subordinate voting stock may be lower as a result.
There are provisions in our amended and restated certificate of incorporation and bylaws, as they will be in effect following this offering, that may make it difficult for a third party to acquire, or attempt to acquire, control of us. These provisions are in addition to the effects of the multiple class structure and the concentrated control by the Zekelman family described above and include provisions that:
| • | authorize the issuance of “blank check” preferred stock that our Board of Directors could use to implement a stockholder rights plan; |
| • | permit the Board of Directors to establish the number of directors and fill any vacancies and newly created directorships; |
| • | following the Automatic Conversion Date, classify our Board of Directors into three separate classes with three-year staggered terms; |
| • | following the Automatic Conversion Date, prohibit stockholders from acting by written consent or calling special meetings; and |
| • | following the Automatic Conversion Date, require super-majority voting to amend certain provisions in our amended and restated certificate of incorporation and our bylaws. |
Section 203 of the Delaware General Corporation Law may affect the ability of an “interested stockholder” to engage in certain business combinations, including mergers, consolidations or acquisitions of additional shares, for a period of three years following the time that the stockholder becomes an “interested stockholder.” An “interested stockholder” is defined to include persons owning directly or indirectly 15% or more of the outstanding voting stock of a corporation. We will elect in our amended and restated certificate of incorporation not to be subject to Section 203 of the Delaware General Corporation Law. However, our amended and restated certificate of incorporation will contain provisions that have the same effect as Section 203, except that they will provide that members of the
| 47 |
Table of Contents
Confidential Treatment Requested Pursuant to 17 C.F.R. Section 200.83
Zekelman family and their respective affiliates will not be deemed to be “interested stockholders,” regardless of the percentage of our voting stock owned by them, and accordingly will not be subject to such restrictions.
Our amended and restated bylaws will provide that the Court of Chancery of the State of Delaware will be the exclusive forum for substantially all disputes between us and our stockholders, which could limit our stockholders’ ability to choose a favorable judicial forum for disputes with us or our directors, officers or employees.
Our amended and restated bylaws will provide that the Court of Chancery of the State of Delaware is the exclusive forum for any derivative action or proceeding brought on our behalf, any action asserting a breach of fiduciary duty, any action asserting a claim against us arising pursuant to the Delaware General Corporation Law, our amended and restated certificate of incorporation or our amended and restated bylaws or any action asserting a claim against us that is governed by the internal affairs doctrine. This choice of forum provision may limit a stockholder’s ability to bring a claim in a judicial forum that it finds favorable for disputes with us or our directors, officers or other employees and may discourage these types of lawsuits.
| 48 |
Table of Contents
Confidential Treatment Requested Pursuant to 17 C.F.R. Section 200.83
SPECIAL NOTE REGARDING FORWARD-LOOKING STATEMENTS
This prospectus includes “forward-looking statements” that express our opinions, expectations, beliefs, plans, objectives, assumptions or projections regarding future events or future results. Theseforward-looking statements can generally be identified by the use offorward-looking terminology, including the terms “believes,” “estimates,” “anticipates,” “expects,” “seeks,” “projects,” “intends,” “plans,” “may,” “will” or “should” or, in each case, their negative or other variations or comparable terminology. Theseforward-looking statements include all matters that are not historical facts. They appear in a number of places throughout this prospectus and include statements regarding our intentions, beliefs or current expectations concerning, among other things, our results of operations, financial condition, liquidity, our proposed use of proceeds of this offering, prospects, growth, strategies and the industry in which we operate.
By their nature,forward-looking statements involve risks and uncertainties because they relate to events and depend on circumstances that may or may not occur in the future. Although it is not possible to identify all risks, uncertainties and other factors that may impact forward-looking statements, they include, but are not limited, to those described in “Risk Factors” and elsewhere in this prospectus and the following:
| • | the effects of general economic conditions and conditions in thenon-residential construction, infrastructure and other industries that we serve on demand for our products; |
| • | our ability to effectively respond to changes in steel prices; |
| • | competitive conditions in our industry; |
| • | the effects of current and future United States, Canadian and foreign trade and tariff actions; |
| • | levels of imports of steel products into the United States and Canada; |
| • | our ability to anticipate and successfully respond to our customers’ evolving requirements and preferences; |
| • | our ability to obtain key supplies and services, such as steel, transportation and energy, on favorable terms; |
| • | our ability to successfully acquire and integrate businesses; |
| • | our ability to successfully develop and implement new technology initiatives and other strategic endeavors; |
| • | our ability to successfully complete planned or potential construction and production optimization and modernization activities and to realize the potential benefits thereof; |
| • | our compliance with environmental, health and safety, and other applicable laws and regulations and the effects of changes in those regulations; |
| • | our exposure to potential litigation or regulatory actions; |
| • | our reliance on key managerial personnel; |
| • | the availability and cost of labor and our ability to effectively manage labor relations; |
| • | risks and uncertainties associated with operations in international markets; and |
| • | the effects of financial market conditions on our ability to obtain capital, at all or on acceptable terms. |
Those factors should not be construed as exhaustive and should be read with the other cautionary statements in this prospectus.
| 49 |
Table of Contents
Confidential Treatment Requested Pursuant to 17 C.F.R. Section 200.83
Although we base theseforward-looking statements on assumptions that we believe are reasonable when made, we caution you thatforward-looking statements are not guarantees of future performance and that our actual results of operations, financial condition and liquidity, and the development of the industry in which we operate, may differ materially from those made in or suggested by theforward-looking statements contained in this prospectus. In addition, even if our results of operations, financial condition and liquidity, and the development of the industry in which we operate, are consistent with theforward-looking statements contained in this prospectus, those results or developments may not be indicative of results or developments in subsequent periods.
Given these risks and uncertainties, you are cautioned not to place undue reliance on theseforward-looking statements. Anyforward-looking statements that we make in this prospectus speak only as of the date of those statements, and we undertake no obligation to update those statements or to publicly announce the results of any revisions to any of those statements to reflect future events or developments, except as required by law. Comparisons of results for current and any prior periods are not intended to express any future trends or indications of future performance, unless expressed as such, and should only be viewed as historical data.
| 50 |
Table of Contents
Confidential Treatment Requested Pursuant to 17 C.F.R. Section 200.83
We estimate that the net proceeds to us from the sale of shares of our Class A subordinate voting stock in this offering will be approximately $ based upon the assumed initial public offering price of $ per share, which is the midpoint of the estimated offering price range set forth on the cover page of this prospectus, and after deducting estimated underwriting discounts and commissions and estimated offering expenses payable by us. If the underwriters’ option to purchase additional shares of our Class A subordinate voting stock from us is exercised in full, we estimate that the net proceeds to us would be approximately $ , after deducting estimated underwriting discounts and commissions and estimated offering expenses payable by us. We will not receive any of the proceeds from the sale of Class A subordinate voting stock in this offering by the selling stockholders.
Each $1.00 increase or decrease in the assumed initial public offering price of $ per share, which is the midpoint of the estimated offering price range set forth on the cover page of this prospectus, would increase or decrease the net proceeds that we receive from this offering by approximately $ , assuming that the number of shares offered by us, as set forth on the cover page of this prospectus, remains the same and after deducting the estimated underwriting discounts and commissions payable by us. Similarly, each increase or decrease of 1.0 million in the number of shares of our Class A subordinate voting stock offered by us would increase or decrease the net proceeds that we receive from this offering by approximately $ , assuming the assumed initial public offering price remains the same and after deducting the estimated underwriting discounts and commissions payable by us.
We intend to use approximately $ of the net proceeds of this offering to repay a portion of our outstanding indebtedness. As of March 31, 2018, we had $1.3 billion of total indebtedness outstanding (excluding $29.1 million of letters of credit). See “Management’s Discussion and Analysis of Financial Condition and Results of Operations—Liquidity and Capital Resources” and “Note 10—Long-Term Debt” to our consolidated annual financial statements included in this prospectus.
We intend to use the remaining net proceeds we receive from this offering for general corporate purposes, including working capital, operating expenses and capital expenditures. Additionally, we may use a portion of the remaining net proceeds we receive from this offering to acquire businesses, assets, equipment, products, services or technologies. However, we do not have agreements or commitments for any material acquisitions at this time. We cannot specify with certainty the particular uses of the remaining net proceeds that we will receive from this offering. Accordingly, we will have broad discretion in using these proceeds. Pending the use of proceeds from this offering as described above, we may invest the net proceeds that we receive in this offering in short-term, investment grade, interest-bearing instruments.
| 51 |
Table of Contents
Confidential Treatment Requested Pursuant to 17 C.F.R. Section 200.83
We paid dividends to our common stockholders and the holder of our Exchangeable Shares in the amount of $20.0 million in the first quarter of fiscal year 2018 and each of fiscal years 2017, 2016 and 2015. See “Selected Historical Consolidated Financial and Other Data” for information regarding dividends per common share. In connection with these dividends, holders of options pursuant to our Second Amended and Restated Stock Option Plan (the “Option Plan”) were entitled to dividend equivalents of $1.4 million in respect of the dividend paid in the first quarter of fiscal year 2018 and $1.4 million, $1.5 million and $1.5 million in respect of the dividends paid in fiscal years 2017, 2016 and 2015, respectively. These dividend equivalents are only paid when options are vested. As of March 31, 2018, a total of $1.0 million in unpaid dividend equivalents were included in other accrued liabilities or other liabilities (depending on the expected timing of future payouts) on our consolidated balance sheet.
Following the completion of this offering, our Board of Directors may, in its discretion, elect to pay cash dividends. See “Description of Capital Stock” for further information on the respective rights of our stockholders with respect to any dividends. No decision has been made with respect to the amount and timing of dividend payments, if any. We cannot assure you that we will pay dividends in the future. Any determination to pay dividends will be at the discretion of our Board of Directors and will depend upon many factors, including our results of operations, financial condition, capital requirements, restrictions in our debt agreements and those of our subsidiaries and other factors that our Board of Directors deems relevant. Under our debt agreements, we are currently restricted from paying cash dividends or making certain other restricted payments, and we expect these restrictions to continue in the future. Our ability to pay dividends may also be restricted by the terms of any future credit agreement or any future debt or preferred equity securities of us or our subsidiaries. See “Risk Factors—Risks Related to the Offering and Ownership of Our Class A Subordinate Voting Stock—We may not pay dividends on our Class A subordinate voting stock.”
| 52 |
Table of Contents
Confidential Treatment Requested Pursuant to 17 C.F.R. Section 200.83
The following table sets forth our cash and cash equivalents and consolidated capitalization as of March 31, 2018:
| • | on an actual basis; |
| • | on a pro forma basis to reflect the completion of the Reorganization; and |
| • | on a pro forma as adjusted basis to further reflect (i) the receipt of the estimated net proceeds of this offering of approximately $ , based upon the assumed initial public offering price of $ per share, which is the midpoint of the estimated offering price range set forth on the cover page of this prospectus, and after deducting estimated underwriting discounts and commissions and estimated offering expenses payable by us and (ii) the application of approximately $ of the net proceeds of this offering to repay a portion of the outstanding indebtedness as described under “Use of Proceeds.” |
The pro forma as adjusted information below is illustrative only, and our cash and cash equivalents and capitalization following the completion of this offering will be adjusted based on the actual initial public offering price and other terms of the offering determined at the pricing of this offering. You should read this table in conjunction with the sections of this prospectus entitled “Selected Historical Consolidated Financial and Other Data,” “Management’s Discussion and Analysis
| 53 |
Table of Contents
Confidential Treatment Requested Pursuant to 17 C.F.R. Section 200.83
of Financial Condition and Results of Operations,” and our consolidated financial statements and related notes included elsewhere in this prospectus.
| As of March 31, 2018 | ||||||||||||
| Actual | Pro forma | Pro forma As Adjusted | ||||||||||
(in millions) (Unaudited) | ||||||||||||
Cash and cash equivalents | $ | 41.6 | $ | $ | (1) | |||||||
|
|
|
|
|
| |||||||
Current and long-term debt(2) | $ | 1,315.9 | $ | $ | ||||||||
|
|
|
|
|
| |||||||
Stockholders’ equity: | ||||||||||||
Common stock, $.01 par value—400,000 shares authorized, 164,644 shares issued, 24,040 shares outstanding (actual); no shares authorized or issued and outstanding (pro forma and pro forma as adjusted) | — | — | — | |||||||||
Non-voting common stock, $.01 par value—50,000 shares authorized, 10,000 shares issued, 9,361 shares outstanding (actual); no shares authorized or issued and outstanding (pro forma and pro forma as adjusted) | — | — | — | |||||||||
Preferred stock, $.01 par value—100,000 shares authorized, no shares issued and outstanding (actual); shares authorized, no shares issued and outstanding (pro forma and pro forma as adjusted) | — | — | — | |||||||||
Special voting stock, $.000001 par value—200,000 shares authorized, 122,652 shares issued and outstanding (actual); shares authorized, shares issued and outstanding (pro forma); shares authorized, shares issued and outstanding (pro forma as adjusted) | — | — | — | |||||||||
Class A subordinate voting stock, $ par value—no shares authorized or issued and outstanding (actual); shares authorized, shares issued and outstanding (pro forma); shares authorized, shares issued and outstanding (pro forma as adjusted) | — | |||||||||||
Class B multiple voting stock, $ par value—no shares authorized or issued and outstanding (actual); shares authorized, shares issued and outstanding (pro forma); shares authorized, shares issued and outstanding (pro forma as adjusted) | — | |||||||||||
Additionalpaid-in capital | $ | 467.3 | ||||||||||
Exchangeable shares in subsidiary—122,652 shares issued and outstanding (actual); shares issued and outstanding (pro forma); shares issued and outstanding (pro forma as adjusted)(3) | $ | 352.1 | ||||||||||
Retained earnings | $ | 194.8 | ||||||||||
Accumulated other comprehensive loss | ($ | 35.1 | ) | |||||||||
Treasury stock, at cost—141,243 shares (actual); no shares (pro forma and pro forma as adjusted) | ($ | 415.1 | ) | — | — | |||||||
|
|
|
|
|
| |||||||
Total stockholders’ equity | $ | 564.0 | $ | $ | ||||||||
|
|
|
|
|
| |||||||
Total capitalization | $ | 1,879.9 | $ | $ | ||||||||
|
|
|
|
|
| |||||||
| (1) | Includes proceeds of this offering not used to repay indebtedness. |
| (2) | For a description of indebtedness, see “Management’s Discussion and Analysis of Financial Condition and Results of Operations—Liquidity and Capital Resources” and “Note 10—Long-Term Debt” to our consolidated annual financial statements included in this prospectus. |
| (3) | See “Description of Capital Stock—Special Voting Shares and Exchangeable Shares.” |
| 54 |
Table of Contents
Confidential Treatment Requested Pursuant to 17 C.F.R. Section 200.83
If you invest in our Class A subordinate voting stock in this offering, your ownership interest will be diluted to the extent of the difference between the initial public offering price per share of our Class A subordinate voting stock and the pro forma as adjusted net tangible book value per share of our common stock immediately after this offering. Net tangible book value dilution per share to new investors represents the difference between the amount per share paid by purchasers of shares of our Class A subordinate voting stock in this offering and the pro forma as adjusted net tangible book value per share of our common stock immediately after completion of this offering.
Net tangible book value per share is determined by dividing our total tangible assets less our total liabilities by the number of shares of our common stock outstanding. Our pro forma net tangible book value as of March 31, 2018, was $ million, or $ per share, based on the total number of shares of our Class A subordinate voting stock and Class B multiple voting stock outstanding as of , 2018, after giving effect to the Reorganization and assuming the exchange of all Exchangeable Shares for shares of Class B multiple voting stock and cancellation without consideration of the corresponding Special Voting Shares.
After giving effect to the sale by us of shares of our Class A subordinate voting stock in this offering at the assumed initial public offering price of $ per share, which is the midpoint of the estimated offering price range set forth on the cover page of this prospectus, and after deducting estimated underwriting discounts and commissions and estimated offering expenses payable by us, our pro forma as adjusted net tangible book value as of March 31, 2018, would have been $ , or $ per share. This represents an immediate increase in pro forma net tangible book value of $ per share to our existing stockholders and an immediate dilution in pro forma net tangible book value of $ per share to investors purchasing shares of our Class A subordinate voting stock in this offering at the assumed initial public offering price. The following table illustrates this dilution:
Initial public offering price per share | $ | |||||||
Pro forma net tangible book value per share as of March 31, 2018 | $ | |||||||
Increase in pro forma net tangible book value per share attributable to new investors purchasing shares of Class A subordinate voting stock in this offering | ||||||||
|
| |||||||
Pro forma as adjusted net tangible book value per share after this offering | ||||||||
|
| |||||||
Dilution in pro forma net tangible book value per share to new investors in this offering | $ |
Each $1.00 increase or decrease in the assumed initial public offering price of $ per share, which is the midpoint of the estimated offering price range set forth on the cover page of this prospectus, would increase or decrease, as applicable, our pro forma as adjusted net tangible book value per share to new investors by $ , and would increase or decrease, as applicable, dilution per share to new investors purchasing shares of our Class A subordinate voting stock in this offering by $ , assuming that the number of shares offered by us, as set forth on the cover page of this prospectus, remains the same and after deducting estimated underwriting discounts and commissions and estimated offering expenses payable by us.
The following table presents, as of March 31, 2018, after giving effect to the Reorganization, the differences between the existing stockholders and the new investors purchasing shares of our Class A subordinate voting stock in this offering with respect to the number of shares purchased from us, the total consideration paid or to be paid to us, which includes net proceeds received from the issuance of our Class A subordinate voting stock and the average price per share paid or to be paid to us at the assumed initial public offering price of $ per share, which is the midpoint of the estimated offering
| 55 |
Table of Contents
Confidential Treatment Requested Pursuant to 17 C.F.R. Section 200.83
price range set forth on the cover page of this prospectus, before deducting estimated underwriting discounts and commissions and estimated offering expenses payable by us:
| Shares purchased | Total consideration | Average price per share | ||||||||||||||||||
| Number | Percent | Amount | Percentage | |||||||||||||||||
Existing stockholders | % | $ | % | $ | ||||||||||||||||
New investors | % | $ | % | $ | ||||||||||||||||
|
|
|
|
|
|
|
| |||||||||||||
Totals | 100 | % | $ | 100 | % | |||||||||||||||
|
|
|
|
|
|
|
| |||||||||||||
Except as otherwise indicated, the above discussion and tables assume no exercise of the underwriters’ option to purchase additional shares of our Class A subordinate voting stock from us. If the underwriters’ option to purchase additional shares of our Class A subordinate voting stock was exercised in full, our existing stockholders would own % and our new investors would own % of the total number of shares of our common stock outstanding upon completion of this offering.
| 56 |
Table of Contents
Confidential Treatment Requested Pursuant to 17 C.F.R. Section 200.83
SELECTED HISTORICAL CONSOLIDATED FINANCIAL AND OTHER DATA
The following tables set forth selected historical consolidated financial and other data.
The selected consolidated financial information presented below under the captions “Statement of operations data” and “Statement of cash flows data” for the fiscal years ended September 30, 2017, September 24, 2016 and September 26, 2015, and the selected consolidated financial information presented below under the caption “Balance sheet data” as of September 30, 2017 and September 24, 2016, have been derived from our consolidated financial statements that have been audited by Ernst & Young LLP, our independent registered public accounting firm, and are included elsewhere in this prospectus. The selected consolidated financial information presented below under the captions “Statement of operations data” and “Statement of cash flows data” for the fiscal years ended September 27, 2014 and September 28, 2013, and the selected consolidated financial information presented below under the caption “Balance sheet data” as of September 26, 2015, September 27, 2014 and September 28, 2013, have been derived from our audited consolidated financial statements that are not included in this prospectus.
The selected interim consolidated financial information presented below under the captions “Statement of operations data” and “Statement of cash flows data” for the 26 weeks ended March 31, 2018 and March 25, 2017, and the selected consolidated financial information presented below under the caption “Balance sheet data” as of March 31, 2018 have been derived from our unaudited interim consolidated financial statements that are included elsewhere in this prospectus and which have been prepared on the same basis as our audited consolidated financial statements. In the opinion of management, the interim data reflects all adjustments, consisting of normal and recurring adjustments, necessary for a fair presentation of results for these periods and such data has been prepared on the same basis as the audited financial information. Interim results may not be indicative of full year results and historical results may not necessarily be indicative of results that may be expected for any future period.
| 57 |
Table of Contents
Confidential Treatment Requested Pursuant to 17 C.F.R. Section 200.83
The selected historical consolidated financial data presented below should be read in conjunction with “Prospectus Summary—Summary Consolidated Financial and Other Data,” “Capitalization,” “Management’s Discussion and Analysis of Financial Condition and Results of Operations” and the consolidated financial statements and related notes included elsewhere in this prospectus.
| 26 Weeks Ended March 31, 2018 | 26 Weeks Ended March 25, 2017 | Year Ended September 30, 2017 | Year Ended September 24, 2016 | Year Ended September 26, 2015 | Year Ended September 27, 2014 | Year Ended September 28, 2013 | ||||||||||||||||||||||
| (unaudited) | (unaudited) | |||||||||||||||||||||||||||
| (in thousands, except share and per share amounts) | ||||||||||||||||||||||||||||
Statement of operations data: | ||||||||||||||||||||||||||||
Net sales | $ | 1,198,601 | $ | 916,675 | $ | 2,095,255 | $ | 1,554,491 | $ | 1,712,547 | $ | 1,965,989 | $ | 1,924,556 | ||||||||||||||
Cost of sales | 937,404 | 710,018 | 1,657,700 | 1,200,215 | 1,466,797 | 1,676,273 | 1,649,153 | |||||||||||||||||||||
|
|
|
|
|
|
|
|
|
|
|
|
|
| |||||||||||||||
Gross profit | 261,197 | 206,657 | 437,555 | 354,276 | 245,750 | 289,716 | 275,403 | |||||||||||||||||||||
Expenses: | ||||||||||||||||||||||||||||
Selling, general and administrative expenses | 86,402 | 69,614 | 151,317 | 130,214 | 123,103 | 128,250 | 130,832 | |||||||||||||||||||||
Transaction costs | — | 731 | 731 | — | — | — | — | |||||||||||||||||||||
Impairment of goodwill, intangible assets and fixed assets | — | — | — | — | — | 5,325 | 10,137 | |||||||||||||||||||||
Exit and restructuring costs | 108 | 1,372 | 1,873 | 1,970 | 8,771 | 635 | 3,316 | |||||||||||||||||||||
|
|
|
|
|
|
|
|
|
|
|
|
|
| |||||||||||||||
Total operating expenses | 86,510 | 71,717 | 153,921 | 132,184 | 131,874 | 134,210 | 144,285 | |||||||||||||||||||||
|
|
|
|
|
|
|
|
|
|
|
|
|
| |||||||||||||||
Operating income | 174,687 | 134,940 | 283,634 | 222,092 | 113,876 | 155,506 | 131,118 | |||||||||||||||||||||
Other expense (income), net: | ||||||||||||||||||||||||||||
Interest expense, net | 42,441 | 46,624 | 92,139 | 95,931 | 98,511 | 104,034 | 103,212 | |||||||||||||||||||||
Other expense (income), net | 4,682 | 1,702 | (7,141 | ) | 25,074 | 14,242 | 17,187 | 15,077 | ||||||||||||||||||||
|
|
|
|
|
|
|
|
|
|
|
|
|
| |||||||||||||||
Total other expense, net | 47,123 | 48,326 | 84,998 | 121,005 | 112,753 | 121,221 | 118,289 | |||||||||||||||||||||
|
|
|
|
|
|
|
|
|
|
|
|
|
| |||||||||||||||
Income from continuing operations before income taxes | 127,564 | 86,614 | 198,636 | 101,087 | 1,123 | 34,285 | 12,829 | |||||||||||||||||||||
Provision (benefit) for income taxes | 22,148 | 14,866 | 35,340 | 16,008 | (4,637 | ) | 3,295 | 7,317 | ||||||||||||||||||||
|
|
|
|
|
|
|
|
|
|
|
|
|
| |||||||||||||||
Income from continuing operations | 105,416 | 71,748 | 163,296 | 85,079 | 5,760 | 30,990 | 5,512 | |||||||||||||||||||||
|
|
|
|
|
|
|
|
|
|
|
|
|
| |||||||||||||||
(Loss) income from discontinued operations, net of income taxes | (714 | ) | 355 | (1,822 | ) | (16,580 | ) | (69,430 | ) | (26,496 | ) | (87,798 | ) | |||||||||||||||
|
|
|
|
|
|
|
|
|
|
|
|
|
| |||||||||||||||
Net income (loss) | $ | 104,702 | $ | 72,103 | $ | 161,474 | $ | 68,499 | $ | (63,670 | ) | $ | 4,494 | $ | (82,286 | ) | ||||||||||||
|
|
|
|
|
|
|
|
|
|
|
|
|
| |||||||||||||||
Net income (loss) available to common stockholders—basic(1) | $ | 15,168 | $ | 10,390 | $ | 23,487 | $ | 10,048 | $ | (9,844 | ) | $ | 696 | $ | (17,148 | ) | ||||||||||||
|
|
|
|
|
|
|
|
|
|
|
|
|
| |||||||||||||||
Net income (loss) available to common stockholders—diluted(1) | $ | 90,397 | $ | 63,398 | $ | 141,316 | $ | 59,277 | $ | (61,073 | ) | $ | 3,942 | $ | (80,197 | ) | ||||||||||||
|
|
|
|
|
|
|
|
|
|
|
|
|
| |||||||||||||||
| 58 |
Table of Contents
Confidential Treatment Requested Pursuant to 17 C.F.R. Section 200.83
| 26 Weeks Ended March 31, 2018 | 26 Weeks Ended March 25, 2017 | Year Ended September 30, 2017 | Year Ended September 24, 2016 | Year Ended September 26, 2015 | Year Ended September 27, 2014 | Year Ended September 28, 2013 | ||||||||||||||||||||||
| (unaudited) | (unaudited) | |||||||||||||||||||||||||||
| (in thousands, except share and per share amounts) | ||||||||||||||||||||||||||||
Earnings (loss) per common share—basic(1): | ||||||||||||||||||||||||||||
Continuing operations | $ | 635.20 | $ | 430.07 | $ | 987.94 | $ | 517.27 | $ | 35.44 | $ | 182.45 | $ | 7.04 | ||||||||||||||
Discontinued operations | (4.25 | ) | 2.13 | (10.94 | ) | (99.30 | ) | (444.92 | ) | (156.01 | ) | (533.86 | ) | |||||||||||||||
|
|
|
|
|
|
|
|
|
|
|
|
|
| |||||||||||||||
Net income (loss) | $ | 630.95 | $ | 432.20 | $ | 977.00 | $ | 417.97 | $ | (409.48 | ) | $ | 26.44 | $ | (526.82 | ) | ||||||||||||
|
|
|
|
|
|
|
|
|
|
|
|
|
| |||||||||||||||
Earnings (loss) per common share—diluted(1): | ||||||||||||||||||||||||||||
Continuing operations | $ | 620.49 | $ | 430.07 | $ | 974.29 | $ | 503.39 | $ | 28.59 | $ | 182.45 | $ | 7.04 | ||||||||||||||
Discontinued operations | (4.25 | ) | 2.13 | (10.94 | ) | (99.30 | ) | (444.92 | ) | (156.01 | ) | (533.86 | ) | |||||||||||||||
|
|
|
|
|
|
|
|
|
|
|
|
|
| |||||||||||||||
Net income (loss) | $ | 616.24 | $ | 432.20 | $ | 963.35 | $ | 404.09 | $ | (416.33 | ) | $ | 26.44 | $ | (526.82 | ) | ||||||||||||
|
|
|
|
|
|
|
|
|
|
|
|
|
| |||||||||||||||
Weighted average common shares outstanding—basic | 24,040 | 24,040 | 24,040 | 24,040 | 24,040 | 26,325 | 32,550 | |||||||||||||||||||||
|
|
|
|
|
|
|
|
|
|
|
|
|
| |||||||||||||||
Weighted average common shares outstanding—diluted | 146,692 | 146,692 | 146,692 | 146,692 | 146,692 | 148,977 | 156,712 | |||||||||||||||||||||
|
|
|
|
|
|
|
|
|
|
|
|
|
| |||||||||||||||
Net income (loss) available tonon-voting common stockholders—basic and diluted(1) | $ | 4,630 | $ | 4,046 | $ | 7,870 | $ | 2,636 | $ | (5,110 | ) | $ | 252 | $ | (4,915 | ) | ||||||||||||
|
|
|
|
|
|
|
|
|
|
|
|
|
| |||||||||||||||
Earnings (loss) pernon-voting common share—basic and diluted(1): | ||||||||||||||||||||||||||||
Continuing operations | $ | 498.86 | $ | 430.07 | $ | 851.66 | $ | 380.89 | $ | (100.96 | ) | $ | 182.45 | $ | (100.58 | ) | ||||||||||||
Discontinued operations | (4.25 | ) | 2.13 | (10.94 | ) | (99.30 | ) | (444.92 | ) | (156.01 | ) | (533.86 | ) | |||||||||||||||
|
|
|
|
|
|
|
|
|
|
|
|
|
| |||||||||||||||
Net income (loss) | $ | 494.61 | $ | 432.20 | $ | 840.72 | $ | 281.59 | $ | (545.88 | ) | $ | 26.44 | $ | (634.44 | ) | ||||||||||||
|
|
|
|
|
|
|
|
|
|
|
|
|
| |||||||||||||||
Weighted averagenon-voting common shares outstanding—basic and diluted | 9,361 | 9,361 | 9,361 | 9,361 | 9,361 | 9,507 | 7,747 | |||||||||||||||||||||
|
|
|
|
|
|
|
|
|
|
|
|
|
| |||||||||||||||
Cash dividends per weighted average common share | $ | 136.34 | $ | — | $ | 136.34 | $ | 136.34 | $ | 136.34 | $ | — | $ | 107.58 | ||||||||||||||
|
|
|
|
|
|
|
|
|
|
|
|
|
| |||||||||||||||
Statement of cash flows data: | ||||||||||||||||||||||||||||
Net cash provided by operating activities | $ | 55,289 | $ | 25,249 | $ | 159,045 | $ | 174,124 | $ | 202,607 | $ | 37,490 | $ | 32,517 | ||||||||||||||
Net cash used in investing activities | $ | (31,463 | ) | $ | (216,384 | ) | $ | (241,217 | ) | $ | (38,379 | ) | $ | (47,942 | ) | $ | (37,353 | ) | $ | (49,460 | ) | |||||||
Net cash (used in) provided by financing activities | $ | (6,993 | ) | $ | 178,769 | $ | 73,878 | $ | (134,333 | ) | $ | (147,726 | ) | $ | 1,543 | $ | (5,541 | ) | ||||||||||
Capital expenditures | $ | (31,482 | ) | $ | (24,043 | ) | $ | (46,815 | ) | $ | (38,398 | ) | $ | (47,114 | ) | $ | (43,959 | ) | $ | (51,067 | ) | |||||||
| 59 |
Table of Contents
Confidential Treatment Requested Pursuant to 17 C.F.R. Section 200.83
| (1) | Following this offering, our Class A subordinate voting stock and Class B multiple voting stock will have identical economic rights and both net income (loss) available to common stockholders and earnings (loss) per common share will be calculated to account for both classes. We expect to no longer present separate line items for two classes of common stock as we have historically. |
| March 31, 2018 | September 30, 2017 | September 24, 2016 | September 26, 2015 | September 27, 2014 | September 28, 2013 | |||||||||||||||||||
| (unaudited) | ||||||||||||||||||||||||
| (in thousands) | ||||||||||||||||||||||||
Balance sheet data: | ||||||||||||||||||||||||
Cash and cash equivalents | $ | 41,564 | $ | 29,201 | $ | 36,721 | $ | 35,200 | $ | 23,478 | $ | 44,453 | ||||||||||||
Total assets, including amounts held for sale | $ | 2,368,548 | $ | 2,284,805 | $ | 1,957,389 | $ | 1,980,416 | $ | 2,370,188 | $ | 2,365,063 | ||||||||||||
Operating working capital(1) | $ | 539,787 | $ | 447,907 | $ | 252,389 | $ | 234,416 | $ | 378,495 | $ | 297,016 | ||||||||||||
Total debt, including current portion | $ | 1,315,874 | $ | 1,299,338 | $ | 1,199,483 | $ | 1,287,581 | $ | 1,412,898 | $ | 1,369,251 | ||||||||||||
Total liabilities, including amounts held for sale | $ | 1,804,572 | $ | 1,808,505 | $ | 1,636,687 | $ | 1,679,018 | $ | 1,987,051 | $ | 1,931,237 | ||||||||||||
Total stockholders’ equity | $ | 563,976 | $ | 476,300 | $ | 320,702 | $ | 301,398 | $ | 383,137 | $ | 433,826 | ||||||||||||
| (1) | Operating working capital is a financial metric used by management, calculated as accounts receivable, net, plus inventories, net, less accounts payable. |
| 60 |
Table of Contents
Confidential Treatment Requested Pursuant to 17 C.F.R. Section 200.83
MANAGEMENT’S DISCUSSION AND ANALYSIS
OF FINANCIAL CONDITION AND RESULTS OF OPERATIONS
You should read the following discussion and analysis of our financial condition and results of operations in conjunction with our consolidated financial statements and related notes included elsewhere in this prospectus. This discussion and analysis containsforward-looking statements that involve risks, uncertainties and assumptions. Our actual results may differ materially from those anticipated in theseforward-looking statements as a result of a number of factors, including, but not limited to, those set forth under “Special Note RegardingForward-Looking Statements,” “Risk Factors” and elsewhere in this prospectus. Unless otherwise noted, all information in this discussion and analysis of our financial condition and results of operations excludes discontinued operations and reflects continuing operations only.
Overview
Zekelman Industries is a leading North American manufacturer of industrial steel pipe and tube products with over 100 years of operating experience. We have 13 pipe and tube production facilities in seven U.S. states and one Canadian province, with total production of approximately 2.1 million tons from our continuing operations for the LTM Period. We offer a broad array of products marketed under the Atlas, Wheatland, Sharon Tube, Western Tube & Conduit and Picoma brands. The majority of our products are used in infrastructure andnon-residential construction applications. We also supply products for use in the fabrication, automotive, oil and gas, agricultural and industrial equipment and retail end markets. We manufacture many of our products to operate under specialized conditions, including in load-bearing, high-pressure, corrosive and high-temperature environments.
For the LTM Period, approximately 86% of our net sales from continuing operations was generated in the United States, the balance of which was primarily generated in Canada.
Key Factors Affecting Our Results
Our results are primarily derived from the sale of steel pipe and tube products to various infrastructure andnon-residential end markets in the United States and Canada. Our business is therefore dependent upon construction activity in these sectors of the economy. The historical performance and outlook for our business is influenced by numerous factors, including the following:
| • | Fluctuations in Prices of Steel and Other Costs—Fluctuations in steel prices can lead to volatility in the pricing of our products, which influences the buying patterns of our customers. Because the cost of steel represents over half of our total operating costs, higher or lower cost steel affects our gross margins. Increases in the market price of steel typically enable us to raise our selling prices. To a lesser extent, our gross margins and selling prices can also be impacted by the prices of other raw materials (such as zinc), transportation and labor. |
| • | Economic Cycles—In addition to fluctuations in steel prices, demand for the products we manufacture is dependent on general economic cycles and infrastructure andnon-residential construction end markets. |
| • | Inventory Levels—Customer and other manufacturer inventory levels of steel pipe and tube products can change significantly from period to period. During periods of rising steel prices, our customer base has demonstrated the desire to build inventory levels. During periods of decreasing steel prices, our customer base typically reduces inventory levels. We use a number of supply chain and inventory management techniques to help us mitigate the effect of these fluctuations. |
| 61 |
Table of Contents
Confidential Treatment Requested Pursuant to 17 C.F.R. Section 200.83
| • | General Competition—We sell products in competitive markets. Our business could be adversely affected by competitors who reduce prices, improveon-time delivery and take other competitive actions, which may reduce our customers’ purchases of products from us. |
| • | Foreign Competition—Several of our products have historically faced significant competition from foreign imports, and we have successfully competed against imports with excellent customer service, high quality products and rapid fulfillment of customer orders. Foreign competition has been most significant in our standard pipe and energy tubular businesses with foreign production excluding Canada estimated to represent 47% and 53%, respectively, of volumes of tons sold in the United States for the LTM Period. At various times, we believe we have faced unfair competition due to dumping or subsidization by foreign countries. We believe that various trade cases, tariffs and quotas can improve our competitive environment. We also believe that recent developments, particularly the implementation of trade sanctions against unfairly traded steel and steel products in connection with Section 232 of the Trade Expansion Act of 1962 (“Section 232”), meaningfully enhance our competitive positioning relative to foreign sources of supply. In particular, we believe that the implementation of trade relief in connection with Section 232 (and trade deals negotiated in connection therewith) will cause foreign production to account for a lesser share of total volumes sold in the United States for the foreseeable future. Moreover, since imported products, and those in our product portfolio in particular, must be shipped long distances via ocean freight, we believe domestically produced standard pipe and energy tubular products will remain competitive with imported products, independent of Section 232 or other trade case actions. We face more limited foreign competition in our structural tubing and electrical conduit markets. |
Growth Strategy
We intend to expand our leading market positions and scale through a variety of growth initiatives, and to respond to and capitalize on strong demand for our products and sustained strength in our end markets. At present, we have identified a number of pending or potential projects to restart idled facilities, optimize existing production capacity by increasing utilization across our portfolio of manufacturing facilities, and build new capacity at our existing locations. For example, during the first quarter of fiscal year 2017, we began the process of restarting and modernizing our Blytheville, Arkansas facility and are currently increasing production of structural tubing at that facility with the expectation of reaching normal capacity and production by the end of the second quarter of fiscal year 2019, and we are engaged in, planning or considering several other optimization activities. We also believe that our industry leading scale and advantaged geographic footprint, together with our sophisticated logistics and information sharing systems and manufacturing facilities’ production flexibility, uniquely position us to optimize our capacity by rapidly responding to improving market conditions. These growth initiatives are outlined in more detail in “Business—Growth Strategy.”
Recent Acquisitions
In the second quarter of fiscal year 2017, we completed two acquisitions: Western Tube & Conduit Corporation (“Western Tube”) and American Tube Manufacturing, Inc. (“American Tube”). Western Tube is located in Long Beach, California and is a leading producer of electrical conduit, fence and mechanical tubing. The acquisition of Western Tube significantly expanded our capabilities and presence in these markets across the western half of the United States. American Tube is located in Birmingham, Alabama and is a leading producer of round, square and rectangular-shaped structural tubing. The acquisition of American Tube significantly expanded our capabilities and presence in this market across the southeastern United States.
| 62 |
Table of Contents
Confidential Treatment Requested Pursuant to 17 C.F.R. Section 200.83
Reportable Segments
We have three reportable segments:
| • | Atlas—structural tubing; |
| • | EFM—electrical conduit, fittings and couplings, fence pipe and mechanical tubing; and |
| • | Pipe—standard pipe and fire sprinkler pipe. |
In addition to our three reportable segments, our consolidated financial results include an “All Other” category, which includes our DOM tubing and energy tubular product lines and othernon-core activities that are not material enough to require separate disclosure, as well as unallocated corporate costs.
We evaluate segment performance primarily on the basis of net sales and operating income. Certain manufacturing and distribution expenses are allocated among the segments due to the sharing of manufacturing facilities and other activities.
Discontinued Operations
In the first quarter of fiscal year 2016, our Board of Directors formally approved a plan to sell our EnergeX business, which is comprised primarily of two idled manufacturing facilities in Welland, Ontario and Thomasville, Alabama. For all periods presented in our consolidated financial statements the EnergeX assets and liabilities are classified separately as “held for sale” and EnergeX’s operating results and cash flows are presented as discontinued operations.
As of March 31, 2018, the EnergeX business continues to meet the requirements for presentation as “held for sale” and discontinued operations. Market conditions in the oil and gas industry, and specifically related to OCTG, continue to affect our ability to sell the EnergeX business. Based on these changing market conditions, we have taken steps as needed to adjust our formal plan to sell EnergeX, and we continue to actively market the business at a price that we feel is reasonable based on the current circumstances. If certain events or changes in circumstances arise, such as being unable to sell our EnergeX business for a prolonged period of time, we may need to reclassify the related assets and liabilities from “held for sale” to “held and used” and change the presentation of EnergeX’s operating results and cash flows back to continuing operations.
Unless otherwise noted all information and discussion in this prospectus reflects only continuing operations.
Fiscal Year
We use a fiscal year that is a 52 or 53 week period ending on the last Saturday in September. Fiscal year 2018 will end on September 29, 2018 and will consist of 52 weeks. Fiscal year 2017 ended on September 30, 2017 and consisted of 53 weeks. Fiscal year 2016 ended on September 24, 2016 and consisted of 52 weeks. Fiscal year 2015 ended on September 26, 2015 and consisted of 52 weeks. Our fiscal quarters are all 13 or 14 week periods generally ending on the last Saturday in December, March, June and September. The second quarter and first half of fiscal year 2018 ended on March 31, 2018 and consisted of 13 weeks and 26 weeks, respectively. The second quarter and first half of fiscal year 2017 ended on March 25, 2017 and consisted of 13 weeks and 26 weeks, respectively.
| 63 |
Table of Contents
Confidential Treatment Requested Pursuant to 17 C.F.R. Section 200.83
Results of Operations
13 Weeks Ended March 31, 2018 Compared to 13 Weeks Ended March 25, 2017
The following table compares our consolidated results for the second quarter of fiscal year 2018 to the second quarter of fiscal year 2017 (dollars in thousands):
| 13 Weeks Ended | ||||||||||||||||
| March 31, 2018 | March 25, 2017 | Change | Percentage Change | |||||||||||||
Net sales | $ | 662,845 | $ | 501,174 | $ | 161,671 | 32.3 | % | ||||||||
Cost of sales | 502,875 | 370,330 | 132,545 | 35.8 | % | |||||||||||
|
|
|
|
|
| |||||||||||
Gross profit | 159,970 | 130,844 | 29,126 | 22.3 | % | |||||||||||
Expenses: | ||||||||||||||||
Selling, general and administrative | 47,946 | 39,510 | 8,436 | 21.4 | % | |||||||||||
Transaction costs | — | 731 | (731 | ) | NM | |||||||||||
Exit and restructuring costs | 95 | 966 | (871 | ) | (90.2 | )% | ||||||||||
|
|
|
|
|
| |||||||||||
Operating income | 111,929 | 89,637 | 22,292 | 24.9 | % | |||||||||||
Interest expense, net | 21,751 | 23,211 | (1,460 | ) | (6.3 | )% | ||||||||||
Debt modification costs | — | 1,587 | (1,587 | ) | NM | |||||||||||
Bargain purchase gain | — | (1,745 | ) | 1,745 | NM | |||||||||||
Other expense (income), net | 2,871 | (961 | ) | 3,832 | NM | |||||||||||
|
|
|
|
|
| |||||||||||
Income from continuing operations before income taxes | 87,307 | 67,545 | 19,762 | 29.3 | % | |||||||||||
Provision for income taxes | 22,641 | 11,732 | 10,909 | 93.0 | % | |||||||||||
|
|
|
|
|
| |||||||||||
Income from continuing operations | $ | 64,666 | $ | 55,813 | $ | 8,853 | 15.9 | % | ||||||||
|
|
|
|
|
| |||||||||||
NM = not meaningful
Net Sales. Our net sales increased $161.7 million or 32.3% in the second quarter of fiscal year 2018 compared to the second quarter of fiscal year 2017. Western Tube and American Tube, which are included in our results for the full quarter in 2018 as compared to only a partial quarter in 2017, accounted for over $60 million, or approximately 12 percentage points of the current period’s total increase, a portion of which is attributable to year-over-year organic growth. The remainder of the change was due to an increase of approximately 9% in the average selling price of our products and an 11.5% increase in tons sold, exclusive of Western Tube and American Tube. The increase in selling prices was a direct result of passing through higher steel prices in the second quarter of fiscal year 2018. The increase in tons sold was primarily related to our structural tubing business, which benefited from increasedend-user demand and our recently restarted and modernized mill in Blytheville, Arkansas. In addition, our launch of new products in our fence pipe portfolio contributed to the increase in tons sold.
Cost of Sales. Our cost of sales increased $132.5 million or 35.8% in the second quarter of fiscal year 2018 compared to the second quarter of fiscal year 2017. Western Tube and American Tube accounted for overone-third of the total increase. The remainder of the increase was due to higher input costs, primarily driven by higher steel prices, and an 11.5% increase in tons sold, exclusive of Western Tube and American Tube.
Gross Profit. Our gross profit was $160.0 million, or 24.1% of net sales, in the second quarter of fiscal year 2018 as compared to $130.8 million, or 26.1% of net sales, in the second quarter of fiscal year 2017. This decrease in gross profit margin was due to the timing of raw material purchases in a period of rising steel prices, and not being able to pass on all steel price fluctuations to our customers. The resulting decrease in relative amounts passed on in the second quarter of fiscal year 2018
| 64 |
Table of Contents
Confidential Treatment Requested Pursuant to 17 C.F.R. Section 200.83
compared to the second quarter of fiscal year 2017 was partially offset by synergies following the Western Tube and American Tube acquisitions and the effect of higher cost of sales in fiscal year 2017 resulting from inventory step-up purchase accounting adjustments for Western Tube and American Tube.
Selling, General and Administrative Expenses. Our selling, general and administrative expenses were $47.9 million in the second quarter of fiscal year 2018 as compared to $39.5 million in the second quarter of fiscal year 2017. As a percentage of net sales, selling, general and administrative expenses were 7.2% and 7.9% in the second quarter of fiscal year 2018 and fiscal year 2017, respectively. The increase in selling, general and administrative expenses was partially due to the impact of the acquisitions of Western Tube and American Tube for the full quarter in fiscal year 2018. The decrease in selling, general and administrative expenses as a percentage of net sales was largely due to the fixed cost nature of certain expenses, such as amortization expense related to intangible assets, depreciation expense and employee salaries and benefits, coupled with the increase in net sales.
Transaction Costs. We incurred $0.7 million in transaction costs during the second quarter of fiscal year 2017 associated with the acquisitions of Western Tube and American Tube.
Exit and Restructuring Costs. We incurred exit and restructuring costs of $0.1 million and $1.0 million in the second quarter of fiscal years 2018 and 2017, respectively. The prior period amount includes $0.7 million related to exiting certain acquired lines of business and downsizing at Western Tube.
Operating Income. As a result of the aforementioned items, our operating income was $111.9 million in the second quarter of fiscal year 2018 as compared to $89.6 million in the second quarter of fiscal year 2017.
Interest Expense, Net. Our interest expense, net of interest income, was $21.8 million in the second quarter of fiscal year 2018 as compared with $23.2 million in the second quarter of fiscal year 2017. The decrease is due to a lower interest rate on our term debt as a result of favorable amendments to our Term Loan Facility in February 2017 and August 2017.
Debt Modification Costs. We recognized $1.6 million of debt modification costs in the second quarter of fiscal year 2017 in connection with the amendment of our Term Loan Facility. This amount was expensed immediately as all outstanding and new term debt was deemed to be modified as opposed to extinguished under the applicable accounting guidance.
Bargain Purchase Gain. We recognized a $1.7 million gain in the second quarter of fiscal year 2017 in connection with the Western Tube acquisition as the estimated fair value of the net assets acquired exceeded the purchase price.
Other Expense (Income), Net. During the second quarter of fiscal year 2018, we recorded other expense, net of $2.9 million as compared to other income, net of $1.0 million in the second quarter of fiscal year 2017. In each period, these amounts were primarily related to foreign exchange gains and losses on intercompany and third party transactions and intercompany loans denominated in currencies other than the functional currencies of the related entities.
Provision for Income Taxes. Our provision for income taxes was $22.6 million in the second quarter of fiscal year 2018 as compared to $11.7 million in the second quarter of fiscal year 2017. Our effective income tax rate was 25.9% for the second quarter of fiscal year 2018 as compared to 17.4% for the second quarter of fiscal year 2017. The effective tax rate in 2017 was lower due to the expected mix of full fiscal year earnings between our United States and Canadian jurisdictions and the corresponding tax rate differential. The Tax Reform reduces the U.S. federal statutory income tax rate
| 65 |
Table of Contents
Confidential Treatment Requested Pursuant to 17 C.F.R. Section 200.83
from 35.0% to 21.0%, effective January 1, 2018. As a result of this change, for our second quarter of fiscal year 2018 interim tax calculations we applied a blended federal statutory income tax rate of 24.5%. Therefore, our effective tax rate for the second quarter of fiscal year 2018 was generally consistent with U.S. and Canadian statutory tax rates.
Income from Continuing Operations. As a result of the aforementioned items, we reported income from continuing operations of $64.7 million in the second quarter of fiscal year 2018 as compared to $55.8 million in the second quarter of fiscal year 2017.
Reportable Segments. The key measures of segment performance are summarized as follows for the second quarter of fiscal year 2018 compared to the second quarter of fiscal year 2017 (dollars in thousands):
| 13 Weeks Ended | ||||||||||||||||
| March 31, 2018 | March 25, 2017 | Change | Percentage Change | |||||||||||||
Net sales from external customers: | ||||||||||||||||
Atlas | $ | 319,831 | $ | 244,465 | $ | 75,366 | 30.8 | % | ||||||||
EFM | $ | 181,181 | $ | 122,735 | $ | 58,446 | 47.6 | % | ||||||||
Pipe | $ | 106,888 | $ | 92,718 | $ | 14,170 | 15.3 | % | ||||||||
Operating income: | ||||||||||||||||
Atlas | $ | 61,525 | $ | 55,266 | $ | 6,259 | 11.3 | % | ||||||||
EFM | $ | 39,423 | $ | 22,382 | $ | 17,041 | 76.1 | % | ||||||||
Pipe | $ | 17,340 | $ | 16,167 | $ | 1,173 | 7.3 | % | ||||||||
Atlas. Atlas net sales increased $75.4 million or 30.8% in the second quarter of fiscal year 2018 compared to the second quarter of fiscal year 2017. American Tube, which is included in our results for the full quarter in 2018 as compared to only a partial quarter in 2017, accounted for over $20 million or approximately 9 percentage points of the total increase, a portion of which would be attributable to year-over-year organic growth. The remainder of the change was due to an 8.6% increase in the average selling price of our products and a 13.1% increase in tons sold, exclusive of American Tube. The increase in selling prices for Atlas, as well as for EFM and Pipe as noted below, was a direct result of passing through higher steel prices in the second quarter of fiscal year 2018. The increase in tons sold for Atlas was primarily due to increasedend-user demand and additional tons sold from the restarted and modernized Blytheville, Arkansas facility.
Our Atlas operating income was $61.5 million in the second quarter of fiscal year 2018 as compared to $55.3 million in the comparable fiscal year 2017 period. As a percentage of net sales from external customers, Atlas operating income was 19.2% and 22.6% in the second quarter of fiscal year 2018 and the second quarter of fiscal year 2017, respectively. Atlas operating income as a percentage of net sales was lower in 2018 primarily due to costs relating to the restart and modernization of our Blytheville, Arkansas facility.
EFM. EFM net sales increased $58.4 million or 47.6% in the second quarter of fiscal year 2018 compared to the second quarter of fiscal year 2017. Western Tube, which is included in our results for the full quarter in 2018 as compared to only a partial quarter in 2017, accounted for over $40 million or approximately 35 percentage points of the total increase, a portion of which would be attributable to year-over-year organic growth. The remainder of the change was due to a 6.7% increase in the average selling price of our products and an 11.1% increase in tons sold, exclusive of Western Tube. This increase in tons sold was primarily related to fence pipe products, behind a new sales strategy and the launch of a newpre-galvanized fence post product, and an improvement in electrical conduit sales.
| 66 |
Table of Contents
Confidential Treatment Requested Pursuant to 17 C.F.R. Section 200.83
Our EFM operating income was $39.4 million in the second quarter of fiscal year 2018 as compared to $22.4 million in the comparable fiscal year 2017 period. As a percentage of net sales from external customers, EFM operating income was 21.8% and 18.2% in the second quarter of fiscal year 2018 and the second quarter of fiscal year 2017, respectively. EFM operating income as a percentage of net sales was higher in the current year due to operating leverage on higher volume and the impact of the combined efficiencies of Western Tube with our existing EFM business.
Pipe. Pipe net sales increased $14.2 million or 15.3% in the second quarter of fiscal year 2018 compared to the second quarter of fiscal year 2017. This change was due to a 10.6% increase in the average selling price of our products and a 4.8% increase in tons sold.
Our Pipe operating income was $17.3 million in the second quarter of fiscal year 2018 as compared to $16.2 million in the comparable fiscal year 2017 period. As a percentage of net sales from external customers, Pipe operating income was 16.2% and 17.4% in the second quarter of fiscal year 2018 and the second quarter of fiscal year 2017, respectively.
26 Weeks Ended March 31, 2018 Compared to 26 Weeks Ended March 25, 2017
The following table compares our consolidated results for the first half of fiscal year 2018 to the first half of fiscal year 2017 (dollars in thousands):
| 26 Weeks Ended | ||||||||||||||||
| March 31, 2018 | March 25, 2017 | Change | Percentage Change | |||||||||||||
Net sales | $ | 1,198,601 | $ | 916,675 | $ | 281,926 | 30.8 | % | ||||||||
Cost of sales | 937,404 | 710,018 | 227,386 | 32.0 | % | |||||||||||
|
|
|
|
|
| |||||||||||
Gross profit | 261,197 | 206,657 | 54,540 | 26.4 | % | |||||||||||
Expenses: | ||||||||||||||||
Selling, general and administrative | 86,402 | 69,614 | 16,788 | 24.1 | % | |||||||||||
Transaction costs | — | 731 | (731 | ) | NM | |||||||||||
Exit and restructuring costs | 108 | 1,372 | (1,264 | ) | (92.1 | )% | ||||||||||
|
|
|
|
|
| |||||||||||
Operating income | 174,687 | 134,940 | 39,747 | 29.5 | % | |||||||||||
Interest expense, net | 42,441 | 46,624 | (4,183 | ) | (9.0 | )% | ||||||||||
Debt modification costs | — | 1,587 | (1,587 | ) | NM | |||||||||||
Bargain purchase gain | — | (1,745 | ) | 1,745 | NM | |||||||||||
Other expense, net | 4,682 | 1,860 | 2,822 | NM | ||||||||||||
|
|
|
|
|
| |||||||||||
Income from continuing operations before income taxes | 127,564 | 86,614 | 40,950 | 47.3 | % | |||||||||||
Provision for income taxes | 22,148 | 14,866 | 7,282 | 49.0 | % | |||||||||||
|
|
|
|
|
| |||||||||||
Income from continuing operations | $ | 105,416 | $ | 71,748 | $ | 33,668 | 46.9 | % | ||||||||
|
|
|
|
|
| |||||||||||
NM = not meaningful
Net Sales. Our net sales increased $281.9 million or 30.8% in the first half of fiscal year 2018 compared to the first half of fiscal year 2017. Western Tube and American Tube, which are included in our results for the full period in 2018 as compared to only part of the second quarter in 2017, accounted for over $125 million or approximately 14 percentage points of the total increase, a portion of which is attributable to year-over-year organic growth. The remainder of the change was due to an increase of approximately 10% in the average selling price of our products and a 6.2% increase in tons sold, exclusive of Western Tube and American Tube. The increase in selling prices was a direct result of passing through higher steel prices in the first half of fiscal year 2018. The increase in tons sold was
| 67 |
Table of Contents
Confidential Treatment Requested Pursuant to 17 C.F.R. Section 200.83
primarily driven by an 8.9% increase in structural tubing due to strongend-user demand and our recently restarted and modernized mill in Blytheville, Arkansas, an increase in fence pipe sales following a new sales strategy and general market improvements for DOM tubing products.
Cost of Sales. Our cost of sales increased $227.4 million or 32.0% in the first half of fiscal year 2018 compared to the first half of fiscal year 2017. Western Tube and American Tube accounted for overone-third of the total increase. The remainder of the increase was due to higher input costs, primarily driven by higher steel prices, and a 6.2% increase in tons sold, exclusive of Western Tube and American Tube.
Gross Profit. Our gross profit was $261.2 million, or 21.8% of net sales, in the first half of fiscal year 2018 as compared to $206.7 million, or 22.5% of net sales, in the first half of fiscal year 2017. This decrease in gross profit margin was due to the timing of raw material purchases in a period of rising steel prices, and not being able to pass on all steel price fluctuations to our customers. The resulting decrease in relative amounts passed on in the first half of fiscal year 2018 compared to the first half of fiscal year 2017 was partially offset by synergies following the Western Tube and American Tube acquisitions and the effect of higher cost of sales in fiscal year 2017 resulting from inventory step-up purchase accounting adjustments for Western Tube and American Tube.
Selling, General And Administrative Expenses. Our selling, general and administrative expenses were $86.4 million in the first half of fiscal year 2018 as compared to $69.6 million in the first half of fiscal year 2017. As a percentage of net sales, selling, general and administrative expenses were 7.2% in the first half of fiscal year 2018 compared to 7.6% in the first half of fiscal year 2017. The increase in selling, general and administrative expenses was largely due to higher stock-based compensation in the first half of fiscal year 2018 and the impact of Western Tube and American Tube for the full period in 2018. The decrease in selling, general and administrative expenses as a percentage of net sales was largely due to the fixed cost nature of certain expenses, such as amortization expense related to intangible assets, depreciation expense and employee salaries and benefits, coupled with the increase in net sales.
Transaction Costs. We incurred $0.7 million in transaction costs during the first half of fiscal year 2017 associated with the acquisitions of Western Tube and American Tube.
Exit and Restructuring Costs. We incurred exit and restructuring costs of $0.1 million and $1.4 million in the first half of fiscal years 2018 and 2017, respectively. The prior period amount includes $0.7 million related to exiting certain acquired lines of business and related downsizing at Western Tube and costs related to our Council Avenue and Mill Street manufacturing facilities in Wheatland, Pennsylvania and Sharon, Pennsylvania, respectively.
Operating Income. As a result of the aforementioned items, our operating income was $174.7 million in the first half of fiscal year 2018 as compared to $134.9 million in the first half of fiscal year 2017.
Interest Expense, Net. Our interest expense, net of interest income, was $42.4 million in the first half of fiscal year 2018 as compared with $46.6 million in the first half of fiscal year 2017. The decrease is due to a lower interest rate on our term debt as a result of favorable amendments to our Term Loan Facility in February 2017 and August 2017.
Debt Modification Costs. We recognized $1.6 million of debt modification costs in the first half of fiscal year 2017 in connection with the amendment of our Term Loan Facility. This amount was expensed immediately as all outstanding and new term debt was deemed to be modified as opposed to extinguished under the applicable accounting guidance.
| 68 |
Table of Contents
Confidential Treatment Requested Pursuant to 17 C.F.R. Section 200.83
Bargain Purchase Gain. We recognized a $1.7 million gain in the first half of fiscal year 2017 in connection with the Western Tube acquisition as the estimated fair value of the net assets acquired exceeded the purchase price.
Other Expense, Net. During the first half of fiscal year 2018, we recorded other expense, net of $4.7 million as compared to $1.9 million in the first half of fiscal year 2017. In each period, these amounts were primarily related to foreign exchange gains and losses on intercompany and third party transactions and intercompany loans denominated in currencies other than the functional currencies of the related entities. In the first half of fiscal year 2017, these losses were partially offset by a $1.1 million gain on the sale of fixed assets.
Provision for Income Taxes. Our provision for income taxes was $22.6 million in the first half of fiscal year 2018 as compared to $14.9 million in the first half of fiscal year 2017. Our effective income tax rate was 17.7% for the first half of fiscal year 2018 as compared to 17.2% for the first half of fiscal year 2017. The effective tax rate in 2017 was significantly impacted by the expected mix of full fiscal year earnings between our United States and Canadian jurisdictions and the corresponding statutory tax rate differential.
Our first half of fiscal year 2018 results were significantly impacted by the enactment of the Tax Reform. As noted above, as a result of this change we applied a blended federal statutory income tax rate of 24.5% for our first half of fiscal year 2018 interim tax calculations. In addition, we reduced our net U.S. deferred tax liability on our consolidated balance sheet by $21.3 million to reflect the new lower income tax rates. The income tax benefits recognized from these items in the first half of fiscal year 2018 were partially offset by the recording of a $12.0 million mandatory repatriation tax liability. The mandatory repatriation tax liability is required by the Tax Reform and relates to the expectedone-time income tax payment computed based on undistributed earnings of our foreign operations, and the associated net cash position and foreign taxes incurred by such operations. As the full year results of fiscal year 2018 are not yet known, our adjustment to deferred taxes and our mandatory repatriation tax liability amount are based on certain assumptions and the best available information, but are considered provisional as of March 31, 2018. We will refine these provisional adjustments and amounts in subsequent quarters of fiscal year 2018 based on our actual financial results and as more information becomes available.
Income from Continuing Operations. As a result of the aforementioned items, we reported income from continuing operations of $105.0 million in the first half of fiscal year 2018 as compared to $71.7 million in the first half of fiscal year 2017.
Reportable Segments. The key measures of segment performance are summarized as follows for the first half of fiscal year 2018 compared to the first half of fiscal year 2017 (dollars in thousands):
| 26 Weeks Ended | ||||||||||||||||
| March 31, 2018 | March 25, 2017 | Change | Percentage Change | |||||||||||||
Net sales from external customers: | ||||||||||||||||
Atlas | $ | 595,673 | $ | 452,738 | $ | 142,935 | 31.6 | % | ||||||||
EFM | $ | 313,904 | $ | 217,160 | $ | 96,744 | 44.5 | % | ||||||||
Pipe | $ | 192,370 | $ | 179,207 | $ | 13,163 | 7.3 | % | ||||||||
Operating income: | ||||||||||||||||
Atlas | $ | 101,709 | $ | 82,323 | $ | 19,386 | 23.5 | % | ||||||||
EFM | $ | 60,387 | $ | 38,987 | $ | 21,400 | 54.9 | % | ||||||||
Pipe | $ | 24,510 | $ | 22,564 | $ | 1,946 | 8.6 | % | ||||||||
| 69 |
Table of Contents
Confidential Treatment Requested Pursuant to 17 C.F.R. Section 200.83
Atlas. Atlas net sales increased $142.9 million or 31.6% in the first half of fiscal year 2018 compared to the first half of fiscal year 2017. American Tube, which is included in our results for the full period in 2018 as compared to only part of the second quarter in 2017, accounted for over $40 million, or approximately 10 percentage points of the total increase. The remainder of the change was due to an 11.9% increase in the average selling price of our products and an 8.9% increase in tons sold, exclusive of American Tube. The increase in selling prices for Atlas, as well as for EFM and Pipe as noted below, was a direct result of passing through higher steel prices in the first half of fiscal year 2018. The increase in tons sold for Atlas was due to an increase inend-user demand for structural tubing and the impact of our restarted and modernized mill in Blytheville, Arkansas.
Our Atlas operating income was $101.7 million in the first half of fiscal year 2018 as compared to $82.3 million in the comparable fiscal year 2017 period. As a percentage of net sales from external customers, Atlas operating income was 17.1% and 18.2% in the first half of fiscal year 2018 and the first half of fiscal year 2017, respectively. Atlas operating income as a percentage of net sales was lower in 2018 compared to the prior year due to costs related to the restart and modernization of our Blytheville, Arkansas facility.
EFM. EFM net sales increased $96.7 million or 44.5% in the first half of fiscal year 2018 compared to the first half of fiscal year 2017. Western Tube, which is included in our results for the full period in 2018 as compared to only part of the second quarter in 2017, accounted for over $85.0 million or approximately 40 percentage points of the total increase. The remainder of the change was due to a 4.4% increase in the average selling price of our products and a 1.4% increase in tons sold, exclusive of Western Tube.
Our EFM operating income was $60.4 million in the first half of fiscal year 2018 as compared to $39.0 million in the comparable fiscal year 2017 period. As a percentage of net sales from external customers, EFM operating income was 19.2% and 18.0% in the first half of fiscal year 2018 and the first half of fiscal year 2017, respectively. The improvement in EFM’s operating income as a percentage of net sales was primarily due to operating leverage related to higher volume, partially offset by higher selling costs.
Pipe. Pipe net sales increased $13.2 million or 7.3% in the first half of fiscal year 2018 compared to the first half of fiscal year 2017. This change was due to an 11.6% increase in the average selling price of our products, partially offset by a 3.8% decrease in tons sold. This decrease in tons sold was primarily related to standard pipe which faced more competition from imports in the period as foreign suppliers shipped additional product to the United States in an effort to avoid expected future trade duties and tariffs.
Our Pipe operating income was $24.5 million in the first half of fiscal year 2018 as compared to $22.6 million in the comparable fiscal year 2017 period. As a percentage of net sales from external customers, Pipe operating income was 12.7% and 12.6% in the first half of fiscal year 2018 and the first half of fiscal year 2017, respectively.
| 70 |
Table of Contents
Confidential Treatment Requested Pursuant to 17 C.F.R. Section 200.83
Fiscal Year Ended September 30, 2017 Compared to Fiscal Year Ended September 24, 2016
The following table compares our consolidated results for fiscal year 2017 to fiscal year 2016 (dollars in thousands):
| Year Ended | ||||||||||||||||
| September 30, 2017 | September 24, 2016 | Change | Percentage Change | |||||||||||||
Net sales | $ | 2,095,255 | $ | 1,554,491 | $ | 540,764 | 34.8 | % | ||||||||
Cost of sales | 1,657,700 | 1,200,215 | 457,485 | 38.1 | % | |||||||||||
|
|
|
|
|
| |||||||||||
Gross profit | 437,555 | 354,276 | 83,279 | 23.5 | % | |||||||||||
Expenses: | ||||||||||||||||
Selling, general and administrative | 151,317 | 130,214 | 21,103 | 16.2 | % | |||||||||||
Transaction costs | 731 | — | 731 | NM | ||||||||||||
Exit and restructuring costs | 1,873 | 1,970 | (97 | ) | (4.9 | )% | ||||||||||
|
|
|
|
|
| |||||||||||
Operating income | 283,634 | 222,092 | 61,542 | 27.7 | % | |||||||||||
Interest expense, net | 92,139 | 95,931 | (3,792 | ) | (4.0 | )% | ||||||||||
Loss on extinguishment of debt | — | 19,343 | (19,343 | ) | NM | |||||||||||
Debt modification costs | 2,725 | 5,480 | (2,755 | ) | (50.3 | )% | ||||||||||
Bargain purchase gain | (1,745 | ) | — | (1,745 | ) | NM | ||||||||||
Other (income) expense, net | (8,121 | ) | 251 | (8,372 | ) | NM | ||||||||||
|
|
|
|
|
| |||||||||||
Income from continuing operations before income taxes | 198,636 | 101,087 | 97,549 | 96.5 | % | |||||||||||
Provision for income taxes | 35,340 | 16,008 | 19,332 | NM | ||||||||||||
|
|
|
|
|
| |||||||||||
Income from continuing operations | $ | 163,296 | $ | 85,079 | $ | 78,217 | 91.9 | % | ||||||||
|
|
|
|
|
| |||||||||||
NM = not meaningful
Net Sales. Our net sales increased $540.8 million or 34.8% in fiscal year 2017 compared to fiscal year 2016. The inclusion of the results of Western Tube and American Tube accounted for $193.0 million or 12.4 percentage points of fiscal year 2017’s total increase, a portion of which is attributable to year-over-year organic growth. The remainder of the increase was due to a 16.0% increase in the average selling price of our products and a 4.4% increase in tons sold, exclusive of Western Tube and American Tube. The increase in selling prices was a direct result of passing through higher steel prices in fiscal year 2017. The increase in tons sold primarily related to structural tubing behind strongend-user demand and energy tubular products, as the increase in oil and gas exploration in the United States led to higher sales especially in the second half of fiscal year 2017. Additionally, fiscal year 2017 included an additional week of operations as compared to the prior year.
Cost of Sales. Our cost of sales increased $457.5 million or 38.1% in fiscal year 2017 compared to fiscal year 2016. The inclusion of the results of Western Tube and American Tube accounted for $160.4 million or 13.4 percentage points of fiscal year 2017’s total increase. The remainder of the increase was due to higher input costs, primarily driven by higher steel and zinc prices, and the 4.4% increase in tons sold, exclusive of Western Tube and American Tube. Additionally, cost of sales in fiscal year 2017 was higher due to the additional week of operations as compared to the prior year.
Gross Profit. Our gross profit was $437.6 million, or 20.9% of net sales, in fiscal year 2017 as compared to $354.3 million, or 22.8% of net sales, in fiscal year 2016. This decrease in gross profit margin was due to the timing of raw material purchases in a period of rising steel and zinc prices, and not being able to pass on all input price fluctuations to our customers, resulting in lower relative pass-throughs in fiscal year 2017 compared to fiscal year 2016. In addition, our fiscal year 2017 gross profit margin was impacted by product mix, as certain lower margin product lines experienced increases in tons sold, and higher cost of sales resulting from inventory step-up purchase accounting adjustments for Western Tube and American Tube.
| 71 |
Table of Contents
Confidential Treatment Requested Pursuant to 17 C.F.R. Section 200.83
Selling, General and Administrative Expenses. Our selling, general and administrative expenses were $151.3 million in fiscal year 2017 as compared to $130.2 million in fiscal year 2016. As a percentage of net sales, selling, general and administrative expenses were 7.2% and 8.4% in fiscal years 2017 and 2016, respectively. The decrease in selling, general and administrative expenses as a percentage of net sales was largely due to the fixed cost nature of certain expenses, such as amortization expense related to intangible assets, depreciation expense and employee salaries and benefits, coupled with the increase in net sales.
Transaction Costs. We incurred $0.7 million in transaction costs during the second quarter of 2017 associated with the acquisitions of Western Tube and American Tube.
Exit and Restructuring Costs. We incurred exit and restructuring costs of $1.9 million and $2.0 million during fiscal years 2017 and 2016, respectively. The current year amount includes $1.0 million related to exiting certain acquired product types and downsizing at Western Tube. The remaining amounts in both years relate to our Council Avenue and Mill Street manufacturing facilities in Wheatland, Pennsylvania and Sharon, Pennsylvania, respectively.
Operating Income. As a result of the aforementioned items, our operating income was $283.6 million in fiscal year 2017 as compared to $222.1 million in fiscal year 2016.
Interest Expense, Net. Our interest expense, net of interest income, was $92.1 million in fiscal year 2017 as compared to $95.9 million in fiscal year 2016. The decrease is a result of lower interest costs following our June 2016 debt refinancing and the favorable term loan amendments in February 2017 and August 2017.
Loss on Extinguishment of Debt. We recognized a loss on extinguishment of debt in fiscal year 2016 related to our debt refinancing completed in June 2016. The primary components of this loss were an aggregate call premium of $16.7 million on the redemption of our Unsecured Senior Notes and the netwrite-off of $3.7 million related to certain capitalized amounts from our previous debt issuances. In addition, during fiscal year 2016 we recorded debt extinguishment gains of $1.1 million, related to repurchasing portions of our outstanding Unsecured Senior Notes on the open market.
Debt Modification Costs. We recognized $2.7 million of debt modification costs in fiscal year 2017 in connection with the February 2017 and August 2017 amendments of our Term Loan facility. These amounts were expensed immediately as all outstanding and new term debt was deemed to be modified as opposed to extinguished under the applicable accounting guidance. We recognized $5.5 million of debt modification costs in fiscal year 2016. This amount represents the portion of our overall costs related to the June 2016 amendment and restatement of our Term Loan Facility that was expensed immediately as the outstanding term debt was deemed to be modified as opposed to extinguished.
Bargain Purchase Gain. We recognized a $1.7 million gain in the second quarter of fiscal year 2017 in connection with the Western Tube acquisition as the estimated fair value of the net assets acquired exceeded the purchase price.
Other (Income) Expense, Net. During fiscal year 2017, we recorded other income, net of $8.1 million as compared to other expense, net of $0.3 million in fiscal year 2016. In each year, these amounts were primarily related to foreign exchange gains and losses on intercompany and third party transactions and intercompany loans denominated in currencies other than the functional currencies of the related entities. In fiscal year 2017, these losses were partially offset by a $1.1 million gain on the sale of fixed assets.
Provision for Income Taxes. Our provision for income taxes was $35.3 million in fiscal year 2017 as compared to $16.0 million in fiscal year 2016. Our effective income tax rate was 17.8% in fiscal year 2017 as compared to 15.8% in fiscal year 2016. The effective tax rates for both periods were impacted by the mix ofpre-tax earnings and losses between our United States and Canadian
| 72 |
Table of Contents
Confidential Treatment Requested Pursuant to 17 C.F.R. Section 200.83
jurisdictions and the corresponding statutory tax rate differential. For fiscal year 2017, the effective tax rate was impacted by the release of a significant portion of our valuation allowance related to certain federal and state deferred tax assets.
Income from Continuing Operations. As a result of the aforementioned items, we reported income from continuing operations of $163.3 million in fiscal year 2017 as compared to $85.1 million in fiscal year 2016.
Reportable Segments. The key measures of segment performance are summarized as follows for fiscal year 2017 compared to fiscal year 2016 (dollars in thousands):
| Year Ended | ||||||||||||||||
| September 30, 2017 | September 24, 2016 | Change | Percentage Change | |||||||||||||
Net sales from external customers: | ||||||||||||||||
Atlas | $ | 1,013,160 | $ | 767,672 | $ | 245,488 | 32.0 | % | ||||||||
EFM | $ | 549,912 | $ | 370,969 | $ | 178,943 | 48.2 | % | ||||||||
Pipe | $ | 363,052 | $ | 317,315 | $ | 45,737 | 14.4 | % | ||||||||
Operating income: | ||||||||||||||||
Atlas | $ | 163,432 | $ | 113,131 | $ | 50,301 | 44.5 | % | ||||||||
EFM | $ | 92,690 | $ | 79,180 | $ | 13,510 | 17.1 | % | ||||||||
Pipe | $ | 39,277 | $ | 43,704 | $ | (4,427 | ) | (10.1 | )% | |||||||
Atlas. Atlas net sales increased $245.5 million or 32.0% in fiscal year 2017 compared to fiscal year 2016. The inclusion of the results of American Tube accounted for $46.8 million, or 6.1 percentage points of fiscal year 2017’s total increase. The remainder of the increase was due to a 21.3% increase in the average selling price of our products and a 2.8% increase in tons sold, exclusive of American Tube. The increase in selling prices for Atlas, as well as for EFM and Pipe as noted below, was a direct result of passing through higher steel prices in fiscal year 2017. The increase in tons sold for Atlas was primarily related to strongend-user demand for structural tubing, partially offset by a decrease for piling products due to an overall market decline in western Canada.
Our Atlas operating income was $163.4 million in fiscal year 2017 as compared to $113.1 million in fiscal year 2016. As a percentage of net sales from external customers, Atlas operating income was 16.1% and 14.7% in fiscal year 2017 and fiscal year 2016, respectively. The improvement in Atlas operating income as a percentage of net sales was primarily driven by an increase in net selling prices in excess of the relative increase of costs for new materials purchased.
Additionally, fiscal year 2017 included an additional week of operations as compared to fiscal year 2016.
EFM. EFM net sales increased $178.9 million or 48.2% in fiscal year 2017 compared to fiscal year 2016. The inclusion of the results of Western Tube accounted for $146.2 million, or 39.4 percentage points of fiscal year 2017’s total increase. The remainder of the increase was due to a 12.3% increase in the average selling price of our products, partially offset by a 2.0% decrease in tons sold, exclusive of Western Tube. This decrease in tons sold was driven by a large reduction in fence pipe tons as competitors withpre-galvanized fence posts were able to gain market share.
Our EFM operating income was $92.7 million in fiscal year 2017 as compared to $79.2 million in fiscal year 2016. As a percentage of net sales from external customers, EFM operating income was 16.9% and 21.3% in fiscal year 2017 and fiscal year 2016, respectively. The decrease in EFM operating income as a percentage of net sales was due to a lower relative operating margin rate for Western Tube in the first six months of ownership and a significant increase in the cost of zinc, which is a primary material in galvanized EFM product.
| 73 |
Table of Contents
Confidential Treatment Requested Pursuant to 17 C.F.R. Section 200.83
As noted above, fiscal year 2017 included an additional week of operations as compared to fiscal year 2016.
Pipe. Pipe net sales increased $45.7 million or 14.4% in fiscal year 2017 compared to fiscal year 2016. This change was due to an 11.3% increase in the average selling price of our products and a 2.7% increase in tons sold. This improvement in tons sold was primarily related to fire sprinkler pipe as we improved our market share in fiscal year 2017.
Our Pipe operating income was $39.3 million in fiscal year 2017 as compared to $43.7 million in fiscal year 2016. As a percentage of net sales from external customers, Pipe operating income was 10.8% and 13.8% in fiscal year 2017 and fiscal year 2016, respectively. The decrease in Pipe operating income as a percentage of net sales was primarily driven by higher steel prices not fully offset by net realized selling price increases.
As noted above, fiscal year 2017 included an additional week of operations as compared to fiscal year 2016.
Fiscal Year Ended September 24, 2016 Compared to Fiscal Year Ended September 26, 2015
The following table compares our consolidated results for fiscal year 2016 to fiscal year 2015 (dollars in thousands):
| Year Ended | ||||||||||||||||
| September 24, 2016 | September 26, 2015 | Change | Percentage Change | |||||||||||||
Net sales | $ | 1,554,491 | $ | 1,712,547 | $ | (158,056 | ) | (9.2 | )% | |||||||
Cost of sales | 1,200,215 | 1,466,797 | (266,582 | ) | (18.2 | )% | ||||||||||
|
|
|
|
|
| |||||||||||
Gross profit | 354,276 | 245,750 | 108,526 | 44.2 | % | |||||||||||
Expenses: | ||||||||||||||||
Selling, general and administrative | 130,214 | 123,103 | 7,111 | 5.8 | % | |||||||||||
Exit and restructuring costs | 1,970 | 8,771 | (6,801 | ) | (77.5 | )% | ||||||||||
|
|
|
|
|
| |||||||||||
Operating income | 222,092 | 113,876 | 108,216 | 95.0 | % | |||||||||||
Interest expense, net | 95,931 | 98,511 | (2,580 | ) | (2.6 | )% | ||||||||||
Loss (gain) on extinguishment of debt | 19,343 | (4,480 | ) | 23,823 | NM | |||||||||||
Debt modification costs | 5,480 | — | 5,480 | NM | ||||||||||||
Other expense, net | 251 | 18,722 | (18,471 | ) | (98.7 | )% | ||||||||||
|
|
|
|
|
| |||||||||||
Income from continuing operations before income taxes | 101,087 | 1,123 | 99,964 | NM | ||||||||||||
Provision (benefit) for income taxes | 16,008 | (4,637 | ) | 20,645 | NM | |||||||||||
|
|
|
|
|
| |||||||||||
Income from continuing operations | $ | 85,079 | $ | 5,760 | $ | 79,319 | NM | |||||||||
|
|
|
|
|
| |||||||||||
NM = not meaningful
Net Sales. Our net sales decreased $158.0 million or 9.2% in fiscal year 2016 compared to fiscal year 2015. The year-over-year comparison of net sales was impacted by unfavorable foreign currency fluctuations. Excluding the effect of foreign currency fluctuations, net sales would have decreased $123.4 million or 7.2% in fiscal year 2016 compared to fiscal year 2015. The decrease in net sales in fiscal year 2016 as compared to fiscal year 2015 was primarily due to a 4.7% decrease in the average selling price of our products, excluding the effect of foreign currency fluctuations. This decrease in selling prices was a direct result of lower steel prices in fiscal year 2016, partially offset by the impact of a significant competitor exiting the fence and fire sprinkler pipe markets which constrained supply and elevated market prices.
| 74 |
Table of Contents
Confidential Treatment Requested Pursuant to 17 C.F.R. Section 200.83
Cost of Sales. Our cost of sales decreased $266.6 million or 18.2% in fiscal year 2016 compared to fiscal year 2015. The decrease was due to lower input costs, primarily driven by lower steel prices and a favorable impact from foreign currency translation compared to fiscal year 2015.
Gross Profit. Our gross profit was $354.3 million, or 22.8% of net sales, in fiscal year 2016 as compared to $245.8 million, or 14.3% of net sales, in fiscal year 2015. This increase in gross profit margin was due to the timing of raw material purchases in a period of declining steel prices, and our ability to retain more input cost pass-through in fiscal year 2016 compared to fiscal year 2015, as evidenced by managing our average selling prices to only a 4.7% decrease. In addition, our fiscal year 2016 gross profit margin was positively impacted by headcount reductions and significant operational improvements at our Council Avenue manufacturing facility that were primarily completed in the second half of fiscal year 2015.
Selling, General and Administrative Expenses. Our selling, general and administrative expenses were $130.2 million in fiscal year 2016 as compared to $123.1 million in fiscal year 2015. As a percentage of net sales, selling, general and administrative expenses were 8.4% and 7.2% in fiscal year 2016 and fiscal year 2015, respectively. The increase in selling, general and administrative expenses as a percentage of net sales was largely due to the fixed cost nature of certain expenses, such as amortization expense related to intangible assets, depreciation expense and employee salaries and benefits, coupled with the decrease in net sales.
Exit and Restructuring Costs. We incurred exit and restructuring costs of $2.0 million and $8.8 million during fiscal year 2016 and fiscal year 2015, respectively, related to our Council Avenue and Mill Street manufacturing facilities in Wheatland, Pennsylvania and Sharon, Pennsylvania, respectively. We implemented significant changes and improvements at our Council Avenue plant, which allowed us to close our Mill Street plant in September 2015.
Operating Income. As a result of the aforementioned items, our operating income was $222.1 million in fiscal year 2016 as compared to $113.9 million in fiscal year 2015.
Interest Expense, Net. Our interest expense, net of interest income, was $95.9 million in fiscal year 2016 as compared to $98.5 million in fiscal year 2015. The decrease was due to substantially lower borrowings on our Revolving Credit Facility during fiscal year 2016, our repurchase of certain debt obligations starting in the first half of fiscal year 2015 and our mandatory prepayment of $49.6 million of outstanding Term Loan Facility borrowings in the first quarter of fiscal year 2016. The effects of these changes were partially offset by the incurrence of additional interest in June 2016 due to the timing of certain aspects of the closing of our debt refinancing.
Loss (Gain) on Extinguishment of Debt. We recognized a loss on extinguishment of debt in fiscal year 2016 related to our debt refinancing completed in June 2016. The primary components of this loss were an aggregate call premium of $16.7 million on the redemption of our formerly outstanding unsecured senior notes and the netwrite-off of $3.7 million related to certain capitalized amounts from our previous debt issuances. In addition, during fiscal year 2016 and fiscal year 2015, we recorded debt extinguishment gains of $1.1 million and $4.5 million, respectively, related to repurchasing portions of our unsecured senior notes on the open market.
Debt Modification Costs. We recognized $5.5 million of debt modification costs in fiscal year 2016. This amount represents the portion of our overall costs related to the June 2016 amendment and restatement of our Term Loan Facility that was expensed immediately as the outstanding term debt was deemed to be modified as opposed to extinguished under the applicable accounting guidance.
Other Expense, Net. During fiscal year 2016, we recorded other expense, net of $0.3 million as compared to $18.7 million in fiscal year 2015. In fiscal year 2016, this amount included certain
| 75 |
Table of Contents
Confidential Treatment Requested Pursuant to 17 C.F.R. Section 200.83
non-operating charges, partially offset by foreign exchange gains on intercompany and third party transactions and intercompany loans denominated in currencies other than the functional currencies of the related entities. The fiscal year 2015 amount was due to foreign exchange losses on similar transactions and intercompany loans.
Provision (Benefit) for Income Taxes. Our provision for income taxes was $16.0 million in fiscal year 2016 as compared to an income tax benefit of $4.6 million in fiscal year 2015. Our effective income tax rate was 15.8% in fiscal year 2016 as compared to (412.9)% in fiscal year 2015. The effective tax rates for both periods were impacted by the mix ofpre-tax earnings and losses between our United States and Canadian jurisdictions and the corresponding effect of the tax rate differential. In addition, the effective tax rates were impacted by increases to our partial valuation allowance of $9.8 million and $18.0 million in fiscal year 2016 and fiscal year 2015, respectively, due to additional uncertainty regarding our ability to utilize all of our federal and state net operating loss carryforwards.
In fiscal year 2015, the impact of permanent differences betweenpre-tax book income from continuing operations and taxable income/loss and other factors on the effective income tax rate was magnified due to our near break-evenpre-tax results.
Income from Continuing Operations. As a result of the aforementioned items, we reported income from continuing operations of $85.1 million in fiscal year 2016 as compared to $5.8 million in fiscal year 2015.
Reportable Segments. The key measures of segment performance are summarized as follows for fiscal year 2016 compared to fiscal year 2015 (dollars in thousands):
| Year Ended | ||||||||||||||||
| September 24, 2016 | September 26, 2015 | Change | Percentage Change | |||||||||||||
Net sales from external customers: | ||||||||||||||||
Atlas | $ | 767,672 | $ | 908,464 | $ | (140,792 | ) | (15.5 | )% | |||||||
EFM | $ | 370,969 | $ | 328,142 | $ | 42,827 | 13.1 | % | ||||||||
Pipe | $ | 317,315 | $ | 340,655 | $ | (23,340 | ) | (6.9 | )% | |||||||
Operating income: | ||||||||||||||||
Atlas | $ | 113,131 | $ | 83,449 | $ | 29,682 | 35.6 | % | ||||||||
EFM | $ | 79,180 | $ | 38,839 | $ | 40,341 | 103.9 | % | ||||||||
Pipe | $ | 43,704 | $ | 18,807 | $ | 24,897 | 132.4 | % | ||||||||
Atlas. Atlas net sales decreased $140.8 million or 15.5% in fiscal year 2016 compared to fiscal year 2015. The year-over-year comparison of net sales was impacted by unfavorable foreign currency fluctuations. Excluding the impact of foreign currency fluctuations, Atlas net sales would have decreased $106.2 million or 11.7% in fiscal year 2016 compared to fiscal year 2015. This decrease, excluding foreign currency fluctuations, was due to a 7.3% decrease in the average selling price of our products and a 2.1% decrease in tons sold. The decrease in selling prices was a direct result of lower steel prices in fiscal year 2016. The decrease in tons sold was primarily due to a decline in sales ofproprietary-sized products which had experienced an exceptionally strong year in fiscal year 2015 behind high demand from certain large customers.
Our Atlas operating income was $113.1 million in fiscal year 2016 as compared to $83.4 million in fiscal year 2015. As a percentage of net sales from external customers, Atlas operating income was 14.7% and 9.2% in fiscal year 2016 and fiscal year 2015, respectively. The improvement in operating income as a percentage of net sales for Atlas, as well as for EFM and Pipe as noted below, was due to a normalization of steel prices in fiscal year 2016 versus a very significant drop in prices in fiscal year 2015. The fiscal year 2015 percentages were historically low as falling steel prices adversely impacted our ability to maintain higher selling prices.
| 76 |
Table of Contents
Confidential Treatment Requested Pursuant to 17 C.F.R. Section 200.83
EFM. EFM net sales increased $42.8 million or 13.1% in fiscal year 2016 compared to fiscal year 2015. This was primarily due to a 12.7% increase in tons sold driven by an increase in fence pipe tons as a significant competitor exited the market, and an increase in mechanical tubing product tons related to demand from the solar energy market.
Our EFM operating income was $79.2 million in fiscal year 2016 as compared to $38.8 million in fiscal year 2015. As a percentage of net sales from external customers, EFM operating income was 21.3% and 11.8% in fiscal year 2016 and fiscal year 2015, respectively.
Pipe. Pipe net sales decreased $23.3 million or 6.9% in fiscal year 2016 compared to fiscal year 2015. This change was due to a 4.4% decrease in the average selling price of our products and a 1.1% decrease in tons sold. The decrease in selling prices was a direct result of lower steel prices in fiscal year 2016, partially offset by the impact of a significant competitor exiting the fire sprinkler pipe market which constrained supply resulting in higher market prices. The decrease in tons sold was due to lower sales of standard pipe products resulting from increased foreign imports and the short-term shut down of our Council Avenue plant in fiscal year 2016 as part of a major facility upgrade project. These decreases were partially offset by an increase of over 30% in fire sprinkler pipe tons due also to the significant competitor exiting the market.
Our Pipe operating income was $43.7 million in fiscal year 2016 as compared to $18.8 million in fiscal year 2015. As a percentage of net sales from external customers, Pipe operating income was 13.8% and 5.5% in fiscal year 2016 and fiscal year 2015, respectively.
Liquidity and Capital Resources
Primary Sources and Uses of Liquidity
Our primary sources of liquidity consist of existing cash balances, cash flows from our operating activities and availability under our Revolving Credit Facility. Our ability to generate sufficient cash flows from our operating activities is primarily dependent on our sales of steel pipe, tube and ancillary products to our customers at margins sufficient to cover fixed and variable expenses.
As of March 31, 2018, we had cash and cash equivalents of $41.6 million and availability of $275.9 million under our Revolving Credit Facility. Our future liquidity needs will primarily consist of working capital requirements, capital expenditures and debt service requirements. We may also pursue strategic acquisition opportunities, which would impact our future cash requirements. We believe that our existing cash, cash equivalents and cash flows from operating activities, combined with availability under our Revolving Credit Facility and the portion of the net proceeds of the offering that we intend to retain for general corporate purposes, will be sufficient to meet our presently anticipated future cash needs for the next 12 months. However, we may, from time to time, including in the next 12 months in the event our cash needs exceed present expectations or we otherwise determine it would be in our interests to do so, increase borrowings under our Revolving Credit Facility or issue securities, if market conditions are favorable, to meet our future cash needs or to reduce our borrowing costs.
Indebtedness
As of March 31, 2018, we had $1.3 billion of total indebtedness on a consolidated basis (excluding $29.1 million of letters of credit). On a pro forma as adjusted basis giving effect to this offering and the application of a portion of the net proceeds thereof as described in “Use of Proceeds” and “Capitalization,” our total indebtedness on a consolidated basis as of March 31, 2018 would have been $ . Our primary sources of indebtedness consist of our Term Loan Facility, our Senior Secured Notes and our Revolving Credit Facility.
As of March 31, 2018, we had $909.4 million outstanding under our Term Loan Facility. The maturity date of the Term Loan Facility is June 14, 2021. The Term Loan Facility requires us to make
| 77 |
Table of Contents
Confidential Treatment Requested Pursuant to 17 C.F.R. Section 200.83
mandatory prepayments under certain circumstances, including if we generate “excess cash flow” during any given fiscal year. The annual excess cash flow calculation is prescribed by the Term Loan Facility and takes into account our cash-based earnings, capital and other expenditures and changes in working capital during the period. Based on the excess cash flow calculation for fiscal year 2015, we made a mandatory prepayment of $49.6 million of the outstanding term loan facility borrowings in the first quarter of fiscal year 2016. No excess cash flow calculation was required for fiscal year 2016 due to the refinancing we completed during the year. Based on the excess cash flow calculation for fiscal year 2017, we were not required to make a mandatory prepayment. The Term Loan Agreement allows for prepayment at any time, in whole or in part, together with accrued interest, without premium or penalty after six months following our most recent amendment in May 2018.
In June 2016, we issued $375.0 million of Senior Secured Notes, all of which remain outstanding as of March 31, 2018. The Senior Secured Notes mature on June 15, 2023.
Our Revolving Credit Facility provides for aggregate commitments of $350.0 million, subject to a borrowing base calculation. The borrowing base is determined by our eligible inventory and accounts receivable balances and is comprised of United States and Canadian components. The maturity date of the Revolving Credit Facility is November 12, 2019. As of March 31, 2018, we had $45.0 million outstanding under the Revolving Credit Facility and $275.9 million of availability.
The agreements governing our Senior Secured Notes, Term Loan Facility and Revolving Credit Facility contain covenants imposing significant restrictions on our business. These restrictions may affect our ability to operate our business and may limit our ability to take advantage of potential business opportunities as they arise. The restrictions these covenants place on us include limitations on our ability to:
| • | incur or guarantee additional indebtedness; |
| • | make certain investments; |
| • | pay dividends or make distributions on our capital stock; |
| • | sell assets, including capital stock of restricted subsidiaries; |
| • | agree to payment restrictions affecting our restricted subsidiaries; |
| • | consolidate, merge, sell or otherwise dispose of all or substantially all of our assets; |
| • | enter into transactions with our affiliates; |
| • | incur liens; and |
| • | designate any of our subsidiaries as unrestricted subsidiaries. |
Additionally, while our Term Loan Facility and Revolving Credit Facility generally do not contain financial maintenance covenants, if our excess availability under our Revolving Credit Facility falls below certain thresholds as of the last day of any fiscal quarter, we will be required to maintain a fixed charge coverage ratio of not less than 1.0 to 1.0 as of that date. In the event that the requirement to comply with that covenant is triggered and we are unable to comply, we will be in default under the Revolving Credit Facility, which could result in, among other things, the outstanding balance of our loans under our Term Loan Facility and Revolving Credit Facility becoming due and payable immediately.
We believe we were in compliance with all debt covenants as of March 31, 2018.
For additional information regarding our debt agreements, applicable interest rates and other terms, as well as historical activities under those agreements, see “Note 10—Long-Term Debt” to our consolidated annual financial statements included in this prospectus.
| 78 |
Table of Contents
Confidential Treatment Requested Pursuant to 17 C.F.R. Section 200.83
Summary of Cash Flows
The following table sets forth our cash flows from continuing operations for the periods indicated below (dollars in thousands):
| 26 Weeks Ended March 31, 2018 | 26 Weeks Ended March 25, 2017 | Year Ended September 30, 2017 | Year Ended September 24, 2016 | Year Ended September 26, 2015 | ||||||||||||||||
Net cash provided by (used in): | ||||||||||||||||||||
Operating activities | $ | 55,289 | $ | 25,249 | $ | 159,045 | $ | 174,124 | $ | 202,607 | ||||||||||
Investing activities | (31,463 | ) | (216,384 | ) | (241,217 | ) | (38,379 | ) | (47,942 | ) | ||||||||||
Financing activities | (6,993 | ) | 178,769 | 73,878 | (134,333 | ) | (147,726 | ) | ||||||||||||
Effect of exchange rate change on cash | (2,639 | ) | (261 | ) | 3,283 | 1,299 | (913 | ) | ||||||||||||
|
|
|
| �� |
|
|
|
|
|
| ||||||||||
Net cash provided by (used in) continuing operations | $ | 14,194 | $ | (12,627 | ) | $ | (5,011 | ) | $ | 2,711 | $ | 6,026 | ||||||||
|
|
|
|
|
|
|
|
|
| |||||||||||
Cash Flows Provided by Operating Activities
Our net cash provided by operating activities in the first half of fiscal year 2018 was $55.3 million. Beginning with our income from continuing operations of $105.4 million, cash flows from operating activities were negatively impacted by a net increase in working capital and other items of $74.0 million. Inventories were higher as we increased our supply of raw materials to take advantage of favorable steel prices and because the average price per ton of our inventory was higher than the previous year. Also in the first half of fiscal year 2018, accounts receivable increased due to higher sales prices and volume in the second quarter of fiscal year 2018 compared to the fourth quarter of 2017. Total netnon-cash charges resulted in a cash flowadd-back of $23.9 million for the period.
Our net cash provided by operating activities in the first half of fiscal year 2017 was $25.2 million. Beginning with our income from continuing operations of $71.7 million, cash flows from operating activities were negatively impacted by a net increase in working capital and other items of $84.4 million. The most significant change in working capital was the increase in accounts receivable as we had significantly higher sales prices and volume in the second quarter of fiscal year 2017 compared to the fourth quarter of fiscal year 2016. In addition, inventories increased as we built up our supply of raw materials to take advantage of favorable steel prices and because the average price per ton of our inventory was higher than the previous year. Total netnon-cash charges resulted in a cash flowadd-back of $37.9 million for the period.
Our net cash provided by operating activities in fiscal year 2017 was $159.0 million. Beginning with our income from continuing operations of $163.3 million, cash flows from operating activities were negatively impacted by a net increase in working capital and other items of $77.4 million. The most significant changes in working capital were increases to inventories and accounts receivable. Inventories increased as we built up our supply of raw materials to take advantage of favorable steel prices and because the average price per ton of our inventory was higher than the previous year. The increase in accounts receivable was due to significantly higher sales in the fourth quarter of fiscal year 2017 compared to the fourth quarter of fiscal year 2016. Total netnon-cash charges resulted in a cash flowadd-back of $73.1 million for the year.
Our net cash provided by operating activities in fiscal year 2016 was $174.1 million. Beginning with our income from continuing operations of $85.1 million, cash flows from operating activities were positively impacted by a net decrease in working capital and other items of $2.2 million. The most significant change in working capital was the increase in inventories as we built up our supply of raw materials to take advantage of favorable steel prices. The effect of the change in inventories was
| 79 |
Table of Contents
Confidential Treatment Requested Pursuant to 17 C.F.R. Section 200.83
largely offset by a corresponding increase in accounts payable related to the timing of payments. Total netnon-cash charges resulted in a cash flowadd-back of $86.8 million for the year.
Our net cash provided by operating activities in fiscal year 2015 was $202.6 million. Beginning with our income from continuing operations of $5.8 million, cash flows from operating activities were positively impacted by a net decrease in working capital and other items of $133.6 million. The most significant changes in working capital were the reductions in inventory and accounts payable. The inventory reduction and corresponding accounts payable decrease are a result of lower raw material purchases and lower steel prices during the fourth quarter of fiscal year 2015 compared to the prior year. Accounts receivable also declined significantly in fiscal year 2015 due to higher sales volume and prices during the fourth quarter of fiscal year 2014 compared to the same period in fiscal year 2015. Total netnon-cash charges resulted in a cash flowadd-back of $63.2 million for the year.
Cash Flows Used in Investing Activities
Our net cash used in investing activities in the first half of fiscal years 2018 and 2017 was $31.5 million and $216.4 million, respectively. Purchases of property, plant and equipment during the first half of fiscal years 2018 and 2017 were $31.5 million and $24.0 million, respectively. The fiscal year 2017 activity includes the acquisitions of Western Tube and American Tube for $130.4 million (total acquisition-date net cash consideration) and $65.5 million, respectively. In the prior year period, these investing cash outflows were partially offset by $3.5 million of proceeds from the sale of certain fixed assets.
Our net cash used in investing activities in fiscal years 2017, 2016 and 2015 was $241.2 million, $38.4 million and $47.9 million, respectively. The fiscal year 2017 activity includes the acquisitions of Western Tube and American Tube for $129.2 million and $65.5 million, respectively. Purchases of property, plant and equipment in fiscal years 2017, 2016 and 2015 were $46.8 million, $38.4 million and $47.1 million, respectively.
Cash Flows (Used in) Provided By Financing Activities
Our net cash used in financing activities in the first half of fiscal year 2018 was $6.6 million. During the period, we had net borrowings of $20.0 million under our revolving credit facility, and we paid down $5.3 million of other debt. In addition, we paid a dividend of $20.0 million and dividend equivalents of $1.7 million during the period.
Our net cash provided by financing activities in the first half of fiscal year 2017 was $178.8 million. During the period, we borrowed an additional $100.0 million of term debt. We also had net borrowings of $85.0 million under our revolving credit facility. In addition, we paid down $5.1 million of other debt and paid $1.1 million of dividend equivalents during the period.
Our net cash used in financing activities in fiscal year 2016 was $134.3 million. In connection with our debt refinancing in June 2016, we made cash payments to settle existing debt of $65.5 million, net of the new amounts borrowed. We also paid $12.1 million of deferred financing costs related to our debt refinancing. In addition, during the period we had net borrowings of $20.0 million under our revolving credit facility, we made additional debt reduction payments of $53.1 million, including a mandatory prepayment of $49.6 million of outstanding term loan facility borrowings, and we received proceeds of $1.1 million through other financing arrangements. We also purchased a portion of our previously outstanding unsecured senior notes with a total principal value of $3.6 million on the open market. Finally, we paid $22.2 million of dividends and dividend equivalents during the period.
Our net cash used in financing activities in fiscal year 2015 was $147.7 million. During the period, we had net repayments of $64.3 million under our revolving credit facility, we incurred $2.5 million of
| 80 |
Table of Contents
Confidential Treatment Requested Pursuant to 17 C.F.R. Section 200.83
debt issuance costs related to refinancing the facility, we made additional debt reduction payments of $6.4 million and we received proceeds of $1.2 million through other financing arrangements. We also purchased a portion of our previously outstanding unsecured senior notes with a total principal value of $59.5 million on the open market. In addition, we paid $21.0 million of dividends and dividend equivalents during the period.
Working Capital
Excluding assets and liabilities “held for sale,” our working capital as of March 31, 2018 was $498.4 million, consisting of $751.5 million in current assets and $253.1 million in current liabilities. Our working capital as of September 30, 2017, excluding amounts “held for sale,” was $402.1 million, consisting of $657.3 million in current assets and $255.2 million in current liabilities. Our working capital as of September 24, 2016 excluding assets and liabilities “held for sale” was $224.8 million, consisting of $415.4 million in current assets and $190.6 million in current liabilities.
Cash Dividend and Dividend Equivalents
During the first quarter of fiscal year 2018, our Board of Directors declared and paid $20.0 million of cash dividends to our common stockholders and the holder of our Exchangeable Shares. As of the dividend declaration date, outstanding stock options qualified for $1.4 million of dividend equivalents.
During the third quarter of fiscal year 2017, our Board of Directors declared and paid $20.0 million of cash dividends to our common stockholders and the holder of our Exchangeable Shares. As of the dividend declaration date, outstanding stock options qualified for $1.4 million of dividend equivalents.
During the fourth quarter of fiscal year 2016, our Board of Directors declared and paid $20.0 million of cash dividends to our common stockholders and the holder of our Exchangeable Shares. As of the dividend declaration date, outstanding stock options qualified for $1.5 million of dividend equivalents. Because we did not have retained earnings at the time, the cash dividends and the dividend equivalents were recorded as adjustments to additionalpaid-in capital.
During the second quarter of fiscal year 2015, our Board of Directors declared and paid $20.0 million of cash dividends to our common stockholders and the holder of our Exchangeable Shares. As of the dividend declaration date, outstanding stock options qualified for $1.5 million of dividend equivalents. Both of these amounts were also recorded as adjustments to additionalpaid-in capital.
As of March 31, 2018, a total of $1.0 million in unpaid dividend equivalents were included in other accrued liabilities or other liabilities (depending on the expected timing of future payouts) on our consolidated balance sheet.
| 81 |
Table of Contents
Confidential Treatment Requested Pursuant to 17 C.F.R. Section 200.83
Contractual Obligations and Commitments
The following table summarizes our outstanding contractual cash obligations and commitments related to continuing operations, by future payment dates as of September 30, 2017 (dollars in thousands):
| Total | Less than 1 year | 1-3 years | 3-5 years | More than 5 years | ||||||||||||||||
Long-term debt(1) | $ | 1,315,078 | $ | 10,318 | $ | 43,418 | $ | 886,342 | $ | 375,000 | ||||||||||
Interest payments(2) | 363,394 | 75,594 | 149,326 | 101,443 | 37,031 | |||||||||||||||
Pension and other benefit obligations(3) | 152,803 | 19,461 | 38,799 | 38,958 | 55,585 | |||||||||||||||
Operating leases | 13,084 | 2,052 | 3,742 | 3,230 | 4,060 | |||||||||||||||
|
|
|
|
|
|
|
|
|
| |||||||||||
Total | $ | 1,844,359 | $ | 107,425 | $ | 235,285 | $ | 1,029,973 | $ | 471,676 | ||||||||||
|
|
|
|
|
|
|
|
|
| |||||||||||
| (1) | Long-term debt amounts assume that our Term Loan Facility is repaid upon maturity, the Senior Secured Notes are repaid upon maturity and the amount drawn under our Revolving Credit Facility remains outstanding until such facility expires. |
| (2) | Interest payments are estimated assuming contractual principal payments through each debt instrument’s maturity using the interest rates in effect as of September 30, 2017 (weighted average interest rate of 5.7%). |
| (3) | Pension and other benefit obligations are derived from funding estimates and future claim payment estimates provided by our third party actuaries. The total amount represents the funded status of our defined benefit pension and other postretirement plans as of September 30, 2017 (projected benefit obligations of $352.5 million less the fair value of plan assets of $199.7 million). |
The table above does not include our $7.4 million liability related to our reserve for unrecognized tax benefits, as management is unable to reliably estimate the timing of the expected payments, if any, for these obligations.
There were no material changes to our contractual obligations and commitments during the first half of fiscal year 2018.
Off-balance Sheet Arrangements
As of March 31, 2018, we did not have anyoff-balance sheet arrangements.
In the normal course of business with customers, vendors, insurers and others, we are contingently liable for performance under standby letters of credit and bid, performance and surety bonds. As of March 31, 2018, we had $29.1 million of standby and documentary letters of credit outstanding, which reduce availability under our revolving credit facility.
Effects of Inflation and Changing Prices
We continually attempt to minimize any effect of inflation by controlling our operating costs and adjusting our selling prices. The principal raw material purchased by us is steel, specifically HRC, which is subject to changes in market price. At times over the last several years, prices for HRC have been highly volatile. As a result, our selling prices have been highly volatile as well. To the extent that we are unable to pass on cost increases to customers without a significant decrease in sales volume or must implement price reductions in response to a rapid decline in raw material costs, these cost changes could have a material adverse effect on the results of our operations.
| 82 |
Table of Contents
Confidential Treatment Requested Pursuant to 17 C.F.R. Section 200.83
Seasonality
Our products are used innon-residential construction and infrastructure projects. These industries are both cyclical and seasonal. Customer demand and product sales during the first and fourth calendar quarters generally tend to be lower due to a lower level of activity in our products’ end markets near the beginning and end of the calendar year. The highest level of sales and profitability generally occur during the times of the year when climatic conditions are most conducive to construction activity.
Critical Accounting Policies and Estimates
We prepare our consolidated financial statements in accordance with U.S. GAAP. In order to apply these principles, management must make judgments and assumptions and develop estimates based on the best available information at the time. We develop our estimates based on historical experience and on various other assumptions that are believed to be reasonable, the results of which form the basis for making judgments about the carrying values of assets and liabilities. Actual results may differ based on the accuracy of the information utilized and subsequent events. The following critical accounting policies could materially affect the amounts recorded in our consolidated financial statements.
Goodwill
Goodwill is tested for impairment each year on the first day of our fourth fiscal quarter or more frequently if we believe indicators of impairment exist.
We identify our reporting units by assessing whether the components of our operating segments constitute businesses for which discrete financial information is available and segment management regularly reviews the operating results of those components.
The goodwill impairment test generally requires atwo-step approach. The first step involves comparing the fair values of our reporting units with their respective carrying values. If the carrying value of a reporting unit exceeds its estimated fair value, there is an indication of impairment and we must perform the second step of the impairment test. The second step involves comparing the implied fair value of the affected reporting unit’s goodwill with the carrying value of its goodwill to determine the amount, if any, of the impairment.
In certain situations, management may choose to perform a qualitative assessment for a reporting unit to determine whether the existence of events or circumstances leads to a determination that it is more likely than not that the fair value of the reporting unit is less than its carrying value. If, after assessing the totality of events or circumstances, management determines it is not likely that the fair value of a reporting unit is less than its carrying value, then performing thetwo-step impairment test is unnecessary.
When estimating a reporting unit’s fair value, we typically take into consideration several different valuation approaches including (1) an income approach which relies on projections of operating results and debt-free cash flows, discounted using a risk-adjusted weighted-average cost of capital, (2) a market approach which applies sales, earnings and cash flow multiples, derived from market transactions involving comparable companies, to the reporting unit’s operating performance and (3) a cost approach which estimates the fair value of the reporting unit’s net tangible assets as a “replacement cost.” Fair values computed by these methods are derived using a number of assumptions, including economic projections, anticipated future cash flows, consideration of comparable market data within our industry and the cost of capital ascribed to market participants.
| 83 |
Table of Contents
Confidential Treatment Requested Pursuant to 17 C.F.R. Section 200.83
Each reporting units’ projections are based on management’s best estimates of economic and market conditions during the forecasted periods including growth rates, estimated future operating margins and cash expenditures.
For our most recently completed annual goodwill impairment test, with an effective date of June 25, 2017, we determined that our operating segments also represented our reporting units. We analyzed goodwill for the three reporting units with goodwill balances—Atlas, EFM and Pipe—as well as for the recently acquired American Tube business. Based on an analysis of the events and circumstances surrounding each reporting unit, including the fact that the estimated fair value of each reporting unit substantially exceeded the carrying value, we relied on qualitative assessments and the full, two-step goodwill impairment test was not required.
As of March 31, 2018, our total remaining goodwill balance was $914.8 million.
Impairment Testing—Long-Lived Assets
We review the carrying value of our long-lived assets, including property, plant and equipment and identifiable amortizable intangible assets, for possible impairment whenever events or changes in circumstances indicate that the carrying amount of assets or asset groups may not be recoverable. Recoverability of assets or asset groups to be held and used is measured by a comparison of the carrying amount of any asset or asset group to future undiscounted cash flows expected to be generated by the asset or asset group. For any asset or asset group not deemed recoverable on the undiscounted basis, as well as assets held for disposal, the amount of any impairment may be based upon appraisal of the asset, estimated market value of similar assets or estimated cash flows from the disposition of the asset or asset group. As of March 31, 2018, our net property, plant and equipment and identifiable amortizable intangible assets totaled $649.5 million.
Revenue Recognition
Sales, net of related discounts and allowances, are recognized when both title and risk of loss of the product have been transferred to the customer (generally upon shipment), the sales price to the buyer is fixed, collectability is reasonably assured and persuasive evidence of an arrangement exists. Customers take title and assume all the risks of ownership upon shipment. Any sales transaction that deviates from the standard terms and arrangements is reviewed against applicable revenue recognition requirements before being recorded as a sale.
We offer rebates to customers based primarily on sales volume over a specified period, generally one year. We record these rebates as a reduction of revenue based on a percentage of sales to the customer over the predefined purchase goal of that customer at the negotiated rebate rate. Earned rebates are paid to the customer as a credit against future purchases or in cash. On our consolidated balance sheets, rebates that will be settled in cash are recorded in accrued customer rebates while rebates that will be settled with a credit against the customer’s outstanding receivable balance are recorded as an offset to accounts receivable, net. As of March 31, 2018, our estimated rebate obligations totaled $27.3 million.
Income Taxes
We use the liability method of accounting for income taxes. Deferred tax assets and liabilities are recorded for temporary differences between the tax basis of assets and liabilities and their reported amounts in the consolidated financial statements, using statutory tax rates in effect for the year in which the differences are expected to reverse. The effect on deferred tax assets and liabilities of a change in tax rates is recognized in the results of operations in the period that includes the enactment date. A valuation allowance is recorded to reduce the carrying amount of deferred tax assets if it is more likely than not that those assets will not be realized.
| 84 |
Table of Contents
Confidential Treatment Requested Pursuant to 17 C.F.R. Section 200.83
We operate within multiple taxing jurisdictions and are subject to tax filing requirements and audits within these jurisdictions. We establish contingent liabilities for possible assessments by taxing authorities resulting from our reserve for unrecognized tax benefits including, but not limited to, deductibility of certain expenses and other state and local tax matters. Tax examinations are often complex, as tax authorities may disagree with the treatment of items reported by us, and may require several years to resolve. These accrued liabilities represent provisions for taxes that are reasonably expected to be incurred on the basis of available information but which are not certain.
Our reserve for unrecognized tax benefits as of March 31, 2018, including related interest and penalties, was $7.4 million, all of which would affect the effective tax rate, if recognized. As of March 31, 2018, our U.S. federal tax returns are open to IRS examination for fiscal years 2014 through 2016. With limited exceptions, we are also open to various state and local income tax examinations for fiscal years 2008 through 2016. In addition to the ongoing audits noted below, as of March 31, 2018, our Canadian federal tax returns are open to CRA examination for fiscal years 2015 through 2017.
During fiscal year 2013, the CRA’s International Audit section commenced an audit of our fiscal years 2009 through 2011. During fiscal year 2014, the CRA commenced a full scope audit of our fiscal years 2011 and 2012. Certain parts of their full scope audit were completed during fiscal years 2016 and 2017, while other aspects are ongoing. In fiscal year 2017, the CRA commenced a full scope audit of our fiscal years 2013 and 2014.
Pension and Other Postretirement Benefits
We maintain qualified andnon-qualified defined benefit pension plans that cover certain of its employees. In addition to pension benefits, we provide certain health care benefits for eligible employees who meet age, participation and length of service requirements at retirement. The cost of retiree benefits is recognized over the employees’ service period. We use actuarial methods and assumptions in the valuation of defined benefit obligations and the determination of expense. Differences between actual and expected results or changes in the value of obligations and plan assets are not recognized in earnings as they occur but rather systematically over subsequent periods. We measure the plan assets and benefit obligations of our defined benefit plans as of the end of our fiscal year. As of March 31, 2018, our liabilities related to continuing operations defined benefit plans totaled $144.1 million.
Recently Issued Accounting Standards
In June 2014, the Financial Accounting Standards Board (the “FASB”) issued Accounting Standards UpdateNo. 2014-09, Revenue from Contracts with Customers (Topic 606) (“ASU2014-09”). ASU2014-09 provides revised guidance on how an entity should recognize revenue to depict the transfer of promised goods or services to customers in an amount that reflects the consideration to which the entity expects to be entitled in exchange for those goods or services. ASU2014-09 is effective for annual reporting periods beginning after December 15, 2017 (our fiscal year 2019), and interim periods within that annual period. Multiple early adoption effective dates are permitted. We are still in the process of evaluating the effect of adopting ASU2014-09 and cannot reasonably estimate the impact at this time. We have engaged independent, third party specialists to assist in the evaluation. With their help, we are comparing the requirements of the new standard to our existing revenue recognition policies and procedures and performing detailed reviews of the various contracts and customer terms we utilize with regard to sales, rebate programs, commission plans and other arrangements.
In February 2016, the FASB issued Accounting Standards UpdateNo. 2016-02, Leases (Topic 842) (“ASU2016-02”). ASU2016-02 provides revised guidance on accounting for leases, including the requirement for lessees to recognizeright-of-use assets and lease obligation liabilities for primarily all leases. ASU2016-02 is effective for annual periods beginning after December 15, 2018 (our fiscal year 2020), and interim periods within that annual period. Early adoption is permitted. We are still in the process of evaluating the effect of adopting ASU2016-02.
| 85 |
Table of Contents
Confidential Treatment Requested Pursuant to 17 C.F.R. Section 200.83
In August 2016, the FASB issued Accounting Standards UpdateNo. 2016-15, Statement of Cash Flows (Topic 230): Classification of Certain Cash Receipts and Cash Payments—a consensus of the FASB Emerging Issues Task Force (“ASU2016-15”). ASU2016-15 addresses eight specific cash flow issues with the objective of reducing the existing diversity in practice. ASU2016-15 is effective for annual periods beginning after December 15, 2017 (our fiscal year 2019), and interim periods within that annual period. Early adoption is permitted. The adoption of ASU2016-15 is not expected to have a material impact on our financial position, results of operations or cash flows.
In March 2017, the FASB issued Accounting Standards UpdateNo. 2017-07, Compensation—Retirement Benefits (Topic 715): Improving the Presentation of Net Periodic Pension Cost and Net Periodic Postretirement Benefit Cost (“ASU2017-07”). ASU2017-07 requires all elements of pension and other defined benefit postretirement net periodic benefit cost, except service cost, to be shown outside the operating subtotal of the income statement. ASU2017-07 is effective for annual periods beginning after December 15, 2017 (our fiscal year 2019), and interim periods within that annual period. Early adoption is permitted. We are still in the process of evaluating the effect of adoptingASU 2017-07.
Quantitative and Qualitative Disclosures about Market Risk
We are exposed to market risks related to changes in interest rates, foreign currency exchange rates (primarily related to Canadian dollars) and commodity prices. We may utilize derivative financial instruments, among other methods, to hedge some of these exposures. We do not use derivative financial instruments for speculative or trading purposes.
Interest Rate Risk
We are exposed to changes in interest rates on our Term Loan Facility and Revolving Credit Facility. Assuming these facilities are fully drawn and we have not entered into any hedging agreements, eachone-eighth percentage point increase or decrease in the applicable interest rates would correspondingly change our interest expense on the Term Loan Facility and Revolving Credit Facility by approximately $1.6 million per year.
Foreign Currency Risk
Approximately 14% of our net sales from continuing operations for the LTM Period were to customers located outside the United States (primarily in Canada). Significant changes in foreign currency exchange rates could adversely affect our profitability as we translate the financial results of our Canadian operations into U.S. dollars. We consistently evaluate alternatives to help us reasonably manage the profitability risk related to foreign currency exposures.
Commodity Price Risk
Input costs for our products, primarily steel costs, are subject to changes in market price as they are influenced by commodity markets and supply and demand levels, among other factors. Management attempts to mitigate these risks through effective requirements planning and by working closely with key suppliers to obtain the best possible pricing and delivery terms. As of March 31, 2018, we evaluated our commodity pricing exposures and concluded that it was not currently practical to use derivative financial instruments to hedge our current steel commodity price risks.
We are exposed to fluctuations in the price of zinc, which is used as a protective coating on some of our products. In the past, we have entered into commodity swap contracts with a third party lending institution related to the price of zinc. These contracts generally expired within 12 months of each contract date and were accounted for as cash flow hedges. The impact of the contracts on our results of operations was not material during the periods presented.
| 86 |
Table of Contents
Confidential Treatment Requested Pursuant to 17 C.F.R. Section 200.83
Company Overview
We are a leading North American manufacturer of industrial steel pipe and tube products with over 100 years of operating experience. We believe we are the largest producer by volume of structural tubing and electrical conduit products in the United States and Canada on a combined basis, and the largest producer by volume of standard pipe products in the United States. We are headquartered in Chicago, Illinois and have 13 pipe and tube production facilities in seven U.S. states and one Canadian province, with total production of approximately 2.1 million tons from our continuing operations for the LTM Period. We offer a broad array of products marketed under the Atlas, Wheatland, Sharon Tube, Western Tube & Conduit and Picoma brands. For the LTM Period, we sold over 9,800 distinct pipe and tube products to approximately 2,000 customers. We manufacture our products using a variety of raw materials, the most significant of which is HRC. We believe we are the largest consumer of HRC by volume in the United States and Canada.
The majority of our products are used in infrastructure andnon-residential construction applications. We also supply products for use in the fabrication, automotive, oil and gas, agricultural and industrial equipment and retail end markets. We manufacture many of our products to operate under specialized conditions, including inload-bearing,high-pressure, corrosive andhigh-temperature environments.
As of March 31, 2018, we employed approximately 2,100 employees across the United States and Canada, of which approximately 1,500 are hourly employees and 600 are salaried employees. We generate revenue primarily in the United States, which accounted for approximately 86% of our net sales from continuing operations for the LTM Period, with the remainder generated primarily in Canada. For the LTM Period, we generated $2.4 billion of net sales from continuing operations, $197.0 million of income from continuing operations and $408.5 million of Adjusted EBITDA.
Since 2006, we have completed six strategic acquisitions, including most recently the acquisitions of Western Tube and the operating assets and certain liabilities of American Tube in February 2017. Our acquisitions have enabled us to scale our business by offering a more comprehensive range of industrial steel pipe and tube products and broadened our geographic footprint. Following each acquisition, we have successfully integrated acquired product lines, rationalized manufacturing facilities, reduced costs and improved quality control, as well as reduced working capital by applyingjust-in-time inventory management and leveraging our skilled manufacturing and supply chain management processes across the acquired facilities. These six acquisitions also substantially increased our manufacturing scale and consolidated our raw material consumption, which has allowed us to obtain more favorable terms with suppliers.
We intend to continue to expand our leading market positions and scale through a variety of growth initiatives, and to respond to and capitalize on strong demand for our products. We have identified a number of projects to both optimize existing production capacity by increasing utilization across our portfolio of manufacturing facilities, and build new capacity at our existing locations. We also believe that our industry leading scale and advantaged geographic footprint, together with our sophisticated logistics and information sharing systems and manufacturing facilities’ production flexibility, uniquely position us to optimize our capacity by rapidly responding to improving market conditions. In addition to these organic growth initiatives, we maintain and monitor a pipeline of potential acquisition targets.
| 87 |
Table of Contents
Confidential Treatment Requested Pursuant to 17 C.F.R. Section 200.83
Our Product Offerings
We offer a comprehensive range of products to provide the benefits of a“one-stop shop” to approximately 2,000 steel pipe and tube customers. We manufacture products withvalue-added features, such as galvanizing, color coating, bending, threading and coupling. We also provide customized product solutions and we believe we are the only North American manufacturer of certain products such as CW pipe products and14”-16” square and rectangular-shaped structural tubing. We believe that our broad product offerings differentiate us and benefit our customers by allowing them to consolidate their purchases across product lines, manage inventory more efficiently and reduce lead times.
We have three reportable segments: Atlas (structural tubing), EFM (electrical conduit, fittings and couplings, fence pipe and mechanical tubing), and Pipe (standard pipe and fire sprinkler pipe). In addition to these three reportable segments, our consolidated financial results include an “All Other” category which includes our DOM tubing and energy tubular product lines and other non-core activities that are not material enough to require separate disclosure, as well as unallocated corporate costs.
We sell structural tubing under the Atlas brand. We sell electrical conduit, fence pipe and mechanical tubing under the Wheatland and Western Tube & Conduit brands, and fittings and couplings under the Picoma and Wheatland brands. We sell standard pipe, fire sprinkler pipe and energy tubulars under the Wheatland brand. We sell DOM tubing under the Sharon Tube brand.
Reportable | Brand(s) | Percent of net sales from continuing operations (LTM Period) | Selected Key | Application / Uses | ||||||
Atlas | Atlas | 48 | % | • Structural tubing/HSS | • Broad range of construction and architectural applications, including pilings
• Structural component for vehicles
• Agricultural and industrial equipment
• Highway guardrails, signage and other structures | |||||
|
|
|
|
|
| |||||
EFM | Wheatland / Western Tube & Conduit, Picoma | 27 | % | • Electrical conduit | • To encase electrical wires in residential, commercial and industrial construction applications | |||||
• Fittings and couplings | • Connectors for electrical conduit products | |||||||||
• Fence pipe | • Residential, industrial, commercial, military and high security applications to support the wire body of a fence | |||||||||
• Mechanical tubing | • Construction and assembly of a wide range of applications such as playground equipment, solar panel support systems and greenhouse framing | |||||||||
|
|
|
|
|
| |||||
Pipe | Wheatland | 15 | % | • Standard pipe | • Primarily plumbing and heating applications for thelow-pressure conveyance of water, gas, air, steam and other fluids | |||||
• Fire sprinkler pipe | • Fire suppression purposes to transport water to sprinkler heads innon-residential construction sprinkler systems | |||||||||
|
|
|
|
|
| |||||
All Other | Sharon Tube, Wheatland | | 10 | % | • DOM tubing | • Primarily for fluid power applications such as hydraulic cylinders and hydraulic lines and for certain automotive components | ||||
• Energy tubulars | • Primarily used in the oil and gas industry as key components of drilling, exploration and production processes of oil and natural gas and for the transportation of these resources over both short and long distances | |||||||||
• Othernon-core | ||||||||||
| 88 |
Table of Contents
Confidential Treatment Requested Pursuant to 17 C.F.R. Section 200.83
Atlas (48% of Net Sales from Continuing Operations for the LTM Period)
Structural Tubing/HSS. We manufacture and supply cold-formed, high-strength ERW structural tubing. It is used in a broad range of construction and architectural applications, including pilings, structural components for vehicles, agricultural and industrial equipment, highway guardrails, signage and other structures. We produce round, square and rectangular-shaped structural tubing in a broad range of sizes and wall thicknesses. We also provide coating technologies and sell specialized structural tubing products with specialty steel chemistries such as copper-bearing, high-strengthlow-alloy, roll-over protective structure and weathering steels.
Electrical, Fence and Mechanical (27% of Net Sales from Continuing Operations for the LTM Period)
Electrical Conduit. We manufacture and supply electrical conduit for use in residential, commercial and industrial construction applications. Our line of electrical products consists of rigid steel conduit, electrical metallic tubing and intermediate metallic conduit. The electrical product line also sources and sells certain tubing products made of aluminum and other materials for use in electrical applications.
Fittings and Couplings. We manufacture and supply conduit accessories such as electrical fittings and couplings, which are used by installers to reduce labor costs and improve ease of application. We believe we are the only conduit manufacturer in North America that manufactures its own lines of fittings and couplings.
Fence Pipe. We manufacture and supply a line of galvanized steel fence pipe products. These products provide the framework for a metal fence, supporting the chain link or woven wire fence body. Fence pipe products are used in residential, industrial, commercial, military and high security applications. We believe we are the only manufacturer of fence pipe in the United States that manufactures all three steel fence productlines—hot-dip galvanized,in-line flow coat, andpre-galvanized fence products.
Mechanical Tubing. We manufacture and supply various galvanized and bare mechanical steel tube products in a variety of shapes, sizes and lengths. These products are used by fabricators in the construction and assembly of a wide range of applications such as playground equipment, solar panel support systems and greenhouse framing.
Pipe (15% of Net Sales from Continuing Operations for the LTM Period)
Standard Pipe. We manufacture and supply standard pipe for use in thelow-pressure conveyance of water, gas, air, steam and other fluids. Standard pipe is found in plumbing, heating, air conditioning, drinking water and other pipe transmission systems, as well as in some structural applications. We produce a variety of standard pipe products using both CW and ERW processes, overtwo-thirds of which have value-added features such as galvanizing, threading or coupling. We believe we are the only manufacturer in the United States that manufactures CW standard pipe. CW standard pipe has unique characteristics for ease of further processing by end users such as threading and bending.
Fire Sprinkler Pipe. We manufacture and supply a wide line of fire sprinkler pipe products that are used in sprinkler systems that are installed in industrial, commercial, governmental and residential facilities.
All Other (10% of Net Sales from Continuing Operations for the LTM Period)
DOM Tubing. We manufacture and supply DOM tubing that is used for applications where precise dimensional and mechanical tolerances are required. The product is manufactured by drawing
| 89 |
Table of Contents
Confidential Treatment Requested Pursuant to 17 C.F.R. Section 200.83
ERW tubing over a mandrel through a precision ground die, creating a tube with uniform grain structure, hardness and a high degree of dimensional accuracy. DOM tubing is used in hydraulic mechanisms, automotive applications such as brake systems, steering columns and axles, and various other industrial applications.
Energy Tubulars. We manufacture and supply energy tubular products including OCTG and line pipe. OCTG is used in the oil and gas industry as key components of the drilling, exploration and production processes of oil and natural gas. Line pipe is used for the transportation of these resources over long and short distances. We manufacture a diversified line of OCTG and line pipe products in a variety of grades for use in oil and gas fields across the United States and Canada. We previously marketed OCTG products used in connection with drilling and exploration under our EnergeX brand; however, today we primarily sell all of our energy tubular products under our Wheatland brand.
Illustrative Uses of Our Products
Our Steel Pipe and Tube Manufacturing Facilities and Processes
We operate 13 pipe and tube manufacturing facilities, of which 12 are owned and one is leased. One of these facilities, located in Sharon, Pennsylvania, is currently idled, and may be restarted if market conditions are supportive. Our manufacturing facilities are located in the United States in the Midwest / Great Lakes region, the Southeast, and in California, as well as in Ontario, Canada. The facilities are strategically located in close proximity to our primary steel suppliers and to our customers, which minimizes potential disruption to deliveries of raw materials and allows us to optimize freight costs, lower our inventory levels and reduce lead times for our customers. We believe we employ some of the most advanced technical capabilities in the steel pipe and tube industry, including modern,high-speed, quick change pipe and tube mills.
| 90 |
Table of Contents
Confidential Treatment Requested Pursuant to 17 C.F.R. Section 200.83
Steel Pipe and Tube Production Capabilities(1)
Location | LTM Production (kt) | Production Capacity (kt) | Atlas | EFM | Pipe | Other | ||||||||||
Harrow, ON | 484 | 662 | ✓ | ✓ | ||||||||||||
Chicago, IL (HSS) | 424 | 494 | ✓ | |||||||||||||
Blytheville, AR | 48 | 328 | ✓ | ✓ | ||||||||||||
Plymouth, MI | 172 | 169 | ✓ | |||||||||||||
Birmingham, AL | 96 | 100 | ✓ | |||||||||||||
Wheatland, PA (Council Avenue) | 234 | 255 | ✓ | ✓ | ||||||||||||
Chicago, IL (Pipe) | 197 | 250 | ✓ | ✓ | ✓ | |||||||||||
Warren, OH | 219 | 230 | ✓ | ✓ | ✓ | |||||||||||
Long Beach, CA | 101 | 150 | ✓ | ✓ | ||||||||||||
Wheatland, PA (Church Street) / Niles, OH | 66 | 120 | ✓ | ✓ | ✓ | |||||||||||
Cambridge, OH | 16 | 17 | ✓ | |||||||||||||
Sharon, PA (idled) (Mill Street) | — | 75 | ✓ | ✓ | ||||||||||||
|
|
|
| |||||||||||||
Total: | 2,057 | 2,850 | ||||||||||||||
|
|
|
| |||||||||||||
| (1) | Continuing operations only. |
Our Production Footprint
Note: Excludes facilities in Thomasville, Alabama and Welland, Ontario that are currently idled and held for sale. Also excludes Winnipeg, Manitoba warehouse andZ-Modular facilities.
We employ twopipe-milling technologies—ERW and CW:
| • | Electric Resistance Weld. ERW pipe iscold-formed fromflat-rolled strip steel and electrically welded into a tubular shape. Approximately 88% of our continuing operations’ volume is produced using the ERW process. |
| 91 |
Table of Contents
Confidential Treatment Requested Pursuant to 17 C.F.R. Section 200.83
| • | Continuous Weld. CW pipe is formed fromflat-rolled strip steel that has been heated in a naturalgas-powered furnace operating at temperatures of up to 2,500 degrees Fahrenheit and welded into a tubular shape with a blast of oxygen. This process creates products that are optimal for bending and threading. |
In addition topipe-milling, we employ a broad array of finishing techniques, including DOM,in-line galvanizing,hot-dip galvanizing, heat treating, threading, roll grooving, coupling and color coating.
Our Customers
Our main customers include metal service centers, plumbing distributors, pipe, valve and fitting distributors, electrical wholesalers, retail home improvement centers, large scale construction fabricators, piling contractors, OEMs, rack fabricators, fire sprinkler fabricators, fence supply houses and oil and gas end users as well as distributors.
We have had relationships with many of our customers for more than 20 years. We sell to a broad customer base and are not dependent on any single customer, with our largest customer representing approximately 9% of our total tons sold and 7% of our total net sales from continuing operations for the LTM Period. Our top ten customers represented approximately 31% of our total tons sold and 26% of our total net sales from continuing operations for the LTM Period.
We have developed a proprietary vendor managed inventory program called AIM for use by our larger metal service center structural tubing customers. This program provides customers with an optimized inventory management solution by giving us direct access to distributor sales and stock levels. Customer use of the AIM program is high for our structural tubing business, and we are in the process of rolling this program out to customers of our other product lines as well. We believe our AIM program is an important source of competitive advantage and commercial differentiation, as well as a means of enhancing order flow regularity.
Metal service centers are the primary customers of our structural tubing products. We also sell structural tubing direct to certain fabricators and large contractors.
Our EFM products are typically sold to national chains and major independent electrical supply houses as well as to OEMs,re-packagers and wholesale distributors in thenon-residential construction and general industrial end markets.
Customers of standard pipe products include large and small distributors as well as wholesalers, all of which sell into a variety of end markets. We maintain the flexibility to optimize our sales to both large and small distributors to maximize customer service and product profitability. For sales to larger distributors and wholesalers, our master distributor program for standard pipe has enabled us to concentrate our efforts on serving fewer customers with larger order sizes, optimizing production efficiencies and shipping logistics. We sell fire sprinkler pipe primarily to sprinkler distributors and fabricators.
DOM tubing is generally specifically engineered to end customer needs and is sold directly to OEMs and through metal service centers. Oil and gas end users and distributors are the primary customers of our energy tubular products.
Our Suppliers and Raw Material Input
Our primary raw material input is HRC and we believe we are the largest consumer of HRC by volume in the United States and Canada. We purchase our HRC from a variety of sources and consolidate purchases among our top suppliers to improve cost and delivery terms. For the LTM Period, we purchased 71% of our HRC from domestic producers and the remainder from foreign
| 92 |
Table of Contents
Confidential Treatment Requested Pursuant to 17 C.F.R. Section 200.83
supply sources, primarily Canadian suppliers. We maintain flexibility to purchase raw materials from a variety of sources based on price, availability and end-user specifications. For example, we maintain active relationships with other suppliers to ensure alternative sources of supply. We have also developed supply programs with certain of our key suppliers that we believe provide us with reduced lead times for steel purchases relative to our competitors. For several years we have also purchased a significant portion of our raw materials from suppliers that are able to certify that their product is “made and melted” in the United States in order to satisfy the requirements of certain end users. We believe our scale is a key competitive advantage, as we are able to leverage our purchasing volume and market insights to obtain more favorable terms from our suppliers and drive procurement savings.
Our Industry and Competition
We operate in the industrial steel pipe and tube products industry, which historically has been a highly fragmented industry. Our competitors include Allied Tube & Conduit (Atkore International), Independence Tube (Nucor Corp.), Southland Tube (Nucor Corp.), Republic Conduit (Nucor Corp.), TMK IPSCO (OAO TMK), Bull Moose Tube, EXL Tube, Maruichi Leavitt Pipe & Tube and many smaller, primarily local family-owned manufacturers. We compete primarily on the basis of price, quality, delivery terms and customer service. In recent years, we and certain of our competitors have been active in acquiring smaller industrial steel pipe and tube products companies within our industry.
The largest drivers of domestic consumption for steel pipe and tube products are thenon-residential construction, infrastructure, OCTG and general industrial markets. Recent improvements in demand for our products suggest that key end markets are continuing to strengthen, withnon-residential construction spend estimated to continue to increase over the next few years as shown in the graph below (left). Additionally, the Architecture Billings Index, a measure of non-residential construction activity, has reflected increased architectural billings for 20 of the past 24 months, as of March 31, 2018, as shown in the graph below (right).
TotalNon-Residential Put in Place Est. for the United States ($ in billions)(1) | Architecture Billings Index(2) | |
| | |
| Source: United States Census and FMI Forecasts as of Q1 2018 | Source: The American Institute of Architects |
| (1) | Includes Construction Put in Place forNon-Residential Buildings andNon-Building Structures. |
| (2) | Values in excess of 50 indicate reported increase in architecture billing activity by survey participants. |
| 93 |
Table of Contents
Confidential Treatment Requested Pursuant to 17 C.F.R. Section 200.83
Foreign Competition
Historically, foreign competition has been most significant in the standard pipe and energy tubular markets, with foreign production excluding Canada estimated to represent 47% and 53%, respectively, of volumes of tons sold in the United States for the LTM Period. Because many of our customers’ product applications require domestically manufactured pipe and tube components, and since imported products and our product portfolio in particular, must be shipped long distances via ocean freight at a high cost and at risk of product damage, we believe domestically produced standard pipe and energy tubular products will remain competitive with imported products, independent of certain trade case actions described in greater detail below. More specifically, while we face competition from foreign manufacturers, we believe that recent developments, particularly the implementation of trade sanctions against unfairly traded steel in connection with Section 232, meaningfully enhance our competitive positioning relative to foreign sources of supply. We believe that the implementation of trade relief in connection with Section 232 (and trade deals negotiated in connection therewith) will cause foreign production to account for a lesser share of total volumes sold in the United States for the foreseeable future.
Independent of the implementation of trade sanctions in connection with Section 232, our competitive position relative to imports historically has benefited from the implementation and enforcement of trade cases related specifically to our products, in particular our standard pipe products. For example, over the past several years, there have been trade actions taken by the DOC and the ITC with respect to imports that compete with our standard pipe products. In 2012, the ITC implemented duties on CW pipe from eight countries, and in early 2018 the ITC extended these duties for another five years, issuing preliminary margins ranging from approximately 9% to 38%. In addition, in early 2018, the DOC announced the preliminary results of antidumping duty orders on imports of line pipe from South Korea. The preliminary duty rates range from approximately 2% to 19%. Final duty determinations are expected to be implemented by the end of calendar year 2018. If final duty determination is made by the DOC and the ITC, duties will be in effect for five years, subject to extension for another five years.
Our structural tubing and electrical conduit markets face less competition from imports.For our structural tubing business,we believe our quick-rolling cycles, high levels of product availability and custom product qualities enhance our competitive position relative to foreign sources of supply. We estimate that foreign-produced structural tubing products accounted for approximately 7% of the volume of such products sold in the United States and Canada for the LTM Period. For our electrical conduit business, we believe imports are limited due primarily to the light wall dimensions of electrical conduit, which leaves the product particularly susceptible to ocean freight damage. In general, our business systems, AIM, and our full offering of product lines allow us to compete against imports by affording customers the ability to experience rapid inventory turnover which in turn minimizes potential price fluctuations and reduces the customers’ working capital needs.
Steel Market Dynamics
The market price of our products is closely related to the price of HRC. The price of benchmark HRC is primarily affected by the demand for steel and the cost of raw materials. Robust global growth, along with steel production capacity rationalization in China and raw material price increases, has caused HRC prices to strengthen since 2016, from $386/ton on January 1, 2016 to $651/ton on January 1, 2018. More recently, trade case actions on the part of the United States government have also impacted HRC prices. On March 1, 2018, President Trump announced that his administration would implement trade actions against unfairly traded steel in connection with Section 232. Since January 1, 2018, HRC prices have increased by $204/ton, to $855/ton as of March 31, 2018.
| 94 |
Table of Contents
Confidential Treatment Requested Pursuant to 17 C.F.R. Section 200.83
Hot Rolled Coil Prices ($/Ton)
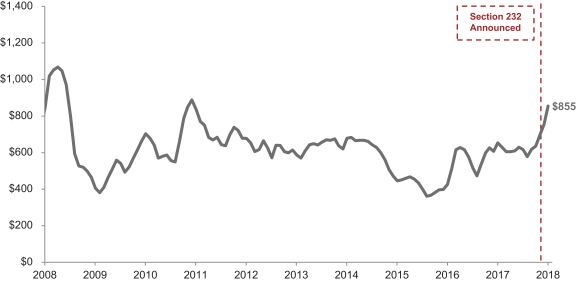
| Source: | Commodity Research Unit (CRU) |
Despite a period of rising HRC prices and significantly improved end-user demand in overall and non-residential construction, customer inventories continue to remain historically low. As a result of these low inventory levels, any further increase in end-user demand for steel products could result in increased demand through the supply chain (including for our products).
Metal Service Center Inventories (kt)
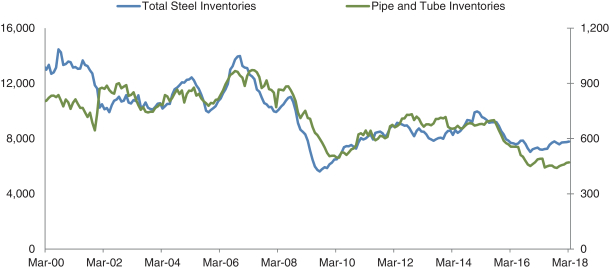
| Source: | Metal Service Center Institute, Metals Activity Report |
While the volatility of HRC has resulted in corresponding volatility in the prices of our products, we seek to pass HRC price increases on to our customers. We sell our products on a non-contractual spot basis, which has allowed us to successfully limit our commodity price exposure through our price negotiation, raw material procurement and inventory management program.Although the price of our
| 95 |
Table of Contents
Confidential Treatment Requested Pursuant to 17 C.F.R. Section 200.83
products closely relates to the price of HRC, there may be a time lag between when changes in prices charged by our suppliers take effect and the point when we can implement corresponding changes in the prices of our products. Our successful track record in managing underlying commodity price exposure is evident in our financial performance over the last several years, during which we have successfully grown Adjusted EBITDA per ton throughout a period of HRC price volatility as evidenced by the chart below.
HRC Price Volatility and Adjusted EBITDA / Ton(1)
| (1) | See “Non-GAAP Financial Measures” and “Summary Consolidated Financial and Other Data—Non-GAAP Reconciliation” for more information about our use of Adjusted EBITDA and derivative operating measures such as Adjusted EBITDA per ton, as well as a reconciliation to income from continuing operations. In the periods presented in the above table, income from continuing operations was $5.8 million in fiscal year 2015, $85.1 million in fiscal year 2016, $163.3 million in fiscal year 2017 and $197.0 million in the LTM Period. |
Underlying HRC price volatility is also mitigated through the counter-cyclical nature of our working capital flows, with increases in working capital when HRC prices rise and releases of working capital when HRC prices fall, resulting in relative stability in our net cash flows provided by operating activities.
| 96 |
Table of Contents
Confidential Treatment Requested Pursuant to 17 C.F.R. Section 200.83
HRC Price Volatility and Net Cash Flows provided by Operating Activities
Our Competitive Strengths
We believe that the following competitive strengths enhance our market position:
A Leading Producer in North America. We believe we are the largest producer by volume of structural tubing and electrical conduit products in the United States and Canada on a combined basis, and the largest producer by volume of standard pipe products in the United States.
| LTM Period | ||||||||||
| Estimated Share (1) | Tons (kt) (2) | Closest competitors | ||||||||
Structural tubing | 29% | 1,206 | Independence Tube (Nucor), Southland Tube (Nucor), | |||||||
|
| Maruichi Leavitt Pipe & Tube | ||||||||
Electrical conduit | 48% | 259 | Allied Tube & Conduit (Atkore International), | |||||||
|
| Republic Conduit (Nucor) | ||||||||
Standard pipe | 20 | % | 385 | Bull Moose Tube, EXL Tube, foreign producers | ||||||
Source: NEMA, Preston Pipe & Tube Report, MSCI and management estimates.
| (1) | For structural tubing and electrical conduit, estimated share is for the United States and Canada on a combined basis. For standard pipe, estimated share is for the United States. |
| (2) | Represents our shipments in the LTM period. |
Advantaged Manufacturing Footprint. We believe our network of facilities gives us an advantaged manufacturing footprint in the United States and Canada, with an operating presence in the Midwest / Great Lakes region, the Southeast and the West Coast. Our strategically located facilities are in close proximity to our primary steel suppliers and to our customers in each of our key regions, which minimizes potential disruption to deliveries of raw materials and allows us to realize freight cost savings, while also lowering our inventory levels and reducing lead times and freight costs for our customers. Our network of strategically located facilities also allows us to be more responsive than competitors in leveraging and capitalizing on market and growth opportunities within each of the
| 97 |
Table of Contents
Confidential Treatment Requested Pursuant to 17 C.F.R. Section 200.83
regions in which we operate. We have solidified our industry advantaged footprint through selective acquisitions, where we believe we have a demonstrated track record of successfully acquiring and integrating businesses, as well as investing organically.
Important Supplier to Our Customers and End Markets. With our product diversity, quality and reliability, we are able to serve as a“one-stop shop” for many of our customers with numerous customer relationships of over 20 years in length. Our manufacturing and distribution advantages and quick turnaround times from order to shipment create high customer retention rates. Moreover, our product mix, sophisticated logistics, information technology systems, including an SAP enterprise resource planning system, and specialized manufacturing capabilities allow us to effectively bundle shipments, thereby reducing transportation costs and lead times. We produce over 9,800 distinct pipe and tube products in a broad range of sizes and shapes and we believe we are the only North American manufacturer of certain products such as CW pipe products and14”-16” square and rectangular-shaped structural tubing. Consequently, we are an important supplier for the majority of our steel service centers and major distributor customers and the end markets that they serve.
Efficient Operations with Significant Scale and Purchasing Power. We have total annual production capacity of approximately 2.9 million tons from continuing operations and have continuously invested in equipment, processes and training to increase throughput, yields and efficiencies. Our scale also benefits our procurement of raw materials. As we believe we are the largest consumer of HRC by volume in the United States and Canada, we believe we are able to leverage our scale to drive procurement savings. Our manufacturing scale and raw material consumption also allow us to aggregate purchasing and obtain more favorable terms from our suppliers. Over the past several years, management has implemented cost and production efficiency initiatives, while managing capital expenditures to optimize physical assets. These improvements have enabled us to successfully and profitably satisfy growing demand in the end markets related to products we sell.
Low Cost and Highly Variable Cost Structure. Our scale and flexible manufacturing base enable us to maintain a highly variable cost structure, with variable costs accounting for 82% of total costs for the LTM Period, of which steel accounts for 61% of total costs. We believe this cost structure, which is underpinned by our industry leading scale and network of facilities located in close proximity to suppliers and customers, is among the lowest compared to our competitors in the United States and Canada. The following chart illustrates the key components of our highly variable cost structure.
| (1) | Total Variable Costs include Steel, Freight and Conversion (Variable). |
| 98 |
Table of Contents
Confidential Treatment Requested Pursuant to 17 C.F.R. Section 200.83
Experienced and Proven Management Team. Our senior management team has decades of leadership experience in the industrial steel pipe and tube industry and other relevant industrial sectors. We believe our senior management team is supported by a strong executive and operating leadership organization, including our corporate vice presidents and production facility leaders, who are seasoned operators with valuable insight into and deep knowledge of the industrial steel pipe and tube market. Our Executive Chairman and CEO, Barry Zekelman, has served in leadership capacities at Zekelman Industries and its predecessors for over 30 years. Barry Zekelman is supported by a team of operating executives with over 100 cumulative years of steel tube and pipe sector experience, who have managed the business through steel price cycles, shifting macroeconomic climates and different capital structures.
Growth Strategy
We intend to expand our leading market positions and scale through organic and inorganic growth initiatives. At present, we have identified a number of projects to both optimize existing production capacity at minimal incremental capital cost, and to modernize and build new capacity at our existing locations to respond to and capitalize on market opportunities. Specifically, we believe that the continued recovery of non-residential construction and infrastructure end-market demand supports production capacity optimization initiatives. For example, between 2010 and 2018 (based on annualized data as of the end April 2018), HSS consumption in the United States and Canada on a combined basis has grown at an average annual rate of approximately 5%, from 2.6 million tons to 3.9 million tons, based on market research from MSCI. Growth in the consumption of HSS has been driven by recovery of non-residential construction and infrastructure spend, as well as increased penetration and acceptance of products using HSS relative to competing building products. We believe that demand for products using HSS will continue to remain strong for the foreseeable future, and we believe our portfolio of highly efficient structural mills, which feature quick change capabilities, are well positioned to capitalize on this market strength through specific optimization initiatives described in further detail below. In addition to the HSS market opportunity, we believe that our structural mills are well positioned to flexibly produce a variety of other steel pipe and tube products with modest incremental capital expenditure. For example, this flexibility enables us to produce energy tubulars, fence and mechanical products and certain types of standard pipe products. As we respond to and capitalize on opportunities in the market as part of our growth strategy, we have primarily focused our investment in optimizing, modernizing and building new capacity in our Atlas structural tube facilities, though also have identified opportunities in our other businesses as well.
In addition to these organic growth opportunities, we maintain and monitor a pipeline of potential acquisition targets. We believe we have a demonstrated track record of successfully acquiring and integrating businesses.
We Intend to Grow by Optimizing and Modernizing Capacity to Capitalize on Market Opportunities.
For the LTM Period, we estimate that utilization levels for our key business segments were70-75% for Atlas (inclusive of our Blytheville, Arkansas manufacturing facility, which we are currently in the process of restarting and modernizing),75-80% for EFM and80-85% for Pipe (inclusive of our currently idled Mill Street manufacturing facility in Sharon, Pennsylvania). We believe that strong demand for our products and sustained strength in our products’ end markets present us with a number of opportunities to flexibly grow production and sales by increasing utilization across our portfolio of manufacturing facilities. We also believe that our industry leading scale and advantaged geographic footprint, together with our sophisticated logistics and information sharing systems and manufacturing facilities’ production flexibility, uniquely position us to optimize our capacity by rapidly responding to improving market conditions. Strength in end-market demand for domestically produced products is further supported by the anticipated favorable competitive impact to our business from the
| 99 |
Table of Contents
Confidential Treatment Requested Pursuant to 17 C.F.R. Section 200.83
implementation of trade actions against unfairly traded steel and steel products in connection with Section 232.
Within our Atlas business, we are in the process of increasing utilization and optimizing production capacity to respond to current and anticipated market conditions. Specific capacity optimization initiatives that are currently underway include:
| • | We are restarting and modernizing our previously idled Blytheville, Arkansas manufacturing facility in response to strong and growing end-market demand for structural tubing products in the Southeast and Southwest regions of the United States. We estimate the cost of restarting and modernizing our Blytheville facility will total approximately $30 million, of which substantially all is expected to be spent by the end of calendar year 2018. The modernization of this facility is expected to result in an incremental 62 kt of annual production capacity, resulting in annualized production capacity of approximately 390 kt by the end of the second quarter of fiscal year 2019. We also expect that the restart and modernization of operations at our Blytheville facility will allow us to optimize warehouse and logistics costs in the Southeast, particularly with respect to our recently acquired American Tube manufacturing facility in Birmingham, Alabama. |
| • | In connection with the restart of our Blytheville facility, we intend to optimize and geographically rationalize production of certain structural tubing products at our Chicago, Illinois HSS mill. Currently, our Chicago HSS mill services market demand both in the Midwest / Great Lakes region and the Southeast for a variety of structural tubing products. Once the restart and modernization is completed, we expect our Blytheville, Arkansas manufacturing facility will more efficiently and cost effectively service market demand in the Southeast and Southwest for structural tubing, particularly larger diameter products. As a result, we expect our Chicago facility to be better positioned to flexibly increase its production of structural tubing for sale in the Midwest / Great Lakes region at no incremental capital cost. We expect that these two initiatives will result in a net increase in structural tubing production, driven by the ongoing restart and modernization of the Blytheville facility, as well as net reduction in operating and transportation costs, as our Blytheville and Chicago facilities become better positioned to more efficiently meet demand within their respective geographic markets. |
| • | In response to market conditions in Canada, we have begun the construction of a new HSS mill at our Harrow, Ontario operation. We anticipate this mill will have the capability to produce smaller sized structural tubing, similar to what we currently produce at our Plymouth, Michigan manufacturing facility, to service strong demand for this product in the Canadian market. We expect that the new mill will eliminate cross border shipments from Plymouth into Canada, freeing up our Plymouth facility’s capacity and reducing freight costs. We anticipate the installation of this mill will be completed in the third quarter of fiscal year 2019, and reach full annual production capacity of approximately 80 kt by the end of the second quarter of fiscal year 2020. Capital expenditures for the construction of this mill are expected to total approximately $13 million. |
Within our other business units, we have also identified a number of opportunities to optimize production and increase utilization in response to anticipated demand in our key markets and geographies. Specific initiatives include:
| • | Within our EFM business, we are in the process of increasing utilization and optimizing mix at our manufacturing facilities by increasing output of fence products with a more differentiated market position and potential higher operating margin. At our Chicago, Illinois Pipe facility and our Long Beach, California facility, we are broadening our mix by producing a new line of fence framework products frompre-galvanized steel to complement our existing production of high qualityin-line flow coat andhot-dip galvanized fence products. We believe we are now the only United States manufacturer of all three fence product lines. Based on current prices and costs, |
| 100 |
Table of Contents
Confidential Treatment Requested Pursuant to 17 C.F.R. Section 200.83
| we currently estimate that we are able to earn$75-100/ton more for the sale ofpre-galvanized fence versus our bare mechanical product. |
| • | We believe that increased drilling activity in the United States and Canadian oil and gas end market, along with the improving competitive dynamic for energy tubular products relative to foreign imports, has resulted in an increase in demand for domestically produced energy tubular. As a result, we are in the process of optimizing mix at our Warren, Ohio manufacturing facility and producing more energy tubular by increasing utilization of existing capacity at little incremental capital cost. We are also using our other highly efficient ERW mills to create hollows and green tube product, which we sell to third party processors to finish for energy tubular end uses. |
| • | Within our Pipe business, although no decision has been made, we have the opportunity to restart our Mill Street manufacturing facility in Sharon, Pennsylvania, which was previously idled in fiscal year 2015. Specifically, we are optimistic that strengthening market conditions for small diameter pipe, supported by improving competitive dynamics for these products relative to foreign imports, position us to consider a potential restart of production capacity at Mill Street. We believe that if the Mill Street facility is restarted, we would have the opportunity to shift annual production capacity of approximately 75 kt of small diameter pipe from our Council Avenue facility in Wheatland, Pennsylvania to the Mill Street facility, as we believe the production equipment there has the capability to more efficiently and cost effectively produce smaller diameter products than Council Avenue. Also, by shifting production capacity of smaller diameter products to the Mill Street facility, we would position our Council Avenue facility to increase production capacity of larger diameter products by approximately 130 kt annually. While no final decision has been made with respect to the potential restart of the Mill Street facility, we expect that doing so would result inone-time costs of approximately $5 million, with the facility becoming fully operational within six to nine months. |
A summary of selected optimization and modernization initiatives and other identified opportunities is included in the following table.
Summary of Selected Potential Capacity Optimization Initiatives
Manufacturing Facility | Reportable | Description | Production Capacity (kt) | Estimated Start-up Costs ($ in millions) | Anticipated Completion | |||||||||||
Blytheville(1) | Atlas | In-Process Restart | 120 | 2019 | ||||||||||||
Blytheville(2) | Atlas | Restart & Mill Modernization | 270 | 2019 | ||||||||||||
Subtotal: | 390 | $ | 30 | |||||||||||||
Harrow | Atlas | New Mill Addition | 80 | $ | 13 | 2019 | ||||||||||
Mill Street(3) | Pipe | Idled, Potential Restart | 75 | $ | 5 | 2019 | ||||||||||
Council Avenue(3)(4) | Pipe | Potential Mix Shift Optimization | 55 | — | 2019 | |||||||||||
| (1) | Inclusive of 48 kt of production during the LTM Period and current production capacity of 120 kt. |
| (2) | Inclusive of 62 kt increase in production capacity relative to current production capacity of 208 kt. Increase in production capacity due to mill modernization. |
| (3) | No decision has been made yet with respect to this project. |
| (4) | Represents 130 kt of potential incremental production capacity, net of 75 kt of production capacity shifted to Mill Street. |
We also have the Opportunity to Grow by Building New Capacity to Capitalize on Market Opportunities.
Alongside our efforts to optimize our existing capacity, we have also identified opportunities to profitably add additional production capacity to enhance our operating footprint and grow our positions
| 101 |
Table of Contents
Confidential Treatment Requested Pursuant to 17 C.F.R. Section 200.83
in certain markets. Specifically, for our structural tubing and related piling products, we believe there is an opportunity to add further capacity at our Blytheville manufacturing facility, particularly for the production of the largest diameter structural tubing products which are commonly used in infrastructure projects outside of the United States, but have had limited domestic acceptance to date. Within the United States, demand for these large diameter structural tubing products historically has been satisfied by imports, primarily from Japan, although we believe domestic demand for these products has also been minimal due to limited availability of supply. We now believe that market conditions may be supportive of adding domestic production capacity for these products, given the anticipated increase in infrastructure spend in the United States. We also believe that trade actions on unfairly traded steel in connection with Section 232 could enhance the competitive positioning of potential domestic production. Additional investments in finishing line equipment could also be made to supply large diameter pipeline products to meet demand in the energy tubular market. While no final construction decisions have been made, we estimate that the construction of a new large diameter structural tubing mill at our Blytheville manufacturing facility with annual production capacity of up to 400 kt would cost approximately $125 million, with first production within 24-36 months from project approval.
We have Made an Investment in the Fast-Growing Business of Permanent Modular Construction.
We are in the early stages of building a new business, calledZ-Modular, to take advantage of what we believe to be attractive market trends in modular construction. The permanent modular construction industry is a growing segment within the overall commercial construction market, representing 3.2% of the total construction spend in North America in 2016 (up from 2.4% in North America in 2014). According to the Modular Building Institute, the modular construction market reported estimated revenues of approximately $3 billion in 2016, up 50% from estimated revenues of $2 billion in 2011. The market is anticipated to continue to experience robust growth based on the growth of the industry’s six key markets—multifamily housing, retail / commercial, education, healthcare, institutional and assembly and office and administrative.Z-Modular designs, manufactures and installs permanent modular buildings using our patented VectorBloc system of construction. We believe the VectorBloc system of construction is the most precise structural connection system available and offers best in class in quality,build-out efficiency and total project cost. Our unique proprietary patented connections allow for rapid finished vertical construction up to 14 stories in height. As of March 31, 2018, we have made a modest cumulative investment of $5.2 million in property, plant and equipment and intangible assets to prove out our concepts, establish optimal manufacturing methods and establish a commercially viable product line. We anticipate additional modest capital investments in the near-term, including fiscal year 2019, as we continue to establish the business. Over the long-term, the nature and extent of our investments will be dictated by the development of the market and opportunities that may arise. We intend to participate in the permanent modular construction industry in North America as a full-service designer, manufacturer and installer of permanent modular construction and by selling products and services to authorized modular construction partners that build using our technology. We also believe there is a market to license our technology outside of North America. Finally, there is an opportunity for our steel pipe and tube products to be used inZ-Modular projects.
Business Strategy
Our primary objective is to create value by sustaining growth in earnings and cash flows from operating activities over various economic cycles. To achieve this objective, we strive to improve our cost structure, provide high quality service and products, expand our product offerings and increase our market share.
| 102 |
Table of Contents
Confidential Treatment Requested Pursuant to 17 C.F.R. Section 200.83
Expand Leading Market Positions. We believe that our leading market position and scale are our most compelling competitive strengths. Our management team is focused on expanding market share, which we believe will generate operating leverage and improved financial performance. We believe this can be accomplished through acquisitions and organic initiatives, including offering new products, serving additional end markets and increasing customer penetration and geographic coverage. As part of our business strategy, we evaluate acquisition opportunities from time to time.
Optimize Our Portfolio and Product Mix to be Responsive to Market Conditions. We seek to maintain flexibility to adjust our product mix and rapidly respond to changing market conditions. While prioritizing our highest margin products, we regularly evaluate our portfolio of assets to ensure that our offerings are responsive to prevailing market conditions. Our recent restart of our Blytheville, Arkansas manufacturing facility and the ongoing construction of additional production capacity at our Harrow, Ontario manufacturing facility reflect our continued focus on responding to our markets’ needs. We will continue to assess and pursue other similar opportunities to utilize, optimize and grow production capacity to capitalize on market opportunities.
Provide Superior Quality Products and Customer Service. Our products play a critical role in a variety of construction, infrastructure, equipment and safety applications. Our emphasis on manufacturing processes, quality control testing and product development helps us deliver ahigh-quality product to our customers. We focus on providing superior customer service through our geographic manufacturing footprint and continued development of our proprietary, vendor managed AIM system, as well as our experienced customer service teams and sales forces. We also seek to provide high-quality customer service through continued warehouse optimization, including increased digitization and automation of certain systems to debottleneck loading and dispatch logistics and improve truck availability. We believe that superior warehouse, transportation and shipping logistics represents a key point of commercial differentiation relative to our competitors.
Focus on Efficient Manufacturing and Cost Management. We strive for continued operational excellence with the goal of providinghigh-quality products at competitive prices. Our operating personnel continually examine costs and profitability by product, plant and region. Our goal is to maximize operational benchmarks by leveraging skilled manufacturing and supply chain management processes.
Focus on Key Supplier Relationships. We believe that our relationships with our key suppliers provide a competitive advantage in serving our customers. We have developed purchasing programs that we believe improve our access to raw materials and reduce our lead times. Our ability to provide our suppliers with accurate information regarding our future demands is critical to this relationship. In doing so, we are focused on accurate demand planning and have invested in systems to enhance this function.
Execute Pricing Strategy to Pass Through Underlying Costs. We believe we have a long track record of managing underlying commodity price exposure through our price negotiation, raw material procurement and inventory management program. In addition to managing underlying commodity prices, more recently we have had success in sharing transportation costs with our customers through our product pricing strategies, particularly for our electrical conduit products. We believe there is opportunity to implement this pricing strategy for our other products as well.
Our History
The Zekelman family founded our largest business, Atlas, in 1984, and has a long history of successful leadership in the steel pipe and tube industry. Barry Zekelman, our Executive Chairman and CEO, and his brothers, Alan Zekelman and Clayton Zekelman, members of our Board of Directors, assumed leadership of Atlas from their father in 1986 and led it through a period of robust growth. Since 1986, our Company has grown from a single structural tubing manufacturing facility located in
| 103 |
Table of Contents
Confidential Treatment Requested Pursuant to 17 C.F.R. Section 200.83
Harrow, Ontario with annual sales of less than $1.5 million, to a leading North American manufacturer of industrial steel pipe and tube products, with 13 pipe and tube production facilities across seven U.S. states and one Canadian province with total production of approximately 2.1 million tons from our continuing operations and net sales from continuing operations of $2.4 billion for the LTM Period.
Zekelman Industries has grown both through organic investment as well as selective strategic acquisitions. In 2006, Atlas merged with the John Maneely Company, a predecessor company founded in 1877 that was acquired by Carlyle earlier in 2006. Upon consummation of the merger, the Company was renamed JMC Steel Group, Inc. Subsequent to this merger, Barry Zekelman served as COO of JMC Steel between 2006 and 2008, during which time he completed the acquisition and integration of Sharon Tube Company. In 2008, Barry Zekelman was named CEO, a position which he held until March 2010, at which point he was appointed as our Executive Chairman. In fiscal year 2011, we and Barry Zekelman purchased a portion of our outstanding stock that was held by Carlyle. Barry Zekelman returned to the CEO position of JMC Steel in February 2013. In fiscal year 2014, we repurchased all remaining outstanding stock held by Carlyle. Effective April 28, 2016, we changed our name from JMC Steel Group, Inc. to Zekelman Industries, Inc. to better reflect the broad nature of our business and the reputation of the Zekelman family in steel pipe and tube markets. During fiscal year 2017, we successfully completed the acquisition and integration of both Western Tube and American Tube.
Transaction History
Date | Name | Acquired net sales | Description | |||
December 2006 | Atlas | ~$1 billion (12 months ended December 31, 2006) | • Founded in 1984 • Producer of structural tubing and pilings • Merged with John Maneely Company | |||
|
|
| ||||
February 2007 | Sharon Tube Company | ~$230 million (12 months ended December 31, 2006) | • Founded in 1929 • Manufacturer of standard pipe and DOM tubing • Acquired for $174 million | |||
|
|
| ||||
November 2009 | Certain assets of Picoma Industries | ~$40 million (12 months ended July 31, 2009) | • Electrical fittings and couplings product line • Acquired for $17 million | |||
|
|
| ||||
March 2012 | Lakeside Steel, Inc. | ~$210 million (12 months ended March 30, 2012) | • Founded in 1909 • Producer of energy tubulars • Acquired for $146 million | |||
|
|
| ||||
February 2017 | Western Tube | ~$220 million (12 months ended December 31, 2016) | • Founded in 1964 • Producer of electrical conduit, fence pipe and mechanical tubing • Acquired for $129 million | |||
|
|
| ||||
February 2017 | American Tube | ~$70 million (12 months ended December 31, 2016) | • Founded in 1994 • Producer of structural tubing • Acquired for $65 million |
| 104 |
Table of Contents
Confidential Treatment Requested Pursuant to 17 C.F.R. Section 200.83
Employees
As of March 31, 2018, we employed approximately 2,100 employees across the United States and Canada, of which approximately 1,500 are hourly employees and 600 are salaried employees. Of the hourly employees, approximately 1,100 are covered by collective bargaining agreements and are represented by the United Steelworkers, the International Brotherhood of the Teamsters, the United Automobile Workers, the International Association of Sheet Metal, Air, Rail and Transportation Workers or Unifor. We believe we have good relationships with our employees and we have not had strikes or business interruptions in the past decade.
Sales and Marketing
Our structural tubing sales force primarily consists of an internal team organized regionally and supported by third party manufacturers’ representatives with end market specializations. Customer service is centralized and provides support to customers across geographic markets. We position ourselves as the structural tubing supplier of choice to steel service centers with a wide and high quality product selection and short lead times.
We sell our electrical conduit and fittings and couplings using a dedicated sales force which is organized regionally. This internal sales force works closely with our network of manufacturers’ representatives who are retained to exclusively represent our electrical products.
We sell standard pipe products primarily using an internal sales force in conjunction with third party regional marketing agents. We market ourselves as a premium producer of standard pipe and have established a well-recognized brand in the industries we serve and a reputation for quality and reliability.
Properties
We have 13 pipe and tube manufacturing facilities in seven U.S. states and one Canadian province, and have twostand-alone administrative offices. We own 12 of the 13 manufacturing facilities, and the Plymouth, Michigan location is leased through March 2022. We also lease a Winnipeg, Manitoba warehouse through October 2018. Our administrative office locations are as follows:
| • | 227 West Monroe Street, Suite 2600, Chicago, Illinois (principal executive office, leased); and |
| • | 700 S. Dock Street, Sharon, Pennsylvania (owned). |
In addition to thestand-alone administrative offices noted above, certain of our manufacturing facilities also maintain administrative offices at the following locations:
| • | 1 Council Avenue, Wheatland, Pennsylvania; |
| • | 1855 East 122nd Street, Chicago, Illinois; |
| • | 200 Clark Street, Harrow, Ontario; and |
| • | 2001 East Dominguez Street, Long Beach, California. |
Environmental Matters
We are subject to a variety of federal, state, local, foreign and provincial environmental, health and safety laws and regulations, including those governing the discharge of pollutants into the air or water, the management, storage and disposal of, or exposure to, hazardous substances and wastes, the responsibility to investigate and clean up contamination, and occupational health and safety. Fines
| 105 |
Table of Contents
Confidential Treatment Requested Pursuant to 17 C.F.R. Section 200.83
and penalties may be imposed fornon-compliance with applicable environmental, health and safety requirements and the failure to have or to comply with the terms and conditions of required permits. Historically, our costs to comply with environmental and health and safety requirements have not been material. Under certain laws and regulations, such as CERCLA, the obligation to investigate and remediate contamination at a facility may be imposed on current and former owners or operators or on persons who may have sent waste to that facility for disposal. Liability under these laws and regulations is strict, and under certain circumstances, joint and several. Although we are not aware of any claims against us under CERCLA or its state equivalents, we could incur material costs to investigate and remediate contamination at our current and former facilities. Should environmental laws and regulations, or their interpretation or enforcement, become more stringent, or previously unknown conditions be discovered, our costs could increase, which may have a material adverse effect on our business, results of operations and financial condition.
In addition, increasing efforts globally to control emissions of carbon dioxide, methane and other greenhouse gases (“GHG”) have the potential to impact our facilities, costs, products and customers. Pursuant to the Clean Air Act (“CAA”), the United States Environmental Protection Agency (“EPA”) has taken action to regulate GHGs from certain stationary and mobile sources. These actions include issuance of a GHG reporting rule applicable to specified stationary sources, as well as a rule requiring limits on GHG emissions for certain sources under the CAA New Source Review, Prevention of Significant Deterioration and Title V Operating Permit programs. The United States Congress has also considered proposals to limit GHG emissions and several states have taken steps such as adoption of cap and trade programs or other regulatory systems to address GHGs. Pursuant to President Trump’s Executive Order 13793, in October 2017, the EPA proposed to repeal the Clean Power Plan, an Obama era regulation which set standards to reduce carbon emissions from power plants. At the same time, opponents of climate change regulation have initiated litigation, as well as introduced legislation in Congress, to delay, limit or eliminate the EPA’s and, possibly, states’ actions to regulate GHG. There have also been international efforts seeking legally binding reductions in emissions of GHGs. However, in 2017, the United States formally provided notice of its intent to withdraw from the Paris Agreement, an agreement which requires all parties to commit to nationally determined contributions to curb global GHG emissions. Given that the earliest the United States can withdraw from the Paris Agreement is November 2020, the possibility exists that some form of federal action may further impose limitations on greenhouse gas emissions. These developments and further actions that may be taken in the United States and in other countries, states or provinces could affect our operations both positively and negatively (e.g., by affecting the demand for or suitability of some of our products).
Legal Proceedings
From time to time, we have been subject to various claims and involved in legal proceedings incidental to the nature of our businesses. We maintain insurance coverage to reduce financial risk associated with certain of these claims and proceedings, but it is not possible to predict the outcome. However, in our opinion, there are no pending legal proceedings that are likely to have a material adverse effect on our overall business, results of operations or financial condition, although it is possible that the resolution of certain actual, threatened or anticipated claims or proceedings could have a material adverse effect on our business, results of operations or financial condition in the specific period of resolution.
| 106 |
Table of Contents
Confidential Treatment Requested Pursuant to 17 C.F.R. Section 200.83
Executive Officers and Directors
The following table sets forth the names, ages and positions of the executive officers and the directors of Zekelman Industries:
Name | Residence | Age | Position | |||||
Barry M. Zekelman | Ontario, Canada | 51 | Executive Chairman and Chief Executive Officer, Director | |||||
Michael J. Graham | Illinois, U.S.A. | 57 | Executive Vice President and Chief Financial Officer | |||||
Michael P. McNamara | Ohio, U.S.A. | 47 | Executive Vice President and General Counsel; President, Z-Modular | |||||
Michael E. Mechley | Ohio, U.S.A. | 63 | Executive Vice President of Special Procurement | |||||
Armand F. Lauzon, Jr. | Florida, U.S.A. | 61 | Director | |||||
David W. Seeger | Illinois, U.S.A | 62 | Director | |||||
Edward M. Siegel | Connecticut, U.S.A. | 76 | Director | |||||
Alan S. Zekelman | Michigan, U.S.A. | 55 | Director | |||||
Clayton W. Zekelman | Ontario, Canada | 49 | Director | |||||
Barry M. Zekelman. Barry Zekelman serves as our Executive Chairman and CEO. Mr. Zekelman was appointed as the CEO in February 2013 and the Executive Chairman in March 2010. Previously, Mr. Zekelman served as CEO from 2008 to 2010 and COO from 2006 to 2008. Mr. Zekelman was also previously the CEO of Atlas Tube, which merged with John Maneely Company in 2006. Mr. Zekelman had led Atlas Tube since age 19, and grew annual sales from less than $1.5 million in 1986 to approximately $1.0 billion before it merged with the John Maneely Company.
Mr. Zekelman has served as a director since inception. We believe Mr. Zekelman is qualified to serve on our Board of Directors due to his role as our CEO, his significant experience with our Company and in our industry and his significant equity interest in us.
Michael J. Graham. Mike Graham serves as our Executive Vice President and Chief Financial Officer (“CFO”). Prior to joining the Company in September 2012, Mr. Graham was the CFO of Career Education Corporation. He also held the positions of CFO of Terlato Wine Group, Senior Vice President and Controller of RR Donnelley & Sons, Vice President and Controller of Sears, Roebuck & Co. and Sears Holdings Corporation and CFO and Executive Vice President-Corporate Development at Aegis Communications Group, Inc. Mr. Graham previously held executive-level finance and controller positions with The Wellbridge Company, Sunbeam Corporation and the Quaker Oats Company.
Michael P. McNamara. Mickey McNamara serves as our Executive Vice President and General Counsel. Mr. McNamara also serves as the President of our Z-Modular business. Prior to joining the Company in September 2007, Mr. McNamara was a partner at BakerHostetler LLP.
Michael E. Mechley. Mike Mechley serves as our Executive Vice President of Special Procurement. Prior to joining the Company in 2006, Mr. Mechley served in various roles in finance, product support and purchasing for General Electric Aircraft Engines.
| 107 |
Table of Contents
Confidential Treatment Requested Pursuant to 17 C.F.R. Section 200.83
Armand F. Lauzon, Jr. Armand Lauzon serves as a member of our Board of Directors. Mr. Lauzon is the CEO and President of C&D Technologies, Inc. (“C&D”), also having served as its Chairman from September 2016 until 2018. Prior to joining C&D in February 2015, he served as CEO of Sequa Corporation since January 2009 and Chromalloy France SA since October 2011. He served as our CEO from December 2006 to April 2008. Prior to joining us, he was the CEO and Chairman of Firth Rixson Ltd.
Mr. Lauzon has served as a director since December 2006. We believe Mr. Lauzon is qualified to serve on our Board of Directors due to his significant executive experience at various industrial companies and his prior experience as our CEO.
David W. Seeger. Dave Seeger serves as a member of our Board of Directors. Mr. Seeger served as Company President prior to retiring in October 2016. Previously, Mr. Seeger led our structural tubing sales and marketing and operations and served as general manager of manufacturing functions for structural tubing at Copperweld Holding Company prior to its acquisition by Atlas Tube in 2005.
Mr. Seeger has served as a director since April 2013. We believe Mr. Seeger is qualified to serve on our Board of Directors due to his significant experience with our Company and in our industry.
Edward M. Siegel. Edward Siegel serves as a member of our Board of Directors. Mr. Siegel has held leadership positions in various manufacturing companies, most recently as the President and CEO of Russel Metals, Inc. from 1997 to 2009. Prior to joining Russel Metals in 1987, Mr. Siegel held executive level positions for Duferco, Inc. and Titan Industrial Corporation.
Mr. Siegel has served as a director since March 2011. We believe Mr. Siegel is qualified to serve on our Board of Directors due to his significant experience in leadership positions at metals and manufacturing companies.
Alan S. Zekelman. Alan Zekelman serves as a member of our Board of Directors. Mr. Zekelman served as the President of Atlas Tube from 1986 to 2006. Mr. Zekelman served in an integral role in implementing SAP across Atlas and the strategic selection and installation of ERW mills which pioneered our quick change capabilities. Mr. Zekelman is a member of numerous charitable boards.
Mr. Zekelman has served as a director since inception. We believe Mr. Zekelman is qualified to serve on our Board of Directors due to his significant experience with our Company and in our industry and his significant equity interest in us.
Clayton W. Zekelman. Clayton Zekelman serves as a member of our Board of Directors. Mr. Zekelman joined Atlas Tube in 1986 in the capacity of Vice President, responsible for the provision of IT infrastructure services including desktop applications, local and wide area networks and telecommunications. In 1994, he founded Managed Network Systems, Inc., a regional telecommunications service provider located in Ontario, Canada. Mr. Zekelman remained with Atlas Tube both in his capacity as Vice President as well as in an advisory role until the merger with John Maneely Company in 2006.
Mr. Zekelman has served as a director since inception. We believe Mr. Zekelman is qualified to serve on our Board of Directors due to his significant experience with our Company and in our industry and his significant equity interest in us.
Barry Zekelman, Alan Zekelman and Clayton Zekelman are brothers.
| 108 |
Table of Contents
Confidential Treatment Requested Pursuant to 17 C.F.R. Section 200.83
Board of Directors
Our business and affairs are managed under the direction of our Board of Directors. Our Board of Directors currently consists of six directors.
After this offering, the number of directors will be fixed by our Board of Directors, subject to the terms of our amended and restated certificate of incorporation and bylaws that will become effective immediately prior to the completion of this offering. Each director’s term will continue until the election and qualification of his or her successor, or his or her earlier death, resignation or removal.
So long as any shares of our Class B multiple voting stock are outstanding, we will not have a classified Board of Directors, and all directors will be elected for annual terms. Following the conversion of all of our Class B multiple voting stock to Class A subordinate voting stock, we will have a classified Board of Directors consisting of three classes. Each class will be approximately equal in size, with each director serving staggered three-year terms. Directors will be assigned to a class by the then-current Board of Directors. When our Board of Directors is classified, we expect that any additional directorships resulting from an increase in the number of directors will be distributed among the three classes so that, as nearly as possible, each class will consist ofone-third of the directors. The division of our Board of Directors into three classes with staggered three-year terms may delay or prevent a change of our management or a change in control.
Following this offering, members of the Zekelman family will have certain director nomination rights as described under “Certain Relationships and Related Party Transactions—Stockholders Agreement.”
Controlled Company
Upon the completion of this offering, members of the Zekelman family will continue to control a majority of the voting power of our outstanding capital stock. As a result, we will be a “controlled company” under the corporate governance listing standards of the . As a controlled company, we are exempt from the obligation to comply with certain corporate governance requirements, including the requirements:
| • | that our Board of Directors consists of a majority of independent directors; |
| • | that we have a corporate governance and nominating committee that is composed entirely of independent directors with a written charter addressing the committee’s purpose and responsibilities; and |
| • | that we have a compensation committee that is composed entirely of independent directors with a written charter addressing the committee’s purpose and responsibilities. |
Director Independence
Our Board of Directors has undertaken a review of the independence of each director. Based on information provided by each director concerning his background, employment and affiliations, our Board of Directors has determined that , and do not have a relationship that would interfere with the exercise of independent judgment in carrying out the responsibilities of a director and that each of these directors is “independent” as that term is defined under the listing standards of the . In making these determinations, our Board of Directors considered the current and prior relationships that eachnon-employee director has with our Company and all other facts and circumstances our Board of Directors deemed relevant in determining their independence.
| 109 |
Table of Contents
Confidential Treatment Requested Pursuant to 17 C.F.R. Section 200.83
Committees of the Board of Directors
Our Board of Directors has established an audit committee, a compensation committee and a nominating and corporate governance committee. The composition and responsibilities of each of the committees of our Board of Directors following completion of this offering are described below. Members will serve on these committees until their resignation or until as otherwise determined by our Board of Directors.
Audit Committee
Following the completion of this offering, our audit committee will consist of , , and , with serving as Chairperson. will meet the requirements for audit committee member independence under the listing standards of the and SEC rules and regulations. Each member of our audit committee also meets the financial literacy and sophistication requirements of the listing standards of the . In addition, our Board of Directors has determined that is an audit committee financial expert within the meaning of Item 407(d) of RegulationS-K under the Securities Act of 1933, as amended (the “Securities Act”). Following the completion of this offering, our audit committee will be responsible for, among other things:
| • | selecting a qualified firm to serve as the independent registered public accounting firm to audit our financial statements; |
| • | helping to ensure the independence and performance of the independent registered public accounting firm; |
| • | discussing the scope and results of the audit with the independent registered public accounting firm, and reviewing, with management and the independent registered public accounting firm, our interim andyear-end operating results; |
| • | reviewing our financial statements and our critical accounting policies and estimates; |
| • | reviewing the adequacy and effectiveness of our internal controls; |
| • | developing procedures for employees to submit concerns anonymously about questionable accounting, internal accounting controls or audit matters; |
| • | reviewing our policies on risk assessment and risk management; |
| • | reviewing related party transactions; and |
| • | pre-approving all audit and all permissiblenon-audit services, other than de minimisnon-audit services, to be performed by the independent registered public accounting firm. |
Our audit committee will operate under a written charter, to be effective prior to the completion of this offering, that satisfies the applicable rules and regulations of the SEC and the listing standards of the .
Compensation Committee
Following the completion of this offering, our compensation committee will consist of , , and , with serving as Chairperson. will meet the requirements for compensation committee member independence under the listing standards of the and SEC rules and regulations. Following the completion of this offering, our compensation committee will be responsible for, among other things:
| • | reviewing, approving and determining, or making recommendations to our Board of Directors regarding, the compensation of our executive officers; |
| 110 |
Table of Contents
Confidential Treatment Requested Pursuant to 17 C.F.R. Section 200.83
| • | reviewing, approving and making recommendations to our Board of Directors regarding incentive compensation and equity compensation plans; |
| • | establishing and reviewing general policies relating to compensation and benefits of our employees; and |
| • | making recommendations regardingnon-employee director compensation to our full Board of Directors. |
Our compensation committee will operate under a written charter, to be effective prior to the completion of this offering, that satisfies the applicable rules and regulations of the SEC and the listing standards of the .
Nominating and Corporate Governance Committee
Following the completion of this offering, our nominating and corporate governance committee will consist of , , and , with serving as Chairperson. Following the completion of this offering, our nominating and corporate governance committee will be responsible for, among other things:
| • | identifying, evaluating and selecting, or making recommendations to our Board of Directors regarding, nominees for election to our Board of Directors and its committees; |
| • | evaluating the performance of our Board of Directors and of individual directors; |
| • | considering and making recommendations to our Board of Directors regarding the composition of our Board of Directors and its committees; |
| • | reviewing developments in corporate governance practices; |
| • | evaluating the adequacy of our corporate governance practices and reporting; |
| • | approving our committee charters; |
| • | overseeing compliance with our code of business conduct and ethics; |
| • | contributing to succession planning; |
| • | reviewing actual and potential conflicts of interest of our directors and officers other than related party transactions reviewed by our audit committee; and |
| • | developing and making recommendations to our Board of Directors regarding corporate governance guidelines and matters. |
Our nominating and corporate governance committee will operate under a written charter, to be effective prior to the completion of this offering, that satisfies the applicable listing standards of the .
Compensation Committee Interlocks and Insider Participation
None of the members of our compensation committee is an officer or employee, or has been an officer in the past, of our Company. None of our executive officers currently serves, or in the past year has served, as a member of the Board of Directors or compensation committee (or other board committee performing equivalent functions) of any entity that has one or more of its executive officers serving on our Board of Directors or compensation committee.
Code of Business Conduct and Ethics
Our Board of Directors has adopted a code of business conduct and ethics that applies to all of our employees, officers and directors, including our CEO, CFO, and other executive and senior
| 111 |
Table of Contents
Confidential Treatment Requested Pursuant to 17 C.F.R. Section 200.83
financial officers. The full text of our code of business conduct and ethics will be posted on the investor relations page on our website. We intend to disclose any amendments to our code of business conduct and ethics, or waivers of its requirements, on our website or in filings under the Exchange Act.
Director Compensation
During fiscal year 2017, our Board of Directors was comprised of threenon-employeenon-family directors (Messrs. Lauzon, Seeger and Siegel) and three family member directors (Messrs. A. Zekelman, B. Zekelman and C. Zekelman). In fiscal year 2017, ournon-employeenon-family directors received an annual retainer fee of $75,000 for their service on the Board. We did not provide meeting fees or any additional compensation for service on a committee. Our family member directors are not generally compensated for their service on the Board. However, during fiscal year 2017, Mr. C. Zekelman used the Company-owned and fractional share airplanes for personal use on limited occasions. While Mr. Zekelman reimbursed us in accordance with Company policies, the aggregate incremental costs of such personal use, as calculated under SEC reporting requirements, exceeded the amount of reimbursement by an estimated $13,037 in fiscal year 2017 and are disclosed in the table below under “All Other Compensation.”
Although no option grants were made to directors during fiscal year 2017, the three non-employee, non-family directors hold options granted in prior fiscal years. Information about those options as of September 30, 2017 is included in the footnotes to the table below. Under the Option Plan, option holders earn dividend equivalents in connection with our declaration and payment of dividends to common stockholders. These dividend equivalents are only paid when options are vested. Dividend equivalent amounts paid to the non-employee non-family directors during fiscal year 2017 are included in the table below under “All Other Compensation.” The amounts of unpaid dividend equivalents on unvested options as of September 30, 2017 are included in the footnotes to the table.
The compensation paid to our directors quantified in the table below reflects payments made by the Company during fiscal year 2017.
Director Name | Fees Earned or Paid in Cash | All Other Compensation(5) | Total(1) | |||||||||
Armand Lauzon Jr.(2) | $ | 75,000 | $ | 330,812 | $ | 405,812 | ||||||
David Seeger(3) | $ | 75,000 | $ | 330,812 | $ | 405,812 | ||||||
Edward Siegel(4) | $ | 75,000 | $ | 43,659 | $ | 118,659 | ||||||
Clayton Zekelman | — | $ | 13,037 | $ | 13,037 | |||||||
| (1) | Directors are also reimbursed for travel and other business expenses associated with service on the Board. |
| (2) | As of September 30, 2017, Mr. Lauzon Jr. holds stock options with a weighted average exercise price of $ , of which were vested as of such date. The remainder are scheduled to vest monthly on a ratable basis through April 2019, although we expect vesting will be accelerated in connection with this offering. Upon vesting, all unpaid dividend equivalents would be paid. |
| (3) | As of September 30, 2017, Mr. Seeger holds stock options with a weighted average exercise price of $ , of which were vested as of such date. The remainder are scheduled to vest monthly on a ratable basis through April 2019, although we expect vesting will be accelerated in connection with this offering. Upon vesting, all unpaid dividend equivalents would be paid. |
| (4) | As of September 30, 2017, Mr. Siegel holds stock options with a weighted average exercise price of $ , of which were vested as of such date. The remainder are scheduled to vest monthly on a ratable basis through April 2019, although we expect vesting will |
| 112 |
Table of Contents
Confidential Treatment Requested Pursuant to 17 C.F.R. Section 200.83
| be accelerated in connection with this offering. Upon vesting, all unpaid dividend equivalents would be paid. |
| (5) | For Mr. C. Zekelman, represents unreimbursed aggregate incremental cost for personal use of the Company-owned and fractional share airplanes as discussed above. For Messrs. Lauzon, Seeger and Siegel, represents dividend equivalents paid for dividends declared in fiscal year 2017 on vested options and dividend equivalents from prior fiscal year dividends, which were paid in fiscal year 2017 associated with the vesting in fiscal year 2017 of previously unvested options. Does not include dividend equivalents unpaid with respect to unvested options as of September 30, 2017. These amounts were $183,692, $183,692 and $25,813 for each of Messrs. Lauzon, Seeger and Siegel, respectively. |
In connection with this offering and in preparation for becoming a publicly traded company, we are in the process of considering changes to ournon-employee director compensation program, including adding an equity compensation element and stock ownership guidelines. The material terms of this program will be described in this prospectus once they are determined.
| 113 |
Table of Contents
Confidential Treatment Requested Pursuant to 17 C.F.R. Section 200.83
Compensation Discussion and Analysis
This compensation discussion and analysis provides an overview of our compensation philosophy and each element of our executive compensation program for our “named executive officers” as determined under SEC rules (our “NEOs”) for our fiscal year ended September 30, 2017. In this section, we also provide information on our ongoing review of our executive compensation program and certain changes that we expect to make in connection with this offering and becoming a publicly traded company.
For the fiscal year ended September 30, 2017, our NEOs were:
NEO | Position | |
Barry M. Zekelman | Executive Chairman and CEO | |
Michael J. Graham | Executive Vice President and CFO | |
Michael P. McNamara | Executive Vice President and General Counsel; President, Z-Modular | |
Michael E. Mechley | Executive Vice President of Special Procurement |
Compensation Philosophy and Objectives
Our executive compensation program is designed to attract, retain and motivate employees to advance overall business objectives and to create long-term stockholder value. Specifically, our executive compensation program is designed to:
| • | attract and retain outstanding individuals critical to the success of our Company; |
| • | align the financial interests of our executives with the value-creation interests of our stockholders; and |
| • | reward executive officers for the achievement of Company performance objectives, the creation of stockholder value and their contributions to the success of our Company. |
To achieve these objectives, following this offering we expect that executive compensation decisions will be based on the following foundational principles used in the design of our compensation program:
| • | Pay-for-Performance: We will pay for performance achievements while adhering to Company values. The primary emphasis for our executive officers will be placed on Company performance rather than on individual performance. We expect to establish performance goals that do not encourage excessive risk-taking behavior among executives and balance short- and long-term objectives. |
| • | Fixed versus Variable Compensation: The portion of an executive officer’s total compensation that is variable should increase with overall responsibilities and compensation level. A majority of our CEO’s compensation will be variable and tied to overall Company performance. |
| • | Pay Positioning: Total compensation levels will generally be targeted within a reasonable range of the 50th to 75th percentile of competitive compensation data from an appropriate peer group of companies that reflect similar size and industry. However, the specific competitiveness of an individual’s compensation will be determined considering factors such as experience, skills, capabilities, contributions, performance and the sufficiency of compensation potential to retain the executive. |
The Board’s compensation committee is currently comprised of , , and . For information regarding the responsibilities of the compensation committee following this offering,
| 114 |
Table of Contents
Confidential Treatment Requested Pursuant to 17 C.F.R. Section 200.83
see “Management—Committees of the Board of Directors—Compensation Committee.” The compensation committee reviews and approves compensation packages for each NEO annually with input from the CEO and management. The CEO recommends to the compensation committee compensation packages for executives who report directly to him, including the NEOs other than himself.
Fiscal Year 2017 Compensation
For fiscal year 2017, compensation for the Company’s NEOs consisted of the primary elements identified in the following table:
Compensation Element | Objective | Key Features | ||
Base Salary | Provide a competitive level of base pay designed to attract and retain qualified executives | Represents the fixed portion of our NEOs total compensation | ||
Management Incentive Plan (“MIP”) | Motivate executives to drive performance and reward executives for achievement in key areas of operational and financial performance | Cash payments based on a pool funded through achievement ofone-year Adjusted EBITDA goals | ||
Discretionary Bonuses | Motivate executives by rewarding Company and individual achievements not captured by our MIP | Cash payments based on successful acquisitions and integrations not otherwise reflected in our MIP for fiscal year 2017 | ||
Options | Align management interests with those of stockholders and reward long-term Company performance | Each of our NEOs other than Mr. Zekelman holds options that were granted under our Option Plan and that provide dividend equivalent rights as set forth below. No option grants were made to the NEOs during fiscal year 2017. |
Base Salary
Base salaries are typically reviewed annually for external market competitiveness. Decisions about base salary increases are based on individual performance evaluations and take into consideration the overall accomplishments of the Company. The Company targets base salaries around the median (50th percentile) of the competitive market.
Base salary increases were made during fiscal year 2017 taking into account factors including changes in job responsibilities, changes in industry or local market salary trends and Company and individual performance. These changes were effective as of January 1, 2017.
NEO | 2016 Salary | 2017 Salary | Percentage change | |||||||||
Barry M. Zekelman(1) | $ | 1,511,250 | $ | 1,511,250 | 0 | % | ||||||
Michael J. Graham | $ | 557,094 | $ | 573,807 | 3 | % | ||||||
Michael P. McNamara | $ | 424,480 | $ | 437,215 | 3 | % | ||||||
Michael E. Mechley | $ | 333,565 | $ | 343,572 | 3 | % | ||||||
| (1) | Mr. Zekelman receives 50% of his salary in Canadian Dollars (“CAD”). Applicable exchange rates are applied to determine the CAD payment amounts that are approximately equivalent to 50% of the salary expressed in U.S. dollars in the above table. |
| 115 |
Table of Contents
Confidential Treatment Requested Pursuant to 17 C.F.R. Section 200.83
Management Incentive Plan
Annual cash incentive awards for the NEOs for fiscal year 2017 were made under our MIP. The MIP is an important part of our executive compensation program and is designed to reward our most senior executives for performance that is aligned with creating value for our stockholders. The MIP is intended to reward executives when they meet and exceed the MIP annual financial targets. MIP awards are based on an incentive pool funded through achievement ofone-year Adjusted EBITDA goals established by management and approved by the compensation committee. Each MIP participant is entitled to receive a payment equal to a certain percentage of the pool.
MIP award opportunities are set as a percentage of each NEO’s base salary as follows:
NEO | MIP Target Award Opportunity as a Percentage of Base Salary | |||
Barry M. Zekelman | 87.5 | % | ||
Michael J. Graham | 75 | % | ||
Michael P. McNamara | 50 | % | ||
Michael E. Mechley | 50 | % | ||
For fiscal year 2017, the compensation committee approved the following MIP Adjusted EBITDA performance goal levels and associated incentive payout levels:
| MIP Adjusted EBITDA Performance Goals (in millions) | ||||||||||||||||||||||||
| Below Threshold | Threshold | Target | Stretch | Above Stretch | Actual | |||||||||||||||||||
Adjusted EBITDA(1) | <$ | 175 | $ | 175 | $ | 245 | $ | 320 | >$320 | $337 | ||||||||||||||
|
|
|
|
|
|
|
|
|
|
|
| |||||||||||||
Pool funding level as % of target | 0 | % | 25 | % | 100 | % | 250 | % | 7.5% of | 280 | % | |||||||||||||
| | incremental Adjusted EBITDA | | ||||||||||||||||||||||
| (1) | Adjusted EBITDA is anon-GAAP measure. See“Non-GAAP Financial Measures” and “Prospectus Summary—Summary Consolidated Financial and OtherData—Non-GAAP Reconciliation.” The actual Adjusted EBITDA for fiscal year 2017 shown in the table above excludes the results of Western Tube and American Tube because the target levels were established prior to those acquisitions. |
Actual award amounts are interpolated for performance between the threshold, target and stretch levels. As a result of Adjusted EBITDA performance above stretch, the MIP pool was funded at 250% of target, plus 7.5% of incremental Adjusted EBITDA above $320 million.
Based on the achievement of these financial performance objectives, the associated pool funding level and individual allocation of the incentive pool, the final payouts under the fiscal year 2017 MIP were as follows for each NEO:
NEO | Actual MIP Award | |||
Barry M. Zekelman(1) | $ | 3,698,065 | ||
Michael J. Graham | $ | 1,203,531 | ||
Michael P. McNamara | $ | 611,357 | ||
Michael E. Mechley | $ | 480,416 | ||
| (1) | Mr. Zekelman receives 50% of his MIP award in CAD. Applicable exchange rates are applied to determine the CAD payment amounts that are approximately equivalent to 50% of the MIP award expressed in U.S. dollars in the above table. |
| 116 |
Table of Contents
Confidential Treatment Requested Pursuant to 17 C.F.R. Section 200.83
Discretionary Bonuses
As noted above, the Company’s fiscal year 2017 MIP targets did not anticipate the acquisitions of Western Tube and American Tube. Rather than revising existing plans and establishing targets given the unknown forecasts for the acquired entities at the acquisition dates, discretionary bonuses were awarded to recognize individual contributions to these transactions.
The acquisitions have been very successful, with the following positive results:
| • | Purchased entities at below market multiples; |
| • | Gained meaningful synergies; |
| • | Converted both businesses to our SAP platform; |
| • | Contributed strong cash flow in the six months of ownership in fiscal year 2017; and |
| • | Retired approximately $90 million of the debt incurred to purchase the businesses. |
The CEO recommended to the compensation committee, who approved the following discretionary bonuses for fiscal year 2017 for three of our four NEOs:
NEO | Discretionary Bonus | |||
Michael J. Graham | $ | 50,000 | ||
Michael P. McNamara | $ | 50,000 | ||
Michael E. Mechley | $ | 25,000 | ||
Options
The Company has granted its NEOs (other than Mr. Zekelman) options pursuant to its Option Plan, although no grants were made in fiscal year 2017. For additional information regarding the Option Plan and options granted thereunder, refer to “—Equity Plans—Option Plan” below. Following this offering, we will not make any additional grants under the Option Plan.
Under the Option Plan, option holders earn dividend equivalents in connection with our declaration and payment of dividends to common stockholders. In fiscal year 2017, we declared and paid cash dividends to our common stockholders and the holder of our Exchangeable Shares in the amount of $20.0 million. In connection therewith, option holders were entitled to dividend equivalents of $1.4 million in the aggregate. These dividend equivalents are only paid when options are vested.
The following table sets forth the number of outstanding stock options as of September 30, 2017 that were held by three of our four NEOs, the dollar amounts of dividend equivalent payments in fiscal year 2017 and the dividend equivalent amount unpaid as of September 30, 2017 related to unvested options:
NEO | Outstanding Stock Options | Paid Dividend Equivalents on Vested Options(1) | Unpaid Dividend Equivalents on Unvested Options | |||||||||
Michael J. Graham | $ | 335,208 | $ | 299,315 | ||||||||
Michael P. McNamara(2) | $ | 131,726 | $ | 75,255 | ||||||||
Michael E. Mechley | $ | 131,726 | $ | 75,255 | ||||||||
| (1) | Includes dividend equivalents paid for dividends declared in fiscal year 2017 on vested options and dividend equivalents from prior fiscal year dividends, which were paid in fiscal year 2017 associated with the vesting in fiscal year 2017 of previously unvested options. |
| 117 |
Table of Contents
Confidential Treatment Requested Pursuant to 17 C.F.R. Section 200.83
| (2) | In October, 2017, the Company granted additional options to Mr. McNamara. |
In connection with this offering, we expect that the vesting of all unvested options will be accelerated and we will pay out all unpaid dividend equivalents declared with respect to the unvested options that will be accelerated. Based on the number of unvested options as of , 2018, this would result in an aggregate payment of $ to our NEOs. Approximately % of all outstanding options are fully vested, and our Board of Directors determined to accelerate the remainder of the options in connection with this offering so that our executives and other key employees would be treated equally regardless of when their options were granted.
Other Benefits
The NEOs participate in a 401(k) savings plan on the same terms as other employees.
The Company provides limited perquisites and other personal benefits to our NEOs, including athletic and country club memberships for our CEO, Mr. Zekelman.
Mr. Zekelman uses a Company-owned airplane and fractional ownership arrangements with Net Jets, Inc. for business and personal purposes. He reimburses the Company for his personal use, includingout-of-pocket operating costs following CRA and IRS standards, as applicable. Any aggregate incremental costs that are not fully reimbursed by Mr. Zekelman, as calculated under SEC reporting requirements, are disclosed in the Summary Compensation Table as perquisites. For fiscal year 2017, these unreimbursed aggregate incremental costs were estimated to be $124,687 for his personal use of the airplanes. In fiscal year 2018, the Company purchased a yacht to be used for business purposes with our customers as well as third-party rentals when not used by the Company. Mr. Zekelman uses the Company-owned yacht for business and personal purposes. He reimburses the Company for his personal use based on an estimated charter fee provided by the yacht’s management services company. To the extent the aggregate incremental costs of any personal use exceed reimbursement, such amounts will be reflected in the Summary Compensation Table for the applicable fiscal year.
Review of Executive Compensation Program
During fiscal year 2018, management retained a compensation consultant, Mercer (US), Inc. (“Mercer”), to assist in it and the compensation committee’s review of compensation, compensation governance and incentive programs in anticipation of this offering and becoming a publicly traded company.
To assist the compensation committee in establishing executive compensation programs and reviewing and setting executive compensation, the compensation committee is considering survey data and data from annual reports and proxy statements of selected peer group companies. Compensation data was also gathered from the 2017 U.S. Mercer Executive Remuneration Suite and the 2017 Willis Towers Watson Executive Compensation Survey.
The compensation committee, with the assistance of Mercer, has selected a peer group which includes 15 companies in the industrials and materials sectors. Within these sectors, the companies were selected because they have similar annual revenue (approximately half to two times the
| 118 |
Table of Contents
Confidential Treatment Requested Pursuant to 17 C.F.R. Section 200.83
Company’s net sales). The peer group also includes companies with which the Company competes for talent. The peer group includes:
| • | Armstrong World Industries, Inc. |
| • | Atkore International Group Inc. |
| • | Commercial Metals Company |
| • | Flowserve Corporation |
| • | Forterra, Inc. |
| • | Gibraltar Industries, Inc. |
| • | Kaiser Aluminum Corporation |
| • | MRC Global Inc. |
| • | NCI Building Systems, Inc. |
| • | Owens Corning |
| • | Rexnord Corporation |
| • | TimkenSteel Corporation |
| • | USG Corporation |
| • | Valmont Industries, Inc. |
| • | Worthington Industries, Inc. |
The Company’s percentile rank relative to the peer group’s sales for the most recently available fiscal years is as follows:
Peer Group Percentile | Sales | |||
| (in millions) | ||||
75th Percentile | $ | 3,646 | ||
Median | $ | 1,918 | ||
25th Percentile | $ | 1,398 | ||
Zekelman Industries | $ | 2,095 | ||
Percentile Rank | 51 | % | ||
The Company’s review of executive compensation programs and practices is ongoing. However, based on the review to date, the Company expects to make the following changes to its executive compensation program in connection with this offering:
| • | Implementing a cap under the MIP so that the maximum payout may not exceed % of targeted MIP opportunity; |
| • | Adopting a new equity compensation plan as described under “—Equity Plans—2018 Equity Incentive Plan;” and |
| • | Implementing stock ownership guidelines specifying the number of shares as a multiple of base salary ( times for our CEO, and times for our other NEOs), that our NEOs must acquire and hold within years following this offering. |
As part of its ongoing review, the Company is also considering whether to enter into new employment agreements with its NEOs or, in lieu of employment agreements, adopting a severance policy applicable to all of its NEOs or certain other executive officers. The Company currently has employment agreements with three of the four NEOs as described under “—Potential Payments Upon Termination or Change in Control” below.
To the extent determined, further details about material changes to our executive compensation programs and practices may be provided in any subsequentpre-effective amendments to the registration statement of which this prospectus forms a part.
| 119 |
Table of Contents
Confidential Treatment Requested Pursuant to 17 C.F.R. Section 200.83
Summary Compensation Table
The following table sets forth the compensation of our NEOs for the fiscal year ended September 30, 2017. The primary components of each NEO’s compensation are described further throughout this “Executive Compensation” section of the prospectus.
Name and Principal Position | Year | Salary | Bonus(1) | Non-Equity Incentive Plan Compensation(2) | All Other Compensation(3) | Total | ||||||||||||||||||
Barry M. Zekelman | 2017 | $ | 1,536,092 | — | $ | 3,698,065 | $ | 202,834 | $ | 5,436,991 | ||||||||||||||
Executive Chairman and Chief Executive Officer | ||||||||||||||||||||||||
Michael J. Graham | 2017 | $ | 578,752 | $ | 50,000 | $ | 1,203,531 | $ | 354,208 | $ | 2,186,491 | |||||||||||||
Executive Vice President and Chief Financial Officer | ||||||||||||||||||||||||
Michael P. McNamara | 2017 | $ | 440,983 | $ | 50,000 | $ | 611,357 | $ | 148,073 | $ | 1,250,413 | |||||||||||||
Executive Vice President and General Counsel; President, Z-Modular | ||||||||||||||||||||||||
Michael E. Mechley | 2017 | $ | 346,533 | $ | 25,000 | $ | 480,416 | $ | 150,234 | $ | 1,002,183 | |||||||||||||
Executive Vice President of Special Procurement | ||||||||||||||||||||||||
| (1) | Amounts reflect discretionary bonuses associated with the acquisitions of Western Tube and American Tube. |
| (2) | Amounts reflect annual cash incentive compensation earned under the MIP. Under his employment agreement, Mr. Zekelman receives a good faith estimate of 50% of his annual incentive under the MIP within 30 days of the close of the Company’s second fiscal quarter. Any amount paidmid-year that is in excess of the actual annual incentive ultimately earned for that fiscal year is offset against Mr. Zekelman’s incentive in the following fiscal year. |
| (3) | Amounts received by each NEO for fiscal year 2017 are set forth below but exclude other arrangements that are generally available to our salaried employees and do not discriminate in favor of our NEOs, such as our medical, dental, disability and group life insurance programs. Mr. Zekelman is the only NEO who received perquisites with an aggregate value in excess of $10,000, which was for his reimbursement of various athletic and country club dues and related expenses, and aggregate incremental costs of any amounts not fully reimbursed for personal use of the Company-owned and fractional share airplanes. The aggregate incremental costs of the personal use of the Company-owned and fractional share airplanes are determined on a per flight basis and include the cost of the fuel used, the hourly cost of aircraft maintenance for the applicable number of flight hours, landing fees, trip-related hangar and parking costs and other costs specifically incurred (excluding depreciation of the airplane fornon-business use). The amount shown as perquisites for Mr. Zekelman includes an estimated $124,687 for unreimbursed aggregate incremental costs of personal use of airplanes. Mr. Zekelman also received a 401(k)catch-up contribution of $58,250 in fiscal year 2017 as reflected in the 401(k) Company Contributions column below. |
NEO | Perquisites | Dividends Equivalents Paid on Options(1) | 401(k) Company Contributions | Total | ||||||||||||
Barry M. Zekelman | $ | 136,484 | — | $ | 66,350 | $ | 202,834 | |||||||||
Michael J. Graham | — | $ | 335,308 | $ | 18,900 | $ | 354,208 | |||||||||
Michael P. McNamara | — | $ | 131,726 | $ | 16,347 | $ | 148,073 | |||||||||
Michael E. Mechley | — | $ | 131,726 | $ | 18,508 | $ | 150,234 | |||||||||
| 120 |
Table of Contents
Confidential Treatment Requested Pursuant to 17 C.F.R. Section 200.83
| (1) | Includes dividend equivalents paid for dividends declared in fiscal year 2017 on vested options and dividend equivalents from prior fiscal year dividends, which were paid in fiscal year 2017 associated with the vesting in fiscal year 2017 of previously unvested options. Does not include dividend equivalents for dividends declared in fiscal year 2017 with respect to unvested options and that were unpaid as of September 30, 2017. |
Grants of Plan-Based Awards in Fiscal Year 2017
The following table summarizes cash-based awards that were granted to each of our NEOs during fiscal year 2017. No equity-based awards were granted to our NEOs in fiscal year 2017.
| Non-Equity Incentive Plan Awards(1) | ||||||||||||
NEO | Threshold | Target | Stretch | |||||||||
Barry M. Zekelman | $ | 330,586 | $ | 1,322,344 | $ | 3,305,859 | ||||||
Michael J. Graham | $ | 107,589 | $ | 430,355 | $ | 1,075,888 | ||||||
Michael P. McNamara | $ | 54,652 | $ | 218,607 | $ | 546,519 | ||||||
Michael E. Mechley | $ | 42,946 | $ | 171,786 | $ | 429,465 | ||||||
| (1) | Amounts in these columns represent potential performance bonuses that our NEOs could have earned under the MIP for fiscal year 2017. The Target amount is a dollar value based on a percentage of each NEO’s base salary. The Threshold amount is 25% of the Target payout. The Stretch amount shown is based on a 250% of Target payout. Because performance metrics under the MIP are uncapped, the actual amount paid was greater than the stretch amounts in fiscal year 2017 as reflected in the Summary Compensation Table above. |
Outstanding Equity Awards at 2017 FiscalYear-End
The following table shows for each of our NEOs (other than Mr. Zekelman, who does not hold any options) all option awards that were outstanding as of September 30, 2017.
NEO | Option Grant Date | Number of Securities Underlying Unexercised Options Exercisable | Number of Securities Underlying Unexercised Options Unexercisable(1) | Option Exercise Price | Option Expiration Date | |||||||||||||||
Michael J. Graham | 12/1/2012 | $ | 12/11/2030 | |||||||||||||||||
Michael P. McNamara(2) | 6/30/2011 | $ | 4/11/2029 | |||||||||||||||||
Michael E. Mechley | 6/30/2011 | $ | 4/11/2029 | |||||||||||||||||
| (1) | The unexercisable options vest pro rata on a monthly basis. Mr. Graham’s options will be fully vested by December 2020 and Messrs. McNamara’s and Mechley’s options will be fully vested by April 2019. It is expected that vesting of all such options will be accelerated in connection with this offering. |
| (2) | In October 2017, the Company granted additional options to Mr. McNamara with an exercise price of $ . |
Option Exercises and Stock Vested in Fiscal Year 2017
No options were exercised by our NEOs in fiscal year 2017. We have not granted any stock awards to our NEOs.
Pension Benefits
Our NEOs do not participate in any defined benefit pension plans.
| 121 |
Table of Contents
Confidential Treatment Requested Pursuant to 17 C.F.R. Section 200.83
Nonqualified Deferred Compensation
Our NEOs do not participate in any nonqualified deferred compensation plans.
Potential Payments Upon Termination or Change in Control
Employment Agreements
The Company has entered into employment agreements with three of its four NEOs (Barry M. Zekelman, Michael P. McNamara and Michael E. Mechley) that govern the terms of their compensation, benefits and severance arrangements. The agreements also provide for a number of protections for the Company and the executives covering employment-related issues as well asnon-competition and nondisclosure provisions.
Barry M. Zekelman. The Company entered into an amended employment agreement with Barry M. Zekelman in April 2016. The agreement has an initial term of five years and successiveone-year terms following the expiration of the initial term. The agreement sets an annual base salary and a target annual cash bonus. The annual bonus, if any, will be payable as follows (i) a good faith estimate of 50% will be paid within 30 days of the close of the Company’s second fiscal quarter and (ii) the remainder, if any, will be paid after the end of the fiscal year, at the time the Company normally pays bonuses after compensation committee approval.
On termination for any reason, Mr. Zekelman would be entitled to his base salary through the date of termination, any unpaid annual bonus for any completed fiscal year before the termination date and certain other accrued benefits pursuant to his employment agreement. In the event of a termination due to disability or death, Mr. Zekelman would also be entitled to a pro rata share of any annual bonus for the fiscal year of termination based on actual Company performance. If Mr. Zekelman terminated his employment for “good reason” as defined in the employment agreement, in addition to the foregoing, he would be entitled to a lump sum payment equal to 4.75 times base salary. Finally, if the Company terminated Mr. Zekelman without cause, he would be entitled to all of the foregoing plus any base salary that would have been paid during the remaining term of the agreement (which currently ends March 31, 2021).
Michael P. McNamara and Michael E. Mechley. The Company has entered into employment agreements with Michael P. McNamara and Michael E. Mechley. The agreements automatically renew for successiveone-year periods unless either party gives90-days’ written notice ofnon-renewal. The agreements set annual base salaries and target annual cash bonuses. On termination for any reason, the executive would receive his base salary through the date of termination, any unpaid annual bonus for any completed fiscal year before the termination date and certain other accrued benefits.
For termination without cause ornon-renewal of the employment agreement, the executive would receive a severance amount equal to his then-current annual base salary and annual bonus. This amount would generally be payable in equal monthly installments over the 12 months following termination, although the initial payment may be delayed for six months in specified circumstances, in which case half of the payment would be paid in a lump sum at such time and the remainder would be paid in equal monthly installments over the remaining six months. The executive would also receive continued coverage under the Company’s group health plan for12-months following the termination date.
| 122 |
Table of Contents
Confidential Treatment Requested Pursuant to 17 C.F.R. Section 200.83
Assuming a change in control or the NEO’s employment was terminated as of September 30, 2017, the following table sets forth payments and benefits that would have been provided to each NEO in connection with the change of control or termination, as applicable. The table does not include payments or benefits to which the NEO would be entitled to regardless of the change of control or termination.
| Change in Control | Without Cause | With Good Reason | Death or Disability (1) | |||||||||||||
Barry M. Zekelman | ||||||||||||||||
Separation Payment(2) | — | $ | 16,165,878 | $ | 10,876,503 | $ | 3,698,065 | |||||||||
|
|
|
|
|
|
|
| |||||||||
Total | — | $ | 16,165,878 | $ | 10,876,503 | $ | 3,698,065 | |||||||||
Michael J. Graham | ||||||||||||||||
Accelerated Vesting of Equity Awards(4) | $ | 1,293,224 | — | — | — | |||||||||||
|
|
|
|
|
|
|
| |||||||||
Total | $ | 1,293,224 | — | — | — | |||||||||||
Michael P. McNamara | ||||||||||||||||
Separation Payment | — | $ | 1,048,572 | — | — | |||||||||||
Benefit Continuation(3) | — | $ | 14,272 | — | — | |||||||||||
Accelerated Vesting of Equity Awards(4) | $ | 219,763 | — | — | — | |||||||||||
|
|
|
|
|
|
|
| |||||||||
Total | $ | 219,763 | $ | 1,062,845 | — | — | ||||||||||
Michael E. Mechley | ||||||||||||||||
Separation Payment | — | $ | 823,988 | — | — | |||||||||||
Benefit Continuation(3) | — | $ | 14,272 | — | — | |||||||||||
Accelerated Vesting of Equity Awards(4) | $ | 219,763 | — | — | — | |||||||||||
|
|
|
|
|
|
|
| |||||||||
Total | $ | 219,763 | $ | 838,260 | — | — | ||||||||||
| (1) | In the event of a termination due to death or disability, Mr. Zekelman would be entitled a pro rata share of any annual bonus for the fiscal year of termination based on actual Company performance. Given the termination is assumed to occur as of the end of fiscal year 2017, the amount of the actual MIP award to Mr. Zekelman is included in the table. In the event of termination due to disability, Mr. Zekelman may also be entitled to certain statutory benefits under the Ontario Employment Standards Act. |
| (2) | Includes a separation payment of 4.75 times his base salary as of the date of termination to be paid within 30 days following the execution of a release of claims and a pro rata share of any annual bonus for the fiscal year of termination based on actual Company performance (the amount of the actual fiscal year 2017 MIP award in this case). In the termination without cause column, also includes the base salary that he would have been entitled to receive between the date of termination and the end of the initial term of the agreement. |
| (3) | Reflects 75% cost share on COBRA family PPO rate for 12 months. The NEO and any eligible dependents shall be entitled to continue receiving coverage under all Company group health benefit plans until the earlier of (a) 12 months following the termination date, (b) the date the NEO violates any restrictive covenants set forth in his employment agreement or (c) the date the NEO becomes eligible to participate in any other group health benefit plan. |
| (4) | Amounts include (i) the difference between the exercise price of the unvested options that would have been accelerated and the estimated fair market value of the underlying shares ofnon-voting common stock as of September 30, 2017 and (ii) amounts of unpaid dividend equivalents with respect to such unvested options. The Option Plan provides for accelerated vesting of the time-vested portion of unvested awards upon a change in control or “liquidity event” as defined in the Option Plan. |
| 123 |
Table of Contents
Confidential Treatment Requested Pursuant to 17 C.F.R. Section 200.83
Equity Plans
Option Plan
Prior to this offering, equity compensation was granted in the form of options to purchase ournon-voting common stock pursuant to the Option Plan. In connection with the Reorganization, outstanding options will become exerciseable for shares of our Class A subordinate voting stock. As of , 2018, after giving effect to the Reorganization, we had outstanding options to purchase an aggregate of shares of our Class A subordinate voting stock, with a weighted-average exercise price of $ per share. See “Description of Capital Stock—Options.”
No future awards will be granted pursuant to the Option Plan following this offering.
2018 Equity Incentive Plan
In connection with this offering, we expect to adopt a 2018 Equity Incentive Plan (the “2018 Equity Plan”). Under the 2018 Equity Plan, we will be authorized to grant stock options (either incentive ornon-qualified), restricted stock, restricted stock units, performance shares, performance share units, stock appreciation rights and other stock-based awards with respect to our Class A subordinate voting stock. The maximum number of shares of Class A subordinate voting stock that will be available for issuance pursuant to the 2018 Equity Incentive Plan will initially be shares. We will provide additional details regarding the material terms and conditions of the 2018 Equity Plan in a subsequentpre-effective amendment to the registration statement of which this prospectus forms a part.
Tax Deductibility of Compensation
Section 162(m) of the Internal Revenue Code imposes a $1 million limit per year on the amount that a public company may deduct for compensation paid to certain of the company’s executive officers who served during the tax year. The Company intends to take advantage of the transition rules for newly public companies provided under IRS regulations to the maximum extent possible.
| 124 |
Table of Contents
Confidential Treatment Requested Pursuant to 17 C.F.R. Section 200.83
CERTAIN RELATIONSHIPS AND RELATED PARTY TRANSACTIONS
Stockholders Agreement
We expect to enter into a stockholders agreement that will provide Barry Zekelman, Clayton Zekelman and Alan Zekelman each with the right to nominate one director following this offering and for so long as the nominating individual (or his permitted transferees) maintains beneficial ownership of at least five percent of our outstanding capital stock. In addition, as long as Barry Zekelman serves as our CEO, he will serve on our Board separately from such nominating rights. The Board has the right to reject a nominee if, after consultation with counsel, it determines in good faith that the nomination would violate its fiduciary duties, applicable law or listing standards; provided that we must promptly notify the nominating member of the Zekelman family of the rejection and reasons therefor and the nominating person will have the opportunity to name a replacement nominee. Each of Barry Zekelman, Clayton Zekelman and Alan Zekelman has agreed to vote in favor of all of the Zekelman family nominees. If any Zekelman family nominee ceases to serve as a director for any reason, a replacement may be appointed by the member of the Zekelman family with the right to nominate that director. For so long as any member of the Zekelman family has nominating rights, we will not be permitted to increase the size of the Board without consent of such person.
Registration Rights Agreement
We expect to enter into a registration rights agreement that will provide members of the Zekelman family, through entities they control, with certain demand registration rights following the expiration of the180-daylock-up period following this offering. In addition, in the event that we register additional shares of Class A subordinate voting stock for sale to the public following the completion of this offering, members of the Zekelman family will have piggyback registration rights. These registration rights will be subject to certain customary limitations in terms of the number of registrations we will be required to effect, the minimum amounts we will be required to register and other matters. We will be required to bear the registration expenses, other than underwriting discounts and commissions and transfer taxes, associated with any registration of shares pursuant to the registration rights agreement. The registration rights agreement will include customary indemnification provisions.
Other Related Party Transactions
Our Board of Directors approved a new CEO employment agreement for Barry Zekelman in April 2016. This new agreement mandated that we seek key man life insurance on Barry Zekelman. In August 2016, we purchased an existing,in-force life insurance policy from an entity controlled by Barry Zekelman for $2.2 million.
In March 2016, we purchased two buildings previously rented for use by us from an entity controlled by Barry Zekelman for $1.7 million.
In August 2013, an entity controlled by Clayton Zekelman purchased a portion of our previously outstanding unsecured senior notes with a total principal value of $5.0 million on the open market. In February 2015, the same entity controlled by Clayton Zekelman purchased additional unsecured senior notes with a total principal value of $1.0 million. In connection with our debt refinancing in June 2016, the $6.0 million unsecured senior notes held by the entity controlled by Clayton Zekelman were fully redeemed.
As of September 30, 2017, September 24, 2016 and September 26, 2015, we had related party receivables for cash advances outstanding from an entity controlled by Barry Zekelman of $5.3 million, $3.6 million and $0.1 million, respectively. As of March 31, 2018, $3.0 million was outstanding. All outstanding amounts will be repaid prior to completion of this offering.
We receive information technology services from a company that is controlled by Clayton Zekelman. We incurred costs of less than $0.1 million during each of fiscal years 2017, 2016 and 2015 related to these services.
| 125 |
Table of Contents
Confidential Treatment Requested Pursuant to 17 C.F.R. Section 200.83
Limitation of Liability and Indemnification of Officers and Directors
Our amended and restated certificate of incorporation will contain provisions that limit the liability of our directors for monetary damages to the fullest extent permitted by Delaware law. Consequently, our directors will not be personally liable to us or our stockholders for monetary damages for any breach of fiduciary duties as directors, except liability for the following:
| • | any breach of their duty of loyalty to our company or our stockholders; |
| • | any act or omission not in good faith or that involves intentional misconduct or a knowing violation of law; |
| • | unlawful payments of dividends or unlawful stock repurchases or redemptions as provided in Section 174 of the Delaware General Corporation Law; or |
| • | any transaction from which they derived an improper personal benefit. |
Any amendment to, or repeal of, these provisions will not eliminate or reduce the effect of these provisions in respect of any act, omission, or claim that occurred or arose prior to that amendment or repeal. If the Delaware General Corporation Law is amended to provide for further limitations on the personal liability of directors of corporations, then the personal liability of our directors will be further limited to the greatest extent permitted by the Delaware General Corporation Law.
In addition, we expect to adopt amended and restated bylaws, which will become effective immediately prior to the completion of this offering, and which will provide that we will indemnify, to the fullest extent permitted by law, any person who is or was a party or is threatened to be made a party to any action, suit, or proceeding by reason of the fact that he or she is or was one of our directors or officers or is or was serving at our request as a director, officer, employee or agent of another corporation, partnership, joint venture, trust, or other enterprise. Our amended and restated bylaws are expected to provide that we may indemnify to the fullest extent permitted by law any person who is or was a party or is threatened to be made a party to any action, suit, or proceeding by reason of the fact that he or she is or was one of our employees or agents. Our amended and restated bylaws will also provide that we must advance expenses incurred by or on behalf of a director or officer in advance of the final disposition of any action or proceeding, subject to limited exceptions.
Further, we have entered into or will enter into indemnification agreements with each of our directors and executive officers that may be broader than the specific indemnification provisions contained in the Delaware General Corporation Law. These indemnification agreements require us, among other things, to indemnify our directors and executive officers against liabilities that may arise by reason of their status or service. These indemnification agreements also require us to advance all expenses incurred by the directors and executive officers in investigating or defending any such action, suit, or proceeding.
The limitation of liability and indemnification provisions that are expected to be included in our amended and restated certificate of incorporation, amended and restated bylaws, and in indemnification agreements that we have entered into or will enter into with our directors and executive officers may discourage stockholders from bringing a lawsuit against our directors and executive officers for breach of their fiduciary duties. They may also reduce the likelihood of derivative litigation against our directors and executive officers, even though an action, if successful, might benefit us and other stockholders. Further, a stockholder’s investment may be adversely affected to the extent that we pay the costs of settlement and damage awards against directors and executive officers as required by these indemnification provisions.
We have obtained insurance policies under which, subject to the limitations of the policies, coverage is provided to our directors and executive officers against loss arising from claims made by
| 126 |
Table of Contents
Confidential Treatment Requested Pursuant to 17 C.F.R. Section 200.83
reason of breach of fiduciary duty or other wrongful acts as a director or executive officer, including claims relating to public securities matters, and to us with respect to payments that may be made by us to these directors and executive officers pursuant to our indemnification obligations or otherwise as a matter of law.
The underwriting agreement will provide for indemnification by the underwriters of us and our officers and directors for certain liabilities arising under the Securities Act or otherwise.
Insofar as indemnification for liabilities arising under the Securities Act may be permitted to directors, officers or persons controlling our company pursuant to the foregoing provisions, we have been informed that, in the opinion of the SEC, such indemnification is against public policy as expressed in the Securities Act and is therefore unenforceable.
Policies and Procedures for Related Party Transactions
Following the completion of this offering, our audit committee will have the primary responsibility for reviewing and approving or disapproving “related party transactions,” which are transactions between us and related persons in which the aggregate amount involved exceeds or may be expected to exceed $120,000 and in which a related person has or will have a direct or indirect material interest. Upon completion of this offering, our policy regarding transactions between us and related persons will provide that a related person is defined as a director, executive officer, nominee for director, or greater than 5% beneficial owner of our common stock, in each case since the beginning of the most recently completed year, and any of their immediate family members. Our audit committee charter that will be in effect upon completion of this offering will provide that our audit committee shall review and approve or disapprove any related party transactions.
| 127 |
Table of Contents
Confidential Treatment Requested Pursuant to 17 C.F.R. Section 200.83
PRINCIPAL AND SELLING STOCKHOLDERS
The following table sets forth information with respect to the beneficial ownership of our shares as of , 2018, assuming completion of the Reorganization, by:
| • | each named executive officer; |
| • | each of our directors; |
| • | our directors and executive officers as a group; |
| • | each beneficial owner of more than 5% of our Class A subordinate voting stock or Class B multiple voting stock; and |
| • | all selling stockholders. |
Except as indicated by the footnotes below, we believe, based on information furnished to us, that the persons and entities named in the table below have sole voting and sole investment power with respect to all shares that they beneficially own, subject to applicable community property laws.
The number and percentage of beneficially owned shares are based on shares of Class A subordinate voting stock and shares of Class B multiple voting stock outstanding as of , 2018, after giving effect to completion of the Reorganization and an assumption that all Exchangeable Shares have been exchanged for shares of Class B multiple voting stock and the corresponding Special Voting Shares have been cancelled without consideration. The number and percentage ownership of shares of Class A subordinate voting stock do not include shares of Class A subordinate voting stock that may be issued upon conversion of shares of Class B multiple voting stock. Applicable percentage ownership after the offering is based on no exercise by the underwriters of their option to purchase additional Class A subordinate voting stock.
Unless otherwise indicated, the address for each beneficial owner listed in the table below is c/o Zekelman Industries, Inc., 227 West Monroe Street, Suite 2600, Chicago, Illinois 60606.
Beneficial Ownership | # of Shares being sold | Beneficial Ownership After the Offering | ||||||||||||||||||||||||||||||||||||||||||
| Subordinate Voting | Multiple Voting | % of Total Voting Power Before the Offering | Subordinate Voting | Multiple Voting | % of Total Voting Power After the Offering | |||||||||||||||||||||||||||||||||||||||
Name of Beneficial Owner | Shares | % | Shares | % | Shares | % | Shares | % | ||||||||||||||||||||||||||||||||||||
Directors and Named Executive Officers: | ||||||||||||||||||||||||||||||||||||||||||||
Barry M. Zekelman(1) | ||||||||||||||||||||||||||||||||||||||||||||
Michael J. Graham(2) | ||||||||||||||||||||||||||||||||||||||||||||
Michael P. McNamara(3) | ||||||||||||||||||||||||||||||||||||||||||||
Michael E. Mechley(4) | ||||||||||||||||||||||||||||||||||||||||||||
Armand F. Lauzon, Jr.(5) | ||||||||||||||||||||||||||||||||||||||||||||
David W. Seeger(6) | ||||||||||||||||||||||||||||||||||||||||||||
Edward M. Siegal(7) | ||||||||||||||||||||||||||||||||||||||||||||
Alan S. Zekelman(8) | ||||||||||||||||||||||||||||||||||||||||||||
Clayton W. Zekelman(9) | ||||||||||||||||||||||||||||||||||||||||||||
All directors and executive officers as a group (9 persons) | ||||||||||||||||||||||||||||||||||||||||||||
Other Selling Stockholders: | ||||||||||||||||||||||||||||||||||||||||||||
| * | Represents beneficial ownership of less than 1%. |
| (1) | Before the offering, consists of shares of Class B multiple voting stock directly held by Man of Steel Holdings Ltd. and shares of Class B multiple voting stock directly held by 1156676 Ontario Ltd. or a newly-formed subsidiary of such entity (inclusive of shares issuable upon exchange of Exchangeable Shares). After the offering, consists |
| 128 |
Table of Contents
Confidential Treatment Requested Pursuant to 17 C.F.R. Section 200.83
| of shares of Class B multiple voting stock directly held by Man of Steel Holdings Ltd. and shares of Class B multiple voting stock directly held by 1156676 Ontario Ltd. or a newly-formed subsidiary of such entity (inclusive of shares issuable upon exchange of Exchangeable Shares). Mr. Barry Zekelman disclaims beneficial ownership of the remaining shares of Class B multiple voting stock and Exchangeable Shares directly held by 1156676 Ontario Ltd. or a newly-formed subsidiary of such entity, which are beneficially owned by Messrs. Alan Zekelman and Clayton Zekelman, respectively, as set forth in other notes to this table. |
| (2) | Consists of shares of Class A subordinate voting stock issuable upon exercise of stock options. |
| (3) | Consists of shares of Class A subordinate voting stock issuable upon exercise of stock options. |
| (4) | Consists of shares of Class A subordinate voting stock issuable upon exercise of stock options. |
| (5) | Consists of shares of Class A subordinate voting stock issuable upon exercise of stock options. |
| (6) | Consists of shares of Class A subordinate voting stock issuable upon exercise of stock options. |
| (7) | Consists of shares of Class A subordinate voting stock issuable upon exercise of stock options. |
| (8) | Before the offering, consists of shares of Class B multiple voting stock directly held by 1156676 Ontario Ltd. or a newly-formed subsidiary of such entity (inclusive of shares issuable upon exchange of Exchangeable Shares). After the offering, consists of shares of Class B multiple voting stock directly held by 1156676 Ontario Ltd. or a newly-formed subsidiary of such entity (inclusive of shares issuable upon exchange of Exchangeable Shares). Mr. Alan Zekelman disclaims beneficial ownership of the remaining shares of Class B multiple voting stock and Exchangeable Shares directly held by 1156676 Ontario Ltd. or a newly-formed subsidiary of such entity, which are beneficially owned by Messrs. Barry Zekelman and Clayton Zekelman, respectively, as set forth in other notes to this table. |
| (9) | Before the offering, consists of shares of Class B multiple voting stock directly held by 1156676 Ontario Ltd. or a newly-formed subsidiary of such entity (inclusive of shares issuable upon exchange of Exchangeable Shares). After the offering, consists of shares of Class B multiple voting stock directly held by 1156676 Ontario Ltd. or a newly-formed subsidiary of such entity (inclusive of shares issuable upon exchange of Exchangeable Shares). Mr. Clayton Zekelman disclaims beneficial ownership of the remaining shares of Class B multiple voting stock and Exchangeable Shares directly held by 1156676 Ontario Ltd. or a newly-formed subsidiary of such entity, which are beneficially owned by Messrs. Barry Zekelman and Alan Zekelman, respectively, as set forth in other notes to this table. |
| 129 |
Table of Contents
Confidential Treatment Requested Pursuant to 17 C.F.R. Section 200.83
General
The following description summarizes certain important terms of our capital stock, as they are expected to be in effect immediately prior to the completion of this offering. We expect to adopt an amended and restated certificate of incorporation and amended and restated bylaws that will become effective immediately prior to the completion of this offering, and this description summarizes the provisions that are expected to be included in such documents. Because it is only a summary, it does not contain all the information that may be important to you. For a complete description of the matters set forth in this section titled “Description of Capital Stock,” you should refer to the forms of our amended and restated certificate of incorporation and bylaws, which are included as exhibits to the registration statement of which this prospectus forms a part, and to the applicable provisions of Delaware law.
Immediately following the completion of this offering, our authorized capital stock will consist of shares of capital stock, $ par value per share, of which:
| • | shares are designated as Class A subordinate voting stock; |
| • | shares are designated as Class B multiple voting stock; |
| • | shares are designated as Special Voting Shares; and |
| • | shares are designated as preferred stock. |
In addition, as described below, one of our subsidiaries has a class of Exchangeable Shares that are exchangeable for shares of our Class B multiple voting stock.
Assuming the effectiveness of the Reorganization, as of , 2018, there were no shares of our Class A subordinate voting stock outstanding, shares of our Class B multiple voting stock outstanding held by stockholders of record and Special Voting Shares and Exchangeable Shares outstanding held by stockholders of record. Pursuant to our amended and restated certificate of incorporation, our Board of Directors will have the authority, without stockholder approval except as required by the listing standards of , to issue additional shares of our capital stock.
The shares designated as Class A subordinate voting stock are “restricted securities” within the meaning of such term under applicable Canadian securities laws. We are exempt from the requirements of Section 12.3 of National Instrument41-101—General Prospectus Requirements, or NI41-101, of the Canadian Securities Administrators on the basis that we were a private issuer within the meaning of such term under applicable Canadian securities laws immediately before filing the prospectus.
Class A Subordinate Voting Stock and Class B Multiple Voting Stock
The rights of the holders of Class A subordinate voting stock and Class B multiple voting stock are identical, except with respect to voting and conversion.
Dividend Rights
Subject to preferences that may apply to any shares of preferred stock outstanding at the time, the holders of our Class A subordinate voting stock and Class B multiple voting stock are entitled to receive dividends out of funds legally available if our Board of Directors, in its discretion, determines to issue dividends and then only at the times and in the amounts that our Board of Directors may
| 130 |
Table of Contents
Confidential Treatment Requested Pursuant to 17 C.F.R. Section 200.83
determine. The dividend rights of the Class A subordinate voting stock and Class B multiple voting stock are identical, and any dividends must be paid to holders on a pro rata basis. See the section titled “Dividend Policy” for additional information.
Voting Rights
Holders of our Class B multiple voting stock are entitled to ten votes for each share held and holders of our Class A subordinate voting stock are entitled to one vote for each share held on all matters submitted to a vote of stockholders. The holders of our common stock vote together as a single class, unless otherwise required by law. For example, Delaware law could require either holders of our Class A subordinate voting stock or our Class B multiple voting stock to vote separately as a single class in the following circumstances:
| • | if we were to seek to amend our amended and restated certificate of incorporation to increase or decrease the par value of a class of stock, then that class would be required to vote separately to approve the proposed amendment; and |
| • | if we were to seek to amend our amended and restated certificate of incorporation in a manner that alters or changes the powers, preferences, or special rights of a class of stock in a manner that affected its holders adversely, then that class would be required to vote separately to approve the proposed amendment. |
Stockholders do not have the ability to cumulate votes for the election of directors.
After giving effect to the Reorganization and this offering (and assuming both no exercise of the underwriters’ option to purchase additional shares of Class A subordinate voting stock and the exchange of all Exchangeable Shares for Class B multiple voting stock and the cancellation of the corresponding Special Voting Shares): (i) the Class A subordinate voting stock will collectively represent % of the total number of shares of our Class A subordinate voting stock and Class B multiple voting stock outstanding and % of the voting power attached to the Class A subordinate voting stock and Class B multiple voting stock; and (ii) the Class B multiple voting stock will collectively represent % of the total number of shares of our Class A subordinate voting stock and Class B multiple voting stock outstanding and % of the total voting power attached to the Class A subordinate voting stock and Class B multiple voting stock. After giving effect to the Reorganization and this offering (and assuming both exercise of the underwriters’ option to purchase additional shares of Class A subordinate voting stock and the exchange of all Exchangeable Shares for Class B multiple voting stock and the cancellation of the corresponding Special Voting Shares): (i) the Class A subordinate voting stock will collectively represent % of the total number of shares of our Class A subordinate voting stock and Class B multiple voting stock outstanding and % of the total voting power attached to the Class A subordinate voting stock and Class B multiple voting stock; and (ii) the Class B multiple voting stock will collectively represent % of the total number of shares of our Class A subordinate voting stock and Class B multiple voting stock outstanding and % of the total voting power attached to the Class A subordinate voting stock and Class B multiple voting stock.
No Preemptive or Similar Rights
Our common stock is not entitled to preemptive rights, and is not subject to redemption or sinking fund provisions.
Right to Receive Liquidation Distributions
If we become subject to a liquidation, dissolution, orwinding-up, the assets legally available for distribution to our stockholders would be distributable ratably among the holders of our Class A subordinate voting stock and Class B multiple voting stock and any participating preferred stock
| 131 |
Table of Contents
Confidential Treatment Requested Pursuant to 17 C.F.R. Section 200.83
outstanding at that time, subject to prior satisfaction of all outstanding debt and liabilities and the preferential rights of and the payment of liquidation preferences, if any, on any outstanding shares of preferred stock.
Conversion of Class B Multiple Voting Stock
Each share of Class B multiple voting stock is convertible at any time at the option of the holder into one share of Class A subordinate voting stock. Following the completion of this offering, shares of Class B multiple voting stock will automatically convert into shares of Class A subordinate voting stock upon sale or transfer, other than with respect to certain permitted transfers to be described in our amended and restated certificate of incorporation. These permitted transfers will include transfers to or among members of the Zekelman family or entities controlled by any of them, as well as certain transfers for tax or estate planning purposes.
All the outstanding shares of Class B multiple voting stock will convert automatically into shares of Class A subordinate voting stock on the date (the “Automatic Conversion Date”) that the number of shares of Class B multiple voting stock then outstanding (plus the number of shares of Class B multiple voting stock issuable pursuant to Exchangeable Shares then outstanding) is less than 15% of the aggregate number of shares of Class A subordinate voting stock and Class B multiple voting stock outstanding (plus the number of shares of Class B multiple voting stock issuable pursuant to Exchangeable Shares then outstanding).
Once converted into Class A subordinate voting stock, the Class B multiple voting stock may not be reissued.
Special Voting Shares and Exchangeable Shares
Special Voting Shares
The Special Voting Shares will be issued to holders of the Exchangeable Shares. The number of Special Voting Shares that we will issue in connection with the Reorganization will be equal to the number of Exchangeable Shares that are issued in connection with the Reorganization. The number of Special Voting Shares issued and outstanding in our capital stock at any given time will always correspond on aone-for-one basis with the number of Exchangeable Shares issued and outstanding, and the Special Voting Shares cannot be separated from the Exchangeable Shares.
Our Special Voting Shares allow holders of the Exchangeable Shares (as described below) to vote on anas-exchanged basis with holders of our Class A subordinate voting stock and Class B multiple voting stock. For so long as the Exchangeable Shares are exchangeable for shares of our Class B multiple voting stock, holders of our Special Voting Shares will be entitled to ten votes for each share held. Following the Automatic Conversion Date, the Exchangeable Shares will be exchangeable for shares of our Class A subordinate voting stock only, and thereafter holders of our Special Voting Shares will be entitled to only one vote for each share. The holders of Special Voting Shares will vote together as a single class with holders of our Class A subordinate voting stock and Class B multiple voting stock, unless otherwise required by law. Holders of Special Voting Shares will be able to vote in person or by proxy on any matters put before holders of our Class A subordinate voting stock and Class B multiple voting stock at any stockholders meeting.
Our Special Voting Shares do not entitle their holders to receive dividends or distributions from us or to receive any consideration in the event of our liquidation, dissolution orwinding-up. To the extent Exchangeable Shares are exchanged for shares of our Class B multiple voting stock, a corresponding number of Special Voting Shares will be cancelled without consideration.
| 132 |
Table of Contents
Confidential Treatment Requested Pursuant to 17 C.F.R. Section 200.83
Exchangeable Shares
The following is a summary of the rights, privileges, restrictions and conditions attaching to the Exchangeable Shares of 6582125 Canada Inc. (“CanCo”), our subsidiary. Because this description is a summary, it does not contain all the information that may be important to you. For a complete description, you should refer to the exchangeable shares provision of CanCo and the exchangeable share support agreement, which are included as exhibits to the registration statement of which this prospectus forms a part.
The Exchangeable Shares, together with the Special Voting Shares, are intended to be the economic and voting equivalent to shares of our Class B multiple voting stock. The rights, preferences, restrictions and conditions attaching to the Exchangeable Shares include the following:
| • | Any holder of Exchangeable Shares is entitled at any time to require CanCo to redeem any or all of the Exchangeable Shares registered in such holder’s name in exchange for each Exchangeable Share presented and surrendered (i) prior to the Automatic Conversion Date, at the election of the holder, one share of our Class B multiple voting stock or one share of our Class A subordinate voting stock, or (ii) from and after the Automatic Conversion Date, one share of our Class A subordinate voting stock, in the case of (i) or (ii) plus a cash payment in an amount equal to any accrued and unpaid dividends on such Exchangeable Shares at the time of redemption. The right of a holder of Exchangeable Shares to require CanCo to redeem such holder’s Exchangeable Shares is referred to herein as the put right. |
| • | If we declare a dividend on our Class A subordinate voting stock and Class B multiple voting stock, the holders of Exchangeable Shares are entitled to receive from CanCo the same dividend, or an economically equivalent dividend, on their Exchangeable Shares. |
| • | Holders of Exchangeable Shares are not entitled to receive notice of or to attend any meeting of the stockholders of CanCo or to vote at any such meeting, except as required by law or as specifically provided in the Exchangeable Share conditions. |
| • | We will have the right to redeem the Exchangeable Sharesfor shares of our Class B multiple voting stock (if prior to the Automatic Conversion Date) or Class A subordinate voting stock (if after the Automatic Conversion Date), as applicable, together with payment of any accrued and unpaid dividends on the Exchangeable Shares, at any time on the earliest to occur of (i) , 2058, (ii) the date on which fewer than 10% of the originally issued Exchangeable Shares remain issued and outstanding or (iii) the effective date of a change of control, or the sale of all or substantially all of the assets, of Zekelman Industries. The right of CanCo to force the exchange of all Exchangeable Shares is referred to herein as the call right. |
| • | The right of holders of Exchangeable Shares to require CanCo to redeem their Exchangeable Shares and our right to redeem the Exchangeable Shares, both as described above, are subject to our overriding right (and, in some circumstances, our obligation) to purchase, or cause another subsidiary to purchase, such shares at a rate of one share of our Class B multiple voting stock (if prior to the Automatic Conversion Date) or one share of our Class A subordinate voting stock (if after the Automatic Conversion Date), as applicable, for each Exchangeable Share, together with all declared and unpaid dividends on such Exchangeable Share. |
| • | Holders of Exchangeable Shares will be entitled to vote their Special Voting Shares. |
Exchangeable Share Support Agreement
In connection with the issuance of the Exchangeable Shares as part of the Reorganization, we will enter into an exchangeable share support agreement with, among others, CanCo and the holders of the Exchangeable Shares.
| 133 |
Table of Contents
Confidential Treatment Requested Pursuant to 17 C.F.R. Section 200.83
Pursuant to the exchangeable share support agreement, for so long as any Exchangeable Shares (other than Exchangeable Shares held by us or any of our subsidiaries) remain outstanding:
| • | CanCo and we will take all actions and do all things as are reasonably necessary or desirable to enable and permit it and us, in accordance with applicable law, to perform our respective obligations and complete all such actions and all such things as are necessary or desirable to enable and permit us to deliver or cause to be delivered shares of our Class B multiple voting stock or Class A subordinate voting stock, as applicable, to the holders of Exchangeable Shares who exercise their put rights. |
| • | We will take all such actions and do all things as are necessary or desirable to enable and permit us, in accordance with applicable law, to perform our obligations arising upon the exercise of our rights to acquire Exchangeable Shares, including without limitation all such actions and all such things as are necessary or desirable to enable and permit us to deliver or cause to be delivered shares of our Class B multiple voting stock or Class A subordinate voting stock, as applicable, to the holders of Exchangeable Shares in accordance with the provisions of such rights. |
| • | We will not take any action relating to a voluntary liquidation, dissolution orwinding-up of CanCo, or the continuance or other transfer of the corporate existence of CanCo to any jurisdiction outside of Canada, prior to the redemption of the Exchangeable Shares. |
We will send to the holders of Exchangeable Shares, to the extent not already sent to holders of the Special Voting Shares, the notice of each meeting at which our stockholders are entitled to vote, together with the related meeting materials, including without limitation, any circular or information statement. Such mailing will commence on the same day as we send such notice and materials to our stockholders. We will also send to the holders of Exchangeable Shares copies of all information statements, interim and annual financial statements, reports and other materials that we send to our stockholders at the same time as such materials are sent to our stockholders. We will also use reasonable efforts to obtain and deliver a copy of any materials sent by a third party to our stockholders, including dissident proxy and information circulars (and related information and materials) and tender and exchange offer circulars, as soon as reasonably practicable after receipt of such materials by us or by our stockholders (if such receipt is known by us), to the extent not already sent to holders of the Special Voting Shares.
The exchangeable share support agreement further provides that, in the event of any proposed tender offer, share exchange offer, issuer bid, take-over bid or similar transaction with respect to the shares of our Class A subordinate voting stock or Class B multiple voting stock which is recommended by our Board of Directors, we will use all reasonable efforts expeditiously and in good faith to take all actions necessary or desirable to enable and permit holders of Exchangeable Shares to participate in such transaction to the same extent and on an economically equivalent basis as holders of shares of our Class B multiple voting stock and Class A subordinate voting stock, without discrimination.
In order to assist us in complying with our obligations under the exchangeable share support agreement, CanCo is required to notify us as soon as practicable upon the exercise of its rights (or in certain cases, its obligation) to acquire Exchangeable Shares.
We will not take any action that will result in the declaration or payment of any dividend or make any other distribution on our Class B multiple voting stock or Class A subordinate voting stock unless (i) CanCo shall simultaneously, declare or pay, as the case may be, an equivalent dividend or other distribution economically equivalent thereto on the Exchangeable Shares and has sufficient money or other assets or authorized but unissued securities available to enable the due declaration and the due and punctual payment, in accordance with applicable law and the Exchangeable Share provisions, of such equivalent dividend, or (ii) if the dividend or other distribution is a stock or share dividend or
| 134 |
Table of Contents
Confidential Treatment Requested Pursuant to 17 C.F.R. Section 200.83
distribution of stock or shares, CanCo effects a corresponding, contemporaneous and economically equivalent subdivision of the Exchangeable Shares and has sufficient authorized but unissued shares to enable such subdivision. In order to assist CanCo in complying with its obligations under the exchangeable share support agreement, we will notify CanCo as soon as possible upon a proposed declaration by us of any dividend on our shares of Class B multiple voting stock and Class A subordinate voting stock and take all such other actions as are reasonably necessary, in cooperation with CanCo, to ensure that the respective declaration date, record date and payment date (or, in the case of a stock dividend, the effective date for any subdivision of the Exchangeable Shares) for a dividend on our shares of Class B multiple voting stock and Class A subordinate voting stock shall be the same as the declaration date, record date and payment date for the corresponding dividend on the Exchangeable Shares, subject to all applicable laws.
We will reserve for issuance, and will keep available free frompre-emptive and other rights, such number of Class B multiple voting stock and Class A subordinate voting stock issuable upon the conversion of all issued and outstanding Exchangeable Shares in accordance with their terms from time to time.
We will not: (i) issue or distribute, as applicable, any rights, options, securities or other assets to holders of Class B multiple voting stock or Class A subordinate voting stock unless the same or the economic equivalent thereof (on a per share basis) is issued or distributed, as applicable, to the holders of Exchangeable Shares; or (ii) change our share capitalization (whether by way of subdivision, combination, reclassification or otherwise) unless the same or an economically equivalent change is made to or in the rights of the holders of Exchangeable Shares.
We will not consummate any transaction whereby all or substantially all of our assets would become the property of a successor person or entity unless, in connection with such transaction: (i) the successor becomes bound by all of our obligations under the exchangeable share support agreement, whether by operation of law or contractually; and (ii) the rights, duties, powers and authorities of the other parties to the exchangeable share support agreement are preserved and are not impaired in any material respect.
Preferred Stock
Our Board of Directors is authorized, subject to limitations prescribed by Delaware law, to issue preferred stock in one or more series, to establish from time to time the number of shares to be included in each series, and to fix the designation, powers, preferences, and rights of the shares of each series and any of its qualifications, limitations, or restrictions, in each case without further vote or action by our stockholders. Our Board of Directors can also increase or decrease the number of shares of any series of preferred stock, but not below the number of shares of that series then outstanding, without any further vote or action by our stockholders. Our Board of Directors may authorize the issuance of preferred stock with voting or conversion rights that could adversely affect the voting power or other rights of the holders of our common stock. The issuance of preferred stock, while providing flexibility in connection with possible acquisitions and other corporate purposes, could, among other things, have the effect of delaying, deferring, or preventing a change in control of our company and might adversely affect the market price of our common stock and the voting and other rights of the holders of our common stock. We have no current plan to issue any shares of preferred stock.
Options
As of , 2018, after giving effect to the Reorganization, we had outstanding options to purchase an aggregate of shares of our Class A subordinate voting stock, with a weighted-average exercise price of $ per share. We expect that selling stockholders will exercise a total of of such options with a weighted-average exercise price of $ per share in order to sell the underlying shares in this offering.
| 135 |
Table of Contents
Confidential Treatment Requested Pursuant to 17 C.F.R. Section 200.83
The following table shows the aggregate number of options outstanding as of , 2018, after giving effect to the Reorganization.
Category of Holder | Number of Options | Exercise Price per Option | Expiration Date | |||||||||
All of our executive officers and past executive officers, as a group ( in total) | $ | From to | ||||||||||
All of our directors and past directors who are not also executive officers, as a group ( in total) | $ | From to | ||||||||||
All directors and past directors of our subsidiaries who are not also executive officers of the subsidiary, as a group ( in total) | $ | From to | ||||||||||
All of our other employees and past employees, as a group ( in total) | $ | From to | ||||||||||
Registration Rights
See “Certain Relationships and Related Party Transactions—Registration Rights Agreement” for information about certain registration rights that entities controlled by members of the Zekelman family will be entitled to following this offering.
Anti-Takeover Provisions
Certain provisions of Delaware law, our amended and restated certificate of incorporation, and our amended and restated bylaws, which are summarized below, may have the effect of delaying, deferring, or discouraging another person from acquiring control of us. They are also designed, in part, to encourage persons seeking to acquire control of us to negotiate first with our Board of Directors. We believe that the benefits of increased protection of our potential ability to negotiate with an unfriendly or unsolicited acquirer outweigh the disadvantages of discouraging a proposal to acquire us because negotiation of these proposals could result in an improvement of their terms.
Business Combinations with Interested Stockholders
We will elect in our amended and restated certificate of incorporation not to be subject to Section 203 of the Delaware General Corporation Law, which generally prohibits a publicly held Delaware corporation from engaging in a business combination, such as a merger, with a person or group owning 15% or more of the corporation’s voting stock, for a period of three years following the date the person became an interested stockholder, unless (with certain exceptions) the business combination or the transaction in which the person became an interested stockholder is approved in a prescribed manner. Accordingly, we are not subject to any anti-takeover effects of Section 203. However, our amended and restated certificate of incorporation will contain provisions that have the same effect as Section 203, except that they provide that members of the Zekelman family and their permitted transferees will not be deemed to be “interested stockholders,” regardless of the percentage of our voting stock owned by them, and accordingly will not be subject to such restrictions.
| 136 |
Table of Contents
Confidential Treatment Requested Pursuant to 17 C.F.R. Section 200.83
Amended and Restated Certificate of Incorporation and Amended and Restated Bylaw Provisions
Our amended and restated certificate of incorporation and our amended and restated bylaws will include a number of provisions that could deter hostile takeovers or delay or prevent changes in control of our Board of Directors or management team, including the following:
Multiple Class Stock. As described above in “—Class A Subordinate Voting Stock and Class B Multiple Voting Stock—Voting Rights,” our amended and restated certificate of incorporation provides for a multiple class common stock structure, which will provide the Zekelman family and affiliated entities with significant influence over matters requiring stockholder approval, including the election of directors and significant corporate transactions, such as a merger or other sale of our company or its assets.
Issuance of Undesignated Preferred Stock. As discussed above under “—Preferred Stock,” our Board of Directors will have the ability to designate and issue preferred stock with voting or other rights or preferences that could deter hostile takeovers or delay changes in our control or management.
Board of Directors Vacancies. Our amended and restated certificate of incorporation and amended and restated bylaws will authorize only our Board of Directors to fill vacant directorships, including newly created seats. In addition, the number of directors constituting our Board of Directors will be permitted to be set only by a resolution adopted by a majority vote of our entire Board of Directors. These provisions would prevent a stockholder from increasing the size of our Board of Directors and then gaining control of our Board of Directors by filling the resulting vacancies with its own nominees. This will make it more difficult to change the composition of our Board of Directors.
Advance Notice Requirements for Stockholder Proposals and Director Nominations. Our amended and restated bylaws will provide advance notice procedures for stockholders seeking to bring business before our annual meeting of stockholders or to nominate candidates for election as directors at our annual meeting of stockholders. Our amended and restated bylaws will also specify certain requirements regarding the form and content of a stockholder’s notice. These provisions might preclude our stockholders from bringing matters before our annual meeting of stockholders or from making nominations for directors at our annual meeting of stockholders if the proper procedures are not followed. We expect that these provisions may also discourage or deter a potential acquirer from conducting a solicitation of proxies to elect the acquirer’s own slate of directors or otherwise attempting to obtain control of our company.
Classified Board of Directors. Following the Automatic Conversion Date, we will have a classified Board of Directors consisting of three classes. In addition, once our Board of Directors is classified, directors may only be removed for cause. The division of our Board of Directors into three classes with staggered three-year terms may delay or prevent a change of our management or a change in control.
Stockholder Action by Written Consent; Special Meetings of Stockholders. Following the Automatic Conversion Date, our stockholders will not be able to take action by written consent for any matter and may only take action at annual or special meetings. In addition, following such date, stockholders will not have the ability to call special meetings of our stockholders. These provisions might delay the ability of our stockholders to force consideration of a proposal or for stockholders controlling a majority of our capital stock to take any action.
Amendment of Charter and Bylaws Provisions. Following the Automatic Conversion Date, any amendment of the above provisions in our amended and restated certificate of incorporation and
| 137 |
Table of Contents
Confidential Treatment Requested Pursuant to 17 C.F.R. Section 200.83
or to our amended and restated bylaws would require approval by holders of at leasttwo-thirds of the voting power of our then outstanding capital stock.
Exclusive Forum
Our amended and restated bylaws will provide that, unless we consent in writing to the selection of an alternative forum, the sole and exclusive forum for (1) any derivative action or proceeding brought on our behalf, (2) any action asserting a claim of breach of a fiduciary duty owed by any of our directors, officers, or other employees to us or our stockholders, (3) any action asserting a claim against the company or any director or officer of the company arising pursuant to any provision of the Delaware General Corporation Law, or (4) any other action asserting a claim that is governed by the internal affairs doctrine shall be a state or federal court located within the State of Delaware, in all cases subject to the court’s having jurisdiction over indispensable parties named as defendants. Any person or entity purchasing or otherwise acquiring any interest in our shares of capital stock shall be deemed to have notice of and consented to this provision. Although we believe these provisions benefit us by providing increased consistency in the application of Delaware law for the specified types of actions and proceedings, the provisions may have the effect of discouraging lawsuits against us or our directors and officers. Our amended and restated bylaws will also provide that the federal district courts of the United States will be the exclusive forum for resolving any complaint asserting a cause of action arising under the Securities Act.
Transfer Agent and Registrar
Upon completion of this offering, the transfer agent and registrar for our Class A subordinate voting stock will be . The transfer agent and registrar’s address is .
Limitations of Liability and Indemnification
See the section titled “Certain Relationships and Related Party Transactions—Limitation of Liability and Indemnification of Officers and Directors.”
Listing
We intend to apply for the listing of our Class A subordinate voting stock on the under the symbol “ ” and on the Toronto Stock Exchange under the symbol “ ”. Listing will be subject to us fulfilling all the original listing requirements of the and the Toronto Stock Exchange. Neither the nor the Toronto Stock Exchange has conditionally approved our listing application and there is no assurance that either or both of the or the Toronto Stock Exchange will approve our listing application.
Prior Sales
The following summarizes the issuance by us of the securities of the class distributed under this prospectus and of securities that are convertible or exchangeable into securities of the class distributed under this prospectus during the12-month period preceding the date of this prospectus. During such time period, we have issued the following options, as adjusted to give effect to the Reorganization:
Date of Issuance | Type of Securities | Number of Securities Issued | Exercise Price | |||
| October 19, 2017 | Options to purchase shares of Class A subordinate voting stock | |||||
| February 16, 2018 | Options to purchase shares of Class A subordinate voting stock |
| 138 |
Table of Contents
Confidential Treatment Requested Pursuant to 17 C.F.R. Section 200.83
SHARES ELIGIBLE FOR FUTURE SALE
Prior to this offering, there has been no public market for our Class A subordinate voting stock, and we cannot predict the effect, if any, that market sales of shares of our Class A subordinate voting stock or the availability of shares of our Class A subordinate voting stock for sale will have on the market price of our Class A subordinate voting stock prevailing from time to time. Future sales of our common stock in the public market, or the availability of such shares for sale in the public market, could adversely affect market prices prevailing from time to time. As described below, only a limited number of shares of our Class A subordinate voting stock will be available for sale shortly after this offering due to contractual and legal restrictions on resale. Nevertheless, sales of our Class A subordinate voting stock in the public market after such restrictions lapse, or the perception that those sales may occur, could adversely affect the prevailing market price at such time and our ability to raise equity capital in the future.
Following the completion of the Reorganization and this offering, we will have a total of shares of our Class A subordinate voting stock and shares of our Class B multiple voting stock outstanding, and an additional shares of our Class A or Class B multiple voting stock will be issuable at upon exchange of outstanding Exchangeable Shares. Of these shares, all shares of our Class A subordinate voting stock sold in this offering will be freely tradable, except that any shares purchased in this offering by our affiliates, as that term is defined in Rule 144 under the Securities Act, would only be able to be sold in compliance with the Rule 144 limitations described below.
The remaining outstanding shares of our common stock will be deemed “restricted securities” as defined in Rule 144 under the Securities Act. Restricted securities may be sold in the public market only if they are registered under the Securities Act or if they qualify for an exemption from registration under Rule 144 or Rule 701 under the Securities Act, which rules are summarized below. As a result of thelock-up agreements referenced below and the provisions of the registration rights agreement described below, and subject to the provisions of Rule 144 or Rule 701, shares of our Class A subordinate voting stock will be available for sale in the public market as follows:
| • | beginning on the date of this prospectus, all shares of our Class A subordinate voting stock sold in this offering will be immediately available for sale in the public market; and |
| • | beginning 181 days after the date of this prospectus (subject to the terms of thelock-up agreements described below) additional shares of Class A subordinate voting stock will become eligible for sale in the public market (after conversion of shares of Class B common outstanding or that may be issued upon exchange of Exchangeable Shares), of which substantially all shares will be held by affiliates and subject to the volume and other restrictions of Rule 144, as described below, unless sold in a registered offering as provided by the registration rights agreement. |
Lock-Up Agreements
In connection with this offering, we, each of our directors, executive officers and certain other stockholders, will enter intolock-up agreements that restrict the sale of our securities for up to 180 days after the date of this prospectus, subject to certain exceptions or an extension in certain circumstances. See “Underwriting” for a description of thelock-up agreements that will be in effect following this offering.
Registration Rights
Beginning 180 days after the date of this prospectus, subject to certain exceptions and limitations, members of the Zekelman family, through entities that they control, will be entitled to the registration
| 139 |
Table of Contents
Confidential Treatment Requested Pursuant to 17 C.F.R. Section 200.83
rights described under “Certain Relationships and Related Party Transactions—Registration Rights Agreement.” Registration of these shares under the Securities Act would result in these shares becoming freely tradable without restriction under the Securities Act immediately upon sale pursuant to an effective registration statement.
Registration Statement on FormS-8
We intend to file a registration statement on FormS-8 under the Securities Act after the completion of this offering to register shares of our Class A subordinate voting stock subject to outstanding awards or reserved for future issuance under our equity compensation plans. The registration statement on FormS-8 is expected to become effective immediately upon filing, and shares of our common stock covered by the registration statement will then become eligible for sale in the public market, subject to the Rule 144 limitations applicable to affiliates, vesting restrictions, and any applicablelock-up agreements.
Rule 144
In general, Rule 144 provides that once we have been subject to the public company reporting requirements of Section 13 or Section 15(d) of the Exchange Act for at least 90 days, a person who is not deemed to have been one of our affiliates for purposes of the Securities Act at any time during the 90 days preceding a sale and who has beneficially owned the shares of our Class A subordinate voting stock proposed to be sold for at least six months is entitled to sell those shares without complying with the manner of sale, volume limitation, or notice provisions of Rule 144, subject to compliance with the public information requirements of Rule 144. If such a person has beneficially owned the shares proposed to be sold for at least one year, including the holding period of any prior owner other than our affiliates, then that person would be entitled to sell those shares without complying with any of the requirements of Rule 144.
In general, Rule 144 provides that our affiliates or persons selling shares of our Class A subordinate voting stock on behalf of our affiliates are entitled to sell upon expiration of thelock-up agreements described above, within any three-month period, a number of shares of our Class A subordinate voting stock that does not exceed the greater of:
| • | 1% of the number of shares of our Class A subordinate voting stock then outstanding, which will equal shares immediately after the completion of this offering; or |
| • | the average weekly trading volume of our Class A subordinate voting stock during the four calendar weeks preceding the filing of a notice on Form 144 with respect to that sale. |
Sales of Class A subordinate voting stock made in reliance upon Rule 144 by our affiliates or persons selling shares of our Class A subordinate voting stock on behalf of our affiliates are also subject to certain manner of sale provisions and notice requirements and to the availability of current public information about us.
Rule 701
Rule 701 generally allows a stockholder who purchased shares of our capital stock pursuant to a written compensatory plan or contract and who is not deemed to have been an affiliate of our company during the immediately preceding 90 days to sell these shares in reliance upon Rule 144, but without being required to comply with the public information, holding period, volume limitation, or notice provisions of Rule 144. Rule 701 also permits affiliates of our company to sell their Rule 701 shares under Rule 144 without complying with the holding period requirements of Rule 144. All holders of Rule 701 shares, however, are required to wait until 90 days after the date of this prospectus before selling those shares pursuant to Rule 701.
| 140 |
Table of Contents
Confidential Treatment Requested Pursuant to 17 C.F.R. Section 200.83
MATERIAL U.S. FEDERAL INCOME TAX CONSEQUENCES TONON-U.S. HOLDERS OF OUR CLASS A SUBORDINATE VOTING STOCK
The following is a summary of the material U.S. federal income tax consequences to certainnon-U.S. holders (as defined below) of the acquisition, ownership and disposition of our Class A subordinate voting stock but does not purport to be a complete analysis of all the potential tax considerations relating thereto. This summary is based upon the provisions of the Internal Revenue Code of 1986, as amended (the “Code”), Treasury Regulations promulgated thereunder, administrative rulings, judicial decisions, and published rulings and administrative pronouncements of the Internal Revenue Service (the “IRS”), all as of the date hereof. These authorities may be changed, possibly retroactively, so as to result in U.S. federal income tax consequences different from those set forth below. No ruling from the IRS has been, or will be, sought with respect to the tax consequences discussed herein, and there can be no assurance that the IRS will not take a position contrary to the tax consequences discussed below or that any position taken by the IRS would not be sustained.
This summary does not address the tax considerations arising under the laws of anynon-U.S., state, or local jurisdiction, or under U.S. federal gift and estate tax laws, except to the limited extent set forth below. In addition, this discussion does not address the application of the Medicare contribution tax on net investment income or any tax considerations applicable to anon-U.S. holder’s particular circumstances ornon-U.S. holders that may be subject to special tax rules, including, without limitation:
| • | banks, insurance companies or other financial institutions (except to the extent specifically set forth below), regulated investment companies, or real estate investment trusts; |
| • | persons subject to the alternative minimum tax; |
| • | tax-exempt organizations or governmental organizations; |
| • | “controlled foreign corporations,” “passive foreign investment companies,” or corporations that accumulate earnings to avoid U.S. federal income tax; |
| • | brokers or dealers in securities or currencies; |
| • | traders in securities or other persons that elect to use amark-to-market method of accounting for their holdings in our stock; |
| • | U.S. expatriates or certain former citizens or long-term residents of the United States; |
| • | partnerships or entities classified as partnerships for U.S. federal income tax purposes or other pass-through entities (and investors therein); |
| • | persons who hold our Class A subordinate voting stock as a position in a hedging transaction, “straddle,” “conversion transaction,” or other risk reduction transaction or integrated investment; |
| • | persons who hold or receive our Class A subordinate voting stock pursuant to the exercise of any employee stock option or otherwise as compensation; |
| • | persons who do not hold our Class A subordinate voting stock as a “capital asset” within the meaning of Section 1221 of the Code; |
| • | persons deemed to sell our Class A subordinate voting stock under the constructive sale provisions of the Code; |
| • | persons subject to special tax accounting rules as a result of any item with respect to Class A subordinate voting stock being taken into account in an applicable financial statement; |
| • | persons that own, or are deemed to own, more than five percent of our Class A subordinate voting stock (except to the extent specifically set forth below); or |
| • | persons that own, or are deemed to own, our Class B multiple voting stock. |
In addition, if a partnership or entity classified as a partnership for U.S. federal income tax purposes holds our Class A subordinate voting stock, the tax treatment of a partner generally will
| 141 |
Table of Contents
Confidential Treatment Requested Pursuant to 17 C.F.R. Section 200.83
depend on the status of the partner and upon the activities of the partnership. Accordingly, partnerships that hold our Class A subordinate voting stock, and partners in such partnerships, should consult their tax advisors.
You are urged to consult your tax advisor with respect to the application of the U.S. federal income tax laws to your particular situation, as well as any tax consequences of the acquisition, ownership, and disposition of our Class A subordinate voting stock arising under the U.S. federal estate or gift tax rules, under the laws of any state, local,non-U.S., or other taxing jurisdiction, or under any applicable tax treaty.
Non-U.S. Holder Defined
For purposes of this discussion, you are a“non-U.S. holder” if you are a holder of our Class A subordinate voting stock that is not a partnership (or entity or arrangement treated as a partnership for U.S. federal income tax purposes) and is not any of the following:
| • | an individual who is a citizen or resident of the United States (for U.S. federal income tax purposes); |
| • | a corporation or other entity taxable as a corporation created or organized in the United States or under the laws of the United States or any political subdivision thereof or other entity treated as such for U.S. federal income tax purposes; |
| • | an estate whose income is subject to U.S. federal income tax regardless of its source; or |
| • | a trust (x) whose administration is subject to the primary supervision of a U.S. court and which has one or more “United States persons” (within the meaning of Section 7701(a)(30) of the Code) who have the authority to control all substantial decisions of the trust or (y) which has a valid election in effect to be treated as a United States person for U.S. federal income tax purposes. |
Distributions
As described in the section titled “Dividend Policy,” no decision has been made with respect to the timing or amount of dividend payments, if any, and any future dividend payments will be at the discretion of our Board of Directors and depend on various factors and restrictions. However, if we do make distributions of cash or property on our Class A subordinate voting stock, such distributions will constitute dividends for U.S. tax purposes to the extent paid from our current or accumulated earnings and profits, as determined under U.S. federal income tax principles. To the extent those distributions exceed both our current and our accumulated earnings and profits, they will constitute a return of capital and will first reduce anon-U.S. holder’s adjusted tax basis in its Class A subordinate voting stock, but not below zero, and then will be treated as gain from the sale of stock as described below under “—Gain on Disposition of Our Class A Subordinate Voting Stock.”
Except as otherwise described below in the discussions of effectively connected income, backup withholding and the Foreign Account Tax Compliance Act and the rules and regulations promulgated thereunder (collectively, “FATCA”), any dividend paid to anon-U.S. holder generally will be subject to U.S. withholding tax either at a rate of 30% of the gross amount of the dividend or such lower rate as may be specified by an applicable income tax treaty. In order to receive a reduced treaty rate, anon-U.S. holder must provide us with an IRS FormW-8BEN, IRS FormW-8BEN-E, or other appropriate version of IRS FormW-8, including any required attachments and its taxpayer identification number, certifying qualification for the reduced rate; additionally anon-U.S. holder will be required to update such Forms and certifications from time to time as required by law. Anon-U.S. holder of shares of our Class A subordinate voting stock eligible for a reduced rate of U.S. withholding tax pursuant to
| 142 |
Table of Contents
Confidential Treatment Requested Pursuant to 17 C.F.R. Section 200.83
an income tax treaty may obtain a refund of any excess amounts withheld by timely filing an appropriate claim for refund with the IRS. If thenon-U.S. holder holds the stock through a financial institution or other agent acting on thenon-U.S. holder’s behalf, thenon-U.S. holder will be required to provide appropriate documentation to the agent, which then will be required to provide certification to us or our paying agent, either directly or through other intermediaries.Non-U.S. holders should consult their tax advisors regarding their entitlement to benefits under an applicable income tax treaty.
Effectively Connected Income
If anon-U.S. holder is engaged in a U.S. trade or business and dividends on, or any gain recognized upon the disposition of, Class A subordinate voting stock, is effectively connected with the conduct of that U.S. trade or business, then suchnon-U.S. Holder would be subject to U.S. federal income tax on that dividend or gain on a net income basis in the same manner as if thenon-U.S. Holder were a “United States person” (as defined under Section 7701(a)(30) of the Code) unless an applicable income tax treaty provides otherwise. In that case, suchnon-U.S. Holder generally would be exempt from the U.S. federal withholding tax discussed above on dividends, although thenon-U.S. Holder generally would be required to provide a properly executed applicable IRS FormW-8 in order to claim such exemption. In addition, if thenon-U.S. Holder is a corporation, it generally would be subject to a “branch profits tax” at a rate of 30% (or an applicable lower treaty rate) on its effectively connected earnings and profits attributable to such dividend or gain (subject to certain adjustments).Non-U.S. holders should consult their tax advisors regarding any applicable tax treaties that may provide for different rules.
Gain on Disposition of Our Class A Subordinate Voting Stock
Except as otherwise described below in the discussions of backup withholding and FATCA, anon-U.S. holder generally will not be subject to U.S. federal income tax on any gain realized upon the sale or other disposition of our Class A subordinate voting stock unless:
| • | the gain is effectively connected with thenon-U.S. holder’s conduct of a U.S. trade or business (and, if required by an applicable income tax treaty, the gain is attributable to a permanent establishment maintained by thenon-U.S. holder in the United States); |
| • | Thenon-U.S. holder is anon-resident alien individual who is present in the United States for a period or periods aggregating 183 days or more during the calendar year in which the sale or disposition occurs, and other conditions are met; or |
| • | our Class A subordinate voting stock constitutes a “United States real property interest” (“USRPI”) by reason of our status as a “United States real property holding corporation” (a “USRPHC”) for U.S. federal income tax purposes at any time within the shorter of the five-year period preceding anon-U.S. holder’s disposition of, or its holding period for, our Class A subordinate voting stock, and, in the case where shares of our Class A subordinate voting stock are regularly traded on an established securities market, thenon-U.S. holder owns, or is treated as owning, more than 5% of our Class A subordinate voting stock at any time during the foregoing period. |
Generally, a corporation is a USRPHC if the fair market value of its USRPIs equals or exceeds 50% of the sum of the fair market value of its worldwide real property interests and its other assets used or held for use in a trade or business (all as determined for U.S. federal income tax purposes). We believe that we are not currently and will not become a USRPHC for U.S. federal income tax purposes, and the remainder of this discussion assumes this is the case. However, because the determination of whether we are a USRPHC depends on the fair market value of our USRPIs relative to the fair market value of our other business assets, there can be no assurance that we will not
| 143 |
Table of Contents
Confidential Treatment Requested Pursuant to 17 C.F.R. Section 200.83
become a USRPHC in the future. Even if we are or we become a USRPHC, however, as long as our Class A subordinate voting stock is “regularly traded” (as defined by applicable Treasury Regulations) on an established securities market, such Class A subordinate voting stock will be treated as USRPIs only if anon-U.S. holder actually or constructively hold more than 5% of such regularly traded Class A subordinate voting stock at any time during the shorter of the five-year period preceding its disposition of, or its holding period for, our Class A subordinate voting stock. No assurance can be provided that our Class A subordinate voting stock will be regularly traded on an established securities market at all times for purposes of the rules described above.
If you are anon-U.S. holder described in the first bullet above, you will generally be required to pay tax on the net gain derived from the disposition under regular graduated U.S. federal income tax rates (and a corporatenon-U.S. holder described in the first bullet above also may be subject to the branch profits tax at a 30% rate (subject to certain adjustments)), unless otherwise provided by an applicable income tax treaty. If you are anon-U.S. holder described in the second bullet above, you will generally be required to pay a flat 30% tax (or such lower rate specified by an applicable income tax treaty) on the gain derived from the disposition, which gain may be offset by U.S. source capital losses for the year (provided you have timely filed U.S. federal income tax returns with respect to such losses).Non-U.S. holders should consult their tax advisors with respect to whether any applicable income tax or other treaties may provide for different rules.
Backup Withholding and Information Reporting
Generally, we must report annually to the IRS the amount of dividends paid tonon-U.S. holders, their names and addresses, and the amount of tax withheld, if any. A similar report will be sent tonon-U.S. holders. Pursuant to applicable income tax treaties or other agreements, the IRS may make these reports available to tax authorities in anon-U.S. holder’s country of residence.
Payments of dividends or of proceeds on the disposition of stock made to anon-U.S. holder may be subject to information reporting and backup withholding at a current rate of 24% unless thenon-U.S. holder establishes an exemption, for example, by properly certifying itsnon-U.S. status on an IRS FormW-8BEN, IRS FormW-8BEN-E, or another appropriate version of IRS FormW-8. Notwithstanding the foregoing, backup withholding and information reporting may apply if either we our paying agent has actual knowledge, or reason to know, that you are a United States person as defined under the Code.
Backup withholding is not an additional tax; rather, the U.S. federal income tax liability of persons subject to backup withholding will be reduced by the amount of tax withheld. If withholding results in an overpayment of taxes, a refund or credit may generally be obtained from the IRS, provided that the required information is furnished to the IRS in a timely manner.
Withholdable Payments to Foreign Financial Entities and Other Foreign Entities (FATCA)
FATCA generally impose withholding tax at a rate of 30% on dividends on and gross proceeds from the sale or other disposition of our Class A subordinate voting stock paid to “foreign financial institutions” (as specially defined under these rules), unless such institution enters into an agreement with the U.S. government to withhold on certain payments and to collect and provide to the U.S. tax authorities substantial information regarding the U.S. account holders of such institution (which includes certain equity and debt holders of such institution, as well as certain account holders that are foreign entities with U.S. owners) or otherwise establishes an exemption. FATCA also generally imposes a U.S. federal withholding tax of 30% on dividends on and gross proceeds from the sale or other disposition of our Class A subordinate voting stock paid to a“non-financial foreign entity” (as specially defined under these rules) unless such entity provides the withholding agent with a
| 144 |
Table of Contents
Confidential Treatment Requested Pursuant to 17 C.F.R. Section 200.83
certification identifying certain substantial direct and indirect U.S. owners of the entity, certifies that there are none, or otherwise establishes and certifies to an exemption. The withholding provisions under FATCA generally apply to dividends on our Class A subordinate voting stock, and under current transition rules, are expected to apply with respect to the gross proceeds from the sale or other disposition of our Class A subordinate voting stock on or after January 1, 2019. An intergovernmental agreement between the U.S. and anon-U.S. holder’s country of tax residence may modify the requirements described in this paragraph. If a dividend payment is both subject to withholding under FATCA and subject to the withholding tax discussed above under “—Distributions,” the withholding under FATCA may be credited against, and therefore reduce, such other withholding tax.Non-U.S. holders should consult their own tax advisors regarding the possible implications of FATCA on their investment in our Class A subordinate voting stock.
Each prospective investor should consult its own tax advisor regarding the particular U.S. federal, state, and local, andnon-U.S. tax consequences of purchasing, holding, and disposing of our common stock, including the consequences of any proposed change in applicable laws.
| 145 |
Table of Contents
Confidential Treatment Requested Pursuant to 17 C.F.R. Section 200.83
The Company, the selling stockholders and the underwriters named below have entered into an underwriting agreement with respect to the Class A subordinate voting stock being offered. Subject to certain conditions, each underwriter has severally agreed to purchase the number of shares of Class A subordinate voting stock indicated in the following table. Goldman Sachs & Co. LLC is the representative (the “representative”) of the underwriters.
Underwriters | Number of Shares | |||
Goldman Sachs & Co. LLC | ||||
Merrill Lynch, Pierce, Fenner & Smith Incorporated | ||||
BMO Capital Markets Corp. | ||||
Credit Suisse Securities (USA) LLC | ||||
Griffiths McBurney Corp. | ||||
KeyBanc Capital Markets Inc. | ||||
PNC Capital Markets LLC | ||||
Stifel, Nicolaus & Company, Incorporated | ||||
BTIG, LLC | ||||
William Blair & Company, L.L.C. | ||||
|
| |||
Total | ||||
|
| |||
The offering is being made concurrently in the United States and in each of the provinces and territories of Canada. The Class A subordinate voting stock will be offered in the United States through those underwriters who are registered to offer the Class A subordinate voting stock for the sale in the United States and such other registered dealers as may be designated by the underwriters. The Class A subordinate voting stock will be offered in each of the provinces and territories of Canada through those underwriters or their Canadian affiliates who are registered to offer the Class A subordinate voting stock for sale in such provinces and territories and such other registered dealers as may be designated by the underwriters. Subject to applicable law, the underwriters, or such other registered dealers as may be designated by the underwriters, may offer the Class A subordinate voting stock outside of the United States and Canada.
The underwriting agreement may be terminated in the discretion of the underwriters if (i) trading generally shall have been suspended or materially limited on or by either of the or the Toronto Stock Exchange (the “TSX”); (ii) trading of any securities issued by the Company shall have been suspended on either of the or the TSX; (iii) a general moratorium on commercial banking activities in the United States or Canada shall have been declared by the relevant authorities or a material disruption in commercial banking or securities settlement or clearance services in the United States or Canada; (iv) there shall have occurred any outbreak or escalation of hostilities involving the United States or Canada or the declaration by the United States or Canada of a national emergency or war; or (v) there shall have occurred any other calamity or crisis or any change in financial, political or economic conditions in the United States or elsewhere, that, in the judgment of the underwriters, makes it impracticable or inadvisable to proceed with the offering or delivery of the shares of Class A subordinate voting stock on the terms and in the manner contemplated in the prospectus.
The underwriters are, however, committed to take and pay for all of the shares being offered, if any are taken, other than the shares covered by the option described below unless and until this option is exercised.
The underwriters have an option to buy up to an additional shares of Class A subordinate voting stock from the Company and up to an additional shares of Class A subordinate voting stock from the selling stockholders to cover sales by the underwriters of a greater number of shares
| 146 |
Table of Contents
Confidential Treatment Requested Pursuant to 17 C.F.R. Section 200.83
than the total number set forth in the table above. They may exercise that option for 30 days. If any Class A subordinate voting stock is purchased pursuant to this option, the underwriters will severally purchase shares in approximately the same proportion as set forth in the table above.
The following tables show the per share and total underwriting discounts and commissions to be paid to the underwriters by the Company and the selling stockholders. Such amounts are shown assuming both no exercise and full exercise of the underwriters’ option to purchase additional shares of Class A subordinate voting stock.
Paid by the Company
| No Exercise | Full Exercise | |||||||
Per Share of Class A subordinate voting stock | US$ | US$ | ||||||
Total | US$ | US$ | ||||||
Paid by the Selling Stockholders
| No Exercise | Full Exercise | |||||||
Per Share of Class A subordinate voting stock | US$ | US$ | ||||||
Total | US$ | US$ | ||||||
Shares of Class A subordinate voting stock sold by the underwriters to the public will initially be offered at the initial public offering price set forth on the cover of this prospectus. Any shares of Class A subordinate voting stock sold by the underwriters to securities dealers may be sold at a discount of up to $ per share from the initial public offering price. After the initial offering of the shares of Class A subordinate voting stock, the representatives may change the offering price and the other selling terms. The offering of the shares of Class A subordinate voting stock by the underwriters is subject to receipt and acceptance and subject to the underwriters’ right to reject any order in whole or in part.
The Company and its officers, directors, and holders of substantially all of the Company’s Class A subordinate voting stock, including the selling stockholders, have agreed with the underwriters, subject to certain exceptions, not to dispose of or hedge any of their Class A subordinate voting stock or securities convertible into or exchangeable for shares of Class A subordinate voting stock during the period from the date of this prospectus continuing through the date 180 days after the date of this prospectus, except with the prior written consent of the representative. This agreement does not apply to any existing employee benefit plans. See “Shares Eligible for Future Sale” for a discussion of certain transfer restrictions.
Prior to the offering, there has been no public market for the shares. The initial public offering price has been negotiated among the Company, the selling stockholders and the representative. Among the factors to be considered in determining the initial public offering price of the shares, in addition to prevailing market conditions, will be the Company’s historical performance, estimates of the business potential and earnings prospects of the Company, an assessment of the Company’s management and the consideration of the above factors in relation to market valuation of companies in related businesses.
We intend to apply to list the Class A subordinate voting stock on the in the United States and on the TSX in Canada under the symbol “ .” In order to meet one of the requirements for listing the Class A subordinate voting stock on the , the underwriters have undertaken to sell lots of 100 or more shares to a minimum of 400 beneficial holders.
In connection with the offering, the underwriters may purchase and sell shares of Class A subordinate voting stock in the open market. These transactions may include short sales, stabilizing transactions and purchases to cover positions created by short sales. Short sales involve the sale by the underwriters of a greater number of shares than they are required to purchase in the offering, and a short position represents the amount of such sales that have not been covered by subsequent
| 147 |
Table of Contents
Confidential Treatment Requested Pursuant to 17 C.F.R. Section 200.83
purchases. A “covered short position” is a short position that is not greater than the amount of additional shares for which the underwriters’ option described above may be exercised. The underwriters may cover any covered short position by either exercising their option to purchase additional shares or purchasing shares in the open market. In determining the source of shares to cover the covered short position, the underwriters will consider, among other things, the price of shares available for purchase in the open market as compared to the price at which they may purchase additional shares pursuant to the option described above. “Naked” short sales are any short sales that create a short position greater than the amount of additional shares for which the option described above may be exercised. The underwriters must cover any such naked short position by purchasing shares in the open market. A naked short position is more likely to be created if the underwriters are concerned that there may be downward pressure on the price of the Class A subordinate voting stock in the open market after pricing that could adversely affect investors who purchase in the offering. Stabilizing transactions consist of various bids for or purchases of Class A subordinate voting stock made by the underwriters in the open market prior to the completion of the offering.
The underwriters may also impose a penalty bid. This occurs when a particular underwriter repays to the underwriters a portion of the underwriting discount received by it because the representatives have repurchased shares sold by or for the account of such underwriter in stabilizing or short covering transactions.
In accordance with rules and policy statements of certain Canadian securities regulatory authorities and the Universal Market Integrity Rules for Canadian Marketplaces (“UMIR”), the underwriters may not, at any time during the period of distribution, bid for or purchase Class A subordinate voting stock. The foregoing restriction is, however, subject to exceptions as permitted by such rules and policy statements and UMIR. These exceptions include a bid or purchase permitted under such rules and policy statements and UMIR, relating to market stabilization and market balancing activities and a bid or purchase on behalf of a customer where the order was not solicited.
Purchases to cover a short position and stabilizing transactions, as well as other purchases by the underwriters for their own accounts, may have the effect of preventing or retarding a decline in the market price of the Company’s Class A subordinate voting stock, and together with the imposition of the penalty bid, may stabilize, maintain or otherwise affect the market price of the Class A subordinate voting stock. As a result, the price of the Class A subordinate voting stock may be higher than the price that otherwise might exist in the open market. The underwriters are not required to engage in these activities and may end any of these activities at any time. These transactions may be effected on the , TSX, in theover-the-counter market or otherwise.
Selling Restrictions
Other than in the United States and each of the Canadian provinces and territories, no action has been taken by us or the underwriters that would permit a public offering of the Class A subordinate voting stock shares offered by this prospectus in any jurisdiction where action for that purpose is required. The Class A subordinate voting stock offered by this prospectus may not be offered or sold, directly or indirectly, nor may this prospectus or any other offering material or advertisements in connection with the offer and sale of any such Class A subordinate voting stock be distributed or published in any jurisdiction, except under circumstances that will result in compliance with the applicable rules and regulations of that jurisdiction. Persons into whose possession this prospectus comes are advised to inform themselves about and to observe any restrictions relating to the offering and the distribution of this prospectus. This prospectus does not constitute an offer to sell or a solicitation of an offer to buy any Class A subordinate voting stock offered by this prospectus in any jurisdiction in which such an offer or a solicitation is unlawful.
European Economic Area
In relation to each Member State of the European Economic Area which has implemented the Prospectus Directive (each, a “Relevant Member State”) an offer to the public of our Class A
| 148 |
Table of Contents
Confidential Treatment Requested Pursuant to 17 C.F.R. Section 200.83
subordinate voting stock may not be made in that Relevant Member State, except that an offer to the public in that Relevant Member State of our Class A subordinate voting stock may be made at any time under the following exemptions under the Prospectus Directive:
| • | To any legal entity which is a qualified investor as defined in the Prospectus Directive; |
| • | To fewer than 150 natural or legal persons (other than qualified investors as defined in the Prospectus Directive), subject to obtaining the prior consent of the representative for any such offer; or |
| • | In any other circumstances falling within Article 3(2) of the Prospectus Directive; |
provided that no such offer or shares of our Class A subordinate voting stock shall result in a requirement for the publication by us or any Brazilian placement agent of a prospectus pursuant to Article 3 of the Prospectus Directive.
For the purposes of this provision, the expression an “offer to public” in relation to our common shares in any Relevant Member State means the communication in any form and by any means of sufficient information on the terms of the offer and our Class A subordinate voting stock to be offered so as to enable an investor to decide to purchase our Class A subordinate voting stock, as the same may be varied in that Member State by any measure implementing the Prospectus Directive in that Member State, the expression “Prospectus Directive” means Directive 2003/71/EC (as amended), including by Directive 2010/73/EU and includes any relevant implementing measure in the Relevant Member State.
This European Economic Area selling restriction is in addition to any other selling restrictions set out below.
United Kingdom
In the United Kingdom, this prospectus is only addressed to and directed as qualified investors who are (i) investment professionals falling within Article 19(5) of the Financial Services and Markets Act 2000 (Financial Promotion) Order 2005 (the Order); or (ii) high net worth entities and other persons to whom it may lawfully be communicated, falling within Article 49(2)(a) to (d) of the Order (all such persons together being referred to as “relevant persons”). Any investment or investment activity to which this prospectus relates is available only to relevant persons and will only be engaged with relevant persons. Any person who is not a relevant person should not act or relay on this prospectus or any of its contents.
Hong Kong
The Class A subordinate voting stock may not be offered or sold in Hong Kong by means of any document other than (i) in circumstances which do not constitute an offer to the public within the meaning of the Companies (Winding Up and Miscellaneous Provisions) Ordinance (Cap. 32 of the Laws of Hong Kong) (“Companies (Winding Up and Miscellaneous Provisions) Ordinance”) or which do not constitute an invitation to the public within the meaning of the Securities and Futures Ordinance (Cap. 571 of the Laws of Hong Kong) (“Securities and Futures Ordinance”), or (ii) to “professional investors” as defined in the Securities and Futures Ordinance and any rules made thereunder, or (iii) in other circumstances which do not result in the document being a “prospectus” as defined in the Companies (Winding Up and Miscellaneous Provisions) Ordinance, and no advertisement, invitation or document relating to the shares may be issued or may be in the possession of any person for the purpose of issue (in each case whether in Hong Kong or elsewhere), which is directed at, or the contents of which are likely to be accessed or read by, the public in Hong Kong (except if permitted to do so under the securities laws of Hong Kong) other than with respect to shares which are or are intended to be disposed of only to persons outside Hong Kong or only to “professional investors” in Hong Kong as defined in the Securities and Futures Ordinance and any rules made thereunder.
| 149 |
Table of Contents
Confidential Treatment Requested Pursuant to 17 C.F.R. Section 200.83
Singapore
This prospectus has not been registered as a prospectus with the Monetary Authority of Singapore. Accordingly, this prospectus and any other document or material in connection with the offer or sale, or invitation for subscription or purchase, of the Class A subordinate voting stock may not be circulated or distributed, nor may the shares be offered or sold, or be made the subject of an invitation for subscription or purchase, whether directly or indirectly, to persons in Singapore other than (i) to an institutional investor (as defined under Section 4A of the Securities and Futures Act, Chapter 289 of Singapore (the “SFA”)) under Section 274 of the SFA, (ii) to a relevant person (as defined in Section 275(2) of the SFA) pursuant to Section 275(1) of the SFA, or any person pursuant to Section 275(1A) of the SFA, and in accordance with the conditions specified in Section 275 of the SFA or (iii) otherwise pursuant to, and in accordance with the conditions of, any other applicable provision of the SFA, in each case subject to conditions set forth in the SFA.
Where the Class A subordinate voting stock are subscribed or purchased under Section 275 of the SFA by a relevant person which is a corporation (which is not an accredited investor (as defined in Section 4A of the SFA)) the sole business of which is to hold investments and the entire share capital of which is owned by one or more individuals, each of whom is an accredited investor, the securities (as defined in Section 239(1) of the SFA) of that corporation shall not be transferable for 6 months after that corporation has acquired the shares under Section 275 of the SFA except: (1) to an institutional investor under Section 274 of the SFA or to a relevant person (as defined in Section 275(2) of the SFA), (2) where such transfer arises from an offer in that corporation’s securities pursuant to Section 275(1A) of the SFA, (3) where no consideration is or will be given for the transfer, (4) where the transfer is by operation of law, (5) as specified in Section 276(7) of the SFA, or (6) as specified in Regulation 32 of the Securities and Futures (Offers of Investments) (Shares and Debentures) Regulations 2005 of Singapore (“Regulation 32”)
Where the Class A subordinate voting stock are subscribed or purchased under Section 275 of the SFA by a relevant person which is a trust (where the trustee is not an accredited investor (as defined in Section 4A of the SFA)) whose sole purpose is to hold investments and each beneficiary of the trust is an accredited investor, the beneficiaries’ rights and interest (howsoever described) in that trust shall not be transferable for 6 months after that trust has acquired the shares under Section 275 of the SFA except: (1) to an institutional investor under Section 274 of the SFA or to a relevant person (as defined in Section 275(2) of the SFA), (2) where such transfer arises from an offer that is made on terms that such rights or interest are acquired at a consideration of not less than S$200,000 (or its equivalent in a foreign currency) for each transaction (whether such amount is to be paid for in cash or by exchange of securities or other assets), (3) where no consideration is or will be given for the transfer, (4) where the transfer is by operation of law, (5) as specified in Section 276(7) of the SFA, or (6) as specified in Regulation 32.
Japan
The Class A subordinate voting stock have not been and will not be registered under the Financial Instruments and Exchange Act of Japan (Act No. 25 of 1948, as amended), (the “FIEA”). The securities may not be offered or sold, directly or indirectly, in Japan or to or for the benefit of any resident of Japan (including any person resident in Japan or any corporation or other entity organized under the laws of Japan) or to others for reoffering or resale, directly or indirectly, in Japan or to or for the benefit of any resident of Japan, except pursuant to an exemption from the registration requirements of the FIEA and otherwise in compliance with any relevant laws and regulations of Japan.
The Company and the selling stockholders estimate that their share of the total expenses of the offering, excluding underwriting discounts and commissions, will be approximately $ .
The Company and the selling stockholders have agreed to indemnify the several underwriters against certain liabilities, including liabilities under the Securities Act.
| 150 |
Table of Contents
Confidential Treatment Requested Pursuant to 17 C.F.R. Section 200.83
The underwriters and their respective affiliates are full service financial institutions engaged in various activities, which may include sales and trading, commercial and investment banking, advisory, investment management, investment research, principal investment, hedging, market making, brokerage and other financial andnon-financial activities and services. Certain of the underwriters and their respective affiliates have provided, and may in the future provide, a variety of these services to the issuer and to persons and entities with relationships with the issuer, for which they received or will receive customary fees and expenses.
In the ordinary course of their various business activities, the underwriters and their respective affiliates, officers, directors and employees may purchase, sell or hold a broad array of investments and actively trade securities, derivatives, loans, commodities, currencies, credit default swaps and other financial instruments for their own account and for the accounts of their customers, and such investment and trading activities may involve or relate to assets, securities and/or instruments of the issuer (directly, as collateral securing other obligations or otherwise) and/or persons and entities with relationships with the issuer. The underwriters and their respective affiliates may also communicate independent investment recommendations, market color or trading ideas and/or publish or express independent research views in respect of such assets, securities or instruments and may at any time hold, or recommend to clients that they should acquire, long and/or short positions in such assets, securities and instruments.
| 151 |
Table of Contents
Confidential Treatment Requested Pursuant to 17 C.F.R. Section 200.83
Baker & Hostetler LLP, Cleveland, Ohio, which has acted as our counsel in connection with this offering, will pass upon the validity of the shares of our Class A subordinate voting stock being offered by this prospectus. The underwriters have been represented by Latham & Watkins LLP, Washington, District of Columbia. Certain legal matters as to Canadian law will be passed upon on behalf of us by Stikeman Elliott LLP, Toronto, Canada. Certain legal matters as to Canadian law will be passed upon on behalf of the Underwriters involved in the Offering by Osler, Hoskin & Harcourt LLP, Toronto, Canada.
The consolidated financial statements of Zekelman Industries, Inc. at September 30, 2017 and September 24, 2016, and for each of the three years in the period ended September 30, 2017, appearing in this prospectus and Registration Statement have been audited by Ernst & Young LLP, independent registered public accounting firm, as set forth in their report thereon appearing elsewhere herein, and are included in reliance upon such report given on the authority of such firm as experts in accounting and auditing.
WHERE YOU CAN FIND ADDITIONAL INFORMATION
We have filed with the SEC a registration statement on FormS-1 under the Securities Act with respect to the shares of our Class A subordinate voting stock offered by this prospectus. This prospectus, which constitutes a part of the registration statement, does not contain all of the information set forth in the registration statement, some of which is contained in exhibits to the registration statement as permitted by the rules and regulations of the SEC. For further information with respect to us and our Class A subordinate voting stock, we refer you to the registration statement, including the exhibits filed as a part of the registration statement. Statements contained in this prospectus concerning the contents of any contract or any other document is not necessarily complete. If a contract or document has been filed as an exhibit to the registration statement, please see the copy of the contract or document that has been filed. Each statement in this prospectus relating to a contract or document filed as an exhibit is qualified in all respects by the filed exhibit. You may obtain copies of this information by mail from the Public Reference Section of the SEC, 100 F Street, N.E., Room 1580, Washington, D.C. 20549, at prescribed rates. You may obtain information on the operation of the public reference rooms by calling the SEC at1-800-SEC-0330. The SEC also maintains an Internet website that contains reports, proxy statements, and other information about issuers, like us, that file electronically with the SEC. The address of that website is www.sec.gov.
As a result of this offering, we will become subject to the information and reporting requirements of the Exchange Act and, in accordance with this law, will file periodic reports, proxy statements, and other information with the SEC. These periodic reports, proxy statements, and other information will be available for inspection and copying at the SEC’s public reference facilities and the website of the SEC referred to above. We also maintain a website at www.zekelman.com. Upon completion of this offering, you may access these materials free of charge as soon as reasonably practicable after they are electronically filed with, or furnished to, the SEC. Information contained on our website is not a part of this prospectus and the inclusion of our website address in this prospectus is an inactive textual reference only.
| 152 |
Table of Contents
Confidential Treatment Requested Pursuant to 17 C.F.R. Section 200.83
INDEX TO CONSOLIDATED FINANCIAL STATEMENTS
ZEKELMAN INDUSTRIES, INC.
Audited Consolidated Annual Financial Statements
| F-2 | ||||
| F-3 | ||||
| F-5 | ||||
| F-6 | ||||
| F-7 | ||||
| F-8 | ||||
| F-9 | ||||
| Unaudited Consolidated Interim Financial Statements | ||||
| F-52 | ||||
| F-54 | ||||
Unaudited Consolidated Statements of Comprehensive Income (Loss) | F-55 | |||
Unaudited Consolidated Statement of Changes in Stockholders’ Equity | F-56 | |||
| F-57 | ||||
| F-58 | ||||
| F-1 |
Table of Contents
Confidential Treatment Requested Pursuant to 17 C.F.R. Section 200.83
REPORT OF INDEPENDENT REGISTERED PUBLIC ACCOUNTING FIRM
The Board of Directors and Stockholders of Zekelman Industries, Inc.
We have audited the accompanying consolidated balance sheets of Zekelman Industries, Inc., as of September 30, 2017 and September 24, 2016, and the related consolidated statements of operations, comprehensive income (loss), changes in stockholders’ equity and cash flows for each of the three years in the period ended September 30, 2017. These financial statements are the responsibility of the Company’s management. Our responsibility is to express an opinion on these financial statements based on our audits.
We conducted our audits in accordance with the standards of the Public Company Accounting Oversight Board (United States) and in accordance with auditing standards generally accepted in the United States of America. Those standards require that we plan and perform the audit to obtain reasonable assurance about whether the financial statements are free of material misstatement. We were not engaged to perform an audit of the Company’s internal control over financial reporting. Our audits included consideration of internal control over financial reporting as a basis for designing audit procedures that are appropriate in the circumstances, but not for the purpose of expressing an opinion on the effectiveness of the Company’s internal control over financial reporting. Accordingly, we express no such opinion. An audit also includes examining, on a test basis, evidence supporting the amounts and disclosures in the financial statements, assessing the accounting principles used and significant estimates made by management, and evaluating the overall financial statement presentation. We believe that our audits provide a reasonable basis for our opinion.
In our opinion, the financial statements referred to above present fairly, in all material respects, the consolidated financial position of Zekelman Industries, Inc. at September 30, 2017 and September 24, 2016, and the consolidated results of its operations and its cash flows for each of the three years in the period ended September 30, 2017, in conformity with U.S. generally accepted accounting principles.
/s/ Ernst & Young LLP
Chicago, Illinois
June 7, 2018
| F-2 |
Table of Contents
Confidential Treatment Requested Pursuant to 17 C.F.R. Section 200.83
ZEKELMAN INDUSTRIES, INC.
(In Thousands, Except Share and Per Share Amounts)
| September 30, 2017 | September 24, 2016 | |||||||
Assets | ||||||||
Current assets: | ||||||||
Cash and cash equivalents | $ | 29,201 | $ | 36,721 | ||||
Accounts receivable, net of allowance for doubtful accounts of $589 and $93 | 266,174 | 160,599 | ||||||
Other receivables | 9,762 | 8,471 | ||||||
Inventories, net | 318,408 | 182,402 | ||||||
Consumable supplies inventory | 24,192 | 19,941 | ||||||
Prepaid expenses and other current assets | 6,588 | 6,532 | ||||||
Refundable income taxes | 3,017 | 778 | ||||||
Current assets held for sale | 25,728 | 29,746 | ||||||
|
|
|
| |||||
Total current assets | 683,070 | 445,190 | ||||||
Property, plant and equipment | 736,110 | 617,903 | ||||||
Accumulated depreciation | (283,809 | ) | (229,857 | ) | ||||
|
|
|
| |||||
Property, plant and equipment, net | 452,301 | 388,046 | ||||||
Deferred financing costs, net | 1,911 | 2,785 | ||||||
Trademarks, net | 20,176 | 23,663 | ||||||
Customer relationships, net | 181,658 | 177,606 | ||||||
Goodwill | 914,787 | 895,844 | ||||||
Consumable supplies inventory and other noncurrent assets | 30,902 | 24,255 | ||||||
|
|
|
| |||||
Total other noncurrent assets | 1,149,434 | 1,124,153 | ||||||
|
|
|
| |||||
Total assets | $ | 2,284,805 | $ | 1,957,389 | ||||
|
|
|
| |||||
See accompanying notes.
| F-3 |
Table of Contents
Confidential Treatment Requested Pursuant to 17 C.F.R. Section 200.83
ZEKELMAN INDUSTRIES, INC.
CONSOLIDATED BALANCE SHEETS (CONTINUED)
(In Thousands, Except Share and Per Share Amounts)
| September 30, 2017 | September 24, 2016 | |||||||
Liabilities and stockholders’ equity | ||||||||
Current liabilities: | ||||||||
Current portion of long-term debt | $ | 10,318 | $ | 9,257 | ||||
Accounts payable | 136,675 | 90,612 | ||||||
Accrued customer rebates | 19,783 | 12,625 | ||||||
Accrued payroll liabilities | 30,851 | 27,098 | ||||||
Accrued income taxes payable | 2,348 | 5,346 | ||||||
Pension and postretirement benefit obligations | 4,111 | 4,031 | ||||||
Accrued interest expense | 12,461 | 12,321 | ||||||
Other accrued liabilities | 38,616 | 29,305 | ||||||
Current liabilities held for sale | 26,657 | 32,052 | ||||||
|
|
|
| |||||
Total current liabilities | 281,820 | 222,647 | ||||||
Long-term debt, net of current portion | 1,289,020 | 1,190,226 | ||||||
Pension and postretirement benefit obligations | 148,692 | 174,401 | ||||||
Deferred income taxes | 78,965 | 39,735 | ||||||
Other liabilities | 10,008 | 9,678 | ||||||
|
|
|
| |||||
Total noncurrent liabilities | 1,526,685 | 1,414,040 | ||||||
|
|
|
| |||||
Total liabilities | 1,808,505 | 1,636,687 | ||||||
Commitments and contingencies (Note 20) | ||||||||
Stockholders’ equity: | ||||||||
Common stock, $.01 par value, 400,000 shares authorized; 164,644 shares issued; 24,040 shares outstanding | 2 | 2 | ||||||
Preferred stock, $.01 par value, 100,000 shares authorized; 0 shares issued and outstanding | — | — | ||||||
Special voting stock, $.000001 par value, 200,000 shares authorized; 122,652 shares issued and outstanding | — | — | ||||||
Non-voting common stock, $.01 par value, 50,000 shares authorized; 10,000 shares issued; 9,361 shares outstanding | — | — | ||||||
Additionalpaid-in capital | 463,538 | 462,095 | ||||||
Exchangeable shares in subsidiary, 122,652 shares issued and outstanding | 352,055 | 352,055 | ||||||
Retained earnings (deficit) | 111,518 | (28,545 | ) | |||||
Accumulated other comprehensive loss | (35,705 | ) | (49,797 | ) | ||||
Treasury stock, at cost (141,243 shares) | (415,108 | ) | (415,108 | ) | ||||
|
|
|
| |||||
Total stockholders’ equity | 476,300 | 320,702 | ||||||
|
|
|
| |||||
Total liabilities and stockholders’ equity | $ | 2,284,805 | $ | 1,957,389 | ||||
|
|
|
| |||||
See accompanying notes.
| F-4 |
Table of Contents
Confidential Treatment Requested Pursuant to 17 C.F.R. Section 200.83
ZEKELMAN INDUSTRIES, INC.
CONSOLIDATED STATEMENTS OF OPERATIONS
(In Thousands, Except Share and Per Share Amounts)
| Year Ended September 30, 2017 | Year Ended September 24, 2016 | Year Ended September 26, 2015 | ||||||||||
Net sales | $ | 2,095,255 | $ | 1,554,491 | $ | 1,712,547 | ||||||
Cost of sales | 1,657,700 | 1,200,215 | 1,466,797 | |||||||||
|
|
|
|
|
| |||||||
Gross profit | 437,555 | 354,276 | 245,750 | |||||||||
Expenses: | ||||||||||||
Selling | 41,045 | 29,575 | 29,448 | |||||||||
General and administrative | 110,272 | 100,639 | 93,655 | |||||||||
Transaction costs | 731 | — | — | |||||||||
Exit and restructuring costs | 1,873 | 1,970 | 8,771 | |||||||||
|
|
|
|
|
| |||||||
Total expenses | 153,921 | 132,184 | 131,874 | |||||||||
|
|
|
|
|
| |||||||
Operating income | 283,634 | 222,092 | 113,876 | |||||||||
Other expense (income): | ||||||||||||
Interest expense, net | 92,139 | 95,931 | 98,511 | |||||||||
Loss (gain) on extinguishment of debt | — | 19,343 | (4,480 | ) | ||||||||
Debt modification costs | 2,725 | 5,480 | — | |||||||||
Bargain purchase gain | (1,745 | ) | — | — | ||||||||
Foreign exchange (gain) loss | (6,606 | ) | (1,074 | ) | 18,725 | |||||||
Other (income) expense, net | (1,515 | ) | 1,325 | (3 | ) | |||||||
|
|
|
|
|
| |||||||
Total other expense, net | 84,998 | 121,005 | 112,753 | |||||||||
|
|
|
|
|
| |||||||
Income from continuing operations before income taxes | 198,636 | 101,087 | 1,123 | |||||||||
Provision (benefit) for income taxes | 35,340 | 16,008 | (4,637 | ) | ||||||||
|
|
|
|
|
| |||||||
Income from continuing operations | 163,296 | 85,079 | 5,760 | |||||||||
|
|
|
|
|
| |||||||
Loss from discontinued operations, net of income taxes | (1,822 | ) | (16,580 | ) | (69,430 | ) | ||||||
|
|
|
|
|
| |||||||
Net income (loss) | $ | 161,474 | $ | 68,499 | $ | (63,670 | ) | |||||
|
|
|
|
|
| |||||||
Net income (loss) available to common stockholders—basic | $ | 23,487 | $ | 10,048 | $ | (9,844 | ) | |||||
|
|
|
|
|
| |||||||
Net income (loss) available to common stockholders—diluted | $ | 141,316 | $ | 59,277 | $ | (61,073 | ) | |||||
|
|
|
|
|
| |||||||
Basic earnings (loss) per common share: | ||||||||||||
Continuing operations | $ | 987.94 | $ | 517.27 | $ | 35.44 | ||||||
Discontinued operations | (10.94 | ) | (99.30 | ) | (444.92 | ) | ||||||
|
|
|
|
|
| |||||||
Net income (loss) | $ | 977.00 | $ | 417.97 | $ | (409.48 | ) | |||||
|
|
|
|
|
| |||||||
Diluted earnings (loss) per common share: | ||||||||||||
Continuing operations | $ | 974.29 | $ | 503.39 | $ | 28.59 | ||||||
Discontinued operations | (10.94 | ) | (99.30 | ) | (444.92 | ) | ||||||
|
|
|
|
|
| |||||||
Net income (loss) | $ | 963.35 | $ | 404.09 | $ | (416.33 | ) | |||||
|
|
|
|
|
| |||||||
Weighted average common shares outstanding—basic | 24,040 | 24,040 | 24,040 | |||||||||
|
|
|
|
|
| |||||||
Weighted average common shares outstanding—diluted | 146,692 | 146,692 | 146,692 | |||||||||
|
|
|
|
|
| |||||||
Net income (loss) available tonon-voting common stockholders—basic and diluted | $ | 7,870 | $ | 2,636 | $ | (5,110 | ) | |||||
|
|
|
|
|
| |||||||
Basic and diluted earnings (loss) pernon-voting common share: | ||||||||||||
Continuing operations | $ | 851.66 | $ | 380.89 | $ | (100.96 | ) | |||||
Discontinued operations | (10.94 | ) | (99.30 | ) | (444.92 | ) | ||||||
|
|
|
|
|
| |||||||
Net income (loss) | $ | 840.72 | $ | 281.59 | $ | (545.88 | ) | |||||
|
|
|
|
|
| |||||||
Weighted averagenon-voting common shares outstanding—basic and diluted | 9,361 | 9,361 | 9,361 | |||||||||
|
|
|
|
|
| |||||||
See accompanying notes.
| F-5 |
Table of Contents
Confidential Treatment Requested Pursuant to 17 C.F.R. Section 200.83
ZEKELMAN INDUSTRIES, INC.
CONSOLIDATED STATEMENTS OF COMPREHENSIVE INCOME (LOSS)
(In Thousands)
| Year Ended September 30, 2017 | Year Ended September 24, 2016 | Year Ended September 26, 2015 | ||||||||||
Net income (loss) | $ | 161,474 | $ | 68,499 | $ | (63,670 | ) | |||||
|
|
|
|
|
| |||||||
Other comprehensive income (loss) items, net of tax: | ||||||||||||
Cash flow hedges: | ||||||||||||
Gain (loss) arising during period(1) | 16 | (507 | ) | (1,938 | ) | |||||||
Reclassification adjustments(2) | (313 | ) | 2,301 | 441 | ||||||||
Defined benefit postretirement plans: | ||||||||||||
Actuarial gain (loss)(3) | 13,071 | (33,317 | ) | 608 | ||||||||
Curtailment gain(4) | — | — | 2,246 | |||||||||
Settlement gain (loss)(5) | — | 257 | (461 | ) | ||||||||
Reclassification adjustments(6) | 2,195 | 859 | (320 | ) | ||||||||
Foreign currency translation loss | (877 | ) | (378 | ) | (1,146 | ) | ||||||
|
|
|
|
|
| |||||||
Comprehensive income (loss) | $ | 175,566 | $ | 37,714 | $ | (64,240 | ) | |||||
|
|
|
|
|
| |||||||
| (1) | Net of income tax expense (benefit) of $1,242 and $(1,242) for fiscal years 2016 and 2015, respectively. |
| (2) | Net of income tax (benefit) expense of $(282) and $282 for fiscal years 2016 and 2015, respectively. |
| (3) | Net of income tax expense (benefit) of $8,105, $2,106 and $(1,398) for fiscal years 2017, 2016 and 2015, respectively. |
| (4) | Net of income tax expense of $749 for fiscal year 2015. |
| (5) | Net of income tax expense (benefit) of $83 and $(154) for fiscal years 2016 and 2015, respectively. |
| (6) | Net of income tax expense (benefit) of $1,519, $88 and $(207) for fiscal years 2017, 2016 and 2015, respectively. |
See accompanying notes.
| F-6 |
Table of Contents
Confidential Treatment Requested Pursuant to 17 C.F.R. Section 200.83
ZEKELMAN INDUSTRIES, INC.
CONSOLIDATED STATEMENTS OF CHANGES IN STOCKHOLDERS’ EQUITY
(In Thousands, Except Share Amounts)
| Common Stock | Non-Voting Common Stock | Additional Paid-in Capital | Special Voting Stock | Exchangeable Shares | Retained Earnings (Deficit) | Accumulated Other Comprehensive Loss | Treasury Stock | Total | ||||||||||||||||||||||||||||||||||||||||||||||||
| Shares | Amount | Shares | Amount | Shares | Amount | Shares | Amount | Shares | Amount | |||||||||||||||||||||||||||||||||||||||||||||||
Balance at September 27, 2014 | 164,644 | $ | 2 | 10,000 | $ | — | $ | 498,004 | 122,652 | $ | — | 122,652 | $ | 352,055 | $ | (33,374 | ) | $ | (18,442 | ) | 141,243 | $ | (415,108 | ) | $ | 383,137 | ||||||||||||||||||||||||||||||
Net loss | — | — | — | — | — | — | — | — | — | (63,670 | ) | — | — | — | (63,670 | ) | ||||||||||||||||||||||||||||||||||||||||
Stock-based compensation expense | — | — | — | — | 4,011 | — | — | — | — | — | — | — | — | 4,011 | ||||||||||||||||||||||||||||||||||||||||||
Gain on defined benefit postretirement plans, net of tax benefit of $1,010 | — | — | — | — | — | — | — | — | — | — | 2,073 | — | — | 2,073 | ||||||||||||||||||||||||||||||||||||||||||
Unrealized loss on cash flow hedges, net of tax benefit of $960 | — | — | — | — | — | — | — | — | — | — | (1,497 | ) | — | — | (1,497 | ) | ||||||||||||||||||||||||||||||||||||||||
Cash dividends | — | — | — | — | (20,000 | ) | — | — | — | — | — | — | — | — | (20,000 | ) | ||||||||||||||||||||||||||||||||||||||||
Dividend equivalents | — | — | — | — | (1,510 | ) | — | — | — | — | — | — | — | — | (1,510 | ) | ||||||||||||||||||||||||||||||||||||||||
Foreign currency translation | — | — | — | — | — | — | — | — | — | — | (1,146 | ) | — | — | (1,146 | ) | ||||||||||||||||||||||||||||||||||||||||
|
|
|
|
|
|
|
|
|
|
|
|
|
|
|
|
|
|
|
|
|
|
|
|
|
|
|
| |||||||||||||||||||||||||||||
Balance at September 26, 2015 | 164,644 | 2 | 10,000 | — | 480,505 | 122,652 | — | 122,652 | 352,055 | (97,044 | ) | (19,012 | ) | 141,243 | (415,108 | ) | 301,398 | |||||||||||||||||||||||||||||||||||||||
Net income | — | — | — | — | — | — | — | — | — | 68,499 | — | — | — | 68,499 | ||||||||||||||||||||||||||||||||||||||||||
Stock-based compensation expense | — | — | — | — | 3,076 | — | — | — | — | — | — | — | — | 3,076 | ||||||||||||||||||||||||||||||||||||||||||
Loss on defined benefit postretirement plans, net of tax expense of $2,277 | — | — | — | — | — | — | — | — | — | — | (32,201 | ) | — | — | (32,201 | ) | ||||||||||||||||||||||||||||||||||||||||
Unrealized gain on cash flow hedges, net of tax expense of $960 | — | — | — | — | — | — | — | — | — | — | 1,794 | 1,794 | ||||||||||||||||||||||||||||||||||||||||||||
Cash dividends | — | — | — | — | (20,000 | ) | — | — | — | — | — | — | — | — | (20,000 | ) | ||||||||||||||||||||||||||||||||||||||||
Dividend equivalents | — | — | — | — | (1,486 | ) | — | — | — | — | — | — | — | — | (1,486 | ) | ||||||||||||||||||||||||||||||||||||||||
Foreign currency translation | — | — | — | — | — | — | — | — | — | — | (378 | ) | — | — | (378 | ) | ||||||||||||||||||||||||||||||||||||||||
|
|
|
|
|
|
|
|
|
|
|
|
|
|
|
|
|
|
|
|
|
|
|
|
|
|
|
| |||||||||||||||||||||||||||||
Balance at September 24, 2016 | 164,644 | 2 | 10,000 | — | 462,095 | 122,652 | — | 122,652 | 352,055 | (28,545 | ) | (49,797 | ) | 141,243 | (415,108 | ) | 320,702 | |||||||||||||||||||||||||||||||||||||||
Net income | — | — | — | — | — | — | — | — | — | 161,474 | — | — | — | 161,474 | ||||||||||||||||||||||||||||||||||||||||||
Stock-based compensation expense | — | — | — | — | 1,034 | — | — | — | — | — | — | — | — | 1,034 | ||||||||||||||||||||||||||||||||||||||||||
Gain on defined benefit postretirement plans, net of tax expense of $9,624 | — | — | — | — | — | — | — | — | — | — | 15,266 | — | — | 15,266 | ||||||||||||||||||||||||||||||||||||||||||
Unrealized loss on cash flow hedges | — | — | — | — | — | — | — | — | — | — | (297 | ) | — | — | (297 | ) | ||||||||||||||||||||||||||||||||||||||||
Cash dividends | — | — | — | — | — | — | — | — | — | (20,000 | ) | — | — | — | (20,000 | ) | ||||||||||||||||||||||||||||||||||||||||
Dividend equivalents | — | — | — | — | — | — | — | — | — | (1,411 | ) | — | — | — | (1,411 | ) | ||||||||||||||||||||||||||||||||||||||||
Income tax benefit on dividend equivalents | — | — | — | — | 409 | — | — | — | — | — | — | — | — | 409 | ||||||||||||||||||||||||||||||||||||||||||
Foreign currency translation | — | — | — | — | — | — | — | — | — | — | (877 | ) | — | — | (877 | ) | ||||||||||||||||||||||||||||||||||||||||
|
|
|
|
|
|
|
|
|
|
|
|
|
|
|
|
|
|
|
|
|
|
|
|
|
|
|
| |||||||||||||||||||||||||||||
Balance at September 30, 2017 | 164,644 | $ | 2 | 10,000 | $ | — | $ | 463,538 | 122,652 | $ | — | 122,652 | $ | 352,055 | $ | 111,518 | $ | (35,705 | ) | 141,243 | $ | (415,108 | ) | $ | 476,300 | |||||||||||||||||||||||||||||||
|
|
|
|
|
|
|
|
|
|
|
|
|
|
|
|
|
|
|
|
|
|
|
|
|
|
|
| |||||||||||||||||||||||||||||
See accompanying notes.
| F-7 |
Table of Contents
Confidential Treatment Requested Pursuant to 17 C.F.R. Section 200.83
ZEKELMAN INDUSTRIES, INC.
CONSOLIDATED STATEMENTS OF CASH FLOWS
(In Thousands)
| Year Ended September 30, 2017 | Year Ended September 24, 2016 | Year Ended September 26, 2015 | ||||||||||
Operating activities | ||||||||||||
Net income (loss) | $ | 161,474 | $ | 68,499 | $ | (63,670 | ) | |||||
Less: Loss from discontinued operations | (1,822 | ) | (16,580 | ) | (69,430 | ) | ||||||
|
|
|
|
|
| |||||||
Income from continuing operations | 163,296 | 85,079 | 5,760 | |||||||||
Adjustments to reconcile income from continuing operations to net cash provided by operating activities: | ||||||||||||
Depreciation | 54,601 | 49,879 | 46,792 | |||||||||
Amortization of intangible assets | 20,370 | 17,630 | 17,630 | |||||||||
Payments for postretirement obligations in excess of charges | (3,116 | ) | (3,101 | ) | (9,182 | ) | ||||||
Amortization of deferred financing costs | 3,024 | 4,951 | 5,493 | |||||||||
Amortization of long-term debt premium and discount, net | 1,692 | 10 | (659 | ) | ||||||||
Stock-based compensation expense | 1,034 | 3,076 | 4,011 | |||||||||
Unrealized foreign exchange (gain) loss | (10,270 | ) | (2,865 | ) | 16,704 | |||||||
Impairment of fixed assets | 239 | — | 3,261 | |||||||||
Impairment of consumable supplies inventory | — | — | 1,047 | |||||||||
Loss (gain) on extinguishment of debt | — | 19,343 | (4,480 | ) | ||||||||
Bargain purchase gain | (1,745 | ) | — | — | ||||||||
Deferred tax expense (benefit) | 8,470 | (2,088 | ) | (17,440 | ) | |||||||
(Gain) loss on sale of fixed assets | (1,130 | ) | 26 | 104 | ||||||||
Net change in certain assets and liabilities (excluding acquisitions): | ||||||||||||
Accounts receivable | (46,573 | ) | (1,291 | ) | 63,420 | |||||||
Inventories | (68,878 | ) | (24,428 | ) | 187,581 | |||||||
Prepaid expenses and other current assets | 2,301 | (6,850 | ) | 1,645 | ||||||||
Accounts payable | 32,235 | 8,793 | (116,526 | ) | ||||||||
Accrued liabilities | 13,202 | 22,422 | 1,472 | |||||||||
Refundable and accrued income taxes payable | (5,169 | ) | 8,480 | 637 | ||||||||
Other | (4,538 | ) | (4,942 | ) | (4,663 | ) | ||||||
|
|
|
|
|
| |||||||
Net cash provided by operating activities | 159,045 | 174,124 | 202,607 | |||||||||
Investing activities | ||||||||||||
Additions to property, plant and equipment | (46,815 | ) | (38,398 | ) | (47,114 | ) | ||||||
Acquisition of Western Tube, net of cash acquired | (129,222 | ) | — | — | ||||||||
Acquisition of American Tube | (65,490 | ) | — | — | ||||||||
Proceeds from sale of assets | 3,568 | 19 | — | |||||||||
Other | (3,258 | ) | — | (828 | ) | |||||||
|
|
|
|
|
| |||||||
Net cash used in investing activities | (241,217 | ) | (38,379 | ) | (47,942 | ) | ||||||
Financing activities | ||||||||||||
Proceeds from borrowings of long-term debt | 341,256 | 1,069,249 | 342,770 | |||||||||
Repayments and purchases of long-term debt | (245,458 | ) | (1,169,271 | ) | (466,984 | ) | ||||||
Deferred financing costs | — | (12,088 | ) | (2,489 | ) | |||||||
Payment of dividends and dividend equivalents | (22,329 | ) | (22,223 | ) | (21,023 | ) | ||||||
Income tax benefit on dividend equivalents | 409 | — | — | |||||||||
|
|
|
|
|
| |||||||
Net cash provided by (used in) financing activities | 73,878 | (134,333 | ) | (147,726 | ) | |||||||
|
|
|
|
|
| |||||||
Effect of exchange rate change on cash | 3,283 | 1,299 | (913 | ) | ||||||||
Net cash (used in) provided by continuing operations | (5,011 | ) | 2,711 | 6,026 | ||||||||
|
|
|
|
|
| |||||||
Discontinued operations | ||||||||||||
Net cash (used in) provided by operating activities | (2,839 | ) | (2,334 | ) | 5,088 | |||||||
Net cash provided by (used in) investing activities | 45 | — | (668 | ) | ||||||||
Net cash used in financing activities | — | — | (9 | ) | ||||||||
Effect of exchange rate change on cash | (13 | ) | 6 | (42 | ) | |||||||
|
|
|
|
|
| |||||||
Net cash (used in) provided by discontinued operations | (2,807 | ) | (2,328 | ) | 4,369 | |||||||
|
|
|
|
|
| |||||||
Net (decrease) increase in cash and cash equivalents | (7,818 | ) | 383 | 10,395 | ||||||||
Cash and cash equivalents at beginning of period, including discontinued operations | 37,488 | 37,105 | 26,710 | |||||||||
|
|
|
|
|
| |||||||
Cash and cash equivalents at end of period, including discontinued operations | $ | 29,670 | $ | 37,488 | $ | 37,105 | ||||||
|
|
|
|
|
| |||||||
Supplemental disclosure of cash flow information, including discontinued operations: | ||||||||||||
Interest paid | $ | 87,406 | $ | 81,456 | $ | 94,075 | ||||||
Income taxes paid, net | $ | 27,974 | $ | 10,246 | $ | 12,914 | ||||||
Non-cash activities, including discontinued operations: | ||||||||||||
Operating activities financed through seller | $ | 245 | $ | 238 | $ | 245 | ||||||
See accompanying notes.
| F-8 |
Table of Contents
Confidential Treatment Requested Pursuant to 17 C.F.R. Section 200.83
NOTES TO CONSOLIDATED FINANCIAL STATEMENTS
1. Description of Business and Basis of Presentation
Zekelman Industries, Inc. (the “Company”) is a Delaware corporation. The Company manufactures and sells structural tubing, electrical conduit, standard pipe and other industrial steel pipe and tube products. The majority of the Company’s products are used in infrastructure andnon-residential construction applications. The Company also supplies products for use in the fabrication, automotive, oil and gas, agricultural and industrial equipment and retailend-markets. The Company manufactures many products to operate under specialized conditions, including in load-bearing, high-pressure, corrosive and high-temperature environments.
Effective April 28, 2016, the Company changed its name from JMC Steel Group, Inc. to Zekelman Industries, Inc.
The Company uses a fiscal year that is a 52 or 53 week period ending on the last Saturday in September. Fiscal year 2017 ended on September 30, 2017 and consisted of 53 weeks. Fiscal year 2016 ended on September 24, 2016 and consisted of 52 weeks. Fiscal year 2015 ended on September 26, 2015 and consisted of 52 weeks.
The preparation of financial statements in conformity with U.S. generally accepted accounting principles requires management to make estimates and assumptions that affect the reported amounts of assets and liabilities and disclosures of contingent assets and liabilities at the date of the financial statements and the reported amounts of revenues and expenses during the reporting period. Actual results could differ from those estimates. The Company develops its estimates based on historical experience and on various other assumptions that are believed to be reasonable.
On February 14, 2017, the Company acquired all issued and outstanding common shares of Western Tube and Conduit Corporation (“Western Tube”). On February 21, 2017, the Company acquired the majority of operating assets and certain liabilities of American Tube Manufacturing, Inc. (“American Tube”). See Note 4 for further details regarding these acquisitions.
On March 30, 2012, the Company completed the acquisition of Lakeside Steel, Inc. (“Lakeside”). Lakeside is a steel pipe and tubing manufacturer with a focus on manufacturing energy tubulars. Following the acquisition, the Lakeside portfolio of products has been marketed under the EnergeX brand. All assets and liabilities of the Company’s EnergeX business are classified as “held for sale” and all operating results and cash flows of the EnergeX business are classified as discontinued operations for all periods presented in these consolidated financial statements. In addition, unless otherwise noted all disclosures in the Notes reflect continuing operations only. See Note 14 for further details regarding the EnergeX business.
The accompanying consolidated financial statements include the accounts of the Company and its wholly-owned subsidiaries. All intercompany balances and transactions have been eliminated in consolidation.
The Company evaluated all material subsequent events occurring through June 7, 2018, the date the consolidated financial statements were available for issuance, for recognition and disclosure in these Notes.
2. Summary of Significant Accounting Policies
Foreign Currency Translation and Foreign Net Assets
The financial statements of the Company’s Canadian subsidiaries are maintained in their functional currency, the Canadian dollar, and translated into the Company’s reporting currency, the
| F-9 |
Table of Contents
Confidential Treatment Requested Pursuant to 17 C.F.R. Section 200.83
U.S. dollar. All assets and liabilities of the Company’s Canadian subsidiaries are translated at the exchange rate in effect as of the balance sheet date. The income, expenses, gains and losses of the Company’s Canadian subsidiaries are translated at the average exchange rate for the period. The resulting translation adjustments are recorded in stockholders’ equity as a separate component of accumulated other comprehensive income (loss) until such time as the subsidiary is sold or substantially or completely liquidated.
Transactions denominated in foreign currencies are initially remeasured into the functional currency using actual exchange rates at the time of the transactions and subsequently remeasured at each reporting date until settlement. Transaction gains or losses resulting from transactions denominated in foreign currencies and the remeasurement of intercompany balances, other than intercompany debt deemed to be of a long-term nature, are recorded in foreign exchange (gain) loss on the Consolidated Statements of Operations.
As of September 30, 2017, $149.6 million of the Company’s total net assets, excluding amounts held for sale, were affiliated with its Canadian subsidiaries.
Cash and Cash Equivalents
Cash and cash equivalents include cash and short-term liquid investments with maturities of less than three months when purchased.
Accounts Receivable
Accounts receivable consist of amounts due to the Company from its normal business activities and do not bear interest. An allowance for doubtful accounts is maintained to include the expected uncollectibility of accounts receivable based on past collection history and specific risks identified in the portfolio.
The Company performs credit evaluations of its new customers and generally requires no collateral. Accounts receivable related to accounts deemed uncollectible are written off against the allowance for doubtful accounts during the period in which the account is deemed uncollectible. If the financial condition of the Company’s customers were to deteriorate, resulting in an impairment of their ability to make payments, additional allowances would be required.
A rollforward of the Company’s allowance for doubtful accounts is as follows (in thousands):
Balance at September 27, 2014 | $ | 722 | ||
Bad debt expense | 103 | |||
Write-offs | (4 | ) | ||
Foreign currency translation and other | (118 | ) | ||
|
| |||
Balance at September 26, 2015 | 703 | |||
Reversal of bad debt expense, primarily due to recoveries | (496 | ) | ||
Write-offs | (124 | ) | ||
Foreign currency translation and other | 10 | |||
|
| |||
Balance at September 24, 2016 | 93 | |||
Bad debt expense | 630 | |||
Write-offs | (394 | ) | ||
Foreign currency translation and other | 260 | |||
|
| |||
Balance at September 30, 2017 | $ | 589 | ||
|
|
| F-10 |
Table of Contents
Confidential Treatment Requested Pursuant to 17 C.F.R. Section 200.83
Concentration of Credit Risk
Financial instruments that potentially subject the Company to concentrations of credit risk consist primarily of cash and cash equivalents and accounts receivable.
The Company maintains cash deposits with banks that, at times, exceed applicable insurance limits. The Company reduces its exposure to credit risk by maintaining such deposits with high quality financial institutions and limits the amount of credit exposure at any one institution. The Company believes that the risk of loss associated with both cash and short-term liquid investments is remote.
The Company’s customers are primarily U.S. and Canadian steel service centers and distributors that purchase the Company’s products for resale to end users. The Company does not require collateral or other security from its customers in the normal course. The Company believes that any credit risk associated with accounts receivable is substantially mitigated by the relatively large number of customer accounts and reasonably short collection terms. In the event of a customer default, the Company has historically pursued payment through collection procedures.
Inventories
Inventories are stated at cost, determined by an average cost method, or market, whichever is lower. Fixed manufacturing overhead costs are allocated to inventory based on normal production capacity and abnormal manufacturing costs are recognized as period costs.
At each balance sheet date, the Company evaluates the carrying value of its inventory and when necessary, provides allowances to adjust the carrying value to the lower of cost or market, including any costs to sell or dispose. Appropriate consideration is given to obsolescence, excessive inventory levels, product deterioration and other factors in evaluating net realizable value.
Consumable Supplies Inventory
The Company maintains storerooms with consumable supplies and repair parts needed for the repair and periodic maintenance of its machinery and equipment. Purchases of consumable supplies and repair parts are stated at cost and maintained in this asset account until used within operations. When used, these items are either expensed to cost of sales or capitalized into inventory in accordance with the Company’s manufacturing overhead capitalization policy.
Consumable supplies inventory is reviewed periodically for obsolescence. The Company maintains a slow moving and obsolescence reserve for consumable supplies inventory that is deemed to be in excess of anticipated future needs. The evaluation of future needs is based on an identification of critical versusnon-critical supplies/parts and secondarily based on the age of the supplies inventory. Consumable supplies that are considered critical (i.e. the item is required for the operation of the primary manufacturing equipment and the source of the item is limited based on age, location of supplier and lead time) are not evaluated based onage. Non-critical supplies that have no usage for at least one year are reserved at 100%. The consumable supplies inventory is also reviewed on a periodic basis for potential impairment. Indicators of impairment generally include the elimination or impairment of manufacturing equipment for which the consumable supplies are specifically identified.
During fiscal year 2015, the Company recorded impairment charges of $1.0 million on certain consumable supplies inventory which was identified as having no future economic benefit. These impairment charges were recorded in cost of sales on the Consolidated Statement of Operations. No such charges were recorded during fiscal years 2017 and 2016.
| F-11 |
Table of Contents
Confidential Treatment Requested Pursuant to 17 C.F.R. Section 200.83
Property, Plant and Equipment
The Company’s property, plant and equipment are recorded at cost upon acquisition. Upon the sale of property, plant and equipment, the net carrying amount is eliminated with any associated gain or loss recognized in the results of operations at that time.
Property, plant and equipment to be disposed of other than by sale, such as abandonment, is classified as held and used until such time that the asset ceases to be used. When the Company commits to a plan to abandon property, plant and equipment before the end of its previously estimated useful life, a new estimated useful life is determined and the remaining carrying value of the asset is depreciated over its shortened useful life. At the point the asset ceases to be used, the carrying amount of the asset should equal its salvage value, if any. Property, plant and equipment that has been temporarily or indefinitely idled generally continues to be classified as held and used and as such, is not accounted for as an abandoned asset.
Assets acquired are depreciated by the straight-line method over their estimated useful lives. Estimated useful lives of various categories of assets are as follows:
Building and improvements | 39 years | |||
Land improvements | 15 years | |||
Machinery and equipment | 10–20 years | |||
Computer hardware and software | 3–5 years | |||
Other | 3-8 years |
The Company capitalizes costs related to computer software developed or obtained for internal use. Software developed or obtained for internal use has generally been enterprise-level business and finance software that is customized to meet the Company’s specific operational needs. Costs incurred in the application development phase are capitalized and amortized over their estimated useful lives. The net book value of the Company’s capitalized software totaled $9.6 million and $9.5 million as of September 30, 2017 and September 24, 2016, respectively. Amortization expense on capitalized software was $4.6 million, $4.7 million and $4.4 million during fiscal years 2017, 2016 and 2015, respectively.
Goodwill
Goodwill represents the excess of the purchase price over the fair market value of the net assets of an acquired business. Goodwill is tested for impairment each year on the first day of the Company’s fourth fiscal quarter or more frequently if the Company believes indicators of impairment exist.
The Company identifies its reporting units by assessing whether the components of the Company’s operating segments constitute businesses for which discrete financial information is available and segment management regularly reviews the operating results of those components.
The goodwill impairment test generally requires atwo-step approach. The first step involves comparing the estimated fair values of the Company’s reporting units with their respective carrying values. If the carrying value of a reporting unit exceeds its estimated fair value, there is an indication of impairment and the Company must perform the second step of the impairment test. The second step involves comparing the implied fair value of the affected reporting unit’s goodwill with the carrying value of its goodwill to determine the amount, if any, of the impairment.
In certain situations, management may choose to perform a qualitative assessment for a reporting unit to determine whether the existence of events or circumstances leads to a determination that it is more likely than not that the fair value of the reporting unit is less than its carrying value. If,
| F-12 |
Table of Contents
Confidential Treatment Requested Pursuant to 17 C.F.R. Section 200.83
after assessing the totality of events or circumstances, management determines it is not likely that the fair value of a reporting unit is less than its carrying value, then performing thetwo-step impairment test is unnecessary.
Long-Lived Assets
The Company reviews the carrying value of its long-lived assets, including property, plant and equipment and identifiable amortizable intangible assets, for possible impairment whenever events or changes in circumstances indicate that the carrying amount of assets or asset groups may not be recoverable. Recoverability of assets or asset groups to be held and used is measured by a comparison of the carrying amount of any asset or asset group to future undiscounted cash flows expected to be generated by the asset or asset group. For any asset or asset group not deemed recoverable on the undiscounted basis, as well as assets held for disposal, the amount of any impairment is determined by comparing the carrying value to the estimated fair value.
Revenue Recognition
Sales, net of related discounts and allowances, are recognized when both title and risk of loss of the product have been transferred to the customer (generally upon shipment), the sales price to the buyer is fixed, collectability is reasonably assured and persuasive evidence of an arrangement exists. Customers take title and assume all the risks of ownership upon shipment. Any sales transaction that deviates from the standard terms and arrangements is reviewed against applicable revenue recognition requirements before being recorded as a sale.
The Company offers rebates to customers based primarily on sales volume over a specified period, generally one year. The Company records these rebates as a reduction of revenue based on a percentage of sales to the customer over the predefined purchase goal of that customer at the negotiated rebate rate. Earned rebates are paid to the customer as a credit against future purchases or in cash. On the Consolidated Balance Sheets, rebates that will be settled in cash are recorded in accrued customer rebates while rebates that will be settled with a credit against the customer’s outstanding receivable balance are recorded as an offset to accounts receivable, net. As of September 30, 2017 and September 24, 2016, the Company had reduced accounts receivable by $16.3 million and $12.6 million, respectively, for customer rebates expected to be settled with credits.
Freight Costs
Freight costs billed to customers are included in net sales on the Consolidated Statements of Operations, and freight costs incurred by the Company are included in cost of sales. Total freight costs incurred were $127.7 million, $105.5 million and $119.9 million in fiscal years 2017, 2016 and 2015, respectively.
Income Taxes
The Company uses the liability method of accounting for income taxes. Deferred tax assets and liabilities are recorded for temporary differences between the tax basis of assets and liabilities and their reported amounts in the consolidated financial statements, using statutory tax rates in effect for the year in which the differences are expected to reverse. The effect on deferred tax assets and liabilities of a change in tax rates is recognized in the results of operations in the period that includes the enactment date. A valuation allowance is recorded to reduce the carrying amount of any portion of deferred tax assets if it is more likely than not that those assets will not be realized.
The Company operates within multiple taxing jurisdictions and is subject to tax filing requirements and audits within these jurisdictions. The Company establishes contingent liabilities for possible
| F-13 |
Table of Contents
Confidential Treatment Requested Pursuant to 17 C.F.R. Section 200.83
assessments by taxing authorities resulting from uncertain tax positions including, but not limited to, deductibility of certain expenses and other state and local tax matters. Tax examinations are often complex, as tax authorities may disagree with the treatment of items reported by the Company, and may require several years to resolve. These accrued liabilities represent provisions for taxes that are reasonably expected to be incurred on the basis of available information but which are not certain.
Stock-Based Compensation
The Company measures the cost of all share-based compensation awards expected to vest based on the grant-date fair value of those awards and records that cost as compensation expense over the period during which the employee ornon-employee director is required to perform service in exchange for the award (generally over the vesting period of the award). Stock-based compensation expense is included in general and administrative expenses on the Consolidated Statements of Operations.
Pension and Other Postretirement Benefits
The Company maintains qualified andnon-qualified defined benefit pension plans that cover certain of its employees. In addition to pension benefits, the Company provides certain health care benefits for eligible employees who meet age, participation and length of service requirements at retirement.
The cost of retiree benefits is recognized over the employees’ service period. The Company uses actuarial methods and assumptions in the valuation of defined benefit obligations and the determination of expense. Differences between actual and expected results or changes in the value of obligations and plan assets are not recognized in earnings as they occur but rather systematically over subsequent periods. The Company records the funded status of its defined benefit plans in the Consolidated Balance Sheets, with adjustments to the funded status related to unrecognized actuarial gains or losses recorded in stockholders’ equity as a separate component of accumulated other comprehensive income (loss). The amount recorded in accumulated other comprehensive income (loss) also includesafter-tax unamortized prior service costs or credits. The Company measures the plan assets and benefit obligations of its defined benefit plans as of the end of its fiscal year.
Self-Insurance
The Company purchases insurance against certain risks, including general, product, automobile, employer’s liability and workers’ compensation, property, crime, directors and officers, fiduciary and employment practices liability. The Company is primarily self-insured with respect to workers’ compensation and health insurance benefits, subject to certain retention and stop loss limits, and to other policies in which limits andsub-limits may apply. The Company performs actuarial analyses of the workers’ compensation liability and health insurance benefits liability to develop estimates of expected losses. The Company’s total accrued liabilities for self-insured losses were $8.9 million and $8.3 million as of September 30, 2017 and September 24, 2016, respectively, and are included in other accrued liabilities on the Consolidated Balance Sheets.
3. Recently Issued Accounting Standards
In June 2014, the Financial Accounting Standards Board (the “FASB”) issued Accounting Standards UpdateNo. 2014-09, Revenue from Contracts with Customers (Topic 606)(“ASU 2014-09”).ASU 2014-09 provides revised guidance on how an entity should recognize revenue to depict the transfer of promised goods or services to customers in an amount that reflects the consideration to which the entity expects to be entitled in exchange for those goods or services.
| F-14 |
Table of Contents
Confidential Treatment Requested Pursuant to 17 C.F.R. Section 200.83
ASU 2014-09 is effective for annual reporting periods beginning after December 15, 2017 (the Company’s fiscal year 2019), and interim periods within that annual period. Multiple early adoption effective dates are permitted. The Company is still in the process of evaluating the effect of adopting ASU2014-09 and cannot reasonably estimate the impact at this time. The Company has engaged independent, third party specialists to assist in the evaluation. With their help, management is comparing the requirements of the new standard to its existing revenue recognition policies and procedures and performing detailed reviews of the various contracts and customer terms utilized by the Company with regard to sales, rebate programs, commission plans and other arrangements.
In February 2016, the FASB issued Accounting Standards UpdateNo. 2016-02, Leases (Topic 842) (“ASU2016-02”). ASU2016-02 provides revised guidance on accounting for leases, including the requirement for lessees to recognizeright-of-use assets and lease obligation liabilities for primarily all leases. ASU2016-02 is effective for annual periods beginning after December 15, 2018 (the Company’s fiscal year 2020), and interim periods within that annual period. Early adoption is permitted. The Company is still in the process of evaluating the effect of adopting ASU2016-02.
In March 2016, the FASB issued Accounting Standards UpdateNo. 2016-09, Compensation—Stock Compensation (Topic 718): Improvements to Employee Share-Based Payment Accounting (“ASU2016-09”). ASU2016-09 simplifies the accounting for certain aspects of share-based payment transactions, including the income tax consequences, classification of awards as either equity or liabilities and classification on the statement of cash flows. ASU2016-09 is effective for annual periods beginning after December 15, 2016 (the Company’s fiscal year 2018), and interim periods within that annual period. Early adoption is permitted. The adoption of ASU2016-09 is not expected to have a material impact on the Company’s financial position, results of operations or cash flows.
In August 2016, the FASB issued Accounting Standards UpdateNo. 2016-15, Statement of Cash Flows (Topic 230): Classification of Certain Cash Receipts and Cash Payments—a consensus of the FASB Emerging Issues Task Force (“ASU2016-15”). ASU2016-15 addresses eight specific cash flow issues with the objective of reducing the existing diversity in practice. ASU2016-15 is effective for annual periods beginning after December 15, 2017 (the Company’s fiscal year 2019), and interim periods within that annual period. Early adoption is permitted. The adoption of ASU2016-15 is not expected to have a material impact on the Company’s financial position, results of operations or cash flows.
In March 2017, the FASB issued Accounting Standards UpdateNo. 2017-07, Compensation—Retirement Benefits (Topic 715): Improving the Presentation of Net Periodic Pension Cost and Net Periodic Postretirement Benefit Cost (“ASU2017-07”). ASU2017-07 requires all elements of pension and other defined benefit postretirement net periodic benefit cost, except service cost, to be shown outside the operating subtotal of the income statement. ASU2017-07 is effective for annual periods beginning after December 15, 2017 (the Company’s fiscal year 2019), and interim periods within that annual period. Early adoption is permitted. The Company is still in the process of evaluating the effect of adopting ASU2017-07.
4. Business Combinations and Acquisitions
In the second quarter of fiscal year 2017, the Company completed two acquisitions—Western Tube and American Tube—for a combined purchase price of approximately $194.7 million.
The Company accounted for these acquisitions using the acquisition method of accounting. Therefore, the Company has recognized the assets acquired and liabilities assumed at their estimated fair values as of the respective acquisition dates.
As wholly-owned subsidiaries of the Company, the financial positions, results of operations and cash flows of Western Tube and American Tube are included in the Company’s consolidated financial
| F-15 |
Table of Contents
Confidential Treatment Requested Pursuant to 17 C.F.R. Section 200.83
statements since their respective acquisition dates. Any trade payables or receivables arising prior to the acquisition dates between the Company’s other divisions and the acquired entities were eliminated as intercompany balances starting at the acquisition dates.
Western Tube
Pursuant to a stock purchase agreement, on February 14, 2017 the Company acquired all of the issued and outstanding common shares of Western Tube for a total purchase price of $129.2 million.
The following table summarizes the components of the purchase price (in thousands):
Total cash consideration transferred | $ | 130,700 | ||
Western Tube cash acquired | (1,478 | ) | ||
|
| |||
Total purchase price | $ | 129,222 | ||
|
|
Western Tube is located in Long Beach, California and is a leading producer of electrical conduit, fence and mechanical tubing. The acquisition of Western Tube significantly expands the Company’s capabilities and presence in these markets across the western half of the United States.
The following table summarizes the estimated fair values of the assets acquired and liabilities assumed as of the acquisition date (in thousands):
Accounts receivable | $ | 48,596 | ||
Inventories | 49,762 | |||
Property, plant and equipment | 56,366 | |||
Trademarks | 1,800 | |||
Customer relationships | 4,000 | |||
Other assets | 6,413 | |||
|
| |||
Total assets acquired | 166,937 | |||
Accounts payable | (6,153 | ) | ||
Deferred income tax liabilities | (18,842 | ) | ||
Other liabilities | (10,975 | ) | ||
|
| |||
Total liabilities assumed | (35,970 | ) | ||
|
| |||
Net assets acquired | 130,967 | |||
Bargain purchase gain | (1,745 | ) | ||
|
| |||
Total purchase price | $ | 129,222 | ||
|
|
The acquisition resulted in the recognition of a $1.7 million bargain purchase gain on the accompanying Consolidated Statement of Operations because the estimated fair value of the net assets acquired exceeded the purchase price.
The Company incurred $0.5 million of transaction costs during the second quarter of fiscal year 2017 associated with the acquisition of Western Tube. This amount was recorded in transaction costs on the accompanying Consolidated Statement of Operations.
During fiscal year 2017 following the acquisition, Western Tube contributed $146.2 million of net sales and $15.5 million of operating income to the consolidated results of the Company.
| F-16 |
Table of Contents
Confidential Treatment Requested Pursuant to 17 C.F.R. Section 200.83
The following table provides pro forma financial information for the Company on a consolidated basis as if Western Tube had been acquired on September 25, 2015 (beginning of fiscal year 2016) (in thousands):
| Year Ended September 30, 2017 | Year Ended September 24, 2016 | |||||||
Pro forma net sales | $ | 2,172,765 | $ | 1,771,372 | ||||
Pro forma operating income | $ | 301,527 | $ | 257,099 | ||||
Anticipated cost savings and other effects of the integration of Western Tube are not included in the pro forma amounts. The pro forma amounts are not necessarily indicative of the results that would have occurred had the acquisition been completed on September 25, 2015, nor are they necessarily indicative of future results.
American Tube
Pursuant to an asset purchase agreement, on February 21, 2017 the Company acquired the majority of operating assets and certain liabilities of American Tube for a total purchase price of $65.5 million.
American Tube is located in Birmingham, Alabama and is a leading producer of round, square and rectangle shaped structural tubing. The acquisition of American Tube significantly expands the Company’s capabilities and presence in this market across the southeastern United States.
The following table summarizes the estimated fair values of the assets acquired and liabilities assumed as of the acquisition date (in thousands):
Accounts receivable | $ | 7,631 | ||
Inventories | 14,211 | |||
Property, plant and equipment | 15,550 | |||
Trademarks | 1,300 | |||
Customer relationships | 13,300 | |||
Other assets | 700 | |||
|
| |||
Total identifiable assets acquired | 52,692 | |||
Accounts payable | (5,753 | ) | ||
Other liabilities | (392 | ) | ||
|
| |||
Total liabilities assumed | (6,145 | ) | ||
|
| |||
Net identifiable assets acquired | 46,547 | |||
Goodwill | 18,943 | |||
|
| |||
Net assets acquired | $ | 65,490 | ||
|
|
Goodwill consists of the excess of the purchase price over the fair value of the net identifiable assets acquired and represents the estimated economic value attributable to future operations, primarily resulting from expected synergies from combining operations. The acquisition resulted in the recognition of $18.9 million of goodwill, which is expected to be deductible for income tax purposes.
The Company incurred $0.2 million of transaction costs during the second quarter of fiscal year 2017 associated with the acquisition of American Tube. This amount was recorded in transaction costs on the accompanying Consolidated Statement of Operations.
| F-17 |
Table of Contents
Confidential Treatment Requested Pursuant to 17 C.F.R. Section 200.83
Financial information following the American Tube acquisition and consolidated pro forma financial information including American Tube is not provided because it is not considered a material acquisition.
5. Inventories
The Company’s inventories consist of the following (in thousands):
| September 30, 2017 | September 24, 2016 | |||||||
Finished products | $ | 144,902 | $ | 105,995 | ||||
Work in process | 25,450 | 18,742 | ||||||
Raw materials | 148,056 | 57,665 | ||||||
|
|
|
| |||||
Total | $ | 318,408 | $ | 182,402 | ||||
|
|
|
| |||||
The Company maintains reserves for excess and obsolete inventories of $1.3 million and $1.4 million as of September 30, 2017 and September 24, 2016, respectively.
6. Property, Plant and Equipment
The Company’s property, plant and equipment consist of the following (in thousands):
| September 30, 2017 | September 24, 2016 | |||||||
Land, buildings and improvements | $ | 149,714 | $ | 100,633 | ||||
Machinery and equipment | 496,612 | 450,270 | ||||||
Computer hardware and software | 48,659 | 42,128 | ||||||
Construction in progress | 28,975 | 17,100 | ||||||
Other | 12,150 | 7,772 | ||||||
|
|
|
| |||||
| 736,110 | 617,903 | |||||||
Less accumulated depreciation | (283,809 | ) | (229,857 | ) | ||||
|
|
|
| |||||
Total | $ | 452,301 | $ | 388,046 | ||||
|
|
|
| |||||
Fixed asset impairment charges of $0.2 million and $3.3 million in fiscal years 2017 and 2015, respectively, are included in exit and restructuring costs on the Consolidated Statements of Operations. See Note 9 for further discussion of these charges. No impairment charges were recorded during fiscal year 2016.
The Company recognized depreciation expense of $54.6 million, $49.9 million and $46.8 million during fiscal years 2017, 2016 and 2015, respectively.
The Company capitalized interest of $0.2 million and $1.3 million to capital projects during fiscal years 2016 and 2015, respectively. The amount of interest capitalized in fiscal year 2017 was not significant.
7. Goodwill and Other Intangible Assets
In fiscal year 2017, the Company’s annual impairment assessment of its goodwill resulted in no impairment. The Company utilized a qualitative assessment for completing this evaluation for all reporting units.
| F-18 |
Table of Contents
Confidential Treatment Requested Pursuant to 17 C.F.R. Section 200.83
In the second quarter of fiscal year 2017, the Company recorded goodwill of $18.9 million in connection with the acquisition of American Tube, which is part of the Atlas reportable segment. See Note 4 for further details on the Company’s business combinations. Gross goodwill and accumulated impairment losses as of September 30, 2017 and September 24, 2016 are as follows (in thousands):
| September 30, 2017 | September 24, 2016 | |||||||
Gross goodwill by reportable segment: | ||||||||
Atlas | $ | 579,462 | $ | 560,519 | ||||
Electrical, Fence and Mechanical | 140,888 | 140,888 | ||||||
Pipe | 194,437 | 194,437 | ||||||
All other | 10,137 | 10,137 | ||||||
|
|
|
| |||||
| 924,924 | 905,981 | |||||||
Accumulated impairment losses (related to “All other”) | (10,137 | ) | (10,137 | ) | ||||
|
|
|
| |||||
| $ | 914,787 | $ | 895,844 | |||||
|
|
|
| |||||
The Company’s customer relationship and trademark intangible assets are being amortized using the straight-line method over their estimated useful lives of five to 20 years and consist of the following (in thousands):
| September 30, 2017 | September 24, 2016 | |||||||||||||||||||||||
| Gross Carrying Amount | Accumulated Amortization | Net Carrying Amount | Gross Carrying Amount | Accumulated Amortization | Net Carrying Amount | |||||||||||||||||||
Customer relationships | $ | 263,300 | $ | (81,642 | ) | $ | 181,658 | $ | 246,000 | $ | (68,394 | ) | $ | 177,606 | ||||||||||
Trademarks | 56,801 | (36,625 | ) | 20,176 | 53,300 | (29,637 | ) | 23,663 | ||||||||||||||||
|
|
|
|
|
|
|
|
|
|
|
| |||||||||||||
Total | $ | 320,101 | $ | (118,267 | ) | $ | 201,834 | $ | 299,300 | $ | (98,031 | ) | $ | 201,269 | ||||||||||
|
|
|
|
|
|
|
|
|
|
|
| |||||||||||||
In the second quarter of fiscal year 2017, the Company recorded customer relationships and trademarks of $17.3 million and $3.1 million, respectively, in connection with the acquisitions of Western Tube and American Tube. The customer relationships and trademarks were assigned estimated useful lives of 15 year and five years, respectively. In the fourth quarter of fiscal year 2017, management decided to cease use of the American Tube trademark; therefore, the Company accelerated the amortization of the remaining $1.1 million net carrying amount of the intangible asset. See Note 4 for further details on the Company’s business combinations.
Based on amounts recorded as of September 30, 2017, the estimated amortization of the Company’s customer relationship and trademark intangible assets during each of the next five fiscal years and thereafter is as follows (in thousands):
2018 | $ | 19,222 | ||
2019 | 19,222 | |||
2020 | 19,222 | |||
2021 | 16,132 | |||
2022 | 13,642 | |||
Thereafter | 114,394 | |||
|
| |||
Total | $ | 201,834 | ||
|
|
Total amortization of all intangible assets was $20.4 million, $17.6 million and $17.6 million during fiscal years 2017, 2016 and 2015, respectively.
| F-19 |
Table of Contents
Confidential Treatment Requested Pursuant to 17 C.F.R. Section 200.83
8. Other Accrued Liabilities
The Company’s other accrued liabilities consist of the following (in thousands):
| September 30, 2017 | September 24, 2016 | |||||||
Accrued freight costs | $ | 14,771 | $ | 10,649 | ||||
Self-insurance reserves | 8,907 | 8,338 | ||||||
Accrued commissions | 2,265 | 1,247 | ||||||
Accrued utilities | 1,308 | 1,023 | ||||||
Current portion of dividend equivalent payables | 406 | 1,041 | ||||||
Other | 10,959 | 7,007 | ||||||
|
|
|
| |||||
Total | $ | 38,616 | $ | 29,305 | ||||
|
|
|
| |||||
9. Exit and Restructuring Activities
Western Tube Plan
Following the acquisition of Western Tube, the Company announced that it was exiting certain acquired product types related to mechanical tubing and downsizing the Long Beach facility in order to lower costs and improve operational flexibility and profitability. The costs associated with these activities are included as part of the “Western Tube Plan.” As part of the Western Tube Plan, the Company has incurred certain costs including severance and fixed asset impairment charges.
A summary of the exit cost activities included in the Western Tube Plan is as follows (in thousands):
| Severance & Other Benefits | Fixed Asset Impairment Charges | Other | Total | |||||||||||||
Total estimated exit costs | $ | 947 | $ | 239 | $ | 272 | $ | 1,458 | ||||||||
|
|
|
|
|
|
|
| |||||||||
Incurred during Q4 2017 | 71 | — | (12 | ) | 59 | |||||||||||
Incurred during Q3 2017 | 31 | 59 | 68 | 158 | ||||||||||||
Incurred during Q2 2017 | 545 | 180 | 16 | 741 | ||||||||||||
|
|
|
|
|
|
|
| |||||||||
Remainder to be incurred | $ | 300 | $ | — | $ | 200 | $ | 500 | ||||||||
|
|
|
|
|
|
|
| |||||||||
As of September 30, 2017, there were no severance and other benefit costs related to the Western Tube Plan on the Consolidated Balance Sheet. A rollforward of accrued severance and other benefit costs is as follows (in thousands):
| Western Tube Plan | ||||
Accruals | $ | 647 | ||
Payments | (647 | ) | ||
|
| |||
Balance at September 30, 2017 | $ | — | ||
|
| |||
As part of the Western Tube Plan, the Company identified certain mill machinery and equipment at the Long Beach manufacturing facility that was determined to have no future use or value. The Company recorded impairment charges of $0.2 million to reduce the carrying value of these assets to their estimated fair value of $0 during the second and third quarters of fiscal year 2017 and included these charges as components of the Western Tube Plan’s exit and restructuring costs on the Consolidated Statement of Operations.
| F-20 |
Table of Contents
Confidential Treatment Requested Pursuant to 17 C.F.R. Section 200.83
Wheatland Plan
During fiscal year 2015, the Company made significant improvements at its Council Avenue manufacturing facility in Wheatland, Pennsylvania, including adding new equipment, realigning the manufacturing footprint and automating many processes in the facility. This project, which was primarily completed by the end of fiscal year 2016, created a safer, cleaner workplace, eliminated production bottlenecks, reduced work in process inventory levels, enhanced production efficiencies, improved product quality and improved customer service. In connection with this project, the facility’s headcount was reduced over time. In June 2015, the Company announced the closure of its Mill Street manufacturing facility in Sharon, Pennsylvania, with all hourly and salaried employees at the facility laid off during the fourth quarter of fiscal year 2015. The Company was able to lower costs and improve profitability by moving certain manufacturing processes previously performed at the Mill Street facility to the newly updated and expanded Council Avenue facility. The costs associated with the activities at both the Council Avenue and Mill Street facilities are included as part of the “Wheatland Plan.” As part of the Wheatland Plan, the Company has incurred certain costs including severance, special pension and other postretirement defined benefit plan costs and fixed asset impairment charges.
A summary of the exit cost activities included in the Wheatland Plan is as follows (in thousands):
| Severance & Other Benefits | Special Defined Benefit Costs | Fixed Asset Impairment Charges | Other | Total | ||||||||||||||||
Total estimated exit costs | $ | 5,237 | $ | 345 | $ | 3,261 | $ | 2,496 | $ | 11,339 | ||||||||||
|
|
|
|
|
|
|
|
|
| |||||||||||
Incurred during Q4 2017 | — | — | — | 50 | 50 | |||||||||||||||
Incurred during Q3 2017 | — | — | — | 234 | 234 | |||||||||||||||
Incurred during Q2 2017 | — | — | — | 225 | 225 | |||||||||||||||
Incurred during Q1 2017 | — | — | — | 406 | 406 | |||||||||||||||
Incurred during fiscal year 2016 | 790 | 345 | — | 835 | 1,970 | |||||||||||||||
Incurred during fiscal year 2015 | 4,447 | — | 3,261 | 246 | 7,954 | |||||||||||||||
|
|
|
|
|
|
|
|
|
| |||||||||||
Remainder to be incurred | $ | — | $ | — | $ | — | $ | 500 | $ | 500 | ||||||||||
|
|
|
|
|
|
|
|
|
| |||||||||||
As of September 30, 2017, less than $0.1 million of severance and other benefit costs related to the Wheatland Plan are included in other accrued liabilities on the Consolidated Balance Sheet. A rollforward of accrued severance and other benefit costs is as follows (in thousands):
| Wheatland Plan | ||||
Balance at September 24, 2016 | $ | 116 | ||
Payments | (90 | ) | ||
|
| |||
Balance at September 30, 2017 | $ | 26 | ||
|
| |||
As part of the Wheatland Plan, the Company identified certain mill machinery and equipment at the Mill Street manufacturing facility that was determined to have no future use or value. Additionally, the Company determined that, consistent with past practices, it likely will not sell the machinery and equipment in order to prevent competitors from gaining any advantage in the market place. Furthermore, the Company estimated that the scrap value of the machinery and equipment would likely be less than the cost to tear down or dismantle such assets. As such, the Company recorded an impairment charge of $3.3 million to reduce the carrying value of these assets to their estimated fair value of $0 during the fourth quarter of fiscal year 2015 and included this charge as a component of the Wheatland Plan’s exit and restructuring costs on the Consolidated Statement of Operations.
| F-21 |
Table of Contents
Confidential Treatment Requested Pursuant to 17 C.F.R. Section 200.83
Blytheville Manufacturing Facility
In April 2015, the Company temporarily idled its Atlas manufacturing facility in Blytheville, Arkansas, with all hourly and the majority of salaried employees at the facility laid off on a temporary basis. While the Blytheville facility is part of the Company’s Atlas asset group, a significant portion of the plant’s production included raw tubing for the energy tubular business. The idlement and resulting layoffs were due to general market conditions in the steel industry including the impact of imports, as well as very unfavorable oil country tubular goods (“OCTG”) market conditions and the excess inventory levels for energy tubular products throughout the United States and Canada. The Company incurred severance of $0.8 million associated with the Blytheville idlement, and these costs were classified as exit and restructuring costs. All of the severance obligations were paid during fiscal year 2016.
During the first quarter of fiscal year 2017, the Company began the process ofre-opening the Blytheville facility and is currently ramping up production of HSS (hollow structural sections) with the expectation of reaching normal capacity and production by the end of calendar year 2017.
10. Long-Term Debt
The Company’s long-term debt consists of the following (in thousands):
| September 30, 2017 | September 24, 2016 | |||||||
Senior secured term loan facility | $ | 913,969 | $ | 822,938 | ||||
Discount on senior secured term loan facility | (6,144 | ) | (7,836 | ) | ||||
Deferred financing costs on senior secured term loan facility | (4,186 | ) | (5,339 | ) | ||||
Senior secured revolving credit facility | 25,000 | 20,000 | ||||||
Senior secured notes | 375,000 | 375,000 | ||||||
Deferred financing costs on senior secured notes | (5,410 | ) | (6,377 | ) | ||||
Other debt | 1,109 | 1,097 | ||||||
|
|
|
| |||||
Total | 1,299,338 | 1,199,483 | ||||||
Less current portion | (10,318 | ) | (9,257 | ) | ||||
|
|
|
| |||||
Total long-term debt | $ | 1,289,020 | $ | 1,190,226 | ||||
|
|
|
| |||||
Scheduled maturities for each of the Company’s next five fiscal years and thereafter are as follows (in thousands):
| 2018 | 2019 | 2020 | 2021 | 2022 | Thereafter | Total | ||||||||||||||||||||||
Senior secured term loan facility | $ | 9,209 | $ | 9,209 | $ | 9,209 | $ | 886,342 | $ | — | $ | — | $ | 913,969 | ||||||||||||||
Senior secured revolving credit facility(1) | — | — | 25,000 | — | — | — | 25,000 | |||||||||||||||||||||
Senior secured notes | — | — | — | — | — | 375,000 | 375,000 | |||||||||||||||||||||
Other debt | 1,109 | — | — | — | — | — | 1,109 | |||||||||||||||||||||
|
|
|
|
|
|
|
|
|
|
|
|
|
| |||||||||||||||
Total | $ | 10,318 | $ | 9,209 | $ | 34,209 | $ | 886,342 | $ | — | $ | 375,000 | $ | 1,315,078 | ||||||||||||||
|
|
|
|
|
|
|
|
|
|
|
|
|
| |||||||||||||||
| (1) | The scheduled maturity is based on the expiration date of the current revolving credit facility. |
Certain tangible and financial assets of the Company and its restricted subsidiaries serve as collateral against the senior secured term loan and revolving credit facilities and senior secured notes. The revolving credit facility lenders have a first priority lien on the Company’s accounts receivable and
| F-22 |
Table of Contents
Confidential Treatment Requested Pursuant to 17 C.F.R. Section 200.83
inventories and a second priority lien on the Company’s fixed assets. The term loan facility lenders have a first priority lien on the Company’s fixed assets and a second priority lien on the Company’s accounts receivable and inventories. The holders of the Company’s senior secured notes have a third priority lien on the Company’s accounts receivable, inventories and fixed assets. The Company’s subsidiaries Atlas Tube (Arkansas) Inc., which owns the Atlas facility in Blytheville, Arkansas, Lakeside Steel Alabama Inc., which owns the EnergeX facilities in Thomasville, Alabama, Lakeside Steel Texas Inc., Lakeside Steel USA Inc. and Lakeside Steel Holding USA Inc. are designated as unrestricted subsidiaries, excluding their assets as collateral under the Company’s senior secured term loan and revolving credit facilities and senior secured notes.
Senior Secured Term Loan Facility
In March 2011, the Company entered into a $400.0 million Term Loan and Guaranty Agreement (the “Term Loan Agreement”) and a Senior Secured Term Loan Credit Facility (the “Term Loan Facility”). The Term Loan Facility had a six year term which was set to expire on April 1, 2017. Borrowings under the Term Loan Facility bore interest on a per annum basis equal to LIBOR (subject to a 150 basis point LIBOR floor) plus 325 basis points for Eurodollar Rate loans or the Prime Rate plus 225 basis points for Base Rate loans.
In February 2012, the Company exercised its option under the Term Loan Facility to increase the total amount of borrowings under this facility from $400.0 million to $500.0 million. All terms, conditions and covenants of the Term Loan Facility, including the rate at which borrowings bore interest, were applicable to the additional $100.0 million borrowed against the facility in February 2012. The additional $100.0 million in term loans was borrowed at a price of 99.5, resulting in a $0.5 million discount that was being amortized through the April 1, 2017 maturity date.
In connection with the completion of its debt refinancing in June 2016, the Company amended and restated its Term Loan Facility to, among other things i) incur $396.4 million of additional indebtedness under the Term Loan Agreement, for an aggregate principal amount of $825.0 million outstanding under the Term Loan Facility and ii) extend the maturity of the Company’s Term Loan Facility for five years. The aggregate $825.0 million in term loans was borrowed at a price of 99.0, resulting in an $8.3 million discount that will be amortized through the June 14, 2021 maturity date. Amortization of the discount is recorded in interest expense, net on the Consolidated Statements of Operations. Borrowings under the Amended and Restated Term Loan Facility bore interest on a per annum basis equal to LIBOR (subject to a 100 basis point LIBOR floor) plus 500 basis points for Eurodollar Rate loans or the Prime Rate plus 400 basis points for Base Rate loans.
In February 2017, the Company further amended its Term Loan Facility in order to borrow an additional $100.0 million and reduce the interest rates applicable to all borrowings outstanding under the facility, such that term loan borrowings bore interest on a per annum basis equal to LIBOR (subject to a 100 basis point LIBOR floor) plus 375 basis points for Eurodollar Rate loans or the Prime Rate plus 275 basis points for Base Rate loans.
In August 2017, the Company amended its Term Loan Facility in order to further reduce the interest rates applicable to all borrowings outstanding under the facility, such that term loan borrowings now bear interest on a per annum basis equal to LIBOR (subject to a 100 basis point LIBOR floor) plus 275 basis points for Eurodollar Rate loans or the Prime Rate plus 175 basis points for Base Rate loans.
In May 2018, the Company amended its Term Loan Facility again in order to reduce the interest rates applicable to all borrowings outstanding under the facility, such that term loan borrowings now bear interest on a per annum basis equal to LIBOR (no longer subject to a LIBOR floor) plus 225 basis points for Eurodollar Rate loans or the Prime Rate plus 125 basis points for Base Rate loans.
| F-23 |
Table of Contents
Confidential Treatment Requested Pursuant to 17 C.F.R. Section 200.83
For each of the amendments described above since the June 2016 refinancing, all other terms, conditions and covenants of the Amended and Restated Term Loan Facility, including the maturity date, remained the same.
Under the Amended and Restated Term Loan Facility, the Company is required to make quarterly principal payments of approximately $2.3 million. A final payment of the outstanding principal balance is due upon the expiration of the Term Loan Facility on June 14, 2021. The Term Loan Agreement allows for prepayment at any time, in whole or in part, together with accrued interest, without premium or penalty after six months (which reset following the May 2018 amendment) and requires the Company to make mandatory prepayments under certain circumstances, including the generation of “excess cash flow” during any given fiscal year.
The annual excess cash flow calculation is prescribed by the Term Loan Agreement and takes into account the Company’s cash-based earnings, capital and other expenditures and changes in working capital during the period. In December 2015, the Company made a $49.6 million mandatory prepayment on its existing Term Loan Facility which was required based on the fiscal year 2015 excess cash flow calculation. No excess cash flow calculation was required for fiscal year 2016 due to the June 2016 refinancing. The Company does not expect to make a mandatory prepayment based on the excess cash flow calculation for fiscal year 2017.
As of September 30, 2017, the Company had $914.0 million outstanding under the Amended and Restated Term Loan Facility at an interest rate of 4.1%.
Senior Secured Revolving Credit Facility
In March 2011, the Company entered into a $400.0 million Senior Secured Revolving Credit Facility (the “Revolving Credit Facility”). The Revolving Credit Facility had a five year term which was set to expire on March 11, 2016. Borrowings under the Revolving Credit Facility generally bore interest on a per annum basis equal to LIBOR plus anon-default variable spread ranging from 200 basis points to 250 basis points.
In November 2014, the Company amended and restated its Revolving Credit Facility. The amended and restated facility provided for an extension of the same $400.0 million revolving credit limit through November 12, 2019. Borrowings under the Amended and Restated Revolving Credit Facility bear interest on a per annum basis equal to either i) LIBOR plus anon-default variable spread ranging from 175 basis points to 225 basis points or ii) the prime rate plus anon-default variable spread ranging from 75 basis points to 125 basis points. The variable spreads are dependent upon the Company’s average excess availability at the time of the borrowing. The Company is also required to pay an annual commitment fee ranging from 25 basis points to 37.5 basis points depending on the amount drawn.
In connection with its debt refinancing, in May 2016 the Company entered into another amendment to its Revolving Credit Facility to i) permit the Company to issue new Senior Secured Notes, ii) permit the Company to incur incremental term loans and iii) reduce the aggregate commitments under the Revolving Credit Facility to $350.0 million. The expiration date of the Amended and Restated Revolving Credit Facility and other significant terms remain unchanged. This amendment became operative upon the closing of the refinancing of the Company’s other outstanding debt in June 2016.
The total amount of loans and advances outstanding at any time under the Amended and Restated Revolving Credit Facility may not exceed the lesser of the then-current borrowing base or the revolving limit of $350.0 million. The borrowing base is determined by the Company’s eligible inventory and accounts receivable balances and is comprised of U.S. and Canadian components.
| F-24 |
Table of Contents
Confidential Treatment Requested Pursuant to 17 C.F.R. Section 200.83
During fiscal year 2017, the Company borrowed $240.0 million and repaid $235.0 million under the facility resulting in an outstanding balance of $25.0 million as of September 30, 2017. As of September 30, 2017, the Company had $292.5 million of availability under the Amended and Restated Revolving Credit Facility. During the fiscal years 2016 and 2015, the Company borrowed $127.0 million and $341.6 million, respectively, and repaid $107.0 million and $405.9 million, respectively, under the facility.
Senior Secured Notes
In connection with the completion of its debt refinancing in June 2016, the Company issued $375.0 million of 9.875% Senior Secured Notes (the “Senior Secured Notes”) that will mature on June 15, 2023. Interest on the Senior Secured Notes is paid every six months in arrears on June 15th and December 15th.
The Company may redeem some or all of the Senior Secured Notes at the redemption prices set forth in the offering memorandum, plus accrued and unpaid interest, if any, to the redemption date. Upon the occurrence of certain events constituting a change of control, the Company may be required to make an offer to repurchase the Senior Secured Notes at a redemption price equal to 101% of their principal amount, plus accrued and unpaid interest, if any, to the date of purchase.
As of September 30, 2017, the Company had $375.0 million of Senior Secured Notes outstanding at a fixed interest rate of 9.875%.
Unsecured Senior Notes
In March 2011, the Company issued $725.0 million of 8.25% Unsecured Senior Notes (the “Fiscal 2011 Unsecured Senior Notes”) that were set to mature on March 15, 2018.
In February 2012, the Company issued an additional $150.0 million of 8.25% Unsecured Senior Notes (the “Fiscal 2012 Unsecured Senior Notes”). The Fiscal 2012 Unsecured Senior Notes were issued at a price of 103.25, resulting in a $4.9 million premium that was being amortized through the March 15, 2018 maturity date. All terms, conditions and covenants of the Fiscal 2012 Unsecured Senior Notes were identical to those of the Fiscal 2011 Unsecured Senior Notes. The Fiscal 2012 Unsecured Senior Notes and Fiscal 2011 Unsecured Senior Notes are referred to together herein as “the Unsecured Senior Notes.”
During the first half of fiscal year 2015, the Company purchased a portion of its outstanding Unsecured Senior Notes with a total principal value of $59.5 million on the open market. As a result, the Company recorded a $4.5 million gain on the extinguishment of debt on the Consolidated Statement of Operations. During the second quarter of fiscal year 2016, the Company purchased additional Senior Notes with a total principal value of $3.6 million and recorded a $1.1 million gain on the extinguishment of debt on the Consolidated Statement of Operations.
In connection with the completion of its debt refinancing in June 2016, the Company chose to redeem all outstanding Unsecured Senior Notes at a redemption price equal to 102.063% of the principal amount, plus accrued and unpaid interest, to the redemption date. This resulted in the payment of an aggregate call premium of $16.7 million to the holders of the Unsecured Senior Notes, which is included as part of the loss on extinguishment of debt on the Consolidated Statement of Operations. The $1.3 million unamortized balance of the debt premium from the issuance of the Fiscal 2012 Unsecured Senior Notes was also written off in connection with the redemption, and this amount partially offset the loss on extinguishment of debt on the Consolidated Statement of Operations.
| F-25 |
Table of Contents
Confidential Treatment Requested Pursuant to 17 C.F.R. Section 200.83
Debt Covenants
Under certain circumstances, the Company is required to maintain certain financial ratios as well as certain affirmative and negative covenants under its debt arrangements. For example, the Revolving Credit Facility establishes a minimum fixed charge coverage ratio of 1.0 to 1.0 if the Company’s excess availability is less than the greater of $40.0 million or 12.5% of the borrowing base.
In addition, the Company’s debt arrangements limit its ability to incur additional indebtedness, incur liens, pay dividends or make certain other restricted payments and enter into certain transactions with affiliates; and places restrictions on the Company’s ability to merge or consolidate with any other person or sell, assign, transfer, convey or otherwise dispose of all or substantially all of its assets.
The Company believes it is in compliance with all debt covenants as of September 30, 2017.
Deferred Financing and Debt Modification Costs
When appropriate, the Company capitalizes certain costs incurred in connection with the issuance of new debt, including origination, printing, legal, accounting and filing costs, and amortizes such costs over the term of the debt agreement. Deferred financing costs related to the Company’s Revolving Credit Facility are included in noncurrent assets on the Consolidated Balance Sheets, while all other deferred financing costs reduce the carrying amount of long-term debt.
During the first quarter of fiscal year 2015, the Company incurred and capitalized $2.5 million in deferred financing costs in connection with the refinancing of its Revolving Credit Facility. These costs, plus a majority of the remaining unamortized deferred financing costs from the original Revolving Credit Facility entered into in March 2011, were being amortized over the five year term of the amended and restated facility.
In connection with the completion of its debt refinancing in June 2016, the Company incurred the following costs:
Deferred financing costs: | ||||
Senior secured term loan facility | $ | 4,749 | ||
Senior secured revolving credit facility | 696 | |||
Senior secured notes | 6,643 | |||
|
| |||
Total | $ | 12,088 | ||
|
| |||
Debt modification costs: | ||||
Senior secured term loan facility | $ | 5,480 | ||
|
| |||
Total | $ | 5,480 | ||
|
|
The Company incurred $10.2 million of total costs related to the June 2016 amendment and restatement of its Term Loan Facility. Because a portion of the outstanding term debt was deemed to be modified as opposed to extinguished, $5.5 million of these costs was required to be expensed immediately. This amount is reflected as debt modification costs on the Consolidated Statement of Operations. The remaining $4.7 million, plus a portion of the remaining unamortized deferred financing costs from the March 2011 and February 2012 term debt issuances, will be amortized over the five year term of the Amended and Restated Term Loan Facility through June 14, 2021.
The Company incurred $0.7 million related to the May 2016 amendment of its Revolving Credit Facility. This amount, plus a portion of the remaining unamortized deferred financing costs from the March 2011 and November 2014 revolving credit facility activities, will be amortized over the remaining term of the Amended and Restated Revolving Credit Facility through November 12, 2019.
| F-26 |
Table of Contents
Confidential Treatment Requested Pursuant to 17 C.F.R. Section 200.83
The Company incurred $6.6 million related to the June 2016 issuance of Senior Secured Notes. This amount will be amortized over the seven year term of the Senior Secured Notes through June 15, 2023.
Also in connection with the completion of its debt refinancing in June 2016, $5.0 million of unamortized deferred financing costs and other capitalized fees were written off and included as part of the loss on extinguishment of debt on the Consolidated Statement of Operations.
In connection with the amendments of its Term Loan Facility in February 2017 and August 2017, the Company incurred costs of $2.7 million. These amounts were expensed immediately and reflected as debt modification costs on the Consolidated Statement of Operations because all outstanding and new term debt was deemed to be modified as opposed to extinguished.
Amortization of deferred financing costs of $3.0 million, $5.0 million and $5.5 million, respectively, is included in interest expense, net on the Consolidated Statements of Operations during fiscal years 2017, 2016 and 2015, respectively.
11. Fair Value Measurements
The Fair Value Measurements and Disclosures Topic of the FASB’s Accounting Standards Codification defines fair value as the price that would be received to sell an asset or paid to transfer a liability in an orderly transaction between market participants at the measurement date and establishes the following fair value hierarchy:
| Level 1 — | Quoted prices in active markets that are accessible at the measurement date for identical assets or liabilities. The fair value hierarchy gives the highest priority to Level 1 inputs. |
| Level 2 — | Quoted prices for similar instruments in active markets; quoted prices for identical or similar instruments in markets that are not active; and model-derived valuations in which all significant inputs are observable in active markets. |
| Level 3 — | Unobservable inputs for which there is little or no market data available. The fair value hierarchy gives the lowest priority to Level 3 inputs. |
The hierarchy is based upon the transparency of inputs to the valuation of an asset or liability as of the measurement date. The classification of fair value measurements within the hierarchy is based upon the lowest level of input that is significant to the measurement.
The Company has certain financial instruments that are recognized at historical cost or some basis other than fair value. The carrying amounts of the Company’s cash and cash equivalents, accounts receivable and accounts payable approximate fair value due to the short maturities of these financial instruments.
The Company’s debt instruments are recorded at cost on the Consolidated Balance Sheet. The fair value of long-term debt, including the current portion, is approximately $59 million higher than carrying value as of September 30, 2017. The fair value estimates were calculated based on quoted market prices from recent open market trade activity for the Company’s primary debt obligations, including the Senior Secured Notes and the senior secured term loan borrowings (Level 1).
Certain assets and liabilities are measured at fair value on a nonrecurring basis, which means that the assets and liabilities are not measured at fair value on an ongoing basis but are subject to fair value measurements or adjustments in certain circumstances, for example, when the Company makes an acquisition or in connection with goodwill and long-lived asset impairment testing.
| F-27 |
Table of Contents
Confidential Treatment Requested Pursuant to 17 C.F.R. Section 200.83
12. Income Taxes
The components of income from continuing operations before income taxes are as follows (in thousands):
| Year Ended September 30, 2017 | Year Ended September 24, 2016 | Year Ended September 26, 2015 | ||||||||||
United States | $ | 114,673 | $ | 37,585 | $ | (47,981 | ) | |||||
Foreign | 83,963 | 63,502 | 49,104 | |||||||||
|
|
|
|
|
| |||||||
Total | $ | 198,636 | $ | 101,087 | $ | 1,123 | ||||||
|
|
|
|
|
| |||||||
The provision (benefit) for income taxes consists of the following (in thousands):
| Year Ended September 30, 2017 | Year Ended September 24, 2016 | Year Ended September 26, 2015 | ||||||||||
Current: | ||||||||||||
Federal | $ | 2,667 | $ | 718 | $ | — | ||||||
State | 760 | 6 | 404 | |||||||||
Foreign | 23,443 | 17,372 | 12,399 | |||||||||
|
|
|
|
|
| |||||||
| 26,870 | 18,096 | 12,803 | ||||||||||
Deferred: | ||||||||||||
Federal | 9,221 | (915 | ) | (16,481 | ) | |||||||
State | 425 | (28 | ) | (153 | ) | |||||||
Foreign | (1,176 | ) | (1,145 | ) | (806 | ) | ||||||
|
|
|
|
|
| |||||||
| 8,470 | (2,088 | ) | (17,440 | ) | ||||||||
|
|
|
|
|
| |||||||
Total | $ | 35,340 | $ | 16,008 | $ | (4,637 | ) | |||||
|
|
|
|
|
| |||||||
| F-28 |
Table of Contents
Confidential Treatment Requested Pursuant to 17 C.F.R. Section 200.83
Deferred tax assets and liabilities consist of the following (in thousands):
| September 30, 2017 | September 24, 2016 | |||||||
Deferred tax assets: | ||||||||
Accruals | $ | 5,648 | $ | 3,896 | ||||
Inventory | 3,020 | 4,684 | ||||||
Sales allowances | 1,251 | 1,013 | ||||||
Postretirement benefits | 54,124 | 63,685 | ||||||
Stock-based compensation | 6,199 | 6,114 | ||||||
State net operating loss carryforward | 9,937 | 15,527 | ||||||
Federal net operating loss carryforward | 1,801 | 34,106 | ||||||
Foreign net operating loss carryforward | 713 | 260 | ||||||
Other | 10,307 | 14,402 | ||||||
|
|
|
| |||||
Total gross deferred tax assets | 93,000 | 143,687 | ||||||
Less: valuation allowance | (11,022 | ) | (38,840 | ) | ||||
|
|
|
| |||||
Total deferred tax assets | 81,978 | 104,847 | ||||||
|
|
|
| |||||
Deferred tax liabilities: | ||||||||
Intangible asset amortization | (61,467 | ) | (53,551 | ) | ||||
Depreciation | (68,807 | ) | (64,933 | ) | ||||
Other | (30,669 | ) | (26,098 | ) | ||||
|
|
|
| |||||
Total deferred tax liabilities | (160,943 | ) | (144,582 | ) | ||||
|
|
|
| |||||
Net deferred tax liabilities | $ | (78,965 | ) | $ | (39,735 | ) | ||
|
|
|
| |||||
Deferred income taxes result from temporary differences in the recognition of income and expenses for financial and income tax reporting purposes, and differences between the fair values of assets acquired in business combinations accounted for as purchases for financial reporting purposes and their corresponding tax bases. Deferred income taxes represent future tax benefits or costs to be recognized when those temporary differences reverse.
None of the Company’s deferred tax assets and liabilities are included as part of the assets and liabilities “held for sale” based on management’s assumption that these amounts most likely will not transfer to a buyer of the EnergeX business.
As of September 30, 2017, the net domestic deferred tax liability was $60.4 million and the net foreign deferred tax liability was $18.5 million. The Company’s deferred tax liabilities largely relate tobook-to-tax basis differences for intangible and fixed assets. The Company’s most significant deferred tax assets relate to postretirement benefits that will become deductible for tax purposes over an extended period of time as cash contributions are made to its defined benefit pension plans and payments are made related to its other defined benefit postretirement plans.
As of September 30, 2017, the Company has federal net operating loss carryforwards of $5.1 million (nottax-effected), which are available to offset future federal taxable income, if any, through fiscal year 2035. The Company also has foreign tax credits of $1.6 million that will expire beginning in fiscal year 2018. As of September 30, 2017, the Company has over $560 million (nottax-effected) of state net operating loss carryforwards that will expire by fiscal year 2036. As of September 30, 2017, the Company has foreign net operating loss carryforwards of $2.7 million (nottax-effected) that will expire between fiscal years 2034 and 2037.
As of September 30, 2017, the Company has provided a valuation allowance of $11.0 million for a portion of its state net operating loss carryforwards and foreign tax credits.
| F-29 |
Table of Contents
Confidential Treatment Requested Pursuant to 17 C.F.R. Section 200.83
A rollforward of the Company’s valuation allowance is as follows (in thousands):
Balance at September 27, 2014 | $ | 10,996 | ||
Additions | 18,034 | |||
|
| |||
Balance at September 26, 2015 | 29,030 | |||
Additions | 9,810 | |||
|
| |||
Balance at September 24, 2016 | 38,840 | |||
Reversals | (27,818 | ) | ||
|
| |||
Balance at September 30, 2017 | $ | 11,022 | ||
|
|
Provision has not been made for any incremental income taxes on a portion of the undistributed earnings of the Company’s foreign subsidiaries ($156.7 million as of September 30, 2017) as the Company intends to reinvest those earnings for the foreseeable future. It is not currently practicable to estimate the incremental tax expense associated with repatriation of these foreign earnings.
Reconciliations from the U.S. federal statutory income tax rate of 35.0% to the Company’s effective tax rates are as follows:
| Year Ended September 30, 2017 | Year Ended September 24, 2016 | Year Ended September 26, 2015 | ||||||||||
U.S. federal statutory rate | 35.0 | % | 35.0 | % | 35.0 | % | ||||||
State income taxes, net of federal tax | 3.1 | (0.9 | ) | (434.3 | ) | |||||||
Income tax exposures and audit settlements | — | (0.6 | ) | 14.8 | ||||||||
Valuation allowance | (14.0 | ) | (4.0 | ) | 501.5 | |||||||
Effects of foreign operations | (4.0 | ) | (6.2 | ) | (429.9 | ) | ||||||
Non-taxable interest | (2.4 | ) | (4.0 | ) | (244.5 | ) | ||||||
Permanent items and other | 0.1 | (3.5 | ) | 144.5 | ||||||||
|
|
|
|
|
| |||||||
Effective tax rate | 17.8 | % | 15.8 | % | (412.9 | )% | ||||||
|
|
|
|
|
| |||||||
The Company’s effective tax rate for fiscal year 2015 was not meaningful due to the breakeven nature of itspre-tax income. The effective tax rates for all periods were significantly impacted by the mix of earnings and losses between the Company’s U.S. and Canadian jurisdictions and the corresponding statutory tax rate differential.
The Company’s gross unrecognized tax benefits as of September 30, 2017 and September 24, 2016 were $4.1 million and $4.2 million, respectively, all of which would affect the effective tax rate, if recognized. In the next 12 months, the Company’s effective tax rate and the amount of unrecognized tax benefits could be affected positively or negatively by the resolution of ongoing tax audits and the expiration of certain statutes of limitations. The Company is unable to project the potential range of tax impacts at this time.
| F-30 |
Table of Contents
Confidential Treatment Requested Pursuant to 17 C.F.R. Section 200.83
A rollforward of the Company’s reserves for unrecognized tax benefits, excluding interest and penalties, is as follows (in thousands):
Balance at September 27, 2014 | $ | 5,405 | ||
Additions related to prior period tax positions | 155 | |||
Reversals due to the lapse of the statute of limitations | (468 | ) | ||
|
| |||
Balance at September 26, 2015 | 5,092 | |||
Additions related to prior period tax positions | 74 | |||
Reductions related to prior period tax positions | (570 | ) | ||
Reversals due to the lapse of the statute of limitations | (365 | ) | ||
|
| |||
Balance at September 24, 2016 | 4,231 | |||
Additions related to prior period tax positions | 248 | |||
Reversals due to settlements | (29 | ) | ||
Reversals due to the lapse of the statute of limitations | (303 | ) | ||
|
| |||
Balance at September 30, 2017 | $ | 4,147 | ||
|
|
The Company recognizes interest and penalties related to unrecognized tax benefits in income tax expense. As of September 30, 2017 and September 24, 2016, the Company’s accrual for interest and penalties related to federal, state and foreign matters totaled $3.0 million and $2.9 million, respectively. During fiscal years 2017, 2016 and 2015, the Company recognized interest and penalties of $0.1 million, $0.2 million and $0.1 million, respectively
None of the Company’s reserves for unrecognized tax benefits are included as part of the liabilities “held for sale” based on management’s assumption that these amounts most likely will not transfer to a buyer of the EnergeX business.
The Company is subject to examination by the Internal Revenue Service (“IRS”), by various states in which the Company has significant business operations and by the Canada Revenue Agency (“CRA”). As of September 30, 2017, the Company’s U.S. federal tax returns are open to IRS examination for fiscal years 2014 through 2016. With limited exceptions, the Company is also open to various state and local income tax examinations for fiscal years 2008 through 2016. In addition to the ongoing audits noted below, as of September 30, 2017 the Company’s Canadian federal tax returns are open to CRA examination for fiscal years 2015 through 2016.
During fiscal year 2013, the CRA’s International Audit section commenced an audit of the Company’s fiscal years 2009 through 2011. During fiscal year 2014, the CRA commenced a full scope audit of the Company’s fiscal years 2011 and 2012. Certain parts of their full scope audit were completed during fiscal years 2016 and 2017, while other aspects are ongoing. As part of this ongoing process, in April 2018 the Company received a letter from the CRA outlining certain proposed adjustments increase to the Company’s 2012 fiscal year tax by approximately $12.0 million, related primarily to the Lakeside acquisition. The Company disagrees with the CRA’s position, is currently preparing its response to the CRA and continues to believe that it has taken reasonable and supportable tax positions with regards to these matters. However, should the likelihood increase that the CRA prevails in defending its position it is reasonably possible that the Company will need to adjust its accruals for uncertain tax positions in the second half of fiscal year 2018 related to these proposed adjustments including penalties and interest, if any. Because of the complexity of the matter, including the potential involvement of Canadian and U.S. Competent Authorities, it is not possible for the Company to estimate the potential impact at this time. In the first quarter of fiscal year 2017, the CRA commenced a full scope audit of the Company’s fiscal years 2013 and 2014.
On December 22, 2017, the Tax Cuts and Jobs Act was signed into law in the United States (“Tax Reform”). The new law reduces the federal statutory income tax rate from 35.0% to 21.0%
| F-31 |
Table of Contents
Confidential Treatment Requested Pursuant to 17 C.F.R. Section 200.83
effective January 1, 2018. It also requires the recognition of a mandatory repatriation tax liability related to the expectedone-time income tax payment computed based on undistributed earnings of the Company’s foreign operations, and the associated net cash position and foreign taxes incurred by such operations. Based on the Tax Reform, in the first quarter of fiscal year 2018 the Company began using a blended federal statutory income tax rate of 24.5% to recognize current period income taxes, reduced its net U.S. deferred tax liability on its Consolidated Balance Sheet by $21.3 million to reflect the newly enacted tax rate and recorded an estimate of $12.0 million for its mandatory repatriation tax liability based on certain assumptions and the best available information. All of these adjustments in fiscal year 2018 are considered provisional and will be refined later in fiscal year 2018 based on the Company’s actual financial results and as more tax information becomes available.
13. Benefit Plans
The Company has six noncontributory defined benefit pension plans which provide benefits for eligible salaried and hourly employees. The Company also has five other defined benefit postretirement plans which provide health benefits and life insurance to eligible salaried and hourly employees.
Four of the Company’s noncontributory defined benefit pension plans and two of the other defined benefit postretirement plans are related to continuing operations. The following tables set forth the funded status, the net periodic benefit cost and other information related to continuing operations.
| Pension | ||||||||||||
| Year Ended September 30, 2017 | Year Ended September 24, 2016 | Year Ended September 26, 2015 | ||||||||||
| (In Thousands) | ||||||||||||
Change in benefit obligation: | ||||||||||||
Projected benefit obligation (“PBO”) at beginning of period | $ | 304,802 | $ | 280,983 | $ | 269,590 | ||||||
Service cost | 3,696 | 3,664 | 4,877 | |||||||||
Interest cost | 11,029 | 12,138 | 15,466 | |||||||||
Actuarial (gain) loss | (14,319 | ) | 23,728 | 4,489 | ||||||||
Benefits paid | (21,857 | ) | (15,711 | ) | (13,439 | ) | ||||||
|
|
|
|
|
| |||||||
PBO at end of period | 283,351 | 304,802 | 280,983 | |||||||||
|
|
|
|
|
| |||||||
Change in plan assets: | ||||||||||||
Fair value of plan assets at beginning of period | 192,703 | 183,958 | 190,021 | |||||||||
Actual return on plan assets | 18,779 | 15,946 | (1,067 | ) | ||||||||
Employer contributions | 10,050 | 8,510 | 8,443 | |||||||||
Benefits paid | (21,857 | ) | (15,711 | ) | (13,439 | ) | ||||||
|
|
|
|
|
| |||||||
Fair value of assets at end of period | 199,675 | 192,703 | 183,958 | |||||||||
|
|
|
|
|
| |||||||
Funded status | $ | (83,676 | ) | $ | (112,099 | ) | $ | (97,025 | ) | |||
|
|
|
|
|
| |||||||
Amounts recognized in balance sheets: | ||||||||||||
Current liabilities | $ | (329 | ) | $ | (415 | ) | $ | (1,936 | ) | |||
Noncurrent liabilities | (83,347 | ) | (111,684 | ) | (95,089 | ) | ||||||
|
|
|
|
|
| |||||||
Net amount recognized | $ | (83,676 | ) | $ | (112,099 | ) | $ | (97,025 | ) | |||
|
|
|
|
|
| |||||||
Accumulated benefit obligation (“ABO”) at end of period | $ | 274,600 | $ | 297,683 | $ | 273,336 | ||||||
Amounts included in accumulated other comprehensive income/loss, including discontinued operations: | ||||||||||||
Actuarial loss | $
| 44,706 65 |
| $
| 71,298 90 |
| $
| 52,588 115 |
| |||
Prior service cost | ||||||||||||
|
|
|
|
|
| |||||||
Total | $ | 44,771 | $ | 71,388 | $ | 52,703 | ||||||
|
|
|
|
|
| |||||||
| F-32 |
Table of Contents
Confidential Treatment Requested Pursuant to 17 C.F.R. Section 200.83
| Other Benefits | ||||||||||||
| Year Ended September 30, 2017 | Year Ended September 24, 2016 | Year Ended September 26, 2015 | ||||||||||
| (In Thousands) | ||||||||||||
Change in benefit obligation: | ||||||||||||
PBO at beginning of period | $ | 66,333 | $ | 60,826 | $ | 77,219 | ||||||
Service cost (benefit) | 648 | 613 | (17 | ) | ||||||||
Interest cost (benefit) | 2,471 | 2,662 | (3,499 | ) | ||||||||
Actuarial loss (gain) | 2,920 | 6,348 | (8,970 | ) | ||||||||
Benefits paid | (3,245 | ) | (4,116 | ) | (3,907 | ) | ||||||
|
|
|
|
|
| |||||||
PBO at end of period | 69,127 | 66,333 | 60,826 | |||||||||
|
|
|
|
|
| |||||||
Change in plan assets: | ||||||||||||
Employer contributions | 3,245 | 4,116 | 3,907 | |||||||||
Benefits paid | (3,245 | ) | (4,116 | ) | (3,907 | ) | ||||||
|
|
|
|
|
| |||||||
Fair value of assets at end of period | — | — | — | |||||||||
|
|
|
|
|
| |||||||
Funded status | $ | (69,127 | ) | $ | (66,333 | ) | $ | (60,826 | ) | |||
|
|
|
|
|
| |||||||
Amounts recognized in balance sheets: | ||||||||||||
Current liabilities | $ | (3,782 | ) | $ | (3,616 | ) | $ | (3,621 | ) | |||
Noncurrent liabilities | (65,345 | ) | (62,717 | ) | (57,205 | ) | ||||||
|
|
|
|
|
| |||||||
Net amount recognized | $ | (69,127 | ) | $ | (66,333 | ) | $ | (60,826 | ) | |||
|
|
|
|
|
| |||||||
Effect of a change in the assumed rate of increase in health benefit costs: | ||||||||||||
Effect of a 1% increase on: | ||||||||||||
Postretirement benefit obligation | $ | 10,196 | $ | 10,033 | $ | 8,956 | ||||||
Total service cost and interest cost | $ | 520 | $ | 507 | $ | 683 | ||||||
Effect of a 1% decrease on: | ||||||||||||
Postretirement benefit obligation | $ | (8,130 | ) | $ | (7,962 | ) | $ | (7,138 | ) | |||
Total service cost and interest cost | $ | (415 | ) | $ | (429 | ) | $ | (529 | ) | |||
Amounts included in accumulated other comprehensive income/loss, including discontinued operations: | ||||||||||||
Actuarial gain | $ | (13,429 | ) | $ | (15,258 | ) | $ | (26,599 | ) | |||
Prior service cost | 161 | 263 | 365 | |||||||||
|
|
|
|
|
| |||||||
Total | $ | (13,268 | ) | $ | (14,995 | ) | $ | (26,234 | ) | |||
|
|
|
|
|
| |||||||
| F-33 |
Table of Contents
Confidential Treatment Requested Pursuant to 17 C.F.R. Section 200.83
| Pension | ||||||||||||
| Year Ended September 30, 2017 | Year Ended September 24, 2016 | Year Ended September 26, 2015 | ||||||||||
| (In Thousands) | ||||||||||||
Components of net periodic benefit cost: | ||||||||||||
Service cost | $ | 3,696 | $ | 3,664 | $ | 4,877 | ||||||
Interest cost | 11,029 | 12,138 | 15,466 | |||||||||
Expected return on plan assets | (11,590 | ) | (10,979 | ) | (13,131 | ) | ||||||
Amortization of: | ||||||||||||
Prior service cost | 25 | 25 | 24 | |||||||||
Actuarial loss | 4,211 | 2,598 | 865 | |||||||||
Settlement loss | — | 345 | — | |||||||||
|
|
|
|
|
| |||||||
Total net periodic benefit cost | $ | 7,371 | $ | 7,791 | $ | 8,101 | ||||||
|
|
|
|
|
| |||||||
Estimated amortization for next fiscal year: | ||||||||||||
Prior service cost | $ | 25 | ||||||||||
Actuarial loss | 1,587 | |||||||||||
|
| |||||||||||
Total | $ | 1,612 | ||||||||||
|
| |||||||||||
Weighted-average assumptions used to determine net periodic benefit cost for periods ended: | ||||||||||||
Discount rate | 3.7 | % | 4.5 | % | 4.1 | % | ||||||
Expected return on plan assets | 6.1 | % | 6.1 | % | 7.0 | % | ||||||
Rate of compensation increase | 2.5 | % | 2.5 | % | 2.5 | % | ||||||
Weighted-average assumption used to determine benefit obligations as of the periods ended: | ||||||||||||
Discount rate | 3.8 | % | 3.7 | % | 4.5 | % | ||||||
Other changes recognized in other comprehensive income/loss, including discontinued operations: | ||||||||||||
Amortization of: | ||||||||||||
Prior service cost | $ | (25 | ) | $ | (25 | ) | $ | (24 | ) | |||
Actuarial loss | (4,211 | ) | (2,943 | ) | (865 | ) | ||||||
Other changes in: | ||||||||||||
Actuarial (gain) loss | (22,381 | ) | 21,993 | 16,951 | ||||||||
Settlement (gain) loss | — | (340 | ) | 615 | ||||||||
|
|
|
|
|
| |||||||
Total | $ | (26,617 | ) | $ | 18,685 | $ | 16,677 | |||||
|
|
|
|
|
| |||||||
| F-34 |
Table of Contents
Confidential Treatment Requested Pursuant to 17 C.F.R. Section 200.83
| Other Benefits | ||||||||||||
| Year Ended September 30, 2017 | Year Ended September 24, 2016 | Year Ended September 26, 2015 | ||||||||||
| (In Thousands) | ||||||||||||
Components of net periodic benefit cost: | ||||||||||||
Service cost (benefit) | $ | 648 | $ | 613 | $ | (17 | ) | |||||
Interest cost (benefit) | 2,471 | 2,662 | (3,499 | ) | ||||||||
Amortization of: | ||||||||||||
Prior service cost | 102 | 102 | 102 | |||||||||
Actuarial gain | (413 | ) | (1,643 | ) | (1,518 | ) | ||||||
|
|
|
|
|
| |||||||
Total net periodic benefit cost | $ | 2,808 | $ | 1,734 | $ | (4,932 | ) | |||||
|
|
|
|
|
| |||||||
Estimated amortization for next fiscal year: | ||||||||||||
Prior service cost | $ | 46 | ||||||||||
Actuarial gain | (114 | ) | ||||||||||
|
| |||||||||||
Total | $ | (68 | ) | |||||||||
|
| |||||||||||
Weighted-average assumptions used to determine net periodic benefit cost for periods ended: | ||||||||||||
Discount rate | 3.8 | % | 4.5 | % | 4.1 | % | ||||||
Rate of compensation increase | 2.4 | % | 2.5 | % | 2.4 | % | ||||||
Weighted-average assumption used to determine benefit obligations as of the periods ended: | ||||||||||||
Discount rate | 3.9 | % | 3.8 | % | 4.5 | % | ||||||
Rate of increase in health benefit costs: | ||||||||||||
Immediate rate | 7.1 | % | 7.5 | % | 7.8 | % | ||||||
Ultimate rate | 4.5 | % | 4.5 | % | 4.5 | % | ||||||
Year ultimate rate reached | 2037 | 2037 | 2037 | |||||||||
Other changes recognized in other comprehensive income/loss, including discontinued operations: | ||||||||||||
Amortization of: | ||||||||||||
Prior service cost | $ | (102 | ) | $ | (102 | ) | $ | (102 | ) | |||
Actuarial gain | 624 | 2,123 | 1,518 | |||||||||
Other changes in: | ||||||||||||
Actuarial loss (gain) | 1,205 | 9,218 | (16,161 | ) | ||||||||
Curtailment gain | — | — | (2,995 | ) | ||||||||
|
|
|
|
|
| |||||||
Total | $ | 1,727 | $ | 11,239 | $ | (17,740 | ) | |||||
|
|
|
|
|
| |||||||
Estimated future benefit and claim payments over the Company’s next ten fiscal years are as follows (in thousands):
| Pension Benefits | Other Benefits | |||||||
2018 | $ | 15,165 | $ | 3,782 | ||||
2019 | $ | 15,500 | $ | 3,755 | ||||
2020 | $ | 15,772 | $ | 3,686 | ||||
2021 | $ | 16,104 | $ | 3,775 | ||||
2022 | $ | 16,372 | $ | 3,825 | ||||
2023 to 2027 | $ | 84,003 | $ | 17,497 | ||||
| F-35 |
Table of Contents
Confidential Treatment Requested Pursuant to 17 C.F.R. Section 200.83
The Company’s contributions to its defined benefit pension plans in fiscal year 2018 are expected to be $15.7 million.
The weighted-average asset allocation of the Company’s pension plan assets by asset category is as follows:
| Pension | ||||||||
| September 30, 2017 | September 24, 2016 | |||||||
Cash and cash equivalents | 5 | % | 3 | % | ||||
Fixed income | 41 | % | 36 | % | ||||
Equity securities | 32 | % | 33 | % | ||||
Equity mutual funds | 22 | % | 28 | % | ||||
There are no plan assets held for the Company’s other defined benefit postretirement plans.
The Company’s investment goal for its pension plan assets is to maximize long-term total return through a combination of income and capital appreciation investment vehicles which are monitored against applicable benchmarks in a prudent manner consistent with the fiduciary standards of ERISA and with sound investment practices. The Company tries to manage the pension assets to earn at least competitive nominal returns in comparison with selected benchmarks within their respective asset classes. In general, it is desired that the assets earn nominal returns equal to or in excess of actuarial assumptions for the pension plans, while also being attentive to the plans’ obligations and adjusting the investment strategy accordingly. The Company realizes that market performance in general, and that of any individual investment, will vary from year to year and realizing a particular rate of return may not be achievable during some periods. The Company also realizes that historical performance is no guarantee of future performance.
In determining the expected rate of return on plan assets, the Company takes into account the plan’s asset allocation. Note that over very long historical periods the realized risk premium has been higher. The Company believes that its long-term annual rate of return on plan assets assumption is comparable to other companies, given the target allocation of the plan assets; however, there exists the potential for the use of a different rate in the future.
| F-36 |
Table of Contents
Confidential Treatment Requested Pursuant to 17 C.F.R. Section 200.83
The fair values of the Company’s pension plan assets by asset category are presented in the following tables (in thousands):
| Fair Value as of September 30, 2017 | Level 1 | Level 2 | Level 3 | |||||||||||||
Investments in the fair value hierarchy: | ||||||||||||||||
Cash and cash equivalents | $ | 9,996 | $ | 9,996 | $ | — | $ | — | ||||||||
Fixed income securities: | ||||||||||||||||
Government and agencies | 28,768 | — | 28,768 | — | ||||||||||||
Bond funds | 13,268 | 13,268 | — | — | ||||||||||||
Municipal bonds | 3,451 | — | 3,451 | — | ||||||||||||
Corporate bonds and notes | 22,500 | 22,500 | — | — | ||||||||||||
Equity securities: | ||||||||||||||||
U.S. common stocks | 63,765 | 63,765 | — | — | ||||||||||||
Equity funds | 29,932 | 29,932 | — | — | ||||||||||||
|
|
|
|
|
|
|
| |||||||||
| 171,680 | $ | 139,461 | $ | 32,219 | $ | — | ||||||||||
|
|
|
|
|
| |||||||||||
Investments with fair values estimated based on NAV: | ||||||||||||||||
Fixed income securities—bond funds | 13,406 | |||||||||||||||
Equity funds | 14,589 | |||||||||||||||
|
| |||||||||||||||
| 27,995 | ||||||||||||||||
|
| |||||||||||||||
Total | $ | 199,675 | ||||||||||||||
|
| |||||||||||||||
| Fair Value as of September 24, 2016 | Level 1 | Level 2 | Level 3 | |||||||||||||
Investments in the fair value hierarchy: | ||||||||||||||||
Cash and cash equivalents | $ | 6,899 | $ | 6,899 | $ | — | $ | — | ||||||||
Fixed income securities: | ||||||||||||||||
Government and agencies | 18,603 | — | 18,603 | — | ||||||||||||
Bond funds | 12,307 | 12,307 | — | — | ||||||||||||
Municipal bonds | 8,252 | — | 8,252 | — | ||||||||||||
Corporate bonds and notes | 23,180 | 21,063 | 2,117 | — | ||||||||||||
Asset-backed securities | 6,968 | — | 6,968 | — | ||||||||||||
Equity securities: | ||||||||||||||||
U.S. common stocks | 63,183 | 63,183 | — | — | ||||||||||||
Equity funds | 27,242 | 27,242 | — | — | ||||||||||||
|
|
|
|
|
|
|
| |||||||||
| 166,634 | $ | 130,694 | $ | 35,940 | $ | — | ||||||||||
|
|
|
|
|
| |||||||||||
Investments with fair values estimated based on NAV: | ||||||||||||||||
Equity funds | 26,069 | |||||||||||||||
|
| |||||||||||||||
| 26,069 | ||||||||||||||||
|
| |||||||||||||||
Total | $ | 192,703 | ||||||||||||||
|
| |||||||||||||||
The valuation methodologies used for pension plan assets measured at fair value are as follows:
| • | Cash and cash equivalents—Valued at cost, which approximates fair value. |
| • | Fixed income securities—Certain amounts valued at the closing prices reported in active markets for the specific securities. Other amounts are valued based on observable inputs, such as quotes received from independent pricing services or from dealers who make markets in such securities. |
| F-37 |
Table of Contents
Confidential Treatment Requested Pursuant to 17 C.F.R. Section 200.83
| • | Equity securities—Valued at the quoted market prices. |
| • | Equity funds—Valued based on quoted market prices or the fair value of the underlying investments. |
As a practical expedient, the Company estimates the fair value of common/collective trusts using the net asset value (“NAV”) per share multiplied by the number of shares of the trust investment held as of the measurement date. Management does not believe there is a higher level of risk or significant restrictions associated with these investments, nor are these investments, if sold, probable of being sold at amounts significantly different than the fair values estimated based on NAV.
The Company funds its other defined benefit postretirement plans with amounts sufficient to cover current claims. The Company, at its election, may fund these plans through either current operations or direct reimbursement from its defined benefit pension plans. The Company did not receive such direct reimbursement during fiscal years 2017, 2016 or 2015.
Additionally, the Company maintains defined contribution plans for eligible employees which allow employees to contribute a percentage of their salary, a portion of which is matched by the Company. The Company contributed $5.8 million, $3.9 million and $4.8 million to these plans during fiscal years 2017, 2016 and 2015, respectively.
14. Discontinued Operations
Since the acquisition of Lakeside in March 2012, the pipe and tube elements of the oil and gas industry have experienced a downturn in North America due to increased import activity leading to significant price pressure. The decline in global oil prices has also had a significant impact on the oil and gas industry, resulting in further decrease in demand for products of the Company’s energy tubular business.
The Company implemented several exit and restructuring plans beginning in fiscal year 2012 and continuing into fiscal year 2015, improving the performance of the EnergeX business and better positioning the Company to compete in the oil and gas industry. As part of these plans, the EnergeX manufacturing facilities in Welland, Ontario and Thomasville, Alabama were eventually indefinitely idled in May 2014 and March 2015, respectively. During the third and fourth quarters of fiscal year 2015, the OCTG market conditions continued to worsen throughout the United States and Canada as excess inventory levels for energy tubular products remained high, global oil prices declined even further and imports continued at record levels. As a result, in the fourth quarter of fiscal year 2015 management determined that the EnergeX asset group was impaired, and the Company recorded fixed asset impairment charges of $51.0 million and an intangible asset impairment charge of $9.6 million. As of September 26, 2015, the Company continued to classify all fixed assets at its EnergeX manufacturing facilities as “held and used” and continued to depreciate the remaining adjusted book value.
In the first quarter of fiscal year 2016, the Company’s Board of Directors formally approved a plan to sell the EnergeX business, which is comprised primarily of the two idled manufacturing facilities. Based on the guidance in Accounting Standards UpdateNo. 2014-08, Presentation of Financial Statements (Topic 205) and Property, Plant and Equipment (Topic 360): Reporting Discontinued Operations and Disclosures of Disposals of Components of an Entity, which the Company elected to early-adopt in first quarter of fiscal year 2016, and the Property, Plant and Equipment Topic of the FASB’s Accounting Standards Codification, management determined that the EnergeX business had met all criteria to be classified as “held for sale” and that the decision to sell the business represents a strategic shift that will have a major effect on the Company. As a result, for all periods presented in the accompanying consolidated financial statements the EnergeX assets and liabilities are classified separately as “held for sale” and EnergeX’s operating results and cash flows are presented as
| F-38 |
Table of Contents
Confidential Treatment Requested Pursuant to 17 C.F.R. Section 200.83
discontinued operations. Prior to this classification and presentation, EnergeX was its own reportable segment.
As of September 30, 2017, the EnergeX business continues to meet the requirements for presentation as “held for sale” and discontinued operations. Management remains committed to selling the business and continues to actively market the business at a price that it feels is reasonable based on the current circumstances. As a leading manufacturer of industrial steel pipe and tube products, the Company has been regularly receiving inquiries and interest in the Energex business and the related assets. In addition, management, along with its legal and investment banking advisors, has been using its experience and knowledge in these markets to reach out to potential buyers and interested parties.
Market conditions in the oil and gas industry, and specifically related to OCTG, continue to affect the Company’s ability to sell the EnergeX business. Based on these changing market conditions, management has taken steps as needed to adjust its formal plan to sell EnergeX, including lowering the asking price for the business and changing the marketing strategy related to the divestiture process. Recent trends and positive trade developments have led to upward momentum in the oil and gas industry, including OCTG.
Based on this upward momentum in the market, as well as the changes the Company has made to its formal plan to sell the business, management continues to believe that a sale of the EnergeX business at a reasonable price is probable.
Balance Sheet Information
The major components of EnergeX’s “held for sale” assets and liabilities are presented below. As of September 30, 2017 and September 24, 2016, all amounts are classified as current because the Company expects to sell the EnergeX business within the next year.
| September 30, 2017 | September 24, 2016 | |||||||
| (In Thousands) | ||||||||
Accounts receivable, net | $ | 66 | $ | 433 | ||||
Inventories, net(1) | 53 | 2,811 | ||||||
Property, plant and equipment, net(2) | 22,252 | 24,785 | ||||||
Other | 3,357 | 1,717 | ||||||
|
|
|
| |||||
Current assets held for sale | $ | 25,728 | $ | 29,746 | ||||
|
|
|
| |||||
| (1) | Inventories held for sale consist primarily of finished products. |
| (2) | Property, plant and equipment held for sale consist primarily of machinery and equipment. |
| September 30, 2017 | September 24, 2016 | |||||||
| (In Thousands) | ||||||||
Accounts payable | $ | 308 | $ | 722 | ||||
Pension and postretirement benefit obligations | 25,321 | 27,272 | ||||||
Other(3) | 1,028 | 4,058 | ||||||
|
|
|
| |||||
Current liabilities held for sale | $ | 26,657 | $ | 32,052 | ||||
|
|
|
| |||||
| (3) | Other liabilities as of September 30, 2017 and September 24, 2016 includes $0.8 million and $1.9 million, respectively, related to EnergeX’s exit and restructuring plans. |
| F-39 |
Table of Contents
Confidential Treatment Requested Pursuant to 17 C.F.R. Section 200.83
Statement of Operations Information
The major components of EnergeX’s loss from discontinued operations, net of tax are presented below. The operating results of discontinued operations include revenues and expenses directly attributable to the EnergeX business. Accordingly, no interest expense or general corporate overhead costs have been allocated to discontinued operations.
| Year Ended September 30, 2017 | Year Ended September 24, 2016 | Year Ended September 26, 2015 | ||||||||||
| (In Thousands) | ||||||||||||
Net sales | $ | 3,829 | $ | 20,048 | $ | 161,364 | ||||||
Cost of sales | 2,249 | 30,637 | 171,876 | |||||||||
|
|
|
|
|
| |||||||
Gross profit (loss) | 1,580 | (10,589 | ) | (10,512 | ) | |||||||
Selling, general and administrative expenses | 172 | 2,261 | 5,903 | |||||||||
Exit and restructuring costs | 4,007 | 3,785 | 63,124 | |||||||||
Other | 90 | (40 | ) | 2,174 | ||||||||
|
|
|
|
|
| |||||||
Loss before income taxes | (2,689 | ) | (16,595 | ) | (81,713 | ) | ||||||
Benefit for income taxes | (867 | ) | (15 | ) | (12,283 | ) | ||||||
|
|
|
|
|
| |||||||
Loss from discontinued operations, net of income taxes | $ | (1,822 | ) | $ | (16,580 | ) | $ | (69,430 | ) | |||
|
|
|
|
|
| |||||||
Exit and Restructuring Activities
EnergeX’s exit and restructuring costs consist of the following (in thousands):
| Year Ended September 30, 2017 | Year Ended September 24, 2016 | Year Ended September 26, 2015 | ||||||||||
Severance and other benefits | $ | 420 | $ | 17 | $ | 741 | ||||||
Fixed and intangible asset impairment charges | 2,875 | 1,000 | 60,601 | |||||||||
Defined benefit curtailment and other special benefits | (425 | ) | (1,354 | ) | (433 | ) | ||||||
Contractual obligation costs | — | 2,285 | — | |||||||||
Other | 1,137 | 1,837 | 2,215 | |||||||||
|
|
|
|
|
| |||||||
Total | $ | 4,007 | $ | 3,785 | $ | 63,124 | ||||||
|
|
|
|
|
| |||||||
As noted above, the Company recorded impairment charges in the fourth quarter of fiscal year 2015 for the difference between the carrying value of the EnergeX asset group and its fair value. Primarily all fixed assets at the Thomasville and Welland manufacturing facilities, including both real and personal property, were written down to an estimated fair value of $24.6 million. In order to estimate the fair value of the EnergeX asset group and the related assets, the Company engaged independent, third party valuation experts and used various valuation techniques including cost and market approaches, as well as the concept of net orderly liquidation value due to the current operational environment (Level 3 in the fair value hierarchy established by the Fair Value Measurements and Disclosures Topic of the FASB’s Accounting Standards Codification). In addition, the Company reduced the carrying value of its EnergeX customer relationship intangible asset to its estimated fair value of $0 during the period.
In fiscal year 2016, the Company took a charge for costs related to contractual obligations at the Thomasville manufacturing facility for which the Company does not expect to receive any future benefit. Also in fiscal year 2016, the Company recorded a fixed asset impairment charge of $1.0 million which reflects an adjustment to the carrying value of the assets to their estimated fair value less costs to sell.
| F-40 |
Table of Contents
Confidential Treatment Requested Pursuant to 17 C.F.R. Section 200.83
In the fourth quarter of fiscal year 2017, the Company recorded additional impairment charges of $2.9 million related to the EnergeX asset group. Fixed assets at the Thomasville and Welland manufacturing facilities, including both real and personal property, were written down to $22.1 million. In a similar process to the one completed in fiscal year 2015, the Company again engaged independent, third party valuation experts and used various valuation techniques in order to estimate the fair value of the EnergeX fixed assets.
Pension and Other Benefit Plans
The following information relates to the EnergeX defined benefit pension and other postretirement plans (in thousands).
| September 30, 2017 | September 24, 2016 | September 26, 2015 | ||||||||||
Pension: | ||||||||||||
PBO at end of period | $ | 53,150 | $ | 56,626 | $ | 55,744 | ||||||
Fair value of assets at end of period | 55,494 | 55,901 | 56,076 | |||||||||
|
|
|
|
|
| |||||||
Funded status | $ | 2,344 | $ | (725 | ) | $ | 332 | |||||
|
|
|
|
|
| |||||||
Other benefits: | ||||||||||||
PBO at end of period | $ | 25,321 | $ | 26,346 | $ | 24,559 | ||||||
Fair value of assets at end of period | — | — | — | |||||||||
|
|
|
|
|
| |||||||
Funded status | $ | (25,321 | ) | $ | (26,346 | ) | $ | (24,559 | ) | |||
|
|
|
|
|
| |||||||
| Year Ended September 30, 2017 | Year Ended September 24, 2016 | Year Ended September 26, 2015 | ||||||||||
Pension—components of net periodic benefit cost: | ||||||||||||
Service cost | $ | — | $ | — | $ | 65 | ||||||
Interest cost | 1,735 | 2,092 | 2,406 | |||||||||
Expected return on plan assets | (3,228 | ) | (3,185 | ) | (3,557 | ) | ||||||
Other | — | 188 | (13 | ) | ||||||||
|
|
|
|
|
| |||||||
Total net periodic pension benefit cost | $ | (1,493 | ) | $ | (905 | ) | $ | (1,099 | ) | |||
|
|
|
|
|
| |||||||
Other benefits—components of net periodic benefit cost: | ||||||||||||
Service cost | $ | 71 | $ | 160 | $ | 561 | ||||||
Interest cost | 823 | 972 | 1,454 | |||||||||
Curtailment gain | (425 | ) | (1,542 | ) | (420 | ) | ||||||
Other | (211 | ) | (480 | ) | — | |||||||
|
|
|
|
|
| |||||||
Total net periodic other benefit cost | $ | 258 | $ | (890 | ) | $ | 1,595 | |||||
|
|
|
|
|
| |||||||
15. Stockholders’ Equity
Exchangeable Shares in Subsidiary
The exchangeable shares issued by one of the Company’s subsidiaries are held by an entity controlled by Barry Zekelman (the Chief Executive Officer of the Company and the Chairman of the Board of Directors) and other members of the Zekelman family.
The holder of the exchangeable shares has the right to exchange those shares for an equal number of the Company’s common shares at any time, at the holder’s sole discretion and without the payment of any consideration. The holder of the exchangeable shares also has the right to receive dividends equal to the common stockholders when and if declared by the Board of Directors. The exchangeable shares, by themselves, do not have voting rights.
| F-41 |
Table of Contents
Confidential Treatment Requested Pursuant to 17 C.F.R. Section 200.83
Special Voting Stock
The holder of the exchangeable shares also holds an equal number of the Company’s special voting shares. The special voting shares enable the holder to vote this stock as if it were an equivalent number of the Company’s common shares.
Non-Voting Common Stock
The holders of thenon-voting common stock have the right to receive dividends when and if declared by the Board of Directors. In recent years, the holders ofnon-voting common stock have not participated in any of the dividends declared by the Board of Directors.
Cash Dividends and Dividend Equivalents
During the third quarter of fiscal year 2017, the Board of Directors declared and paid $20.0 million of cash dividends to the Company’s common stockholders and the holder of the exchangeable shares. Additionally, the Company’s Second Amended and Restated Stock Option Plan (the “Second Restated Plan”) provides that in the event the Board of Directors declares cash dividends, stock option holders will be eligible to receive a cash dividend equivalent payment. As of the dividend declaration date, outstanding stock options qualified for $1.4 million of dividend equivalents. The dividend equivalents will only be paid to holders of vested stock options and, as such, the entire $1.4 million was recorded as an adjustment to retained earnings along with the cash dividends.
During the fourth quarter of fiscal year 2016, the Board of Directors declared and paid $20.0 million of cash dividends to the Company’s common stockholders and the holder of the exchangeable shares. As of the dividend declaration date, outstanding stock options qualified for $1.5 million of dividend equivalents. Because the Company did not have retained earnings at the time, the cash dividends and the dividend equivalents were recorded as adjustments to additionalpaid-in capital.
During the second quarter of fiscal year 2015, the Board of Directors declared and paid $20.0 million of cash dividends to the Company’s common stockholders and the holder of the exchangeable shares. As of the dividend declaration date, outstanding stock options qualified for $1.5 million of dividend equivalents. Both of these amounts were recorded as adjustments to additionalpaid-in capital.
The dividends described above equated to a dividend per share amount, for common stock and the exchangeable shares, of $136.34 for each of fiscal years 2017, 2016 and 2015.
During fiscal year 2017, $2.3 million of dividend equivalents were paid to stock option holders in accordance with the provisions of the Second Restated Plan. As of September 30, 2017, a total of $1.2 million in unpaid dividend equivalents was included in other accrued liabilities or other liabilities (depending on the expected timing of future payouts) on the Consolidated Balance Sheet.
In October 2017, the Board of Directors declared and paid $20.0 million of cash dividends to the Company’s common stockholders and the holder of the exchangeable shares.
16. Stock-Based Compensation
In June 2011, the Company’s Board of Directors approved the Second Restated Plan. The Second Restated Plan provides for the granting of up to 18,235 stock options to employees,non-employee directors and consultants. Stock options granted to date under the Second Restated Plan vest 50% based on service (“Time Vesting”) and 50% based on a cash flow performance
| F-42 |
Table of Contents
Confidential Treatment Requested Pursuant to 17 C.F.R. Section 200.83
measure (“Performance Vesting”) and expire ten years following the date the last option in each grant becomes exercisable. Upon exercise of these options, new shares of the Company’snon-voting common stock would be issued.
There were no options granted by the Company during fiscal years 2017 and 2016. Options granted by the Company during fiscal year 2015 have weighted average grant date fair values of $2,261 per option. The grant date fair values were determined using a Black-Scholes option pricing model.
During fiscal years 2017, 2016 and 2015, the Company recognized stock-based compensation expense of $1.0 million, $3.1 million and $4.0 million, respectively. The Company recognized $0.4 million of income tax benefit for stock-based compensation during fiscal year 2017. No income tax benefit was recognized for stock-based compensation during fiscal years 2016 and 2015 due to the Company’s deferred tax asset valuation allowance in place during those periods.
The aggregate fair value of stock options that vested during fiscal years 2017, 2016 and 2015 totaled $1.0 million, $3.0 million and $4.0 million, respectively. As of September 30, 2017, there was $2.0 million of total unrecognized compensation cost related tonon-vested stock options which is expected to be recognized over a weighted average period of 1.3 years.
The following table summarizes the Company’s stock option activity:
| Number of Options | Weighted- Average Exercise Price | Aggregate Intrinsic Value (in thousands) | Weighted- Average Remaining Contractual Term | |||||||||||||
Outstanding, September 27, 2014 | 11,078 | $ | 2,892 | |||||||||||||
Granted | 182 | $ | 2,970 | |||||||||||||
Cancelled | (320 | ) | $ | 2,955 | ||||||||||||
|
| |||||||||||||||
Outstanding, September 26, 2015 | 10,940 | $ | 2,892 | |||||||||||||
Cancelled | (44 | ) | $ | 2,870 | ||||||||||||
|
| |||||||||||||||
Outstanding, September 24, 2016 | 10,896 | $ | 2,892 | |||||||||||||
Cancelled | (547 | ) | $ | 2,870 | ||||||||||||
|
| |||||||||||||||
Outstanding, September 30, 2017 | 10,349 | $ | 2,893 | $ | 28,521 | 11.1 years | ||||||||||
|
| |||||||||||||||
Exercisable at September 30, 2017 | 9,188 | $ | 2,890 | $ | 25,347 | 11.0 years | ||||||||||
|
| |||||||||||||||
The following table summarizes the assumptions used to calculate the estimated fair value of stock options granted:
| Year Ended September 26, 2015 | ||
Risk free interest rate | 2.1% | |
Volatility | 67% to 68% | |
Expected life | 10.3 to 11.3 years | |
Dividend yield | 0% |
The risk-free interest rates are based on the U.S. Treasury rates in effect at the time of the grant. The Company’s computation of stock price volatility was based on a combination of historical and implied volatility rates of comparable companies over a period equal to the expected life of the options granted by the Company. The Company’s computation of expected life was determined using the “simplified” method which calculates the average of the weighted vesting period and the contractual term of the options. The dividend yield rate was based on the expectation, at the time, that the Company would not continue to pay annual dividends.
| F-43 |
Table of Contents
Confidential Treatment Requested Pursuant to 17 C.F.R. Section 200.83
The Company utilized independent, third party valuation experts to assist in the estimation of the underlying business enterprise value (“BEV”) in order to calculate the fair value of stock options on their respective grant dates. The BEV estimate was based on the Company’s historical financial results, management’s projections of future operations and other comparable company and industry financial metrics. The per share fair value factored in a discount for the lack of marketability of the Company’s stock.
17. Earnings Per Share
The Company computes earnings (loss) per share using thetwo-class method, which is an earnings allocation approach that treats participating securities as having rights to earnings that otherwise would have been available to common stockholders ornon-voting common stockholders. The exchangeable shares issued by one of the Company’s subsidiaries are considered participating securities because the holders have dividend rights equal to the common stockholders. Outstanding stock options are also considered participating securities because of the holders’ eligibility to receive cash dividend equivalent payments.
Basic earnings (loss) per share is computed by dividing net income (loss) available to common stockholders andnon-voting common stockholders by the weighted average number of shares of common stock andnon-voting common stock outstanding during the period. Diluted earnings (loss) per share is computed by dividing net income (loss) available to common stockholders andnon-voting common stockholders, adjusted for the reallocation of earnings assuming all potentially dilutive shares had been issued, by the weighted-average number of common stock andnon-voting common stock outstanding during the period, adjusted to include the number of shares that would have been outstanding had all potentially dilutive shares been issued.
| F-44 |
Table of Contents
Confidential Treatment Requested Pursuant to 17 C.F.R. Section 200.83
Common Stock
Reconciliations of net income (loss) to net income (loss) available to common stockholders, which is used as the numerator in the basic and diluted earnings (loss) per share calculations, is presented below:
| Year Ended September 30, 2017 | Year Ended September 24, 2016 | Year Ended September 26, 2015 | ||||||||||
Net income (loss) | $ | 161,474 | $ | 68,499 | $ | (63,670 | ) | |||||
Dividends paid to the holder of exchangeable shares | (16,722 | ) | (16,722 | ) | (16,722 | ) | ||||||
Dividend equivalents declared | (1,411 | ) | (1,486 | ) | (1,510 | ) | ||||||
Allocation of undistributed (income) loss tonon-voting common stock and participating securities | (119,854 | ) | (40,243 | ) | 72,058 | |||||||
|
|
|
|
|
| |||||||
Net income (loss) available to common stockholders—basic | 23,487 | 10,048 | (9,844 | ) | ||||||||
Reallocation of earnings assuming exchange of all exchangeable shares | 117,829 | 49,229 | (51,229 | ) | ||||||||
|
|
|
|
|
| |||||||
Net income (loss) available to common stockholders—diluted | $ | 141,316 | $ | 59,277 | $ | (61,073 | ) | |||||
|
|
|
|
|
| |||||||
Components of net income (loss) available to common stockholders—basic: | ||||||||||||
Continuing operations | $ | 23,750 | $ | 12,435 | $ | 852 | ||||||
Discontinued operations | (263 | ) | (2,387 | ) | (10,696 | ) | ||||||
|
|
|
|
|
| |||||||
Net income (loss) available to common stockholders—basic | $ | 23,487 | $ | 10,048 | $ | (9,844 | ) | |||||
|
|
|
|
|
| |||||||
Components of net income (loss) available to common stockholders—diluted: | ||||||||||||
Continuing operations | $ | 142,920 | $ | 73,844 | $ | 4,192 | ||||||
Discontinued operations | (1,604 | ) | (14,567 | ) | (65,265 | ) | ||||||
|
|
|
|
|
| |||||||
Net income (loss) available to common stockholders—diluted | $ | 141,316 | $ | 59,277 | $ | (61,073 | ) | |||||
|
|
|
|
|
| |||||||
Reconciliations of weighted average common shares outstanding, which is used as the denominator in the basic and diluted earnings (loss) per share calculations, is presented below:
| Year Ended September 30, 2017 | Year Ended September 24, 2016 | Year Ended September 26, 2015 | ||||||||||
Weighted average common shares outstanding—basic | 24,040 | 24,040 | 24,040 | |||||||||
Effect of assumed exchange of all exchangeable shares | 122,652 | 122,652 | 122,652 | |||||||||
|
|
|
|
|
| |||||||
Weighted average common shares outstanding—diluted | 146,692 | 146,692 | 146,692 | |||||||||
|
|
|
|
|
| |||||||
| F-45 |
Table of Contents
Confidential Treatment Requested Pursuant to 17 C.F.R. Section 200.83
Non-Voting Common Stock
Reconciliations of net income (loss) to net income (loss) available tonon-voting common stockholders, which is used as the numerator in the basic and diluted earnings (loss) per share calculations, is presented below:
| Year Ended September 30, 2017 | Year Ended September 24, 2016 | Year Ended September 26, 2015 | ||||||||||
Net income (loss) | $ | 161,474 | $ | 68,499 | $ | (63,670 | ) | |||||
Dividends paid to holders of common stock and exchangeable shares | (20,000 | ) | (20,000 | ) | (20,000 | ) | ||||||
Dividend equivalents declared | (1,411 | ) | (1,486 | ) | (1,510 | ) | ||||||
Allocation of undistributed (income) loss to common stock and participating securities | (132,193 | ) | (44,377 | ) | 80,070 | |||||||
|
|
|
|
|
| |||||||
Net income (loss) available tonon-voting common stockholders—basic and diluted | $ | 7,870 | $ | 2,636 | $ | (5,110 | ) | |||||
|
|
|
|
|
| |||||||
Components of net income (loss) available tonon-voting common stockholders—basic and diluted: | ||||||||||||
Continuing operations | $ | 7,972 | $ | 3,566 | $ | (945 | ) | |||||
Discontinued operations | (102 | ) | (930 | ) | (4,165 | ) | ||||||
|
|
|
|
|
| |||||||
Net income (loss) available tonon-voting common stockholders—basic and diluted | $ | 7,870 | $ | 2,636 | $ | (5,110 | ) | |||||
|
|
|
|
|
| |||||||
18. Segment Reporting and Other Information
The Company has three reportable segments which are organized on a product line basis, as follows:
| • | Atlas—structural tubing |
| • | Electrical, Fence and Mechanical (“EFM”)—electrical conduit, fittings and couplings, fence pipe and mechanical tubing |
| • | Pipe—standard pipe and fire sprinkler pipe |
The Company’s other product lines, as well as othernon-core activities, are not material enough to require separate disclosure and are included throughout the Company’s segment reporting as part of “All Other.” The Company’s unallocated corporate costs are also part of the “All Other.”
Management, including the Company’s chief operating decision maker (“CODM”), uses operating earnings as the primary measure of segment profit and loss. Certain manufacturing and distribution expenses are allocated between the segments due to the sharing of manufacturing facilities and other activities. The accounting policies applied to each segment are the same as those described in Note 2. The Company accounts for sales between the Atlas segment and all other segments as if the sales were to a third party, and these intersegment sales are eliminated in consolidation. Certain transactions between other segments are accounted for as inventory transfers.
Segment asset information is not disclosed because no such information is provided to the CODM. However, capital expenditure information by segment is included below as it is regularly reviewed by the CODM. Corporate capital expenditures, including primarily all computer hardware and software, are not allocated to the Company’s reportable segments.
| F-46 |
Table of Contents
Confidential Treatment Requested Pursuant to 17 C.F.R. Section 200.83
The following tables summarize the Company’s segment reporting (in thousands):
| Year Ended September 30, 2017 | ||||||||||||||||||||||||
| Net Sales from External Customers | Net Intersegment Sales | Total Net Segment Sales | Operating Income (Loss) | Depreciation and Amortization | Capital Expenditures | |||||||||||||||||||
Atlas | $ | 1,013,160 | $ | 10,660 | $ | 1,023,820 | $ | 163,432 | $ | 30,133 | $ | 20,035 | ||||||||||||
EFM | 549,912 | — | 549,912 | 92,690 | 13,723 | 6,234 | ||||||||||||||||||
Pipe | 363,052 | — | 363,052 | 39,277 | 17,906 | 6,623 | ||||||||||||||||||
All Other | 169,131 | 1,131 | 170,262 | (9,119 | ) | 13,209 | 13,923 | |||||||||||||||||
|
|
|
|
|
|
|
|
|
|
|
| |||||||||||||
| 2,095,255 | 11,791 | 2,107,046 | 286,280 | 74,971 | 46,815 | |||||||||||||||||||
Eliminations | — | (11,791 | ) | (11,791 | ) | — | — | — | ||||||||||||||||
Transaction costs | — | — | — | (731 | ) | — | — | |||||||||||||||||
Exit and restructuring costs | — | — | — | (1,873 | ) | — | — | |||||||||||||||||
Other | — | — | — | (42 | ) | — | — | |||||||||||||||||
|
|
|
|
|
|
|
|
|
|
|
| |||||||||||||
Consolidated total | $ | 2,095,255 | $ | — | $ | 2,095,255 | $ | 283,634 | $ | 74,971 | $ | 46,815 | ||||||||||||
|
|
|
|
|
|
|
|
|
|
|
| |||||||||||||
| Year Ended September 24, 2016 | ||||||||||||||||||||||||
| Net Sales from External Customers | Net Intersegment Sales | Total Net Segment Sales | Operating Income (Loss) | Depreciation and Amortization | Capital Expenditures | |||||||||||||||||||
Atlas | $ | 767,672 | $ | 9,870 | $ | 777,542 | $ | 113,131 | $ | 28,110 | $ | 13,966 | ||||||||||||
EFM | 370,969 | — | 370,969 | 79,180 | 11,374 | 4,389 | ||||||||||||||||||
Pipe | 317,315 | — | 317,315 | 43,704 | 18,689 | 11,770 | ||||||||||||||||||
All Other | 98,535 | 1,002 | 99,537 | (12,068 | ) | 9,336 | 8,273 | |||||||||||||||||
|
|
|
|
|
|
|
|
|
|
|
| |||||||||||||
| 1,554,491 | 10,872 | 1,565,363 | 223,947 | 67,509 | 38,398 | |||||||||||||||||||
Eliminations | — | (10,872 | ) | (10,872 | ) | — | — | — | ||||||||||||||||
Exit and restructuring costs | — | — | — | (1,970 | ) | — | — | |||||||||||||||||
Other | — | — | — | 115 | — | — | ||||||||||||||||||
|
|
|
|
|
|
|
|
|
|
|
| |||||||||||||
Consolidated total | $ | 1,554,491 | $ | — | $ | 1,554,491 | $ | 222,092 | $ | 67,509 | $ | 38,398 | ||||||||||||
|
|
|
|
|
|
|
|
|
|
|
| |||||||||||||
| Year Ended September 26, 2015 | ||||||||||||||||||||||||
| Net Sales from External Customers | Net Intersegment Sales | Total Net Segment Sales | Operating Income (Loss) | Depreciation and Amortization | Capital Expenditures | |||||||||||||||||||
Atlas | $ | 908,464 | $ | 5,551 | $ | 914,015 | $ | 83,449 | $ | 27,134 | $ | 8,793 | ||||||||||||
EFM | 328,142 | — | 328,142 | 38,839 | 10,249 | 4,059 | ||||||||||||||||||
Pipe | 340,655 | — | 340,655 | 18,807 | 15,710 | 28,197 | ||||||||||||||||||
All Other | 135,286 | 10,958 | 146,244 | (18,284 | ) | 11,329 | 6,065 | |||||||||||||||||
|
|
|
|
|
|
|
|
|
|
|
| |||||||||||||
| 1,712,547 | 16,509 | 1,729,056 | 122,811 | 64,422 | 47,114 | |||||||||||||||||||
Eliminations | — | (16,509 | ) | (16,509 | ) | — | — | — | ||||||||||||||||
Exit and restructuring costs | — | — | — | (8,771 | ) | — | — | |||||||||||||||||
Other | — | — | — | (164 | ) | — | — | |||||||||||||||||
|
|
|
|
|
|
|
|
|
|
|
| |||||||||||||
Consolidated total | $ | 1,712,547 | $ | — | $ | 1,712,547 | $ | 113,876 | $ | 64,422 | $ | 47,114 | ||||||||||||
|
|
|
|
|
|
|
|
|
|
|
| |||||||||||||
| F-47 |
Table of Contents
Confidential Treatment Requested Pursuant to 17 C.F.R. Section 200.83
The Company’s geographical net sales and long-lived assets were as follows:
| Net Sales(1) | Long-Lived Assets(2) | |||||||||||||||||||||||
| Year Ended September 30, 2017 | Year Ended September 24, 2016 | Year Ended September 26, 2015 | September 30, 2017 | September 24, 2016 | September 26, 2015 | |||||||||||||||||||
United States | $ | 1,790,295 | $ | 1,295,488 | $ | 1,390,881 | $ | 419,942 | $ | 355,575 | $ | 367,381 | ||||||||||||
Foreign(3) | 304,960 | 259,003 | 321,666 | 63,261 | 56,726 | 49,804 | ||||||||||||||||||
|
|
|
|
|
|
|
|
|
|
|
| |||||||||||||
Consolidated total | $ | 2,095,255 | $ | 1,554,491 | $ | 1,712,547 | $ | 483,203 | $ | 412,301 | $ | 417,185 | ||||||||||||
|
|
|
|
|
|
|
|
|
|
|
| |||||||||||||
| (1) | Net sales are allocated geographically based on the location of the customer. |
| (2) | Long-lived assets include property, plant and equipment, net and consumable supplies inventory and other noncurrent assets. |
| (3) | Consists almost entirely of net sales and long-lived assets from Canada. |
No single customer represented over 10% of the Company’s consolidated net sales in fiscal years 2017, 2016 or 2015.
19. Derivative Financial Instruments
The costs of the Company’s raw materials, primarily steel, are subject to changes in market price as they are influenced by commodity markets and supply and demand levels, among other factors. Management attempts to mitigate these risks through effective requirements planning and by working closely with key suppliers to obtain the best possible pricing and delivery terms. From time to time, the Company uses derivative instruments for risk management purposes only, and does not use them for trading or speculative purposes.
During fiscal years 2016 and 2015, the Company entered into a series of commodity swap contracts with a third party lending institution related to the price of zinc, which is used as a protective coating on some of the Company’s products. The Company entered into these contracts in order to fix the price of portions of its forecasted zinc purchases for specified periods of time and reduce the related cash flow variability.
These contracts were designated as cash flow hedges; as a result, unrealized gains and losses on these contracts were recorded to accumulated other comprehensive income (loss) until the underlying hedged items were recognized through operations. The ineffective portion of a contract’s change in fair value was immediately recognized through operations. As of September 30, 2017, there were no commodity swaps outstanding. The following tables provide information on these contracts (in thousands):
| September 24, 2016 | ||||
Fair value of derivative assets(1) | $ | 297 | ||
Amount ofpre-tax income recorded in accumulated other comprehensive income (loss) | $ | (297 | ) | |
| Year Ended September 30, 2017 | Year Ended September 24, 2016 | |||||||
Amount reclassified from accumulated other comprehensive income (loss) to earnings(2) | $ | 313 | $ | 2,019 | ||||
| (1) | Amount included in prepaid expenses and other current assets on the Consolidated Balance Sheet. |
| (2) | Amounts included in cost of sales on the Consolidated Statements of Operations. |
| F-48 |
Table of Contents
Confidential Treatment Requested Pursuant to 17 C.F.R. Section 200.83
The Company also recognized an immaterial loss due to ineffectiveness of these commodity swap contracts during fiscal years 2017, 2016 and 2015.
The fair value of the Company’s derivative instruments was determined using pricing models, with all significant inputs derived from or corroborated by observable market data such as zinc commodity spot and forward rates and historical volatility (Level 2 in the fair value hierarchy established by the Fair Value Measurements and Disclosures Topic of the FASB’s Accounting Standards Codification).
20. Commitments and Contingencies
The Company is subject to various lawsuits and claims with respect to matters such as governmental regulations, labor, and other actions arising in the normal course of business. No significant accrual for legal matters existed as of September 30, 2017 or September 24, 2016. Management believes that any losses resulting from such lawsuits and claims will not materially affect the consolidated results of operations, financial position or cash flows of the Company.
As of September 30, 2017 and September 24, 2016, the Company had $32.5 million and $18.2 million, respectively, in letters of credit outstanding related to raw material purchases and potential insurance claims. The letters of credit reduce the availability under the Amended and Restated Revolving Credit Facility.
The Company leases office space as well as computer and transportation equipment. The Company incurred rent expense under operating leases of $4.8 million, $4.5 million, and $4.7 million during fiscal years 2017, 2016 and 2015, respectively.
Scheduled future minimum lease payments undernon-cancelable leases in effect as of September 30, 2017 are as follows for each of the Company’s next five fiscal years and thereafter (in thousands):
2018 | $ | 2,052 | ||
2019 | 1,868 | |||
2020 | 1,874 | |||
2021 | 1,899 | |||
2022 | 1,331 | |||
Thereafter | 4,060 | |||
|
| |||
Total | $ | 13,084 | ||
|
|
The Company subleases a portion of its corporate office space. As of September 30, 2017, the Company expects to receive a total of $2.1 million in the future related to thisnon-cancelable sublease.
The Company’s manufacturing plants are subject to collective bargaining agreements for certain of its employees. Approximately half of the Company’s labor force is covered by collective bargaining agreements.
Certain of the Company’s key executives are covered by employment agreements that provide benefits in the event that their employment is involuntarily terminated.
The Company maintains a reserve for undiscounted, estimated environmental obligations. Uncertainties associated with environmental remediation contingencies are pervasive and often result in wide ranges of outcomes. Estimates developed in the early stages of remediation can vary significantly. A finite estimate of costs does not normally become fixed and determinable at a specific
| F-49 |
Table of Contents
Confidential Treatment Requested Pursuant to 17 C.F.R. Section 200.83
time. Rather, the costs associated with environmental remediation become estimable over a continuum of events and activities that help to frame and define a liability, and the Company continually updates its cost estimates. The Company has an ongoing monitoring and identification process to assess how the activities, with respect to the known exposures, are progressing against the accrued cost estimates, as well as to identify other potential remediation issues.
Estimates of the amount and timing of future costs of environmental remediation requirements are, by their nature, imprecise because of the continuing evolution of environmental laws and regulatory requirements, the availability and application of technology, the identification of presently unknown remediation sites and the allocation of costs among the potentially responsible parties. The Company estimates the exposure for its environmental loss contingencies to range from $0.2 million to $5.3 million, and has accrued $0.4 million as its best estimate of the probable environmental obligation as of September 30, 2017. This reserve is included in other liabilities on the Consolidated Balance Sheet. Based upon information presently available, such future costs are not expected to have a material adverse effect on the Company’s financial condition, results of operations or cash flows. However, such costs could be material to the Company’s results of operations in any particular future quarter or year.
21. Related Party Transactions
The Company’s Board of Directors approved a new Chief Executive Officer employment agreement for Barry Zekelman in April 2016. This new agreement mandated that the Company seek key man life insurance on Barry Zekelman. In August 2016, the Company purchased an existing,in-force life insurance policy from an entity controlled by Barry Zekelman for $2.2 million. The purchase price was charged to general and administrative expenses on the Consolidated Statement of Operations.
In March 2016, the Company purchased two buildings previously rented for use by the Company from an entity controlled by Barry Zekelman for $1.7 million.
In August 2013, an entity controlled by a member of the Company’s Board of Directors purchased a portion of the Company’s outstanding Unsecured Senior Notes with a total principal value of $5.0 million on the open market. In February 2015, the same member of the Board of Directors purchased additional Unsecured Senior Notes with a total principal value of $1.0 million. In connection with the Company’s debt refinancing in June 2016, the $6.0 million held by a member of the Board of Directors was fully redeemed and he does not hold any of the Company’s debt instruments as of September 30, 2017.
As of September 30, 2017 and September 24, 2016, the Company had related party receivables for cash advances outstanding from an entity controlled by Barry Zekelman of $5.3 million and $3.6 million, respectively. These amounts are included in other receivables on the Consolidated Balance Sheets.
The Company receives information technology services from a company that is controlled by a member of the Company’s Board of Directors. The Company incurred costs of less than $0.1 million during each of fiscal years 2017, 2016 and 2015 related to these services.
| F-50 |
Table of Contents
Confidential Treatment Requested Pursuant to 17 C.F.R. Section 200.83
22. Accumulated Other Comprehensive Income (Loss)
The following table summarizes the changes in each component of accumulated other comprehensive income (loss), net of tax (in thousands):
| Foreign Currency Translation | Cash Flow Hedges | Defined Benefit Postretirement Plans | Affected line item in the Consolidated Statement of Operations | Total | ||||||||||||||||
Balance as of September 24, 2016 | $ | (2,818 | ) | $ | 297 | $ | (47,276 | ) | $ | (49,797 | ) | |||||||||
|
|
|
|
|
|
|
|
|
| |||||||||||
Other comprehensive (loss) income before reclassifications | (877 | ) | 16 | (1) | 13,071 | (1) | 12,210 | |||||||||||||
Amounts reclassified from accumulated other comprehensive income (loss): | ||||||||||||||||||||
Realized gain on cash flow hedges | — | (313 | )(2) | — | (4) | (313 | ) | |||||||||||||
Amortization of actuarial gains | — | — | 2,119 | (2) | (5) | 2,119 | ||||||||||||||
Amortization of prior service cost | — | — | 76 | (3) | (5) | 76 | ||||||||||||||
|
|
|
|
|
|
|
|
|
| |||||||||||
Net current-period other comprehensive (loss) income | (877 | ) | (297 | ) | 15,266 | 14,092 | ||||||||||||||
|
|
|
|
|
|
|
|
|
| |||||||||||
Balance as of September 30, 2017 | $ | (3,695 | ) | $ | — | $ | (32,010 | ) | $ | (35,705 | ) | |||||||||
|
|
|
|
|
|
|
|
|
| |||||||||||
| (1) | Net of income tax expense of $8,105. |
| (2) | Net of income tax expense of $1,468. |
| (3) | Net of income tax expense of $51. |
| (4) | Components are included in cost of sales (see Note 19 for details). |
| (5) | Components are included in the computation of net periodic benefit cost (see Note 13 for details). |
| F-51 |
Table of Contents
Confidential Treatment Requested Pursuant to 17 C.F.R. Section 200.83
ZEKELMAN INDUSTRIES, INC.
(In Thousands, Except Share and Per Share Amounts)
| March 31, 2018 | September 30, 2017 | |||||||
| (Unaudited) | ||||||||
Assets | ||||||||
Current assets: | ||||||||
Cash and cash equivalents | $ | 41,564 | $ | 29,201 | ||||
Accounts receivable, net of allowance for doubtful accounts of $481 and $589 | 307,788 | 266,174 | ||||||
Other receivables | 5,071 | 9,762 | ||||||
Inventories, net | 363,682 | 318,408 | ||||||
Consumable supplies inventory | 25,354 | 24,192 | ||||||
Prepaid expenses and other current assets | 6,273 | 6,588 | ||||||
Refundable income taxes | 1,786 | 3,017 | ||||||
Current assets held for sale | 25,002 | 25,728 | ||||||
|
|
|
| |||||
Total current assets | 776,520 | 683,070 | ||||||
Property, plant and equipment | 763,724 | 736,110 | ||||||
Accumulated depreciation | (310,154 | ) | (283,809 | ) | ||||
|
|
|
| |||||
Property, plant and equipment, net | 453,570 | 452,301 | ||||||
Deferred financing costs, net | 1,445 | 1,911 | ||||||
Trademarks, net | 17,280 | 20,176 | ||||||
Customer relationships, net | 174,932 | 181,658 | ||||||
Goodwill | 914,787 | 914,787 | ||||||
Consumable supplies inventory and other noncurrent assets | 30,014 | 30,902 | ||||||
|
|
|
| |||||
Total other noncurrent assets | 1,138,458 | 1,149,434 | ||||||
|
|
|
| |||||
Total assets | $ | 2,368,548 | $ | 2,284,805 | ||||
|
|
|
| |||||
See accompanying notes.
| F-52 |
Table of Contents
Confidential Treatment Requested Pursuant to 17 C.F.R. Section 200.83
ZEKELMAN INDUSTRIES, INC.
CONSOLIDATED BALANCE SHEETS (CONTINUED)
(In Thousands, Except Share and Per Share Amounts)
| March 31, 2018 | September 30, 2017 | |||||||
| (Unaudited) | ||||||||
Liabilities and stockholders’ equity | ||||||||
Current liabilities: | ||||||||
Current portion of long-term debt | $ | 9,588 | $ | 10,318 | ||||
Accounts payable | 131,683 | 136,675 | ||||||
Accrued customer rebates | 21,412 | 19,783 | ||||||
Accrued payroll liabilities | 24,504 | 30,851 | ||||||
Accrued income taxes payable | 6,923 | 2,348 | ||||||
Pension and postretirement benefit obligations | 4,111 | 4,111 | ||||||
Accrued interest expense | 12,879 | 12,461 | ||||||
Other accrued liabilities | 42,042 | 38,616 | ||||||
Current liabilities held for sale | 24,954 | 26,657 | ||||||
|
|
|
| |||||
Total current liabilities | 278,096 | 281,820 | ||||||
Long-term debt, net of current portion | 1,306,286 | 1,289,020 | ||||||
Income taxes payable | 11,040 | — | ||||||
Pension and postretirement benefit obligations | 140,004 | 148,692 | ||||||
Deferred income taxes | 59,167 | 78,965 | ||||||
Other liabilities | 9,979 | 10,008 | ||||||
|
|
|
| |||||
Total noncurrent liabilities | 1,526,476 | 1,526,685 | ||||||
|
|
|
| |||||
Total liabilities | 1,804,572 | 1,808,505 | ||||||
Commitments and contingencies (Note 18) | ||||||||
Stockholders’ equity: | ||||||||
Common stock, $.01 par value, 400,000 shares authorized; 164,644 shares issued; 24,040 shares outstanding | 2 | 2 | ||||||
Preferred stock, $.01 par value, 100,000 shares authorized; 0 shares issued and outstanding | — | — | ||||||
Special voting stock, $.000001 par value, 200,000 shares authorized; 122,652 shares issued and outstanding | — | — | ||||||
Non-voting common stock, $.01 par value, 50,000 shares authorized; 10,000 shares issued; 9,361 shares outstanding | — | — | ||||||
Additionalpaid-in capital | 467,302 | 463,538 | ||||||
Exchangeable shares in subsidiary, 122,652 shares issued and outstanding | 352,055 | 352,055 | ||||||
Retained earnings | 194,809 | 111,518 | ||||||
Accumulated other comprehensive loss | (35,084 | ) | (35,705 | ) | ||||
Treasury stock, at cost (141,243 shares) | (415,108 | ) | (415,108 | ) | ||||
|
|
|
| |||||
Total stockholders’ equity | 563,976 | 476,300 | ||||||
|
|
|
| |||||
Total liabilities and stockholders’ equity | $ | 2,368,548 | $ | 2,284,805 | ||||
|
|
|
| |||||
See accompanying notes.
| F-53 |
Table of Contents
Confidential Treatment Requested Pursuant to 17 C.F.R. Section 200.83
ZEKELMAN INDUSTRIES, INC.
UNAUDITED CONSOLIDATED STATEMENTS OF OPERATIONS
(In Thousands, Except Share and Per Share Amounts)
| 13 Weeks Ended | 26 Weeks Ended | |||||||||||||||
| March 31, 2018 | March 25, 2017 | March 31, 2018 | March 25, 2017 | |||||||||||||
Net sales | $ | 662,845 | $ | 501,174 | $ | 1,198,601 | $ | 916,675 | ||||||||
Cost of sales | 502,875 | 370,330 | 937,404 | 710,018 | ||||||||||||
|
|
|
|
|
|
|
| |||||||||
Gross profit | 159,970 | 130,844 | 261,197 | 206,657 | ||||||||||||
Expenses: | ||||||||||||||||
Selling | 12,860 | 10,262 | 23,053 | 17,861 | ||||||||||||
General and administrative | 35,086 | 29,248 | 63,349 | 51,753 | ||||||||||||
Transaction costs | — | 731 | — | 731 | ||||||||||||
Exit and restructuring costs | 95 | 966 | 108 | 1,372 | ||||||||||||
|
|
|
|
|
|
|
| |||||||||
Total expenses | 48,041 | 41,207 | 86,510 | 71,717 | ||||||||||||
|
|
|
|
|
|
|
| |||||||||
Operating income | 111,929 | 89,637 | 174,687 | 134,940 | ||||||||||||
Other expense (income): | ||||||||||||||||
Interest expense, net | 21,751 | 23,211 | 42,441 | 46,624 | ||||||||||||
Debt modification costs | — | 1,587 | — | 1,587 | ||||||||||||
Bargain purchase gain | — | (1,745 | ) | — | (1,745 | ) | ||||||||||
Foreign exchange loss (gain) | 2,872 | (1,158 | ) | 4,642 | 3,025 | |||||||||||
Other (income) expense, net | (1 | ) | 197 | 40 | (1,165 | ) | ||||||||||
|
|
|
|
|
|
|
| |||||||||
Total other expense, net | 24,622 | 22,092 | 47,123 | 48,326 | ||||||||||||
|
|
|
|
|
|
|
| |||||||||
Income from continuing operations before income taxes | 87,307 | 67,545 | 127,564 | 86,614 | ||||||||||||
Provision for income taxes | 22,641 | 11,732 | 22,148 | 14,866 | ||||||||||||
|
|
|
|
|
|
|
| |||||||||
Income from continuing operations | 64,666 | 55,813 | 105,416 | 71,748 | ||||||||||||
|
|
|
|
|
|
|
| |||||||||
(Loss) income from discontinued operations, net of income taxes | (451 | ) | (242 | ) | (714 | ) | 355 | |||||||||
|
|
|
|
|
|
|
| |||||||||
Net income | $ | 64,215 | $ | 55,571 | $ | 104,702 | $ | 72,103 | ||||||||
|
|
|
|
|
|
|
| |||||||||
Net income available to common stockholders—basic | $ | 9,150 | $ | 8,012 | $ | 15,168 | $ | 10,390 | ||||||||
|
|
|
|
|
|
|
| |||||||||
Net income available to common stockholders—diluted | $ | 55,834 | $ | 48,889 | $ | 90,397 | $ | 63,398 | ||||||||
|
|
|
|
|
|
|
| |||||||||
Basic earnings (loss) per common share: | ||||||||||||||||
Continuing operations | $ | 383.28 | $ | 334.73 | $ | 635.20 | $ | 430.07 | ||||||||
Discontinued operations | (2.66 | ) | (1.45 | ) | (4.25 | ) | 2.13 | |||||||||
|
|
|
|
|
|
|
| |||||||||
Net income | $ | 380.62 | $ | 333.28 | $ | 630.95 | $ | 432.20 | ||||||||
|
|
|
|
|
|
|
| |||||||||
Diluted earnings (loss) per common share: | ||||||||||||||||
Continuing operations | $ | 383.28 | $ | 334.73 | $ | 620.49 | $ | 430.07 | ||||||||
Discontinued operations | (2.66 | ) | (1.45 | ) | (4.25 | ) | 2.13 | |||||||||
|
|
|
|
|
|
|
| |||||||||
Net income | $ | 380.62 | $ | 333.28 | $ | 616.24 | $ | 432.20 | ||||||||
|
|
|
|
|
|
|
| |||||||||
Weighted average common shares outstanding—basic | 24,040 | 24,040 | 24,040 | 24,040 | ||||||||||||
|
|
|
|
|
|
|
| |||||||||
Weighted average common shares outstanding—diluted | 146,692 | 146,692 | 146,692 | 146,692 | ||||||||||||
|
|
|
|
|
|
|
| |||||||||
Net income available tonon-voting common stockholders—basic and diluted | $ | 3,563 | $ | 3,119 | $ | 4,630 | $ | 4,046 | ||||||||
|
|
|
|
|
|
|
| |||||||||
Basic and diluted earnings (loss) pernon-voting common share: | ||||||||||||||||
Continuing operations | $ | 383.28 | $ | 334.73 | $ | 498.86 | $ | 430.07 | ||||||||
Discontinued operations | (2.66 | ) | (1.45 | ) | (4.25 | ) | 2.13 | |||||||||
|
|
|
|
|
|
|
| |||||||||
Net income | $ | 380.62 | $ | 333.28 | $ | 494.61 | $ | 432.20 | ||||||||
|
|
|
|
|
|
|
| |||||||||
Weighted averagenon-voting common shares outstanding—basic and diluted | 9,361 | 9,361 | 9,361 | 9,361 | ||||||||||||
|
|
|
|
|
|
|
| |||||||||
See accompanying notes.
| F-54 |
Table of Contents
Confidential Treatment Requested Pursuant to 17 C.F.R. Section 200.83
ZEKELMAN INDUSTRIES, INC.
UNAUDITED CONSOLIDATED STATEMENTS OF COMPREHENSIVE INCOME (LOSS)
(In Thousands)
| 13 Weeks Ended | 26 Weeks Ended | |||||||||||||||
| March 31, 2018 | March 25, 2017 | March 31, 2018 | March 25, 2017 | |||||||||||||
Net income | $ | 64,215 | $ | 55,571 | $ | 104,702 | $ | 72,103 | ||||||||
|
|
|
|
|
|
|
| |||||||||
Other comprehensive income (loss) items, net of tax: | ||||||||||||||||
Cash flow hedges: | ||||||||||||||||
Gain arising during the period | — | — | — | 16 | ||||||||||||
Reclassification adjustments | — | — | — | (313 | ) | |||||||||||
Defined benefit postretirement plans: | ||||||||||||||||
Reclassification adjustments(1) | 147 | 925 | 239 | 1,850 | ||||||||||||
Foreign currency translation (loss) gain | (264 | ) | 127 | 382 | 1,165 | |||||||||||
|
|
|
|
|
|
|
| |||||||||
Comprehensive income | $ | 64,098 | $ | 56,623 | $ | 105,323 | $ | 74,821 | ||||||||
|
|
|
|
|
|
|
| |||||||||
| (1) | Net of income tax expense of $54 and $163 for the 13 and 26 weeks ended March 31, 2018, respectively, and income tax benefit of $13 and $26 for the 13 and 26 weeks ended March 25, 2017, respectively. |
See accompanying notes.
| F-55 |
Table of Contents
Confidential Treatment Requested Pursuant to 17 C.F.R. Section 200.83
ZEKELMAN INDUSTRIES, INC.
UNAUDITED CONSOLIDATED STATEMENT OF CHANGES IN STOCKHOLDERS’ EQUITY
(In Thousands, Except Share Amounts)
| Common Stock | Non-Voting Common Stock | Additional Paid-in Capital | Special Voting Stock | Exchangeable Shares | Retained Earnings | Accumulated Other Comprehensive Loss | Treasury Stock | Total | ||||||||||||||||||||||||||||||||||||||||||||||||
| Shares | Amount | Shares | Amount | Shares | Amount | Shares | Amount | Shares | Amount | |||||||||||||||||||||||||||||||||||||||||||||||
Balance at September 30, 2017 | 164,644 | $ | 2 | 10,000 | $ | — | $ | 463,538 | 122,652 | $ | — | 122,652 | $ | 352,055 | $ | 111,518 | $ | (35,705 | ) | 141,243 | $ | (415,108 | ) | $ | 476,300 | |||||||||||||||||||||||||||||||
Net income | — | — | — | — | — | — | — | — | — | 104,702 | — | — | — | 104,702 | ||||||||||||||||||||||||||||||||||||||||||
Stock-based compensation expense | — | — | — | — | 3,764 | — | — | — | — | — | — | — | — | 3,764 | ||||||||||||||||||||||||||||||||||||||||||
Gain on defined benefit postretirement plans, net of tax expense of $163 | — | — | — | — | — | — | — | — | — | — | 239 | — | — | 239 | ||||||||||||||||||||||||||||||||||||||||||
Cash dividends | — | — | — | — | — | — | — | — | — | (20,000 | ) | — | — | — | (20,000 | ) | ||||||||||||||||||||||||||||||||||||||||
Dividend equivalents | — | — | — | — | — | — | — | — | — | (1,411 | ) | — | — | — | (1,411 | ) | ||||||||||||||||||||||||||||||||||||||||
Foreign currency translation | — | — | — | — | — | — | — | — | — | — | 382 | — | — | 382 | ||||||||||||||||||||||||||||||||||||||||||
|
|
|
|
|
|
|
|
|
|
|
|
|
|
|
|
|
|
|
|
|
|
|
|
|
|
|
| |||||||||||||||||||||||||||||
Balance at March 31, 2018 | 164,644 | $ | 2 | 10,000 | $ | — | $ | 467,302 | 122,652 | $ | — | 122,652 | $ | 352,055 | $ | 194,809 | $ | (35,084 | ) | 141,243 | $ | (415,108 | ) | $ | 563,976 | |||||||||||||||||||||||||||||||
|
|
|
|
|
|
|
|
|
|
|
|
|
|
|
|
|
|
|
|
|
|
|
|
|
|
|
| |||||||||||||||||||||||||||||
See accompanying notes.
| F-56 |
Table of Contents
Confidential Treatment Requested Pursuant to 17 C.F.R. Section 200.83
ZEKELMAN INDUSTRIES, INC.
UNAUDITED CONSOLIDATED STATEMENTS OF CASH FLOWS
(In Thousands)
| 26 Weeks Ended | ||||||||
| March 31, 2018 | March 25, 2017 | |||||||
Operating activities | ||||||||
Net income | $ | 104,702 | $ | 72,103 | ||||
Less: (Loss) income from discontinued operations | (714 | ) | 355 | |||||
|
|
|
| |||||
Income from continuing operations | 105,416 | 71,748 | ||||||
Adjustments to reconcile income from continuing operations to net cash provided by operating activities: | ||||||||
Depreciation | 28,532 | 25,416 | ||||||
Amortization of intangible assets | 9,821 | 8,989 | ||||||
Payments for postretirement obligations in excess of charges | (7,916 | ) | (1,493 | ) | ||||
Amortization of deferred financing costs | 1,488 | 1,482 | ||||||
Amortization of long-term debt discount | 830 | 830 | ||||||
Stock-based compensation expense | 3,764 | 522 | ||||||
Impairment of fixed assets | — | 180 | ||||||
Unrealized foreign exchange loss | 7,067 | 3,738 | ||||||
Bargain purchase gain | — | (1,745 | ) | |||||
Deferred tax (benefit) provision | (19,787 | ) | 1,115 | |||||
Loss (gain) on sale of fixed assets | 50 | (1,140 | ) | |||||
Net change in certain assets and liabilities (excluding acquisitions): | ||||||||
Accounts receivable | (43,629 | ) | (46,762 | ) | ||||
Inventories | (47,232 | ) | (31,644 | ) | ||||
Prepaid expenses and other current assets | 4,817 | (377 | ) | |||||
Accounts payable | (3,867 | ) | (1,521 | ) | ||||
Accrued liabilities | (682 | ) | (1,005 | ) | ||||
Refundable and accrued income taxes payable | 17,176 | (3,260 | ) | |||||
Other | (559 | ) | 176 | |||||
|
|
|
| |||||
Net cash provided by operating activities | 55,289 | 25,249 | ||||||
Investing activities | ||||||||
Additions to property, plant and equipment | (31,482 | ) | (24,043 | ) | ||||
Acquisitions of Western Tube, net of cash acquired | — | (130,384 | ) | |||||
Acquisition of American Tube | — | (65,490 | ) | |||||
Proceeds from sale of assets | 19 | 3,533 | ||||||
|
|
|
| |||||
Net cash used in investing activities | (31,463 | ) | (216,384 | ) | ||||
Financing activities | ||||||||
Proceeds from borrowings of long-term debt | 178,000 | 262,000 | ||||||
Repayments of long-term debt | (163,334 | ) | (82,118 | ) | ||||
Payment of dividends and dividend equivalents | (21,659 | ) | (1,113 | ) | ||||
|
|
|
| |||||
Net cash (used in) provided by financing activities | (6,993 | ) | 178,769 | |||||
Effect of exchange rate change on cash | (2,639 | ) | (261 | ) | ||||
Net cash provided by (used in) continuing operations | 14,194 | (12,627 | ) | |||||
|
|
|
| |||||
Discontinued operations | ||||||||
Net cash used in operating activities | (2,028 | ) | (813 | ) | ||||
Effect of exchange rate change on cash | (6 | ) | (7 | ) | ||||
|
|
|
| |||||
Net cash used in discontinued operations | (2,034 | ) | (820 | ) | ||||
|
|
|
| |||||
Net increase (decrease) in cash and cash equivalents | 12,160 | (13,447 | ) | |||||
|
|
|
| |||||
Cash and cash equivalents at beginning of period, including discontinued operations | 29,670 | 37,488 | ||||||
|
|
|
| |||||
Cash and cash equivalents at end of period, including discontinued operations | $ | 41,830 | $ | 24,041 | ||||
|
|
|
| |||||
See accompanying notes.
| F-57 |
Table of Contents
Confidential Treatment Requested Pursuant to 17 C.F.R. Section 200.83
ZEKELMAN INDUSTRIES, INC.
NOTES TO UNAUDITED CONSOLIDATED FINANCIAL STATEMENTS
1. Background and Basis of Presentation
Zekelman Industries, Inc. (the “Company”) is a Delaware corporation. The Company manufactures and sells structural tubing, electrical conduit, standard pipe and other industrial steel pipe and tube products. The majority of the Company’s products are used in infrastructure andnon-residential construction applications. The Company also supplies products for use in the fabrication, automotive, oil and gas, agricultural and industrial equipment and retailend-markets. The Company manufactures many products to operate under specialized conditions, including in load-bearing, high-pressure, corrosive and high-temperature environments.
The Company’s accompanying Unaudited Consolidated Financial Statements do not include all of the information and footnotes required by accounting principles generally accepted in the United States (“U.S. GAAP”) for complete financial statements. In the opinion of management, all adjustments, consisting of normal recurring accruals, and disclosures considered necessary for a fair presentation have been included. The Consolidated Balance Sheet as of September 30, 2017 has been derived from audited financial statements for the year ended September 30, 2017. These consolidated financial statements should be read in conjunction with the consolidated financial statements and notes thereto for the year ended September 30, 2017.
The Company uses a fiscal year that is a 52 or 53 week period ending on the last Saturday in September. Fiscal year 2018 will end on September 29, 2018 and will consist of 52 weeks. Fiscal year 2017 ended on September 30, 2017 and consisted of 53 weeks. The Company’s fiscal quarters are all 13 or 14 week periods generally ending on the last Saturday in December, March, June and September. The second quarter of fiscal year 2018 ended on March 31, 2018 and consisted of 13 weeks. The second quarter of fiscal year 2017 ended on March 25, 2017 and consisted of 13 weeks.
On February 14, 2017, the Company acquired all issued and outstanding common shares of Western Tube and Conduit Corporation (“Western Tube”). On February 21, 2017, the Company acquired the majority of operating assets and certain liabilities of American Tube Manufacturing, Inc. (“American Tube”).
On March 30, 2012, the Company completed the acquisition of Lakeside Steel, Inc. (“Lakeside”). Lakeside is a steel pipe and tubing manufacturer with a focus on manufacturing energy tubulars. Following the acquisition, the Lakeside portfolio of products has been marketed under the EnergeX brand. Beginning in the first quarter of fiscal year 2016, the Company is classifying all assets and liabilities of its EnergeX business as “held for sale” and all operating results and cash flows of its EnergeX business as discontinued operations for all periods presented in these consolidated financial statements. In addition, unless otherwise noted all disclosures in the Notes reflect only continuing operations. See Note 13 for further details regarding the EnergeX business.
The accompanying consolidated financial statements include the accounts of the Company and its wholly-owned subsidiaries. All intercompany balances and transactions have been eliminated in consolidation.
The Company evaluated all material subsequent events occurring through June 7, 2018, the date the consolidated financial statements were available for issuance, for recognition and disclosure in these Notes.
| F-58 |
Table of Contents
Confidential Treatment Requested Pursuant to 17 C.F.R. Section 200.83
2. Use of Estimates
The preparation of financial statements in conformity with U.S. GAAP requires management to make estimates and assumptions that affect the reported amounts of assets and liabilities and disclosures of contingent assets and liabilities at the date of the financial statements and the reported amounts of revenues and expenses during the reporting period. Actual results could differ from those estimates. The Company develops its estimates based on historical experience and on various other assumptions that are believed to be reasonable.
3. Recently Issued Accounting Standards
In June 2014, the Financial Accounting Standards Board (the “FASB”) issued Accounting Standards UpdateNo. 2014-09, Revenue from Contracts with Customers (Topic 606)(“ASU 2014-09”). ASU2014-09 provides revised guidance on how an entity should recognize revenue to depict the transfer of promised goods or services to customers in an amount that reflects the consideration to which the entity expects to be entitled in exchange for those goods or services.ASU 2014-09 is effective for annual reporting periods beginning after December 15, 2017 (the Company’s fiscal year 2019), and interim periods within that annual period. Multiple early adoption effective dates are permitted. The Company is still in the process of evaluating the effect of adopting ASU2014-09 and cannot reasonably estimate the impact at this time. The Company has engaged independent, third party specialists to assist in the evaluation. With their help, management is comparing the requirements of the new standard to its existing revenue recognition policies and procedures and performing detailed reviews of the various contracts and customer terms utilized by the Company with regard to sales, rebate programs, commission plans and other arrangements.
In February 2016, the FASB issued Accounting Standards UpdateNo. 2016-02, Leases (Topic 842) (“ASU2016-02”). ASU2016-02 provides revised guidance on accounting for leases, including the requirement for lessees to recognizeright-of-use assets and lease obligation liabilities for primarily all leases. ASU2016-02 is effective for annual periods beginning after December 15, 2018 (the Company’s fiscal year 2020), and interim periods within that annual period. Early adoption is permitted. The Company is still in the process of evaluating the effect of adopting ASU2016-02.
In August 2016, the FASB issued Accounting Standards UpdateNo. 2016-15, Statement of Cash Flows (Topic 230): Classification of Certain Cash Receipts and Cash Payments—a consensus of the FASB Emerging Issues Task Force (“ASU2016-15”). ASU2016-15 addresses eight specific cash flow issues with the objective of reducing the existing diversity in practice. ASU2016-15 is effective for annual periods beginning after December 15, 2017 (the Company’s fiscal year 2019), and interim periods within that annual period. Early adoption is permitted. The adoption of ASU2016-15 is not expected to have a material impact on the Company’s financial position, results of operations or cash flows.
In March 2017, the FASB issued Accounting Standards UpdateNo. 2017-07, Compensation—Retirement Benefits (Topic 715): Improving the Presentation of Net Periodic Pension Cost and Net Periodic Postretirement Benefit Cost (“ASU2017-07”). ASU2017-07 requires all elements of pension and other defined benefit postretirement net periodic benefit cost, except service cost, to be shown outside the operating subtotal of the income statement. ASU2017-07 is effective for annual periods beginning after December 15, 2017 (the Company’s fiscal year 2019), and interim periods within that annual period. Early adoption is permitted. The Company is still in the process of evaluating the effect of adopting ASU2017-07.
4. Business Combinations and Acquisitions
In the second quarter of fiscal year 2017, the Company completed two acquisitions—Western Tube and American Tube—for a combined purchase price of approximately $194.7 million.
| F-59 |
Table of Contents
Confidential Treatment Requested Pursuant to 17 C.F.R. Section 200.83
The Company accounted for these acquisitions using the acquisition method of accounting. Therefore, the Company has recognized the assets acquired and liabilities assumed at their estimated fair values as of the respective acquisition dates. As wholly-owned subsidiaries of the Company, the financial positions, results of operations and cash flows of Western Tube and American Tube are included in the Company’s consolidated financial statements since their respective acquisition dates. Any trade payables or receivables between the Company’s other divisions and the acquired entities were eliminated as intercompany balances starting at the acquisition dates.
Western Tube
Pursuant to a stock purchase agreement, on February 14, 2017 the Company acquired all of the issued and outstanding common shares of Western Tube for a total purchase price of $129.2 million.
Western Tube is located in Long Beach, California and is a leading producer of electrical conduit, fence and mechanical tubing. The acquisition of Western Tube significantly expands the Company’s capabilities and presence in these markets across the western half of the United States.
The acquisition resulted in the recognition of a $1.7 million bargain purchase gain in the second quarter of fiscal year 2017 because the estimated fair value of the net assets acquired exceeded the purchase price.
The Company incurred $0.5 million of transaction costs during the second quarter of fiscal year 2017 associated with the acquisition of Western Tube. This amount was recorded in transaction costs on the accompanying Consolidated Statement of Operations.
American Tube
Pursuant to an asset purchase agreement, on February 21, 2017 the Company acquired the majority of operating assets and certain liabilities of American Tube for a total purchase price of $65.5 million.
American Tube is located in Birmingham, Alabama and is a leading producer of round, square and rectangle shaped structural tubing. The acquisition of American Tube significantly expands the Company’s capabilities and presence in this market across the southeastern United States.
The acquisition resulted in the recognition of $18.9 million of goodwill, which is expected to be deductible for federal income tax purposes.
The Company incurred $0.2 million of transaction costs during the second quarter of fiscal year 2017 associated with the acquisition of American Tube. This amount was recorded in transaction costs on the accompanying Consolidated Statement of Operations.
5. Inventories
The Company’s inventories consist of the following (in thousands):
| March 31, 2018 | September 30, 2017 | |||||||
Finished products | $ | 157,181 | $ | 144,902 | ||||
Work in process | 30,082 | 25,450 | ||||||
Raw materials | 176,419 | 148,056 | ||||||
|
|
|
| |||||
Total | $ | 363,682 | $ | 318,408 | ||||
|
|
|
| |||||
| F-60 |
Table of Contents
Confidential Treatment Requested Pursuant to 17 C.F.R. Section 200.83
The Company maintains reserves for excess and obsolete inventories of $0.8 million and $1.3 million as of March 31, 2018 and September 30, 2017, respectively.
6. Property, Plant and Equipment
The Company’s property, plant and equipment consist of the following (in thousands):
| March 31, 2018 | September 30, 2017 | |||||||
Land, buildings and improvements | $ | 150,675 | $ | 149,714 | ||||
Machinery and equipment | 518,317 | 496,612 | ||||||
Computer hardware and software | 52,599 | 48,659 | ||||||
Construction in progress | 22,275 | 28,975 | ||||||
Other | 19,858 | 12,150 | ||||||
|
|
|
| |||||
| 763,724 | 736,110 | |||||||
Less accumulated depreciation | (310,154 | ) | (283,809 | ) | ||||
|
|
|
| |||||
Total | $ | 453,570 | $ | 452,301 | ||||
|
|
|
| |||||
7. Goodwill and Other Intangible Assets
There were no changes to the Company’s goodwill during the first half of fiscal year 2018.
The Company’s customer relationship and trademark intangible assets consist of the following (in thousands):
| March 31, 2018 | September 30, 2017 | |||||||||||||||||||||||
| Gross Carrying Amount | Accumulated Amortization | Net Carrying Amount | Gross Carrying Amount | Accumulated Amortization | Net Carrying Amount | |||||||||||||||||||
Customer relationships | $ | 263,300 | $ | (88,368 | ) | $ | 174,932 | $ | 263,300 | $ | (81,642 | ) | $ | 181,658 | ||||||||||
Trademarks | 56,788 | (39,508 | ) | 17,280 | 56,801 | (36,625 | ) | 20,176 | ||||||||||||||||
|
|
|
|
|
|
|
|
|
|
|
| |||||||||||||
Total | $ | 320,088 | $ | (127,876 | ) | $ | 192,212 | $ | 320,101 | $ | (118,267 | ) | $ | 201,834 | ||||||||||
|
|
|
|
|
|
|
|
|
|
|
| |||||||||||||
8. Other Accrued Liabilities
The Company’s other accrued liabilities consist of the following (in thousands):
| March 31, 2018 | September 30, 2017 | |||||||
Accrued freight costs | $ | 20,791 | $ | 14,771 | ||||
Self-insurance reserves | 10,026 | 8,907 | ||||||
Accrued commissions | 2,279 | 2,265 | ||||||
Accrued utilities | 1,644 | 1,308 | ||||||
Current portion of dividend equivalent payables | 520 | 406 | ||||||
Other | 6,782 | 10,959 | ||||||
|
|
|
| |||||
Total | $ | 42,042 | $ | 38,616 | ||||
|
|
|
| |||||
| F-61 |
Table of Contents
Confidential Treatment Requested Pursuant to 17 C.F.R. Section 200.83
9. Exit and Restructuring Activities
Western Tube Plan
Following the acquisition of Western Tube, the Company announced that it was exiting certain acquired product types related to mechanical tubing and downsizing the Long Beach facility in order to lower costs and improve operational flexibility and profitability. The costs associated with these activities are included as part of the “Western Tube Plan.” As part of the Western Tube Plan, the Company has incurred certain costs including severance and fixed asset impairment charges.
A summary of the exit cost activities included in the Western Tube Plan is as follows (in thousands):
| Severance & Other Benefits | Fixed Asset Impairment Charges | Other | Total | |||||||||||||
Total estimated exit costs | $ | 747 | $ | 239 | $ | 367 | $ | 1,353 | ||||||||
|
|
|
|
|
|
|
| |||||||||
Incurred during Q2 2018 | — | — | 95 | 95 | ||||||||||||
Incurred during Q4 2017 | 71 | — | (12 | ) | 59 | |||||||||||
Incurred during Q3 2017 | 31 | 59 | 68 | 158 | ||||||||||||
Incurred during Q2 2017 | 545 | 180 | 16 | 741 | ||||||||||||
|
|
|
|
|
|
|
| |||||||||
Remainder to be incurred | $ | 100 | $ | — | $ | 200 | $ | 300 | ||||||||
|
|
|
|
|
|
|
| |||||||||
As of March 31, 2018 and September 30, 2017, there were no severance and other benefits costs related to the Western Tube Plan accrued on the Consolidated Balance Sheets.
As part of the Western Tube Plan, the Company identified certain mill machinery and equipment at the Long Beach manufacturing facility that was determined to have no future use or value. The Company recorded impairment charges of $0.2 million to reduce the carrying value of these assets to their estimated fair value of $0 during the second and third quarters of fiscal year 2017 and included these charges as components of the Western Tube Plan’s exit and restructuring costs on the Consolidated Statement of Operations.
Wheatland Plan
During fiscal year 2015, the Company made significant improvements at its Council Avenue manufacturing facility in Wheatland, Pennsylvania, including adding new equipment, realigning the manufacturing footprint and automating many processes in the facility. This project, which was primarily completed by the end of fiscal year 2016, created a safer, cleaner workplace, eliminated production bottlenecks, reduced work in process inventory levels, enhanced production efficiencies, improved product quality and improved customer service. In connection with this project, the facility’s headcount was reduced over time. In June 2015, the Company announced the closure of its Mill Street manufacturing facility in Sharon, Pennsylvania, with all hourly and salaried employees at the facility laid off during the fourth quarter of fiscal year 2015. The Company was able to lower costs and improve profitability by moving certain manufacturing processes previously performed at the Mill Street facility to the newly updated and expanded Council Avenue facility. The costs associated with the activities at both the Council Avenue and Mill Street facilities are included as part of the “Wheatland Plan.” As part of the Wheatland Plan, the Company has incurred certain costs including severance, special pension and other postretirement defined benefit plan costs and fixed asset impairment charges.
| F-62 |
Table of Contents
Confidential Treatment Requested Pursuant to 17 C.F.R. Section 200.83
A summary of the exit cost activities included in the Wheatland Plan is as follows (in thousands):
| Severance & Other Benefits | Special Defined Benefit Costs | Fixed Asset Impairment Charges | Other | Total | ||||||||||||||||
Total estimated exit costs | $ | 5,237 | $ | 345 | $ | 3,261 | $ | 2,109 | $ | 10,952 | ||||||||||
|
|
|
|
|
|
|
|
|
| |||||||||||
Incurred during Q1 2018 | — | — | — | 13 | 13 | |||||||||||||||
Incurred during Q4 2017 | — | — | — | 50 | 50 | |||||||||||||||
Incurred during Q3 2017 | — | — | — | 234 | 234 | |||||||||||||||
Incurred during Q2 2017 | — | — | — | 225 | 225 | |||||||||||||||
Incurred during Q1 2017 | — | — | — | 406 | 406 | |||||||||||||||
Incurred during fiscal year 2016 | 790 | 345 | — | 835 | 1,970 | |||||||||||||||
Incurred during fiscal year 2015 | 4,447 | — | 3,261 | 246 | 7,954 | |||||||||||||||
|
|
|
|
|
|
|
|
|
| |||||||||||
Remainder to be incurred | $ | — | $ | — | $ | — | $ | 100 | $ | 100 | ||||||||||
|
|
|
|
|
|
|
|
|
| |||||||||||
As of March 31, 2018 and September 30, 2017, less than $0.1 million of severance and other benefit costs related to the Wheatland Plan are included in other accrued liabilities on the Consolidated Balance Sheets.
10. Long-Term Debt
The Company’s long-term debt consists of the following (in thousands):
| March 31, 2018 | September 30, 2017 | |||||||
Senior secured term loan facility | $ | 909,365 | $ | 913,969 | ||||
Discount on senior secured term loan facility | (5,314 | ) | (6,144 | ) | ||||
Deferred financing costs on senior secured term loan facility | (3,621 | ) | (4,186 | ) | ||||
Senior secured revolving credit facility | 45,000 | 25,000 | ||||||
Senior secured notes | 375,000 | 375,000 | ||||||
Deferred financing costs on senior secured notes | (4,935 | ) | (5,410 | ) | ||||
Other debt | 379 | 1,109 | ||||||
|
|
|
| |||||
Total | 1,315,874 | 1,299,338 | ||||||
Less current portion | (9,588 | ) | (10,318 | ) | ||||
|
|
|
| |||||
Total long-term debt | $ | 1,306,286 | $ | 1,289,020 | ||||
|
|
|
| |||||
Certain tangible and financial assets of the Company and its restricted subsidiaries serve as collateral against the senior secured term loan and revolving credit facilities and senior secured notes. The revolving credit facility lenders have a first priority lien on the Company’s accounts receivable and inventories and a second priority lien on the Company’s fixed assets. The term loan facility lenders have a first priority lien on the Company’s fixed assets and a second priority lien on the Company’s accounts receivable and inventories. The holders of the Company’s senior secured notes have a third priority lien on the Company’s accounts receivable, inventories and fixed assets. The Company’s subsidiaries Atlas Tube (Arkansas) Inc., which owns the Atlas facility in Blytheville, Arkansas, Lakeside Steel Alabama Inc., which owns the EnergeX facilities in Thomasville, Alabama, Lakeside Steel Texas Inc., Lakeside Steel USA Inc. and Lakeside Steel Holding USA Inc. are designated as unrestricted subsidiaries, excluding their assets as collateral under the Company’s senior secured term loan and revolving credit facilities and senior secured notes.
| F-63 |
Table of Contents
Confidential Treatment Requested Pursuant to 17 C.F.R. Section 200.83
Senior Secured Term Loan Facility
In March 2011, the Company entered into a $400.0 million Term Loan and Guaranty Agreement (the “Term Loan Agreement”) and a Senior Secured Term Loan Credit Facility (the “Term Loan Facility”). The Term Loan Facility had a six year term which was set to expire on April 1, 2017. Borrowings under the Term Loan Facility bore interest on a per annum basis equal to LIBOR (subject to a 150 basis point LIBOR floor) plus 325 basis points for Eurodollar Rate loans or the Prime Rate plus 225 basis points for Base Rate loans.
In February 2012, the Company exercised its option under the term loan facility to increase the total amount of borrowings under this facility from $400.0 million to $500.0 million. All terms, conditions and covenants of the Term Loan Facility, including the rate at which borrowings bore interest, were applicable to the additional $100.0 million borrowed against the facility in February 2012. The additional $100.0 million in term loans was borrowed at a price of 99.5, resulting in a $0.5 million discount that was being amortized through the April 1, 2017 maturity date.
In connection with the completion of its debt refinancing in June 2016, the Company amended and restated its Term Loan Facility to, among other things i) incur $396.4 million of additional indebtedness under the Term Loan Agreement, for an aggregate principal amount of $825.0 million outstanding under the Term Loan Facility and ii) extend the maturity of the Term Loan Facility for five years. The aggregate $825.0 million in term loans was borrowed at a price of 99.0, resulting in an $8.3 million discount that will be amortized through the June 14, 2021 maturity date. Amortization of the discount is recorded in interest expense, net on the Consolidated Statements of Operations. Borrowings under the Amended and Restated Term Loan Facility bore interest on a per annum basis equal to LIBOR (subject to a 100 basis point LIBOR floor) plus 500 basis points for Eurodollar Rate loans or the Prime Rate plus 400 basis points for Base Rate loans.
In February 2017, the Company further amended its Term Loan Facility in order to borrow an additional $100.0 million and reduce the interest rates applicable to all borrowings outstanding under the facility, such that term loan borrowings bore interest on a per annum basis equal to LIBOR (subject to a 100 basis point LIBOR floor) plus 375 basis points for Eurodollar Rate loans or the Prime Rate plus 275 basis points for Base Rate loans.
In August 2017, the Company amended its Term Loan Facility in order to further reduce the interest rates applicable to all borrowings outstanding under the facility, such that term loan borrowings now bear interest on a per annum basis equal to LIBOR (subject to a 100 basis point LIBOR floor) plus 275 basis points for Eurodollar Rate loans or the Prime Rate plus 175 basis points for Base Rate loans.
In May 2018, the Company amended its Term Loan Facility again in order to reduce the interest rates applicable to all borrowings outstanding under the facility, such that term loan borrowings now bear interest on a per annum basis equal to LIBOR (no longer subject to a LIBOR floor) plus 225 basis points for Eurodollar Rate loans or the Prime Rate plus 125 basis points for Base Rate loans.
For each of the amendments described above since the June 2016 refinancing, all other terms, conditions and covenants of the Amended and Restated Term Loan Facility, including the maturity date, remained the same.
Under the Amended and Restated Term Loan Facility, the Company is required to make quarterly principal payments of approximately $2.3 million. A final payment of the outstanding principal balance is due upon the expiration of the Term Loan Facility on June 14, 2021. The Term Loan Agreement allows for prepayment at any time, in whole or in part, together with accrued interest, without premium or penalty after six months (which reset following the May 2018 amendment) and requires the Company to make mandatory prepayments under certain circumstances, including the generation of “excess cash flow” during any given fiscal year.
| F-64 |
Table of Contents
Confidential Treatment Requested Pursuant to 17 C.F.R. Section 200.83
The annual excess cash flow calculation is prescribed by the Term Loan Agreement and takes into account the Company’s cash-based earnings, capital and other expenditures and changes in working capital during the period. Based on the excess cash flow calculation for fiscal year 2017, the Company was not required to make a mandatory prepayment. No excess cash flow calculation was required for fiscal year 2016 due to the June 2016 refinancing.
As of March 31, 2018, the Company had $909.4 million outstanding under the Term Loan Facility at an interest rate of 5.0%.
Senior Secured Revolving Credit Facility
In March 2011, the Company entered into a $400.0 million Senior Secured Revolving Credit Facility (the “Revolving Credit Facility”). The Revolving Credit Facility had a five year term which was set to expire on March 11, 2016. Borrowings under the Revolving Credit Facility generally bore interest on a per annum basis equal to LIBOR plus anon-default variable spread ranging from 200 basis points to 250 basis points.
In November 2014, the Company amended and restated its Revolving Credit Facility. The amended and restated facility provided for an extension of the same $400.0 million revolving credit limit through November 12, 2019. Borrowings under the Amended and Restated Revolving Credit Facility bear interest on a per annum basis equal to either i) LIBOR plus anon-default variable spread ranging from 175 basis points to 225 basis points or ii) the prime rate plus anon-default variable spread ranging from 75 basis points to 125 basis points. The variable spreads are dependent upon the Company’s average excess availability at the time of the borrowing. The Company is also required to pay an annual commitment fee ranging from 25 basis points to 37.5 basis points depending on the amount drawn.
In connection with its debt refinancing, in May 2016 the Company entered into another amendment to its Revolving Credit Facility to i) permit the Company to issue new Senior Secured Notes, ii) permit the Company to incur incremental term loans and iii) reduce the aggregate commitments under the Revolving Credit Facility to $350.0 million. The expiration date of the Amended and Restated Revolving Credit Facility and other significant terms remain unchanged. This amendment became operative upon the closing of the refinancing of the Company’s other outstanding debt in June 2016.
The total amount of loans and advances outstanding at any time under the Amended and Restated Revolving Credit Facility may not exceed the lesser of the then-current borrowing base or the revolving limit of $350.0 million. The borrowing base is determined by the Company’s eligible inventory and accounts receivable balances and is comprised of U.S. and Canadian components.
During the first half of fiscal year 2018, the Company borrowed $178.0 million and repaid $158.0 million under the facility resulting in an outstanding balance of $45.0 million as of March 31, 2018. As of March 31, 2018, the Company had $275.9 million of availability under the Amended and Restated Revolving Credit Facility. During the first half of fiscal year 2017, the Company borrowed $162.0 million and repaid $77.0 million under the facility.
Senior Secured Notes
In connection with the completion of its debt refinancing in June 2016, the Company issued $375.0 million of 9.875% Senior Secured Notes (the “Senior Secured Notes”) that will mature on June 15, 2023. Interest on the Senior Secured Notes is paid every six months in arrears on June 15th and December 15th.
| F-65 |
Table of Contents
Confidential Treatment Requested Pursuant to 17 C.F.R. Section 200.83
The Company may redeem some or all of the Senior Secured Notes at the redemption prices set forth in the offering memorandum, plus accrued and unpaid interest, if any, to the redemption date. Upon the occurrence of certain events constituting a change of control, the Company may be required to make an offer to repurchase the Senior Secured Notes at a redemption price equal to 101% of their principal amount, plus accrued and unpaid interest, if any, to the date of purchase.
As of March 31, 2018, the Company had $375.0 million of Senior Secured Notes outstanding at a fixed interest rate of 9.875%.
Debt Covenants
Under certain circumstances, the Company is required to maintain certain financial ratios as well as certain affirmative and negative covenants under its debt arrangements. For example, the Revolving Credit Facility establishes a minimum fixed charge coverage ratio of 1.0 to 1.0 if the Company’s excess availability is less than the greater of $40.0 million or 12.5% of the borrowing base.
In addition, the Company’s debt arrangements limit its ability to incur additional indebtedness, incur liens, pay dividends or make certain other restricted payments and enter into certain transactions with affiliates; and places restrictions on the Company’s ability to merge or consolidate with any other person or sell, assign, transfer, convey or otherwise dispose of all or substantially all of its assets.
The Company believes it is in compliance with all debt covenants as of March 31, 2018.
Deferred Financing and Debt Modification Costs
When appropriate, the Company capitalizes certain costs incurred in connection with the issuance of new debt, including origination, printing, legal, accounting and filing costs, and amortizes such costs over the term of the debt agreement. Deferred financing costs related to the Company’s Revolving Credit Facility are included in noncurrent assets on the Consolidated Balance Sheets, while all other deferred financing costs reduce the carrying amount of long-term debt.
In connection with the amendment of its Term Loan Facility in February 2017, the Company incurred costs of $1.6 million. This amount was expensed immediately and reflected as debt modification costs in the Consolidated Statement of Operations because all outstanding and new term debt was deemed to be modified as opposed to extinguished.
11. Income Taxes
Income tax expense includes federal, state, local and foreign income taxes, and is based onpre-tax earnings. Income tax expense is recorded on an interim basis based upon the Company’s estimate of the annual effective rate, adjusted each quarter for discrete items. In determining the estimated annual effective income tax rate, the Company analyzes various factors, including projections of the Company’s annual earnings and taxing jurisdictions in which the earnings will be generated, the impact of state and local income taxes, the Company’s ability to use tax credits and net operating loss carryforwards and available tax planning alternatives. The Company also regularly assesses the likelihood of tax deficiencies in each of its jurisdictions resulting from ongoing and subsequent years’ examinations by taxing authorities. Changes to the Company’s accruals for uncertain tax positions, including interest and penalties, as applicable, are included in current period income tax expense.
For the second quarter of fiscal years 2018 and 2017, the effective income tax rates were 25.9% and 17.4%, respectively. For the first half of fiscal years 2018 and 2017, the effective income tax rates were 17.4% and 17.2%, respectively. The effective tax rates in 2017 were significantly impacted by the
| F-66 |
Table of Contents
Confidential Treatment Requested Pursuant to 17 C.F.R. Section 200.83
expected mix of full fiscal year earnings between the Company’s U.S. and Canadian jurisdictions and the corresponding tax rate differential.
The Company’s first half results for fiscal year 2018 were significantly impacted by the enactment of the Tax Cuts and Jobs Act in the United States (“Tax Reform”), which was signed into law on December 22, 2017. The new law reduces the federal statutory income tax rate from 35.0% to 21.0%, effective January 1, 2018. As a result of this change, for its first half of fiscal year 2018 interim tax calculations, the Company applied a blended federal statutory income tax rate of 24.5%. In addition, the Company reduced its net U.S. deferred tax liability on its Consolidated Balance Sheet by $21.3 million to reflect the new lower income tax rates. The income tax benefits recognized from these items in the first half of fiscal year 2018 were partially offset by the recording of a $12.0 million mandatory repatriation tax liability. The mandatory repatriation tax liability is required by the Tax Reform related to the expectedone-time income tax payment computed based on undistributed earnings of the Company’s foreign operations, and the associated net cash position and foreign taxes incurred by such operations. As the full year results of fiscal year 2018 are not yet known, the Company’s adjustment to deferred taxes and its mandatory repatriation tax liability amount are based on certain assumptions and the best available information, but are considered provisional as of March 31, 2018. The Company will refine these provisional adjustments and amounts in subsequent quarters of fiscal year 2018 based on its actual financial results and as more tax information becomes available.
The Company is still in process of evaluating the income tax effect of certain provisions included in the Tax Reform. The final impact of the Tax Reform may differ from current estimates due to the issuance of additional interpretive guidance, changes in assumptions made by the Company and actions the Company may take as a result of the Tax Reform.
The Company is subject to examination by the Internal Revenue Service (“IRS”), by various states in which the Company has significant business operations and by the Canada Revenue Agency (“CRA”). As of March 31, 2018, the Company’s U.S. federal tax returns are open to IRS examination for fiscal years 2014 through 2016. With limited exceptions, the Company is also open to various state and local income tax examinations for fiscal years 2008 through 2016. In addition to the ongoing audits noted below, as of March 31, 2018 the Company’s Canadian federal tax returns are open to CRA examination for fiscal years 2015 through 2017.
During fiscal year 2013, the CRA’s International Audit section commenced an audit of the Company’s fiscal years 2009 through 2011. During fiscal year 2014, the CRA commenced a full scope audit of the Company’s fiscal years 2011 and 2012. Certain parts of their full scope audit were completed during fiscal years 2016 and 2017, while other aspects are ongoing. As part of this ongoing process, in April 2018 the Company received a letter from the CRA outlining certain proposed adjustments increase to the Company’s 2012 fiscal year tax by approximately $12.0 million, related primarily to the Lakeside acquisition. The Company disagrees with the CRA’s position, is currently preparing its response to the CRA and continues to believe that it has taken reasonable and supportable tax positions with regards to these matters. However, should the likelihood increase that the CRA prevails in defending its position it is reasonably possible that the Company will need to adjust its accruals for uncertain tax positions in the second half of fiscal year 2018 related to these proposed adjustments including penalties and interest, if any. Because of the complexity of the matter, including the potential involvement of Canadian and U.S. Competent Authorities, it is not possible for the Company to estimate the potential impact at this time. In fiscal year 2017, the CRA commenced a full scope audit of the Company’s fiscal years 2013 and 2014.
12. Retirement Benefit Plans
The Company has defined benefit pension plans and other defined benefit postretirement plans which provide benefits for eligible salaried and hourly employees.
| F-67 |
Table of Contents
Confidential Treatment Requested Pursuant to 17 C.F.R. Section 200.83
The net periodic benefit costs for the Company’s defined benefit pension and other postretirement plans for the second quarter and first half of fiscal year 2018 are based on actuarial calculations prepared during the period. Consistent with prior years, these calculations may be updated later in the fiscal year. The amounts recorded for the second quarter and first half of fiscal year 2018 represent the Company’s best estimates of the period’s proportionate share of the amounts to be recorded for the full fiscal year 2018.
The following tables set forth net periodic benefit costs for the Company’s defined benefit pension and other postretirement plans (in thousands):
| Pension | ||||||||||||||||
| 13 Weeks Ended | 26 Weeks Ended | |||||||||||||||
| March 31, 2018 | March 25, 2017 | March 31, 2018 | March 25, 2017 | |||||||||||||
Components of net periodic benefit cost: | ||||||||||||||||
Service cost | $ | 853 | $ | 906 | $ | 1,707 | $ | 1,813 | ||||||||
Interest cost | 2,641 | 2,705 | 5,281 | 5,410 | ||||||||||||
Expected return on plan assets | (2,908 | ) | (2,843 | ) | (5,816 | ) | (5,686 | ) | ||||||||
Amortization of: | ||||||||||||||||
Prior service cost | 6 | 6 | 12 | 12 | ||||||||||||
Actuarial loss | 397 | 1,033 | 794 | 2,066 | ||||||||||||
|
|
|
|
|
|
|
| |||||||||
Total net periodic benefit cost | $ | 989 | $ | 1,807 | $ | 1,978 | $ | 3,615 | ||||||||
|
|
|
|
|
|
|
| |||||||||
| Other Benefits | ||||||||||||||||
| 13 Weeks Ended | 26 Weeks Ended | |||||||||||||||
| March 31, 2018 | March 25, 2017 | March 31, 2018 | March 25, 2017 | |||||||||||||
Components of net periodic benefit cost: | ||||||||||||||||
Service cost | $ | 171 | $ | 159 | $ | 343 | $ | 318 | ||||||||
Interest cost | 659 | 606 | 1,318 | 1,212 | ||||||||||||
Amortization of: | ||||||||||||||||
Prior service cost | 12 | 25 | 23 | 50 | ||||||||||||
Actuarial gain | (29 | ) | (101 | ) | (57 | ) | (202 | ) | ||||||||
|
|
|
|
|
|
|
| |||||||||
Total net periodic benefit cost | $ | 813 | $ | 689 | $ | 1,627 | $ | 1,378 | ||||||||
|
|
|
|
|
|
|
| |||||||||
Additionally, the Company maintains defined contribution plans which allow eligible employees to contribute a percentage of their salary, a portion of which is matched by the Company. The Company recognized expense totaling $1.7 million and $1.3 million related to these plans during the second quarter of fiscal years 2018 and 2017, respectively. The Company recognized expense totaling $3.2 million and $2.7 million related to these plans during the first half of fiscal years 2018 and 2017, respectively.
13. Discontinued Operations
Since the acquisition of Lakeside in March 2012, the pipe and tube elements of the oil and gas industry have experienced a downturn in North America due to increased import activity leading to significant price pressure. The decline in global oil prices has also had a significant impact on the oil and gas industry, resulting in further decrease in demand for products of the Company’s energy tubular business.
The Company implemented several exit and restructuring plans beginning in fiscal year 2012 and continuing into fiscal year 2015, improving the performance of the EnergeX business and better positioning the Company to compete in the oil and gas industry. As part of these plans, the EnergeX
| F-68 |
Table of Contents
Confidential Treatment Requested Pursuant to 17 C.F.R. Section 200.83
manufacturing facilities in Welland, Ontario and Thomasville, Alabama were eventually indefinitely idled in May 2014 and March 2015, respectively. During the third and fourth quarters of fiscal year 2015, the oil country tubular goods (“OCTG”) market conditions continued to worsen throughout the United States and Canada as excess inventory levels for energy tubular products remained high, global oil prices declined even further and imports continued at record levels. As a result, in the fourth quarter of fiscal year 2015 management determined that the EnergeX asset group was impaired, and the Company recorded significant fixed asset and intangible asset impairment charges.
In the first quarter of fiscal year 2016, the Company’s Board of Directors formally approved a plan to sell the EnergeX business, which is comprised primarily of the two idled manufacturing facilities. Based on the applicable accounting guidance, management determined that the EnergeX business had met all criteria to be classified as “held for sale” and that the decision to sell the business represented a strategic shift that will have a major effect on the Company. As a result, for all periods presented in the accompanying consolidated financial statements the EnergeX assets and liabilities are classified separately as “held for sale” and EnergeX’s operating results and cash flows are presented as discontinued operations. Prior to this classification and presentation, EnergeX was its own reportable segment.
In the fourth quarter of fiscal year 2017, the Company recorded additional impairment charges of $2.9 million related to the EnergeX asset group. Fixed assets at the Thomasville and Welland manufacturing facilities, including both real and personal property, were written down to $22.1 million.
As of March 31, 2018, the EnergeX business continues to meet the requirements for presentation as “held for sale” and discontinued operations. Management remains committed to selling the business and continues to actively market the business at a price that it feels is reasonable based on the current circumstances. As a leading manufacturer of industrial steel pipe and tube products, the Company has been regularly receiving inquiries and interest in the Energex business and the related assets. In addition, management, along with its legal and investment banking advisors, has been using its experience and knowledge in these markets to reach out to potential buyers and interested parties.
Market conditions in the oil and gas industry, and specifically related to OCTG, continue to affect the Company’s ability to sell the EnergeX business. Based on these changing market conditions, management has taken steps as needed to adjust its formal plan to sell EnergeX, including lowering the asking price for the business and changing the marketing strategy related to the divestiture process. Recent trends and positive trade developments have led to upward momentum in the oil and gas industry, including OCTG.
Based on this upward momentum in the market, as well as the changes the Company has made to its formal plan to sell the business, management continues to believe that a sale of the EnergeX business at a reasonable price is probable.
| F-69 |
Table of Contents
Confidential Treatment Requested Pursuant to 17 C.F.R. Section 200.83
Balance Sheet Information
The major components of EnergeX’s “held for sale” assets and liabilities are presented below. As of March 31, 2018 and September 30, 2017, all amounts are classified as current because the Company expects to sell the EnergeX business within the next year.
| March 31, 2018 | September 30, 2017 | |||||||
| (In Thousands) | ||||||||
Pension assets | $ | 2,184 | $ | 2,344 | ||||
Property, plant and equipment, net(1) | 21,964 | 22,252 | ||||||
Other | 854 | 1,132 | ||||||
|
|
|
| |||||
Current assets held for sale | $ | 25,002 | $ | 25,728 | ||||
|
|
|
| |||||
Accounts payable | $ | 121 | $ | 308 | ||||
Postretirement benefit obligations | 24,409 | 25,321 | ||||||
Other(2) | 424 | 1,028 | ||||||
|
|
|
| |||||
Current liabilities held for sale | $ | 24,954 | $ | 26,657 | ||||
|
|
|
| |||||
| (1) | Property, plant and equipment held for sale consist primarily of machinery and equipment. |
| (2) | Other liabilities as of March 31, 2017 and September 30, 2017 include $0.3 million and $0.8 million, respectively, related to EnergeX’s exit and restructuring plans. |
Statement of Operations Information
The major components of EnergeX’s (loss) income from discontinued operations, net of tax are presented below. The operating results of discontinued operations include revenues and expenses directly attributable to the EnergeX business. Accordingly, no interest expense or general corporate overhead costs have been allocated to discontinued operations.
| 13 Weeks Ended | 26 Weeks Ended | |||||||||||||||
| March 31, 2018 | March 25, 2017 | March 31, 2018 | March 25, 2017 | |||||||||||||
| (In Thousands) | ||||||||||||||||
Net sales | $ | — | $ | 641 | $ | — | $ | 3,273 | ||||||||
Cost of sales | 131 | 611 | 273 | 1,564 | ||||||||||||
|
|
|
|
|
|
|
| |||||||||
Gross (loss) profit | (131 | ) | 30 | (273 | ) | 1,709 | ||||||||||
Selling, general and administrative | (8 | ) | (69 | ) | (112 | ) | 223 | |||||||||
Exit and restructuring costs(1) | 486 | 348 | 803 | 1,133 | ||||||||||||
Other | (8 | ) | (13 | ) | (11 | ) | 15 | |||||||||
|
|
|
|
|
|
|
| |||||||||
(Loss) income before income taxes | (601 | ) | (236 | ) | (953 | ) | 338 | |||||||||
(Benefit) provision for income taxes | (150 | ) | 6 | (239 | ) | (17 | ) | |||||||||
|
|
|
|
|
|
|
| |||||||||
(Loss) income from discontinued operations, net of income taxes | $ | (451 | ) | $ | (242 | ) | $ | (714 | ) | $ | 355 | |||||
|
|
|
|
|
|
|
| |||||||||
| (1) | EnergeX’s exit and restructuring costs in both periods primarily reflect ongoing costs to maintain the idled manufacturing facilities and related production equipment. |
| F-70 |
Table of Contents
Confidential Treatment Requested Pursuant to 17 C.F.R. Section 200.83
14. Stockholders’ Equity
Exchangeable Shares in Subsidiary
The exchangeable shares issued by one of the Company’s subsidiaries are held by an entity controlled by Barry Zekelman (the Chief Executive Officer of the Company and the Chairman of the Board of Directors) and other members of the Zekelman family.
The holder of the exchangeable shares has the right to exchange those shares for an equal number of the Company’s common shares at any time, at the holder’s sole discretion and without the payment of any consideration. The holder of the exchangeable shares also has the right to receive dividends equal to the common stockholders when and if declared by the Board of Directors. The exchangeable shares, by themselves, do not have voting rights.
Special Voting Stock
The holder of the exchangeable shares also holds an equal number of the Company’s special voting shares. The special voting shares enable the holder to vote this stock as if it were an equivalent number of the Company’s common shares.
Non-Voting Common Stock
The holders of thenon-voting common stock have the right to receive dividends when and if declared by the Board of Directors. In recent years, the holders ofnon-voting common stock have not participated in any of the dividends declared by the Board of Directors.
Cash Dividends and Dividend Equivalents
During the first quarter of fiscal year 2018, the Board of Directors declared and paid $20.0 million of cash dividends to the Company’s common stockholders and the holder of the exchangeable shares. Additionally, the Company’s Second Amended and Restated Stock Option Plan (the “Second Restated Plan”) provides that in the event the Board of Directors declares cash dividends, stock option holders will be eligible to receive a cash dividend equivalent payment. As of the dividend declaration date, outstanding stock options qualified for $1.4 million of dividend equivalents. The entire dividend equivalent amount will be paid to holders of stock options that vest and, as such, the $1.4 million was recorded as an adjustment to retained earnings along with the cash dividends.
During the third quarter of fiscal year 2017, the Board of Directors declared and paid $20.0 million of cash dividends to the Company’s common stockholders and the holder of the exchangeable shares. As of the dividend declaration date, outstanding stock options qualified for $1.4 million of dividend equivalents.
For the periods presented herein dividends per share, for common stock and the exchangeable shares, was $136.34 for the first half of fiscal year 2018.
During the first half of fiscal years 2018 and 2017, $1.7 million and $1.1 million of dividend equivalents, respectively, were paid to stock option holders in accordance with the provisions of the Second Restated Plan. As of March 31, 2018, a total of $1.0 million in unpaid dividend equivalents was included in other accrued liabilities or other liabilities (depending on the expected timing of future payouts) on the Consolidated Balance Sheet.
Stock-Based Compensation
The Company measures the cost of all share-based compensation awards expected to vest based on the grant-date fair value of those awards and records that cost as compensation expense
| F-71 |
Table of Contents
Confidential Treatment Requested Pursuant to 17 C.F.R. Section 200.83
over the period during which the employee ornon-employee director is required to perform service in exchange for the award (generally over the vesting period of the award). Stock-based compensation expense is included in general and administrative expenses on the Consolidated Statements of Operations. Stock options granted under the Second Restated Plan expire ten years following the date the last option in each grant becomes exercisable. Through the end of fiscal year 2017, all stock options granted under the Second Restated Plan vest 50% based on service (“Time Vesting”) and 50% based on a cash flow performance measure (“Performance Vesting”). For the options granted in the first half of fiscal year 2018 (see below), 50% were immediately vested and 50% vest based on service (“Time Vesting”). Upon exercise of all options, new shares of the Company’snon-voting common stock would be issued.
The Company granted 2,138 stock options in October 2017 and 365 stock options in February 2018 under the Second Restated Plan. These options have an exercise price of $5,649 per share. These options have a weighted average grant date fair value of $2,439 per option. The grant date fair values were determined using a Black-Scholes option pricing model.
The following table summarizes the assumptions used to calculate the estimated fair value of stock options granted:
Risk free interest rate | 2.5% to 3.0% | |
Volatility | 45% | |
Expected life | 15.0 years | |
Dividend yield | 2.4% |
The risk-free interest rates are based on the U.S. Treasury rates in effect at the time of the grant. The Company’s computation of stock price volatility was based on a combination of historical and implied volatility rates of comparable companies over a period equal to the expected life of the options granted by the Company. The expected life assumption was estimated by management based on historical exercise trends and the contractual term of the options. The dividend yield rate was calculated by dividing the Company’s expected annual dividend by the estimated fair value per share on the grant date.
The Company utilized independent, third party valuation experts to assist in the estimation of the underlying business enterprise value (“BEV”) in order to calculate the fair value of stock options on their respective grant dates. The BEV estimate was based on the Company’s historical financial results, management’s projections of future operations and other comparable company and industry financial metrics. The per share fair value factored in a discount for the lack of marketability of the Company’s stock.
Total stock-based compensation expense was $3.8 million and $0.5 million for the first half of fiscal years 2018 and 2017, respectively.
In the first half of fiscal year 2018, the Company adopted Accounting Standards UpdateNo. 2016-09, Compensation—Stock Compensation (Topic 718): Improvements to Employee Share-Based Payment Accounting (“ASU2016-09”). ASU2016-09 simplifies the accounting for certain aspects of share-based payment transactions, including the treatment of excess income tax benefits in the statements of operations and cash flows. These changes have been applied by the Company prospectively, and prior periods have not been adjusted.
15. Earnings Per Share
The Company computes earnings (loss) per share using thetwo-class method, which is an earnings allocation approach that treats participating securities as having rights to earnings that otherwise would have been available to common stockholders ornon-voting common stockholders.
| F-72 |
Table of Contents
Confidential Treatment Requested Pursuant to 17 C.F.R. Section 200.83
The exchangeable shares issued by one of the Company’s subsidiaries are considered participating securities because the holders have dividend rights equal to the common stockholders. Outstanding stock options are also considered participating securities because of the holders’ eligibility to receive cash dividend equivalent payments.
Basic earnings (loss) per share is computed by dividing net income (loss) available to common stockholders andnon-voting common stockholders by the weighted average number of shares of common stock andnon-voting common stock outstanding during the period. Diluted earnings (loss) per share is computed by dividing net income (loss) available to common stockholders andnon-voting common stockholders, adjusted for the reallocation of earnings assuming all potentially dilutive shares had been issued, by the weighted-average number of common stock andnon-voting common stock outstanding during the period, adjusted to include the number of shares that would have been outstanding had all potentially dilutive shares been issued.
Common Stock
Reconciliations of net income to net income available to common stockholders, which is used as the numerator in the basic and diluted earnings (loss) per share calculations, is presented below:
| 13 Weeks Ended | 26 Weeks Ended | |||||||||||||||
| March 31, 2018 | March 25, 2017 | March 31, 2018 | March 25, 2017 | |||||||||||||
Net income | $ | 64,215 | $ | 55,571 | $ | 104,702 | $ | 72,103 | ||||||||
Dividends paid to the holder of exchangeable shares | — | — | (16,722 | ) | — | |||||||||||
Dividend equivalents declared | — | — | (1,411 | ) | — | |||||||||||
Allocation of undistributed income tonon-voting common stock and participating securities | (55,065 | ) | (47,559 | ) | (71,401 | ) | (61,713 | ) | ||||||||
|
|
|
|
|
|
|
| |||||||||
Net income available to common stockholders—basic | 9,150 | 8,012 | 15,168 | 10,390 | ||||||||||||
Reallocation of earnings assuming exchange of all exchangeable shares | 46,684 | 40,877 | 75,229 | 53,008 | ||||||||||||
|
|
|
|
|
|
|
| |||||||||
Net income available to common stockholders—diluted | $ | 55,834 | $ | 48,889 | $ | 90,397 | $ | 63,398 | ||||||||
|
|
|
|
|
|
|
| |||||||||
Components of net income available to common stockholders—basic: | ||||||||||||||||
Continuing operations | $ | 9,214 | $ | 8,047 | $ | 15,270 | $ | 10,339 | ||||||||
Discontinued operations | (64 | ) | (35 | ) | (102 | ) | 51 | |||||||||
|
|
|
|
|
|
|
| |||||||||
Net income available to common stockholders—basic | $ | 9,150 | $ | 8,012 | $ | 15,168 | $ | 10,390 | ||||||||
|
|
|
|
|
|
|
| |||||||||
Components of net income available to common stockholders—diluted: | ||||||||||||||||
Continuing operations | $ | 56,226 | $ | 49,102 | $ | 91,019 | $ | 63,086 | ||||||||
Discontinued operations | (392 | ) | (213 | ) | (622 | ) | 312 | |||||||||
|
|
|
|
|
|
|
| |||||||||
Net income available to common stockholders—diluted | $ | 55,834 | $ | 48,889 | $ | 90,397 | $ | 63,398 | ||||||||
|
|
|
|
|
|
|
| |||||||||
| F-73 |
Table of Contents
Confidential Treatment Requested Pursuant to 17 C.F.R. Section 200.83
Reconciliations of weighted average common shares outstanding, which is used as the denominator in the basic and diluted earnings (loss) per share calculations, is presented below:
| 13 Weeks Ended | 26 Weeks Ended | |||||||||||||||
| March 31, 2018 | March 25, 2017 | March 31, 2018 | March 25, 2017 | |||||||||||||
Weighted average common shares outstanding—basic | 24,040 | 24,040 | 24,040 | 24,040 | ||||||||||||
Effect of assumed exchange of all exchangeable shares | 122,652 | 122,652 | 122,652 | 122,652 | ||||||||||||
|
|
|
|
|
|
|
| |||||||||
Weighted average common shares outstanding—diluted | 146,692 | 146,692 | 146,692 | 146,692 | ||||||||||||
|
|
|
|
|
|
|
| |||||||||
Non-Voting Common Stock
Reconciliations of net income to net income available tonon-voting common stockholders, which is used as the numerator in the basic and diluted earnings (loss) per share calculations, is presented below:
| 13 Weeks Ended | 26 Weeks Ended | |||||||||||||||
| March 31, 2018 | March 25, 2017 | March 31, 2018 | March 25, 2017 | |||||||||||||
Net income | $ | 64,215 | $ | 55,571 | $ | 104,702 | $ | 72,103 | ||||||||
Dividends paid to holders of common stock and exchangeable shares | — | — | (20,000 | ) | — | |||||||||||
Dividend equivalents declared | — | — | (1,411 | ) | — | |||||||||||
Allocation of undistributed income to common stock and participating securities | (60,652 | ) | (52,452 | ) | (78,661 | ) | (68,057 | ) | ||||||||
|
|
|
|
|
|
|
| |||||||||
Net income available tonon-voting common stockholders—basic and diluted | $ | 3,563 | $ | 3,119 | $ | 4,630 | $ | 4,046 | ||||||||
|
|
|
|
|
|
|
| |||||||||
Components of net income available tonon-voting common stockholders—basic and diluted: | ||||||||||||||||
Continuing operations | $ | 3,588 | $ | 3,133 | $ | 4,670 | $ | 4,026 | ||||||||
Discontinued operations | (25 | ) | (14 | ) | (40 | ) | 20 | |||||||||
|
|
|
|
|
|
|
| |||||||||
Net income available tonon-voting common stockholders—basic and diluted | $ | 3,563 | $ | 3,119 | $ | 4,630 | $ | 4,046 | ||||||||
|
|
|
|
|
|
|
| |||||||||
16. Segment Reporting
The Company has three reportable segments which are organized on a product line basis, as follows:
| • | Atlas—structural tubing |
| • | Electrical, Fence and Mechanical (“EFM”)—electrical conduit, fittings and couplings, fence pipe and mechanical tubing |
| • | Pipe—standard pipe and fire sprinkler pipe |
The Company’s other product lines, as well as othernon-core activities, are not material enough to require separate disclosure and are included throughout the Company’s segment reporting as part of “All Other.” The Company’s unallocated corporate costs are also part of the “All Other.”
| F-74 |
Table of Contents
Confidential Treatment Requested Pursuant to 17 C.F.R. Section 200.83
The following tables summarize the Company’s segment reporting (in thousands):
| 13 Weeks Ended March 31, 2018 | 13 Weeks Ended March 25, 2017 | |||||||||||||||||||||||||||||||
| Net Sales from External Customers | Net Intersegment Sales | Total Net Segment Sales | Operating Income (Loss) | Net Sales from External Customers | Net Intersegment Sales | Total Net Segment Sales | Operating Income (Loss) | |||||||||||||||||||||||||
Atlas | $ | 319,831 | $ | 4,018 | $ | 323,849 | $ | 61,525 | $ | 244,465 | $ | 1,799 | $ | 246,264 | $ | 55,266 | ||||||||||||||||
EFM | 181,181 | — | 181,181 | 39,423 | 122,735 | — | 122,735 | 22,382 | ||||||||||||||||||||||||
Pipe | 106,888 | — | 106,888 | 17,340 | 92,718 | — | 92,718 | 16,167 | ||||||||||||||||||||||||
All Other | 54,945 | 41 | 54,986 | (6,355 | ) | 41,256 | 288 | 41,544 | (2,481 | ) | ||||||||||||||||||||||
|
|
|
|
|
|
|
|
|
|
|
|
|
|
|
| |||||||||||||||||
| 662,845 | 4,059 | 666,904 | 111,933 | 501,174 | 2,087 | 503,261 | 91,334 | |||||||||||||||||||||||||
Eliminations | — | (4,059 | ) | (4,059 | ) | — | — | (2,087 | ) | (2,087 | ) | — | ||||||||||||||||||||
Transaction costs | — | — | — | — | — | — | — | (731 | ) | |||||||||||||||||||||||
Exit and restructuring costs | — | — | — | (95 | ) | — | — | — | (966 | ) | ||||||||||||||||||||||
Other | — | — | — | 91 | — | — | — | — | ||||||||||||||||||||||||
|
|
|
|
|
|
|
|
|
|
|
|
|
|
|
| |||||||||||||||||
Consolidated total | $ | 662,845 | $ | — | $ | 662,845 | $ | 111,929 | $ | 501,174 | $ | — | $ | 501,174 | $ | 89,637 | ||||||||||||||||
|
|
|
|
|
|
|
|
|
|
|
|
|
|
|
| |||||||||||||||||
| 26 Weeks Ended March 31, 2018 | 26 Weeks Ended March 25, 2017 | |||||||||||||||||||||||||||||||
| Net Sales from External Customers | Net Intersegment Sales | Total Net Segment Sales | Operating Income (Loss) | Net Sales from External Customers | Net Intersegment Sales | Total Net Segment Sales | Operating Income (Loss) | |||||||||||||||||||||||||
Atlas | $ | 595,673 | $ | 6,955 | $ | 602,628 | $ | 101,709 | $ | 452,738 | $ | 4,492 | $ | 457,230 | $ | 82,323 | ||||||||||||||||
EFM | 313,904 | — | 313,904 | 60,387 | 217,160 | — | 217,160 | 38,987 | ||||||||||||||||||||||||
Pipe | 192,370 | — | 192,370 | 24,510 | 179,207 | — | 179,207 | 22,564 | ||||||||||||||||||||||||
All Other | 96,654 | 268 | 96,922 | (11,902 | ) | 67,570 | 419 | 67,989 | (6,880 | ) | ||||||||||||||||||||||
|
|
|
|
|
|
|
|
|
|
|
|
|
|
|
| |||||||||||||||||
| 1,198,601 | 7,223 | 1,205,824 | 174,704 | 916,675 | 4,911 | 921,586 | 136,994 | |||||||||||||||||||||||||
Eliminations | — | (7,223 | ) | (7,223 | ) | — | — | (4,911 | ) | (4,911 | ) | — | ||||||||||||||||||||
Transaction costs | — | — | — | — | — | — | — | (731 | ) | |||||||||||||||||||||||
Exit and restructuring costs | — | — | — | (108 | ) | — | — | — | (1,372 | ) | ||||||||||||||||||||||
Other | — | — | — | 91 | — | — | — | 49 | ||||||||||||||||||||||||
|
|
|
|
|
|
|
|
|
|
|
|
|
|
|
| |||||||||||||||||
Consolidated total | $ | 1,198,601 | $ | — | $ | 1,198,601 | $ | 174,687 | $ | 916,675 | $ | — | $ | 916,675 | $ | 134,940 | ||||||||||||||||
|
|
|
|
|
|
|
|
|
|
|
|
|
|
|
| |||||||||||||||||
17. Derivative Financial Instruments
The costs of the Company’s raw materials, primarily steel, are subject to changes in market price as they are influenced by commodity markets and supply and demand levels, among other factors. Management attempts to mitigate these risks through effective requirements planning and by working closely with key suppliers to obtain the best possible pricing and delivery terms. From time to time, the Company uses derivative instruments for risk management purposes only, and does not use them for trading or speculative purposes.
During fiscal years 2016 and 2015, the Company entered into a series of commodity swap contracts with a third party lending institution related to the price of zinc, which is used as a protective coating on some of the Company’s products. The Company entered into these contracts in order to fix
| F-75 |
Table of Contents
Confidential Treatment Requested Pursuant to 17 C.F.R. Section 200.83
the price of portions of its forecasted zinc purchases for specified periods of time and reduce the related cash flow variability.
These contracts were designated as cash flow hedges; as a result, unrealized gains and losses on these contracts were recorded to accumulated other comprehensive income (loss) until the underlying hedged items were recognized through operations. The ineffective portion of a contract’s change in fair value was immediately recognized through operations. As of March 31, 2018 and September 30, 2017, there were no commodity swaps outstanding. During the first half of fiscal year 2017, $0.3 million was reclassified from accumulated other comprehensive income (loss) to cost of sales on the Consolidated Statement of Operations. The Company also recognized an immaterial loss due to ineffectiveness of its commodity swap contracts during the first half of fiscal year 2017.
18. Commitments and Contingencies
The Company maintains a reserve for undiscounted, estimated environmental obligations. Uncertainties associated with environmental remediation contingencies are pervasive and often result in wide ranges of outcomes. Estimates developed in the early stages of remediation can vary significantly. A finite estimate of costs does not normally become fixed and determinable at a specific time. Rather, the costs associated with environmental remediation become estimable over a continuum of events and activities that help to frame and define a liability, and the Company continually updates its cost estimates. The Company has an ongoing monitoring and identification process to assess how the activities, with respect to the known exposures, are progressing against the accrued cost estimates, as well as to identify other potential remediation issues.
Estimates of the amount and timing of future costs of environmental remediation requirements are, by their nature, imprecise because of the continuing evolution of environmental laws and regulatory requirements, the availability and application of technology, the identification of presently unknown remediation sites and the allocation of costs among the potentially responsible parties. The Company estimates the exposure for its environmental loss contingencies to range from $0.2 million to $5.2 million, and has accrued $0.4 million as its best estimate of the probable environmental obligation as of March 31, 2018. This reserve is included in other liabilities on the Consolidated Balance Sheet. Based upon information presently available, such future costs are not expected to have a material adverse effect on the Company’s financial condition, results of operations or cash flows. However, such costs could be material to the Company’s results of operations in any particular future quarter or year.
| F-76 |
Table of Contents
Confidential Treatment Requested Pursuant to 17 C.F.R. Section 200.83
19. Accumulated Other Comprehensive Income (Loss)
The following table summarizes the changes in each component of accumulated other comprehensive income (loss), net of tax (in thousands):
| Foreign Currency Translation | Defined Benefit Postretirement Plans | Affected line item in the Consolidated Statement of Operations | Total | |||||||||||||
Balance as of September 30, 2017 | $ | (3,695 | ) | $ | (32,010 | ) | $ | (35,705 | ) | |||||||
|
|
|
|
|
|
|
| |||||||||
Other comprehensive income before reclassifications | 382 | — | 382 | |||||||||||||
Amounts reclassified from accumulated other comprehensive income (loss): | ||||||||||||||||
Amortization of actuarial gains | — | 216 | (1) | (3 | ) | 216 | ||||||||||
Amortization of prior service cost | — | 23 | (2) | (3 | ) | 23 | ||||||||||
|
|
|
|
|
|
|
| |||||||||
Net current-period other comprehensive income | 382 | 239 | 621 | |||||||||||||
|
|
|
|
|
|
|
| |||||||||
Balance as of March 31, 2018 | $ | (3,313 | ) | $ | (31,771 | ) | $ | (35,084 | ) | |||||||
|
|
|
|
|
|
|
| |||||||||
| (1) | Net of income tax expense of $152. |
| (2) | Net of income tax expense of $11. |
| (3) | Components are included in the computation of net periodic benefit cost (see Note 12 for details). |
20. Related-Party Receivables
As of March 31, 2018 and September 30, 2017, the Company had related party receivables for cash advances outstanding from an entity controlled by Barry Zekelman of $3.0 million and $5.3 million, respectively. These amounts are included in other receivables on the Consolidated Balance Sheets.
| F-77 |
Table of Contents
Confidential Treatment Requested Pursuant to 17 C.F.R. Section 200.83
Shares

Class A Subordinate Voting Stock
Prospectus
Goldman Sachs & Co. LLC
BofA Merrill Lynch
BMO Capital Markets
Credit Suisse
GMP Securities
KeyBanc Capital Markets
PNC Capital Markets LLC
Stifel
BTIG
William Blair
, 2018
Table of Contents
Confidential Treatment Requested Pursuant to 17 C.F.R. Section 200.83
PART II
INFORMATION NOT REQUIRED IN PROSPECTUS
Item 13. Other Expenses of Issuance and Distribution.
The following table sets forth all expenses to be paid by us, other than underwriting discounts and commissions, upon completion of this offering. All amounts shown are estimates except for the SEC registration fee, the FINRA filing fee and the exchange listing fee.
| Amount to be paid | ||||
SEC registration fee | $ | * | ||
FINRA filing fee | * | |||
Exchange listing fee | * | |||
Printing and engraving expenses | * | |||
Legal fees and expenses | * | |||
Accounting fees and expenses | * | |||
Transfer agent and registrar fees | * | |||
Miscellaneous | * | |||
|
| |||
Total | $ | * | ||
|
| |||
| * | To be filed by amendment. |
Item 14. Indemnification of Directors and Officers.
Section 145 of the Delaware General Corporation Law authorizes a corporation’s board of directors to grant, and authorizes a court to award, indemnity to officers, directors, and other corporate agents.
Our amended and restated certificate of incorporation will contain provisions that limit the liability of our directors for monetary damages to the fullest extent permitted by Delaware law. Consequently, our directors will not be personally liable to us or our stockholders for monetary damages for any breach of fiduciary duties as directors, except liability for the following:
| • | any breach of their duty of loyalty to our company or our stockholders; |
| • | any act or omission not in good faith or that involves intentional misconduct or a knowing violation of law; |
| • | unlawful payments of dividends or unlawful stock repurchases or redemptions as provided in Section 174 of the Delaware General Corporation Law; or |
| • | any transaction from which they derived an improper personal benefit. |
Any amendment to, or repeal of, these provisions will not eliminate or reduce the effect of these provisions in respect of any act, omission, or claim that occurred or arose prior to that amendment or repeal. If the Delaware General Corporation Law is amended to provide for further limitations on the personal liability of directors of corporations, then the personal liability of our directors will be further limited to the greatest extent permitted by the Delaware General Corporation Law.
In addition, we expect to adopt amended and restated bylaws, which will become effective immediately prior to the completion of this offering, and which will provide that we will indemnify, to the fullest extent permitted by law, any person who is or was a party or is threatened to be made a party to
| II-1 |
Table of Contents
Confidential Treatment Requested Pursuant to 17 C.F.R. Section 200.83
any action, suit, or proceeding by reason of the fact that he or she is or was one of our directors or officers or is or was serving at our request as a director or officer of another corporation, partnership, joint venture, trust, or other enterprise. Our amended and restated bylaws are expected to provide that we may indemnify to the fullest extent permitted by law any person who is or was a party or is threatened to be made a party to any action, suit, or proceeding by reason of the fact that he or she is or was one of our employees or agents or is or was serving at our request as an employee or agent of another corporation, partnership, joint venture, trust, or other enterprise. Our amended and restated bylaws will also provide that we must advance expenses incurred by or on behalf of a director or officer in advance of the final disposition of any action or proceeding, subject to limited exceptions.
Further, we have entered into or will enter into indemnification agreements with each of our directors and executive officers that may be broader than the specific indemnification provisions contained in the Delaware General Corporation Law. These indemnification agreements require us, among other things, to indemnify our directors and executive officers against liabilities that may arise by reason of their status or service. These indemnification agreements also require us to advance all expenses incurred by the directors and executive officers in investigating or defending any such action, suit, or proceeding.
The limitation of liability and indemnification provisions that are expected to be included in our amended and restated certificate of incorporation, amended and restated bylaws, and in indemnification agreements that we have entered into or will enter into with our directors and executive officers may discourage stockholders from bringing a lawsuit against our directors and executive officers for breach of their fiduciary duties. They may also reduce the likelihood of derivative litigation against our directors and executive officers, even though an action, if successful, might benefit us and other stockholders. Further, a stockholder’s investment may be adversely affected to the extent that we pay the costs of settlement and damage awards against directors and executive officers as required by these indemnification provisions.
We have obtained insurance policies under which, subject to the limitations of the policies, coverage is provided to our directors and executive officers against loss arising from claims made by reason of breach of fiduciary duty or other wrongful acts as a director or executive officer, including claims relating to public securities matters, and to us with respect to payments that may be made by us to these directors and executive officers pursuant to our indemnification obligations or otherwise as a matter of law.
The underwriting agreement filed as Exhibit 1.1 to this registration statement will provide for indemnification by the underwriters of us and our officers and directors for certain liabilities arising under the Securities Act or otherwise.
Item 15. Recent Sales of Unregistered Securities.
Option Grants
Zekelman Industries has granted the following options to purchase shares of Class A subordinate voting stock in the past three years pursuant to its Second Amended and Restated Option Plan: in fiscal year 2018, options were granted with a weighted average exercise price of $ ; and in fiscal year 2015, options were granted with a weighted average exercise price of $ . Option amounts, the shares for which they are exercisable and exercise prices have been adjusted to reflect the Reorganization. The options were issued in reliance on Section 4(a)(2) and/or Rule 701 under the Securities Act.
9.875% Senior Secured Notes due 2023
In June 2016, Zekelman Industries sold $375,000,000 aggregate principal amount of its 9.875% Senior Secured Notes due 2023 (the “Notes”) to Goldman Sachs & Co. LLC (formerly Goldman,
| II-2 |
Table of Contents
Confidential Treatment Requested Pursuant to 17 C.F.R. Section 200.83
Sachs & Co.) and J.P. Morgan Securities LLC, as initial purchasers (the “Initial Purchaser”), in reliance on Section 4(a)(2) under the Securities Act. The Notes were resold by the Initial Purchasers to qualified institutional buyers in reliance on Rule 144A and/ornon-U.S. persons in offshore transactions in reliance on Regulation S. The Initial Purchasers received customary discounts in connection with the transaction.
Item 16. Exhibits and Financial Statement Schedules.
(a) Exhibits.
See the Exhibit Index immediately preceding the signature page hereto for a list of exhibits filed as part of this registration statement on FormS-1, which Exhibit Index is incorporated herein by reference.
(b) Financial statement schedules.
All financial statement schedules are omitted because the information called for is not required or is shown either in the consolidated financial statements or in the notes thereto.
Item 17. Undertakings.
The undersigned Registrant hereby undertakes to provide to the underwriters at the closing specified in the underwriting agreement certificates in such denominations and registered in such names as required by the underwriters to permit prompt delivery to each purchaser.
Insofar as indemnification for liabilities arising under the Securities Act of 1933 may be permitted to directors, officers, and controlling persons of the registrant pursuant to the foregoing provisions, or otherwise, the registrant has been advised that in the opinion of the Securities and Exchange Commission such indemnification is against public policy as expressed in the Act and is, therefore, unenforceable. In the event that a claim for indemnification against such liabilities (other than the payment by the registrant of expenses incurred or paid by a director, officer, or controlling person of the registrant in the successful defense of any action, suit, or proceeding) is asserted by such director, officer, or controlling person in connection with the securities being registered, the registrant will, unless in the opinion of its counsel the matter has been settled by controlling precedent, submit to a court of appropriate jurisdiction the question whether such indemnification by it is against public policy as expressed in the Act and will be governed by the final adjudication of such issue.
The undersigned Registrant hereby undertakes that:
| (1) | For purposes of determining any liability under the Securities Act of 1933, the information omitted from the form of prospectus filed as part of this registration statement in reliance upon Rule 430A and contained in a form of prospectus filed by the Registrant pursuant to Rule 424(b)(1) or (4) or 497(h) under the Securities Act shall be deemed to be part of this registration statement as of the time it was declared effective. |
| (2) | For the purpose of determining any liability under the Securities Act of 1933, each post-effective amendment that contains a form of prospectus shall be deemed to be a new registration statement relating to the securities offered therein, and the offering of such securities at that time shall be deemed to be the initial bona fide offering thereof. |
| II-3 |
Table of Contents
Confidential Treatment Requested Pursuant to 17 C.F.R. Section 200.83
EXHIBIT INDEX
Exhibit | Description | |
| 1.1* | Form of Underwriting Agreement. | |
| 3.1* | Form of Amended and Restated Certificate of Incorporation of the Registrant, to be in effect upon completion of this offering. | |
| 3.2* | Form of Amended and Restated Bylaws of the Registrant, to be in effect upon completion of this offering. | |
| 4.1* | Form of Class A Subordinate Voting Stock certificate of the Registrant. | |
| 4.2* | Form of Stockholders Agreement, to be in effect upon completion of this offering. | |
| 4.3* | Form of Registration Rights Agreement, to be in effect upon completion of this offering. | |
| 4.4* | Form of Exchangeable Shares Provisions of 6582125 Canada Inc., to be in effect upon completion of this offering. | |
| 4.5* | Form of Exchangeable Share Support Agreement, to be in effect upon completion of this offering. | |
| 4.6* | Indenture, dated June 14, 2016, among Zekelman Industries, Inc., the guarantors party thereto and Wilmington Trust, National Association, with respect to 9.875% Senior Secured Notes due 2023 (including form of note). | |
| 5.1* | Opinion of Baker & Hostetler LLP. | |
| 10.1+* | Form of Indemnification Agreement between the Registrant and each of its directors and executive officers. | |
| 10.2+* | 2018 Equity Incentive Plan. | |
| 10.3+* | Second Amended and Restated Stock Option Plan (and form of option agreement thereunder). | |
| 10.4+* | Amended Employment Agreement (Barry M. Zekelman). | |
| 10.5+* | Employment Agreement (Michael P. McNamara). | |
| 10.6+* | Employment Agreement (Michael E. Mechley). | |
| 10.7* | Amended and Restated Revolving Credit and Guaranty Agreement, dated November 13, 2014 (the “Revolving Credit Agreement”). | |
| 10.8* | Amendment No. 1 to the Revolving Credit Agreement, dated May 19, 2016. | |
| 10.9* | Amended and Restated Credit Agreement, dated June 14, 2016 (the “Term Loan Agreement”). | |
| 10.10* | First Amendment to the Term Loan Agreement, dated February 9, 2017. | |
| 10.11* | Second Amendment to the Term Loan Agreement, dated August 9, 2017. | |
| 10.12* | Third Amendment to the Term Loan Agreement, dated May 30, 2018. | |
| 21.1* | List of subsidiaries of the Registrant. | |
| 23.1* | Consent of Independent Registered Public Accounting Firm. | |
| 23.2* | Consent of Baker & Hostetler LLP (included in Exhibit 5.1). | |
| 24.1* | Power of Attorney (included on signature page). | |
| * | To be filed by amendment. |
| + | Indicates management contract or compensatory plan. |
| II-4 |
Table of Contents
Confidential Treatment Requested Pursuant to 17 C.F.R. Section 200.83
SIGNATURES
Pursuant to the requirements of the Securities Act of 1933, the Registrant has duly caused this registration statement on FormS-1 to be signed on its behalf by the undersigned, thereunto duly authorized, in Chicago, Illinois, on the day of , 2018.
| ZEKELMAN INDUSTRIES, INC. | ||
| By: | ||
| Barry M. Zekelman, Chief Executive Officer and Chairman | ||
POWER OF ATTORNEY
KNOW ALL PERSONS BY THESE PRESENTS, that each person whose signature appears below constitutes and appoints , and , and each one of them, as his or her true and lawfulattorneys-in-fact and agents, with lull power of substitution and resubstitution, for him or her and in their name, place and stead, in any and all capacities, to sign any and all amendments (including post-effective amendments) to this registration statement, and to sign any registration statement for the same offering covered by this registration statement that is to be effective on filing pursuant to Rule 462(b) under the Securities Act of 1933, as amended, and all post-effective amendments thereto, and to file the same, with all exhibits thereto and other documents in connection therewith, with the Securities and Exchange Commission, granting unto saidattorneys-in-fact and agents, and each of them, full power and authority to do and perform each and every act and thing requisite and necessary to be done in connection therewith, as fully to all intents and purposes as he or she might or could do in person, hereby ratifying and confirming all that saidattorneys-in-fact and agents or any of them, or his or her substitute or substitutes, may lawfully do or cause to be done by virtue hereof.
Pursuant to the requirements of the Securities Act of 1933, this registration statement on FormS-1 has been signed by the following persons in the capacities and on the dates indicated.
Signature | Title | Date | ||
Barry M. Zekelman | Chief Executive Officer and Chairman (Principal Executive Officer) | |||
Michael J. Graham | Executive Vice President and Chief Financial Officer (Principal Financial Officer and Principal Accounting Officer) | |||
Armand F. Lauzon, Jr. | Director | |||
David W. Seeger | Director | |||
Edward M. Siegel | Director | |||
Alan S. Zekelman | Director | |||
Clayton W. Zekelman | Director | |||