Exhibit 99.21

PYROGENESIS CANADA INC.
MANAGEMENT’S DISCUSSION AND ANALYSIS
This management’s discussion and analysis (“MD&A”) is intended to assist readers in understanding the business environment, strategies, performance and risk factors of PyroGenesis Canada Inc. (“PyroGenesis”, or the “Company”). The MD&A provides the reader with a view and analysis, from the perspective of management, of the Company’s financial results for the three months ended March 31, 2019. The MD&A has been prepared in accordance with National Instrument 51-102, Continuous Disclosure Requirements, and should be read in conjunction with the audited financial statements and related notes thereto of the Company for the year ended December 31, 2018.
The financial statements and MD&A have been reviewed by PyroGenesis’ Audit Committee and were approved by its Board of Directors on May 28, 2019. The Board of Directors is responsible for ensuring that the Company fulfills its responsibilities for financial reporting and is ultimately responsible for reviewing and approving the MD&A. The Board of Directors carries out this responsibility principally through its Audit Committee. The Audit Committee is appointed by the Board of Directors and is comprised of independent directors. The Audit Committee reports its findings to the Board of Directors for its consideration when it approves the MD&A and financial statements for issuance to shareholders.
The following information takes into account all material events that took place up until May 28, 2019, the date on which the Company’s Board of Directors approved this MD&A. Unless otherwise indicated, all amounts are presented in Canadian dollars. The Company’s functional and reporting currency is the Canadian dollar.
Additional information regarding PyroGenesis is available on SEDAR (www.sedar.com), OTC Markets (www.otcmarkets.com) and on the Company’s website at www.pyrogenesis.com.
FORWARD-LOOKING STATEMENTS
This MD&A contains forward-looking statements. All statements other than statements of historical fact contained in this MD&A are forward-looking statements, including, without limitation, the Company’s statements regarding its products and services; relations with suppliers and clients; future financial position; business strategies; potential acquisitions; potential business partnering; litigation; and plans and objectives. In certain cases, forward-looking statements can be identified by the use of words such as “plans”, “expects” or “does not expect”, “is expected”, “budget”, “scheduled”, “estimates”, “forecasts”, “intends”, “anticipates” or “does not anticipate”, or “believes”, or variations of such words and phrases or state that certain actions, events or results “may”, “could”, “would”, “might” or “will be taken”, “occur” or “be achieved” and similar words or the negative thereof. Although management of the Company believes that the expectations represented in such forward-looking statements are reasonable, there can be no assurance that such expectations will prove to be correct.
1 | P a g e
In particular, this MD&A contains forward-looking statements that relate, but are not limited, to:
| · | the Company’s business strategies, strategic objectives and growth strategy; |
| · | the Company’s current and future capital resources and the need for additional financing; |
| · | the Company’s ability to increase sales, including the results of the successful completion of the Company’s current projects; |
| · | management’s expectation that the Company will achieve sustained annual growth and profitability, and that gross margins will increase resulting in a decrease in cost of sales as a percentage of revenue; and |
| · | the Company’s overall financial performance. |
By their nature, forward-looking statements require assumptions and are subject to inherent risks and uncertainties including those discussed herein. In particular, forward-looking statements relating to future sales, growth and profitability are based on the assumption that current projects will be completed, and the Company will be awarded certain anticipated contracts pursuant to recent negotiations with, and statements made by, third parties. There is significant risk that predictions and other forward-looking statements will not prove to be accurate. Readers are cautioned to not place undue reliance on forward-looking statements made herein because a number of factors could cause actual future results, conditions, actions or events to differ materially from the targets, expectations, estimates or intentions expressed in the forward-looking statements.
The future outcomes that relate to forward-looking statements may be influenced by many factors, including, but not limited to, the strength of the Canadian, US and Asian economies; operational, funding, and liquidity risks; unforeseen engineering and environmental problems; delays or inability to obtain required financing and/or anticipated contracts; risks associated with licenses, permits and regulatory approvals; supply interruptions or labour disputes; foreign exchange fluctuations and collection risk; competition from other suppliers, or alternative, less capital intensive, energy solutions; and risk factors described elsewhere in this document under the heading “Risk Factors”. We caution that the foregoing list of factors is not exhaustive, and that, when relying on forward-looking statements to make decisions with respect to the Company, investors and others should carefully consider these factors, as well as other uncertainties and potential events, and the inherent uncertainty of forward-looking statements.
Although the Company has attempted to identify significant factors that could cause actions, events or results to differ materially from those described in forward-looking statements, there may be other factors that cause actions, events or results not to be as anticipated, estimated or intended. There can be no assurance that forward-looking statements will prove to be accurate, as actual results and future events could differ materially from those anticipated in such statements. Accordingly, readers should not place undue reliance on forward-looking statements. Forward-looking statements are provided as of the date of this MD&A, and the Company assumes no obligation to update or revise such forward-looking statements to reflect new events or circumstances except as required under applicable securities laws.
The forward-looking statements contained herein are expressly qualified in their entirety by this cautionary statement. The forward-looking statements included in this MD&A are made as of the date of this MD&A or such other date specified herein.
2 | P a g e
OVERVIEW
PyroGenesis Canada Inc. is a world leader in the design, development, manufacturing and commercialization of advanced plasma processes. The Company provides engineering and manufacturing expertise, cutting-edge contract research, as well as turnkey process equipment packages to the defense, metallurgical, mining, advanced materials (including 3D printing), oil & gas, and environmental industries. With a team of experienced engineers, scientists and technicians working from its Montreal office and its 3,800m2 production facility, PyroGenesis maintains its competitive advantage by remaining at the forefront of technology development and commercialization. PyroGenesis’ core competencies allow the Company to be a leader in providing innovative plasma torches, plasma waste processes, plasma atomisation processes, high-temperature metallurgical processes, and engineering services to the global marketplace. PyroGenesis’ operations are ISO 9001:2008 certified and have been ISO certified since 1997. PyroGenesis is a publicly-traded Canadian company on the TSX Venture Exchange (Ticker symbol: PYR.V) and on the OTCQB in the United States (Ticker symbol: PYRNF).
SELECTED FINANCIAL INFORMATION

Modified EBITDA (loss) is not a performance measure defined under IFRS and it is not considered an alternative to Income (Loss) from operations or Comprehensive Earnings (Loss) in the context of measuring a Company’s performance. Management believes that providing certain non-GAAP performance measures, in addition to IFRS measures, provides users of the Company’s financial statements with an enhanced understanding of their results and related trends, and as such increases transparency and clarity. Modified EBITDA (loss) is an important measure of operating performance because it allows management, investors and others to evaluate and compare the Company’s core operating results, including our return on capital and operating efficiencies, from period to period, by removing the impact of its capital structure (interest expense to service outstanding debt), asset base (depreciation and amortization), tax consequences, and other non-operating items not requiring cash outlays including share-based compensation and change in fair value of investment. Securities regulations require that companies caution readers that earnings and other measures adjusted to a basis other than IFRS do not have standardized meanings and are unlikely to be comparable to similar measures used by other companies. Accordingly, they should not be considered in isolation.
3 | P a g e
Extract from Statement of Financial Position at:

RESULTS OF OPERATIONS
Revenue
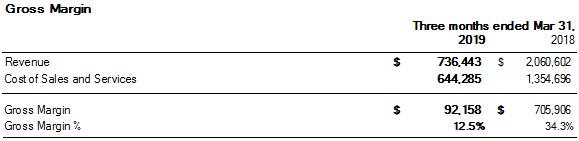
PyroGenesis recorded revenue of $736,443 in the first quarter of 2019 (“Q1, 2019”), representing a decrease of 64% compared with $2,060,602 recorded in the first quarter of 2018 (“Q1, 2018”).
Revenues recorded in the first quarter of 2019 were generated primarily from:
| (i) | PUREVAP™ related sales of $94,077 (2018 Q1 - $736,660) |
| (ii) | Torch related sales of $139,813 (2018 Q1 - $Nil) |
| (iii) | support services related to PAWDS-Marine systems supplied to the US Navy $210,667 (2018 Q1 - $527,444) |
Cost of Sales and Services and Gross Margin

4 | P a g e
Cost of sales and services before amortization of intangible assets is not a performance measure defined under IFRS and it is not considered an alternative to gross margin in the context of measuring the Company’s performance. Management believes that providing certain non-GAAP performance measures, in addition to IFRS measures, provides users of the Company’s financial statements with an enhanced understanding of its results and related trends, and increases transparency and clarity. Gross margin before amortization of intangible assets is an important measure of operating performance because it allows management, investors and others to evaluate and compare the Company’s core operating results, including its return on capital and operating efficiencies, from period to period, by removing the impact of non-operating items not requiring cash outlays. Securities regulations require that companies caution readers that earnings and other measures adjusted to a basis other than IFRS do not have standardized meanings and are unlikely to be comparable to similar measures used by other companies. Accordingly, they should not be considered in isolation or a substitute for financial measures prepared in accordance with IFRS.
Cost of sales and services before amortization of intangible assets was $639,506 in Q1 2019, representing a decrease of 53% compared with $1,354,696 in Q1 2018, primarily due to lower direct materials and manufacturing overhead as a result of lower revenues in Q1 2019.
In Q1 2019, employee compensation, subcontracting, direct materials and manufacturing overhead decreased to $662,379 (Q1 2018 - $1,420,628). The gross margin for Q1 2019 was $92,158 or 12.5% of revenue compared to a gross margin of $705,906 or 34.3% of revenue for Q1 2018. As a result of the type of contracts being executed, the nature of the project activity had a significant impact on the gross margin and the overall level of cost of sales and services reported in a period, as well as the composition of the cost of sales and services, as the mix between labour, materials and subcontracts may be significantly different.
Investment tax credits recorded against cost of sales are related to projects that qualify for tax credits from the provincial government of Quebec. Qualifying tax credits decreased to $36,071 in Q1 2019, compared with $88,397 in Q1 2018. This represents a decrease of 59% year-over-year. The decrease in Q1 2019 is primarily due to the Investment tax credits being recorded against the respective expenses in cost of goods sold, selling and general expenses and research and development expenses, versus all of the investment tax credits of Q1 2018 being recorded against cost of goods sold only, and the offset of a government grant related to our qualifying research and development costs. In total, the Company earned investment tax credits of $67,808 in Q1 2019.
The amortization of intangible assets of $4,779 in Q1 2019 and $Nil for Q1 2018 relates to patents and deferred development costs. Of note, these expenses are non-cash items and will be amortized over the duration of the patent lives.
5 | P a g e
Selling, General and Administrative Expenses
Included within Selling, General and Administrative expenses (“SG&A”) are costs associated with corporate administration, business development, project proposals, operations administration, investor relations and employee training.
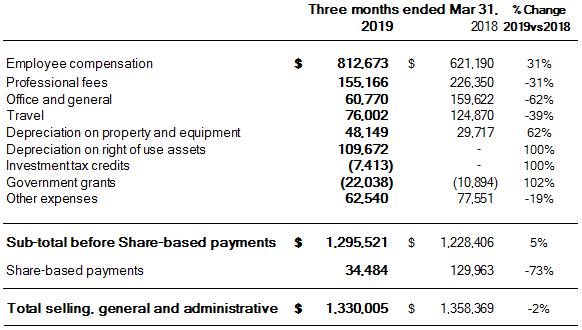
SG&A expenses for Q1 2019 excluding the costs associated with share-based compensation (a non-cash item in which options vest principally over a four-year period), were $1,295,521 representing an increase of 5% compared with $1,228,406 reported for Q1 2018.
The increase in SG&A expenses in Q1 2019 over the same period in 2018 is mainly attributable to the net effect of:
| i) | an increase of 31% in employee compensation due primarily to additional headcount, |
| ii) | a decrease of 31% for professional fees, primarily due to a decrease in legal fees and employee recruitment expenses, |
| iii) | a decrease of 62% in office and general expenses, is primarily due to the reclassification of rent expense to depreciation right of use assets, |
| iv) | travel costs decreased by 39%, due to a decrease in travel abroad, |
| v) | depreciation on property and equipment increased by 62% due to higher amounts of property and equipment being depreciated, |
| vi) | depreciation on right of use assets increased by 100% due to reclassification of rent expense to depreciation right of use assets, |
| vii) | Investment tax credits increased by 100% due to the investment tax credits being recorded against the respective expenses in cost of goods sold, selling and general expenses and research and development expenses versus all of the investment tax credits of Q1 2018 being recorded against cost of goods sold only, |
| viii) | government grants increased by 102% due to a government grant contribution for a maximum amount of $350,000 for the period 2018-2020, |
| ix) | other expenses decreased by 19%, primarily due to a decrease in advertising expenses and in the reclassification of lease property taxes to depreciation right of use assets. |
6 | P a g e
Separately, share based payments decreased by 73% in Q1 2019 over the same period in 2018 as a result of the vesting structure of the stock option plan including the stock options granted in 2018.
Research and Development (“R&D”) Costs
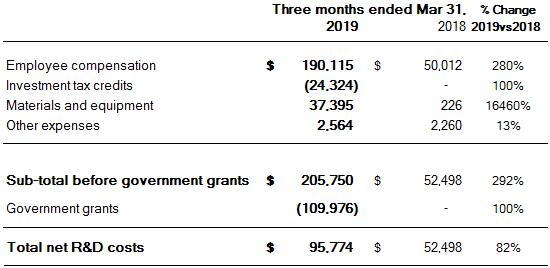
The Company incurred $95,774 of R&D costs, net of government grants, on internal projects in Q1 2019, an increase of 82% as compared with $52,498 in Q1 2018. The increase in Q1 2019 is related to torch development and plasma atomization related expenses.
In addition to internally funded R&D projects, the Company also incurred R&D expenditures during the execution of client funded projects. These expenses are eligible for Scientific Research and Experimental Development (“SR&ED”) tax credits. SR&ED tax credits on client funded projects are applied against cost of sales and services (see “Cost of Sales” above).
Net Finance Costs

Finance costs for Q1 2019 totaled $(454,698) as compared with $323,834 for Q1 2018, representing a decrease of 240% year-over-year. The decrease in finance costs in Q1 2019, is primarily attributable to the adjustment in fair value of investments in HPQ Silicon Resources Inc. and Beauce Gold Fields. The adjustment to the fair market value of investments for Q1 2019 resulted in a gain of $706,196 compared to a loss in the amount of $219,000 in Q1 2018.
7 | P a g e
Depreciation on Property and Equipment

The depreciation on property and equipment increased to $48,149 in Q1 2019, compared with $29,717 in Q1 2018. The 62% increase is due to higher amounts of property and equipment being depreciated.
Net comprehensive loss

The net comprehensive loss for Q1 2019 of $878,923 compared to a loss of $1,028,795, in Q1 2018, represents a decrease of 15% year-over-year. The decrease of $149,872 in the comprehensive loss in Q1 2019 is primarily attributable to the factors described above, which have been summarized as follows:
| (i) | a decrease in product and service-related revenue of $1,324,159 arising in Q1 2019, |
| (ii) | a decrease in cost of sales and services totaling $710,411, primarily due to a decrease in employee compensation, a decrease in subcontracting, a decrease in direct materials, decrease in manufacturing overhead, a decrease in investment tax credits, and an increase in amortization of intangible assets, |
| (iii) | a decrease in SG&A expenses of $28,364 arising in Q1 2019 primarily due to a decrease in professional fees, a decrease in travel, and a decrease in other expenses, |
| (iv) | an increase in R&D expenses of $43,276 primarily due to an increase in employee compensation, and materials & equipment, |
| (v) | a decrease in net finance costs of $778,532 in Q1 2019 primarily due to the fair value adjustment of investments. |
8 | P a g e
Reconciliation of Non-IFRS measures (EBITDA, Adjusted and Modified)

EBITDA is defined as Earnings (from operations) before Net Financing Charges, Taxes, Depreciation and Amortization, Adjusted EBITDA is defined as Earnings (from operations) before Net Financing Charges, Taxes, Depreciation, Amortization and other non-cash items including share-based payment costs, and Modified EBITDA is defined as Earnings (from operations) before Net Financing Charges, Taxes, Depreciation, Amortization and other non-cash items including share-based payment costs and change in fair value of investments.
EBITDA, Adjusted EBITDA and Modified EBITDA are not performance measures defined under IFRS and they are not considered an alternative to income or loss from operations, or to comprehensive earnings or loss, in the context of measuring a company’s performance. Management believes that providing certain non-GAAP performance measures, in addition to IFRS measures, provides users of the Company’s financial statements with an enhanced understanding of its results and related trends and increases transparency and clarity. Management believes that EBITDA, Adjusted EBITDA and Modified EBITDA are important measures of operating performance because it allows management, investors and others to evaluate and compare the Company’s operating results, including its return on capital and operating efficiencies, from period-to-period by removing the impact of the Company’s capital structure (interest expense to service outstanding debt), asset base (depreciation and amortization), tax consequences, and other non-operating items not requiring cash outlays including the adjustment to the fair value of investments and share-based compensation. Securities regulations require that companies caution readers that earnings and other measures adjusted to a basis other than IFRS do not have standardized meanings and are unlikely to be comparable to similar measures used by other companies. Accordingly, they should not be considered in isolation.
The EBITDA loss in Q1 2019 was $464,825 compared with an EBITDA loss of $894,244 for Q1 2018, representing a decrease of 48% year-over-year. The $429,419 decrease in the EBITDA loss in Q1 2019 compared with Q1 2018 is due to the decrease in comprehensive loss of $149,872, offset by an increase in depreciation on property and equipment of $18,432, an increase in depreciation of right of use assets of $109,672, an increase in amortization of intangible assets of $4,779 and an increase in finance charges of $146,664.
Adjusted EBITDA loss in Q1 2019 was $430,341 compared with an Adjusted EBITDA loss of $764,281 for Q1 2018. The decrease of $333,940 in the Adjusted EBITDA loss in Q1 2019 is attributable to a decrease in EBITDA loss of $429,419, offset by a decrease of $95,479 in share-based payments.
The Modified EBITDA loss in Q1 2019 was $1,136,537 compared with a Modified EBITDA loss of $545,281 for Q1 2018, representing an increase of 108%. The increase in the Modified EBITDA loss in Q1 2019 is attributable to the decrease as mentioned above in the Adjusted EBITDA of $333,940 and an increase in the change of fair value of investments of $925,196.
9 | P a g e
Summary of Quarterly Results

The majority of PyroGenesis’ revenue is recognised from long-term contracts over time and is dependent on the timing of project initiation and execution, including project engineering, manufacturing, and testing. In Q1 2019 the Company has adopted IFRS 15 dealing with revenue from contracts with customers.
LIQUIDITY AND CAPITAL RESOURCES
The following table summarizes the contractual maturities of financial liabilities as at March 31, 2019.
| Total¹ | 6 months or less | 6 to 12 months | 1- 3 years | Thereafter | ||||||||||||||||
| $ | $ | $ | $ | |||||||||||||||||
| Accounts payable and accrued liabilities | 2,452,917 | 2,452,917 | - | - | - | |||||||||||||||
| Lease liabilities | 5,643,199 | 252,768 | 263,417 | 3,993,569 | 1,133,445 | |||||||||||||||
| Term loans to the controlling shareholder | 317,125 | - | 317,125 | - | - | |||||||||||||||
| Convertible debentures | 3,570,000 | 142,500 | 142,500 | 3,285,000 | - | |||||||||||||||
| 11,983,241 | 2,848,185 | 723,042 | 7,278,569 | 1,133,445 | ||||||||||||||||
1 Including interest to be paid
The Company has incurred, in the last several years, operating losses and negative cash flows from operations, resulting in an accumulated deficit of $51,945,463 and a negative working capital of $8,648,282 as at Q1 2019, (December 31, 2018 - $51,066,540 and $4,101,428 respectively). Furthermore, as at Q1 2019, the Company’s current liabilities and expected level of expenses for the next twelve months exceed cash on hand of $141,850 (December 31, 2018 - $644,981). The Company has relied upon external financings to fund its operations in the past, primarily through the issuance of equity, debt, and convertible debentures, as well as from investment tax credits.
10 | P a g e
Revenue generated from active projects does not yet produce sufficient positive cash flow to fund operations. However, the Company has a strong backlog from signed contracts totaling $8.5 million, and a pipeline of prospective new projects resulting in the Company's business plan becoming less dependent on raising additional funds to finance operations within and beyond the next 12 months. While the Company has been successful in securing financing in the past, raising additional funds is dependent on a number of factors outside the Company's control, and as such there is no assurance that it will be able to do so, should it need to, in the future. If the Company is unable to obtain sufficient additional financing when needed, it may have to curtail operations and development activities, any of which could harm the business, financial condition and results of operations. Until such financing is secured, there exists a material uncertainty that may cast significant doubt about the Company’s ability to continue operating as a going concern and realize its assets and settle its liabilities and commitments in the normal course of business. See note 1(b) to the financial statements.
SUMMARY OF CASH FLOWS
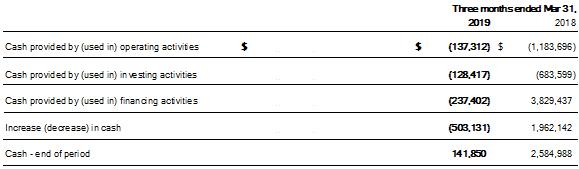
During the three months ended March 31, 2019, cash flows used by operating activities was $137,312 compared to $1,183,696 for the same period in the prior year.
The use of cash during Q1, 2019 consists of the comprehensive loss of $878,923 (2018 - $1,028,795) plus adjustments for operating activities of $257,614 (2018 - $483,514), plus a net change in non-cash operating working capital items of $1,201,518 (2018 – net decrease of $637,926) plus interest paid of $155,569 (2018 - interest paid of $489).
Investing activities resulted in a use of cash of $128,417 in 2019, compared to a use of cash of $683,599 in 2019 resulting from the purchase of inventories, property and equipment and reimbursement of deposits.
Financing activities in Q1, 2019 resulted in a use of funds of $237,402, compared with a net source of funds of $3,829,437 for the same periods in 2018. In Q1, 2019, the Company repaid loans of $247,200, made payment of lease liabilities of $52,494 and received a reimbursement of a deposit of $62,292. In 2018, the source of funds resulted from the issuance of common shares upon exercise of warrants, units and stock options, convertible debentures for net proceeds of $4,121,717 raised for general working capital purposes, and repaid an amount of $292,280 in loans and capital lease obligations.
The net cash position of the Company decreased by $503,131 for Q1, 2019 compared to a net increase of $1,962,142 for Q1, 2018.
11 | P a g e
CAPITAL STOCK INFORMATION
The authorized share capital of the Company consists of an unlimited number of Class A common shares (the “Common Shares”). As at May 28, 2019 PyroGenesis had 138,619,450 on shares, 23,741,870 share purchase warrants, 9,922,000 outstanding stock options issued, and 9,035,000 exercisable options issued.
GOING CONCERN
Cash generated from contracts and from providing engineering services to clients has historically been insufficient to meet the overall cash requirements of the Company to cover operating costs. For the Company to generate sufficient positive cash flows from operations and meet current cash requirements, the level of business must exceed that recorded to date. Management expects that the investments currently being made in accelerating projects under development for various clients, together with executing on the $8.5 million backlog at May 28 2019, (169% of 2018 revenues) which is primarily related to the Company’s successful diversification into niche markets of the additive manufacturing (including 3D printing), and metals & mining industries, will continue to improve the Company’s cash position.
To date, the Company has raised financing primarily through successive issuances of equity and convertible debentures. There is no certainty that the Company will continue to be able to raise additional financing or expand its sales to fund its operations, although management is confident that it will be able to do so. These conditions indicate the existence of a material uncertainty that may cast significant doubt on the Company’s ability to continue as a going concern.
The December 31, 2018 financial statements have been prepared using International Financial Reporting Standards (“IFRS”) applicable to a going concern, which contemplates the realization of assets and settlement of liabilities in the normal course of business as they become due. If the going concern assumption were not appropriate for these financial statements then adjustments would be necessary to the carrying value of assets and liabilities, the reported expenses and the statements of financial position classifications used. The impact on the financial statements could be material.
RELATED PARTY TRANSACTIONS
During the three months ended March 31, 2019, the Company concluded the following transactions with related parties:
Lease payments of $66,679 were paid to a trust whose beneficiary is the controlling shareholder and CEO (rent and property taxes of $51,946 were charges in 2018). A balance due of $1,755,477 (2018 - $91,550) is included in lease liabilities at March 31, 2019.
An amount of $240,159 was paid as a deposit for rent to a trust whose beneficiary is the controlling shareholder and CEO of the Company (December 31, 2018 – $240,519), of this amount $112,034 is included in prepaids.
An amount of $10,213 was owed by a trust whose beneficiary is the controlling shareholder and CEO of the Company (December 31, 2018 – $10,213) of this amount $10,213 is included in accounts receivable.
12 | P a g e
A balance due to the controlling shareholder and CEO of the Company amounted to $166,309 (December 31, 2018 - $193,842) for expense report, salary and vacation payables and is included in accounts payable and accrued liabilities as at March 31, 2019.
An amount of $4,364 (December 31, 2018 - $7,427), of interest payable and an accretion amount of $8,132 (December 31, 2018 - $12,946), were accrued on the loan of $295,000 from the controlling shareholder and CEO of the Company and are included in accounts payable and accrued liabilities.
The key management personnel of the Company are the members of the Board of Directors and certain officers. Total compensation to key management consisted of the following:

A balance of $40,252 of key management compensation, of the amounts noted above, is included in accounts payable and accrued liabilities as at March 31, 2019 (December 31, 2018 - $127,748).
SUBSEQUENT EVENTS
On April 4, 2019 the Company received an amount of $157,122 from a term loan with respect to its scientific research and experimental development tax credit ("SR&ED Tax Credits") for the Company's fiscal years ending December 31, 2018. The loan bears a yearly interest rate of 16.68% for a term of twelve months.
On April 29, 2019 the Company announced an imminent potential contract of over $20,000,000 in first year revenues, together with significant subsequent years revenues.
On May 15, 2019, the Company issued 2,996,500 Units to unrelated parties at a price of $0.58 per Unit, for gross proceeds of $1,737,970. Each Unit consists of one common share and one common share purchase warrant of the Company. Each warrant entitles the holder thereof to purchase one common share at a price of $0.85 until May 15th, 2021. Each Unit will be subject to a statutory hold period of four months and one day from the date of closing. In connection with the private placement the Company paid finder’s fees in the amount of $42,595.
On May 28, 2019, the Company issued 2,024,500 Units to unrelated parties at a price of $0.58 per Unit, for gross proceeds of $1,174,210. Each Unit consists of one common share and one common share purchase warrant of the Company. Each warrant entitles the holder thereof to purchase one common share at a price of $0.85 until May 28, 2021. Each Unit will be subject to a statutory hold period of four months and one day from the date of closing. In connection with the private placement the Company paid finder’s fees in the amount of $40,600.
13 | P a g e
On May 30, 2019, the President and CEO of the Company Mr. Photis Peter Pascali announced that he acquired ownership of 3,385,715 Common Shares and 3,385,715 Warrants in the capital of the Company at a price of $0.55 per Common Share representing an aggregate amount of $1,862,143. Each Warrant entitles the holder thereof to purchase one common share at a price of $0.85 until April 20, 2020. The acquisition of these Common Shares represents approximately 2.44% of the Company’s issued and outstanding shares.
CRITICAL ACCOUNTING ESTIMATES, NEW AND FUTURE ACCOUNTING POLICIES AND FINANCIAL INSTRUMENTS
For a discussion of critical accounting estimates, new and future accounting policies and financial instruments, please refer to notes 3, 4, 5 and 24 of the annual 2018 Financial Statements.
RISK FACTORS
PyroGenesis is subject to a number of risks and uncertainties that could significantly affect the Company’s financial condition and performance. This list of risk factors may not be exhaustive as the Company operates in a rapidly changing business environment and new risk factors emerge from time to time. The Company cannot predict such risk factors, nor can the Company assess the impact, if any, of such risk factors or uncertainties on its business or the extent to which any factor, or combination of factors, may cause actual results to differ materially from those projected in any forward-looking statements. Accordingly, neither shareholders of the Company nor purchasers of securities of the Company should rely on forward-looking statements as a prediction of actual results. If any of these risks actually occur, the Company’s business, results of operations, financial position and cash flows could be adversely affected. In any such case, the market price of the Company’s common shares could decline, and investors may lose all or part of their investment.
Revenue Risks
PyroGenesis may experience delays in achieving revenues, particularly with plasma gasification projects which have a long sales cycle. Revenues may be delayed or negatively impacted by issues encountered by the Company or its clients including:
| (a) | unforeseen engineering and/or environmental problems; |
| (b) | delays or inability to obtain required financing, licenses, permits and/or regulatory approvals; |
| (c) | supply interruptions and/or labour disputes; |
| (d) | foreign exchange fluctuations and/or collection risk; and |
| (e) | competition from other suppliers and/or alternative energy solutions that are less capital intensive. |
There is no assurance that the business will perform as expected or that returns from the business will support the expenditures needed to develop it.
14 | P a g e
Technology Development and Manufacturing Capability Risks
PyroGenesis recently expanded into new areas of business and, as a result, many of the Company’s products are at various stages of the development cycle. The Company may be unable to commercialise such products, or it may be unable to manufacture such products in a commercially viable manner. Whilst management is confident in both its technology and in its team of experienced engineers, scientists and technicians, it cannot know with certainty, which of its products will be commercialised, when such products will be commercialised, or whether such products will be able to be manufactured and distributed profitably.
Lack of Product Revenues/History of Losses
PyroGenesis has incurred losses in the majority of years since its inception. The Company’s operations have not generated sufficient earnings and cash flows to date to result in consistent profitability or positive cash flow. Consequently, the Company’s continued existence is dependent upon its ability to generate profitable operations by establishing and expanding its client base and/or raising adequate long-term financing. PyroGenesis has relied primarily on equity financing, debt financing, partner funding and government funding to carry on its business to date. The ability of the Company to achieve profitable sustainable operations in the future is uncertain. PyroGenesis has not yet demonstrated its ability to consistently achieve positive gross margins and its ongoing efforts to improve product gross margins may be insufficient to result in profitability.
Additional financing and dilution
PyroGenesis will require additional financing to support ongoing operations and to undertake capital expenditures. There can be no assurance that additional financing will be available to the Company when needed, or on terms acceptable to the Company. PyroGenesis’ inability to raise financing to support ongoing operations or to fund capital expenditures could limit the Company’s growth and may have a material adverse effect upon the Company.
The Company does not exclude raising additional funds by equity financing. In addition, at May 28, 2019, 9,922,000 stock options are currently issued and outstanding, together with 23,741,870 share purchase warrants and $3,000,000 convertible debentures. The exercise of stock options and/or warrants, together with the conversion of debentures, as well as any new equity financings, represents dilution factors for present and future shareholders.
Sales Cycle and Fixed Price Contracts
PyroGenesis sales cycle is long and the signing of new contracts is subject to delay, over which the Company has little control. The Company also enters into sales contracts with fixed pricing, which may be impacted by changes over the period of implementation. There is no assurance that delays or problems in fulfilling contracts with clients will not adversely affect the Company’s activities, operating results or financial position.
15 | P a g e
Reliance on Technology
PyroGenesis will depend upon continuous improvements in technology to meet client demands in respect of performance and cost, and to explore additional business opportunities. There can be no assurance that the Company will be successful in its efforts in this regard or that it will have the resources available to meet this demand. Whilst management anticipates that the research and development will allow the Company to explore additional business opportunities, there is no guarantee that such business opportunities will be presented or realised. The commercial advantage of the Company will depend to a significant extent on the intellectual property and proprietary technology of PyroGenesis and the ability of the Company to prevent others from copying such proprietary technologies. PyroGenesis currently relies on intellectual property rights and other contractual or proprietary rights, including (without limitation) copyright, trade secrets, confidential procedures, contractual provisions, licenses and patents, to protect its proprietary technology. PyroGenesis may have to engage in litigation in order to protect its patents or other intellectual property rights, or to determine the validity or scope of the proprietary rights of others. This type of litigation can be expensive and time consuming, regardless of whether or not the Company is successful. PyroGenesis may seek patents or other similar protections in respect of particular technology; however, there can be no assurance that any future patent applications will actually result in issued patents, or that, even if patents are issued, they will be of sufficient scope or strength to provide meaningful protection or any commercial advantage to the Company. Moreover, the process of seeking patent protection can itself be long and expensive. In the meantime, competitors may develop technologies that are similar or superior to PyroGenesis’ technology or design around the patents owned by the Company, thereby adversely affecting the Company’s competitive advantage in one or more of its areas of business. Despite the efforts of the Company, its intellectual property rights may be invalidated, circumvented, challenged, infringed or required to be licensed to others. It cannot be assured that any steps the Company may take to protect its intellectual property rights and other rights to such proprietary technologies that are central to the Company’s operations will prevent misappropriation or infringement of its technology.
Changes to Contracts
PyroGenesis is dependent upon its ability to establish and develop new relationships and to build on existing relationships with current clients. The Company cannot provide assurance that it will be successful in maintaining or advancing its relationships with current clients or procure additional clients. In addition, PyroGenesis cannot provide assurance that the U.S. Military and/or other military clients will continue to provide the Company with business. Sales to governments and governmental entities are subject to specific additional risks, such as delays in funding, termination of contracts or sub-contracts at the convenience of the government, termination, reduction or modification of contracts or sub-contracts in the event of changes in the government’s policies or as a result of budgetary constraints and increased or unexpected costs resulting in losses or reduced profits under fixed price contracts.
Foreign Exchange Exposure
PyroGenesis’ products and services are increasingly being sold in markets outside of Canada, whilst most of its operating expenses and capital expenditures are denominated in Canadian dollars. As a result, the Company is exposed to fluctuations in the foreign exchange rates between Canadian dollar and the currency in which a particular sale is transacted, which may result in foreign exchange losses that could affect earnings.
Competition
The industry is competitive and PyroGenesis competes with a substantial number of companies which have greater technical and financial resources. There can be no assurance that such competitors will not substantially increase the resources devoted to the development and marketing of products and services that compete with those of the Company or that new or existing competitors will not enter the various markets in which PyroGenesis is active. There can be no assurance that competitors will not develop new and unknown technologies with which the Company may have difficulty competing. Furthermore, failure to remain cost competitive may result in PyroGenesis losing business to its competitors.
16 | P a g e
Management and Key Personnel
PyroGenesis depends on the skills and experience of its management team and other key employees. The Company relies heavily on its ability to attract and retain highly-skilled personnel in a competitive environment. PyroGenesis may be unable to recruit, retain, and motivate highly-skilled employees in order to assist the Company’s business, especially activities that are essential to the success of the Company. Failure to recruit and retain highly-skilled employees may adversely affect PyroGenesis’ business, financial condition and results of operations.
Implementation of a strategic plan
PyroGenesis’ commercial strategy aims to leverage its products, consumables, and services whilst focusing on the resolution of problems within niche markets within the industries served by the Company. There can be no assurances as to the success of the Company’s strategic plan, which should be considered under the risks perspective and difficulties frequently encountered by a developing business.
Adverse Decisions of Sovereign Governments
PyroGenesis conducts an increasing portion of its business internationally. There is no assurance that any sovereign government, including Canada’s, will not establish laws or regulations that will not be detrimental to the Company’s interests or that, as a foreign corporation, it will continue to have access to the regulatory agencies in other countries. Governments have, from time to time, established foreign exchange controls, which could have a material adverse effect on the Company’s business, financial condition and results of operations.
Governmental Regulation
PyroGenesis is subject to a variety of federal, provincial, state, local and international laws and regulations relating namely to the environment, health and safety, export controls, currency exchange, labour and employment and taxation. These laws and regulations are complex, change frequently and have tended to become more stringent over time. Failure to comply with these laws and regulations may result in a variety of administrative, civil and criminal enforcement measures, including assessment of monetary penalties, imposition of remedial requirements and issuance of injunctions as to future compliance. The Company may be subject to compliance audits by regulatory authorities in the various countries in which it operates.
Environmental Liability
PyroGenesis is subject to various environmental laws and regulations enacted in the jurisdictions in which it operates, which govern the manufacturing, processing, importation, transportation, handling and disposal of certain materials used in the Company’s operations. Management believes that it has adequate procedures in place to address compliance with current environmental laws and regulations. Furthermore, management monitors the Company’s practices concerning the handling of environmentally hazardous materials. However, there can be no assurance that the Company’s procedures will prevent environmental damage occurring from spills of materials handled by the Company or that such damage has not already occurred. On occasion, substantial liabilities to third parties may be incurred. The Company may have the benefit of insurance maintained by it or the operator, however, the Company may become liable for damages against which it cannot adequately insure or against which it may elect not to insure because of high costs or other reasons. The Company’s clients are subject to similar environmental laws and regulations, as well as limits on emissions to the air and discharges into surface and sub-surface waters. While regulatory developments that may follow in subsequent years could have the effect of reducing industry activity, the Company cannot predict the nature of the restrictions that may be imposed. The Company may be required to increase operating expenses or capital expenditures in order to comply with any new restrictions or regulations.
17 | P a g e
Product Liability and Other Lawsuits
PyroGenesis is subject to a variety of potential product liabilities claims and other lawsuits related with its operations, including liabilities and expenses associated with product defects. The Company maintains product liability and other insurance coverage that management believes is generally in accordance with the market practice in its industry, but there can be no assurance that the Company will always be adequately insured against all such potential liabilities.
Market Liquidity
The market price for the common shares of the Company could be subject to wide fluctuations. Factors such as the announcement of significant contracts, technological innovations, new commercial products, patents, a change in regulations, quarterly financial results, future sales of common shares by the Company or current shareholders, and many other factors could have considerable repercussions on the price of the Company’s common shares. In addition, the financial markets may experience significant price and value fluctuations that affect the market prices of equity securities of companies that sometimes are unrelated to the operating performance of these companies. Broad market fluctuations, as well as economic conditions generally may adversely affect the market price of the Company’s common shares.
Information systems disruptions
The Company’s business depends on the efficient and uninterrupted operation of its computer and communications software, hardware systems, and its other information technology. If such systems were to fail, or the Company was unable to successfully expand the capacity of these systems or integrate new technologies into its existing systems, its operations and financial results could be adversely affected.
18 | P a g e
OUTLOOK
2019 is turning into the year that bears the fruit of 2018 strategies, in which PyroGenesis successfully positioned itself with unique and strategic partnerships, geared to effectively accelerate commercialization in two of its three business segments.
In 2018, the Company successfully positioned each of its commercial business lines for rapid growth by strategically partnering with multi-billion-dollar entities who have identified PyroGenesis’ offerings to be unique, in demand, and of such a commercial nature as to warrant such unique relationships.
By the end of 2018 PyroGenesis could boast of a unique relationship with a multi-billion-dollar entity in each of its three commercial offerings:
| 1) | The US Navy within the Military/Environmental sector; |
| 2) | A Japanese trading house within the DROSRITETM (tolling) offering; |
| 3) | Aubert & Duval within the Additive Manufacturing/3D printing (“AM”) offering. |
Most companies would be thankful for one such relationship, but PyroGenesis has successfully developed three.
It became readily apparent to management that partnering with the right entity could significantly accelerate commercialization in each of its new business lines. This, however, would come with a cost in 2018. In order to succeed, PyroGenesis would have to dedicate significant resources to demonstrating the value proposition, and capabilities, to these entities. This meant that assets which should have been dedicated to sales now had to be deployed to developing these relationships. This not only impacted revenues, but it also increased costs of non-paying projects. We have seen this effect continue into Q1 2019, which we expect will continue to some degree into Q2, 2019.
To date, PyroGenesis has announced that it should be awarded a two-ship build for its PAWDS unit, for approximately $13.5MM. Add to this the recently announced potential contract with 1st year revenues of $20MM ($30-50MM in subsequent years revenues) and the impact of this strategy is apparent: over $30MM in revenues over the next 18 months. Approximately 6x 2018 revenues.
2019 should also be the year in which the Company takes steps, outside of the ordinary course of business, to unlock additional value for investors.
One such step that has been announced is the spin-off of the Company’s additive manufacturing capabilities.
Another step, which is likewise outside the ordinary course of business, and is geared to unlocking shareholder value, is the previously announced up-listing of the Company’s stock to a more senior exchange other than the one the Company is currently on. This is projected to be completed by year-end.
There are other steps, outside the ordinary course of business, that the Company is considering, to further increase shareholder value. The first of which should be announced in early Q3, 2019.
In short, 2019 is playing out to be the first of many years which will bear the fruit of strategic decisions made in the recent past.
19 | P a g e