UNITED STATES
SECURITIES AND EXCHANGE COMMISSION
Washington, D.C. 20549
FORM N-CSR
CERTIFIED SHAREHOLDER REPORT OF REGISTERED
MANAGEMENT INVESTMENT COMPANIES
| Investment Company Act file number | 811-23436 | |
NB Crossroads Private Markets Fund VI Holdings LP
(Exact name of registrant as specified in charter)
325 North Saint Paul Street
49th Floor
Dallas, TX 75201
(Address of principal executive offices) (Zip code)
Patrick Deaton, Chief Operating Officer
Neuberger Berman Investment Advisers LLC
1290 Avenue of the Americas
New York, NY 10104
(Name and address of agent for service)
| | Registrant’s telephone number, including area code: | (212) 476-8800 | |
| Date of fiscal year end: | March 31 |
| Date of reporting period: | March 31, 2023 |
Form N-CSR is to be used by management investment companies to file reports with the Commission not later than 10 days after the transmission to stockholders of any report that is required to be transmitted to stockholders under Rule 30e-1 under the Investment Company Act of 1940 (17 CFR 270.30e-1). The Commission may use the information provided on Form N-CSR in its regulatory, disclosure review, inspection, and policymaking roles.
A registrant is required to disclose the information specified by Form N-CSR, and the Commission will make this information public. A registrant is not required to respond to the collection of information contained in Form N-CSR unless the Form displays a currently valid Office of Management and Budget ("OMB") control number. Please direct comments concerning the accuracy of the information collection burden estimate and any suggestions for reducing the burden to Secretary, Securities and Exchange Commission, 100 F Street, NE, Washington, DC 20549. The OMB has reviewed this collection of information under the clearance requirements of 44 U.S.C. § 3507.
Item 1. Reports to Stockholders.
(a)
NB Crossroads Private Markets Fund VI Holdings LP
Consolidated Financial Statements
For the year ended March 31, 2023
NB Crossroads Private Markets Fund VI Holdings LP
(Unaudited)
Private Market Overview
Throughout 2022 and the start of 2023, geopolitical tensions, high inflation, interest rate hikes, and most recently, a turbulent banking sector, have created a period of uncertainty for investors. However, we believe private market investments have unique characteristics which generally allow them to better navigate significant market volatility compared to public markets. Additionally, we believe private markets have particular qualities that support the case for including them in a diversified portfolio throughout a cycle. Some of those qualities may even support the case for committing new capital to the asset class at times like the present, as private equity has the ability to take advantage of opportunity sets that tend to emerge in relatively weak points in the market cycle.
Opportunities for Growth in Private Equity Markets
Private equity firms are largely focused today on strategic and operational value creation as opposed to relying on leverage or multiple expansion as value drivers, and thus typically make investments with deep, well-thought-out plans with the goal of accelerating earnings growth. They often also have more flexibility to adapt operationally to a changing economic environment relative to larger, public companies. In particular, sustaining margins and investing in growth initiatives through difficult environments may be easier for a smaller company working away from the glare and short-term focus of public markets. In recent years, this was paramount, as underlying companies faced headwinds related to the pandemic, supply chain disruption, geopolitical unrest, inflationary pressure, and higher interest rates.
Further, private equity firms today have greatly improved on operating resources in-house, and they can use their position of control or influence to respond quickly to changes in the market environment. The value of this became particularly apparent during the recent banking crisis as we saw sponsors react with speed to help their firms and portfolio companies safeguard assets and maintain access to credit, while simultaneously identifying exposures and proactively communicating to investors in real time.
Although standard for public equities, this rapid response and willingness to provide investors with transparency is a shift for private equity and an example of the evolution and growing sophistication of the asset class.
The impact of market volatility has historically been more muted on private markets given the long-term nature of the underlying investments. Capital is locked up, fire sales are rare, and in times of volatility, sellers can simply hold on to an asset longer and continue executing their operational and growth plans. Furthermore, private equity managers can be quicker than their public counterparts to manage costs, conserve cash, or improve management. Private firms also tend to have ready access to capital in turbulent times, so they can inject more equity into businesses that may be temporarily affected by external weakness.
This active management has allowed overall performance to hold up relatively well compared to the declining public market multiples. Some of that may be due to lagging or over-optimistic valuations that may ultimately have to be written down by private equity managers – but not as much as many fear, in our view.
Private Equity Investment Activity
Global private equity deal activity slowed during 2022, as evidenced in the chart below. The first three quarters of the year saw a run rate that was 80% as high as that for the full year 2021 – and 2021 was an extraordinarily busy year as the industry got back to work following the disruption of the pandemic. Moreover, this slowdown in activity partly reflects another quality that private equity brings to a portfolio: private asset owners can be strategic and opportunistic about when to monetize their assets – if the market is weak, they can often hold onto fundamentally high-quality assets until the environment has recovered.
(Unaudited)
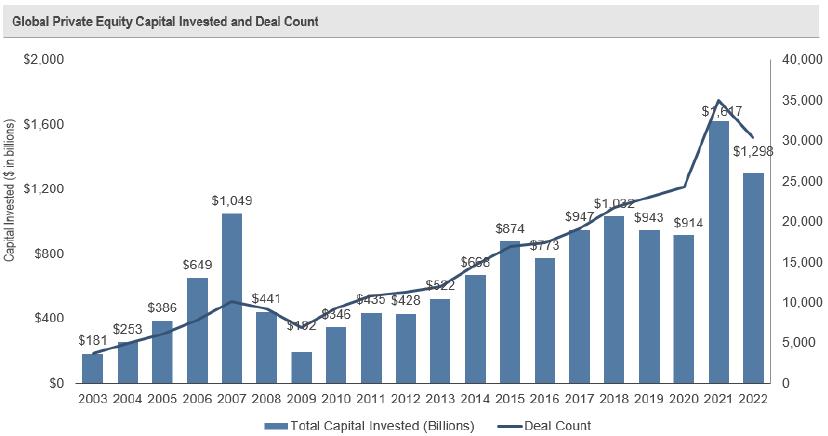
Source: Pitchbook as of Q4 2022. Includes buyout, late stage VC, and growth equity. Includes completed deals only.
We are starting to see entry valuations come down slightly, with the potential to decrease further, but this likely won’t occur until broader dealmaking activity further rebounds. In contrast, one area of the market where we have seen valuations reset is in the public markets. This is still an opportunity for larger-scale private equity managers because they can acquire the majority of these companies and delist them in “take private” transactions. The companies can benefit from the sponsor transformation plans outside of the public eye, which take time to implement and are hard to execute with the short-term scrutiny that comes with quarterly earnings reporting. We believe this will represent a significant opportunity for larger private equity managers if the market uncertainty and volatility persist.
Private Equity Outlook for 2023 and Beyond
Against this backdrop, NB Crossroads Private Markets Fund VI Holdings LP (the “Fund”) has continued to perform well.
We believe the private equity model, with active governance and the potential to drive real value at underlying companies, is a significant advantage in this uncertain environment. Private equity managers can be quick to react to change, and importantly take advantage of opportunities. We believe the Fund’s underlying portfolio is comprised of market-leading private equity managers and companies that have long-term secular growth trends and should be relatively resilient to current economic pressures. Despite the uncertain environment so far in 2023, we believe the Fund has a portfolio that is well-positioned to generate value for our investors.
(Unaudited)
Fund Overview
The Fund’s investment objective is to provide attractive risk-adjusted returns. The Fund seeks to achieve its objective by investing in a diversified global portfolio of high-quality third-party private equity funds (“Portfolio Funds”), including secondary investments in underlying Portfolio Funds acquired from investors in such Portfolio Funds, pursuing investment strategies in small and mid-cap buyout, large-cap buyout, special situations (primarily distressed-oriented strategies), and venture and growth capital, and by co-investing directly in portfolio companies alongside Portfolio Funds and other private equity firms. The Fund is fully committed to a diversified set of Portfolio Funds and portfolio companies and allocated across investment strategy, asset class, industry, sponsor and geography. As of March 31, 2023, the Fund was invested across 72 investments, including 41 co-investments, 26 primary Portfolio Fund investments and 5 secondary Portfolio Fund investments.
The Fund generated a 1.65% total return on a net asset value (“NAV”) basis for the fiscal year ended March 31, 2023. The Fund generated mixed performance results across its three key transaction types: primary, secondary and co-investments. Among the positive drivers, the Fund benefitted from a co-investment in a European industrials business focused on environmental services. The Fund also benefitted from a co-investment in a global IT services company. On the other hand, among the detractors from performance, the Fund generated negative performance from a co-investment in a North American company focused on fitness equipment manufacturing and distribution. The Fund also saw negative performance from a co-investment in a North American technology business focused on e-commerce and shipping solutions.
The portfolio composition, industries and holdings of the Fund are subject to change without notice. The opinions are as of the date of this report and are subject to change without notice.
Fund Performance – Average Annual Total Return Ended 3/31/2023
| | 1 Year | Since Inception |
| NB Crossroads Private Markets Fund VI Holdings LP1 | 1.65% | 7.40% |
| MSCI World Index (Net)2 | -7.02% | 6.19% |
The performance data quoted represent past performance and does not predict future performance. Current performance may be lower or higher than the performance data quoted.
The results shown in the table reflect the reinvestment of distributions, if any. The results do not reflect the effect of taxes a Fund investor (“Investor”) would pay on Fund distributions or on the sale of the Fund’s limited liability company interests (the “Interests”).
Unlike open-ended funds, the Fund’s Interests are not continually offered. The Fund offered its Interests only to persons or entities that are both “accredited investors” as defined in Section 501(a) of Regulation D under the Securities Act of 1933, as amended (the “Securities Act”), and “qualified clients” as defined in Rule 205-3 under the Investment Advisers Act of 1940, as amended, in private placement transactions that do not involve any “public offering” within the meaning of Section 4(a)(2) of, and/or Regulation D under, the Securities Act.
| (1) | The Fund commenced operations on February 14, 2020. |
| (2) | The MSCI World Index captures large and mid-cap representation across 23 Developed Markets countries. The index covers approximately 85% of the free float-adjusted market capitalization in each country. The Developed Markets countries include Australia, Austria, Belgium, Canada, Denmark, Finland, France, Germany, Hong Kong, Ireland, Israel, Italy, Japan, Netherlands, New Zealand, Norway, Portugal, Singapore, Spain, Sweden, Switzerland, the UK and the US. The index is unmanaged and does not include fees. Investors may not invest in the index directly. |
(Unaudited)
Growth of a $50,000 Investment
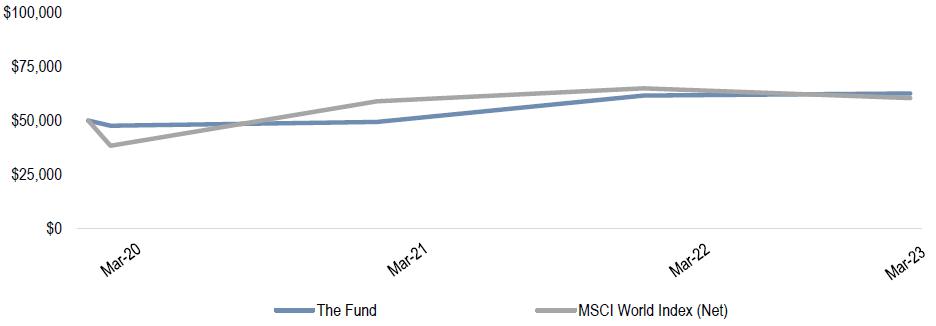
This graph shows the change in value of a hypothetical $50,000 investment in the Fund over the past 10 fiscal years. The results shown in the graph reflect the reinvestment of Fund distributions, in any. The results do not reflect the effect of taxes and Investor would pay on Fund distributions. The result is compared with a broad-based market index. The market index has not been reduced to reflect any of the fees and costs of investing. The required minimum initial capital commitment by an Investor in the Fund was $50,000. Consistent with Securities and Exchange Commission reporting requirement, the line graph above assumes that an Investor’s $50,000 capital commitment was fully called and invested at the commencement of the Fund’s operations; however, as disclosed to potential investors, their initial capital commitments to the Fund would not be full called and immediately invested. Rather, Investors’ capital commitments are called and drawn down by the Fund as investment opportunities are identified by the Fund’s Investment Adviser over the term of the Fund. As such, the investment growth shown in the line graph above may not reflect the actual performance experience of an Investor invested in the Fund over this time period.
Impact of the Fund’s Distribution Policy
The Fund does not have a policy or practice of maintaining a specified level of distributions to Investors. The Fund intends to qualify annually as a regulated investment company under the Internal Revenue Code of 1986, as amended, and intends to distribute at least 90% of its annual net taxable income to its Investors. From time to time, the Fund may also pay special interim distributions at the discretion of the Board of Directors. In general, this practice does not affect the Fund’s investment strategy and may reduce the Fund’s net asset value. Over time, a portion of an Investor’s distribution will be a return of its capital given the Fund has a limited term and will seek to return its available assets to investors. The tax characteristics of an Investor’s distributions will be reflected on its annual Form 1099-DIV.
NB Crossroads Private Markets Fund VI Holdings LP
For the year ended March 31, 2023
NB Crossroads Private Markets Fund VI Holdings LP
Consolidated Statement of Assets, Liabilities and Partners’ Capital – Net Assets
As of March 31, 2023
| Assets | | | | |
| | | | | |
| Investments, at fair value (cost $264,589,267) | | $ | 312,067,278 | |
| Deferred financing costs, net | | | 26,837 | |
| Prepaid insurance | | | 16,308 | |
| Interest receivable | | | 9,559 | |
| | | | | |
| Total Assets | | $ | 312,119,982 | |
| | | | | |
| Liabilities | | | | |
| | | | | |
| Advisory fees payable | | $ | 531,169 | |
| Professional fees payable | | | 230,699 | |
| Due to Affiliate | | | 76,376 | |
| Administration service fees payable | | | 63,997 | |
| Deferred tax payable | | | 28,259 | |
| Due to investment | | | 14,740 | |
| Other payables | | | 13,614 | |
| | | | | |
| Total Liabilities | | $ | 958,854 | |
| | | | | |
| Commitments and contingencies (See Note 5) | | | | |
| | | | | |
| Partners' Capital - Net Assets | | $ | 311,161,128 | |
| | | | | |
| Partners’ Capital - Net Assets consist of: | | | | |
| Partners’ capital paid-in | | $ | 262,441,689 | |
| Partners’ distributable earnings (loss) | | | 48,719,439 | |
| | | | | |
| Total Partners' Capital - Net Assets | | $ | 311,161,128 | |
| | | | | |
| Units of Partnership Interests outstanding (unlimited units authorized) | | | 250,576.55 | |
| Net Asset Value Per Unit | | $ | 1,241.78 | |
The accompanying notes are an integral part of these financial statements.
NB Crossroads Private Markets Fund VI Holdings LP
Consolidated Schedule of Investments
As of March 31, 2023
| Investments / Co-investments (A),(B),(D) | | Acquisition Type | | Acquisition Dates (C) | | Geographic Region (E) | | Cost | | | Fair Value | |
| | | | | | | | | | | | | |
| Large-cap Buyout (27.63)% | | | | | | | | | | | | | | |
| BC Partners XI GD - I LP | | Primary | | 07/2021-02/2023 | | Europe | | $ | 3,472,069 | | | $ | 3,668,704 | |
| Boom Co-Invest B, L.P. | | Co-Investment | | 09/2021 | | North America | | | 4,805,142 | | | | 5,075,492 | |
| Clayton, Dubilier & Rice Fund XI, L.P. | | Primary | | 09/2021-02/2023 | | North America | | | 4,911,986 | | | | 5,164,542 | |
| Hellman & Friedman Capital Partners X (Parallel), L.P. | | Primary | | 11/2021-01/2023 | | North America | | | 6,405,404 | | | | 6,513,237 | |
| KKR Apple Co-Invest L.P. | | Co-Investment | | 09/2021-11/2021 | | North America | | | 5,173,770 | | | | 6,208,524 | |
| KKR Leo Co-Invest L.P. | | Co-Investment | | 06/2021 | | Asia | | | 1,606,324 | | | | 2,968,620 | |
| KKR Oculus Co-Invest L.P. | | Co-Investment | | 11/2020 | | North America | | | 2,100,000 | | | | 2,835,096 | |
| KKR Redwood Co-Invest L.P. | | Co-Investment | | 07/2020 | | North America | | | 1,349,413 | | | | 1,923,596 | |
| Magenta Blocker Aggregator LP | | Co-Investment | | 07/2021-12/2022 | | North America | | | 1,866,895 | | | | 2,707,450 | |
| NB RR Co-Invest LP | | Co-Investment | | 10/2020-11/2022 | | North America | | | 4,455,114 | | | | 6,474,952 | |
| Project Metal Co-Invest Fund, L.P. | | Co-Investment | | 10/2021 | | North America | | | 5,703,040 | | | | 4,745,472 | |
| Project Stream Co-Invest Fund, L.P. | | Co-Investment | | 10/2021 | | North America | | | 5,705,878 | | | | 4,258,563 | |
| RealPage Parent, LP (F) | | Co-Investment | | 04/2021 | | North America | | | 4,100,000 | | | | 4,829,495 | |
| RL Co-Investor Aggregator II L.P. | | Co-Investment | | 03/2022-03/2023 | | North America | | | 2,259,103 | | | | 2,247,404 | |
| RL Co-Investor Aggregator L.P. | | Co-Investment | | 05/2022-03/2023 | | North America | | | 2,551,189 | | | | 2,531,943 | |
| Silver Lake Partners VI, L.P. | | Primary | | 01/2021-02/2023 | | North America | | | 6,025,145 | | | | 6,420,325 | |
| THL Fund Investors (Altar), L.P. | | Co-Investment | | 02/2022 | | North America | | | 3,510,097 | | | | 4,387,261 | |
| Thoma Bravo XIV- A, L.P. | | Primary | | 04/2021-02/2023 | | North America | | | 7,599,946 | | | | 7,682,393 | |
| TPG Asia VI Digs 1 L.P. | | Co-Investment | | 11/2020 | | Asia | | | 3,227,764 | | | | 2,754,031 | |
| TPG Jedi CoInvest, L.P. | | Co-Investment | | 07/2020-11/2022 | | North America | | | 1,811,616 | | | | 2,565,911 | |
| | | | | | | | | | 78,639,895 | | | | 85,963,011 | |
| Small and Mid-cap Buyout (54.18)% | | | | | | | | | | | | | | |
| AAI FG Holdco L.P. | | Co-Investment | | 09/2020 | | Europe | | | 2,802,532 | | | | 4,304,765 | |
| Advent Global Technology Fund II-C Limited Partnership | | Primary | | 02/2022-09/2022 | | North America | | | 4,020,000 | | | | 4,623,201 | |
| AFC Acquisitions, Inc. (F) | | Co-Investment | | 04/2021-01/2023 | | North America | | | 4,025,313 | | | | 5,479,234 | |
| Austin Co-Investment, L.P.2 | | Co-Investment | | 03/2021 | | North America | | | 529,052 | | | | 7,587,738 | |
| BC Partners Galileo (1) L.P. | | Secondary | | 07/2021-01/2023 | | Europe | | | 5,514,350 | | | | 7,117,200 | |
| Breakaway Co-Investment Holdings LP | | Co-Investment | | 10/2021 | | North America | | | 2,282,908 | | | | 4,769 | |
| Charlesbank Equity Fund X, L.P. | | Primary | | 09/2021-03/2023 | | North America | | | 5,238,961 | | | | 5,898,567 | |
| CIMI Holdings L.P. | | Co-Investment | | 09/2020 | | North America | | | 1,700,000 | | | | 4,516,779 | |
| Compass Syndication L.P. | | Co-Investment | | 10/2021-12/2021 | | North America | | | 1,109,383 | | | | 1,258,271 | |
| Crosspoint Capital Fund I, LP | | Primary | | 04/2021-03/2023 | | North America | | | 10,131,533 | | | | 10,877,753 | |
| EMK Capital Partners II LP | | Primary | | 09/2021-10/2022 | | Europe | | | 4,181,414 | | | | 5,084,843 | |
| Ethos Capital Investments A LP | | Primary | | 10/2021-03/2023 | | North America | | | 6,323,727 | | | | 10,053,501 | |
| Evidence Co-Invest LP | | Co-Investment | | 12/2020-12/2022 | | North America | | | 3,917,660 | | | | 4,217,948 | |
| Goldeneye Holdings Parent, LP (F) | | Co-Investment | | 07/2021 | | North America | | | 1,800,000 | | | | 1,746,000 | |
| Green Equity Investors Offshore Fund IX, L.P. | | Primary | | - | | North America | | | 14,740 | | | | - | |
| Greenbriar Equity Fund V, L.P. | | Primary | | 08/2021-02/2023 | | North America | | | 7,491,219 | | | | 9,549,132 | |
| Highline PPC FT Holdings LLC (G) | | Co-Investment | | 11/2020 | | North America | | | 2,690,000 | | | | 2,691,754 | |
| Horizon Co-Investment, L.P. | | Co-Investment | | 06/2022 | | North America | | | 3,204,396 | | | | 3,200,000 | |
| Itelyum Co-Investment LP | | Co-Investment | | 09/2021 | | Europe | | | 5,512,630 | | | | 8,373,067 | |
| JLL MedeAnalytics Co-Invest, L.P. | | Co-Investment | | 11/2020-12/2022 | | North America | | | 828,582 | | | | 355,387 | |
| Madison Dearborn Capital Partners VIII-C, L.P. | | Primary | | 04/2021-01/2023 | | North America | | | 727,245 | | | | 689,575 | |
| New Mountain Partners VI, L.P. | | Primary | | 03/2021-03/2023 | | North America | | | 4,342,278 | | | | 4,916,256 | |
| Nordic Capital X Alpha, L.P. | | Primary | | 05/2021-03/2023 | | Europe | | | 6,789,192 | | | | 8,488,595 | |
| Oakley Capital IV Co-Investment (B) SCSp | | Co-Investment | | 02/2021 | | Europe | | | 2,451,704 | | | | 1,190,022 | |
| Oakley Capital IV Co-Investment (C) SCSp | | Co-Investment | | 09/2021 | | Europe | | | 592,534 | | | | 268,558 | |
| Oakley Capital V-B2 SCSp | | Primary | | 05/2022-10/2022 | | Europe | | | 1,034,144 | | | | 878,805 | |
| Patriot SPV, L.P. | | Secondary | | 03/2021-01/2023 | | North America | | | 3,416,849 | | | | 5,310,619 | |
| PPC III-A LP | | Primary | | 03/2021-02/2023 | | North America | | | 9,299,777 | | | | 11,735,002 | |
| Prime Acquisitions Holdco, LP | | Co-Investment | | 08/2021 | | North America | | | 5,008,333 | | | | 5,007,229 | |
| Riverside Fund V CF-B, L.P. | | Secondary | | 03/2021-03/2023 | | North America | | | 3,021,728 | | | | 3,305,857 | |
| SPH Acquisitions, Inc. (F) | | Co-Investment | | 12/2020 | | North America | | | 1,300,000 | | | | 1,573,000 | |
| Summit Partners Co-Invest (Lions), L.P. | | Co-Investment | | 10/2020-09/2022 | | North America | | | 2,755,317 | | | | 4,256,777 | |
| Tailwind TPRC Investor, LP | | Co-Investment | | 01/2021-09/2022 | | North America | | | 1,822,658 | | | | 2,808,982 | |
| THL HT Parallel SPV, L.P. | | Secondary | | 12/2020-02/2023 | | North America | | | 4,073,737 | | | | 7,137,625 | |
| Thoma Bravo Discover Fund III-A, L.P. | | Primary | | 06/2021-08/2022 | | North America | | | 7,371,649 | | | | 8,051,709 | |
| Thomas H. Lee Parallel Fund IX L.P. | | Primary | | 01/2022-01/2023 | | North America | | | 3,672,208 | | | | 3,377,746 | |
| VSC Precision Medical LLC (F)(G) | | Co-Investment | | 11/2020-11/2022 | | North America | | | 1,954,918 | | | | 2,640,769 | |
| | | | | | | | | | 132,952,671 | | | | 168,577,035 | |
The accompanying notes are an integral part of these financial statements.
NB Crossroads Private Markets Fund VI Holdings LP
Consolidated Schedule of Investments
As of March 31, 2023
| Investments / Co-investments (A),(B),(D) | | Acquisition Type | | Acquisition Dates (C) | | Geographic Region (E) | | Cost | | | Fair Value | |
| | | | | | | | | | | | | |
| Special Situations (6.19)% | | | | | | | | | | | | | | |
| CB Starfish TopCo, L.P. | | Co-Investment | | 08/2021 | | North America | | | 419,553 | | | | 1,000,000 | |
| Centerbridge Capital Partners IV, L.P. | | Primary | | 12/2021-05/2022 | | North America | | | 5,146,200 | | | | 7,900,000 | |
| NS KMS Investment LLC (G) | | Co-Investment | | 11/2020-06/2022 | | North America | | | 4,041,771 | | | | 3,401,922 | |
| Rothwell Ventures Ultimate Feeder I (Cayman) L.P. | | Secondary | | 09/2021-10/2022 | | North America | | | 3,992,701 | | | | 6,964,528 | |
| | | | | | | | | | 13,600,225 | | | | 19,266,450 | |
| Venture Capital (10.53)% | | | | | | | | | | | | | | |
| ACME Fund IV, LP | | Primary | | 12/2021-09/2022 | | North America | | | 1,633,447 | | | | 1,392,082 | |
| Blackstone Growth L.P. | | Primary | | 01/2021-03/2023 | | North America | | | 6,314,720 | | | | 5,875,197 | |
| Blackstone Growth Mario Co-Invest L.P. | | Co-Investment | | 12/2020 | | North America | | | 1,861,396 | | | | 2,486,509 | |
| Dragoneer Opportunities Offshore Feeder V, L.P. | | Primary | | 01/2021-12/2022 | | North America | | | 4,836,392 | | | | 4,095,265 | |
| FV Ace Grades Partners, L.P. | | Co-Investment | | 07/2020 | | Asia | | | 2,222,510 | | | | 858,000 | |
| GGV Capital Fund VIII L.P. | | Primary | | 04/2021-03/2023 | | North America | | | 3,616,000 | | | | 4,110,721 | |
| GGV Capital Fund VIII Plus L.P. | | Primary | | 06/2021-12/2022 | | North America | | | 736,000 | | | | 763,880 | |
| Meritech Capital Partners VII L.P. | | Primary | | 11/2020-01/2023 | | North America | | | 2,687,500 | | | | 3,000,465 | |
| Meritech Capital SPV I L.P. | | Co-Investment | | 05/2021 | | North America | | | 3,000,000 | | | | 2,287,564 | |
| Summit Partners Co-Invest (Optmo), SCSp | | Co-Investment | | 10/2021 | | Europe | | | 1,811,897 | | | | 1,803,347 | |
| Summit Partners Venture Capital Fund V-B, L.P. | | Primary | | 05/2021-02/2023 | | North America | | | 2,681,473 | | | | 2,625,468 | |
| THL Automation Fund Investors (4K), L.P. | | Co-Investment | | 03/2021-09/2022 | | North America | | | 2,507,857 | | | | 3,475,000 | |
| | | | | | | | | | 33,909,192 | | | | 32,773,498 | |
| | | | | | | | | | | | | | | |
| Short Term Investments | | Cost | | | Fair Value | |
| | | | | | | |
| Money Market Fund (1.76)% | | | | | | | | |
| Morgan Stanley Institutional Liquidity Fund Government Portfolio | | | 5,487,284 | | | | 5,487,284 | |
| | | | 5,487,284 | | | | 5,487,284 | |
| | | | | | | | | |
| Total Investments (cost $264,589,267) (100.29)% | | | | | | | 312,067,278 | |
| Other Assets & Liabilities (Net) (-0.29)% | | | | | | | (906,150 | ) |
| Partners' Capital - Net Assets (100.00)% | | | | | | $ | 311,161,128 | |
| | | | | | | | | | | | | | | |
| (A) | Non-income producing securities, which are restricted as to public resale and illiquid. |
| (B) | Total cost of illiquid and restricted securities at March 31, 2023 aggregated $259,101,983. Total fair value of illiquid and restricted securities at March 31, 2023 was $306,579,994 or 98.53% of net assets. |
| (C) | Acquisition Dates cover from original investment date to the last acquisition date and is required disclosure for restricted securities only. |
| (D) | All percentages are calculated as fair value divided by the Master Fund's Partners' Capital - Net Assets. |
| (E) | Geographic Region is based on where a Portfolio Fund is headquartered and may be different from where the Portfolio Fund invests. |
| (F) | The fair value of the investment was determined using a significant unobservable input. |
| (G) | This investment is made through the Master Fund's wholly owned subsidiary, NB CPMF VI B LLC. |
The accompanying notes are an integral part of these financial statements.
NB Crossroads Private Markets Fund VI Holdings LP
Consolidated Statement of Operations
For the year ended March 31, 2023
| Investment Income: | | | | |
| | | | | |
| Interest income | | $ | 173,251 | |
| | | | | |
| Total Investment Income | | | 173,251 | |
| | | | | |
| Operating Expenses: | | | | |
| | | | | |
| Advisory fees | | | 2,005,971 | |
| Professional fees | | | 421,276 | |
| Interest expense | | | 349,431 | |
| Administration service fees | | | 220,957 | |
| Independent Directors' fees | | | 160,937 | |
| Financing costs | | | 107,645 | |
| Insurance expense | | | 43,791 | |
| Tax expense | | | 28,259 | |
| Other expenses | | | 101,345 | |
| | | | | |
| Total Operating Expenses | | | 3,439,612 | |
| | | | | |
| Net Investment Loss | | | (3,266,361 | ) |
| | | | | |
| Net Realized and Change in Unrealized Gain on Investments (Note 2) | | | | |
| Net realized gain on investments | | | 4,771,856 | |
| Net change in unrealized appreciation on investments | | | 4,782,611 | |
| | | | | |
| Net Realized and Change in Unrealized Gain on Investments | | | 9,554,467 | |
| | | | | |
| Net Increase in Partners' Capital – Net Assets Resulting from Operations | | $ | 6,288,106 | |
The accompanying notes are an integral part of these financial statements.
NB Crossroads Private Markets Fund VI Holdings LP
Consolidated Statement of Changes in Partners’ Capital – Net Assets
For the year ended March 31, 2022
| | | Partners' Capital | | | Special Limited
Partner | | | Total | |
| Partners' committed capital | | $ | 373,189,746 | | | $ | 3,769,593 | | | $ | 376,959,339 | |
| | | | | | | | | | | | | |
| Partners' capital at April 1, 2021 | | $ | 81,714,444 | | | $ | 825,399 | | | $ | 82,539,843 | |
| Capital contributions | | | 133,644,143 | | | | 1,349,941 | | | | 134,994,084 | |
| Offering costs | | | (1,633 | ) | | | (17 | ) | | | (1,650 | ) |
| Net investment loss | | | (2,681,288 | ) | | | (27,084 | ) | | | (2,708,372 | ) |
| Net realized gain on investments | | | 2,362,053 | | | | 23,859 | | | | 2,385,912 | |
| Net change in unrealized appreciation on investments | | | 36,612,015 | | | | 369,818 | | | | 36,981,833 | |
| Partners' capital at March 31, 2022 | | $ | 251,649,734 | | | $ | 2,541,916 | | | $ | 254,191,650 | |
| |
| For the year ended March 31, 2023 |
| | | | | | | | | | |
| | | Partners' Capital | | | Special Limited
Partner | | | Total | |
| Partners' committed capital | | $ | 373,189,746 | | | $ | 3,769,593 | | | $ | 376,959,339 | |
| | | | | | | | | | | | | |
| Partners' capital at April 1, 2022 | | $ | 251,649,734 | | | $ | 2,541,916 | | | $ | 254,191,650 | |
| Capital contributions | | | 52,246,564 | | | | 527,744 | | | | 52,774,308 | |
| Capital distributions | | | (2,072,007 | ) | | | (20,929 | ) | | | (2,092,936 | ) |
| Net investment loss | | | (3,233,697 | ) | | | (32,664 | ) | | | (3,266,361 | ) |
| Net realized gain on investments | | | 4,724,138 | | | | 47,718 | | | | 4,771,856 | |
| Net change in unrealized appreciation on investments | | | 4,734,784 | | | | 47,827 | | | | 4,782,611 | |
| Partners' capital at March 31, 2023 | | $ | 308,049,516 | | | $ | 3,111,612 | | | $ | 311,161,128 | |
The accompanying notes are an integral part of these financial statements.
NB Crossroads Private Markets Fund VI Holdings LP
Consolidated Statement of Cash Flows
For the year ended March 31, 2023
| CASH FLOWS FROM OPERATING ACTIVITIES | | | | |
| | | | | |
| Net change in Partners’ Capital – Net Assets resulting from operations | | $ | 6,288,106 | |
| Adjustments to reconcile net change in Partners’ Capital – Net Assets resulting from operations to net cash used in operating activities: | | | | |
| Purchases of investments | | | (58,074,571 | ) |
| Proceeds received from investments | | | 10,862,078 | |
| Net purchases and sales of short term investments | | | (509,874 | ) |
| Net realized gain on investments | | | (4,771,856 | ) |
| Net change in unrealized (appreciation) depreciation on investments | | | (4,782,611 | ) |
| Changes in assets and liabilities related to operations | | | | |
| (Increase) decrease in deferred financing costs | | | 107,645 | |
| (Increase) decrease in prepaid insurance | | | 23 | |
| (Increase) decrease in interest receivable | | | (9,148 | ) |
| Increase (decrease) in advisory fees payable | | | 112,766 | |
| Increase (decrease) in professional fees payable | | | 34,576 | |
| Increase (decrease) in due to Affiliate | | | 33,982 | |
| Increase (decrease) in administration service fees payable | | | 8,796 | |
| Increase (decrease) in deferred tax payable | | | 28,259 | |
| Increase (decrease) in other payables | | | (9,543 | ) |
| | | | | |
| Net cash provided by (used in) operating activities | | | (50,681,372 | ) |
| | | | | |
| CASH FLOWS FROM FINANCING ACTIVITIES | | | | |
| | | | | |
| Borrowings from credit facility | | | 11,000,000 | |
| Payments to credit facility | | | (11,000,000 | ) |
| Contributions from Partners | | | 52,774,308 | |
| Distributions to Partners | | | (2,092,936 | ) |
| | | | | |
| Net cash provided by (used in) financing activities | | | 50,681,372 | |
| | | | | |
| Net change in cash and cash equivalents | | | - | |
| Cash and cash equivalents at beginning of the year | | | - | |
| | | | | |
| Cash and cash equivalents at end of the year | | $ | - | |
| | | | | |
| Supplemental cash flow information | | | | |
| Interest paid | | $ | 349,431 | |
The accompanying notes are an integral part of these financial statements.
NB Crossroads Private Markets Fund VI Holdings LP
Consolidated Financial Highlights
| | | For the year ended
March 31, 2023 | | | For the year ended
March 31, 2022 | | | For the year ended
March 31, 2021 | | | For the Period
February 14, 2020
(Commencement of
Operations)
Through March 31, 2020 | |
| Per Unit Operating Performance (1) | | | | | | | | | | | | | | | | |
| | | | | | | | | | | | | | | | | |
| NET ASSET VALUE, BEGINNING OF YEAR | | $ | 1,230.31 | | | $ | 986.24 | | | $ | 951.15 | | | $ | 1,000.00 | |
| INCOME (LOSS) FROM INVESTMENT OPERATIONS: | | | | | | | | | | | | | | | | |
| Net investment loss | | | (14.00 | ) | | | (17.16 | ) | | | (55.63 | ) | | | (48.85 | ) |
| Net realized and change in unrealized gain (loss) on investments | | | 34.04 | | | | 261.23 | | | | 90.72 | | | | - | |
| Net increase (decrease) in net assets resulting from operations | | | 20.04 | | | | 244.07 | | | | 35.09 | | | | (48.85 | ) |
| | | | | | | | | | | | | | | | | |
| DISTRIBUTIONS TO PARTNERS: | | | | | | | | | | | | | | | | |
| Net change in Partners’ Capital - Net Assets due to distributions to Partners | | | (8.57 | ) | | | - | | | | - | | | | - | |
| NET ASSET VALUE, END OF YEAR | | $ | 1,241.78 | | | $ | 1,230.31 | | | $ | 986.24 | | | $ | 951.15 | |
| TOTAL NET ASSET VALUE RETURN (1), (2), (3) | | | 1.65 | % | | | 24.75 | % | | | 3.69 | % | | | (4.89 | )%(4) |
| | | | | | | | | | | | | | | | | |
| RATIOS AND SUPPLEMENTAL DATA: | | | | | | | | | | | | | | | | |
| Partners' Capital - Net Assets, end of year in thousands (000's) | | $ | 311,161 | | | $ | 254,192 | | | $ | 82,540 | | | $ | 2,282 | |
| Ratios to Average Partners' Capital - Net Assets: (5), (7) | | | | | | | | | | | | | | | | |
| Expenses excluding incentive carried interest | | | 1.27 | % | | | 1.74 | % | | | 4.16 | % | | | 56.10 | % |
| Net change in incentive carried interest | | | - | | | | - | | | | - | | | | - | |
| Expenses including incentive carried interest | | | 1.27 | % | | | 1.74 | % | | | 4.16 | % | | | 56.10 | % |
| Net investment loss excluding incentive carried interest | | | (1.21 | )% | | | (1.70 | )% | | | (4.16 | )% | | | (56.10 | )% |
| Portfolio Turnover Rate (6) | | | (4.05 | )% | | | (4.28 | )% | | | (0.69 | )% | | | 0.00 | % |
| | | | | | | | | | | | | | | | | |
| INTERNAL RATES OF RETURN: | | | | | | | | | | | | | | | | |
| Internal Rate of Return (8) | | | 11.23 | % | | | 24.13 | % | | | 17.38 | % | | | NM | |
| (1) | Selected data for a unit of Master Fund interest outstanding throughout each period. |
| (2) | Total investment return, based on per unit net asset value, reflects the changes in net asset value based on the effects of organizational costs, the performance of the Master Fund during the period and assumes distributions, if any, were reinvested. The Master Fund's units are not traded in any market; therefore, the market value total investment return is not calculated. |
| (3) | Total investment return is not annualized. |
| (4) | Total return and the ratios to average Partners' Capital - Net Assets is calculated for the Master Fund taken as a whole. Total return is calculated using a commitment-weighted rate of return methodology based on the timing of closings during the period from commencement of operations on February 14, 2020 through March 31, 2020. As a result, an individual partner's return may vary from these returns and ratios based on the timing of their capital transactions. |
| (5) | Ratios do not reflect the Master Fund's proportional share of the net investment income (loss) and expenses, including any performance-based fees, of the Underlying Investments. |
| (6) | Proceeds received from investments are included in the portfolio turnover rate. |
| (7) | For the period February 14, 2020 (Commencement of Operations) through March 31, 2020, the expense and net investment loss ratios are based on a very limited operating period and, as such, may not be meaningful. |
| (8) | The Internal Rate of Return is computed based on the actual dates of the cash inflows and outflows since inception and the ending net assets at the end of the period as of each measurement date. For the periods ended March 31, 2021 and 2020, the Internal Rate of Return is based on a limited operating period and, as such, may not be meaningful. |
The accompanying notes are an integral part of these financial statements.
NB Crossroads Private Markets Fund VI Holdings LP
Notes to the Consolidated Financial Statements
March 31, 2023
1. Organization
NB Crossroads Private Markets Fund VI Holdings LP (the “Master Fund”) is a non-diversified, closed-end management investment company registered under the Investment Company Act of 1940, as amended (the “Investment Company Act”). The Master Fund was organized as a Delaware limited partnership on June 1, 2018. The Master Fund commenced operations on February 14, 2020 (the “Initial Subscription” closing date). The Master Fund’s term will expire on December 31 following the tenth anniversary from the Initial Subscription closing date, subject to two one-year extensions which may be approved by the Board of Directors of the Master Fund (the “Board” or the “Board of Directors”). Thereafter, the term of the Master Fund may be extended by consent of a majority-in-interest of its limited partners (“Partners”) as defined in the Master Fund’s limited partnership agreement (the “LP Agreement”).
The Master Fund’s investment objective is to provide attractive risk adjusted returns. The Master Fund seeks to achieve its investment objective by investing in a diversified global portfolio of high quality third-party private equity funds (“Portfolio Funds”), including secondary investments in underlying Portfolio Funds acquired from investors in such Portfolio Funds (each, a “Secondary Investment”), pursuing investment strategies in small and mid-cap buyout, large-cap buyout, special situations (primarily distressed-oriented strategies), and venture and growth capital, and by co-investing directly in portfolio companies alongside Portfolio Funds and other private equity firms (each, a “Co-Investment” and together with the Portfolio Funds and Secondary Investments, the “Underlying Investments”). Neither the Master Fund nor the Registered Investment Adviser (as defined below) guarantees any level of return or risk on investments and there can be no assurance that the Master Fund will achieve its investment objective. The Portfolio Funds are not registered as investment companies under the Investment Company Act.
NB Crossroads Private Markets Fund VI LP (the “LP Fund”) and NB Crossroads Private Markets Fund VI Advisory LP (the “Advisory Fund” and together with the LP Fund, the “Feeder Funds”) pursue their investment objectives by investing substantially all of their assets in the Master Fund. Each Feeder Fund is a Delaware limited partnership that is registered under the Investment Company Act as a non-diversified, closed-end management investment company. The Feeder Funds have the same investment objective and substantially the same investment policies as the Master Fund.
The Board has overall responsibility to manage and supervise the operations of the Master Fund, including the exclusive authority to oversee and to establish policies regarding the management, conduct, and operations of the Master Fund. The Board exercises the same powers, authority and responsibilities on behalf of the Master Fund as are customarily exercised by directors of a typical investment company registered under the Investment Company Act. The Board has engaged Neuberger Berman Investment Advisers LLC (“NBIA” or “Registered Investment Adviser”) and NB Alternatives Advisers LLC (“NBAA” or “Sub-Adviser” and together with NBIA, the “Adviser”) to provide investment advice regarding the selection of the Underlying Investments and to manage the day-to-day operations of the Master Fund.
NB Crossroads Private Markets Fund VI Holdings LP
Notes to the Consolidated Financial Statements
March 31, 2023
The Master Fund operates as a vehicle for the investment of substantially all of the assets of the Feeder Funds as partners of the Master Fund (“Partners”). As of March 31, 2023, the LP Fund’s and Advisory Fund’s ownership of the Master Fund’s Partners’ contributed capital was 82.78% and 16.22%, respectively, with a NB affiliate’s (the “Special Limited Partner”) (who is also a Partner of the Master Fund) percentage ownership of the Master Fund’s Partners’ contributed capital being 1%.
2. Significant Accounting Policies
The Master Fund meets the definition of an investment company and follows the accounting and reporting guidance as issued through Accounting Standards Codification (“ASC”) 946, Financial Services – Investment Companies. The following is a summary of significant accounting policies followed by the Master Fund in the preparation of its financial statements.
A. Basis of Accounting
The Master Fund’s policy is to prepare its financial statements on the accrual basis of accounting in accordance with accounting principles generally accepted in the United States of America (“GAAP”). Consequently, income and the related assets are recognized when earned, and expenses and the related liabilities are recognized when incurred. The books and records of the Master Fund are maintained in U.S. dollars.
Consolidation of Subsidiaries
NB CPMF VI B LLC (the “Subsidiary), is an investment company and a wholly-owned subsidiary of the Master Fund. The Consolidated Schedule of Investments, Consolidated Statement of Assets and Liabilities, Consolidated Statement of Operations, Consolidated Statement of Changes in Net Assets, Consolidated Statement of Cash flows and the Consolidated Financial Highlights of the Master Fund include the accounts of its Subsidiary. All inter-company accounts and transactions have been eliminated in consolidation. The inception date of the Subsidiary was November 16, 2021. On March 31, 2023, the Subsidiary had net assets of $8,693,937 which equals 2.8% of the Master Fund’s total net assets.
B. Use of Estimates
The preparation of financial statements in conformity with GAAP requires management to make estimates and assumptions that affect the reported amounts of assets and liabilities and disclosure of contingent assets and liabilities at the date of the financial statements and the reported amounts of increases and decreases in net assets from operations during the reporting period. Actual results could differ from those estimates and the differences could be material.
C. Valuation of Investments
The Master Fund computes its net asset value (“NAV”) as of the last business day of each fiscal quarter and at such other times as deemed appropriate by the Adviser in accordance with valuation principles set forth below, or may be determined from time to time, pursuant to the valuation procedures (the “Procedures”) established by the Board.
The Board has approved the Procedures pursuant to which the Master Fund values its interests in the Portfolio Funds and other investments. In December 2020, the Securities and Exchange Commission
NB Crossroads Private Markets Fund VI Holdings LP
Notes to the Consolidated Financial Statements
March 31, 2023
("SEC") adopted Rule 2a-5 under the Investment Company Act, which establishes requirements for determining fair value in good faith for purposes of the Investment Company Act, including related oversight and reporting requirements. Effective as of the compliance date of September 8, 2022, the Board approved changes to the Procedures to comply with Rule 2a-5 and designated NBIA as the Master Fund’s valuation designee (as defined in the rule). The valuation designee, with assistance from NBAA, is responsible for determining fair value in good faith for any and all Fund investments, subject to oversight by the Board.
It is expected that most of the Underlying Investments in which the Master Fund invests will meet the criteria set forth under the Financial Accounting Standards Board (“FASB”) ASC Topic 820, Fair Value Measurement (“ASC 820”) permitting the use of the practical expedient to determine the fair value of the Underlying Investments. ASC 820 provides that, in valuing alternative investments that do not have quoted market prices but calculate NAV per share or equivalent, an investor may determine fair value by using the NAV reported to the investor by the Underlying Investment. To the extent ASC 820 is applicable to an Underlying Investment, the Adviser generally will value the Master Fund’s investment based primarily upon the value reported to the Master Fund by the Portfolio Fund or the lead investor of a Co-Investment as of each quarter-end, determined by the Underlying Investment in accordance with its own valuation policies.
FASB ASC 820 establishes a fair value hierarchy that prioritizes the inputs to valuation techniques used to measure fair value. The hierarchy gives the highest priority to unadjusted quoted prices in active markets for identical assets or liabilities (Level 1 measurements) and the lowest priority to unobservable inputs (Level 3 measurements). FASB ASC 820 provides three levels of the fair value hierarchy as follows:
| Level 1 | Unadjusted quoted prices in active markets for identical assets or liabilities that the Master Fund has the ability to access; |
| Level 2 | Observable inputs other than quoted prices included in Level 1 that are observable for the asset or liability either directly or indirectly. These inputs may include quoted prices for the identical instrument on an inactive market, prices for similar instruments, interest rates, prepayment speeds, credit risk, yield curves, default rates, and similar data; |
| Level 3 | Unobservable inputs for the asset or liability to the extent that relevant observable inputs are not available, representing the Master Fund’s own assumptions about the assumptions that a market participant would use in valuing the asset or liability, and that would be based on the best information available. |
Most Portfolio Funds are structured as closed-end, commitment-based private investment funds to which the Master Fund commits a specified amount of capital upon inception of the Portfolio Fund (i.e., committed capital) which is then drawn down over a specified period of the Portfolio Fund’s life. Such Portfolio Funds generally do not provide redemption options for investors and, subsequent to final closing, do not permit subscriptions by new or existing investors. Accordingly, the Master
NB Crossroads Private Markets Fund VI Holdings LP
Notes to the Consolidated Financial Statements
March 31, 2023
Fund generally holds interests in Portfolio Funds for which there is no active market, although, in some situations, a transaction may occur in the “secondary market” where an investor purchases a limited partner’s existing interest and remaining commitment.
Assumptions used by the Adviser due to the lack of observable inputs may significantly impact the resulting fair value and therefore the Master Fund’s results of operations and financial condition.
The following table presents the investments carried on the Consolidated Statement of Assets, Liabilities and Partners’ Capital – Net Assets by level within the valuation hierarchy as of March 31, 2023.
| | | Level 1 | | | Level 2 | | | Level 3 | | | Net Asset Value | | | Total | |
| Assets: | | | | | | | | | | | | | | | | | | | | |
| Large-cap Buyout | | $ | - | | | $ | - | | | $ | 4,829,495 | | | $ | 81,133,516 | | | $ | 85,963,011 | |
| Small and Mid-cap Buyout | | | - | | | | - | | | | 11,439,003 | | | | 157,138,032 | | | | 168,577,035 | |
| Special Situations | | | - | | | | - | | | | - | | | | 19,266,450 | | | | 19,266,450 | |
| Venture Capital | | | - | | | | - | | | | - | | | | 32,773,498 | | | | 32,773,498 | |
| Money Market Fund | | | 5,487,284 | | | | - | | | | - | | | | - | | | | 5,487,284 | |
| Total | | $ | 5,487,284 | | | $ | - | | | $ | 16,268,498 | | | $ | 290,311,496 | | | $ | 312,067,278 | |
Significant Unobservable Inputs
As of March 31, 2023, the Master Fund had investments valued at $312,067,278. The fair value of investments valued at $290,311,496 in the Master Fund's Consolidated Schedule of Investments have been valued at the unadjusted NAV reported by the managers of the investments.
The classification of an investment within Level 3 is based upon the significance of the unobservable inputs to the overall fair value measurement. The following table summarizes the valuation methodologies and inputs used for investments categorized in Level 3 as of March 31, 2023.
| | | | | | | | Unobservable Inputs |
| Investments | | Fair Value
03/31/23 | | | Valuation
Methodologies | | Variable | | Value/Range | | Weighted
Average1 |
| Large-cap Buyout | | $ | 4,829,495 | | | Market Comparables | | LTM EBITDA | | 21.0x | | 21.0x |
| | | | | | | | | | | | | |
| Small and Mid-cap Buyout | | | 9,693,003 | | | Market Comparables | | LTM EBITDA | | 12.5 - 15.0x | | 13.4x |
| | | | | | | | | | | | | |
| Small and Mid-cap Buyout | | | 1,746,000 | | | Market Comparables | | LTM Net Revenue | | 12.0x | | 12.0x |
| | | | | | | | | | | | | |
| Total | | $ | 16,268,498 | | | | | | | | | |
1 Inputs weighted based on fair value of investments in range.
During the year ended March 31, 2023, purchases of and sales from Level 3 investments were as follows:
| Purchases | | | Sales | |
| $ | 1,419,531 | | | $ | - | |
During the year ended March 31, 2023, unrealized depreciation and realized gains from Level 3 investments were $2,471,508 and $0, respectively.
NB Crossroads Private Markets Fund VI Holdings LP
Notes to the Consolidated Financial Statements
March 31, 2023
The Master Fund recognizes transfers into and out of the levels indicated above at the end of the reporting period. There were no transfers into or out of Level 3 during the year ended March 31, 2023.
The estimated remaining life of the Master Fund’s Portfolio Funds as of March 31, 2023 is one to ten years, with the possibility of extensions by each of the Underlying Investments.
D. Cash and Cash Equivalents
Cash and cash equivalents consist primarily of cash and short term investments which are readily convertible into cash and have an original maturity of three months or less. UMB Bank N.A. serves as the Master Fund’s custodian.
Cash and cash equivalents can include deposits in money market accounts, which are classified as Level 1 assets. As of March 31, 2023, the Master Fund held $5,487,284, in an overnight sweep that is deposited into a money market account.
Cash and cash equivalents are subject to credit risk to the extent those balances exceed applicable Securities Investor Protection Corporations (“SIPC”) or Federal Deposit Insurance Corporation (“FDIC”) limitations.
E. Investment Gains and Losses
The Master Fund records distributions of cash or in-kind securities from the Underlying Investments based on the information from distribution notices when distributions are received. The Master Fund recognizes within the Consolidated Statement of Operations its share of realized gains or (losses), the Master Fund’s change in net unrealized appreciation/(depreciation) and the Master Fund’s share of net investment income or (loss) based upon information received regarding distributions from managers of the Underlying Investments. The Master Fund may also recognize realized losses based upon information received from the Underlying Investment managers for write-offs taken in the underlying portfolio. Changes in unrealized appreciation/(depreciation) on investments within the Consolidated Statement of Operations includes the Master Fund’s share of interest and dividends, realized (but undistributed) and unrealized gains and losses on security transactions, and expenses of each Underlying Investment.
The Underlying Investments may make in-kind distributions to the Master Fund and, particularly in the event of a dissolution of an Underlying Investment, such distributions may contain securities that are not marketable. While the general policy of the Master Fund will be to liquidate such investment and distribute proceeds to Partners, under certain circumstances when deemed appropriate by the Board, a Partner may receive in-kind distributions from the Master Fund.
F. Income Taxes
The Master Fund has elected to be treated for U.S. federal income tax purposes as a regulated investment company (“RIC”) under Subchapter M of the Internal Revenue Code of 1986, as amended (the “Code”), with a tax year end of September 30. If the Master Fund were to fail to meet the requirements of Subchapter M to qualify as a RIC, and if the Master Fund were ineligible to or otherwise unable to cure such failure, the Master Fund would be subject to tax
NB Crossroads Private Markets Fund VI Holdings LP
Notes to the Consolidated Financial Statements
March 31, 2023
on its taxable income at corporate rates, whether or not distributed to Partners, and all distributions out of earnings and profits would be taxable to Partners as ordinary income. In addition, the Master Fund could be required to recognize unrealized gains, pay substantial taxes and interest, and make substantial distributions before re-qualifying as a RIC under Subchapter M. The Master Fund intends to comply with the requirements under Subchapter M and to distribute substantially all of its taxable income and gains to Partners and to meet certain diversification and income requirements with respect to its underlying investments. As of March 31, 2023 there is no provision for federal income or excise tax within the financial statements.
Differences arise in the computation of Partners’ capital for financial reporting in accordance with GAAP and Partners' capital for federal and state income tax reporting. These differences are primarily due to the fact that changes in unrealized gains and losses are allocated for financial reporting purposes and are not allocated for federal and state income tax reporting purposes. The cost of the Underlying Investments for federal income tax purposes is based on amounts reported to the Master Fund on Schedule K-1 from the Underlying Investments. For the tax year ended September 30, 2022, permanent book to tax reclassifications have resulted in an increase to Partners' distributable earnings of $2,474,183 and a decrease to Partners' Capital Paid in of $2,474,183. As of September 30, 2022, the Fund had a late-year ordinary loss of $5,902,248, which is deferred until the next taxable year.
For the tax year ended September 30, 2022, the components of distributable earnings on a tax basis are as follows:
| Net tax appreciation (depreciation) | | $ | 40,646,656 | |
| Other differences | | | (6,193,732 | ) |
| Total distributable earnings | | $ | 34,452,924 | |
As of March 31, 2023, the federal tax cost of investments and unrealized appreciation (depreciation) are as follows:
| Gross unrealized appreciation | | $ | 73,613,565 | |
| Gross unrealized depreciation | | | (15,918,744 | ) |
| Net unrealized appreciation | | $ | 57,694,821 | |
| Tax cost of investments | | $ | 248,885,173 | |
The tax character of the distributions made during the year ended March 31, 2023 were as follows:
| Ordinary Income | | | Long-Term Capital Gains | | | Short Term Capital Gains | |
| $ | 0 | | | $ | 2,092,936 | | | $ | 0 | |
The Master Fund files tax returns as prescribed by the tax laws of the jurisdictions in which it operates. In the normal course of business, the Master Fund is subject to examination by federal, state, local and foreign jurisdictions, where applicable. As of March 31, 2023, the tax years that remain subject to examination by the major tax jurisdictions under the statute of limitations is from the year 2020 forward (with limited exceptions). FASB ASC 740-10, Income Taxes requires the
NB Crossroads Private Markets Fund VI Holdings LP
Notes to the Consolidated Financial Statements
March 31, 2023
Adviser to determine whether a tax position of the Master Fund is more likely than not to be sustained upon examination by taxing authorities, based on the technical merits of the position. The Adviser has reviewed the Master Fund’s tax positions for the current tax year and has concluded that no provision for taxes is required in the Master Fund’s financial statements for the year ended March 31, 2023. The Master Fund recognizes interest and penalties, if any, related to unrecognized tax liabilities as income tax expense in the Consolidated Statement of Operations. During the year ended March 31, 2023, the Master Fund did not incur any interest or penalties.
The Subsidiary is a domestic limited liability company that is treated as a corporation for tax reporting and has a tax year end of September 30. The Subsidiary is subject to federal, state and local income taxes. As of March 31, 2023, the Subsidiary has recorded a total deferred tax payable of $28,259.
G. Restrictions on Transfers
Interests of the Master Fund (“Interests”) are generally not transferable. No Partner may assign, sell, transfer, pledge, hypothecate or otherwise dispose of any of its Interests without the prior written consent of the Board which may be granted or withheld in the Board’s sole discretion, and in compliance with applicable securities and tax laws.
H. Fees of the Underlying Investments
Each Underlying Investment will charge its investors (including the Master Fund) expenses, including asset-based management fees and performance-based fees, which are referred to as an allocation of profits. In addition to the Master Fund level expenses shown on the Master Fund’s Consolidated Statement of Operations, Partners of the Master Fund will indirectly bear the fees and expenses charged by the Underlying Investments. These fees are reflected in the valuations of the Underlying Investments and are not reflected in the ratios to average net assets in the Master Fund’s Financial Highlights.
I. Master Fund Expenses
The Master Fund bears all expenses incurred in the course of business on an accrual basis, including, but not limited to, the following: Advisory Fees (as defined herein); investment related expenses; legal fees; administration; auditing; tax preparation fees; custodial fees; cost of insurance; registration expenses; Independent Directors’ fees (as defined herein); and expenses of meetings of the Board.
J. Organizational and Offering Costs
Organization and offering costs are costs incidental to the organization, issuing and marketing of interests in a partnership and are non-recurring in nature. The Master Fund shall bear its organizational expenses, and expenses relating to the offering and sale of interests only to the extent such expenses when aggregated with those of the Master Fund’s feeder funds exceed $400,000, as the initial $400,000 shall be borne by the Registered Investment Adviser. In addition, if such aggregated expenses exceed $1,000,000, the excess amount over $1,000,000 shall be borne by the Registered Investment Adviser. For the year ended March 31, 2023, the Master Fund has incurred no organizational and offering costs.
NB Crossroads Private Markets Fund VI Holdings LP
Notes to the Consolidated Financial Statements
March 31, 2023
K. Foreign Currency Translation
The Master Fund has foreign investments which require the Master Fund to translate these investments into U.S. dollars. For foreign investments for which the functional currency is not the U.S. dollar, the fair values of the investments are translated into the U.S. dollar equivalent using period end exchange rates. The resulting translation adjustments are recorded as unrealized appreciation or depreciation on investments.
Contributed capital to and distributions received from these foreign Portfolio Funds are translated into the U.S. dollar equivalent using exchange rates on the date of the transaction.
Conversion gains and losses resulting from changes in foreign exchange rates during the reporting period and gains and losses realized upon settlement of foreign currency transactions are reported in the Consolidated Statement of Operations. The Master Fund does not isolate the portion of the results of operations arising as a result of changes in foreign exchange rates on investment transactions from the fluctuations arising from changes in the fair value of these investments.
3. Advisory Fee, Administration Service Fee and Related Party Transactions
The Registered Investment Adviser provides investment advisory services to the Master Fund and incurs research, travel and other expenses related to the selection and monitoring of Portfolio Funds. Further, the Registered Investment Adviser provides certain management and administrative services to the Feeder Funds, including providing office space and other support services, maintaining files and records, and preparing and filing various regulatory materials. In consideration for such services, the Master Fund pays the Registered Investment Adviser an investment advisory fee (the "Advisory Fee") quarterly in arrears based on an annual rate of 0.80% following the Master Fund’s commencement of operations through the end of year eight; and then 0.15% for the remaining life of the Master Fund, in each case based on the Master Fund’s invested capital. For the year ended March 31, 2023, the Master Fund incurred Advisory Fees totaling $2,005,971.
Pursuant to an Administrative and Accounting Services Agreement, the Master Fund retains UMB Fund Services, Inc. (the “Administrator”), a subsidiary of UMB Financial Corporation, to provide administration, custodial, accounting, tax preparation and investor services to the Master Fund. In consideration for these services, the Master Fund pays the Administrator a tiered fee between 0.01% and 0.02%, based on the first day of each calendar quarter’s net assets, subject to a minimum quarterly fee. In accordance with the service level agreement additional fees may be charged for out of scope services and quarterly filings made on behalf of the Master Fund. For the year ended March 31, 2023, the Master Fund incurred administration service fees totaling $220,957.
The Board consists of six directors, each of whom is not an “interested person” of the Master Fund as defined by Section 2(a)(19) of the Investment Company Act (the “Independent Directors”). Currently, the Independent Directors are each paid an annual retainer of $175,000 for serving on the boards of the funds in the fund complex. Compensation to the Board is paid and expensed by the Master Fund on a quarterly basis. The Independent Directors are also reimbursed for out of pocket
NB Crossroads Private Markets Fund VI Holdings LP
Notes to the Consolidated Financial Statements
March 31, 2023
expenses in connection with providing their services to the Master Fund. For the year ended March 31, 2023, the Master Fund incurred $160,937 in Independent Directors’ fees.
4. Capital Commitments from Partners
At March 31, 2023 and 2022, capital commitments from Partners totaled $376,959,339 and $376,959,339. Capital contributions received by the Master Fund with regard to satisfying Partner commitments totaled $265,756,335 and $212,982,027, which represents approximately 70.5% and 56.5% of committed capital at March 31, 2023 and 2022, respectively.
Capital contributions will be credited to Partners’ capital accounts and units will be issued when paid. Capital contributions will be determined based on a percentage of commitments. During the year ended March 31, 2023 and 2022, the Master Fund issued 43,968.09 and 122,917.39 units, respectively.
The net profits or net losses of the Master Fund are allocated to Partners in a manner that takes into account the amount of cash that would be distributed based upon a hypothetical liquidation, such that allocations are based on Partners’ percentage interests, as defined in the Master Fund’s LP Agreement.
Distributions shall be made of available cash (net of reserves that the Board deems reasonable) or other net investment proceeds to Partners at such times and in such amounts as determined by the Board of Directors in its sole discretion and in accordance with Partners’ respective percentage interests, as defined in the LP Agreement. As of March 31, 2023, the Master Fund had distributed $2,092,936 to Partners. Distributions from the Master Fund are made in the following priority:
(a) First, to Partners of the Master Fund until they have received a 125% return of all drawn capital commitments; and
(b) Then, 7% to the Special Limited Partner (as defined in Note 1), if the Master Fund reaches an allocation of at least 40% of its total capital commitments entered into with respect to Portfolio Funds and Co-Investments (“Underlying Commitments”) to Secondary Investments and Co-Investments combined; 6.75% if the Master Fund’s allocation to Secondary Investments and Co-Investments is at least 35% but less than 40% of Underlying Commitments; and 6.5% if the allocation is below 35% of Underlying Commitments. The Special Limited Partner will not collect any of the incentive carried interest that it may have earned until after the fourth anniversary of the final closing.
Incentive carried interest is accrued based on the NAV of the Feeder Funds at each quarter-end as an allocation of profits, to the extent there is an amount to be accrued. The Consolidated Statement of Changes in Partners’ Capital – Net Assets discloses the amount payable and paid to the Special Limited Partner in the period in which it occurs. At March 31, 2023, there was no accrued Incentive Carried Interest.
NB Crossroads Private Markets Fund VI Holdings LP
Notes to the Consolidated Financial Statements
March 31, 2023
5. Capital Commitments of the Master Fund to Investments
As of March 31, 2023, the Master Fund had total capital commitments of $366,143,841 to the investments with remaining unfunded commitments to the investments totaling $100,381,371 as listed below:
| Assets: | | Unfunded
Commitment | |
| Large-cap Buyout | | | 20,258,321 | |
| Small and Mid-cap Buyout | | | 56,597,576 | |
| Special Situations | | | 7,136,332 | |
| Venture Capital | | | 16,389,142 | |
| Total | | $ | 100,381,371 | |
6. Description of the Investments
Due to the nature of the Underlying Investments, the Master Fund generally cannot liquidate its positions in the investments except through distributions from the Underlying Investments, which are made at the discretion of the Portfolio Funds or sponsor of the Co-Investment. The Master Fund has no right to demand repayment of its investment in the Portfolio Funds or Co-Investments.
7. Line of Credit
The Master Fund entered into a revolving line of credit agreement (the “Credit Agreement”) with Bank OZK, dated July 1, 2020, under which the Master Fund can borrow an aggregate principal amount of $25,000,000 for the temporary financing of investments and payment of expenses under the specified terms. The line of credit is secured by the Master Fund’s unfunded Partners’ capital commitments. The Credit Agreement has a maturity date of June 30, 2023.
As of March 31, 2023, there is outstanding principal of $0 owed to the bank by the Master Fund. Interest is charged on the outstanding principal amount at a rate per annum that is the aggregate of the applicable margin and London Interbank Offered Rate (“LIBOR”). Additionally, a commitment fee is charged on the daily unused portion. During the year ended March 31, 2023, the Master Fund had an average outstanding principal of $4,961,644, with an average interest rate of 6.8%. During the year, the Master Fund incurred $349,431 of interest expense, as presented in the Consolidated Statement of Operations. In relation to entering the Credit Agreement, the Master Fund incurred origination fees and other legal costs (“Financing Costs”). These Financing Costs will be amortized over the term of the loan. For the year ended March 31, 2023, the Master Fund expensed $107,645 of Financing Costs as shown in the Consolidated Statement of Operations.
8. Indemnifications
In the normal course of business, the Master Fund enters into contracts that provide general indemnifications. The Master Fund’s maximum exposure under these agreements is dependent on future claims that may be made against the Master Fund, and therefore cannot be established;
NB Crossroads Private Markets Fund VI Holdings LP
Notes to the Consolidated Financial Statements
March 31, 2023
however, based on the Registered Investment Adviser’s experience, the risk of loss from such claims is considered remote.
Many of the Portfolio Funds’ partnership agreements contain provisions that allow them to recycle or recall distributions made to the Master Fund. Accordingly, the unfunded commitments disclosed under Note 5 reflect both amounts undrawn to satisfy commitments and distributions that are recallable, as applicable.
9. Concentrations of Market, Credit, Liquidity, Industry, Currency and Capital Call Risk
Due to the inherent uncertainty of valuations, estimated values may differ significantly from the values that would have been used had a ready market for the securities existed, and the difference could be material. The Master Fund’s investments are subject, directly or indirectly, to various risk factors including market, credit, industry, currency and capital call risk. Certain investments are made internationally, which may subject the investments to additional risks resulting from political or economic conditions in such countries or regions and the possible imposition of adverse governmental laws or currency exchange restrictions affecting such countries or regions. Market risk represents the potential loss in value of financial instruments caused by movements in market variables, such as interest and foreign exchange rates and equity prices. The Master Fund may have a concentration of investments, as permitted by its registration statement, in a particular industry or sector. Investment performance of the sector may have a significant impact on the performance of the Master Fund. The Master Fund’s investments are also subject to the risk associated with investing in private equity securities. The investments in private equity securities are illiquid, can be subject to various restrictions on resale, and there can be no assurance that the Master Fund will be able to realize the value of such investments in a timely manner if at all.
The Master Fund believes that its liquidity and capital resources are adequate to satisfy its operational needs as well as the continuation of its investment program.
If the Master Fund defaults on its commitment or fails to satisfy capital calls, it will be subject to significant penalties, including the complete forfeiture of the Master Fund’s investment in the Underlying Investment. This may impair the ability of the Master Fund to pursue its investment program, force the Master Fund to borrow or otherwise impair the value of the Master Fund’s investments (including the complete devaluation of the Master Fund). In addition, defaults by Partners on their commitments to the Master Fund, may cause the Master Fund to, in turn, default on its commitment to a Underlying Investment. In this case, the Master Fund, and especially the non-defaulting Partners, will bear the penalties of such default as outlined above. While the Registered Investment Adviser has taken steps to mitigate this risk, there is no guarantee that such measures will be sufficient or successful.
10. Subsequent Events
The Master Fund has evaluated all events subsequent to March 31, 2023, through the date these financial statements were available to be issued and has determined that there were no subsequent events that require disclosure.
 | KPMG LLP Two Financial Center 60 South Street Boston, MA 02111 | |
Report of Independent Registered Public Accounting Firm
To the Partners and Board of Directors
NB Crossroads Private Markets Fund VI Holdings LP:
Opinion on the Consolidated Financial Statements
We have audited the accompanying consolidated statement of assets, liabilities and partners’ capital - net assets of NB Crossroads Private Markets Fund VI Holdings LP (the Partnership), including the consolidated schedule of investments, as of March 31, 2023, the related consolidated statements of operations and cash flows for the year then ended, the consolidated statements of changes in partners’ capital - net assets for each of the years in the two-year period then ended, and the related notes (collectively, the consolidated financial statements) and the consolidated financial highlights for each of the years in the three-year period then ended and the period from February 14, 2020 (commencement of operations) through March 31, 2020. In our opinion, the consolidated financial statements and consolidated financial highlights present fairly, in all material respects, the financial position of the Partnership as of March 31, 2023, the results of its operations and its cash flows for the year then ended, the changes in its partners’ capital for each of the years in the two-year period then ended, and the financial highlights for each of the years in the three-year period then ended and the period from February 14, 2020 through March 31, 2020, in conformity with U.S. generally accepted accounting principles.
Basis for Opinion
These consolidated financial statements and consolidated financial highlights are the responsibility of the Partnership's management. Our responsibility is to express an opinion on these consolidated financial statements and consolidated financial highlights based on our audits. We are a public accounting firm registered with the Public Company Accounting Oversight Board (United States) (PCAOB) and are required to be independent with respect to the Partnership in accordance with the U.S. federal securities laws and the applicable rules and regulations of the Securities and Exchange Commission and the PCAOB.
We conducted our audits in accordance with the standards of the PCAOB. Those standards require that we plan and perform the audit to obtain reasonable assurance about whether the consolidated financial statements and consolidated financial highlights are free of material misstatement, whether due to error or fraud. Our audits included performing procedures to assess the risks of material misstatement of the consolidated financial statements and consolidated financial highlights, whether due to error or fraud, and performing procedures that respond to those risks. Such procedures included examining, on a test basis, evidence regarding the amounts and disclosures in the consolidated financial statements and consolidated financial highlights. Such procedures also included confirmation of securities owned as of March 31, 2023, by correspondence with underlying fund managers and portfolio companies or by other appropriate auditing procedures where replies from underlying fund managers and portfolio companies were not received. Our audits also included evaluating the accounting principles used and significant estimates made by management, as well as evaluating the overall presentation of the consolidated financial statements and consolidated financial highlights. We believe that our audits provide a reasonable basis for our opinion.
/s/ KPMG LLP
We have served as the auditor for one or more NB Private Markets/NB Crossroads Private Markets investment companies since 2016.
Boston, Massachusetts
May 26, 2023 | KPMG LLP, a Delaware limited liability partnership and a member firm of the KPMG global organization of independent member firms affiliated with KPMG International Limited, a private English company limited by guarantee. | |
NB Crossroads Private Markets Fund VI Holdings LP
Investment Program
March 31, 2023 (Unaudited)
Investment Objective and Process
The investment objective of NB Crossroads Private Markets Fund VI Holdings LP (the "Master Fund") is to provide attractive risk-adjusted returns to investors ("Investors"). The Master Fund seeks to achieve its investment objective principally by making primary investments (each, a "Primary Investment") in a portfolio of newly formed, third party private equity funds ("Portfolio Funds") managed by various experienced unaffiliated asset managers that generally have an established track record. The Master Fund will also opportunistically invest in "secondary investments" in Portfolio Funds acquired in privately negotiated transactions from investors in these Portfolio Funds typically after the end of the Portfolio Fund's fundraising period (each, a "Secondary Investment") and invest directly in equity or debt securities of portfolio companies alongside Portfolio Funds and other private equity firms (each, a "Co-Investment"). Neuberger Berman Investment Advisers LLC (the "Investment Adviser") believes the coupling of Secondary Investments and Co-Investment activities with Primary Investments should enhance and accelerate investment returns and offers Investors an opportunity to gain exposure to a broad range of private equity investment opportunities in the United States, Europe, Asia and emerging markets around the world.
Each of NB Crossroads Private Markets Fund VI LP and NB Crossroads Private Markets Fund VI Advisory LP (each, a "Feeder Fund") invests all or substantially all of its assets in the Master Fund. The Master Fund has the same investment objective, investment policies and restrictions as those of the Feeder Funds. This form of investment structure is commonly known as a "master/feeder" structure.
Each of the Feeder Funds and the Master Fund is a non-diversified fund under the Investment Company Act of 1940, as amended. However, the Master Fund generally will not commit more than 25% of the value of total capital commitments ("Commitment") by Investors (measured at the time of the Commitment) in a single Portfolio Fund.
The Investment Adviser serves as investment adviser of the Master Fund. The Investment Adviser has engaged NB Alternatives Advisers LLC (the "Sub-Adviser" and, together with the Investment Adviser, the "Adviser") to make investment decisions on behalf of the Master Fund. The Investment Adviser and the Sub-Adviser are indirect wholly-owned subsidiaries of Neuberger Berman Group LLC. None of the Master Fund, the Feeder Funds or the Adviser guarantees any level of return or risk on investments and there can be no assurance that the Master Fund's investment objective will be achieved.
Principal Risk Factors
Information on the risk factors associated with investments in the Master Fund is incorporated herein by reference from the section entitled "Investment Program – Principal Risk Factors" in NB Crossroads Private Markets Fund VI LP's annual report to shareholders for the fiscal year ended March 31, 2023, as filed with the Securities and Exchange Commission (File No. 811-23365) (the "Client Feeder Annual Report").
NB Crossroads Private Markets Fund VI Holdings LP
Investment Program
March 31, 2023 (Unaudited)
Recent Changes
Information on certain changes since March 31, 2022 is incorporated herein by reference from the section entitled "Investment Program – Recent Changes" in the Client Feeder Annual Report.
NB Crossroads Private Markets Fund VI Holdings LP
Supplemental Information
March 31, 2023 (Unaudited)
Proxy Voting and Portfolio Holdings
A description of the Master Fund’s policies and procedures used to determine how to vote proxies relating to the Master Fund’s portfolio securities, as well as information regarding proxy votes cast by the Master Fund (if any) during the most recent twelve month period ended June 30, is available without charge, upon request, by calling the Master Fund at 212-476-8800 or on the website of the Securities and Exchange Commission (the “SEC”) at http://www.sec.gov. The Master Fund did not receive any proxy solicitations during the year ended March 31, 2023.
The Master Fund files a complete schedule of portfolio holdings on Form N-PORT with the SEC for the first and third quarters of each fiscal year. The Master Fund’s N-PORT filings are available in the EDGAR database on the SEC’s website at www.sec.gov or by calling Neuberger Berman at 212-476-8800.
NB Crossroads Private Markets Fund VI Holdings LP
Board of Directors of the Master Fund
March 31, 2023 (Unaudited)
Information pertaining to the Board of Directors of the Master Fund is set forth below.
Name, Position(s) Held,
Address, and Year of Birth | Term of Office
and Length of
Time Served | Principal Occupation During Past 5
Years | Number of
Funds in Fund
Complex*
Overseen by
Director | Other Directorships Held by Director During
Past 5 Years |
| Disinterested Directors |
| | | | | |
Virginia G. Breen, Director
1290 Avenue of the Americas
New York, NY 10104
(1964) | Term Indefinite – Since Inception | Private investor and board member of certain entities (as listed herein). | 21 | Director of Jones Lang LaSalle Property Trust, Inc.; Trustee/Director of UBS A&Q Registered Fund Complex (3 funds); Director of Calamos Fund Complex (26 funds); Director of Paylocity Holding Corp. |
| | | | | |
Alan Brott, Director
1290 Avenue of the Americas
New York, NY 10104
(1942) | Term Indefinite – Since Inception | Consultant (since 10/1991). | 21 | Director of Grosvenor Registered Multi- Strategy Funds (3 funds); Director of Hedge Fund Guided Portfolio Solution (part of the Grosvenor complex); Director of Stone Harbor Investment Funds (8 funds) (2007-2022); Manager of Man FRM Alternative Multi-Strategy Fund LLC (8/09 to 8/21). |
| | | | | |
Victor F. Imbimbo, Jr., Director
1290 Avenue of the Americas
New York, NY 10104
(1952) | Term Indefinite – Since Inception | President and CEO of Caring Today, LLC, an information and support resource for the family caregiver market. | 21 | Manager of Man FRM Alternative Multi-Strategy Fund LLC (10/00 to 8/21). |
| | | | | |
Thomas F. McDevitt, Director
1290 Avenue of the Americas
New York, NY 10104
(1956) | Term Indefinite – Since Inception | Managing Partner of Edgewood Capital Partners and President of Edgewood Capital Advisors (5/2002 to present). | 21 | Director of Jones Lang LaSalle Property Trust, Inc. (12/04 to 06/15). |
| | | | | |
| | | | | |
Stephen V. Murphy, Director
1290 Avenue of the Americas
New York, NY 10104
(1945) | Term Indefinite – Since Inception | President of S.V. Murphy & Co, an investment banking firm. | 21 | Director of The First of Long Island Corporation and The First National Bank of Long Island; Manager of Man FRM Alternative Multi-Strategy Fund LLC (10/00 to 8/21). |
| | | | | |
Thomas G. Yellin, Director
1290 Avenue of the Americas
New York, NY 10104
(1954) | Term Indefinite – Since Inception | President of The Documentary Group (since 6/2006). | 21 | Director of Grosvenor Registered Multi-Strategy Funds (3 funds); Director of Hedge Fund Guided Portfolio Solution (part of the Grosvenor complex); Manager of Man FRM Alternative Multi-Strategy Fund LLC (8/09 to 8/21). |
| | | | | |
| Interested Director |
| | | | | |
James D. Bowden**, Director
1290 Avenue of the Americas
New York, NY 10104
(1953) | Term Indefinite – Since April 2023 | Managing Director, NBAA (2015 - 2023). | 18 | None. |
| | | | | |
| * The ‘‘Fund Complex’’ consists of NB Private Markets Fund II (Master) LLC, NB Private Markets Fund II (TI) LLC, NB Private Markets Fund II (TE) LLC, NB Private Markets Fund III (Master) LLC, NB Private Markets Fund III (TI) LLC, NB Private Markets Fund III (TE) LLC, NB Crossroads Private Markets Fund IV (TI) – Client LLC, NB Crossroads Private Markets Fund IV (TE) – Client LLC, NB Crossroads Private Markets Fund IV Holdings LLC, NB Crossroads Private Markets Fund V Holdings LP, NB Crossroads Private Markets Fund V (TE) LP, NB Crossroads Private Markets Fund V (TE) Advisory LP, NB Crossroads Private Markets Fund V (TI) LP, NB Crossroads Private Markets Fund V (TI) Advisory LP, NB Crossroads Private Markets Fund VI Holdings LP, NB Crossroads Private Markets Fund VI LP, NB Crossroads Private Markets Fund VI Advisory LP, NB Crossroads Private Markets Fund VII Holdings LP, NB Crossroads Private Markets Fund VII LP, NB Crossroads Private Markets Fund VII Advisory LP and NB Crossroads Private Markets Access Fund LLC. |
| | | | | |
| ** Mr. Bowden is deemed to be an “interested person” (as defined in the Investment Company Act) of the Partnership because of his prior position at NBAA. Mr. Bowden does not serve on the Board’s Audit or Nominating Committees. |
NB Crossroads Private Markets Fund VI Holdings LP
Officers of the Master Fund
March 31, 2023 (Unaudited)
Information pertaining to the Officers of the Master Fund is set forth below.
| Name, Address* and Age | Position(s)
Held with the
Company | Term of Office and
Length of Time
Served | Principal Occupation During Past 5
Years |
| Officers who are not Directors |
| | | | |
Peter von Lehe
(1968) | President | Term — Indefinite; Length — since 2023 | Head of Investments Solutions and Strategy, Managing Director, NBAA, since 2006. |
| | | | |
Mark Bonner
(1977) | Treasurer | Term — Indefinite; Length — since inception | Senior Vice President, NBAA, since 2015. Formerly, Senior Vice President, Bank of America; Merrill Lynch Alternative Investments LLC (2006-2015); Manager, Advent International Corporation (2004-2006); Senior Associate, PricewaterhouseCoopers LLP (1999-2004). |
| | | | |
Claudia A. Brandon
(1956) | Executive Vice President and Secretary | Term — Indefinite; Length — since inception | Senior Vice President, Neuberger Berman LLC, since 2007. |
| | | | |
Patrick Deaton
(1978) | Chief Operating Officer | Term — Indefinite; Length — since 2023 | Managing Director, Neuberger Berman LLC, since 2018, Chief Operating Officer, NBAA, since 2023. Formerly, Chief Administrative Officer, NBAA (2021-2023), Chief Operating Officer and Head of Operational Due Diligence – NBAIM (2010-2021). |
| | | | |
Sarah Doane
(1989) | Assistant Treasurer | Term — Indefinite; Length — since 2020 | Vice President, Neuberger Berman LLC, since 2022 and Employee since 2016. |
| | | | |
Savonne Ferguson
(1973) | Chief Compliance Officer | Term — Indefinite; Length — since 2018 | Senior Vice President, Neuberger Berman LLC, Chief Compliance Officer (Mutual Funds) and Associate General Counsel, NBIA, since November 2018. Formerly, Vice President, T. Rowe Price Group, Inc. (2018), Vice President and Senior Legal Counsel, T. Rowe Price Associates, Inc. (2014-2018). |
NB Crossroads Private Markets Fund VI Holdings LP
Officers of the Master Fund
March 31, 2023 (Unaudited)
Information pertaining to the Officers of the Master Fund is set forth below.
| Name, Address* and Age | Position(s)
Held with the
Company | Term of Office and
Length of Time
Served | Principal Occupation During Past 5
Years |
| Officers who are not Directors |
| |
Corey A. Issing
(1978) | Chief Legal Officer (only for purposes of sections 307 and 406 of the Sarbanes-Oxley Act of 2002) | Term — Indefinite; Length — since inception | General Counsel and Head of Compliance – Mutual Funds since 2016 and Managing Director, NBIA, since 2017. |
| | | | |
Sheila James
(1965) | Assistant Secretary | Term — Indefinite; Length — since inception | Senior Vice President, Neuberger Berman LLC, since 2023. Formerly, Vice President, Neuberger Berman LLC (2008-2023). |
| | | | |
Maura Reilly Kennedy
(1978) | Vice President | Term — Indefinite; Length — since 2023 | Managing Director, NBAA, since 2018. Formerly Principal, NBAA (2014-2018). |
| | | | |
Brian Kerrane
(1969) | Vice President | Term — Indefinite; Length — since inception | Managing Director, Neuberger Berman LLC, since 2013; Chief Operating Officer – Mutual Funds and Managing Director, NBIA, since 2015. |
| | | | |
Josephine Marone
(1963) | Assistant Secretary | Term — Indefinite; Length — since inception | Senior Paralegal, Neuberger Berman LLC, since 2007. |
| | | | |
Michael Smith
(1984) | Vice President | Term — Indefinite; Length — since 2023 | Managing Director, NBAA, since 2022. Formerly Principal, NBAA (2018-2022). |
| | | | |
| * The business address of each listed person is 1290 Avenue of the Americas, New York, NY 10104, except for Mark Bonner, Sarah Doane and Michael Smith, whose business address is 53 State Street, 13th Floor, Boston, MA 02109. |
All officers of the Master Fund are employees and/or officers of the Registered Investment Adviser. Officers of the Master Fund are elected by the Directors and hold office until they resign, are removed or are otherwise disqualified to serve.
Alternative investments are sold to qualified investors only by a Confidential Offering Memorandum. An investment in an alternative investment fund is speculative and should not constitute a complete investment program. The information presented in this report is current as of the date noted, is for information purposes only and does not constitute an offer to sell or a solicitation of an offer to buy interests in the Master Fund. This is not, and under no circumstances is to be construed as, an offer to sell or a solicitation to buy any of the securities or investments referenced, nor does this information constitute investment advice or recommendations with respect to any of the securities or investments used. Past performance is no guarantee of future results. Additional information is available upon request.
(b) Not applicable to the Registrant.
Item 2. Code of Ethics.
The Registrant (or the “Fund”) has adopted a code of ethics that applies to the Registrant’s principal executive officer, principal financial officer, principal accounting officer or controller, or persons performing similar functions. During the period covered by this report, there were no substantive amendments to or waivers from the code of ethics. A copy of the Code of Ethics is incorporated by reference to NB Private Markets Fund III (Master) LLC’s Form N-CSR, Investment Company Act file number 811-22816 (filed June 09, 2023). The Code of Ethics is also available, without charge, by calling 1-800-877-9700 (toll-free).
Item 3. Audit Committee Financial Expert.
The Board of Directors (the “Board”) of the Registrant has determined that Alan Brott and Stephen V. Murphy possess the technical attributes to qualify as the audit committee's financial experts and that each of them is an "independent" Director pursuant to paragraph (a)(2) of Item 3 on Form N-CSR.
Item 4. Principal Accountant Fees and Services.
KPMG, LLP serves as independent registered public accounting firm to the Registrant.
(a) Audit Fees
The aggregate fees, billed for professional services rendered by the Registrant's principal accountant for the audit of the Registrant's annual financial statements and security counts required under Rule 17f-2 of the Investment Company Act of 1940 (the "1940 Act") for the fiscal year ended March 31, 2022 and March 31, 2023 was $148,850 and $155,400, respectively.
(b) Audit-Related Fees
There were no audit-related services provided by the principal accountant to the Registrant for the last fiscal year.
(c) Tax Fees
The principal accountant for the audit of the Registrant's annual financial statements billed no fees for tax compliance, tax advice or tax planning services to the Registrant during the last fiscal year.
(d) All Other Fees
The principal accountant billed no other fees to the Registrant during the last fiscal year.
(e) (1) During its regularly scheduled periodic meetings, the Registrant's audit committee will pre-approve all audit, audit-related, tax and other services to be provided by the principal accountants of the Registrant. The audit committee has delegated pre-approval authority to its Chairman for any subsequent new engagements that arise between regularly scheduled meeting dates provided that any such pre-approved fees are presented to the audit committee at its next regularly scheduled meeting.
(e) (2) None of the services described in paragraphs (b)-(d) above were approved by the Registrant’s audit committee pursuant to the “de minimis exception” in paragraph (c)(7)(i)(C) of Rule 2-01 of Regulation S-X.
(f) Not applicable.
(g) The amount of non-audit fees that were billed by the Registrant's accountant for services rendered to:
(i) the Registrant, and (ii) the Registrant's investment adviser and any control person of the adviser that provides ongoing services to the Registrant for the fiscal year ended March 31, 2022 and March 31, 2023 were $0 and $0, respectively.
(h) The Registrant's audit committee has considered whether the provision of non-audit services that may be rendered to the Registrant's investment adviser, and any entity controlling, controlled by, or under common control with the investment adviser that provides ongoing services to the Registrant that were not pre-approved pursuant to paragraph (c)(7)(ii) of Rule 2-01 of Regulation S-X is compatible with maintaining the principal accountant’s independence. No such services were rendered.
(i) Not applicable.
(j) Not applicable.
Item 5. Audit Committee of Listed Registrants.
Not applicable.
Item 6. Schedule of Investments.
(a) The Schedule of Investments is included as part of the report to partners filed under Item 1 of this form.
(b) Not applicable.
Item 7. Disclosure of Proxy Voting Policies and Procedures for Closed-End Management Investment Companies.
Subject to the Board’s oversight, the Registrant has delegated responsibility to vote any proxies the Registrant may receive to the Investment Adviser, Neuberger Berman Investment Advisers LLC (“NBIA”).
NBIA is required by the Board to vote proxies related to portfolio securities in the best interests of the Registrant and its members. The Board permits NBIA to contract with a third party to obtain proxy voting and related services, including research of current issues.
NBIA has implemented written Proxy Voting Policies and Procedures (“Proxy Voting Policy”) that are designed to reasonably ensure that NBIA votes proxies prudently and in the best interest of its advisory clients for whom NBIA has voting authority, including the Registrant. The Proxy Voting Policy also describes how NBIA addresses any conflicts that may arise between its interests and those of its clients with respect to proxy voting.
NBIA’s Governance and Proxy Committee (“Proxy Committee”) is responsible for developing, authorizing, implementing and updating the Proxy Voting Policy, overseeing the proxy voting process and engaging and overseeing any independent third-party vendor as a voting delegate to review, monitor and/or vote proxies. In order to apply the Proxy Voting Policy noted above in a timely and consistent manner, NBIA utilizes Glass, Lewis & Co. (“Glass Lewis”) to vote proxies in accordance with NBIA’s voting guidelines or, in instances where a material conflict has been determined to exist, in accordance with the voting recommendations of an independent third party.
NBIA retains final authority and fiduciary responsibility for proxy voting. NBIA believes that this process is reasonably designed to address material conflicts of interest that may arise between NBIA and a client as to how proxies are voted.
In the event that an investment professional at NBIA believes that it is in the best interests of a client or clients to vote proxies in a manner inconsistent with NBIA’s proxy voting guidelines, the Proxy Committee will review information submitted by the investment professional to determine that there is no material conflict of interest between NBIA and the client with respect to the voting of the proxy in that manner.
If the Proxy Committee determines that the voting of a proxy as recommended by the investment professional would not be appropriate, the Proxy Committee shall: (i) take no further action, in which case Glass Lewis shall vote such proxy in accordance with the proxy voting guidelines or as Glass Lewis recommends; (ii) disclose such conflict to the client or clients and obtain written direction from the client as to how to vote the proxy; (iii) suggest that the client or clients engage another party to determine how to vote the proxy; or (iv) engage another independent third party to determine how to vote the proxy.
Information on how the Registrant voted proxies relating to portfolio securities during the most recent 12-month period ended June 30 is available without charge by calling the Registrant toll-free at 866-637-2587 or by accessing the website of the Securities and Exchange Commission (the “SEC”) at http://www.sec.gov.
Item 8. Portfolio Managers of Closed-End Management Investment Companies.
(a)(1) Identification of Portfolio Manager(s) or Management Team Members and Description of Role of Portfolio Manager(s) or Management Team Member - As of March 31, 2023:
Neuberger Berman Private Equity’s investment team is responsible for the day-to-day management of the Fund and, along with other members of NB Private Equity, serves as the day-to-day interface with the members of the Investment Committee, which serve as the Fund’s Portfolio Fund Managers. The Investment Committee and other senior private equity investment personnel also have responsibility for managing private equity investments made on behalf of third-party investors, sourcing new investment opportunities, performing due diligence on all new investment opportunities and monitoring existing investments.
The Investment Committee is responsible for the development, selection, and ongoing monitoring and realization of investments:
Kent Chen, CFA, is a Managing Director of Neuberger Berman and leader of the firm’s private equity efforts in the Asia Pacific region. He is a member of the Private Investment Portfolios and Co-Investment Investment Committee. Mr. Chen joined Neuberger Berman in May 2015 from the Hong Kong Monetary Authority (HKMA) after 17 years of central banking career in various positions including Deputy Chief Representative of the HKMA’s New York Office and Advisor to the Executive Director for China at the International Monetary Fund in Washington D.C. From 2008, Mr. Chen helped to establish the HKMA’s private equity program, comprising of global buyout, Asia private equity and global energy investments. Before joining the HKMA in 1998, Mr. Chen was Head of China Research at Daiwa Securities in Hong Kong covering the Chinese stocks market with a focus on infrastructure, energy and power equipment stocks. Mr. Chen has been awarded the Chartered Financial Analyst designation and earned a MPA from Columbia University, MBA from University of Hull and BS in Economics from University of London.
Paul Daggett, CFA is a Managing Director of Neuberger Berman and a senior member of the firm's Private Investment Portfolios group where he leads investments in private equity and venture capital funds and direct co-investments in venture capital, growth equity and buyout transactions. He is a member of the Private Investment Portfolios and Co-Investment Investment Committee. Mr. Daggett sits on the Limited Partner Advisory Boards of a number of venture capital and private equity fund relationships and has Board of Directors and Observer seats for a number of direct venture and growth capital investments on behalf of Neuberger Berman Funds. Prior to joining Neuberger Berman in 2004, Mr. Daggett worked in the European Equity Derivatives Group at JPMorgan Chase & Co. He holds an MBA from the Cox School of Business at Southern Methodist University and a BEng, with honors, in Aeronautical Engineering from the University of Bristol. Mr. Daggett is a Fellow of the Institute of Chartered Accountants in England and Wales (FCA) and holds the Chartered Financial Analyst designation.
Michael Kramer is a Managing Director of Neuberger Berman. He is a member of the Private Investment Portfolios, Credit Opportunities, Marquee Brands and Co-Investment Investment Committees as well as a member of the Board of Directors for Marquee Brands. Before joining Neuberger Berman in 2006, Mr. Kramer was a vice president at The Cypress Group, a private equity firm with $3.5 billion under management. Prior thereto, he worked as an analyst at PaineWebber Incorporated. Mr. Kramer holds an MBA from Harvard Business School and a BA, cum laude, from Harvard College.
David Morse is a Managing Director of Neuberger Berman and is the Global Co-Head of Private Equity Co-Investments. He is also a member of the Private Investment Portfolios and Co-Investment Investment Committee, as well as the Private Debt Investment Committee. Mr. Morse joined Lehman Brothers in 2003 as a Managing Director and principal in the Merchant Banking Group where he helped raise and invest Lehman Brothers Merchant Banking Partners III L.P. Prior to joining Lehman Brothers, Mr. Morse was a founding Partner of Hampshire Equity Partners (and its predecessor entities). Founded in 1993, Hampshire is a middle-market private equity and corporate restructuring firm with $825 million of committed capital over three private equity funds. Prior to Hampshire, Mr. Morse worked in GE Capital’s Corporate Finance Group providing one-stop financings to middle-market buyouts. Mr. Morse began his career in 1984 in Chemical Bank’s middle-market lending group. Mr. Morse holds an MBA from the Tuck School of Business at Dartmouth College and a BA in Economics from Hamilton College. Mr. Morse is a former member of the MBA Advisory Board of the Tuck School and of the Alumni Council of Hamilton College, and is a current member of the Board of Trustees of the Berkshire School.
Joana Rocha Scaff is a Managing Director of Neuberger Berman, Head of Europe Private Equity and a member of the Private Investment Portfolio and Co-Investment, and Strategic Capital Investment Committees. She is also a member of Neuberger Berman’s ESG Advisory Committee. Ms. Rocha Scaff has over 20 years of experience in financial markets, the majority of which in private equity investing and prior to that in investment banking. She has been with the firm since 2005. Prior to NB Private Equity, Ms. Rocha Scaff worked in the investment banking division of Lehman Brothers, and prior to that at Citigroup Global Markets and Espirito Santo Investment Bank. She advised on corporate transactions including M&A, financial restructurings and public equity and debt offerings in the United States, Europe and Brazil. Ms. Rocha Scaff received her M.B.A. from Columbia Business School and her B.A. in Business Management and Administration from the Universidade Catolica of Lisbon. Ms. Rocha Scaff is the current Chair of the LP Committee of the BVCA – British Private Equity Association and a member of the Limited Partner Advisory Committee of multiple European private equity funds.
Jonathan D. Shofet is the Global Head of the firm’s Private Investment Portfolios and Co-Investments group and is a Managing Director of Neuberger Berman. He is a member of the Private Investment Portfolios and Co-Investment Investment Committees. Prior to joining Neuberger Berman in 2005, Mr. Shofet was a member of the Lehman Brothers Private Equity division, focusing on mid-through late-stage equity investments primarily in the technology, communications and media sectors. Prior to that, Mr. Shofet was a member of the Lehman Brothers Investment Banking division, where he focused on public and private financings, as well as strategic advisory in the real estate, technology and utility sectors. Mr. Shofet has been, or currently sits, on the Limited Partner Advisory Boards of a number of funds including those managed by Amulet Capital, Beacon Capital Partners, Castlelake, Cerberus Institutional Partners, Clearlake Capital, ComVest Investment Partners, DFW Capital, Oak Hill Capital Partners, Platinum Equity, Thomas H. Lee Partners and Vector Capital Partners. He has also been a Board Observer for several private companies. Mr. Shofet holds a B.A. from Binghamton University, where he graduated summa cum laude, Phi Beta Kappa.
Brien Smith is a Managing Director of Neuberger Berman and Senior Advisor of the Neuberger Berman Private Equity Division. He is a member of the Private Investment Portfolios and Co-Investment Investment Committee, as well as the Private Debt Investment Committee. Brien is also a member of Neuberger Berman’s Operating Committee, the firm’s Investment Risk and Operational Risk Committees and was also formerly Chief Operating Officer of the Neuberger Berman Private Equity Division. Prior to joining Neuberger Berman in 2001, he worked in the middle market private equity firm Mason Best Company, L.P., and its affiliates. He began his career at Arthur Andersen & Co. Brien is a life member of the Red McCombs School of Business Advisory Council at the University of Texas at Austin. He also currently serves on the board of the Texas Exes Alumni Association and chairs its Investment Committee. He serves and has served on a number of other boards of directors. He received a Master’s in Professional Accounting and a BBA from the University of Texas at Austin.
David Stonberg is a Managing Director of Neuberger Berman and is the Deputy Head of NB Alternatives and the Global Co-Head of Private Equity Co-Investments. He is also a member of the Private Investment Portfolios and Co-Investment Investment Committee, as well as the Renaissance, Secondary, Real Estate Secondary and Strategic Capital Investment Committees. Before joining Neuberger Berman in 2002, Mr. Stonberg held several positions within Lehman Brothers’ Investment Banking Division including providing traditional corporate and advisory services to clients as well as leading internal strategic and organizational initiatives for Lehman Brothers. Mr. Stonberg began his career in the Mergers and Acquisitions Group at Lazard Frères. Mr. Stonberg holds an MBA from the Stern School of New York University and a BSE. from the Wharton School of the University of Pennsylvania.
Elizabeth Traxler is a Managing Director of Neuberger Berman and a senior member of the private equity investment team. She is a member of the Private Investment Portfolios and Co-investment Investment Committee, as well as the Secondary Investment Committee. Prior to joining Neuberger Berman in 2008, Ms. Traxler was at Wachovia Capital Partners (now known as Pamlico Capital), where she focused on making direct growth equity and buyout investments across a broad range of industries. Ms. Traxler also worked at Wachovia Securities in the Leveraged Capital Group, which provided senior and mezzanine debt for private equity-backed transactions. She is currently a Board Observer for several private companies and Advisory Board member for a number of private equity funds. Ms. Traxler received an MBA from the Kellogg School of Management at Northwestern University and a BA, cum laude, in Economics from Vanderbilt University.
Anthony Tutrone is the Global Head of NB Alternatives and a Managing Director of Neuberger Berman. He is a member of all Neuberger Berman Private Equity’s Investment Committees. Anthony is also a member of Neuberger Berman's Partnership, Operating, and Asset Allocation Committees. Prior to Neuberger Berman, from 1994 to 2001, Anthony was a Managing Director and founding member of The Cypress Group, a private equity firm focused on middle market buyouts that managed approximately $3.5 billion of commitments. Anthony began his career at Lehman Brothers in 1986, starting in Investment Banking and in 1987 becoming one of the original members of the firm’s Merchant Banking Group. This group managed a $1.2 billion private equity fund focused on middle market buyouts. He has been a member of the board of directors of several public and private companies and has sat on the advisory boards of several private equity funds. Anthony earned an MBA from Harvard Business School and a BA in Economics from Columbia University.
Peter von Lehe, JD, is the Head of Investment Solutions and Strategy and is a Managing Director of Neuberger Berman. He is also a member of the Private Investment Portfolios and Co-investment Investment Committee, as well as the Athyrium, Marquee Brands and Renaissance Investment Committees. He is also a member of the NB Insurance-Linked Strategies Underwriting Committee and a Chairman of NB Reinsurance Ltd. Mr. von Lehe sits on the Limited Partner Advisory Boards of a number of investment relationships globally on behalf of Neuberger Berman funds. Previously, Mr. von Lehe was a Managing Director and Deputy Head of the Private Equity Fund of Funds unit of Swiss Reinsurance Company. At Swiss Re, Mr. von Lehe was responsible for investment analysis and product structuring and worked in both New York and Zurich. Before that, he was an attorney with the law firm of Willkie Farr & Gallagher LLP in New York focusing on corporate finance and private equity transactions. He began his career as a financial analyst for a utility company, where he was responsible for econometric modeling. Mr. von Lehe received a BS with Honors in Economics from the University of Iowa and a JD with High Distinction, from the University of Iowa College of Law. He is a member of the New York Bar.
Jacquelyn Wang is a Managing Director of Neuberger Berman and a senior member of the private equity investment team. She is a member of the Private Investment Portfolios and Co-Investment Investment Committee. Ms. Wang joined Neuberger Berman in 2007, focusing on direct Co-investments, Primary Investments and Secondary Investments. Prior to joining Neuberger Berman, Ms. Wang worked in Corporate Development at Verizon Communications focused on corporate M&A. Previously, Ms. Wang worked at Spectrum Equity Investors, where she was responsible for sourcing, executing and evaluating buyout and growth equity investments in media, technology and telecom. Ms. Wang began her career in the investment banking division of Lehman Brothers advising on corporate transactions in the communications and media industries. Ms. Wang received an MBA from The Wharton School of the University of Pennsylvania and a BA with honors from The Johns Hopkins University.
Patricia Miller Zollar is a Managing Director of Neuberger Berman and a leader of the firm’s Private Investment Portfolios practice. She is a member of the Private Investment Portfolios and Co-Investment Investment Committee. Additionally, Ms. Zollar sits on the limited partner advisory boards of a number of funds. Before rejoining Neuberger Berman in 2004, Ms. Zollar was a vice president in the Asset Management Division of Goldman Sachs. Ms. Zollar began her career as a Certified Public Accountant in the Audit Division of Deloitte & Touche. She received her MBA from Harvard Business School and her BS, with highest distinction, from North Carolina A&T State University, where she is Chairperson Emeritus of the Board of Trustees and the recipient of an honorary Doctorate degree. Ms. Zollar is a member of the Executive Leadership Council, the Harvard Business School Alumni Board and was a former member of the executive board of the National Association of Investment Companies. She serves as Vice Chairman of The Apollo Theater and a member of the Investment Committee of the Robert Wood Johnson Foundation’s Board of Trustees.
(a)(2) Other Accounts Managed by Portfolio Manager(s) or Management Team Member - As of March 31, 2023:
The following tables set forth information about funds and accounts other than the Registrant for which a member of the Portfolio Management Team is primarily responsible for the day-to-day portfolio management as of March 31, 2023, unless indicated otherwise. Registered investment companies in a “master-feeder” structure are counted as one investment company for purposes for determining the number of accounts managed.
Kent Chen
Registered Investment Companies
Managed | | Pooled Vehicles Managed | | Other Accounts Managed |
| Number | | Total Assets | | Number | | Total Assets | | Number | | Total Assets |
| 6 | | $1,490,981,864 | | 31 | | $18,607,152,840 | | 149 | | $43,057,386,498 |
Registered Investment Companies
Managed | | Pooled Vehicles Managed | | Other Accounts Managed |
Number with
Performance-
Based Fees | | Total Assets with
Performance-
Based Fees | | Number with
Performance-
Based Fees | | Total Assets with
Performance-
Based Fees | | Number with
Performance-
Based Fees | | Total Assets with
Performance-
Based Fees |
| 6 | | $1,490,981,864 | | 31 | | $18,607,152,840 | | 149 | | $43,057,386,498 |
Paul Daggett
Registered Investment Companies
Managed | | Pooled Vehicles Managed | | Other Accounts Managed |
| Number | | Total Assets | | Number | | Total Assets | | Number | | Total Assets |
| 6 | | $1,490,981,864 | | 31 | | $18,607,152,840 | | 149 | | $43,057,386,498 |
| | | | | | | | | | | |
Registered Investment Companies
Managed | | Pooled Vehicles Managed | | Other Accounts Managed |
Number with
Performance-
Based Fees | | Total Assets with
Performance-
Based Fees | | Number with
Performance-
Based Fees | | Total Assets with
Performance-
Based Fees | | Number with
Performance-
Based Fees | | Total Assets with
Performance-
Based Fees |
| 6 | | $1,490,981,864 | | 31 | | $18,607,152,840 | | 149 | | $43,057,386,498 |
Michael Kramer
Registered Investment Companies
Managed | | Pooled Vehicles Managed | | Other Accounts Managed |
| Number | | Total Assets | | Number | | Total Assets | | Number | | Total Assets |
| 6 | | $1,490,981,864 | | 31 | | $18,607,152,840 | | 149 | | $43,057,386,498 |
| | | | | | | | | | | |
Registered Investment Companies
Managed | | Pooled Vehicles Managed | | Other Accounts Managed |
Number with
Performance-
Based Fees | | Total Assets with
Performance-
Based Fees | | Number with
Performance-
Based Fees | | Total Assets with
Performance-
Based Fees | | Number with
Performance-
Based Fees | | Total Assets with
Performance-
Based Fees |
| 6 | | $1,490,981,864 | | 31 | | $18,607,152,840 | | 149 | | $43,057,386,498 |
David Morse
Registered Investment Companies
Managed | | Pooled Vehicles Managed | | Other Accounts Managed |
| Number | | Total Assets | | Number | | Total Assets | | Number | | Total Assets |
| 6 | | $1,490,981,864 | | 31 | | $18,607,152,840 | | 149 | | $43,057,386,498 |
Registered Investment Companies
Managed | | Pooled Vehicles Managed | | Other Accounts Managed |
Number with
Performance-
Based Fees | | Total Assets with
Performance-
Based Fees | | Number with
Performance-
Based Fees | | Total Assets with
Performance-
Based Fees | | Number with
Performance-
Based Fees | | Total Assets with
Performance-
Based Fees |
| 6 | | $1,490,981,864 | | 31 | | $18,607,152,840 | | 149 | | $43,057,386,498 |
Joana P. Rocha Scaff
Registered Investment Companies
Managed | | Pooled Vehicles Managed | | Other Accounts Managed |
| Number | | Total Assets | | Number | | Total Assets | | Number | | Total Assets |
| 6 | | $1,490,981,864 | | 34 | | $25,035,407,840 | | 153 | | $43,557,386,498 |
Registered Investment Companies
Managed | | Pooled Vehicles Managed | | Other Accounts Managed |
Number with
Performance-
Based Fees | | Total Assets with
Performance-
Based Fees | | Number with
Performance-
Based Fees | | Total Assets with
Performance-
Based Fees | | Number with
Performance-
Based Fees | | Total Assets with
Performance-
Based Fees |
| 6 | | $1,490,981,864 | | 34 | | $25,035,407,840 | | 153 | | $43,557,386,498 |
Jonathan D. Shofet
Registered Investment Companies
Managed | | Pooled Vehicles Managed | | Other Accounts Managed |
| Number | | Total Assets | | Number | | Total Assets | | Number | | Total Assets |
| 6 | | $1,490,981,864 | | 31 | | $18,607,152,840 | | 149 | | $43,057,386,498 |
Registered Investment Companies
Managed | | Pooled Vehicles Managed | | Other Accounts Managed |
Number with
Performance-
Based Fees | | Total Assets with
Performance-
Based Fees | | Number with
Performance-
Based Fees | | Total Assets with
Performance-
Based Fees | | Number with
Performance-
Based Fees | | Total Assets with
Performance-
Based Fees |
| 6 | | $1,490,981,864 | | 31 | | $18,607,152,840 | | 149 | | $43,057,386,498 |
Brien Smith
Registered Investment Companies
Managed | | Pooled Vehicles Managed | | Other Accounts Managed |
| Number | | Total Assets | | Number | | Total Assets | | Number | | Total Assets |
| 6 | | $1,490,981,864 | | 31 | | $18,607,152,840 | | 149 | | $43,057,386,498 |
Registered Investment Companies
Managed | | Pooled Vehicles Managed | | Other Accounts Managed |
Number with
Performance-
Based Fees | | Total Assets with
Performance-
Based Fees | | Number with
Performance-
Based Fees | | Total Assets with
Performance-
Based Fees | | Number with
Performance-
Based Fees | | Total Assets with
Performance-
Based Fees |
| 6 | | $1,490,981,864 | | 31 | | $18,607,152,840 | | 149 | | $43,057,386,498 |
David S. Stonberg
Registered Investment Companies
Managed | | Pooled Vehicles Managed | | Other Accounts Managed |
| Number | | Total Assets | | Number | | Total Assets | | Number | | Total Assets |
| 6 | | $1,490,981,864 | | 38 | | $30,452,743,340 | | 154 | | $43,632,386,498 |
Registered Investment Companies
Managed | | Pooled Vehicles Managed | | Other Accounts Managed |
Number with
Performance-
Based Fees | | Total Assets with
Performance-
Based Fees | | Number with
Performance-
Based Fees | | Total Assets with
Performance-
Based Fees | | Number with
Performance-
Based Fees | | Total Assets with
Performance-
Based Fees |
| 6 | | $1,490,981,864 | | 38 | | $30,452,743,340 | | 154 | | $43,632,386,498 |
Elizabeth Traxler
Registered Investment Companies
Managed | | Pooled Vehicles Managed | | Other Accounts Managed |
| Number | | Total Assets | | Number | | Total Assets | | Number | | Total Assets |
| 6 | | $1,490,981,864 | | 34 | | $25,035,407,840 | | 153 | | $43,557,386,498 |
Registered Investment Companies
Managed | | Pooled Vehicles Managed | | Other Accounts Managed |
Number with
Performance-
Based Fees | | Total Assets with
Performance-
Based Fees | | Number with
Performance-
Based Fees | | Total Assets with
Performance-
Based Fees | | Number with
Performance-
Based Fees | | Total Assets with
Performance-
Based Fees |
| 6 | | $1,490,981,864 | | 34 | | $25,035,407,840 | | 153 | | $43,557,386,498 |
Anthony D. Tutrone
Registered Investment Companies
Managed | | Pooled Vehicles Managed | | Other Accounts Managed |
| Number | | Total Assets | | Number | | Total Assets | | Number | | Total Assets |
| 6 | | $1,490,981,864 | | 38 | | $30,452,743,340 | | 154 | | $43,632,386,498 |
Registered Investment Companies
Managed | | Pooled Vehicles Managed | | Other Accounts Managed |
Number with
Performance-
Based Fees | | Total Assets with
Performance-
Based Fees | | Number with
Performance-
Based Fees | | Total Assets with
Performance-
Based Fees | | Number with
Performance-
Based Fees | | Total Assets with
Performance-
Based Fees |
| 6 | | $1,490,981,864 | | 38 | | $30,452,743,340 | | 154 | | $43,632,386,498 |
Peter J. von Lehe
Registered Investment Companies
Managed | | Pooled Vehicles Managed | | Other Accounts Managed |
| Number | | Total Assets | | Number | | Total Assets | | Number | | Total Assets |
| 6 | | $1,490,981,864 | | 31 | | $18,607,152,840 | | 149 | | $43,057,386,498 |
Registered Investment Companies
Managed | | Pooled Vehicles Managed | | Other Accounts Managed |
Number with
Performance-
Based Fees | | Total Assets with
Performance-
Based Fees | | Number with
Performance-
Based Fees | | Total Assets with
Performance-
Based Fees | | Number with
Performance-
Based Fees | | Total Assets with
Performance-
Based Fees |
| 6 | | $1,490,981,864 | | 31 | | $18,607,152,840 | | 149 | | $43,057,386,498 |
| Jacquelyn Wang | | | | | | | | |
| | | | | | | | | | | |
Registered Investment Companies
Managed | | Pooled Vehicles Managed | | Other Accounts Managed |
| Number | | Total Assets | | Number | | Total Assets | | Number | | Total Assets |
| 6 | | $1,490,981,864 | | 31 | | $18,607,152,840 | | 149 | | $43,057,386,498 |
| | | | | | | | | | | |
Registered Investment Companies
Managed | | Pooled Vehicles Managed | | Other Accounts Managed |
Number with
Performance-
Based Fees | | Total Assets with
Performance-
Based Fees | | Number with
Performance-
Based Fees | | Total Assets with
Performance-
Based Fees | | Number with
Performance-
Based Fees | | Total Assets with
Performance-
Based Fees |
| 6 | | $1,490,981,864 | | 31 | | $18,607,152,840 | | 149 | | $43,057,386,498 |
| | | | | | | | | | | |
| Patricia Miller Zollar | | | | | | | | | | |
| | | | | | | | | | | |
Registered Investment Companies
Managed | | Pooled Vehicles Managed | | Other Accounts Managed |
| Number | | Total Assets | | Number | | Total Assets | | Number | | Total Assets |
| 6 | | $1,490,981,864 | | 31 | | $18,607,152,840 | | 149 | | $43,057,386,498 |
| | | | | | | | | | | |
Registered Investment Companies
Managed | | Pooled Vehicles Managed | | Other Accounts Managed |
Number with
Performance-
Based Fees | | Total Assets with
Performance-
Based Fees | | Number with
Performance-
Based Fees | | Total Assets with
Performance-
Based Fees | | Number with
Performance-Based Fees | | Total Assets with
Performance-
Based Fees |
| 6 | | $1,490,981,864 | | 31 | | $18,607,152,840 | | 149 | | $43,057,386,498 |
Potential Conflicts of Interests
Real, potential or apparent conflicts of interest may arise should members of the Portfolio Management Team have day-to-day portfolio management responsibilities with respect to more than one fund. Portfolio Management Team members may manage other accounts with investment strategies similar to the Registrant, including other investment companies, pooled investment vehicles and separately managed accounts. Fees earned by the Investment Adviser may vary among these accounts and Portfolio Management Team members may personally invest in these accounts. These factors could create conflicts of interest because the Portfolio Management Team members may have incentives to favor certain accounts over others, that could result in other accounts outperforming the Registrant. A conflict may also exist if a Portfolio Management Team member identifies a limited investment opportunity that may be appropriate for more than one account, but the Registrant is not able to take full advantage of that opportunity due to the need to allocate that opportunity among multiple accounts. In addition, a Portfolio Management Team member may execute transactions for another account that may adversely impact the value of securities held by the Registrant. However, the Investment Adviser believes that these risks are mitigated by the fact that accounts with like investment strategies managed by the Portfolio Management Team members are generally managed in a similar fashion and the Investment Adviser has policies that seek to allocate opportunities on a fair and equitable basis, taking into consideration the investment objectives and strategies and any legal, tax or regulatory considerations.
(a)(3) Compensation Structure of Portfolio Manager(s) or Management Team Members - As of March 31, 2023:
Neuberger Berman’s compensation philosophy is one that focuses on rewarding performance and incentivizing our employees. We are also focused on creating a compensation process that we believe is fair, transparent, and competitive with the market.
Compensation for the Fund’s Portfolio Management Team consists of fixed (salary) and variable (bonus) compensation but is more heavily weighted on the variable portion of total compensation and is paid from a team compensation pool made available to the portfolio management team with which the portfolio manager is associated. The size of the team compensation pool is determined based on a formula that takes into consideration a number of factors including the pre-tax revenue that is generated by that particular portfolio management team, less certain adjustments. The bonus portion of the compensation for a portfolio manager is discretionary and is determined on the basis of a variety of criteria, including investment performance (including the aggregate multi-year track record), utilization of central resources (including research, sales and operations/support), business building to further the longer term sustainable success of the investment team, effective team/people management, and overall contribution to the success of Neuberger Berman.
The terms of our long-term retention incentives are as follows:
| · | Employee-Owned Equity. Certain employees (i.e., senior leadership and investment professionals) participate in Neuberger Berman’s equity ownership structure, which was designed to incentivize and retain key personnel. In addition, in prior years certain employees may have elected to have a portion of their compensation delivered in the form of equity. |
For confidentiality and privacy reasons, Neuberger Berman cannot disclose individual equity holdings or program participation.
| · | Contingent Compensation. Certain employees may participate in the Neuberger Berman Group Contingent Compensation Plan (the “CCP”) to serve as a means to further align the interests of our employees with the success of the firm and the interests of our clients, and to reward continued employment. Under the CCP, up to 20% of a participant’s annual total compensation in excess of $500,000 is contingent and subject to vesting. The contingent amounts are maintained in a notional account that is tied to the performance of a portfolio of Neuberger Berman investment strategies as specified by the firm on an employee-by-employee basis. By having a participant’s contingent compensation tied to Neuberger Berman investment strategies, each employee is given further incentive to operate as a prudent risk manager and to collaborate with colleagues to maximize performance across all business areas. In the case of members of investment teams, including Portfolio Managers, the CCP is currently structured so that such employees have exposure to the investment strategies of their respective teams as well as the broader Neuberger Berman portfolio. |
| · | Restrictive Covenants. Most investment professionals, including Portfolio Fund Managers, are subject to notice periods and restrictive covenants which include employee and client non-solicit restrictions as well as restrictions on the use of confidential information. In addition, depending on participation levels, certain senior professionals who have received equity grants have also agreed to additional notice and transition periods and, in some cases, non-compete restrictions. |
(a)(4) Disclosure of Securities Ownership.
As of March 31, 2023, no Portfolio Management Team member owned any interest in the Registrant.
(b) Not applicable.
Item 9. Purchase of Equity Securities By Close-End Management Investment Company and Affiliated Purchasers.
Not applicable.
Item 10. Submission of Matters to a Vote of Security Holders.
There have been no material changes to the procedures by which partners may recommend nominees to the Board.
Item 11. Controls and Procedures.
(a) The Registrant's Principal Executive Officer and Principal Financial Officer have concluded that the Registrant's disclosure controls and procedures (as defined in Rule 30a-3(c) under the Investment Company Act of 1940, as amended (the “1940 Act”)) were effective as of a date within 90 days prior to the filing date of this report, based on their evaluation of the effectiveness of the Registrant's disclosure controls and procedures, as required by Rule 30a-3(b) of the 1940 Act.
(b) There were no changes in the Registrant's internal control over financial reporting that occurred during the period covered by this report that has materially affected, or is reasonably likely to materially affect, the Registrant's internal control over financial reporting.
Item 12. Disclosure of Securities Lending Activities for Closed-End Management Investment Companies.
(a) The Fund did not engage in any securities lending activity during the fiscal year ended March 31, 2023.
(b) The Fund did not engage in any securities lending activity and did not engage a securities lending agent during the fiscal year ended March 31, 2023.
Item 13. Exhibits.
Signatures
Pursuant to the requirements of the Securities Exchange Act of 1934 and the Investment Company Act of 1940, the registrant has duly caused this report to be signed on its behalf by the undersigned, thereunto duly authorized.
NB Crossroads Private Markets Fund VI Holdings LP
| By: | /s/ Patrick Deaton | |
| | Patrick Deaton | |
| Chief Operating Officer | |
Date: June 9, 2023
Pursuant to the requirements of the Securities Exchange Act of 1934 and the Investment Company Act of 1940, this report has been signed below by the following persons on behalf of the registrant and in the capacities and on the dates indicated.
| By: | /s/ Patrick Deaton | |
| | Patrick Deaton | |
| Chief Operating Officer | |
| | (Principal Executive Officer) | |
Date: June 9, 2023
| By: | /s/ Mark Bonner | |
| | Mark Bonner | |
| Treasurer | |
| | (Principal Financial Officer) | |
Date: June 9, 2023