Q2 2024�Company Update August 1, 2024 Exhibit 99.2
DISCLAIMER Forward Looking Statements�This presentation contains forward looking statements that involve risks, uncertainties and assumptions. If the risks or uncertainties ever materialize or the assumptions prove incorrect, the Company's results may differ materially from those expressed or implied by such forward-looking statements. All statements other than statements of historical fact could be deemed forward-looking statements, including, but not limited to: information or predictions concerning the Company's future financial performance (including its FY2024 guidance and long-term goals), business plans and objectives, potential growth opportunities, potential market leadership, technological, industry or market trends (including assumptions regarding the market in late 2024 and 2025 market) and potential market opportunities. These statements are based on estimates and information available to the Company at the time of this presentation and are not guarantees of future performance. Actual results could differ materially from the Company's current expectations as a result of many factors, including, but not limited to: current macroeconomic conditions, including but not limited to the impacts of high inflation and the risk of a recession on demand for our products, consumer confidence and financial markets generally; the Company’s ability to build and maintain the strength of its brand among gaming and streaming enthusiasts and its ability to continuously develop and successfully market new gear and improvements to existing gear; the introduction and success of new third-party high-performance computer hardware, particularly graphics processing units and central processing units, as well as sophisticated new video games; fluctuations in operating results; the risk that the Company is not able to compete with competitors and/or that the gaming industry, including streaming and eSports, does not grow as expected or declines; the loss or inability to attract and retain key management; the impact of global instability, such as the war between Russia and Ukraine or any conflict between China and Taiwan, and any sanctions or other geopolitical tensions that may result therefrom; the impacts from any pandemic, including any lingering impacts from the COVID-19 pandemic; delays or disruptions at manufacturing and distribution facilities of the Company or third parties; the Company's ability to successfully integrate any companies or assets it may acquire; currency exchange rate fluctuations or international trade disputes resulting in the Company’s gear becoming relatively more expensive to its overseas customers or resulting in an increase in the Company’s manufacturing costs; and the other factors described under the heading "Risk Factors" in the Company's Annual Report on Form 10-K for the year ended December 31, 2023 filed with the Securities and Exchange Commission ("SEC") and its subsequent filings with the SEC. The Company assumes no obligation, and does not intend, to update these forward-looking statements, except as required by law. Investors are urged to review in detail the risks and uncertainties outlined in Corsair’s SEC filings. You may get these SEC documents for free by visiting EDGAR on the SEC website at http://www.sec.gov. Non-GAAP Financial Measures�Included in this presentation are certain non-GAAP financial measures, including Adjusted Operating Income (Loss), Adjusted EBITDA, Adjusted EBITDA Margin, Adjusted Net Income (Loss) and Adjusted Net Income (Loss) Per Share, which are not recognized under the generally accepted accounting principles (“GAAP”) in the United States and designed to complement the financial information presented in accordance with GAAP in the United States because management believes such measures are useful to investors. The non-GAAP measures have limitations as analytical tools and you should not consider them in isolation of, or as an alternative to, measures prepared in accordance with U.S. GAAP. The non-GAAP measures used by the Company may differ from the non-GAAP measures used by other companies. The Company urges you to review the reconciliation of its non-GAAP financial measures to the most directly comparable U.S. GAAP financial measures set forth in the Appendix to this presentation, and not to rely on any single financial measure to evaluate the Company's business. Market & Industry Data�This presentation also contains estimates and other statistical data made by independent parties and by the Company relating to the Company’s industry, the Company’s business and the market for the Company’s products and its future growth. This data involves a number of assumptions and limitations, and you are cautioned not to give undue weight to such estimates. In addition, projections, assumptions, and estimates of the Company’s future performance and the future performance of the market for its products are necessarily subject to a high degree of uncertainty and risk.
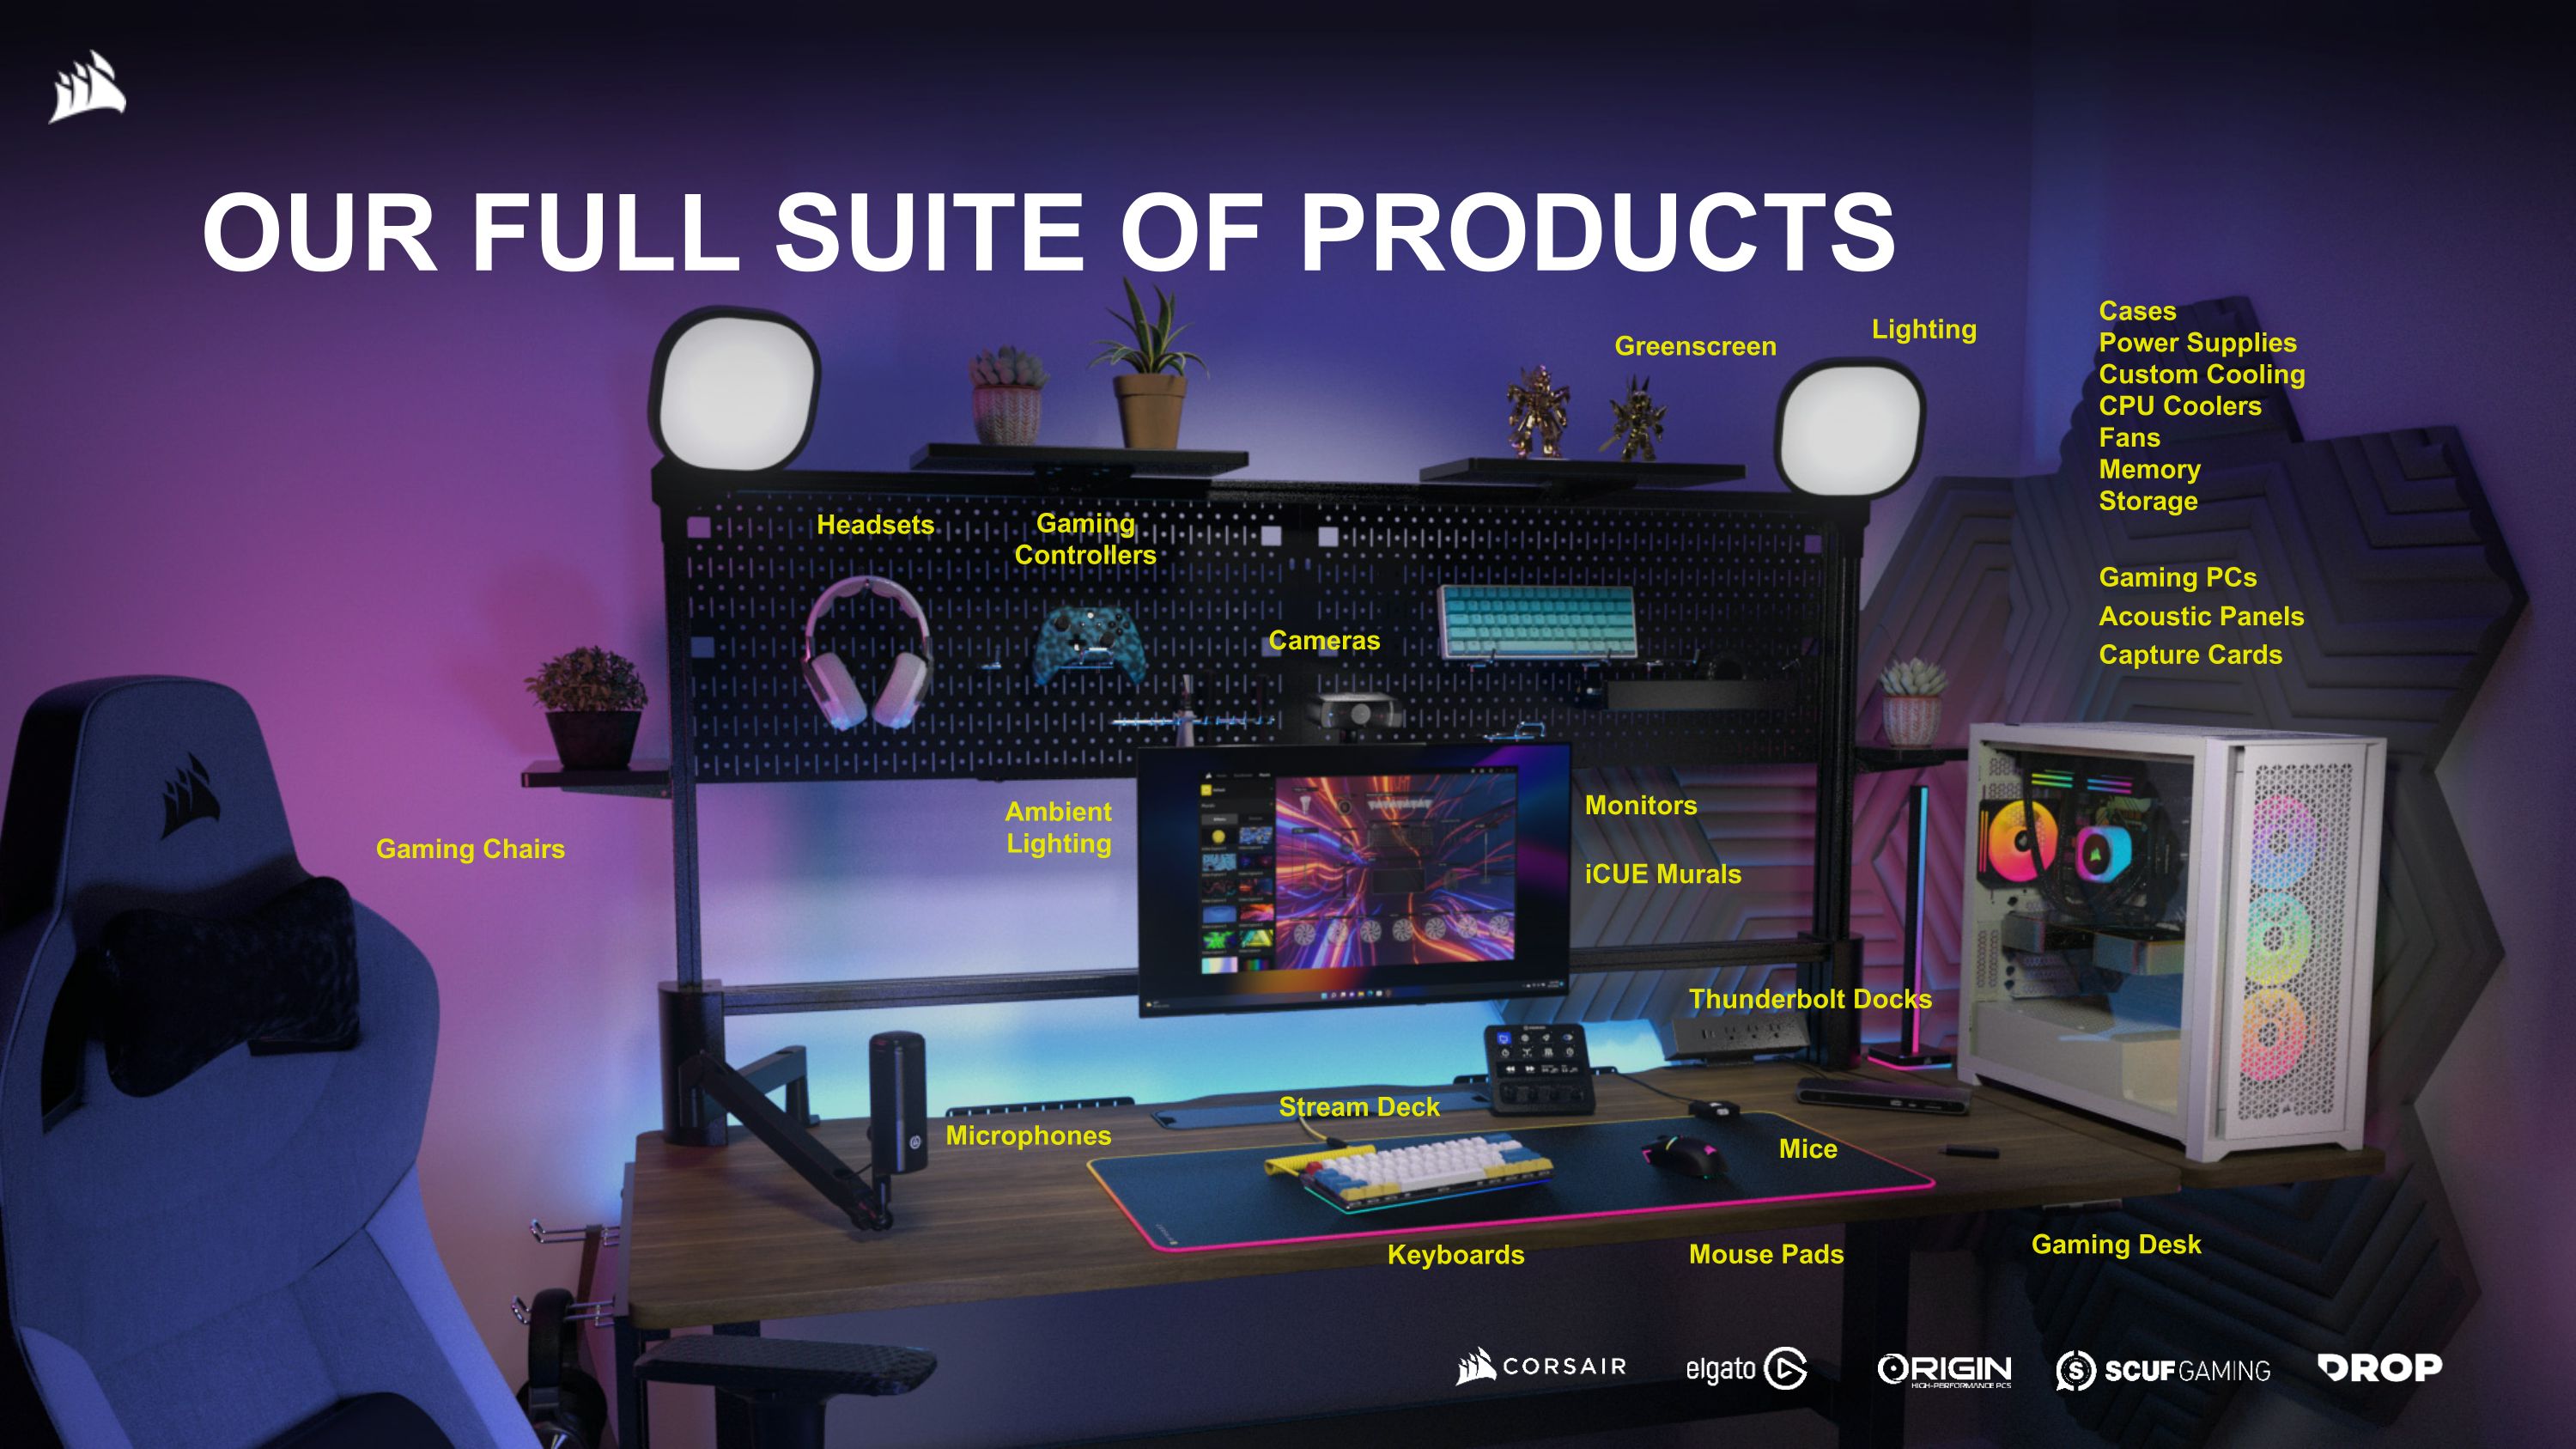
OUR FULL SUITE OF PRODUCTS Cases Power Supplies Custom Cooling CPU Coolers Fans Memory Storage Greenscreen Cameras Stream Deck Microphones Lighting Acoustic Panels Capture Cards Monitors Headsets Ambient Lighting Keyboards Mice Thunderbolt Docks Gaming Chairs Gaming Controllers Mouse Pads Gaming PCs Gaming Desk iCUE Murals
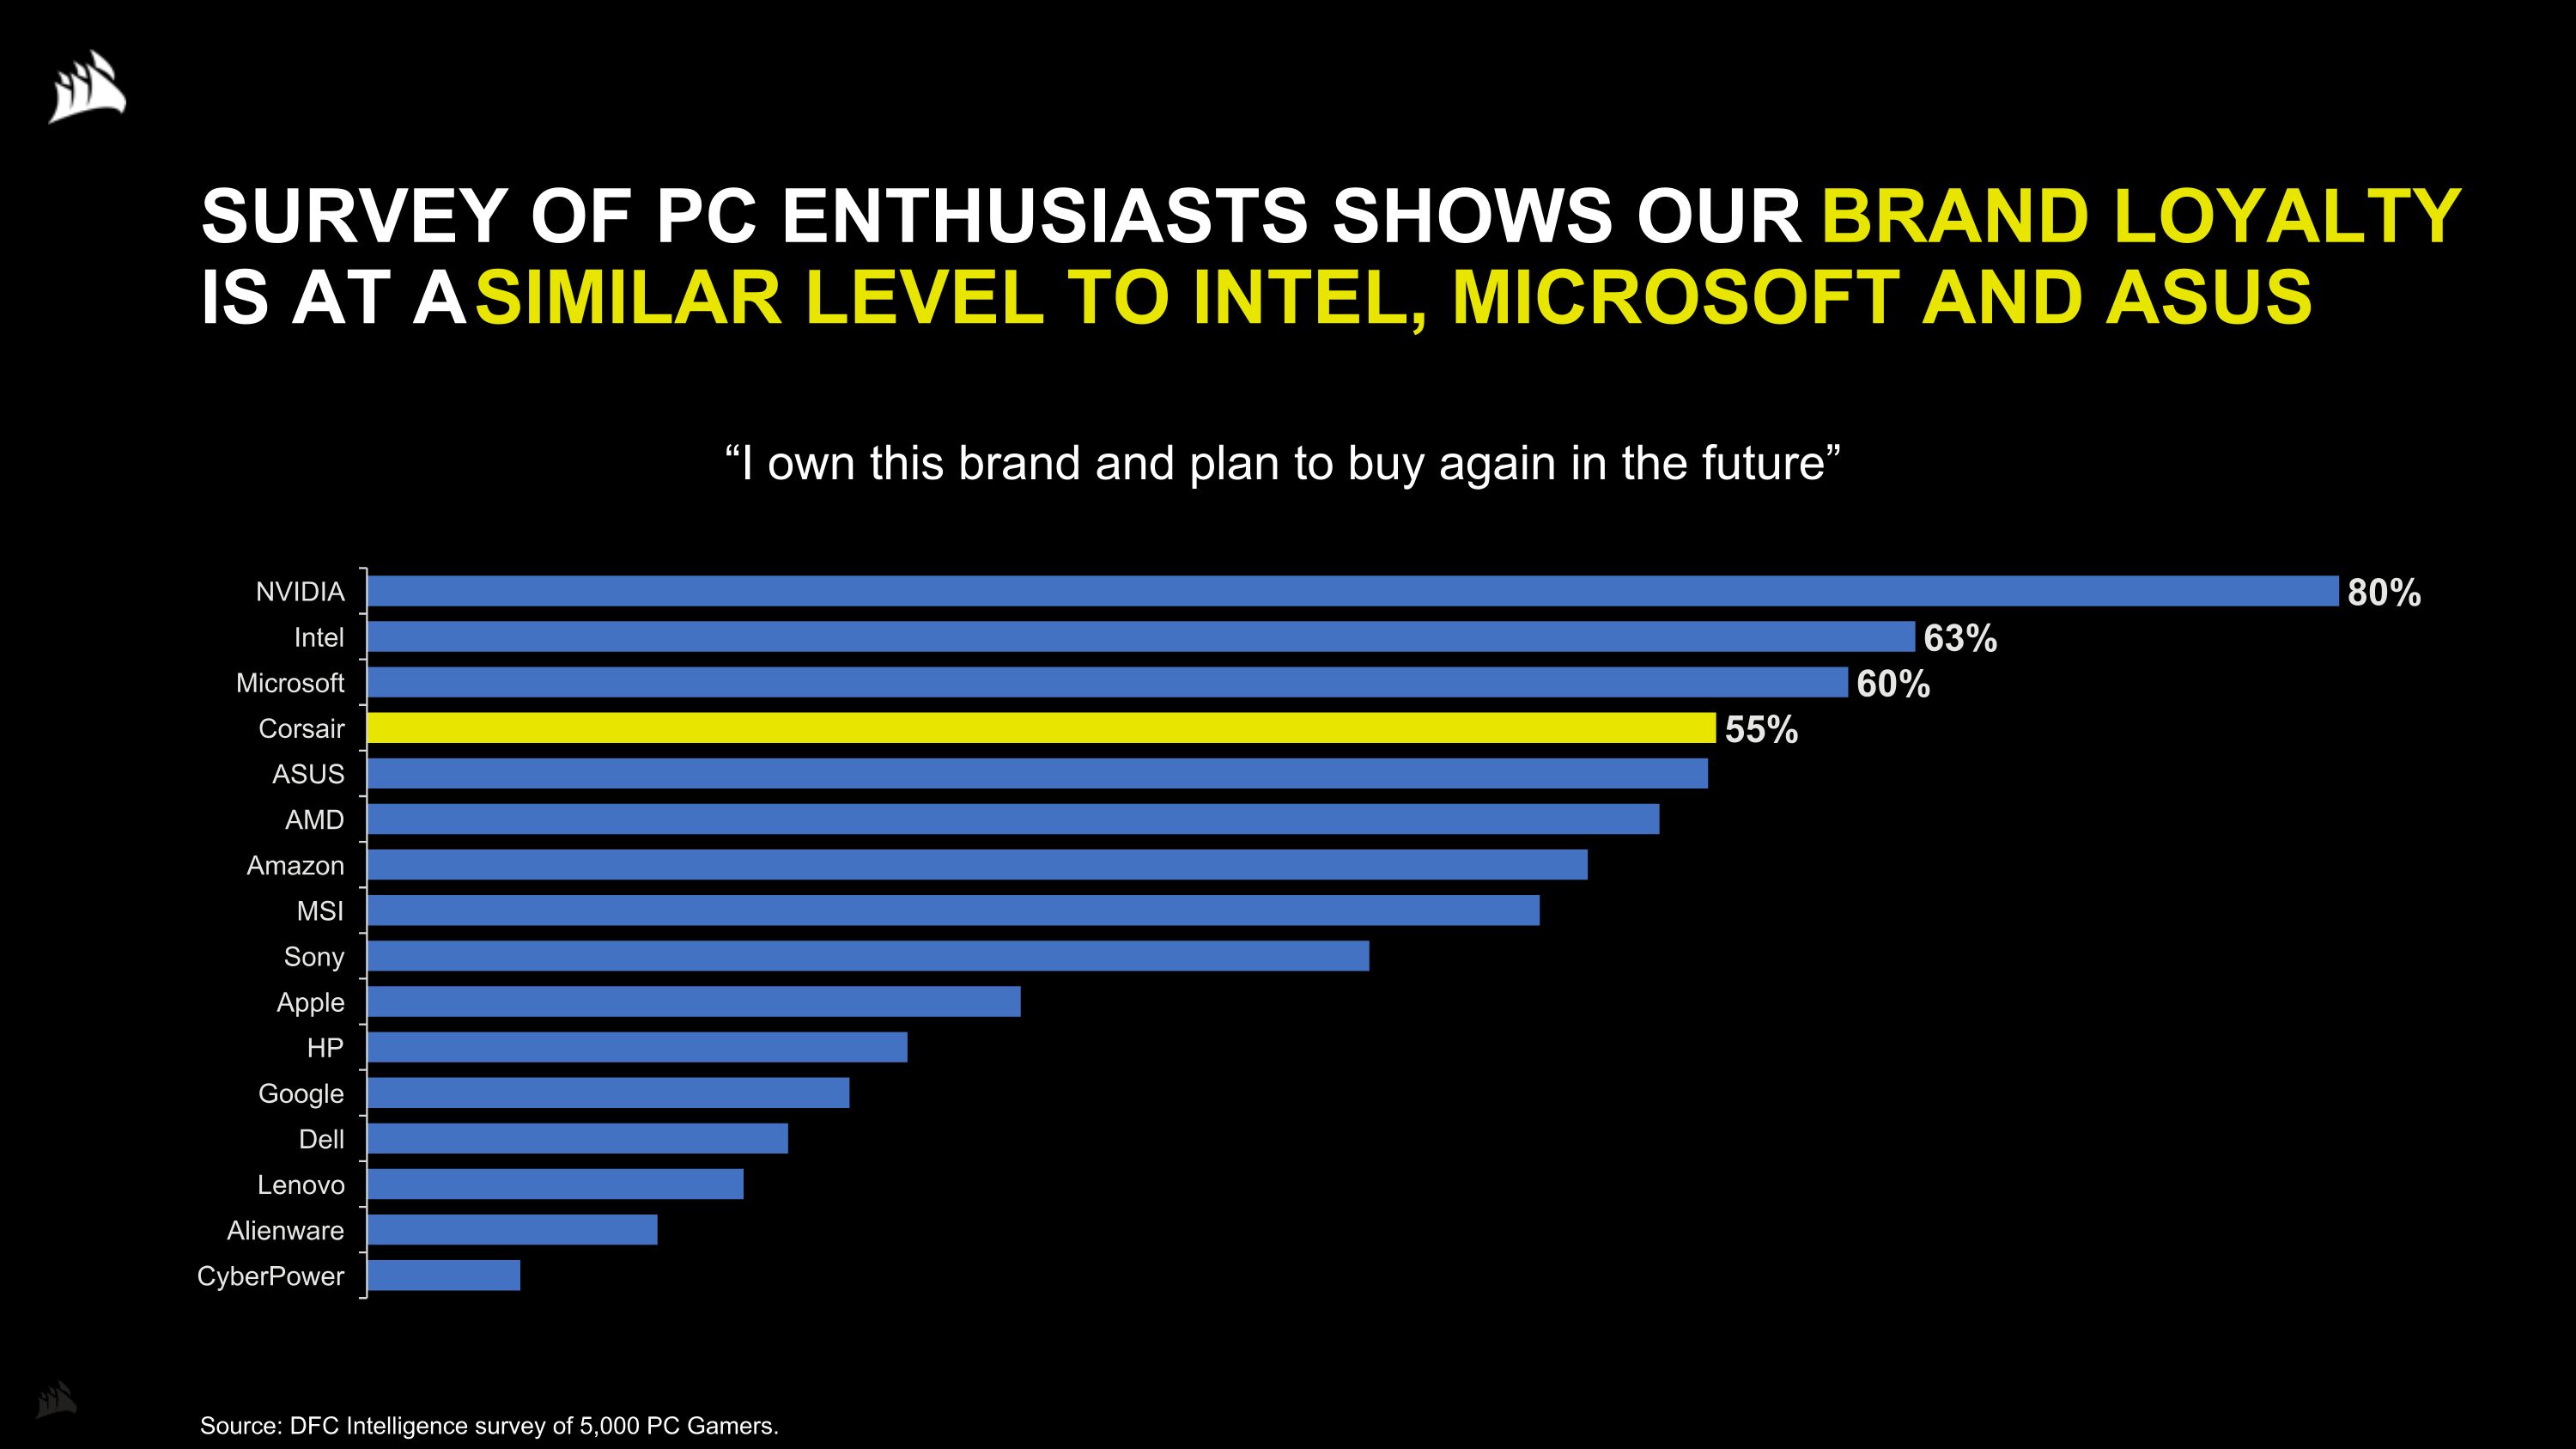
SURVEY OF PC ENTHUSIASTS SHOWS OUR BRAND LOYALTY IS AT A SIMILAR LEVEL TO INTEL, MICROSOFT AND ASUS Source: DFC Intelligence survey of 5,000 PC Gamers. “I own this brand and plan to buy again in the future”

INDUSTRY UPDATE
LENGTHENING REFRESH CYCLE WILL LIKELY PUSH NEXT ACTIVITY SURGE TO 2025 Macroeconomic conditions are making consumers cautious with high ticket purchases like $3,000 gaming PCs Next-gen Graphics cards expected in late Q4’24 or Q1’25 Massive installed base of gaming hardware purchased in 2020 and 2021 will need upgrading or replacing over the next 2 years A.I. innovation brings exciting new technology and experiences to the gaming market Peripheral market stable, and approximately 60% higher than the size of the pre-pandemic market
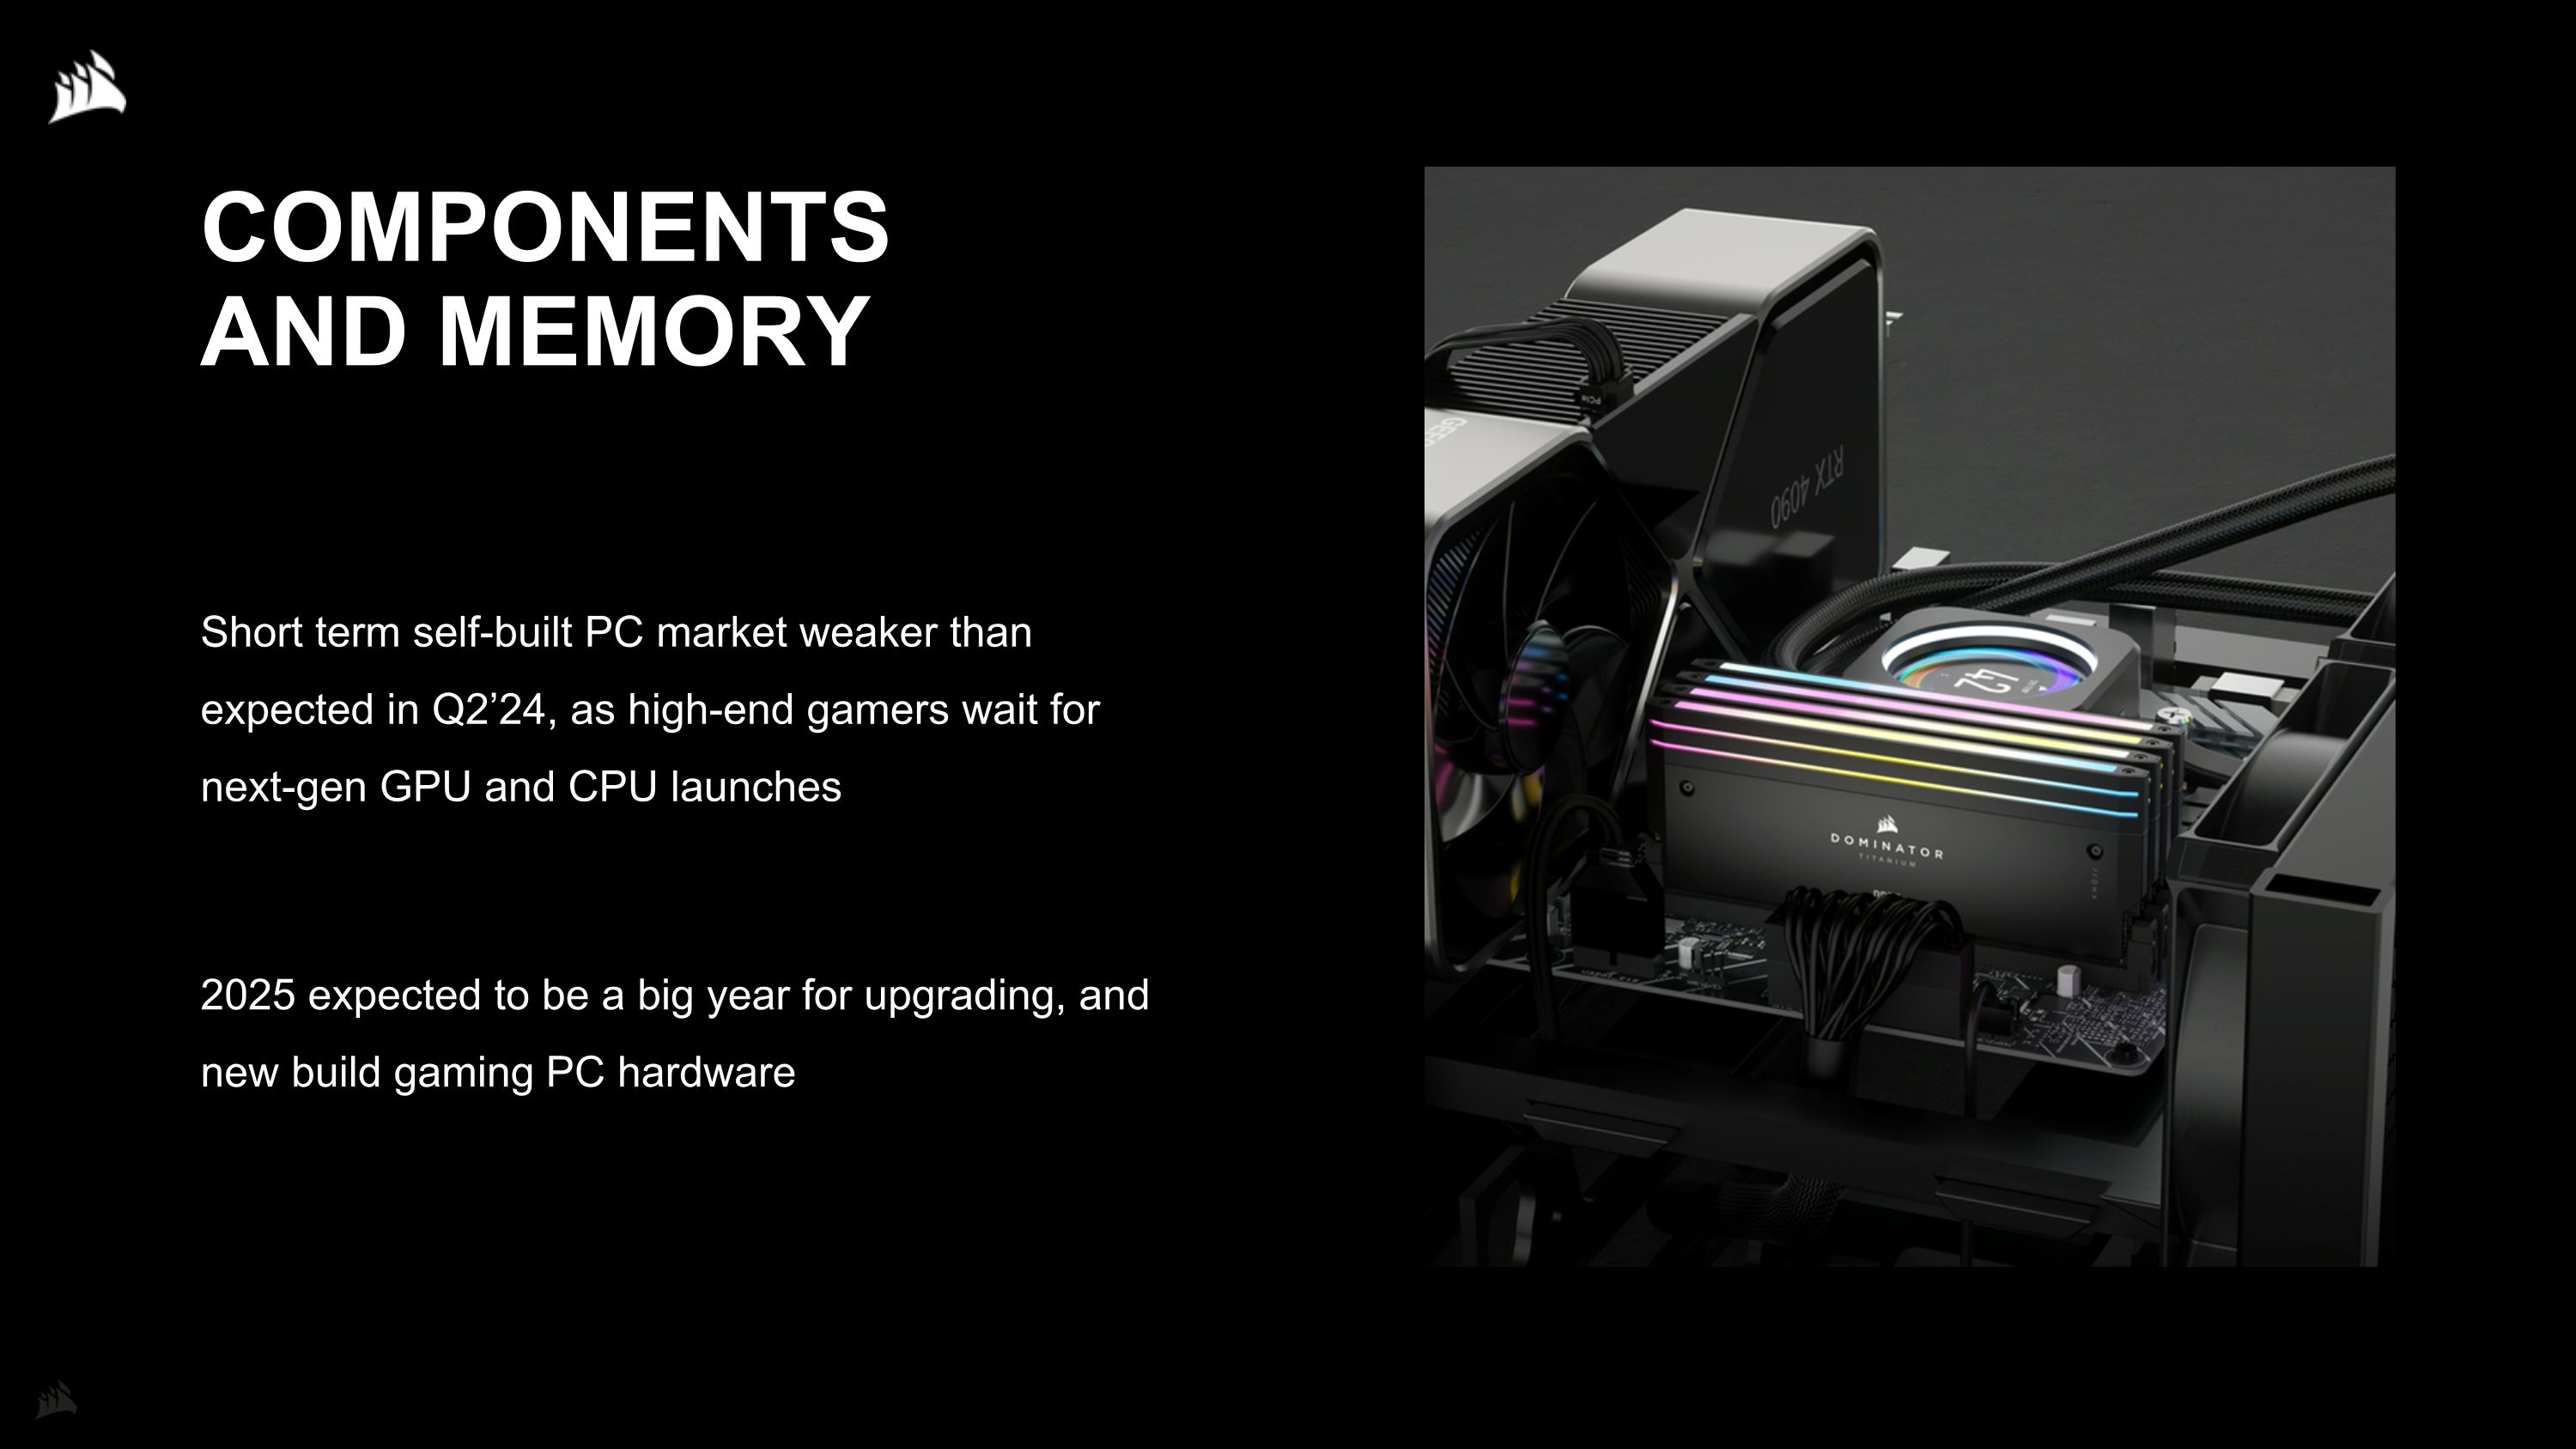
COMPONENTS AND MEMORY Short term self-built PC market weaker than expected in Q2’24, as high-end gamers wait for next-gen GPU and CPU launches 2025 expected to be a big year for upgrading, and new build gaming PC hardware
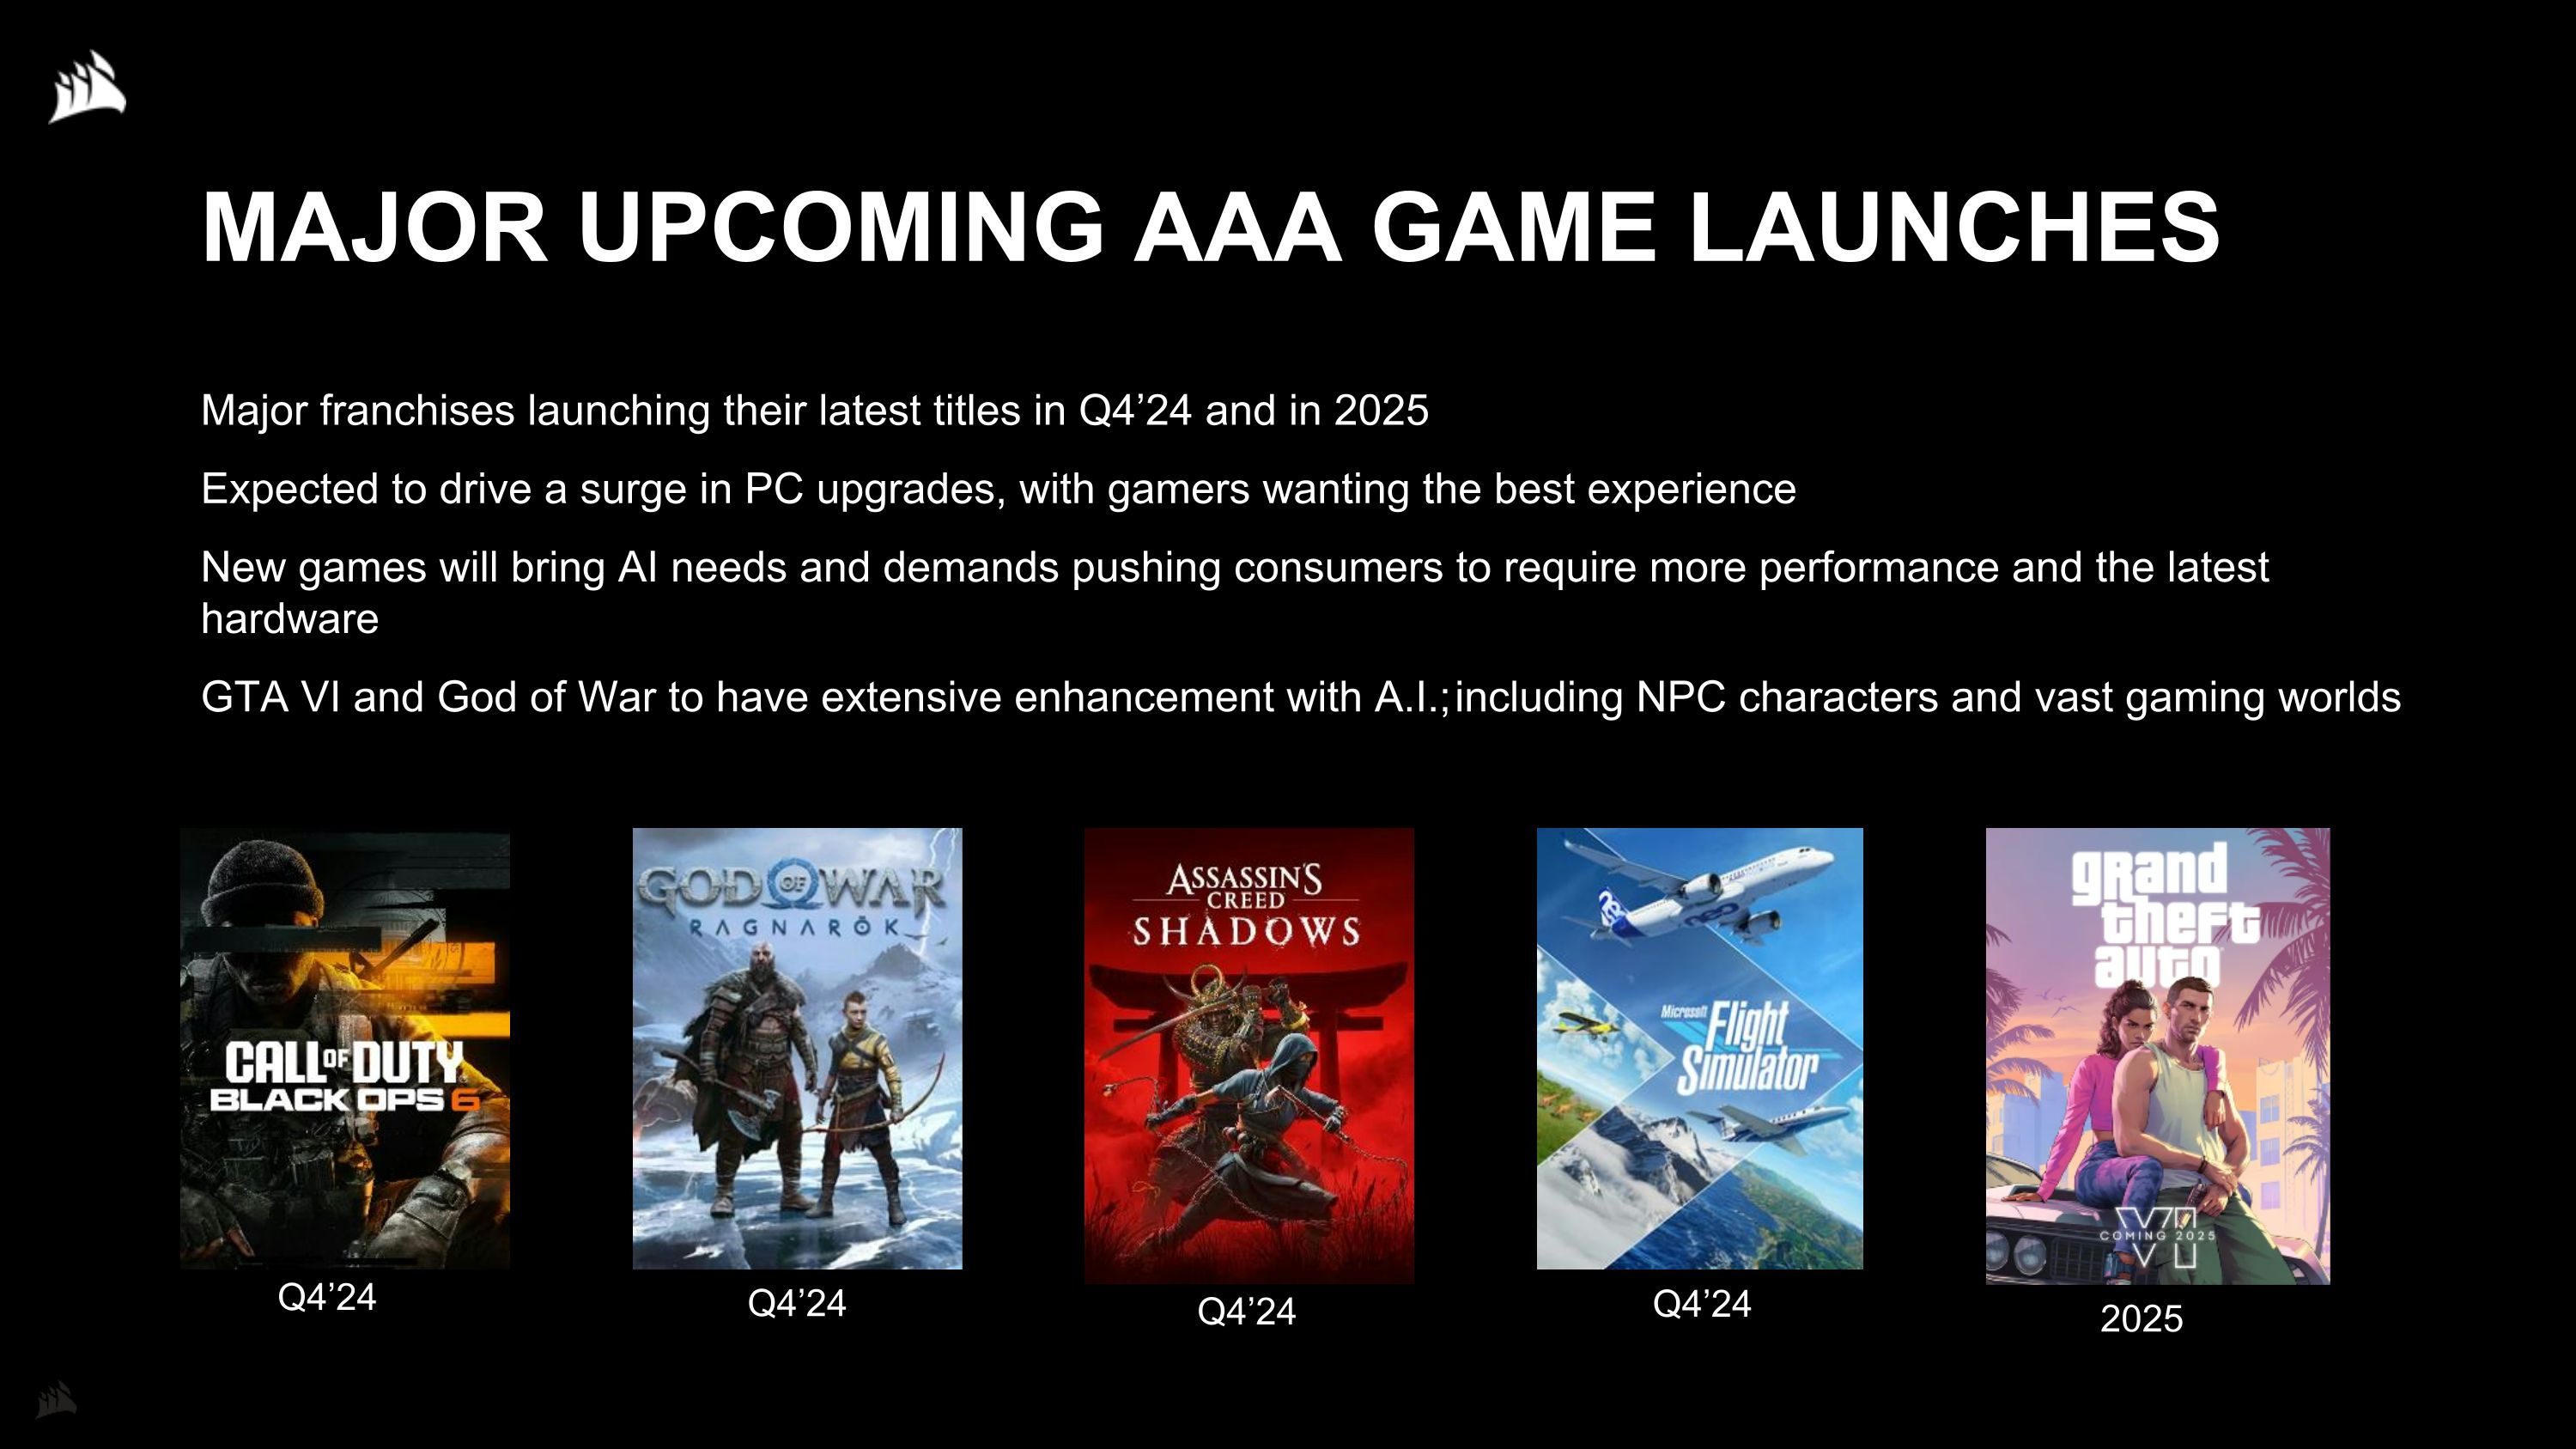
MAJOR UPCOMING AAA GAME LAUNCHES Major franchises launching their latest titles in Q4’24 and in 2025 Expected to drive a surge in PC upgrades, with gamers wanting the best experience New games will bring AI needs and demands pushing consumers to require more performance and the latest hardware GTA VI and God of War to have extensive enhancement with A.I.; including NPC characters and vast gaming worlds Q4’24 Q4’24 Q4’24 Q4’24 2025
KEY PRODUCT PROGRESS Q2’24
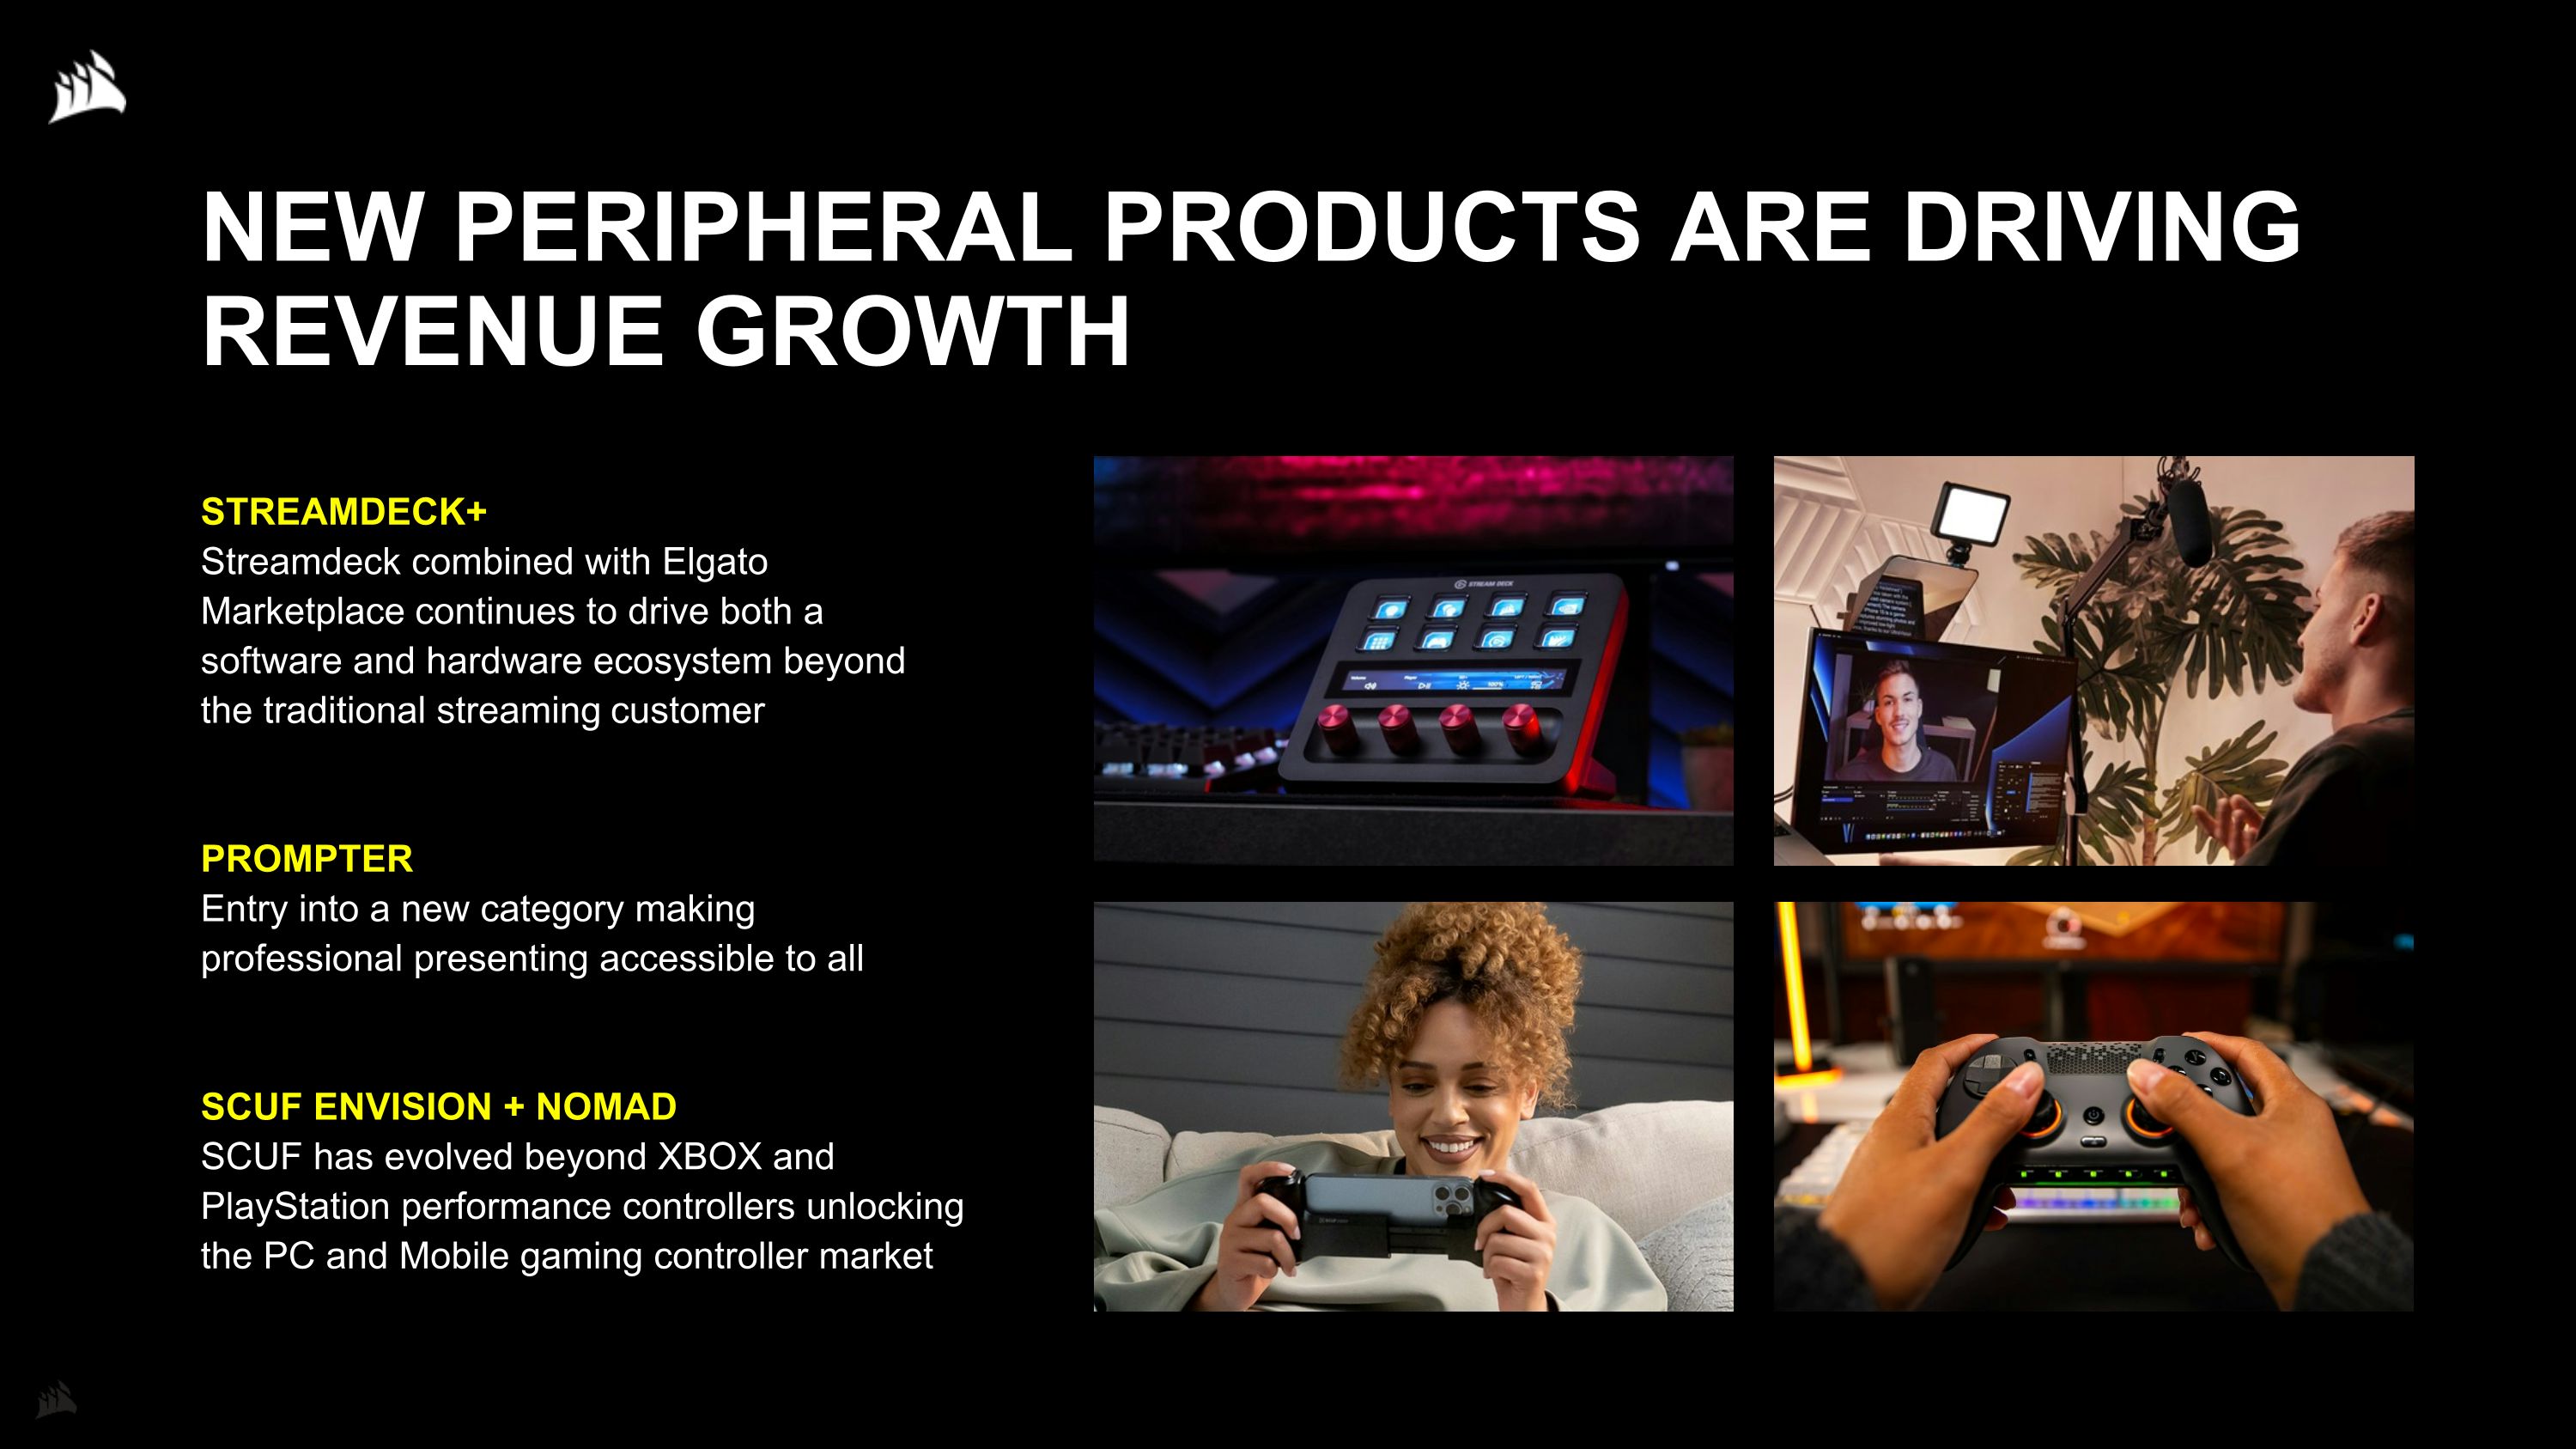
NEW PERIPHERAL PRODUCTS ARE DRIVING REVENUE GROWTH STREAMDECK+ Streamdeck combined with Elgato Marketplace continues to drive both a software and hardware ecosystem beyond the traditional streaming customer PROMPTER Entry into a new category making professional presenting accessible to all SCUF ENVISION + NOMAD SCUF has evolved beyond XBOX and PlayStation performance controllers unlocking the PC and Mobile gaming controller market
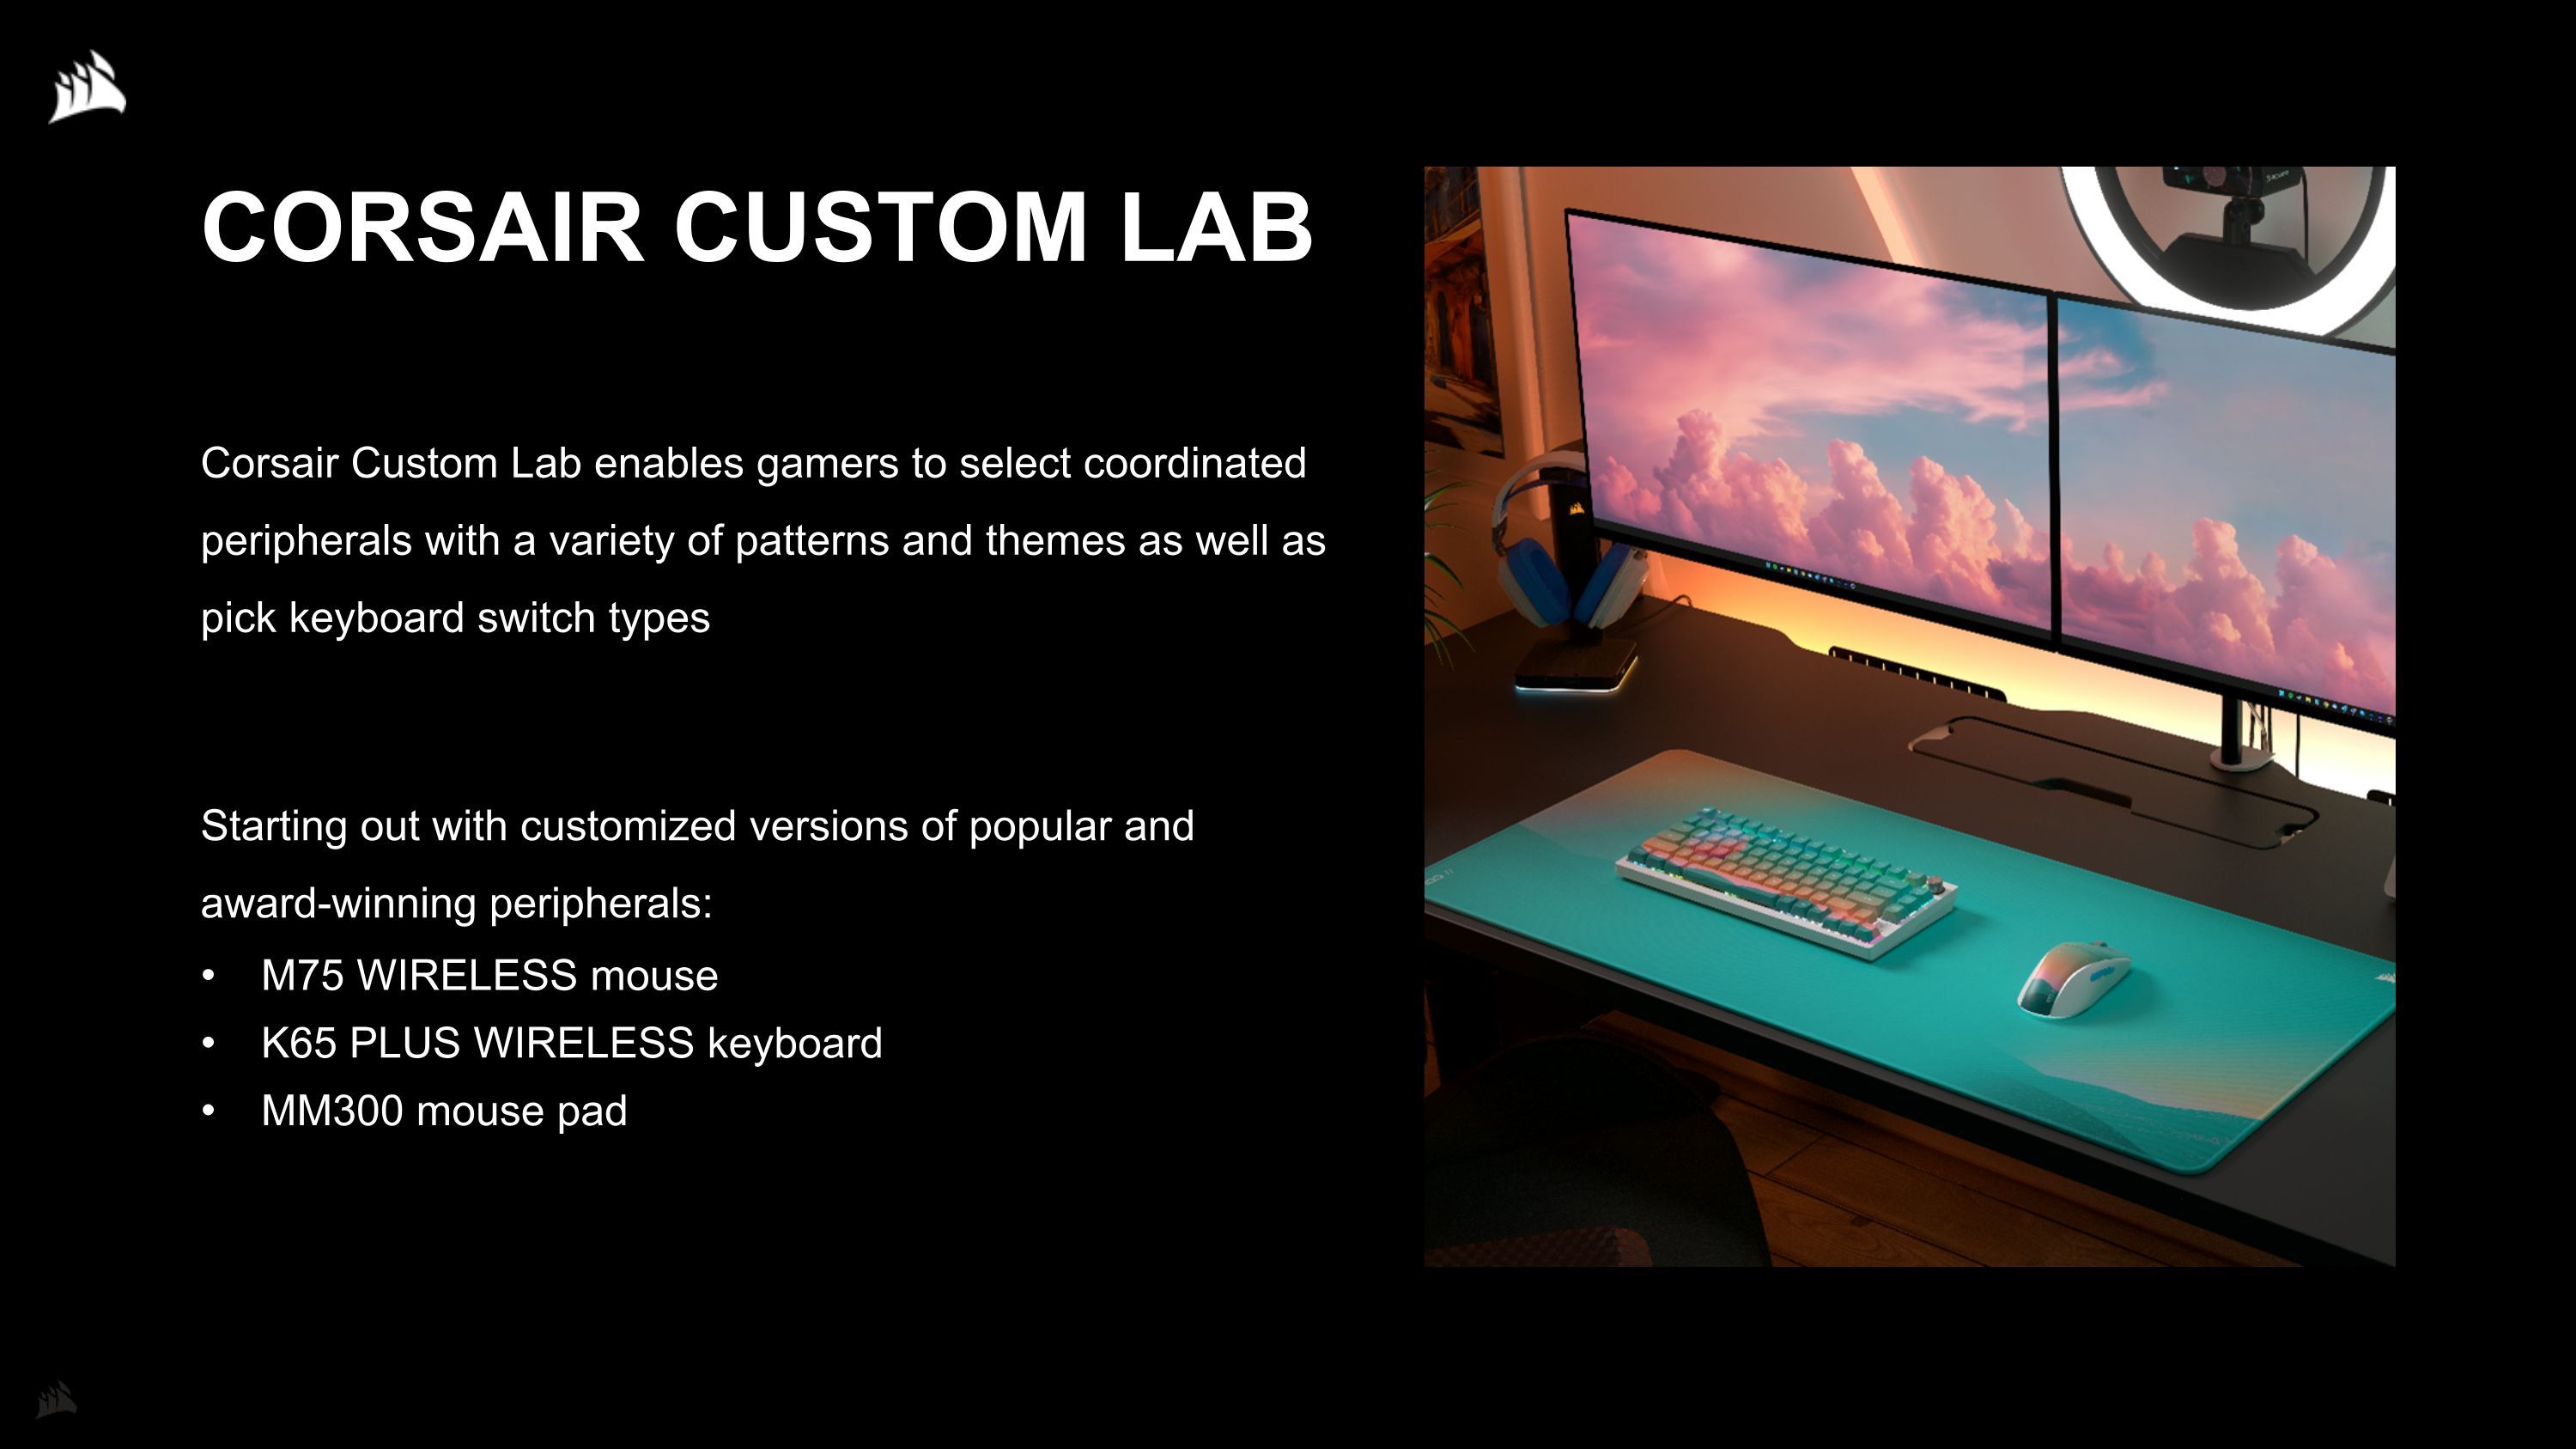
CORSAIR CUSTOM LAB Corsair Custom Lab enables gamers to select coordinated peripherals with a variety of patterns and themes as well as pick keyboard switch types Starting out with customized versions of popular and award-winning peripherals: M75 WIRELESS mouse K65 PLUS WIRELESS keyboard MM300 mouse pad
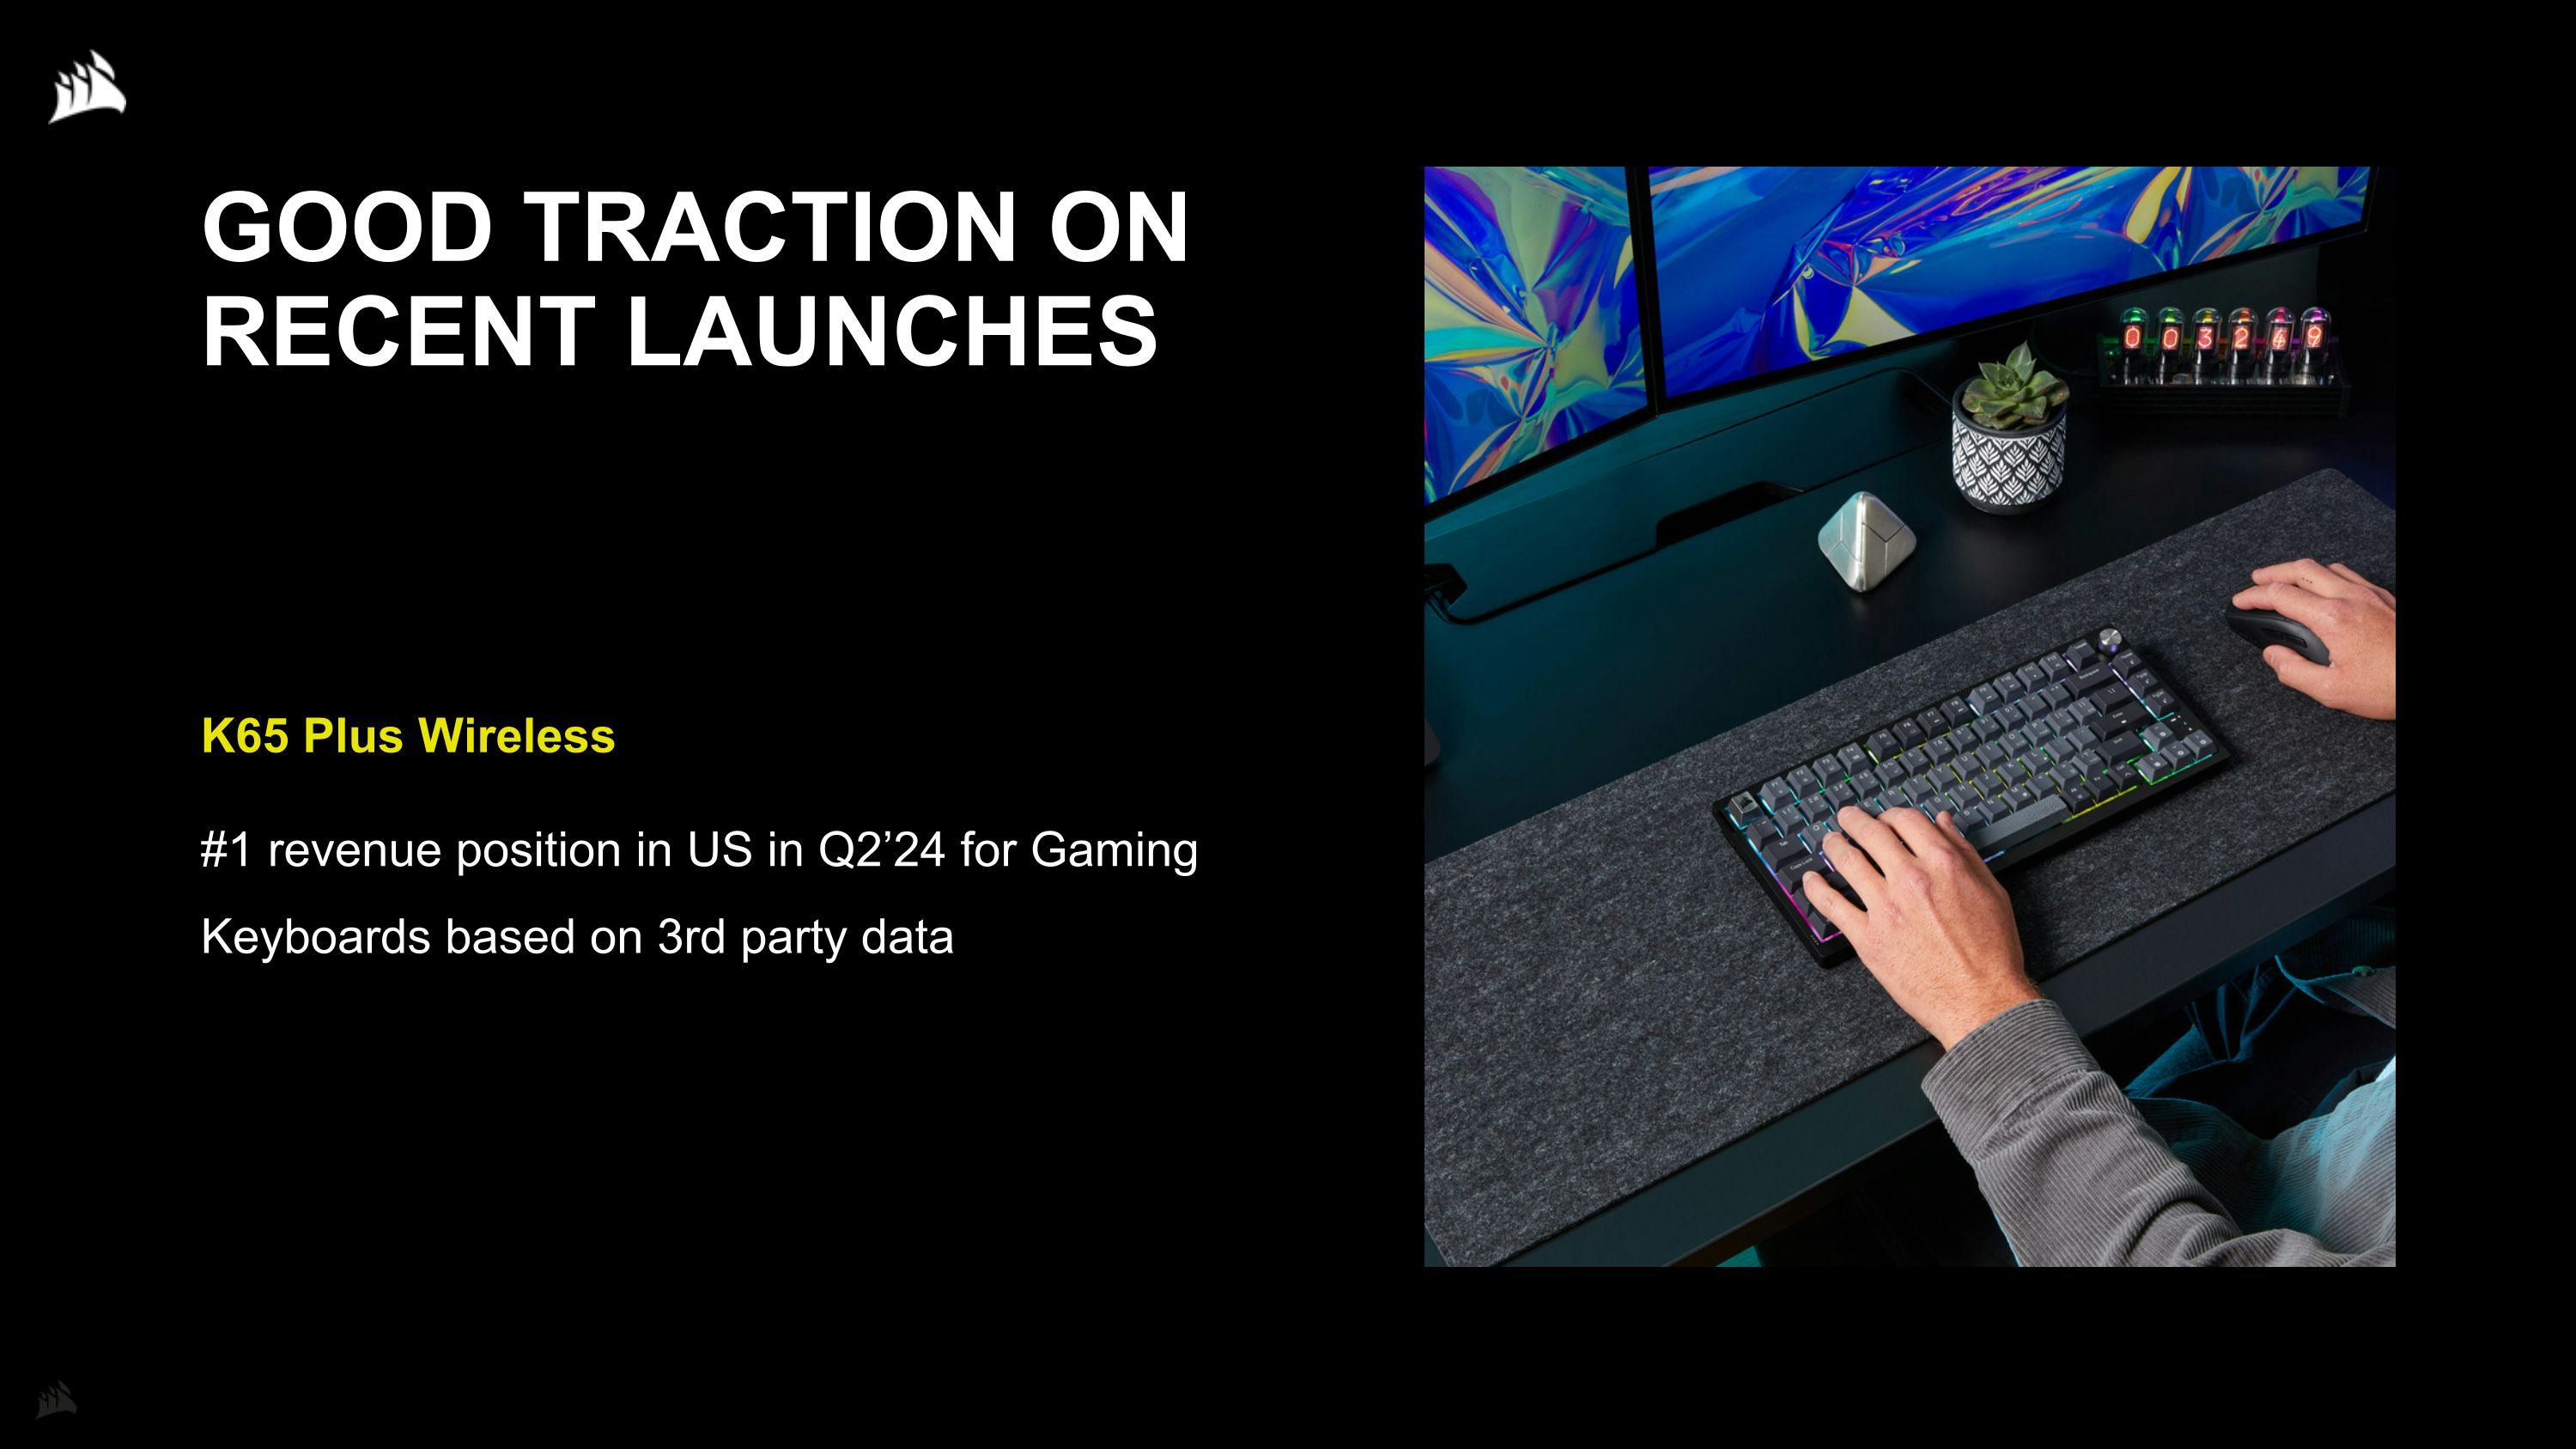
GOOD TRACTION ON RECENT LAUNCHES K65 Plus Wireless #1 revenue position in US in Q2’24 for Gaming Keyboards based on 3rd party data

CORSAIR RACING Corsair launched its first sim-racing product – our Sim cockpit We have delivered a great solution for avid Sim racing fans that allows endless attachment points for monitors and peripherals Modular design allows consumers to build precisely what they need for competitive racing
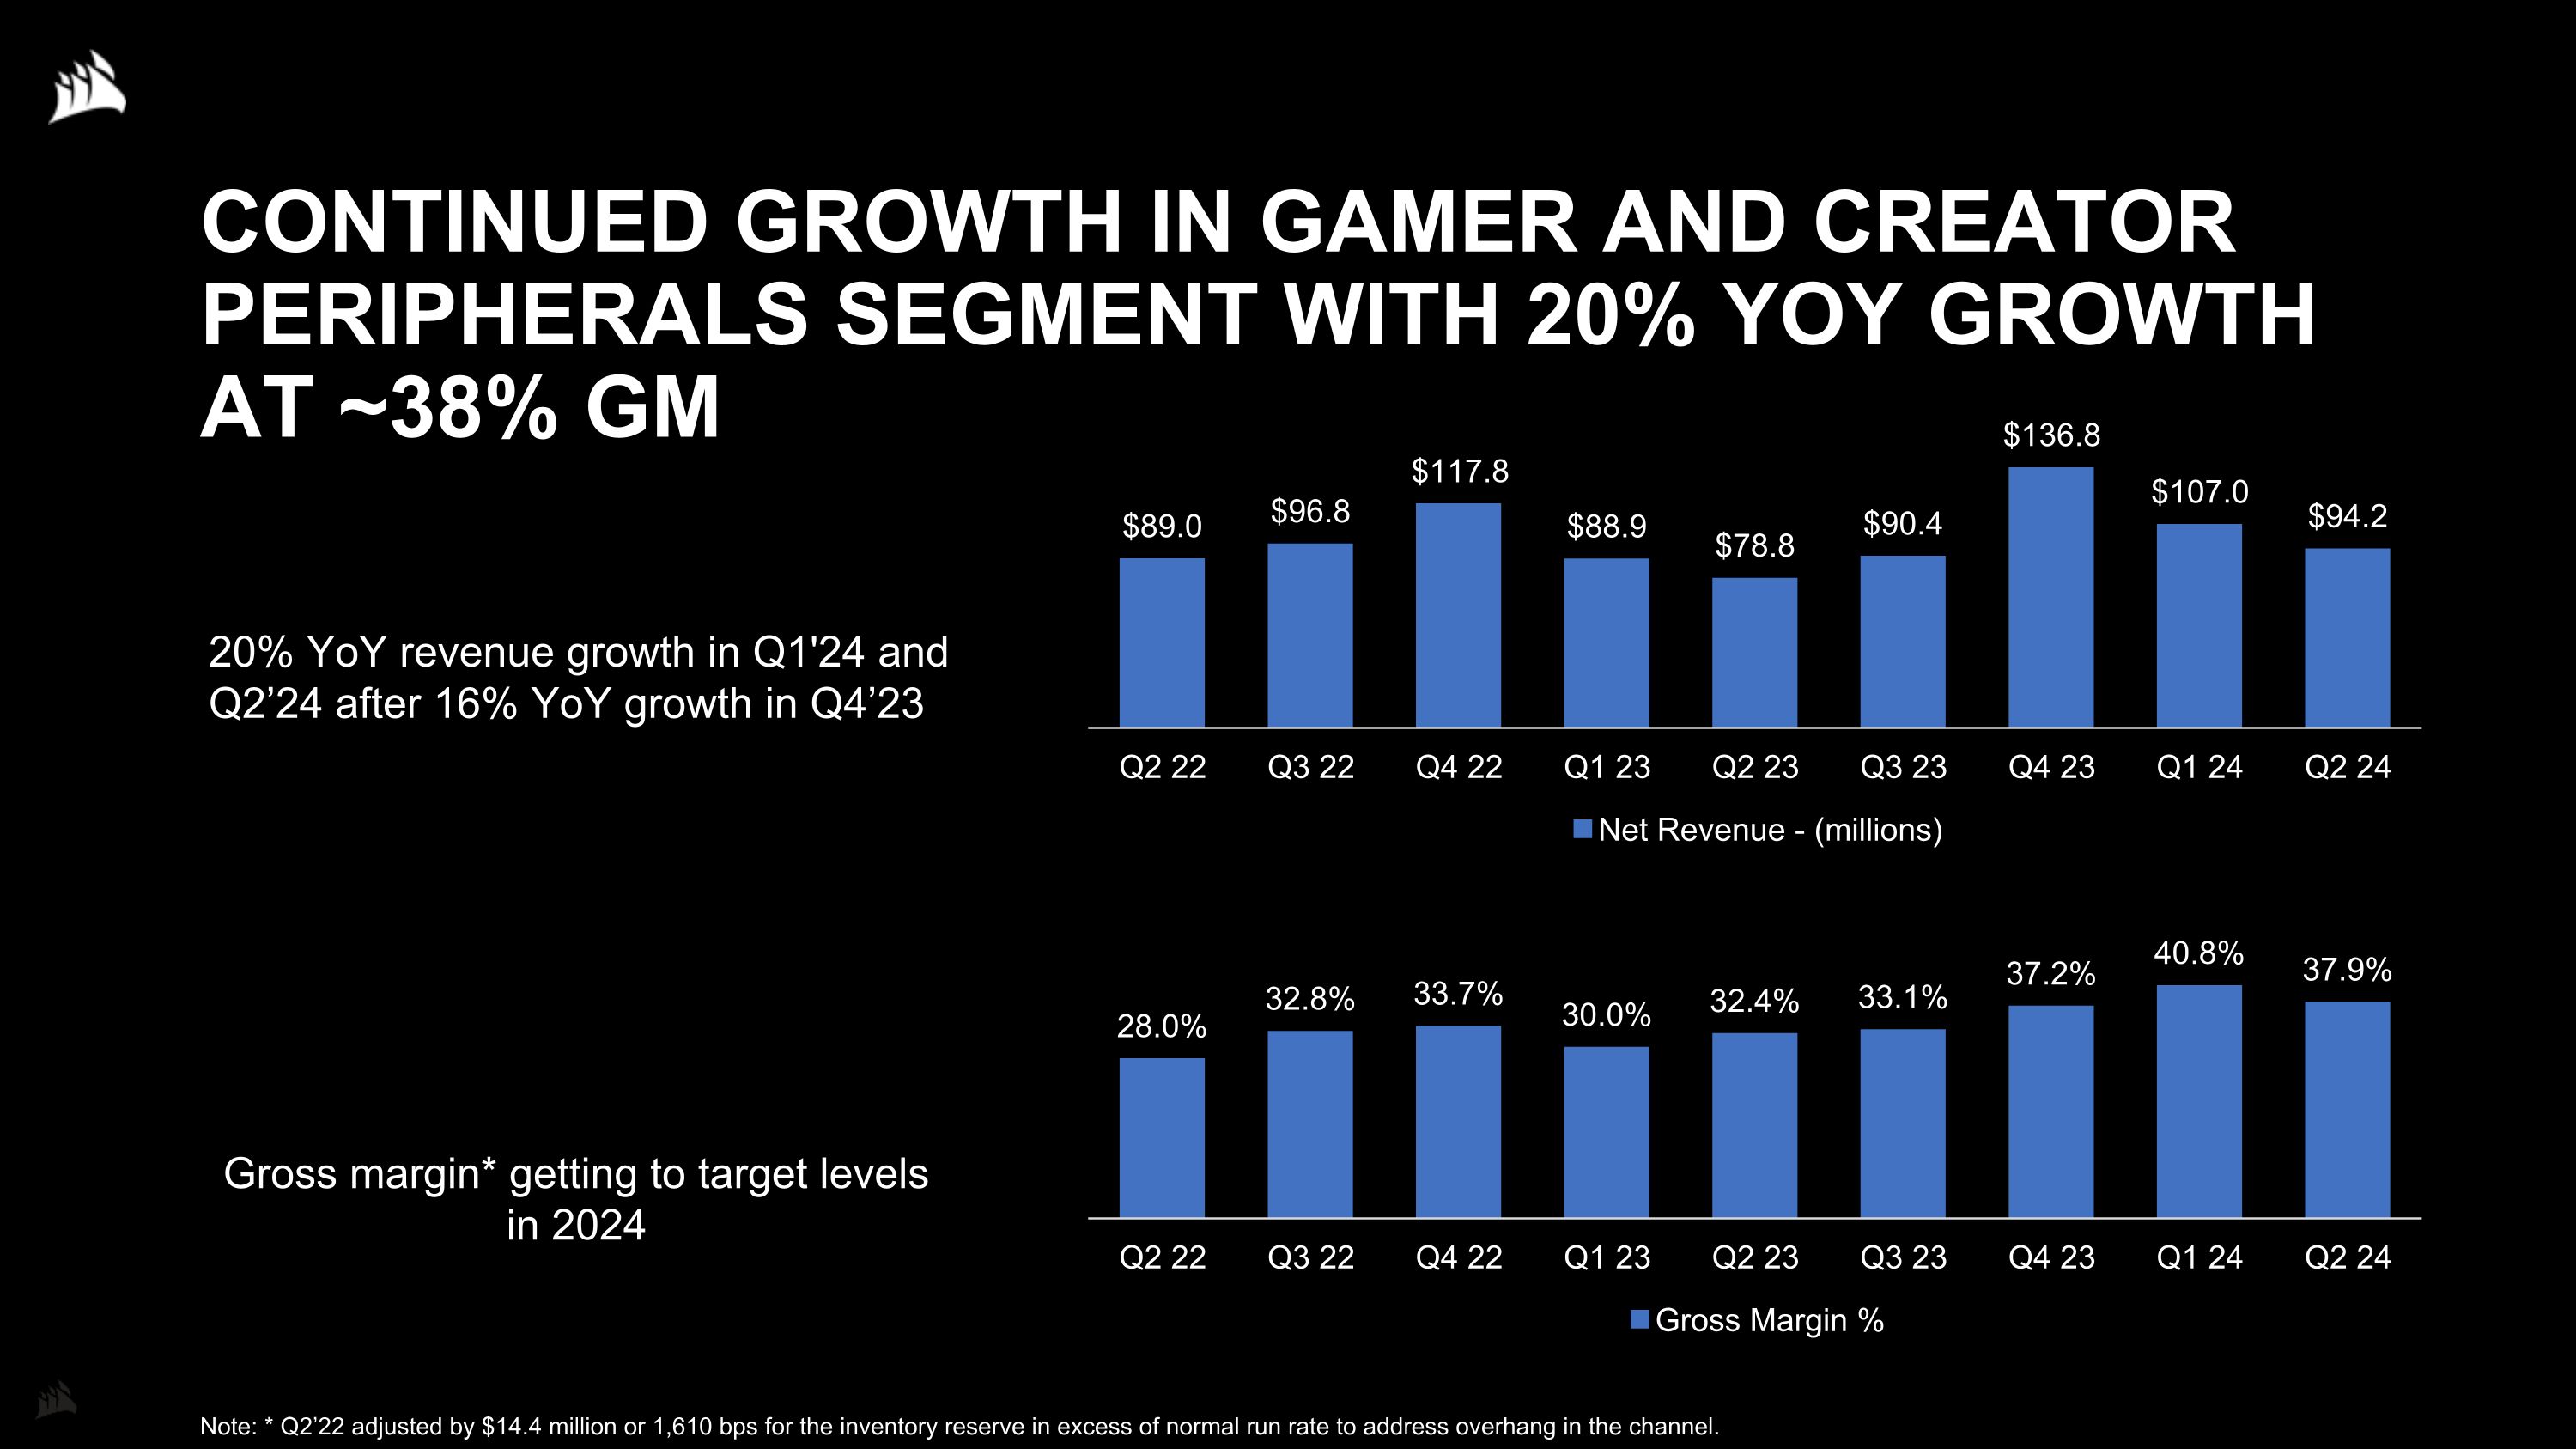
CONTINUED GROWTH IN GAMER AND CREATOR PERIPHERALS SEGMENT WITH 20% YOY GROWTH AT ~38% GM 20% YoY revenue growth in Q1'24 and Q2’24 after 16% YoY growth in Q4’23 Gross margin* getting to target levels in 2024 Note: * Q2’22 adjusted by $14.4 million or 1,610 bps for the inventory reserve in excess of normal run rate to address overhang in the channel.

FINANCIAL RESULTS
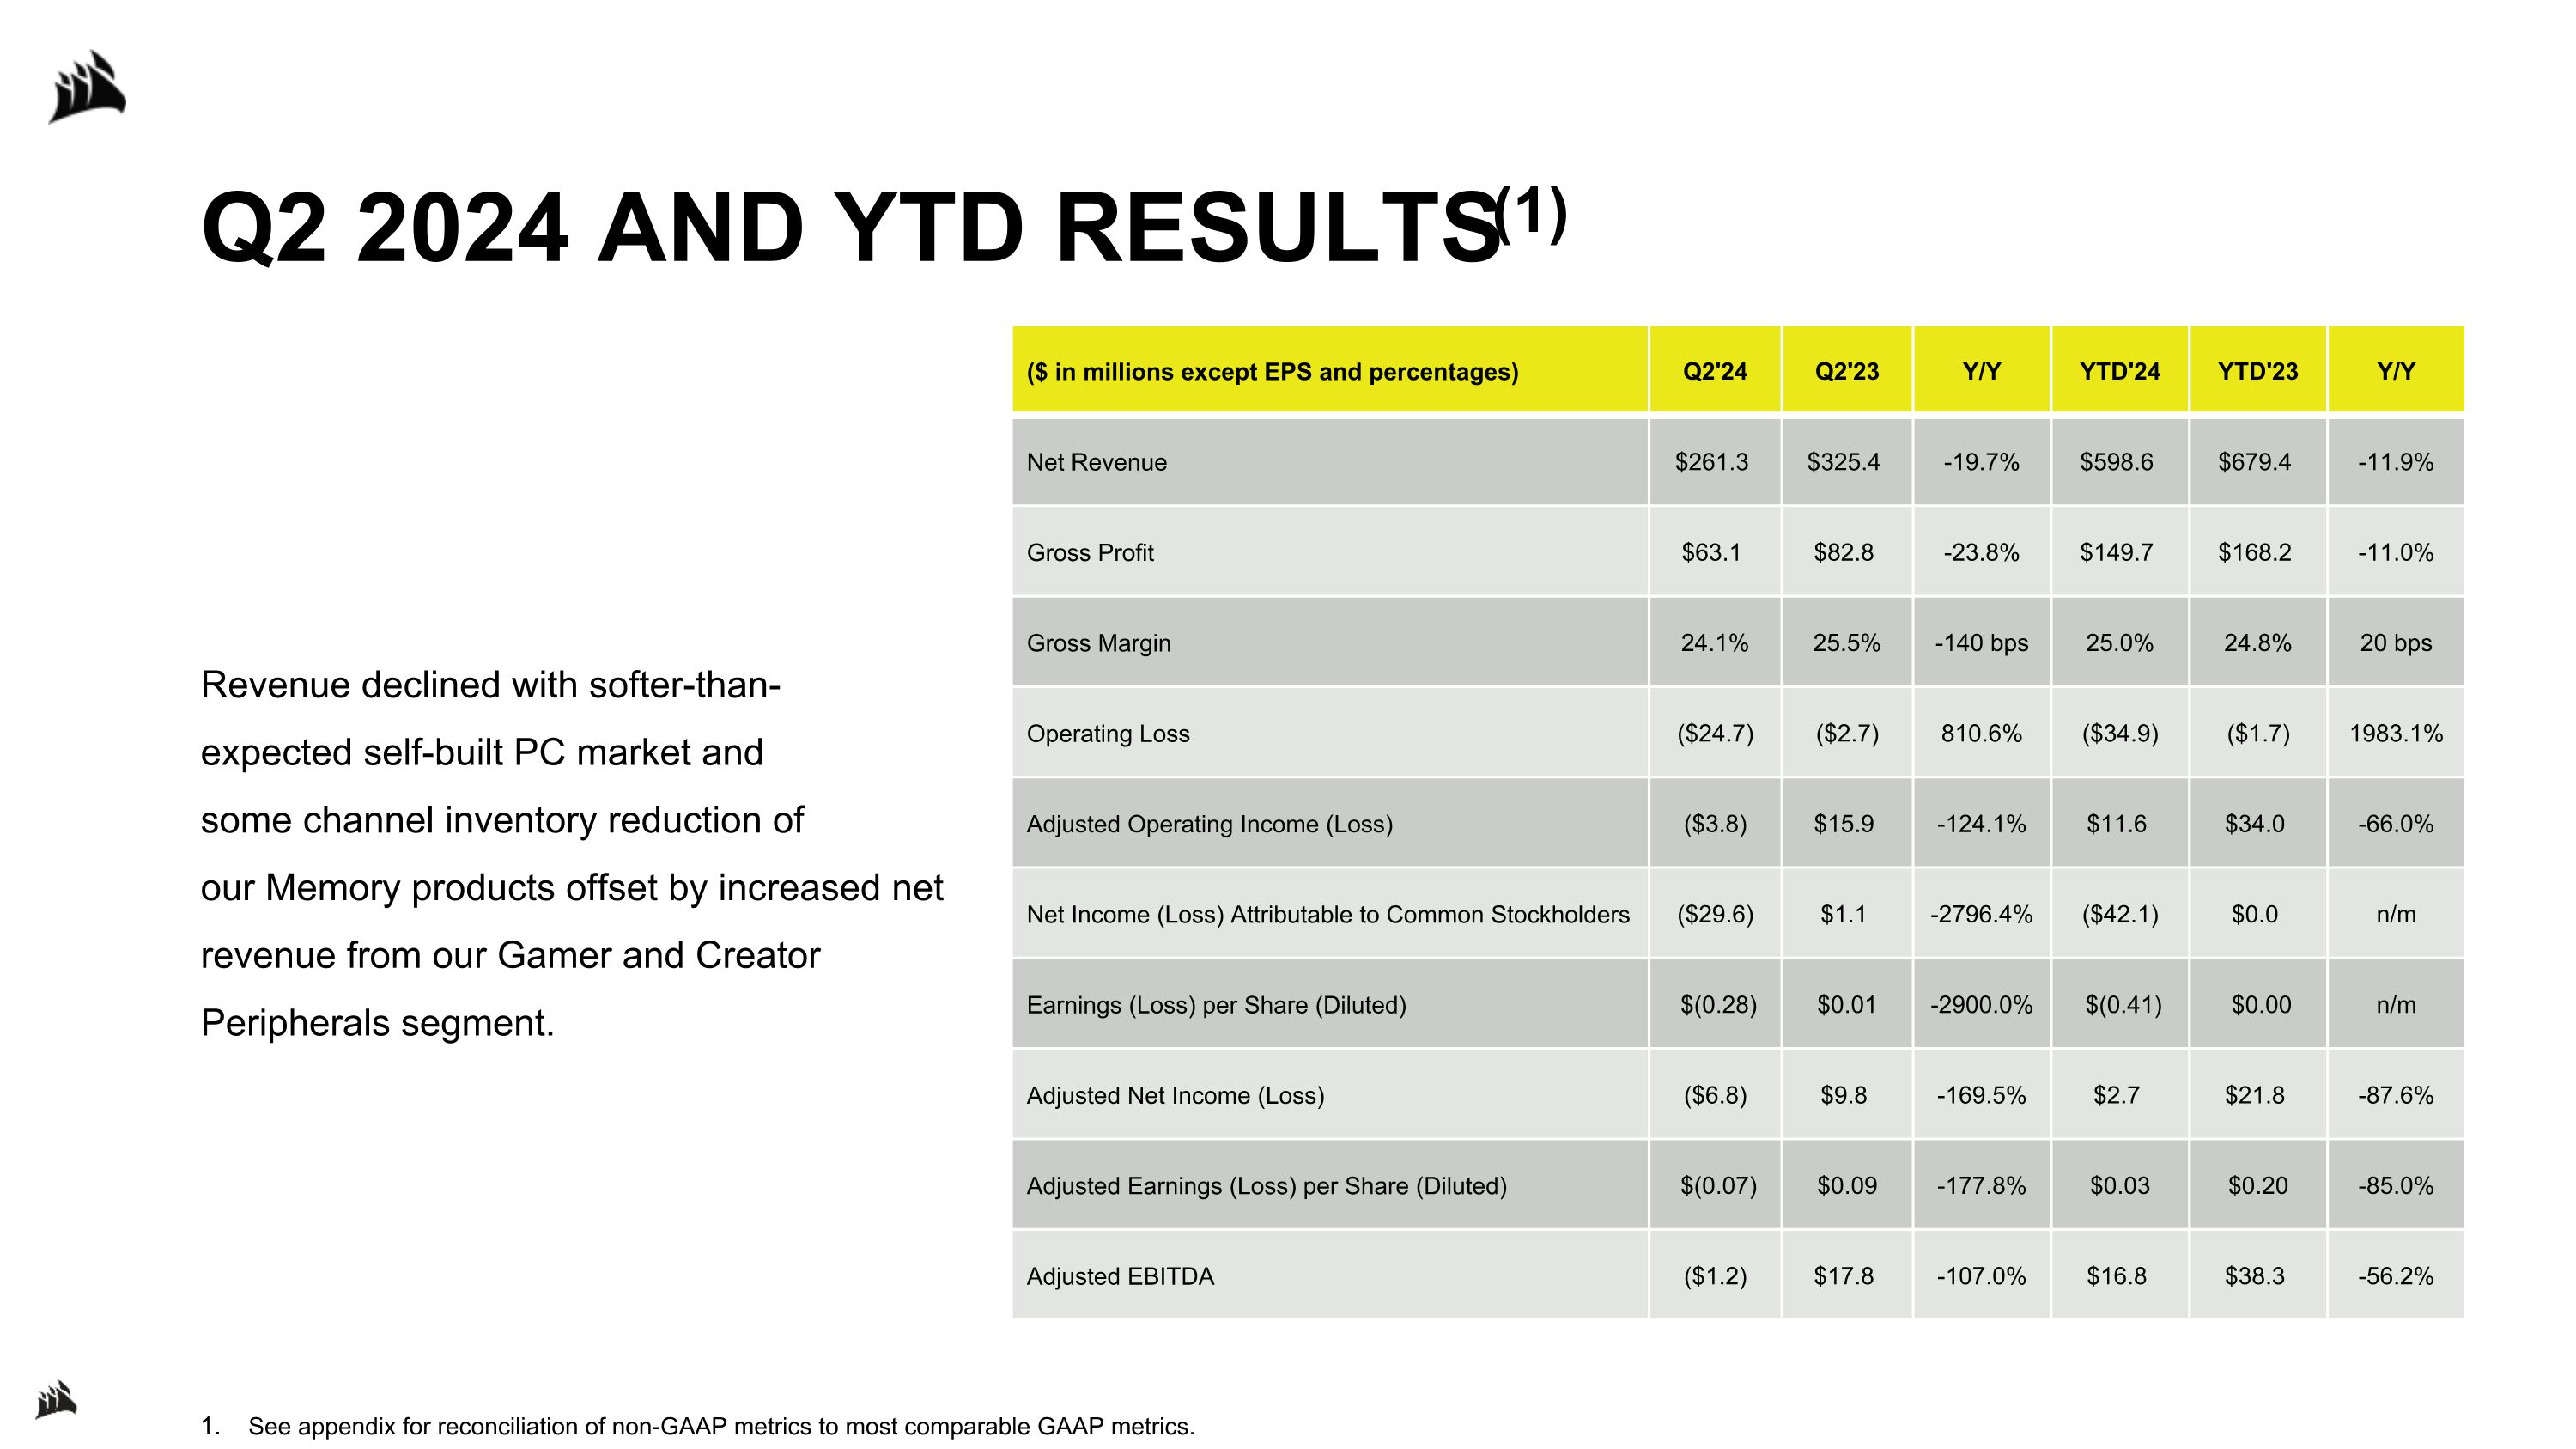
Q2 2024 AND YTD RESULTS(1) Revenue declined with softer-than-expected self-built PC market and some channel inventory reduction of our Memory products offset by increased net revenue from our Gamer and Creator Peripherals segment. See appendix for reconciliation of non-GAAP metrics to most comparable GAAP metrics. ($ in millions except EPS and percentages) Q2'24 Q2'23 Y/Y YTD'24 YTD'23 Y/Y Net Revenue $261.3 $325.4 -19.7% $598.6 $679.4 -11.9% Gross Profit $63.1 $82.8 -23.8% $149.7 $168.2 -11.0% Gross Margin 24.1% 25.5% -140 bps 25.0% 24.8% 20 bps Operating Loss ($24.7) ($2.7) 810.6% ($34.9) ($1.7) 1983.1% Adjusted Operating Income (Loss) ($3.8) $15.9 -124.1% $11.6 $34.0 -66.0% Net Income (Loss) Attributable to Common Stockholders ($29.6) $1.1 -2796.4% ($42.1) $0.0 n/m Earnings (Loss) per Share (Diluted) $(0.28) $0.01 -2900.0% $(0.41) $0.00 n/m Adjusted Net Income (Loss) ($6.8) $9.8 -169.5% $2.7 $21.8 -87.6% Adjusted Earnings (Loss) per Share (Diluted) $(0.07) $0.09 -177.8% $0.03 $0.20 -85.0% Adjusted EBITDA ($1.2) $17.8 -107.0% $16.8 $38.3 -56.2%
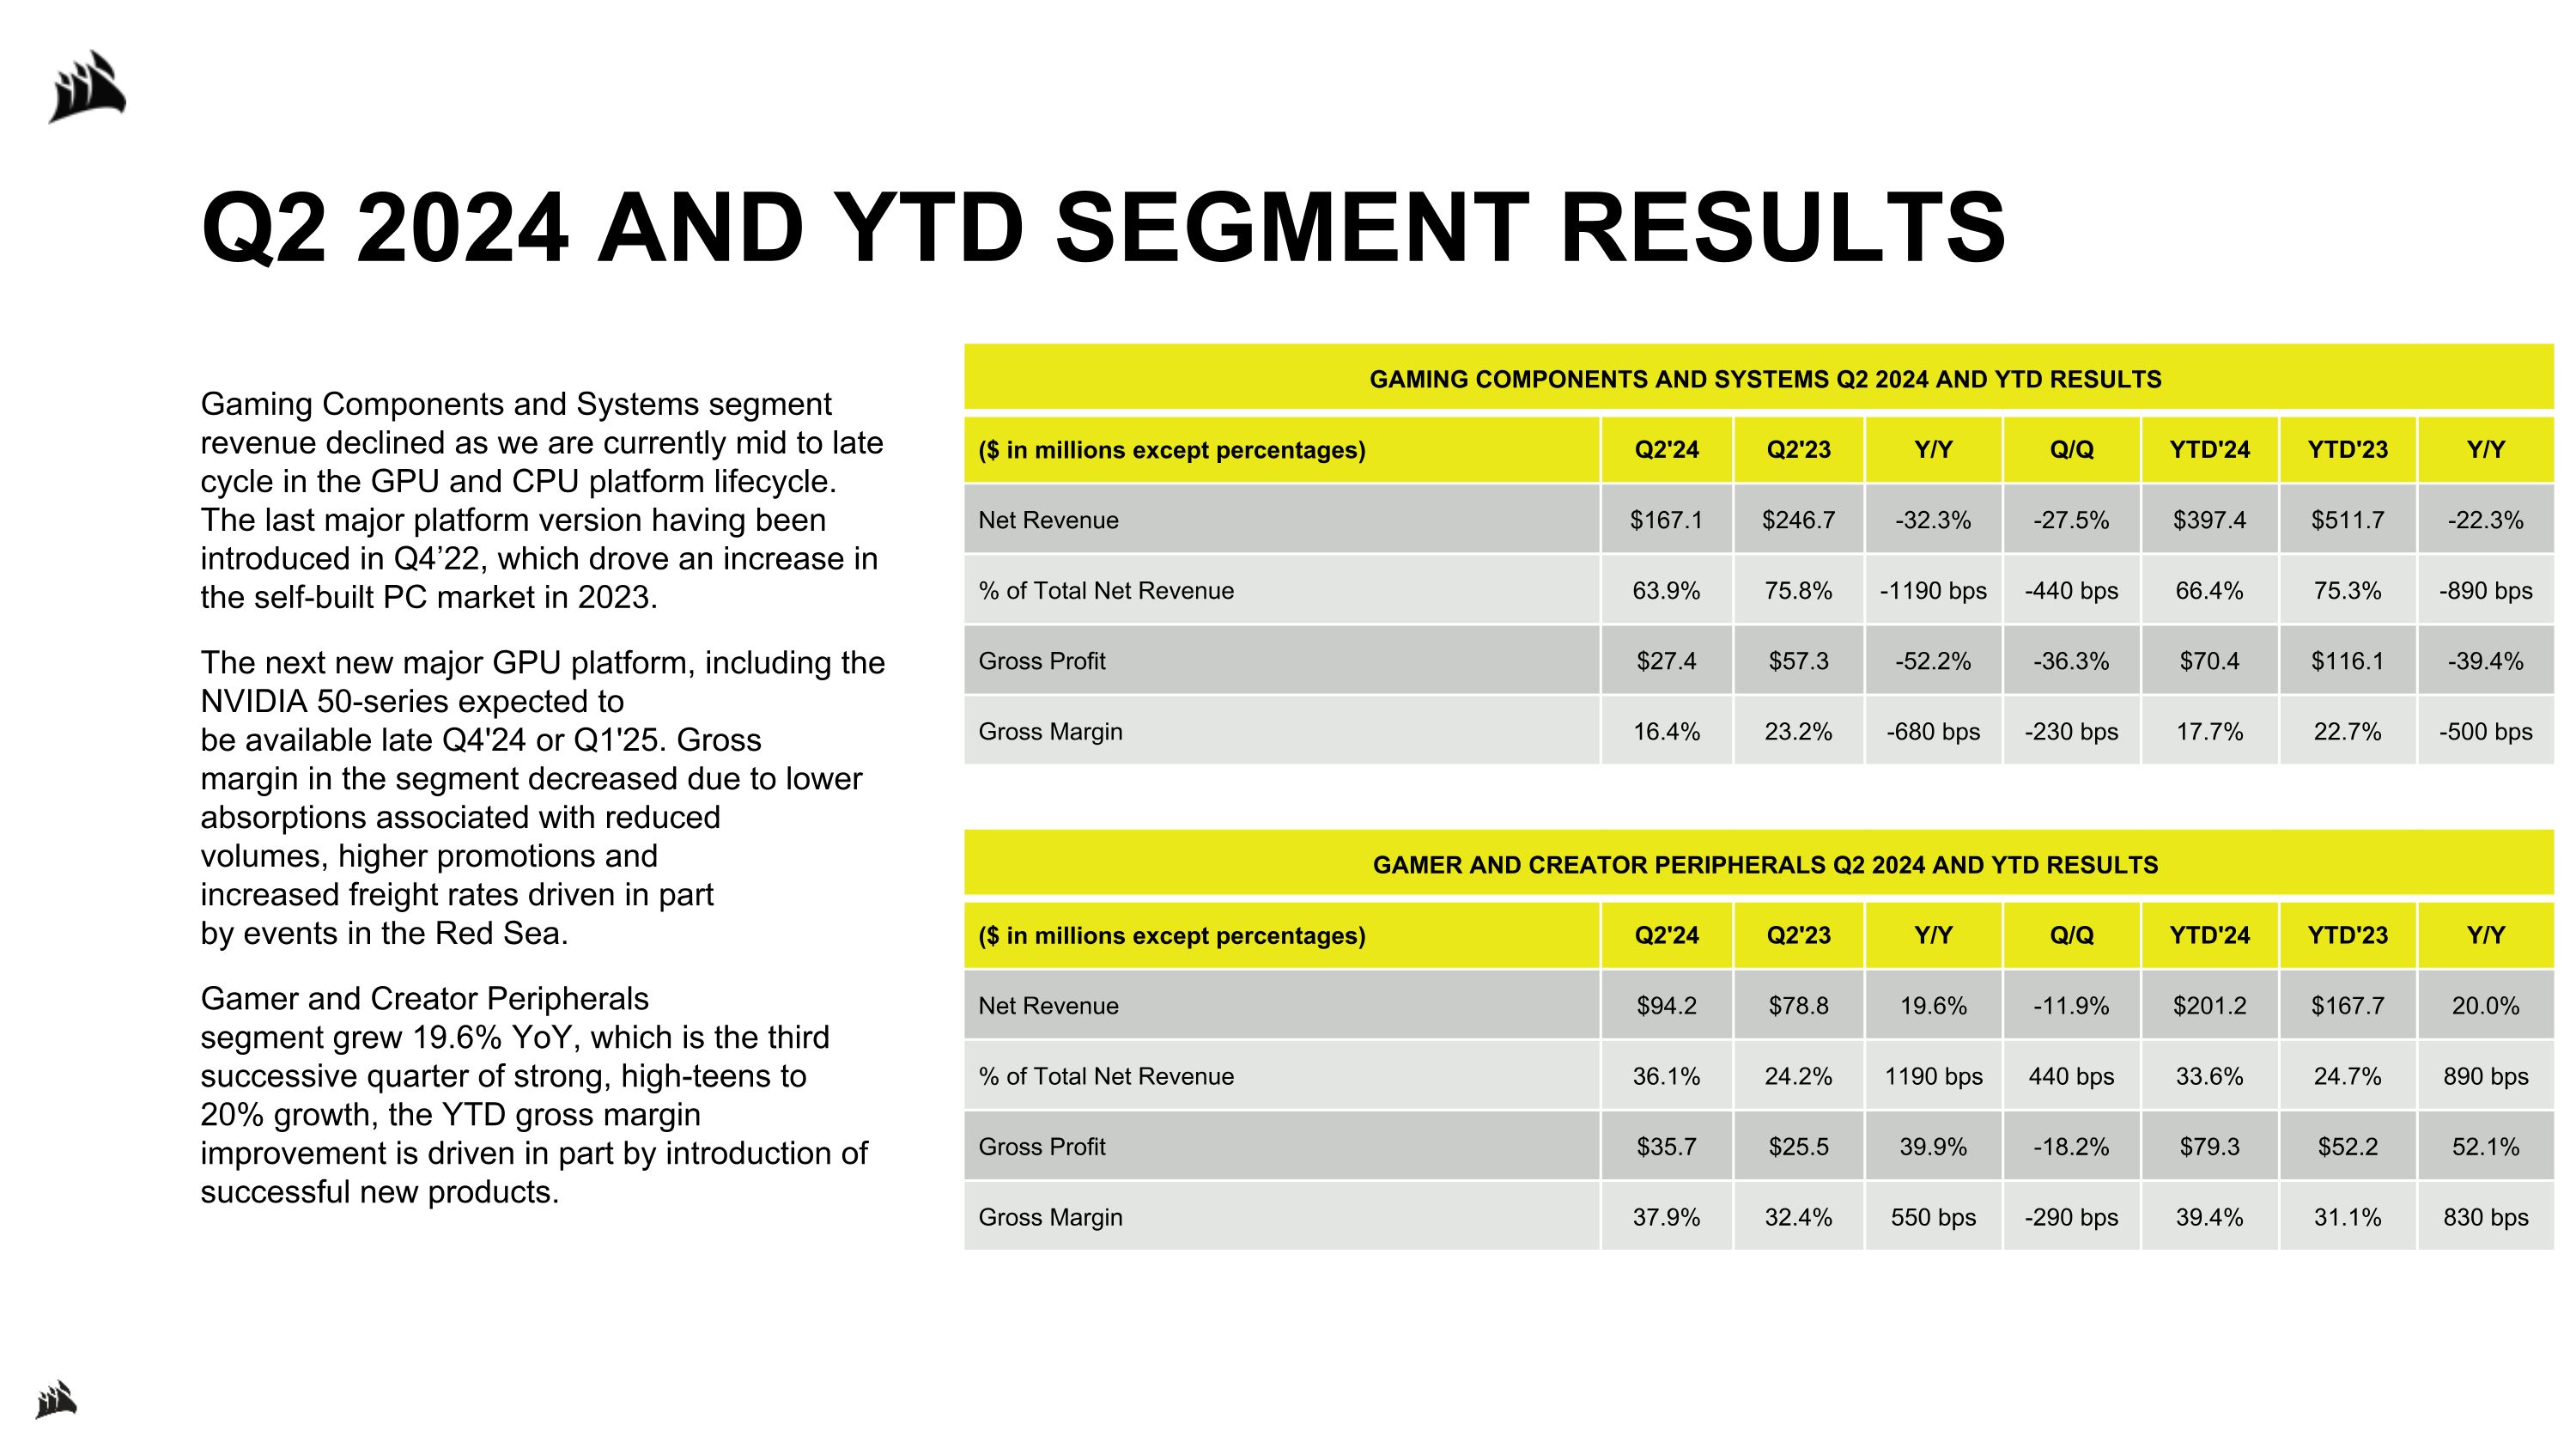
Q2 2024 AND YTD SEGMENT RESULTS Gaming Components and Systems segment revenue declined as we are currently mid to late cycle in the GPU and CPU platform lifecycle. The last major platform version having been introduced in Q4’22, which drove an increase in the self-built PC market in 2023. The next new major GPU platform, including the NVIDIA 50-series expected to be available late Q4'24 or Q1'25. Gross margin in the segment decreased due to lower absorptions associated with reduced volumes, higher promotions and increased freight rates driven in part by events in the Red Sea. Gamer and Creator Peripherals segment grew 19.6% YoY, which is the third successive quarter of strong, high-teens to 20% growth, the YTD gross margin improvement is driven in part by introduction of successful new products. GAMING COMPONENTS AND SYSTEMS Q2 2024 AND YTD RESULTS ($ in millions except percentages) Q2'24 Q2'23 Y/Y Q/Q YTD'24 YTD'23 Y/Y Net Revenue $167.1 $246.7 -32.3% -27.5% $397.4 $511.7 -22.3% % of Total Net Revenue 63.9% 75.8% -1190 bps -440 bps 66.4% 75.3% -890 bps Gross Profit $27.4 $57.3 -52.2% -36.3% $70.4 $116.1 -39.4% Gross Margin 16.4% 23.2% -680 bps -230 bps 17.7% 22.7% -500 bps GAMER AND CREATOR PERIPHERALS Q2 2024 AND YTD RESULTS ($ in millions except percentages) Q2'24 Q2'23 Y/Y Q/Q YTD'24 YTD'23 Y/Y Net Revenue $94.2 $78.8 19.6% -11.9% $201.2 $167.7 20.0% % of Total Net Revenue 36.1% 24.2% 1190 bps 440 bps 33.6% 24.7% 890 bps Gross Profit $35.7 $25.5 39.9% -18.2% $79.3 $52.2 52.1% Gross Margin 37.9% 32.4% 550 bps -290 bps 39.4% 31.1% 830 bps
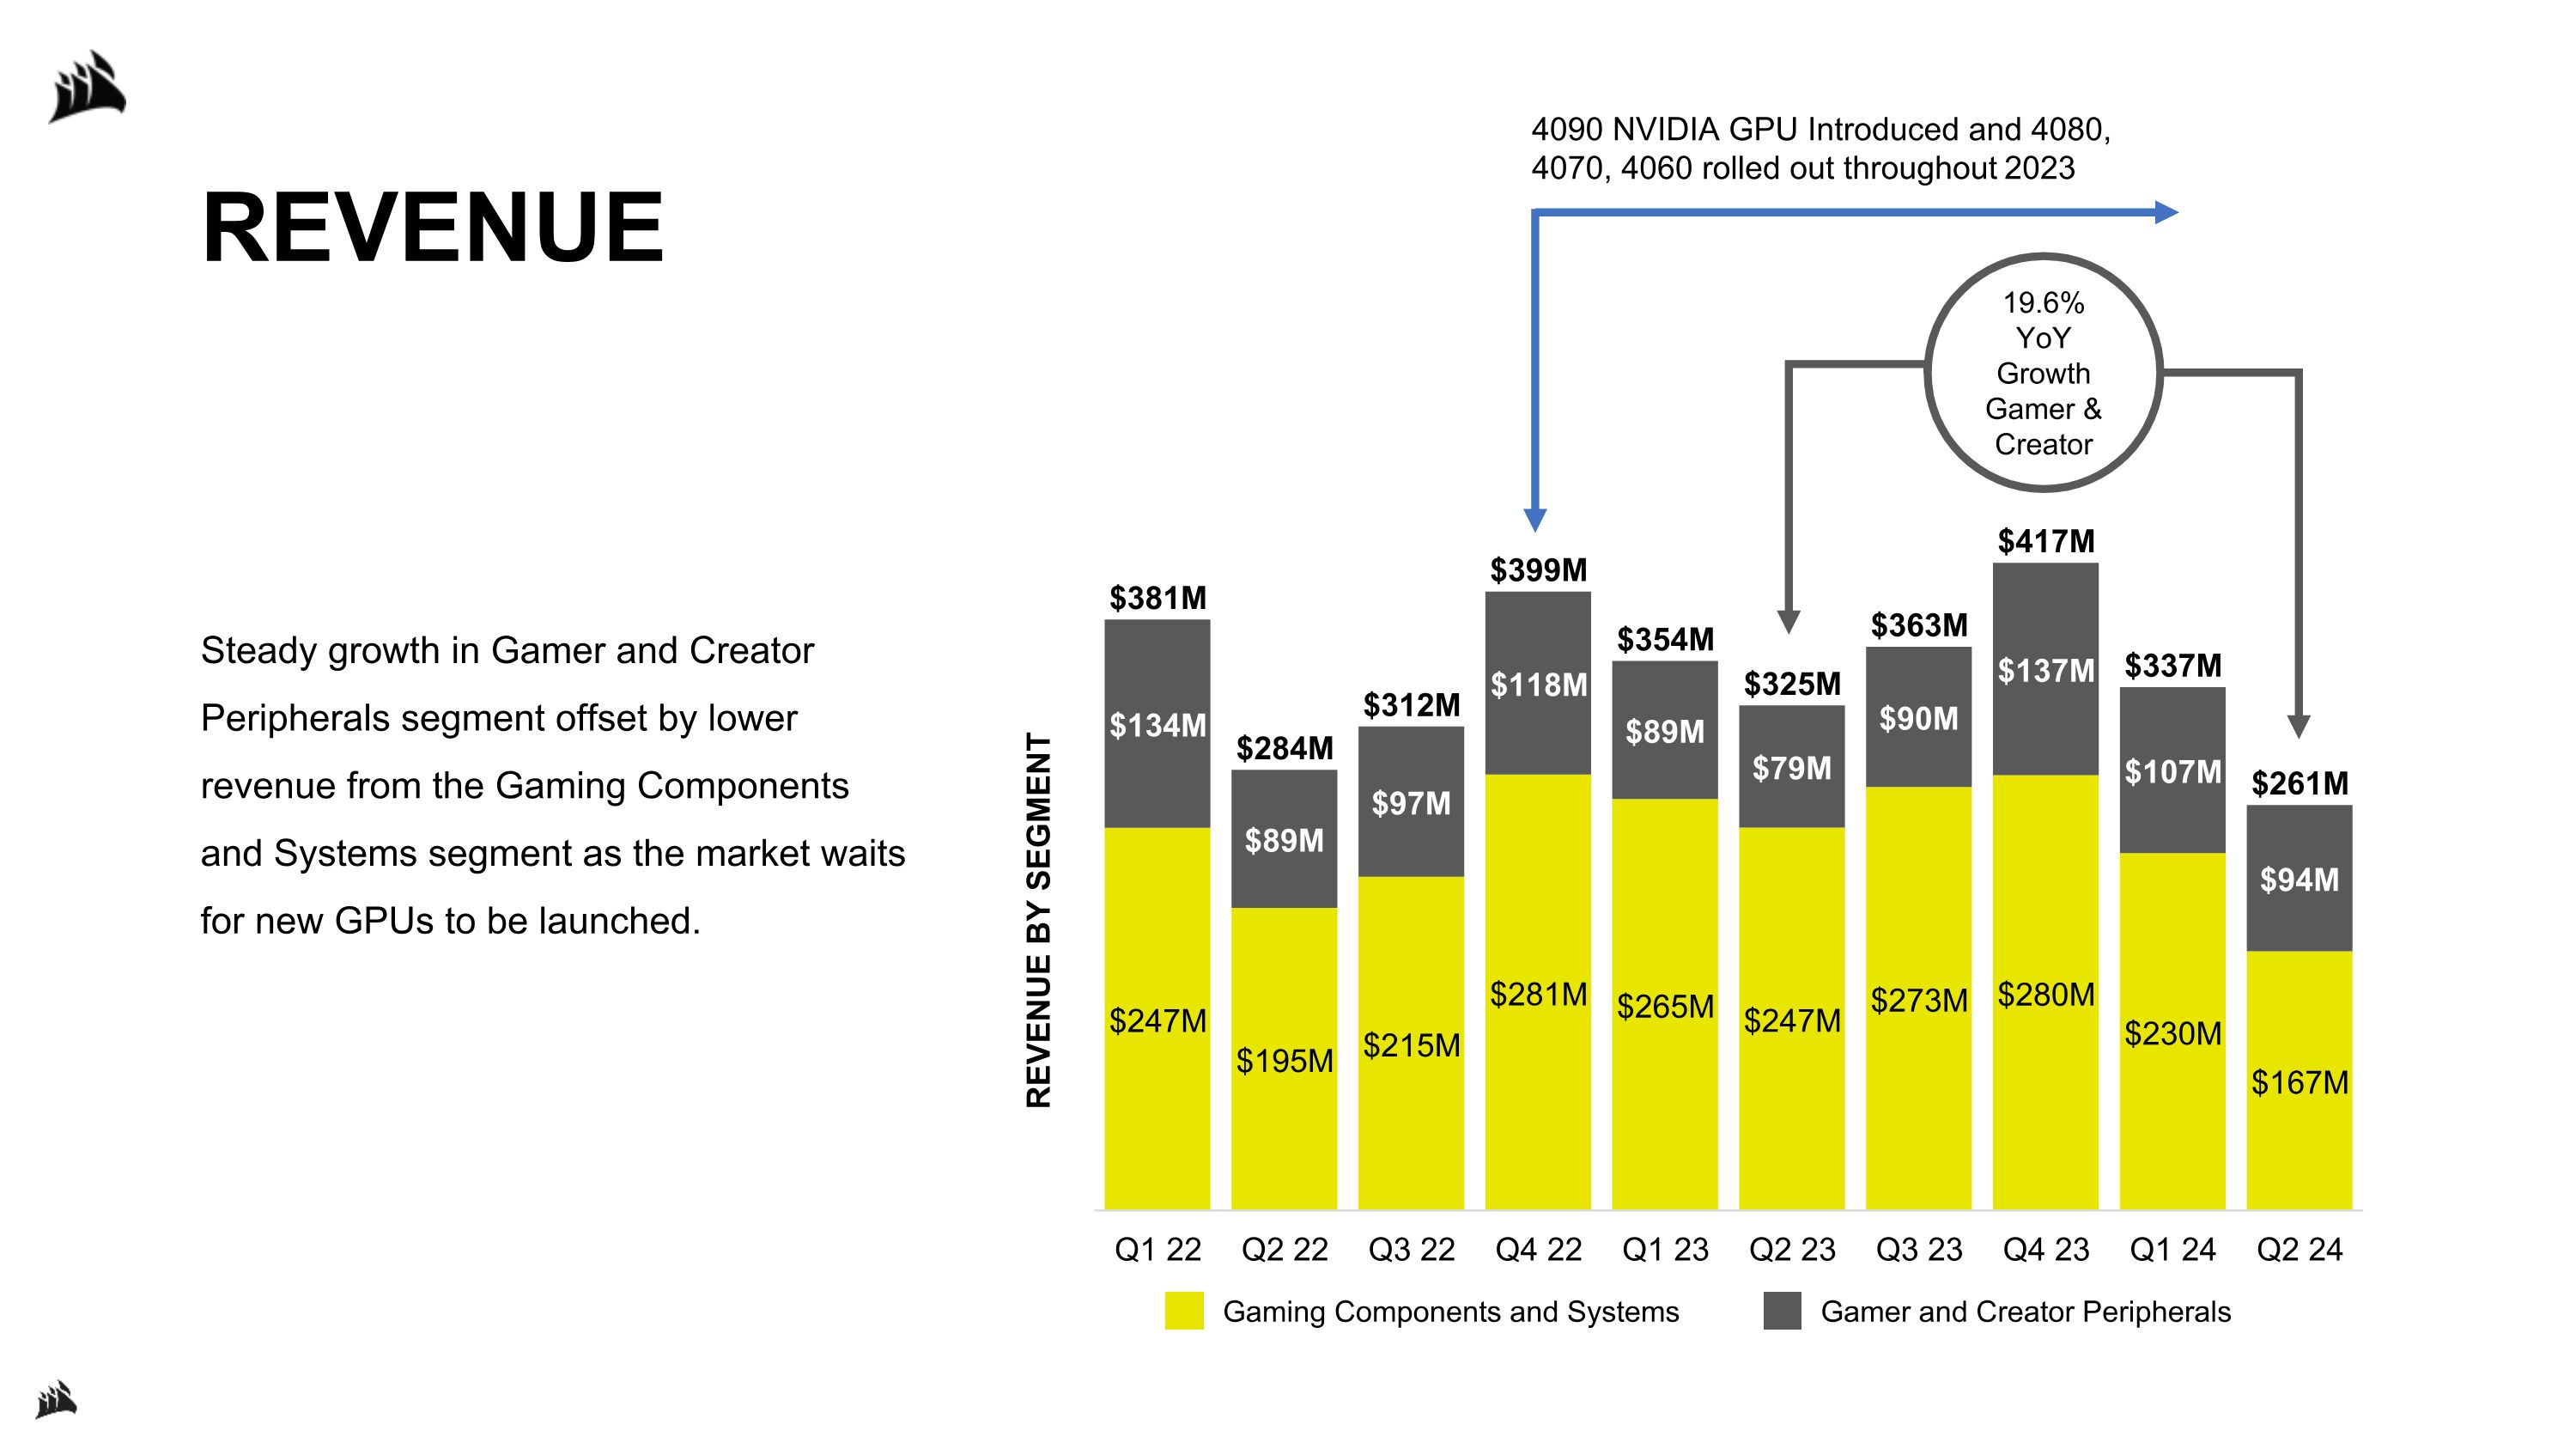
REVENUE Steady growth in Gamer and Creator Peripherals segment offset by lower revenue from the Gaming Components and Systems segment as the market waits for new GPUs to be launched. REVENUE BY SEGMENT Gaming Components and Systems Gamer and Creator Peripherals 4090 NVIDIA GPU Introduced and 4080, 4070, 4060 rolled out throughout 2023 19.6% YoY Growth Gamer & Creator
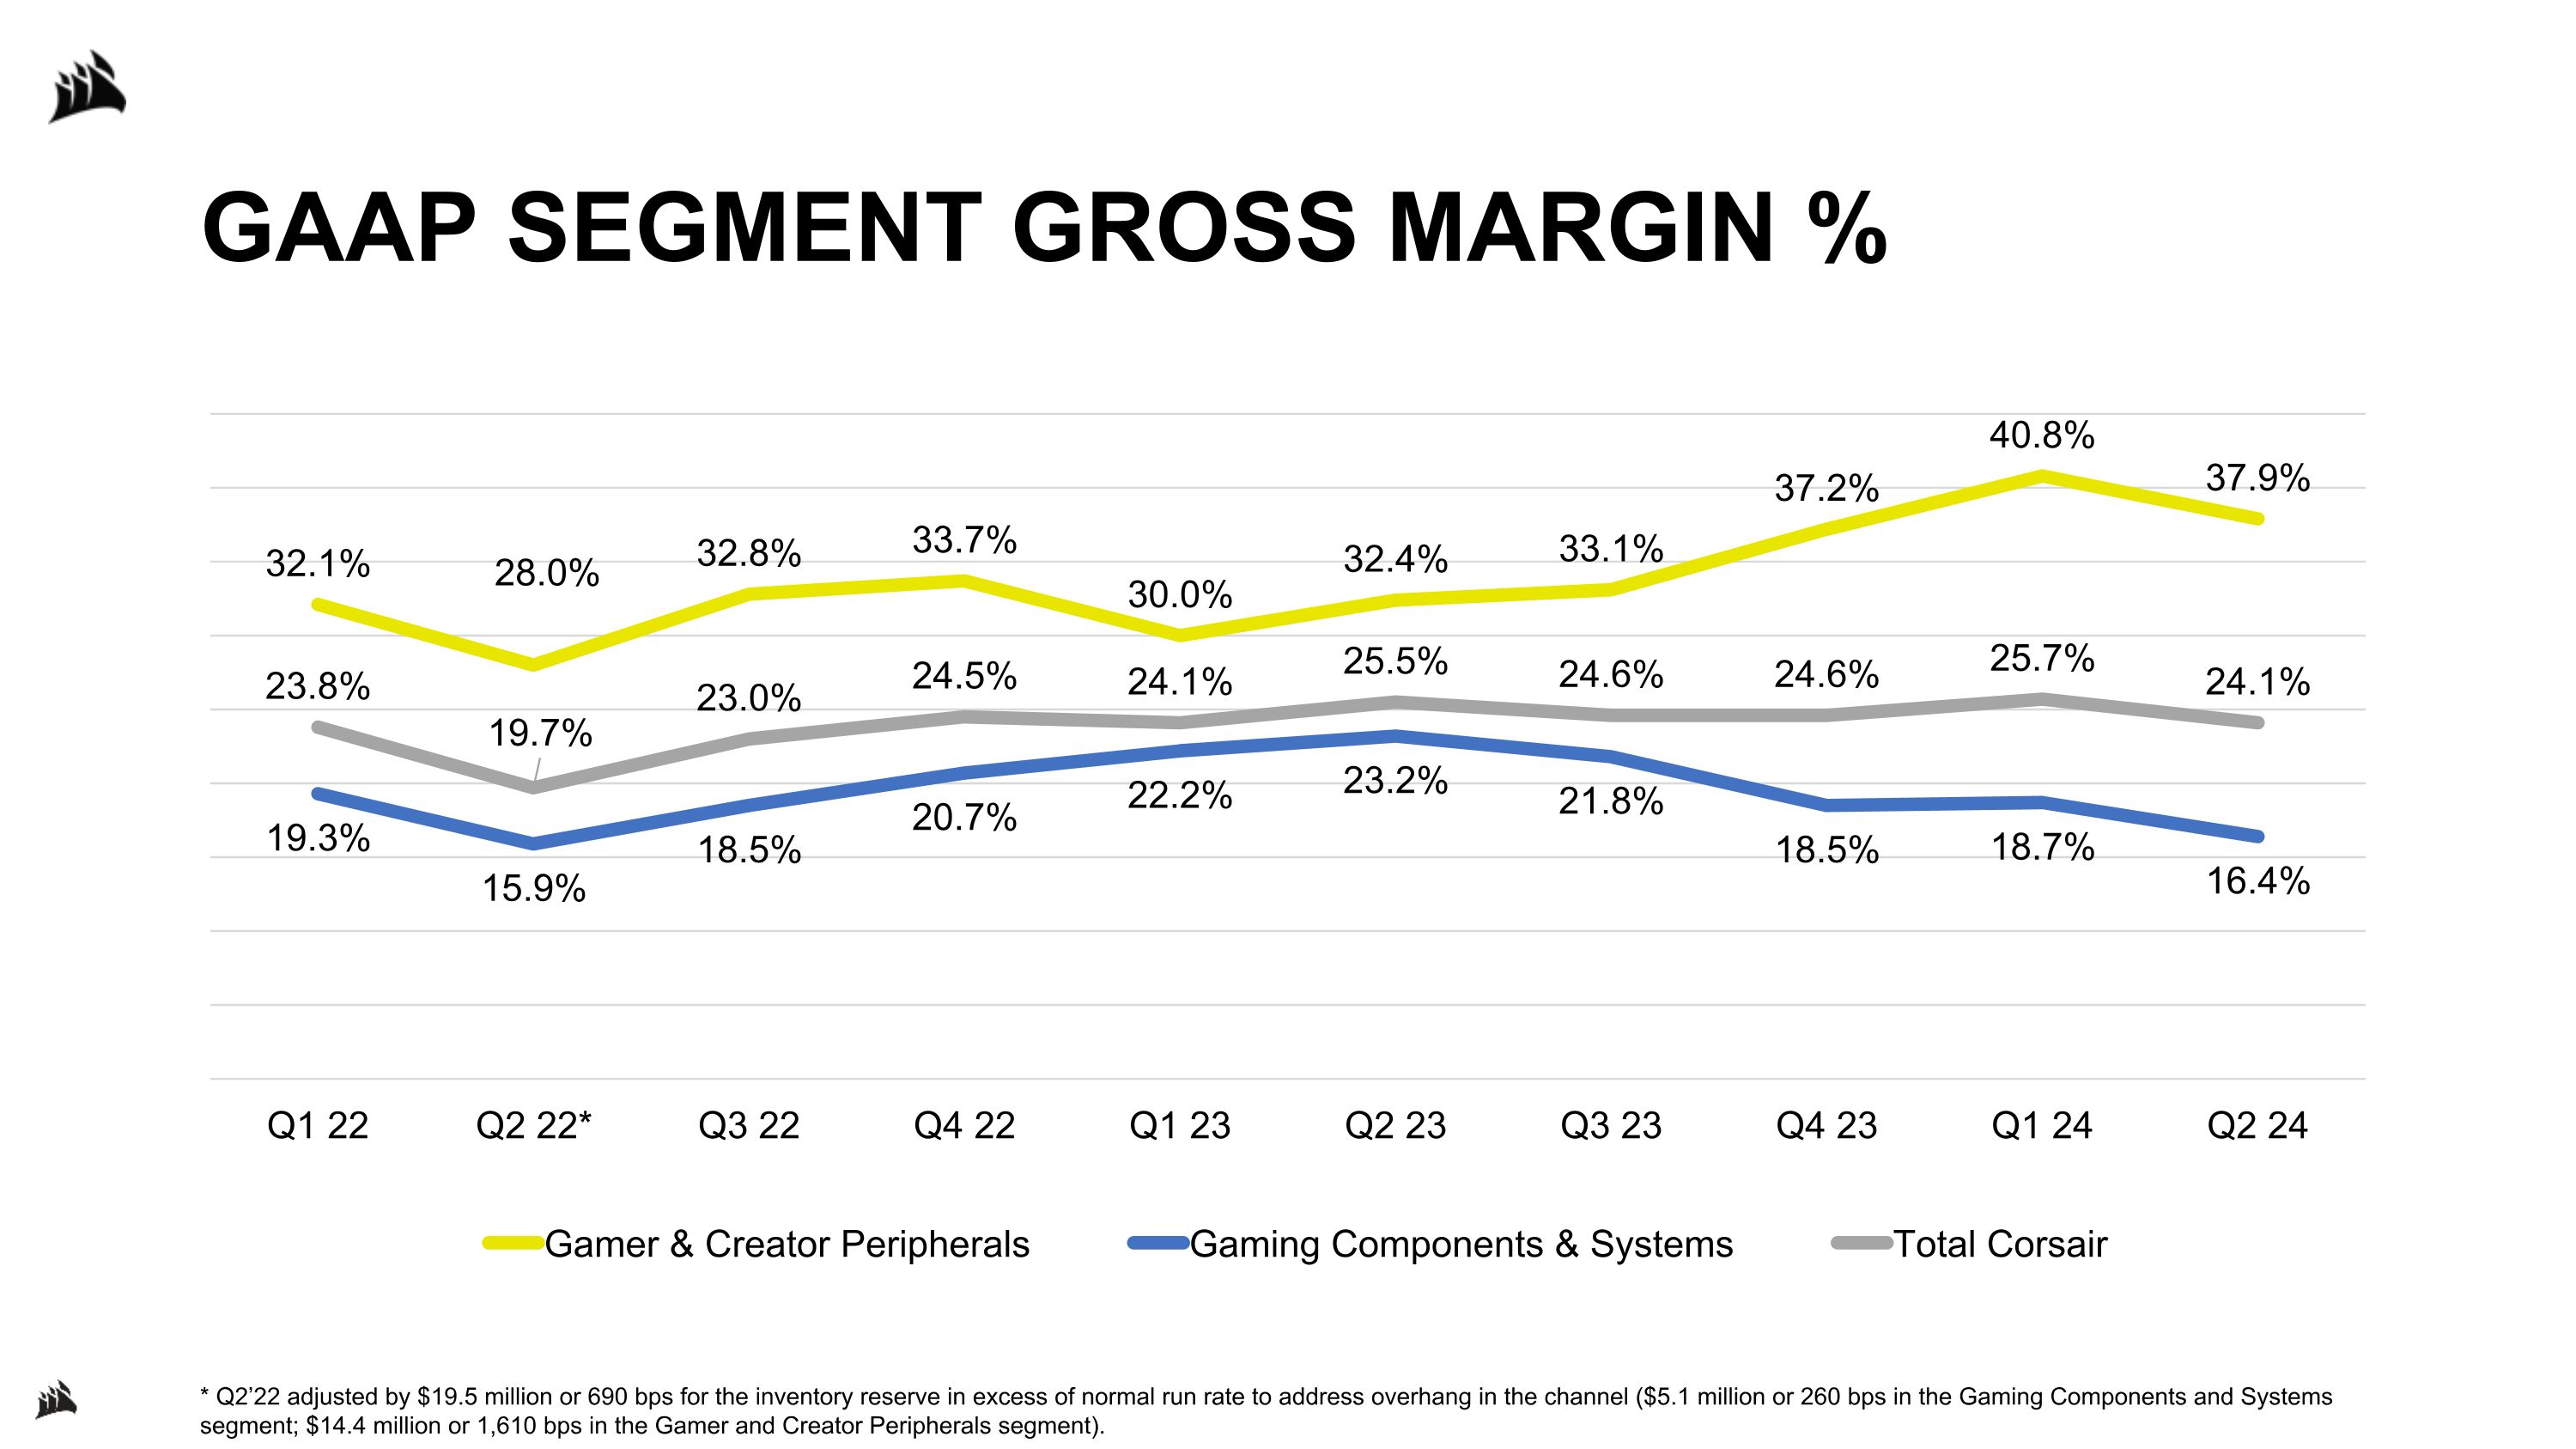
GAAP SEGMENT GROSS MARGIN % * Q2’22 adjusted by $19.5 million or 690 bps for the inventory reserve in excess of normal run rate to address overhang in the channel ($5.1 million or 260 bps in the Gaming Components and Systems segment; $14.4 million or 1,610 bps in the Gamer and Creator Peripherals segment).
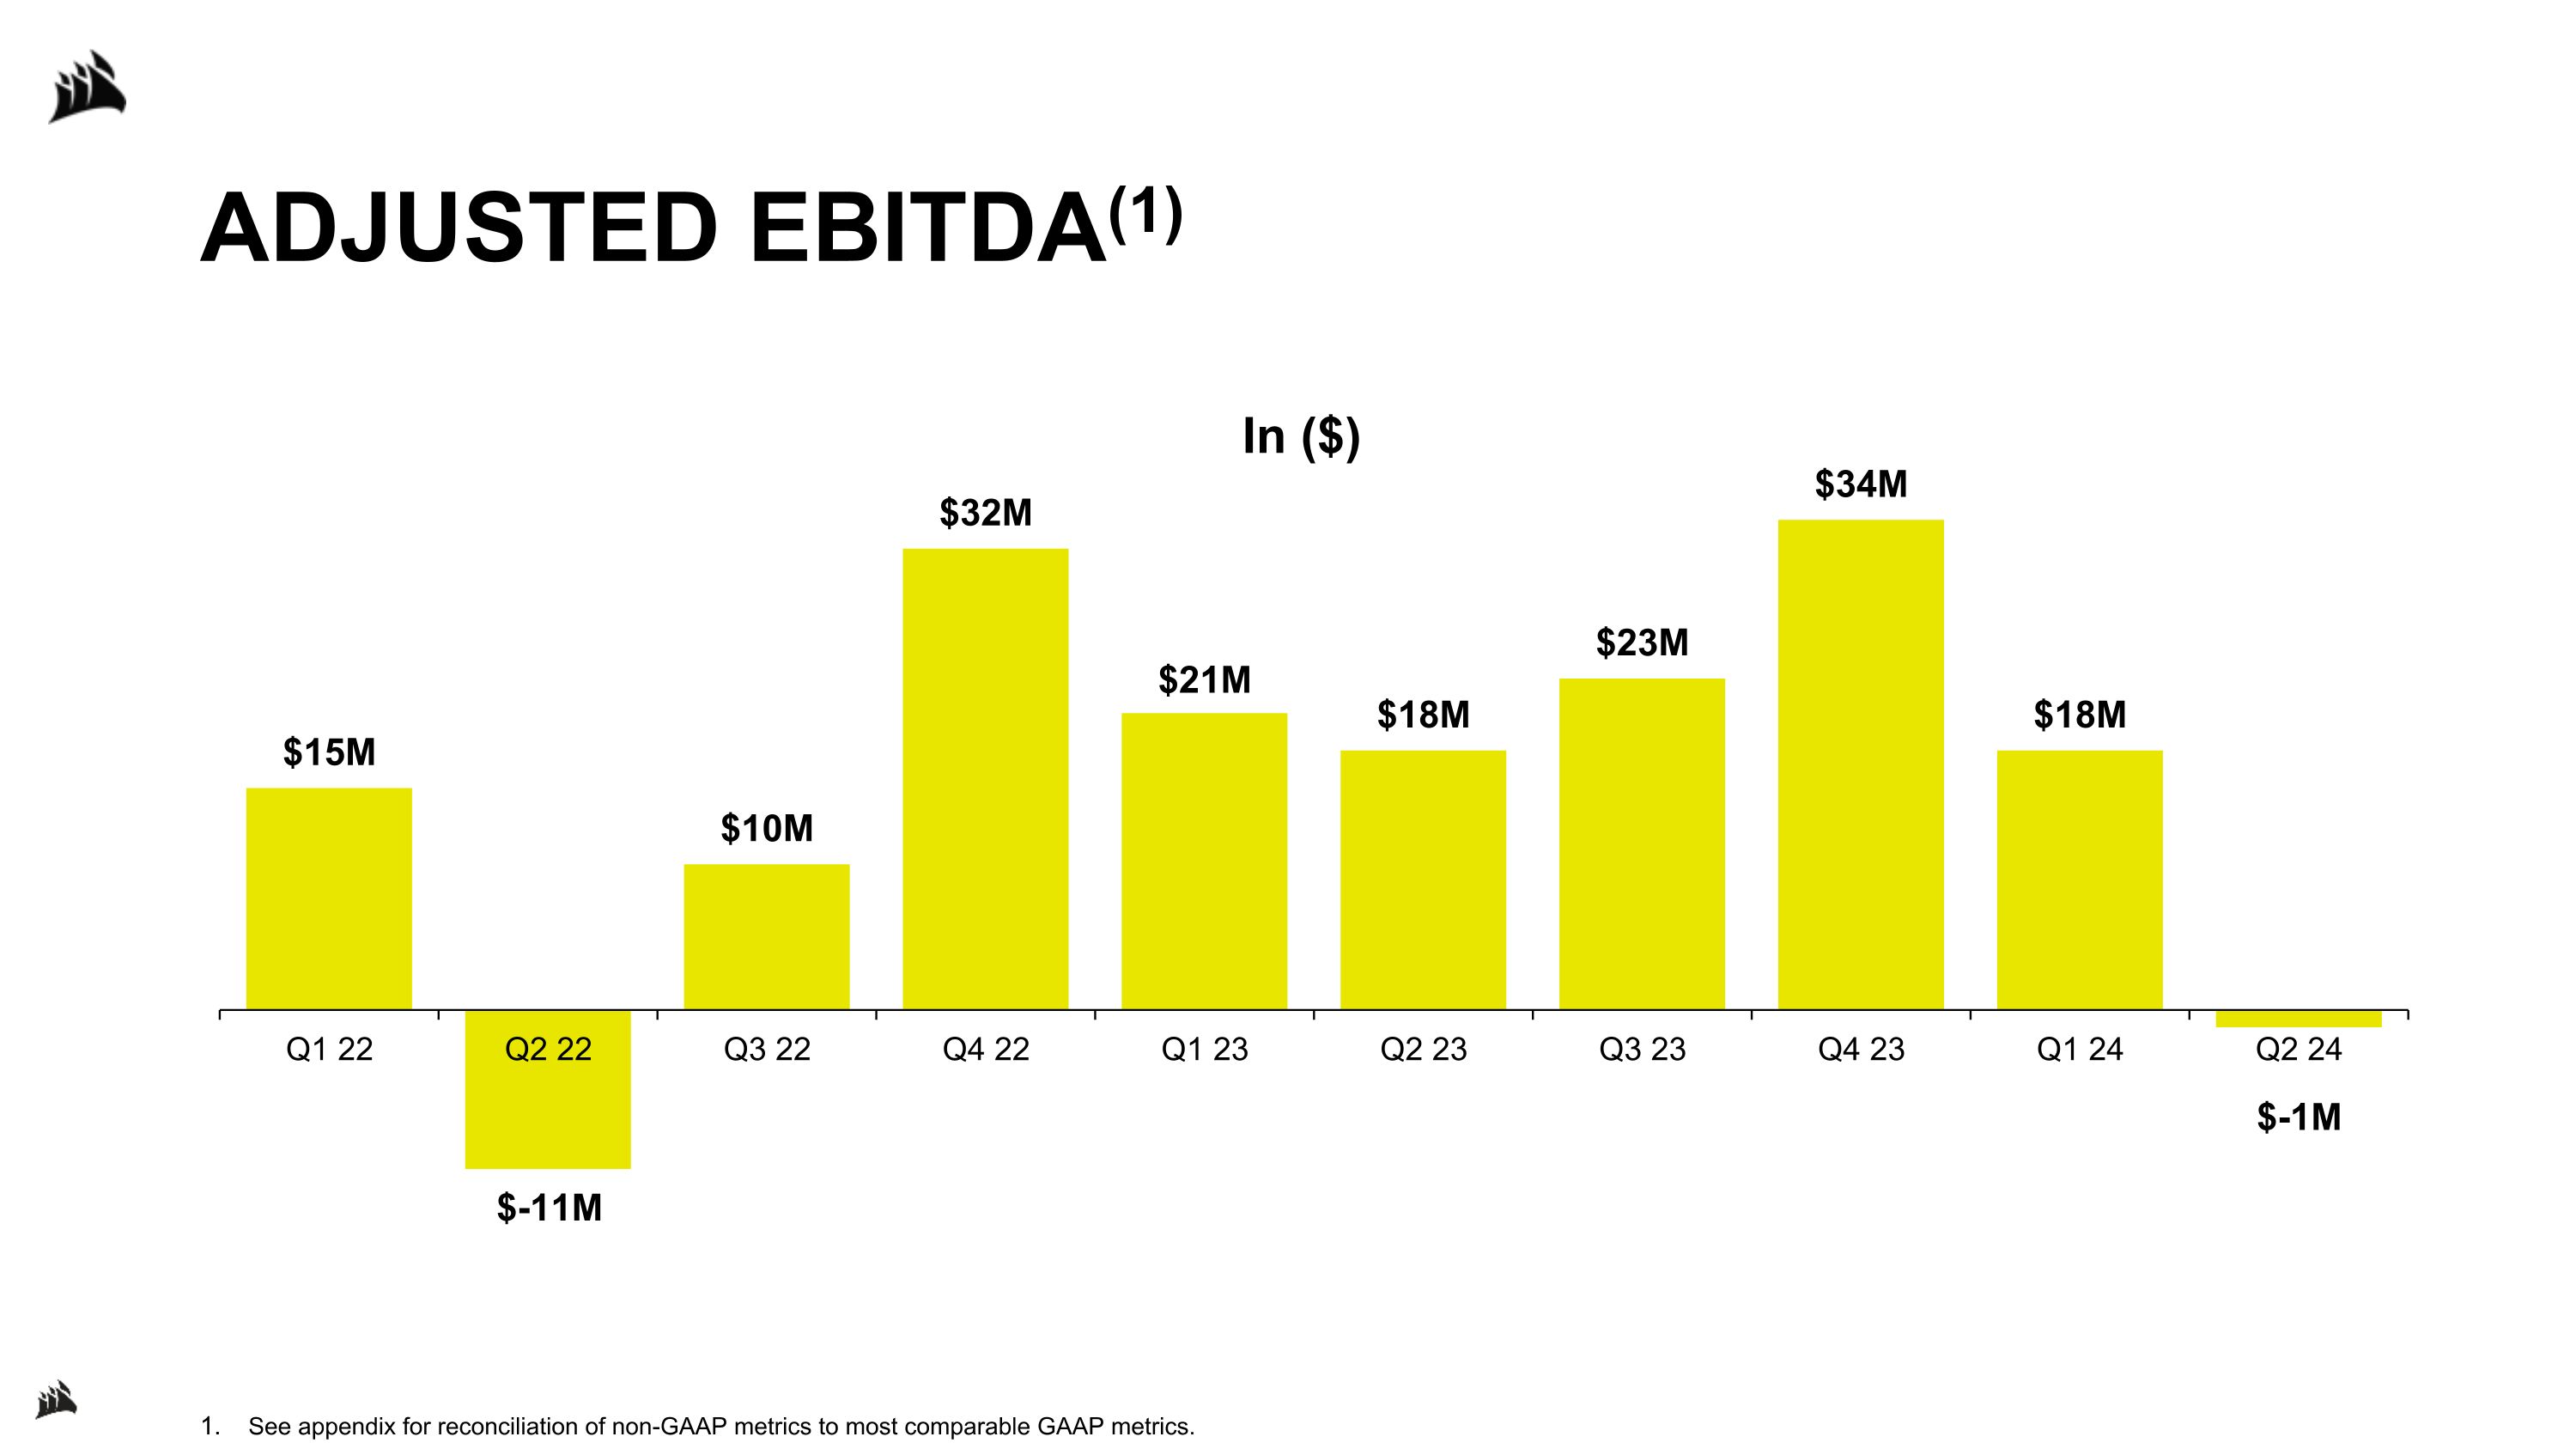
ADJUSTED EBITDA(1) See appendix for reconciliation of non-GAAP metrics to most comparable GAAP metrics.
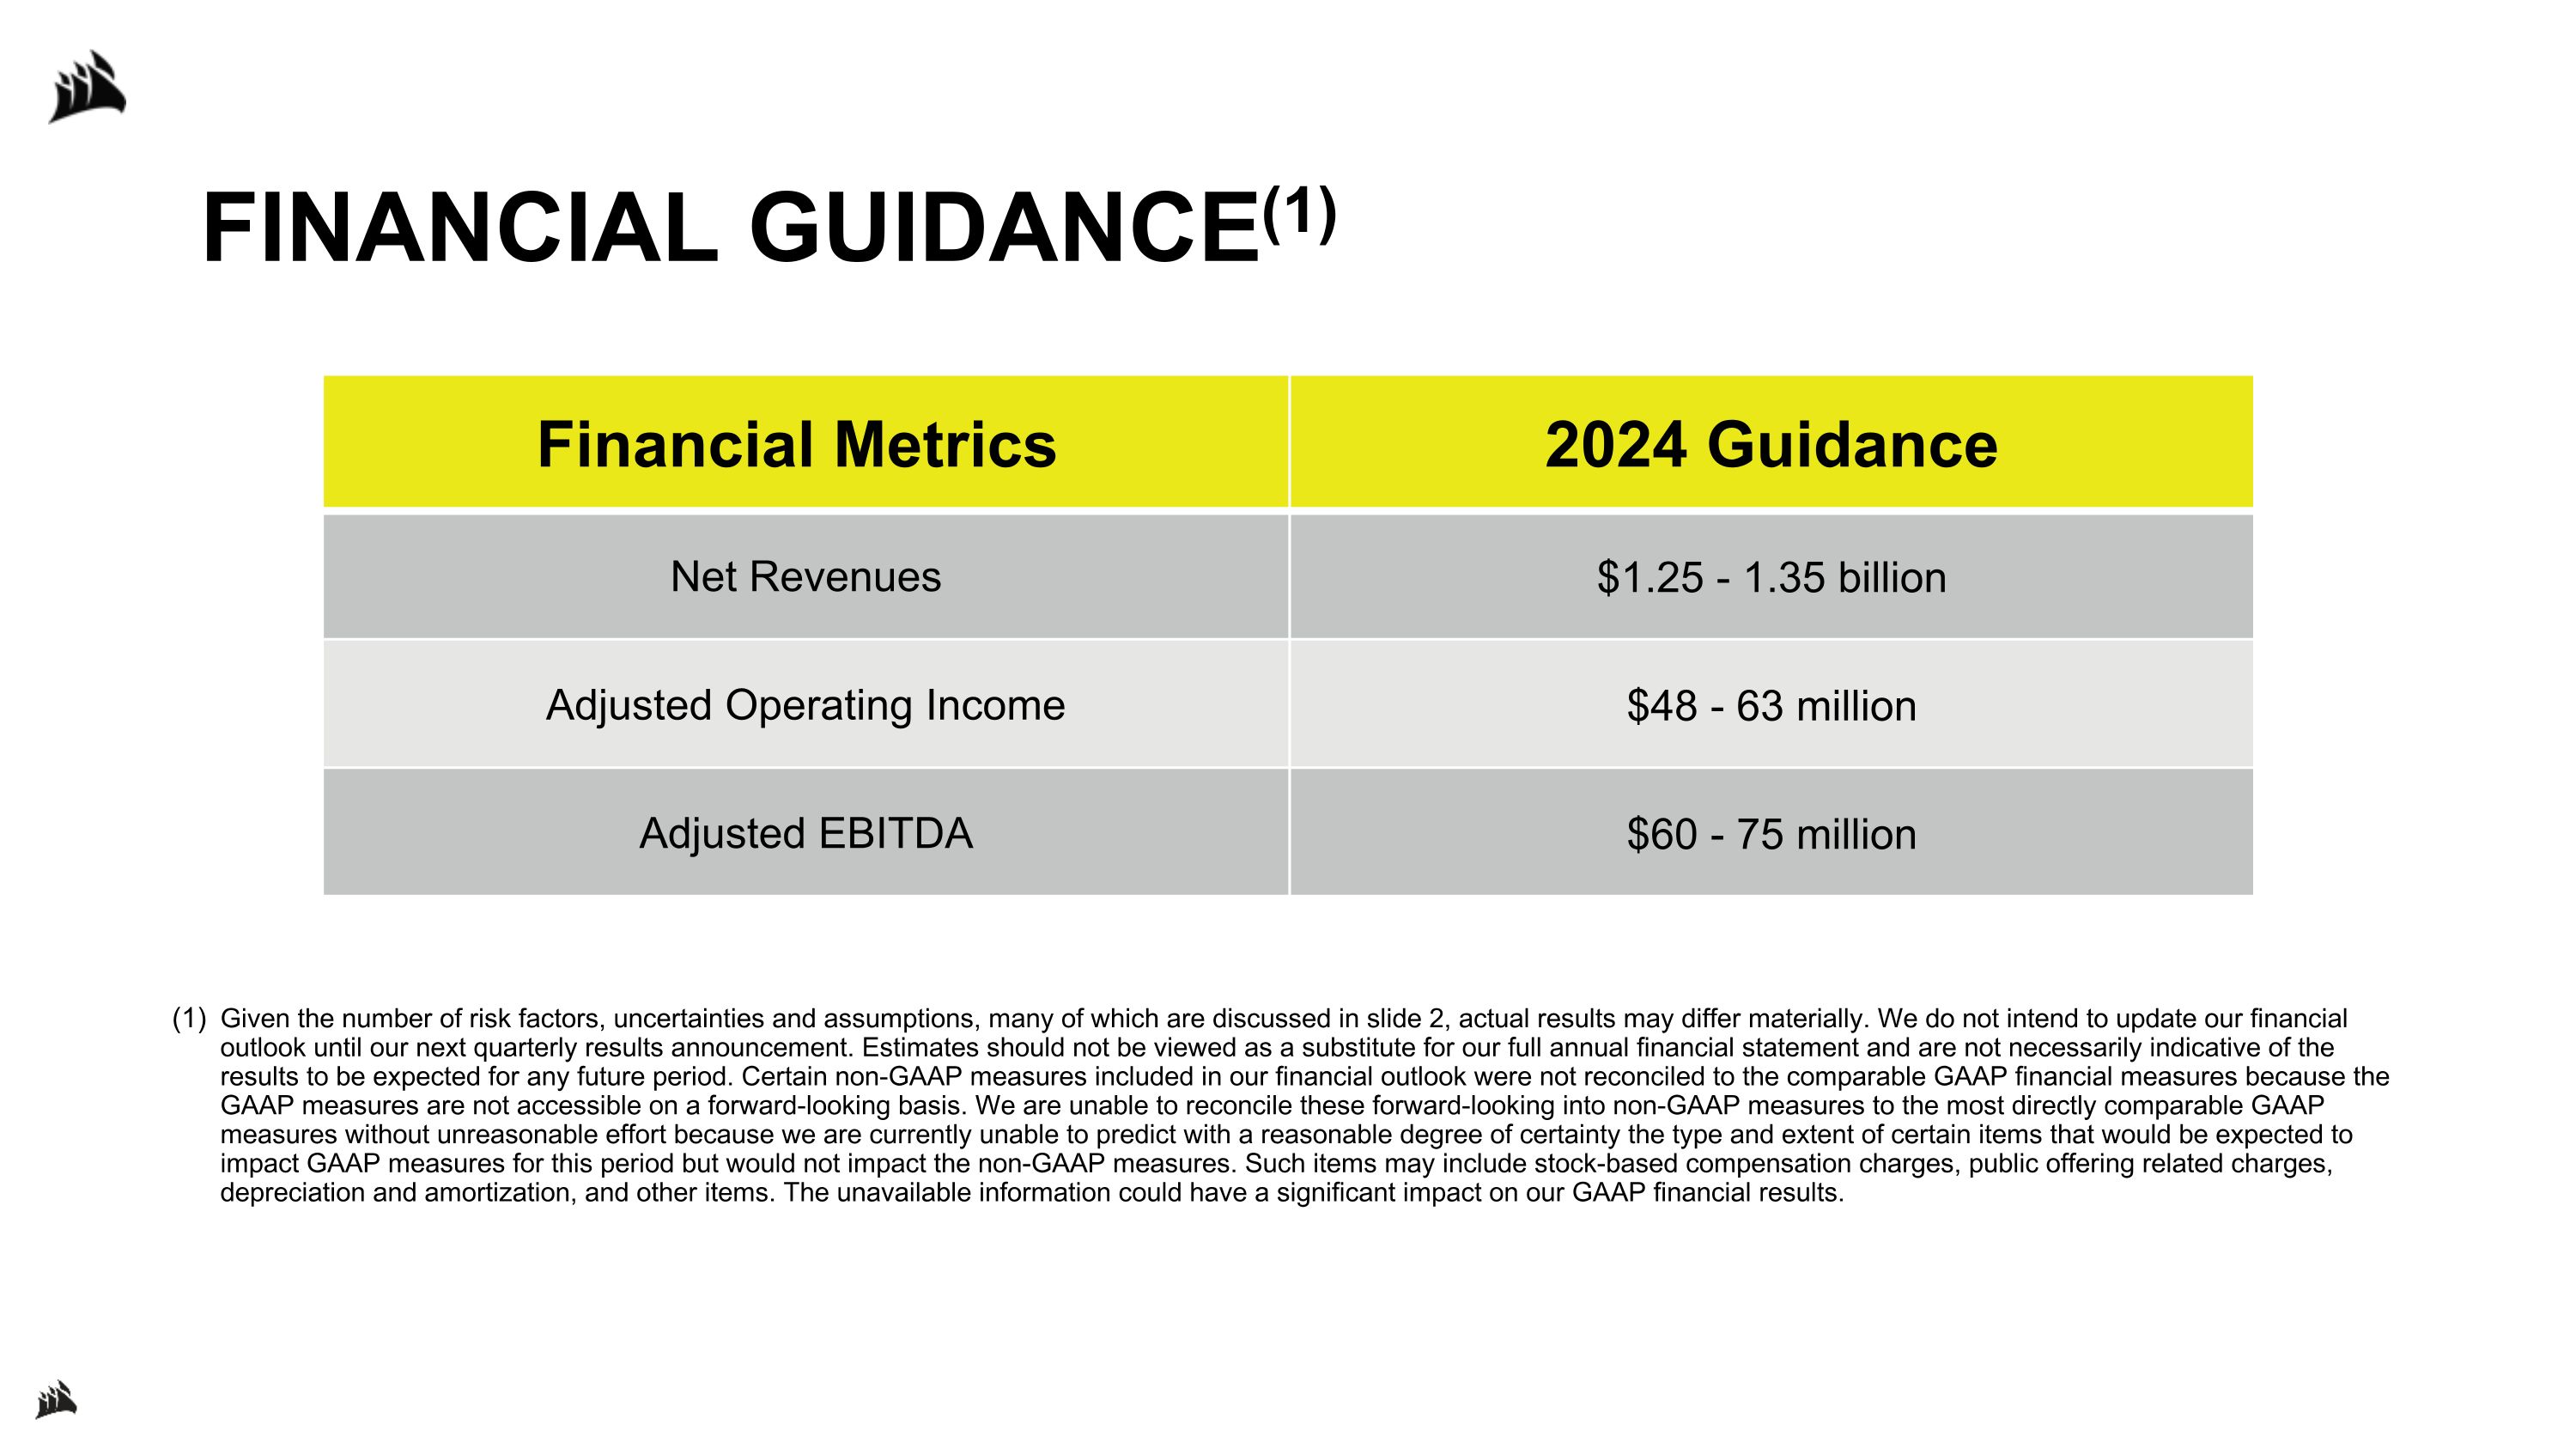
FINANCIAL GUIDANCE(1) Given the number of risk factors, uncertainties and assumptions, many of which are discussed in slide 2, actual results may differ materially. We do not intend to update our financial outlook until our next quarterly results announcement. Estimates should not be viewed as a substitute for our full annual financial statement and are not necessarily indicative of the results to be expected for any future period. Certain non-GAAP measures included in our financial outlook were not reconciled to the comparable GAAP financial measures because the GAAP measures are not accessible on a forward-looking basis. We are unable to reconcile these forward-looking into non-GAAP measures to the most directly comparable GAAP measures without unreasonable effort because we are currently unable to predict with a reasonable degree of certainty the type and extent of certain items that would be expected to impact GAAP measures for this period but would not impact the non-GAAP measures. Such items may include stock-based compensation charges, public offering related charges, depreciation and amortization, and other items. The unavailable information could have a significant impact on our GAAP financial results. Financial Metrics 2024 Guidance Net Revenues $1.25 - 1.35 billion Adjusted Operating Income $48 - 63 million Adjusted EBITDA $60 - 75 million
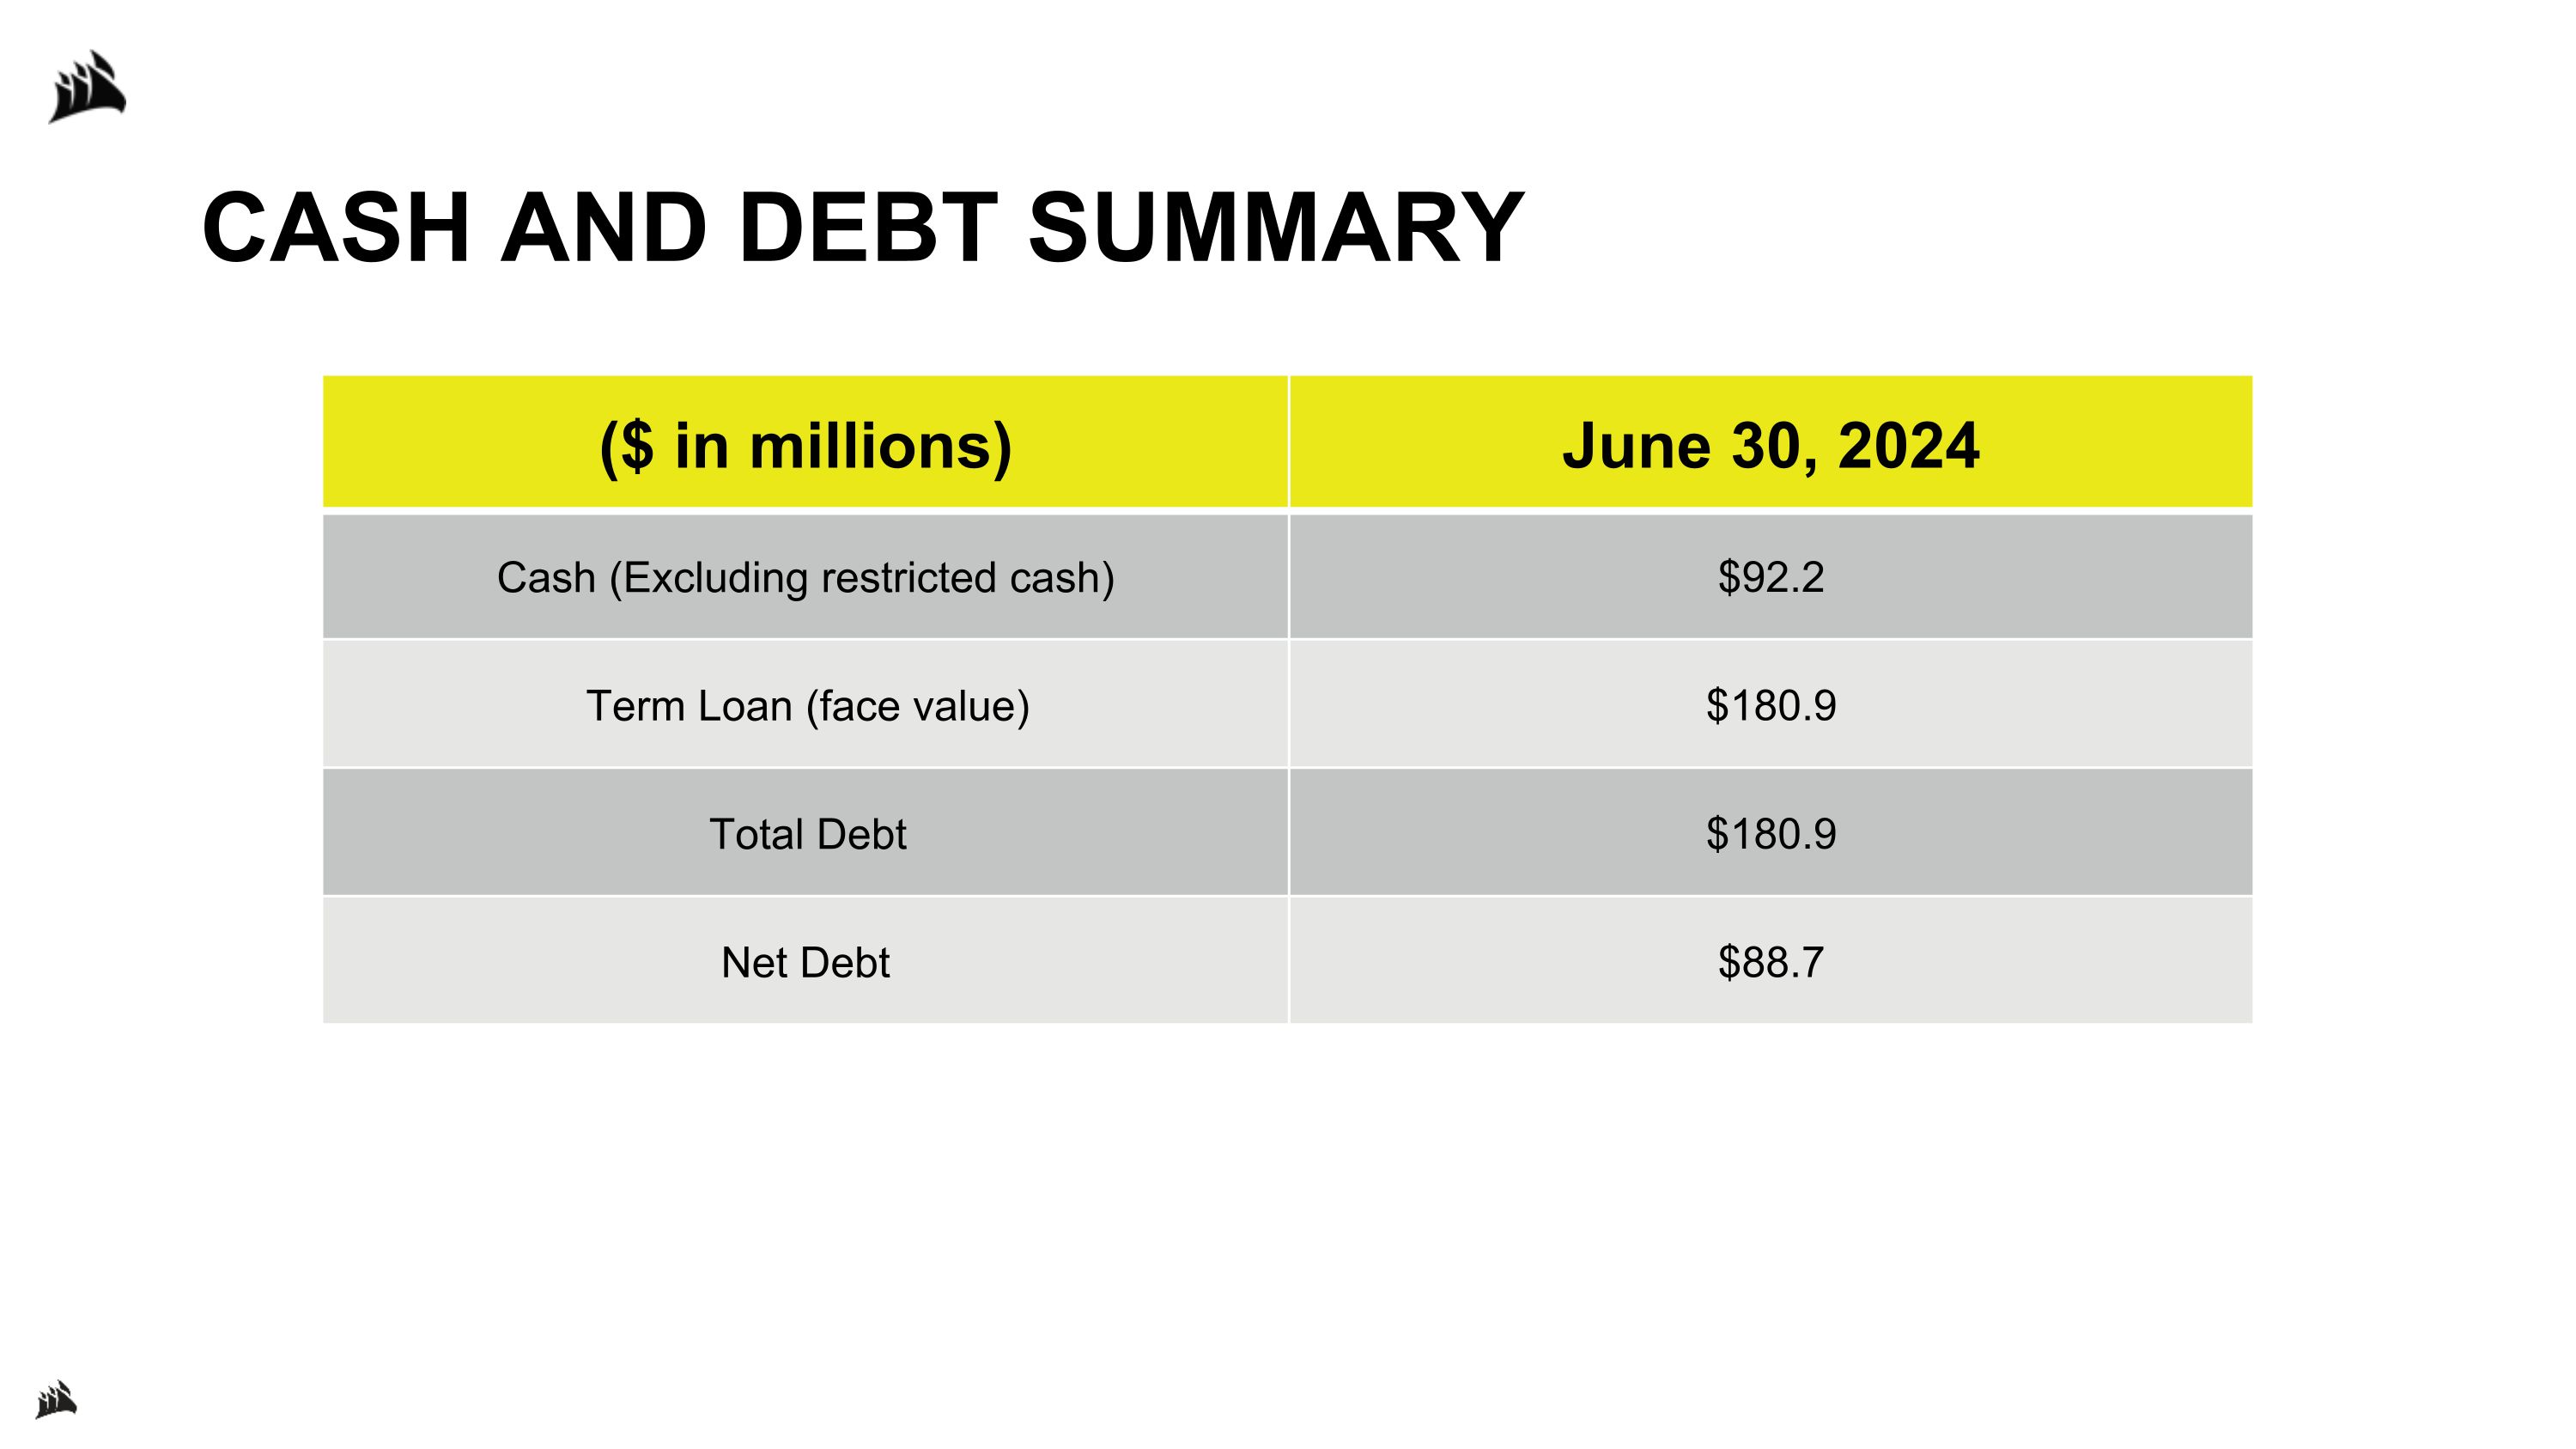
CASH AND DEBT SUMMARY ($ in millions) June 30, 2024 Cash (Excluding restricted cash) $92.2 Term Loan (face value) $180.9 Total Debt $180.9 Net Debt $88.7
APPENDIX
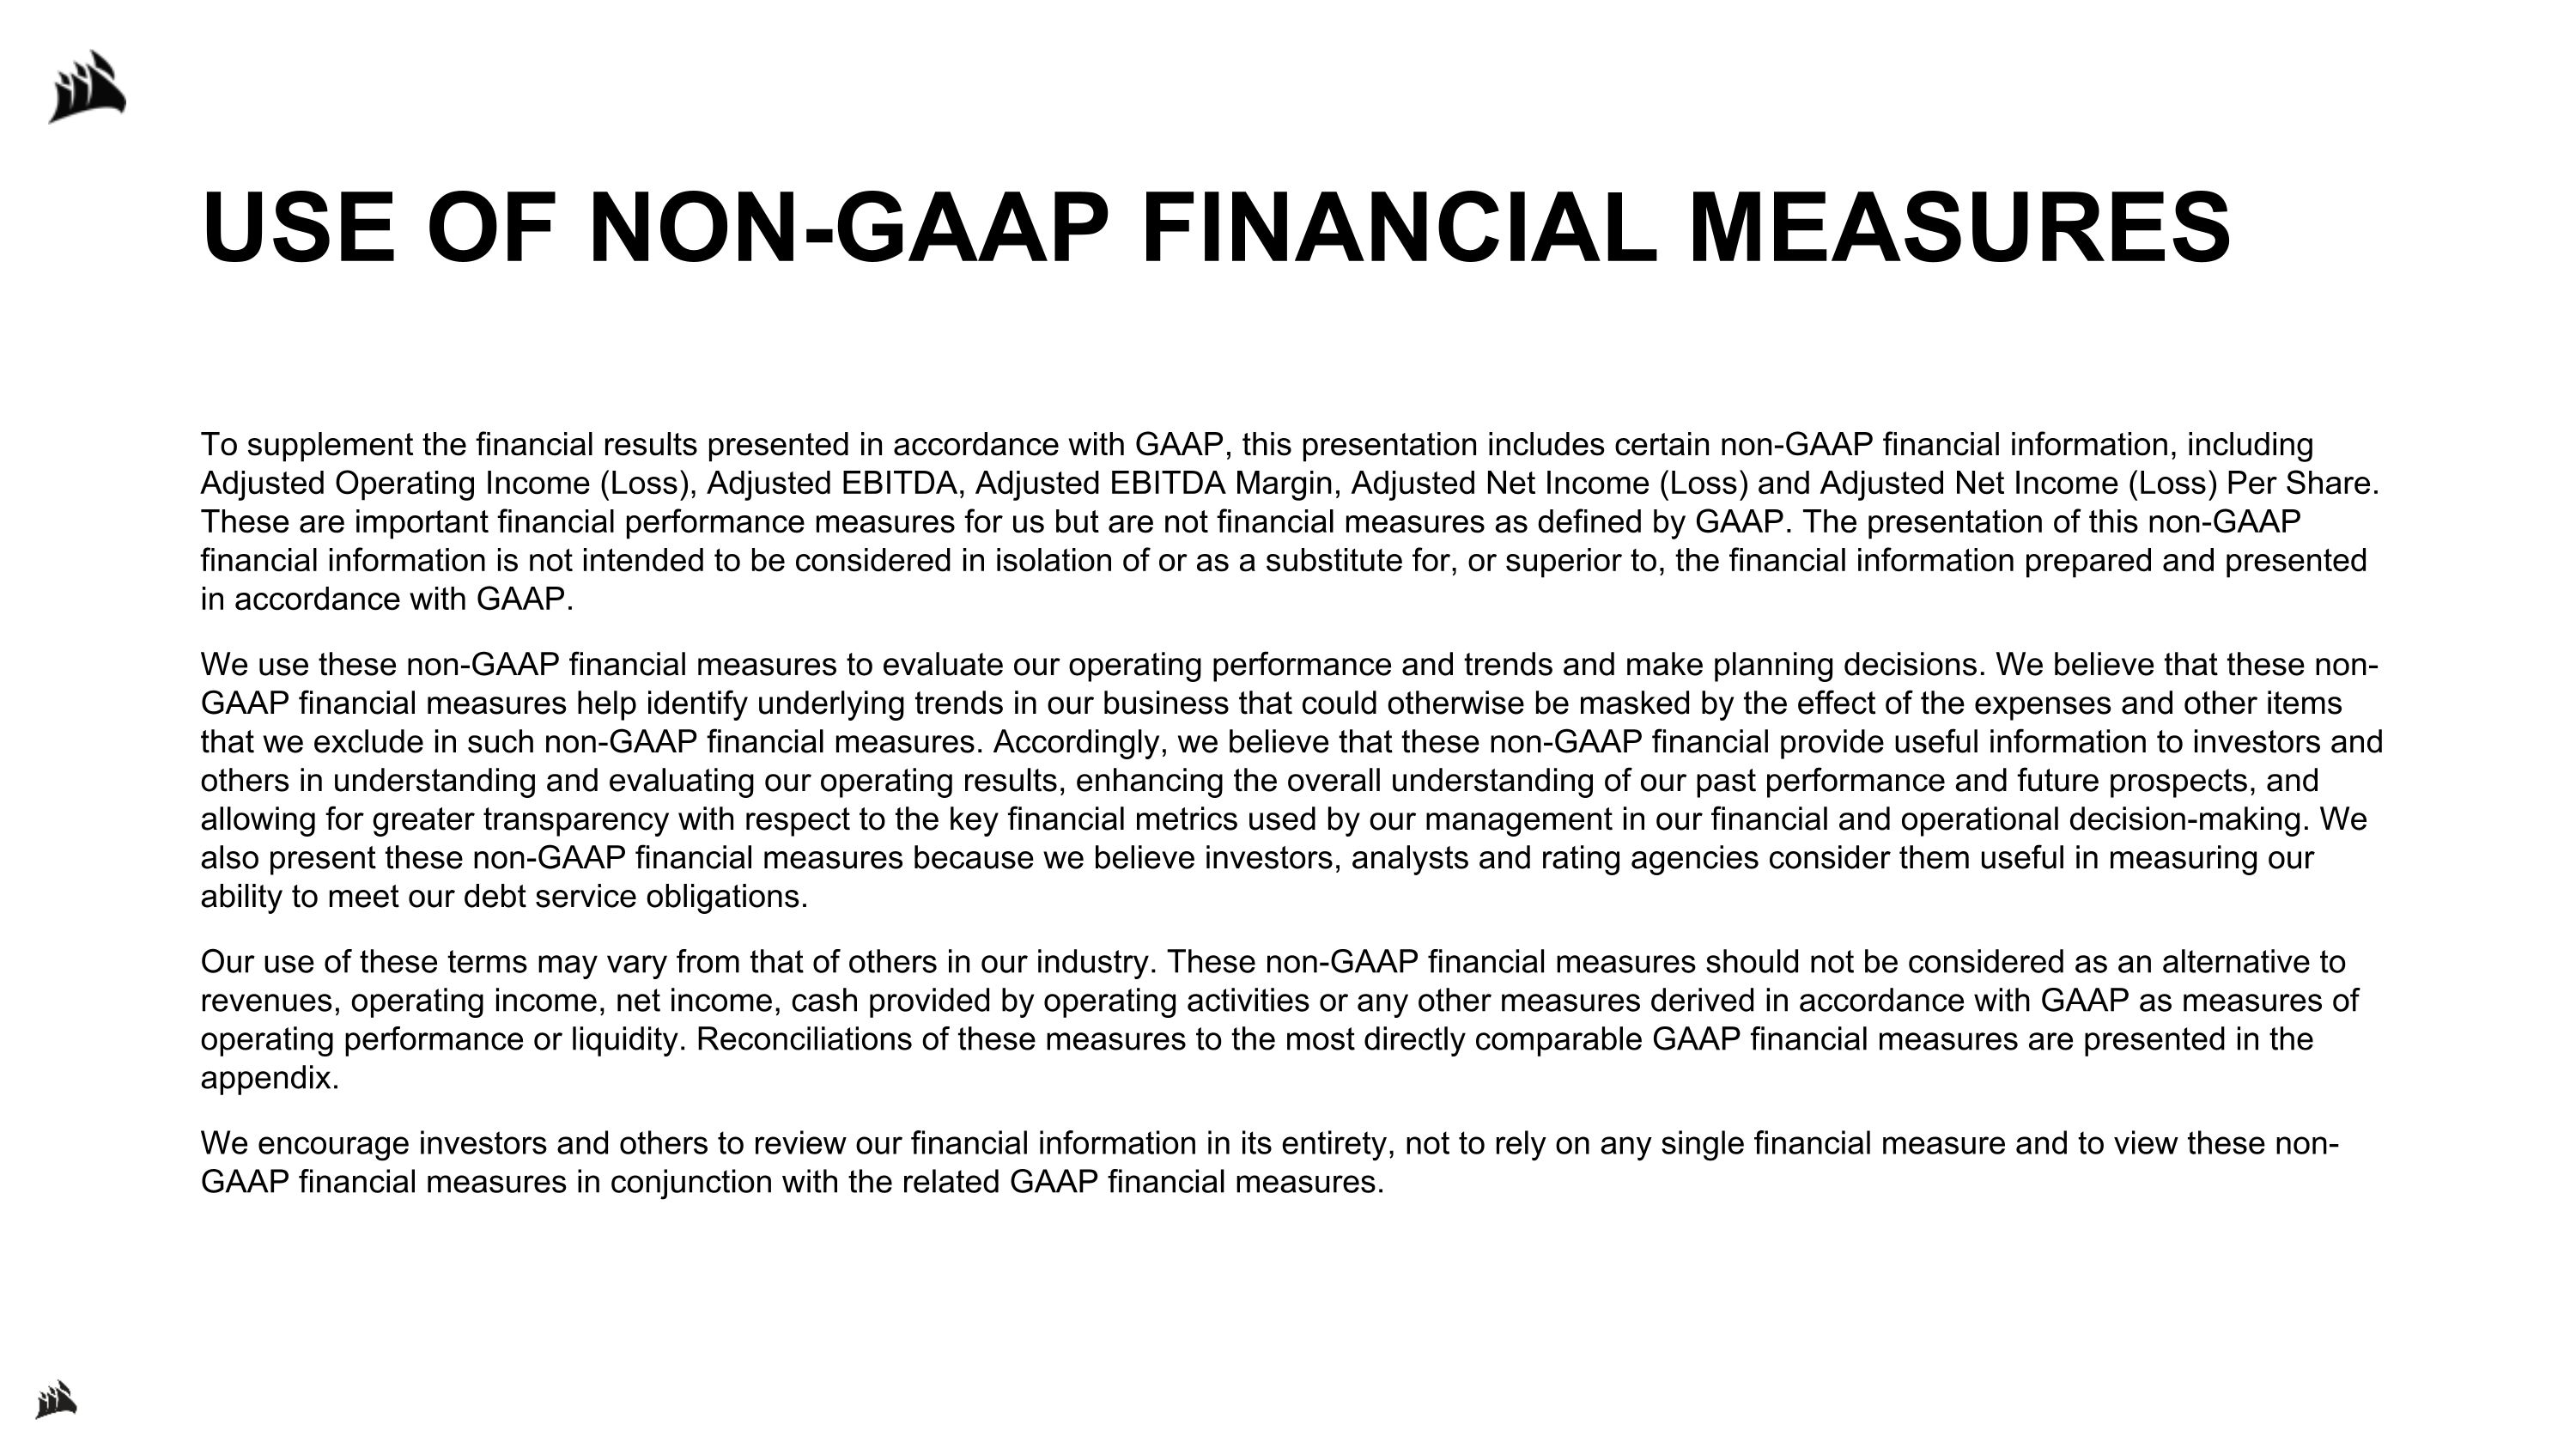
USE OF NON-GAAP FINANCIAL MEASURES To supplement the financial results presented in accordance with GAAP, this presentation includes certain non-GAAP financial information, including Adjusted Operating Income (Loss), Adjusted EBITDA, Adjusted EBITDA Margin, Adjusted Net Income (Loss) and Adjusted Net Income (Loss) Per Share. These are important financial performance measures for us but are not financial measures as defined by GAAP. The presentation of this non-GAAP financial information is not intended to be considered in isolation of or as a substitute for, or superior to, the financial information prepared and presented in accordance with GAAP. We use these non-GAAP financial measures to evaluate our operating performance and trends and make planning decisions. We believe that these non-GAAP financial measures help identify underlying trends in our business that could otherwise be masked by the effect of the expenses and other items that we exclude in such non-GAAP financial measures. Accordingly, we believe that these non-GAAP financial provide useful information to investors and others in understanding and evaluating our operating results, enhancing the overall understanding of our past performance and future prospects, and allowing for greater transparency with respect to the key financial metrics used by our management in our financial and operational decision-making. We also present these non-GAAP financial measures because we believe investors, analysts and rating agencies consider them useful in measuring our ability to meet our debt service obligations. Our use of these terms may vary from that of others in our industry. These non-GAAP financial measures should not be considered as an alternative to revenues, operating income, net income, cash provided by operating activities or any other measures derived in accordance with GAAP as measures of operating performance or liquidity. Reconciliations of these measures to the most directly comparable GAAP financial measures are presented in the appendix. We encourage investors and others to review our financial information in its entirety, not to rely on any single financial measure and to view these non-GAAP financial measures in conjunction with the related GAAP financial measures.
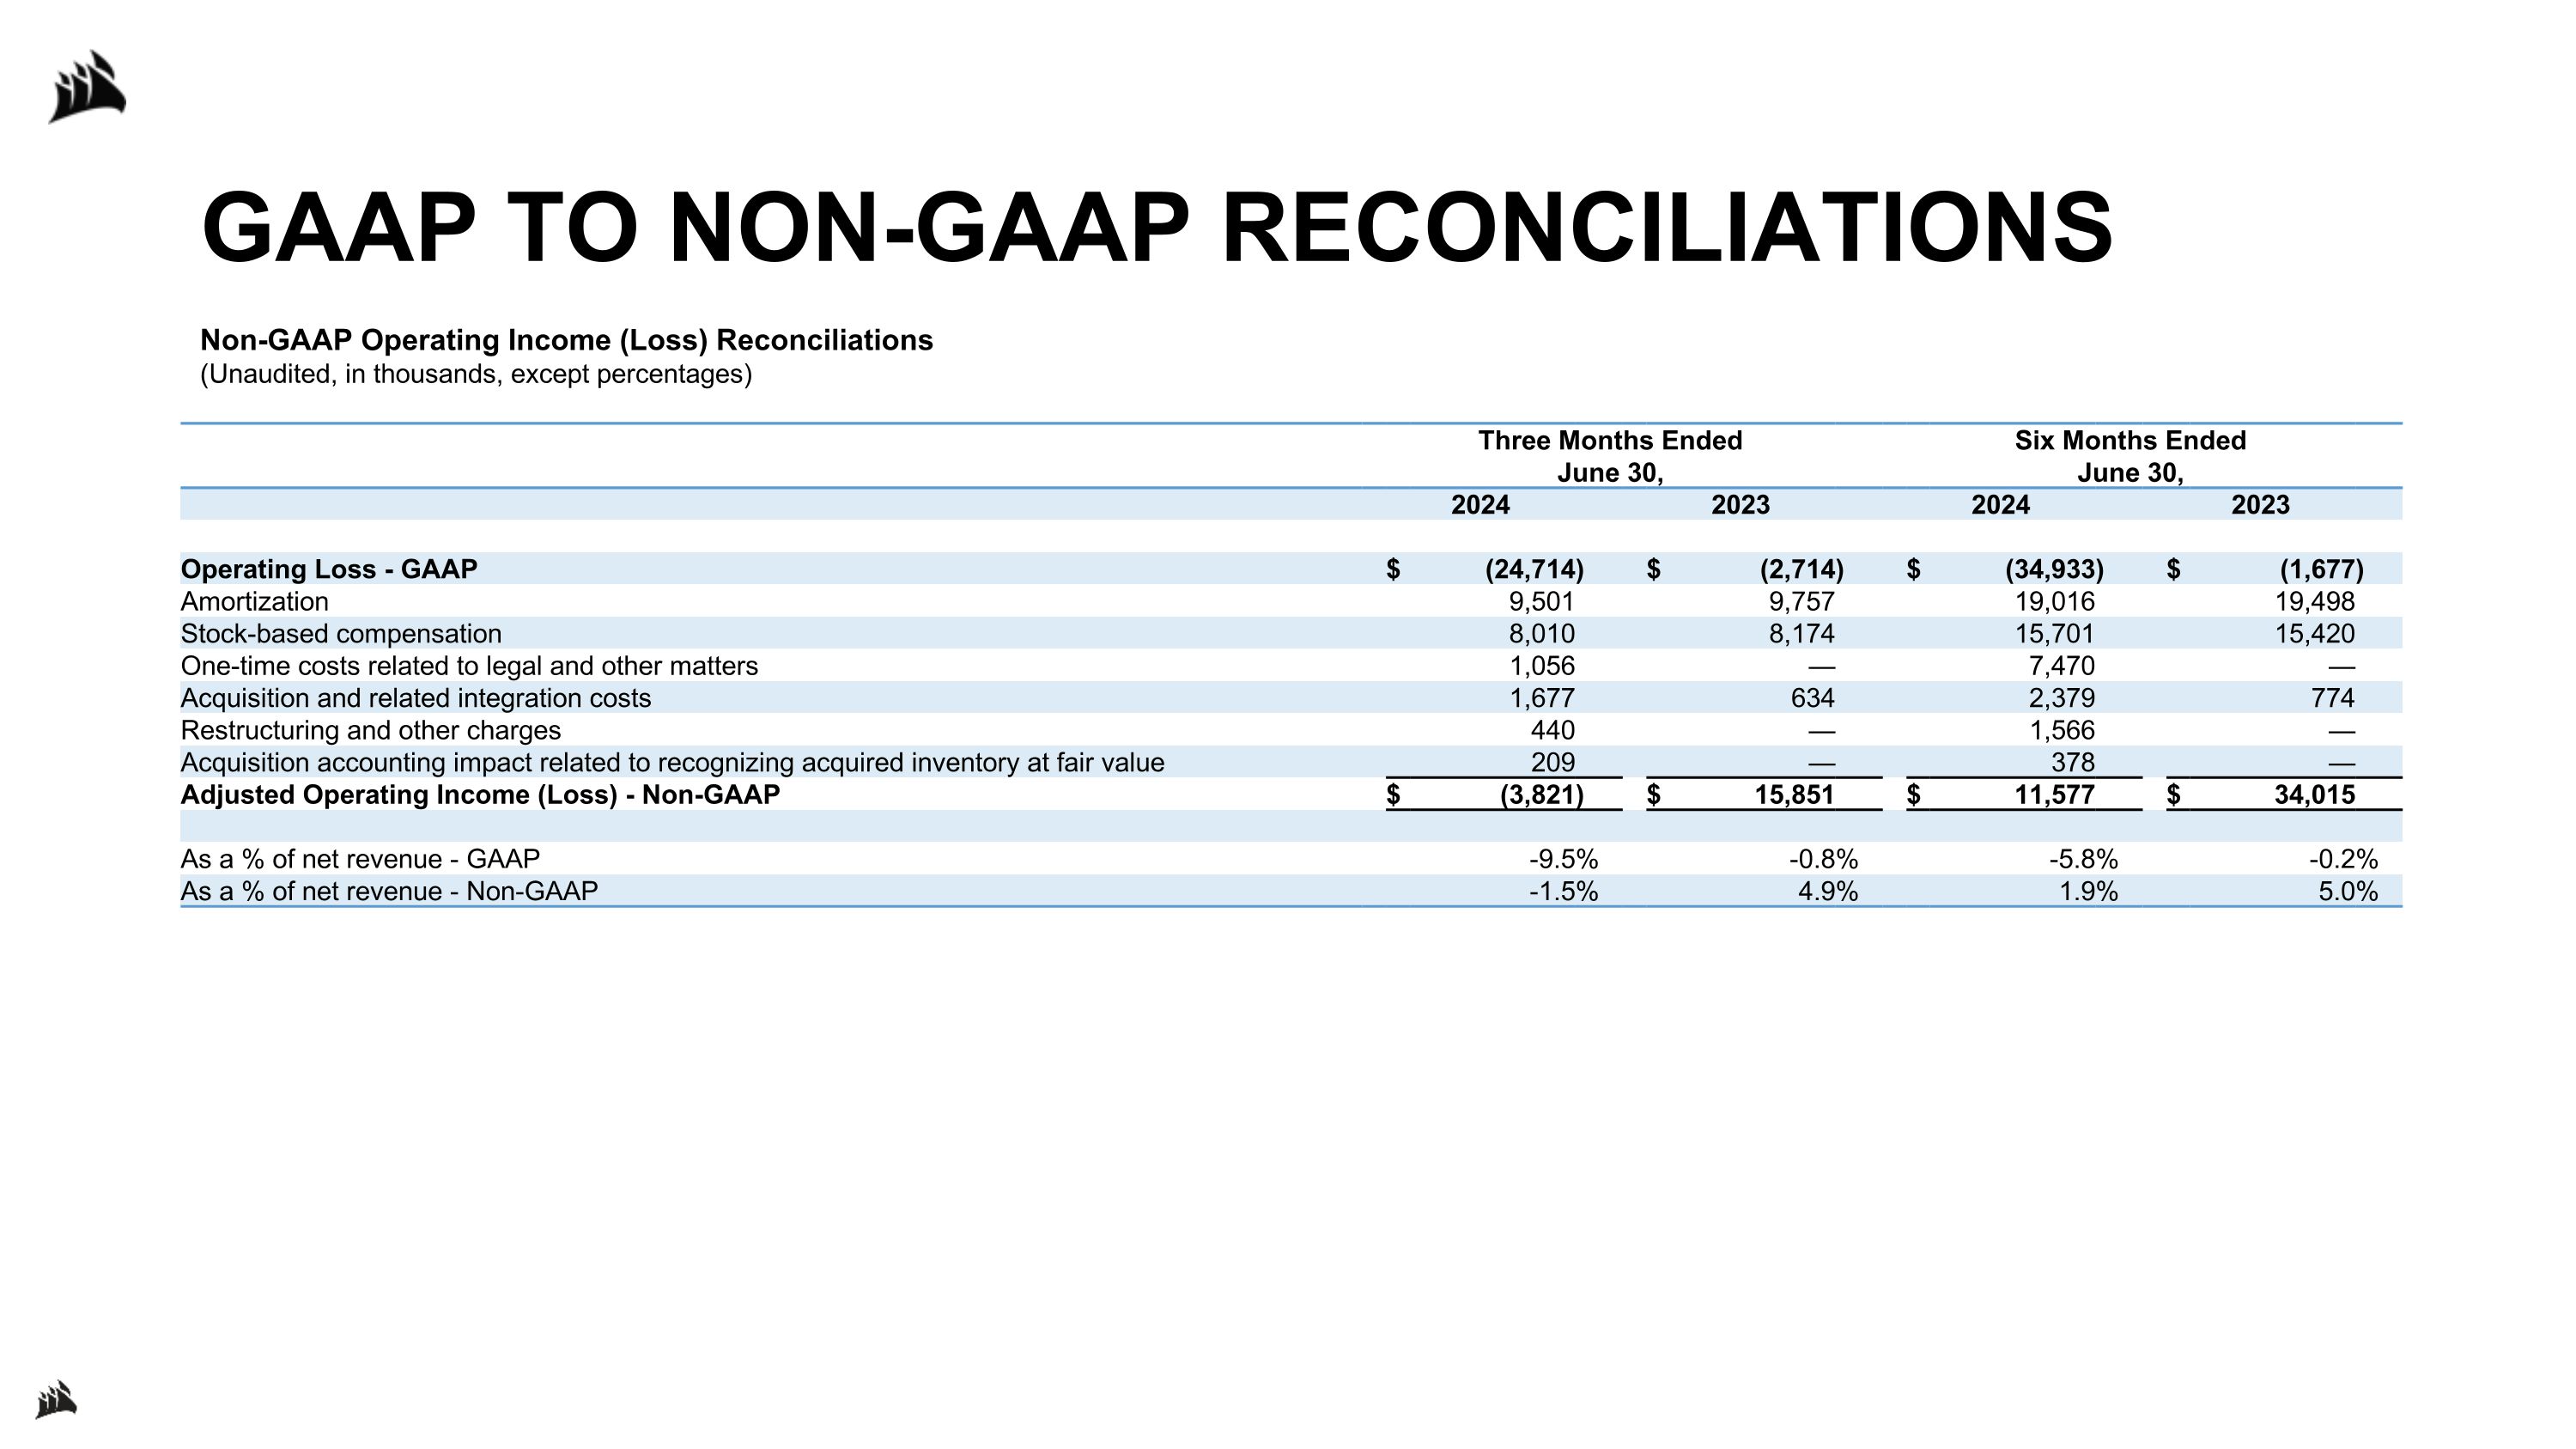
GAAP TO NON-GAAP RECONCILIATIONS Non-GAAP Operating Income (Loss) Reconciliations (Unaudited, in thousands, except percentages) Three Months Ended�June 30, Six Months Ended�June 30, 2024 2023 2024 2023 Operating Loss - GAAP $ (24,714 ) $ (2,714 ) $ (34,933 ) $ (1,677 ) Amortization 9,501 9,757 19,016 19,498 Stock-based compensation 8,010 8,174 15,701 15,420 One-time costs related to legal and other matters 1,056 — 7,470 — Acquisition and related integration costs 1,677 634 2,379 774 Restructuring and other charges 440 — 1,566 — Acquisition accounting impact related to recognizing acquired inventory at fair value 209 — 378 — Adjusted Operating Income (Loss) - Non-GAAP $ (3,821 ) $ 15,851 $ 11,577 $ 34,015 As a % of net revenue - GAAP -9.5 % -0.8 % -5.8 % -0.2 % As a % of net revenue - Non-GAAP -1.5 % 4.9 % 1.9 % 5.0 %
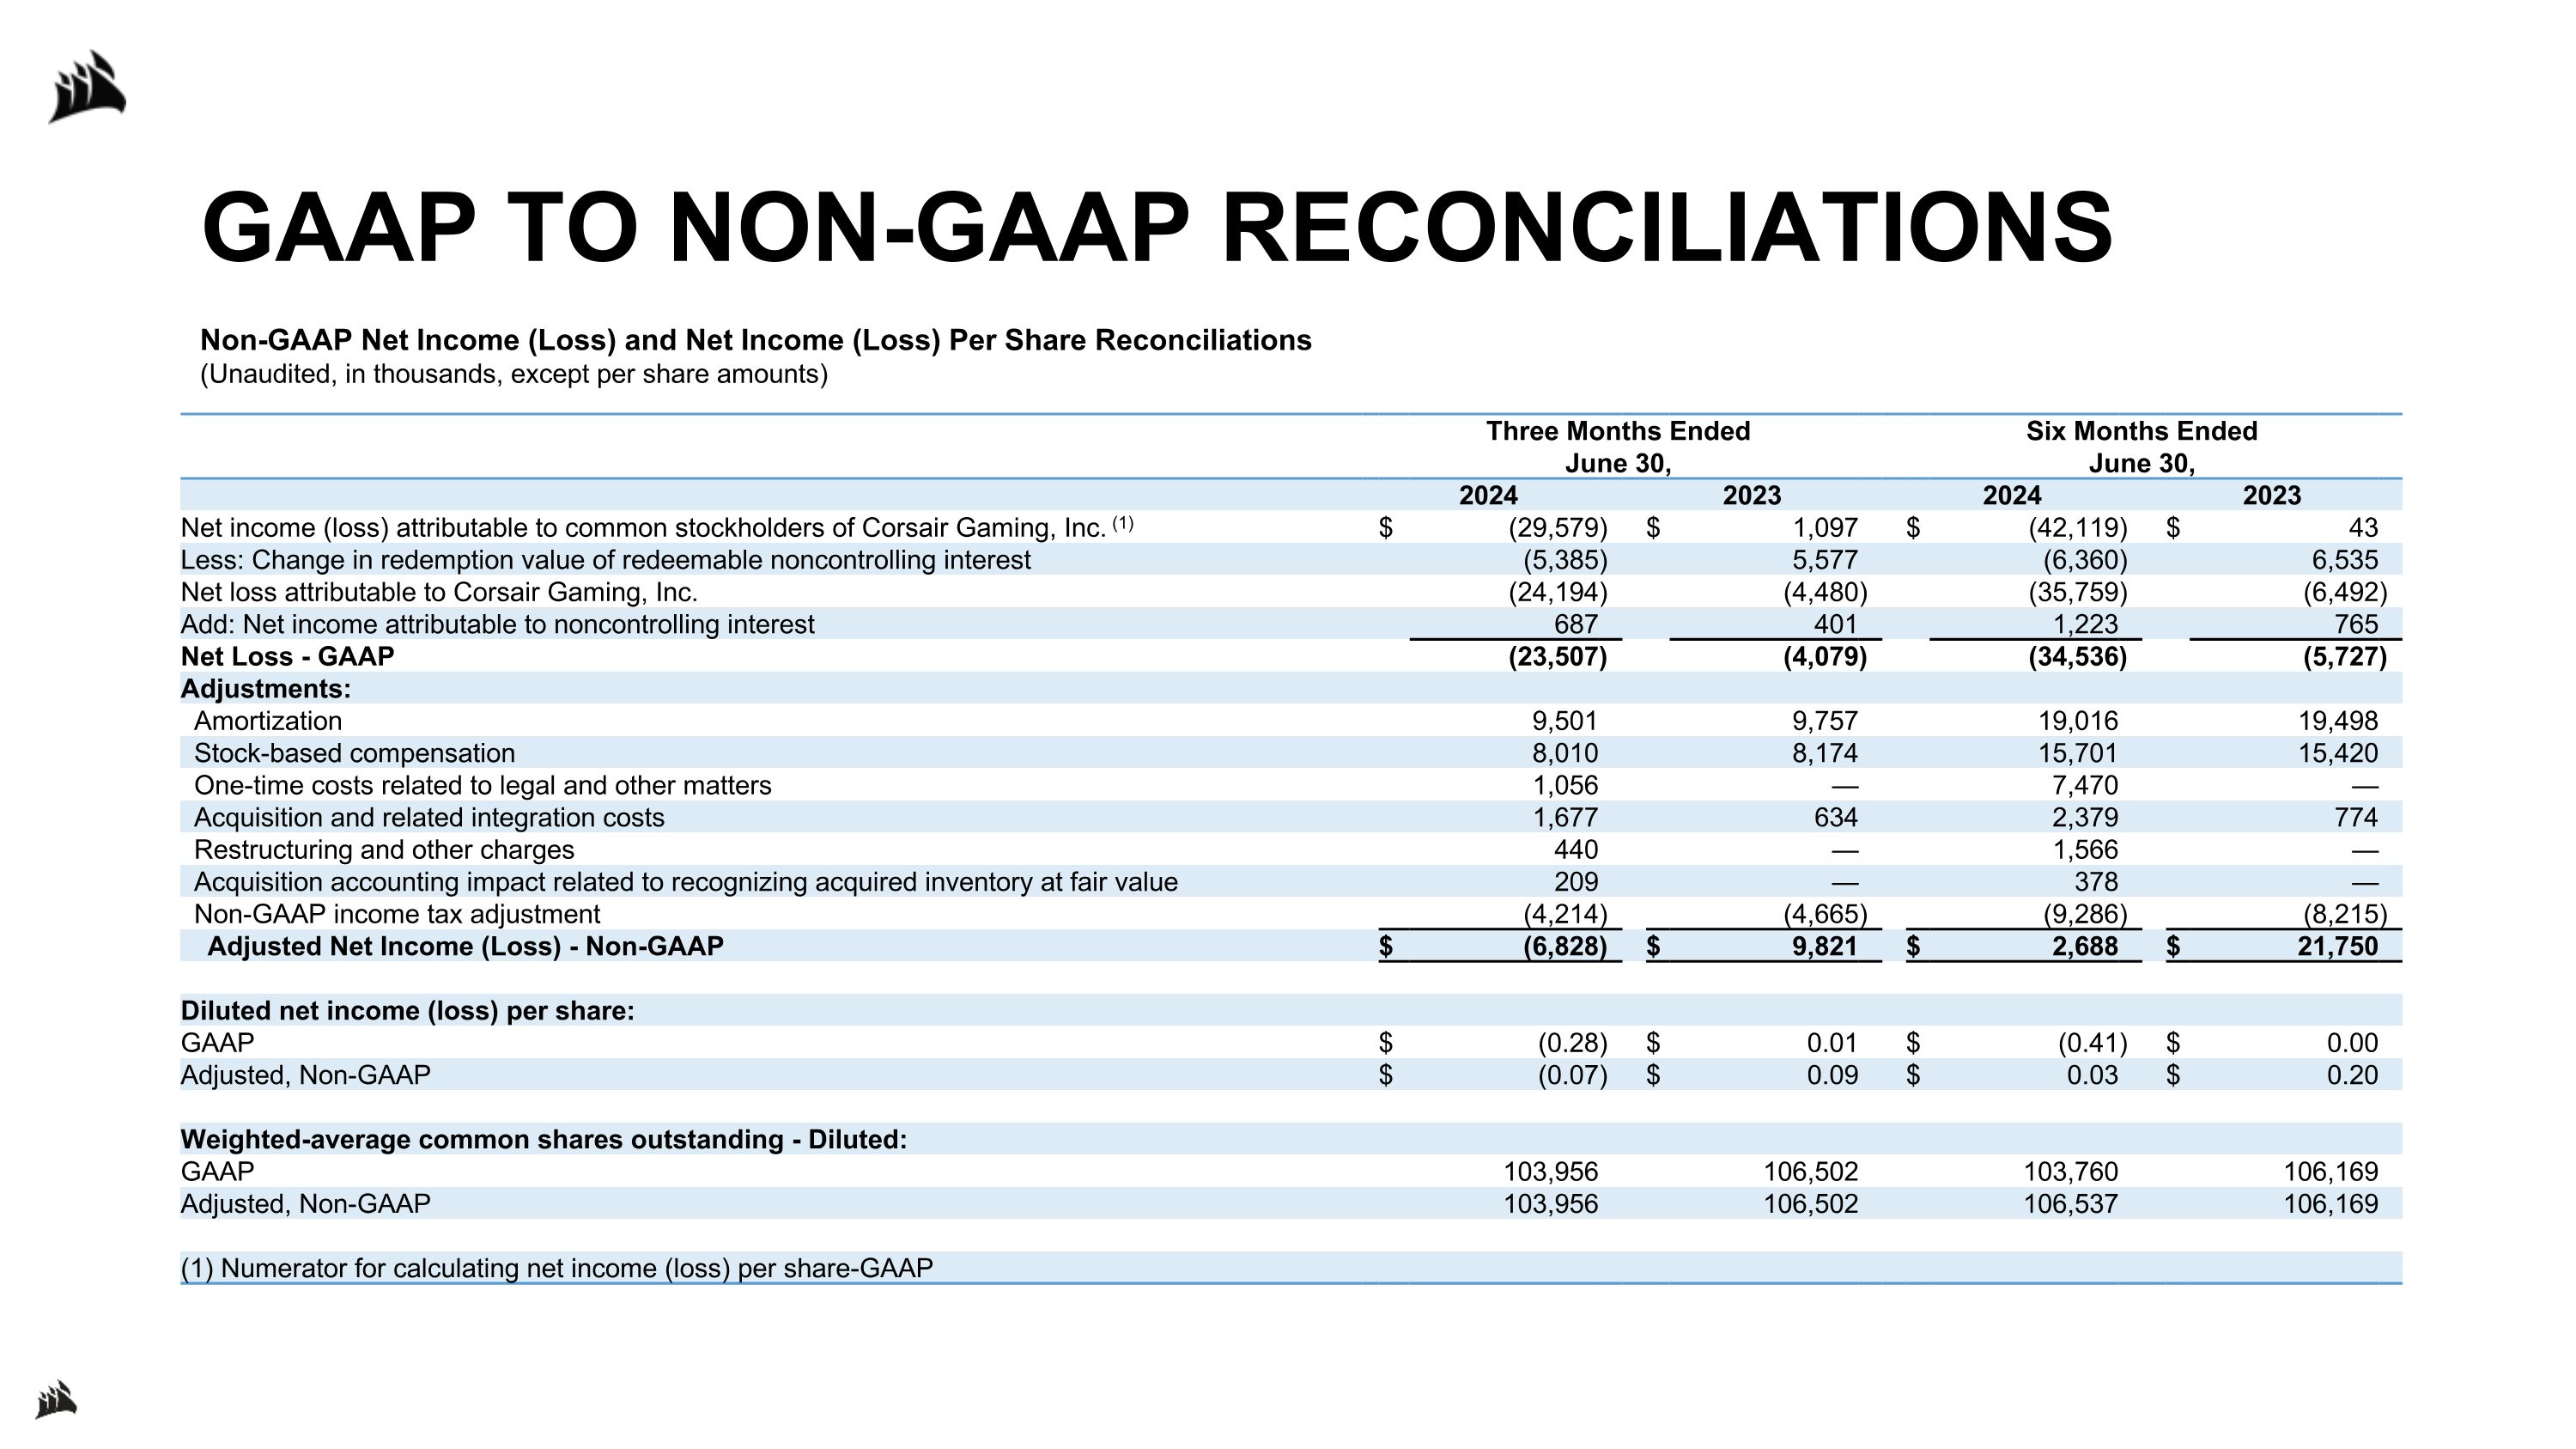
GAAP TO NON-GAAP RECONCILIATIONS Non-GAAP Net Income (Loss) and Net Income (Loss) Per Share Reconciliations (Unaudited, in thousands, except per share amounts) Three Months Ended�June 30, Six Months Ended�June 30, 2024 2023 2024 2023 Net income (loss) attributable to common stockholders of Corsair Gaming, Inc. (1) $ (29,579 ) $ 1,097 $ (42,119 ) $ 43 Less: Change in redemption value of redeemable noncontrolling interest (5,385 ) 5,577 (6,360 ) 6,535 Net loss attributable to Corsair Gaming, Inc. (24,194 ) (4,480 ) (35,759 ) (6,492 ) Add: Net income attributable to noncontrolling interest 687 401 1,223 765 Net Loss - GAAP (23,507 ) (4,079 ) (34,536 ) (5,727 ) Adjustments: Amortization 9,501 9,757 19,016 19,498 Stock-based compensation 8,010 8,174 15,701 15,420 One-time costs related to legal and other matters 1,056 — 7,470 — Acquisition and related integration costs 1,677 634 2,379 774 Restructuring and other charges 440 — 1,566 — Acquisition accounting impact related to recognizing acquired inventory at fair value 209 — 378 — Non-GAAP income tax adjustment (4,214 ) (4,665 ) (9,286 ) (8,215 ) Adjusted Net Income (Loss) - Non-GAAP $ (6,828 ) $ 9,821 $ 2,688 $ 21,750 Diluted net income (loss) per share: GAAP $ (0.28 ) $ 0.01 $ (0.41 ) $ 0.00 Adjusted, Non-GAAP $ (0.07 ) $ 0.09 $ 0.03 $ 0.20 Weighted-average common shares outstanding - Diluted: GAAP 103,956 106,502 103,760 106,169 Adjusted, Non-GAAP 103,956 106,502 106,537 106,169 (1) Numerator for calculating net income (loss) per share-GAAP
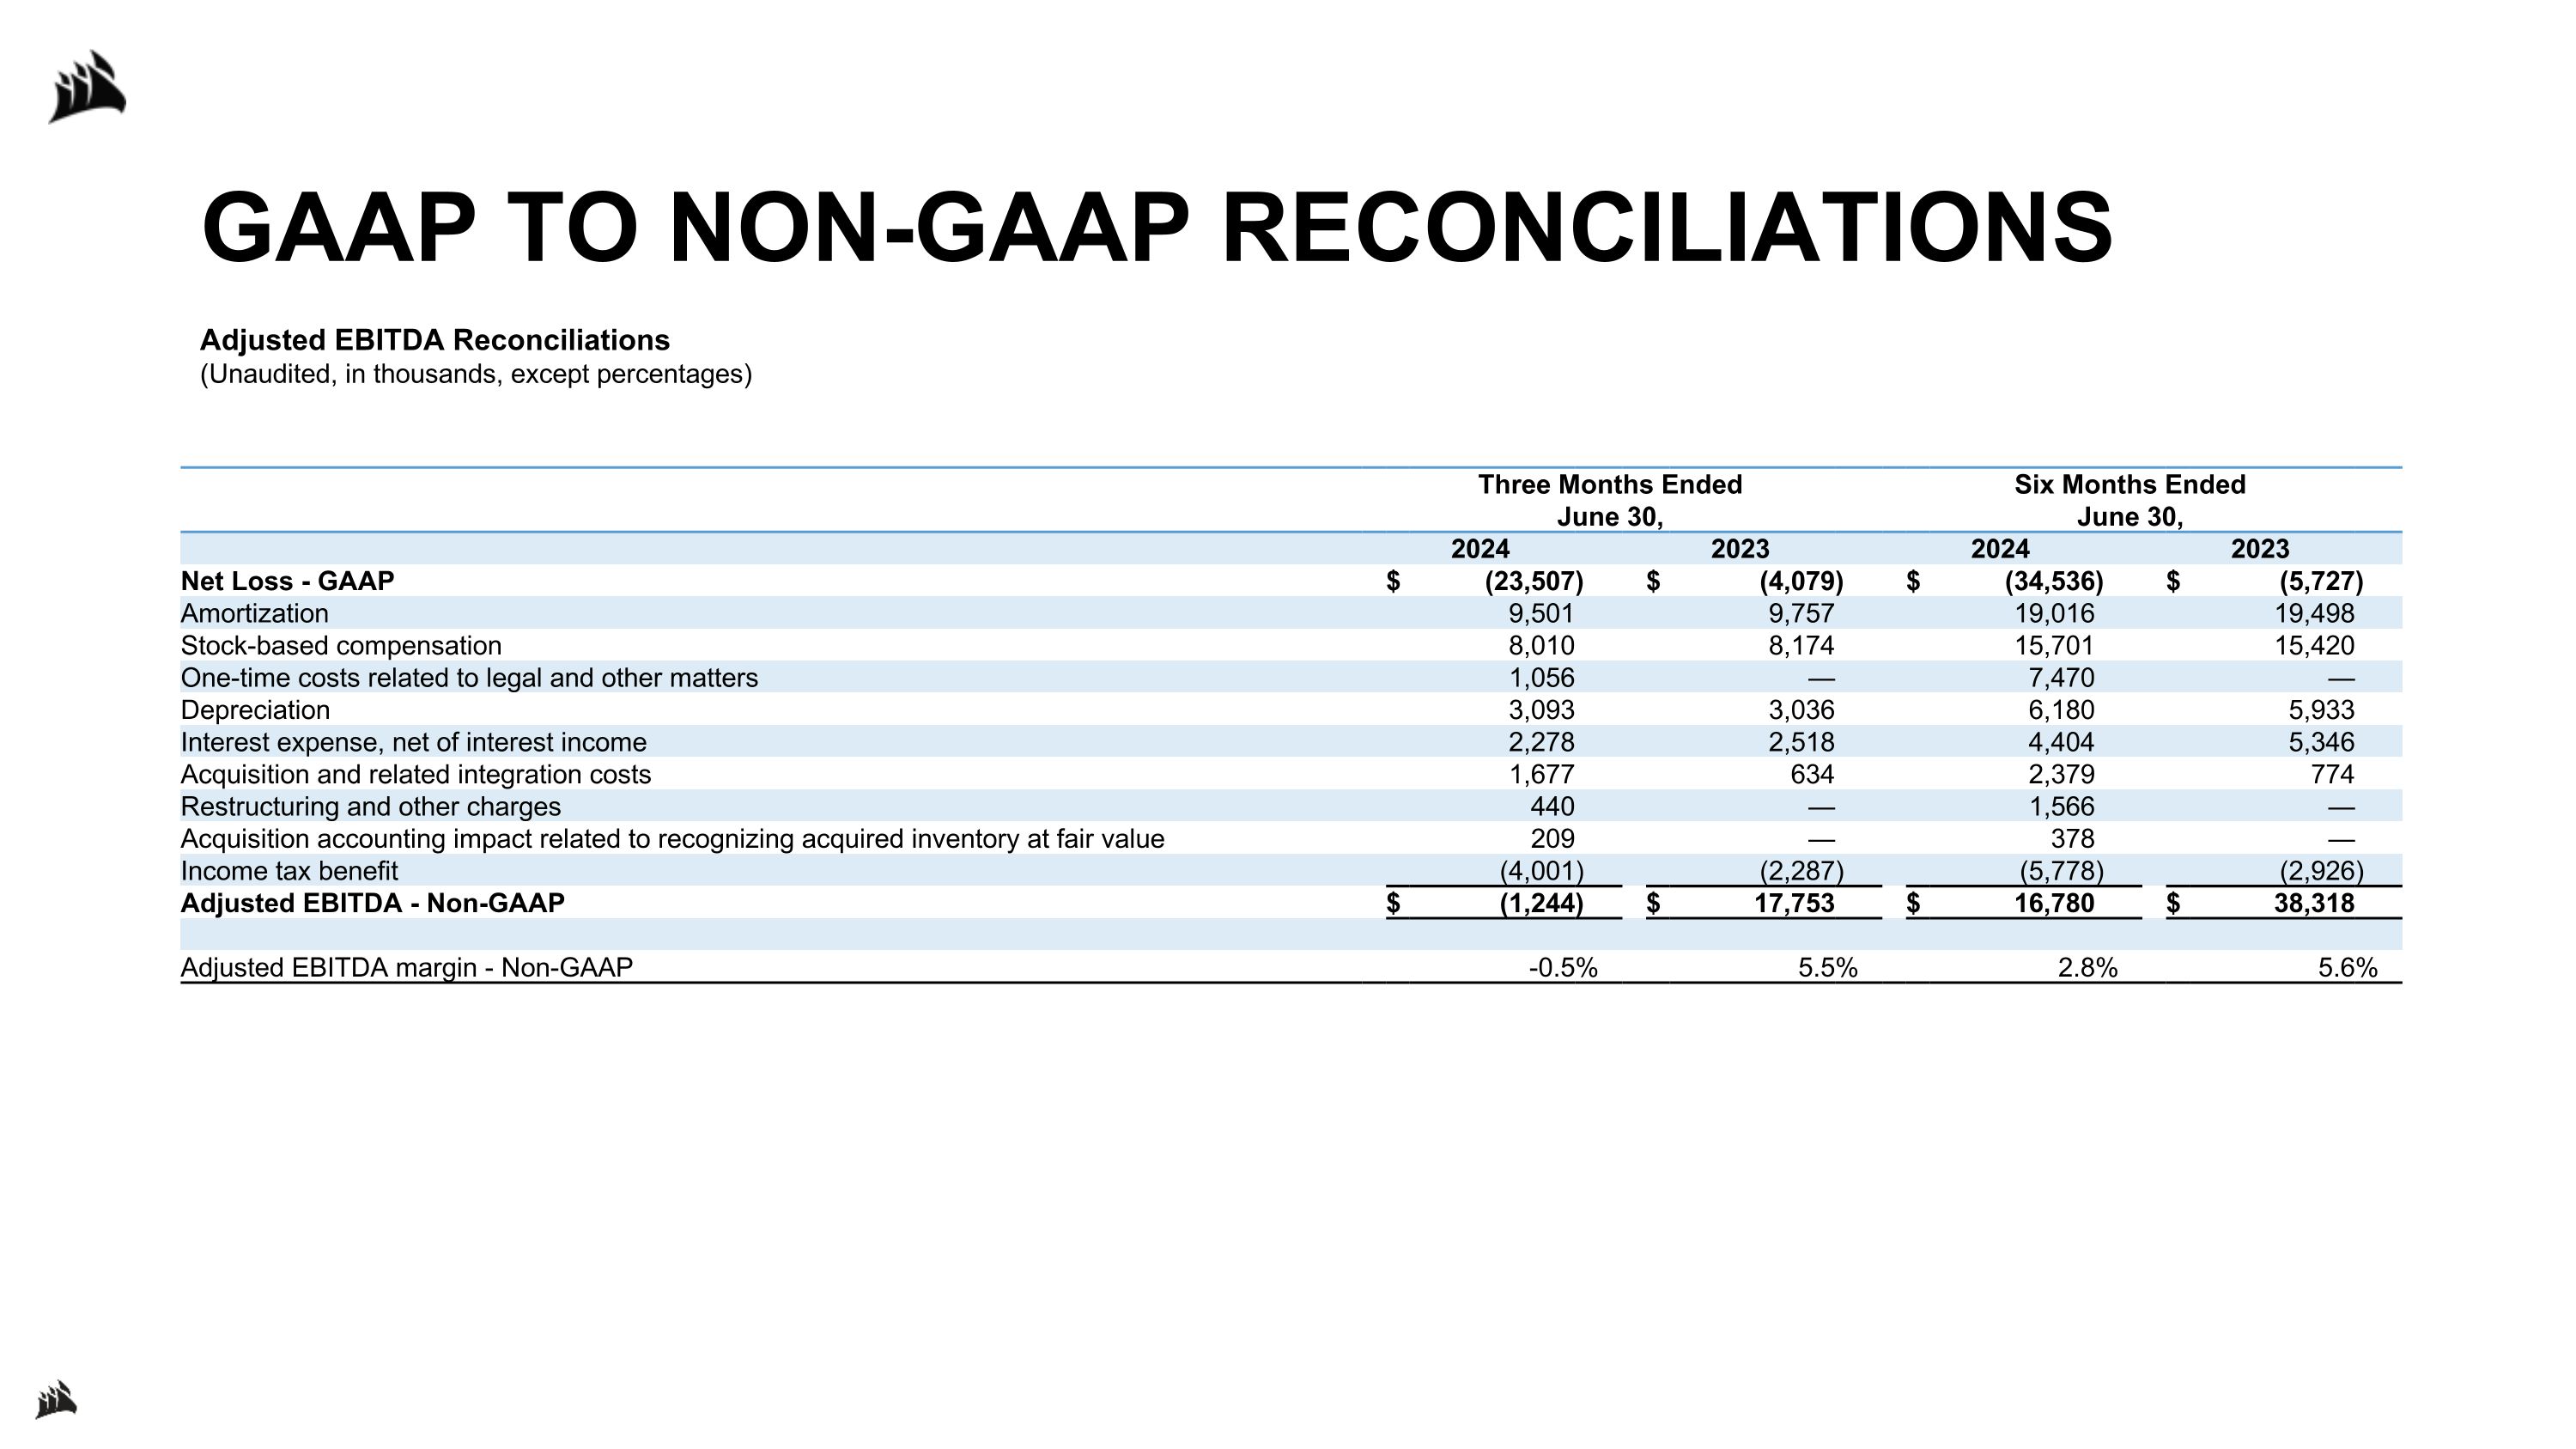
GAAP TO NON-GAAP RECONCILIATIONS Adjusted EBITDA Reconciliations (Unaudited, in thousands, except percentages) Three Months Ended�June 30, Six Months Ended�June 30, 2024 2023 2024 2023 Net Loss - GAAP $ (23,507 ) $ (4,079 ) $ (34,536 ) $ (5,727 ) Amortization 9,501 9,757 19,016 19,498 Stock-based compensation 8,010 8,174 15,701 15,420 One-time costs related to legal and other matters 1,056 — 7,470 — Depreciation 3,093 3,036 6,180 5,933 Interest expense, net of interest income 2,278 2,518 4,404 5,346 Acquisition and related integration costs 1,677 634 2,379 774 Restructuring and other charges 440 — 1,566 — Acquisition accounting impact related to recognizing acquired inventory at fair value 209 — 378 — Income tax benefit (4,001 ) (2,287 ) (5,778 ) (2,926 ) Adjusted EBITDA - Non-GAAP $ (1,244 ) $ 17,753 $ 16,780 $ 38,318 Adjusted EBITDA margin - Non-GAAP -0.5 % 5.5 % 2.8 % 5.6 %
