Exhibit 99.5
PRO FORMA VALUATION APPRAISAL REPORT
Federal Life Group, Inc.│Riverwoods, Illinois
PROPOSED HOLDING COMPANY FOR:
Federal Life Insurance Company
Dated as of December 22, 2017

1100 North Glebe Road Suite 600
Arlington, Virginia 22201
703.528.1700
rpfinancial.com

December 22, 2017
Board of Directors
Federal Life Mutual Holding Company
Federal Life Insurance Company
3750 West Deerfield Road
Riverwoods, Illinois 60015
Members of the Board:
At your request, we have completed and hereby provide an independent appraisal (“Appraisal”) of the estimated pro forma market value of the Common Stock which is to be offered in connection with the conversion transaction described below (hereinafter referred to as the “Conversion”).
This Appraisal is furnished pursuant to the requirements stipulated in Section 59.1 of the Illinois Insurance Code. In accordance with Section 59.1(6)(f) of the Illinois Insurance Code, the aggregate price of the capital stock shall be equal to the estimated pro forma market value of the converted stock company based upon an independent evaluation by a qualified person. Furthermore, as permitted by Section 59.1(6)(f), the pro forma market value may be the value that is estimated to be necessary to attract full subscription for the shares as indicated by the independent evaluation. Pursuant to the requirement in Section 59.1(3)(b)(i)(A), the Appraisal must be filed with the Illinois Department of Insurance (the “Department”).
Description of Conversion and Stock Issuance
We understand that Federal Life Mutual Insurance Holding Company (“FLMHC” or the “MHC”), the mutual insurance holding company for Federal Life Insurance Company (“Federal Life” or the “Company”) will reorganize into a stock insurance holding company. Pursuant to the Plan of Conversion (the “Plan”), upon completion of the Conversion, all of the outstanding shares of common stock of FLMHC will be issued to Federal Life Group (“FLG”). FLG will be the first tier parent of FLMHC which will wholly-own Federal Life. The Conversion will be effected only if subscriptions and orders are received for at least the minimum shares of common stock as indicated by the Valuation Range and the members of the MHC approve the Plan of Conversion. Federal Life Group, Inc. (“FLG”) which will offer its common stock in a subscription offering first to eligible members, and second, to the directors and officers.
The Standby Purchase Agreement
Insurance Capital Group, LLC. (“ICG” or the “Standby Purchaser”), has entered into a Standby Purchase Agreement (the “Agreement”) with FLG, FLMHC and Federal Life. Pursuant to the Agreement, the Standby Purchaser agrees to purchase at least the number of shares equal to (i) the number of shares that would be issued at the minimum of the valuation range minus (ii) the sum of any shares for which subscriptions have been accepted in the Subscription Offering, plus any shares for which orders have been accepted in the Community Offering (such number of shares purchased being the “Purchased Shares”). The Standby Purchaser has also been guaranteed the right but not the obligation to purchase 2,800,000 shares issued in the conversion, subject to other requirements of the Agreement. Any order submitted by Standby Purchaser in the Community Offering may be accepted by FLG prior to accepting any other order received in the Community Offering. In addition, the Company and the Standby Purchaser have agreed to certain other operating and management provisions including board representation by the Standby Purchaser. In addition, the Standby Purchaser has agreed that it will not seek to acquire or otherwise control the Company for a period of least 5 years subject to certain conditions.
| | |
| Washington Headquarters | |
| Three Ballston Plaza | |
| 1100 North Glebe Road, Suite 600 | Telephone: (703) 528-1700 |
| Arlington, VA 22201 | Fax No.: (703) 528-1788 |
| E-Mail: mail@rpfinancial.com | Toll-Free No.: (866) 723-0594 |
Board of Directors
December 22, 2017
Page 2
RP Financial, LC.
RP Financial, LC. (“RP Financial”) is a financial consulting firm serving the financial services industry nationwide that, among other things, specializes in financial valuations and analyses of business enterprises and securities, including the pro forma valuation for companies undertaking the demutualization process, including insurance companies and savings institutions. RP Financial is a nationally recognized valuation expert in stock conversion transactions for mutually owned financial services companies. The background and experience of RP Financial is detailed in Exhibit V-1. We believe that, except for the fee we will receive for our appraisal services, we are independent of FLMHC, FLG and Federal Life and the other parties engaged by the Company to assist in the conversion process.
Valuation Methodology
In preparing our appraisal, we have reviewed the Plan of Conversion to be filed with the Department. We have conducted a financial analysis of the Company that has included a review of its financial information for fiscal years ended December 31, 2015 through 2016 and through September 30, 2017, all unaudited but prepared in accordance with generally accepted accounting principles (“GAAP”). We have conducted due diligence related discussions with the Company’s management, Stevens & Lee, the Company’s counsel, and Griffin Financial Group, LLC, the Company’s financial and marketing advisor in connection with the stock offering. All conclusions set forth in the Appraisal were reached independently from such discussions. In addition, where appropriate, we have considered information based on other available published sources that we believe are reliable. While we believe the information and data gathered from all these sources are reliable, we cannot guarantee the accuracy and completeness of such information.
We have investigated the competitive environment within which the Company operates and have assessed the Company’s relative strengths and weaknesses. We have kept abreast of the changing regulatory and legislative environment for insurance companies, including those with broadly similar lines of business, and analyzed the potential impact on the Company and the industry as a whole. We have analyzed the potential effects of the Conversion and stock offering on the Company’s operating characteristics and financial performance as they relate to the pro forma market value. We have reviewed the economy in the Company’s primary market area and have compared the Company’s financial performance and condition with publicly-traded insurance companies sharing similar lines of business. We have reviewed conditions in the securities markets in general and in the market for insurance company stocks in particular, including the market for existing insurance companies, the market for the newly issued stock offered by demutualized insurance companies, and the market for mutual thrift institutions converting to stock form. We have also considered the expected market for FLG including the post-transaction illiquidity of the shares in view of the large insider ownership and shares purchased by ICG.
Board of Directors
December 22, 2017
Page 3
Our Appraisal is based on the Company’s representation that the information contained in the regulatory applications and additional information furnished to us by the Company, its independent auditors and actuaries, legal counsel and other authorized agents are truthful, accurate and complete. We did not independently verify the financial statements and other information provided by the Company, its independent auditors and actuaries, legal counsel and other authorized agents nor did we independently value the assets or liabilities of the Company. The valuation considers the Company only as a going concern and should not be considered as an indication of the Company’s liquidation value.
Our appraised value is predicated on a continuation of the current operating environment for the Company and for all insurance companies and their holding companies. Changes in the local, state and national economy, the legislative and regulatory environment for insurance companies and legal professional liability insurers, the stock market, interest rates, and other external forces (such as natural disasters or significant world events) may occur from time to time, often with great unpredictability, and may materially impact the value of insurers as a whole or FLG’s value alone. To the extent that such factors can be foreseen, they have been factored into our analysis.
Pro forma market value is defined as the price at which FLG’s stock, immediately upon completion of the Offering, would change hands between a willing buyer and a willing seller, neither being under any compulsion to buy or sell and both having reasonable knowledge of relevant facts.
Valuation Conclusion
It is our opinion that, as of December 22, 2017 (the “Valuation Date”), the estimated pro forma market value of the Company was $40,000,000 with a range (the “Valuation Range”) of $34,000,000 to $46,000,000. The Valuation Range was based upon a 15% decrease from the midpoint of $40,000,000 to determine the minimum and a 15% increase from the midpoint to establish the maximum. Based on an assumed offering price of $10.00 per share, the number of shares of common stock offered for sale will range from 3,400,000 shares at the minimum to 4,600,000 shares at the maximum with a midpoint of 4,000,000 shares.
Limiting Factors and Considerations
Our valuation is not intended, and must not be construed, as a recommendation of any kind as to the advisability of purchasing shares of the Common Stock. Moreover, because such valuation is necessarily based upon estimates and projections of a number of matters, all of which are subject to change from time to time, no assurance can be given that persons who purchase shares of common stock in the offering will thereafter be able to buy or sell such shares at prices related to the foregoing valuation of the pro forma market value thereof.
Our valuation conclusion reflects our opinion as to the fair market value of the shares issued in the Offering assuming a full distribution of the shares to eligible subscribers. This valuation conclusion does not express an opinion as to the pro forma impact to the subscribers. Furthermore, this valuation is based on offering and transaction terms set forth in the draft documents which set forth the terms and structure of the offering on a preliminary basis. Changes in the transaction terms and structure could have a material impact on the valuation conclusion set forth herein.
Board of Directors
December 22, 2017
Page 4
RP Financial’s valuation was determined based on the financial condition and operations of the Company as of September 30, 2017.
RP Financial is not a seller of securities within the meaning of any federal and state securities laws and any report prepared by RP Financial shall not be used as an offer or solicitation with respect to the purchase or sale of any securities. RP Financial maintains a policy which prohibits the company, its principals or employees from purchasing stock of its client institutions.
| | Respectfully submitted, |
| | |
| | RP FINANCIAL, LC. |
| | |
| |  |
| | James P. Hennessey |
| | Director |
| RP® Financial, LC. | TABLE OF CONTENTS |
| | i |
TABLE OF CONTENTS
Federal Life Insurance Company
Riverwoods, Illinois
| | | PAGE |
| DESCRIPTION | | NUMBER |
| | | |
| CHAPTER ONE OVERVIEW AND FINANCIAL ANALYSIS | | |
| | | |
| Company Overview | | 1.1 |
| Business Strategies | | 1.2 |
| Product Description | | 1.4 |
| Marketing and Distribution | | 1.8 |
| Underwriting | | 1.10 |
| Reinsurance | | 1.10 |
| Claims Management | | 1.11 |
| Executive Officers | | 1.12 |
| Plan of Conversion | | 1.13 |
| Financial Overview | | 1.14 |
| Income and Expense Trends | | 1.19 |
| Potential Off Balance Sheet Value | | 1.22 |
| Legal Proceedings | | 1.23 |
| | | |
| CHAPTER TWO EXTERNAL ENVIRONMENT | | |
| | | |
| Introduction | | 2.1 |
| National Economic Factors | | 2.1 |
| Life Insurance Trends | | 2.3 |
| Regulatory Environment | | 2.5 |
| Competition | | 2.6 |
| | | |
| CHAPTER THREE PEER GROUP ANALYSIS | | |
| | | |
| Peer Group Selection | | 3.1 |
| Financial Condition | | 3.8 |
| Income and Expense Components | | 3.10 |
| Summary | | 3.13 |
| RP® Financial, LC. | TABLE OF CONTENTS |
| | ii |
TABLE OF CONTENTS
Federal Life Insurance Company
Riverwoods, Illinois
(continued)
| | | PAGE |
| DESCRIPTION | | NUMBER |
| | | |
| CHAPTER FOUR VALUATION ANALYSIS | | |
| | | |
| Introduction | | 4.1 |
| Pro Forma Approach to the Valuation | | 4.1 |
| Valuation Analysis | | 4.2 |
| | 1. | Financial Considerations | | 4.2 |
| | 2. | Operating Considerations | | 4.3 |
| | 3. | Dividends | | 4.4 |
| | 4 | Liquidity of the Shares | | 4.4 |
| | 5. | Marketing of the Issue | | 4.5 |
| | | A. | The Public Market | | 4.5 |
| | | B. | The New Issue Market | | 4.8 |
| | 6. | Organization | | 4.11 |
| | 7. | Regulatory Environment | | 4.11 |
| Summary of Adjustments | | 4.12 |
| Valuation Approaches | | 4.12 |
| | 1. | Price-to-Earnings ("P/E") | | 4.14 |
| | 2. | Price-to-Book ("P/B") | | 4.16 |
| | 3. | P/Revenues | | 4.16 |
| Comparison to Recent Demutualizations | | 4.16 |
| Valuation Conclusion | | 4.17 |
| RP® Financial, LC. | LIST OF TABLES |
| | iii |
LIST OF TABLES
Federal Life Insurance Company
Riverwoods, Illinois
| TABLE | | | | |
| NUMBER | | DESCRIPTION | | PAGE |
| | | | | |
| 1.1 | | Direct Premium by Product Type | | 1.6 |
| 1.2 | | Number of Policies by Type | | 1.7 |
| 1.3 | | Summary of Life Insurance in Force | | 1.7 |
| 1.4 | | Geographic Distribution of Premium Income | | 1.9 |
| 1.5 | | Reinsurance Ceded by Reinsurer | | 1.11 |
| 1.6 | | Historical Balance Sheets | | 1.15 |
| 1.7 | | Historical Income Statements as a Percent Average Assets | | 1.20 |
| | | | | |
| 2.1 | | Market Shares | | 2.7 |
| | | | | |
| 3.1 | | Peer Group of Publicly-Traded Insurance Companies | | 3.3 |
| 3.2 | | Comparative Financial Condition Data | | 3.9 |
| 3.3 | | Comparative Operating Performance Data | | 3.12 |
| | | | | |
| 4.1 | | Stock Market Pricing Trends | | 4.7 |
| 4.2 | | Demutualization Transaction – Subscription Rights Offerings | | 4.9 |
| 4.3 | | Public Market Pricing | | 4.15 |
| 4.4 | | Valuation Range and Offering Characteristics | | 4.17 |
RP Financial, LC.
Page 1.1
I. OVERVIEW AND FINANCIAL ANALYSIS
Company Overview
Federal Life Insurance Company (“Federal Life” or the “Company” is an Illinois chartered stock insurance company whose primary business activity is the marketing and underwriting of quality life insurance and annuity products. The Company was incorporated in 1899 and conducts operations through its headquarters office in Riverwoods, Illinois, a suburb approximately thirty miles north of Chicago. The Company is licensed to do business in all states except: Maine, Massachusetts, New Hampshire, New York, and Vermont. Moreover, the Company markets its products through independent agents located across the United States. Federal Life is focused on the underwriting of various life and annuity products and does not offer property, casualty or health insurance.
For more than 100 years, Federal Life has provided quality whole life and term life insurance products as well as various savings products including annuities. Federal Life’s products and services have evolved over time in keeping with changing consumer needs and preferences. In this regard, Federal Life was a pioneer in the variable annuity business when it formed a relationship with Wellington Management Company. In 1976, Federal Life introduced a Variable Annuity that was unique at that time having Wellington Management Funds as investment option as well as a Fixed Annuity with Federal Life. Other innovative product offerings include the 2015 introduction by Federal Life of Market Shield Plus, an Index-Linked Annuity which offers the opportunity to participate in stock market growth on a tax-deferred basis, with downside protection.
In June 2016, the Company was reorganized into a mutual holding company structure whereby the Company converted to the stock form of ownership and became a wholly-owned subsidiary of FedHo Holding Company, Inc., which is a wholly-owned subsidiary of Federal Life Mutual Holding Company (“FLMHC” or the “MHC”).
Federal Life Group, Inc. (“FLG”) will be a newly created Pennsylvania corporation organized to be the stock holding company for Federal Life following the conversion to the stock form of ownership (the “Conversion”). In the Conversion, FLG will become the sole shareholder of FLMHC which will own 100% of Federal Life. Federal Life is subject to examination and comprehensive regulation by the Illinois Department of Insurance. Federal Life is also a member of the Chicago Federal Home Loan Bank.
RP Financial, LC.
Page 1.2
Business Strategies
Federal Life states that its mission is to offer competitive products that are beneficial to customers, create a culture of service that strives to “do the right thing”, and maintain operations that support long term financial strength to ensure the promises of the Company will be kept.
The Company’s vision is to offer products, service and security that will enable people to achieve their goals now and in the future while providing security for future generations. The Company has trademarked the following tagline with the U.S. Patent and Trademark Office to promote this vision:“Live your dreams. Leave a legacy.”
Federal Life offers a variety of annuity, life insurance and had previously but does not currently offer Medicare supplement plans. Federal Life administers and sells a variety of variable, fixed, index-linked and income annuities designed to address contract holders’ needs for protected wealth accumulation on a tax-deferred basis, wealth transfer and income security. The life segment offers insurance products and services, including term, whole, universal and variable life products designed to address policyholders’ needs for financial security and protected wealth transfer, which may be provided on a tax-advantaged basis. Most of the Company’s offerings are marketed through independent agent relationships but Federal Life is increasingly emphasizing direct marketing through the Internet and social media platforms.
Importantly, Federal Life has reported operating losses for over a decade, which management attributes to serval factors. In this regard, the economic environment following the financial crisis in 2007, has resulted in a long period of falling and or very low interest rates which have had a significant impact on the financial results of the Company in recent years. Despite taking proactive steps to mitigate the interest rate risk by significantly diversifying the investment portfolio, and closely monitoring crediting rates, diminished investment income on the Company’s investment securities portfolio has resulted in lower net income.
Like most of the life insurance industry, the Company also suffered significant capital losses in 2008 and 2009 due to the global financial crisis. Many of the losses were on investment grade bonds which under normal conditions would not be considered high credit risks.
Accordingly, the financial results of the Company over the last 10 years have reflected the effects of the low interest rate environment, the global economic crisis and the limited marketing growth due to the changing niche market. The Company sought to preserve capital through this difficult operating environment while also managing expense levels while maintaining an infrastructure with capacity for future growth.
RP Financial, LC.
Page 1.3
In response to the challenging operating environment, Federal Life has developed a growth oriented business plan designed to reverse the recent operating losses. Management believes that growth in underwriting supported by the capital provided by the conversion and facilitated by relationships and partnerships fostered by the standby investor in the offering (the “Standby Investor”) will facilitate the reversal of the current operating losses and provide a future return for investors in the conversion offering. In view of the foregoing, the management of Federal Life has developed the following key business strategies for achieving its vision and mission.
| 1. | Undertake growth to expand revenues and achieve economies of scale. The Company will be implementing a marketing plan based on the formation of strategic partnerships to improve the Company’s distribution capabilities which will enable significant growth in products that the Company identifies as having unique market opportunities. A portion of this growth will be achieved through the Standby Investor who has longstanding experience and relationships within the insurance industry. The strategic partnership will leverage national distribution systems with existing relationships with the partner to enhance the current marketing program of the Company. |
| 2. | Maximize the use of the existing infrastructure capacity in growth plans to create a competitive advantage. The Company has maintained an administrative infrastructure capacity which can be utilized efficiently in the future growth plans. The Company is able to make modest incremental investments in infrastructure to create a companywide digital transformation that will allow it to adapt to the technological demands of the industry with a competitive advantage for service. The digital transformation over the next several years is targeted to result a full suite of digital distribution and service business applications. Existing programs and applications will be improved, which will increase the speed with which new products are released and existing products are updated. This will eliminate time-consuming, manual processes and allows employees and agents to focus on higher priority tasks, increasing efficiency. |
| 3. | Promote a performance oriented culture within the organization to ensure financial strength. The Company has sought to develop a performance oriented culture which emphasizes execution and accountability. The highest priority goal of the plan will be to maintain operations that support long term financial strength. Areas requiring improvement will be identified and modified as appropriate. Projections and forecasts will be continuously updated, and the strategic plans will be dynamically changed to ensure the operations support this goal. This will include reviewing that expenses and staff levels are appropriate for actual growth rates achieved. |
| 4. | Identify potential internal opportunities to increase regulatory surplus to support growth and risk levels. The Company is currently exploring internal resources to improve surplus levels separate from operations. The Company owns several assets whichcurrently have market values significantly in excess of the statutory book values, and also has other avenues it is exploring to improve surplus levels. These opportunities include: |
RP Financial, LC.
Page 1.4
| · | The Company’s home office building which is located on 10 acres of property in a sought after location in Riverwoods, Illinois. The current market value is estimated to be materially in excess of the current book value under both STAT and GAAP accounting; |
| · | The Company owns oil and gas mineral rights leases that are at market values materially above the current book values. The Company will continue to explore additional opportunities to utilize these assets to benefit operations or raise surplus levels. |
| · | FHLB – As a member of the Federal Home Loan Bank of Chicago, Federal Life has access to low-cost, flexible advances that can be used for funding, liquidity and yield enhancement. |
| · | Reinsurance – The Company has entered into new reinsurance treaties that will stabilize the operations of the Company, and provide surplus relief to assist in growth plans. The increase in capital resulting from the Conversion transaction will facilitate Federal Life’s flexibility with respect to its reinsurance arrangements. |
| 5. | Complete the conversion to capitalize future growth and provide enhanced access to capital markets in the future to support growth and risk levels. The Company is currently pursuing a plan to raise enough capital to support the future growth plans by offering common stock investments in a full subscription rights demutualization. The current plan is to offer subscription rights to invest in the Company to policyholders, directors, officers, employees and other stakeholders such as agents. The Company will also sell stock to the Standby Investor which will facilitate growth objectives through referrals and industry relationships of the Standby Investor. |
Product Description
Federal life offers a variety of life insurance and annuity/savings.
Life Insurance.
The Company offers a variety of term and whole life policies. Term life policies are offered for terms of up to 30 years and for a minimum benefit amount of $50,000. The Company has policies with the ability to change the coverage based on changing circumstances of the policyholder including the ability to add a spouse asan additional insured to this plan, instead of having to purchase a second plan. Whole life policies offered by the Company include traditional level premium insurance products and single premium plans. The Company’s insurance products include the following:
RP Financial, LC.
Page 1.5
Current Interest Tradition -Interest Sensitive Whole Life. Current Interest Tradition provides whole life coverage, with level premiums and a level death benefit. A variety of optional riders are available for an additional charge.
The Level Term Series – 10, 15, 20 and 30-year periods -Level Premium Term Life. The Level Term Series provides term life coverage for a specific period, with level premiums and a level death benefit. These plans are renewable and convertible, and also feature a variety of optional riders for an additional charge.
Ultra Flex-Life –Universal Life. Ultra Flex-Life provides flexible premiums, a choice of death benefit options (level or increasing), and a variety of optional riders available for an additional charge. This plan also allows an additional insured to be added to the base plan.
The Estate Builder –Single Premium Whole Life. The Estate Builder provides permanent whole life coverage by locking in a guaranteed death benefit purchased with a one-time premium payment. This plan also features a built-in accelerated death benefit, free of charge.
Express Plan –Final Expense Coverage. The Express Plan provides permanent whole life coverage, with level premiums and lower face amounts ($2,500-$25,000), available via simplified underwriting.
Graded Benefit Whole Life– Final Expense Coverage. The Graded Benefit Whole Life plan provides permanent whole life coverage, with level premiums and lower face amounts ($2,500-$25,000), with a graded benefit during the first two policy years. This plan is offered as an alternative for individuals who may not qualify for the Express Plan.
Annuities
The Company offers a variety of annuities that can be used for both primary and supplemental retirement savings, and can provide either an immediate or future stream of guaranteed income. These retirement plans can also be setup as Traditional or Roth IRAs and include the following products:
Market Shield Plus -Single Premium Deferred Annuity with Fixed and Index-Linked Options. Market Shield Plus allows the customer to build long-term savings by earning interest as the market increases, while protecting principal during periods of decline. This product earns interest on a tax-deferred basis and features three allocation options. There are two annual point- to-point index-linked allocation options which earn interest based on the S&P500®, and one fixed allocation option that earns interest based on a current competitive rate. Interest is credited on an annual basis. Additionally, Market Shield Plus features a built-in Nursing Home Rider, which is included free of charge, and an optional Income Benefit Rider (Income Security Shield).
RP Financial, LC.
Page 1.6
Flexi/Saver –Flexible Premium Deferred Annuity. Flexi/Saver features a guaranteed principal, death benefit, and minimum interest rate. Additionally, this product earns interest on a tax-deferred basis, and offers a variety of annuitization payout options.
Maxi/Saver –Single Premium Deferred Annuity. Maxi/Saver features a guaranteed principal, death benefit, and minimum interest rate. Additionally, this product earns interest on a tax-deferred basis and offers a variety of annuitization payout options.
Income Security Shield –Single Premium Immediate Annuity. Income Security Shield requires a one-time initial premium payment. The customer can then choose to begin receiving guaranteed income payments within the first contract year at regularly scheduled intervals (i.e. monthly, quarterly, semi-annually, or annually). A variety of payout options, including Life Income with Cash Refund, are available.
Table 1.1 below shows the gross direct premiums by product type.
Table 1.1
Federal Life Insurance Company
Direct Premium by Product Type
(Dollars In Thousands)
| | | | | | Nine Months | |
| | | Fiscal Year Ended | | | Ended | |
| | | 12/31/2015 | | | 12/31/2016 | | | 9/30/2017 | |
| | | | | | | | | | |
| Whole Life Premium | | $ | 10,156 | | | $ | 9,655 | | | $ | 6,197 | |
| Term life Premium | | $ | 4,684 | | | $ | 4,571 | | | $ | 3,448 | |
| FEGLI Premium | | $ | 2,926 | | | $ | 2,908 | | | $ | 2,181 | |
| Total Life Insurance Premiums | | $ | 17,766 | | | $ | 17,134 | | | $ | 11,827 | |
| | | | | | | | | | | | | |
| Fixed Annuity Premium | | $ | 3,098 | | | $ | 7,376 | | | $ | 9,519 | |
| Variable Annuity Premium | | | 0 | | | | 0 | | | | 0 | |
| Total Annuity Premiums | | $ | 3,098 | | | $ | 7,376 | | | $ | 9,519 | |
Source: Internal Financial Reports
RP Financial, LC.
Page 1.7
Table 1.2 below shows the number of policies by type of policy as of the end of the last two fiscal years and as of September 30, 2017 which reflects the historical focus on writing whole life insurance policies.
Table 1.2
Federal Life Insurance Company
Number of Policies by Type
| | | | | | | | | Nine Months | |
| | | Fiscal Year Ended | | | Ended | |
| | | 12/31/2015 | | | 12/31/2016 | | | 9/30/2017 | |
| Whole life | | | 18,901 | | | | 18,710 | | | | 18,270 | |
| Term life | | | 9,180 | | | | 9,080 | | | | 9,016 | |
| Group life | | | 1,146 | | | | 1,079 | | | | 1,034 | |
| FEGLI | | | 4,929 | | | | 4,422 | | | | 4,422 | |
| Fixed annuities | | | 1,740 | | | | 1,773 | | | | 1,840 | |
| Variable annuities | | | 176 | | | | 149 | | | | 142 | |
| Total | | | 36,072 | | | | 35,213 | | | | 34,724 | |
Source: Internal Financial Reports.
Table 1.3 shows the total value of life Insurance in force by type of policy as of the end of the last two fiscal years and as of September 30, 2017.
Table 1.3
Federal Life Insurance Company
Summary of Life Insurance In Force
(Dollars in Thousands)
| | | As of the Fiscal Year Ended | | | As of | |
| | | 12/31/2015 | | | 12/31/2016 | | | 9/30/2017 | |
| Whole Life | | $ | 721,213 | | | $ | 719,135 | | | $ | 705,797 | |
| Term Life | | | 1,026,524 | | | | 1,019,717 | | | | 1,007,992 | |
| FEGLI | | | 624,615 | | | | 559,752 | | | | 559,752 | |
| Total | | $ | 2,372,352 | | | $ | 2,298,604 | | | $ | 2,273,541 | |
Source: Internal Financial Reports.
RP Financial, LC.
Page 1.8
Marketing and Distribution
The Company historically distributed life, health and annuity products through financial institutions such as banks, mortgage companies and savings and loans. This strategy was highly successful and the Company had significant capital increases for many years creating a heavily capitalized balance sheet. Changes in the regulatory environment and the resulting consolidation of financial institutions led to the elimination of many smaller banks, mortgage companies and savings and loans. These events had the direct effect of significantly reducing new premium production for the Company and limiting balance sheet growth.
The Company made a strategic decision to emphasize the senior market in 2011 with the introduction a new single premium whole life plan. This program enabled the Company to develop relationships with many producers in the senior market who were also major producers of other products which were not being offered by the Company, including index annuities. In an effort to expand further into the senior market the Company developed an index annuity which was introduced in the 4th quarter of 2015.
Federal Life maintains a network of independent agents and agencies for distribution. The Company offers competitive commission schedules and personalized sales training and development programs. The Company is currently upgrading its digital distribution and service system to enhance the sales process for contracted agents. Currently, Federal Life maintains relationships with approximately 1,000 independent agents, with a compensation system structured to encourage production and long-term persistency. Agents receive commissions for new life insurance and annuity sales and renewal commissions on premium payments in subsequent years. Production bonuses are paid based on the premium level of new life business written each quarter and the persistency of the business written by the agent. (Persistency is a commonly used industry benchmark that gauges business quality based on the consistency of premium payments.)
Table 1.4 below reflects that while Federal Life has a concentration of agents and premium income derived from Illinois residents (42.5% of total premiums year-to-date through September 30, 2017), the agent network is widely dispersed and more than one-half of the premium income is derived from out-of-state policyholders.
RP Financial, LC.
Page 1.9
Table 1.4
Geographic Distribution of Premium Income
As of September 30, 2017
(Dollars in Thousands)
| | | Life | | | | | | Accident & | | | | | | | |
| | | Insurance | | | Annuity | | | Health | | | | | | | |
| State | | Premiums | | | Considerations | | | Premiums | | | Total | |
| | | ($000) | | | ($000) | | | ($000) | | | ($000) | | | (%) | |
| | | | | | | | | | | | | | | | |
| Illinois | | $ | 3,436 | | | $ | 4,752 | | | $ | 24 | | | $ | 8,212 | | | | 42.5 | % |
| Ohio | | | 253 | | | | 1,790 | | | | 1 | | | | 2,044 | | | | 10.6 | % |
| Michigan | | | 251 | | | | 1,567 | | | | 1 | | | | 1,819 | | | | 9.4 | % |
| California | | | 1,468 | | | | 22 | | | | 13 | | | | 1,503 | | | | 7.8 | % |
| Florida | | | 755 | | | | 428 | | | | 10 | | | | 1,193 | | | | 6.2 | % |
| Wisconsin | | | 494 | | | | 376 | | | | 17 | | | | 887 | | | | 4.6 | % |
| Texas | | | 804 | | | | 30 | | | | 3 | | | | 837 | | | | 4.3 | % |
| New Jersey | | | 300 | | | | 303 | | | | 3 | | | | 605 | | | | 3.1 | % |
| Pennsylvania | | | 263 | | | | 3 | | | | 4 | | | | 270 | | | | 1.4 | % |
| Georgia | | | 229 | | | | 9 | | | | 3 | | | | 242 | | | | 1.3 | % |
| All Other States | | | 1,470 | | | | 239 | | | | 15 | | | | 1,724 | | | | 8.9 | % |
| Total | | $ | 9,723 | | | $ | 9,519 | | | $ | 95 | | | $ | 19,336 | | | | 100.0 | % |
Source: Internal financial reports.
RP Financial, LC.
Page 1.10
Underwriting
Federal Life follows industry underwriting standards and procedures, designed to assess, qualify, and rate life applicants before issuing the policies. To implement these procedures, the Company employs an experienced underwriting staff.
The underwriting process involves a multi-step review process for each application, which is supported by any required testing and records, including: blood, urine, or oral fluid testing, paramedical/physicians’ examinations, and/or motor vehicle, pharmacological, and medical inspection reports and records. The Company’s non-medical limit is $150,000, which means that blood and urine testing is generally required for face amounts exceeding that amount. Other factors may affect table and premium rates, such as the proposed insured’s tobacco/nicotine use. Tobacco/nicotine use within the 2-year period prior to application may result in a higher mortality charge. Additional underwriting requirements and inspection reports may be required when the face amount of the policy and/or the age of the proposed insured increases. Based on the results of these tests, Federal Life may adjust the mortality charge or decline coverage completely.
Reinsurance
Federal Life reinsures a portion of its life insurance exposure with unaffiliated insurance companies under traditional indemnity reinsurance agreements, which assists in diversifying risk and limiting its maximum loss on risks that exceed the Company’s policy retention limits. The current maximum retention limit on an insured’s life is $250,000. New sales of life products are reinsured above prescribed limits and do not require the reinsurer’s prior approval within certain guidelines.
Reinsurance contracts do not fully discharge Federal Life’s obligation to pay claims on the reinsured business. As the ceding insurer, Federal Life remains responsible for policy claims to the extent the reinsurer fails to pay claims. No reinsurer of business ceded by Federal Life has failed to pay any material policy claims (either individually or in the aggregate) with respect to the ceded business. The management of Federal Life continually evaluates the financial strength of its reinsurers and monitors concentrations of credit risk. If for any reason reinsurance coverages would need to be replaced, Federal Life believes that replacement coverages from financially responsible reinsurers would be available.
Table 1.5 below reflects that the majority of the reinsurance has been placed with Optimum Re, Inc.
RP Financial, LC.
Page 1.11
Table 1.5
Federal Life Insurance Company
Reinsurance Ceded By Reinsurer
| | | 9/30/2017 | |
| | | Amount Ceded | | | Reserve Ceded | |
| | | ($000) | | | ($000) | |
| Swiss RE (Cigna) | | $ | 57 | | | $ | 1 | |
| Optimum RE (LNL) | | | 4 | | | | 1 | |
| Optimum RE | | | 645,804 | | | | 2,035 | |
| Swiss RE | | | 238 | | | | 5 | |
| Prudential | | | 799 | | | | 3 | |
| SCOR | | | 37,742 | | | | 448 | |
| Total | | $ | 684,644 | | | $ | 2,493 | |
Source: Internal Financial Reports.
Claims Management
Federal Life processed approximately $7.9 million and $7.7 million of life insurance benefit claims in the fiscal year ended December 31, 2016 and the nine months ended September 30, 2017, on policies underwritten by the Company. The Company provides a high level of customer service and is committed to paying all valid claims. The claim may be reported by an agent, a beneficiary, an interested party, or in the case of a qualifying disability or terminal illness, the policyholder. Claims may also be initiated by us as a result of a search of the Social Security Death Master File or other database. Through the claims administration system, Federal Life records, processes and pays the appropriate benefit for any reported claim. The claims administrative staff orders medical and investigative reports from third-party providers. The claims administrative staff determines the benefit payable based upon the Cyberlife system, calculations from the Actuarial Department, and other amounts such as post mortem interest. The claims administrative staff reports and recovers reinsurance payments from the appropriate reinsurance providers.
The Company as an Illinois domestic insurer regularly consults the Social Security Administration’s Death Master File (“Death Master File”) in accordance with applicable state requirements. These processes help identify potential deceased insureds for whom claims have not been presented in the normal course of business. If unreported deaths are identified, Federal Life determines the validity of claims, locates beneficiaries, and pays benefits accordingly.
RP Financial, LC.
Page 1.12
Executive Officers
Federal Life is managed by an experienced group of executives led by Joseph D. Austin, Chief Executive Officer and Chairman of the Board and William S. Austin, its President and Chief Operating Officer (“COO”). Current management has longstanding experience both at Federal Life and within the insurance industry. Summary biographies of the Company’s executive officers are included below:
Joseph D. Austin has been employed with the Company since 1972 and a member of the Board of Directors since 1973. He was elected Chairman of the Board, President and Chief Executive Officer in June 1977. Since 2002 he has served as Chairman of the Board and Chief Executive Officer. Mr. Austin holds a B.A. degree from the University of Scranton and is a Fellow of the Society of Actuaries and a Member of the American Academy of Actuaries. Prior to joining Federal Life, Mr. Austin served in actuarial, administrative and marketing positions and on the Board of Directors of several other life insurance companies as well as serving as an expert consultant to the U.S. Post Office Department.
William S. Austin has been employed with the Company since 1990 and a member of the Board of Directors since 1992. He has served as President and Chief Operating Officer since 2002. Mr. Austin is a graduate of Marquette University and has an M.B.A. degree in Finance, Investments and Banking from the University of Wisconsin-Madison. Mr. Austin is a Chartered Life Underwriter and a member of the Society of Financial Services Professionals.
Michael Austin has been employed with the Company since 1982 and a member of the Board of Directors since 1992. He has served as Executive Vice President and Chief Marketing Officer since 2000. Mr. Austin attended Western Illinois University. He holds a FINRA Series 6 and Broker-Dealer Agency license with FED Mutual Financial Services, Inc. (a subsidiary of Federal Life Insurance Company) and also holds a producer's license for life and casualty insurance in the State of Illinois. Mr. Austin is responsible for marketing of the Company.
Anders Raaum has been employed with the Company since 1994 and has served as Chief Financial Officer since 2011. Mr. Raaum has a B.A. degree in Business Administration from the University of Oregon and an M.B.A. degree in Finance, Investments and Banking from the University of Wisconsin-Madison and is a Chartered Financial Analyst and a Chartered Life Underwriter. He is also a registered FINRA Full Registration/General Securities Representative and a General Securities Principal with FED Mutual Financial Services, Inc. (a subsidiary of Federal Life Insurance Company. Mr. Raaum is responsible for overseeing the invested assets of Federal Life and well as all accounting functions and regulatory reporting for the Company.
Paul R. Murphy has been employed with the Company since 2002 as its Actuary. He has a B.S. degree in Mathematics Education and a Master of Science degree in Mathematics from the University of Illinois and is a Fellow of the Society of Actuaries, a Member of the American Academy of Actuaries and a Fellow of the Life Management Institute. Mr. Murphy is responsible for actuarial functions for Federal Life and serves as the Appointed Actuary and Illustration Actuary for the Company.
RP Financial, LC.
Page 1.13
Plan of Conversion
As a mutual insurance holding company, FLMHC does not have shareholders. It has members. The members of the FLMHC are the policyholders of Federal Life. On March 8, 2018, the Board of Directors of the FLMHC unanimously adopted the Plan of Conversion, subject to the approval of the Illinois Department of Insurance and the members of FLMHC.
The Plan of Conversion provides for the conversion of Federal Life Mutual Holding Company, a mutual holding company organized under the laws of Illinois (such entity, both before and after the Conversion, being referred to as “FLMHC”), from a mutual holding company into a stock company, and the issuance by FLMHC of newly-issued shares of common stock of FLMHC to FLG pursuant to the Illinois Insurance Code. The Plan of Conversion provides that FLG will offer shares of its common stock for sale in a subscription offering to eligible members of FLMHC, and the directors, officers, and employees of FLMHC. In addition, the Company may elect to offer the shares of common stock not subscribed for in the subscription offering, if any, for sale in a community offering commencing during or upon completion of the subscription offering and in a subsequent syndicated community offering. An identified standby investor, Insurance Capital Group, LLC. (“ICG”) has entered into a Standby Purchase Agreement (the “Agreement”), to purchase in the community offering all unsold shares in the offering up to at least the minimum of the valuation range subject to certain restrictions on their acquisition, sale, and voting of the common stock.
Upon completion of the Conversion, all of the outstanding shares of common stock of FLMHC will be issued to FLG. FLG will be the first-tier parent of FLMHC which will wholly-own Federal Life. The Conversion will be effected only if the orders received in the subscription and community offerings equal or exceed at least the minimum of the Valuation Range and the members of the MHC approve the Plan of Conversion. The Conversion will be accounted for as a simultaneous reorganization, recapitalization, and share offering that will not change the historical accounting basis of FLMHC’s consolidated financial statements.
After paying its expenses and commissions related to the Conversion, FLG will retain a majority of the proceeds of the Offering after downstreaming $12.5 million of the proceeds to Federal Life. The net proceeds infused into Federal Life will supply additional capital that Federal Life needs to support future premium growth, including the expansion of the Company’s producer networks and the marketing of its products. On a short-term basis, the net proceeds will be invested primarily in U.S. Government securities, other federal agency securities, and other corporate and asset-backed securities consistent with the Company’s investment policy.
RP Financial, LC.
Page 1.14
The principal purpose of the Conversion as articulated in the Plan is to create a stock holding company to enhance its strategic and financial flexibility and to provide the Eligible Members with the right to acquire an equity interest in FLG. The Board has indicated its belief that the additional capital resulting from the Conversion would result in the following:
| · | Support further organic growth in life insurance premiums written and annuity deposits; |
| · | Provide the capital necessary to permit increased sales of life insurance and annuities by Federal Life; |
| · | Enable FLG to attract institutional investors and engage in strategic transactions advantageous to FLG and its subsidiaries; and |
| · | The Board further believes that the transaction is fair and equitable, is consistent with the purpose and intent of Section 59.1 and will not prejudice the interests of the Members. |
Financial Overview
This valuation analysis is based on Federal Life’s historical financial statements and operations up through September 30, 2017. The financial data presentation for Federal Life in the tables below and incorporated by reference in Exhibit I-1 is based on United States generally accepted accounting principles (“GAAP”). Statutory financial data for Federal Life is included in Exhibit I-2 to provide a more lengthy presentation of the Company’s operating trends, notwithstanding the significant differences between GAAP and the statutory financial presentation. Table 1.6 presents Federal Life’s balance sheet for the fiscal years ended December 31, 2015 and 2016, and as of September 30, 2017, presented in accordance with GAAP.
Growth Trends
The Company balance sheet has remained relatively stable reflecting limited change in Federal’s Life’s operations as the Company has restricted growth in the face of on-going operating losses. Fixed maturity investment securities, which comprise the majority of the asset base, increased from $173.2 million as of December 31, 2015, to $182.9 million as of September 30, 2017, which was partially offset by a reduction in equity securities from $10.2 million as of December 31, 2015, to $7.5 million as of September 30, 2017. The remaining balance of non- invested assets, consisted of various insurance and non-insurance related accruals, the largest of which were deferred policy acquisition costs and assets held in separate accounts, both of which increased modestly through the one and three-quarter year period ended September 30, 2017.
RP Financial, LC.
Page 1.15
Table 1.6
Federal Life Insurance Company
Historical Balance Sheets
| | | As of the Fiscal Year Ended December 31, | | | As of | |
| | | 2015 | | | 2016 | | | September 30, 2017 | |
| | | | | | % of | | | | | | % of | | | | | | % of | |
| | | Amount | | | Assets | | | Amount | | | Assets | | | Amount | | | Assets | |
| | | ($000) | | | (%) | | | ($000) | | | (%) | | | ($000) | | | (%) | |
| ASSETS | | | | | | | | | | | | | | | | | | | | | | | | |
| INVESTMENTS: | | | | | | | | | | | | | | | | | | | | | | | | |
| Available-for-sale | | | | | | | | | | | | | | | | | | | | | | | | |
| Fixed maturities, at fair value | | $ | 173,161 | | | | 71.87 | % | | $ | 173,102 | | | | 70.64 | % | | $ | 182,937 | | | | 71.01 | % |
| Equity securities, at fair value | | | 10,199 | | | | 4.23 | % | | | 7,927 | | | | 3.23 | % | | | 7,526 | | | | 2.92 | % |
| Policy loans | | | 10,129 | | | | 4.20 | % | | | 10,059 | | | | 4.11 | % | | | 9,937 | | | | 3.86 | % |
| Other invested assets | | | - | | | | 0.00 | % | | | 2,059 | | | | 0.84 | % | | | 2,208 | | | | 0.86 | % |
| Short-term investments | | | 4,987 | | | | 2.07 | % | | | 5,548 | | | | 2.26 | % | | | 4,868 | | | | 1.89 | % |
| Total investments | | $ | 198,476 | | | | 82.37 | % | | $ | 198,695 | | | | 81.09 | % | | $ | 207,476 | | | | 80.53 | % |
| | | | | | | | | | | | | | | | | | | | | | | | | |
| OTHER ASSETS: | | | | | | | | | | | | | | | | | | | | | | | | |
| Cash | | $ | 1,567 | | | | 0.65 | % | | $ | 2,719 | | | | 1.11 | % | | $ | 1,602 | | | | 0.62 | % |
| Real Estate | | | 1,882 | | | | 0.78 | % | | | 1,987 | | | | 0.81 | % | | | 1,915 | | | | 0.74 | % |
| Accrued investment income | | | 1,951 | | | | 0.81 | % | | | 1,827 | | | | 0.75 | % | | | 1,905 | | | | 0.74 | % |
| Accounts receivable | | | 552 | | | | 0.23 | % | | | 575 | | | | 0.23 | % | | | 2,722 | | | | 1.06 | % |
| Reinsurance recoverable | | | 411 | | | | 0.17 | % | | | 3,526 | | | | 1.44 | % | | | 3,680 | | | | 1.43 | % |
| Prepaid reinsurance premiums | | | 103 | | | | 0.04 | % | | | 924 | | | | 0.38 | % | | | 1,097 | | | | 0.43 | % |
| Deferred policy acquisition costs, net | | | 11,605 | | | | 4.82 | % | | | 11,938 | | | | 4.87 | % | | | 12,048 | | | | 4.68 | % |
| Deferred sales inducement costs | | | 13 | | | | 0.01 | % | | | 314 | | | | 0.13 | % | | | 754 | | | | 0.29 | % |
| Income taxes recoverable | | | - | | | | 0.00 | % | | | - | | | | 0.00 | % | | | - | | | | 0.00 | % |
| Deferred tax asset | | | 487 | | | | 0.20 | % | | | 457 | | | | 0.19 | % | | | 460 | | | | 0.18 | % |
| Property and equipment | | | 343 | | | | 0.14 | % | | | 310 | | | | 0.13 | % | | | 229 | | | | 0.09 | % |
| Other Assets | | | 227 | | | | 0.09 | % | | | 254 | | | | 0.10 | % | | | 196 | | | | 0.08 | % |
| Assets held in separate accounts | | | 23,335 | | | | 9.68 | % | | | 21,513 | | | | 8.78 | % | | | 23,554 | | | | 9.14 | % |
| TOTAL ASSETS | | $ | 240,952 | | | | 100.00 | % | | $ | 245,039 | | | | 100.00 | % | | $ | 257,638 | | | | 100.00 | % |
| | | | | | | | | | | | | | | | | | | | | | | | | |
| LIABILITIES & EQUITY | | | | | | | | | | | | | | | | | | | | | | | | |
| LIABILITIES: | | | | | | | | | | | | | | | | | | | | | | | | |
| Policy liabilities and accruals: | | | | | | | | | | | | | | | | | | | | | | | | |
| Policyholder account balance | | $ | 94,691 | | | | 39.30 | % | | $ | 99,440 | | | | 40.58 | % | | $ | 107,090 | | | | 41.57 | % |
| Future life policy benefits | | | 72,760 | | | | 30.20 | % | | | 73,097 | | | | 29.83 | % | | | 72,155 | | | | 28.01 | % |
| Future life and accident and health policy benefits | | | 146 | | | | 0.06 | % | | | 90 | | | | 0.04 | % | | | 89 | | | | 0.03 | % |
| Resrve for deposit type contracts | | | 10,039 | | | | 4.17 | % | | | 10,529 | | | | 4.30 | % | | | 10,726 | | | | 4.16 | % |
| Other policyholder funds | | | 1,806 | | | | 0.75 | % | | | 1,889 | | | | 0.77 | % | | | 5,243 | | | | 2.04 | % |
| Unearned premium | | | 1,234 | | | | 0.51 | % | | | 1,396 | | | | 0.57 | % | | | 1,383 | | | | 0.54 | % |
| Taxes payable | | | 64 | | | | 0.03 | % | | | 5 | | | | 0.00 | % | | | 5 | | | | 0.00 | % |
| Deferrred tax liability | | | 5 | | | | 0.00 | % | | | 6 | | | | 0.00 | % | | | 7 | | | | 0.00 | % |
| Other liabilities | | | 1,380 | | | | 0.57 | % | | | 1,137 | | | | 0.46 | % | | | 1,145 | | | | 0.44 | % |
| Separate accounts | | | 23,335 | | | | 9.68 | % | | | 21,513 | | | | 8.78 | % | | | 23,554 | | | | 9.14 | % |
| | | | | | | | | | | | | | | | | | | | | | | | | |
| TOTAL LIABILITIES | | $ | 205,460 | | | | 85.27 | % | | $ | 209,102 | | | | 85.33 | % | | $ | 221,397 | | | | 85.93 | % |
| | | | | | | | | | | | | | | | | | | | | | | | | |
| Equity | | | | | | | | | | | | | | | | | | | | | | | | |
| Common stock | | $ | 0 | | | | 0.00 | % | | $ | 2,500 | | | | 1.02 | % | | $ | 2,500 | | | | 0.97 | % |
| Retained earnings | | $ | 29,576 | | | | 12.27 | % | | $ | 27,924 | | | | 11.40 | % | | $ | 26,779 | | | | 10.39 | % |
| Accumulated other comprehensive income | | | 5,916 | | | | 2.46 | % | | | 5,513 | | | | 2.25 | % | | | 6,962 | | | | 2.70 | % |
| | | | | | | | | | | | | | | | | | | | | | | | | |
| TOTAL EQUITY | | $ | 35,492 | | | | 14.73 | % | | $ | 35,937 | | | | 14.67 | % | | $ | 36,241 | | | | 14.07 | % |
| | | | | | | | | | | | | | | | | | | | | | | | | |
| TOTAL LIABILITIES & EQUITY | | $ | 240,952 | | | | 100.00 | % | | $ | 245,039 | | | | 100.00 | % | | $ | 257,638 | | | | 100.00 | % |
Source: Federal Life's and subsidiaries unaudited GAAP adjusted financial statements.
RP Financial, LC.
Page 1.16
Liabilities have remained between 85% and 86% of assets since the end of fiscal 2015. Policyholder account balances have increased reflecting in part, the normal variances typically observed in the accounts. Other liabilities including reserves for future policy benefits and liabilities related to annuities sold remained relatively stable.
Total equity remained relatively stable since the end of fiscal 2015 as retained earnings diminished because of the ongoing operating losses as well as the mutual holding company restructuring which resulted in the upstreaming of capital to the MHC which was subsequently down streamed to the Company as a credit to common stock. Stability of the capital base in the face of operating losses reported by Federal Life was supported by increases in the value of the investment portfolio, which positively impacted the balance of accumulated other comprehensive income (“AOCI”).
The following discussion addresses the major balance sheet items in terms of characteristics, composition and trends.
Investment Securities
Investment decisions for the fixed income portfolio are made by management. Investment management advisory services are provided by Deutsche Asset Management (“Deutsche”) with respect to structured products such as residential mortgage backed securities, commercial mortgage backed securities, asset backed securities, and non-investment grade corporate bonds. Deutsche Asset Management is a leading global asset manager that offers investment services across all asset classes to a variety of individual and institutional clients, including insurance companies. Investment purchases and sales for the defined sectors are made by Deutsche within the parameters established by the Company’s investment guidelines and with prior notification of the Company’s management team. Other investments, primarily exchange traded stock fund investments (“ETFs”), are managed by the Company’s senior management with the assistance of Alley Company, LLC.
RP Financial, LC.
Page 1.17
Federal Life’s investment policy is conservative and has placed primary emphasis on capital preservation and the maintenance of liquidity appropriate for the current and long-term requirements of the Company. The Company’s primary investment objective is to earn a sustainable positive risk-adjusted, after-tax total rate of return on invested assets. Specifically, the structure and composition of the portfolio will seek to complement all aspects of the insurance operations including, but not limited to, liquidity requirements, cash flow, taxation, risk tolerance, and the applicable regulatory directives governing investment activity. The process of policy implementation is meant to be flexible so that the assets of the Company can be invested in a prudent manner under any normal business cycle or market condition which can be reasonably anticipated.
In conforming with the Company’s investment policy, fixed income securities must be rated BB- or higher by Standard & and Poor’s at the time of purchase, with such securities subject to issuer specific limitations by rating category, and overall limitations on investment amounts by rating category. There are various other requirements with respect to management of the investment portfolio detailed in the investment policy pertaining to issuer diversification, sector limitations, etc.
The composition of the investment portfolio is set forth below as of September 30, 2017. As reflected in the data, more than 80% of the portfolio is comprised of corporate and mortgage-backed securities. The average yield and duration of the portfolio as of September 30, 2017, was 3.11% and 6.24 years, respectively.
| Type | | Market
Value | | | Market
Yield | | | Duration | | | Market Value /
Book Value | | | Unrealized
Gain / Loss | |
| ABS | | $ | 1,026 | | | | 3.46 | % | | | 3.36 | | | | 0.10 | % | | $ | 6 | |
| MBS-Commercial | | | 4,914 | | | | 3.43 | % | | | 7.02 | | | | 0.10 | % | | | (22 | ) |
| MBS-Residential | | | 39,107 | | | | 3.25 | % | | | 9.07 | | | | 0.10 | % | | | 1,487 | |
| Municipal | | | 16,846 | | | | 3.23 | % | | | 7.24 | | | | 0.10 | % | | | 763 | |
| Corporate | | | 109,694 | | | | 3.02 | % | | | 5.24 | | | | 0.10 | % | | | 3,565 | |
| Government Agy | | | 8,933 | | | | 3.39 | % | | | 4.38 | | | | 0.10 | % | | | (65 | ) |
| U. S. Treasury | | | 2,417 | | | | 2.03 | % | | | 6.07 | | | | 0.11 | % | | | 213 | |
| Total Bonds | | $ | 182,937 | | | | 3.11 | % | | | 6.24 | | | | 0.10 | % | | $ | 5,946 | |
RP Financial, LC.
Page 1.18
Historically, fixed-income investments have accounted for the majority of the Company’s investments portfolio. As of September 30, 2017, the was a small balance of equity securities investments ($7.5 million or 2.92% of assets) which consisted primarily of exchange- traded funds (“ETFs”).
Other Assets
Other assets totaled $50.1 million or 19.46% of assets. The largest component of other assets is investments underlying annuities sold by Federal Life, which are held in separate accounts. Deferred policy acquisition costs are also material and reflect the commissions paid to agents on long term insurance policies which are deferred and expensed over the estimated term of the policies. The remaining balance of other assets include operating and trade related accounts such as cash, reinsurance recoverables, prepaid reinsurance premiums and accounts receivable. These balances fluctuate based on typical fluctuations in the Company’s insurance business and internal operations.
Policyholder Account Balances and Policy Benefits
The majority of the Company’s liabilities are comprised of obligations to policyholders. In this regard, policyholder account balances representing the cash surrender value of the policies, totaled $107.1 million, or 41.57% of assets, as of September 30, 2017. Reserves for future life insurance benefits of policy holders was also material, totaling $72.2 million, equal to 28.01% of total assets.
Other Liabilities
Other liabilities consisted primarily of reserves for deposit-type contracts and liabilities for funds due to annuity holders. The remaining balance of other liabilities include operating and trade related accounts such as liabilities for separate accounts, policyholder funds and various accrued liabilities. These balances fluctuate based on typical fluctuations in the Company’s insurance business and internal operations.
Equity
The balance of GAAP equity has remained relatively stable in a range of $35.5 million to $36.2 million since December 31, 2015. A portion of retained earnings was reallocated as a result of the MHC reorganization to common stock while AOCI has increased to offset the impact of operating losses. The conversion and issuance of stock will substantially bolster the Company’s capital position and provide the capital resources required for the Company to implement a growth oriented business plan. In this regard, the infusion of the conversion proceeds will bolster the Company’s capital resources on both a GAAP and statutory basis.
RP Financial, LC.
Page 1.19
Income and Expense Trends
The Company has been reporting operating losses on a GAAP basis for more than a decade, which management attributes to a high level of competition in the traditional markets for life insurance and annuity products. Specifically, Federal Life’s small size and resulting high cost structure have resulted in operating losses for the last decade. Moreover, the erosion of the statutory surplus has eroded the ability to introduce products and services which, while entailing a significant upfront cost to develop and market, could provide enhanced revenues and earnings over the long term. Additionally, the low interest rate environment has diminished net investment income on investment assets used to provide guaranteed benefits to policyholders.
The Company’s losses are reflected in Table 1.7, which provides historical income statements for fiscal 2016 and for the nine months ended September 30, 2017. The ratios presented reflect revenues and expenses as a percent of both average assets and revenues for the periods depicted, with the ratios expressed as a percent of asset reflecting annualized nine month results for the period ended September 30, 2017.
Overall, the Company reported a loss equal to $2.0 million in fiscal 2016, and $1.1 million for the nine months ended September 30, 2017. The fiscal 2016 loss equaled 0.81 percent of assets and 7.7 percent of revenues. Over the nine months ended September 30, 2017, losses equaled 0.56 percent of assets on an annualized basis and 6.2% of revenues for the corresponding period.
Net Premiums Earned
Premiums on life insurance policies comprise the largest component of revenues, and equaled $14.9 million (58.03% of revenues) in fiscal 2016 and $9.7 million (54.3% of revenues) for the first nine months of fiscal 2017. The substantial majority of the Company’s premium revenues is derived through the sale of Federal Life’s insurance and annuity products.
RP Financial, LC.
Page 1.20
Table 1.7
Federal Life Insurance Company
Historical Income Statements as a Percent of Average Assets
| | | For the Fiscal Year Ended | | | For the Nine Months Ended | |
| | | December 31, 2016 | | | September 30, 2017 | |
| | | | | | % of Avg | | | % of | | | | | | % of Avg. | | | % of | |
| | | Amount | | | Assets | | | Revenues | | | Amount | | | Assets (1) | | | Revenues | |
| | | ($000) | | | (%) | | | (%) | | | ($000) | | | (%) | | | (%) | |
| | | | | | | | | | | | | | | | | | | |
| REVENUES: | | | | | | | | | | | | | | | | | | | | | | | | |
| Premiums | | $ | 14,879 | | | | 6.12 | % | | | 58.03 | % | | $ | 9,698 | | | | 4.86 | % | | | 54.30 | % |
| Net investment income | | | 8,797 | | | | 3.62 | % | | | 34.31 | % | | | 6,326 | | | | 3.17 | % | | | 35.42 | % |
| Net realized capital gains | | | 1,783 | | | | 0.73 | % | | | 6.95 | % | | | 1,697 | | | | 0.85 | % | | | 9.50 | % |
| Miscellaneous income | | | 179 | | | | 0.07 | % | | | 0.70 | % | | | 138 | | | | 0.07 | % | | | 0.77 | % |
| | | | | | | | | | | | | | | | | | | | | | | | | |
| Total revenues | | $ | 25,638 | | | | 10.55 | % | | | 100.00 | % | | $ | 17,859 | | | | 8.94 | % | | | 100.00 | % |
| | | | | | | | | | | | | | | | | | | | | | | | | |
| EXPENSES: | | | | | | | | | | | | | | | | | | | | | | | | |
| Policyholder benefits | | $ | 18,645 | | | | 7.67 | % | | | 72.72 | % | | $ | 12,577 | | | | 6.30 | % | | | 70.42 | % |
| Interest credited to policyholders | | | 315 | | | | 0.13 | % | | | 1.23 | % | | | 330 | | | | 0.17 | % | | | 1.85 | % |
| Operating Costs and expenses | | | 7,809 | | | | 3.21 | % | | | 30.46 | % | | | 5,441 | | | | 2.72 | % | | | 30.47 | % |
| Taxes, licenses and fees | | | 722 | | | | 0.30 | % | | | 2.82 | % | | | 554 | | | | 0.28 | % | | | 3.10 | % |
| | | | | | | | | | | | | | | | | | | | | | | | | |
| Total Benefits and Expenses | | | 27,491 | | | | 11.31 | % | | | 107.23 | % | | | 18,902 | | | | 9.46 | % | | | 105.84 | % |
| | | | | | | | | | | | | | | | | | | | | | | | | |
| INCOME (LOSS) BEFORE DIVIDENDS TO POLICY HOLDERS AND INCOME TAXES | | $ | (1,853 | ) | | | -0.76 | % | | | -7.23 | % | | $ | (1,043 | ) | | | -0.52 | % | | | -5.84 | % |
| | | | | | | | | | | | | | | | | | | | | | | | | |
| DIVIDENDS TO POLICY HOLDERS | | | 86 | | | | 0.04 | % | | | 0.34 | % | | | 49 | | | | 0.02 | % | | | 0.27 | % |
| | | | | | | | | | | | | | | | | | | | | | | | | |
| INCOME (LOSS) BEFORE INCOME TAXES | | $ | (1,939 | ) | | | -0.80 | % | | | -7.56 | % | | $ | (1,092 | ) | | | -0.55 | % | | | -6.11 | % |
| | | | | | | | | | | | | | | | | | | | | | | | | |
| INCOME TAX (BENEFIT) PROVISION: | | $ | 32 | | | | 0.01 | % | | | 0.12 | % | | $ | 18 | | | | 0.01 | % | | | 0.10 | % |
| NET INCOME | | $ | (1,971 | ) | | | -0.81 | % | | | -7.69 | % | | $ | (1,110 | ) | | | -0.56 | % | | | -6.22 | % |
(1) Reflects annualized ratio.
Source: Federal Life's and subsidiaries unaudited GAAP adjusted financial statements.
RP Financial, LC.
Page 1.21
Investment Income
Investment income consists of dividends and interest earned on invested assets. As previously noted, investment income has been declining over time as the higher yielding investments have matured with the proceeds reinvested into securities with relatively low interest rates consistent with the prevailing market. Investment income equaled $8.8 million (34.3% of revenues) in fiscal 2016 and $6.3 million (35.4% of revenues) for the first nine months of fiscal 2017.
Other Income
Other income, outside of policies revenues and investment income, has been a relatively minor contributor to the earnings of the Company for the period of time shown in Table 1.7 and primarily consisted of realized capital gains on the sale of investments and other miscellaneous revenue sources.
Policyholder Benefits
Benefit expenses related to policyholder claims represent the largest component of expenses, equaling $12.6 million, or 70.4% of revenues. Life and annuity policy liabilities are developed by actuarial methods and are intended to provide, in the aggregate, reserves that are greater than, or equal to, the minimum or guaranteed policy cash values or the amounts required by law.
Operating Costs and Expenses
Operating and administrative expenses consist of the administrative expenses directly related to underwriting insurance and the ancillary activities of the Company. Federal Life has sought to limit the growth of operating expenses with the objective of stemming the recent operating losses. In this regard, the Company has reduced staffing and sought to minimize other controllable costs without impacting revenues. Additionally, the Company has held off on revenue producing initiatives, such as introducing alternative variable annuity products given their upfront costs. Operating costs and expenses totaled $7.8 million (30.5% of revenues) in fiscal 2016, and $5.4 million (30.5% of revenues) for the nine months ended September 30, 2017.
RP Financial, LC.
Page 1.22
Income Taxes
As of September 30, 2017, Federal Life had net operating loss carryforwards (“NOLs”) available to offset future taxable income totaling $28.6 million with expirations extending out for 15 years through 2032. As of September 30, 2017 the Company had a deferred tax asset (“DTA”) related to the NOL equal to $9.7 million, but only carried a net deferred tax asset of $0.5 million as an admitted asset on its balance sheet. The value of the DTA will be affected by any future changes in the corporate tax rate and could be further limited by IRS rules related to change in ownership. Management has indicated that the ability of the Company to utilize NOL’s to offset taxable income in the future might be subject to an annual “382 limitation” of approximately $0.7 million, depending on the pre-sale value of the Company. Moreover, the ability to utilize the NOLs will be subject to the Company’s plans to implement a growth oriented business plan and generate taxable income.
Potential Off Balance Sheet Value
The Company has several assets that management estimates may have value beyond the historical cost as reflected on the balance sheet. In this regard, Federal Life’s headquarters office in Riverwoods, Illinois had a de minimus net book value as the building was fully depreciated as of September 30, 2017. The tax value is in the range of $5.5 million, and management has indicated that the value could be higher in a market sale transaction. Alternatively, the office could be divided with a portion of the spaced leased to a tenant.
In addition to the foregoing, the Company’s wholly owned subsidiary Americana Realty Company owns mineral rights on land primarily in Texas and Oklahoma that has generated an average of approximately $875,000 in annual bonus and royalty payments over the past five years. These mineral rights have been fully depleted and have a zero book value on Americana’s balance sheet. Management believes that the sale of these mineral rights could yield significant value.
Importantly, management has indicated no current intent to undertake any of the foregoing strategies to monetize the unrealized value in the main office building or the mineral rights it owns. Additionally, some of the benefits of such unrealized values are realized through operations, in terms of the relatively low occupancy costs and revenues from the mineral rights.
RP Financial, LC.
Page 1.23
Legal Proceedings
Other than the routine legal proceedings that occur in the Company’s ordinary course of business, the Company is not involved in litigation that is expected to have a material impact on financial condition or operations.
RP Financial, LC.
Page 2.1
II. EXTERNAL ENVIRONMENT
Introduction
As the U.S. economy continues its steady post-recession recovery, the gap between small and large insurance companies is projected to widen. Many segments of the insurance industry are highly cyclical and subject to intense competition, particularly in Federal Life’s more significant markets in the Midwest and in the life and annuity insurance product segments. While life insurance ownership amongst U.S. households has increased steadily over the years, the mix has shifted towards employer-based plans in recent years, driven by population growth, reductions in unemployment and increased corporate profitability. Going forward, industry analysts expect that many life insurers will see greater demand for simple products, particularly whole life insurance, as individuals flee to greater levels of safety in today’s volatile financial environment. Another important external factor critical to Federal Life’s business is the current low interest rate environment that has caused bond yields to plummet to historical lows and limited investment income for all insurers. Other factors impacting life insurers include the changing regulatory landscape, evolving customer expectations and the looming threat of technology start-ups entering the life insurance market. In summary, the major factors that will influence Federal Life’s business during 2017-2018 include: national economic factors, customer expectations, regulatory matters, and competition. These topics are further discussed below.
National Economic Trends
Profitability for Federal Life and the life insurance industry will be significantly affected by investment returns and the strength and health of the economy, which may impact demand for insurance products. In assessing national economic trends over the past quarter, manufacturing activity decelerated in July 2017, based on readings of 56.3 and 53.9, respectively. The U.S. economy added 209,000 jobs in July and the July unemployment rate fell to 4.3%. Housing starts for July declined 4.8%, while new and existing home sales also fell in July decreasing by 9.4% and 1.3%, respectively. Durable-goods orders declined 6.8% in July, which was driven by a drop in aircraft orders. Excluding aircraft orders, July durable-goods orders were up 0.5%. Economic activity in the manufacturing and service sectors expanded at faster rates in August, based on respective readings of 58.8 and 55.3. The U.S. economy added 156,000 jobs in August and the August unemployment rate ticked up to 4.4%. Housing data for August showed a slight slowdown compared to July, as August housing starts fell 0.8%, existing home sales slipped 1.7% and new home sales decreased 3.4%. Manufacturing activity for September reached a 13-year high, with a reading of 60.8. Similarly, the September service sector activity reading of 59.8 was a 12-year high. The U.S. economy lost 33,000 jobs in September, reflecting the impact of hurricanes Harvey and Irma. The September unemployment rate fell to a post-crisis low of 4.2%. Sales of existing homes edged up 0.7% in September, while new home sales for September surged 18.9%. Indications that the U.S. economy was gaining momentum was provided by a 2.2% increase in September durable- goods orders and GDP increased at a 3.0% annual rate in the third quarter.
RP Financial, LC.
Page 2.2
Manufacturing activity for October 2017 expanded at a slightly lower rate compared to September, with a reading of 58.7. Comparatively, service sector activity accelerated in October to a reading of 60.1, its highest reading since August 2005. The unemployment rate for October declined to a 17-year low of 4.1%, as U.S. employers added 261,000 jobs in October.
The upward trend in long-term Treasury yields continued at the start of the third quarter of 2017, which was followed by a slight decline in long-term Treasury yields in the second half of July. The Federal Reserve elected to hold rates steady following its late-July policy meeting and signaled readiness to begin shrinking its bond holdings as soon as September 2017. Following a period of relatively stable interest rates through most of August, long-term Treasury yields trended lower in late-August through the first part of September. Factors contributing to the rally in Treasury bonds included warnings from Federal Reserve officials regarding low inflation and its impact on further rate increases, as well as a flight to safe-haven investments fueled by escalating tensions between the U.S. and North Korea. Long-term Treasury yields edged higher ahead of the Federal Reserve’s September meeting. The Federal Reserve concluded its September policy meeting leaving interest rates unchanged and indicated that it was on track to raise short-term interest rates later in 2017. The upward trend in long-term Treasury yields continued through the end of the third quarter.
Strong reports for September manufacturing and service sector activity contributed to sustaining the upward trend in long-term Treasury yields at the start of the fourth quarter of 2017. Comparatively, soft inflation data contributed to a rally in Treasury bonds in mid-October. Long-term Treasury yields moved higher during the second half of October, with the 10-year Treasury yield closing above 2.4% for the time in five months. Investors preparing for the Federal Reserve to back away from years of stimulus efforts was a noted factor contributing to the rise in Treasury yields. At the start of November, the Federal Reserve concluded its policy meeting leaving its target rate unchanged as expected. Treasury yields eased lower in early- November, as the nomination of Jerome Powell as the next Federal Reserve chairman eased some investors’ fears. As of November 8, 2017, the bond equivalent yields for U.S. Treasury bonds with terms of one and ten years equaled 1.53% and 2.32%, respectively, versus comparable year ago yields of 0.71% and 1.88%. Exhibit II-2 provides historical interest rate trends.
RP Financial, LC.
Page 2.3
Based on the consensus outlook of economists surveyed by The Wall Street Journal in October 2017, GDP growth was projected to increase to 2.4% in 2018. The unemployment rate was forecasted to equal 4.2% in December 2017 and then decline slightly to equal 4.1% in June 2018. An average of 161,000 jobs were projected to be added per month during 2017. On average, the economists forecasted an increase in the federal funds rate to 1.37% in December 2017 and then increase to 1.72% in June 2018. On average, the economists forecasted that the 10-year Treasury yield would increase to 2.46% in December 2017 and then increase to 2.76% in June 2017. The surveyed economists also forecasted home prices would rise 4.8% in 2018 and housing starts would continue to trend slightly higher in 2018.
Life Insurance Trends
Since 2010, the number of Americans with life insurance coverage has increased by approximately 0.5% to 172 million or approximately 53% the U.S. population. Coverage growth over this period can be attributed to enrollment in employer-based life insurance plans, which increased by 9 million persons from 2010 through 2016 (see chart below)
RP Financial, LC.
Page 2.4
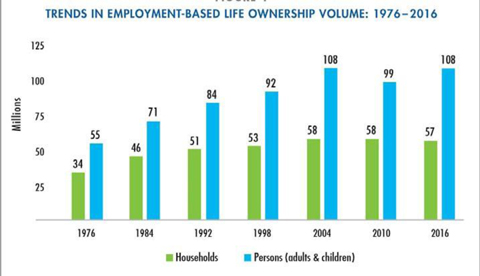
Source: LIMRA
Despite the increase in persons with life insurance coverage, coverage amounts continue to be an issue. The mean life insurance coverage amount is currently $168,000, which translates to 3.4 years of income replacement – falling short of the industry recommended 7 years of income replacement. The observed shortfall in insurance coverage amounts is due in part, to relatively low coverage limits imposed by employer-based insurance plans, and a general lack of education regarding life insurance products. Among the 102 million Americans without life insurance coverage at the end of 2016, the primary reasons for not purchasing coverage include a belief that life insurance products are too expensive, and that other financial priorities such as living expenses, establishing savings, managing debt and/or saving for retirement take precedence. In addition, more than a quarter of Americans believe that they would not qualify for insurance, with almost half of millennial respondents without insurance coverage surveyed by LIMR, stating that they have never been approached by a life insurance agent.
The confluence of the aforementioned findings highlights the market opportunity for life insurers in the U.S. According to studies by LIMRA, a financial services consulting and research organization, a consumer centric approach will be key to growth for successful life insurance underwriters, with an emphasis on education and attentive customer service. With more than half of consumers surveyed by the LIMRA, stating that they would have immediate or near immediate trouble paying living expenses if their primary wage earner died, life insurance agents must seek to counsel consumers on the benefits of life insurance as a source of income to cover final expenses, supplement wages and/or retirement income. As millennials age and establish families, their propensity for life insurance products increase accordingly. Winning the business of persons from this segment of the population, characterized by their prevalent use of smartphones and the internet, desire for transparency and instant gratification, will require higher levels of service that may include product innovation, increased focus on social media, and the use of mobile applications and online platforms.
RP Financial, LC.
Page 2.5
Technology will continue to shape the future of the industry, as innovators seek to develop new applications, thereby driving innovation and efficiencies. Industry advances include the use of artificial intelligence in process automation and underwriting decisions, in turn providing consumers with rapid policy approval. Companies leveraging enterprise data will be better positioned to drive product innovation, as such technologies will allow insurers to optimize product offerings to better suit consumer needs, in addition to generating cross-sales.
Regulatory Environment
The current regulatory environment and pending legislation have the potential to impact the life insurance industry as well as Federal Life on many different levels. The Department of Labor fiduciary rules, issued on April 2016, are changing the way in which insurance companies and their agent networks operate. The rule demands that financial professionals, specifically those recommending or soliciting retirement plans or products (defined-contribution plans, defined-benefit plans and IRAs), work in the best interest of their clients. Importantly, the fiduciary standard outlined in the rule indicates a level of accountability beyond the suitability standard previously required of agents and advisors. The suitability standard of old required that an investment recommendation be made to meet a client’s defined need and objectives. The fiduciary standard however, means that agents and advisors would be legally obligated to find and recommend the best possible investment for their clients based on their overall profile. In addition, agents or advisors seeking to continue working on commission will need to provide clients with a disclosure agreement, known as a Best Interest Contract Exemption (“BICE”), thereby clearly outlining all possible conflicts of interest that may exist, such as higher bonuses and commissions for specific product sales. In addition, all compensation received by agents or advisors must be quantified.
RP Financial, LC.
Page 2.6
The impact of the rule on the insurance industry is twofold, an increase in costs stemming from heightened compliance (the rule stipulates that BICE be supervised by a “Financial Institution”), and investment in due diligence efforts required of fiduciaries, along with a possible elimination of the commission-based compensation structure agents and advisors. Following an initial assessment of the rule, many insurance companies, have already begun moving towards a fee based compensation structure for their agents and advisors. Implementation of the rule however, has been delayed until June 2019 by the Trump Administration, to allow for a legal and economic review.
An increased national focus on cybersecurity, following several high-profile security breaches in recent months, is likely to attract government action at both the state and federal level. Recently proposed cybersecurity regulations from New York State, the Federal Reserve, the Office of the Comptroller of the Currency and the Federal Deposit Insurance Corporation serve as early indicators of the Trump Administration’s regulatory agenda. This will spell higher compliance costs for insurers, stemming from cyber risk audits, enterprise-wide training, and penetration testing, as digital transformation continues to gain hold within the industry, thereby increasing exposure to cybercrime.
Competition
Federal Life faces notable competition, including direct competition with insurers that primarily have a local, regional or national presence. The slow growth/declining population of Federal Life’s primary market area of Illinois, over the last several years has naturally had an effect on the economic and business environment, increasing competition for life insurers in the market.
Importantly the impact of the local market conditions is limited as Federal Life operates nationwide with the exception of the New England states. In addition, Federal Life, like many other life insurers, has a significant focus on annuities, a space in which many asset managers. Table 2.1 lists the largest competitors by market share in Federal Life’s top 5 markets, based on 2016 direct premiums written.
RP Financial, LC.
Page 2.7
Table 2.1
Federal Life
Market Share
| | | 2016 | | | 2016 | |
| Institution | | Rank | | | State Direct Premiums &
Annuity Considerations
($000) | | | Market Share (%) | |
| Illinois - Total Life | | | | | | | | | | | | |
| Prudential Financial Inc. (SNL Life Group) | | | 1 | | | | 1,696,732 | | | | 8.0 | |
| Massachusetts Mutl Life Ins Co (SNL Life Group) | | | 2 | | | | 1,106,999 | | | | 5.3 | |
| Northwestern Mutl Life Ins Co. (SNL Life Group) | | | 3 | | | | 912,527 | | | | 4.3 | |
| Principal Financial Group Inc. (SNL Life Group) | | | 4 | | | | 838,287 | | | | 4.0 | |
| Jackson (SNL Life Group) | | | 5 | | | | 815,382 | | | | 3.9 | |
| John Hancock (SNL Life Group) | | | 6 | | | | 802,241 | | | | 3.8 | |
| Voya Financial Inc. (SNL Life Group) | | | 7 | | | | 760,166 | | | | 3.6 | |
| New York Life (SNL Life Group) | | | 8 | | | | 727,242 | | | | 3.5 | |
| American International Group (SNL Life Group) | | | 9 | | | | 708,066 | | | | 3.4 | |
| AEGON (SNL Life Group) | | | 10 | | | | 703,337 | | | | 3.3 | |
| Federal Life Insurance Co. | | | 94 | | | | 9,906 | | | | 0.1 | |
| Total Life Premiums in Market | | | | | | | 21,100,314 | | | | | |
| | | | | | | | | | | | | |
| Ohio - Total Life | | | | | | | | | | | | |
| Western & Southern Financial (SNL Life Group) | | | 1 | | | | 3,257,094 | | | | 15.1 | |
| Prudential Financial Inc. (SNL Life Group) | | | 2 | | | | 1,130,026 | | | | 5.3 | |
| Nationwide Mutual Group (SNL Life Group) | | | 3 | | | | 1,037,672 | | | | 4.8 | |
| Voya Financial Inc. (SNL Life Group) | | | 4 | | | | 856,789 | | | | 4.0 | |
| Jackson (SNL Life Group) | | | 5 | | | | 822,454 | | | | 3.8 | |
| Massachusetts Mutl Life Ins Co (SNL Life Group) | | | 6 | | | | 729,614 | | | | 3.4 | |
| New York Life (SNL Life Group) | | | 7 | | | | 707,685 | | | | 3.3 | |
| Lincoln Financial (SNL Life Group) | | | 8 | | | | 654,177 | | | | 3.0 | |
| John Hancock (SNL Life Group) | | | 9 | | | | 619,977 | | | | 2.9 | |
| American International Group (SNL Life Group) | | | 10 | | | | 618,054 | | | | 2.9 | |
| Federal Life Insurance Co. | | | 118 | | | | 2,370 | | | | 0.0 | |
| Total Life Premiums in Market | | | | | | | 21,522,121 | | | | | |
| | | | | | | | | | | | | |
| California - Total Life | | | | | | | | | | | | |
| Prudential Financial Inc. (SNL Life Group) | | | 1 | | | | 3,986,735 | | | | 7.8 | |
| AEGON (SNL Life Group) | | | 2 | | | | 3,060,243 | | | | 6.0 | |
| New York Life (SNL Life Group) | | | 3 | | | | 2,862,496 | | | | 5.6 | |
| John Hancock (SNL Life Group) | | | 4 | | | | 2,365,467 | | | | 4.6 | |
| American International Group (SNL Life Group) | | | 5 | | | | 2,316,407 | | | | 4.5 | |
| Massachusetts Mutl Life Ins Co (SNL Life Group) | | | 6 | | | | 2,158,317 | | | | 4.2 | |
| Voya Financial Inc. (SNL Life Group) | | | 7 | | | | 2,011,980 | | | | 3.9 | |
| Jackson (SNL Life Group) | | | 8 | | | | 1,954,043 | | | | 3.8 | |
| Lincoln Financial (SNL Life Group) | | | 9 | | | | 1,925,509 | | | | 3.8 | |
| Nationwide Mutual Group (SNL Life Group) | | | 10 | | | | 1,748,029 | | | | 3.4 | |
| Federal Life Insurance Co. | | | 132 | | | | 2,003 | | | | 0.0 | |
| Total Life Premiums in Market | | | | | | | 51,315,483 | | | | | |
| | | | | | | | | | | | | |
| Florida - Total Life | | | | | | | | | | | | |
| American International Group (SNL Life Group) | | | 1 | | | | 2,115,923 | | | | 6.3 | |
| AEGON (SNL Life Group) | | | 2 | | | | 2,046,986 | | | | 6.1 | |
| Prudential Financial Inc. (SNL Life Group) | | | 3 | | | | 1,846,866 | | | | 5.5 | |
| Nationwide Mutual Group (SNL Life Group) | | | 4 | | | | 1,723,117 | | | | 5.1 | |
| Lincoln Financial (SNL Life Group) | | | 5 | | | | 1,620,467 | | | | 4.8 | |
| New York Life (SNL Life Group) | | | 6 | | | | 1,370,578 | | | | 4.1 | |
| Massachusetts Mutl Life Ins Co (SNL Life Group) | | | 7 | | | | 1,305,471 | | | | 3.9 | |
| Jackson (SNL Life Group) | | | 8 | | | | 1,225,869 | | | | 3.6 | |
| John Hancock (SNL Life Group) | | | 9 | | | | 1,209,279 | | | | 3.6 | |
| Voya Financial Inc. (SNL Life Group) | | | 10 | | | | 1,073,527 | | | | 3.2 | |
| Federal Life Insurance Co. | | | 142 | | | | 1,254 | | | | 0.0 | |
| Total Life Premiums in Market | | | | | | | 33,634,825 | | | | | |
| | | | | | | | | | | | | |
| Texas - Total Life | | | | | | | | | | | | |
| American International Group (SNL Life Group) | | | 1 | | | | 3,012,599 | | | | 9.0 | |
| New York Life (SNL Life Group) | | | 2 | | | | 1,642,642 | | | | 4.9 | |
| Prudential Financial Inc. (SNL Life Group) | | | 3 | | | | 1,368,211 | | | | 4.1 | |
| Voya Financial Inc. (SNL Life Group) | | | 4 | | | | 1,247,832 | | | | 3.7 | |
| Lincoln Financial (SNL Life Group) | | | 5 | | | | 1,234,451 | | | | 3.7 | |
| Allianz Group (SNL Life Group) | | | 6 | | | | 1,189,602 | | | | 3.6 | |
| Jackson (SNL Life Group) | | | 7 | | | | 1,160,386 | | | | 3.5 | |
| AEGON (SNL Life Group) | | | 8 | | | | 1,141,780 | | | | 3.4 | |
| John Hancock (SNL Life Group) | | | 9 | | | | 1,109,000 | | | | 3.3 | |
| Massachusetts Mutl Life Ins Co (SNL Life Group) | | | 10 | | | | 1,102,403 | | | | 3.3 | |
| Federal Life Insurance Co. | | | 168 | | | | 1,087 | | | | 0.0 | |
| Total Life Premiums in Market | | | | | | | 33,555,061 | | | | | |
RP Financial, LC.
Page 3.1
III. PEER GROUP ANALYSIS
The applicable valuation technique is the pro forma market value approach, whereby the pro forma market value of Federal Life is derived from the market pricing of a group of publicly- traded insurance companies sharing reasonably comparable characteristics. This section presents an analysis of Federal Life’s operations versus a group of comparable companies (the “Peer Group”) selected from the universe of all publicly-traded insurance companies which share reasonably comparable characteristics with the Company. Factors affecting the Company’s pro forma market value, such as financial condition and operating performance, and liquidity of the stock, can be assessed in relation to the Peer Group. Current market pricing of the Peer Group, subject to adjustments to account for fundamental differences between Federal Life and the Peer Group, will then be used as a basis for the valuation of Federal Life’s to-be- issued common stock.
Peer Group Selection
We consider the appropriate Peer Group to be of publicly-traded companies with established markets for common stock (NASDAQ, NYSE, AMEX and OTC Bulletin Board/Pink Sheets). We believe companies trading outside of these markets are frequently highly irregular in terms of frequency of trading and/or pricing and as a result, the trading activity may not be a reliable indicator of market value. We have excluded from the Peer Group those companies under acquisition and/or those companies whose market prices appear to be distorted by speculative factors or unusual operating conditions.
Ideally, the Peer Group should be comprised of similarly-sized publicly-traded insurance companies that have reasonably comparable financial characteristics and strategies as the Company. While there are many insurance companies with relatively small asset bases, smaller companies are usually not exchange-listed or are in mutual form. Thus, the peer group of publicly-traded companies selected for this analysis are generally significantly larger and more diversified than Federal Life. We also attempted to select Peer Group members whose business focus was on life insurance and annuity/savings products as these companies are subject to the same general market dynamics and pricing trends as the Company, which influences their stock prices and investor perceptions of value.
RP Financial, LC.
Page 3.2
Of the 24 companies composing the Public Life Insurance Group as of December 22, 2017, there were only seven insurers with a total market capitalization under $1 billion. The median market capitalization of the overall Public Life Insurance Group was $4.3 billion and the average size was even larger at $10.5 billion, skewed by such large and well known life insurers as MetLife, Prudential and AFLAC. We applied the following specific selection criteria and focused principally on companies with market capitalization of less than $1 billion and total assets less than $5 billion, which were thus the most comparable to Federal Life:
| · | Publicly traded – stock-form insurance company whose shares are traded on New York Stock Exchange, NYSE MKT, or NASDAQ Stock Market or in one of the over the counter markets. |
| · | Market segment – Insurance underwriter whose primary market segment is listed as life insurance by SNL Financial. |
| · | Not subject to acquisition |
| · | Operations – We sought to include companies with either modest losses or earnings on a trailing 12 month basis; and |
| · | Market capitalization – Less than $10 billion. |
Table 3.1 lists certain key characteristics of the Peer Group companies.
RP Financial, LC.
Page 3.3
Table 3.1
General Characteristics
Peer Group of Publicly-Traded Insurance Companies
| | | | | Corporate | | | | Primarily |
| Ticker | | Company | | Headquarters | | Exchange | | Lines of Business |
| | | | | | | | | |
| | | Federal Life Insurance Company | | Riverwoods, IL | | NA | | Asset Accumulation, Life |
| | | | | | | | | |
| AEL | | American Equity Investment Life Holding Company | | West Des Moines, IA | | NYSE | | Asset Accumulation, Life |
| CIA | | Citizens, Inc. | | Austin, TX | | NYSE | | Health, Life, Multi-Peril, Other P&C |
| CNO | | CNO Financial Group, Inc. | | Carmel, IN | | NYSE | | Asset Accumulation, Asset Management, Health, Life, Manage |
| FFG | | FBL Financial Group, Inc. | | West Des Moines, IA | | NYSE | | Asset Accumulation, Asset Management, Health, Life |
| IHC | | Independence Holding Company | | Stamford, CT | | NYSE | | Asset Accumulation, Health, Life, Managed Care |
| KCLI | | Kansas City Life Insurance Company | | Kansas City, MO | | OTCQX | | Accident & Health, Asset Accumulation, Life, Managed Care |
| NWLI | | National Western Life Group, Inc. | | Austin, TX | | NASDAQ | | Asset Accumulation, Life, Other L&H |
| SNFCA | | Security National Financial Corporation | | Salt Lake City, UT | | NASDAQ | | Asset Accumulation, Health, Life |
| UTGN | | UTG, Inc. | | Springfield, IL | | OTC Pink | | Asset Accumulation, Health, Life |
Source: S&P Global Market Intelligence and Federal Life's internal financials, as of September 30, 2017 for Federal Life and all other Companies.
RP Financial, LC.
Page 3.4
Table 3.1
General Characteristics
Peer Group of Publicly-Traded Insurance Companies
| | | | | | | | Trailing | | | | |
| | | | | | | | 12 Months | | | As of 12/22/2017 | |
| | | | | Total | | | Policy | | | Total | | | Common | | | Market | |
| Ticker | | Company | | Assets | | | Revenues | | | Revenues | | | Stock Price | | | Value | |
| | | | | ($Mil) | | | ($Mil) | | | ($Mil) | | | ($) | | | ($Mil) | |
| | | | | | | | | | | | | | | | | | |
| | | Federal Life Insurance Company (1) | | $ | 258 | | | $ | 13 | | | $ | 24 | | | | NA | | | | NA | |
| | | | | | | | | | | | | | | | | | | | | | | |
| AEL | | American Equity Investment Life Holding Company | | $ | 60,380 | | | $ | 230 | | | $ | 3,275 | | | $ | 32.13 | | | $ | 2,863 | |
| CIA | | Citizens, Inc. | | $ | 1,651 | | | $ | 199 | | | $ | 253 | | | $ | 7.48 | | | $ | 375 | |
| CNO | | CNO Financial Group, Inc. | | $ | 32,705 | | | $ | 2,641 | | | $ | 4,212 | | | $ | 24.87 | | | $ | 4,172 | |
| FFG | | FBL Financial Group, Inc. | | $ | 9,892 | | | $ | 311 | | | $ | 737 | | | $ | 71.80 | | | $ | 1,790 | |
| IHC | | Independence Holding Company | | $ | 1,039 | | | $ | 278 | | | $ | 317 | | | $ | 27.95 | | | $ | 415 | |
| KCLI | | Kansas City Life Insurance Company | | $ | 4,511 | | | $ | 292 | | | $ | 450 | | | $ | 45.10 | | | $ | 437 | |
| NWLI | | National Western Life Group, Inc. | | $ | 12,138 | | | $ | 181 | | | $ | 811 | | | $ | 337.03 | | | $ | 1,158 | |
| SNFCA | | Security National Financial Corporation | | $ | 1,008 | | | $ | 69 | | | $ | 288 | | | $ | 5.40 | | | $ | 82 | |
| UTGN | | UTG, Inc. | | $ | 405 | | | $ | 6 | | | $ | 21 | | | $ | 25.00 | | | $ | 83 | |
(1) Revenues are annualized nine month results.
Source: S&P Global Market Intelligence and Federal Life's internal financials, as of September 30, 2017 for Federal Life and all other Companies.
RP Financial, LC.
Page 3.5
American Equity Investment Life Holding Company (“AEL”), based in West Des Moines, IA, issues fixed annuity and life insurance products through its wholly-owned life insurance subsidiaries, American Equity Investment Life Insurance Company, American Equity Investment Life Insurance Company of New York and Eagle Life Insurance Company. AEL has one business segment which represents its core business comprised of the sale of fixed index and fixed rate annuities and AEL business strategy is focused on growing policyholder funds and earning predictable returns by managing investment spreads and investment risk. AEL is licensed to sell its annuity products in 50 states and the District of Columbia, and marketing of the products is undertaken through a variable cost distribution network including, independent agents through national marketing organizations, broker/dealers, banks and registered investment advisors.
| · | Citizens, Inc. (“CIA”) isan insurance holding company incorporated in Colorado serving the life insurance needs of individuals in the United States since 1969 and internationally since 1975. Through CIA’s insurance subsidiaries, CIA pursues a strategy of offering traditional insurance products in niche markets where its believes it is able to achieve competitive advantages. CIA’s core insurance operations include issuing and servicing: |
| · | U.S. Dollar-denominated ordinary whole life insurance and endowment policies predominantly sold to foreign residents, located principally in Latin America and the Pacific Rim, through independent marketing consultants; |
| · | Ordinary whole life insurance policies to middle income households concentrated in the Midwest, Mountain West and southern United States through independent marketing consultants; and |
| · | Final expense and limited liability property policies to middle and lower income households in Louisiana, Mississippi and Arkansas through employee and independent agents in our home service distribution channel and funeral homes |
| · | CNO Financial Group (“CNO”), based in Carmel, Indiana,is an insurance holding company. CNO’s insurance subsidiaries - principally Bankers Life and Casualty Company, Colonial Penn Life Insurance Company and Washington National Insurance Company - primarily serve middle-income pre-retiree and retired Americans by helping them protect against financial adversity and provide for a more secure retirement. CNO’s insurance subsidiaries develop, market and administer health insurance, annuity, individual life insurance and other insurance products with these products sold through three primary distribution channels: career agents, independent producers (some of whom sell one or more of our product lines exclusively) and direct marketing. CNO’s insurance subsidiaries collectively hold licenses to market our insurance products in all fifty states, the District of Columbia, and certain protectorates of the United States. |
RP Financial, LC.
Page 3.6
| · | FBL Financial Group, Inc. (“FFG”)is an insurance holding company whose primary operating subsidiary, Farm Bureau Life Insurance Company,underwrites and markets a broad range of life insurance and annuities to individuals and businesses, which are distributed by multiline exclusive Farm Bureau agents. In addition, FBL Financial Group manages all aspects of two Farm Bureau affiliated property-casualty insurance companies for a management fee. Sales through the principal distribution channels are currently conducted in 15 states. FFG’s target market is Farm Bureau members and "Middle America." FFG has traditionally have been very strong in rural and small-town markets while having a growing presence in small and mid-metro markets. The financial needs of FFG’s target market/customer tend to focus on security, insurance needs and retirement savings.FBL Financial Group, is headquartered in West Des Moines, Iowa. |
| · | Independence Holding Company (“IHC”), Stamford, CT is an insuranceholding company that is principally engaged in underwriting, administering and/or distributing group and individual specialty benefit products, including disability, supplemental health, pet, and group life insurance through its subsidiaries since 1980. The IHC Group owns three insurance companies (Standard Security Life Insurance Company of New York, Madison National Life Insurance Company, Inc. and Independence American Insurance Company), and IHC Specialty Benefits, Inc., a technology-driven insurance sales and marketing company that creates value for insurance producers, carriers and consumers (both individuals and small businesses) through a suite of proprietary tools and products (including ACA plans and small group medical stop-loss). |
| · | Kansas City Life Insurance Company (“KCLI”),was established in 1895 and is based in Kansas City, Missouri. KCLI’s primary business is providing financial protection through the sale of life insurance and annuities. Kansas City Life’s Individual Insurance segment provides financial security to consumers in 48 states. Life insurance products are distributed through two channels: the Company’s field force and through third-party marketing arrangements. The Individual Insurance segment consists of individual insurance products for both Kansas City Life and Sunset Life. Kansas City Life offers several insurance products in the Group Insurance segment, including dental, life, accident, vision, and short and long term disability. These offerings encompass both traditional, employer-funded group insurance, as well as voluntary, employee-paid products. The Group Insurance segment markets products primarily to small and mid-size organizations. Marketing is conducted through through sales representatives who target a nationwide network of independent general agents and group brokers, along with the Company’s career general agents. This sales network is this segment’s core distribution system. The Company also markets insurance products through third party alliances and marketing arrangements. |
| · | National Western Life Group, Inc. (“NWLI”) isthe insurance holding company of National Western Life Insurance Company (NWLIC). Founded in 1956, NWLIC is a stock life insurance company offering a broad portfolio of individual whole life, universal life and term insurance plans, and annuities, including supplementary riders. Products are offered to meetthe financial needs of its customers in 49 states as well as residents of various international countries. NWLIC has 277 employees and approximately 30,100 contracted independent agents, brokers, and consultants. |
RP Financial, LC.
Page 3.7
| · | Security National Financial Corporation (“SNFCA”) is based in Salt Lake City, Utah, andoperates three main business segments: life insurance, funeral service and mortgage loans. SNFCA is designed and structured so each segment relates to the others, and contributes to the profitability of the whole. For example, the cemetery and mortuary operations enjoy a high level of public awareness, assisting in the sales and marketing of SNFCA’s insurance and preneed cemetery and funeral products. Security National Life Insurance Company in turn invests its assets in high quality mortgage loans. Thus, while each segment is a stand-alone profit center, this horizontal integration is strategically planned to improve profitability. Additionally, SNFCA actively pursues growth through acquisitions of life insurance companies and mortuaries, and through expanding its mortgage operations. |
The majority of domestic sales are SNFCA’s annuities. National Western markets and distributes its domestic products primarily through independent national marketing organizations ("NMOs"). These NMOs assist the company in recruiting, contracting, and managing independent agents. International applications are submitted on behalf of their clients by independent contractors, consultants and broker-agents, many of whom have been submitting policy applications to National Western for twenty or more years.
| · | UTG, Inc (“UTGN”),a Delaware corporation, is a life insurance holding UTGN. UTGN’s dominant business is individual life insurance, which includes the servicing of existing insurance policies in force, the acquisition of other companies in the life insurance business and the administration and processing of life insurance business for other entities. UTGN’s product portfolio consists of a limited number of life insurance product offerings. All of the products are individual life insurance products, with design variations from each other to provide choices to the customer. These variations generally center around the length of the premium paying period, length of the coverage period and whether the product accumulates cash value or not. In recent years, UTGN has not placed an emphasis on new business production. Current sales primarily represent sales to existing customers through additional insurance needs or conservation efforts. The UTGN currently encourages policy retention as opposed to new sales in an attempt to maintain or improve current persistency levels. UTGN also performs administrative work as a third-party administrator (“TPA”) for unaffiliated life insurance companies seeking business process outsourcing solutions. |
RP Financial, LC.
Page 3.8
The following sections present a comparison of Federal Life’s financial condition and income and expense trends versus the latest financial data reported data by the Peer Group companies. The conclusions drawn from the comparative analysis are then factored into the valuation analysis discussed in the final chapter.
Financial Condition
Overall, the balance sheet composition of Federal Life and the Peer Group was relatively comparable (see Table 3.2). Federal Life’s financial data reflects financial data as of September 30, 2017. The Peer Group data is as of the latest available date for which information is publicly available, which is generally as of September 30, 2017, as well, and is based on their respective public company financial reports which are solely reported on a GAAP basis.
Cash and investments comprised the bulk of assets for both the Company (80.5% of assets) and the Peer Group (83.0% of assets based on the median). The Company’s and the Peer Group’s cash and investments portfolio is dominated by fixed-income securities (75% of cash and investments for the Company and 78% at the median for the Peer Group). The higher level of cash and investments for Federal Life is reflective of the Company’s focus on insurance underwriting, small size, and lower level of diversification of business into non-insurance activities.
Other assets for the Company consisted primarily of deferred policy acquisition costs and assets held in separate accounts. Likewise, the Peer Group companies had a similar composition in other assets. On balance, while the Company is very small and is much less diversified than the majority of the Peer Group members, the composition of its asset base is relatively similar.
RP Financial, LC.
Page 3.9
Table 3.2
Comparative Financial Condition Data
Federal Life Insurance Company and the Peer Group
| | | | | | | | | | | | | | | | | | | Policy | | | Cash and | | | | | | | |
| | | | | | | Total | | | Policy | | | Total | | | LTM | | | Reserves/ | | | Investments/ | | | Total Equity/ | | | Tangible Equity/ | |
| Company Name | | City, State | | Ticker | | Assets | | | Reserves | | | Equity | | | Asset Growth | | | Equity | | | Assets | | | Assets | | | Assets | |
| | | | | | | ($Mil) | | | ($Mil) | | | ($Mil) | | | (%) | | | (x) | | | (%) | | | (%) | | | (%) | |
| | | | | | | | | | | | | | | | | | | | | | | | | | | | | |
| Federal Life | | | | | | | | | | | | | | | | | | | | | | | | | | | | | | | | | | | | |
| - As of September 30, 2017 | | Riverwoods, IL | | NA | | $ | 258 | | | $ | 195 | | | $ | 36 | | | | 6.86 | % | | | 5.40 | x | | | 80.53 | % | | | 14.07 | % | | | 14.07 | % |
| | | | | | | | | | | | | | | | | | | | | | | | | | | | | | | | | | | | | |
| All Publicly Traded Life and Health Companies |
| | | | | | | | | | | | | | | | | | | | | | | | | | | | | | | | | | | | | |
| Average | | | | | | | 126,634 | | | | 63,220 | | | | 9,913 | | | | 2.13 | % | | | 6.16 | x | | | 65.58 | % | | | 15.23 | % | | | 14.37 | % |
| Median | | | | | | | 27,849 | | | | 18,522 | | | | 3,822 | | | | 1.52 | % | | | 5.21 | x | | | 74.13 | % | | | 13.81 | % | | | 13.69 | % |
| | | | | | | | | | | | | | | | | | | | | | | | | | | | | | | | | | | | | |
| Peer Group | | | | | | | | | | | | | | | | | | | | | | | | | | | | | | | | | | | | |
| Average | | | | | | $ | 13,748 | | | $ | 11,346 | | | $ | 1,373 | | | | 2.42 | % | | | 6.02 | x | | | 78.25 | % | | | 17.52 | % | | | 16.93 | % |
| Median | | | | | | $ | 4,511 | | | $ | 3,213 | | | $ | 704 | | | | 2.17 | % | | | 4.77 | x | | | 83.04 | % | | | 14.93 | % | | | 14.93 | % |
| | | | | | | | | | | | | | | | | | | | | | | | | | | | | | | | | | | | | |
| Peer Group Companies | | | | | | | | | | | | | | | | | | | | | | | | | | | | | | | | | | | | |
| | | | | | | | | | | | | | | | | | | | | | | | | | | | | | | | | | | | | |
| American Equity Investment Life Holding | | West Des Moines, IA | | AEL | | $ | 60,380 | | | $ | 55,220 | | | $ | 2,763 | | | | 8.11 | % | | | 19.99 | x | | | 83.04 | % | | | 4.58 | % | | | 4.58 | % |
| Citizens, Inc. | | Austin, TX | | CIA | | $ | 1,651 | | | $ | 1,276 | | | $ | 264 | | | | 5.42 | % | | | 4.83 | x | | | 80.55 | % | | | 16.00 | % | | | 15.06 | % |
| CNO Financial Group, Inc. | | Carmel, IN | | CNO | | $ | 32,705 | | | $ | 23,270 | | | $ | 4,882 | | | | 0.88 | % | | | 4.77 | x | | | 85.39 | % | | | 14.93 | % | | | 14.93 | % |
| FBL Financial Group, Inc. | | West Des Moines, IA | | FFG | | $ | 9,892 | | | $ | 7,576 | | | $ | 1,279 | | | | 2.31 | % | | | 5.93 | x | | | 87.47 | % | | | 12.93 | % | | | 12.84 | % |
| Independence Holding Company | | Stamford, CT | | IHC | | $ | 1,039 | | | $ | 549 | | | $ | 423 | | | | -16.92 | % | | | 1.30 | x | | | 47.87 | % | | | 40.69 | % | | | 36.69 | % |
| Kansas City Life Insurance Company | | Kansas City, MO | | KCLI | | $ | 4,511 | | | $ | 3,213 | | | $ | 704 | | | | -0.04 | % | | | 4.56 | x | | | 78.20 | % | | | 15.62 | % | | | 15.62 | % |
| National Western Life Group, Inc. | | Austin, TX | | NWLI | | $ | 12,138 | | | $ | 10,129 | | | $ | 1,803 | | | | 2.17 | % | | | 5.62 | x | | | 90.13 | % | | | 14.85 | % | | | 14.85 | % |
| Security National Financial Corporation | | Salt Lake City, UT | | SNFCA | | $ | 1,008 | | | $ | 605 | | | $ | 139 | | | | 20.34 | % | | | 4.34 | x | | | 62.86 | % | | | 13.83 | % | | | 13.59 | % |
| UTG, Inc. | | Springfield, IL | | UTGN | | $ | 405 | | | $ | 280 | | | $ | 98 | | | | -0.50 | % | | | 2.85 | x | | | 88.77 | % | | | 24.24 | % | | | 24.24 | % |
Source: S&P Global Market Intelligence and Federal Life's audited and unaudited financial statements as of September 30, 2017.
RP Financial, LC.
Page 3.10
Liabilities
Various types of policyholder-liabilities comprised the majority of liabilities for both the Company and the Peer Group. In this regard, the policy reserves, which primarily consisted of reserves for future policy benefits and the policyholder account balances (i.e., cash surrender value of whole life policies), comprised the largest segment of liabilities and totaled $195 million, or 75.8 percent of assets.
The peer Group’s policy-related reserves were $3.2 billion based on the median equal to 71.2 percent of assets. Based on the average, policy reserves totaled $11.3 billion for the Peer Group, equal to 82.5 percent of the average Peer Group assets of $13.7 billion.
Equity
Federal Life’s pre-offering equity base of 14.07% of assets as measured on a GAAP basis was modestly below the Peer Group’s median equity ratio of 14.93% of assets. Federal Life operates with no intangible assets while the Peer Group possesses a moderate level on intangibles, resulting in similar tangible equity to asset ratios for the Company and Peer Group equal to 14.1% and 14.9% based on the median. As a result of the similarity of the capital levels and the composition of liabilities, the ratios of policy reserves/equity for Federal Life, equal to 5.40x fell within the range of the Peer Group average and median equal to 6.02x and 4.77x, respectively.
As a result of the conversion offering, Federal Life’s GAAP and statutory capital ratios will be substantially bolstered to levels in excess of the Peer Group average and median ratios. The increased capitalization will facilitate the adoption of a growth-oriented business plan designed to restore the Company’s operations to profitability.
Income and Expense Components
Federal Life’s recent operating performance versus the Peer Group is reflected in Table 3.3. The earnings data for Federal Life is based on annualized GAAP financial data for the nine months ended September 30, 2017. The Peer Group’s financial data is as of or for the most recent twelve months for which data is publicly available and is based on their respective public company reports which reflect GAAP financial reporting.
RP Financial, LC.
Page 3.11
As noted in Section One of the valuation, Federal Life has been reporting operating losses in recent years which has eroded capital. Management has attributed the ongoing losses to several factors including a high level of competition in the traditional markets for life insurance and annuity products. Specifically, Federal Life’s small size and resulting high cost structure have resulted in operating losses for the last decade. Moreover, the erosion of the statutory surplus has eroded the ability to introduce products and services which, while entailing a significant upfront cost to develop and market, could provide enhanced revenues and earnings over the long term. Additionally, the low interest rate environment has diminished net investment income on investment assets used to provide guaranteed benefits to policyholders.
The Company’s small size in comparison to the Peer Group is reflected in the revenues data, including both total revenues and policy revenues. In this regard, total revenues equaled $18 million for Federal Life ($24 million on an annualized basis versus the Peer Group median of $450 million). Federal Life’s modest revenues reflect its comparatively more limited line of insurance products in comparison to the Peer Group companies.
Overall, Federal Life reported ongoing losses from operations, with a loss equal to 0.56 percent of assets on an annualized basis and a negative return on equity equal to 4.10%. In contrast, the Peer Group reported positive earnings equal to 0.62 percent of assets based on the median and 5.38 percent of equity.
Revenues
Policy revenues (i.e., net premiums earned) represented the largest revenue source for both the Company and the Peer Group, equal to 54.3% and 42.3% of total revenues, respectively, based on the median for the Peer Group. Given their focus on underwriting long term life insurance policies, investment income is significant for both the Company and the Peer Group, equal to 35.5 percent and 36.3 percent of total revenues, respectively. Accordingly, policy revenues and investment income, both of which are primarily related to the respective insurance operations of the Company and the Peer Group totaled 89.7 percent and 78.5% of revenues, respectively.
RP Financial, LC.
Page 3.12
Table 3.3
Comparative Operating Performance Data
Federal Life Insurance Company and the Peer Group
| | | | | | | | | | | | | Policy | | | | | | | | | | | | | | | | |
| | | | | | | Total | | | Policy | | | Revenues/ | | | Portfolio Rev./ | | | Policy Exp. | | | G&A Exp./ | | | | | | | |
| Company Name | | City, State | | Ticker | | Revenue | | | Revenues | | | Revenues | | | Revenues | | | Revenues | | | Revenues | | | ROAA | | | ROAE | |
| | | | | | | ($Mil) | | | ($Mil) | | | ($Mil) | | | (%) | | | (%) | | | (%) | | | (%) | | | (%) | |
| | | | | | | | | | | | | | | | | | | | | | | | | | | | | |
| Federal Life | | | | | | | | | | | | | | | | | | | | | | | | | | | | | | | | | | | | |
| - Annualized For the Nine Months Ended September 30, 2017 (1) | | Riverwoods, IL | | NA | | $ | 24 | | | $ | 13 | | | | 54.30 | % | | | 35.42 | % | | | 72.29 | % | | | 30.47 | % | | | -0.56 | % | | | -4.10 | % |
| | | | | | | | | | | | | | | | | | | | | | | | | | | | | | | | | | | | | |
| All Publicly Traded Life and Health Companies | | | | | | | | | | | | | | | | | | | | | | | | | | | | | | | | | | | | |
| Average | | | | | | $ | 9,539 | | | $ | 6,547 | | | | 58.58 | % | | | 27.91 | % | | | 57.75 | % | | | 39.46 | % | | | 1.03 | % | | | 1.61 | % |
| Median | | | | | | $ | 3,675 | | | $ | 1,784 | | | | 63.52 | % | | | 24.95 | % | | | 58.78 | % | | | 28.45 | % | | | 0.59 | % | | | 8.35 | % |
| | | | | | | | | | | | | | | | | | | | | | | | | | | | | | | | | | | | | |
| Peer Group | | | | | | | | | | | | | | | | | | | | | | | | | | | | | | | | | | | | |
| Average | | | | | | $ | 1,152 | | | $ | 468 | | | | 46.39 | % | | | 41.24 | % | | | 54.27 | % | | | 36.61 | % | | | 0.88 | % | | | 5.65 | % |
| Median | | | | | | $ | 450 | | | $ | 230 | | | | 42.26 | % | | | 36.27 | % | | | 58.66 | % | | | 32.60 | % | | | 0.62 | % | | | 5.38 | % |
| | | | | | | | | | | | | | | | | | | | | | | | | | | | | | | | | | | | | |
| Peer Group Companies | | | | | | | | | | | | | | | | | | | | | | | | | | | | | | | | | | | | |
| American Equity Investment Life Holding Company | | West Des Moines, IA | | AEL | | $ | 3,275 | | | $ | 230 | | | | 7.03 | % | | | 59.61 | % | | | 51.24 | % | | | 35.29 | % | | | 0.45 | % | | | 10.18 | % |
| Citizens, Inc. | | Austin, TX | | CIA | | $ | 253 | | | $ | 199 | | | | 78.61 | % | | | 20.85 | % | | | 65.11 | % | | | 32.60 | % | | | 0.39 | % | | | 2.42 | % |
| CNO Financial Group, Inc. | | Carmel, IN | | CNO | | $ | 4,212 | | | $ | 2,641 | | | | 62.71 | % | | | 36.27 | % | | | 58.66 | % | | | 25.57 | % | | | 1.48 | % | | | 10.36 | % |
| FBL Financial Group, Inc. | | West Des Moines, IA | | FFG | | $ | 737 | | | $ | 311 | | | | 42.26 | % | | | 55.67 | % | | | 58.90 | % | | | 20.35 | % | | | 1.16 | % | | | 9.15 | % |
| Independence Holding Company | | Stamford, CT | | IHC | | $ | 317 | | | $ | 278 | | | | 87.68 | % | | | 5.63 | % | | | 43.83 | % | | | 47.25 | % | | | 3.02 | % | | | 7.69 | % |
| Kansas City Life Insurance Company | | Kansas City, MO | | KCLI | | $ | 450 | | | $ | 292 | | | | 64.94 | % | | | 33.57 | % | | | 62.75 | % | | | 30.22 | % | | | 0.51 | % | | | 3.31 | % |
| National Western Life Group, Inc. | | Austin, TX | | NWLI | | $ | 811 | | | $ | 181 | | | | 22.34 | % | | | 75.37 | % | | | 54.77 | % | | | 27.21 | % | | | 0.79 | % | | | 5.38 | % |
| Security National Financial Corporation | | Salt Lake City, UT | | SNFCA | | $ | 288 | | | $ | 69 | | | | 24.09 | % | | | 14.42 | % | | | 21.08 | % | | | 73.80 | % | | | 0.62 | % | | | 4.39 | % |
| UTG, Inc. | | Springfield, IL | | UTGN | | $ | 21 | | | $ | 6 | | | | 27.85 | % | | | 69.77 | % | | | 72.10 | % | | | 37.18 | % | | | -0.49 | % | | | -2.06 | % |
(1) Reflects annualized 9 month result for Federal Life.
Source: S&P Global Market Intelligence and Federal Life's internal financials, for the nine months ended September 30, 2017 for Federal Life and the twelve months ended September 30, 2017 for Peers.
RP Financial, LC.
Page 3.13
Expenses
The Company operated with a relatively high level of policy expenses reflecting its small size, as policy expenses totaled 72.3 percent of revenues, which was well above the Peer Group median of 58.7 percent. Coupled with a similar level of G&A expense which totaled 30.5 percent of revenues for the Company versus a median of 32.6 percent for the Peer Group, the Company’s overhead and policy expenses totaled 102.8% of revenues, and with the ratio in excess of 100% reflective of Federal Life’s recent operating losses. In comparison, the Peer Group’s median G&A and policy expenses combined to equal 91.3 percent of revenues reflecting their generally profitable operations from underwriting life insurance and other insurance-related operations.
Taxes
As of September 30, 2017, Federal Life had net operating loss carryforwards (“NOLs”) available to offset future taxable income totaling $28.6 million with expirations extending out for 15 years through 2032. As of September 30, 2017, the Company had a deferred tax asset (“DTA”) related to the NOL equal to $9.7 million, but only carried a net deferred tax asset of $0.5 million as an admitted asset on its balance sheet. The value of the DTA will be affected by any future changes in the corporate tax rate and could be further limited by IRS rules related to change in ownership. In contrast, the majority of the Peer Group companies are in a fully taxable position. While the ability to utilize a portion of the tax loss carryforwards may benefit the Company’s future operations, the value of such tax benefits will be subject to Federal Life’s ability to reverse the recent operating losses and generate taxable income.
Summary
Based on the above analysis, RP Financial concluded that the Peer Group forms a reasonable basis for determining the pro forma market value of Federal Life. Areas where substantial differences exist will be further addressed in the valuation section to follow, which will lead to valuation adjustments.
RP Financial, LC.
Page 4.1
IV. VALUATION ANALYSIS
Introduction
This section of the valuation report presents the valuation analysis and methodology used to determine Federal Life’s estimated pro forma market value. The valuation utilizes the market value approach to value incorporating the selection of the Peer Group, fundamental and technical analysis on both the Company and the Peer Group, and determination of the Company’s pro forma market value utilizing the pro forma market value approach.
Pro Forma Approach to the Valuation
Employing the principles embodied in the pro forma market value approach, the valuation incorporates a detailed analysis based on the Peer Group, discussed in Section III, which constitutes a “fundamental analysis”. The valuation also incorporates a “technical analysis”, incorporating recently completed stock offerings of other demutualized insurance companies. It should be noted that these valuation analyses, based on either the Peer Group or recent insurance company demutualizations, cannot possibly fully account for all the market forces which impact trading activity and pricing characteristics of a stock on a given day.
The appraised value determined herein is based on the current market and operating environment for the Company and for all insurance companies. Subsequent changes in the local and national economy, the legislative and regulatory environment, the stock market, interest rates, and other external forces (such as natural disasters or major world events), which may occur from time to time (often with great unpredictability) may materially impact the market value of all insurance company stocks, including Federal Life, the market value of the stocks of life insurers, or Federal Life’s value alone.
The basis of the appraised value determined herein is that of a minority stock issuance in keeping with standard conversion valuation guidelines and the Company’s Plan of Conversion, whereby all of the shares will be issued at the same stock price. We made no valuation adjustment to account for ICG’s ownership position, which could acquire up to 80 percent of the outstanding shares.
RP Financial, LC.
Page 4.2
Valuation Analysis
The following sections summarize the key differences between the Company and the Peer Group addressed in Section III and how those differences affect the pro forma valuation. Emphasis is placed on the specific strengths and weaknesses of the Company relative to the Peer Group in such key areas as financial considerations, operating considerations, risk assessment, primary market and growth, dividends, liquidity of the shares, marketing of the issue, management, and the effect of government regulations and/or regulatory reform. We have also considered the market for insurance company stocks, in particular new issues, in evaluating the impact of the new issue market on the value of Federal Life coming to market at this time. Finally, we have considered the overall market for common stocks generally with particular focus on the market for the common stock of life insurance underwriters.
| 1. | Financial Considerations |
The financial condition of a company is an important determinant in pro forma market value, because investors typically look to such factors as liquidity, capital and balance sheet composition in assessing investment attractiveness. In assessing comparative strengths and weaknesses, we have considered the Company on a pro forma basis, that is raising the equity capital and infusing the majority of the proceeds into Federal Life. The similarities and differences in the financial condition are noted below:
| · | Balance Sheet Composition and Liquidity. Federal Life’s balance sheet composition was broadly similar to the Peer Group company’s balance sheets with a comparable level of invested assets which comprised the majority of assets for both the Company and the Peer Group. Other assets for the Company consisted primarily of deferred policy acquisition costs and assets held in separate accounts. Likewise, the Peer Group companies had a similar composition in other assets which were primarily insurance-related assets. On balance, while the Company is very small and is much less diversified than the majority of the Peer Group members, the composition of its asset base is relatively similar. |
| · | Equity Capital. The Company operates with a similar pre-offering tangible equity ratio in comparison to the Peer Group median. The Company capital position will be enhanced with the conversion as up to $12.5 million of the net conversion proceeds are infused into Federal Life to support its insurance underwriting operations. The remaining balance of the proceeds will be retained by FLG for general corporate purposes. On a pro forma basis, the Company’s tangible GAAP equity to assets ratio is projected to be in the range of 23% to 26% based on the valuation set forth herein, which will be well in excess of the Peer Group averages and medians. |
RP Financial, LC.
Page 4.3
| · | Potential Unrealized Off Balance Sheet Value. As described in Section One (Overview and Financial Analysis), the Company has several assets with significant value beyond the historical cost as reflected on the balance sheet. These may potentially include Federal Life’s headquarters office and the Company’s ownership of mineral rights on land in Texas and Oklahoma. Importantly, management has indicated no current intent to undertake any of the foregoing strategies to monetize the unrealized value in the main office building or the mineral rights it owns. Additionally, some of the benefits of such unrealized values are realized through operations, in terms of the relatively low occupancy costs and revenues from the mineral rights. It is our belief that the Peer Group companies do not have similar elements of potential unrealized value. |
| · | Potential Value of the Deferred Tax Asset (“DTA”). The Company currently has a 100% valuation allowance established against the DTA. To the extent Federal Life can utilize NOLs on a post-conversion basis, a portion of the value of the DTA may be recognized through the reversal of the valuation allowance. The Peer Group companies are generally fully taxable with regard to state and federal income taxes and thus, do not have the potential to realize such tax benefits. At the same time, any benefit which the Company may realize is contingent upon its achieving profitable operations in the future. |
On balance, we believe an upward adjustment is warranted for the Company’s higher pro forma capitalization and potential unrealized value in fixed assets and the ownership of mineral rights.
| 2. | Operating Considerations |
Earnings are a key factor in determining pro forma market value, as the level and risk characteristics of an insurance company’s earnings stream and the prospects and ability to generate future earnings heavily influence the multiple the investment community will pay for pro forma earnings. The major factors considered in the valuation are described below.
| · | Reported Profitability. Federal Life has reported operating losses since fiscal 2002 and losses equaled 0.56% of assets on an annualized basis for the nine months ended September 30, 2017, and a negative return on equity equal to 4.10%. By comparison, eight of the nine Peer Group companies reported positive net income. |
| · | Earnings Growth Potential. Several factors were considered in assessing earnings growth potential. In general, we believe that the Company’s earnings growth potential is limited in the near term due to a number of factors. |
| Ø | First, it remains a challenging investing environment to reinvest the conversion proceeds as intermediate to longer term interest rates remain near their historical lows. Accordingly, the reinvestment benefit of the proceeds will be modest initially. |
RP Financial, LC.
Page 4.4
| Ø | The conversion proceeds will provide substantial additional statutory capital with which Federal Life intends to implement a growth oriented business plan which may include the following: |
| - | The Company will be implementing a marketing plan based on the formation of strategic partnerships to improve the Company’s distribution capabilities which will enable significant growth in products that the Company identifies as having unique market opportunities. A portion of the growth is expected to be derived from the marketing of a variable annuity product. |
| - | The Standby Investor who has longstanding experience and relationships within the insurance industry is expected to facilitate the expansion. |
| - | In addition to the foregoing, the Company may seek to diversify into other financial services businesses and/or seek potential acquisition opportunities as a stock company. |
Overall, primarily in view of the history of operating losses and execution risk in the growth- oriented business plan, we concluded a significant downward valuation adjustment for the foregoing operating considerations was appropriate.
Management has indicated that it will not pay a cash dividend initially. Federal Life’s pro forma capitalization will improve the dividend paying capacity of the Company. At the same time, the post-conversion growth objectives will require earnings retention, to the extent the Company can reverse the operating losses which have eroded the Company’s capital in recent years.
A total of six out of the nine companies in the Peer Group currently pays a cash dividend, with an average dividend yield of 1.3%. On balance, we believe that in view of the stated intent that the Company will not pay a dividend coupled with the recent history of operating losses and the need to retain capital for future growth will limit the Company’s dividend paying capacity.
On balance, we have applied a downward adjustment for this factor.
| 4. | Liquidity of the Shares |
The Peer Group is by definition composed of companies that are traded in the public markets, and 7 of the nine of the Peer Group members trade on either the New York exchange or the NASDAQ system while two trade in the over the counter market. Typically, the number of shares outstanding and market capitalization provides an indication of how much liquidity there will be in a stock. The market capitalization of the Peer Group companies ranged from $82 million to $4.2 billion as of December 22, 2017, with average and median market values of $436 million and $1.3 billion, respectively. The shares issued and outstanding to shareholders of the Peer Group members ranged from approximately 3.3 to 167.8 million, with average and median shares outstanding of approximately 15.3 million and 42.1 million, respectively. The Company’s stock offering is expected to result in shares outstanding and market capitalization which will be far below the range exhibited by the Peer Group average and median, and the pro forma market capitalization at the midpoint of the offering range will be less than half of the smallest Peer Group companies. In addition, the majority of the stock will be held by the Standby Purchaser and insiders who are long term holders of the stock.
RP Financial, LC.
Page 4.5
At the same time, the Company expects that its shares will be traded on NASDAQ and there will be at least several market makers in the issue. Overall, we concluded that a downward adjustment was warranted for this factor.
Two separate markets exist for insurance company stocks: (1) the after-market for public companies in which trading activity is regular and investment decisions are made based upon financial condition, earnings, capital, ROE, dividends and prospects; and (2) the new issue market in which demutualizing insurers are evaluated based on the same factors but on a pro forma basis without the benefit of prior operations as a publicly-held company and stock trading history. Both markets were considered in the valuation of the Company’s to-be-issued stock.
The value of publicly-traded insurance company stocks, i.e., those which are listed on an exchange or on NASDAQ, is easily measurable, and is tracked by investment firms, related organizations and by electronic means. In general, the stocks of insurance companies react to market stimuli such as interest rates, inflation, perceived industry health, projected rates of economic growth, regulatory issues and stock market conditions in general.
Table 4.1 shows the recent performance of various insurance stock indexes along with broader market indexes. In terms of assessing general stock market conditions, the broad stock market rallied strongly over the last 12 months. The general market for stocks has been supported by strong underlying fundamentals. Consumer confidence hit 122.1 in December, slightly below the 17-year high set in November of 128.6, according to the Conference Board's index. Confidence has been fueled by a few factors including: the strong job market, the stock market rally and Republicans' tax reforms.
RP Financial, LC.
Page 4.6
The U.S. job market is very strong with the national unemployment rate at 4.1%, the lowest level since 2000. Job openings are abundant too as the U.S. economy has gained jobs for 86 consecutive months, the longest streak in history, according to Labor Department figures going back to 1939. Balanced growth in the global economy has also supported some U.S. employment levels in the last several years.
Strong underlying economic fundamentals have supported a surging stock market. The stock market's surge has also been another reflection of consumer confidence. The Dow ended 2017 just below 25,000 points which reflects a nearly 25 percent increase on a year over year basis. Stock market gains have been supported by corporate earnings growth and the passage of tax reform by the Republican congress in late 2017. In addition, while the Federal Reserve has raised the targeted short-term interest rates and indicated that it anticipates three rate increases in 2018, interest rates remain low by historical standards, which has also supported stock prices.
Insurance company stocks have participated in the ongoing bull market with the SNL Insurance Underwriter Index increasing by 21 percent in 2017 and by nearly 47% over the prior three years. While the performance of the Life and Health sector has lagged the broader index for all insurance underwriters, the stocks of the public life and health insurers have nonetheless participated in the broader stock market rally as indicated by appreciation of the SNL U.S. Life and Health Insurance index of 12 percent over the last year and nearly 26% over the prior three years.
RP Financial, LC.
Page 4.7
Table 4.1
Stock Market Pricing Trends
Through January 2, 2018
| | | Index | | | Percent Change | |
| | | Value | | | 1 Year | | | 3 Year | |
| SNL Insurance Indexes | | | | | | | | | | | | |
| SNL U.S. Insurance | | | 1,032.09 | | | | 20.56 | | | | 45.82 | |
| SNL U.S. Insurance Underwriter | | | 1,023.03 | | | | 20.73 | | | | 46.67 | |
| S&P 500 Insurance | | | 397.03 | | | | 12.39 | | | | 29.62 | |
| NASDAQ Insurance | | | 8,494.84 | | | | 1.69 | | | | 26.49 | |
| S&P 500 Insurance Brokers | | | 630.39 | | | | 18.96 | | | | 34.57 | |
| S&P 500 Multi-line Insurance | | | 116.38 | | | | (1.37 | ) | | | 12.78 | |
| | | | | | | | | | | | | |
| SNL Sector Indexes | | | | | | | | | | | | |
| SNL U.S. Insurance Multiline | | | 225.51 | | | | 29.87 | | | | 32.69 | |
| SNL U.S. Insurance L&H | | | 1,027.49 | | | | 11.59 | | | | 25.98 | |
| S&P 500 L&H | | | 421.66 | | | | 13.47 | | | | 25.78 | |
| SNL U.S. Insurance P&C | | | 921.77 | | | | 11.31 | | | | 32.83 | |
| S&P 500 P&C | | | 539.61 | | | | 16.97 | | | | 42.07 | |
| SNL U.S. Reinsurance | | | 1,103.46 | | | | (3.41 | ) | | | 24.27 | |
| SNL U.S. Managed Care | | | 3,296.10 | | | | 43.44 | | | | 103.47 | |
| SNL U.S. Title Insurer | | | 1,766.97 | | | | 22.77 | | | | 25.65 | |
| SNL U.S. Mortgage & Finl Guaranty | | | 103.08 | | | | 14.21 | | | | 30.78 | |
| SNL Global Reinsurance | | | 181.19 | | | | NA | | | | NA | |
| | | | | | | | | | | | | |
| SNL Asset Size Indexes | | | | | | | | | | | | |
| SNL U.S. Insurance < $250M | | | 1,258.14 | | | | 27.43 | | | | 91.45 | |
| SNL U.S. Insurance $250M-$500M | | | 641.97 | | | | 10.06 | | | | (9.12 | ) |
| SNL U.S. Insurance $500M-$1B | | | 1,072.15 | | | | 20.89 | | | | 43.90 | |
| SNL U.S. Insurance $1B-$2.5B | | | 2,094.80 | | | | 10.27 | | | | 36.99 | |
| SNL U.S. Insurance $2.5B-$10B | | | 1,290.02 | | | | 14.79 | | | | 44.69 | |
| SNL U.S. Insurance > $10B | | | 971.74 | | | | 21.10 | | | | 46.85 | |
| SNL U.S. Insurance > $1B | | | 1,063.13 | | | | 20.69 | | | | 46.64 | |
| SNL U.S. Insurance < $1B | | | 1,326.38 | | | | 21.20 | | | | 44.17 | |
| | | | | | | | | | | | | |
| SNL Market Cap Indexes | | | | | | | | | | | | |
| SNL Micro Cap U.S. Insurance | | | 261.10 | | | | (11.09 | ) | | | (26.17 | ) |
| SNL Small Cap U.S. Insurance | | | 970.41 | | | | 8.90 | | | | 20.49 | |
| SNL Mid Cap U.S. Insurance | | | 717.06 | | | | 9.19 | | | | 30.55 | |
| SNL Large Cap U.S. Insurance | | | 969.53 | | | | 24.23 | | | | 50.85 | |
| | | | | | | | | | | | | |
| Broad Market Indexes | | | | | | | | | | | | |
| DJIA | | | 24,824.01 | | | | 25.61 | | | | 39.20 | |
| S&P 500 | | | 2,695.81 | | | | 20.41 | | | | 30.98 | |
| S&P Mid-Cap | | | 1,917.36 | | | | 15.46 | | | | 32.11 | |
| S&P Small-Cap | | | 942.97 | | | | 12.53 | | | | 36.63 | |
| S&P 500 Financials | | | 463.66 | | | | 19.95 | | | | 39.07 | |
| NASDAQ | | | 7,006.90 | | | | 30.16 | | | | 48.24 | |
| NASDAQ Financial | | | 4,500.97 | | | | 12.60 | | | | 43.95 | |
Source: S&P Global Market Intelligence.
RP Financial, LC.
Page 4.8
In addition to stock market conditions for insurers in general, the new issue market for demutualizing insurers is also an important consideration in determining the Company’s pro forma market value. The new issue market is separate and distinct from the market for seasoned stock insurers in that the pricing ratios (primarily price/book and price/earnings) for demutualizing issues are computed on a pro forma basis, specifically: (1) the numerator and denominator are both impacted by the stock offering amount, unlike existing stock issues in which price change affects only the numerator; and (2) the pro forma pricing ratio incorporates assumptions regarding source and use of proceeds, effective tax rates, stock plan purchases, etc. which impact pro forma financials, whereas pricing for existing issues are based on reported financials. The distinction between pricing of demutualizing and existing issues is perhaps no clearer than in the case of the price/tangible book (“P/TB”) ratio in that the P/TB ratio of a demutualizing insurer, particularly those employing the thrift subscription method, will typically result in a discount to tangible book value whereas the P/TB in the current market for the Peer Group reflects a premium to tangible book value, on average. Therefore, it is appropriate to also consider the market for new issues, both at the time of the demutualization and in the aftermarket.
The number of demutualized insurance company issues which are publicly traded is relatively limited, and while there were no demutualization transactions completed pursuant to the subscription rights method between 2010 and 2017, there were two such transactions completed in March 2017. Table 4.2 shows the financial and pricing characteristics of selected demutualized insurers completing their demutualization transactions since 1997. The average and median pro forma P/TB ratios for the ten insurance companies completing demutualizations were 63.0% and 58.1%, respectively. The average and median pro forma price/core earnings (“P/Core”) equaled 17.0 times and 15.1 times, respectively.
Perhaps the most comparable of the offerings was by ICC Holdings, which is also based in Illinois, which completed its offering on March 24, 2017, raising gross proceeds of $35 million, which is comparable in size to the Company’s proposed offering. The transaction was completed at a pro forma P/TB ratio of 56.3% while the pro forma P/E multiple was 17.0x. The fact that ICC Holdings was profitable on pre-conversion basis represents a significant difference from Federal Life’s history of operating losses. At the same time, the bull market environment has continued and Federal Life has developed a growth oriented business plan which is dependent on the capital raised in the offering.
RP Financial, LC.
Page 4.9
Table 4.2
Demutualization Transactions: Subscription Rights Offerings
| | | | | AM | | | | Demutual | | | | Aggregate Value | | | Shares Issued | | | |
| | | | | Best | | | | Deal Structure | | Demut | | Initial | | | | | | Shrs. Dist | | | | | | Exrcs | | | |
| | | | | Rating | | Main | | | | IPO | | Closing | | Mkt | | | Gross | | | To | | | Offering | | | Over- | | Issue | |
| Ticker | | Company | | @ IPO | | Lines | | Form | | Struct. | | Date | | Cap | | | Prcds | | | Insureds(6) | | | Shares | | | allot. | | Price | |
| | | | | | | | | | | | | | | ($Mil) | | | ($Mil) | | | (000) | | | (000) | | | | | ($) | |
| | | | | | | | | | | | | | | | | | | | | | | | | | | | | | |
| NODK | | NI Holdings Inc. | | A | | P/C-Mix | | MHC/ | | Subscr | | 03/13/17 | | $ | 104 | | | $ | 104 | | | | - | | | | 103,500 | | | - | | $ | 10.00 | |
| | | | | | | | | Minority | | | | | | | | | | | | | | | | | | | | | | | | | | |
| ICCH | | ICC Holdings | | B++ | | P/C - Mix | | Full | | Subscr | | 03/24/17 | | $ | 35 | | | $ | 35 | | | | - | | | | 3,500 | | | - | | $ | 10.00 | |
| | | | | | | | | | | | | | | | | | | | | | | | | | | | | | | | | | | |
| PMIC | | Penn Millers Holding Corp. | | A- | | P/C-Mix | | Full | | Subscr | | 10/16/09 | | $ | 54 | | | $ | 54 | | | | - | | | | 5,444 | | | - | | $ | 10.00 | |
| | | | | | | | | | | | | | | | | | | | | | | | | | | | | | | | | | | |
| EIHI | | Eastern Insurance Holdings, Inc. | | B++ | | Life/Pc | | Full | | Subscr | | 06/19/06 | | | 114 | (5) | | | 75 | (5) | | | - | | | | 7,475 | | | - | | $ | 10.00 | |
| | | | | | | | | | | | | | | | | | | | | | | | | | | | | | | | | | | |
| FMMH.OB | | Fremont Michigan Insuracorp, MI | | B++ | | P/C-Mix | | Full | | Subscr | | 10/18/04 | | $ | 9 | | | $ | 9 | | | | - | | | | 862 | | | - | | $ | 10.00 | |
| | | | | | | | | | | | | | | | | | | | | | | | | | | | | | | | | | | |
| MIGP | | Mercer Insurance Group, PA | | A | | P/C-Mix | | Full | | Subscr | | 12/15/03 | | $ | 69 | | | $ | 59 | | | | - | | | | 5,884 | | | - | | $ | 10.00 | |
| | | | | | | | | | | | | | | | | | | | | | | | | | | | | | | | | | | |
| NCRI | | NCRIC Group, Inc., DC(2) | | A- | | Med Liab | | 2nd Step MHC | | Subscr | | 06/25/03 | | $ | 69 | | | $ | 41 | | | | - | | | | 4,144 | | | - | | $ | 10.00 | |
| | | | | | | | | | | | | | | | | | | | | | | | | | | | | | | | | | | |
| PFLD.OB | | Professionals Direct, MI | | B++ | | Attny. Liab | | Full | | Subscr | | 07/01/01 | | $ | 3 | | | $ | 3 | | | | - | | | | 334 | | | - | | $ | 10.00 | |
| | | | | | | | | | | | | | | | | | | | | | | | | | | | | | | | | | | |
| ACAP | | AP Capital, Inc., MI (3) | | A- | | Med Liab | | Full | | Subscr | | 12/08/00 | | $ | 155 | | | $ | 155 | | | | - | | | | 11,450 | | | Yes | | $ | 13.50 | |
| | | | | | | | | | | | | | | | | | | | | | | | | | | | | | | | | | | |
| OGGI | | Old Guard Grp, Inc., PA | | A- | | P/C-Mix | | Full | | Subscr | | 02/01/97 | | | N.A. | | | $ | 40 | | | | - | | | | 3,955 | | | No | | $ | 10.00 | |
| (1) | Reflects the impact of a simultaneous merger with Eastern Holding Company. |
| (2) | Reflects second step offering by NCRIC Group's mutual holding company. NCRIC completed an initial MHC offering prior to the second step conversion. |
| (3) | Core earnings and ROA and ROE ratios reflect adjustment to exclude a significant one-time income tax recovery. |
| (4) | None for subscription rights transactions. |
| (5) | Includes 3.9 million shares issued connection with a merger with Eastern Holding Co. and 7.5 million shares sold in a subscription offering. |
RP Financial, LC.
Page 4.10
Table 4.2 (continued)
Demutualization Transactions: Subscription Rights Offerings
| | | | | | | | | | | | | | | | | | | | | | | | | | | | | | | | | After-Market | |
| | | | | | | | | | | | | | | | | | | | | | | | | | | | | | | | | Price Change | |
| | | Pro Forma Financial Ratios | | | Pro Forma Pricing Ratios | | | Vs. IPO Price | |
| Company | | E/A | | | Tg. E/A | | | ROA | | | ROE | | | P/E | | | P/CE | | | P/B | | | P/TB | | | P/Rev | | | P/A | | | 1 day | | 1 wk | | | 1 mo | |
| | | (%) | | | (%) | | | (%) | | | (%) | | | (x) | | | (x) | | | (%) | | | (%) | | | (%) | | | (%) | | | (%) | | | (%) | | | (%) | |
| | | | | | | | | | | | | | | | | | | | | | | | | | | | | | | | | | | | | | | | |
| NI Holdings Inc. (3) | | | 64.3 | % | | | 63.8 | % | | | 2.37 | % | | | 3.68 | % | | | 18.1 | x | | | 18.1 | x | | | 66.9 | % | | | 67.3 | % | | | 141.5 | % | | | 42.9 | % | | | 48 | % | | | 44 | % | | | 57 | % |
| | | | | | | | | | | | | | | | | | | | | | | | | | | | | | | | | | | | | | | | | | | | | | | | | | | | | |
| ICC Holdings | | | 21.7 | % | | | 21.7 | % | | | 1.24 | % | | | 2.99 | % | | | 17.0 | x | | | 17.0 | x | | | 56.3 | % | | | 56.3 | % | | | 94.8 | % | | | 22.3 | % | | | 44 | % | | | 53 | % | | | 52 | % |
| | | | | | | | | | | | | | | | | | | | | | | | | | | | | | | | | | | | | | | | | | | | | | | | | | | | | |
| Penn Millers Holding Corp. | | | 44.5 | % | | | 44.5 | % | | | 0.88 | % | | | 1.98 | % | | | 27.0 | x | | | 27.0 | x | | | 53.5 | % | | | 53.5 | % | | | 119.3 | % | | | 20.0 | % | | | 8 | % | | | 2 | % | | | 2 | % |
| | | | | | | | | | | | | | | | | | | | | | | | | | | | | | | | | | | | | | | | | | | | | | | | | | | | | |
| Eastern Insurance Holdings, Inc. | | | 47.1 | % | | | 44.7 | % | | | 3.46 | % | | | 7.36 | % | | | 8.6 | x | | | 8.6 | x | | | 66.7 | % | | | 74.4 | % | | | 84.9 | % | | | 31.4 | % | | | 14 | % | | | 21 | % | | | 29 | % |
| | | | | | | | | | | | | | | | | | | | | | | | | | | | | | | | | | | | | | | | | | | | | | | | | | | | | |
| Fremont Michigan Insuracorp, MI | | | 25.0 | % | | | 25.0 | % | | | 1.00 | % | | | 4.00 | % | | | 13.4 | x | | | 13.4 | x | | | 53.3 | % | | | 53.3 | % | | | 44.7 | % | | | 13.3 | % | | | N.A. | | | | N.A. | | | | N.A. | |
| | | | | | | | | | | | | | | | | | | | | | | | | | | | | | | | | | | | | | | | | | | | | | | | | | | | | |
| Mercer Insurance Group, PA | | | 65.3 | % | | | 62.1 | % | | | 1.46 | % | | | 2.24 | % | | | 31.7 | x | | | 31.7 | x | | | 70.9 | % | | | 74.5 | % | | | 160.9 | % | | | 46.3 | % | | | 22 | % | | | 24 | % | | | 34 | % |
| | | | | | | | | | | | | | | | | | | | | | | | | | | | | | | | | | | | | | | | | | | | | | | | | | | | | |
| NCRIC Group, Inc., DC(1) | | | 35.3 | % | | | 32.3 | % | | | 0.63 | % | | | 1.78 | % | | | 46.0 | x | | | 28.9 | x | | | 82.1 | % | | | 89.9 | % | | | 141.0 | % | | | 25.9 | % | | | 5 | % | | | 3 | % | | | 10 | % |
| | | | | | | | | | | | | | | | | | | | | | | | | | | | | | | | | | | | | | | | | | | | | | | | | | | | | |
| Professionals Direct, MI | | | 20.4 | % | | | 19.2 | % | | | 3.03 | % | | | 14.99 | % | | | 3.7 | x | | | 4.6 | x | | | 53.7 | % | | | 57.2 | % | | | 43.8 | % | | | 11.0 | % | | | N.A. | | | | N.A. | | | | N.A. | |
| | | | | | | | | | | | | | | | | | | | | | | | | | | | | | | | | | | | | | | | | | | | | | | | | | | | | |
| AP Capital, Inc., MI (2) | | | 38.1 | % | | | 36.3 | % | | | 1.80 | % | | | 4.74 | % | | | 3.6 | x | | | 8.9 | x | | | 42.9 | % | | | 45.0 | % | | | 69.7 | % | | | 16.1 | % | | | 1 | % | | | 13 | % | | | 26 | % |
| | | | | | | | | | | | | | | | | | | | | | | | | | | | | | | | | | | | | | | | | | | | | | | | | | | | | |
| Old Guard Grp, Inc., PA | | | 39.4 | % | | | 39.4 | % | | | 1.89 | % | | | 4.78 | % | | | N.M. | | | | 12.3 | x | | | 59.0 | % | | | 59.0 | % | | | 61.7 | % | | | 40.6 | % | | | 44 | % | | | 39 | % | | | 46 | % |
| (1) | Reflects second step offering by NCRIC Group's mutual holding company. NCRIC completed an initial MHC offering prior to the second step conversion. |
| (2) | Core earnings and ROA and ROE ratios reflect adjustment to exclude a significant one-time income tax recovery. |
| (3) | Reflects pricing ratios on a fully converted basis. |
RP Financial, LC.
Page 4.11
* * * * * * * * * * *
In determining the valuation adjustment for marketing of the issue, we considered trends in both the overall market for insurance companies and the new issue market. Taking these factors and trends into account, RP Financial concluded that a downward adjustment was appropriate in the valuation analysis for purposes of marketing of the issue.
By its relatively small level of total assets and revenues, Federal Life’s management team is constrained relative to the resources available relative to other larger insurers. At the same time, the Company has indicated that the management infrastructure in place can manage targeted growth with little or no additions at the senior executive level. On balance we have applied a downward adjustment for Organization as Federal Life’s management depth is limited by the smaller size.
Both Federal Life and the Peer Group companies operate in a regulated industry with oversight typically provided by state insurance regulators, generally within the framework of guidelines established by state law and the National Association of Insurance Commissioners. Federal Life appears to maintain good relations with its regulators and we believe the Peer Group companies are not subject to operating restrictions. On balance, we believe no adjustment is warranted for this factor.
RP Financial, LC.
Page 4.12
Summary of Adjustments
Overall, based on the factors discussed above, we concluded that the Company’s pro forma market value should be discounted relative to the Peer Group as follows:
| Key Valuation Parameters | | Valuation Adjustment |
| | | |
| Financial Considerations | | Upward Adjustment |
| Operating Considerations | | Significant Downward Adj. |
| Dividends | | Downward Adjustment |
| Liquidity of the Shares | | Downward Adjustment |
| Marketing of the Issue | | Downward Adjustment |
| Organization | | Downward Adjustment |
| Regulatory Environment | | No Adjustment |
Valuation Approaches
In applying the pro forma market value approach, we considered the three key pricing ratios in valuing Federal Life’s to-be-issued stock – price/earnings (“P/E”), price/book value (“P/B” and price/revenue (“P/Rev”) — all performed on a pro forma basis including the effects of the stock offering proceeds. In computing the pro forma impact of the demutualization and the related pricing ratios, we have incorporated the valuation parameters as provided by management on a preliminary basis (see Exhibit IV-2 and IV-3).
Pursuant to the stock offering, we have also incorporated the valuation parameters as estimated by management for offering expenses. The assumptions utilized in the pro forma analysis in calculating the Company’s value pursuant to the conversion is described more fully below.
| Ø | Offering Expenses. Total fixed offering expenses were assumed to be fixed at $1,500,00 based on management’s preliminary estimates. In addition, there will be a variable component in the offering costs paid to the marketing agent as follows: |
| Ø | A 2.0% commission on all shares sold in the subscription offering and to an identified list of individuals, customers, etc. developed by Federal Life’s management preliminarily estimated to total $10.0 million: and |
| Ø | A 6.5% common on all shares sold to the Public and Standby Investor |
| Ø | Based on the foregoing, total offering expenses at the midpoint of the offering range are estimated at $3.65 million. |
RP Financial, LC.
Page 4.13
| · | Reinvestment Rate. A 3.10 percent reinvestment rate on the net offering proceeds has been assumed, which is consistent with the current weighted average yield on the investment portfolio as of September 30, 2017. Management has indicated that the offering proceeds will be invested in a laddered portfolio of investment securities relatively consistent with the current investment securities portfolio composition. |
| · | Effective Tax Rate. Assumes the current non-taxable status continues owing to NOLs. While the conversion transaction is expected to limit the future ability to utilize NOLs, the annual usage limitation is expected to be in the range of range of $700,000 of taxable income annually. Coupled with the recent reduction in the federal corporate tax rate, it appears that the Company will not be taxable for the short to intermediate term. |
In our estimate of value, we assessed the relationship of the pro forma pricing ratios relative to the Peer Group and the recent demutualizations.
RP Financial’s valuation placed an emphasis on the following:
| · | P/E Approach. The P/E approach is historically the preferred valuation approach. Important with respect to Federal Life however, the recent history of operating losses renders the P/E approach to valuation less meaningful relative to P/B and P/Revenue approaches. |
| · | P/B Approach. P/B ratios have generally served as a useful benchmark in the valuation of the equity securities of financial securities companies in recent years, including insurance companies, particularly in the context of an initial public offering. RP Financial considered the P/B approach to be a reliable indicator of value given current market conditions, particularly the market for recent demutualizations. RP Financial also considered price/tangible book, which adjusts for intangible assets, particularly goodwill. |
It is important to stress that the P/B ratios of the Peer Group companies are not subject to capital raising – the denominator (reported stockholders’ equity) is relatively stable quarter whereas the numerator (stock price) tends to be more volatile based on prevailing market conditions. In comparison, the Company’s P/B ratio must mathematically be discounted to book value as the denominator (pro forma equity) will always be less than the numerator (the price, the offering amount) since the pro forma equity incorporates both pre-offering equity as well as the net proceeds raised in the offering.
| · | P/Revenues Approach. P/Revenue ratios have also been considered a benchmark of trading value. A benefit of the revenues approach is that it is not significantly impacted by the offering proceeds, unlike the earnings and book value approaches. In addition, given the lack of a history of core earnings, we have given the Price/Revenues approach more weight in the valuation conclusion. |
RP Financial, LC.
Page 4.14
Based on the application of the pro forma valuation approaches described above, taking into consideration the valuation adjustments discussed above, RP Financial concluded that the pro forma market value of the shares to be offered by Federal Life was $40.0 million at the midpoint of the offering range. Table 4.3 sets forth details regarding the offering range for the Company and the Company’s pro forma pricing relative to the Peer Group based on stock prices as of December 22, 2017.
In developing the pro forma valuation estimate, RP Financial considered the potential for restoration of positive earnings within the first two or three years following the completion of the conversion transaction. In this regard, the major elements of the business plan to reverse the recent operating losses include:
| 1. | Undertake growth to expand revenues and achieve economies of scale. |
| 2. | Maximize the use of the existing infrastructure capacity in growth plans to create a competitive advantage. |
| 3. | Promote a performance oriented culture within the organization to ensure financial strength. |
| 4. | Identify potential internal opportunities to increase regulatory surplus to support growth and risk levels. |
| 5. | Complete the conversion to capitalize future growth and provide enhanced access to capital markets in the future to support growth and risk levels. |
| 6. | The realization of the foregoing elements of the strategic plan is expected to be facilitated by efforts of the Standby Purchaser to assist in the Company in implementing the foregoing elements of the Strategic Plan. |
1. P/E.The application of the P/E valuation method requires calculating the Company’s pro forma market value by applying a valuation P/E multiple to the pro forma earnings base. In applying this technique, we considered both reported earnings and a recurring earnings base, that is, earnings adjusted to exclude any one-time non-operating items, plus the estimated after-tax earnings benefit of the reinvestment of the net proceeds. As discussed in the financial analysis in Section One, Federal Life reported a net loss equal to $1.110 million for the nine months ended September 30, 2017, equal to $1.480 million on an annualized basis. Based on these net losses, the application of the P/E approach was deemed “not meaningful” and no analysis was performed.
RP Financial, LC.
Page 4.15
Table 4.3
Public Market Pricing
Federal Life Insurance Company and the Peer Group
Prices as of December 22, 2017
| | | | | | | | | Financial Data as of September 30, 2017 | | | Key Pricing Ratios as of December 22, 2017 | |
| | | | | | | | | | | | | | | | | | | | | | | | | | | | | | Price/ | | | Price/ | | | Price/ | |
| | | | | | | | | Closing | | | Market | | | | | | Equity/ | | | | | | | | | Price/ | | | Tangible | | | TTM | | | TTM | |
| Company Name | | City, State | | Ticker | | Exchange | | Price | | | Value | | | Assets | | | Assets | | | ROAA | | | ROAE | | | Book | | | Book | | | Earnings | | | Revenue | |
| | | | | | | | | ($) | | | ($Mil) | | | ($Mil) | | | (%) | | | (%) | | | (%) | | | (%) | | | (%) | | | (x) | | | (x) | |
| Federal Life Insurance Company | | Riverwods, IL | | | | | | | | | | | | | | | | | | | | | | | | | | | | | | | | | | | | | | | | | | | | |
| Maximum | | | | | | | | $ | 10.00 | | | $ | 46.00 | | | $ | 300 | | | | 26.10 | % | | | -0.06 | % | | | -0.22 | % | | | 58.8 | % | | | 58.8 | % | | | NM | | | | 1.83 | x |
| Midpoint | | | | | | | | $ | 10.00 | | | $ | 40.00 | | | $ | 294 | | | | 24.69 | % | | | -0.12 | % | | | -0.48 | % | | | 55.1 | % | | | 55.1 | % | | | NM | | | | 1.60 | x |
| Minimum | | | | | | | | $ | 10.00 | | | $ | 34.00 | | | $ | 288 | | | | 23.23 | % | | | -0.18 | % | | | -0.78 | % | | | 50.8 | % | | | 50.8 | % | | | NM | | | | 1.37 | x |
| | | | | | | | | | | | | | | | | | | | | | | | | | | | | | | | | | | | | | | | | | | | | | | |
| All Public Life Insurance Companies | | | | | | | | | | | | | | | | | | | | | | | | | | | | | | | | | | | | | | | | | | | | | | |
| Average | | | | | | | | $ | 66.40 | | | $ | 10,482.5 | | | $ | 130,630 | | | | 12.98 | % | | | 0.42 | % | | | 1.29 | % | | | 112.3 | % | | | 119.8 | % | | | 17.51 | x | | | 1.35 | x |
| Median | | | | | | | | $ | 51.48 | | | $ | 4,373.7 | | | $ | 45,699 | | | | 13.36 | % | | | 0.59 | % | | | 8.35 | % | | | 98.6 | % | | | 117.9 | % | | | 12.81 | x | | | 1.16 | x |
| | | | | | | | | | | | | | | | | | | | | | | | | | | | | | | | | | | | | | | | | | | | | | | |
| Peer Group | | | | | | | | | | | | | | | | | | | | | | | | | | | | | | | | | | | | | | | | | | | | | | |
| Average | | | | | | | | $ | 64.08 | | | $ | 1,264.1 | | | $ | 13,748 | | | | 17.52 | % | | | 0.88 | % | | | 5.65 | % | | | 93.9 | % | | | 97.4 | % | | | 19.56 | x | | | 1.52 | x |
| Median | | | | | | | | $ | 27.95 | | | $ | 436.7 | | | $ | 4,511 | | | | 14.93 | % | | | 0.62 | % | | | 5.38 | % | | | 85.8 | % | | | 85.8 | % | | | 14.16 | x | | | 1.31 | x |
| | | | | | | | | | | | | | | | | | | | | | | | | | | | | | �� | | | | | | | | | | | | | | | | | |
| Peer Group Companies | | | | | | | | | | | | | | | | | | | | | | | | | | | | | | | | | | | | | | | | | | | | | | |
| American Equity Investment Life Holding Company | | West Des Moines, IA | | AEL | | NYSE | | $ | 32.13 | | | $ | 2,863.5 | | | $ | 60,380 | | | | 4.58 | % | | | 0.45 | % | | | 10.18 | % | | | 103.4 | % | | | 103.4 | % | | | 11.16 | x | | | 0.87 | x |
| Citizens, Inc. | | Austin, TX | | CIA | | NYSE | | $ | 7.48 | | | $ | 374.6 | | | $ | 1,651 | | | | 16.00 | % | | | 0.39 | % | | | 2.42 | % | | | 141.8 | % | | | 152.3 | % | | | 60.49 | x | | | 1.48 | x |
| CNO Financial Group, Inc. | | Carmel, IN | | CNO | | NYSE | | $ | 24.87 | | | $ | 4,172.2 | | | $ | 32,705 | | | | 14.93 | % | | | 1.48 | % | | | 10.36 | % | | | 85.5 | % | | | 85.5 | % | | | 8.98 | x | | | 0.99 | x |
| FBL Financial Group, Inc. | | West Des Moines, IA | | FFG | | NYSE | | $ | 71.80 | | | $ | 1,790.2 | | | $ | 9,892 | | | | 12.93 | % | | | 1.16 | % | | | 9.15 | % | | | 140.3 | % | | | 141.4 | % | | | 15.99 | x | | | 2.43 | x |
| Independence Holding Company | | Stamford, CT | | IHC | | NYSE | | $ | 27.95 | | | $ | 415.4 | | | $ | 1,039 | | | | 40.69 | % | | | 3.02 | % | | | 7.69 | % | | | 99.2 | % | | | 117.6 | % | | | 14.12 | x | | | 1.31 | x |
| Kansas City Life Insurance Company | | Kansas City, MO | | KCLI | | OTCQX | | $ | 45.10 | | | $ | 436.7 | | | $ | 4,511 | | | | 15.62 | % | | | 0.51 | % | | | 3.31 | % | | | 62.0 | % | | | 62.0 | % | | | 18.95 | x | | | 0.97 | x |
| National Western Life Group, Inc. | | Austin, TX | | NWLI | | NASDAQ | | $ | 337.03 | | | $ | 1,158.1 | | | $ | 12,138 | | | | 14.85 | % | | | 0.79 | % | | | 5.38 | % | | | 68.0 | % | | | 68.0 | % | | | 12.62 | x | | | 1.43 | x |
| Security National Financial Corporation | | Salt Lake City, UT | | SNFCA | | NASDAQ | | $ | 5.40 | | | $ | 82.4 | | | $ | 1,008 | | | | 13.83 | % | | | 0.62 | % | | | 4.39 | % | | | 59.2 | % | | | 60.4 | % | | | 14.21 | x | | | 0.29 | x |
| UTG, Inc. | | Springfield, IL | | UTGN | | OTC Pink | | $ | 25.00 | | | $ | 83.4 | | | $ | 405 | | | | 24.24 | % | | | -0.49 | % | | | -2.06 | % | | | 85.8 | % | | | 85.8 | % | | | NM | | | | 3.88 | x |
(1) Financial information is on a pro forma basis for Federal Life. Peer Group data is as of September 30, 2017.
Source: S&P Global Market Intelligence and Federal Life's internal f inancials, as of September 30, 2017 for Federal Lif e and September 30, 2017 for all other Companies.
RP Financial, LC.
Page 4.16
2. P/B. The application of the P/B valuation method requires calculating the Company’s pro forma market value by applying a valuation P/B ratio to Federal Life’s pro forma book value. In applying the P/B approach, we relied most heavily on tangible book value (i.e., book value net of intangible assets) because historically the market has not generally given credit for intangible assets.
At the estimated midpoint of the offering range, Federal Life exhibited a pro forma reported and tangible P/B ratios equal 55.1% (the ratios are the same for Federal Life because the Company has no intangible assets on its balance sheet). The Peer Group’s median reported and tangible P/B median ratios were both 85.8%. Accordingly, the Company’s pro forma reported and tangible P/B ratios are both discounted by 36%. RP Financial considered these discounts to be appropriate considering the downward adjustments indicated above, including the Company’s history of operating losses and the more limited liquidity of the stock in the aftermarket coupled with Federal Life’s status as a new issue. These discounts were mitigated to an extent by various positive considerations including the potential ability of the Standby Purchaser to assist the Company in restoring profitability through its industry relationships and related ability to facilitate the Company’s implementation of a growth-oriented business plan.
3. P/Revenues. The P/Revenues valuation methodology determines market value by applying a valuation P/Revenue ratio to the Company’s pro forma revenues. At the estimated midpoint value, Federal Life’s value equaled 1.60x pro forma revenues, which is at a premium of 5.3 percent to the Peer Group average of 1.52x and at a premium of 22.1% to the Peer Group median of 1.31x. A benefit of the revenues approach is that it is not significantly impacted by the offering proceeds, unlike the earnings and book value approaches. At the same time, we believe that investors tend to focus more heavily on overall net earnings levels rather than the magnitude of overall revenues.
Comparison to Recent Demutualizations
We also considered the conversion offering by ICC Holdings, an Illinois-domiciled insurance company, which completed its offering on March 24, 2017, raising gross proceeds of $40 million, which is comparable in size to the Company’s proposed offering size. The transaction was completed at a pro forma P/TB ratio of 56.3% while the pro forma P/E multiple was 17.0x. The fact that ICC Holdings was profitable on pre-conversion basis represents a significant difference from Federal Life’s history of operating losses. At the same time, we considered that the bull market environment has continued, both with respect to the broad market and insurance underwriters, and that Federal Life has developed a growth oriented business plan which is dependent on the capital raised in the offering.
RP Financial, LC.
Page 4.17
Valuation Conclusion
Based on the foregoing, it is our opinion that, based on stock prices as of December 22, 2017, and financial statements through September 30, 2017, the estimated aggregate pro forma market value of the shares to be issued immediately following the offering, was $40,000,000 (the “midpoint value”). A range of value will be established based on the midpoint value to be responsive to moderate changes in market conditions. The resulting range of value pursuant to regulatory guidelines, and the corresponding number of shares based on the Board determined $10.00 per share offering price, is set forth below.
Table 4.4
Federal Life Insurance Company
Valuation Range and Offering Characteristics
| | | Aggregate | | | | |
| Shares | | Value | | | Shares (1) | |
| Maximum | | $ | 46,000,000 | | | | 4,600,000 | |
| Midpoint | | $ | 40,000,000 | | | | 4,000,000 | |
| Minimum | | $ | 34,000,000 | | | | 3,400,000 | |
| | | | | | | | | |
| (1) Based on offering price of $10.00 per share. |
LIST OF EXHIBITS
| Exhibit | | |
| Number | | Description |
| | | |
| I-1 | | Federal Life’s Unaudited Financial Statements |
| | | |
| I-2 | | Financial Data based on Statutory Accounting Principles |
| | | |
| IV-1 | | Pricing and Financial Characteristics of Public Life Insurance Companies |
| | | |
| IV-2 | | Pro Forma Analysis Sheet |
| | | |
| IV-3 | | Pro Forma Effect of Offering Proceeds |
| | | |
| V-1 | | Firm Qualifications Statement |
EXHIBIT I-1
Federal Life Insurance Company Unaudited
Financial Statements
[Incorporated by Reference]
EXHIBIT I-2
Federal Life Insurance Company
Financial Statements Based on Statutory Accounting Data
Federal Life Insurance Company | Life Balance Sheet
MI STAT ENTITY KEY: C2347
Periods Last Five Years
| | | 2012 Y | | | 2013 Y | | | 2014 Y | | | 2015 Y | | | 2016 Y | |
| Period Ended | | 12/31/2012 | | | 12/31/2013 | | | 12/31/2014 | | | 12/31/2015 | | | 12/31/2016 | |
| Data displayed in $000 unless otherwise noted | | | | | | | | | | | | | | | | | | | | |
| | | | | | | | | | | | | | | | | | | | | |
| Assets | | | | | | | | | | | | | | | | | | | | |
| Investments: | | | | | | | | | | | | | | | | | | | | |
| Bonds | | | 163,926 | | | | 165,160 | | | | 166,181 | | | | 168,725 | | | | 168,634 | |
| Preferred Stocks | | | 0 | | | | 0 | | | | 0 | | | | 0 | | | | 0 | |
| Common Stocks | | | 12,152 | | | | 13,037 | | | | 11,568 | | | | 10,667 | | | | 8,468 | |
| Mortgage Loans | | | 0 | | | | 0 | | | | 0 | | | | 0 | | | | 0 | |
| Real Estate | | | 1,966 | | | | 1,873 | | | | 1,826 | | | | 1,882 | | | | 1,987 | |
| Contract Loans | | | 10,145 | | | | 10,461 | | | | 10,322 | | | | 10,129 | | | | 10,059 | |
| Derivatives | | | 0 | | | | 0 | | | | 0 | | | | 0 | | | | 60 | |
| Cash & Short Term Investments | | | 3,228 | | | | 4,348 | | | | 6,293 | | | | 5,687 | | | | 7,080 | |
| Other Investments | | | 0 | | | | 0 | | | | 0 | | | | 0 | | | | 2,000 | |
| Total Cash & Investments | | | 191,417 | | | | 194,879 | | | | 196,189 | | | | 197,090 | | | | 198,287 | |
| Premiums and Considerations Due | | | 4,500 | | | | 4,412 | | | | 4,060 | | | | 4,219 | | | | 4,497 | |
| Reinsurance Recoverable | | | 2 | | | | 0 | | | | 50 | | | | 0 | | | | 0 | |
| Receivable from Parent, Subsidiary or Affiliates | | | 34 | | | | 4 | | | | 0 | | | | 0 | | | | 0 | |
| All Other Admitted Assets | | | 2,654 | | | | 2,874 | | | | 2,744 | | | | 3,045 | | | | 3,223 | |
| Total Assets without Separate Account | | | 198,607 | | | | 202,169 | | | | 203,044 | | | | 204,355 | | | | 206,006 | |
| Separate Account Assets | | | 21,536 | | | | 26,068 | | | | 26,651 | | | | 23,335 | | | | 21,513 | |
| Total Assets | | | 220,144 | | | | 228,237 | | | | 229,695 | | | | 227,690 | | | | 227,519 | |
| | | | | | | | | | | | | | | | | | | | | |
| Liabilities | | | | | | | | | | | | | | | | | | | | |
| Net Policy Reserves - Life | | | 162,403 | | | | 166,454 | | | | 169,171 | | | | 171,775 | | | | 173,876 | |
| Net Policy Reserves - A&H | | | 563 | | | | 491 | | | | 491 | | | | 422 | | | | 351 | |
| Liability for Deposit-Type Contracts | | | 9,679 | | | | 9,379 | | | | 9,603 | | | | 10,039 | | | | 10,529 | |
| Total Policy Reserves plus Deposits | | | 172,645 | | | | 176,325 | | | | 179,265 | | | | 182,236 | | | | 184,756 | |
| | | | | | | | | | | | | | | | | | | | | |
| Contract Claims | | | 1,906 | | | | 2,248 | | | | 1,490 | | | | 1,806 | | | | 1,889 | |
| Interest Maintenance Reserve | | | 847 | | | | 918 | | | | 733 | | | | 869 | | | | 686 | |
| Asset Valuation Reserve | | | 2,922 | | | | 3,230 | | | | 2,928 | | | | 2,765 | | | | 2,822 | |
| Reinsurance Liabilities | | | 0 | | | | 0 | | | | 0 | | | | 0 | | | | 0 | |
| | | 2012 Y | | | 2013 Y | | | 2014 Y | | | 2015 Y | | | 2016 Y | |
| Commissions, expenses, and tax due | | | 705 | | | | 815 | | | | 673 | | | | 637 | | | | 663 | |
| Payable to Parent, Subs or Affiliates | | | 0 | | | | 0 | | | | 0 | | | | 0 | | | | 0 | |
| Derivatives | | | 0 | | | | 0 | | | | 0 | | | | 0 | | | | 0 | |
| All Other Liabilities | | | 173,243 | | | | 176,971 | | | | 179,932 | | | | 182,979 | | | | 185,231 | |
| Total Liabilities without Sep Accounts | | | 179,623 | | | | 184,182 | | | | 185,757 | | | | 189,056 | | | | 191,290 | |
| From Separate Account Statements | | | 21,536 | | | | 26,068 | | | | 26,651 | | | | 23,335 | | | | 21,513 | |
| Total Liabilities incl Sep Accounts | | | 201,160 | | | | 210,250 | | | | 212,408 | | | | 212,392 | | | | 212,803 | |
| | | | | | | | | | | | | | | | | | | | | |
| Capital and Surplus | | | | | | | | | | | | | | | | | | | | |
| Common Capital Stock | | | 0 | | | | 0 | | | | 0 | | | | 0 | | | | 2,500 | |
| Preferred Capital Stock | | | 0 | | | | 0 | | | | 0 | | | | 0 | | | | 0 | |
| Surplus Notes | | | 0 | | | | 0 | | | | 0 | | | | 0 | | | | 0 | |
| Unassigned Surplus | | | 18,584 | | | | 17,588 | | | | 16,887 | | | | 14,899 | | | | 14,316 | |
| Other Including Gross Contributed | | | 400 | | | | 400 | | | | 400 | | | | 400 | | | | (2,100 | ) |
| Capital & Surplus | | | 18,984 | | | | 17,988 | | | | 17,287 | | | | 15,299 | | | | 14,716 | |
| | | | | | | | | | | | | | | | | | | | | |
| Total Liabilities and C&S | | | 220,144 | | | | 228,237 | | | | 229,695 | | | | 227,690 | | | | 227,519 | |
| | | | | | | | | | | | | | | | | | | | | |
| Memo: Affiliated Investments | | | | | | | | | | | | | | | | | | | | |
| Bonds | | | 0 | | | | 0 | | | | 0 | | | | 0 | | | | 0 | |
| Preferred Stocks | | | 0 | | | | 0 | | | | 0 | | | | 0 | | | | 0 | |
| Common Stocks | | | 5,195 | | | | 6,186 | | | | 550 | | | | 572 | | | | 578 | |
| Mortgage Loans | | | 0 | | | | 0 | | | | 0 | | | | 0 | | | | 0 | |
| Cash & Short Term Investments | | | 0 | | | | 0 | | | | 0 | | | | 0 | | | | 0 | |
| All Other Investments | | | 0 | | | | 0 | | | | 0 | | | | 0 | | | | 2,000 | |
| | | | | | | | | | | | | | | | | | | | | |
| Total Affiliated Investments | | | 5,195 | | | | 6,186 | | | | 550 | | | | 572 | | | | 2,578 | |
| | | | | | | | | | | | | | | | | | | | | |
| Total Cash & Investments, Excl Affiliated | | | 186,221 | | | | 188,693 | | | | 195,639 | | | | 196,519 | | | | 195,708 | |
Site content and design Copyright © 2018, S&P Global Market Intelligence
Usage of this product is governed by the SNL Master Subscription Agreement or separate S&P Agreement, as applicable.
S&P Global Market Intelligence, 55 Water Street, New York, NY 10041,
Federal Life Insurance Company | Life Income Statement
MI STAT ENTITY KEY: C2347
Periods Last Five Years
| | | 2012 Y | | | 2013 Y | | | 2014 Y | | | 2015 Y | | | 2016 Y | |
| Period Ended | | 12/31/2012 | | | 12/31/2013 | | | 12/31/2014 | | | 12/31/2015 | | | 12/31/2016 | |
| Data displayed in $000 unless otherwise noted | | | | | | | | | | | | | | | | | | | | |
| | | | | | | | | | | | | | | | | | | | | |
| Revenue | | | | | | | | | | | | | | | | | | | | |
| Life Insurance Premiums | | | 20,179 | | | | 19,472 | | | | 18,386 | | | | 17,535 | | | | 15,262 | |
| Annuity Premiums & Deposits | | | 1,997 | | | | 3,522 | | | | 2,065 | | | | 3,098 | | | | 7,376 | |
| Accident & Health Premiums | | | 220 | | | | 199 | | | | 176 | | | | 153 | | | | 139 | |
| Credit Life & Credit A&H Premiums | | | 0 | | | | 0 | | | | 0 | | | | 0 | | | | 0 | |
| Other Premiums & Considerations | | | 0 | | | | 71 | | | | 0 | | | | 40 | | | | 223 | |
| Premiums, Consideration and Deposits | | | 22,396 | | | | 23,264 | | | | 20,627 | | | | 20,826 | | | | 23,001 | |
| | | | | | | | | | | | | | | | | | | | | |
| Net Investment Income | | | 10,431 | | | | 10,629 | | | | 10,281 | | | | 9,747 | | | | 9,586 | |
| Reinsurance Allowance | | | 0 | | | | 0 | | | | 0 | | | | 0 | | | | 0 | |
| Separate Accounts Revenue | | | 171 | | | | 199 | | | | 218 | | | | 220 | | | | 183 | |
| Other Income | | | 282 | | | | 326 | | | | 334 | | | | 383 | | | | 410 | |
| Total Revenue | | | 33,280 | | | | 34,419 | | | | 31,460 | | | | 31,176 | | | | 33,181 | |
| | | | | | | | | | | | | | | | | | | | | |
| Expense | | | | | | | | | | | | | | | | | | | | |
| Life Benefits | | | 12,198 | | | | 13,725 | | | | 11,685 | | | | 10,424 | | | | 10,386 | |
| Annuity Benefits | | | 7,061 | | | | 5,895 | | | | 5,938 | | | | 4,176 | | | | 6,481 | |
| Accident & Health Benefits | | | 168 | | | | 184 | | | | 198 | | | | 118 | | | | 92 | |
| Credit Life & Credit A&H Benefits | | | 0 | | | | 0 | | | | 0 | | | | 0 | | | | 0 | |
| Other Benefits | | | 248 | | | | 234 | | | | 239 | | | | 215 | | | | 220 | |
| Total Benefits | | | 19,675 | | | | 20,039 | | | | 18,059 | | | | 14,933 | | | | 17,178 | |
| | | | | | | | | | | | | | | | | | | | | |
| Life Surrenders | | | 2,563 | | | | 2,294 | | | | 3,262 | | | | 3,415 | | | | 3,367 | |
| Annuity Surrenders | | | 0 | | | | 0 | | | | 0 | | | | 2,750 | | | | 3,758 | |
| Accident & Health Surrenders | | | 0 | | | | 0 | | | | 0 | | | | 0 | | | | 0 | |
| Credit Life & Credit A&H Surrenders | | | 0 | | | | 0 | | | | 0 | | | | 0 | | | | 0 | |
| Other Surrenders | | | 0 | | | | 0 | | | | 0 | | | | 0 | | | | 0 | |
| Total Surrenders | | | 2,563 | | | | 2,294 | | | | 3,262 | | | | 6,165 | | | | 7,125 | |
| | | | | | | | | | | | | | | | | | | | | |
| Life Inc. in Reserves | | | 3,495 | | | | 3,438 | | | | 3,048 | | | | 2,707 | | | | (517 | ) |
| | | 2012 Y | | | 2013 Y | | | 2014 Y | | | 2015 Y | | | 2016 Y | |
| Annuity Inc. in Reserves | | | (2,504 | ) | | | 863 | | | | 18 | | | | 1,012 | | | | 2,723 | |
| Accident & Health Inc. in Reserves | | | (250 | ) | | | (72 | ) | | | 0 | | | | (69 | ) | | | (71 | ) |
| Credit Life & Credit A&H Inc. in Reserves | | | 0 | | | | 0 | | | | 0 | | | | 0 | | | | 0 | |
| Other Inc. in Reserves | | | (56 | ) | | | 17 | | | | (89 | ) | | | 31 | | | | 210 | |
| Total Inc. in Reserves | | | 685 | | | | 4,246 | | | | 2,977 | | | | 3,680 | | | | 2,345 | |
| | | | | | | | | | | | | | | | | | | | | |
| Life Trsfrs. to Sep. Accts | | | 0 | | | | 0 | | | | 0 | | | | 0 | | | | 0 | |
| Annuity Trsfrs. to Sep. Accts | | | (146 | ) | | | (779 | ) | | | (1,840 | ) | | | (2,714 | ) | | | (3,733 | ) |
| Accident & Health Trsfrs. to Sep. Accts | | | 0 | | | | 0 | | | | 0 | | | | 0 | | | | 0 | |
| Credit Life & Credit A&H Trsfrs. to Sep. Accts | | | 0 | | | | 0 | | | | 0 | | | | 0 | | | | 0 | |
| Other Trsfrs. to Sep. Accts | | | 0 | | | | 0 | | | | 0 | | | | 0 | | | | 0 | |
| Total Trsfrs. to Sep. Accts | | | (146 | ) | | | (779 | ) | | | (1,840 | ) | | | (2,714 | ) | | | (3,733 | ) |
| | | | | | | | | | | | | | | | | | | | | |
| Commissions | | | 1,700 | | | | 1,759 | | | | 1,538 | | | | 1,656 | | | | 1,925 | |
| General & Administrative Expenses | | | 9,926 | | | | 8,904 | | | | 8,689 | | | | 8,838 | | | | 9,026 | |
| Insurance Taxes, Licenses and Fees | | | 909 | | | | 863 | | | | 791 | | | | 766 | | | | 722 | |
| Other Expenses | | | (15 | ) | | | (67 | ) | | | (99 | ) | | | 66 | | | | (99 | ) |
| Total Expenses | | | 35,298 | | | | 37,259 | | | | 33,378 | | | | 33,390 | | | | 34,490 | |
| | | | | | | | | | | | | | | | | | | | | |
| Net Income | | | | | | | | | | | | | | | | | | | | |
| Policyholder Dividends | | | 287 | | | | 284 | | | | 271 | | | | 253 | | | | 86 | |
| Net Gain from Operations before FIT | | | (2,305 | ) | | | (3,124 | ) | | | (2,189 | ) | | | (2,467 | ) | | | (1,395 | ) |
| Federal Income Tax | | | (156 | ) | | | (424 | ) | | | (335 | ) | | | (245 | ) | | | (310 | ) |
| Net Income before Cap Gains | | | (2,149 | ) | | | (2,700 | ) | | | (1,854 | ) | | | (2,222 | ) | | | (1,085 | ) |
| | | | | | | | | | | | | | | | | | | | | |
| Net Realized Capital Gains (Losses) | | | 410 | | | | 299 | | | | 1,234 | | | | (55 | ) | | | 1,021 | |
| | | | | | | | | | | | | | | | | | | | | |
| Net Income | | | (1,739 | ) | | | (2,402 | ) | | | (620 | ) | | | (2,276 | ) | | | (64 | ) |
| | | | | | | | | | | | | | | | | | | | | |
| Pre-tax Operating Income | | | (2,305 | ) | | | (3,124 | ) | | | (2,189 | ) | | | (2,467 | ) | | | (1,395 | ) |
| | | | | | | | | | | | | | | | | | | | | |
| Change In Capital and Surplus | | | | | | | | | | | | | | | | | | | | |
| Capital & Surplus, Beginning of Period | | | 20,462 | | | | 18,984 | | | | 17,988 | | | | 17,287 | | | | 15,299 | |
| Net Income | | | (1,739 | ) | | | (2,402 | ) | | | (620 | ) | | | (2,276 | ) | | | (64 | ) |
| Net Unrealized Capital Gains (Losses) | | | 638 | | | | 1,679 | | | | (433 | ) | | | 252 | | | | (403 | ) |
| Change in Surplus Notes | | | 0 | | | | 0 | | | | 0 | | | | 0 | | | | 0 | |
| Capital Changes & Surplus Adj | | | 0 | | | | 0 | | | | 0 | | | | 0 | | | | 0 | |
| | | 2012 Y | | | 2013 Y | | | 2014 Y | | | 2015 Y | | | 2016 Y | |
| Dividends to Stockholders | | | 0 | | | | 0 | | | | 0 | | | | 0 | | | | 0 | |
| All Other Changes in Surplus | | | (378 | ) | | | (274 | ) | | | 352 | | | | 36 | | | | (116 | ) |
| Capital & Surplus, Current Period Ended | | | 18,984 | | | | 17,988 | | | | 17,287 | | | | 15,299 | | | | 14,716 | |
Site content and design Copyright © 2018, S&P Global Market Intelligence
Usage of this product is governed by the SNL Master Subscription Agreement or separate S&P Agreement, as applicable.
S&P Global Market Intelligence, 55 Water Street, New York, NY 10041,
Federal Life Insurance Company | Life Financial Highlights
MI STAT ENTITY KEY: C2347
Periods Last Five Years
| | | 2012 Y | | | 2013 Y | | | 2014 Y | | | 2015 Y | | | 2016 Y | |
| Period Ended | | 12/31/2012 | | | 12/31/2013 | | | 12/31/2014 | | | 12/31/2015 | | | 12/31/2016 | |
| Data displayed in $000 unless otherwise noted | | | | | | | | | | | | | | | | | | | | |
| | | | | | | | | | | | | | | | | | | | | |
| Balance Sheet | | | | | | | | | | | | | | | | | | | | |
| Total Cash and Investments | | | 191,417 | | | | 194,879 | | | | 196,189 | | | | 197,090 | | | | 198,287 | |
| Separate Account Assets | | | 21,536 | | | | 26,068 | | | | 26,651 | | | | 23,335 | | | | 21,513 | |
| Total Assets | | | 220,144 | | | | 228,237 | | | | 229,695 | | | | 227,690 | | | | 227,519 | |
| Affiliated Investments (incl above) | | | 5,195 | | | | 6,186 | | | | 550 | | | | 572 | | | | 2,578 | |
| | | | | | | | | | | | | | | | | | | | | |
| Net Policy Reserves - Life | | | 162,403 | | | | 166,454 | | | | 169,171 | | | | 171,775 | | | | 173,876 | |
| Net Policy Reserves - A&H | | | 563 | | | | 491 | | | | 491 | | | | 422 | | | | 351 | |
| Total Policy Reserves | | | 162,966 | | | | 166,946 | | | | 169,662 | | | | 172,197 | | | | 174,227 | |
| Interest Maintenance Reserve | | | 847 | | | | 918 | | | | 733 | | | | 869 | | | | 686 | |
| Asset Valuation Reserve | | | 2,922 | | | | 3,230 | | | | 2,928 | | | | 2,765 | | | | 2,822 | |
| Total Liabilities | | | 201,160 | | | | 210,250 | | | | 212,408 | | | | 212,392 | | | | 212,803 | |
| | | | | | | | | | | | | | | | | | | | | |
| Surplus Notes | | | 0 | | | | 0 | | | | 0 | | | | 0 | | | | 0 | |
| Capital and Surplus | | | 18,984 | | | | 17,988 | | | | 17,287 | | | | 15,299 | | | | 14,716 | |
| | | | | | | | | | | | | | | | | | | | | |
| C&S / Assets (%) | | | 9.56 | | | | 8.90 | | | | 8.51 | | | | 7.49 | | | | 7.14 | |
| Total Reserves & Deposits / C&S (%) | | | 909.41 | | | | 980.25 | | | | 1,037.00 | | | | 1,191.19 | | | | 1,255.46 | |
| | | | | | | | | | | | | | | | | | | | | |
| Income Statement | | | | | | | | | | | | | | | | | | | | |
| Premiums, Consideration & Deposits | | | 22,396 | | | | 23,264 | | | | 20,627 | | | | 20,826 | | | | 23,001 | |
| Net Investment Income | | | 10,431 | | | | 10,629 | | | | 10,281 | | | | 9,747 | | | | 9,586 | |
| Separate Accounts Revenue | | | 171 | | | | 199 | | | | 218 | | | | 220 | | | | 183 | |
| Total Revenue | | | 33,280 | | | | 34,419 | | | | 31,460 | | | | 31,176 | | | | 33,181 | |
| | | | | | | | | | | | | | | | | | | | | |
| Benefits | | | 19,675 | | | | 20,039 | | | | 18,059 | | | | 14,933 | | | | 17,178 | |
| Surrenders | | | 2,563 | | | | 2,294 | | | | 3,262 | | | | 6,165 | | | | 7,125 | |
| Increase in Reserves and Deposits | | | 685 | | | | 4,246 | | | | 2,977 | | | | 3,680 | | | | 2,345 | |
| Commissions | | | 1,700 | | | | 1,759 | | | | 1,538 | | | | 1,656 | | | | 1,925 | |
| General & Administrative Expense | | | 9,926 | | | | 8,904 | | | | 8,689 | | | | 8,838 | | | | 9,026 | |
| Net transfers to Separate Accounts | | | (146 | ) | | | (779 | ) | | | (1,840 | ) | | | (2,714 | ) | | | (3,733 | ) |
| Policyholder Dividends | | | 287 | | | | 284 | | | | 271 | | | | 253 | | | | 86 | |
| Income Tax | | | (156 | ) | | | (424 | ) | | | (335 | ) | | | (245 | ) | | | (310 | ) |
| Net Realized Capital Gains (Losses) | | | 410 | | | | 299 | | | | 1,234 | | | | (55 | ) | | | 1,021 | |
| Net Income | | | (1,739 | ) | | | (2,402 | ) | | | (620 | ) | | | (2,276 | ) | | | (64 | ) |
| | | | | | | | | | | | | | | | | | | | | |
| Pre-tax Operating Income | | | (2,305 | ) | | | (3,124 | ) | | | (2,189 | ) | | | (2,467 | ) | | | (1,395 | ) |
| | | | | | | | | | | | | | | | | | | | | |
| Premiums & Annuity Considerations By Major Segment (%) | | | | | | | | | | | | | | | | | | | | |
| Life | | | 90.10 | | | | 83.70 | | | | 89.13 | | | | 84.20 | | | | 66.35 | |
| Annuities | | | 8.92 | | | | 15.14 | | | | 10.01 | | | | 14.88 | | | | 32.07 | |
| Accident & Health | | | 0.98 | | | | 0.86 | | | | 0.85 | | | | 0.73 | | | | 0.61 | |
| Credit | | | 0.00 | | | | 0.00 | | | | 0.00 | | | | 0.00 | | | | 0.00 | |
| Other | | | 0.00 | | | | 0.30 | | | | 0.00 | | | | 0.19 | | | | 0.97 | |
| | | | | | | | | | | | | | | | | | | | | |
| Operating Ratios (%) | | | | | | | | | | | | | | | | | | | | |
| Growth Rate - Direct Premium & Annuity Cnsdrtns | | | (7.11 | ) | | | 9.03 | | | | (6.63 | ) | | | 6.43 | | | | 20.18 | |
| Growth Rate - Premium & Annuity Cnsdrtns | | | (12.75 | ) | | | 3.88 | | | | (11.34 | ) | | | 0.97 | | | | 10.44 | |
| Growth Rate - Operating Income | | | NM | | | | NM | | | | NM | | | | NM | | | | NM | |
| Growth Rate - Revenue | | | (10.08 | ) | | | 3.42 | | | | (8.60 | ) | | | (0.90 | ) | | | 6.43 | |
| Benefit Ratio (Premiums) | | | 87.85 | | | | 86.14 | | | | 87.55 | | | | 71.70 | | | | 74.68 | |
| Commission Ratio | | | 7.59 | | | | 7.56 | | | | 7.46 | | | | 7.95 | | | | 8.37 | |
| Expense Ratio (Premiums) | | | 44.32 | | | | 38.27 | | | | 42.12 | | | | 42.44 | | | | 39.24 | |
| | | 2012 Y | | | 2013 Y | | | 2014 Y | | | 2015 Y | | | 2016 Y | |
| Change in Policyholder Dividend | | | (7.64 | ) | | | (1.16 | ) | | | (4.55 | ) | | | (6.61 | ) | | | (65.90 | ) |
| Effective Tax Rate | | | NM | | | | NM | | | | NM | | | | NM | | | | NM | |
| Net Yield on Avg. Invested Assets | | | 5.43 | | | | 5.50 | | | | 5.28 | | | | 4.97 | | | | 4.87 | |
| Pre-Tax Operating Margin | | | (6.93 | ) | | | (9.08 | ) | | | (6.96 | ) | | | (7.91 | ) | | | (4.20 | ) |
| Return on Average Equity | | | (8.86 | ) | | | (13.35 | ) | | | (3.53 | ) | | | (14.17 | ) | | | (0.45 | ) |
| Pre-Tax Operating ROAE | | | (11.74 | ) | | | (17.36 | ) | | | (12.47 | ) | | | (15.35 | ) | | | (9.84 | ) |
| Return on Average Assets | | | (0.78 | ) | | | (1.06 | ) | | | (0.27 | ) | | | (0.99 | ) | | | (0.03 | ) |
| | | | | | | | | | | | | | | | | | | | | |
| Capital, Leverage & Liquidity (%) | | | | | | | | | | | | | | | | | | | | |
| RBC - Total Adjusted Capital | | | 22,053 | | | | 21,360 | | | | 20,350 | | | | 18,192 | | | | 17,581 | |
| ACL Risk Based Capital | | | 3,471 | | | | 3,373 | | | | 3,095 | | | | 3,052 | | | | 2,906 | |
| Risk Based Capital Ratio(TAC/ACL RBC) | | | 635.32 | | | | 633.27 | | | | 657.47 | | | | 595.98 | | | | 604.91 | |
| Net Premiums Written / C&S | | | 114.11 | | | | 129.28 | | | | 117.53 | | | | 129.63 | | | | 162.27 | |
| Affiliated Investments / C&S | | | 27.37 | | | | 34.39 | | | | 3.18 | | | | 3.74 | | | | 17.52 | |
| Dividends to Stockholders ($000) | | | 0 | | | | 0 | | | | 0 | | | | 0 | | | | 0 | |
| | | | | | | | | | | | | | | | | | | | | |
| Reserve Analysis | | | | | | | | | | | | | | | | | | | | |
| Total Reserves including Separate Accounts | | | 194,181 | | | | 202,393 | | | | 205,916 | | | | 205,571 | | | | 206,270 | |
| Growth Rate Total Reserves incl. SA (%) | | | 1.46 | | | | 4.23 | | | | 1.74 | | | | (0.17 | ) | | | 0.34 | |
| | | | | | | | | | | | | | | | | | | | | |
| Investments (%) | | | | | | | | | | | | | | | | | | | | |
| Net Yield on Invested Assets | | | 5.43 | | | | 5.50 | | | | 5.28 | | | | 4.97 | | | | 4.87 | |
| Unaff. Bonds / Unaff. Investments | | | 88.03 | | | | 87.53 | | | | 84.94 | | | | 85.86 | | | | 86.17 | |
| Unaff. Preferred Stocks / Unaff. Investments | | | 0.00 | | | | 0.00 | | | | 0.00 | | | | 0.00 | | | | 0.00 | |
| Unaff. Common Stocks / Unaff. Investments | | | 3.74 | | | | 3.63 | | | | 5.63 | | | | 5.14 | | | | 4.03 | |
| Affiliated Investments / Total Investments | | | 2.71 | | | | 3.17 | | | | 0.28 | | | | 0.29 | | | | 1.30 | |
| Gross Yield - Bonds (excl affiliates) | | | 5.44 | | | | 5.16 | | | | 5.04 | | | | 4.77 | | | | 4.63 | |
| Bond Average Asset Quality (1-6) (#) | | | 1.49 | | | | 1.44 | | | | 1.43 | | | | 1.46 | | | | 1.45 | |
| Bonds Rated 3-6 / Total Bonds | | | 7.46 | | | | 5.32 | | | | 5.35 | | | | 5.23 | | | | 4.90 | |
| Bonds < 1 Year / Total Bonds | | | 11.51 | | | | 11.94 | | | | 16.56 | | | | 15.21 | | | | 9.94 | |
| | | | | | | | | | | | | | | | | | | | | |
| Reinsurance Analysis ($000) | | | | | | | | | | | | | | | | | | | | |
| Reinsurance Ceded - Premiums & Annuity Considerations | | | | | | | | | | | | | | | | | | | | |
| Life | | | 218 | | | | 237 | | | | 224 | | | | 230 | | | | 1,872 | |
| Annuities | | | 0 | | | | 0 | | | | 0 | | | | 0 | | | | 0 | |
| Accident and Health | | | 0 | | | | 0 | | | | 0 | | | | 0 | | | | 0 | |
| Reinsurance Ceded - Reserve Credits Taken | | | | | | | | | | | | | | | | | | | | |
| Life & Annuities General Accounts | | | 375 | | | | 378 | | | | 401 | | | | 411 | | | | 2,378 | |
| Life & Annuities Separate Accounts | | | 0 | | | | 0 | | | | 0 | | | | 0 | | | | 0 | |
| Accident & Health (incl Unearned Prem) | | | 32 | | | | 0 | | | | 0 | | | | 0 | | | | 0 | |
| Reinsurance Ceded - Outstanding Surplus Relief | | | | | | | | | | | | | | | | | | | | |
| Life & Annuities General Accounts | | | 0 | | | | 0 | | | | 0 | | | | 0 | | | | 0 | |
| Life & Annuities Separate Accounts | | | 0 | | | | 0 | | | | 0 | | | | 0 | | | | 0 | |
| Accident and Health | | | 0 | | | | 0 | | | | 0 | | | | 0 | | | | 0 | |
Site content and design Copyright © 2018, S&P Global Market Intelligence
Usage of this product is governed by the SNL Master Subscription Agreement or separate S&P Agreement, as applicable.
S&P Global Market Intelligence, 55 Water Street, New York, NY 10041,
EXHIBIT IV-1
Pricing and Financial Characteristics of Public Life Insurance Companies
Exhibit IV-1
Public Life Insurance Market Pricing
As of December 22, 2017
| | | | | Market
Capitalization | | | | | | | | | | | | | | | Dividends(4) | | | Financial Characteristics(6) | |
| | | | | Price/ | | | Market | | | Pricing Ratios(3) | | | Amount/ | | | | | | Payout | | | Total | | | Equity/ | | | Tang. Eq./ | | | Reported | |
| | | | | Share(1) | | | Value | | | P/E | | | P/B | | | P/TB | | | P/TTM Rev | | | Share | | | Yield | | | Ratio(5) | | | Assets | | | Assets | | | T. Assets | | | ROAA | | | ROAE | |
| | | | | ($) | | | ($Mil) | | | (x) | | | (%) | | | (%) | | | (x) | | | ($) | | | (%) | | | (%) | | | ($Mil) | | | (%) | | | (%) | | | (%) | | | (%) | |
| | | | | | | | | | | | | | | | | | | | | | | | | | | | | | | | | | | | | | | | | | | | | |
| Comparable Group | | | | | | | | | | | | | | | | | | | | | | | | | | | | | | | | | | | | | | | | | | | | | | | | | | | | | | | | |
| Averages | | $ | 70.29 | | | $ | 11,360.62 | | | | 16.86 | x | | | 118.22 | % | | | 127.07 | % | | | 1.43 | x | | $ | 0.82 | | | | 1.11 | % | | | 18.09 | % | | $ | 137,723 | | | | 13.04 | % | | | 12.62 | % | | | 0.43 | % | | | 1.13 | % |
| Medians | | $ | 53.31 | | | $ | 5,853.27 | | | | 12.81 | x | | | 101.30 | % | | | 118.49 | % | | | 1.27 | x | | $ | 0.48 | | | | 0.79 | % | | | 16.01 | % | | $ | 45,699 | | | | 13.36 | % | | | 13.21 | % | | | 0.70 | % | | | 9.08 | % |
| | | | | | | | | | | | | | | | | | | | | | | | | | | | | | | | | | | | | | | | | | | | | | | | | | | | | | | | | |
| Comparable Group | | | | | | | | | | | | | | | | | | | | | | | | | | | | | | | | | | | | | | | | | | | | | | | | | | | | | | | | |
| AFL | | Aflac Incorporated | | GA | | $ | 87.21 | | | $ | 34,286.58 | | | | 12.64 | x | | | 156.30 | % | | | NA | | | | 1.54 | x | | $ | 1.80 | | | | 2.06 | % | | | 26.09 | % | | $ | 136,083 | | | | 16.15 | % | | | NA | | | | 2.06 | % | | | 13.09 | % |
| AEL | | American Equity Investment Life Holding Compa | | IA | | $ | 32.13 | | | $ | 2,863.48 | | | | 11.16 | x | | | 103.43 | % | | | 103.43 | % | | | 0.87 | x | | $ | 0.26 | | | | 0.81 | % | | | 9.03 | % | | $ | 60,380 | | | | 4.58 | % | | | 4.58 | % | | | 0.45 | % | | | 10.18 | % |
| ATH | | Athene Holding Ltd. | | | | $ | 51.82 | | | $ | 10,361.74 | | | | NA | | | | 119.53 | % | | | 119.53 | % | | | 1.75 | x | | $ | 0.00 | | | | 0.00 | % | | | NA | | | $ | 96,061 | | | | 9.02 | % | | | 9.02 | % | | | 1.49 | % | | | 17.64 | % |
| BHF | | Brighthouse Financial, Inc. | | NC | | $ | 59.54 | | | $ | 7,131.29 | | | | NA | | | | 51.80 | % | | | 51.80 | % | | | 1.62 | x | | $ | 0.00 | | | | 0.00 | % | | | NA | | | $ | 223,279 | | | | 6.19 | % | | | 6.19 | % | | | -1.25 | % | | | -18.01 | % |
| CIA | | Citizens, Inc. | | TX | | $ | 7.48 | | | $ | 374.61 | | | | 60.49 | x | | | 141.78 | % | | | 152.28 | % | | | 1.48 | x | | $ | 0.00 | | | | 0.00 | % | | | 0.00 | % | | $ | 1,651 | | | | 16.00 | % | | | 15.06 | % | | | 0.39 | % | | | 2.42 | % |
| CNO | | CNO Financial Group, Inc. | | IN | | $ | 24.87 | | | $ | 4,172.25 | | | | 8.98 | x | | | 85.47 | % | | | 85.47 | % | | | 0.99 | x | | $ | 0.36 | | | | 1.45 | % | | | 13.00 | % | | $ | 32,705 | | | | 14.93 | % | | | 14.93 | % | | | 1.48 | % | | | 10.36 | % |
| FFG | | FBL Financial Group, Inc. | | IA | | $ | 71.80 | | | $ | 1,790.23 | | | | 15.99 | x | | | 140.34 | % | | | 141.45 | % | | | 2.43 | x | | $ | 1.76 | | | | 2.45 | % | | | 39.20 | % | | $ | 9,892 | | | | 12.93 | % | | | 12.84 | % | | | 1.16 | % | | | 9.15 | % |
| IHC | | Independence Holding Company | | CT | | $ | 27.95 | | | $ | 415.40 | | | | 14.12 | x | | | 99.16 | % | | | 117.56 | % | | | 1.31 | x | | $ | 0.12 | | | | 0.43 | % | | | 6.06 | % | | $ | 1,039 | | | | 40.69 | % | | | 36.69 | % | | | 3.02 | % | | | 7.69 | % |
| KCLI | | Kansas City Life Insurance Company | | MO | | $ | 45.10 | | | $ | 436.72 | | | | 18.95 | x | | | 62.00 | % | | | 62.00 | % | | | 0.97 | x | | $ | 1.08 | | | | 2.39 | % | | | 45.38 | % | | $ | 4,511 | | | | 15.62 | % | | | 15.62 | % | | | 0.51 | % | | | 3.31 | % |
| LNC | | Lincoln National Corporation | | PA | | $ | 77.75 | | | $ | 17,013.99 | | | | 12.17 | x | | | 104.63 | % | | | 121.57 | % | | | 1.23 | x | | $ | 1.32 | | | | 1.70 | % | | | 20.66 | % | | $ | 276,785 | | | | 5.89 | % | | | 5.11 | % | | | 0.54 | % | | | 9.42 | % |
| MET | | MetLife, Inc. | | NY | | $ | 50.76 | | | $ | 53,414.71 | | | | NM | | | | 97.99 | % | | | 118.77 | % | | | 0.91 | x | | $ | 1.60 | | | | 3.15 | % | | | NA | | | $ | 720,515 | | | | 7.90 | % | | | 6.67 | % | | | -0.05 | % | | | -0.65 | % |
| MDWT | | Midwest Holding Inc. | | NE | | $ | 0.06 | | | $ | 1.39 | | | | NM | | | | 74.52 | % | | | 118.21 | % | | | 0.32 | x | | $ | 0.00 | | | | 0.00 | % | | | NA | | | $ | 48 | | | | 4.92 | % | | | 3.50 | % | | | -10.16 | % | | | -123.48 | % |
| NWLI | | National Western Life Group, Inc. | | TX | | $ | 337.03 | | | $ | 1,158.09 | | | | 12.62 | x | | | 67.98 | % | | | 67.98 | % | | | 1.43 | x | | $ | 0.36 | | | | 0.11 | % | | | 1.35 | % | | $ | 12,138 | | | | 14.85 | % | | | 14.85 | % | | | 0.79 | % | | | 5.38 | % |
| PRI | | Primerica, Inc. | | GA | | $ | 103.40 | | | $ | 4,575.25 | | | | 20.12 | x | | | 358.36 | % | | | 373.64 | % | | | 2.79 | x | | $ | 0.80 | | | | 0.77 | % | | | 15.56 | % | | $ | 12,207 | | | | 10.49 | % | | | 10.10 | % | | | 2.04 | % | | | 19.14 | % |
| PFG | | Principal Financial Group, Inc. | | IA | | $ | 71.26 | | | $ | 20,576.66 | | | | 11.68 | x | | | 171.37 | % | | | 213.56 | % | | | 1.43 | x | | $ | 1.96 | | | | 2.75 | % | | | 32.13 | % | | $ | 247,934 | | | | 4.87 | % | | | 3.95 | % | | | 0.77 | % | | | 16.66 | % |
| PRU | | Prudential Financial, Inc. | | NJ | | $ | 116.16 | | | $ | 49,251.84 | | | | 11.67 | x | | | 97.94 | % | | | NA | | | | 0.87 | x | | $ | 3.00 | | | | 2.58 | % | | | 30.15 | % | | $ | 821,131 | | | | 6.16 | % | | | NA | | | | 0.55 | % | | | 9.01 | % |
| RGA | | Reinsurance Group of America, Incorporated | | MO | | $ | 155.07 | | | $ | 9,987.14 | | | | 12.76 | x | | | 123.27 | % | | | 123.38 | % | | | 0.81 | x | | $ | 2.00 | | | | 1.29 | % | | | 16.46 | % | | $ | 58,694 | | | | 13.80 | % | | | 13.79 | % | | | 1.43 | % | | | 10.42 | % |
| SNFCA | | Security National Financial Corporation | | UT | | $ | 5.40 | | | $ | 82.43 | | | | 14.21 | x | | | 59.16 | % | | | 60.36 | % | | | 0.29 | x | | $ | 0.00 | | | | 0.00 | % | | | 0.00 | % | | $ | 1,008 | | | | 13.83 | % | | | 13.59 | % | | | 0.62 | % | | | 4.39 | % |
| TMK | | Torchmark Corporation | | TX | | $ | 90.69 | | | $ | 10,469.87 | | | | 19.30 | x | | | 202.45 | % | | | 221.36 | % | | | 2.57 | x | | $ | 0.60 | | | | 0.66 | % | | | 12.77 | % | | $ | 22,994 | | | | 22.47 | % | | | 20.96 | % | | | 2.54 | % | | | 11.55 | % |
| UNM | | Unum Group | | TN | | $ | 54.79 | | | $ | 12,294.28 | | | | 12.86 | x | | | 130.10 | % | | | 134.93 | % | | | 1.09 | x | | $ | 0.92 | | | | 1.68 | % | | | 21.60 | % | | $ | 63,806 | | | | 14.81 | % | | | 14.35 | % | | | 1.55 | % | | | 10.60 | % |
| UTGN | | UTG, Inc. | | IL | | $ | 25.00 | | | $ | 83.44 | | | | NM | | | | 85.84 | % | | | 85.84 | % | | | 3.88 | x | | $ | 0.00 | | | | 0.00 | % | | | NA | | | $ | 405 | | | | 24.24 | % | | | 24.24 | % | | | -0.49 | % | | | -2.06 | % |
| VOYA | | Voya Financial, Inc. | | NY | | $ | 51.14 | | | $ | 9,192.25 | | | | NM | | | | 67.33 | % | | | 68.31 | % | | | 0.93 | x | | $ | 0.04 | | | | 0.08 | % | | | NA | | | $ | 226,644 | | | | 6.45 | % | | | 6.37 | % | | | -0.09 | % | | | -1.39 | % |
| | | | | | | | | | | | | | | | | | | | | | | | | | | | | | | | | | | | | | | | | | | | | | | | | | | | | | | | | | | | | |
| Under Acquisition | | | | | | | | | | | | | | | | | | | | | | | | | | | | | | | | | | | | | | | | | | | | | | | | | | | | | | | | |
| GNW | | Genworth Financial, Inc. | | VA | | $ | 3.20 | | | $ | 1,597.31 | | | | 4.78 | x | | | 12.22 | % | | | 12.52 | % | | | 0.18 | x | | $ | 0.00 | | | | 0.00 | % | | | NA | | | $ | 104,629 | | | | 14.42 | % | | | 14.16 | % | | | 0.57 | % | | | 3.99 | % |
| IHRC | | Investors Heritage Capital Corporation | | KY | | $ | 44.00 | | | $ | 48.88 | | | | 40.64 | x | | | 82.54 | % | | | 82.54 | % | | | 0.77 | x | | $ | 0.01 | | | | 0.57 | % | | | 23.09 | % | | $ | 580 | | | | 10.20 | % | | | 10.20 | % | | | 0.20 | % | | | 2.05 | % |
| (1) | Core income, on a diluted per-share basis. Core income is net income after taxes and before extraordinary items, less net income attributable to noncontrolling interest, gain on the sale of securities, amortization of intangibles, goodwill and nonrec |
| (2) | P/E = Price to earnings; P/B = Price to book; P/A = Price to assets; P/TB = Price to tangible book value; and P/Core = Price to core earnings. P/E and P/Core =NM if the ratio is negative or above 35x. |
| (3) | Indicated 12 month dividend, based on last quarterly dividend declared. |
| (4) | Indicated 12 month dividend as a percent of trailing 12 month earnings. |
| (5) | ROAA (return on average assets) and ROAE (return on average equity) are indicated ratios based on trailing 12 month earnings and average equity and assets balances. |
| (6) | Excludes from averages and medians those companies the subject of actual or rumored acquisition activities or unusual operating characteristics. |
Source: S&P Global Market Intelligence and RP Financial, LC. calculations. The information provided in this report has been obtained from sources we believe are reliable, but we cannot guarantee the accuracy or completeness of such information.
Copyright (c) 2017 by RP® Financial, LC.
EXHIBIT IV-2
Pro Forma Analysis Sheet
RP Financial, LC.
Financial Services Industry Consultants
Exhibit IV-2
Pro Forma Analysis Sheet
Federal Life Insurance Company
| | | | | | | | | | | Peer Group Aggregate | | | | | | | | | |
| Valuation Midpoint Pricing Multiples | | | | | Symbol | | | Subject (1) | | Mean | | | Median | | | | | | | | | |
| | | | | | | | | | | | | | | | | | | | | | | |
| 1. Price-earnings multiple | | = | | | P/E | | | N.M. | | 19.56 | x | | 14.16 | x | | | | | | | | |
| 2. Price-book ratio | | = | | | P/B | | | 55.10 | % | 93.90 | % | | 85.80 | % | | | | | | | | |
| 3. Price-tangible book ratio | | = | | | P/TB | | | 55.10 | % | 97.40 | % | | 85.80 | % | | | | | | | | |
| 4. Price-revenue ratio | | = | | | P/Rev. | | | 1.60 | x | 1.52 | x | | 1.31 | x | | | | | | | | |
| | | | | | | | | | | | | | | | | | | | | | | |
| Valuation Parameters | | | | | | | | | | | | | | | | | | | | | | |
| Pre-Conversion Reported Earnings (Y) | | | | $ | (1,480,000 | ) | | 30-Sep-17 | | ESOP Stock Purchases (E) | | | | 0.00 | % | | | (4) | |
| Pre-Conversion Core Earnings (CE) | | | | $ | (1,480,000 | ) | | 30-Sep-17 | | Cost of ESOP Borrowings (S) | | | | 0.00 | % | | | | |
| Pre-Conversion Book Value (B) | | | | $ | 36,241,000 | | | 30-Sep-17 | | ESOP Amortization (T) | | | | 0.00 | | | | years | |
| Pre-Conv. Tang. Book Value (TB) | | | | $ | 36,241,000 | | | 30-Sep-17 | | Stock Programs Amount (M) | | | | 0.00 | % | | | | |
| Pre-Conversion Assets (A) | | | | $ | 257,638,000 | | | 30-Sep-17 | | Stock Programs Vesting (N) | | | | 5.00 | | | | years (4) | |
| Pre-Conversion Revenues (Rev.) | | | | $ | 23,812,000 | | | 30-Sep-17 | | Percentage Sold (PCT) | | | | 100.00 | % | | | | |
| Reinvestment Rate (R)(2) | | | | | 3.11 | % | | | | Fixed Expenses | | | $ | 1,500,000 | | | | | |
| Est. Conversion Expenses (X)(3) | | | | | 9.13 | % | | | | Commissions Paid on Sales to Friends and Family | | | | | | | | | |
| Tax Rate (TAX) | | | | | 0.00 | % | | | | Insiders, Friends and Family | | | | 2.00 | % | | | | |
| Price/Share | | | | $ | 10.00 | | | | | Insider Purchases | | | $ | 10,000,000 | | | | | |
| | | | | | | | | | | Commissions Paid on Sales to Public/Standby Investor | | | | 6.50 | % | | | | |
| | | | | | | | | | | Option (O1) | | | | 0.00 | % | | | | |
| | | | | | | | | | | Estimated Option Value (O2) | | | | 0.00 | % | | | | |
| | | | | | | | | | | Option vesting (O3) | | | | 0.00 | | | | | |
| | | | | | | | | | | Option pct taxable (O4) | | | | 25.00 | % | | | | |
Calculation of Pro Forma Value After Conversion
| | 1. | V= | | P/E * Y | | V= | N.M. |
| | | | | (1 - P/E * PCT * ((1-X-E-M)*R - (1-TAX)*E/T - (1-TAX)*M/N) - (1-(TAX*O4))*O1*O2/O3) | | | |
| | | | | | | | |
| | 2. | V= | | P/BE * (Y) | | V= | N.M. |
| | | | | (1 - P/BE * PCT * ((1-X-E-M)*R - (1-TAX)*E/T - (1-TAX)*M/N) - (1-(TAX*O4))*O1*O2/O3) | | | |
| | | | | | | | |
| | 3. | V= | | P/B * B | | V= | $40,000,000 |
| | | | | 1 - P/B * PCT * (1-X-E-M) | | | |
| | | | | | | | |
| | 4. | V= | | P/TB * TB | | V= | $40,000,000 |
| | | | | 1 - P/TB * PCT * (1-X-E-M) | | | |
| | | | | | | | |
| | 5. | V= | | P/Rev. * Rev. | | V= | $40,000,000 |
| | | | | 1 - P/Rev. * PCT * (1-X-E-M)*R | | | |
| | | Shares | | | Price/ | | | Gross | | | Pro Forma | |
| Conclusion and Range of Value | | Issued | | | Share | | | Proceeds | | | Market Value | |
| | | | | | | | | | | | | | | | | |
| Minimum | | | 3,400,000 | | | | 10.00000 | | | $ | 34,000,000 | | | $ | 34,000,000 | |
| Midpoint | | | 4,000,000 | | | | 10.00000 | | | $ | 40,000,000 | | | $ | 40,000,000 | |
| Maximum | | | 4,600,000 | | | | 10.00000 | | | $ | 46,000,000 | | | $ | 46,000,000 | |
| (1) | Pricing ratios shown reflect the Midpoint Value. |
| (2) | Net return reflects a reinvestment rate of 2.00%, and a tax rate of 0.0%. |
| (3) | Estimated offering expenses at midpoint of the offering. |
| (4) | Stock benefit plans amortization expenses tax effected at 0.0%. |
EXHIBIT IV-3
Pro Forma Effects of Offering Proceeds
RP Financial, LC.
Financial Services Industry Consultants
Exhibit IV-3
Pro Forma Effect of Conversion
Federal Life Insurance Company
| Demutualization Proceeds | | Minimum | | | Midpoint | | | Maximum | |
| Shares Issued | | | 3,400,000 | | | | 4,000,000 | | | | 4,600,000 | |
| Price Per Share | | $ | 10.00 | | | $ | 10.00 | | | $ | 10.00 | |
| | | | | | | | | | | | | |
| Gross Offering Proceeds | | $ | 34,000,000 | | | $ | 40,000,000 | | | $ | 46,000,000 | |
| Less: Estimated Offering Expenses | | | 3,260,000 | | | | 3,650,000 | | | | 4,040,000 | |
| Net Demutualization Proceeds | | $ | 30,740,000 | | | $ | 36,350,000 | | | $ | 41,960,000 | |
| | | | | | | | | | | | | |
| Estimated Additional Income from Demutualization Proceeds | | | | | | | | | | | | |
| Net Demutualization Proceeds | | $ | 30,740,000 | | | $ | 36,350,000 | | | $ | 41,960,000 | |
| Less: Non-Cash Stock Purchases | | | - | | | | - | | | | - | |
| Net Proceeds Available for Reinvestment | | $ | 30,740,000 | | | $ | 36,350,000 | | | $ | 41,960,000 | |
| Estimated Net Incremental Rate of Return (1) | | | 3.11 | % | | | 3.11 | % | | | 3.11 | % |
| Reinvestment Income | | $ | 956,014 | | | $ | 1,130,485 | | | $ | 1,304,956 | |
| | | Before | | | | |
| Earnings Pro Forma Impact | | Demutualization | | | Pro Forma After Demutualization | |
| | | | | | | | | | | | | |
| 12 Months ended September 30, 2017 | | $ | (1,480,000 | ) | | $ | (523,986 | ) | | $ | (349,515 | ) | | $ | (175,044 | ) |
| 12 Months ended September 30, 2017 | | $ | (1,480,000 | ) | | $ | (523,986 | ) | | $ | (349,515 | ) | | $ | (175,044 | ) |
| | | | | | | | | | | | | | | | | |
| Net Worth Pro Forma Impact | | | | | | | | | | | | | | | | |
| | | | | | | | | | | | | | | | | |
| September 30, 2017 (GAAP Estimated) | | $ | 36,241,000 | | | $ | 66,981,000 | | | $ | 72,591,000 | | | $ | 78,201,000 | |
| September 30, 2017 (Tangible GAAP Estimated) | | $ | 36,241,000 | | | $ | 66,981,000 | | | $ | 72,591,000 | | | $ | 78,201,000 | |
| | | | | | | | | | | | | | | | | |
| Revenues Pro Forma Impact | | | | | | | | | | | | | | | | |
| | | | | | | | | | | | | | | | | |
| 12 Months ended September 30, 2017 | | $ | 23,812,000 | | | $ | 24,768,014 | | | $ | 24,942,485 | | | $ | 25,116,956 | |
| (1) | Based on current portfolio mix and anticipated short term use of proceeds. |
EXHIBIT V-1
RP Financial, LC.
Firm Qualifications Statement

| FIRM QUALIFICATION STATEMENT |
RP® Financial (“RP®) provides financial and management consulting, merger advisory and valuation services to the financial services industry nationwide. We offer a broad array of services, high quality and prompt service, hands-on involvement by principals and senior staff, careful structuring of strategic initiatives and sophisticated valuation and other analyses consistent with industry practices and regulatory requirements. Our staff maintains extensive background in financial and management consulting, valuation and investment banking. Our clients include commercial banks, thrifts, credit unions, mortgage companies, insurance companies and other financial services companies.
| STRATEGIC PLANNING SERVICES |
RP®’s strategic planning services are designed to provide effective feasible plans with quantifiable results. We analyze strategic options to enhance shareholder value, achieve regulatory approval or realize other objectives. Such services involve conducting situation analyses; establishing mission/vision statements, developing strategic goals and objectives; and identifying strategies to enhance franchise and/or market value, capital management, earnings enhancement, operational matters and organizational issues. Strategic recommendations typically focus on: capital formation and management, asset/liability targets, profitability, return on equity and stock pricing. Our proprietary financial simulation models provide the basis for evaluating the impact of various strategies and assessing their feasibility and compatibility with regulations.
RP®’s merger advisory services include targeting potential buyers and sellers, assessing acquisition merit, conducting due diligence, negotiating and structuring merger transactions, preparing merger business plans and financial simulations, rendering fairness opinions, preparing mark-to-market analyses, valuing intangible assets and supporting the implementation of post-acquisition strategies. Our merger advisory services involve transactions of financially healthy companies and failed bank deals. RP® is also expert in de novo charters and shelf charters. Through financial simulations, comprehensive data bases, valuation proficiency and regulatory familiarity, RP®’s merger advisory services center on enhancing shareholder returns.
RP®’s extensive valuation practice includes bank and thrift mergers, thrift mutual-to-stock conversions, goodwill impairment, insurance company demutualizations, ESOPs, subsidiary companies, merger accounting and other purposes. We are highly experienced in performing appraisals which conform to regulatory guidelines and appraisal standards. RP® is the nation’s leading valuation firm for thrift mutual-to-stock conversions, with appraised values ranging up to $4 billion.
| OTHER CONSULTING SERVICES |
RP® offers other consulting services including evaluating the impact of regulatory changes (TARP, etc.), branching and diversification strategies, feasibility studies and special research. We assist banks/thrifts in preparing CRA plans and evaluating wealth management activities on a de novo or merger basis. Our other consulting services are facilitated by proprietary valuation and financial simulation models.
| KEY PERSONNEL (Years of Relevant Experience & Contact Information) |
| Ronald S. Riggins, Managing Director (37) | (703) 647-6543 | rriggins@rpfinancial.com |
| William E. Pommerening, Managing Director (33) | (703) 647-6546 | wpommerening@rpfinancial.com |
| Marcus Faust, Managing Director (29) | (703) 647-6553 | mfaust@rpfinancial.com |
| Gregory E. Dunn, Director (34) | (703) 647-6548 | gdunn@rpfinancial.com |
| James P. Hennessey, Director (30) | (703) 647-6544 | jhennessey@rpfinancial.com |
| James J. Oren, Director (30) | (703) 647-6549 | joren@rpfinancial.com |
| Carla Pollard, Senior Vice President (27) | (703) 647-6556 | cpollard@rpfinancial.com |
| Washington Headquarters | |
| Three Ballston Plaza | Telephone: (703) 528-1700 |
| 1100 North Glebe Road, Suite 600 | Fax No.: (703) 528-1788 |
| Arlington, VA 22201 | Toll-Free No.: (866) 723-0594 |
| www.rpfinancial.com | E-Mail: mail@rpfinancial.com |