UNITED STATES SECURITIES AND EXCHANGE COMMISSION
Washington, DC 20549
Form 10-K
(Mark One) | | | | | | | | |
| | x
| ANNUAL REPORT PURSUANT TO SECTION 13 OR 15(d) OF THE SECURITIES EXCHANGE ACT OF 1934 |
| | For the fiscal year ended September 30, 2022 |
OR
| | | | | | | | |
| | ¨
| TRANSITION REPORT PURSUANT TO SECTION 13 OR 15(d) OF THE SECURITIES EXCHANGE ACT OF 1934 |
COMMISSION FILE NUMBER: 000-55975
Oaktree Strategic Income II, Inc.
(EXACT NAME OF REGISTRANT AS SPECIFIED IN ITS CHARTER)
| | | | | | | | |
DELAWARE (State or jurisdiction of
incorporation or organization) | | 83-0566439 (I.R.S. Employer
Identification No.) |
| | |
333 South Grand Avenue, 28th Floor Los Angeles, CA (Address of principal executive office) | | 90071 (Zip Code) |
REGISTRANT’S TELEPHONE NUMBER, INCLUDING AREA CODE:
(213) 830-6300
Indicate by check mark if the registrant is a well-known seasoned issuer, as defined in Rule 405 of the Securities Act. Yes ¨ No x
Indicate by check mark if the registrant is not required to file reports pursuant to Section 13 or Section 15(d) of the Act. Yes ¨ No x
Indicate by check mark whether the registrant (1) has filed all reports required to be filed by Section 13 or 15(d) of the Securities Exchange Act of 1934 during the preceding 12 months (or for such shorter periods as the registrant was required to file such reports), and (2) has been subject to such filing requirements for the past 90 days. Yes x No ¨
Indicate by check mark whether the registrant has submitted electronically every Interactive Data File required to be submitted pursuant to Rule 405 of Regulation S-T (§232.405 of this chapter) during the preceding 12 months (or for such shorter period that the registrant was required to submit such files). Yes ¨ No ¨
Indicate by check mark whether the registrant is a large accelerated filer, an accelerated filer, a non-accelerated filer, a smaller reporting company, or an emerging growth company. See the definitions of “large accelerated filer,” “accelerated filer”, “smaller reporting company” and "emerging growth company" in Rule 12b-2 of the Exchange Act.
| | | | | | | | | | | | | | | | | | | | |
Large accelerated filer o | | Accelerated filer o | | Non-accelerated filer x | | Smaller reporting company o |
| | | | | | |
| | | | | | |
Emerging growth company x
| | If an emerging growth company, indicate by check mark if the registrant has elected not to use the extended transition period for complying with any new or revised financial accounting standards provided pursuant to Section 13(a) of the Exchange Act x
|
Indicate by check mark whether the registrant has filed a report on and attestation to its management's assessment of the effectiveness of its internal control over financial reporting under Section 404(b) of the Sarbanes-Oxley Act (15 U.S.C. 7262(b)) by the registered public accounting firm that prepared or issued its audit report. o
Indicate by check mark whether the registrant is a shell company (as defined in Rule 12b-2 of the Act) Yes ¨ No x
Securities registered pursuant to Section 12(b) of the Act
| | | | | | | | |
| Title of Each Class | Trading Symbol(s) | Name of Exchange on Which Registered |
| N/A | N/A | N/A |
Securities registered pursuant to Section 12(g) of the Act: Common Stock, par value $0.001 per share
| | | | | | | | |
| Class | | Outstanding at December 13, 2022 |
| Common stock, $0.001 par value | | 17,401,121 |
As of September 30, 2022, there was no established public market for the registrant's common stock.
OAKTREE STRATEGIC INCOME II, INC.
FORM 10-K FOR THE YEAR ENDED SEPTEMBER 30, 2022
TABLE OF CONTENTS
| | | | | | | | |
| | |
| PART I | |
| Item 1. | | |
| Item 1A. | | |
| Item 1B. | | |
| Item 2. | | |
| Item 3. | | |
| Item 4. | | |
| PART II | |
| Item 5. | | |
| Item 6. | | |
| Item 7. | | |
| Item 7A. | | |
| Item 8. | | |
| Item 9. | | |
| Item 9A. | | |
| Item 9B. | | |
| PART III | |
| Item 10. | | |
| Item 11. | | |
| Item 12. | | |
| Item 13. | | |
| Item 14. | | |
| PART IV | |
| Item 15. | | |
| Item 16. | | |
| |
PART I
Item 1. Business
General
Oaktree Strategic Income II, Inc. (together with its subsidiaries, where applicable, the "Company", which may also be referred to as "we," "us" or "our") is structured as a closed-end investment company focused on lending to small-and medium-sized companies. We have elected to be regulated as a business development company (a "BDC") under the Investment Company Act of 1940, as amended (together with the rules and regulations promulgated thereunder, the "Investment Company Act") and have elected to be treated, and to comply with the requirements to qualify annually, as a regulated investment company ("RIC") under Subchapter M of the Internal Revenue Code of 1986, as amended (together with the rules and regulations promulgated thereunder, the "Code").
We were formed on April 30, 2018 as a Delaware corporation and are externally managed by Oaktree Fund Advisors, LLC (the "Adviser" or "Oaktree"). Oaktree is an affiliate of Oaktree Capital Management, L.P. ("OCM"), the Company's external investment adviser through May 11, 2020, and a subsidiary of Oaktree Capital Group, LLC ("OCG"). In 2019, Brookfield Asset Management Inc. ("Brookfield") acquired a majority economic interest in OCG. OCG operates as an independent business within Brookfield, with its own product offerings and investment, marketing and support teams. Oaktree Fund Administration, LLC (the “Administrator”), a subsidiary of OCM, provides certain administrative and other services necessary for us to operate.
Our investment objective is to generate current income and long-term capital appreciation. We seek to achieve our investment objective without subjecting principal to undue risk of loss by investing primarily in situations where a company or its owners (a) are overleveraged or facing pressures to recapitalize, (b) are unable to access broadly syndicated capital markets, (c) are undervalued after having recently exited bankruptcy or completed a restructuring or (d) are otherwise affected by mispricings or inefficiencies in the capital markets or at different points throughout the credit cycle. See "Item 1A. Risk Factors – Risks Relating to Our Investments – Our investments in portfolio companies may be risky, and we could lose all or parts of our investments." We seek to generate revenues primarily in the form of interest income from the investments we hold. In conducting our investment activities, we believe that we benefit from the significant scale and resources of Oaktree and its affiliates.
We conducted private offerings (each, a “Private Offering”) of shares of our common stock (the "Common Stock") to investors in reliance on exemptions from the registration requirements of the Securities Act of 1933, as amended (the “Securities Act”). At each closing of a Private Offering, each investor participating in that closing made a capital commitment (each a “Capital Commitment”) to purchase shares of our Common Stock pursuant to a subscription agreement entered into with us in connection with its Capital Commitment (a "Subscription Agreement"). The initial closing of a Private Offering occurred on August 6, 2018 (the "Initial Closing"). We commenced our loan origination and investment activities shortly after our initial capital drawdown from our non-affiliated investors (the "Initial Drawdown"). The proceeds from the Initial Drawdown provided us with the necessary seed capital to commence operations.
As of September 30, 2022, we completed drawdowns of $337,558,996, or 100%, of Capital Commitments from investors in connection with Private Offerings, of which $3,854,346 in Capital Commitments were made by one or more affiliates of the Adviser. As of September 30, 2022, the fair value of our investment portfolio was $559.3 million and was comprised of investments in 115 portfolio companies. At fair value, 97.3% of our portfolio consisted of senior secured debt investments as of September 30, 2022. The weighted average annual yield of our debt investments at fair value as of September 30, 2022 was approximately 10.6%.
We are permitted to, and expect to continue to, finance our investments through borrowings. However, as a BDC, subject to certain limited exceptions, we are currently only allowed to borrow amounts in accordance with the asset coverage requirements in the Investment Company Act. On March 23, 2018, the Small Business Credit Availability Act (the “SBCAA”) was enacted into law. The SBCAA, among other things, amended Section 61(a) of the Investment Company Act to add a new Section 61(a)(2) that reduces the asset coverage requirements applicable to BDCs from 200% to 150% so long as the BDC meets certain disclosure requirements, which we have made, and obtains certain approvals, which we have obtained. Accordingly, we are subject to an asset coverage requirement of 150%. The amount of leverage that we employ will depend on our assessment of market conditions and other factors at the time of any proposed borrowing, such as the maturity, covenant package and rate structure of the proposed borrowings, our ability to raise funds through the issuance of shares of our common stock and the risks of such borrowings within the context of our investment outlook. Ultimately, we only intend to use leverage if the expected returns from borrowing to make investments will exceed the cost of such borrowing. As of September 30, 2022, we had senior securities outstanding of $257.0 million and an asset coverage ratio of 225.3%.
On September 14, 2022, we entered into an Agreement and Plan of Merger (the “Merger Agreement”) with Oaktree Specialty Lending Corporation, a Delaware corporation (“OCSL”), Project Superior Merger Sub, Inc., a Delaware corporation and wholly-owned subsidiary of OCSL (“Merger Sub”), and, solely for the limited purposes set forth therein, the Adviser. The Merger Agreement provides that, subject to the conditions set forth in the Merger Agreement, at the effective time of the Merger (the “Effective Time”), Merger Sub will merge with and into the Company, with the Company continuing as the surviving company and as a wholly-owned subsidiary of OCSL (the “Merger”) and, immediately thereafter, the Company will merge with and into OCSL, with OCSL continuing as the surviving company (together with the Merger, the “Mergers”). See “Risk Factors – Risks Relating to the Mergers” and “Item 7. Management’s Discussion and Analysis of Financial Condition and Results of Operations—Recent Developments—Merger Agreement” for further information regarding the Merger Agreement and the Mergers.
Our Adviser
Our investment activities are managed by our Adviser. Subject to the overall supervision of our board of directors, our Adviser manages our day-to-day operations and provides investment advisory services to us pursuant to the investment advisory agreement (the “Investment Advisory Agreement”) by and between our Adviser and us.
Our Adviser is a Delaware limited liability company registered with the Securities and Exchange Commission (the “SEC”) as an investment adviser under the U.S. Investment Advisers Act of 1940, as amended (the “Advisers Act”). Our Adviser is an affiliate of OCM, a leading global investment management firm headquartered in Los Angeles, California, focused on less efficient markets and alternative investments. A number of the senior executives and investment professionals of our Adviser and its affiliates have been investing together for over 35 years and have generated impressive investment performance through multiple market cycles. Our Adviser and its affiliates emphasize an opportunistic, value oriented and risk-controlled approach to investments in distressed debt, corporate debt (including high-yield debt and senior loans), control investing, real estate, convertible securities and listed equities.
In 2019, Brookfield acquired a majority economic interest in OCG. OCG operates as an independent business within Brookfield, with its own product offerings and investment, marketing and support teams. Brookfield is a leading global alternative asset manager with over a 100 year history and over $750 billion of assets under management (inclusive of OCG) across a broad portfolio of real estate, infrastructure, renewable power, credit and private equity assets. Commencing in 2022, OCG's founders, senior management and current and former employee-unitholders of OCG will be able to sell their remaining OCG units to Brookfield over time pursuant to an agreed upon liquidity schedule and approach to valuing such units at the time of liquidation. Pursuant to this liquidity schedule, the earliest year in which Brookfield could own 100% of the OCG business is 2029.
The primary firm-wide goal of our Adviser and its affiliates is to achieve attractive returns while bearing less than commensurate risk. Our Adviser and its affiliates believe that they can achieve this goal by taking advantage of market inefficiencies in which financial markets and their participants fail to accurately value assets or fail to make available to companies the capital that they reasonably require. Our Adviser and its affiliates believe that their defining characteristic is their adherence to the highest professional standards, which has yielded several important benefits. First and foremost, this characteristic has allowed our Adviser and its affiliates to attract and retain an extremely talented group of investment professionals (the "Investment Professionals"), as well as accounting, valuation, legal, compliance and other administrative professionals. As of September 30, 2022, our Adviser and its affiliates had more than 1,000 professionals in 20 cities and 14 countries, including a deep and broad credit platform drawing from more than 350 highly experienced investment professionals with significant origination, structuring and underwriting expertise. Specifically, the Strategic Credit group that is primarily responsible for implementing our investment strategy consists of approximately 30 Investment Professionals led by Armen Panossian, our Chief Executive Officer and Chief Investment Officer, who focus on the investment strategy employed by our Adviser and certain of its affiliates. In addition, this characteristic has permitted the investment team to build strong relationships with brokers, banks and other market participants. These institutional relationships have been instrumental in strengthening access to trading opportunities, to understanding the current market, and to executing the investment team’s investment strategies. Our Adviser and its affiliates aim to attract, motivate and retain talented employees (both Investment Professionals and accounting, valuation, legal, compliance and other administrative professionals) by making them active participants in, and beneficiaries of, the platform’s success. In addition to competitive base salaries, all OCM employees share in a discretionary bonus pool. An employee’s participation in the bonus pool is based on the overall success of our Adviser and its affiliates and the individual employee’s performance and level of responsibility.
Our Adviser and its affiliates provide discretionary investment management services to other managed accounts and investment funds, which may have overlapping investment objectives and strategies with our own and, accordingly, may invest in asset classes similar to those targeted by us. The activities of such managed accounts and investment funds may raise actual or potential conflicts of interest. See "-Allocation of Investment Opportunities and Potential Conflicts of Interest" below and
"Item 1A. Risk Factors - Risks Relating to Our Business and Structure - Conflicts of Interest may exist from time to time between our Adviser and certain of its affiliates involved with us, which could impair our investments returns."
Strategic Credit
Our Adviser's affiliates officially launched the Strategic Credit strategy in early 2013 as a step-out from the Distressed Debt strategy, to capture attractive investment opportunities that appear to offer too little return for distressed debt investors, but may pose too much uncertainty for high-yield bond creditors. The strategy seeks to achieve an attractive total return by investing in public and private revenue-generating, performing debt.
Strategic Credit focuses on U.S. and non-U.S. investment opportunities that arise from pricing inefficiencies that occur in the primary and secondary markets or from the financing needs of healthy companies with limited access to traditional lenders or public markets. Typical investments will be in high yield bonds and senior secured loans for borrowers that are in need of direct loans, rescue financings, or other capital solutions or that have had challenged or unsuccessful primary offerings.
The Investment Professionals employ a fundamental, value-driven opportunistic approach to credit investing, which seeks to benefit from the resources, relationships and proprietary information of the global investment platform of our Adviser and its affiliates.
Our Administrator
We entered into an administration agreement, as amended from time to time (the “Administration Agreement”) with the Administrator, a Delaware limited liability company and a wholly owned subsidiary of OCM. The principal executive offices of our Administrator are located at 333 South Grand Avenue, 28th Floor, Los Angeles, CA 90071. Pursuant to the Administration Agreement, our Administrator provides services to us, and we reimburse our Administrator for costs and expenses incurred by the Administrator in performing its obligations under the Administration Agreement and providing personnel and facilities thereunder.
In addition, our Administrator entered into a sub-administration agreement (the “Sub-Administration Agreement”) with State Street Bank and Trust Company (“State Street”), pursuant to which State Street provides for certain administrative and professional services.
Business Strategy
Our investment objective is to generate current income and long-term capital appreciation. Our Adviser intends to implement the following business strategy to achieve our investment objective:
•Portfolio Positioning. Our Adviser intends to generate a competitive return on equity and sustainable, consistent dividends through (1) opportunistically investing across the capital structure, (2) seeking to take advantage of dislocations in financing markets and other situations that may benefit from our Adviser’s credit and restructuring expertise, and (3) generating capital appreciation and income through secondary investments at discounts to par in either private or syndicated transactions.
•Emphasis on Proprietary Deals. Our Adviser is focused on proprietary opportunities as well as partnering with other lenders as appropriate. Dedicated sourcing professionals of our Adviser and its affiliates are in continuous contact with financial sponsors and corporate clients to originate proprietary deals and seek to leverage the networks and relationships of the Investment Professionals with management teams and corporations to originate non-sponsored transactions. Since 2005, our Adviser and its affiliates have invested more than $31 billion in over 500 directly originated loans, and the platform of our Adviser and its affiliates has the capacity to invest in large deals and to solely underwrite transactions.
•Focus on Quality Companies and Extensive Diligence. Our Adviser seeks to maintain a conservative approach to investing with discipline around fundamental credit analysis and downside protection. Our Adviser intends to focus on companies with resilient business models, strong underlying fundamentals, significant asset or enterprise value and seasoned management teams, although not all portfolio companies will meet each of these criteria. Our Adviser intends to leverage its deep credit and deal structuring expertise to lend to companies that have unique needs, complex business models or specific business challenges. Our Adviser conducts diligence on underlying collateral value, including cash flows, hard assets or intellectual property, and will typically model exit scenarios as part of the diligence process, including assessing potential “work-out” scenarios.
•Disciplined Portfolio Management. Our Adviser monitors our portfolio on an ongoing basis to manage risk and take preemptive action to resolve potential problems where possible. Our Adviser intends to seek to reduce the impact of individual investment risks by diversifying portfolios across industry sectors and limiting positions to no more than 5% of our portfolio.
•Manage Risk Through Loan Structures. Our Adviser seeks to leverage its experience in identifying structural risks in prospective portfolio companies and developing customized solutions to enhance downside protection where possible. Our Adviser has the expertise to structure comprehensive, flexible and customized solutions for companies of all sizes across numerous industry sectors. Our Adviser employs a rigorous due diligence process and seeks to include covenant protections designed to ensure that we, as the lender, can negotiate with a portfolio company before a debt investment reaches impairment. The platform of our Adviser and its affiliates can address a wide range of borrower needs, with capability to invest across the capital structure and to fund large loans, and our Adviser pays close attention to market trends. Our Adviser provides certainty to borrowers by seeking to provide fully underwritten financing commitments and has expertise in both performing credit as well as restructuring and turnaround situations, which allows us to lend at times of market stress when our competitors may halt or reduce investment activity.
Our Adviser’s emphasis is on fundamental credit analysis, consistency and downside protection, all of which are key tenets of its investment philosophy and important in times of market dislocation. We believe this philosophy strongly aligns with the interests of our stockholders. Our Adviser controls primarily for risk, rather than return. Although this may lead us to underperform in bullish markets, we expect that prudence across the economic cycle and limiting losses will allow us to achieve our investment objectives.
Investment Philosophy and Approach
Our investment objective is to generate current income and long-term capital appreciation. We seek to achieve our investment objective without subjecting principal to undue risk of loss by lending to and investing in the debt of public and private companies, primarily in situations where a company or its owners are (a) overleveraged or facing pressures to recapitalize, (b) unable to access broadly syndicated capital markets, (c) undervalued after having recently exited bankruptcy, completed a restructuring or are in a cyclically out-of-favor industry or (d) otherwise affected by mispricings or inefficiencies in the capital markets or at different points throughout the credit cycle.
We seek to invest opportunistically across asset classes and geographies and expect most of our investments to be in securities of eligible portfolio companies, in the form of senior loans, and to a lesser extent, high yield bonds, where such companies may be in need of direct loans, rescue financings or other capital solutions or that may have had challenged or unsuccessful primary offerings. As of September 30, 2022, the fair value of our investment portfolio was $559.3 million and was comprised of investments in 115 portfolio companies. At fair value as of September 30, 2022, 97.3% of our portfolio consisted of senior secured loans, including 84.6% of first lien loans and 12.7% of second lien loans, and 0.2% of our portfolio consisted of unsecured debt investments.
When we make a debt investment, we may also be granted equity, such as warrants to purchase common stock in a portfolio company. To a lesser extent, we may also make preferred and/or common equity investments, which are usually in conjunction with a concurrent debt investment or the result of an investment restructuring. For non-control equity investments, we generally seek to structure our non-control equity investments to provide us with minority rights protections and event-driven put rights. We also seek to obtain limited registration rights in connection with these investments, which may include “piggyback” registration rights. At fair value as of September 30, 2022, 2.5% of our portfolio consisted of common equity, preferred equity and warrants.
Since we intend to be an opportunistic investment vehicle, the composition of our portfolio will change with market conditions. We may invest across the capital structure, in both liquid and illiquid securities and obligations, which the Investment Professionals believe should allow us to access attractive risk-reward opportunities as they arise.
Identification of Investment Opportunities
Our primary focus is on identifying differentiated private lending opportunities, with a secondary emphasis on identifying opportunities in the public markets.
Private Lending Opportunities. We believe that the market for lending to private companies is underserved and presents a compelling investment opportunity. We intend to focus on private lending opportunities in the following key areas:
•Situational Lending. Certain businesses may present challenges for traditional lenders to understand or value, thus presenting attractive lending opportunities for the Company. Prospective borrowers with little-to-no revenue or
earnings before interest, taxes, depreciation and amortization, or EBITDA, may be unable to secure financing from traditional lenders. In these instances, a debt-to-EBITDA approach may not be appropriate, instead requiring a value-oriented approach that involves targeting low loan-to-value ratios and negotiating bespoke covenants, contingencies and terms that help mitigate business-specific risks. Examples of these opportunities may include life sciences companies that have revenue-generating drugs and hard assets, but reinvest that capital into research and development for promising new products.
•Sponsor-Related Financings. Financing for portfolio companies backed by private equity firms is one the most active areas of opportunity, including those opportunities related to leveraged buyouts and refinancings. The Investment Professionals have many longstanding relationships with established, reputable sponsors, and generally favor sponsors that view their portfolio companies as long-term partners and those that specialize in certain industries where they have significant subject matter expertise. In addition, the Investment Professionals have historically favored borrowers backed by sponsors that have demonstrated a willingness to invest large amounts of equity, which provides enhanced downside credit protection. Examples of these opportunities may include financings for software- or healthcare-focused borrowers backed by private equity firms.
•Stressed Sector/Rescue Lending. Individual businesses or sectors experiencing stress or reduced access to capital, which can create attractive private lending opportunities. Broad market weakness or sector-specific issues can constrain borrowers’ access to capital. Further, certain factors such as regulation may cause entire industries (e.g., energy) to be rebuffed by more traditional lenders (e.g., commercial banks) such that all borrowers in an industry lose access to capital, regardless of their individual financial condition. Often times, by sifting through an industry issuer-by-issuer, the Investment Professionals can identify attractive investment opportunities that are over-secured by valuable assets.
Opportunities in Public Markets. Certain factors may also create opportunities for us in the public market and allow us to leverage Oaktree’s broader credit platform and decades of credit investing experience. These factors may include:
•Macro Factors. Macro factors that drive market dislocations can ripple through the global economy and include sovereign debt crises, political elections, global pandemics and other unexpected geopolitical events. These factors drive highly correlated “risk on” and “risk off” market swings and frequently result in the indiscriminate selling of securities and obligations at prices that the Investment Professionals believe are well below their intrinsic values.
•Industry Headwinds. Select industries may face secular challenges or may fall out of favor due to a variety of factors such as evolving technology or regulation. These headwinds can cause the debt of healthy and unhealthy companies alike to trade lower, potentially allowing the Investment Professionals to identify mispriced opportunities.
•Company Characteristics. Company-specific factors that drive market dislocations include overleveraged balance sheets, near-term liquidity or maturity issues, secular pressures, acute shock to company operations, asset-light businesses and new or relatively small issuers. These factors may result in mispriced securities or require a highly structured direct loan.
Investment Criteria and Guidelines
Once the Investment Professionals have identified a potential investment opportunity, they will evaluate the opportunity against the following investment criteria and guidelines. However, not all of these criteria will be met by each prospective portfolio company in which we invest.
•Covenant Protections. We generally expect to invest in loans that have covenants that may help to minimize our risk of capital loss and meaningful equity investments in the portfolio company. We intend to target investments that have strong credit protections, including default penalties, information rights and affirmative, negative and financial covenants, such as limitations on debt incurrence, lien protection and prohibitions on dividends.
•Sustainable Cash Flow. Our investment philosophy places emphasis on fundamental analysis from an investor’s perspective and has a distinct value orientation. We intend to focus on companies with significant asset or enterprise value in which we can invest at relatively low multiples of normalized operating cash flow. Additionally, we anticipate investing in companies with a demonstrated ability or credible plan to de-lever. Typically, we will not invest in start-up companies, companies having speculative business plans or structures that could impair capital over the long-term although we may target certain earlier stage companies that have yet to reach profitability.
•Experienced Management Team. We generally will look to invest in portfolio companies with an experienced management team and proper incentive arrangements, including equity compensation, to induce management to succeed and to act in concert with our interests as investors.
•Strong Relative Position in Its Market. We intend to target companies with what we believe to be established and leading market positions within their respective markets and well-developed long-term business strategies.
•Exit Strategy. We generally intend to invest in companies that we believe will provide us with the opportunity to exit our investments in three to eight years, including through (1) the repayment of the remaining principal outstanding at maturity, (2) the recapitalization of the company resulting in our debt investments being repaid and (3) the sale of the company resulting in the repayment of all of its outstanding debt.
•Geography. As a BDC, we will invest at least 70% of our total assets in U.S. companies. To the extent we invest in non-U.S. companies, we intend to do so in accordance with Investment Company Act limitations and only in jurisdictions with established legal frameworks and a history of respecting creditor rights.
Investment Process
Our investment process consists of the following five distinct stages.
Source
The Strategic Credit group has dedicated sourcing professionals and also leverages its strong market presences and relationships across the global platform of our Adviser and its affiliates to gain access to opportunities from advisers, sponsors, banks, management teams, capital raising advisers and other sources. Our Adviser is a trusted partner to financial sponsors and management teams based on its long-term commitment and focus on lending across economic cycles. We believe this gives us access to proprietary deal flow and "first looks" at investment opportunities and that we are well-positioned for difficult and complex transactions.
Screen Using Investment Criteria
We are highly selective in making new investments. The initial screening process typically includes a review of the proposed capital structure of the prospective portfolio company, including level of assets or enterprise value coverage, an assessment by our Adviser of the company’s management team and its equity ownership levels as well as the viability of its long-term business model, and a review of forecasted financial statements and liquidity profile. In addition, our Adviser may assess the prospect of industry or macroeconomic catalysts that may create enhanced value in the investment as well as the potential ability to enforce creditor rights, particularly where collateral is located outside of the United States.
Research
Prior to making any new investment, our Adviser seeks to engage in an extensive due diligence process led by investment analysts assigned to each transaction. The analysts assess a company’s management team, products, services, competitive position in its markets, barriers to entry and operating and financial performance, as well as the growth potential of its markets. In performing this evaluation, the analysts may use financial, descriptive and other due diligence materials provided by the prospective portfolio company, commissioned third party reports and internal sources, including members of the investment team, industry participants and experts with whom our Adviser has relationships. As part of the research process, our Adviser’s analysts typically perform a “what-if” analysis that explores a range of values for each proposed investment and a range of potential credit events.
Evaluate
Our Adviser assesses each potential investment through a rigorous, collaborative decision-making process. Our Adviser applies disciplined investment criteria and evaluates potential risk and reward of each investment with significant focus on downside risk. Our Adviser sizes investments at the portfolio level across a variety of characteristics, including based on the investment criteria described above.
Monitor
Our Adviser prioritizes managing risk. In managing our portfolio, our Adviser monitors each portfolio company to be well-positioned to make hold and exit decisions when credit events occur, our collateral becomes overvalued or opportunities with more attractive risk/reward profiles are identified. Investment analysts are assigned to each investment to monitor industry
developments, review company financial statements, attend company presentations and regularly speak with company management. Based on their monitoring, the Investment Professionals seek to determine the optimal time and strategy for exiting and maximizing the return on the investment, typically when prices or yields reach target valuations. In circumstances where a particular investment is underperforming, our Adviser intends to employ a variety of strategies to maximize its recovery based on the specific facts and circumstances of the underperforming investment, including actively working with the management to restructure all or a portion of the business, explore the possibility of a sale or merger of all or a portion of the assets, recapitalize or refinance the balance sheet, negotiate deferrals or other concessions from existing creditors and arrange new liquidity or new equity contributions. We believe that our Adviser’s experience with restructurings and our access to our Adviser’s deep knowledge, expertise and contacts in the distressed debt area will help us preserve the value of our investments.
Valuation Procedures
We generally invest in debt securities issued by private middle-market companies. We are required to carry our portfolio investments at market value or, if there is no readily available market value, at fair value as determined in good faith by our Adviser, as the valuation designee pursuant to Rule 2a-5 under the Investment Company Act. See “– Item 7. Management’s Discussion and Analysis of Financial Condition and Results of Operations – Critical Accounting Policies – Investment Valuation” for a description of our investment valuation processes and procedures.
Investment Advisory Agreement
From July 9, 2018 through May 11, 2020, we were externally managed by OCM pursuant to an investment advisory agreement. On May 11, 2020, OCM effected the novation of such investment advisory agreement to our Adviser. Immediately following such novation, we and our Adviser entered into the Investment Advisory Agreement with the same terms, including fee structure, as the investment advisory agreement with OCM.
Certain of the Investment Professionals of our Adviser and its affiliates may have indirect ownership and pecuniary interests. In addition, our Adviser, its affiliates, the Investment Professionals, our executive officers and directors, and other current and future principals of our Adviser serve or may serve as investment advisers, officers, directors or principals of entities or investment funds that operate in the same or a related line of business as we do and/or investment funds, accounts and other similar arrangements advised by Oaktree. An affiliated investment fund, account or other similar arrangement currently formed or formed in the future and managed by our Adviser or its affiliates may have investment objectives and strategies that overlap with ours and, accordingly, may invest in asset classes similar to those targeted by us. As a result, our Adviser and/or its affiliates may face conflicts of interest arising out of the investment advisory activities of our Adviser and other operations of Oaktree. See “– Allocation of Investment Opportunities and Potential Conflicts of Interest” below.
Our Adviser will not assume any responsibility to us other than to render the services described in, and on the terms of, the Investment Advisory Agreement, and will not be responsible for any action of our board of directors in declining to follow the advice or recommendations of our Adviser. Under the terms of the Investment Advisory Agreement, our Adviser (and its members (and their partners or members, including the owners of their partners or members), managers, officers, employees, agents, controlling persons and any other person or entity affiliated with it) will not be liable to us for any action taken or omitted to be taken by our Adviser in connection with the performance of any of its duties or obligations under the Investment Advisory Agreement or otherwise as our adviser (except to the extent specified in Section 36(b) of the Investment Company Act concerning loss resulting from a breach of fiduciary duty (as the same is finally determined by judicial proceedings) with respect to the receipt of compensation for services). Absent willful misfeasance, bad faith or gross negligence in the performance of our Adviser’s duties or by reason of the reckless disregard of our Adviser’s duties and obligations under the Investment Advisory Agreement, we will provide indemnification from and against all damages, liabilities, costs and expenses (including reasonable attorneys’ fees and amounts reasonably paid in settlement) incurred by those described above in or by reason of any pending, threatened or completed action, suit, investigation or other proceeding (including an action or suit by or in the right of the Company or our security holders) arising out of or otherwise based upon the performance of any of our Adviser’s duties or obligations under the Investment Advisory Agreement or otherwise as our adviser.
Pursuant to the Investment Advisory Agreement, we are obligated to pay our Adviser a fee for investment advisory and management services consisting of two components – the Management Fee and the Incentive Fee (each as defined below). All Investment Professionals of the Adviser and certain of its affiliates who provide investment advisory services to us will be compensated by the Adviser or such affiliates, as described below.
Management Fee
Prior to (i) the listing of our Common Stock on a national securities exchange or (ii) an initial public offering of our Common Stock that results in gross proceeds to us of at least $50 million and a listing of the Common Stock on a national securities exchange (each of (i) and (ii), a “Qualified Listing”), if any, our Adviser is entitled to receive quarterly in arrears a
management fee (the “Management Fee”) equal to 1.00% per annum (the “Applicable Management Fee Percentage”) of our Gross Asset Value (as defined below); provided, that prior to a Qualified Listing, the Management Fee will not exceed 1.75% per annum of the Unleveraged Asset Value (as defined below). From and after the date of a Qualified Listing, if any, the Applicable Management Fee Percentage will increase to 1.50% per annum of our Gross Asset Value.
For purposes of calculating the Management Fee, the Gross Asset Value is determined by our board of directors (including any committee thereof). Until August 6, 2019, the Management Fee for each quarter was calculated based on our average Gross Asset Value at the end of each month during such calendar quarter (prior to taking into account any Incentive Fee); provided, that the Management Fee for our first calendar quarter was calculated based on our Gross Asset Value at the end of such calendar quarter (prior to taking into account any Incentive Fee). Following August 6, 2019, the Management Fee for each quarter is calculated based on our average Gross Asset Value at the end of such quarter and at the end of the preceding quarter (in each case, prior to taking into account any Incentive Fee); provided, that the Management Fee for the calendar quarter in which we consummate a Qualified Listing will be calculated based on our Gross Asset Value at the end of such calendar quarter (prior to taking into account any Incentive Fee). The Unleveraged Asset Value is determined in a manner consistent with the determination of Gross Asset Value.
The term “Gross Asset Value” means the value of our gross assets, determined on a consolidated basis in accordance with U.S. generally accepted accounting principles (“GAAP”), including portfolio investments purchased with borrowed funds and other forms of leverage, but excluding cash and cash equivalents.
The term “Unleveraged Asset Value” means the Gross Asset Value less our borrowings for investment purposes determined on a consolidated basis in accordance with GAAP (other than borrowings under our investor subscription credit facility that are repaid within 180 days following incurrence).
Incentive Fee
The Incentive Fee consists of two parts: the Investment Income Incentive Fee and the Capital Gains Incentive Fee (each defined below).
Investment Income Incentive Fee
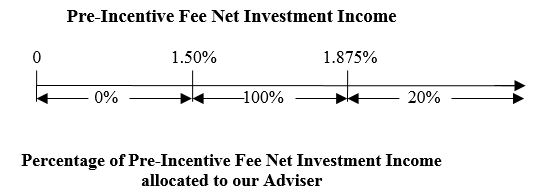
The Investment Income Incentive Fee is calculated and payable quarterly in arrears based on our Pre-Incentive Fee Net Investment Income, which means consolidated interest income, dividend income and any other income (including any other fees (other than fees for providing managerial assistance), such as commitment, origination, structuring, diligence and consulting fees or other fees that we receive from portfolio companies) accrued during the calendar quarter, minus the operating expenses accrued for the quarter (including the Management Fee, Company expenses and any interest expense or fees on any credit facilities or outstanding debt, but excluding the Incentive Fee). The Pre-Incentive Fee Net Investment Income includes, in the case of investments with a deferred interest feature (such as original issue discount ("OID"), debt instruments with payment-in-kind ("PIK") interest and zero coupon securities), accrued income that has not yet been received in cash. (See "Item 1A. Risk Factors – Risks Relating to Our Investments – Our investments may include OID instruments, which involve a number of significant risks"). For the avoidance of doubt, the Pre-Incentive Fee Net Investment Income does not include any realized capital gains, realized capital losses or unrealized capital appreciation or depreciation. The Pre-Incentive Fee Net Investment Income, expressed as a rate of return on the value of our net assets at the end of the immediately preceding calendar quarter, is compared to a hurdle of 1.50% per quarter (6% annualized) (the “Hurdle Rate”). We are obligated to pay our Adviser an Investment Income Incentive Fee each quarter as follows:
(a)Hurdle Rate Return: No Investment Income Incentive Fee in any calendar quarter in which the Pre-Incentive Fee Net Investment Income does not exceed the Hurdle Rate;
(b)Catch-Up: 100% of the Pre-Incentive Fee Net Investment Income, if any, that exceeds the Hurdle Rate but is less than a 1.875% (7.5% annualized) rate of return on the value of our net assets in such calendar quarter (the “Catch-Up”), which is intended to provide our Adviser with 20% of the Pre-Incentive Fee Net Investment Income as if the Hurdle Rate did not apply, if the Pre-Incentive Fee Net Investment Income exceeds the Hurdle Rate in such calendar quarter; and
(c)80/20 Split: 20% of the Pre-Incentive Fee Net Investment Income, if any, that exceeds a 1.875% (7.5% annualized) rate of return on the value of our net assets in such calendar quarter, so that once the Hurdle Rate is reached and the Catch-Up in (b) immediately above is achieved, 20% of the Pre-Incentive Fee Net Investment Income thereafter is allocated to our Adviser.
The following is a graphical representation of the calculation of the income-related portion of the incentive fee:
These calculations are prorated for any period of less than three months and adjusted for any share issuances or repurchases during the relevant quarter. Investors should be aware that a rise in the general level of interest rates can be expected to lead to higher interest rates applicable to our debt investments. Accordingly, an increase in interest rates would make it easier for us to meet or exceed the Hurdle Rate and may result in a substantial increase in the amount of Incentive Fees payable to our Adviser with respect to Pre-Incentive Fee Net Investment Income.
Capital Gains Incentive Fee
In addition to the Investment Income Incentive Fee described above, our Adviser is entitled to receive a Capital Gains Incentive Fee (as defined below). The Capital Gains Incentive Fee is determined and payable in arrears as of the end of each year. The Capital Gains Incentive Fee is equal to 20% of the realized capital gains, if any, on a cumulative basis from the date of the Initial Closing through the end of each calendar year, computed net of all realized capital losses on a cumulative basis and unrealized capital depreciation, less the aggregate amount of any previously paid Capital Gains Incentive Fee with respect to each of the investments in our portfolio, provided that the Capital Gains Incentive Fee determined as of December 31, 2018 was calculated for a period of shorter than 12 calendar months to take into account any realized capital gains computed net of all realized capital losses and unrealized capital depreciation from the date of the Initial Closing through the end of 2018 (the “Capital Gains Incentive Fee,” and together with the Investment Income Incentive Fee, the “Incentive Fee”).
Examples of Quarterly Incentive Fee Calculations
The figures provided in the following examples are hypothetical, are presented for illustrative purposes only and are not indicative of actual expenses or returns.
Example 1: Income Related Portion of Incentive Fee(1):
Alternative 1 - Assumptions
Investment income (including interest, dividends, fees, etc.) = 1.25%.
Hurdle Rate(2) = 1.50%.
Management Fee(3) = 0.25%.
Other expenses (legal, accounting, custodian, transfer agent, etc.)(4) = 0.25%.
Pre-Incentive Fee Net Investment Income =
(investment income - (Management Fee + other expenses)) = 0.75%.
Pre-Incentive Net Investment Income does not exceed Hurdle Rate, therefore there is no Investment Income Incentive Fee.
Alternative 2 - Assumptions
Investment income (including interest, dividends, fees, etc.) = 2.30%.
Hurdle Rate(2) = 1.50%.
Management Fee(3) = 0.25%.
Other expenses (legal, accounting, custodian, transfer agent, etc.)(4) = 0.25%.
Pre-Incentive Fee Net Investment Income =
(investment income - (Management Fee + other expenses)) = 1.80%
Catch-Up = 1.80% - 1.50% = 0.30%
Incentive Fee = 100% (1.80% - 1.50%) = 0.30%.
Alternative 3 - Assumptions
Investment income (including interest, dividends, fees, etc.) = 4.00%.
Hurdle Rate(2) = 1.50%.
Management Fee(3) = 0.25%.
Other expenses (legal, accounting, custodian, transfer agent, etc.)(4) = 0.25%.
Pre-Incentive Fee Net Investment Income =
(investment income - (Management Fee + other expenses)) = 3.50%.
Incentive Fee = 20% × Pre-Incentive Fee Net Investment Income, subject to “Catch-Up” (5).
Incentive Fee = (100% × “Catch-Up”) + (20% × (Pre-Incentive Fee Net Investment Income - 1.875%)).
Catch-Up = 1.875% - 1.50% = 0.375%.
Incentive Fee = (100% × 0.375%) + (20% × (3.50% - 1.875%))
= 0.375% + (20% × 1.625%)
= 0.375% + 0.325%
= 0.70%.
Example 2: Capital Gains Portion of Incentive Fee:
Alternative 1 - Assumptions
•Year 1: $20 million investment made in Company A (“Investment A”), and $30 million investment made in Company B (“Investment B”).
•Year 2: Investment A sold for $50 million and fair market value (“FMV”) of Investment B determined to be $32 million.
•Year 3: FMV of Investment B determined to be $25 million.
•Year 4: Investment B sold for $31 million.
The Capital Gains Incentive Fee, if any, would be:
•Year 1: None.
•Year 2: $6.0 million Capital Gains Incentive Fee, calculated as follows: $30 million realized capital gains on sale of Investment A multiplied by 20%.
•Year 3: None; calculated as follows:(6) $5.0 million cumulative fee (20% multiplied by $25 million ($30 million cumulative capital gains less $5 million cumulative unrealized capital depreciation)) less $6.0 million (previous capital gains fee paid in Year 2).
•Year 4: $200,000 Capital Gains Incentive Fee, calculated as follows: $6.2 million cumulative fee (20% multiplied by $31 million cumulative realized capital gains ($30 million from Investment A and $1 million from Investment B)) less $6.0 million (previous capital gains fee paid in Year 2).
Alternative 2 - Assumptions
•Year 1: $20 million investment made in Company A (“Investment A”), $30 million investment made in Company B (“Investment B”) and $25 million investment made in Company C (“Investment C”).
•Year 2: Investment A sold for $50 million, FMV of Investment B determined to be $25 million and FMV of Investment C determined to be $25 million.
•Year 3: FMV of Investment B determined to be $27 million and Investment C sold for $30 million.
•Year 4: FMV of Investment B determined to be $35 million.
•Year 5: Investment B sold for $20 million.
The Capital Gains Incentive Fee, if any, would be:
•Year 1: None.
•Year 2: $5.0 million Capital Gains Incentive Fee, calculated as follows: 20% multiplied by $25 million ($30 million realized capital gains on sale of Investment A less $5 million unrealized capital depreciation on Investment B).
•Year 3: $1.4 million Capital Gains Incentive Fee, calculated as follows: $6.4 million cumulative fee (20% multiplied by $32 million ($35 million cumulative realized capital gains less $3 million cumulative unrealized capital depreciation)) less $5.0 million (previous capital gains fee paid in Year 2).
•Year 4: $600,000 capital gains incentive fee, calculated as follows: $7.0 million cumulative fee (20% multiplied by $35 million cumulative realized capital gains) less $6.4 million (previous cumulative capital gains fee paid in Year 2 and Year 3).
•Year 5: None. $5.0 million cumulative fee (20% multiplied by $25 million ($35 million cumulative realized capital gains less $10 million realized capital losses)) less $7.0 million (previous cumulative capital gains fee paid in Years 2, 3 and 4).
_________________
Notes:
1.The hypothetical amount of Pre-Incentive Fee Net Investment Income shown is expressed as a rate of return as of the beginning and the end of the immediately preceding calendar quarter. Solely for purposes of these illustrative examples, it has been assumed that we have not incurred any leverage. However, we expect to use leverage to partially finance our investments.
2.Represents 6.0% annualized Hurdle Rate.
3.Represents 1.00% annualized Management Fee.
4.Hypothetical other expenses. Excludes organizational and offering expenses.
5.The “Catch-Up” provision is intended to provide our Adviser with an Incentive Fee of approximately 20% on all of the Pre-Incentive Fee Net Investment Income, as if a Hurdle Rate did not apply, when the net investment income exceeds 1.875% in any calendar quarter.
6.If the Investment Advisory Agreement is terminated on a date other than December 31 of any year, we may pay aggregate Capital Gains Incentive Fees that are more than the amount of such fees that would have been payable if the Investment Advisory Agreement had been terminated on December 31 of such year. This would occur if the FMV of an investment declined between the time the Investment Advisory Agreement was terminated and December 31.
Administration Agreement
Pursuant to the Administration Agreement, our Administrator furnishes us with office facilities (certain of which are located in buildings owned by a Brookfield affiliate), equipment and clerical, bookkeeping and recordkeeping services at such facilities. Under the Administration Agreement, our Administrator also performs, or oversees the performance of, our required administrative services, which include, among other things, providing assistance in accounting, legal, compliance, operations, technology and investor relations, and being responsible for the financial records that we are required to maintain and preparing reports to stockholders and reports filed with the SEC. In addition, our Administrator assists us in determining and publishing the Net Asset Value (as defined below), overseeing the preparation and filing of our tax returns and the printing and dissemination of reports to our stockholders, and generally overseeing the payment of our expenses and the performance of administrative and professional services rendered to us by others.
Payments under the Administration Agreement are equal to an amount that reimburses our Administrator for its costs and expenses incurred in performing its obligations under the Administration Agreement and providing personnel and facilities. The Administration Agreement may be terminated by either party without penalty upon 60 days’ written notice to the other party, by the vote of a majority of our outstanding voting securities, or by the vote of our directors or by our Administrator. Additionally, we bear all of the costs and expenses of any sub-administration agreements that our Administrator enters into.
The Administration Agreement provides that, absent willful misfeasance, bad faith or gross negligence in the performance of its duties or by reason of the reckless disregard of its duties and obligations under the Administration Agreement, our Administrator (and its officers, managers, partners, agents, employees, controlling persons, members, and any other person or entity affiliated with it, including without limitation its members, the Adviser and any person affiliated with its members or the Adviser, to the extent they are providing services for or otherwise acting on behalf of the Administrator, Adviser or us) will not be liable to us for any action taken or omitted to be taken by the Administrator in connection with the performance of any of its duties or obligations under the Administration Agreement or otherwise as administrator for us, and we will indemnify, defend and protect the Administrator (and its officers, managers, partners, agents, employees, controlling persons, members, and any other person or entity affiliated with the Administrator, including without limitation its members, the Adviser and any person affiliated with its members or the Adviser, to the extent they are providing services for or otherwise acting on behalf of the Administrator, Adviser or us) and hold them harmless from and against all damages, liabilities, fees, penalties, costs and expenses (including reasonable attorneys’ fees and amounts reasonably paid in settlement) incurred by them in or by reason of any pending, threatened or completed action, suit, investigation or other proceeding (including an action or suit by or in the right of the Company or our security holders) arising out of or otherwise based upon the performance of any of our Administrator’s duties or obligations under the Administration Agreement or otherwise as our administrator.
Sub-Administration Agreement
The Administrator entered into a Sub-Administration Agreement with State Street (in such capacity, the “Sub-Administrator”). Pursuant to the Sub-Administration Agreement, the Sub-Administrator will provide certain administrative and professional services. The principal office of State Street is One Lincoln Street, Boston, MA 02111. State Street also serves as transfer agent and registrar.
Expenses
All personnel of the Adviser, when and to the extent engaged in providing investment advisory services, and the compensation and routine overhead expenses of such personnel allocable to such services, are provided and paid for by the Adviser and not by us. We bear all other costs and expenses of our organization, operations, administration and transactions, including (without limitation) fees and expenses relating to: (a) all costs, fees, expenses and liabilities incurred in connection with our formation and organization and the offering and sale of the Common Stock, including expenses of registering or qualifying securities held by us for sale and blue sky filing fees; (b) diligence and monitoring of our financial, regulatory and legal affairs, and, if necessary, enforcing rights in respect of investments (to the extent an investment opportunity is being considered for us and any other funds or accounts managed by the Adviser or its affiliates, the Adviser’s out-of-pocket expenses related to the due diligence for such investment will be shared with such other funds and accounts pro rata based on the anticipated allocation of such investment opportunity between us and the other funds and accounts); (c) the cost of calculating our Net Asset Value (as defined below) (including third-party valuation firms); (d) the cost of effecting sales and repurchases of shares of our Common Stock and other securities; (e) Management and Incentive Fees payable pursuant to the Investment Advisory Agreement; (f) fees payable to third parties relating to, or associated with, making investments and valuing investments (including third-party valuation firms); (g) retainer, finder’s, placement, adviser, consultant, custodian, sub-custodian, transfer agent, trustee, disbursal, brokerage, registration, legal and other similar fees, commissions and expenses attributable to making or holding investments; (h) fees and expenses associated with marketing efforts (including travel and attendance at investment conferences and similar events); (i) allocable out-of-pocket costs incurred in providing managerial assistance to those portfolio companies that request it; (j) fees, interest and other costs payable on or in connection with any indebtedness; (k) federal and state registration fees and other governmental charges; (l) any exchange listing fees; (m) federal, state and local taxes; (n) independent directors’ fees and expenses; (o) brokerage commissions; (p) costs of proxy statements, stockholders’ reports and notices and any other regulatory reporting expenses; (q) costs of preparing government filings, including periodic and current reports with the SEC; (r) fidelity bond, liability insurance and other insurance premiums; (s) printing, mailing, independent accountants and outside legal costs; (t) costs of winding up and liquidation; (u) litigation, indemnification and other extraordinary or non-recurring expenses; (v) dues, fees and charges of any trade association of which we are a member; (w) research and software expenses, quotation equipment and services and other expenses incurred in connection with data services, including subscription costs, providing real-time price feeds, real-time news feeds, securities and company information, and company fundamental data attributable to such investments; (x) costs and expenses relating to investor reporting and communications; (y) all costs, expenses, fees and liabilities incurred in connection with a Liquidity Event (as defined below); (z) all other out-of-pocket expenses, fees and liabilities that are incurred by us or by the Adviser on our
behalf or that arise out of our operation and activities, including expenses related to organizing and maintaining persons through or in which investments may be made and the allocable portion of any Adviser costs, including personnel, incurred in connection therewith; (aa) accounting expenses, including expenses associated with the preparation of our financial statements and tax information reporting returns and the filing of various tax withholding forms and treaty forms; (bb) the allocable portion of the compensation of our Chief Financial Officer and Chief Compliance Officer and their respective staffs; and (cc) all other expenses incurred by the Administrator, any affiliate of the Administrator or the Company in connection with administering our business, including payments under the Administration Agreement to the Administrator or any such affiliate in an amount equal to our allocable portion of overhead and other expenses incurred by the Administrator or such affiliate in performing its obligations and services under the Administration Agreement, such as rent and our allocable portion of the cost of personnel attributable to performing such obligations and services, including, but not limited to, marketing, legal and other services performed by the Administrator or such affiliate for us. For the avoidance of doubt, we bear our allocable portion of the costs of the compensation, benefits, and related administrative expenses (including travel expenses) of our officers who provide operational and administrative services under the Administration Agreement, their respective staffs and other professionals who provide services to us (including, in each case, employees of the Administrator or an affiliate) who assist with the preparation, coordination, and administration of the foregoing or provide other “back office” or “middle office” financial or operational services to us. We reimburse the Adviser (or its affiliates) for an allocable portion of the compensation paid by the Adviser (or its affiliates) to such individuals (based on a percentage of time such individuals devote, on an estimated basis, to our business and affairs and to acting on our behalf).
Our “Net Asset Value” as of any date of determination is the value of all of our assets, including accrued interest, dividends and assets purchased with borrowings, less all of our liabilities, including accrued expenses, any reserves established by the Adviser in its discretion for contingent liabilities and any borrowings. The Net Asset Value is determined by our board of directors (including any committee thereof) as and when required under the Investment Company Act.
Competition
We operate in a highly competitive market for investment opportunities. We compete for investments with various other investors, such as other public and private funds, other BDCs, commercial and investment banks, commercial finance companies and to the extent they provide an alternative form of financing, private equity funds, some of which may be our affiliates. Other Oaktree funds have investment objectives that overlap with ours, which may create competition for investment opportunities. Many competitors are substantially larger and have considerably greater financial, technical and marketing resources than we do. For example, some competitors may have a lower cost of funds and access to funding sources that will not be available to us. In addition, some of our competitors may have higher risk tolerances or different risk assessments than we do, which could allow them to consider a wider variety of investments and establish more relationships than we do. Furthermore, many of our competitors are not subject to the regulatory restrictions that the Investment Company Act and the Code impose on us. The competitive pressures could impair our business, financial condition and results of operations. As a result of this competition, we may not be able to take advantage of attractive investment opportunities. See “Item 1A. Risk Factors – Risks Relating to Our Business and Structure – We operate in a highly competitive market for investment opportunities.”
Emerging Growth Company
We are an “emerging growth company,” as defined in the Jumpstart Our Business Startups Act of 2012 (the “JOBS Act”). As a result, we are eligible to take advantage of certain specified reduced disclosure and other requirements that are otherwise generally applicable to public companies that are not “emerging growth companies” including, but not limited to, not being required to comply with the auditor attestation requirements of Section 404(b) of the Sarbanes-Oxley Act of 2002 (the “Sarbanes-Oxley Act”). As a result, we have taken advantage of the exemption under the JOBS Act for emerging growth companies that allows companies like us to temporarily forgo the auditor attestation requirements of the Sarbanes-Oxley Act. See “Item 1A. Risk Factors – Risks Relating to Our Business and Structure – We are an “emerging growth company,” and we do not know if such status will make our shares less attractive to investors.” We do not take advantage of other disclosure or reporting exemptions for emerging growth companies under the JOBS Act. We will remain an emerging growth company until the earlier of (a) the last day of the fiscal year (i) following the fifth anniversary of the completion of an initial public offering, (ii) in which we have total annual gross revenue of at least $1.235 billion, or (iii) in which we are deemed to be a large accelerated filer, which means the market value of the Common Stock that is held by non-affiliates exceeds $700 million as of the end of the prior second fiscal quarter, and (b) the date on which we have issued more than $1 billion in non-convertible debt during the prior three-year period.
Staffing
We do not currently have any employees and do not expect to have any employees. Services necessary for our business are provided through the Administration Agreement and the Investment Advisory Agreement.
Investment Period
The investment period commenced on the Initial Closing and will continue until the earlier of the (a) completion of a Liquidity Event (as defined below), and (b) August 6, 2023 (the “Investment Period”), unless the Investment Period is earlier terminated in connection with a Key Person Event (as defined below).
A “Liquidity Event” means: at the discretion of our board of directors: (a) a Qualified Listing or (b) with the consent of a majority of outstanding shares of Common Stock not affiliated with the Adviser and in accordance with the applicable requirements of Delaware law, a corporate control transaction, which may include a strategic sale of the Company or all or substantially all of our assets to, or a merger with, another entity, or another type of corporate control event, which may include, but is not limited to, a transaction with an affiliated entity, including an affiliated BDC, for consideration in cash or publicly listed securities of such entity or a combination of cash and such publicly listed securities (each, a “Corporate Control Transaction”). If approved by our stockholders and consummated, the Mergers will be a “Liquidity Event” for purposes of the foregoing.
Key Person Event
A key person event will occur if, during the Investment Period, Armen Panossian or his Qualified Replacement (as defined below, each a “Key Executive”) fails to remain actively involved in our investment activities (a “Key Person Event”). In the event of a Key Person Event, we will send written notice to stockholders within ten business days following such occurrence and the Investment Period will automatically be suspended (the “Suspension Period”) until the appointment of a Qualified Replacement or the reinstatement of the Investment Period by the directors, as described below, after which, in either case, the Suspension Period will terminate and the Investment Period will be reinstated. During the Suspension Period, stockholders will not be obligated to pay amounts due under drawdown notices that we may issue other than in respect of Runoff Activities. If during the 60-day period following the sending of written notice (the “Notice Period”), the Key Executive has not been replaced by a Qualified Replacement, we will convene a meeting of our directors who are not “interested persons” (as such term is defined in Section 2(a)(19) of the Investment Company Act) to be held not more than 30 calendar days following the expiration of the Notice Period for the purpose of determining whether the Investment Period will be continued. If a majority of such directors do not vote to approve the continuation of the Investment Period, then the Investment Period will terminate and the stockholders will thereafter be obligated to pay amounts due under drawdown notices that we may issue for Runoff Activities. For the avoidance of doubt, following the termination of the Investment Period pursuant to the foregoing, any unused Capital Commitment (other than any defaulted Capital Commitment) will automatically be reduced to zero, except to the extent necessary to pay amounts due under drawdown notices we may thereafter issue for Runoff Activities.
“Qualified Replacement” means a senior investment professional selected by the Adviser; provided that such replacement has been approved by either (a) a majority of the directors who are not “interested persons” (as such term is defined in Section 2(a)(19) of the Investment Company Act) or (b) the holders of a majority of our outstanding shares of Common Stock, and upon either such approval, such nominee will constitute a “Qualified Replacement.”
Company Term
Our term is perpetual. At the end of the Investment Period, if a Liquidity Event has not yet occurred, our board of directors (subject to any necessary stockholder approvals and applicable requirements of the Investment Company Act) will use its best efforts to wind down and/or liquidate and dissolve the Company (subject to our right to engage in Runoff Activities as described in “– Investment Period” above) (the “Liquidation Period”).
Our board of directors may elect to dissolve and wind up the Company earlier if we have disposed of all of our assets.
Transfer of Our Common Stock
Prior to a Liquidity Event, stockholders generally may not sell, assign, transfer, grant a security interest over or otherwise dispose of their Common Stock or their Capital Commitment (“Transfer”) unless (a) we (and, if required by our lending arrangements, our lenders) give consent, (b) the Transfer is made in accordance with applicable securities laws and (c) the Transfer otherwise complies with the restrictions in the Subscription Agreement.
In addition, pursuant to the Subscription Agreement, following a Qualified Listing, investors will also be restricted from selling or disposing of their Common Stock for a period of time specified in the Subscription Agreement. More specifically, the Subscription Agreement provides that, following a Qualified Listing and continuing to and including the second anniversary of the completion of the Qualified Listing, a Stockholder may not Transfer its Common Stock or announce an intention to do so. Notwithstanding the foregoing, the Stockholder may, without any further action on our part (but subject to any underwriters’ lock-up or other contractual restriction the Stockholder may be or become a party to), beginning on the date that is 180 calendar days after the Qualified Listing, Transfer Common Stock in transactions exempt from registration under the Securities Act (pursuant to Rule 144 or otherwise), provided that the number of shares of Common Stock so Transferred (a) may not exceed 25% of the Stockholder’s shares of Common Stock owned as of the completion of the Qualified Listing prior to 365 days after the completion of the Qualified Listing, (b) may not exceed 50% of the Stockholder’s shares of Common Stock owned as of the completion of the Qualified Listing prior to 540 days after the completion of the Qualified Listing, and (c) may not exceed 75% of the Stockholder’s shares of Common Stock owned as of the completion of the Qualified Listing prior to 720 days after the completion of the Qualified Listing; and provided, further, that any Common Stock owned by the Stockholder as of the completion of the Qualified Listing not previously Transferred may be Transferred commencing 720 days after the completion of the Qualified Listing.
Allocation of Investment Opportunities and Potential Conflicts of Interest
Our executive officers and directors, and certain members of our Adviser, serve or may serve as officers, directors or principals of entities that operate in the same or a related line of business as we do or of investment funds managed by our Adviser’s affiliates. For example, Oaktree presently serves as the investment adviser to OCSL, which is a publicly traded business development company. OCSL has historically invested in debt and debt-like instruments similar to those we target for investment. Therefore, there may be certain investment opportunities that satisfy our investment criteria and that of OCSL as well as private investment funds and accounts advised or sub-advised by Oaktree or its affiliates. OCSL operates as a distinct and separate entity, and any investment in the Common Stock will not be an investment in OCSL. In addition, all of our executive officers serve in substantially similar capacities for OCSL. Accordingly, our executive officers may have obligations to investors in those entities, the fulfillment of which might not be in our best interests or the best interests of our stockholders. For example, the personnel of the Adviser may face conflicts of interest in the allocation of investment opportunities to us and OCSL.
Oaktree has investment allocation guidelines that govern the allocation of investment opportunities among us and the other investment funds and accounts managed or sub-advised by Oaktree and its affiliates (collectively, the “Other Oaktree Funds”). To the extent an investment opportunity is appropriate for us and any of the Other Oaktree Funds, Oaktree will adhere to its investment allocation guidelines in order to determine a fair and equitable allocation.
We invest alongside the Other Oaktree Funds in certain circumstances where doing so is consistent with applicable law and SEC staff interpretations. For example, we may invest alongside such Other Oaktree Funds consistent with guidance promulgated by the staff of the SEC permitting us and such Other Oaktree Funds to purchase interests in a single class of privately placed securities so long as certain conditions are met, including that our Adviser, acting on our behalf and on behalf of other clients, negotiates no term other than price or terms related to price.
In addition, on October 18, 2017, OCM received exemptive relief from the SEC to allow certain managed funds and accounts, each of whose investment adviser is OCM or an investment adviser controlling, controlled by or under common control with OCM, to participate in negotiated co-investment transactions where doing so is consistent with the applicable registered fund’s or BDC’s investment objective and strategies as well as regulatory requirements and other pertinent factors, and pursuant to the conditions of the exemptive relief (the “Exemptive Relief”). Each potential co-investment opportunity that falls under the terms of the Exemptive Relief and is appropriate for us and any affiliated fund or account, and satisfies the then-current board-established criteria, will be offered to us and such other eligible funds and accounts. If there is a sufficient amount of securities to satisfy all participants, the securities will be allocated among the participants in accordance with their proposed order size, and if there is an insufficient amount of securities to satisfy all participants, the securities will be allocated pro rata based on the investment proposed by the applicable investment adviser to such participant, up to the amount proposed to be invested by each, which is reviewed and approved by an independent committee of legal, compliance and accounting professionals at our Adviser. On December 15, 2020, we, with our Adviser and certain other affiliates, received a modified exemptive order that allows Oaktree proprietary accounts to participate in co-investment transactions subject to certain conditions.
Although Oaktree will endeavor to allocate investment opportunities in a fair and equitable manner, we and our stockholders could be adversely affected to the extent investment opportunities are allocated among us and the Other Oaktree Funds. We might not participate in each individual opportunity, but will, on an overall basis, be entitled to participate equitably with other entities managed by Oaktree and its affiliates. Oaktree is committed to treating all clients fairly and equitably over
time such that none receive preferential treatment vis-à-vis the others over time, in a manner consistent with its fiduciary duty to each of them, however, in some instances, especially in instances of limited liquidity, the factors may not result in pro rata allocations or may result in situations where certain funds or accounts receive allocations where others do not.
Pursuant to the Investment Advisory Agreement, our Adviser’s liability is limited and we are required to indemnify our Adviser against certain liabilities. This may lead our Adviser to act in a riskier manner in performing its duties and obligations under the Investment Advisory Agreement than it would if it were acting for its own account, and creates a potential conflict of interest.
Pursuant to the Administration Agreement, our Administrator furnishes us with the facilities and administrative services necessary to conduct our day-to-day operations. We pay the Administrator its allocable portion of overhead and other expenses incurred in performing its obligations under the Administration Agreement. This arrangement creates conflicts of interest that our board of directors must monitor.
Election to be Taxed as a Regulated Investment Company
We have elected to be treated, and intend to operate in a manner so as to continuously qualify annually, as a RIC for U.S. federal income tax purposes under Subchapter M of the Code. As a RIC, we generally will not be required to pay corporate-level U.S. federal income taxes on any ordinary income or capital gains that we timely distribute (or are deemed to distribute) to our stockholders as dividends. Instead, dividends we distribute (or are deemed to distributed) generally will be taxable to stockholders, and any net operating losses, foreign tax credits and most other tax attributes generally will not pass through to stockholders. To continue to qualify as a RIC, we must, among other things, meet certain source-of-income and asset diversification requirements (as described below). In addition, to qualify for RIC tax treatment we must distribute to our stockholders, for each tax year, at least 90% of the Company’s “investment company taxable income” for that year, which is generally its ordinary income plus the excess of its realized net short-term capital gains over its realized net long-term capital losses (the “Annual Distribution Requirement”).
If we:
•qualify as a RIC; and
•satisfy the Annual Distribution Requirement;
then we will not be subject to U.S. federal income tax on the portion of our investment company taxable income and net capital gain (i.e., realized net long-term capital gains in excess of realized net short-term capital losses) we distribute to stockholders. We are subject to U.S. federal income tax at the regular corporate rates on any income or capital gain not distributed (or deemed distributed) to our stockholders.
We will be subject to a 4% nondeductible federal excise tax on certain undistributed income unless we distribute in a timely manner an amount at least equal to the sum of (1) 98% of our ordinary income for each calendar year, (2) 98.2% of our capital gain net income for the one-year period ending October 31 in that calendar year and (3) any income realized, but not distributed, and on which we paid no U.S. federal income tax, in preceding years.
In order to maintain our qualification as a RIC for U.S. federal income tax purposes, we must, among other things:
•at all times during each tax year, have in effect an election to be treated as a BDC under the Investment Company Act;
•derive in each tax year at least 90% of our gross income from (a) dividends, interest, payments with respect to certain securities (including loans), gains from the sale of stock or other securities or currencies, or other income derived with respect to our business of investing in such stock, securities or currencies and (b) net income derived from an interest in a “qualified publicly traded partnership;” (the “90% Gross Income Test”) and
•diversify our holdings so that at the end of each quarter of the tax year:
◦(i) at least 50% of the value of our assets consists of cash, cash equivalents, U.S. government securities, securities of other RICs, and other securities if such other securities of any one issuer do not represent more than 5% of the value of its assets or more than 10% of the outstanding voting securities of the issuer; and
◦(ii) no more than 25% of the value of our assets is invested in (a) the securities, other than U.S. government securities or securities of other RICs, of one issuer, (b) the securities of two or more issuers that are controlled, as determined under applicable tax rules, by us and that are engaged in the same or similar or
related trades or businesses or (c) the securities of one or more “qualified publicly traded partnerships” ((i) and (ii) collectively, the “Diversification Tests”).
We may be required to recognize taxable income in circumstances in which we do not receive cash. For example, if we hold debt obligations that are treated under applicable tax rules as having OID (such as debt instruments with increasing interest rates or debt instruments issued with warrants), we must include in income each year a portion of the OID that accrues over the life of the obligation, regardless of whether cash representing such income is received by us in the same tax year. Because any OID accrued will be included in our investment company taxable income for the year of accrual, we may be required to make a distribution to our stockholders in order to satisfy the Annual Distribution Requirement, even though we will not have received any corresponding cash amount.
We may have difficulty satisfying the diversification requirements as we liquidate our portfolio following the Investment Period, given that we will not be making additional investments. Though we generally will not lose our status as a RIC as long as we do not acquire any non-qualifying securities or other property, under certain circumstances we may be deemed to have made an acquisition of non-qualifying securities or other property.
Because we use debt financing, we are subject to certain asset coverage ratio requirements under the Investment Company Act described above and financial covenants under loan and credit agreements that could, under certain circumstances, restrict us from making distributions necessary to satisfy the Annual Distribution Requirement. If we are unable to obtain cash from other sources or are otherwise limited in our ability to make distributions, we could fail to qualify for RIC tax treatment and thus become subject to corporate-level income tax.
Certain of our investment practices may be subject to special and complex U.S. federal income tax provisions that may, among other things: (a) disallow, suspend or otherwise limit the allowance of certain losses or deductions; (b) convert lower taxed long-term capital gain into higher taxed short-term capital gain or ordinary income; (c) convert an ordinary loss or a deduction into a capital loss (the deductibility of which is more limited); (d) cause us to recognize income or gain without a corresponding receipt of cash; (e) adversely affect the time as to when a purchase or sale of securities is deemed to occur; (f) adversely alter the characterization of certain complex financial transactions; or (g) produce income that will not be qualifying income for purposes of the 90% Gross Income Test described above. We will monitor our transactions and may make certain tax elections in order to mitigate the potential adverse effect of these provisions.
If, in any particular tax year, we do not qualify as a RIC, all of our taxable income (including our net capital gains) will be subject to tax at regular corporate rates without any deduction for distributions to stockholders, and distributions will be taxable to the stockholders as ordinary dividends to the extent of our current and accumulated earnings and profits.
Certain BDC Regulatory Considerations
We have elected to be a BDC under the Investment Company Act and to be taxed as a RIC. As with other companies regulated by the Investment Company Act, a BDC must adhere to certain substantive regulatory requirements. The Investment Company Act contains prohibitions and restrictions relating to transactions between BDCs and their affiliates (including any investment advisers), principal underwriters and affiliates of those affiliates or underwriters.
The Investment Company Act further requires that a majority of our directors be persons other than “interested persons,” as that term is defined in the Investment Company Act. In addition, we may not change the nature of our business so as to cease to be, or withdraw our election as, a BDC unless authorized by a vote of a majority of the outstanding voting securities, as required by the Investment Company Act. A majority of the outstanding voting securities of a company are defined under the Investment Company Act as the lesser of: (a) 67% or more of such company’s voting securities present at a meeting if more than 50% of the outstanding voting securities of such company are present or represented by proxy, and (b) more than 50% of the outstanding voting securities of such company. We do not anticipate any substantial change in the nature of our business.
We are not generally able to issue and sell our Common Stock at a price below Net Asset Value per share. We may, however, sell our Common Stock, or warrants, options or rights to acquire our Common Stock, at a price below the then-current Net Asset Value of our Common Stock if the following conditions, among others, are satisfied: (i) a majority of our stockholders and a majority of our stockholders that are not our affiliates approve such sales within one year immediately prior to such sales and (ii) a majority of our directors who are not "interested persons" of the Company as that term is defined in the Investment Company Act and a majority of our directors who have no financial interest in the transaction determine that such sales are in the best interests of the Company and its stockholders. We may also make rights offerings to our stockholders at prices per share less than the net asset value per share, subject to applicable requirements of the Investment Company Act.
Investment Restrictions
We do not intend to acquire securities issued by any investment company that exceed the limits imposed by the Investment Company Act. Under such limits, except for registered money market funds, we generally cannot invest more than 5% of the value of our total assets in the securities of one investment company or invest more than 10% of the value of our total assets in the securities of investment companies in the aggregate. The portion of our portfolio invested in securities issued by investment companies ordinarily will subject stockholders to additional indirect expenses. None of the policies described above are fundamental and each such policy may be changed without stockholder approval, subject to any limitations imposed by the Investment Company Act. Our investment portfolio is also subject to certain source-of-income and asset diversification requirements by virtue of its status to be a RIC for U.S. tax purposes. See “– Election to be Taxed as a Regulated Investment Company” above for more information.
Qualifying Assets
Under the Investment Company Act, a BDC may not acquire any asset other than assets of the type listed in Section 55(a) of the Investment Company Act, which are referred to as Qualifying Assets, unless at the time the acquisition is made, Qualifying Assets represent at least 70% of the BDC’s total assets. The principal categories of Qualifying Assets relevant to our business are the following:
(1) Securities purchased in transactions not involving any public offering from the issuer of such securities, which issuer (subject to certain limited exceptions) is an eligible portfolio company, or from any person who is, or has been during the preceding 13 months, an affiliated person of an eligible portfolio company, or from any other person, subject to such rules as may be prescribed by the SEC. An eligible portfolio company is defined in the Investment Company Act as any issuer which:
(a) is organized under the laws of, and has its principal place of business in, the United States;
(b) is not an investment company (other than a small business investment company wholly owned by the BDC) or a company that would be an investment company but for certain exclusions under the Investment Company Act; and
(c) satisfies any of the following:
i. does not have any class of securities that is traded on a national securities exchange;
ii. has a class of securities listed on a national securities exchange, but has an aggregate market value of outstanding voting and non-voting common equity of less than $250 million;
iii. is controlled by a BDC or a group of companies including a BDC and the BDC has an affiliated person who is a director of the eligible portfolio company; or
iv. is a small and solvent company having total assets of not more than $4.0 million and capital and surplus of not less than $2.0 million.
(2) Securities of any eligible portfolio company which we control.
(3) Securities purchased in a private transaction from a U.S. issuer that is not an investment company or from an affiliated person of the issuer, or in transactions incident thereto, if the issuer is in bankruptcy and subject to reorganization or if the issuer, immediately prior to the purchase of its securities, was unable to meet its obligations as they came due without material assistance other than conventional lending or financing arrangements.
(4) Securities of an eligible portfolio company purchased from any person in a private transaction if there is no ready market for such securities and we already own 60% of the outstanding equity of the eligible portfolio company.
(5) Securities received in exchange for or distributed on or with respect to securities described in (1) through (4) above, or pursuant to the exercise of warrants or rights relating to such securities.
(6) Cash, cash equivalents, U.S. government securities or high-quality debt securities maturing in one year or less from the time of investment.
Managerial Assistance to Portfolio Companies
In addition, a BDC must have been organized under the laws of, and have its principal place of business in, any state or states within the United States and must be operated for the purpose of making investments in the types of securities described in (1), (2) or (3) above. However, in order to count portfolio securities as Qualifying Assets for the purpose of the 70% test, a BDC must either control the issuer of the securities or must offer to make available to the issuer of the securities (other than small and solvent companies described above) significant managerial assistance. However, when a BDC purchases securities in conjunction with one or more other persons acting together, one of the other persons in the group may make available such managerial assistance. Making available managerial assistance includes any arrangement whereby a BDC, through its directors, officers or employees, offers to provide, and, if accepted, does so provide, significant guidance and counsel concerning the management, operations or business objectives and policies of a portfolio company.
Temporary Investments
Pending investment in other types of Qualifying Assets, as described above, our investments may consist of cash, cash equivalents, U.S. government securities or high-quality debt securities maturing in one year or less from the time of investment (collectively, “temporary investments”) so that 70% of our assets are Qualifying Assets. We may also invest in U.S. Treasury bills or in repurchase agreements, provided that such agreements are fully collateralized by cash or securities issued by the U.S. government or its agencies. A repurchase agreement involves the purchase by an investor, such as the Company, of a specified security and the simultaneous agreement by the seller to repurchase it at an agreed-upon future date and at a price which is greater than the purchase price by an amount that reflects an agreed-upon interest rate. There is no percentage restriction on the proportion of our assets that may be invested in such repurchase agreements. However, if more than 25% of our gross assets constitute repurchase agreements from a single counterparty, we would not meet the diversification tests in order to qualify as a RIC. Thus, we do not intend to enter into repurchase agreements with a single counterparty in excess of this limit. Our Adviser will monitor the creditworthiness of the counterparties with which we enter into repurchase agreement transactions.
Indebtedness and Senior Securities
Consistent with applicable legal and regulatory requirements, we are permitted, under specified conditions, to issue multiple classes of indebtedness and one class of stock senior to our Common Stock if we meet an asset coverage ratio, as calculated as provided in the Investment Company Act, of at least 150% immediately after each such issuance. In addition, while any senior securities remain outstanding, we may be prohibited from making distributions to our stockholders or the repurchase of such securities or shares unless we meet the applicable asset coverage ratios at the time of the distribution or repurchase. We would also be permitted to borrow amounts up to 5% of the value of our total assets for generally up to 60 days for temporary purposes without regard to asset coverage.
Other
We are subject to periodic examination by the SEC for compliance with the Investment Company Act.
We are required to provide and maintain a bond issued by a reputable fidelity insurance company to protect us against larceny and embezzlement. Furthermore, as a BDC, we are prohibited from protecting any director or officer against any liability to us or the stockholders arising from willful misfeasance, bad faith, gross negligence or reckless disregard of the duties involved in the conduct of such person’s office.
We and our Adviser are required to adopt and implement written policies and procedures reasonably designed to prevent violation of the U.S. federal securities laws, review these policies and procedures annually for their adequacy and the effectiveness of their implementation, and designate a Chief Compliance Officer to be responsible for administering the policies and procedures.
Code of Ethics
We have adopted a joint code of ethics with OCSL pursuant to Rule 17j-1 under the Investment Company Act that establishes procedures for personal investments and restricts certain personal securities transactions. Personnel subject to the code are permitted to invest in securities for their personal investment accounts, including securities that may be purchased or held by us, so long as such investments are made in accordance with the code’s requirements. We hereby undertake to provide a copy of this code to any person, without charge, upon request. Requests for a copy of this code may be made in writing addressed to Oaktree Strategic Income II, Inc., 333 South Grand Avenue, 28th Floor, Los Angeles, CA 90071.
Proxy Voting Policies and Procedures
We have delegated our proxy voting responsibility to our Adviser. The proxy voting policies and procedures of our Adviser are set forth below. These guidelines are reviewed periodically by our Adviser and our independent directors, and, accordingly, are subject to change.
An investment adviser registered under the Advisers Act has a fiduciary duty to act solely in the best interests of its clients. As part of this duty, our Adviser recognizes that it must vote portfolio securities in a timely manner free of conflicts of interest and in the best interests of its clients.
These policies and procedures for voting proxies are intended to comply with Section 206 of, and Rule 206(4)-6 under, the Advisers Act.
Our Adviser will vote proxies relating to our portfolio securities, if any, in what it perceives to be the best interest of our stockholders. Our Adviser will review on a case-by-case basis each proposal submitted to a shareholder vote to determine its impact on portfolio securities held by us. Although our Adviser will generally vote against proposals that may have a negative impact on our portfolio securities, it may vote for such a proposal if there are compelling long-term reasons to do so.
Our Adviser’s proxy voting decisions will be made by officers who are responsible for monitoring each of our investments. To ensure that the vote is not the product of a conflict of interest, our Adviser will require that: (1) anyone involved in the decision-making process disclose to the Chief Compliance Officer any potential conflict that he or she is aware of and any contact that he or she has had with any interested party regarding a proxy vote; and (2) employees involved in the decision-making process or vote administration are prohibited from revealing how our Adviser intends to vote on a proposal, in order to reduce any attempted influence from interested parties.
Stockholders may obtain information regarding how we voted proxies by making a written request for proxy voting information to: Oaktree Strategic Income II, Inc., c/o Oaktree Capital Management, L.P., 333 South Grand Avenue 28th Floor, Los Angeles, CA 90071.
Privacy Principles
We endeavor to maintain the privacy of our stockholders and to safeguard their non-public personal information. The following information is provided to help stockholders understand what non-public personal information we collect, how we protect that information and why, in certain cases, we may share that information with select other parties.
We may collect non-public personal information about stockholders from our subscription agreements or other forms, such as name, address, account number and the types and amounts of investments, and information about transactions with us or our affiliates, such as participation in other investment programs, ownership of certain types of accounts or other account data and activity. We may disclose the non-public personal information that we collect from our stockholders or former stockholders, as described above, to our affiliates and service providers and as allowed by applicable law or regulation. Any party that receives this information from us is permitted to use it only for the services required by us and as allowed by applicable law or regulation, and is not permitted to share or use this information for any other purpose. We permit access only by authorized personnel who need access to that non-public personal information to provide services to us and the stockholders. We also maintain physical, electronic and procedural safeguards for non-public personal information that are designed to comply with applicable law.
Reporting Obligations
We file with the SEC annual reports containing audited financial statements, quarterly reports, and such other periodic reports as we determine to be appropriate or as may be required by law. We are required to comply with all periodic reporting, proxy solicitation and other applicable requirements under the Exchange Act.
We do not maintain a website and therefore do not make available through a website our annual reports on Form 10-K, quarterly reports on Form 10-Q, current reports on Form 8-K, reports on Forms 3 and 4 regarding directors, officers or 10% beneficial owners of us, filed or furnished pursuant to section 13(a), 15(d) or 16(a) of the Exchange Act or other reports we file with the SEC. We will provide, however, electronic or paper copies of our filings free of charge upon request to Oaktree Strategic Income II, Inc., 333 South Grand Avenue 28th Floor, Los Angeles, CA 90071.
The SEC also maintains a website (www.sec.gov) that contains reports, proxy and information statements, and other information regarding issuers that file electronically with the SEC such as the Company.
Sarbanes-Oxley Act
The Sarbanes-Oxley Act imposes a wide variety of regulatory requirements on publicly-held companies and their insiders. Many of these requirements affect us. For example:
•pursuant to Rule 13a-14 under the Exchange Act, our Chief Executive Officer and Chief Financial Officer are required to certify the accuracy of the financial statements contained in our periodic reports;
•pursuant to Item 307 of Regulation S-K, our periodic reports are required to disclose our conclusions about the effectiveness of our disclosure controls and procedures;
•pursuant to Rule 13a-15 under the Exchange Act, our management is required to prepare a report regarding its assessment of our internal control over financial reporting and (starting from the date on which we cease to be an emerging growth company under the JOBS Act and have become an "accelerated filer" under the Exchange Act) must obtain an audit performed by our independent registered public accounting firm of the effectiveness of the Company's internal control over financial reporting. Foregoing the attestation requirement may increase the risk that material weaknesses or other deficiencies in our internal control over financial reporting go undetected; and
•pursuant to Item 308 of Regulation S-K and Rule 13a-15 of the Exchange Act, our periodic reports must disclose whether there were significant changes in our internal controls over financial reporting or in other factors that could significantly affect these controls subsequent to the date of their evaluation, including any corrective actions with regard to material weaknesses.
The Sarbanes-Oxley Act requires us to review our current policies and procedures to determine whether we comply with the Sarbanes-Oxley Act and the regulations promulgated thereunder. We will continue to monitor compliance with all regulations that are adopted under the Sarbanes-Oxley Act and will take actions necessary to ensure that we are in compliance therewith.
Item 1A. Risk Factors
Investing in our securities involves a number of significant risks. In addition to the other information contained in this annual report on Form 10-K, you should consider carefully the following information before making an investment in our securities. The risks set out below are not the only risks we face. Additional risks and uncertainties not presently known to us or not presently deemed material by us might also impair our operations and performance. If any of the following events occur, our business, financial condition and results of operations could be materially and adversely affected. In such case, our Net Asset Value and the trading price of our securities could decline, and you may lose part or all of your investment. The risk factors described below are the principal risk factors associated with an investment in us as well as those factors generally associated with an investment company with investment objectives, investment policies, capital structure or trading markets similar to ours.
Summary Risk Factors
The following is a summary of the principal risk factors associated with an investment in us:
•Our current and future investments in distressed or bankrupt companies are subject to significant risks — We have acquired, and may in the future opportunistically acquire the securities and obligations of distressed companies, including opportunistic acquisitions during the COVID-19 pandemic. These investments in distressed companies are subject to significant risks, including lack of income, extraordinary expenses, uncertainty with respect to satisfaction of debt, lower-than-expected investment values or income potentials and resale restrictions.
•Uncertainty regarding LIBOR may adversely affect our business, results of operations and financial condition —Changes in interest rates, changes in the method for determining the London Interbank Offered Rate ("LIBOR") and the eventual replacement of LIBOR may adversely affect our cost of capital and net investment income.
•Our investments in portfolio companies may be risky, and we could lose all or parts of our investments — Middle-market companies in which we primarily invest, as compared with larger companies, may have more limited financial resources, less predictable operating results, greater exposure to economic downturns and limited operating histories, and, for many of our investments, the portfolio companies are highly leveraged and there is little or no publicly available information about them, and our investments in such companies are not rated by any rating agency.
•We operate in a highly competitive market for investment opportunities — We may not be able to take advantage of attractive investment opportunities as a result of competition with other investors.
•A significant portion of our portfolio securities do not have a readily available market price and, as a result, valuations of our portfolio involve uncertainties and subjective determinations — Our portfolio securities typically do not have a readily available market price and, in such a case, we value these securities at fair value as determined in good faith by our Adviser under procedures adopted by our board of directors, which valuation is inherently subjective and may not reflect what we may actually realize from the sale of the investment.
•We are dependent upon our Adviser for future success — Our ability to achieve our investment objective depends in substantial part on the management, skill and acumen of our Adviser. If our Adviser were to lose key personnel or were to resign, our ability to achieve our investment objective could be significantly impeded.
•Our Adviser may face conflicts of interest — Conflicts of interest may exist from time to time between our Adviser and certain of its affiliates involved with us, which could impact our investment returns.
•We are subject to substantial regulation — Regulations governing our operation as a BDC and RIC affect our ability to raise, and the way in which we raise, additional capital or borrow for investment purposes, which may have a negative effect on our growth.
•Our indebtedness could adversely affect our business, financial conditions or results of operations — We borrow money, which magnifies the potential for gain or loss on amounts invested, and each of our investments is pledged as collateral under one or more of our credit facilities, which may increase the risk of investing in us.
•There are risks related to the Mergers that could adversely affect us or our stockholders. Stockholders cannot be sure of the market value of the consideration they will receive in connection with the Mergers until the closing date of the Mergers. OCSL may be unable to realize the benefits anticipated by the Mergers, including estimated cost savings, or it may take longer than anticipated to achieve such benefits. The Mergers may not be consummated, which may have a negative impact on our business.
•General economic and market conditions, including those caused by inflation and a rising interest rate environment, could materially affect the success of our activities and investments. Unfavorable economic conditions
could increase our funding costs, limit our access to the capital markets or result in a decision by lenders not to extend credit to us, and market conditions (including inflation, supply chain issues and decreased consumer demand) have adversely impacted, and could in the future further impact, the operations of certain of our portfolio companies.
•Global economic, political and market conditions may adversely affect our business, results of operations and financial condition, including our revenue growth and profitability — Economic recessions or downturns, changes in regulations or regulatory interpretations thereof, transitions of government, and uncertainty regarding any of the foregoing may have a material adverse effect on our business, financial condition and results of operations, and could impair the ability of our portfolio companies to repay debt or pay interest.
Risks Relating to Our Investments
We invest primarily in privately owned small- and medium-sized companies, which involve a number of significant risks.
We invest primarily in privately owned small- and medium-sized companies. Investments in these types of companies pose a number of significant risks. For example, such companies: (a) have reduced access to the capital markets, resulting in diminished capital resources and ability to withstand financial distress; (b) may have limited financial resources and may be unable to meet their obligations under the debt securities that we hold, which may be accompanied by a deterioration in the value of any collateral and a reduction in the likelihood of us realizing any guarantees we may have obtained in connection with our investment; (c) may have shorter operating histories, narrower product lines and smaller market shares than larger businesses, which tend to render them more vulnerable to competitors’ actions and changing market conditions, as well as general economic downturns; (d) are more likely to depend on the management talents and efforts of a small group of persons; therefore, the death, disability, resignation or termination of one or more of these persons could have a material adverse impact on the portfolio company and, in turn, on us; (e) may have less predictable operating results, may from time to time be parties to litigation, may be engaged in volatile businesses with products subject to a substantial risk of obsolescence and may require substantial additional capital to support their operations, finance expansion or maintain their competitive position; and (f) are not subject to the Exchange Act and other regulations that govern public companies, and therefore provide little information to the public. In addition, we, our Adviser, its affiliates and their directors, executive management team and members and the Investment Professionals may, in the ordinary course of business, be named as defendants in litigation arising from our investments in such portfolio companies.
Also, investments in such companies tend to be less liquid. See “– We invest in illiquid investments and may experience difficulty in selling those investments in a timely manner at the price that we believe the investments are worth.”
Finally, as noted above, little public information generally exists about privately owned companies, and these companies often do not have third-party debt ratings or audited financial statements. Stockholders, therefore, must rely on the ability of the Adviser to obtain adequate information through due diligence to evaluate the creditworthiness and potential returns from investing in these companies. Additionally, these companies and their financial information will not generally be subject to the Sarbanes-Oxley Act and other rules that govern public companies. If the Adviser is unable to uncover all material information about these companies, it may not make a fully informed investment decision, and stockholders may lose money on our investments.
Our investments in portfolio companies may be risky, and we could lose all or parts of our investments.
The companies in which we invest are typically highly leveraged, and, in most cases, our investments in such companies are not rated by any rating agency. If such investments were rated, we believe that they would likely receive a rating from a nationally recognized statistical rating organization of below investment grade (i.e., below BBB- or Baa), which is often referred to as "high yield" and "junk." Exposure to below investment grade securities involves certain risks, and those securities are viewed as having predominately speculative characteristics with respect to the issuer's capacity to pay interest and repay principal. Investing in small and mid-sized companies involves a number of significant risks. Securities in the lower-rated categories and comparable non-rated securities are subject to greater risk of loss of principal and interest than higher-rated and comparable non-rated securities and are generally considered to be predominantly speculative with respect to the issuer’s capacity to pay interest and repay principal. Such issuers typically are highly leveraged, with significant burdens on cash flow and, therefore, involve a high degree of financial risk. During an economic downturn or recession, securities of financially troubled or operationally troubled issuers are more likely to go into default than securities of other issuers. Because investors generally perceive that there are greater risks associated with the lower-rated and comparable non-rated securities, the yields and prices of such securities may be more volatile than those for higher-rated and comparable non-rated securities. The market for lower-rated and comparable non-rated securities is thinner, often less liquid and less active than that for higher-rated or
comparable non-rated securities, and the market prices of such securities are subject to erratic and abrupt movements. The spread between bid and asked prices for such securities may be greater than normally expected. Such factors can adversely affect the prices at which these securities can be sold and may even make it difficult to sell such securities.
Investment in the securities of financially troubled issuers and operationally troubled issuers involves a high degree of credit and market risk. These financial difficulties may never be overcome and may cause issuers to become subject to bankruptcy proceedings.
We have acquired, and may in the future opportunistically acquire the securities and obligations of distressed companies. These investments in distressed or bankrupt companies are subject to significant risks, including lack of income, extraordinary expenses, uncertainty with respect to satisfaction of debt, lower-than-expected investment values or income potentials and resale restrictions.
We have acquired, and may in the future acquire, the securities and other obligations of distressed or bankrupt companies. At times, distressed debt obligations may not produce income and may require us to bear certain extraordinary expenses (including legal, accounting, valuation and transaction expenses) in order to protect and recover our investment. Therefore, when we invest in distressed debt, our ability to achieve current income for our stockholders may be diminished, particularly where the portfolio company has negative earnings before interest, taxes, depreciation and amortization ("EBITDA").
We also are subject to significant uncertainty as to when, in what manner and for what value the distressed debt we acquire will eventually be satisfied whether through a refinancing, restructuring, liquidation, an exchange offer or plan of reorganization involving the distressed debt securities or a payment of some amount in satisfaction of the obligation. In addition, even if an exchange offer is made or plan of reorganization is adopted with respect to distressed debt held by us, there can be no assurance that the securities or other assets received by us in connection with such exchange offer or plan of reorganization will not have a lower value or income potential than may have been anticipated when the investment was made.
Moreover, any securities received by us upon completion of an exchange offer or plan of reorganization may be restricted as to resale. As a result of our participation in negotiations with respect to any exchange offer or plan of reorganization with respect to an issuer of distressed debt, we may be restricted from disposing of such securities.
Our portfolio securities typically do not have a readily available market price and, in such a case, we value these securities at fair value as determined in good faith under procedures adopted by our board of directors, which valuation is inherently subjective and may not reflect what we may actually realize from the sale of the investment.
Valuations of our portfolio, which will affect the amount of the Management Fee and Incentive Fee and our performance results, may involve uncertainties and judgmental determinations. As a BDC, we are required to account for our investments at market value or, if no market value is ascertainable, at fair value as determined in good faith by or under the direction of our board of directors. Typically, there is not a public market for the securities of the privately held companies in which we invest. As a result, we value these securities quarterly at fair value as determined in good faith by or under the direction of our board of directors. Our board of directors has designated the Adviser as the valuation designee pursuant to Rule 2a-5 under the Investment Company Act. The fair value of such securities may change, potentially materially, between the date of the fair value determination and the release of the financial results for the corresponding period or the next date at which fair value is determined.
The process of valuing securities for which reliable market quotations are not available is based on inherent uncertainties, and the resulting values may differ from values that would have been determined had a ready market existed for such securities and may differ from the prices at which such securities may ultimately be sold. Further, third-party pricing information may at times not be available regarding certain of our securities, derivatives and other assets. Certain factors that may be considered in determining the fair value of our investments include the nature and realizable value of any collateral, the portfolio company’s earnings and its ability to make payments on its indebtedness, the markets in which the portfolio company does business, comparison to comparable publicly traded companies, discounted cash flow and other relevant factors. Because such valuations, and particularly valuations of private securities and private companies, are inherently uncertain, may fluctuate over short periods of time and may be based on estimates, our determinations of fair value may differ materially from the values that would have been used if a ready market for these securities existed. In addition, any investments that include OID or PIK interest may have unreliable valuations because their continuing accruals require ongoing judgments about the collectability of their deferred payments and the value of their underlying collateral. Due to these uncertainties, fair value determinations may cause the Net Asset Value on a given date to materially understate or overstate the value that we ultimately realize upon the sale of one or more investments.
A disruption in the secondary markets for our investments may limit the ability of our Adviser to obtain accurate market quotations for purposes of valuing our investments and calculating our Gross Asset Value and the Net Asset Value. In addition, material events occurring after the close of a principal market upon which a portion of our securities or other assets are traded may require the Adviser to make a determination of the effect of a material event on the value of the securities or other assets traded on the market for purposes of determining the fair value of our investments on a valuation date. If the valuation of our securities in accordance with Oaktree’s valuation policy should prove to be incorrect, the fair value of our investments could be adversely affected. Absent bad faith or manifest error, valuation determinations in accordance with Oaktree’s valuation policy will be conclusive and binding. Furthermore, these values are used to determine our Net Asset Value in connection with the shares of Common Stock. To the extent these investments are undervalued or overvalued, the Common Stock of existing stockholders or newly admitted stockholders could be adversely affected.
We may rely upon projections, forecasts or estimates developed by our Adviser and/or a portfolio company concerning a portfolio company’s future performance and cash flow.
We may rely upon projections developed by Oaktree or a third party concerning an investment’s future performance and cash flow, including when deciding that the possibility of actual adversity in connection with an investment in a different part of the capital structure of the portfolio company is remote. Projections are inherently subject to uncertainty and factors beyond the control of Oaktree and the portfolio company. In all cases, projections are only estimates of future results that are based upon assumptions made at the time that the projections are developed. Different assumptions may produce different results. The inaccuracy of certain assumptions, the failure to satisfy certain financial requirements and the occurrence of other unforeseen events could impair the ability of a portfolio company to realize projected values and cash flow and could trigger the need for us to remain passive in the event of a restructuring. In addition, prospective investors should note that projected performance is not indicative of future results and there can be no assurance that the projected results or expected returns will be achieved or that we will be able to effectively implement our investment objective.
In addition, Oaktree may determine the suitability of investments based in part on the basis of financial projections for portfolio issuers. Events or conditions, including changes in general market conditions, which may not have been anticipated or which are otherwise not foreseeable, may occur and have a significant impact on the actual rate of return received with respect to our investments.
Our portfolio may be concentrated in a limited number of portfolio companies and industries, which will subject us to a risk of significant loss if any of these companies defaults on its obligations under any of its debt instruments or if there is a downturn in a particular industry.
Except to the extent required as a BDC or RIC, the Adviser is not under any other obligation to diversify our investments, whether by reference to the amount invested or the industries or geographical areas in which portfolio companies operate. Oaktree may allocate capital among investments as it determines in its sole discretion, subject to the goal of maximizing our returns, and stockholders will have no assurances with respect to the diversification or geographic concentration of the investment program. This lack of diversification will expose us to losses disproportionate to market declines in general if there are disproportionately greater adverse price movements in the particular investments, and our investment portfolio may be subject to more rapid changes in value than would be the case if we were required to maintain a wide diversification among companies, industries and types of securities. To the extent we hold investments concentrated in a particular issuer, security, asset class, industry or geographic region, we will be more susceptible than a more widely diversified investment vehicle to the negative consequences of a single corporate, economic, political or regulatory event. Unfavorable performance by any number of investments could substantially adversely affect the aggregate returns realized by stockholders. Approximately 19.69% of the Company's investments at fair value as of September 30, 2022 are concentrated in the Application Software industry.
Our portfolio companies may be highly leveraged.
Our investments may include companies whose capital structures have significant leverage. Such investments are inherently more sensitive to declines in revenues and to increases in expenses and interest rates. The leveraged capital structure of such investments will increase the exposure of the portfolio companies to adverse economic factors, such as downturns in the economy or deterioration in the condition of the portfolio company or its industry. Additionally, the securities acquired by us may be the most junior in what will typically be a complex capital structure, and thus subject to the greatest risk of loss.
Furthermore, we engage in certain investment activities that involve the use of leverage. The cumulative effect of our use of leverage in a market that moves adversely to our investments could result in a loss to us that would be greater than if leverage had not been used, including loss of the entire investment and also the possibility of loss exceeding the original amount of a particular investment. To the extent that we engage in any leveraging, it will be subject to the risks normally
associated with debt financing, including those relating to the ability to refinance and the insufficiency of cash flow to meet principal and interest payments, which could significantly reduce or even eliminate the value of our investment. Leveraging the capital structure will mean that third parties, such as banks, may be entitled to the cash flow generated by such investments prior to our receiving a return. Also, if an asset of us is mortgaged or otherwise used as collateral to secure repayment of indebtedness and such payments are not made, the asset could be foreclosed upon by the lender or otherwise transferred to the lender.
There are also financing costs associated with leverage, and such costs will be borne by us and therefore may adversely affect the rate of returns obtained by us. In addition, each leveraged investment will involve interest rate risk, including to the extent that financing charges for such leveraged investment are based on a predetermined interest rate. Our assets, including any investment made by us and any capital held by us, are available to satisfy all liabilities and our other obligations. If we default on secured indebtedness, the lender may foreclose and we could lose our entire investment in the collateral for such loan. If we become subject to a liability, parties seeking to have the liability satisfied may have recourse to our assets generally and not be limited to any particular asset, such as the investment giving rise to the liability.
Inflation may adversely affect the business, results of operations and financial condition of our portfolio companies.
Certain of our portfolio companies may be impacted by inflation. If such portfolio companies are unable to pass any increases in their costs along to their customers, it could adversely affect their results and their ability to impacting their ability to pay interest and principal on our loans, particularly if interest rates rise in response to inflation. In addition, any projected future decreases in our portfolio companies’ operating results due to inflation could adversely impact the fair value of those investments. Any decreases in the fair value of our investments could result in future unrealized losses and therefore reduce our net assets resulting from operations.
Our failure to make follow-on investments in our portfolio companies could impair the value of our investments.
We may be called upon to provide follow-on funding for our investments or have the opportunity to increase our investment in such investments. There can be no assurance that we will wish to make follow-on investments or that we will have sufficient funds to do so. Any decision by us not to make follow-on investments or our inability to make them may have a substantial negative impact on an investment in need of such an investment or may diminish our ability to influence such investment’s future development. There can be no assurance that the Adviser will be able to predict accurately how much capital may need to be reserved by us for participation in follow-on investments. If more capital is reserved than is necessary, then we may receive a lower allocation of other investment opportunities. If less capital is reserved than is necessary, then we may not be able to fully protect or enhance our existing investment.
Because we generally do not hold controlling equity interests in our portfolio companies, we may not be in a position to exercise control over our portfolio companies or to prevent decisions by management of our portfolio companies that could decrease the value of our investments.
We generally do not make investments that result in control of, or significant influence over, a company. Although Oaktree monitors the performance of each investment and may make recommendations, we rely upon management to operate the portfolio companies on a day-to-day basis and equity sponsors who control the boards of directors of the portfolio companies to select qualified management for such companies. As a result, we may have a more limited ability to protect our investment in portfolio companies than if we held a controlling interest or position of significant influence. In addition, certain of our investments may be in businesses with limited operating histories.
When we do have an ability to significantly influence a company or an investment, it will expose us to additional risks of liability and may subject us to indemnification obligations.
In certain circumstances, including if we invest in a different part of the capital structure as Other Oaktree Funds, our holdings may be aggregated with those of such Other Oaktree Funds, which collectively may be deemed to give these funds and accounts controlling interests in or the ability to significantly influence a portfolio company. The exercise of control of, or significant influence over, a portfolio company may impose additional risks of liability for environmental damage, product defects, failure to supervise management, violation of governmental regulations (including securities laws) or other types of liability in which the limited liability generally characteristic of business ownership may be ignored. In addition, a greater level of involvement by Oaktree in a portfolio company may subject us to a greater risk of litigation by third parties. The expense of defending against claims by third parties and paying any amounts pursuant to settlements or judgments would, absent certain conduct by Oaktree, be borne by us and would reduce our net assets. If these liabilities were to arise, we might suffer a
significant loss. However, we may have a more limited ability to protect our investment in portfolio companies or issuers in which a controlling interest or position of significant influence has not been obtained. We will be required to indemnify Oaktree and others in connection with such litigation, as well as other matters arising as a result of our management, subject to certain conditions.
We invest in illiquid investments and may experience difficulty in selling those investments in a timely manner at the price that we believe the investments are worth.
We invest, and will continue to invest, in companies whose securities are illiquid, thinly traded for which no market exists or are restricted as to their transferability under applicable securities laws or documents governing our particular transactions. Some securities or instruments that were liquid at the time they were acquired may, for a variety of reasons which may not be in our control, later become illiquid. This factor may have the effect of limiting the availability of these securities or instruments for our purchase and may also limit our ability to sell such investments at their fair market value prior to our termination or in response to changes in the economy or the financial markets. In addition, if we are required to liquidate all or a portion of our portfolio quickly, we may realize significantly less than the value at which we had previously recorded our investments. Due to securities regulations governing certain publicly traded equity securities, our ability to sell securities could also be diminished with respect to equity holdings that represent a significant portion of the issuer’s securities (particularly if we have designated one or more directors of the issuer). Thus, there can be no assurance as to the timing and amount of our distributions, and any distribution that would require either an in-kind distribution or a forced sale of illiquid assets at a price deemed unattractive by the Adviser may occur after the expiration of the Investment Period. To the extent any of our investments cannot be sold prior to the end of the Investment Period, they may be distributed in kind to stockholders. The securities and instruments so distributed may not be readily marketable.
We may face risks in connection with frequent trading and high portfolio turnover.
The different strategies used by us may require frequent trading and a high portfolio turnover. The more frequently we trade, the higher the commission and transaction costs and certain other expenses involved in our operations. These costs will be borne by us regardless of the profitability of our investment and trading activities. In addition, a high portfolio turnover may increase the recognition of short-term, rather than long-term, capital gains.
Debt instruments and loans acquired by us may become non-performing following their acquisition.
Debt instruments and loans acquired by us may become non-performing following their acquisition for a wide variety of reasons. Such non-performing instruments or loans may require a substantial amount of workout negotiations or restructuring, which may entail, among other things, a substantial reduction in the interest rate and a substantial write-down of principal. It is possible that we may find it necessary or desirable to foreclose on collateral securing one or more real loans purchased by us. The foreclosure process varies jurisdiction by jurisdiction and can be lengthy and expensive. Borrowers often resist foreclosure actions, which often prolongs and complicates an already difficult and time-consuming process. In some states or other jurisdictions, foreclosure actions can take up to several years or more to conclude. During the foreclosure proceedings, a borrower may have the ability to file for bankruptcy, potentially staying the foreclosure action and further delaying the foreclosure process. Foreclosure litigation tends to create a negative public image of the collateral property and may result in disrupting ongoing leasing and management of the property.
There may be circumstances where our debt investments could be subordinated to claims of other creditors or we could be subject to lender liability claims.
In recent years, a number of judicial decisions in the United States have upheld the right of borrowers to sue lending institutions on the basis of various evolving legal theories (collectively termed “lender liability”). Generally, lender liability is founded upon the premise that an institutional lender has violated a duty (whether implied or contractual) of good faith and fair dealing owed to the borrower or has assumed a degree of control over the borrower resulting in the creation of a fiduciary duty owed to the borrower or its other creditors. We may be subject to potential allegations of lender liability. In addition, courts have in some cases applied the doctrine of equitable subordination to subordinate the claim of a lending institution against a borrower to claims of other creditors of the borrower when the lending institution is found to have engaged in unfair, inequitable or fraudulent conduct. Such claims may be brought even if we acquired the loan on a secondary basis.
If we make unsecured debt investments, we may lack adequate protection in the event our portfolio companies become distressed or insolvent and will likely experience a lower recovery than more senior debtholders in the event such portfolio companies default on their indebtedness.
In the event of a default by a borrower, we might not receive payments to which we are entitled and thereby could experience a decline in the value of our investments in the borrower. If we invest in debt that is not secured by collateral, in the event of such default, we will have only an unsecured claim against the borrower. In the case of second lien loans that are secured by collateral, while Oaktree generally expects the value of the collateral to be greater than the value of such secured second lien loans, the value of the collateral may actually be equal to or less than the value of such second lien loans or may decline below the outstanding amount of such second lien loans subsequent to our investment. Our ability to have access to the collateral may be limited by bankruptcy and other insolvency laws. Under certain circumstances, the collateral may be released with the consent of the lenders or pursuant to the terms of the underlying loan agreement with the borrower. There is no assurance that the liquidation of the collateral securing a loan would occur in a timely fashion or would satisfy the borrower’s obligation in the event of nonpayment of scheduled interest or principal, or that the collateral could be readily liquidated. As a result, we might not receive full payment on a secured loan investment to which we are entitled and thereby may experience a decline in the value of, or a loss on, the investment.
If we acquire the securities and obligations of distressed or bankrupt companies, such investments may be subject to significant risks, including lack of income, extraordinary expenses, uncertainty with respect to satisfaction of debt, lower-than-expected investment values or income potentials and resale restrictions.
We may acquire the securities and other obligations of distressed or bankrupt companies. At times, distressed debt obligations may not produce income and may require us to bear certain extraordinary expenses (including legal, accounting, valuation and transaction expenses) in order to protect and recover our investment. Therefore, to the extent we invest in distressed debt, our ability to achieve current income for our stockholders may be diminished, particularly where the portfolio company has negative EBITDA.
We also will be subject to significant uncertainty as to when and in what manner and for what value the distressed debt we invest in will eventually be satisfied whether through a liquidation, an exchange offer or plan of reorganization involving the distressed debt securities or a payment of some amount in satisfaction of the obligation. In addition, even if an exchange offer is made or plan of reorganization is adopted with respect to distressed debt held by us, there can be no assurance that the securities or other assets received by us in connection with such exchange offer or plan of reorganization will not have a lower value or income potential than may have been anticipated when the investment was made.
Moreover, any securities received by us upon completion of an exchange offer or plan of reorganization may be restricted as to resale. As a result of our participation in negotiations with respect to any exchange offer or plan of reorganization with respect to an issuer of distressed debt, we may be restricted from disposing of such securities.
Leveraged companies may enter into bankruptcy proceedings at higher rates than companies that are not leveraged and we may invest in debt securities of these companies.
Leveraged companies, such as those in which we invest or plan to invest, may be more prone to bankruptcy or similar financial distress. As a result, we may need to modify the payment terms of our investments, including changes in PIK interest provisions and/or cash interest rates. The performances of such companies have been, and may continue to be, negatively impacted by these economic or other conditions, which may result in our receipt of a reduced level of interest income from such portfolio companies and/or losses or charge offs related to such investments, and, in turn, may adversely affect distributable income and have a material adverse effect on our results of operations.
Our success may depend, in part, on the ability of the Adviser to effectuate loan modifications or restructure and improve the operations of portfolio companies. The activity of identifying and implementing any such restructuring programs and operating improvements entails a high degree of uncertainty. There can be no assurance that the Adviser will be able to successfully identify and implement such restructuring programs and improvements.
A portfolio company’s failure to satisfy financial or operating covenants imposed by us or other lenders could lead to defaults and, potentially, termination of its loans and foreclosure on its secured assets, which could trigger cross-defaults under other agreements and jeopardize a portfolio company’s ability to meet its obligations under the securities that we will hold. We may incur expenses to the extent necessary to seek recovery upon default or to negotiate new terms, which may include the waiver of certain financial covenants, with a defaulting portfolio company. In addition, we may write down the value of a
portfolio company investment upon the worsening of the financial condition of the portfolio company or in anticipation of a default, which could also have a material adverse effect on our business, financial condition and results of operations.
We are subject to certain risks associated with foreign investments.
Certain non-U.S. investments involve risks and special considerations not typically associated with U.S. investments. Such risks include (a) the risk of nationalization or expropriation of assets or confiscatory taxation, (b) social, economic and political uncertainty, including crime, corruption, war, terrorism and revolution, (c) dependence on exports and the corresponding importance of international trade, (d) differences between U.S. and non-U.S. markets, including price fluctuations, market volatility, less liquidity and smaller capitalization of securities markets, (e) currency exchange rate fluctuations, (f) rates of inflation, (g) controls on, and changes in controls on, foreign investment and limitations on repatriation of invested capital and on our ability to exchange local currencies for U.S. dollars, (h) governmental involvement in and control over the economies, (i) governmental decisions to discontinue support of economic reform programs generally and impose centrally planned economies, (j) differences in auditing and financial reporting standards that may result in the unavailability of material information about issuers, (k) less extensive regulation and less government supervision of the securities markets, exchanges, brokers and issuers, (l) longer settlement periods for securities transactions, (m) less developed bankruptcy laws and corporate laws regarding fiduciary duties and the protection of investors, (n) less reliable judicial systems to enforce contracts and applicable law, (o) certain considerations regarding the maintenance of our portfolio securities and cash with non-U.S. sub-custodians and securities depositories, (p) the possible imposition of non-U.S. taxes on income and gains recognized with respect to such non-U.S. investments, (q) restrictions and prohibitions on ownership of property by non-U.S. entities and changes in laws relating thereto and (r) additional transactional costs and administrative burdens as a result of local legal requirements. We may be adversely affected by the foregoing events, or by future adverse developments in global or regional economic conditions or in the financial or credit markets.
In addition, foreign investment in the securities of issuers in certain nations is restricted or controlled to varying degrees. These restrictions or controls may at times limit or preclude non-U.S. investment in issuers in such nations and increase our costs and expenses. Certain countries may restrict investment opportunities in issuers or industries deemed important to national interests. Some countries require governmental approval for the repatriation of investment income, capital or the proceeds of sales of securities by non-U.S. investors. In addition, if there is a deterioration in a country’s balance of payments or for other reasons, a country may impose temporary restrictions on, or altogether change its restrictions on, non-U.S. capital remittances abroad. In response to sovereign debt or currency crises, for example, certain governments have enacted legislation that imposes restrictions on the inflow and outflow of foreign currency into and from such country. These restrictions may adversely affect our ability to source investments or repatriate investment proceeds. Repatriation of capital was particularly a problem during the sovereign debt and currency crises of the 1990s and continues to be a problem today in certain countries. Even where capital controls do not prohibit remittances abroad, the repatriation of proceeds from investment dispositions may require the procurement of a substantial number of regulatory consents, certificates and approvals, including licenses for us and clearance certificates from tax or monetary authorities. Obtaining such approvals or licenses may be difficult, expensive and time consuming and may depend on political or other factors outside our control. Finally, repatriation of income from and investments in entities that are organized or domiciled in non-U.S. countries may be affected adversely by local withholding and other non-U.S. tax requirements. The foregoing requirements and restrictions may adversely affect our ability to source investments or repatriate investment proceeds, and there can be no assurance that we will be permitted to repatriate capital or profits, if any, from the non U.S. jurisdictions in which we invest.
Our obligations in connection with investments in bank loans and participations are subject to unique risks.
Our investment program may include investments in significant amounts of bank loans and participations, as well as other direct lending transactions. These obligations are subject to unique risks, including (a) the possible invalidation of an investment transaction as a fraudulent conveyance under relevant creditors’ rights laws, (b) so-called lender-liability claims by the issuer of the obligations, (c) environmental liabilities that may arise with respect to collateral securing the obligations and (d) limitations on our ability to enforce directly our rights with respect to participations. In addition, bank loans may not be deemed to be “securities” for purposes of the federal securities laws and therefore may not have the protections afforded by the federal securities laws, including anti-fraud protections. In analyzing each bank loan or participation, we compare the relative significance of the risks against the expected benefits of the investment. Successful claims by third parties arising from these and other risks, absent certain conduct by the Adviser, its affiliates and certain other individuals, will be borne by us. In addition, the settlement process for the purchase of bank loans can take significantly longer than the timeframes established by the Loan Syndications & Trading Association and comparable non-U.S. bodies. The longer a trade is outstanding between the counterparties, the greater the risk of additional operational and settlement issues and the potential for our counterparty to fail to perform.
If we purchase a participation, we will not have established any direct contractual relationship with the borrower. We will be required to rely on the lender or the participant that sold the participation, not only for the enforcement of our rights against the borrower, but also for the receipt and processing of payments due to us under the participation. We will thus be subject to the credit risk of both the borrower and the selling lender or participant. Because it may be necessary to assert through the selling lender or participant such rights as may exist against the borrower, in the event the borrower fails to pay principal and interest when due, such assertion of rights against the borrower may be subject to delays, expenses and risks that are greater than those that would be involved if we could enforce our rights against the borrower directly.
We will face risks in effective operating improvements.
In some cases, the success of our investment strategy will depend, in part, on our ability to restructure and effect improvements in the operations of a portfolio company. The activity of identifying and implementing restructuring programs and operating improvements at portfolio companies entails a high degree of uncertainty. There can be no assurance that we will be able to successfully identify and implement such restructuring programs and improvements.
Our portfolio companies may incur debt or issue equity securities that rank equally with, or senior to, our investments in such companies.
Our portfolio companies may have, or may be permitted to incur, other debt that ranks equally with, or senior to, the debt in which we invest. By their terms, such debt instruments may entitle the holders to receive payments of interest or principal on or before the dates on which we are entitled to receive payments with respect to the debt instruments in which we invest. Also, in the event of insolvency, liquidation, dissolution, reorganization or bankruptcy of a portfolio company, holders of debt instruments ranking senior to our investment in that portfolio company would typically be entitled to receive payment in full before we receive any distribution. After repaying such senior creditors, such portfolio company may not have any remaining assets to use for repaying its obligation to us. In the case of debt ranking equally with debt instruments in which we invest, we would have to share on an equal basis any distributions with other creditors holding such debt in the event of an insolvency, liquidation, dissolution, reorganization or bankruptcy of the relevant portfolio company.
We may be exposed to higher risks with respect to our investments that include OID or PIK interest.
Our investments include OID and contractual PIK interest, which typically represents contractual interest added to a loan balance and due at the end of such loan’s term. To the extent OID or PIK interest constitute a portion of our income, we are exposed to typical risks associated with such income being required to be included in taxable and accounting income prior to receipt of cash, including the following:
•OID and PIK instruments may have higher yields, which reflect the payment deferral and credit risk associated with these instruments;
•OID and PIK accruals may create uncertainty about the source of our distributions to stockholders;
•OID and PIK instruments may have unreliable valuations because their continuing accruals require continuing judgments about the collectability of the deferred payments and the value of the collateral; and
•OID and PIK instruments may represent a higher credit risk than coupon loans.
We may invest in derivatives, which involve numerous risks.
While not anticipated to be a meaningful aspect of our investment strategy, we have and may in the future enter into certain foreign exchange and possibly certain other types of OTC derivative instruments from time to time. While Oaktree expects us to enter into OTC contracts on a bilateral basis with banks or other dealers, we may enter into certain derivatives that are traded on swap execution facilities (“SEFs”), security-based swap execution facilities or other similar multi-lateral trading platforms. Certain of such derivatives may be cleared through central counterparties (“CCPs”).
Investing in derivative instruments, particularly OTC derivatives, presents various risks, including market, counterparty, operational and liquidity risks. The prices of derivative instruments, including swaps, forwards and options may be highly volatile and such instruments may subject us to significant loses. The value of derivatives also depends upon the price of the underlying security or other asset or index. Typically, investing in a derivative instrument requires the deposit or payment of an initial amount much smaller than the notional or nominal exposure amount from such derivative instrument. Therefore, if the
relevant cash market moves against us, we will suffer a larger loss than we would have by directly investing in the underlying security or other asset or index. OTC derivatives are also subject to the default and credit risk of the counterparty if they are not cleared through CCPs, while centrally cleared derivatives are subject to the credit risk of the CCP and the relevant futures commission merchant (“FCM”) or other clearing broker. In addition, significant disparities may exist between “bid” and “ask” prices for derivative instruments that are traded over-the-counter and not on an exchange. While such OTC derivatives are subject to increased regulation under the Dodd-Frank Act, the investor protections and other regulations applicable to such OTC derivatives differ from those applicable to futures and other exchange-traded instruments. In addition, compared with such exchange-traded instruments, the market for OTC derivatives is less liquid.
We may have foreign currency risks related to our investments denominated in currencies other than the U.S. Dollar.
A portion of our investments are, and may continue to be, located in jurisdictions other than the United States and, consequently, we are expected to make certain investments denominated in currencies other than the U.S. Dollar. Changes in the rates of exchange between the U.S. Dollar and other currencies will have an effect, which could be adverse, on our performance, amounts available for withdrawal and the value of securities distributed by us. Among the factors that may affect currency values are trade balances, the level of short-term interest rates, differences in relative values of similar assets in different currencies, long-term opportunities for investment and capital appreciation and political developments. Additionally, a particular foreign country may impose exchange controls, devalue its currency or take other measures relating to its currency which could adversely affect us. Finally, we could incur costs in connection with conversions between various currencies.
We are not obligated to hedge currency risks. Even if Oaktree does so, Oaktree may not be able to put a hedge in place on commercially reasonable terms given the credit terms offered by our counterparties or the volatility of the currency. There can be no guarantee that instruments suitable for hedging market shifts will be available at the time when we wish to use them or that any hedge would reduce applicable risks. More specifically, if we hedge currency risk, we do not expect that the full risk of currency fluctuations can be eliminated due to the complexity of the investment characteristics of the portfolio and limitations in the foreign currency market. We will conduct our foreign currency exchange transactions in anticipation of funding investment commitments or receiving proceeds upon dispositions.
We may expose ourselves to risks if we engage in hedging transactions.
In addition to currency hedging, the Adviser may also use other financial instruments for hedging and risk management purposes, including short sales, in order to (a) protect against possible changes in the market value of our investment portfolio resulting from fluctuations in the securities markets and changes in interest rates, (b) protect our unrealized gains in the value of our investment portfolio, (c) facilitate the sale of any such investments, (d) preserve returns, spreads or gains on any investment, (e) hedge the interest rate on any liabilities or assets, (f) protect against any increase in the price of any investments we anticipate purchasing at a later date or (g) for any other similar reason that the Adviser deems appropriate. Hedging against a decline in the values of our portfolio positions does not eliminate the possibility of fluctuations in the values of such positions and amounts due under our credit facilities or prevent losses if the values of such positions decline. However, such hedging can establish other positions designed to gain from those same developments, thereby offsetting the decline in the value of such portfolio positions. Such hedging transactions may also limit the opportunity for gain if the values of the underlying portfolio positions should increase.
The success of our hedging strategy will be subject to the Adviser’s ability to correctly assess the degree of correlation between the performance of the instruments used in the hedging strategy and the performance of the investments in the portfolio being hedged along with the Adviser’s ability to continually recalculate, readjust and execute hedges in an efficient and timely manner. Therefore, though we may enter into transactions to seek to reduce risks, unanticipated changes may result in poorer overall investment performance than if we had not engaged in any such hedging transactions. In addition, the degree of correlation between price movements of the instruments used in a hedging strategy and price movements in the portfolio positions being hedged may vary. Moreover, for a variety of reasons, we may not seek to establish a perfect correlation between such hedging instruments and the portfolio holdings or credit facilities being hedged. Any such imperfect correlation may prevent us from achieving the effect of the intended hedge and expose us to risk of loss. The successful utilization of hedging and risk management transactions requires skills complementary to those needed in the selection of portfolio holdings. It may not be possible to hedge at an acceptable price that is generally anticipated. In addition, we may determine not to hedge against particular risks, including if we determine that available hedging transactions are not available at an acceptable price.
We may be exposed to credit risk on parties with whom we trade and will also bear the risk of settlement default.
From time to time, certain securities markets have experienced operational clearance and settlement problems that have resulted in failed trades. These problems could cause us to miss attractive investment opportunities or result in our liability to
third parties by virtue of an inability to perform our contractual obligation to deliver securities, or we could be unable to achieve the market position selected by Oaktree or might incur a loss in liquidating our positions. In addition, delays and inefficiencies of the local postal, transport and banking systems could result in the loss of investment opportunities, the loss of funds (including dividends) and exposure to currency fluctuations.
Because certain purchases, sales, securities lending, derivatives and other transactions in which we engage involve instruments that are not traded on an exchange, but are instead traded between counterparties based on contractual relationships, we are subject to the risk that a counterparty will not perform its obligations under the related contracts, as well as risks of transfer, clearance or settlement default. Such risks may be exacerbated with respect to non-U.S. securities or transactions with non-U.S. counterparties. There can be no assurance that a counterparty will not default and that we will not sustain a loss on a transaction as a result. Such risks may differ materially from those entailed in exchange-traded transactions that generally are backed by clearing organization guarantees, daily marking-to-market and settlement of positions and segregation and minimum capital requirements applicable to intermediaries. There can be no assurance that Oaktree’s monitoring activities will be sufficient to adequately control counterparty risk.
In situations where we are required to post margin or other collateral with a counterparty, the counterparty may fail to segregate such assets or collateral, as applicable, or may commingle the assets or collateral with the relevant counterparty’s own assets or collateral, as applicable. As a result, in the event of the bankruptcy or insolvency of any counterparty, our excess assets and collateral may be subject to the conflicting claims of the creditors of the relevant counterparty, and we may be exposed to the risk of a court treating us as a general unsecured creditor of such counterparty, rather than as the owner of such assets or collateral, as the case may be.
Transactions entered into by us may be executed on various U.S. and non-U.S. exchanges, and may be cleared and settled through various clearing houses, custodians, depositories and prime brokers throughout the world. Although we will attempt to execute, clear and settle the transactions through entities Oaktree believes to be sound, there can be no assurance that a failure by any such entity will not lead to a loss to us.
Certain of our transactions may be undertaken through local brokers, banks or other organizations in the countries in which we make investments, and we will be subject to the risk of default, insolvency or fraud of such organizations. The collection, transfer and deposit of bearer securities and cash expose us to a variety of risks, including theft, loss and destruction. Finally, we will be dependent upon the general soundness of the banking systems of countries in which investments will be made.
We may enter into reverse repurchase agreements, which are another form of leverage.
We may enter into reverse repurchase agreements as part of our management of our temporary investment portfolio. Under a reverse repurchase agreement, we will effectively pledge our assets as collateral to secure a short-term loan. Generally, the other party to the agreement makes the loan in an amount equal to a percentage of the fair value of the pledged collateral. At the maturity of the reverse repurchase agreement, we will be required to repay the loan and correspondingly receive back our collateral. While used as collateral, the assets continue to pay principal and interest which are for our benefit.
Our use of reverse repurchase agreements, if any, involves many of the same risks involved in our use of leverage, as the proceeds from reverse repurchase agreements generally will be invested in additional securities. There is a risk that the market value of the securities acquired in the reverse repurchase agreement may decline below the price of the securities that we have sold but remain obligated to purchase. In addition, there is a risk that the market value of the securities retained by us may decline. If a buyer of securities under a reverse repurchase agreement were to file for bankruptcy or experience insolvency, we may be adversely affected. Also, in entering into reverse repurchase agreements, we would bear the risk of loss to the extent that the proceeds of such agreements at settlement are less than the fair value of the underlying securities being pledged. In addition, due to the interest costs associated with reverse repurchase agreements, our Net Asset Value would decline, and, in some cases, we may be worse off than if we had not used such agreements.
The disposition of our investments may result in contingent liabilities.
In connection with the disposition of an investment in a portfolio company, we may be required to make representations about the business and financial affairs of such company typical of those made in connection with the sale of any business. We also may be required to indemnify the purchasers of such investment with respect to certain matters, including the accuracy of such representations. These arrangements may result in contingent liabilities for which the Adviser may establish reserves or escrows.
We invest directly in senior secured loans, including at initial issuance, which would typically have limited mandatory amortization and interim repayment requirements.
We invest directly in senior secured loans, including at initial issuance, which would typically have limited mandatory amortization and interim repayment requirements. A low level of amortization of any directly originated senior secured loans over the life of such senior secured loans may increase the risk that an issuer will not be able to repay or refinance the senior secured loans held by us when it comes due at its final stated maturity.
Our investments include “covenant-lite” loans, which may give us fewer rights and subject us to greater risk of loss than loans with financial maintenance covenants.
Although the loans in which we expect to invest will generally have financial maintenance covenants, which are used to proactively address materially adverse changes in a portfolio company’s financial performance, we do invest to a lesser extent in “covenant-lite” loans. We use the term “covenant-lite” to refer generally to loans that do not have financial maintenance covenants. Generally, “covenant-lite” loans provide borrower companies more freedom to negatively impact lenders because their covenants are incurrence-based, which means they are only tested and can only be breached following an affirmative action of the borrower, rather than by a deterioration in the borrower’s financial condition or operating results. Accordingly, to the extent we invest in “covenant-lite” loans, we may have fewer rights against a borrower and may have a greater risk of loss on such investments as compared to investments in or exposure to loans with financial maintenance covenants.
Our investment activities subject us to the risks of becoming involved in litigation by third parties.
Our investment activities subject us to the risks of becoming involved in litigation by third parties. This risk is somewhat greater where we exercise control or significant influence over a company’s direction. In addition, in the course of providing managerial assistance to certain portfolio companies, certain of our or the Adviser’s officers and directors may serve as directors on the boards of such companies. In connection therewith, we will be required to indemnify the Adviser and its affiliates, and each of their respective members, officers, directors, employees, shareholders, partners, and certain other persons who serve at the request of the Adviser or its affiliates on our behalf for liabilities incurred in connection with our affairs. Such liabilities may be material and have an adverse effect on the returns to the stockholders. The expense of defending against claims by third parties and paying any amounts pursuant to settlements or judgments would, absent certain conduct by the Adviser, be payable from our assets. It should also be noted that the Adviser may, but shall not be required to, purchase insurance for us, the Adviser and our affiliates, employees, agents and representatives. Additionally, the Governing Documents, to the extent permitted by law, will limit the circumstances under which the Adviser can be held liable to us and the stockholders. As a result, the stockholders may have a more limited right of action in certain cases than they would in the absence of this provision.
We may invest through joint ventures, partnerships or other special purpose vehicles and investments through these vehicles may entail greater risks, or risks that we otherwise would not incur, if we otherwise made such investments directly.
We may co-invest with third parties through funds, joint ventures or other entities. Such investments may involve risks not present in investments where a third party is not involved, including the possibility that our co-venturer or partner may at any time have other business interests and investments other than the joint venture with us, or may have different economic or business goals. In addition, we may be liable for actions of our co-venturers or partners. Our ability to exercise control or significant influence over management in these cooperative efforts will depend upon the nature of the joint venture arrangement. In addition, such arrangements are likely to involve restrictions on the resale of our interest in the company.
Our Adviser has broad discretion in selecting our investments and investment techniques.
We may employ investment techniques and invest in other instruments that the Adviser believes will help achieve our investment objective, whether or not such investment techniques or instruments are specifically described herein. Consistent with our investment objective, we may invest in financial instruments of any and all types, which exist now or are hereafter created. Such investments may entail risks not described herein.
Our portfolio companies may prepay loans, which may have the effect of reducing our investment income if the returned capital cannot be invested in transactions with equal or greater expected yields.
The loans in our investment portfolio may be prepaid at any time, generally with little advance notice. Whether a loan is prepaid will depend both on the continued positive performance of the portfolio company and the existence of favorable
financing market conditions that allow such portfolio company the ability to replace existing financing with less expensive capital. In periods of rising interest rates, the risk of prepayment of floating rate loans may increase if other financing sources are available. As market conditions change frequently, we will often be unable to predict when, and if, prepayment may be possible for each portfolio company. In some cases, the prepayment of a loan may have the effect of reducing our actual investment income below our expected investment income if the capital returned cannot be invested in transactions with equal or greater expected yields.
The lack of liquidity in our investments may adversely affect our business.
We invest, and will continue to invest, in companies whose securities are not publicly traded, and whose securities are subject to legal and other restrictions on resale or are otherwise less liquid than publicly traded securities. In fact, all of our assets may be invested in illiquid securities. The illiquidity of these investments may make it difficult for us to sell these investments when desired. In addition, if we are required to liquidate all or a portion of our portfolio quickly, we may realize significantly less than the value at which we had previously recorded these investments and suffer losses. Our investments may be subject to contractual or legal restrictions on resale or are otherwise illiquid because there is usually no established trading market for such investments. In addition, we may also face restrictions on our ability to liquidate our investments if our Adviser or any of its affiliates have material nonpublic information regarding the portfolio company.
We may be subject to risks in connection with our origination activities.
The market for originating debt and equity financing is highly competitive, and we may be unable to compete effectively with other market participants for origination opportunities. We may compete for opportunities with public and private investment funds, commercial and investment banks and commercial finance companies. In general, the corporate, non-mortgage debt and equity origination markets present relatively low barriers to entry, and significant competition is likely.
Many current and potential competitors in the debt and equity origination business are much larger than we are and, accordingly, have far greater financial, technical, marketing and other resources. We are subject to various elements of competition, including interest rates and financing costs; origination standards; convenience; customer service; the size, term and seniority of financing arrangements; and marketing and distribution channels. Price pressure from competitors (including market participants that are not directly originating loans) may cause us to lower the interest rates that we charge borrowers, which consequently may lower the value of our loans. Further, if competitors adopt less stringent loan origination standards in order to maintain their loan origination volume, we may elect to do so as well. If we adopt less stringent loan origination standards, we will bear increased risk for each loan originated under such less stringent standards, which may not be compensated by an increase in price. Alternatively, we may determine not to adopt less stringent origination standards in this competitive environment, which decision may result in a loss of market share. Increased pressure on pricing and origination opportunities likely would reduce the volume and quality of our origination activity and materially adversely affect us. In particular, from time to time there may be influxes of capital directed at lending to smaller borrowers, which may result in a tendency by the highest quality borrowers to borrow from sources other than us such that our origination opportunities and our eventual portfolio include a disproportionate number of lower quality borrowers or issuers, exacerbating some of the risks outlined here.
Some competitors may have higher risk tolerances or different risk assessments than we do, thereby allowing such competitors to achieve a broad diversification of investments and to establish more relationships than we are able to establish. Some competitors may have a lower cost of funds and access to more stable funding sources that are not available to us. These competitive pressures could have a material adverse effect on us.
When we originate a loan, we expect to rely significantly upon representations made by the borrower. There can be no assurance that such representations are accurate or complete, or that any due diligence by the Investment Professionals would identify any misrepresentation or omission. Any misrepresentation or omission by a borrower to which we originate a loan may adversely affect the valuation of the collateral underlying the loan, or may adversely affect our ability to perfect or foreclose on a lien on the collateral securing the loan, or may result in our liability to a subsequent purchaser of the loan.
Finally, under certain circumstances, payments to us may be reclaimed if any such payment or distribution is later determined to have been a fraudulent conveyance or a preferential payment.
Risks Relating to Our Business and Structure
We face risks associated with the deployment of our capital.
In light of our need to be able to deploy capital quickly to capitalize on potential investment opportunities or to establish reserves for anticipated debts, liabilities or obligations, including liquidity needs, we may hold cash in money market investments pending deployment into other investments, the amount of which may at times be significant. While the duration of any such holding period is expected to be relatively short, in the event we are unable to find suitable investments, such money market investments may be held for longer periods, which would be dilutive to overall investment returns. It is not anticipated that the temporary investment of such cash into money market investments will generate significant interest, and stockholders should understand that such low interest payments on the temporarily invested cash may adversely affect our overall returns.
We are exposed to risks associated with changes in interest rates, including the current rising interest rate environment.
Debt investments that we make may be based on floating rates, such as SOFR (as defined below), SONIA (as defined below) LIBOR, the Euro Interbank Offered Rate, or alternate base rates such as the prime rate. General interest rate fluctuations may have a substantial negative impact on our investments, the value of our securities and our rate of return on invested capital. It is unclear how increased regulatory oversight and the future of LIBOR may affect market liquidity and the value of the financial obligations to be held by or issued to us that are linked to LIBOR, or how such changes could affect our investments and transactions and financial condition or results of operations. Central banks and regulators in a number of major jurisdictions (for example, the United States, United Kingdom, European Union, Switzerland and Japan) have convened working groups to find, and implement the transition to, suitable replacements for interbank offered rates. On March 5, 2021, the Financial Conduct Authority and ICE Benchmark Authority announced that the publication of all EUR and CHF LIBOR settings, the Spot Next/Overnight, 1 week, 2 month and 12 month JPY and GBP LIBOR settings, and the 1 week and 2 months US dollar LIBOR settings ceased to be published as of December 31, 2021, while the publication of the overnight, 1 month, 3 month, 6 month, and 12 months U.S. dollar (“USD”) LIBOR settings will cease after June 30, 2023. To identify a successor rate for USD LIBOR, the Alternative Reference Rates Committee (“ARRC”), a U.S.-based group convened by the Federal Reserve and the Federal Reserve Bank of New York, was formed. The ARRC has identified the Secured Overnight Financing Rate (“SOFR”) as its preferred alternative rate for LIBOR. SOFR is a measure of the cost of borrowing cash overnight, collateralized by the U.S. Treasury securities, and is based on directly observable U.S. Treasury-backed repurchase transactions. On December 6, 2021, the ARRC released a statement selecting and recommending forms of SOFR, along with associated spread adjustments and conforming changes, to replace references to 1-week and 2-month USD LIBOR. We expect that a substantial portion of our future floating rate investments will be linked to SOFR. At this time, it is not possible to predict the effect of the transition to SOFR.
Because we have borrowed money, our net investment income depends, in part, upon the difference between the rate at which we borrow funds or pay distributions on preferred stock and the rate that our investments yield. As a result, we can offer no assurance that a significant change in market interest rates will not have a material adverse effect on our net investment income.
A reduction in the interest rates on new investments relative to interest rates on current investments could also have an adverse impact on our net interest income. However, an increase in interest rates could decrease the value of any investments we hold which earn fixed interest rates, including subordinated loans, senior and junior secured and unsecured debt securities and loans and high yield bonds, and also could increase our interest expense, thereby decreasing our net income. Also, an increase in interest rates available to investors could make an investment in our common stock less attractive if we are not able to increase our dividend rate, which could reduce the value of our common stock. Further, rising interest rates could also adversely affect our performance if such increases cause our borrowing costs to rise at a rate in excess of the rate that our investments yield.
In 2022, the U.S. Federal Reserve raised short term interest rates and has suggested additional interest rate increases may come. Changing interest rates may have unpredictable effects on markets, may result in heightened market volatility and may detract from our performance to the extent we are exposed to such interest rates and/or volatility. In periods of rising interest rates, such as the current interest rate environment, to the extent we borrow money subject to a floating interest rate, our cost of funds would increase, which could reduce our net investment income. Further, rising interest rates could also adversely affect our performance if such increases cause our borrowing costs to rise at a rate in excess of the rate that our investments yield. Further, rising interest rates could also adversely affect our performance if we hold investments with floating interest rates, subject to specified minimum interest rates (such as a LIBOR or SOFR floor, as applicable), while at the same time engaging in borrowings subject to floating interest rates not subject to such minimums. In such a scenario, rising interest rates may increase our interest expense, even though our interest income from investments is not increasing in a corresponding manner as a result of such minimum interest rates.
If general interest rates rise, there is a risk that the portfolio companies in which we hold floating rate securities will be unable to pay escalating interest amounts, which could result in a default under their loan documents with us. Rising interest rates could also cause portfolio companies to shift cash from other productive uses to the payment of interest, which may have a material adverse effect on their business and operations and could, over time, lead to increased defaults. In addition, rising interest rates may increase pressure on us to provide fixed rate loans to our portfolio companies, which could adversely affect our net investment income, as increases in our cost of borrowed funds would not be accompanied by increased interest income from such fixed-rate investments.
A change in the general level of interest rates can be expected to lead to a change in the interest rates we receive on many of our debt investments. Accordingly, a change in the interest rate could make it easier for us to meet or exceed the performance threshold in the Investment Advisory Agreement and may result in a substantial increase in the amount of incentive fees payable to our Adviser with respect to the portion of the incentive fee based on income.
The general increase in interest rates has had the effect of increasing our net investment income, which makes it easier for our Adviser to receive incentive fees.
The general increase in interest rates has had the effect of increasing the interest rate that we receive on many of our debt investments. Accordingly, it has become easier for our Adviser to meet the quarterly hurdle rate for payment of income incentive fees under the Investment Advisory Agreement and has resulted in an increase in the amount of the income-based incentive fee payable to our Adviser.
Changes in laws or regulations governing our operations may adversely affect our business or cause us to alter our business strategy.
We and our portfolio companies are subject to regulation at the local, state and federal level. New legislation may be enacted or new interpretations, rulings or regulations could be adopted, including those governing the types of investments we are permitted to make or that impose limits on our ability to pledge a significant amount of our assets to secure loans or that restrict the operations of a portfolio company, any of which could harm us and our stockholders and the value of our investments, potentially with retroactive effect. For example, certain provisions of the Dodd-Frank Wall Street Reform and Consumer Protection Act, which influences many aspects of the financial services industry, have been amended or repealed and the Code has been substantially amended and reformed. Any amendment or repeal of legislation, or changes in regulations or regulatory interpretations thereof, could create uncertainty in the near term, which could have a material adverse impact on our business, financial condition and results of operations.
Additionally, any changes to the laws and regulations governing our operations relating to permitted investments may cause us to alter our investment strategy in order to avail ourselves of new or different opportunities. Such changes could result in material differences to the strategies and plans set forth herein and may result in our investment focus shifting from the areas of expertise of our Adviser to other types of investments in which our Adviser may have less expertise or little or no experience. Thus, any such changes, if they occur, could have a material adverse effect on our results of operations and the value of your investment.
We operate in a highly competitive market for investment opportunities.
We operate in a highly competitive market for investment opportunities. We compete for investments with various other investors, such as other public and private funds, commercial and investment banks, commercial finance companies and, to the extent they provide an alternative form of financing, private equity funds, some of which may be our affiliates. Other Oaktree funds have investment objectives that overlap with ours, which may create competition for investment opportunities. Many competitors are substantially larger and have considerably greater financial, technical and marketing resources than we do. Some competitors may have a lower cost of funds and access to funding sources that are not available to us, and may have higher risk tolerances or different risk assessments, which could allow them to consider a wider variety of investments and establish more relationships. Furthermore, many competitors are not subject to the regulatory restrictions that the Investment Company Act and the Code impose on us. The competitive pressures could impair our business, financial condition and results of operations. As a result of this competition, we may not be able to take advantage of attractive investment opportunities.
Regulations governing our operation as a BDC and RIC affect our ability to raise, and the way in which we raise, additional capital or borrow for investment purposes, which may have a negative effect on our growth.
In order to qualify for the tax benefits available to RICs and to minimize corporate-level U.S. federal income taxes, we intend to distribute to our stockholders at least 90% of our taxable income each tax year, except that we may retain certain net
capital gains for investment, and treat such amounts as deemed distributions to our stockholders. If we elect to treat any amounts as deemed distributions, we would be subject to U.S. federal income taxes at the corporate rate on such deemed distributions on behalf of our stockholders.
As a BDC, we have issued and may continue to issue “senior securities,” including borrowing money from banks or other financial institutions only in amounts such that our asset coverage, as defined in the Investment Company Act, equals at least 150% after such incurrence or issuance. These requirements limit the amount that we may borrow, may unfavorably limit our investment opportunities and may reduce our ability in comparison to other companies to profit from favorable spreads between the rates at which we can borrow and the rates at which we can lend. If the value of our assets declines, we may be unable to satisfy the asset coverage test, which could prohibit us from paying distributions and could prevent us from being subject to tax as a RIC. If we cannot satisfy the asset coverage test, we may be required to sell a portion of our investments and, depending on the nature of our debt financing, repay a portion of our indebtedness at a time when such sales may be disadvantageous. Accordingly, any failure to satisfy this test could have a material adverse effect on our business, financial condition or results of operations.
Because we will continue to need capital to grow our investment portfolio, these limitations may prevent us from incurring debt and require us to raise additional equity at a time when it may be disadvantageous to do so. We generally are not able to issue or sell Common Stock at a price below the then-current Net Asset Value per share of Common Stock, which may be a disadvantage as compared with other public companies or private investment funds. We may, however, sell Common Stock, or warrants, options or rights to acquire Common Stock, at a price below the then-current Net Asset Value per share of Common Stock if the following conditions, among others, are satisfied: (i) a majority of our stockholders and a majority of our stockholders that are not our affiliates approve such sales within one year immediately prior to such sales and (ii) a majority of our independent directors and a majority of our directors who have no financial interest in the transaction determine that such sales are in the best interests of the Company and its stockholders.
Also, any amounts that we use to service our indebtedness or senior securities would not be available for distributions to stockholders. Furthermore, as a result of issuing indebtedness or senior securities, stockholders would also be exposed to typical risks associated with increased leverage, including an increased risk of loss resulting from increased indebtedness.
If we issue preferred stock, the preferred stock would rank “senior” to the Common Stock, preferred stockholders would have separate voting rights on certain matters and might have other rights, preferences or privileges more favorable than those of stockholders, and the issuance of preferred stock could have the effect of delaying, deferring or preventing a transaction or a change of control that might involve a premium price for stockholders or otherwise be in their best interest.
If we raise additional funds by issuing more Common Stock or issuing senior securities convertible into, or exchangeable for, Common Stock, the percentage ownership of then-existing stockholders may decline at that time and such stockholders may experience dilution. Moreover, we can offer no assurance that we will be able to issue and sell additional equity securities in the future, on terms favorable to us or at all.
In addition, we securitize and may in the future seek to securitize our portfolio securities to generate cash for funding new investments. To securitize loans, we typically create a wholly-owned subsidiary and contribute a pool of loans to the subsidiary. We then typically sell interests in the subsidiary on a non-recourse basis to purchasers and would retain all or a portion of the equity in the subsidiary. An inability to successfully securitize our loan portfolio could limit our ability to grow our business or fully execute our business strategy and may decrease our earnings, if any. The securitization market is subject to changing market conditions and we may not be able to access this market when we would otherwise deem appropriate. Moreover, the successful securitization of our portfolio might subject us to losses as the residual investments in which we do not sell interests will tend to be those that are riskier and more apt to generate losses. The Investment Company Act also may impose restrictions on the structure of any securitization.
Our board of directors may change our investment objective, operating policies and strategies without prior notice and without stockholder approval.
Our board of directors has the authority to modify or waive our current investment objective, operating policies and strategies without prior notice and without stockholder approval. We cannot predict the effect any changes to our current investment objective, operating policies and strategies would have on our business, Net Asset Value and operating results. However, the effects might be adverse, which could negatively impact our ability to pay distributions and cause stockholders to lose part or all of their investment.
We are an “emerging growth company,” and we do not know if such status will make our shares less attractive to investors.
We are an “emerging growth company” as defined in the JOBS Act, which means that we are eligible to take advantage of certain exemptions from various reporting and disclosure requirements that are applicable to public companies that are not emerging growth companies. As a result, we have taken advantage of the exemption for emerging growth companies allowing us to temporarily forgo the auditor attestation requirements of Section 404(b) of the Sarbanes-Oxley Act. We cannot predict if investors will find the Common Stock less attractive because we rely on this exemption. If some investors find the Common Stock less attractive as a result, there may be less of an interest in investing. We did not take advantage of other disclosure or reporting exemptions for emerging growth companies under the JOBS Act. We will remain an emerging growth company until the earlier of (a) the last day of the fiscal year (i) following the fifth anniversary of the completion of an initial public offering, (ii) in which we have total annual gross revenue of at least $1.235 billion, or (iii) in which we are deemed to be a large accelerated filer, which means the market value of the Common Stock that is held by non-affiliates exceeds $700 million as of the end of the prior second fiscal quarter, and (b) the date on which we have issued more than $1 billion in non-convertible debt during the prior three-year period.
Future control deficiencies could prevent us from accurately and timely reporting our financial results.
We may identify deficiencies in our internal control over financial reporting in the future, including significant deficiencies and material weaknesses. A “significant deficiency” is a deficiency, or a combination of deficiencies, in internal control over financial reporting that is less severe than a material weakness, yet important enough to merit attention by those responsible for oversight of a company’s financial reporting. A material weakness is a deficiency, or a combination of deficiencies, in internal control over financial reporting such that there is a reasonable possibility that a material misstatement of a company’s annual or interim financial statements will not be prevented or detected on a timely basis. A deficiency in internal control exists when the design or operation of a control does not allow management or employees, in the normal course of performing their assigned functions, to prevent or detect misstatements on a timely basis.
Failure to identify deficiencies in our internal control over financial reporting in a timely manner or remediate any deficiencies, or the identification of material weaknesses or significant deficiencies in the future could prevent us from accurately and timely reporting our financial results.
Certain provisions of our amended and restated certificate of incorporation (the "Certificate of Incorporation") and our amended and restated bylaws (the "Bylaws", and together with the Certificate of Incorporation, the "Governing Documents") and the Delaware General Corporation Law (“DGCL”), as well as other aspects of our structure, could deter takeover attempts and have an adverse impact on the price of the Common Stock following a Qualified Listing, if any.
Our Governing Documents, as well as the DGCL, contain provisions that may have the effect of discouraging a third party from making an acquisition proposal for us. Among other things, the Governing Documents:
•provide that our board of directors is classified, which may delay the ability of holders of Common Stock to change the membership of a majority of our board of directors;
•do not provide for cumulative voting;
•provide that vacancies on our board of directors, including newly created directorships, may be filled only by a majority vote of remaining directors then in office (even if they constitute less than a quorum), or by a sole remaining director, subject to any applicable requirements of the Investment Company Act and the rights of any holders of preferred stock;
•provide that our board of directors may be removed only for cause, and only by a supermajority vote of the stockholders entitled to elect such directors;
•provide that, following a Qualified Listing, stockholders may only take action at an annual or special meeting, and may not act by written consent;
•restrict stockholders’ ability to call special meetings; and
•require a vote of 75% of stockholders to effect certain amendments to our Governing Documents.
We have provisions comparable to those of Section 203 of the DGCL. These provisions generally prohibit us from engaging in mergers, business combinations and certain other types of transactions with “interested stockholders” (generally defined as persons or entities that beneficially own 15% or more of our voting stock), other than certain exempt parties, for a period of three years following the date the person became an interested stockholder unless, (a) prior to such stockholder becoming an interested stockholder, our board of directors has approved the “business combination” that would otherwise be restricted or the transaction that resulted in the interested stockholder becoming an interested stockholder, (b) upon consummation of the transaction that resulted in the stockholder becoming an interested stockholder, the interested stockholder owned at least 85% of our voting securities outstanding at the time the transaction commenced, excluding for purposes of determining the voting securities outstanding (but not the outstanding voting securities owned by the interested stockholder) those shares owned by persons who are our directors and also officers or (c) the business combination has been approved by our board of directors and 66 2/3% of its outstanding shares of Common Stock (other than Common Stock owned by the interested stockholder). Such provisions may discourage third parties from trying to acquire control of us and increase the difficulty of consummating such an offer.
These anti-takeover provisions may inhibit a change of control in circumstances that could give the holders of Common Stock the opportunity to realize a premium over the market price for the Common Stock following an initial public offering of the Common Stock, if any. In addition, certain aspects of our structure may have the effect of discouraging a third party from making an acquisition proposal for us.
Cybersecurity risks and cyber incidents may adversely affect our business by causing a disruption to the Adviser’s or our operations, a compromise or corruption of the Adviser’s or our confidential information or damage to our business relationships, all of which could negatively impact our business, financial condition and operating results.
Cybersecurity incidents and cyber-attacks have been occurring globally at a more frequent and severe level and are expected to continue to increase in frequency and severity in the future. The information and technology systems of Oaktree, its affiliates, portfolio companies, issuers and service providers may be vulnerable to damage or interruption from cybersecurity breaches, computer viruses or other malicious code, network failures, computer and telecommunication failures, infiltration by unauthorized persons and other security breaches, usage errors or malfeasance by their respective professionals or service providers, power, communications or other service outages, and catastrophic events such as fires, tornadoes, floods, hurricanes, earthquakes or terrorist incidents. If unauthorized parties gain access to such information and technology systems, or if personnel abuse or misuse their access privileges, they may be able to steal, publish, delete or modify private and sensitive information, including non-public personal information related to stockholders (and their beneficial owners) and material non-public information. Although Oaktree has implemented, and portfolio companies, issuers and service providers may implement, various measures to manage risks relating to these types of events, such systems could prove to be inadequate and, if compromised, could become inoperable for extended periods of time, cease to function properly or fail to adequately secure private information. Oaktree does not control the cybersecurity plans and systems put in place by third party service providers, and such third party service providers may have limited indemnification obligations to Oaktree, its affiliates, us, the stockholders and/or a portfolio company, each of whom could be negatively impacted as a result. Breaches such as those involving covertly introduced malware, impersonation of authorized users and industrial or other espionage may not be identified in a timely manner or at all, even with sophisticated prevention and detection systems. This could potentially result in further harm and prevent such breaches from being addressed appropriately. The failure of these systems and/or of disaster recovery plans for any reason could cause significant interruptions in Oaktree’s, its affiliates’, our and/or a portfolio company’s operations and result in a failure to maintain the security, confidentiality or privacy of sensitive data, including personal information relating to stockholders (and their beneficial owners), material non-public information and the intellectual property and trade secrets and other sensitive information of Oaktree and/or portfolio companies or issuers. Oaktree, we and/or a portfolio company could be required to make a significant investment to remedy the effects of any such failures, harm to their reputations, legal claims that they and their respective affiliates may be subjected to, regulatory action or enforcement arising out of applicable privacy and other laws, adverse publicity, and other events that may affect their business and financial performance.
Certain investors are limited in their ability to make significant investments in us.
As long as the Common Stock is not treated as a “publicly-offered security” for purposes of the Employment Retirement Income Security Act of 1974, as amended ("ERISA"), our Adviser intends that our assets should not be deemed to constitute “plan assets” subject to ERISA or Section 1975 of the Code by limiting investments in us by “benefit plan investors” (as defined in section 3(42) of ERISA and the regulations that may be promulgated thereunder) to less than 25% of the total value of any outstanding class of our capital stock. Were our assets to be treated as “plan assets,” we could, among other things, be subject to certain restrictions on our ability to carry out our activities as described herein.
We cannot guarantee that we will be able to obtain various required licenses in U.S. states or in any other jurisdiction where it may be required in the future.
Certain federal and local banking and other regulatory bodies or agencies inside or outside the United States may require us and/or our Adviser to obtain licenses or similar authorizations to engage in various types of lending activities, including investment in senior loans. Such licenses or authorizations may take a significant amount of time to obtain, and may require the disclosure of confidential information regarding us, a stockholder in us or our respective affiliates, including financial information and/or information regarding officers and directors of such investor, and we may or may not be willing or able to comply with these requirements. In addition, there can be no assurance that any such licenses or authorizations would be granted or, if so, would not impose restrictions on us. Alternatively, the Adviser may be able to structure our potential investments in a manner which would not require such licenses and authorizations, but which would be inefficient or otherwise disadvantageous for us and/or the borrower. The inability of us or the Adviser to obtain such licenses or authorizations, or the structuring of an investment in an inefficient or otherwise disadvantageous manner, could adversely affect the Adviser’s ability to implement the strategy for us and our results.
We may not replicate the historical success of Oaktree.
The past performance of other funds, accounts or investment vehicles managed by our Adviser or its affiliates is not necessarily indicative of our future performance and provides no assurance of future results. As a BDC, we are subject to certain investment limitations that do not apply to other funds, accounts or investment vehicles managed by Oaktree and its affiliates and, accordingly, we may have a materially different portfolio than does such other funds, accounts or investment vehicles. In addition, the fees and expenses we will pay may be different from, and may be higher than, those applicable to such other funds, accounts or investment vehicles. Furthermore, our Adviser does not have significant experience operating under the constraints imposed on us as a BDC, which may hinder our ability to take advantage of attractive investment opportunities and to achieve our investment objective. There can be no assurance that we will be able to (a) successfully identify, make and realize upon any particular investment or (b) achieve desired spreads and yields to maturity (or that such performance will be commensurate with the risks associated with an investment in us). Actual realized returns will depend on, among other factors, future operating results, pace of deployment, refinancings, whether such interests are held to maturity, value of the underlying assets, foreclosures, market conditions, legal and contractual restrictions, any related transaction costs, and the timing and manner of sale. Therefore, the actual realized returns may differ materially from those obtained by other funds, accounts or investment vehicles managed by Oaktree and its affiliates and there can be no assurance that any such performance will be achieved or that losses will be avoided.
Changes in tax laws or tax treaties could adversely affect our results of operations and financial condition.
The jurisdictions in which we may invest impose taxes on the types of income such as dividends, interest and in some instances, capital gains. In addition, changes in the tax laws or tax treaties (or their interpretation) of the countries in which we invest may severely and adversely affect our ability to efficiently realize income or capital gains and may subject us or the stockholders to tax and return filing obligations in such countries. The tax consequences applicable to a stockholder will depend upon the particular situation of such stockholder.
We will be subject to corporate-level U.S. federal income tax on all of our income if we are unable to qualify as a RIC under Subchapter M of the Code, which would have a material adverse effect on our financial performance.
Although we have elected to be treated, and intend to qualify annually, as a RIC under Subchapter M of the Code, there can be no assurances that we will be able to qualify for and maintain RIC status. To obtain and maintain RIC status and be relieved of U.S. federal income taxes on income and gains distributed to stockholders, we must, among other things, meet the Annual Distribution Requirement, the 90% Gross Income Test and the Diversification Tests (each as defined and explained more fully in Part I, Item 1 of this Form 10-K "Business – Election to be Taxed as a Regulated Investment Company.").
If we fail to qualify for or maintain our RIC status for any reason, and we do not qualify for certain relief provisions under the Code, we would be subject to corporate-level U.S. federal income tax (and any applicable U.S. state and local taxes). In this event, the resulting taxes and any resulting penalties could substantially reduce our net assets, the amount of our income available for distribution and the amount of our distributions to stockholders, which could have a material adverse effect on our financial performance. For additional discussion regarding the tax implications of a RIC, see Part I, Item 1 of this Form 10-K "Business – Election to be Taxed as a Regulated Investment Company."
Risks Relating to our Use of Leverage and our Credit Facilities
We borrow money, which magnifies the potential for gain or loss on amounts invested and may increase the risk of investing in us.
Borrowings, also known as leverage, magnify the potential for loss on invested equity capital. We expect to continue to use leverage to partially finance our investments, through borrowings from banks and other lenders, which will increase the risks of investing in our Common Stock, including the likelihood of default. We borrow under our credit facilities, and may issue other debt securities or enter into other types of borrowing arrangements in the future. If the value of our assets decreases, leveraging would cause Net Asset Value to decline more sharply than it otherwise would have had we not leveraged. Similarly, any decrease in our income would cause net income to decline more sharply than it would have had we not borrowed. To the extent we incur additional leverage, these effects would be further magnified, increasing the risk of investing in us. Such a decline could negatively affect our ability to make Common Stock distributions or scheduled debt payments. Leverage is generally considered a speculative investment technique and we only intend to use leverage if expected returns will exceed the cost of borrowing.
As of September 30, 2022, we had $37.0 million of outstanding indebtedness under our CNB-2 Facility and $220.0 million of outstanding indebtedness under our Citibank Facility. These debt instruments require periodic payments of interest. The weighted average interest rate charged on our borrowings as of September 30, 2022 was 5.3% (exclusive of deferred financing costs). We will need to generate sufficient cash flow to make these required interest payments. In order for us to cover our annual interest payments on indebtedness, we must achieve annual returns on our September 30, 2022 total assets of at least 2.3%. If we are unable to meet the financial obligations under our credit facilities, the lenders under the credit facilities will have a superior claim to our assets over our stockholders.
Illustration. The following table illustrates the effect of leverage on returns from an investment in our common stock assuming various annual returns, net of expenses. The calculations in the table below are hypothetical and actual returns may be higher or lower than those appearing below.
| | | | | | | | | | | | | | | | | | | | | | | | | | | | | | | | | | | | | | | | | | | | | | | |
| Assumed Return on Portfolio (Net of Expenses) | - 10% | - 5% | 0% | 5% | 10% |
| Corresponding net return to common stockholder | -22.18 | -13.19 | -4.20 | 4.79 | 13.79 |
For purposes of this table, we have assumed $578.9 million in total assets (less all liabilities and indebtedness not represented by senior securities), $257.0 million in debt outstanding, $321.9 million in net assets as of September 30, 2022, and a weighted average interest rate of 5.3% as of September 30, 2022 (exclusive of deferred financing costs). Actual interest payments may be different.
We are subject to certain risks associated with our credit facilities.
As of September 30, 2022, substantially all of our assets were pledged as collateral under our credit facilities and may be pledged as collateral under future credit facilities. If we default on our obligations under these facilities, the lenders may have the right to foreclose upon and sell, or otherwise transfer, the collateral subject to their security interests or their superior claim. In such event, we may be forced to sell our investments to raise funds to repay our outstanding borrowings in order to avoid foreclosure and these forced sales may be at times and at prices we would not consider advantageous. Moreover, such deleveraging of our company could significantly impair our ability to effectively operate our business in the manner in which we have historically operated. As a result, we could be forced to curtail or cease new investment activities and lower or eliminate the distributions that we have historically paid to our stockholders.
We own 100% of the equity interests in OSI 2 SPV, the borrower under the Citibank Facility. We consolidate the financial statements of OSI 2 SPV in our consolidated financial statements and treat the indebtedness of this entity as our leverage. Our interest in OSI 2 SPV is subordinated in priority of payment to every other obligation of OSI 2 SPV and is subject to certain payment restrictions set forth in the Citibank Facility. We receive cash distributions on our equity interest in this entity only if it has made all required cash interest payments to the lenders and no default exists. We cannot assure you that distributions on the assets held by OSI 2 SPV will be sufficient to make any distributions to us or that such distributions will meet our expectations.
We receive cash from OSI 2 SPV only to the extent that we receive distributions on our equity interest in such entity. OSI 2 SPV may make distributions on its equity interests only to the extent permitted by the payment priority provisions of the
Citibank Facility, which generally provides that payments on such interests may not be made on any payment date unless all amounts owing to the lenders and other secured parties are paid in full.
In addition, if the lenders exercise their right to sell the assets pledged under the Citibank Facility, such sales may be completed at distressed sale prices, thereby diminishing or potentially eliminating the amount of cash available to us after repayment of the amounts outstanding under the Citibank Facility.
Our indebtedness could adversely affect our business, financial conditions or results of operations.
We cannot assure you that our business will generate sufficient cash flow from operations or that future borrowings will be available to us under our credit facilities or otherwise in an amount sufficient to enable us to repay our indebtedness or to fund our other liquidity needs. We may need to refinance all or a portion of our indebtedness on or before it matures. We cannot assure you that we will be able to refinance any of our indebtedness on commercially reasonable terms or at all. If we cannot service our indebtedness, we may have to take actions such as selling assets or seeking additional equity. We cannot assure you that any such actions, if necessary, could be effected on commercially reasonable terms or at all, or on terms that would not be disadvantageous to our stockholders or on terms that would not require us to breach the terms and conditions of our existing or future debt agreements.
Risks Relating to our External Management
We are dependent upon our Adviser for future success.
Our success depends in substantial part on the management, skill and acumen of the Adviser and the Investment Professionals. Investment in the Common Stock is a passive investment, and stockholders have no opportunity to control our day-to-day operations, including investment and disposition decisions. The Adviser and the Investment Professionals evaluate, negotiate, structure, execute, monitor and service our investments. Subjective decisions made by Oaktree may cause us to incur losses or to miss profit opportunities on which we would otherwise have capitalized. In order to safeguard their limited liability for our liabilities and obligations, stockholders must rely entirely on the Adviser to conduct and manage our affairs. stockholders have no direct rights against third parties engaged by Oaktree in respect of us.
The Adviser’s capabilities in structuring the investment process, providing competent, attentive and efficient services to us, and facilitating access to financing on acceptable terms depend on the employment of the Investment Professionals in adequate number and of adequate sophistication to match the corresponding flow of transactions. There can be no assurance that the Investment Professionals (including the Key Executives) and such other professionals will continue to be employed by Oaktree. The loss of any of the Investment Professionals and other professionals could have a material adverse effect on us. Moreover, certain of the Investment Professionals are also responsible for investing and managing the capital of certain Other Oaktree Funds, which require that such Investment Professionals devote considerable time to such Other Oaktree Funds instead of us. The Adviser may need to hire, train, supervise and manage new investment professionals to participate in the investment selection and monitoring process and may not be able to find investment professionals in a timely manner or at all.
In addition, our Adviser may resign on 60 days’ notice. If we are unable to quickly find a new investment adviser or hire internal management with similar expertise and ability to provide the same or equivalent services on acceptable terms, our operations are likely to experience a disruption and our ability to achieve our investment objective and pay distributions would likely be materially and adversely affected.
Conflicts of interest may exist from time to time between our Adviser and certain of its affiliates involved with us, which could impact our investment returns.
Our executive officers and directors, and certain members of our Adviser, serve or may serve as officers, directors or principals of entities that operate in the same or a related line of business as we do, or of investment funds managed by Oaktree’s affiliates. For example, Oaktree presently serves as the investment adviser to OCSL. OCSL has historically invested in debt and debt-like instruments similar to those we target for investment. Therefore, there may be certain investment opportunities that satisfy the investment criteria for OCSL and us. OCSL operates as distinct and separate entity, and any investment in Common Stock will not be an investment in OCSL. In addition, all of our executive officers serve in substantially similar capacities for OCSL. Accordingly, they may have obligations to investors in those entities, the fulfillment of which might not be in our best interests or the best interests of the stockholders. For example, the personnel of the Adviser may face conflicts of interest in the allocation of investment opportunities to us and such other funds and accounts.
Oaktree has investment allocation guidelines that govern the allocation of investment opportunities among the investment funds and accounts managed or sub-advised by Oaktree and its affiliates. To the extent an investment opportunity is appropriate for us, OCSL or any of the Other Oaktree Funds, Oaktree will adhere to its investment allocation guidelines in order to determine a fair and equitable allocation.
We invest alongside funds and accounts managed or sub-advised by our Adviser and its affiliates in certain circumstances where doing so is consistent with applicable law and SEC staff interpretations. For example, we may invest alongside such accounts consistent with guidance promulgated by the staff of the SEC permitting us and such other accounts to purchase interests in a single class of privately placed securities so long as certain conditions are met, including that our Adviser, acting on our behalf and on behalf of other clients, negotiates no term other than price or terms related to price.
In addition, on October 18, 2017, our former adviser received exemptive relief from the SEC to allow certain managed funds and accounts, each of whose investment adviser is OCM or an investment adviser controlling, controlled by or under common control with OCM, to participate in negotiated co-investment transactions where doing so is consistent with the applicable registered fund’s or BDC’s investment objective and strategies as well as regulatory requirements and other pertinent factors, and pursuant to the conditions of the Exemptive Relief. Each potential co-investment opportunity that falls under the terms of the Exemptive Relief and is appropriate for us and any affiliated fund or account, and satisfies the then-current board-established criteria, will be offered to us and such other eligible funds and accounts. If there is a sufficient amount of securities to satisfy all participants, the securities will be allocated among the participants in accordance with their proposed order size and if there is an insufficient amount of securities to satisfy all participants, the securities will be allocated pro rata based on the investment proposed by the applicable investment adviser to such participant, up to the amount proposed to be invested by each, which is reviewed and approved by an independent committee of legal, compliance and accounting professionals at the Adviser. Although Oaktree will endeavor to allocate investment opportunities in a fair and equitable manner, we and the stockholders could be adversely affected to the extent investment opportunities are allocated to other investment vehicles managed or sponsored by, or affiliated with, our executive officers, directors and members of the Adviser. We might not participate in each individual opportunity, but will, on an overall basis, be entitled to participate equitably with other entities managed by Oaktree and its affiliates. Oaktree seeks to treat all clients fairly and equitably such that none receive preferential treatment vis-à-vis the others over time, in a manner consistent with its fiduciary duty to each of them; however, in some instances, especially in instances of limited liquidity, the factors may not result in pro rata allocations or may result in situations where certain funds or accounts receive allocations where others do not.
Pursuant to the Investment Advisory Agreement, our Adviser’s liability is limited and we are required to indemnify our Adviser against certain liabilities. This may lead our Adviser to act in a riskier manner in performing its duties and obligations under the Investment Advisory Agreement than it would if it were acting for its own account, and creates a potential conflict of interest.
Pursuant to the Administration Agreement, our Administrator furnishes us with the facilities, including our principal executive office, and administrative services necessary to conduct our day-to-day operations. We pay our Administrator our allocable portion of overhead and other expenses incurred by our Administrator or such affiliate in performing its obligations and services under the Administration Agreement, such as rent and our allocable portion of the cost of personnel attributable to performing such obligations and services, including, but not limited to, marketing, legal and other services performed by our Administrator or such affiliate for us. This arrangement creates conflicts of interest that our board of directors must monitor.
Our Adviser may face conflicts of interest in choosing our service providers and financing sources, and certain service providers may provide services to our Adviser or Other Oaktree Funds on more favorable terms than those payable by us.
Conflicts of interest may exist with respect to the Adviser’s selection of brokers, dealers and transaction agents and counterparties (collectively, “Broker-Dealers”) and financing sources for the execution of our transactions. When engaging the services of Broker-Dealers and financing sources, the Adviser may, subject to best execution, take into consideration a variety of factors, including, to the extent applicable, the ability to achieve prompt and reliable execution, competitive pricing, transaction costs, operational efficiency with which transactions are effected, access to deal flow and precedent transactions, and the financial stability and reputation of the particular Broker-Dealer, as well as other factors that the Adviser deems appropriate to consider under the circumstances. Broker-Dealers and financing sources may provide other services that are beneficial to Oaktree and their affiliates, but that are not necessarily beneficial to us, including capital introductions, other marketing assistance, client and personnel referrals, consulting services, and research-related services. These other services and items may influence the Adviser’s selection of Broker-Dealers and financing sources.
Our Incentive Fee may induce our Adviser to pursue speculative investments.
The fact that the Incentive Fee is based on our performance may create an incentive for Oaktree to make investments on our behalf that are riskier or more speculative than would be the case in the absence of the Incentive Fee. The way in which the Incentive Fee is determined may encourage Oaktree to use leverage to increase the return on our investments. Under certain circumstances, the use of leverage may increase our likelihood of default, which would disfavor stockholders, and could result in higher investment losses, particularly during economic downturns.
In addition, the Investment Income Incentive Fee payable to Oaktree is computed and paid on income that may include interest income that has been accrued but not yet received in cash, such as OID interest, debt instruments with PIK interest and zero coupon securities and obligations. As a result, for any calendar quarter, the Investment Income Incentive Fee that is paid to Oaktree may be calculated on the basis of an amount that is greater than the amount of net investment income actually received by us for such calendar quarter. This fee structure may be considered to involve a conflict of interest for Oaktree to the extent that it may encourage Oaktree to favor debt financings that provide for deferred interest, rather than current cash payments of interest. Oaktree may have an incentive for us to invest in deferred interest securities or obligations in circumstances where it would not have done so but for the opportunity to continue to earn the Investment Income Incentive Fee even when the issuers of the deferred interest securities or obligations would not be able to make actual cash payments on such securities and obligations. Moreover, certain of the types of investments within our investment objective, such as PIK “toggle” debt, may result in a PIK election, which may have the simultaneous effect of increasing the assets under management, thereby increasing the Management Fee, and increasing investment income, thus increasing the Incentive Fee.
This risk could be increased because Oaktree is not obligated to reimburse us for any distributions of Incentive Fees previously received even if we subsequently incur losses or never receive in cash the deferred income that was previously accrued. Thus, while the stockholders will share in both the risks and rewards of investing in such instruments, Oaktree will not share in such risks.
In the event that losses are allocated to us for a given annual period, Oaktree is not required to reduce the Incentive Fee credited for prior annual periods. Stockholders should also be aware that a rise in the general level of interest rates can generally be expected to lead to higher interest rates applicable to our debt investments. Accordingly, an increase in interest rates would make it easier for the Hurdle Rate to be met or exceeded and may result in a substantial increase of the amount of Incentive Fee payable to Oaktree with respect to the Investment Income Incentive Fee without a corresponding increase in performance relative to the market as a whole.
No index will be used as a comparative measure of investment performance as a basis for calculating the Incentive Fee.
In addition, Oaktree will be entitled to the portion of the Incentive Fee for each fiscal quarter in an amount equal to a percentage of the excess of Pre-Incentive Fee Net Investment Income for that quarter above a threshold return for that quarter. For these purposes, Oaktree’s Pre-Incentive Fee Net Investment Income excludes realized capital gains, realized capital losses, unrealized capital appreciation and unrealized capital depreciation that we may incur in the fiscal quarter, even if such capital losses result in a net loss for us for that quarter. Thus, we may be required to pay Oaktree the Incentive Fee for a fiscal quarter even if there is a decline in the value of our portfolio or we incur a net loss for that quarter. If we pay an Incentive Fee of 20% of realized capital gains (net of all realized capital losses on a cumulative basis and unrealized capital depreciation) and thereafter experience additional realized capital losses or unrealized capital depreciation, we will not be able to recover any portion of the Incentive Fee previously paid.
Our Management Fee may induce our Adviser to incur leverage.
Oaktree’s Management Fee is based on our Gross Asset Value, including assets purchased with borrowed amounts. The Adviser may, therefore, be incentivized to increase such borrowing to increase the Management Fee. Under certain circumstances, the use of increased leverage may increase the likelihood of default, which would disfavor stockholders.
Our ability to enter into transactions with Oaktree and our other affiliates is restricted.
We and certain of our controlled affiliates are prohibited under the Investment Company Act from knowingly participating in certain transactions with our upstream affiliates, or our Adviser and its affiliates, without the prior approval of our independent directors and, in some cases, the SEC. Any person that owns, directly or indirectly, 5% or more of our outstanding voting securities is our upstream affiliate for purposes of the Investment Company Act and we are generally prohibited from buying or selling any security (other than our securities) from or to such affiliate, absent the prior approval of our independent directors. The Investment Company Act also prohibits “joint” transactions with an upstream affiliate, or our
Adviser or its affiliates, which could include investments in the same portfolio company (whether at the same or different times), without prior approval of our independent directors. In addition, we and certain of our controlled affiliates are prohibited from buying or selling any security from or to, or entering into joint transactions with, our Adviser and its affiliates, or any person who owns more than 25% of our voting securities or is otherwise deemed to control, be controlled by, or be under common control with us, absent the prior approval of the SEC through an exemptive order (other than in certain limited situations pursuant to current regulatory guidance as described below). The analysis of whether a particular transaction constitutes a joint transaction requires a review of the relevant facts and circumstances then existing.
As a BDC, we are required to comply with certain regulatory requirements. For example, we are not generally permitted to invest in any portfolio company in which a fund managed by Oaktree or any of its downstream affiliates (other than us and our downstream affiliates) currently has an investment, or make any co-investments with our Adviser or its affiliates, including any fund managed by Oaktree or any of its downstream affiliates (other than us and our downstream affiliates), without exemptive relief from the SEC, subject to certain exceptions. The SEC has granted our former adviser and certain of its affiliates Exemptive Relief that permits certain present and future funds advised by OCM (or a future investment adviser controlling, controlled by or under common control with OCM), including us, to co‑invest in suitable negotiated investments. Co‑investments made under the Exemptive Relief are subject to compliance with the conditions and other requirements contained in the Exemptive Relief, which could limit our ability to participate in a co-investment transaction. On December 15, 2020, we, with the Adviser and certain other affiliates, received a modified exemptive order that allows Oaktree proprietary accounts to participate in co-investment transactions subject to certain conditions. We may also co-invest with funds managed by Oaktree or any of its downstream affiliates, subject to compliance with applicable law and regulations, existing regulatory guidance, and our Adviser’s allocation policies and procedures.
In addition to co-investing pursuant to the Exemptive Relief, we may invest alongside affiliates or their affiliates in certain circumstances where doing so is consistent with applicable law and current regulatory guidance. For example, we may invest alongside such investors consistent with guidance promulgated by the SEC staff permitting us and an affiliated person to purchase interests in a single class of privately placed securities so long as certain conditions are met, including that we negotiate no term other than price. We may, in certain cases, also make investments in securities owned by affiliates that we acquire from non-affiliates. In such circumstances, our ability to participate in any restructuring of such investment or other transaction involving the issuer of such investment may be limited, and as a result, we may realize a loss on such investments that might have been prevented or reduced had we not been restricted in participating in such restructuring or other transaction.
Our Adviser or its affiliates may, from time to time, possess material non-public information, limiting our investment discretion.
By reason of their responsibilities in connection with us and the Other Oaktree Funds, personnel of our Adviser or its affiliates may acquire confidential or material non-public information or be restricted from initiating transactions in certain securities. Our Adviser or its affiliate, as applicable, will not be free to act upon any such information. Due to these restrictions, we may not be able to initiate a transaction that we otherwise might have initiated and may not be able to sell an investment that we otherwise might have sold. Notwithstanding the foregoing, our Adviser may determine, in its sole discretion at any time, that such information could impair its ability to effect certain transactions on our behalf, whether for legal, contractual, or other reasons. Accordingly, our Adviser may elect not to receive such information. Lack of access to any such information may adversely affect our investments that in some cases may have been avoided had we or our Adviser had such information.
Risks Relating to Our Common Stock
The shares of Common Stock are generally an illiquid investment.
Stockholders generally are not permitted to sell their shares of Common Stock prior to a Liquidity Event, if any, and Common Stock may only be Transferred with our permission. In some circumstances, stockholders are not permitted to Transfer their Common Stock without our permission for a period of time following a Qualified Listing as set forth in the Subscription Agreement. In addition, stockholders have no right to cause us to repurchase their shares of Common Stock.
There is a risk that our stockholders may not receive distributions or that our distributions may not grow over time.
We intend to pay distributions to stockholders out of assets legally available for distribution. We cannot assure stockholders that we will achieve investment results that will allow us to sustain a specified level of cash distributions or periodic increases in cash distributions. In addition, the inability to satisfy the asset coverage test applicable to us as a BDC can limit our ability to pay distributions. All distributions will be paid at the discretion of the board of directors and will depend on our earnings, financial condition, maintenance of ability to be subject to tax as a RIC, compliance with applicable BDC
regulations and such other factors as the board of directors may deem relevant from time to time. We cannot assure stockholders that we will pay distributions to them.
In addition, although under normal circumstances, we intend to make distributions in cash, it is possible that under certain circumstances (including our liquidation), distributions may be made in kind and could consist of securities or other investments for which there is no readily available public market.
A stockholder’s interest in us will be diluted if we issue additional shares of Common Stock, which could reduce the overall value of an investment in us.
If we raise additional funds by issuing more Common Stock or by issuing senior securities convertible into, or exchangeable for, Common Stock, the percentage ownership of then-existing stockholders that do not participate in those transactions will decline at that time and such stockholders will experience dilution in their ownership percentage of us.
Risks Relating to the Mergers
Because the market price of OCSL Common Stock will fluctuate, our stockholders cannot be sure of the market value of the consideration they will receive in connection with the Mergers until the closing date of the Mergers.
At the Effective Time, each share of our common stock issued and outstanding immediately prior to the Effective Time (other than shares owned by OCSL or any of its consolidated subsidiaries, the “Cancelled Shares”) will be converted into the right to receive a number of shares of common stock, par value $0.01 per share, of OCSL (“OCSL Common Stock”) equal to the Exchange Ratio (as defined below), plus any cash (without interest) in lieu of fractional shares. The market value of such consideration to be received by our stockholders upon completion of the Mergers (the “Merger Consideration”) may vary from the closing price OCSL Common Stock, respectively, on the date the Mergers were announced, on the date of the special meeting of our stockholders to consider the adoption of the Merger Agreement and approval of the Mergers (the “Special Meeting”), and on the date the Mergers are completed. Any change in the market price of OCSL Common Stock prior to completion of the Mergers will affect the market value of the Merger Consideration that our stockholders will receive upon completion of the Mergers. Additionally, the Exchange Ratio will fluctuate as our and OCSL’s respective net asset values change prior to the closing date of the Mergers.
Accordingly, at the time of the Special Meeting, our stockholders will not know or be able to calculate the market value of the Merger Consideration they would receive upon completion of the Mergers. Neither we nor OCSL is permitted to terminate the Merger Agreement or resolicit the vote of our respective stockholders solely because of changes in the market price of shares of OCSL Common Stock. There will be no adjustment to the Merger Consideration for changes in the market price of shares of OCSL Common Stock.
Changes in the market price of OCSL Common Stock may result from a variety of factors, including, among other things:
•significant volatility in the market price and trading volume of securities of BDCs or other companies in OCSL’s sector, which are not necessarily related to the operating performance of these companies;
•inability to obtain any exemptive relief that may be required by OCSL from the SEC;
•changes in regulatory policies, accounting pronouncements or tax guidelines, particularly with respect to RICs and BDCs;
•loss of OCSL’s BDC or RIC status;
•changes in earnings or variations in operating results or distributions that exceed OCSL’s net investment income;
•increases in expenses associated with defense of litigation and responding to SEC inquiries;
•changes in accounting guidelines governing valuation of OCSL’s investments;
•changes in the value of OCSL’s portfolio of investments and any derivative instruments, including as a result of general economic conditions, interest rate shifts and changes in the performance of OCSL’s portfolio companies;
•any shortfall in investment income or net investment income or any increase in losses from levels expected by investors or securities analysts;
•departure of Oaktree’s key personnel; and
•general economic trends and other external factors.
These factors are generally beyond the control of OCSL and may not relate to OCSL’s operating performance. The range of high and low closing sales prices per share of OCSL Common Stock as reported on Nasdaq for the three months ended September 30, 2022 was a low of $5.87 and a high of $7.25. However, historical trading prices are not necessarily indicative of
future performance. You should obtain current market quotations for shares of OCSL Common Stock prior to the Special Meeting.
Sales of shares of OCSL Common Stock after the completion of the Mergers may cause the trading price of OCSL Common Stock to decline.
For illustrative purposes, based on September 30, 2022 net asset values and excluding transaction costs and other tax-related distributions, OCSL would issue approximately 2.72 shares of OCSL Common Stock pursuant to the Merger Agreement for each share of our common stock outstanding, resulting in pro forma ownership of 20.5% for our current stockholders and 79.5% for current OCSL stockholders. Following completion of the Mergers, certain of our former stockholders may be required to or decide to sell the shares of OCSL Common Stock that they receive pursuant to the Merger Agreement. In addition, OCSL’s stockholders may decide not to hold their shares of OCSL Common Stock after completion of the Mergers. In each case, such sales of OCSL Common Stock could have the effect of depressing the trading price for OCSL Common Stock and may take place promptly following the completion of the Mergers. If this occurs, it could impair OCSL’s ability to raise additional capital through the sale of equity securities should OCSL desire to do so.
Our stockholders will experience a reduction in percentage ownership and voting power in the combined company as a result of the Mergers.
Our stockholders will experience a substantial reduction in their percentage ownership interests and effective voting power in respect of the combined company relative to their percentage ownership interests in us prior to the Mergers. Consequently, our stockholders should expect to exercise less influence over the management and policies of the combined company following the Mergers than they currently exercise over our management and policies. In addition, prior to completion of the Mergers, subject to certain restrictions in the Merger Agreement, we and OCSL may issue additional shares of our common stock and OCSL Common Stock, respectively, which would further reduce the percentage ownership of the combined company to be held by our current stockholders.
After completion of the Mergers, OCSL may issue additional shares of OCSL Common Stock at prices below OCSL Common Stock’s then-current NAV per share, subject to certain restrictions under the Investment Company Act, including stockholder approval of such issuance. The issuance or sale by OCSL of shares of OCSL Common Stock at a discount to NAV poses a risk of dilution to stockholders.
OCSL may be unable to realize the benefits anticipated by the Mergers, including estimated cost savings, or it may take longer than anticipated to achieve such benefits.
The realization of certain benefits anticipated as a result of the Mergers will depend in part on the integration of our investment portfolio with OCSL’s investment portfolio, the integration of our business with OCSL’s business and the ability to rotate certain of our current investments into higher yielding assets. There can be no assurance that our investment portfolio or business can be operated profitably or integrated successfully into OCSL’s operations in a timely fashion or at all. The dedication of management resources to such integration may detract attention from the day-to-day business of the combined company and there can be no assurance that there will not be substantial costs associated with the transition process or there will not be other material adverse effects as a result of these integration efforts. Such effects, including incurring unexpected costs or delays in connection with such integration and failure of our investment portfolio to perform as expected, could have a material adverse effect on the financial results of the combined company.
OCSL also expects to achieve certain synergies and cost savings from the Mergers when the two companies have fully integrated their portfolios. It is possible that the estimates of these potential synergies and cost savings could ultimately be incorrect. The cost savings estimates also assume OCSL will be able to combine our operations and OCSL’s operations in a manner that permits those cost savings to be fully realized. If the estimates turn out to be incorrect or if OCSL is not able to successfully combine our investment portfolio or business with OCSL’s operations, the anticipated synergies and cost savings may not be fully realized or realized at all or may take longer to realize than expected.
The opinion delivered to the Special Committee and our board of directors from the financial advisor to the Special Committee will not reflect changes in circumstances between the signing of the Merger Agreement and completion of the Mergers.
The opinion of the financial advisor to a special committee comprised solely of certain of our independent directors, or the Special Committee, was delivered to the Special Committee and our board of directors on, and was dated, September 14, 2022. Changes in our or OCSL’s operations and prospects, general market and economic conditions and other factors that may be beyond the control of us or OCSL may significantly alter our value or the price of shares of OCSL Common Stock by the time
the Mergers are completed. The opinion does not speak as of the time the Mergers will be completed or as of any date other than the date of such opinion.
If the Mergers do not close, we will not benefit from the expenses incurred in pursuit of the Mergers.
The Mergers may not be completed. If the Mergers are not completed, we will have incurred substantial expenses for which no ultimate benefit will have been received. We have incurred out-of-pocket expenses in connection with the Mergers for investment banking, legal and accounting fees and financial printing and other related charges, much of which will be incurred even if the Mergers are not completed.
The termination of the Merger Agreement could negatively impact us.
If the Merger Agreement is terminated, there may be various consequences, including:
•our business may have been adversely impacted by the failure to pursue other beneficial opportunities due to the focus of management on the Mergers, without realizing any of the anticipated benefits of completing the Mergers; and
•we may not be able to find a party willing to pay an equivalent or more attractive price than the price OCSL agreed to pay in the Mergers.
The Merger Agreement limits our ability to pursue alternatives to the Mergers.
The Merger Agreement contains provisions that limit our ability to discuss, facilitate or commit to competing third party proposals to acquire all or a significant part of us. These provisions, which are typical for transactions of this type, include a termination fee of $9.8 million payable by third parties to OCSL under certain circumstances, might discourage a potential competing acquirer that might have an interest in acquiring all or a significant part of us from considering or proposing that acquisition even if it were prepared to pay consideration with a higher per share market price than that proposed in the Mergers or might result in a potential competing acquirer proposing to pay a lower per share price to acquire us than it might otherwise have proposed to pay.
The Mergers are subject to closing conditions, including stockholder approvals, that, if not satisfied or (to the extent legally allowed) waived, will result in the Mergers not being completed, which may result in material adverse consequences to our business and operations.
The Mergers are subject to closing conditions, including certain approvals of our and OCSL’s respective stockholders that, if not satisfied, will prevent the Mergers from being completed. The closing condition that our stockholders adopt the Merger Agreement and approve the Mergers may not be waived under applicable law and must be satisfied for the Mergers to be completed. If our stockholders do not adopt the Merger Agreement and approve the Mergers and the Mergers are not completed, the resulting failure of the Mergers could have a material adverse impact on our business and operations. In addition, the closing condition that OCSL’s stockholders approve the issuance of shares of OCSL Common Stock pursuant to the Merger Agreement may not be waived and must be satisfied for the Mergers to be completed. If OCSL’s stockholders do not approve the issuance of shares of OCSL Common Stock pursuant to the Merger Agreement and the Mergers are not completed, the resulting failure of the Mergers could have a material adverse impact on our business and operations. In addition to the required approvals of our and OCSL’s stockholders, the Mergers are subject to a number of other conditions beyond our control that may prevent, delay or otherwise materially adversely affect completion of the Mergers. We cannot predict whether and when these other conditions will be satisfied.
We may, to the extent legally allowed, waive one or more conditions to the Mergers without resoliciting stockholder approval.
Certain conditions to our obligations to complete the Mergers may be waived, in whole or in part, to the extent legally allowed, either unilaterally or by agreement of us and OCSL. In the event that any such waiver does not require re-solicitation of stockholders, we will have the discretion to complete the Mergers without seeking further stockholder approval. The conditions requiring the approval of our and OCSL’s stockholders, however, cannot be waived.
We will be subject to operational uncertainties and contractual restrictions while the Mergers are pending.
Uncertainty about the effect of the Mergers may have an adverse effect on us and, consequently, on the combined company following completion of the Mergers. These uncertainties may cause those that deal with us to seek to change their existing business relationships with us. In addition, the Merger Agreement restricts us from taking actions that we might otherwise consider to be in our best interests. These restrictions may prevent us from pursuing certain business opportunities that may arise prior to the completion of the Mergers.
The market price of OCSL Common Stock after the Mergers may be affected by factors different from those affecting OCSL Common Stock currently.
Our business and OCSL’s business differ in some respects and, accordingly, the results of operations of the combined company and the market price of OCSL Common Stock after the Mergers may be affected by factors different from those currently affecting the independent results of operations, such as a larger stockholder base, a different portfolio composition and a different capital structure.
Accordingly, OCSL’s historical trading prices and financial results may not be indicative of such matters for the combined company following the Mergers.
If we have not consummated Liquidity Event, including the Mergers, by the end of the Investment Period, our board of directors (to the extent consistent with its fiduciary duties and subject to any necessary stockholder approvals and applicable requirements of the Investment Company Act) will meet to consider our potential wind down and/or liquidation and dissolution.
If we have not consummated a Liquidity Event, including the Mergers, by the end of the Investment Period, our board of directors (to the extent consistent with its fiduciary duties and subject to any necessary stockholder approvals and applicable requirements of the Investment Company Act) will meet to consider our potential wind down and/or liquidation and dissolution. To the extent our Board determines to pursue a liquidation or dissolution, no assurances can be provided as to what price they will be able to obtain from selling or liquidating our investments and we could end up being liquidated below our then NAV per share or at a price per share below what stockholders paid.
In the event of any liquidation, dissolution or winding up of our affairs, our common stockholders would receive any remaining net assets only after payment or provision or payment of our debts and other liabilities and subject to the prior rights of any outstanding preferred stock. In addition, we expect that we would incur certain costs associated with a liquidation or dissolution. Accordingly, to the extent our board of directors determines to proceed with our liquidation or dissolution, it could result in a loss for our common stockholders.
General Risk Factors
General economic and market conditions, including those caused by inflation and a rising interest rate environment, could materially affect the success of our activities and investments.
Any disruptions in the capital markets, as a result of inflation and a rising interest environment or otherwise, may increase the spread between the yields realized on risk-free and higher risk securities and can result in illiquidity in parts of the capital markets, significant write-offs in the financial sector and re-pricing of credit risk in the broadly syndicated market. These and any other unfavorable economic conditions could increase our funding costs, limit our access to the capital markets or result in a decision by lenders not to extend credit to us. During the spring of 2020, the occurrence of these events during the initial onset of the COVID-19 pandemic negatively impacted the fair value of the investments that we held and, if they were to occur again in the future, could limit our investment originations (including as a result of the investment professionals of our Adviser diverting their time to the restructuring of certain investments), negatively impact our operating results and limit our ability to grow. More recently, the fair value of our investments has been adversely affected by increasing market yields.
In addition, market conditions (including inflation, supply chain issues and decreased consumer demand) have adversely impacted, and could in the future further impact, the operations of certain of our portfolio companies. If the financial results of middle-market companies, like those in which we invest, experience deterioration, it could ultimately lead to difficulty in meeting debt service requirements and an increase in defaults, and further deterioration in market conditions will further depress the outlook for those companies. Further, adverse economic conditions decreased and may in the future decrease the value of collateral securing some of our loans and the value of our equity investments. Such conditions have required and may in the future require us to modify the payment terms of our investments, including changes in PIK interest provisions and/or cash interest rates. The performance of certain of our portfolio companies has been, and in the future may be, negatively impacted by these economic or other conditions, which can result in our receipt of reduced interest income from our portfolio companies and/or realized and unrealized losses related to our investments, and, in turn, may adversely affect distributable income and have a material adverse effect on our results of operations.
Economic recessions or downturns may have a material adverse effect on our business, financial condition and results of operations, and could impair the ability of our portfolio companies to repay debt or pay interest.
Economic recessions or downturns may result in a prolonged period of market illiquidity which could have a material adverse effect on our business, financial condition and results of operations. Unfavorable economic conditions, including
sustained inflation and rising interest rates, also have and could further increase our funding costs, limit our access to the capital markets or result in a decision by lenders not to extend credit to us. These events could limit our investment originations, limit our ability to grow and negatively impact our operating results. In addition, uncertainty with regard to economic recovery from recessions or downturns could also have a negative impact on our business, financial condition and results of operations.
When recessionary conditions exist, the financial results of middle-market companies, like those in which we invest, typically experience deterioration, which could ultimately lead to difficulty in meeting debt service requirements and an increase in defaults. Additionally, there can be reduced demand for certain of our portfolio companies’ products and services and/or other economic consequences, such as decreased margins or extended payment terms. Further, adverse economic conditions may decrease the value of collateral securing some of our loans and the value of our equity investments. Such conditions may require us to modify the payment terms of our investments, including changes in PIK interest provisions and/or cash interest rates. The performance of certain of our portfolio companies has been, and in the future may be, negatively impacted by these economic or other conditions, which may result in our receipt of reduced interest income from our portfolio companies and/or realized and unrealized losses related to our investments, and, in turn, may adversely affect distributable income and have a material adverse effect on our results of operations.
Global economic, political and market conditions, including downgrades of the U.S. credit rating and Russia's invasion of Ukraine, may adversely affect our business, results of operations and financial condition, including our revenue growth and profitability.
The current worldwide financial market situation, as well as various social and political tensions in the United States and around the world, including Russia's invasion of Ukraine, may contribute to increased market volatility, may have long-term effects on the United States and worldwide financial markets and may cause economic uncertainties or deterioration in the U.S. and worldwide. The impact of downgrades by rating agencies to the U.S. government’s sovereign credit rating or its perceived creditworthiness as well as potential government shutdowns and uncertainty surrounding transfers of power could adversely affect the U.S. and global financial markets and economic conditions. U.S. debt ceiling and budget deficit concerns have increased the possibility of additional credit-rating downgrades and economic slowdowns, or a recession in the United States. In addition, disagreement over the federal budget has caused the U.S. federal government to shut down for periods of time. Continued adverse political and economic conditions could have a material adverse effect on our business, financial condition and results of operations.
Deterioration in the economic conditions in the Eurozone and other regions or countries globally and the resulting instability in global financial markets may pose a risk to our business. Financial markets have been affected at times by a number of global macroeconomic events, including the following: large sovereign debts and fiscal deficits of several countries in Europe and in emerging markets jurisdictions, levels of non‑performing loans on the balance sheets of European banks, the effect of the United Kingdom leaving the European Union, instability in the Chinese capital markets and the COVID-19 pandemic.
Various social and political circumstances in the U.S. and around the world (including wars and other forms of conflict, terrorist acts, security operations and catastrophic events such as fires, floods, earthquakes, tornadoes, hurricanes and global health epidemics), may also contribute to increased market volatility and economic uncertainties or deterioration in the U.S. and worldwide. Such events, including rising trade tensions between the United States and China, other uncertainties regarding actual and potential shifts in U.S. and foreign, trade, economic and other policies with other countries, and the COVID-19 pandemic, could adversely affect our business, financial condition or results of operations. These market and economic disruptions could negatively impact the operating results of our portfolio companies.
In addition, Russia’s invasion of Ukraine in February 2022 and corresponding events have had, and could continue to have, severe adverse effects on regional and global economic markets. Following Russia’s actions, various governments, including the United States, have issued broad-ranging economic sanctions against Russia, including, among other actions, a prohibition on doing business with certain Russian companies, large financial institutions, officials and oligarchs; a commitment by certain countries and the European Union to remove selected Russian banks from the Society for Worldwide Interbank Financial Telecommunications, the electronic banking network that connects banks globally; and restrictive measures to prevent the Russian Central Bank from undermining the impact of the sanctions. The duration of hostilities and the vast array of sanctions and related events (including cyberattacks and espionage) cannot be predicted. Those events present material uncertainty and risk with respect to markets globally, which pose potential adverse risks to us and the performance of our investments and operations. Any such market disruptions could affect our portfolio companies’ operations and, as a result, could have a material adverse effect on our business, financial condition and results of operations.
Additionally, the Federal Reserve’s actions with respect to raising short term interest rates and future interest rate increases, along with the United States government’s credit and deficit concerns, global economic uncertainties and market
volatility and the impacts of COVID-19, could cause interest rates to be volatile, which may negatively impact our ability to access the debt markets and capital markets on favorable terms.
Item 1B. Unresolved Staff Comments
None.
Item 2. Properties
We do not own any real estate or other physical properties material to our operations. Our administrative and principal executive offices are located at 333 South Grand Avenue, 28th Floor, Los Angeles, CA 90071. We believe that our office facilities are suitable and adequate for our business as it is presently conducted.
Item 3. Legal Proceedings
From time to time, we may be a party to certain legal proceedings in the ordinary course of business, including proceedings relating to the enforcement of our rights under loans to or other contracts with our portfolio companies. We are not currently subject to any material legal proceedings, and, to our knowledge, no material legal proceeding is threatened against us.
Item 4. Mine Safety Disclosures
Not applicable.
PART II
Item 5. Market for Registrant’s Common Equity, Related Stockholder Matters and Issuer Purchases of Equity Securities
Market Information
There is no public market for our Common Stock currently, nor are there any plans for one to develop.
Holders
As of December 13, 2022, there were 1,752 holders of record of our Common Stock.
Distributions
We anticipate that we will make quarterly distributions of at least 90% of our realized net ordinary income and net short-term capital gains in excess of our net long-term capital losses, if any, then available for distribution, each as determined by our board of directors in accordance with applicable law and the terms of the Governing Documents. Any distributions will be declared out of assets legally available for distribution. We expect quarterly distributions to be paid from income primarily generated by interest and dividends earned on our investments, although distributions to stockholders may also include a return of capital.
We have elected to be treated, and intend to qualify annually, as a RIC under Subchapter M of the Code. To maintain RIC qualification, we must distribute to our stockholders, for each tax year, at least 90% of our “investment company taxable income” for that year. In order to avoid certain excise taxes imposed on RICs, we intend to distribute during each calendar year an amount at least equal to the sum of: (1) 98% of our ordinary income for the calendar year; (2) 98.2% of our capital gain net income (both long-term and short-term) for the one-year period ending on October 31 of the calendar year; and, (3) any undistributed ordinary income and capital gain net income for preceding years on which we paid no U.S. federal income tax less certain over-distributions in prior years. In addition, although we currently intend to distribute realized net capital gains (i.e., net long term capital gains in excess of short term capital losses), if any, at least annually, we may in the future decide to retain such capital gains for investment, pay U.S. federal income tax on such amounts at regular corporate tax rates, and elect to treat such gains as deemed distributions to stockholders. We can offer no assurance that we will achieve results that will permit the payment of any cash distributions and, to the extent that we issue senior securities, we will be prohibited from making distributions if doing so causes us to fail to maintain the asset coverage ratios stipulated by the Investment Company Act or if distributions are limited by the terms of any of our borrowings.
Depending on the level of taxable income and net capital gain earned in a year, we may choose to carry forward taxable income or net capital gain for distribution in the following year and pay the applicable U.S. federal excise tax. Distributions will be appropriately adjusted for any taxes payable by us or any direct or indirect subsidiary through which it invests (including any corporate, state, local, non-U.S. and withholding taxes). Any Incentive Fee to be paid to our Adviser will not be reduced to take into account any such taxes.
Sales of Unregistered Securities and Use of Proceeds
We did not sell any securities during the period covered by this Form 10-K that were not registered under the Securities Act.
Item 6. Selected Financial Data
Not applicable.
Item 7. Management's Discussion and Analysis of Financial Condition and Results of Operations
The following discussion and analysis should be read in conjunction with the Consolidated Financial Statements and the notes thereto included elsewhere in this annual report on Form 10-K. This discussion contains forward-looking statements and involves numerous risks and uncertainties, including, but not limited to, those described in Part I, Item 1A, “Risk Factors” of this Form 10-K.
Some of the statements in this annual report on Form 10-K constitute forward-looking statements because they relate to future events or the future performance or financial condition of Oaktree Strategic Income II, Inc. (together with its subsidiaries, where applicable, the "Company", which may also be referred to as "we," "us" or "our"). The forward-looking statements contained in this annual report on Form 10-K may include statements as to:
•our future operating results and distribution projections;
•the ability of Oaktree Fund Advisors, LLC (our "Adviser" or "Oaktree") to implement its future plans with respect to our business and to achieve our investment objective;
•the ability of Oaktree and its affiliates to attract and retain highly talented professionals;
•our business prospects and the prospects of our portfolio companies;
•the impact of the investments that we expect to make;
•the ability of our portfolio companies to achieve their objectives;
•our expected financings and investments and additional leverage we may seek to incur in the future;
•the adequacy of our cash resources and working capital;
•the timing of cash flows, if any, from the operations of our portfolio companies; and
•the impact of current global economic conditions, including those caused by inflation, a rising interest rate environment, COVID-19 and Russia's invasion of Ukraine on all of the foregoing.
In addition, words such as “anticipate,” “believe,” “expect,” “seek,” “plan,” “should,” “estimate,” “project” and “intend” indicate forward-looking statements, although not all forward-looking statements include these words. The forward-looking statements contained in this annual report on Form 10-K involve risks and uncertainties. Our actual results could differ materially from those implied or expressed in the forward-looking statements for any reason, including the factors set forth in “Item 1A. Risk Factors” and elsewhere in this annual report on Form 10-K.
Other factors that could cause actual results to differ materially include:
•changes or potential disruptions in our operations, the economy, financial markets or political environment, including those caused by inflation and a rising interest rate environment;
•risks associated with possible disruption in our operations, the operations of our portfolio companies or the economy generally due to terrorism, war or other geopolitical conflict (including Russia's invasion of Ukraine), natural disasters or the COVID-19 pandemic;
•future changes in laws or regulations (including the interpretation of these laws and regulations by regulatory authorities) and conditions in our operating areas, particularly with respect to business development companies ("BDCs") or regulated investment companies ("RICs");
•the ability of the parties to consummate the proposed Mergers on the expected timeline, or at all;
•the ability to realize the anticipated benefits of the proposed Mergers;
•the effects of disruption on our business from the proposed Mergers;
•the combined company’s plans, expectations, objectives and intentions, as a result of the proposed Mergers;
•any potential termination of the Merger Agreement;
•the actions of our stockholders or the stockholders of OCSL with respect to the proposals submitted for their approval in connection with the Mergers; and
•other considerations that may be disclosed from time to time in our publicly disseminated documents and filings.
We have based the forward-looking statements included in this annual report on Form 10-K on information available to us on the date of this annual report, and we assume no obligation to update any such forward-looking statements. Although we undertake no obligation to revise or update any forward-looking statements, whether as a result of new information, future events or otherwise, you are advised to consult any additional disclosures that we may make directly to you or through reports that we in the future may file with the Securities and Exchange Commission (the “SEC”), including annual reports on Form 10-K, quarterly reports on Form 10-Q and current reports on Form 8-K.
Business Overview
We are structured as a closed-end investment company focused on lending to small-and medium-sized companies. We have elected to be regulated as a BDC under the Investment Company Act of 1940, as amended (the “Investment Company Act”) and have elected to be treated, and intend to comply with the requirements to qualify annually, as a RIC under Subchapter M of the Internal Revenue Code of 1986, as amended (together with the rules and regulations promulgated thereunder, the “Code”).
We were formed on April 30, 2018 as a Delaware corporation and are externally managed by our Adviser pursuant to an investment advisory agreement (the “Investment Advisory Agreement”) between us and our Adviser, which was approved by our board of directors most recently on August 6, 2021. From July 9, 2018 through May 11, 2020, we were managed by Oaktree Capital Management, L.P., an affiliate of our Adviser. We seek to invest opportunistically across asset classes and geographies, primarily in the form of senior loans, and to a lesser extent, high yield bonds, to borrowers that are in need of direct loans, rescue financings or other capital solutions or that have had challenged or unsuccessful primary offerings. Our investment objective is to generate current income and long-term capital appreciation. We seek to achieve our investment objective without subjecting principal to undue risk of loss by investing primarily in situations where a company or its owners (a) are overleveraged or facing pressures to recapitalize, (b) are unable to access broadly syndicated capital markets, (c) are undervalued after having recently exited bankruptcy or completed a restructuring or (d) are otherwise affected by mispricings or inefficiencies in the capital markets or at different points throughout the credit cycle. We seek to generate revenues primarily in the form of interest income from the investments we hold.
In the current market environment, Oaktree intends to focus primarily on the following areas, in which Oaktree believes there is less competition and thus potential for greater returns, for new investment opportunities: (1) situational lending, which we define to include directly originated loans to non-sponsor companies that are hard to understand and value using traditional underwriting techniques, (2) select sponsor lending, which we define to include financing to support leveraged buyouts of companies with specialized sponsors that have expertise in certain industries, and (3) stressed sector and rescue lending, which we define to include opportunistic private loans in industries experiencing stress or limited access to capital.
We conducted private offerings (each, a “Private Offering”) of shares of our common stock ("Common Stock") to investors in reliance on exemptions from the registration requirements of the Securities Act of 1933, as amended (the “Securities Act”). At each Closing of a Private Offering, each investor participating in that closing made a capital commitment (each, a “Capital Commitment") to purchase our Common Stock pursuant to a subscription agreement entered into with us in connection with its Capital Commitment (“Subscription Agreement”). Investors were required to fund drawdowns to purchase our Common Stock up to the amount of their respective Capital Commitments on an as-needed basis with a minimum of ten calendar days' prior notice (excluding the initial drawdown for each investor). The initial closing of a Private Offering occurred on August 6, 2018 (the “Initial Closing”). We commenced our loan origination and investment activities shortly after our initial capital drawdown from our non-affiliated investors (the "Initial Drawdown"). The proceeds from the Initial Drawdown provided us with the necessary seed capital to commence operations. As of September 30, 2022, we completed drawdowns of $337,558,996, or 100%, of Capital Commitments from investors in connection with Private Offerings, of which $3,854,346 in Capital Commitments were made by one or more affiliates of the Adviser.
Business Environment and Developments
Global financial markets have experienced an increase in volatility as concerns about the impact of higher inflation, rising interest rates, a potential recession, the current conflict in Ukraine and the ongoing uncertainty related to the COVID-19 pandemic have weighed on market participants. These factors have created disruptions in supply chains and economic activity and have had a particularly adverse impact on certain companies in the energy, raw materials and transportation sectors, among others. These uncertainties can ultimately impact the overall supply and demand of the market through changing spreads, deal terms and structures and equity purchase price multiples.
We are unable to predict the full effects of these macroeconomic events or how long any further market disruptions or volatility might last. We continue to closely monitor the impact these events have on our business, industry and portfolio companies and will provide constructive solutions where necessary.
Against this uncertain macroeconomic backdrop, we believe attractive risk-adjusted returns can be achieved by making loans to middle market companies that typically possess resilient business models with strong underlying fundamentals. Given the breadth of the investment platform and decades of credit investing experience of Oaktree and its affiliates, we believe that we have the resources and experience to source, diligence and structure investments in these companies and are well placed to generate attractive returns for investors.
As of September 30, 2022, 91.5% of our debt investment portfolio (at fair value) and 91.8% of our debt investment portfolio (at cost) bore interest at floating rates. Most of our floating rate loans are indexed to the LIBOR, the Secured Overnight Financing Rate ("SOFR") and/or an alternate base rate (e.g., prime rate), which typically resets semi-annually, quarterly or monthly at the borrower’s option. Certain loans are also indexed to the Sterling Overnight Index Average ("SONIA"), an alternative reference rate that is based on transactions. The U.S. Federal Reserve, in conjunction with the Alternative Reference Rates Committee, a steering committee comprised of large U.S. financial institutions, supports replacing U.S.-dollar LIBOR with SOFR. Although there have been issuances utilizing SOFR or SONIA, it is unknown whether these alternative reference rates will attain market acceptance as replacements for LIBOR. In anticipation of the cessation of LIBOR, we may need to renegotiate any credit agreements extending beyond the applicable phase out date with our prospective portfolio companies that utilize LIBOR as a factor in determining the interest rate. Certain of the loan agreements with our portfolio companies have included fallback language in the event that LIBOR becomes unavailable. This language generally provides that the administrative agent may identify a replacement reference rate, typically with the consent of (or prior consultation with) the borrower. In certain cases, the administrative agent will be required to obtain the consent of either a majority of the lenders under the facility, or the consent of each lender, prior to identifying a replacement reference rate. Certain of the loan agreements with our portfolio companies do not include any fallback language providing a mechanism for the parties to negotiate a new reference interest rate and will instead revert to the base rate in the event LIBOR ceases to exist.
Critical Accounting Estimates
Fair Value Measurements
Our Adviser, as the valuation designee of our board of directors pursuant to Rule 2a-5 under the Investment Company Act, determines the fair value of our assets on at least a quarterly basis in accordance with Financial Accounting Standards Board, or FASB, Accounting Standards Codification, or ASC, Topic 820, Fair Value Measurements and Disclosures, or ASC 820. ASC 820 defines fair value as the amount that would be received to sell an asset or paid to transfer a liability in an orderly transaction between market participants at the measurement date. A liability's fair value is defined as the amount that would be paid to transfer the liability to a new obligor, not the amount that would be paid to settle the liability with the creditor. ASC 820 prioritizes the use of observable market prices over entity-specific inputs. Where observable prices or inputs are not available or reliable, valuation techniques are applied. These valuation techniques involve some level of estimation and judgment, the degree of which is dependent on the price transparency for the investments or market and the investments' complexity.
Hierarchical levels, defined by ASC 820 and directly related to the amount of subjectivity associated with the inputs to fair valuation of these assets and liabilities, are as follows:
•Level 1 — Unadjusted, quoted prices in active markets for identical assets or liabilities as of the measurement date.
•Level 2 — Observable inputs other than Level 1 prices, such as quoted prices for similar assets or liabilities; quoted prices in markets that are not active; or other inputs that are observable or can be corroborated by observable market data at the measurement date for substantially the full term of the assets or liabilities.
•Level 3 — Unobservable inputs that reflect the Adviser's best estimate of what market participants would use in pricing the asset or liability at the measurement date. Consideration is given to the risk inherent in the valuation technique and the risk inherent in the inputs to the model.
If inputs used to measure fair value fall into different levels of the fair value hierarchy, an investment's level is based on the lowest level of input that is significant to the fair value measurement. The Adviser's assessment of the significance of a particular input to the fair value measurement in its entirety requires judgment and considers factors specific to the investment. This includes investment securities that are valued using "bid" and "ask" prices obtained from independent third party pricing services or directly from brokers. These investments may be classified as Level 3 because the quoted prices may be indicative in nature for securities that are in an inactive market, may be for similar securities or may require adjustments for investment-specific factors or restrictions.
Financial instruments with readily available quoted prices generally will have a higher degree of market price observability and a lesser degree of judgment inherent in measuring fair value. As such, the Adviser obtains and analyzes readily available market quotations provided by pricing vendors and brokers for all of our investments for which quotations are available. In determining the fair value of a particular investment, pricing vendors and brokers use observable market information, including both binding and non-binding indicative quotations.
The Adviser seeks to obtain at least two quotations for the subject or similar securities, typically from pricing vendors. If the Adviser is unable to obtain two quotes from pricing vendors, or if the prices obtained from pricing vendors are not within the Adviser's set threshold, the Adviser seeks to obtain a quote directly from a broker making a market for the asset. The Adviser evaluates the quotations provided by pricing vendors and brokers based on available market information, including
trading activity of the subject or similar securities, or by performing a comparable security analysis to ensure that fair values are reasonably estimated. The Adviser also performs back-testing of valuation information obtained from pricing vendors and brokers against actual prices received in transactions. In addition to ongoing monitoring and back-testing, the Adviser performs due diligence procedures over pricing vendors to understand their methodology and controls to support their use in the valuation process. Generally, the Adviser does not adjust any of the prices received from these sources.
If the quotations obtained from pricing vendors or brokers are determined not to be reliable or are not readily available, the Adviser values such investments using any of three different valuation techniques. The first valuation technique is the transaction precedent technique, which utilizes recent or expected future transactions of the investment to determine fair value, to the extent applicable. The second valuation technique is an analysis of the enterprise value ("EV") of the portfolio company. EV means the entire value of the portfolio company to a market participant, including the sum of the values of debt and equity securities used to capitalize the enterprise at a point in time. The EV analysis is typically performed to determine (i) the value of equity investments, (ii) whether there is credit impairment for debt investments and (iii) the value for debt investments that we are deemed to control under the Investment Company Act. To estimate the EV of a portfolio company, the Adviser analyzes various factors, including the portfolio company’s historical and projected financial results, macroeconomic impacts on the company and competitive dynamics in the company’s industry. the Adviser also utilizes some or all of the following information based on the individual circumstances of the portfolio company: (i) valuations of comparable public companies, (ii) recent sales of private and public comparable companies in similar industries or having similar business or earnings characteristics, (iii) purchase prices as a multiple of their earnings or cash flow, (iv) the portfolio company’s ability to meet its forecasts and its business prospects, (v) a discounted cash flow analysis, (vi) estimated liquidation or collateral value of the portfolio company's assets and (vii) offers from third parties to buy the portfolio company. The Adviser may probability weight potential sale outcomes with respect to a portfolio company when uncertainty exists as of the valuation date. The third valuation technique is a market yield technique, which is typically performed for non-credit impaired debt investments. In the market yield technique, a current price is imputed for the investment based upon an assessment of the expected market yield for a similarly structured investment with a similar level of risk, and the Adviser considers the current contractual interest rate, the capital structure and other terms of the investment relative to our risk and the specific investment. A key determinant of risk, among other things, is the leverage through the investment relative to the EV of the portfolio company. As debt investments held by us are substantially illiquid with no active transaction market, the Adviser depends on primary market data, including newly funded transactions and industry specific market movements, as well as secondary market data with respect to high yield debt instruments and syndicated loans, as inputs in determining the appropriate market yield, as applicable.
The Adviser estimates the fair value of certain privately held warrants using a Black Scholes pricing model, which includes an analysis of various factors and subjective assumptions, including the current stock price (by using an EV analysis as described above), the expected period until exercise, expected volatility of the underlying stock price, expected dividends and the risk free rate. Changes in the subjective input assumptions can materially affect the fair value estimates.
In December 2020, the SEC adopted Rule 2a-5 under the Investment Company Act. Rule 2a-5 permits boards of directors of registered investment companies and BDCs to either (i) choose to continue to determine fair value in good faith, or (ii) designate a valuation designee tasked with determining fair value in good faith, subject to the board’s oversight. Our board of directors has designated the Adviser to serve as its valuation designee effective September 8, 2022.
The Adviser undertakes a multi-step valuation process each quarter in connection with determining the fair value of our investments:
•The quarterly valuation process begins with each portfolio company or investment being initially valued by the Adviser's valuation team;
•Preliminary valuations are then reviewed and discussed with management of the Adviser;
•Separately, independent valuation firms prepare valuations of the our investments, on a selected basis, for which market quotations are not readily available or are readily available but deemed not reflective of the fair value of the investment, and submit the reports to us and provide such reports to the Adviser;
•The Adviser compares and contrasts its preliminary valuations to the valuations of the independent valuation firms and prepares a valuation report for the Audit Committee;
•The Audit Committee reviews the valuation report with the Adviser, and the Adviser responds and supplements the valuation report to reflect any discussions between the Adviser and the Audit Committee; and
•The Adviser, as valuation designee, determines the fair value of each investment in our portfolio.
The fair value of our investments as of September 30, 2022 was determined by the Adviser, as our valuation designee, and the fair value of our investments as of September 30, 2021 was determined in good faith by our board of directors. We have and will continue to engage independent valuation firms each quarter to provide assistance regarding the determination of the
fair value of a portion of its portfolio securities for which market quotations are not readily available or are readily available but deemed not reflective of the fair value of the investment.
Due to the inherent uncertainty of determining the fair value of investments that do not have a readily available market value, the fair value of our investments may fluctuate from period to period. Because of the inherent uncertainty of valuation, these estimated values may differ significantly from the values that would have been reported had a ready market for the investments existed, and it is reasonably possible that the difference could be material.
With the exception of the line items entitled "deferred financing costs," "other assets," "deferred tax liability," "secured borrowings" and "credit facilities payable," which are reported at amortized cost, all assets and liabilities on the Consolidated Statements of Assets and Liabilities approximate fair value. The carrying value of the line items titled "interest receivable," "receivables from unsettled transactions," "accounts payable, accrued expenses and other liabilities," "base management fee and incentive fees payable," "due to affiliates," "interest payable" and "payables from unsettled transactions" approximate fair value due to their short maturities.
As of September 30, 2022, investments at fair value were $559,313,056, down from $575,429,432 held at September 30, 2021, primarily driven by unrealized losses related to credit spread widening during the year ended September 30, 2022.
Revenue Recognition
We generate revenues in the form of interest income on debt investments and, to a lesser extent, capital gains and distributions, if any, on equity securities that we may acquire in portfolio companies. Some of our investments provide for deferred interest payments or payment-in-kind ("PIK") interest income. The principal amount of the debt investments and any accrued but unpaid interest generally becomes due at the maturity date.
Interest Income
Interest income, adjusted for accretion of original issue discount ("OID"), is recorded on an accrual basis to the extent that such amounts are expected to be collected. We stop accruing interest on investments when it is determined that interest is no longer collectible. Investments that are expected to pay regularly scheduled interest in cash are generally placed on non-accrual status when there is reasonable doubt that principal or interest cash payments will be collected. Cash interest payments received on investments may be recognized as income or a return of capital depending upon management’s judgment. A non-accrual investment is restored to accrual status if past due principal and interest are paid in cash, and the portfolio company, in management’s judgment, is likely to continue timely payment of its remaining obligations.
In connection with our investment in a portfolio company, we sometimes receive nominal cost equity that is valued as part of the negotiation process with the portfolio company. When we receive nominal cost equity, we allocate our cost basis in the investment between debt securities and the nominal cost equity at the time of origination. Any resulting discount from recording the loan, or otherwise purchasing a security at a discount, is accreted into interest income over the life of the loan.
For our secured borrowings, the interest earned on the entire loan balance is recorded within interest income and the interest earned by the counterparty is recorded within interest expense in the Consolidated Statements of Operations.
PIK Interest Income
Our investments in debt securities may contain PIK interest provisions. PIK interest, which generally represents contractually deferred interest added to the loan balance that is generally due at the end of the loan term, is generally recorded on the accrual basis to the extent such amounts are expected to be collected. We generally cease accruing PIK interest if there is insufficient value to support the accrual or if we do not expect the portfolio company to be able to pay all principal and interest due. Our decision to cease accruing PIK interest on a loan or debt security involves subjective judgments and determinations based on available information about a particular portfolio company, including whether the portfolio company is current with respect to its payment of principal and interest on its loans and debt securities; financial statements and financial projections for the portfolio company; our assessment of the portfolio company's business development success; information obtained by us in connection with periodic formal update interviews with the portfolio company's management and, if appropriate, the private equity sponsor; and information about the general economic and market conditions in which the portfolio company operates. Our determination to cease accruing PIK interest is generally made well before our full write-down of a loan or debt security. In addition, if it is subsequently determined that we will not be able to collect any previously accrued PIK interest, the fair value of the loans or debt securities would be reduced by the amount of such previously accrued, but uncollectible, PIK interest. The accrual of PIK interest on our debt investments increases the recorded cost bases of these investments in our consolidated financial statements including for purposes of computing the capital gains incentive fee payable by us to the Adviser. To
maintain our status as a RIC, certain income from PIK interest may be required to be distributed to our stockholders even though we have not yet collected the cash and may never do so.
As of each of September 30, 2022 and September 30, 2021, there were no investments on non-accrual status.
Portfolio Composition
As of September 30, 2022, the fair value of our investment portfolio was $559.3 million and was comprised of investments in 115 portfolio companies. As of September 30, 2021, the fair value of our investment portfolio was $575.4 million and was comprised of investments in 108 portfolio companies.
As of September 30, 2022 and September 30, 2021, our investment portfolio consisted of the following:
| | | | | | | | | | | | | | |
| | | September 30, 2022 | | September 30, 2021 |
| Cost: | | | | |
| Senior Secured Debt | | 97.47 | % | | 97.57 | % |
| Preferred Equity | | 1.79 | % | | 1.28 | % |
| Common Equity & Warrants | | 0.52 | % | | 0.46 | % |
| Subordinated Debt | | 0.22 | % | | 0.69 | % |
| Total | | 100.00 | % | | 100.00 | % |
| | | | | | | | | | | | | | |
| | | September 30, 2022 | | September 30, 2021 |
| Fair Value: | | | | |
| Senior Secured Debt | | 97.31 | % | | 97.30 | % |
| Preferred Equity | | 1.95 | % | | 1.49 | % |
| Common Equity & Warrants | | 0.51 | % | | 0.53 | % |
| Subordinated Debt | | 0.23 | % | | 0.68 | % |
| Total | | 100.00 | % | | 100.00 | % |
The table below describes investments by industry composition based on fair value as a percentage of total investments:
| | | | | | | | | | | | | | |
| | September 30, 2022 | | September 30, 2021 |
| Fair Value: | | | | |
| Application Software | | 19.69 | % | | 18.42 | % |
| Pharmaceuticals | | 5.27 | % | | 6.08 | % |
| Biotechnology | | 4.19 | % | | 5.65 | % |
| Industrial Machinery | | 4.07 | % | | 3.65 | % |
| Construction & Engineering | | 3.77 | % | | 3.63 | % |
| Health Care Technology | | 3.14 | % | | 0.98 | % |
| Internet & Direct Marketing Retail | | 3.04 | % | | 3.08 | % |
| Aerospace & Defense | | 2.94 | % | | 2.81 | % |
| Personal Products | | 2.77 | % | | 5.11 | % |
| Data Processing & Outsourced Services | | 2.76 | % | | 2.74 | % |
| Health Care Distributors | | 2.76 | % | | 0.84 | % |
| Fertilizers & Agricultural Chemicals | | 2.65 | % | | 3.18 | % |
| Health Care Supplies | | 2.50 | % | | 1.42 | % |
| Automotive Retail | | 2.37 | % | | 1.85 | % |
| Internet Services & Infrastructure | | 2.35 | % | | 2.12 | % |
| Insurance Brokers | | 2.18 | % | | 2.57 | % |
| Health Care Services | | 2.03 | % | | 2.73 | % |
| Home Improvement Retail | | 1.99 | % | | 1.98 | % |
| Airport Services | | 1.86 | % | | 1.75 | % |
| Distributors | | 1.66 | % | | — | % |
| Metal & Glass Containers | | 1.63 | % | | 0.97 | % |
| Integrated Telecommunication Services | | 1.61 | % | | 1.90 | % |
| Real Estate Services | | 1.50 | % | | 1.52 | % |
| Soft Drinks | | 1.46 | % | | 1.40 | % |
| Cable & Satellite | | 1.42 | % | | 1.57 | % |
| Movies & Entertainment | | 1.38 | % | | 1.37 | % |
| Electrical Components & Equipment | | 1.26 | % | | 1.26 | % |
| Leisure Facilities | | 1.20 | % | | 0.77 | % |
| Other Diversified Financial Services | | 1.18 | % | | 1.11 | % |
| Oil & Gas Storage & Transportation | | 0.95 | % | | 1.52 | % |
| Real Estate Operating Companies | | 0.91 | % | | 1.24 | % |
| Environmental & Facilities Services | | 0.88 | % | | — | % |
| Education Services | | 0.83 | % | | — | % |
| Specialized Finance | | 0.83 | % | | 0.80 | % |
| Health Care Equipment | | 0.79 | % | | 0.76 | % |
| Diversified Support Services | | 0.79 | % | | 0.77 | % |
| Home Furnishings | | 0.79 | % | | 0.83 | % |
| IT Consulting & Other Services | | 0.74 | % | | 1.00 | % |
| Communications Equipment | | 0.73 | % | | 0.83 | % |
| Hotels, Resorts & Cruise Lines | | 0.58 | % | | — | % |
| Paper Packaging | | 0.58 | % | | — | % |
| Restaurants | | 0.56 | % | | 0.59 | % |
| Property & Casualty Insurance | | 0.46 | % | | — | % |
| Consumer Finance | | 0.37 | % | | — | % |
| Oil & Gas Refining & Marketing | | 0.36 | % | | 1.35 | % |
| Leisure Products | | 0.36 | % | | 1.41 | % |
| Systems Software | | 0.33 | % | | — | % |
| Air Freight & Logistics | | 0.24 | % | | — | % |
| Research & Consulting Services | | 0.22 | % | | 0.42 | % |
| Diversified Banks | | 0.20 | % | | 0.20 | % |
| Food Distributors | | 0.19 | % | | 0.26 | % |
| Alternative Carriers | | 0.17 | % | | 0.17 | % |
| Health Care Facilities | | 0.13 | % | | — | % |
| Construction Materials | | 0.12 | % | | 0.15 | % |
| Housewares & Specialties | | 0.12 | % | | 0.12 | % |
| Specialty Chemicals | | 0.10 | % | | 0.13 | % |
| Advertising | | 0.04 | % | | — | % |
| Independent Power Producers & Energy Traders | | — | % | | 1.31 | % |
| Airlines | | — | % | | 0.74 | % |
| Interactive Media & Services | | — | % | | 0.70 | % |
| Managed Health Care | | — | % | | 0.68 | % |
| Thrifts & Mortgage Finance | | — | % | | 0.67 | % |
| Forest Products | | — | % | | 0.34 | % |
| Electric Utilities | | — | % | | 0.27 | % |
| Electronic Components | | — | % | | 0.24 | % |
| Food Retail | | — | % | | 0.04 | % |
| Total | | 100.00 | % | | 100.00 | % |
The table below describes investments by geographic composition at fair value as a percentage of total investments:
| | | | | | | | | | | | | | |
| | | September 30, 2022 | | September 30, 2021 |
| Fair Value: | | | | |
| United States | | 88.85% | | 86.07% |
| United Kingdom | | 5.47% | | 5.97% |
| Switzerland | | 2.15% | | 2.22% |
| Australia | | 1.38% | | 1.37% |
| Iceland | | 1.23% | | 1.19% |
| Luxembourg | | 0.92% | | 1.70% |
| Chile | | —% | | 0.74% |
| Singapore | | —% | | 0.70% |
| Canada | | —% | | 0.04% |
| Total | | 100.00% | | 100.00% |
See the Schedule of Investments as of September 30, 2022 and September 30, 2021 in our consolidated financial statements in Part II, Item 8, of this Form 10-K for more information on these investments, including a list of companies and the type, cost and fair value of investments.
Discussion and Analysis of Results and Operations
Results of Operations
The principal measure of our financial performance is the net increase (decrease) in net assets resulting from operations, which includes net investment income, net realized gains (losses) and net unrealized appreciation (depreciation). Net investment income is the difference between our income from interest income and fee income and total expenses. Net realized gains (losses) on investments is the difference between the proceeds received from dispositions of portfolio investments and their stated costs. Net unrealized appreciation (depreciation) is the net change in the fair value of our investment portfolio during the reporting period, including the reversal of previously recorded unrealized appreciation (depreciation) when gains or losses are realized. The net increase or decrease in net assets from operations may vary substantially from period to period as a result of various factors, including the recognition of realized gains and losses and net change in unrealized appreciation and depreciation.
Comparison of the years ended September 30, 2022 and September 30, 2021
Investment Income
Total investment income for the year ended September 30, 2022 was $56,415,159 and consisted of $54,789,935 of interest income primarily from portfolio investments (including $4,233,285 of PIK interest income), $1,600,512 of fee income and $24,712 of dividend income. Total investment income for the year ended September 30, 2021 was $49,072,091 and consisted of $44,916,273 of interest income primarily from portfolio investments (including $4,150,838 of PIK interest income) and $4,155,818 of fee income. The increase of $7,343,068 in total investment income, as compared to the prior year, was due to a $9,873,662 increase in interest income, which was due to a larger investment portfolio and a higher yield on investments due to rising reference rates, and a $24,712 increase in dividend income, partially offset by a $2,555,306 decrease in fee income primarily due to lower prepayment fees during the year.
Expenses
Total expenses for the years ended September 30, 2022 and September 30, 2021 were $23,534,397 and $22,479,260, respectively. The increase in total expenses for the year ended September 30, 2022, as compared to the prior year, was primarily due to (1) a $3,501,753 increase in interest expense as a result of higher average borrowings outstanding and the impact of rising reference rates, (2) a $663,842 increase in professional fees primarily as a result of merger related expenses, (3) a $567,387 increase in investment income incentive fees primarily as a result of higher total investment income and (4) a $379,004 increase in base management fees primarily as a result of a higher average investment portfolio, partially offset by a $4,018,372 decrease in accrued capital gains incentive fees as a result of a reversal of previously accrued capital gains incentive fees driven by unrealized losses during the current year. | | | | | | | | | | | | | | |
| | | Year ended September 30, 2022 | | Year ended September 30, 2021 |
| Expenses: | | | | |
| Base management fee | | $ | 5,656,120 | | | $ | 5,277,116 | |
| Investment income incentive fee | | 7,723,049 | | | 7,155,662 | |
| Capital gains incentive fee | | (1,988,557) | | | 2,029,815 | |
| Professional fees | | 1,694,986 | | | 1,031,144 | |
| Directors fees | | 155,000 | | | 155,000 | |
| Interest expense | | 8,998,725 | | | 5,496,972 | |
| Administrator expense | | 462,867 | | | 418,580 | |
| General and administrative expenses | | 832,207 | | | 914,971 | |
| Total expenses | | $ | 23,534,397 | | | $ | 22,479,260 | |
Net Unrealized Appreciation (Depreciation)
Net unrealized depreciation was $24,139,553 for the year ended September 30, 2022, primarily due to unrealized depreciation across various investments in the portfolio, partially offset by unrealized appreciation on foreign currency forward contracts. Net unrealized appreciation was $7,280,860 for the year ended September 30, 2021, primarily due to unrealized appreciation across various investments in the portfolio and foreign currency forward contracts.
Net Realized Gains (Losses)
Net realized gains were $3,323,075 and $2,992,242 for the years ended September 30, 2022 and 2021, respectively. For the year ended September 30, 2022, net realized gains were primarily due to realized gains on foreign currency forward contracts, partially offset by realized losses resulting from exits of various investments in the portfolio. For the year ended September 30, 2021, net realized gains from exits of various investments in the portfolio were partially offset by realized losses on foreign currency forward contracts.
Comparison of the years ended September 30, 2021 and September 30, 2020
The comparison of the fiscal years ended September 30, 2021 and 2020 can be found within Part II, Item 7. Management's Discussion and Analysis of Financial Condition and Results of Operations of our annual report on Form 10-K for the fiscal year ended September 30, 2021 which is incorporated by reference herein.
Financial Condition, Liquidity and Capital Resources
We generate cash from (1) cash flows from operations, including earnings on investments, as well as interest earned from the temporary investment of cash in cash-equivalents, U.S. government securities and other high-quality debt investments that mature in one year or less, and (2) borrowings from banks and issuances of senior securities.
Our primary use of cash is for (1) investments in portfolio companies and other investments to comply with certain portfolio diversification requirements, (2) the cost of operations (including our expenses, the Management Fee and the Incentive Fee), (3) debt service of borrowings under our credit facilities and secured borrowings, and (4) cash distributions to the stockholders.
For the year ended September 30, 2022, we experienced a net decrease in cash and cash equivalents and restricted cash of $4,167,222. During that period, $36,861,615 of cash was provided by operating activities, primarily consisting of cash proceeds from the sales and repayments of investments, a net increase in net payables from unsettled transactions and cash provided by net investment income, partially offset by cash used to fund new investments. During the same period, cash used in financing activities was $40,685,790, primarily consisting of distributions to stockholders of $36,716,365 and $9,969,425 of net repayment of secured borrowings, partially offset by $6,000,000 of net borrowings under our credit facilities.
For the year ended September 30, 2021, we experienced a net decrease in cash and cash equivalents and restricted cash of $7,443,071. During that period, $124,961,666 of cash was used in operating activities, primarily consisting of cash used to fund new investments, partially offset by cash proceeds from the sales and repayments of investments. During the same period, cash provided by financing activities was $117,925,820, primarily consisting of $146,000,000 of net borrowings under our credit facilities and $9,969,425 of net proceeds from secured borrowings, partially offset by distributions to stockholders of $37,238,403 and financings costs paid of $805,202.
As of September 30, 2022, we had $19,405,793 of cash and cash equivalents (including $3,794,868 of restricted cash), portfolio investments (at fair value) of $559,313,056, $7,586,938 of interest receivable, $5,242,361 of due from portfolio companies, $257,000,000 of borrowings outstanding under our credit facilities and $8,853,364 of net payables from unsettled transactions.
As of September 30, 2021, we had $23,573,015 of cash and cash equivalents (including $4,317,968 of restricted cash), portfolio investments (at fair value) of $575,429,432, $3,196,194 of interest receivable, $251,000,000 of borrowings outstanding under our credit facilities, $9,969,425 of secured borrowings and $11,349,581 of receivables from unsettled transactions.
We are a party to financial instruments with off-balance sheet risk in the normal course of business to meet the financial needs of our portfolio companies. As of September 30, 2022 and September 30, 2021, off-balance sheet arrangements consisted of $22,812,917 and $48,497,448, respectively, of unfunded commitments to provide debt and equity financing to certain of our portfolio companies. Such commitments are subject to the portfolio company's satisfaction of certain financial and nonfinancial covenants and may involve, to varying degrees, elements of credit risk in excess of the amount recognized in our Consolidated Statements of Assets and Liabilities.
As of September 30, 2022, we have analyzed cash and cash equivalents, availability under our credit facilities, the ability to rotate out of certain assets and amounts of unfunded commitments that could be drawn and believe our liquidity and capital resources are sufficient to take advantage of market opportunities in the current economic climate.
Contractual Obligations | | | | | | | | | | | | | | | | | | | | | | | |
| Debt Outstanding
as of September 30, 2021 | | Debt Outstanding
as of September 30, 2022 | | Weighted average debt
outstanding for the
year ended
September 30, 2022 | | Maximum debt
outstanding for the year ended
September 30, 2022 |
| Citibank Facility | $ | 200,000,000 | | | $ | 220,000,000 | | | $ | 221,265,753 | | | $ | 231,000,000 | |
| CNB-2 Facility | 51,000,000 | | | 37,000,000 | | | 34,767,123 | | | 51,000,000 | |
| Secured Borrowings | 9,969,425 | | | — | | | 7,999,097 | | | 13,000,786 | |
| Total debt | $ | 260,969,425 | | | $ | 257,000,000 | | | $ | 264,031,973 | | | |
| | | | | | | | | | | | | | | | | | | | | | | | | | |
| | | Payments due by period as of September 30, 2022 |
| | | Total | | < 1 year | | 1-3 years | | 3-5 years |
| CNB-2 Facility | | $ | 37,000,000 | | | $ | 37,000,000 | | | $ | — | | | $ | — | |
| Interest due on CNB-2 Facility | | 1,294,058 | | | 1,294,058 | | | — | | | — | |
| Citibank Facility | | 220,000,000 | | | — | | | 220,000,000 | | | — | |
| Interest due on Citibank Facility | | 27,068,004 | | | 11,637,010 | | | 15,430,994 | | | — | |
| Total | | $ | 285,362,062 | | | $ | 49,931,068 | | | $ | 235,430,994 | | | $ | — | |
Equity Activity
As of September 30, 2022 and September 30, 2021, we completed drawdowns of $337,558,996, or 100%, of Capital Commitments from investors in connection with Private Offerings, of which $3,854,346 in Capital Commitments were made by one or more affiliates of the Adviser.
We have the authority under our organizational documents to issue 250,000,000 shares of Common Stock, $0.001 per share par value and 100,000,000 shares of preferred stock, $0.001 per share par value. The following table summarizes total shares issued and proceeds related to capital drawdowns delivered pursuant to the Subscription Agreements for our Common Stock through September 30, 2022:
| | | | | | | | | | | | | | | | | | | | |
| | Shares Issued | | Price per Share | | Proceeds |
| August 6, 2018 (1) | | 770,869 | | | $ | 20.00 | | | $ | 15,417,385 | |
| September 17, 2018 | | 770,869 | | | 20.00 | | | 15,417,384 | |
| October 29, 2018 | | 1,060,964 | | | 19.85 | | | 21,060,130 | |
| November 15, 2018 | | 789,198 | | | 19.82 | | | 15,641,900 | |
| April 29, 2019 | | 1,655,314 | | | 20.40 | | | 33,768,400 | |
| August 30, 2019 | | 1,631,324 | | | 20.70 | | | 33,768,400 | |
| September 23, 2019 | | 1,631,323 | | | 20.70 | | | 33,768,399 | |
| March 26, 2020 (2) | | 3,263,385 | | | 20.68 | | | 67,486,799 | |
| April 30, 2020 (2) | | 5,827,875 | | | 17.37 | | | 101,230,199 | |
| Total | | 17,401,121 | | | | | $ | 337,558,996 | |
__________________
(1)Includes 50 shares issued to one or more affiliates of the Adviser on July 23, 2018.
(2)For the March 26, 2020 and April 30, 2020 drawdowns, the shares issued exclude 2,418 shares and 4,318 shares related to defaulted investors. In connection with these defaults, Capital Commitments and proceeds from capital drawdowns were each reduced by $125,000.
Leverage
On July 9, 2018, our sole stockholder approved our becoming subject to a minimum asset coverage ratio of 150% as set forth in Section 61(a)(2) of the Investment Company Act. As a result of this approval, we are permitted to borrow amounts so long as our asset coverage ratio, as defined in the Investment Company Act, is at least 150% after such borrowing (if certain requirements are met). As of September 30, 2022, our asset coverage ratio, as defined in the Investment Company Act, was 225.3%, and senior securities outstanding were $257.0 million.
We may issue debt securities or preferred stock and/or borrow additional money from banks or other financial institutions, which we refer to collectively as "senior securities," up to the maximum amount permitted by the Investment Company Act. We have securitized and may in the future securitize a portion of our investments to the extent permitted by applicable law and regulation. To securitize investments, we typically create a wholly-owned subsidiary and contribute a pool of loans to the subsidiary. We then typically sell interests in the subsidiary on a non-recourse basis to purchasers and we would retain all or a portion of the equity in the subsidiary. Our primary uses of funds are investments in our targeted asset classes and cash distributions to holders of our common stock.
CNB-1 Facility
On October 16, 2018, we entered into a revolving credit agreement (the “CNB-1 Loan Agreement”) between us, as borrower, and City National Bank ("CNB"), as lender. Prior to its termination, the CNB-1 Loan Agreement provided for a senior secured revolving credit facility (the "CNB-1 Facility"), of up to $60 million (the "CNB-1 Facility Maximum Commitment"), in aggregate principal amount, subject to the lesser of (i) a percentage of unfunded commitments from certain classes of eligible investors in the Company and (ii) the CNB-1 Facility Maximum Commitment and had a scheduled maturity date of October 15, 2020. On May 1, 2020, we repaid all borrowings outstanding under the CNB-1 Facility, following which the CNB-1 Facility was terminated.
Borrowings under the CNB-1 Facility bore interest at a rate equal to (a) the LIBOR for the selected period plus 1.65% for LIBOR loans or (b) the prime rate of CNB minus 0.25% for prime rate loans. There was a non-usage fee of 25 basis points per year on the unused portion of the CNB-1 Facility, payable quarterly.
The CNB-1 Facility was secured by a first priority security interest, subject to customary exceptions, in (i) all Capital Commitments, (ii) our right to make capital calls, receive payment of capital contributions from investors and enforce payment of capital commitments and capital contributions under our Subscription Agreements with investors and other operative documents and (iii) a cash collateral account into which the capital contributions from investors are made. We made customary representations and warranties and were required to comply with various affirmative and negative covenants, reporting
requirements and other customary requirements for similar credit facilities. Our borrowings, including under the CNB-1 Facility, were subject to the leverage restrictions contained in the Investment Company Act.
As of September 30, 2022 and September 30, 2021, we had no borrowings outstanding under the CNB-1 Facility. Our borrowings under the CNB-1 Facility bore interest at a weighted average interest rate of 3.27% for the year ended September 30, 2020. For the year ended September 30, 2020, we recorded interest expense (inclusive of fees) of $1,769,383 related to the CNB-1 Facility.
CNB-2 Facility
On June 9, 2020 (the “CNB-2 Closing Date”), we entered into a loan and security agreement, which was subsequently amended on March 31, 2021 (as amended, the “CNB-2 Loan Agreement”) between us, as borrower, and CNB, as lender. The CNB-2 Loan Agreement provides for a senior secured revolving credit facility (the “CNB-2 Facility”) of up to $60 million (the “CNB-2 Facility Maximum Commitment”) in aggregate principal amount, subject to the lesser of (i) the borrowing base, which is an amount determined by applying different rates to eligible assets held by the Company based generally on the value of such assets and (ii) the CNB-2 Facility Maximum Commitment. The maturity date of the CNB-2 Facility is June 9, 2023.
Borrowings under the CNB-2 Facility bear interest at a rate equal to LIBOR for the selected period (subject to a floor of 0.25%) plus 2.50%. There is a non-usage fee of 50 basis points per year on the unused portion of the CNB-2 Facility, payable annually, if on any anniversary of the CNB-2 Closing Date, the average daily utilization of the CNB-2 Facility is less than $25 million over the prior 365-day period.
The CNB-2 Facility is secured by a first priority security interest in substantially all of our assets, including our portfolio investments but excluding those investments held in OSI 2 SPV (defined below). We have made customary representations and warranties and are required to comply with various affirmative and negative covenants, reporting requirements and other customary requirements for similar credit facilities. Our borrowings, including under the CNB-2 Facility, are subject to the leverage restrictions contained in the Investment Company Act.
As of September 30, 2022 and September 30, 2021, we had $37.0 million and $51.0 million, respectively, outstanding under the CNB-2 Facility. For the years ended September 30, 2022, 2021 and 2020, our borrowings under the CNB-2 Facility bore interest at a weighted average interest rate of 3.37%, 2.91% and 3.32%, respectively. For the years ended September 30, 2022, 2021 and 2020, we recorded interest expense (inclusive of fees) of $1,423,297, $1,302,400 and $183,244, respectively, related to the CNB-2 Facility.
Citibank Facility
On July 26, 2019 (the "Citibank Closing Date"), we and OSI 2 Senior Lending SPV, LLC ("OSI 2 SPV"), a wholly-owned and consolidated subsidiary of us, entered into a loan and security agreement, which was subsequently amended on September 20, 2019, July 2, 2020, December 31, 2020 and March 31, 2021 (as amended, the "Citibank Loan Agreement"), with the lenders from time to time party thereto and the other parties referenced below. Under the terms of the Citibank Loan Agreement, we serve as the collateral manager and seller and OSI 2 SPV serves as borrower with Citibank, N.A., as administrative agent, and Deutsche Bank Trust Company Americas, as collateral agent.
The Citibank Loan Agreement provides for a senior secured revolving credit facility (the "Citibank Facility"), of up to $250 million (the "Citibank Maximum Commitment"), in aggregate principal amount, subject to the lesser of (i) the borrowing base, which is an amount based on advance rates that vary depending on the class of assets and the value assigned to such assets under the Citibank Loan Agreement and (ii) the Citibank Maximum Commitment. The Citibank Facility has a forty-two (42) month reinvestment period (the "Reinvestment Period"), during which advances may be made; and matures sixty-six (66) months from the Citibank Closing Date. Following the Reinvestment Period, OSI 2 SPV will be required to make certain mandatory amortization payments. Borrowings under the Citibank Facility bear interest payable quarterly at a rate per year equal to (a) in the case of a lender that is identified as a conduit lender under the Loan Agreement, the lesser of (i) the applicable commercial paper rate for such conduit lender and (ii) the LIBOR for a three month maturity and (b) for all other lenders under the Citibank Facility, LIBOR, plus, in each case, an applicable spread. During the Reinvestment Period, the applicable spread is the greater of (i) a weighted average rate of (x) 1.65% per year for broadly syndicated loans and (y) 2.25% per year for all other eligible loans and (ii) 1.85%. After the Reinvestment Period, the applicable spread is 3.00% per year. There is also a non-usage fee of (i) 0.40% per year for the first six months following the Citibank Closing Date (the "Ramp-Up Period"), and (ii) 0.50% per year thereafter, in each case, on the unused portion of the Citibank Facility, payable quarterly; provided that if after the Ramp-Up Period the unused portion of the Citibank Facility is greater than 30% of the commitments under the Citibank Facility, the non-usage fee will be based on an unused portion of 30% of the commitments under the Citibank Facility.
The Citibank Facility is secured by a first priority security interest in substantially all of OSI 2 SPV’s assets.
As part of the Citibank Facility, OSI 2 SPV is subject to certain limitations as to how borrowed funds may be used and the types of loans that are eligible to be acquired by OSI 2 SPV including, but not limited to, restrictions on sector concentrations, loan size, tenor and minimum investment ratings (or estimated ratings). The Citibank Facility also contains certain requirements relating to interest coverage, collateral quality and portfolio performance, certain violations of which could result in the acceleration of the amounts due under the Citibank Facility.
Under the Citibank Facility, we and OSI 2 SPV, as applicable, have made customary representations and warranties, and are required to comply with various affirmative and negative covenants, reporting requirements and other customary requirements for similar credit facilities.
OSI 2 SPV’s borrowings are non-recourse to us but are considered borrowings of us for purposes of complying with the asset coverage requirements under the Investment Company Act.
As of September 30, 2022 and September 30, 2021, we had $220.0 million and $200.0 million, respectively, outstanding under the Citibank Facility. Our borrowings under the Citibank Facility bore interest at a weighted average interest rate of 3.00%, 2.32% and 2.91%, for the years ended September 30, 2022, 2021 and 2020, respectively. For the years ended September 30, 2022, 2021 and 2020, we recorded interest expense (inclusive of fees) of $7,300,813, $3,999,650 and $2,692,069, respectively, related to the Citibank Facility.
Secured Borrowings
As of September 30, 2022, we had no secured borrowings outstanding. As of September 30, 2021, we had $10.0 million
of secured borrowings outstanding, which were recorded as a result of certain securities that were sold and simultaneously
repurchased at a premium, with amounts payable to the counterparty due on the repurchase settlement date, which is generally
within 120 days of the trade date. Our secured borrowings bore interest at a weighted average rate of 3.43% and 3.23%, respectively, for the years ended September 30, 2022 and 2021. We recorded $274,617 and $194,922 of interest expense in connection with secured borrowings for the years ended September 30, 2022 and 2021, respectively.
Regulated Investment Company Status and Distributions
We anticipate that we will make quarterly distributions of at least 90% of our realized net ordinary income and net short-term capital gains in excess of our net long-term capital losses, if any, then available for distribution, each as determined by our board of directors in accordance with applicable law and the terms of the Governing Documents. Any distributions will be declared out of assets legally available for distribution. We expect quarterly distributions to be paid from income primarily generated by interest earned on our investments, although distributions to stockholders may also include a return of capital.
We have elected to be treated, and intend to qualify annually, as a RIC under Subchapter M of the Code. To maintain RIC qualification, we must distribute to our stockholders, for each tax year, at least 90% of our “investment company taxable income” for that year. In order to avoid certain excise taxes imposed on RICs, we intend to distribute during each calendar year an amount at least equal to the sum of: (1) 98% of our ordinary income for the calendar year; (2) 98.2% of our capital gain net income (both long-term and short-term) for the one-year period ending on October 31 of the calendar year; and, (3) any undistributed ordinary income and capital gain net income for preceding years on which we paid no U.S. federal income tax less certain over-distributions in prior years. In addition, although we currently intend to distribute realized net capital gains (i.e., net long term capital gains in excess of short term capital losses), if any, at least annually, we may in the future decide to retain such capital gains for investment, pay U.S. federal income tax on such amounts at regular corporate tax rates, and elect to treat such gains as deemed distributions to stockholders. We can offer no assurance that we will achieve results that will permit the payment of any cash distributions and, to the extent that we issue senior securities, we will be prohibited from making distributions if doing so causes us to fail to maintain the asset coverage ratios stipulated by the Investment Company Act or if distributions are limited by the terms of any of our borrowings.
Depending on the level of taxable income and net capital gain earned in a year, we may choose to carry forward taxable income or net capital gain for distribution in the following year and pay the applicable U.S. federal excise tax. Distributions will be appropriately adjusted for any taxes payable by us or any direct or indirect subsidiary through which it invests (including any corporate, state, local, non-U.S. and withholding taxes). Any Incentive Fee to be paid to our Adviser will not be reduced to take into account any such taxes.
We may generate qualified net interest income or qualified net short-term capital gains that may be exempt from U.S. withholding tax when distributed to foreign stockholders. A RIC is permitted to designate distributions of qualified net interest income and qualified short-term capital gains as exempt from U.S. withholding tax when paid to non-U.S. shareholders with proper documentation. The following table, which may be subject to change as we finalize our annual tax filings, lists the percentage of qualified net interest income and qualified short-term capital gains for the year ended September 30, 2022, our most recently completed tax year end.
| | | | | | | | | | | |
| Year Ended | | Qualified Net Interest Income | Qualified Short-Term Capital Gains |
| September 30, 2022 | | 68.3 | % | 16.5 | % |
The following table reflects the distributions per share that we have paid on our common stock during the year ended September 30, 2022:
| | | | | | | | | | | | | | | | | | | | | | | | | | |
| Distribution Type | | Record Date | | Payment Date | | Amount
per Share | | Cash Distribution |
| Quarterly | | December 15, 2021 | | December 28, 2021 | | $ | 0.42 | | | $ | 7,308,472 | |
| Special | | December 15, 2021 | | December 28, 2021 | | 0.38 | | | 6,612,424 | |
| Quarterly | | March 15, 2022 | | March 28, 2022 | | 0.43 | | | 7,482,481 | |
| Quarterly | | June 15, 2022 | | June 30, 2022 | | 0.44 | | | 7,656,494 | |
| Quarterly | | September 15, 2022 | | September 27, 2022 | | 0.44 | | | 7,656,494 | |
| | | | | | $ | 2.11 | | | $ | 36,716,365 | |
The following table reflects the distributions per share that the Company has paid on its common stock during the year ended September 30, 2021:
| | | | | | | | | | | | | | | | | | | | | | | | | | |
| Distribution Type | | Record Date | | Payment Date | | Amount
per Share | | Cash Distribution |
| Quarterly | | December 15, 2020 | | December 31, 2020 | | $ | 0.35 | | | $ | 6,090,393 | |
| Special | | December 15, 2020 | | December 31, 2020 | | 0.62 | | | 10,788,696 | |
| Quarterly | | March 15, 2021 | | March 26, 2021 | | 0.35 | | | 6,090,393 | |
| Quarterly | | June 15, 2021 | | June 30, 2021 | | 0.40 | | | 6,960,449 | |
| Quarterly | | September 15, 2021 | | September 27, 2021 | | 0.42 | | | 7,308,472 | |
| | | | | | $ | 2.14 | | | $ | 37,238,403 | |
Related Party Transactions
We have entered into the Investment Advisory Agreement with the Adviser and the Administration Agreement with the Administrator, an affiliate of the Adviser. The Adviser is a registered investment adviser under the Investment Advisers Act of 1940, as amended, and is a subsidiary of Oaktree Capital Group, LLC.
Recent Developments
Distribution Declaration
On December 12, 2022, our board of directors approved a quarterly distribution of $0.44 per share, payable in cash on December 27, 2022 to our stockholders of record as of the close of business on December 15, 2022. Additionally, on December 12, 2022, our Board of Directors approved a special distribution of $0.23 per share, payable in cash on December 27, 2022 to our stockholders of record as of the close of business on December 15, 2022.
Merger Agreement
On September 14, 2022, we entered into the Merger Agreement, which provides that, subject to the conditions set forth in the Merger Agreement, Merger Sub will merge with and into us, with us continuing as the surviving company and as OCSL’s wholly-owned subsidiary and, immediately thereafter, we will merge with and into OCSL, with OCSL continuing as the surviving company. Both our board of directors and the board of directors of OCSL, including all of the respective independent directors, in each case, on the recommendation of a special committee comprised solely of certain independent directors of us or OCSL, as applicable, have approved the Merger Agreement and the transactions contemplated thereby.
At the Effective Time, each share of our common stock issued and outstanding immediately prior to the Effective Time (other than Cancelled Shares) will be converted into the right to receive a number of shares of OCSL Common Stock equal to the Exchange Ratio (as defined below), plus any cash (without interest) in lieu of fractional shares.
As of a mutually agreed date no earlier than 48 hours (excluding Sundays and holidays) prior to the Effective Time, which we refer as the “Determination Date”, each of us and OCSL will deliver to the other a calculation of its net asset value as of such date, in each case using a pre-agreed set of assumptions, methodologies and adjustments. We refer to such calculation with respect to us as the “Closing OSI2 Net Asset Value” and with respect to OCSL as the “Closing OCSL Net Asset Value”. Based on such calculations, the parties will calculate the “OSI2 Per Share NAV”, which will be equal to (i) the Closing OSI2 Net Asset Value divided by (ii) the number of shares of our common stock issued and outstanding as of the Determination Date (excluding any Cancelled Shares), and the “OCSL Per Share NAV”, which will be equal to (A) the Closing OCSL Net Asset Value divided by (B) the number of shares of OCSL Common Stock issued and outstanding as of the Determination Date. The “Exchange Ratio” will be equal to the quotient (rounded to four decimal places) of (i) the OSI2 Per Share NAV divided by (ii) the OCSL Per Share NAV.
We and OCSL will update and redeliver the Closing OSI2 Net Asset Value or the Closing OCSL Net Asset Value, respectively, in the event of a material change to such calculation between the Determination Date and the closing of the Mergers and if needed to ensure that the calculation is determined within 48 hours (excluding Sundays and holidays) prior to the Effective Time.
The Merger Agreement contains customary representations and warranties by each of us, OCSL and Oaktree. The Merger Agreement also contains customary covenants, including, among others, covenants relating to the operation of each of our and OCSL’s businesses during the period prior to the closing of the Mergers.
Consummation of the Mergers, which is currently anticipated to occur during the second fiscal quarter of 2023, is subject to certain closing conditions, including requisite approvals of our and OCSL’s stockholders and certain other closing conditions.
The Merger Agreement also contains certain termination rights in favor of us and OCSL, including if the Mergers are not completed on or before June 30, 2023 or if the requisite approvals of our or OCSL’s stockholders are not obtained. The Merger Agreement provides that, upon the termination of the Merger Agreement under certain circumstances, a third party acquiring us may be required to pay OCSL a termination fee of approximately $9.8 million. The Merger Agreement provides that, upon the termination of the Merger Agreement under certain circumstances, a third party acquiring OCSL may be required to pay to us a termination fee of approximately $37.9 million.
The foregoing description of the Merger Agreement does not purport to be complete and is qualified in its entirety by reference to the full text of the Merger Agreement, a copy of which is an exhibit to this annual report on Form 10-K. The representations, warranties, covenants and agreements contained in the Merger Agreement were made only for purposes of the Merger Agreement and as of specific dates; were solely for the benefit of the parties to the Merger Agreement (except as may be expressly set forth in the Merger Agreement); may be subject to limitations agreed upon by the parties, including being qualified by confidential disclosures made for the purposes of allocating contractual risk between the parties to the Merger Agreement instead of establishing these matters as facts; and may be subject to standards of materiality applicable to the contracting parties that differ from those applicable to investors. Investors and security holders should not rely on such representations, warranties, covenants or agreements, or any descriptions thereof, as characterizations of the actual state of facts or condition of any of the parties to the Merger Agreement or any of their respective subsidiaries or affiliates. Moreover, information concerning the subject matter of the representations, warranties, covenants and agreements may change after the date of the Merger Agreement, which subsequent information may or may not be fully reflected in public disclosures by the parties to the Merger Agreement.
Item 7A. Quantitative and Qualitative Disclosures about Market Risk
We are subject to financial market risks, including changes in the valuations of our investment portfolio and interest rates.
Valuation Risk
Our investments often do not have a readily available market price, and we value these investments at fair value as determined in good faith by the Adviser, as the valuation designee appointed by our board of directors pursuant to Rule 2a-5 under the Investment Company Act. There is no single standard for determining fair value in good faith and valuation methodologies involve a significant degree of judgment. In addition, our valuation methodology utilizes discount rates in part in valuing our investments, and changes in those discount rates may have an impact on the valuation of our investments. Accordingly, valuations by us do not necessarily represent the amounts which may eventually be realized from sales or other dispositions of investments. Estimated fair values may differ from the values that would have been used had a ready market for the investment existed, and the differences could be material to our consolidated financial statements.
Interest Rate Risk
We are subject to financial market risks, including changes in interest rates. Changes in interest rates may affect both our cost of funding and our interest income from portfolio investments, cash and cash equivalents and idle funds investments. Our risk management procedures are designed to identify and analyze our risk, to set appropriate policies and to continually monitor these risks. Our investment income will be affected by changes in various interest rates, including LIBOR, SOFR, SONIA and prime rates, to the extent our debt investments include floating interest rates.
As of September 30, 2022, 91.5% of our debt investment portfolio at fair value bore interest at floating rates. The composition of our floating rate debt investments by interest rate floor as of September 30, 2022 and September 30, 2021 was as follows:
| | | | | | | | | | | | | | | | | | | | | | | | | | |
| | | September 30, 2022 | | September 30, 2021 |
| ($ in thousands) | | Fair Value | | % of Floating
Rate Portfolio | | Fair Value | | % of Floating
Rate Portfolio |
| 0% | | $ | 37,265,822 | | | 7.46 | % | | $ | 48,594,490 | | | 9.30 | % |
| >0% and <1% | | 137,622,429 | | | 27.56 | | | 97,766,063 | | | 18.72 | |
| 1% | | 303,106,103 | | | 60.69 | | | 355,262,700 | | | 68.02 | |
| >1% | | 21,411,903 | | | 4.29 | | | 20,656,619 | | | 3.96 | |
| Total | | $ | 499,406,257 | | | 100.00 | % | | $ | 522,279,872 | | | 100.00 | % |
| | | | | | | | |
Based on our Consolidated Statements of Assets and Liabilities as of September 30, 2022, the following table shows the approximate annualized net increase (decrease) in net assets resulting from operations (excluding the impact of any potential incentive fees) of hypothetical base rate changes in interest rates, assuming no changes in our investment and capital structure. However, there can be no assurances our portfolio companies will be able to meet their contractual obligations at any or all levels of increases in interest rates.
| | | | | | | | | | | | | | | | | | | | |
| Basis point increase | | Increase in Interest Income | | (Increase) in Interest Expense | | Net increase in net assets resulting from operations |
| 250 | | $ | 12,865,517 | | | $ | (6,425,000) | | | $ | 6,440,517 | |
| 200 | | 10,284,291 | | | (5,140,000) | | | 5,144,291 | |
| 150 | | 7,703,065 | | | (3,855,000) | | | 3,848,065 | |
| 100 | | 5,121,839 | | | (2,570,000) | | | 2,551,839 | |
| 50 | | 2,542,663 | | | (1,285,000) | | | 1,257,663 | |
| | | | | | | | | | | | | | | | | | | | |
| Basis point decrease | | (Decrease) in Interest Income | | Decrease in Interest Expense | | Net (decrease) in net assets resulting from operations |
| 50 | | $ | (2,537,204) | | | $ | 1,285,000 | | | $ | (1,252,204) | |
| 100 | | (5,017,879) | | | 2,570,000 | | | (2,447,879) | |
| 150 | | (7,485,342) | | | 3,855,000 | | | (3,630,342) | |
| 200 | | (9,943,513) | | | 5,140,000 | | | (4,803,513) | |
| 250 | | (11,961,061) | | | 6,351,000 | | | (5,610,061) | |
We regularly measure exposure to interest rate risk. We assess interest rate risk and manage our interest rate exposure on an ongoing basis by comparing our interest rate sensitive assets to our interest rate sensitive liabilities. Based on this review, we determine whether or not any hedging transactions are necessary to mitigate exposure to changes in interest rates. The interest rate on the principal balance outstanding for primarily most of the floating rate loans is indexed to the LIBOR, SOFR, SONIA and/or an alternate base rate (e.g., prime rate), which typically resets semi-annually, quarterly, or monthly at the borrower's option. The borrower may also elect to have multiple interest reset periods for each loan. The following table shows a comparison of the interest rate base for our outstanding debt investments, at principal, and our outstanding borrowings as of September 30, 2022 and September 30, 2021:
| | | | | | | | | | | | | | | | | | | | | | | | | | |
| | September 30, 2022 | | September 30, 2021 |
| | Debt Investments | | Borrowings | | Debt Investments | | Borrowings |
| Prime rate | | $ | 745,881 | | | $ | — | | | $ | 1,097,727 | | | $ | — | |
| LIBOR: | | | | | | | | |
| 30 day | | 145,886,106 | | | 37,000,000 | | | 135,281,414 | | | 51,000,000 | |
| 90 day | | 225,699,332 | | | 220,000,000 | | | 259,893,962 | | | 200,000,000 | |
| 180 day | | 53,339,994 | | | — | | | 79,023,702 | | | — | |
| 360 day | | — | | | — | | | 20,074,643 | | | — | |
| EURIBOR: | | | | | | | | |
| 30 day | | 5,042,259 | | | — | | | 5,965,116 | | | — | |
| 90 day | | 6,681,213 | | | — | | | 7,904,039 | | | — | |
| 180 day | | 1,031,309 | | | — | | | 5,428,096 | | | — | |
| SOFR | | | | | | | | |
| 30 day | | 19,329,700 | | | — | | | — | | | — | |
| 90 day | | 51,831,659 | | | — | | | — | | | — | |
| SONIA | | 14,637,092 | | | — | | | — | | | — | |
| UK LIBOR: | | | | | | | | |
| 30 day | | — | | | — | | | 4,213,594 | | | — | |
| 180 day | | — | | | — | | | 13,466,173 | | | — | |
| Fixed rate | | 46,961,783 | | | — | | | 42,102,695 | | | 9,969,425 | |
| Total | | $ | 571,186,328 | | | $ | 257,000,000 | | | $ | 574,451,161 | | | $ | 260,969,425 | |
Item 8. Financial Statements and Supplementary Data
Index to Consolidated Financial Statements
Report of Independent Registered Public Accounting Firm
To the Stockholders and the Board of Directors of Oaktree Strategic Income II, Inc.
Opinion on the Financial Statements
We have audited the accompanying consolidated statements of assets and liabilities of Oaktree Strategic Income II, Inc. (the Company), including the consolidated schedules of investments, as of September 30, 2022 and 2021, the related consolidated statements of operations, changes in net assets, and cash flows for each of the three years in the period ended September 30, 2022, and the related notes (collectively referred to as the “consolidated financial statements”). In our opinion, the consolidated financial statements present fairly, in all material respects, the financial position of the Company at September 30, 2022 and 2021, and the results of its operations, changes in its net assets, and its cash flows for each of the three years in the period ended September 30, 2022, in conformity with U.S. generally accepted accounting principles.
Basis for Opinion
These financial statements are the responsibility of the Company’s management. Our responsibility is to express an opinion on the Company’s financial statements based on our audits. We are a public accounting firm registered with the Public Company Accounting Oversight Board (United States) (PCAOB) and are required to be independent with respect to the Company in accordance with the U.S. federal securities laws and the applicable rules and regulations of the Securities and Exchange Commission and the PCAOB.
We conducted our audits in accordance with the standards of the PCAOB. Those standards require that we plan and perform the audit to obtain reasonable assurance about whether the financial statements are free of material misstatement, whether due to error or fraud. The Company is not required to have, nor were we engaged to perform, an audit of its internal control over financial reporting. As part of our audits, we are required to obtain an understanding of internal control over financial reporting but not for the purpose of expressing an opinion on the effectiveness of the Company’s internal control over financial reporting. Accordingly, we express no such opinion.
Our audits included performing procedures to assess the risks of material misstatement of the financial statements, whether due to error or fraud, and performing procedures that respond to those risks. Such procedures included examining, on a test basis, evidence regarding the amounts and disclosures in the financial statements. Our procedures included confirmation of investments owned as of September 30, 2022 and 2021 by correspondence with the custodians, syndication agents and underlying investee companies, and by other appropriate auditing procedures where confirmation was not received. Our audits also included evaluating the accounting principles used and significant estimates made by management, as well as evaluating the overall presentation of the financial statements. We believe that our audits provide a reasonable basis for our opinion.
/s/ Ernst & Young LLP
We have served as the Company’s auditor since 2018.
Los Angeles, CA
December 14, 2022
Oaktree Strategic Income II, Inc.
Consolidated Statements of Assets and Liabilities
| | | | | | | | | | | | | | |
| | September 30, 2022 | | September 30, 2021 |
| ASSETS | | |
| Assets: | | | | |
| Investments – Non-control/Non-affiliate, at fair value (cost September 30, 2022: $577,383,482; cost September 30, 2021: $568,303,425) | | $ | 559,313,056 | | | $ | 575,429,432 | |
| Cash and cash equivalents | | 15,610,925 | | | 19,255,047 | |
| Restricted cash | | 3,794,868 | | | 4,317,968 | |
| Interest receivable | | 7,586,938 | | | 3,196,194 | |
| Receivables from unsettled transactions | | 2,713,570 | | | 11,349,581 | |
| Deferred financing costs | | 1,215,354 | | | 1,915,573 | |
| Derivative asset at fair value | | 1,746,307 | | | 618,004 | |
| Due from portfolio companies | | 5,242,361 | | | — | |
| Other assets | | 415,725 | | | 364,450 | |
| Total assets | | $ | 597,639,104 | | | $ | 616,446,249 | |
| LIABILITIES AND NET ASSETS | | |
| Liabilities: | | | | |
| Accounts payable, accrued expenses and other liabilities | | $ | 792,148 | | | $ | 482,680 | |
| Base management fee and incentive fees payable | | 3,272,662 | | | 6,433,876 | |
| Due to affiliates | | 920,645 | | | 1,055,391 | |
| Interest payable | | 2,122,904 | | | 884,294 | |
| Payables from unsettled transactions | | 11,566,934 | | | — | |
| Deferred tax liability | | 41,149 | | | 117,374 | |
| Secured borrowings | | — | | | 9,969,425 | |
| Credit facilities payable | | 257,000,000 | | | 251,000,000 | |
| Total liabilities | | 275,716,442 | | | 269,943,040 | |
| Commitments and contingencies (Note 11) | | | | |
| Net assets: | | | | |
| Common stock, $0.001 par value per share, 250,000,000 shares authorized; 17,401,121 shares issued and outstanding at September 30, 2022 and September 30, 2021 | | 17,401 | | | 17,401 | |
| Preferred stock, $0.001 par value per share, 100,000,000 shares authorized; none issued and outstanding at September 30, 2022 and September 30, 2021 | | — | | | — | |
| Additional paid-in-capital | | 337,337,998 | | | 337,337,998 | |
| Accumulated distributable earnings (loss) | | (15,432,737) | | | 9,147,810 | |
| Total net assets (equivalent to $18.50 and $19.91 per common share at September 30, 2022 and September 30, 2021, respectively) (Note 10) | | 321,922,662 | | | 346,503,209 | |
| Total liabilities and net assets | | $ | 597,639,104 | | | $ | 616,446,249 | |
See notes to Consolidated Financial Statements.
Oaktree Strategic Income II, Inc.
Consolidated Statements of Operations
| | | | | | | | | | | | | | | | | | | | |
| | Year ended September 30, 2022 | | Year ended September 30, 2021 | | Year ended September 30, 2020 |
| Interest income: | | | | | | |
| Non-control/Non-affiliate investments | | $ | 50,511,684 | | | $ | 40,765,646 | | | $ | 28,836,321 | |
| Interest on cash and cash equivalents | | 44,966 | | | (211) | | | 53,486 | |
| Total interest income | | 50,556,650 | | | 40,765,435 | | | 28,889,807 | |
| PIK interest income: | | | | | | |
| Non-control/Non-affiliate investments | | 4,233,285 | | | 4,150,838 | | | 1,628,775 | |
| Total PIK interest income | | 4,233,285 | | | 4,150,838 | | | 1,628,775 | |
| Fee income: | | | | | | |
Non-control/Non-affiliate investments | | 1,600,512 | | | 4,155,818 | | | 2,315,769 | |
| Total fee income | | 1,600,512 | | | 4,155,818 | | | 2,315,769 | |
| Dividend income: | | | | | | |
Non-control/Non-affiliate investments | | 24,712 | | | — | | | — | |
| Total dividend income | | 24,712 | | | — | | | — | |
| Total investment income | | 56,415,159 | | | 49,072,091 | | | 32,834,351 | |
| Expenses: | | | | | | |
| Base management fee | | 5,656,120 | | | 5,277,116 | | | 3,689,499 | |
| Investment income incentive fee | | 7,723,049 | | | 7,155,662 | | | 3,955,710 | |
| Capital gains incentive fee | | (1,988,557) | | | 2,029,815 | | | 1,027,505 | |
| Professional fees | | 1,694,986 | | | 1,031,144 | | | 873,795 | |
| Director fees | | 155,000 | | | 155,000 | | | 155,137 | |
| Interest expense | | 8,998,725 | | | 5,496,972 | | | 4,644,696 | |
| Administrator expense | | 462,867 | | | 418,580 | | | 470,898 | |
| General and administrative expenses | | 832,207 | | | 914,971 | | | 847,031 | |
| Total expenses | | 23,534,397 | | | 22,479,260 | | | 15,664,271 | |
| Net investment income | | 32,880,762 | | | 26,592,831 | | | 17,170,080 | |
| Unrealized appreciation (depreciation): | | | | | | |
| Non-control/Non-affiliate investments | | (25,267,856) | | | 6,014,967 | | | (714,223) | |
| Foreign currency forward contracts | | 1,128,303 | | | 1,265,893 | | | (725,448) | |
| Net unrealized appreciation (depreciation) | | (24,139,553) | | | 7,280,860 | | | (1,439,671) | |
| Realized gains (losses): | | | | | | |
| Non-control/Non-affiliate investments | | (1,222,787) | | | 3,915,365 | | | 6,405,079 | |
| Foreign currency forward contracts | | 4,545,862 | | | (923,123) | | | 165,752 | |
| Net realized gains (losses) | | 3,323,075 | | | 2,992,242 | | | 6,570,831 | |
| Provision for income tax (expense) benefit | | 71,534 | | | (126,088) | | | 6,367 | |
| Net realized and unrealized gains (losses), net of taxes | | (20,744,944) | | | 10,147,014 | | | 5,137,527 | |
| Net increase (decrease) in net assets resulting from operations | | $ | 12,135,818 | | | $ | 36,739,845 | | | $ | 22,307,607 | |
| Net investment income per common share — basic and diluted | | $ | 1.89 | | | $ | 1.53 | | | $ | 1.38 | |
| Earnings (loss) per common share — basic and diluted (Note 5) | | $ | 0.70 | | | $ | 2.11 | | | $ | 1.80 | |
| Weighted average common shares outstanding — basic and diluted | | 17,401,121 | | | 17,401,121 | | | 12,422,418 | |
| | | | | | |
See notes to Consolidated Financial Statements.
Oaktree Strategic Income II, Inc.
Consolidated Statements of Changes in Net Assets
| | | | | | | | | | | | | | | | | | | | |
| | Year ended September 30, 2022 | | Year ended September 30, 2021 | | Year ended September 30, 2020 |
| Operations: | | | | | | |
| Net investment income | | $ | 32,880,762 | | | $ | 26,592,831 | | | $ | 17,170,080 | |
| Net unrealized appreciation (depreciation) | | (24,139,553) | | | 7,280,860 | | | (1,439,671) | |
| Net realized gains (losses) | | 3,323,075 | | | 2,992,242 | | | 6,570,831 | |
| Provision for income tax (expense) benefit | | 71,534 | | | (126,088) | | | 6,367 | |
| Net increase (decrease) in net assets resulting from operations | | 12,135,818 | | | 36,739,845 | | | 22,307,607 | |
| Capital share transactions: | | | | | | |
| Distributions to stockholders | | (36,716,365) | | | (37,238,403) | | | (15,649,588) | |
| Issuance of common stock | | — | | | — | | | 168,716,998 | |
| Net increase (decrease) in net assets from capital share transactions | | (36,716,365) | | | (37,238,403) | | | 153,067,410 | |
| Total increase (decrease) in net assets | | (24,580,547) | | | (498,558) | | | 175,375,017 | |
| Net assets at beginning of period | | 346,503,209 | | | 347,001,767 | | | 171,626,750 | |
| Net assets at end of period | | $ | 321,922,662 | | | $ | 346,503,209 | | | $ | 347,001,767 | |
| Net asset value per common share | | $ | 18.50 | | | $ | 19.91 | | | $ | 19.94 | |
| Common shares outstanding at end of period | | 17,401,121 | | | 17,401,121 | | | 17,401,121 | |
See notes to Consolidated Financial Statements.
Oaktree Strategic Income II, Inc.
Consolidated Statements of Cash Flows
| | | | | | | | | | | | | | | | | | | | |
| | Year ended September 30, 2022 | | Year ended September 30, 2021 | | Year ended September 30, 2020 |
| Operating activities: | | | | | | |
| Net increase (decrease) in net assets resulting from operations | | $ | 12,135,818 | | | $ | 36,739,845 | | | $ | 22,307,607 | |
| Adjustments to reconcile net increase (decrease) in net assets resulting from operations to net cash provided by (used in) operating activities: | | | | | | |
| Net unrealized (appreciation) depreciation | | 24,139,553 | | | (7,280,860) | | | 1,439,671 | |
| Net realized (gains) losses | | (3,323,075) | | | (2,992,242) | | | (6,570,831) | |
| PIK interest income | | (4,233,285) | | | (4,150,838) | | | (1,628,775) | |
| Accretion of original issue discount on investments | | (5,029,852) | | | (4,913,067) | | | (3,367,010) | |
| Amortization of deferred financing costs | | 700,219 | | | 633,019 | | | 601,757 | |
| Deferred taxes | | (76,225) | | | 113,535 | | | 3,839 | |
| Purchases of investments | | (159,170,135) | | | (371,570,973) | | | (361,650,887) | |
| Proceeds from sales and repayments of investments | | 163,351,349 | | | 244,149,229 | | | 233,910,031 | |
| Changes in operating assets and liabilities: | | | | | | |
| (Increase) decrease in interest receivable | | (4,794,179) | | | (1,389,264) | | | (479,735) | |
| (Increase) decrease in receivables from unsettled transactions | | 8,636,011 | | | (10,236,214) | | | 4,213,068 | |
| (Increase) decrease in due from portfolio companies | | (5,242,361) | | | — | | | — | |
| (Increase) decrease in other assets | | (51,275) | | | 140,397 | | | (122,120) | |
| Increase (decrease) in accounts payable, accrued expenses and other liabilities | | 309,468 | | | (362,669) | | | (569,717) | |
| Increase (decrease) in base management fee and incentive fees payable | | (3,161,214) | | | 1,965,002 | | | 3,340,216 | |
| Increase (decrease) in due to affiliates | | (134,746) | | | 485,257 | | | (183,531) | |
| Increase (decrease) in interest payable | | 1,238,610 | | | 302,532 | | | (484,141) | |
| Increase (decrease) in payables from unsettled transactions | | 11,566,934 | | | (6,594,355) | | | (45,780,577) | |
| Net cash provided by (used in) operating activities | | 36,861,615 | | | (124,961,666) | | | (155,021,135) | |
| Financing activities: | | | | | | |
| Distributions paid in cash | | (36,716,365) | | | (37,238,403) | | | (15,649,588) | |
| Borrowings under the credit facilities | | 66,000,000 | | | 161,000,000 | | | 169,000,000 | |
| Repayments of borrowings under the credit facilities | | (60,000,000) | | | (15,000,000) | | | (147,000,000) | |
| Proceeds from secured borrowings | | 15,771,906 | | | 19,969,425 | | | — | |
| Repayments of secured borrowings | | (25,741,331) | | | (10,000,000) | | | — | |
| Proceeds from the issuance of common stock | | — | | | — | | | 169,064,498 | |
| Deferred financing costs paid | | — | | | (805,202) | | | (614,927) | |
| Net cash provided by (used in) financing activities | | (40,685,790) | | | 117,925,820 | | | 174,799,983 | |
| Effect of exchange rate changes on foreign currency | | (343,047) | | | (407,225) | | | (110,888) | |
| Net increase (decrease) in cash and cash equivalents and restricted cash | | (4,167,222) | | | (7,443,071) | | | 19,667,960 | |
| Cash and cash equivalents and restricted cash, beginning of period | | 23,573,015 | | | 31,016,086 | | | 11,348,126 | |
| Cash and cash equivalents and restricted cash, end of period | | $ | 19,405,793 | | | $ | 23,573,015 | | | $ | 31,016,086 | |
| Supplemental information: | | | | | | |
| Cash paid for interest | | $ | 7,059,896 | | | $ | 4,561,421 | | | $ | 4,527,080 | |
| Non-cash financing activities: | | | | | | |
| Accrued deferred financing costs | | $ | — | | | $ | 73,487 | | | $ | (342,000) | |
| | | | | | |
| Reconciliation to the Consolidated Statement of Assets and Liabilities | | September 30, 2022 | | September 30, 2021 | | September 30, 2020 |
| Cash and cash equivalents | | $ | 15,610,925 | | | $ | 19,255,047 | | | $ | 28,742,283 | |
| Restricted cash | | 3,794,868 | | | 4,317,968 | | | 2,273,803 | |
| Total cash and cash equivalents and restricted cash | | $ | 19,405,793 | | | $ | 23,573,015 | | | $ | 31,016,086 | |
See notes to Consolidated Financial Statements.
Oaktree Strategic Income II, Inc.
Consolidated Schedule of Investments
September 30, 2022
| | | | | | | | | | | | | | | | | | | | | | | | | | | | | | | | | | | | | | |
| Portfolio Company/Type of Investment (1)(2)(3)(4) | | Cash Interest Rate (5) | | Industry | | Principal (6) | | Cost | | Fair Value | | Notes |
| Non-Control/Non-Affiliate Investments | | | | | | | | | | | | (7) |
| 109 Montgomery Owner LLC | | | | Real Estate Operating Companies | | | | | | | | |
| First Lien Term Loan, LIBOR+7.00% cash due 2/2/2023 | | 9.80 | % | | | | $ | 94,081 | | | $ | 93,655 | | | $ | 175,837 | | | (5)(8) |
| First Lien Delayed Draw Term Loan, LIBOR+7.00% cash due 2/2/2023 | | | | | | — | | | (15,031) | | | — | | | (5)(8)(9) |
| | | | | | | | 78,624 | | | 175,837 | | | |
| A.T. Holdings II SÀRL | | | | Biotechnology | | | | | | | | |
| First Lien Term Loan, 10.50% PIK due 12/22/2022 | | | | | | 11,722,027 | | | 11,709,457 | | | 12,030,316 | | | (8)(10) |
| | | | | | | | 11,709,457 | | | 12,030,316 | | | |
| Accupac, Inc. | | | | Personal Products | | | | | | | | |
| First Lien Term Loan, SOFR+5.50% cash due 1/16/2026 | | 9.12 | % | | | | 4,467,777 | | | 4,424,848 | | | 4,458,842 | | | (5)(8) |
| First Lien Delayed Draw Term Loan, SOFR+5.50% cash due 1/16/2026 | | | | | | — | | | — | | | (1,713) | | | (5)(8)(9) |
| First Lien Revolver, SOFR+5.50% cash due 1/16/2026 | | 9.14 | % | | | | 139,694 | | | 134,207 | | | 138,552 | | | (5)(8)(9) |
| | | | | | | | 4,559,055 | | | 4,595,681 | | | |
| Acquia Inc. | | | | Application Software | | | | | | | | |
| First Lien Term Loan, LIBOR+7.00% cash due 10/31/2025 | | 9.63 | % | | | | 4,381,994 | | | 4,336,874 | | | 4,351,320 | | | (5)(8) |
| First Lien Revolver, LIBOR+7.00% cash due 10/31/2025 | | 10.64 | % | | | | 191,189 | | | 186,237 | | | 187,909 | | | (5)(8)(9) |
| | | | | | | | 4,523,111 | | | 4,539,229 | | | |
| ADB Companies, LLC | | | | Construction & Engineering | | | | | | | | |
| First Lien Term Loan, SOFR+6.25% cash due 12/18/2025 | | 9.80 | % | | | | 8,274,679 | | | 8,147,431 | | | 8,131,527 | | | (5)(8) |
| | | | | | | | 8,147,431 | | | 8,131,527 | | | |
| AI Sirona (Luxembourg) Acquisition S.a.r.l. | | | | Pharmaceuticals | | | | | | | | |
| Second Lien Term Loan, EURIBOR+7.25% cash due 9/28/2026 | | 7.94 | % | | | | € | 5,147,000 | | | 5,646,006 | | | 4,588,455 | | | (5)(8)(10) |
| | | | | | | | 5,646,006 | | | 4,588,455 | | | |
| AIP RD Buyer Corp. | | | | Distributors | | | | | | | | |
| Second Lien Term Loan, SOFR+7.75% cash due 12/23/2029 | | 10.88 | % | | | | $ | 3,459,000 | | | 3,396,501 | | | 3,337,935 | | | (5)(8) |
| 3,460 Common Units in RD Holding LP | | | | | | | | 324,727 | | | 310,016 | | | (8) |
| | | | | | | | 3,721,228 | | | 3,647,951 | | | |
| Alvogen Pharma US, Inc. | | | | Pharmaceuticals | | | | | | | | |
| First Lien Term Loan, SOFR+7.50% cash due 6/30/2025 | | 11.20 | % | | | | 4,828,476 | | | 4,665,078 | | | 4,804,333 | | | (5)(8) |
| | | | | | | | 4,665,078 | | | 4,804,333 | | | |
| Alvotech Holdings S.A. | | | | Biotechnology | | | | | | | | |
| Tranche A Fixed Rate Bond 10.00% cash due 6/24/2025 | | | | | | 3,565,356 | | | 3,519,456 | | | 3,547,529 | | | (8)(10) |
| Tranche B Fixed Rate Bond 10.00% cash due 6/24/2025 | | | | | | 3,336,873 | | | 3,300,141 | | | 3,320,189 | | | (8)(10) |
| 79,437 Common Shares in Alvotech SA | | | | | | | | 717,277 | | | 536,994 | | | (10)(11) |
| 16,860 Seller Earn Out Shares in Alvotech SA | | | | | | | | 65,531 | | | 28,578 | | | (8)(10)(11) |
| | | | | | | | 7,602,405 | | | 7,433,290 | | | |
| American Auto Auction Group, LLC | | | | Consumer Finance | | | | | | | | |
| Second Lien Term Loan, SOFR+8.75% cash due 1/2/2029 | | 12.30 | % | | | | 2,288,000 | | | 2,246,458 | | | 2,059,200 | | | (5)(8) |
| | | | | | | | 2,246,458 | | | 2,059,200 | | | |
| American Tire Distributors, Inc. | | | | Distributors | | | | | | | | |
| First Lien Term Loan, LIBOR+6.25% cash due 10/20/2028 | | 9.03 | % | | | | 5,978,955 | | | 5,904,218 | | | 5,614,896 | | | (5) |
| | | | | | | | 5,904,218 | | | 5,614,896 | | | |
| Amplify Finco Pty Ltd. | | | | Movies & Entertainment | | | | | | | | |
| First Lien Term Loan, LIBOR+4.25% cash due 11/26/2026 | | 7.92 | % | | | | 7,995,000 | | | 7,766,545 | | | 7,715,175 | | | (5)(8)(10) |
| | | | | | | | 7,766,545 | | | 7,715,175 | | | |
| Anastasia Parent, LLC | | | | Personal Products | | | | | | | | |
| First Lien Term Loan, LIBOR+3.75% cash due 8/11/2025 | | 7.42 | % | | | | 1,002,841 | | | 789,549 | | | 802,378 | | | (5) |
| | | | | | | | 789,549 | | | 802,378 | | | |
Oaktree Strategic Income II, Inc.
Consolidated Schedule of Investments
September 30, 2022
| | | | | | | | | | | | | | | | | | | | | | | | | | | | | | | | | | | | | | |
| Portfolio Company/Type of Investment (1)(2)(3)(4) | | Cash Interest Rate (5) | | Industry | | Principal (6) | | Cost | | Fair Value | | Notes |
| Ankura Consulting Group LLC | | | | Research & Consulting Services | | | | | | | | |
| Second Lien Term Loan, LIBOR+8.00% cash due 3/19/2029 | | 10.78 | % | | | | $ | 1,395,813 | | | $ | 1,374,876 | | | $ | 1,224,826 | | | (5)(8) |
| | | | | | | | 1,374,876 | | | 1,224,826 | | | |
| Apptio, Inc. | | | | Application Software | | | | | | | | |
| First Lien Term Loan, LIBOR+6.00% cash due 1/10/2025 | | 8.46 | % | | | | 7,129,297 | | | 7,074,346 | | | 6,980,294 | | | (5)(8) |
| First Lien Revolver, LIBOR+6.00% cash due 1/10/2025 | | 8.46 | % | | | | 184,615 | | | 181,112 | | | 174,969 | | | (5)(8)(9) |
| | | | | | | | 7,255,458 | | | 7,155,263 | | | |
| Ardonagh Midco 3 PLC | | | | Insurance Brokers | | | | | | | | |
| First Lien Term Loan, EURIBOR+7.00% cash due 7/14/2026 | | 8.00 | % | | | | € | 1,052,732 | | | 1,177,266 | | | 1,032,443 | | | (5)(8)(10) |
| First Lien Term Loan, SONIA+7.00% cash due 7/14/2026 | | 9.19 | % | | | | £ | 9,987,149 | | | 12,505,731 | | | 11,160,918 | | | (5)(8)(10) |
| | | | | | | | 13,682,997 | | | 12,193,361 | | | |
| ASP-R-PAC Acquisition Co LLC | | | | Paper Packaging | | | | | | | | |
| First Lien Term Loan, LIBOR+6.00% cash due 12/29/2027 | | 9.67 | % | | | | $ | 3,309,413 | | | 3,251,562 | | | 3,233,296 | | | (5)(8)(10) |
| First Lien Revolver, LIBOR+6.00% cash due 12/29/2027 | | | | | | — | | | (6,922) | | | (9,107) | | | (5)(8)(9)(10) |
| | | | | | | | 3,244,640 | | | 3,224,189 | | | |
| Assembled Brands Capital LLC | | | | Specialized Finance | | | | | | | | |
| First Lien Revolver, LIBOR+6.75% cash due 10/17/2023 | | 10.42 | % | | | | 2,650,081 | | | 2,650,081 | | | 2,621,407 | | | (5)(8)(9) |
| 174,131 Class A Units | | | | | | | | 82,713 | | | 40,050 | | | (8) |
| 100,285 Preferred Units, 6% | | | | | | | | 110,285 | | | 132,341 | | | (8) |
| 7,621 Class A Warrants (exercise price $3.3778) expiration date 9/9/2029 | | | | | | | | — | | | — | | | (8) |
| | | | | | | | 2,843,079 | | | 2,793,798 | | | |
| Associated Asphalt Partners, LLC | | | | Construction Materials | | | | | | | | |
| First Lien Term Loan, LIBOR+5.25% cash due 4/5/2024 | | 8.06 | % | | | | 902,217 | | | 840,786 | | | 697,527 | | | (5) |
| | | | | | | | 840,786 | | | 697,527 | | | |
| Astra Acquisition Corp. | | | | Application Software | | | | | | | | |
| First Lien Term Loan, LIBOR+5.25% cash due 10/25/2028 | | 8.37 | % | | | | 2,849,690 | | | 2,779,005 | | | 2,436,485 | | | (5) |
| | | | | | | | 2,779,005 | | | 2,436,485 | | | |
| Asurion, LLC | | | | Property & Casualty Insurance | | | | | | | | |
| First Lien Term Loan, SOFR+4.00% cash due 8/19/2028 | | 7.65 | % | | | | 3,000,000 | | | 2,852,065 | | | 2,566,875 | | | (5) |
| | | | | | | | 2,852,065 | | | 2,566,875 | | | |
| athenahealth Group Inc. | | | | Health Care Technology | | | | | | | | |
| 2,888 Shares of Series A Preferred Stock in Minerva Holdco, Inc., 10.75% | | | | | | | | 2,830,529 | | | 2,568,732 | | | (8) |
| | | | | | | | 2,830,529 | | | 2,568,732 | | | |
| Athenex, Inc. | | | | Pharmaceuticals | | | | | | | | |
| First Lien Term Loan, 11.00% cash due 6/19/2026 | | | | | | 3,953,346 | | | 3,851,325 | | | 3,795,211 | | | (8)(10) |
| First Lien Revenue Interest Financing Term Loan due 5/31/2031 | | | | | | 2,461,367 | | | 2,448,064 | | | 2,461,367 | | | (8)(10) |
| 97,205 Common Stock Warrants (exercise price $0.4955) expiration date 6/19/2027 | | | | | | | | 334,386 | | | 4,860 | | | (8)(10) |
| | | | | | | | 6,633,775 | | | 6,261,438 | | | |
| Aurora Lux Finco S.À.R.L. | | | | Airport Services | | | | | | | | |
| First Lien Term Loan, LIBOR+6.00% cash due 12/24/2026 | | 8.78 | % | | | | 7,312,500 | | | 7,202,040 | | | 6,954,188 | | | (5)(8)(10) |
| | | | | | | | 7,202,040 | | | 6,954,188 | | | |
| The Avery | | | | Real Estate Operating Companies | | | | | | | | |
| First Lien Term Loan in T8 Urban Condo Owner, LLC, LIBOR+7.30% cash due 2/17/2023 | | 10.44 | % | | | | 3,956,109 | | | 3,948,370 | | | 3,958,130 | | | (5)(8) |
| Subordinated Debt in T8 Senior Mezz LLC, LIBOR+12.50% cash due 2/17/2023 | | 16.17 | % | | | | 956,410 | | | 954,672 | | | 958,979 | | | (5)(8) |
| | | | | | | | 4,903,042 | | | 4,917,109 | | | |
Oaktree Strategic Income II, Inc.
Consolidated Schedule of Investments
September 30, 2022
| | | | | | | | | | | | | | | | | | | | | | | | | | | | | | | | | | | | | | |
| Portfolio Company/Type of Investment (1)(2)(3)(4) | | Cash Interest Rate (5) | | Industry | | Principal (6) | | Cost | | Fair Value | | Notes |
| | | | | | | | | | | | |
| BAART Programs, Inc. | | | | Health Care Services | | | | | | | | |
| First Lien Term Loan, LIBOR+5.00% cash due 6/11/2027 | | 8.12 | % | | | | $ | 1,274,100 | | | $ | 1,262,250 | | | $ | 1,229,507 | | | (5)(8) |
| First Lien Delayed Draw Term Loan, LIBOR+5.00% cash due 6/11/2027 | | 8.12 | % | | | | 733,414 | | | 723,029 | | | 689,739 | | | (5)(8)(9) |
| Second Lien Term Loan, LIBOR+8.50% cash due 6/11/2028 | | 11.62 | % | | | | 1,754,000 | | | 1,727,690 | | | 1,692,610 | | | (5)(8) |
| Second Lien Delayed Draw Term Loan, LIBOR+8.50% cash due 6/11/2028 | | 11.62 | % | | | | 1,020,426 | | | 982,579 | | | 926,766 | | | (5)(8)(9) |
| | | | | | | | 4,695,548 | | | 4,538,622 | | | |
| Berner Food & Beverage, LLC | | | | Soft Drinks | | | | | | | | |
| First Lien Term Loan, LIBOR+5.50% cash due 7/30/2027 | | 8.31 | % | | | | 7,997,254 | | | 7,884,640 | | | 7,749,339 | | | (5)(8) |
| First Lien Revolver, PRIME+4.50% cash due 7/30/2026 | | 10.75 | % | | | | 411,381 | | | 401,360 | | | 390,962 | | | (5)(8)(9) |
| | | | | | | | 8,286,000 | | | 8,140,301 | | | |
| BioXcel Therapeutics, Inc. | | | | Pharmaceuticals | | | | | | | | |
| First Lien Term Loan, 10.25% cash due 4/19/2027 | | | | | | 1,245,098 | | | 1,195,570 | | | 1,196,290 | | | (8)(10) |
| First Lien Delayed Draw Term Loan, 10.25% cash due 4/19/2027 | | | | | | — | | | — | | | — | | | (8)(9)(10) |
| First Lien Revenue Interest Financing Term Loan due 9/30/2032 | | | | | | 550,497 | | | 550,497 | | | 550,497 | | | (8)(10) |
| First Lien Revenue Interest Financing Delayed Draw Term Loan due 9/30/2032 | | | | | | — | | | — | | | — | | | (8)(9)(10) |
| 4,954 Common Stock Warrants (exercise price $20.04) expiration date 4/19/2029 | | | | | | — | | | 29,278 | | | 22,937 | | | (8)(10) |
| | | | | | | | 1,775,345 | | | 1,769,724 | | | |
| Blumenthal Temecula, LLC | | | | Automotive Retail | | | | | | | | |
| First Lien Term Loan, 9.00% cash due 9/24/2023 | | | | | | 1,277,827 | | | 1,277,827 | | | 1,271,438 | | | (8) |
| 415,294 Preferred Units in Unstoppable Automotive AMV, LLC | | | | | | | | 415,294 | | | 411,141 | | | (8) |
| 95,837 Preferred Units in Unstoppable Automotive VMV, LLC | | | | | | | | 95,837 | | | 94,879 | | | (8) |
| 95,837 Common Units in Unstoppable Automotive AMV, LLC | | | | | | | | 95,837 | | | 112,129 | | | (8) |
| | | | | | | | 1,884,795 | | | 1,889,587 | | | |
| Cadence Aerospace, LLC | | | | Aerospace & Defense | | | | | | | | |
| First Lien Term Loan, LIBOR+6.50% cash 2.00% PIK due 11/14/2023 | | 9.31 | % | | | | 3,189,380 | | | 3,159,915 | | | 2,932,635 | | | (5)(8) |
| | | | | | | | 3,159,915 | | | 2,932,635 | | | |
| CCO Holdings LLC | | | | Cable & Satellite | | | | | | | | |
| Fixed Rate Bond, 4.50% cash due 5/1/2032 | | | | | | 400,000 | | | 335,837 | | | 305,784 | | | (10) |
| | | | | | | | 335,837 | | | 305,784 | | | |
| CITGO Petroleum Corp. | | | | Oil & Gas Refining & Marketing | | | | | | | | |
| First Lien Term Loan, LIBOR+6.25% cash due 3/28/2024 | | 9.37 | % | | | | 2,026,330 | | | 2,006,067 | | | 2,031,903 | | | (5) |
| | | | | | | | 2,006,067 | | | 2,031,903 | | | |
| Clear Channel Outdoor Holdings, Inc. | | | | Advertising | | | | | | | | |
| Fixed Rate Bond, 5.125% cash due 8/15/2027 | | | | | | 250,000 | | | 219,382 | | | 211,594 | | | (10) |
| | | | | | | | 219,382 | | | 211,594 | | | |
| Continental Intermodal Group LP | | | | Oil & Gas Storage & Transportation | | | | | | | | |
| First Lien Term Loan, LIBOR+8.50% cash due 1/28/2025 | | 11.62 | % | | | | 5,740,538 | | | 5,740,538 | | | 5,195,186 | | | (5)(8) |
| Common Stock Warrants expiration date 7/28/2025 | | | | | | | | — | | | 116,433 | | | (8) |
| | | | | | | | 5,740,538 | | | 5,311,619 | | | |
| Convergeone Holdings, Inc. | | | | IT Consulting & Other Services | | | | | | | | |
| First Lien Term Loan, LIBOR+5.00% cash due 1/4/2026 | | 8.12 | % | | | | 5,730,160 | | | 5,620,175 | | | 4,134,683 | | | (5) |
| | | | | | | | 5,620,175 | | | 4,134,683 | | | |
Oaktree Strategic Income II, Inc.
Consolidated Schedule of Investments
September 30, 2022
| | | | | | | | | | | | | | | | | | | | | | | | | | | | | | | | | | | | | | |
| Portfolio Company/Type of Investment (1)(2)(3)(4) | | Cash Interest Rate (5) | | Industry | | Principal (6) | | Cost | | Fair Value | | Notes |
| CorEvitas, LLC | | | | Health Care Technology | | | | | | | | |
| First Lien Term Loan, SOFR+5.75% cash due 12/13/2025 | | 8.88 | % | | | | $ | 5,006,153 | | | $ | 4,950,930 | | | $ | 4,959,094 | | | (5)(8) |
| First Lien Revolver, PRIME+4.75% cash due 12/13/2025 | | 11.00 | % | | | | 334,500 | | | 328,256 | | | 328,211 | | | (5)(8)(9) |
| 401 Class A2 Common Units in CorEvitas Group Holdings, L.P. | | | | | | | | 251,644 | | | 853,633 | | | (8) |
| | | | | | | | 5,530,830 | | | 6,140,938 | | | |
| Covetrus, Inc. | | | | Health Care Distributors | | | | | | | | |
| First Lien Term Loan, SOFR+5.00% cash due 9/20/2029 | | 7.65 | % | | | | 4,488,000 | | | 4,218,720 | | | 4,203,775 | | | (5) |
| | | | | | | | 4,218,720 | | | 4,203,775 | | | |
| CPC Acquisition Corp. | | | | Specialty Chemicals | | | | | | | | |
| Second Lien Term Loan, LIBOR+7.75% cash due 12/29/2028 | | 11.42 | % | | | | 727,000 | | | 716,095 | | | 565,243 | | | (5)(8) |
| | | | | | | | 716,095 | | | 565,243 | | | |
| Dialyze Holdings, LLC | | | | Health Care Equipment | | | | | | | | |
| First Lien Term Loan, LIBOR+9.00% cash 2.00% PIK due 8/4/2026 | | 12.67 | % | | | | 4,484,884 | | | 4,243,385 | | | 4,227,003 | | | (5)(8) |
| First Lien Delayed Draw Term Loan, LIBOR+9.00% cash 2.00% PIK due 8/4/2026 | | | | | | — | | | (24,807) | | | (23,653) | | | (5)(8)(9) |
| 993,431 Class A Warrants (exercise price $1.00) expiration date 8/4/2028 | | | | | | | | 258,292 | | | 238,423 | | | (8) |
| | | | | | | | 4,476,870 | | | 4,441,773 | | | |
| Digital.AI Software Holdings, Inc. | | | | Application Software | | | | | | | | |
| First Lien Term Loan, LIBOR+7.00% cash due 2/10/2027 | | 9.91 | % | | | | 2,611,203 | | | 2,554,248 | | | 2,582,480 | | | (5)(8) |
| First Lien Revolver, LIBOR+6.50% cash due 2/10/2027 | | 9.41 | % | | | | 66,274 | | | 60,079 | | | 63,150 | | | (5)(8)(9) |
| | | | | | | | 2,614,327 | | | 2,645,630 | | | |
| DirecTV Financing, LLC | | | | Cable & Satellite | | | | | | | | |
| First Lien Term Loan, LIBOR+5.00% cash due 8/2/2027 | | 8.12 | % | | | | 8,190,000 | | | 8,108,100 | | | 7,649,992 | | | (5) |
| | | | | | | | 8,108,100 | | | 7,649,992 | | | |
| FINThrive Software Intermediate Holdings, Inc. | | | | Health Care Technology | | | | | | | | |
| Second Lien Term Loan, LIBOR+6.75% cash due 12/17/2029 | | 9.87 | % | | | | 6,013,000 | | | 5,922,805 | | | 5,193,729 | | | (5) |
| | | | | | | | 5,922,805 | | | 5,193,729 | | | |
| Fortress Biotech, Inc. | | | | Biotechnology | | | | | | | | |
| First Lien Term Loan, 11.00% cash due 8/27/2025 | | | | | | 2,452,500 | | | 2,365,706 | | | 2,333,799 | | | (8)(10) |
| 85,811 Common Stock Warrants (exercise price $3.20) expiration date 8/27/2030 | | | | | | | | 90,960 | | | 17,162 | | | (8)(10) |
| | | | | | | | 2,456,666 | | | 2,350,961 | | | |
| Gibson Brands, Inc. | | | | Leisure Products | | | | | | | | |
| First Lien Term Loan, LIBOR+5.00% cash due 8/11/2028 | | 7.94 | % | | | | 2,481,250 | | | 2,461,400 | | | 2,009,813 | | | (5)(8) |
| | | | | | | | 2,461,400 | | | 2,009,813 | | | |
| Global Medical Response, Inc. | | | | Health Care Services | | | | | | | | |
| First Lien Term Loan, LIBOR+4.25% cash due 3/14/2025 | | 7.37 | % | | | | 1,056,733 | | | 1,047,030 | | | 919,432 | | | (5) |
| First Lien Term Loan, LIBOR+4.25% cash due 10/2/2025 | | 6.81 | % | | | | 3,707,268 | | | 3,661,418 | | | 3,232,737 | | | (5) |
| | | | | | | | 4,708,448 | | | 4,152,169 | | | |
| Grove Hotel Parcel Owner, LLC | | | | Hotels, Resorts & Cruise Lines | | | | | | | | |
| First Lien Term Loan, SOFR+8.00% cash due 6/21/2027 | | 11.04 | % | | | | 3,309,767 | | | 3,247,269 | | | 3,251,846 | | | (5)(8) |
| First Lien Delayed Draw Term Loan, SOFR+8.00% cash due 6/21/2027 | | | | | | — | | | (12,500) | | | (11,584) | | | (5)(8)(9) |
| First Lien Revolver, SOFR+8.00% cash due 6/21/2027 | | | | | | — | | | (6,250) | | | (5,792) | | | (5)(8)(9) |
| | | | | | | | 3,228,519 | | | 3,234,470 | | | |
| Harbor Purchaser Inc. | | | | Education Services | | | | | | | | |
| First Lien Term Loan, SOFR+5.25% cash due 4/9/2029 | | 8.38 | % | | | | 5,100,000 | | | 4,916,870 | | | 4,660,125 | | | (5) |
| | | | | | | | 4,916,870 | | | 4,660,125 | | | |
| iCIMs, Inc. | | | | Application Software | | | | | | | | |
| First Lien Term Loan, SOFR+6.75% cash due 8/18/2028 | | 9.49 | % | | | | 4,509,987 | | | 4,432,646 | | | 4,431,062 | | | (5)(8) |
| First Lien Delayed Draw Term Loan, SOFR+6.75% cash due 8/18/2028 | | | | | | — | | | — | | | — | | | (5)(8)(9) |
| First Lien Revolver, SOFR+6.75% cash due 8/18/2028 | | | | | | — | | | (7,366) | | | (7,517) | | | (5)(8)(9) |
| | | | | | | | 4,425,280 | | | 4,423,545 | | | |
Oaktree Strategic Income II, Inc.
Consolidated Schedule of Investments
September 30, 2022
| | | | | | | | | | | | | | | | | | | | | | | | | | | | | | | | | | | | | | |
| Portfolio Company/Type of Investment (1)(2)(3)(4) | | Cash Interest Rate (5) | | Industry | | Principal (6) | | Cost | | Fair Value | | Notes |
| Immucor, Inc. | | | | Health Care Supplies | | | | | | | | |
| First Lien Term Loan, LIBOR+5.75% cash due 7/2/2025 | | 9.42 | % | | | | $ | 2,318,955 | | | $ | 2,293,429 | | | $ | 2,275,127 | | | (5)(8) |
| Second Lien Term Loan, LIBOR+8.00% cash 3.50% PIK due 10/2/2025 | | 11.67 | % | | | | 6,121,119 | | | 6,056,442 | | | 6,028,078 | | | (5)(8) |
| | | | | | | | 8,349,871 | | | 8,303,205 | | | |
| Impel Neuropharma, Inc. | | | | Health Care Technology | | | | | | | | |
| First Lien Revenue Interest Financing Term Loan due 2/15/2031 | | | | | | 1,020,439 | | | 1,020,439 | | | 1,020,439 | | | (8) |
| First Lien Term Loan, SOFR+8.75% cash due 3/17/2027 | | 12.45 | % | | | | 948,500 | | | 931,587 | | | 931,427 | | | (5)(8) |
| | | | | | | | 1,952,026 | | | 1,951,866 | | | |
| Indivior Finance S.À.R.L. | | | | Pharmaceuticals | | | | | | | | |
| First Lien Term Loan, LIBOR+5.25% cash due 6/30/2026 | | 8.80 | % | | | | 1,975,000 | | | 1,944,812 | | | 1,942,906 | | | (5)(8)(10) |
| | | | | | | | 1,944,812 | | | 1,942,906 | | | |
| Innocoll Pharmaceuticals Limited | | | | Health Care Technology | | | | | | | | |
| First Lien Term Loan, 11.00% cash due 1/26/2027 | | | | | | 1,635,588 | | | 1,572,360 | | | 1,537,453 | | | (8)(10) |
| First Lien Delayed Draw Term Loan, 11.00% cash due 1/26/2027 | | | | | | — | | | — | | | — | | | (8)(9)(10) |
| 13,676 Tranche A Warrant Shares (exercise price $4.23) expiration date 1/26/2029 | | | | | | | | 32,275 | | | 146,052 | | | (8)(10) |
| | | | | | | | 1,604,635 | | | 1,683,505 | | | |
| Inventus Power, Inc. | | | | Electrical Components & Equipment | | | | | | | | |
| First Lien Term Loan, SOFR+5.00% cash due 3/29/2024 | | 8.55 | % | | | | 4,514,255 | | | 4,491,807 | | | 4,386,953 | | | (5)(8) |
| Second Lien Term Loan, LIBOR+8.50% cash due 9/29/2024 | | 12.17 | % | | | | 2,750,000 | | | 2,718,676 | | | 2,645,500 | | | (5)(8) |
| | | | | | | | 7,210,483 | | | 7,032,453 | | | |
| INW Manufacturing, LLC | | | | Personal Products | | | | | | | | |
| First Lien Term Loan, LIBOR+5.75% cash due 3/25/2027 | | 9.42 | % | | | | 11,400,000 | | | 11,137,811 | | | 10,089,000 | | | (5)(8) |
| | | | | | | | 11,137,811 | | | 10,089,000 | | | |
| IPC Corp. | | | | Application Software | | | | | | | | |
| First Lien Term Loan, LIBOR+6.50% cash due 10/1/2026 | | 9.44 | % | | | | 6,229,786 | | | 6,094,629 | | | 5,918,296 | | | (5)(8) |
| | | | | | | | 6,094,629 | | | 5,918,296 | | | |
| Ivanti Software, Inc. | | | | Application Software | | | | | | | | |
| Second Lien Term Loan, LIBOR+7.25% cash due 12/1/2028 | | 10.33 | % | | | | 3,692,000 | | | 3,673,540 | | | 2,775,147 | | | (5) |
| | | | | | | | 3,673,540 | | | 2,775,147 | | | |
| Jazz Acquisition, Inc. | | | | Aerospace & Defense | | | | | | | | |
| First Lien Term Loan, LIBOR+7.50% cash due 1/29/2027 | | 10.62 | % | | | | 9,413,380 | | | 9,199,296 | | | 9,454,308 | | | (5)(8) |
| Second Lien Term Loan, LIBOR+8.00% cash due 6/18/2027 | | 11.12 | % | | | | 137,300 | | | 124,121 | | | 125,086 | | | (5) |
| | | | | | | | 9,323,417 | | | 9,579,394 | | | |
| Kings Buyer, LLC | | | | Environmental & Facilities Services | | | | | | | | |
| First Lien Term Loan, LIBOR+6.50% cash due 10/29/2027 | | 10.17 | % | | | | 3,268,837 | | | 3,236,149 | | | 3,203,461 | | | (5)(8) |
| First Lien Revolver, LIBOR+6.50% cash due 10/29/2027 | | 10.17 | % | | | | 79,045 | | | 74,566 | | | 70,086 | | | (5)(8)(9) |
| | | | | | | | 3,310,715 | | | 3,273,547 | | | |
| LaserShip, Inc. | | | | Air Freight & Logistics | | | | | | | | |
| Second Lien Term Loan, LIBOR+7.50% cash due 5/7/2029 | | 10.38 | % | | | | 575,000 | | | 569,250 | | | 448,500 | | | (5)(8) |
| | | | | | | | 569,250 | | | 448,500 | | | |
| Lightbox Intermediate, L.P. | | | | Real Estate Services | | | | | | | | |
| First Lien Term Loan, LIBOR+5.00% cash due 5/9/2026 | | 8.67 | % | | | | 8,707,500 | | | 8,639,926 | | | 8,402,738 | | | (5)(8) |
| | | | | | | | 8,639,926 | | | 8,402,738 | | | |
| Liquid Environmental Solutions Corporation | | | | Environmental & Facilities Services | | | | | | | | |
| Second Lien Term Loan, LIBOR+8.50% cash due 11/30/2026 | | 11.38 | % | | | | 1,046,111 | | | 1,028,807 | | | 1,014,728 | | | (5)(8) |
| Second Lien Delayed Draw Term Loan, LIBOR+8.50% cash due 11/30/2026 | | 11.38 | % | | | | 569,085 | | | 557,703 | | | 543,978 | | | (5)(8)(9) |
| 108.233 Class A2 Units in LES Group Holdings, L.P. | | | | | | | | 108,233 | | | 108,233 | | | (8) |
| | | | | | | | 1,694,743 | | | 1,666,939 | | | |
Oaktree Strategic Income II, Inc.
Consolidated Schedule of Investments
September 30, 2022
| | | | | | | | | | | | | | | | | | | | | | | | | | | | | | | | | | | | | | |
| Portfolio Company/Type of Investment (1)(2)(3)(4) | | Cash Interest Rate (5) | | Industry | | Principal (6) | | Cost | | Fair Value | | Notes |
| LSL Holdco, LLC | | | | Health Care Distributors | | | | | | | | |
| First Lien Term Loan, LIBOR+6.00% cash due 1/31/2028 | | 9.12 | % | | | | $ | 4,615,633 | | | $ | 4,533,559 | | | $ | 4,488,703 | | | (5)(8) |
| First Lien Revolver, LIBOR+6.00% cash due 1/31/2028 | | 9.12 | % | | | | 410,278 | | | 401,159 | | | 396,175 | | | (5)(8)(9) |
| | | | | | | | 4,934,718 | | | 4,884,878 | | | |
| Marinus Pharmaceuticals, Inc. | | | | Pharmaceuticals | | | | | | | | |
| First Lien Term Loan, 11.50% cash due 5/11/2026 | | | | | | 4,216,200 | | | 4,155,335 | | | 4,079,173 | | | (8)(10) |
| First Lien Delayed Draw Term Loan, 11.50% cash due 5/11/2026 | | | | | | — | | | — | | | — | | | (8)(9)(10) |
| | | | | | | | 4,155,335 | | | 4,079,173 | | | |
| McAfee Corp. | | | | Systems Software | | | | | | | | |
| First Lien Term Loan, SOFR+3.75% cash due 3/1/2029 | | 6.36 | % | | | | 1,995,000 | | | 1,911,355 | | | 1,825,066 | | | (5) |
| | | | | | | | 1,911,355 | | | 1,825,066 | | | |
| Mesoblast, Inc. | | | | Biotechnology | | | | | | | | |
| First Lien Term Loan, 8.00% cash 1.75% PIK due 11/19/2026 | | | | | | 1,731,296 | | | 1,595,301 | | | 1,545,182 | | | (8)(10) |
| First Lien Delayed Draw Term Loan, 8.00% cash 1.75% PIK due 11/19/2026 | | | | | | — | | | 305 | | | — | | | (8)(9)(10) |
| 50,289 Warrant Shares (exercise price $7.26) expiration date 11/19/2028 | | | | | | | | 115,162 | | | 40,734 | | | (8)(10) |
| | | | | | | | 1,710,768 | | | 1,585,916 | | | |
| MHE Intermediate Holdings, LLC | | | | Diversified Support Services | | | | | | | | |
| First Lien Term Loan, SOFR+6.00% cash due 7/21/2027 | | 9.50 | % | | | | 4,597,560 | | | 4,524,325 | | | 4,422,854 | | | (5)(8) |
| First Lien Revolver, SOFR+6.00% cash due 7/21/2027 | | | | | | — | | | (5,718) | | | (13,571) | | | (5)(8)(9) |
| | | | | | | | 4,518,607 | | | 4,409,283 | | | |
| Mindbody, Inc. | | | | Internet Services & Infrastructure | | | | | | | | |
| First Lien Term Loan, LIBOR+7.00% cash 1.50% PIK due 2/14/2025 | | 10.64 | % | | | | 8,698,116 | | | 8,624,002 | | | 8,480,663 | | | (5)(8) |
| First Lien Revolver, LIBOR+8.00% cash due 2/14/2025 | | | | | | — | | | (6,030) | | | (19,048) | | | (5)(8)(9) |
| | | | | | | | 8,617,972 | | | 8,461,615 | | | |
| Mosaic Companies, LLC | | | | Home Improvement Retail | | | | | | | | |
| First Lien Term Loan, LIBOR+6.75% cash due 7/2/2026 | | 9.89 | % | | | | 11,377,594 | | | 11,206,868 | | | 11,113,634 | | | (5)(8) |
| | | | | | | | 11,206,868 | | | 11,113,634 | | | |
| MRI Software LLC | | | | Application Software | | | | | | | | |
| First Lien Term Loan, LIBOR+5.50% cash due 2/10/2026 | | 9.17 | % | | | | 7,190,460 | | | 7,145,127 | | | 6,988,228 | | | (5)(8) |
| First Lien Revolver, LIBOR+5.50% cash due 2/10/2026 | | | | | | — | | | (4,612) | | | (12,971) | | | (5)(8)(9) |
| | | | | | | | 7,140,515 | | | 6,975,257 | | | |
| Navisite, LLC | | | | Data Processing & Outsourced Services | | | | | | | | |
| Second Lien Term Loan, LIBOR+8.50% cash due 12/30/2026 | | 12.17 | % | | | | 7,779,000 | | | 7,668,866 | | | 7,421,943 | | | (5)(8) |
| | | | | | | | 7,668,866 | | | 7,421,943 | | | |
| NeuAG, LLC | | | | Fertilizers & Agricultural Chemicals | | | | | | | | |
| First Lien Term Loan, LIBOR+10.50% cash due 9/11/2024 | | 14.17 | % | | | | 14,382,723 | | | 14,140,390 | | | 14,814,205 | | | (5)(8) |
| | | | | | | | 14,140,390 | | | 14,814,205 | | | |
| NN, Inc. | | | | Industrial Machinery | | | | | | | | |
| First Lien Term Loan, LIBOR+6.88% cash due 9/19/2026 | | 9.99 | % | | | | 14,653,845 | | | 14,389,748 | | | 14,177,595 | | | (5)(8)(10) |
| | | | | | | | 14,389,748 | | | 14,177,595 | | | |
| OEConnection LLC | | | | Application Software | | | | | | | | |
| First Lien Term Loan, LIBOR+4.00% cash due 9/25/2026 | | 7.12 | % | | | | 6,263,545 | | | 6,234,855 | | | 6,044,321 | | | (5) |
| Second Lien Term Loan, LIBOR+7.00% cash due 9/25/2027 | | 10.05 | % | | | | 1,804,000 | | | 1,772,849 | | | 1,736,350 | | | (5)(8) |
| | | | | | | | 8,007,704 | | | 7,780,671 | | | |
| OTG Management, LLC | | | | Airport Services | | | | | | | | |
| First Lien Term Loan, LIBOR+2.00% cash 8.00% PIK due 9/1/2025 | | 5.08 | % | | | | 3,472,975 | | | 3,426,194 | | | 3,472,975 | | | (5)(8) |
| First Lien Delayed Draw Term Loan, LIBOR+2.00% cash 8.00% PIK due 9/1/2025 | | | | | | — | | | (4,455) | | | — | | | (5)(8)(9) |
| | | | | | | | 3,421,739 | | | 3,472,975 | | | |
Oaktree Strategic Income II, Inc.
Consolidated Schedule of Investments
September 30, 2022
| | | | | | | | | | | | | | | | | | | | | | | | | | | | | | | | | | | | | | |
| Portfolio Company/Type of Investment (1)(2)(3)(4) | | Cash Interest Rate (5) | | Industry | | Principal (6) | | Cost | | Fair Value | | Notes |
| Park Place Technologies, LLC | | | | Internet Services & Infrastructure | | | | | | | | |
| First Lien Term Loan, SOFR+5.00% cash due 11/10/2027 | | 8.13 | % | | | | $ | 4,925,000 | | | $ | 4,780,842 | | | $ | 4,686,975 | | | (5) |
| | | | | | | | 4,780,842 | | | 4,686,975 | | | |
| Performance Health Holdings, Inc. | | | | Health Care Distributors | | | | | | | | |
| First Lien Term Loan, LIBOR+6.00% cash due 7/12/2027 | | 8.88 | % | | | | 4,398,925 | | | 4,328,855 | | | 4,291,591 | | | (5)(8) |
| | | | | | | | 4,328,855 | | | 4,291,591 | | | |
| PFNY Holdings, LLC | | | | Leisure Facilities | | | | | | | | |
| First Lien Term Loan, LIBOR+7.00% cash due 12/31/2026 | | 9.28 | % | | | | 6,275,495 | | | 6,169,457 | | | 6,212,740 | | | (5)(8) |
| First Lien Delayed Draw Term Loan, LIBOR+7.00% cash due 12/31/2026 | | 9.25 | % | | | | 534,596 | | | 524,447 | | | 528,590 | | | (5)(8)(9) |
| First Lien Revolver, LIBOR+7.00% cash due 12/31/2026 | | | | | | — | | | (5,075) | | | (3,003) | | | (5)(8)(9) |
| | | | | | | | 6,688,829 | | | 6,738,327 | | | |
| Planview Parent, Inc. | | | | Application Software | | | | | | | | |
| Second Lien Term Loan, LIBOR+7.25% cash due 12/18/2028 | | 10.92 | % | | | | 9,872,000 | | | 9,723,920 | | | 9,477,120 | | | (5)(8) |
| | | | | | | | 9,723,920 | | | 9,477,120 | | | |
| Pluralsight, LLC | | | | Application Software | | | | | | | | |
| First Lien Term Loan, LIBOR+8.00% cash due 4/6/2027 | | 10.68 | % | | | | 15,361,250 | | | 15,128,211 | | | 14,877,371 | | | (5)(8) |
| First Lien Revolver, LIBOR+8.00% cash due 4/6/2027 | | | | | | — | | | (15,915) | | | (33,325) | | | (5)(8)(9) |
| | | | | | | | 15,112,296 | | | 14,844,046 | | | |
| PRGX Global, Inc. | | | | Data Processing & Outsourced Services | | | | | | | | |
| First Lien Term Loan, LIBOR+6.75% cash due 3/3/2026 | | 10.42 | % | | | | 8,173,682 | | | 8,061,864 | | | 8,014,295 | | | (5)(8) |
| First Lien Revolver, LIBOR+6.75% cash due 3/3/2026 | | | | | | — | | | (8,337) | | | (11,883) | | | (5)(8)(9) |
| 19,485 Class B Common Units | | | | | | | | 19,485 | | | 21,434 | | | (8) |
| | | | | | | | 8,073,012 | | | 8,023,846 | | | |
| Profrac Holdings II, LLC | | | | Industrial Machinery | | | | | | | | |
| First Lien Term Loan, SOFR+8.50% cash due 3/4/2025 | | 10.01 | % | | | | 5,445,012 | | | 5,315,852 | | | 5,336,112 | | | (5)(8) |
| | | | | | | | 5,315,852 | | | 5,336,112 | | | |
| Project Boost Purchaser, LLC | | | | Application Software | | | | | | | | |
| Second Lien Term Loan, LIBOR+8.00% cash due 5/31/2027 | | 11.12 | % | | | | 1,500,000 | | | 1,500,000 | | | 1,441,875 | | | (5)(8) |
| | | | | | | | 1,500,000 | | | 1,441,875 | | | |
| Quantum Bidco Limited | | | | Food Distributors | | | | | | | | |
| First Lien Term Loan, SONIA+6.00% cash due 1/29/2028 | | 8.39 | % | | | | £ | 1,125,000 | | | 1,493,034 | | | 1,081,854 | | | (5)(8)(10) |
| | | | | | | | 1,493,034 | | | 1,081,854 | | | |
| Radiology Partners, Inc. | | | | Health Care Distributors | | | | | | | | |
| First Lien Term Loan, LIBOR+4.25% cash due 7/9/2025 | | 7.33 | % | | | | $ | 2,100,000 | | | 1,977,241 | | | 1,778,700 | | | (5) |
| | | | | | | | 1,977,241 | | | 1,778,700 | | | |
| Relativity ODA LLC | | | | Application Software | | | | | | | | |
| First Lien Term Loan, LIBOR+7.50% PIK due 5/12/2027 | | | | | | 6,051,849 | | | 5,947,377 | | | 5,907,209 | | | (5)(8) |
| First Lien Revolver, LIBOR+6.50% cash due 5/12/2027 | | | | | | — | | | (10,447) | | | (15,604) | | | (5)(8)(9) |
| | | | | | | | 5,936,930 | | | 5,891,605 | | | |
| Renaissance Holding Corp. | | | | Diversified Banks | | | | | | | | |
| Second Lien Term Loan, LIBOR+7.00% cash due 5/29/2026 | | 10.12 | % | | | | 1,138,000 | | | 1,129,465 | | | 1,092,952 | | | (5) |
| | | | | | | | 1,129,465 | | | 1,092,952 | | | |
| RP Escrow Issuer LLC | | | | Health Care Distributors | | | | | | | | |
| Fixed Rate Bond, 5.25% cash due 12/15/2025 | | | | | | 306,000 | | | 281,345 | | | 253,288 | | | |
| | | | | | | | 281,345 | | | 253,288 | | | |
| RumbleOn, Inc. | | | | Automotive Retail | | | | | | | | |
| First Lien Term Loan, LIBOR+8.25% cash due 8/31/2026 | | 11.92 | % | | | | 9,100,561 | | | 8,645,949 | | | 8,745,639 | | | (5)(8)(10) |
| First Lien Delayed Draw Term Loan, LIBOR+8.25% cash due 8/31/2026 | | 11.92 | % | | | | 2,753,355 | | | 2,557,592 | | | 2,600,520 | | | (5)(8)(9)(10) |
| 39,794 Class B Common Stock Warrants (exercise price $31.50) expiration date 7/25/2023 | | | | | | | | 290,496 | | | 17,907 | | | (8)(10) |
| | | | | | | | 11,494,037 | | | 11,364,066 | | | |
Oaktree Strategic Income II, Inc.
Consolidated Schedule of Investments
September 30, 2022
| | | | | | | | | | | | | | | | | | | | | | | | | | | | | | | | | | | | | | |
| Portfolio Company/Type of Investment (1)(2)(3)(4) | | Cash Interest Rate (5) | | Industry | | Principal (6) | | Cost | | Fair Value | | Notes |
| Sabert Corporation | | | | Metal & Glass Containers | | | | | | | | |
| First Lien Term Loan, LIBOR+4.50% cash due 12/10/2026 | | 7.63 | % | | | | $ | 2,536,031 | | | $ | 2,510,671 | | | $ | 2,434,590 | | | (5) |
| | | | | | | | 2,510,671 | | | 2,434,590 | | | |
| SiO2 Medical Products, Inc. | | | | Metal & Glass Containers | | | | | | | | |
| First Lien Term Loan, 5.50% cash 8.50% PIK due 12/21/2026 | | | | | | 6,687,369 | | | 6,578,780 | | | 6,567,665 | | | (8) |
| 75.33 Common Stock Warrants (exercise price $4,920.75) expiration date 7/31/2028 | | | | | | | | 123,557 | | | 123,557 | | | (8) |
| | | | | | | | 6,702,337 | | | 6,691,222 | | | |
| SM Wellness Holdings, Inc. | | | | Health Care Services | | | | | | | | |
| Second Lien Term Loan, LIBOR+8.00% cash due 4/16/2029 | | 10.74 | % | | | | 2,925,000 | | | 2,881,125 | | | 2,661,750 | | | (5)(8) |
| | | | | | | | 2,881,125 | | | 2,661,750 | | | |
| Sorenson Communications, LLC | | | | Communications Equipment | | | | | | | | |
| First Lien Term Loan, LIBOR+5.50% cash due 3/17/2026 | | 9.17 | % | | | | 4,246,600 | | | 4,204,134 | | | 4,082,065 | | | (5) |
| | | | | | | | 4,204,134 | | | 4,082,065 | | | |
| Sorrento Therapeutics, Inc. | | | | Biotechnology | | | | | | | | |
| 16,000 Common Stock Units | | | | | | | | 63,040 | | | 25,120 | | | (10) |
| | | | | | | | 63,040 | | | 25,120 | | | |
| Southern Veterinary Partners, LLC | | | | Health Care Facilities | | | | | | | | |
| First Lien Term Loan, LIBOR+4.00% cash due 10/5/2027 | | 7.12 | % | | | | 748,096 | | | 714,432 | | | 709,757 | | | (5) |
| | | | | | | | 714,432 | | | 709,757 | | | |
| SPX Flow, Inc. | | | | Industrial Machinery | | | | | | | | |
| First Lien Term Loan, SOFR+4.50% cash due 4/5/2029 | | 7.63 | % | | | | 3,500,000 | | | 3,311,873 | | | 3,250,625 | | | (5) |
| | | | | | | | 3,311,873 | | | 3,250,625 | | | |
| SumUp Holdings Luxembourg S.À.R.L. | | | | Other Diversified Financial Services | | | | | | | | |
| First Lien Term Loan, EURIBOR+8.50% cash due 3/10/2026 | | 10.00 | % | | | | € | 6,820,000 | | | 7,963,603 | | | 6,597,698 | | | (5)(8)(10) |
| | | | | | | | 7,963,603 | | | 6,597,698 | | | |
| Sunland Asphalt & Construction, LLC | | | | Construction & Engineering | | | | | | | | |
| First Lien Term Loan, LIBOR+6.00% cash due 1/13/2026 | | 8.88 | % | | | | $ | 11,602,865 | | | 11,450,287 | | | 11,359,205 | | | (5)(8) |
| | | | | | | | 11,450,287 | | | 11,359,205 | | | |
| Supermoose Borrower, LLC | | | | Application Software | | | | | | | | |
| First Lien Term Loan, LIBOR+3.75% cash due 8/29/2025 | | 7.42 | % | | | | 2,865,093 | | | 2,673,082 | | | 2,526,296 | | | (5) |
| | | | | | | | 2,673,082 | | | 2,526,296 | | | |
| SVP-Singer Holdings Inc. | | | | Home Furnishings | | | | | | | | |
| First Lien Term Loan, LIBOR+6.75% cash due 7/28/2028 | | 10.42 | % | | | | 5,021,280 | | | 4,727,174 | | | 4,397,813 | | | (5)(8) |
| | | | | | | | 4,727,174 | | | 4,397,813 | | | |
| Tacala, LLC | | | | Restaurants | | | | | | | | |
| Second Lien Term Loan, LIBOR+7.50% cash due 2/4/2028 | | 10.62 | % | | | | 3,394,977 | | | 3,355,000 | | | 3,123,379 | | | (5) |
| | | | | | | | 3,355,000 | | | 3,123,379 | | | |
| Tahoe Bidco B.V. | | | | Application Software | | | | | | | | |
| First Lien Term Loan, LIBOR+6.00% cash due 9/29/2028 | | 8.68 | % | | | | 5,611,000 | | | 5,514,547 | | | 5,521,224 | | | (5)(8)(10) |
| First Lien Revolver, LIBOR+6.00% cash due 10/1/2027 | | | | | | — | | | (7,037) | | | (6,733) | | | (5)(8)(9)(10) |
| | | | | | | | 5,507,510 | | | 5,514,491 | | | |
| Tecta America Corp. | | | | Construction & Engineering | | | | | | | | |
| Second Lien Term Loan, LIBOR+8.50% cash due 4/9/2029 | | 11.62 | % | | | | 1,671,000 | | | 1,645,935 | | | 1,616,701 | | | (5)(8) |
| | | | | | | | 1,645,935 | | | 1,616,701 | | | |
| Telestream Holdings Corporation | | | | Application Software | | | | | | | | |
| First Lien Term Loan, SOFR+9.25% cash due 10/15/2025 | | 12.11 | % | | | | 5,221,988 | | | 5,162,048 | | | 5,091,438 | | | (5)(8) |
| First Lien Revolver, SOFR+9.25% cash due 10/15/2025 | | 12.20 | % | | | | 350,700 | | | 344,537 | | | 338,175 | | | (5)(8)(9) |
| | | | | | | | 5,506,585 | | | 5,429,613 | | | |
Oaktree Strategic Income II, Inc.
Consolidated Schedule of Investments
September 30, 2022
| | | | | | | | | | | | | | | | | | | | | | | | | | | | | | | | | | | | | | |
| Portfolio Company/Type of Investment (1)(2)(3)(4) | | Cash Interest Rate (5) | | Industry | | Principal (6) | | Cost | | Fair Value | | Notes |
| TerSera Therapeutics LLC | | | | Pharmaceuticals | | | | | | | | |
| Second Lien Term Loan, LIBOR+10.00% cash due 3/30/2026 | | 13.67 | % | | | | $ | 6,100,000 | | | $ | 5,984,915 | | | $ | 6,053,030 | | | (5)(8) |
| | | | | | | | 5,984,915 | | | 6,053,030 | | | |
| Thrasio, LLC | | | | Internet & Direct Marketing Retail | | | | | | | | |
| First Lien Term Loan, LIBOR+7.00% cash due 12/18/2026 | | 11.17 | % | | | | 9,697,662 | | | 9,523,347 | | | 9,261,267 | | | (5)(8) |
| 2,182 Shares of Series C-3 Preferred Stock in Thrasio Holdings, Inc. | | | | | | | | 26,665 | | | 17,783 | | | (8) |
| 73,648 Shares of Series C-2 Preferred Stock in Thrasio Holdings, Inc. | | | | | | | | 600,000 | | | 600,233 | | | (8) |
| 12,510 Shares of Series D Preferred Stock in Thrasio Holdings, Inc. | | | | | | | | 253,328 | | | 253,328 | | | (8) |
| 6,000 Shares of Series X Preferred Stock in Thrasio Holdings, Inc. | | | | | | | | 6,000,300 | | | 6,849,942 | | | (8)(9) |
| | | | | | | | 16,403,640 | | | 16,982,553 | | | |
| TIBCO Software Inc. | | | | Application Software | | | | | | | | |
| First Lien Term Loan, SOFR+4.50% cash due 3/20/2029 | | 8.15 | % | | | | 5,224,000 | | | 4,753,840 | | | 4,700,660 | | | (5) |
| | | | | | | | 4,753,840 | | | 4,700,660 | | | |
| Touchstone Acquisition, Inc. | | | | Health Care Supplies | | | | | | | | |
| First Lien Term Loan, LIBOR+6.00% cash due 12/29/2028 | | 9.12 | % | | | | 5,773,985 | | | 5,670,321 | | | 5,658,505 | | | (5)(8) |
| | | | | | | | 5,670,321 | | | 5,658,505 | | | |
| Virgin Pulse, Inc. | | | | Application Software | | | | | | | | |
| Second Lien Term Loan, LIBOR+7.25% cash due 4/6/2029 | | 10.37 | % | | | | 1,540,000 | | | 1,524,600 | | | 1,293,600 | | | (5)(8) |
| | | | | | | | 1,524,600 | | | 1,293,600 | | | |
| Win Brands Group LLC | | | | Housewares & Specialties | | | | | | | | |
| First Lien Term Loan, LIBOR+15.00% cash due 1/22/2026 | | 19.64 | % | | | | 591,398 | | | 585,661 | | | 578,092 | | | (5)(8) |
| 1,250 Class F Warrants in Brand Value Growth LLC (exercise price $0.01) expiration date 1/25/2027 | | | | | | | | — | | | 66,225 | | | (8) |
| | | | | | | | 585,661 | | | 644,317 | | | |
| Windstream Services II, LLC | | | | Integrated Telecommunication Services | | | | | | | | |
| First Lien Term Loan, LIBOR+6.25% cash due 9/21/2027 | | 9.37 | % | | | | 9,919,616 | | | 9,637,264 | | | 9,026,850 | | | (5) |
| | | | | | | | 9,637,264 | | | 9,026,850 | | | |
| WP CPP Holdings, LLC | | | | Aerospace & Defense | | | | | | | | |
| First Lien Term Loan, LIBOR+3.75% cash due 4/30/2025 | | 6.56 | % | | | | 4,346,235 | | | 4,117,383 | | | 3,904,353 | | | (5) |
| | | | | | | | 4,117,383 | | | 3,904,353 | | | |
| WPEngine, Inc. | | | | Application Software | | | | | | | | |
| First Lien Term Loan, LIBOR+6.00% cash due 3/27/2026 | | 10.19 | % | | | | 14,623,000 | | | 14,410,596 | | | 14,476,771 | | | (5)(8) |
| | | | | | | | 14,410,596 | | | 14,476,771 | | | |
| WWEX Uni Topco Holdings, LLC | | | | Air Freight & Logistics | | | | | | | | |
| First Lien Term Loan, LIBOR+4.00% cash due 7/26/2028 | | 7.67 | % | | | | 994,987 | | | 935,527 | | | 909,016 | | | (5) |
| | | | | | | | 935,527 | | | 909,016 | | | |
| Zayo Group Holdings, Inc. | | | | Alternative Carriers | | | | | | | | |
| First Lien Term Loan, LIBOR+3.00% cash due 3/9/2027 | | 6.12 | % | | | | 1,000,000 | | | 945,874 | | | 840,505 | | | (5) |
| Fixed Rate Bond, 4.00% cash due 3/1/2027 | | | | | | 150,000 | | | 126,967 | | | 120,729 | | | |
| | | | | | | | 1,072,841 | | | 961,234 | | | |
| Zephyr Bidco Limited | | | | Specialized Finance | | | | | | | | |
| Second Lien Term Loan, SONIA+7.50% cash due 7/23/2026 | | 9.72 | % | | | | £ | 2,000,000 | | | 2,594,016 | | | 1,839,104 | | | (5)(8)(10) |
| | | | | | | | 2,594,016 | | | 1,839,104 | | | |
| Total Non-Control/Non-Affiliate Investments (173.7% of net assets) | | | | | | | | $ | 577,383,482 | | | $ | 559,313,056 | | | |
| Cash and Cash Equivalents and Restricted Cash (6.0% of net assets) | | | | | | | | $ | 19,405,793 | | | $ | 19,405,793 | | | |
| Total Portfolio Investments, Cash and Cash Equivalents and Restricted Cash (179.8% of net assets) | | | | | | | | $ | 596,789,275 | | | $ | 578,718,849 | | | |
Oaktree Strategic Income II, Inc.
Consolidated Schedule of Investments
September 30, 2022
| | | | | | | | | | | | | | | | | | | | | | | | | | | | | | | | |
| Derivative Instrument | | Notional Amount to be Purchased | | Notional Amount to be Sold | | Maturity Date | | Counterparty | | Cumulative Unrealized Appreciation (Depreciation) |
| Foreign currency forward contract | | $ | 13,066,310 | | | € | 12,710,431 | | | 11/10/2022 | | Bank of New York Mellon | | $ | 580,858 | |
| Foreign currency forward contract | | $ | 15,205,487 | | | £ | 12,568,533 | | | 11/10/2022 | | Bank of New York Mellon | | $ | 1,165,449 | |
| | | | | | | | | | $ | 1,746,307 | |
(1)All debt investments are income producing unless otherwise noted. All equity investments are non-income producing unless otherwise noted.
(2)See Note 3 in the accompanying notes to the Consolidated Financial Statements for portfolio composition by geographic region.
(3)Interest rates may be adjusted from period to period on certain term loans and revolvers. These rate adjustments may be either temporary in nature due to tier pricing arrangements or financial or payment covenant violations in the original credit agreements or permanent in nature per loan amendment or waiver documents.
(4)Each of the Company's investments is pledged as collateral under one or more of its credit facilities. A single investment may be divided into parts that are individually pledged as collateral to separate credit facilities.
(5)The interest rate on the principal balance outstanding for most of the floating rate loans is indexed to the London Interbank Offered Rate ("LIBOR") and/or an alternate base rate (e.g., prime rate), which typically resets semi-annually, quarterly, or monthly at the borrower's option. Certain loans may also be indexed to the secured overnight financing rate ("SOFR") or the sterling overnight index average ("SONIA"). The borrower may also elect to have multiple interest reset periods for each loan. For each of these loans, the Company has provided the applicable margin over the reference rates based on each respective credit agreement and the cash interest rate as of period end. All LIBOR shown above is in U.S. dollars unless otherwise noted. As of September 30, 2022, the reference rates for the Company's variable rate loans were the 30-day LIBOR at 3.12%, the 90-day LIBOR at 3.67%, the 180-day LIBOR at 4.17%, the PRIME at 6.25%, the 30-day SOFR at 3.03%, the 90-day SOFR at 3.55%, the SONIA at 1.69%, the 30-day EURIBOR at 0.69%, the 90-day EURIBOR at 0.99% and the 180-day EURIBOR at 0.38%. Most loans include an interest floor, which generally ranges from 0% to 1%. SOFR and SONIA based contracts may include a credit spread adjustment that is charged in addition to the base rate and the stated spread.
(6)Principal includes accumulated payment in kind ("PIK") interest and is net of repayments, if any. "€" signifies the investment is denominated in Euros. “£” signifies the investment is denominated in British Pounds. All other investments are denominated in U.S. dollars.
(7)Non-Control/Non-Affiliate Investments are investments that are neither Control Investments nor Affiliate Investments. Control Investments generally are defined by the Investment Company Act of 1940, as amended (the "Investment Company Act"), as investments in companies in which the Company owns more than 25% of the voting securities and/or has the power to exercise control over the management or policies of the company. Affiliate Investments generally are defined by the Investment Company Act as investments in companies in which the Company owns between 5% and 25% of the voting securities.
(8)As of September 30, 2022, these investments are categorized as Level 3 within the fair value hierarchy established by Financial Accounting Standards Board ("FASB") Accounting Standards Codification ("ASC") Topic 820, Fair Value Measurements and Disclosures ("ASC 820") and were valued using significant unobservable inputs.
(9)Investment has undrawn commitments. Unamortized fees are classified as unearned income which reduces cost basis, which may result in a negative cost basis. A negative fair value may result from the unfunded commitment being valued below par.
(10)Investment is not a qualifying asset as defined under Section 55(a) of the Investment Company Act. Under the Investment Company Act, the Company may not acquire any non-qualifying asset unless, at the time the acquisition is made, qualifying assets represent at least 70% of the Company's total assets. As of September 30, 2022, qualifying assets represented 80.5% of the Company's total assets and non-qualifying assets represented 19.5% of the Company's total assets.
(11)One half of the Seller Earn Out Shares will vest if, at any time through June 16, 2027, the Alvotech SA common share price is at or above a volume weighted average price ("VWAP") of $15.00 per share for any ten trading days within any twenty trading day period, and the other half will vest, if at any time during such period, the common share price is at or above a VWAP of $20.00 per share for any ten trading days within any twenty trading day period.
See notes to Consolidated Financial Statements.
Oaktree Strategic Income II, Inc.
Consolidated Schedule of Investments
September 30, 2021
| | | | | | | | | | | | | | | | | | | | | | | | | | | | | | | | | | | | | | |
| Portfolio Company/Type of Investment (1)(2)(3)(4) | | Cash Interest Rate (5) | | Industry | | Principal (6) | | Cost | | Fair Value | | Notes |
| Non-Control/Non-Affiliate Investments | | | | | | | | | | | | (7) |
| 109 Montgomery Owner LLC | | | | Real Estate Operating Companies | | | | | | | | |
| First Lien Delayed Draw Term Loan, LIBOR+7.00% cash due 2/2/2023 | | 7.50 | % | | | | $ | 750,674 | | | $ | 725,811 | | | $ | 763,057 | | | (5)(8)(9) |
| | | | | | | | 725,811 | | | 763,057 | | | |
| A.T. Holdings II SÀRL | | | | Biotechnology | | | | | | | | |
| First Lien Term Loan, 9.50% cash due 12/22/2022 | | | | | | 12,812,000 | | | 12,733,548 | | | 12,747,940 | | | (8)(10) |
| | | | | | | | 12,733,548 | | | 12,747,940 | | | |
| Accupac, Inc. | | | | Personal Products | | | | | | | | |
| First Lien Term Loan, LIBOR+6.00% cash due 1/17/2026 | | 7.00 | % | | | | 4,513,601 | | | 4,457,062 | | | 4,513,600 | | | (5)(8) |
| First Lien Delayed Draw Term Loan, LIBOR+6.00% cash due 1/17/2026 | | | | | | — | | | (10,729) | | | — | | | (5)(8)(9) |
| First Lien Revolver, LIBOR+6.00% cash due 1/17/2026 | | 7.00 | % | | | | 513,907 | | | 506,754 | | | 513,907 | | | (5)(8)(9) |
| | | | | | | | 4,953,087 | | | 5,027,507 | | | |
| Acquia Inc. | | | | Application Software | | | | | | | | |
| First Lien Term Loan, LIBOR+7.00% cash due 10/31/2025 | | 8.00 | % | | | | 4,381,994 | | | 4,322,248 | | | 4,373,230 | | | (5)(8) |
| First Lien Revolver, LIBOR+7.00% cash due 10/31/2025 | | 8.00 | % | | | | 37,488 | | | 30,931 | | | 36,551 | | | (5)(8)(9) |
| | | | | | | | 4,353,179 | | | 4,409,781 | | | |
| ADB Companies, LLC | | | | Construction & Engineering | | | | | | | | |
| First Lien Term Loan, LIBOR+6.25% cash due 12/18/2025 | | 7.25 | % | | | | 7,716,667 | | | 7,551,815 | | | 7,628,697 | | | (5)(8) |
| | | | | | | | 7,551,815 | | | 7,628,697 | | | |
| AI Sirona (Luxembourg) Acquisition S.a.r.l. | | | | Pharmaceuticals | | | | | | | | |
| Second Lien Term Loan, EURIBOR+7.25% cash due 9/28/2026 | | 7.25 | % | | | | € | 5,147,000 | | | 5,634,400 | | | 5,955,154 | | | (5)(8)(10) |
| | | | | | | | 5,634,400 | | | 5,955,154 | | | |
| Alvogen Pharma US, Inc. | | | | Pharmaceuticals | | | | | | | | |
| First Lien Term Loan, LIBOR+5.25% cash due 12/31/2023 | | 6.25 | % | | | | $ | 5,082,606 | | | 4,799,993 | | | 4,920,090 | | | (5) |
| | | | | | | | 4,799,993 | | | 4,920,090 | | | |
| Alvotech Holdings S.A. | | | | Biotechnology | | | | | | | | |
| Fixed Rate Bond 15% PIK Tranche A due 6/24/2025 | | | | | | 3,109,198 | | | 3,047,984 | | | 3,109,198 | | | (8)(10)(11) |
| Fixed Rate Bond 15% PIK Tranche B due 6/24/2025 | | | | | | 2,909,948 | | | 2,860,464 | | | 2,909,948 | | | (8)(10)(11) |
| 3,690 Common Shares | | | | | | | | 854,309 | | | 854,309 | | | (8)(10) |
| | | | | | | | 6,762,757 | | | 6,873,455 | | | |
| Amplify Finco Pty Ltd. | | | | Movies & Entertainment | | | | | | | | |
| First Lien Term Loan, LIBOR+4.25% cash due 11/26/2026 | | 5.00 | % | | | | 8,077,000 | | | 7,804,890 | | | 7,871,723 | | | (5)(8)(10) |
| | | | | | | | 7,804,890 | | | 7,871,723 | | | |
| Anastasia Parent, LLC | | | | Personal Products | | | | | | | | |
| First Lien Term Loan, LIBOR+3.75% cash due 8/11/2025 | | 3.88 | % | | | | 1,823,712 | | | 1,445,347 | | | 1,549,015 | | | (5) |
| | | | | | | | 1,445,347 | | | 1,549,015 | | | |
| Ankura Consulting Group LLC | | | | Research & Consulting Services | | | | | | | | |
| Second Lien Term Loan, LIBOR+8.00% cash due 3/19/2029 | | 8.75 | % | | | | 2,398,000 | | | 2,362,030 | | | 2,442,962 | | | (5)(8) |
| | | | | | | | 2,362,030 | | | 2,442,962 | | | |
| Apptio, Inc. | | | | Application Software | | | | | | | | |
| First Lien Term Loan, LIBOR+7.25% cash due 1/10/2025 | | 8.25 | % | | | | 7,129,297 | | | 7,050,240 | | | 7,018,308 | | | (5)(8) |
| First Lien Revolver, LIBOR+7.25% cash due 1/10/2025 | | 8.25 | % | | | | 184,615 | | | 179,575 | | | 177,430 | | | (5)(8)(9) |
| | | | | | | | 7,229,815 | | | 7,195,738 | | | |
| Ardonagh Midco 3 PLC | | | | Insurance Brokers | | | | | | | | |
| First Lien Term Loan, EURIBOR+7.25 cash due 7/14/2026 | | 8.25 | % | | | | € | 1,052,732 | | | 1,173,350 | | | 1,223,724 | | | (5)(8)(10) |
| First Lien Term Loan, UK LIBOR+7.25% cash due 7/14/2026 | | 8.00 | % | | | | £ | 9,987,149 | | | 12,450,863 | | | 13,573,902 | | | (5)(8)(10) |
| | | | | | | | 13,624,213 | | | 14,797,626 | | | |
Oaktree Strategic Income II, Inc.
Consolidated Schedule of Investments
September 30, 2021
| | | | | | | | | | | | | | | | | | | | | | | | | | | | | | | | | | | | | | |
| Portfolio Company/Type of Investment (1)(2)(3)(4) | | Cash Interest Rate (5) | | Industry | | Principal (6) | | Cost | | Fair Value | | Notes |
| | | | | | | | | | | | |
| Assembled Brands Capital LLC | | | | Specialized Finance | | | | | | | | |
| First Lien Revolver, LIBOR+6.00% cash due 10/17/2023 | | 7.00 | % | | | | $ | 1,720,438 | | | $ | 1,720,438 | | | $ | 1,700,145 | | | (5)(8)(9) |
| 174,131 Class A Units | | | | | | | | 82,713 | | | 63,558 | | | (8) |
| 100,285 Preferred Units, 6% | | | | | | | | 110,285 | | | 124,622 | | | (8) |
| 7,621 Class A Warrants (exercise price $3.3778) expiration date 9/9/2029 | | | | | | | | — | | | — | | | (8) |
| | | | | | | | 1,913,436 | | | 1,888,325 | | | |
| Associated Asphalt Partners, LLC | | | | Construction Materials | | | | | | | | |
| First Lien Term Loan, LIBOR+5.25% cash due 4/5/2024 | | 6.25 | % | | | | 913,116 | | | 809,832 | | | 847,865 | | | (5) |
| | | | | | | | 809,832 | | | 847,865 | | | |
| Athenex, Inc. | | | | Pharmaceuticals | | | | | | | | |
| First Lien Term Loan, 11.00% cash due 6/19/2026 | | | | | | 12,484,249 | | | 12,075,426 | | | 12,395,611 | | | (8)(10) |
| First Lien Delayed Draw Term Loan, 11.00% cash due 6/19/2026 | | | | | | — | | | (86,693) | | | (44,319) | | | (8)(9)(10) |
| 97,205 Common Stock Warrants (exercise price $12.63) expiration date 6/19/2027 | | | | | | | | 334,385 | | | 28,189 | | | (8)(10) |
| | | | | | | | 12,323,118 | | | 12,379,481 | | | |
| Aurora Lux Finco S.À.R.L. | | | | Airport Services | | | | | | | | |
| First Lien Term Loan, LIBOR+6.00% cash due 12/24/2026 | | 7.00 | % | | | | 7,387,500 | | | 7,249,544 | | | 6,951,637 | | | (5)(8)(10) |
| | | | | | | | 7,249,544 | | | 6,951,637 | | | |
| The Avery | | | | Real Estate Operating Companies | | | | | | | | |
| First Lien Delayed Draw Term Loan in T8 Urban Condo Owner, LLC, LIBOR+7.30% cash due 2/17/2023 | | 7.55 | % | | | | 5,120,365 | | | 5,081,993 | | | 5,171,494 | | | (5)(8)(9) |
| Subordinated Delayed Draw Debt in T8 Senior Mezz LLC, LIBOR+12.50% cash due 2/17/2023 | | 12.75 | % | | | | 1,184,147 | | | 1,175,581 | | | 1,185,820 | | | (5)(8)(9) |
| | | | | | | | 6,257,574 | | | 6,357,314 | | | |
| BAART Programs, Inc. | | | | Health Care Services | | | | | | | | |
| First Lien Term Loan, LIBOR+5.00% cash due 6/11/2027 | | 6.00 | % | | | | 1,197,000 | | | 1,185,030 | | | 1,194,008 | | | (5)(8) |
| First Lien Delayed Draw Term Loan, LIBOR+5.00% cash due 6/11/2027 | | 6.00 | % | | | | 90,000 | | | 87,103 | | | 89,250 | | | (5)(8)(9) |
| Second Lien Term Loan, LIBOR+8.50% cash due 6/11/2028 | | 9.50 | % | | | | 1,754,000 | | | 1,727,690 | | | 1,745,230 | | | (5)(8) |
| Second Lien Delayed Draw Term Loan, LIBOR+8.50% cash due 6/11/2028 | | | | | | — | | | (12,769) | | | (4,385) | | | (5)(8)(9) |
| | | | | | | | 2,987,054 | | | 3,024,103 | | | |
| Berner Food & Beverage, LLC | | | | Soft Drinks | | | | | | | | |
| First Lien Term Loan, LIBOR+6.50% cash due 7/30/2027 | | 7.50 | % | | | | 8,078,034 | | | 7,940,733 | | | 7,940,707 | | | (5)(8) |
| First Lien Revolver, LIBOR+6.50% cash due 7/30/2027 | | 7.50 | % | | | | 149,593 | | | 136,880 | | | 136,878 | | | (5)(8)(9) |
| | | | | | | | 8,077,613 | | | 8,077,585 | | | |
| Blumenthal Temecula, LLC | | | | Automotive Retail | | | | | | | | |
| First Lien Term Loan, 9.00% cash due 9/24/2023 | | | | | | 1,277,827 | | | 1,277,827 | | | 1,277,827 | | | (8) |
| 415,294 Preferred Units in Unstoppable Automotive AMV, LLC | | | | | | | | 415,294 | | | 415,294 | | | (8) |
| 95,837 Preferred Units in Unstoppable Automotive VMV, LLC | | | | | | | | 95,837 | | | 95,837 | | | (8) |
| 95,837 Common Units in Unstoppable Automotive AMV, LLC | | | | | | | | 95,837 | | | 95,837 | | | (8) |
| 31,946 Common Units in Unstoppable Automotive VMV, LLC | | | | | | | | 31,946 | | | 31,946 | | | (8) |
| | | | | | | | 1,916,741 | | | 1,916,741 | | | |
| Cadence Aerospace, LLC | | | | Aerospace & Defense | | | | | | | | |
| First Lien Term Loan, LIBOR+6.50% cash 2.00% PIK due 11/14/2023 | | 7.50 | % | | | | 3,155,766 | | | 3,125,999 | | | 2,898,255 | | | (5)(8) |
| | | | | | | | 3,125,999 | | | 2,898,255 | | | |
| Chief Power Finance II, LLC | | | | Independent Power Producers & Energy Traders | | | | | | | | |
| First Lien Term Loan, LIBOR+6.50% cash due 12/31/2022 | | 7.50 | % | | | | 7,650,000 | | | 7,574,559 | | | 7,554,375 | | | (5)(8) |
| | | | | | | | 7,574,559 | | | 7,554,375 | | | |
Oaktree Strategic Income II, Inc.
Consolidated Schedule of Investments
September 30, 2021
| | | | | | | | | | | | | | | | | | | | | | | | | | | | | | | | | | | | | | |
| Portfolio Company/Type of Investment (1)(2)(3)(4) | | Cash Interest Rate (5) | | Industry | | Principal (6) | | Cost | | Fair Value | | Notes |
| CITGO Holding, Inc. | | | | Oil & Gas Refining & Marketing | | | | | | | | |
| First Lien Term Loan, LIBOR+7.00% cash due 8/1/2023 | | 8.00 | % | | | | $ | 649,713 | | | $ | 632,186 | | | $ | 642,891 | | | (5) |
| | | | | | | | 632,186 | | | 642,891 | | | |
| CITGO Petroleum Corp. | | | | Oil & Gas Refining & Marketing | | | | | | | | |
| First Lien Term Loan, LIBOR+6.25% cash due 3/28/2024 | | 7.25 | % | | | | 7,110,606 | | | 7,039,500 | | | 7,134,320 | | | (5) |
| | | | | | | | 7,039,500 | | | 7,134,320 | | | |
| Continental Intermodal Group LP | | | | Oil & Gas Storage & Transportation | | | | | | | | |
| First Lien Term Loan, LIBOR+9.50% PIK due 1/28/2025 | | | | | | 9,902,357 | | | 9,902,357 | | | 8,311,048 | | | (5)(8) |
| Common Stock Warrants expiration date 7/28/2025 | | | | | | | | — | | | 486,258 | | | (8) |
| | | | | | | | 9,902,357 | | | 8,797,306 | | | |
| Convergeone Holdings, Inc. | | | | IT Consulting & Other Services | | | | | | | | |
| First Lien Term Loan, LIBOR+5.00% cash due 1/4/2026 | | 5.08 | % | | | | 5,789,540 | | | 5,644,359 | | | 5,772,258 | | | (5) |
| | | | | | | | 5,644,359 | | | 5,772,258 | | | |
| CorEvitas, LLC | | | | Health Care Services | | | | | | | | |
| First Lien Term Loan, LIBOR+5.50% cash due 12/13/2025 | | 6.50 | % | | | | 3,722,865 | | | 3,677,272 | | | 3,691,221 | | | (5)(8) |
| First Lien Delayed Draw Term Loan, LIBOR+5.50% cash due 12/13/2025 | | 6.50 | % | | | | 709,056 | | | 693,504 | | | 697,725 | | | (5)(8)(9) |
| First Lien Revolver, PRIME+4.50% cash due 12/13/2025 | | 7.75 | % | | | | 111,500 | | | 103,307 | | | 105,814 | | | (5)(8)(9) |
| 401 Class A2 Common Units in CorEvitas Group Holdings, L.P. | | | | | | | | 378,610 | | | 429,503 | | | (8) |
| | | | | | | | 4,852,693 | | | 4,924,263 | | | |
| Coty Inc. | | | | Personal Products | | | | | | | | |
| First Lien Revolver, LIBOR+1.75% cash due 4/5/2023 | | | | | | — | | | (457,344) | | | (254,080) | | | (5)(8)(9)(10) |
| | | | | | | | (457,344) | | | (254,080) | | | |
| CPC Acquisition Corp. | | | | Specialty Chemicals | | | | | | | | |
| Second Lien Term Loan, LIBOR+7.75% cash due 12/29/2028 | | 8.50 | % | | | | 727,000 | | | 716,095 | | | 732,453 | | | (5) |
| | | | | | | | 716,095 | | | 732,453 | | | |
| Curium Bidco S.à.r.l. | | | | Biotechnology | | | | | | | | |
| Second Lien Term Loan, LIBOR+7.75% cash due 10/27/2028 | | 8.50 | % | | | | 3,788,000 | | | 3,731,180 | | | 3,851,941 | | | (5)(8)(10) |
| | | | | | | | 3,731,180 | | | 3,851,941 | | | |
| Dialyze Holdings, LLC | | | | Health Care Equipment | | | | | | | | |
| First Lien Term Loan, LIBOR+7.00% cash 2.00% PIK due 8/4/2026 | | 8.00 | % | | | | 4,429,232 | | | 4,124,905 | | | 4,130,258 | | | (5)(8) |
| First Lien Delayed Draw Term Loan, LIBOR+7.00% cash 2.00% PIK due 8/4/2026 | | | | | | — | | | (31,261) | | | (29,961) | | | (5)(8)(9) |
| 993,431 Class A Warrants (exercise price $1.00) expiration date 8/4/2028 | | | | | | | | 258,292 | | | 268,226 | | | (8) |
| | | | | | | | 4,351,936 | | | 4,368,523 | | | |
| Digital.AI Software Holdings, Inc. | | | | Application Software | | | | | | | | |
| First Lien Term Loan, LIBOR+7.00% cash due 2/10/2027 | | 8.00 | % | | | | 2,637,713 | | | 2,566,997 | | | 2,579,683 | | | (5)(8) |
| First Lien Revolver, LIBOR+7.00% cash due 2/10/2027 | | 8.00 | % | | | | 47,339 | | | 39,724 | | | 41,090 | | | (5)(8)(9) |
| | | | | | | | 2,606,721 | | | 2,620,773 | | | |
| DirecTV Financing, LLC | | | | Cable & Satellite | | | | | | | | |
| First Lien Term Loan, LIBOR+5.00% cash due 8/2/2027 | | 5.75 | % | | | | 9,000,000 | | | 8,910,000 | | | 9,015,930 | | | (5) |
| | | | | | | | 8,910,000 | | | 9,015,930 | | | |
| EHR Canada, LLC | | | | Food Retail | | | | | | | | |
| First Lien Term Loan, LIBOR+8.00% cash due 12/31/2021 | | 9.00 | % | | | | 250,000 | | | 249,637 | | | 250,000 | | | (5)(8) |
| | | | | | | | 249,637 | | | 250,000 | | | |
| Enviva Holdings, LP | | | | Forest Products | | | | | | | | |
| First Lien Term Loan, LIBOR+5.50% cash due 2/17/2026 | | 6.50 | % | | | | 1,959,339 | | | 1,939,746 | | | 1,964,238 | | | (5)(8)(10) |
| | | | | | | | 1,939,746 | | | 1,964,238 | | | |
Oaktree Strategic Income II, Inc.
Consolidated Schedule of Investments
September 30, 2021
| | | | | | | | | | | | | | | | | | | | | | | | | | | | | | | | | | | | | | |
| Portfolio Company/Type of Investment (1)(2)(3)(4) | | Cash Interest Rate (5) | | Industry | | Principal (6) | | Cost | | Fair Value | | Notes |
| Fortress Biotech, Inc. | | | | Biotechnology | | | | | | | | |
| First Lien Term Loan, 11.00% cash due 8/27/2025 | | | | | | $ | 2,943,000 | | | $ | 2,803,017 | | | $ | 2,869,425 | | | (8)(10)(12) |
| 85,811 Common Stock Warrants (exercise price $3.20) expiration date 8/27/2030 | | | | | | | | 90,960 | | | 88,385 | | | (8)(10) |
| | | | | | | | 2,893,977 | | | 2,957,810 | | | |
| GI Chill Acquisition LLC | | | | Managed Health Care | | | | | | | | |
| First Lien Term Loan, LIBOR+3.75% cash due 8/6/2025 | | 3.90 | % | | | | 1,940,000 | | | 1,930,300 | | | 1,935,150 | | | (5)(8) |
| Second Lien Term Loan, LIBOR+7.50% cash due 8/6/2026 | | 7.63 | % | | | | 2,000,000 | | | 1,987,852 | | | 1,990,000 | | | (5)(8) |
| | | | | | | | 3,918,152 | | | 3,925,150 | | | |
| Gibson Brands, Inc. | | | | Leisure Products | | | | | | | | |
| First Lien Term Loan, LIBOR+5.00% cash due 8/11/2028 | | 5.75 | % | | | | 1,500,000 | | | 1,485,000 | | | 1,492,500 | | | (5) |
| | | | | | | | 1,485,000 | | | 1,492,500 | | | |
| Global Medical Response, Inc. | | | | Health Care Services | | | | | | | | |
| First Lien Term Loan, LIBOR+4.25% cash due 3/14/2025 | | 5.25 | % | | | | 1,067,720 | | | 1,053,918 | | | 1,073,192 | | | (5) |
| First Lien Term Loan, LIBOR+4.75% cash due 10/2/2025 | | 5.75 | % | | | | 3,745,001 | | | 3,683,273 | | | 3,764,194 | | | (5) |
| | | | | | | | 4,737,191 | | | 4,837,386 | | | |
| Grab Holdings Inc. | | | | Interactive Media & Services | | | | | | | | |
| First Lien Term Loan, LIBOR+4.50% cash due 1/29/2026 | | 5.50 | % | | | | 3,980,000 | | | 3,876,279 | | | 4,033,053 | | | (5)(10) |
| | | | | | | | 3,876,279 | | | 4,033,053 | | | |
| Gulf Operating, LLC | | | | Oil & Gas Storage & Transportation | | | | | | | | |
| First Lien Revolver, LIBOR+4.00% cash due 12/27/2021 | | | | | | — | | | (242,900) | | | (26,025) | | | (5)(8)(9) |
| | | | | | | | (242,900) | | | (26,025) | | | |
| iCIMs, Inc. | | | | Application Software | | | | | | | | |
| First Lien Term Loan, LIBOR+6.50% cash due 9/12/2024 | | 7.50 | % | | | | 2,517,618 | | | 2,487,768 | | | 2,506,876 | | | (5)(8) |
| First Lien Revolver, LIBOR+6.50% cash due 9/12/2024 | | 7.50 | % | | | | 88,235 | | | 87,128 | | | 87,859 | | | (5)(8) |
| | | | | | | | 2,574,896 | | | 2,594,735 | | | |
| Immucor, Inc. | | | | Health Care Supplies | | | | | | | | |
| First Lien Term Loan, LIBOR+5.75% cash due 7/2/2025 | | 6.75 | % | | | | 2,342,678 | | | 2,307,525 | | | 2,319,251 | | | (5)(8) |
| Second Lien Term Loan, LIBOR+8.00% cash 3.50% PIK due 10/2/2025 | | 9.00 | % | | | | 5,908,637 | | | 5,822,441 | | | 5,849,551 | | | (5)(8) |
| | | | | | | | 8,129,966 | | | 8,168,802 | | | |
| Indivior Finance S.À.R.L. | | | | Pharmaceuticals | | | | | | | | |
| First Lien Term Loan, LIBOR+5.25% cash due 6/30/2026 | | 6.00 | % | | | | 1,995,000 | | | 1,956,371 | | | 1,988,347 | | | (5)(10) |
| | | | | | | | 1,956,371 | | | 1,988,347 | | | |
| Intelsat Jackson Holdings S.A. | | | | Alternative Carriers | | | | | | | | |
| First Lien Term Loan, PRIME+4.75% cash due 11/27/2023 | | 8.00 | % | | | | 986,227 | | | 964,264 | | | 1,001,020 | | | (5)(10) |
| | | | | | | | 964,264 | | | 1,001,020 | | | |
| Inventus Power, Inc. | | | | Electrical Components & Equipment | | | | | | | | |
| First Lien Term Loan, LIBOR+5.00% cash due 3/29/2024 | | 6.00 | % | | | | 4,560,085 | | | 4,522,223 | | | 4,525,884 | | | (5)(8) |
| Second Lien Term Loan, LIBOR+8.50% cash due 9/29/2024 | | 9.50 | % | | | | 2,750,000 | | | 2,702,992 | | | 2,701,875 | | | (5)(8) |
| | | | | | | | 7,225,215 | | | 7,227,759 | | | |
| INW Manufacturing, LLC | | | | Personal Products | | | | | | | | |
| First Lien Term Loan, LIBOR+5.75% cash due 5/7/2027 | | 6.50 | % | | | | 11,850,000 | | | 11,516,219 | | | 11,613,000 | | | (5)(8) |
| | | | | | | | 11,516,219 | | | 11,613,000 | | | |
| Itafos Inc. | | | | Fertilizers & Agricultural Chemicals | | | | | | | | |
| First Lien Term Loan, LIBOR+8.25% cash due 8/25/2024 | | 9.25 | % | | | | 5,442,000 | | | 5,231,669 | | | 5,235,204 | | | (5)(8) |
| | | | | | | | 5,231,669 | | | 5,235,204 | | | |
| Ivanti Software, Inc. | | | | Application Software | | | | | | | | |
| Second Lien Term Loan, LIBOR+8.50% cash due 12/1/2028 | | 9.50 | % | | | | 7,975,000 | | | 7,753,202 | | | 7,984,969 | | | (5)(8) |
| | | | | | | | 7,753,202 | | | 7,984,969 | | | |
| Jazz Acquisition, Inc. | | | | Aerospace & Defense | | | | | | | | |
| First Lien Term Loan, LIBOR+7.50% cash due 1/29/2027 | | 8.50 | % | | | | 9,509,160 | | | 9,263,766 | | | 9,490,379 | | | (5)(8)(12) |
| | | | | | | | 9,263,766 | | | 9,490,379 | | | |
| Latam Airlines Group S.A. | | | | Airlines | | | | | | | | |
| First Lien Delayed Draw Term Loan, LIBOR+11.00% PIK due 3/29/2022 | | | | | | 4,208,032 | | | 4,169,586 | | | 4,238,488 | | | (5)(8)(9)(10) |
| | | | | | | | 4,169,586 | | | 4,238,488 | | | |
Oaktree Strategic Income II, Inc.
Consolidated Schedule of Investments
September 30, 2021
| | | | | | | | | | | | | | | | | | | | | | | | | | | | | | | | | | | | | | |
| Portfolio Company/Type of Investment (1)(2)(3)(4) | | Cash Interest Rate (5) | | Industry | | Principal (6) | | Cost | | Fair Value | | Notes |
| Lightbox Intermediate, L.P. | | | | Real Estate Services | | | | | | | | |
| First Lien Term Loan, LIBOR+5.00% cash due 5/9/2026 | | 5.13 | % | | | | $ | 8,797,500 | | | $ | 8,710,292 | | | $ | 8,753,513 | | | (5)(8) |
| | | | | | | | 8,710,292 | | | 8,753,513 | | | |
| Lightstone Holdco LLC | | | | Electric Utilities | | | | | | | | |
| First Lien Term Loan, LIBOR+3.75% cash due 1/30/2024 | | 4.75 | % | | | | 1,902,000 | | | 1,641,216 | | | 1,578,793 | | | (5) |
| | | | | | | | 1,641,216 | | | 1,578,793 | | | |
| LTI Holdings, Inc. | | | | Electronic Components | | | | | | | | |
| Second Lien Term Loan, LIBOR+6.75% cash due 9/6/2026 | | 6.83 | % | | | | 1,396,000 | | | 1,375,156 | | | 1,394,255 | | | (5) |
| | | | | | | | 1,375,156 | | | 1,394,255 | | | |
| Maravai Intermediate Holdings, LLC | | | | Biotechnology | | | | | | | | |
| First Lien Term Loan, LIBOR+3.75% cash due 10/19/2027 | | 4.75 | % | | | | 5,909,583 | | | 5,850,488 | | | 5,933,606 | | | (5) |
| | | | | | | | 5,850,488 | | | 5,933,606 | | | |
| Marinus Pharmaceuticals, Inc. | | | | Pharmaceuticals | | | | | | | | |
| First Lien Term Loan, 11.50% cash due 5/11/2026 | | | | | | 2,529,720 | | | 2,483,088 | | | 2,491,774 | | | (8)(10) |
| First Lien Delayed Draw Term Loan, 11.50% cash due 5/11/2026 | | | | | | — | | | — | | | — | | | (8)(9)(10) |
| | | | | | | | 2,483,088 | | | 2,491,774 | | | |
| MedAssets Software Intermediate Holdings, Inc. | | | | Health Care Technology | | | | | | | | |
| Second Lien Term Loan, LIBOR+7.75% cash due 1/29/2029 | | 8.50 | % | | | | 4,874,000 | | | 4,784,294 | | | 4,813,075 | | | (5)(8) |
| | | | | | | | 4,784,294 | | | 4,813,075 | | | |
| MHE Intermediate Holdings, LLC | | | | Diversified Support Services | | | | | | | | |
| First Lien Term Loan, LIBOR+5.75% cash due 7/21/2027 | | 6.75 | % | | | | 4,107,143 | | | 4,027,699 | | | 4,025,000 | | | (5)(8) |
| First Lien Delayed Draw Term Loan, LIBOR+5.75% cash due 7/21/2027 | | 6.75 | % | | | | 26,429 | | | 20,807 | | | 20,807 | | | (5)(8)(9) |
| First Lien Revolver, LIBOR+5.75% cash due 7/21/2027 | | | | | | — | | | (6,908) | | | (7,143) | | | (5)(8)(9) |
| | | | | | | | 4,041,598 | | | 4,038,664 | | | |
| Mindbody, Inc. | | | | Internet Services & Infrastructure | | | | | | | | |
| First Lien Term Loan, LIBOR+7.00% cash 1.50% PIK due 2/14/2025 | | 8.00 | % | | | | 7,385,581 | | | 7,304,181 | | | 7,245,255 | | | (5)(8) |
| First Lien Revolver, LIBOR+8.00% cash due 2/14/2025 | | | | | | — | | | (8,568) | | | (14,476) | | | (5)(8)(9) |
| | | | | | | | 7,295,613 | | | 7,230,779 | | | |
| Mosaic Companies, LLC | | | | Home Improvement Retail | | | | | | | | |
| First Lien Term Loan, LIBOR+6.75% cash due 7/2/2026 | | 7.75 | % | | | | 11,595,000 | | | 11,374,657 | | | 11,374,695 | | | (5)(8) |
| | | | | | | | 11,374,657 | | | 11,374,695 | | | |
| MRI Software LLC | | | | Application Software | | | | | | | | |
| First Lien Term Loan, LIBOR+5.50% cash due 2/10/2026 | | 6.50 | % | | | | 7,031,843 | | | 6,986,046 | | | 7,027,448 | | | (5)(8) |
| First Lien Delayed Draw Term Loan, LIBOR+5.50% cash due 2/10/2026 | | | | | | — | | | (8,232) | | | (145) | | | (5)(8)(9) |
| First Lien Revolver, LIBOR+5.50% cash due 2/10/2026 | | | | | | — | | | (4,612) | | | (288) | | | (5)(8)(9) |
| | | | | | | | 6,973,202 | | | 7,027,015 | | | |
| Navisite, LLC | | | | Data Processing & Outsourced Services | | | | | | | | |
| Second Lien Term Loan, LIBOR+8.50% cash due 12/30/2026 | | 9.50 | % | | | | 7,779,000 | | | 7,642,947 | | | 7,646,757�� | | | (5)(8) |
| | | | | | | | 7,642,947 | | | 7,646,757 | | | |
| NeuAG, LLC | | | | Fertilizers & Agricultural Chemicals | | | | | | | | |
| First Lien Term Loan, LIBOR+5.50% cash 7.00% PIK due 9/11/2024 | | 7.00 | % | | | | 13,405,671 | | | 13,038,932 | | | 13,110,746 | | | (5)(8) |
| First Lien Delayed Draw Term Loan, LIBOR+5.50% cash 7.00% PIK due 9/11/2024 | | | | | | — | | | (62,040) | | | (34,122) | | | (5)(8)(9) |
| | | | | | | | 12,976,892 | | | 13,076,624 | | | |
| NN, Inc. | | | | Industrial Machinery | | | | | | | | |
| First Lien Term Loan, LIBOR+6.88% cash due 9/19/2026 | | 7.88 | % | | | | 14,802,615 | | | 14,468,636 | | | 14,580,576 | | | (5)(8)(10) |
| | | | | | | | 14,468,636 | | | 14,580,576 | | | |
Oaktree Strategic Income II, Inc.
Consolidated Schedule of Investments
September 30, 2021
| | | | | | | | | | | | | | | | | | | | | | | | | | | | | | | | | | | | | | |
| Portfolio Company/Type of Investment (1)(2)(3)(4) | | Cash Interest Rate (5) | | Industry | | Principal (6) | | Cost | | Fair Value | | Notes |
| OEConnection LLC | | | | Application Software | | | | | | | | |
| First Lien Term Loan, LIBOR+4.00% cash due 9/25/2026 | | 4.08 | % | | | | $ | 9,324,115 | | | $ | 9,281,397 | | | $ | 9,312,460 | | | (5) |
| | | | | | | | 9,281,397 | | | 9,312,460 | | | |
| Olaplex, Inc. | | | | Personal Products | | | | | | | | |
| First Lien Term Loan, LIBOR+6.25% cash due 1/8/2026 | | 7.25 | % | | | | 11,546,327 | | | 11,392,153 | | | 11,459,729 | | | (5)(8) |
| First Lien Revolver, LIBOR+6.25% cash due 1/8/2025 | | | | | | — | | | (13,422) | | | (16,108) | | | (5)(8)(9) |
| | | | | | | | 11,378,731 | | | 11,443,621 | | | |
| OTG Management, LLC | | | | Airport Services | | | | | | | | |
| First Lien Term Loan, LIBOR+10.00% cash due 9/1/2025 | | 11.00 | % | | | | 3,205,000 | | | 3,142,216 | | | 3,140,900 | | | (5)(8) |
| First Lien Delayed Draw Term Loan, LIBOR+10.00% cash due 9/1/2025 | | | | | | — | | | (5,979) | | | (6,104) | | | (5)(8)(9) |
| | | | | | | | 3,136,237 | | | 3,134,796 | | | |
| Park Place Technologies, LLC | | | | Internet Services & Infrastructure | | | | | | | | |
| First Lien Term Loan, LIBOR+5.00% cash due 11/10/2027 | | 6.00 | % | | | | 4,975,000 | | | 4,800,895 | | | 4,980,696 | | | (5) |
| | | | | | | | 4,800,895 | | | 4,980,696 | | | |
| Performance Health Holdings, Inc. | | | | Health Care Distributors | | | | | | | | |
| First Lien Term Loan, LIBOR+6.00% cash due 7/12/2027 | | 7.00 | % | | | | 4,915,000 | | | 4,820,334 | | | 4,816,700 | | | (5)(8) |
| | | | | | | | 4,820,334 | | | 4,816,700 | | | |
| Planview Parent, Inc. | | | | Application Software | | | | | | | | |
| Second Lien Term Loan, LIBOR+7.25% cash due 12/18/2028 | | 8.00 | % | | | | 9,872,000 | | | 9,723,920 | | | 9,896,680 | | | (5)(8) |
| | | | | | | | 9,723,920 | | | 9,896,680 | | | |
| PLNTF Holdings, LLC | | | | Leisure Facilities | | | | | | | | |
| First Lien Term Loan, LIBOR+8.00% cash due 3/22/2026 | | 9.00 | % | | | | 4,408,845 | | | 4,329,641 | | | 4,430,889 | | | (5)(8) |
| | | | | | | | 4,329,641 | | | 4,430,889 | | | |
| Pluralsight, LLC | | | | Application Software | | | | | | | | |
| First Lien Term Loan, LIBOR+8.00% cash due 4/6/2027 | | 9.00 | % | | | | 15,361,250 | | | 15,076,598 | | | 15,069,387 | | | (5)(8) |
| First Lien Revolver, LIBOR+8.00% cash due 4/6/2027 | | | | | | — | | | (19,440) | | | (20,101) | | | (5)(8)(9) |
| | | | | | | | 15,057,158 | | | 15,049,286 | | | |
| PRGX Global, Inc. | | | | Data Processing & Outsourced Services | | | | | | | | |
| First Lien Term Loan, LIBOR+6.75% cash due 3/3/2026 | | 7.75 | % | | | | 8,256,663 | | | 8,110,702 | | | 8,118,504 | | | (5)(8) |
| First Lien Revolver, LIBOR+6.75% cash due 3/3/2026 | | | | | | — | | | (10,773) | | | (10,197) | | | (5)(8)(9) |
| 19,485 Class B Common Units | | | | | | | | 19,485 | | | 19,485 | | | (8) |
| | | | | | | | 8,119,414 | | | 8,127,792 | | | |
| ProFrac Services, LLC | | | | Industrial Machinery | | | | | | | | |
| First Lien Term Loan, LIBOR+8.50% cash due 9/15/2023 | | 9.75 | % | | | | 1,176,313 | | | 1,171,701 | | | 1,164,550 | | | (5)(8) |
| | | | | | | | 1,171,701 | | | 1,164,550 | | | |
| Project Boost Purchaser, LLC | | | | Application Software | | | | | | | | |
| Second Lien Term Loan, LIBOR+8.00% cash due 5/31/2027 | | 8.08 | % | | | | 1,500,000 | | | 1,500,000 | | | 1,492,500 | | | (5)(8) |
| | | | | | | | 1,500,000 | | | 1,492,500 | | | |
| Quantum Bidco Limited | | | | Food Distributors | | | | | | | | |
| First Lien Term Loan, UK LIBOR+6.00% cash due 1/29/2028 | | 6.11 | % | | | | £ | 1,125,000 | | | 1,486,303 | | | 1,501,725 | | | (5)(10) |
| | | | | | | | 1,486,303 | | | 1,501,725 | | | |
| Relativity ODA LLC | | | | Application Software | | | | | | | | |
| First Lien Term Loan, LIBOR+7.50% PIK due 5/12/2027 | | | | | | $ | 5,601,876 | | | 5,474,760 | | | 5,484,237 | | | (5)(8) |
| First Lien Revolver, LIBOR+6.50% cash due 5/12/2027 | | | | | | — | | | (12,712) | | | (11,418) | | | (5)(8)(9) |
| | | | | | | | 5,462,048 | | | 5,472,819 | | | |
| Renaissance Holding Corp. | | | | Diversified Banks | | | | | | | | |
| Second Lien Term Loan, LIBOR+7.00% cash due 5/29/2026 | | 7.08 | % | | | | 1,138,000 | | | 1,129,465 | | | 1,144,401 | | | (5) |
| | | | | | | | 1,129,465 | | | 1,144,401 | | | |
Oaktree Strategic Income II, Inc.
Consolidated Schedule of Investments
September 30, 2021
| | | | | | | | | | | | | | | | | | | | | | | | | | | | | | | | | | | | | | |
| Portfolio Company/Type of Investment (1)(2)(3)(4) | | Cash Interest Rate (5) | | Industry | | Principal (6) | | Cost | | Fair Value | | Notes |
| RumbleOn, Inc. | | | | Automotive Retail | | | | | | | | |
| First Lien Term Loan, LIBOR+8.25% cash due 8/31/2026 | | 9.25 | % | | | | $ | 9,192,486 | | | $ | 8,616,072 | | | $ | 8,613,359 | | | (5)(8)(10) |
| First Lien Delayed Draw Term Loan, LIBOR+8.25% cash due 8/31/2026 | | | | | | — | | | (247,035) | | | (248,197) | | | (5)(8)(9)(10) |
| 39,794 Class B Common Stock Warrants (exercise price $33.00) expiration date 2/28/2023 | | | | | | | | 290,496 | | | 375,257 | | | (8)(10) |
| | | | | | | | 8,659,533 | | | 8,740,419 | | | |
| Sabert Corporation | | | | Metal & Glass Containers | | | | | | | | |
| First Lien Term Loan, LIBOR+4.50% cash due 12/10/2026 | | 5.50 | % | | | | 2,727,699 | | | 2,700,422 | | | 2,737,928 | | | (5) |
| | | | | | | | 2,700,422 | | | 2,737,928 | | | |
| Scilex Pharmaceuticals Inc. | | | | Pharmaceuticals | | | | | | | | |
| Fixed Rate Zero Coupon Bond due 8/15/2026 | | | | | | 1,153,753 | | | 976,809 | | | 1,075,413 | | | (8) |
| | | | | | | | 976,809 | | | 1,075,413 | | | |
| SIO2 Medical Products, Inc. | | | | Metal & Glass Containers | | | | | | | | |
| Subordinated Debt, 11.25% cash due 2/28/2022 | | | | | | 2,883,000 | | | 2,749,617 | | | 2,724,435 | | | (8) |
| Subordinated Delayed Draw Debt, 11.25% cash due 2/28/2022 | | | | | | — | | | (19,881) | | | (21,623) | | | (8)(9) |
| Common Stock Warrants (exercise price $0.75) expiration date 7/31/2028 | | | | | | | | 123,557 | | | 124,249 | | | (8) |
| | | | | | | | 2,853,293 | | | 2,827,061 | | | |
| Sirva Worldwide, Inc. | | | | Diversified Support Services | | | | | | | | |
| First Lien Term Loan, LIBOR+5.50% cash due 8/4/2025 | | 5.58 | % | | | | 434,731 | | | 428,210 | | | 410,958 | | | (5) |
| | | | | | | | 428,210 | | | 410,958 | | | |
| SM Wellness Holdings, Inc. | | | | Health Care Services | | | | | | | | |
| Second Lien Term Loan, LIBOR+8.00% cash due 4/16/2029 | | 8.75 | % | | | | 2,925,000 | | | 2,881,125 | | | 2,946,938 | | | (5)(8) |
| | | | | | | | 2,881,125 | | | 2,946,938 | | | |
| Sorenson Communications, LLC | | | | Communications Equipment | | | | | | | | |
| First Lien Term Loan, LIBOR+5.50% cash due 3/17/2026 | | 6.25 | % | | | | 4,746,200 | | | 4,698,738 | | | 4,784,763 | | | (5) |
| | | | | | | | 4,698,738 | | | 4,784,763 | | | |
| Sorrento Therapeutics, Inc. | | | | Biotechnology | | | | | | | | |
| 25,600 Common Stock Units | | | | | | | | 63,040 | | | 122,080 | | | (10) |
| | | | | | | | 63,040 | | | 122,080 | | | |
| Star US Bidco LLC | | | | Industrial Machinery | | | | | | | | |
| First Lien Term Loan, LIBOR+4.25% cash due 3/17/2027 | | 5.25 | % | | | | 5,221,148 | | | 4,961,750 | | | 5,242,920 | | | (5) |
| | | | | | | | 4,961,750 | | | 5,242,920 | | | |
| SumUp Holdings Luxembourg S.À.R.L. | | | | Other Diversified Financial Services | | | | | | | | |
| First Lien Delayed Draw Term Loan, EURIBOR+8.50% cash due 3/10/2026 | | 10.00 | % | | | | € | 5,637,867 | | | 6,559,321 | | | 6,415,445 | | | (5)(8)(9)(10) |
| | | | | | | | 6,559,321 | | | 6,415,445 | | | |
| Sunland Asphalt & Construction, LLC | | | | Construction & Engineering | | | | | | | | |
| First Lien Term Loan, LIBOR+6.00% cash due 1/13/2026 | | 7.00 | % | | | | $ | 11,720,960 | | | 11,519,948 | | | 11,556,867 | | | (5)(8) |
| First Lien Revolver, LIBOR+6.00% cash due 1/13/2022 | | 7.00 | % | | | | 55,236 | | | 44,849 | | | 46,122 | | | (5)(8)(9) |
| | | | | | | | 11,564,797 | | | 11,602,989 | | | |
| Supermoose Borrower, LLC | | | | Application Software | | | | | | | | |
| First Lien Term Loan, LIBOR+3.75% cash due 8/29/2025 | | 3.88 | % | | | | 2,894,861 | | | 2,634,239 | | | 2,699,009 | | | (5) |
| | | | | | | | 2,634,239 | | | 2,699,009 | | | |
| SVP-Singer Holdings Inc. | | | | Home Furnishings | | | | | | | | |
| First Lien Term Loan, LIBOR+6.75% cash due 7/28/2028 | | 7.50 | % | | | | 5,072,000 | | | 4,723,943 | | | 4,771,890 | | | (5)(8) |
| | | | | | | | 4,723,943 | | | 4,771,890 | | | |
| Tacala, LLC | | | | Restaurants | | | | | | | | |
| Second Lien Term Loan, LIBOR+7.50% cash due 2/4/2028 | | 8.25 | % | | | | 3,394,977 | | | 3,347,525 | | | 3,396,250 | | | (5) |
| | | | | | | | 3,347,525 | | | 3,396,250 | | | |
| Tecta America Corp. | | | | Construction & Engineering | | | | | | | | |
| Second Lien Term Loan, LIBOR+8.50% cash due 4/9/2029 | | 9.25 | % | | | | 1,671,000 | | | 1,645,935 | | | 1,671,000 | | | (5)(8) |
| | | | | | | | 1,645,935 | | | 1,671,000 | | | |
Oaktree Strategic Income II, Inc.
Consolidated Schedule of Investments
September 30, 2021
| | | | | | | | | | | | | | | | | | | | | | | | | | | | | | | | | | | | | | |
| Portfolio Company/Type of Investment (1)(2)(3)(4) | | Cash Interest Rate (5) | | Industry | | Principal (6) | | Cost | | Fair Value | | Notes |
| Telestream Holdings Corporation | | | | Application Software | | | | | | | | |
| First Lien Term Loan, LIBOR+8.75% cash due 10/15/2025 | | 9.75 | % | | | | $ | 5,275,138 | | | $ | 5,194,678 | | | $ | 5,201,286 | | | (5)(8) |
| First Lien Revolver, LIBOR+8.75% cash due 10/15/2025 | | 9.75 | % | | | | 140,280 | | | 132,091 | | | 133,266 | | | (5)(8)(9) |
| | | | | | | | 5,326,769 | | | 5,334,552 | | | |
| TerSera Therapeutics LLC | | | | Pharmaceuticals | | | | | | | | |
| Second Lien Term Loan, LIBOR+10.00% cash due 3/30/2026 | | 11.00 | % | | | | 6,100,000 | | | 5,951,995 | | | 6,148,666 | | | (5)(8) |
| | | | | | | | 5,951,995 | | | 6,148,666 | | | |
| Thermacell Repellents, Inc. | | | | Leisure Products | | | | | | | | |
| First Lien Term Loan, LIBOR+5.75% cash due 12/4/2026 | | 6.75 | % | | | | 6,636,042 | | | 6,602,572 | | | 6,603,150 | | | (5)(8) |
| First Lien Revolver, LIBOR+5.75% cash due 12/4/2026 | | | | | | — | | | (4,167) | | | (4,167) | | | (5)(8)(9) |
| | | | | | | | 6,598,405 | | | 6,598,983 | | | |
| Thrasio, LLC | | | | Internet & Direct Marketing Retail | | | | | | | | |
| First Lien Term Loan, LIBOR+7.00% cash due 12/18/2026 | | 8.00 | % | | | | 9,796,366 | | | 9,568,725 | | | 9,747,384 | | | (5)(8) |
| 2,182 Shares of Series C-3 Preferred Stock in Thrasio Holdings, Inc. | | | | | | | | 26,665 | | | 44,186 | | | (8) |
| 73,648 Shares of Series C-2 Preferred Stock in Thrasio Holdings, Inc. | | | | | | | | 600,000 | | | 1,491,376 | | | (8) |
| 6,000 Shares of Series X Preferred Stock in Thrasio Holdings, Inc. | | | | | | | | 6,000,300 | | | 6,414,321 | | | (8)(9) |
| | | | | | | | 16,195,690 | | | 17,697,267 | | | |
| TIBCO Software Inc. | | | | Application Software | | | | | | | | |
| Second Lien Term Loan, LIBOR+7.25% cash due 3/3/2028 | | 7.34 | % | | | | 1,394,000 | | | 1,379,054 | | | 1,411,774 | | | (5) |
| | | | | | | | 1,379,054 | | | 1,411,774 | | | |
| Velocity Commercial Capital, LLC | | | | Thrifts & Mortgage Finance | | | | | | | | |
| First Lien Term Loan, LIBOR+8.00% cash due 2/5/2026 | | 9.00 | % | | | | 3,850,058 | | | 3,748,666 | | | 3,830,807 | | | (5)(8) |
| | | | | | | | 3,748,666 | | | 3,830,807 | | | |
| Veritas US Inc. | | | | Application Software | | | | | | | | |
| First Lien Term Loan, LIBOR+5.00% cash due 9/1/2025 | | 6.00 | % | | | | 7,425,141 | | | 7,307,798 | | | 7,469,209 | | | (5) |
| | | | | | | | 7,307,798 | | | 7,469,209 | | | |
| Verscend Holding Corp. | | | | Health Care Technology | | | | | | | | |
| First Lien Term Loan, LIBOR+4.00% cash due 8/27/2025 | | 4.08 | % | | | | 834,184 | | | 818,972 | | | 836,440 | | | (5) |
| | | | | | | | 818,972 | | | 836,440 | | | |
| Virgin Pulse, Inc. | | | | Application Software | | | | | | | | |
| Second Lien Term Loan, LIBOR+7.25% cash due 4/6/2029 | | 8.00 | % | | | | 1,540,000 | | | 1,524,600 | | | 1,543,850 | | | (5) |
| | | | | | | | 1,524,600 | | | 1,543,850 | | | |
| Win Brands Group LLC | | | | Housewares & Specialties | | | | | | | | |
| First Lien Term Loan, LIBOR+9.00% cash 5.00% PIK due 1/22/2026 | | 10.00 | % | | | | 652,012 | | | 645,632 | | | 648,752 | | | (5)(8) |
| 62 Class F Warrants in Brand Value Growth LLC (exercise price $0.01) expiration date 1/25/2027 | | | | | | | | — | | | 41,013 | | | (8) |
| | | | | | | | 645,632 | | | 689,765 | | | |
| Windstream Services II, LLC | | | | Integrated Telecommunication Services | | | | | | | | |
| First Lien Term Loan, LIBOR+6.25% cash due 9/21/2027 | | 7.25 | % | | | | 10,861,810 | | | 10,490,500 | | | 10,928,339 | | | (5) |
| | | | | | | | 10,490,500 | | | 10,928,339 | | | |
| WP CPP Holdings, LLC | | | | Aerospace & Defense | | | | | | | | |
| First Lien Term Loan, LIBOR+3.75% cash due 4/30/2025 | | 4.75 | % | | | | 3,893,225 | | | 3,877,791 | | | 3,799,535 | | | (5) |
| | | | | | | | 3,877,791 | | | 3,799,535 | | | |
| WPEngine, Inc. | | | | Application Software | | | | | | | | |
| First Lien Term Loan, LIBOR+6.50% cash due 3/27/2026 | | 7.50 | % | | | | 14,623,000 | | | 14,349,695 | | | 14,434,364 | | | (5)(8) |
| | | | | | | | 14,349,695 | | | 14,434,364 | | | |
| Zephyr Bidco Limited | | | | Specialized Finance | | | | | | | | |
| Second Lien Term Loan, UK LIBOR+7.50% cash due 7/23/2026 | | 7.55 | % | | | | £ | 2,000,000 | | | 2,585,581 | | | 2,689,958 | | | (5)(10) |
| | | | | | | | 2,585,581 | | | 2,689,958 | | | |
Oaktree Strategic Income II, Inc.
Consolidated Schedule of Investments
September 30, 2021
| | | | | | | | | | | | | | | | | | | | | | | | | | | | | | | | | | | | | | |
| Portfolio Company/Type of Investment (1)(2)(3)(4) | | Cash Interest Rate (5) | | Industry | | Principal (6) | | Cost | | Fair Value | | Notes |
| Total Non-Control/Non-Affiliate Investments (166.1% of net assets) | | | | | | | | $ | 568,303,425 | | | $ | 575,429,432 | | | |
| Cash and Cash Equivalents and Restricted Cash (6.8% of net assets) | | | | | | | | $ | 23,573,015 | | | $ | 23,573,015 | | | |
| Total Portfolio Investments, Cash and Cash Equivalents and Restricted Cash (172.9% of net assets) | | | | | | | | $ | 591,876,440 | | | $ | 599,002,447 | | | |
| | | | | | | | | | | | | | | | | | | | | | | | | | | | | | | | |
| Derivative Instrument | | Notional Amount to be Purchased | | Notional Amount to be Sold | | Maturity Date | | Counterparty | | Cumulative Unrealized Appreciation (Depreciation) |
| Foreign currency forward contract | | $ | 13,551,234 | | | € | 11,534,208 | | | 11/12/2021 | | Bank of New York Mellon | | $ | 173,075 | |
| Foreign currency forward contract | | $ | 17,392,336 | | | £ | 12,568,533 | | | 11/12/2021 | | Bank of New York Mellon | | $ | 444,929 | |
| | | | | | | | | | $ | 618,004 | |
Oaktree Strategic Income II, Inc.
Consolidated Schedule of Investments
September 30, 2021
(1)All debt investments are income producing unless otherwise noted. All equity investments are non-income producing unless otherwise noted.
(2)See Note 3 in the accompanying notes to the Consolidated Financial Statements for portfolio composition by geographic region.
(3)Interest rates may be adjusted from period to period on certain term loans and revolvers. These rate adjustments may be either temporary in nature due to tier pricing arrangements or financial or payment covenant violations in the original credit agreements or permanent in nature per loan amendment or waiver documents.
(4)Each of the Company's investments is pledged as collateral under one or more of its credit facilities. A single investment may be divided into parts that are individually pledged as collateral to separate credit facilities.
(5)The interest rate on the principal balance outstanding for all floating rate loans is indexed to the LIBOR and/or an alternate base rate (e.g., prime rate), which typically resets semi-annually, quarterly, or monthly at the borrower's option. The borrower may also elect to have multiple interest reset periods for each loan. For each of these loans, the Company has provided the applicable margin over LIBOR or the alternate base rate based on each respective credit agreement and the cash interest rate as of period end. All LIBOR shown above is in U.S. dollars unless otherwise noted. As of September 30, 2021, the reference rates for the Company's variable rate loans were the 30-day LIBOR at 0.08%, the 60-day LIBOR at 0.11%, the 90-day LIBOR at 0.13%, the 180-day LIBOR at 0.16%, the 360-day LIBOR at 0.24%, the PRIME at 3.25%, the 30-day UK LIBOR at 0.05%, the 180-day UK LIBOR at 0.09%, the 30-day EURIBOR at (0.57)%, the 90-day EURIBOR at (0.56)% and the 180-day EURIBOR at (0.53)%. Most loans include an interest floor, which generally ranges from 0% to 1%.
(6)Principal includes accumulated PIK interest and is net of repayments, if any. "€" signifies the investment is denominated in Euros. “£” signifies the investment is denominated in British Pounds. All other investments are denominated in U.S. dollars.
(7)Non-Control/Non-Affiliate Investments are investments that are neither Control Investments nor Affiliate Investments. Control Investments generally are defined by the Investment Company Act, as investments in companies in which the Company owns more than 25% of the voting securities and/or has the power to exercise control over the management or policies of the company. Affiliate Investments generally are defined by the Investment Company Act as investments in companies in which the Company owns between 5% and 25% of the voting securities.
(8)As of September 30, 2021, these investments are categorized as Level 3 within the fair value hierarchy established by ASC 820 and were valued using significant unobservable inputs.
(9)Investment has undrawn commitments. Unamortized fees are classified as unearned income which reduces cost basis, which may result in a negative cost basis. A negative fair value may result from the unfunded commitment being valued below par.
(10)Investment is not a qualifying asset as defined under Section 55(a) of the Investment Company Act. Under the Investment Company Act, the Company may not acquire any non-qualifying asset unless, at the time the acquisition is made, qualifying assets represent at least 70% of the Company's total assets. As of September 30, 2021, qualifying assets represented 79.8% of the Company's total assets and non-qualifying assets represented 20.2% of the Company's total assets.
(11)PIK interest income for this investment accrues at an annualized rate of 15%, however, the PIK interest is not contractually capitalized on the investment subsequent to a restructuring that occurred during the year ended September 30, 2021. As a result, the principal amount of the investment does not increase over time for accumulated PIK interest. As of September 30, 2021, the accumulated PIK interest balance for each of the Alvotech A notes and the B notes was $0.1 million. The fair value of this investment is inclusive of PIK interest income.
(12)The sale of all or a portion of this investment did not qualify for sale accounting under ASC 860, and therefore the investment remains on the Company's Consolidated Schedule of Investments as of September 30, 2021. See "Secured Borrowings" in Note 6 in the Company's annual report on Form 10-K for year ended September 30, 2021 for further details.
See notes to Consolidated Financial Statements.
OAKTREE STRATEGIC INCOME II, INC.
NOTES TO CONSOLIDATED FINANCIAL STATEMENTS
Note 1. Organization
Oaktree Strategic Income II, Inc. (together with its consolidated subsidiaries, where applicable, the "Company") is structured as a closed-end investment company focused on lending to small- and medium-sized companies. The Company has elected to be regulated as a business development company (a "BDC") under the Investment Company Act of 1940, as amended (the "Investment Company Act") and has elected to be treated, and intends to comply with the requirements to qualify annually, as a regulated investment company ("RIC") under Subchapter M of the Internal Revenue Code of 1986, as amended (together with the rules and regulations promulgated thereunder, the "Code").
The Company was formed on April 30, 2018 as a Delaware corporation and as of September 30, 2022 is externally managed by Oaktree Fund Advisors, LLC (the "Adviser") pursuant to an investment advisory agreement (the “Investment Advisory Agreement”), between the Company and the Adviser, which was approved by the Board of Directors of the Company on May 11, 2020. From July 9, 2018 through May 11, 2020, the Company was managed by Oaktree Capital Management, L.P., an affiliate of the Adviser. The Adviser is a subsidiary of Oaktree Capital Group, LLC ("OCG"). In 2019, Brookfield Asset Management Inc. ("Brookfield") acquired a majority economic interest in OCG. OCG operates as an independent business within Brookfield, with its own product offerings and investment, marketing and support teams.
The Company conducted private offerings (each, a “Private Offering”) of its common stock ("Common Stock") to investors in reliance on exemptions from the registration requirements of the Securities Act of 1933, as amended (the “Securities Act”). At each closing of a Private Offering, each investor participating in that closing made a capital commitment (each, a “Capital Commitment”) to purchase the Company's Common Stock pursuant to a subscription agreement entered into with the Company in connection with its Capital Commitment ("Subscription Agreement"). The initial closing of a Private Offering occurred on August 6, 2018 (the "Initial Closing"). The Company commenced its loan origination and investment activities shortly after its initial capital drawdown from its non-affiliated investors (the "Initial Drawdown"). The proceeds from the Initial Drawdown provided the Company with the necessary seed capital to commence operations. As of September 30, 2022, the Company completed drawdowns of $337,558,996, or 100%, of Capital Commitments from investors in connection with Private Offerings, of which $3,854,346 in Capital Commitments were made by one or more affiliates of the Adviser.
The Company seeks to invest opportunistically across asset classes and geographies, primarily in the form of senior loans, and to a lesser extent, high yield bonds, to borrowers that are in need of direct loans, rescue financings or other capital solutions or that have had challenged or unsuccessful primary offerings. The Company's investment objective is to generate current income and long-term capital appreciation. The Company seeks to achieve its investment objective without subjecting principal to undue risk of loss by lending to and investing in the debt of public and private companies, primarily in situations where a company or its owners are (a) overleveraged or facing pressure to recapitalize, (b) unable to access broadly syndicated capital markets, (c) undervalued after having recently exited bankruptcy, completed a restructuring or are in a cyclically out-of-favor industry or (d) otherwise affected by mispricings or inefficiencies in the capital markets or at different points throughout the credit cycle.
On September 14, 2022, the Company entered into an Agreement and Plan of Merger (the “Merger Agreement”) with Oaktree Specialty Lending Corporation, a Delaware corporation (“OCSL”), Project Superior Merger Sub, Inc., a Delaware corporation and wholly-owned subsidiary of OCSL (“Merger Sub”), and, solely for the limited purposes set forth therein, the Adviser. The Merger Agreement provides that, subject to the conditions set forth in the Merger Agreement, at the effective time of the Merger (the “Effective Time”), Merger Sub will merge with and into the Company, with the Company continuing as the surviving company and as a wholly-owned subsidiary of OCSL (the “Merger”) and, immediately thereafter, the Company will merge with and into OCSL, with OCSL continuing as the surviving company (together with the Merger, the “Mergers”). See “Note 13. Pending Merger with OCSL” for additional information regarding the terms of the proposed Mergers.
Note 2. Significant Accounting Policies
Basis of Presentation:
The accompanying consolidated financial statements of the Company have been prepared in accordance with accounting principles generally accepted in the United States of America ("GAAP") and pursuant to the requirements for reporting on Form 10-K and Regulation S-X. All intercompany balances and transactions have been eliminated in consolidation. The Company is an investment company following the accounting and reporting guidance in FASB ASC Topic 946, Financial Services - Investment Companies ("ASC 946").
OAKTREE STRATEGIC INCOME II, INC.
NOTES TO CONSOLIDATED FINANCIAL STATEMENTS
Use of Estimates:
The preparation of the financial statements in conformity with GAAP requires management to make certain estimates and assumptions affecting amounts reported in the financial statements and accompanying notes. These estimates are based on the information that is currently available to the Company and on various other assumptions that the Company believes to be reasonable under the circumstances. Changes in the economic and political environments, financial markets and any other parameters used in determining these estimates could cause actual results to differ and such differences could be material. Significant estimates include the valuation of investments and revenue recognition.
Consolidation:
The accompanying consolidated financial statements include the accounts of the Company and its consolidated subsidiaries. Each consolidated subsidiary is wholly-owned and, as such, consolidated into the consolidated financial statements. Certain subsidiaries of the Company that hold investments are treated as pass through entities for tax purposes. The assets of the consolidated subsidiaries are not directly available to satisfy the claims of the creditors of the Company. As an investment company, portfolio investments held by the Company are not consolidated into the consolidated financial statements but rather are included on the Consolidated Statements of Assets and Liabilities as investments at fair value.
Fair Value Measurements:
The Adviser, as the valuation designee of the Company’s board of directors pursuant to Rule 2a-5 under the Investment Company Act, determines the fair value of the Company’s assets on at least a quarterly basis in accordance with ASC 820. ASC 820 defines fair value as the amount that would be received to sell an asset or paid to transfer a liability in an orderly transaction between market participants at the measurement date. A liability's fair value is defined as the amount that would be paid to transfer the liability to a new obligor, not the amount that would be paid to settle the liability with the creditor. ASC 820 prioritizes the use of observable market prices over entity-specific inputs. Where observable prices or inputs are not available or reliable, valuation techniques are applied. These valuation techniques involve some level of estimation and judgment, the degree of which is dependent on the price transparency for the investments or market and the investments' complexity.
Hierarchical levels, defined by ASC 820 and directly related to the amount of subjectivity associated with the inputs to fair valuation of these assets and liabilities, are as follows:
•Level 1 — Unadjusted, quoted prices in active markets for identical assets or liabilities as of the measurement date.
•Level 2 — Observable inputs other than Level 1 prices, such as quoted prices for similar assets or liabilities; quoted prices in markets that are not active; or other inputs that are observable or can be corroborated by observable market data at the measurement date for substantially the full term of the assets or liabilities.
•Level 3 — Unobservable inputs that reflect the Adviser's best estimate of what market participants would use in pricing the asset or liability at the measurement date. Consideration is given to the risk inherent in the valuation technique and the risk inherent in the inputs to the model.
If inputs used to measure fair value fall into different levels of the fair value hierarchy, an investment's level is based on the lowest level of input that is significant to the fair value measurement. The Adviser's assessment of the significance of a particular input to the fair value measurement in its entirety requires judgment and considers factors specific to the investment. This includes investment securities that are valued using "bid" and "ask" prices obtained from independent third party pricing services or directly from brokers. These investments may be classified as Level 3 because the quoted prices may be indicative in nature for securities that are in an inactive market, may be for similar securities or may require adjustments for investment-specific factors or restrictions.
Financial instruments with readily available quoted prices generally will have a higher degree of market price observability and a lesser degree of judgment inherent in measuring fair value. As such, the Adviser obtains and analyzes readily available market quotations provided by pricing vendors and brokers for all of the Company's investments for which quotations are available. In determining the fair value of a particular investment, pricing vendors and brokers use observable market information, including both binding and non-binding indicative quotations.
The Adviser seeks to obtain at least two quotations for the subject or similar securities, typically from pricing vendors. If the Adviser is unable to obtain two quotes from pricing vendors, or if the prices obtained from pricing vendors are not within the Adviser's set threshold, the Adviser seeks to obtain a quote directly from a broker making a market for the asset. The Adviser evaluates the quotations provided by pricing vendors and brokers based on available market information, including trading activity of the subject or similar securities, or by performing a comparable security analysis to ensure that fair values are reasonably estimated. The Adviser also performs back-testing of valuation information obtained from pricing vendors and
OAKTREE STRATEGIC INCOME II, INC.
NOTES TO CONSOLIDATED FINANCIAL STATEMENTS
brokers against actual prices received in transactions. In addition to ongoing monitoring and back-testing, the Adviser performs due diligence procedures over pricing vendors to understand their methodology and controls to support their use in the valuation process. Generally, the Adviser does not adjust any of the prices received from these sources.
If the quotations obtained from pricing vendors or brokers are determined not to be reliable or are not readily available, the Adviser values such investments using any of three different valuation techniques. The first valuation technique is the transaction precedent technique, which utilizes recent or expected future transactions of the investment to determine fair value, to the extent applicable. The second valuation technique is an analysis of the enterprise value ("EV") of the portfolio company. EV means the entire value of the portfolio company to a market participant, including the sum of the values of debt and equity securities used to capitalize the enterprise at a point in time. The EV analysis is typically performed to determine (i) the value of equity investments, (ii) whether there is credit impairment for debt investments and (iii) the value for debt investments that the Company is deemed to control under the Investment Company Act. To estimate the EV of a portfolio company, the Adviser analyzes various factors, including the portfolio company’s historical and projected financial results, macroeconomic impacts on the company and competitive dynamics in the company’s industry. the Adviser also utilizes some or all of the following information based on the individual circumstances of the portfolio company: (i) valuations of comparable public companies, (ii) recent sales of private and public comparable companies in similar industries or having similar business or earnings characteristics, (iii) purchase prices as a multiple of their earnings or cash flow, (iv) the portfolio company’s ability to meet its forecasts and its business prospects, (v) a discounted cash flow analysis, (vi) estimated liquidation or collateral value of the portfolio company's assets and (vii) offers from third parties to buy the portfolio company. The Adviser may probability weight potential sale outcomes with respect to a portfolio company when uncertainty exists as of the valuation date. The third valuation technique is a market yield technique, which is typically performed for non-credit impaired debt investments. In the market yield technique, a current price is imputed for the investment based upon an assessment of the expected market yield for a similarly structured investment with a similar level of risk, and the Adviser considers the current contractual interest rate, the capital structure and other terms of the investment relative to risk of the company and the specific investment. A key determinant of risk, among other things, is the leverage through the investment relative to the EV of the portfolio company. As debt investments held by the Company are substantially illiquid with no active transaction market, the Adviser depends on primary market data, including newly funded transactions and industry specific market movements, as well as secondary market data with respect to high yield debt instruments and syndicated loans, as inputs in determining the appropriate market yield, as applicable.
The Adviser estimates the fair value of certain privately held warrants using a Black Scholes pricing model, which includes an analysis of various factors and subjective assumptions, including the current stock price (by using an EV analysis as described above), the expected period until exercise, expected volatility of the underlying stock price, expected dividends and the risk free rate. Changes in the subjective input assumptions can materially affect the fair value estimates.
In December 2020, the SEC adopted Rule 2a-5 under the Investment Company Act. Rule 2a-5 permits boards of registered investment companies and BDCs to either (i) choose to continue to determine fair value in good faith, or (ii) designate a valuation designee tasked with determining fair value in good faith, subject to the board’s oversight. The Company's board of directors has designated the Adviser to serve as its valuation designee effective September 8, 2022.
The Adviser undertakes a multi-step valuation process each quarter in connection with determining the fair value of the Company's investments:
•The quarterly valuation process begins with each portfolio company or investment being initially valued by the Adviser's valuation team;
•Preliminary valuations are then reviewed and discussed with management of the Adviser;
•Separately, independent valuation firms prepare valuations of the Company's investments, on a selected basis, for which market quotations are not readily available or are readily available but deemed not reflective of the fair value of the investment, and submit the reports to the Company and provide such reports to the Adviser;
•The Adviser compares and contrasts its preliminary valuations to the valuations of the independent valuation firms and prepares a valuation report for the Audit Committee;
•The Audit Committee reviews the valuation report with the Adviser, and the Adviser responds and supplements the valuation report to reflect any discussions between the Adviser and the Audit Committee; and
•The Adviser, as valuation designee, determines the fair value of each investment in the Company's portfolio.
The fair value of the Company's investments as of September 30, 2022 was determined by the Adviser, as the Company's valuation designee, and the fair value of the Company's investments as of September 30, 2021 was determined in good faith by the board of directors. The Company has and will continue to engage independent valuation firms each quarter to provide
OAKTREE STRATEGIC INCOME II, INC.
NOTES TO CONSOLIDATED FINANCIAL STATEMENTS
assistance regarding the determination of the fair value of a portion of its portfolio securities for which market quotations are not readily available or are readily available but deemed not reflective of the fair value of the investment.
Due to the inherent uncertainty of determining the fair value of investments that do not have a readily available market value, the fair value of the Company’s investments may fluctuate from period to period. Because of the inherent uncertainty of valuation, these estimated values may differ significantly from the values that would have been reported had a ready market for the investments existed, and it is reasonably possible that the difference could be material.
With the exception of the line items entitled "deferred financing costs," "other assets," "deferred tax liability," "secured borrowings" and "credit facilities payable," which are reported at amortized cost, all assets and liabilities on the Consolidated Statements of Assets and Liabilities approximate fair value. The carrying value of the line items titled "interest receivable," "receivables from unsettled transactions," "accounts payable, accrued expenses and other liabilities," "base management fee and incentive fees payable," "due to affiliates," "interest payable" and "payables from unsettled transactions" approximate fair value due to their short maturities.
Foreign Currency Translation:
The accounting records of the Company are maintained in U.S. dollars. All assets and liabilities denominated in foreign currencies are translated into U.S. dollars based on the prevailing foreign exchange rate on the reporting date. The Company does not isolate that portion of the results of operations resulting from changes in foreign exchange rates on investments from the fluctuations arising from changes in market prices of securities held. The Company’s investments in foreign securities may involve certain risks, including foreign exchange restrictions, expropriation, taxation or other political, social or economic risks, all of which could affect the market and/or credit risk of the investment. In addition, changes in the relationship of foreign currencies to the U.S. dollar can significantly affect the value of these investments and therefore the earnings of the Company.
Derivative Instruments:
The Company uses foreign currency forward contracts to reduce the Company's exposure to fluctuations in the value of foreign currencies. In a foreign currency forward contract, the Company agrees to receive or deliver a fixed quantity of one currency for another at a pre-determined price at a future date. Foreign currency forward contracts are marked-to-market at the applicable forward rate. Unrealized appreciation (depreciation) on foreign currency forward contracts are recorded as a "derivative asset at fair value" or "derivative liability at fair value" on the Consolidated Statements of Assets and Liabilities by counterparty on a net basis, not taking into account collateral posted which is recorded separately, if applicable. Purchases and settlements of foreign currency forward contracts having the same settlement date and counterparty are generally settled net and any realized gains or losses are recognized on the settlement date. The Company does not utilize hedge accounting with respect to foreign currency forward contracts and as such, the Company recognizes its foreign currency forward contracts at fair value with net unrealized gains or losses included in "net unrealized appreciation (depreciation)" in the Consolidated Statements of Operations and net realized gains or losses included in “net realized gains (losses)” in the Consolidated Statements of Operations.
Secured Borrowings:
Securities sold and simultaneously repurchased at a premium are reported as financing transactions in accordance with FASB ASC Topic 860, Transfers and Servicing ("ASC 860"). Amounts payable to the counterparty are due on the repurchase settlement date and, excluding accrued interest, such amounts are presented in the accompanying Consolidated Statements of Assets and Liabilities as secured borrowings. Premiums payable are separately reported as accrued interest.
Investment Income:
Interest Income
Interest income, adjusted for accretion of original issue discount ("OID"), is recorded on an accrual basis to the extent that such amounts are expected to be collected. The Company stops accruing interest on investments when it is determined that interest is no longer collectible. Investments that are expected to pay regularly scheduled interest in cash are generally placed on non-accrual status when there is reasonable doubt that principal or interest cash payments will be collected. Cash interest payments received on investments may be recognized as income or a return of capital depending upon management’s judgment. A non-accrual investment is restored to accrual status if past due principal and interest are paid in cash, and the portfolio company, in management’s judgment, is likely to continue timely payment of its remaining obligations. As of each of September 30, 2022 and September 30, 2021, there were no investments on non-accrual status.
OAKTREE STRATEGIC INCOME II, INC.
NOTES TO CONSOLIDATED FINANCIAL STATEMENTS
In connection with its investment in a portfolio company, the Company sometimes receives nominal cost equity that is valued as part of the negotiation process with the portfolio company. When the Company receives nominal cost equity, the Company allocates its cost basis in the investment between debt securities and the nominal cost equity at the time of origination. Any resulting discount from recording the loan, or otherwise purchasing a security at a discount, is accreted into interest income over the life of the loan.
For the Company's secured borrowings, the interest earned on the entire loan balance is recorded within interest income and the interest earned by the counterparty is recorded within interest expense in the Consolidated Statements of Operations.
PIK Interest Income
The Company's investments in debt securities may contain PIK interest provisions. PIK interest, which generally represents contractually deferred interest added to the loan balance that is generally due at the end of the loan term, is generally recorded on the accrual basis to the extent such amounts are expected to be collected. The Company generally ceases accruing PIK interest if there is insufficient value to support the accrual or if the Company does not expect the portfolio company to be able to pay all principal and interest due. The Company's decision to cease accruing PIK interest on a loan or debt security involves subjective judgments and determinations based on available information about a particular portfolio company, including whether the portfolio company is current with respect to its payment of principal and interest on its loans and debt securities; financial statements and financial projections for the portfolio company; the Company's assessment of the portfolio company's business development success; information obtained by the Company in connection with periodic formal update interviews with the portfolio company's management and, if appropriate, the private equity sponsor; and information about the general economic and market conditions in which the portfolio company operates. The Company's determination to cease accruing PIK interest is generally made well before the Company's full write-down of a loan or debt security. In addition, if it is subsequently determined that the Company will not be able to collect any previously accrued PIK interest, the fair value of the loans or debt securities would be reduced by the amount of such previously accrued, but uncollectible, PIK interest. The accrual of PIK interest on the Company’s debt investments increases the recorded cost bases of these investments in the consolidated financial statements including for purposes of computing the capital gains incentive fee payable by the Company to the Adviser. To maintain its status as a RIC, certain income from PIK interest may be required to be distributed to the Company’s stockholders, even though the Company has not yet collected the cash and may never do so.
Fee Income
The Adviser or its affiliates may provide financial advisory services to portfolio companies in connection with structuring a transaction and in return the Company may receive fees for capital structuring services. These fees are generally nonrecurring and are recognized by the Company upon the investment closing date. The Company may also receive additional fees in the ordinary course of business, including servicing, amendment, and prepayment fees, which are classified as fee income and recognized as they are earned or the services are rendered.
The Company has also structured exit fees across certain of its portfolio investments to be received upon the future exit of those investments. These fees are typically paid to the Company upon the earliest to occur of (i) a sale of the borrower or substantially all of the assets of the borrower, (ii) the maturity date of the loan or (iii) the date when full prepayment of the loan occurs. The receipt of such fees is contingent upon the occurrence of one of the events listed above for each of the investments. These fees are included in net investment income over the life of the loan.
Dividend Income
The Company generally recognizes dividend income on the ex-dividend date for public securities and the record date for private equity investments. Distributions received from private equity investments are evaluated to determine if the distribution should be recorded as dividend income or a return of capital. Generally, the Company will not record distributions from private equity investments as dividend income unless there are sufficient earnings at the portfolio company prior to the distribution. Distributions that are classified as a return of capital are recorded as a reduction in the cost basis of the investment.
Cash and Cash Equivalents and Restricted Cash:
Cash and cash equivalents and restricted cash consist of demand deposits and highly liquid investments with maturities of three months or less, when acquired. The Company places its cash and cash equivalents and restricted cash with financial institutions and, at times, cash held in bank accounts may exceed the Federal Deposit Insurance Corporation ("FDIC")
OAKTREE STRATEGIC INCOME II, INC.
NOTES TO CONSOLIDATED FINANCIAL STATEMENTS
insurance limit. Cash and cash equivalents and restricted cash are included on the Company's Consolidated Schedule of Investments and cash equivalents are classified as Level 1 assets.
As of September 30, 2022 and September 30, 2021, included in restricted cash was $3,794,868 and $4,317,968, respectively, which was held at Deutsche Bank Trust Company Americas in connection with the Company's Citibank Facility (defined in Note 6 – Borrowings). The Company was restricted in terms of access to the $3,794,868 and $4,317,968, respectively, until the occurrence of the periodic distribution dates and, in connection therewith, the Company’s submission of its required periodic reporting schedules and verifications of the Company’s compliance with the terms of the Citibank Facility.
Due from Portfolio Companies:
Due from portfolio companies consists of amounts payable to the Company from its portfolio companies, including proceeds from the sale of portfolio companies not yet received or being held in escrow and excluding those amounts attributable to interest, dividends or fees receivable. These amounts are recognized as they become payable to the Company (e.g., principal payments on the scheduled amortization payment date).
Receivables/Payables from Unsettled Transactions:
Receivables/payables from unsettled transactions consist of amounts receivable to or payable by the Company for transactions that have not settled at the reporting date.
Deferred Financing Costs:
Deferred financing costs consist of fees and expenses paid in connection with the closing or amending of credit facilities. Deferred financing costs incurred in connection with credit facilities are capitalized as an asset when incurred. Deferred financing costs incurred in connection with all other debt arrangements are a direct deduction from the related debt liability when incurred. Deferred financing costs are amortized using the effective interest method over the term of the respective debt arrangement. This amortization expense is included in interest expense in the Company's Consolidated Statements of Operations. Upon early termination or modification of a credit facility, all or a portion of unamortized fees related to such facility may be accelerated into interest expense.
Income Taxes:
The Company has elected to be subject to tax as a RIC under Subchapter M of the Code and intends to operate in a manner so as to qualify for the tax treatment applicable to RICs. In order to be subject to tax as a RIC, among other things, the Company is required to meet certain source of income and asset diversification requirements and timely distribute dividends to its stockholders of an amount generally at least equal to 90% of investment company taxable income, as defined by the Code and determined without regard to any deduction for dividends paid, for each tax year. As a RIC, the Company is not subject to federal income tax on the portion of its taxable income and gains distributed currently to stockholders as a dividend. Depending on the level of taxable income earned during a tax year, the Company may choose to retain taxable income in excess of current year dividend distributions and would distribute such taxable income in the next tax year. The Company would then incur a 4% excise tax on such income, as required. To the extent that the Company determines that its estimated current year annual taxable income, determined on a calendar year basis, could exceed estimated current calendar year dividend distributions, the Company accrues excise tax, if any, on estimated excess taxable income as taxable income is earned. The Company anticipates timely distribution of its taxable income within the tax rules under Subchapter M of the Code. The Company did not incur a U.S. federal excise tax for calendar years 2020 and 2021 and does not expect to incur a U.S. federal excise tax for calendar year 2022.
The Company holds certain portfolio investments through taxable subsidiaries. The purpose of the Company's taxable subsidiaries is to permit the Company to hold equity investments in portfolio companies which are "pass through" entities for U.S. federal income tax purposes in order to comply with the RIC tax requirements. The taxable subsidiaries are consolidated for financial reporting purposes, and portfolio investments held by them are included in the Company’s consolidated financial statements as portfolio investments and recorded at fair value. The taxable subsidiaries are not consolidated with the Company for U.S. federal income tax purposes and may generate income tax expense, or benefit, and the related tax assets and liabilities, as a result of their ownership of certain portfolio investments. This income tax expense, if any, would be reflected in the Company's Consolidated Statements of Operations. The Company uses the liability method to account for its taxable subsidiaries' income taxes. Using this method, the Company recognizes deferred tax assets and liabilities for the estimated future tax effects attributable to temporary differences between financial reporting and tax bases of assets and liabilities. In addition, the Company recognizes deferred tax benefits associated with net operating loss carry forwards that it may use to
OAKTREE STRATEGIC INCOME II, INC.
NOTES TO CONSOLIDATED FINANCIAL STATEMENTS
offset future tax obligations. The Company measures deferred tax assets and liabilities using the enacted tax rates expected to apply to taxable income in the years in which it expects to recover or settle those temporary differences.
FASB ASC Topic 740, Accounting for Uncertainty in Income Taxes ("ASC 740"), provides guidance for how uncertain tax positions should be recognized, measured, presented, and disclosed in the Company's consolidated financial statements. ASC 740 requires the evaluation of tax positions taken or expected to be taken in the course of preparing the Company's tax returns to determine whether the tax positions are "more-likely-than-not" of being sustained by the applicable tax authority. Tax positions not deemed to meet the more-likely-than-not threshold are recorded as a tax benefit or expense in the current year. Management's determinations regarding ASC 740 may be subject to review and adjustment at a later date based upon factors including an ongoing analysis of tax laws, regulations and interpretations thereof. The Company recognizes the tax benefits of uncertain tax positions only where the position is "more likely than not" to be sustained assuming examination by tax authorities. Management has analyzed the Company's tax positions and has concluded that no liability for unrecognized tax benefits should be recorded related to uncertain tax positions taken on returns filed for open tax years 2019, 2020 and 2021. The Company identifies its major tax jurisdictions as U.S. Federal and California, and the Company is not aware of any tax positions for which it is reasonably possible that the total amounts of unrecognized tax benefits will change materially in the next 12 months.
Recently Adopted Accounting Pronouncements
In March 2020, the FASB issued ASU 2020-04, Reference Rate Reform (Topic 848) Facilitation of the Effects of Reference Rate Reform on Financial Reporting, which provides optional expedients and exceptions for applying GAAP to contracts, hedging relationships, and other transactions to ease the potential burden in accounting for (or recognizing the effects of) reference rate reform on financial reporting if certain criteria are met. The guidance is effective from March 12, 2020 through December 31, 2022. As of September 30, 2022, the adoption of this guidance did not have an impact on the Company's consolidated financial statements.
Note 3. Portfolio Investments
Portfolio Composition
As of September 30, 2022, the fair value of the Company's investment portfolio was $559.3 million and was comprised of investments in 115 portfolio companies. As of September 30, 2021, the fair value of the Company's investment portfolio was $575.4 million and was comprised of investments in 108 portfolio companies.
As of September 30, 2022 and September 30, 2021, the Company's investment portfolio consisted of the following:
| | | | | | | | | | | | | | | | | | | | | | | | | | |
| | | September 30, 2022 | | September 30, 2021 |
| Cost: | | | | % of Total Investments | | | | % of Total Investments |
| Senior Secured Debt | | $ | 562,757,842 | | | 97.47 | % | | $ | 554,526,097 | | | 97.57 | % |
| Preferred Equity | | 10,332,238 | | | 1.79 | % | | 7,248,381 | | | 1.28 | % |
| Common Equity & Warrants | | 3,002,893 | | | 0.52 | % | | 2,623,630 | | | 0.46 | % |
| Subordinated Debt | | 1,290,509 | | | 0.22 | % | | 3,905,317 | | | 0.69 | % |
| Total | | $ | 577,383,482 | | | 100.00 | % | | $ | 568,303,425 | | | 100.00 | % |
| | | | | | | | | | | | | | | | | | | | | | | | | | | | | | | | | | | | | | |
| | | September 30, 2022 | | September 30, 2021 |
| Fair Value: | | | | % of Total Investments | | % of Net Assets | | | | % of Total Investments | | % of Net Assets |
| Senior Secured Debt | | $ | 544,289,437 | | | 97.31 | % | | 169.07 | % | | $ | 559,926,869 | | | 97.30 | % | | 161.59 | % |
| Preferred Equity | | 10,928,379 | | | 1.95 | % | | 3.39 | % | | 8,585,636 | | | 1.49 | % | | 2.48 | % |
| Common Equity & Warrants | | 2,830,477 | | | 0.51 | % | | 0.88 | % | | 3,028,295 | | | 0.53 | % | | 0.87 | % |
| Subordinated Debt | | 1,264,763 | | | 0.23 | % | | 0.39 | % | | 3,888,632 | | | 0.68 | % | | 1.12 | % |
| Total | | $ | 559,313,056 | | | 100.00 | % | | 173.74 | % | | $ | 575,429,432 | | | 100.00 | % | | 166.06 | % |
OAKTREE STRATEGIC INCOME II, INC.
NOTES TO CONSOLIDATED FINANCIAL STATEMENTS
The composition of the Company's debt investments as of September 30, 2022 and September 30, 2021 by floating rates and fixed rates was as follows:
| | | | | | | | | | | | | | | | | | | | | | | | | | |
| | | September 30, 2022 | | September 30, 2021 |
| | | Fair Value | | % of Debt Investments | | Fair Value | | % of Debt Investments |
| Floating rate | | $ | 499,406,257 | | | 91.54 | % | | $ | 522,279,872 | | | 92.63 | % |
| Fixed rate | | 46,147,943 | | | 8.46 | % | | 41,535,629 | | | 7.37 | % |
| Total | | $ | 545,554,200 | | | 100.00 | % | | $ | 563,815,501 | | | 100.00 | % |
The geographic composition of the Company's portfolio is determined by the location of the corporate headquarters of the portfolio company, which may not be indicative of the primary source of the portfolio company's business. The following tables show the portfolio composition by geographic region at cost as a percentage of total investments and at fair value as a percentage of total investments and net assets:
| | | | | | | | | | | | | | | | | | | | | | | |
| | September 30, 2022 | | September 30, 2021 |
| Cost: | | | % of Total Investments | | | | % of Total Investments |
| United States | $ | 509,778,567 | | 88.29% | | $ | 489,879,815 | | 86.21% |
| United Kingdom | 34,880,502 | | 6.04% | | 33,461,333 | | 5.89% |
| Switzerland | 11,709,457 | | 2.03% | | 12,733,548 | | 2.24% |
| Australia | 7,766,545 | | 1.35% | | 7,804,890 | | 1.37% |
| Iceland | 6,819,597 | | 1.18% | | 6,762,757 | | 1.19% |
| Luxembourg | 6,428,814 | | 1.11% | | 9,365,580 | | 1.65% |
| Chile | — | | —% | | 4,169,586 | | 0.73% |
| Singapore | — | | —% | | 3,876,279 | | 0.68% |
| Canada | — | | —% | | 249,637 | | 0.04% |
| Total | $ | 577,383,482 | | 100.00% | | $ | 568,303,425 | | 100.00% |
| | | | | | | | | | | | | | | | | | | | | | | | | | | | | | | | | | | |
| | September 30, 2022 | | September 30, 2021 |
| Fair Value: | | | % of Total Investments | | % of Net Assets | | | | % of Total Investments | | % of Net Assets |
| United States | $ | 496,936,709 | | 88.85% | | 154.36% | | $ | 495,262,940 | | 86.07% | | 142.94% |
| United Kingdom | 30,609,111 | | 5.47% | | 9.51% | | 34,344,738 | | 5.97% | | 9.91% |
| Switzerland | 12,030,316 | | 2.15% | | 3.74% | | 12,747,940 | | 2.22% | | 3.68% |
| Australia | 7,715,175 | | 1.38% | | 2.40% | | 7,871,723 | | 1.37% | | 2.27% |
| Iceland | 6,867,718 | | 1.23% | | 2.13% | | 6,873,455 | | 1.19% | | 1.98% |
| Luxembourg | 5,154,027 | | 0.92% | | 1.60% | | 9,807,095 | | 1.70% | | 2.83% |
| Chile | — | | —% | | —% | | 4,238,488 | | 0.74% | | 1.22% |
| Singapore | — | | —% | | —% | | 4,033,053 | | 0.70% | | 1.16% |
| Canada | — | | —% | | —% | | 250,000 | | 0.04% | | 0.07% |
| Total | $ | 559,313,056 | | 100.00% | | 173.74% | | $ | 575,429,432 | | 100.00% | | 166.06% |
OAKTREE STRATEGIC INCOME II, INC.
NOTES TO CONSOLIDATED FINANCIAL STATEMENTS
The composition of the Company's portfolio by industry at cost as a percentage of total investments and at fair value as a percentage of total investments and net assets as of September 30, 2022 and September 30, 2021 was as follows:
| | | | | | | | | | | | | | | | | | | | | | | |
| September 30, 2022 | | September 30, 2021 |
| Cost: | | | % of Total Investments | | | | % of Total Investments |
| Application Software | $ | 113,162,928 | | | 19.54 | % | | $ | 105,037,693 | | | 18.50 | % |
| Pharmaceuticals | 30,805,266 | | | 5.34 | % | | 34,125,774 | | | 6.00 | % |
| Biotechnology | 23,542,336 | | | 4.08 | % | | 32,034,990 | | | 5.64 | % |
| Industrial Machinery | 23,017,473 | | | 3.99 | % | | 20,602,087 | | | 3.63 | % |
| Construction & Engineering | 21,243,653 | | | 3.68 | % | | 20,762,547 | | | 3.65 | % |
| Health Care Technology | 17,840,825 | | | 3.09 | % | | 5,603,266 | | | 0.99 | % |
| Aerospace & Defense | 16,600,715 | | | 2.88 | % | | 16,267,556 | | | 2.86 | % |
| Personal Products | 16,486,415 | | | 2.86 | % | | 28,836,040 | | | 5.07 | % |
| Internet & Direct Marketing Retail | 16,403,640 | | | 2.84 | % | | 16,195,690 | | | 2.85 | % |
| Data Processing & Outsourced Services | 15,741,878 | | | 2.73 | % | | 15,762,361 | | | 2.77 | % |
| Health Care Distributors | 15,740,879 | | | 2.73 | % | | 4,820,334 | | | 0.85 | % |
| Fertilizers & Agricultural Chemicals | 14,140,390 | | | 2.45 | % | | 18,208,561 | | | 3.20 | % |
| Health Care Supplies | 14,020,192 | | | 2.43 | % | | 8,129,966 | | | 1.43 | % |
| Insurance Brokers | 13,682,997 | | | 2.37 | % | | 13,624,213 | | | 2.40 | % |
| Internet Services & Infrastructure | 13,398,814 | | | 2.32 | % | | 12,096,508 | | | 2.13 | % |
| Automotive Retail | 13,378,832 | | | 2.32 | % | | 10,576,274 | | | 1.86 | % |
| Health Care Services | 12,285,121 | | | 2.13 | % | | 15,458,063 | | | 2.72 | % |
| Home Improvement Retail | 11,206,868 | | | 1.94 | % | | 11,374,657 | | | 2.00 | % |
| Airport Services | 10,623,779 | | | 1.84 | % | | 10,385,781 | | | 1.83 | % |
| Integrated Telecommunication Services | 9,637,264 | | | 1.67 | % | | 10,490,500 | | | 1.85 | % |
| Distributors | 9,625,446 | | | 1.67 | % | | — | | | — | % |
| Metal & Glass Containers | 9,213,008 | | | 1.60 | % | | 5,553,715 | | | 0.98 | % |
| Real Estate Services | 8,639,926 | | | 1.50 | % | | 8,710,292 | | | 1.53 | % |
| Cable & Satellite | 8,443,937 | | | 1.46 | % | | 8,910,000 | | | 1.57 | % |
| Soft Drinks | 8,286,000 | | | 1.44 | % | | 8,077,613 | | | 1.42 | % |
| Other Diversified Financial Services | 7,963,603 | | | 1.38 | % | | 6,559,321 | | | 1.15 | % |
| Movies & Entertainment | 7,766,545 | | | 1.35 | % | | 7,804,890 | | | 1.37 | % |
| Electrical Components & Equipment | 7,210,483 | | | 1.25 | % | | 7,225,215 | | | 1.27 | % |
| Leisure Facilities | 6,688,829 | | | 1.16 | % | | 4,329,641 | | | 0.76 | % |
| Oil & Gas Storage & Transportation | 5,740,538 | | | 0.99 | % | | 9,659,457 | | | 1.70 | % |
| IT Consulting & Other Services | 5,620,175 | | | 0.97 | % | | 5,644,359 | | | 0.99 | % |
| Specialized Finance | 5,437,095 | | | 0.94 | % | | 4,499,017 | | | 0.79 | % |
| Environmental & Facilities Services | 5,005,458 | | | 0.87 | % | | — | | | — | % |
| Real Estate Operating Companies | 4,981,666 | | | 0.86 | % | | 6,983,385 | | | 1.23 | % |
| Education Services | 4,916,870 | | | 0.85 | % | | — | | | — | % |
| Home Furnishings | 4,727,174 | | | 0.82 | % | | 4,723,943 | | | 0.83 | % |
| Diversified Support Services | 4,518,607 | | | 0.78 | % | | 4,469,808 | | | 0.79 | % |
| Health Care Equipment | 4,476,870 | | | 0.78 | % | | 4,351,936 | | | 0.77 | % |
| Communications Equipment | 4,204,134 | | | 0.73 | % | | 4,698,738 | | | 0.83 | % |
| Restaurants | 3,355,000 | | | 0.58 | % | | 3,347,525 | | | 0.59 | % |
| Paper Packaging | 3,244,640 | | | 0.56 | % | | — | | | — | % |
| Hotels, Resorts & Cruise Lines | 3,228,519 | | | 0.56 | % | | — | | | — | % |
| Property & Casualty Insurance | 2,852,065 | | | 0.49 | % | | — | | | — | % |
| Leisure Products | 2,461,400 | | | 0.43 | % | | 8,083,405 | | | 1.42 | % |
| Consumer Finance | 2,246,458 | | | 0.39 | % | | — | | | — | % |
| Oil & Gas Refining & Marketing | 2,006,067 | | | 0.35 | % | | 7,671,686 | | | 1.35 | % |
| Systems Software | 1,911,355 | | | 0.33 | % | | — | | | — | % |
| Air Freight & Logistics | 1,504,777 | | | 0.26 | % | | — | | | — | % |
| Food Distributors | 1,493,034 | | | 0.26 | % | | 1,486,303 | | | 0.26 | % |
| Research & Consulting Services | 1,374,876 | | | 0.24 | % | | 2,362,030 | | | 0.42 | % |
| Diversified Banks | 1,129,465 | | | 0.20 | % | | 1,129,465 | | | 0.20 | % |
| Alternative Carriers | 1,072,841 | | | 0.19 | % | | 964,264 | | | 0.17 | % |
| Construction Materials | 840,786 | | | 0.15 | % | | 809,832 | | | 0.14 | % |
| Specialty Chemicals | 716,095 | | | 0.12 | % | | 716,095 | | | 0.13 | % |
| Health Care Facilities | 714,432 | | | 0.12 | % | | — | | | — | % |
| Housewares & Specialties | 585,661 | | | 0.10 | % | | 645,632 | | | 0.11 | % |
OAKTREE STRATEGIC INCOME II, INC.
NOTES TO CONSOLIDATED FINANCIAL STATEMENTS
| | | | | | | | | | | | | | | | | | | | | | | |
| September 30, 2022 | | September 30, 2021 |
| Cost: | | | % of Total Investments | | | | % of Total Investments |
| Advertising | $ | 219,382 | | | 0.04 | % | | $ | — | | | — | % |
| Independent Power Producers & Energy Traders | — | | | — | % | | 7,574,559 | | | 1.33 | % |
| Airlines | — | | | — | % | | 4,169,586 | | | 0.73 | % |
| Managed Health Care | — | | | — | % | | 3,918,152 | | | 0.69 | % |
| Interactive Media & Services | — | | | — | % | | 3,876,279 | | | 0.68 | % |
| Thrifts & Mortgage Finance | — | | | — | % | | 3,748,666 | | | 0.66 | % |
| Forest Products | — | | | — | % | | 1,939,746 | | | 0.34 | % |
| Electric Utilities | — | | | — | % | | 1,641,216 | | | 0.29 | % |
| Electronic Components | — | | | — | % | | 1,375,156 | | | 0.24 | % |
| Food Retail | — | | | — | % | | 249,637 | | | 0.04 | % |
| Total | $ | 577,383,482 | | | 100.00 | % | | $ | 568,303,425 | | | 100.00 | % |
| | | | | | | | | | | | | | | | | | | | | | | | | | | | | | | | | | | |
| September 30, 2022 | | September 30, 2021 |
| Fair Value: | | | % of Total Investments | | % of Net Assets | | | | % of Total Investments | | % of Net Assets |
| Application Software | $ | 110,245,600 | | | 19.69 | % | | 34.23 | % | | $ | 105,949,514 | | | 18.42 | % | | 30.58 | % |
| Pharmaceuticals | 29,499,059 | | | 5.27 | % | | 9.16 | % | | 34,958,925 | | | 6.08 | % | | 10.09 | % |
| Biotechnology | 23,425,603 | | | 4.19 | % | | 7.28 | % | | 32,486,832 | | | 5.65 | % | | 9.38 | % |
| Industrial Machinery | 22,764,332 | | | 4.07 | % | | 7.07 | % | | 20,988,046 | | | 3.65 | % | | 6.06 | % |
| Construction & Engineering | 21,107,433 | | | 3.77 | % | | 6.56 | % | | 20,902,686 | | | 3.63 | % | | 6.03 | % |
| Health Care Technology | 17,538,770 | | | 3.14 | % | | 5.45 | % | | 5,649,515 | | | 0.98 | % | | 1.63 | % |
| Internet & Direct Marketing Retail | 16,982,553 | | | 3.04 | % | | 5.28 | % | | 17,697,267 | | | 3.08 | % | | 5.11 | % |
| Aerospace & Defense | 16,416,382 | | | 2.94 | % | | 5.10 | % | | 16,188,169 | | | 2.81 | % | | 4.67 | % |
| Personal Products | 15,487,059 | | | 2.77 | % | | 4.81 | % | | 29,379,063 | | | 5.11 | % | | 8.48 | % |
| Data Processing & Outsourced Services | 15,445,789 | | | 2.76 | % | | 4.80 | % | | 15,774,549 | | | 2.74 | % | | 4.55 | % |
| Health Care Distributors | 15,412,232 | | | 2.76 | % | | 4.79 | % | | 4,816,700 | | | 0.84 | % | | 1.39 | % |
| Fertilizers & Agricultural Chemicals | 14,814,205 | | | 2.65 | % | | 4.60 | % | | 18,311,828 | | | 3.18 | % | | 5.28 | % |
| Health Care Supplies | 13,961,710 | | | 2.50 | % | | 4.34 | % | | 8,168,802 | | | 1.42 | % | | 2.36 | % |
| Automotive Retail | 13,253,653 | | | 2.37 | % | | 4.12 | % | | 10,657,160 | | | 1.85 | % | | 3.08 | % |
| Internet Services & Infrastructure | 13,148,590 | | | 2.35 | % | | 4.08 | % | | 12,211,475 | | | 2.12 | % | | 3.52 | % |
| Insurance Brokers | 12,193,361 | | | 2.18 | % | | 3.79 | % | | 14,797,626 | | | 2.57 | % | | 4.27 | % |
| Health Care Services | 11,352,541 | | | 2.03 | % | | 3.53 | % | | 15,732,690 | | | 2.73 | % | | 4.54 | % |
| Home Improvement Retail | 11,113,634 | | | 1.99 | % | | 3.45 | % | | 11,374,695 | | | 1.98 | % | | 3.28 | % |
| Airport Services | 10,427,163 | | | 1.86 | % | | 3.24 | % | | 10,086,433 | | | 1.75 | % | | 2.91 | % |
| Distributors | 9,262,847 | | | 1.66 | % | | 2.88 | % | | — | | | — | % | | — | % |
| Metal & Glass Containers | 9,125,812 | | | 1.63 | % | | 2.83 | % | | 5,564,989 | | | 0.97 | % | | 1.61 | % |
| Integrated Telecommunication Services | 9,026,850 | | | 1.61 | % | | 2.80 | % | | 10,928,339 | | | 1.90 | % | | 3.15 | % |
| Real Estate Services | 8,402,738 | | | 1.50 | % | | 2.61 | % | | 8,753,513 | | | 1.52 | % | | 2.53 | % |
| Soft Drinks | 8,140,301 | | | 1.46 | % | | 2.53 | % | | 8,077,585 | | | 1.40 | % | | 2.33 | % |
| Cable & Satellite | 7,955,776 | | | 1.42 | % | | 2.47 | % | | 9,015,930 | | | 1.57 | % | | 2.60 | % |
| Movies & Entertainment | 7,715,175 | | | 1.38 | % | | 2.40 | % | | 7,871,723 | | | 1.37 | % | | 2.27 | % |
| Electrical Components & Equipment | 7,032,453 | | | 1.26 | % | | 2.18 | % | | 7,227,759 | | | 1.26 | % | | 2.09 | % |
| Leisure Facilities | 6,738,327 | | | 1.20 | % | | 2.09 | % | | 4,430,889 | | | 0.77 | % | | 1.28 | % |
| Other Diversified Financial Services | 6,597,698 | | | 1.18 | % | | 2.05 | % | | 6,415,445 | | | 1.11 | % | | 1.85 | % |
| Oil & Gas Storage & Transportation | 5,311,619 | | | 0.95 | % | | 1.65 | % | | 8,771,281 | | | 1.52 | % | | 2.53 | % |
| Real Estate Operating Companies | 5,092,946 | | | 0.91 | % | | 1.58 | % | | 7,120,371 | | | 1.24 | % | | 2.05 | % |
| Environmental & Facilities Services | 4,940,486 | | | 0.88 | % | | 1.53 | % | | — | | | — | % | | — | % |
| Education Services | 4,660,125 | | | 0.83 | % | | 1.45 | % | | — | | | — | % | | — | % |
| Specialized Finance | 4,632,902 | | | 0.83 | % | | 1.44 | % | | 4,578,283 | | | 0.80 | % | | 1.32 | % |
| Health Care Equipment | 4,441,773 | | | 0.79 | % | | 1.38 | % | | 4,368,523 | | | 0.76 | % | | 1.26 | % |
| Diversified Support Services | 4,409,283 | | | 0.79 | % | | 1.37 | % | | 4,449,622 | | | 0.77 | % | | 1.28 | % |
| Home Furnishings | 4,397,813 | | | 0.79 | % | | 1.37 | % | | 4,771,890 | | | 0.83 | % | | 1.38 | % |
| IT Consulting & Other Services | 4,134,683 | | | 0.74 | % | | 1.28 | % | | 5,772,258 | | | 1.00 | % | | 1.67 | % |
| Communications Equipment | 4,082,065 | | | 0.73 | % | | 1.27 | % | | 4,784,763 | | | 0.83 | % | | 1.38 | % |
| Hotels, Resorts & Cruise Lines | 3,234,470 | | | 0.58 | % | | 1.00 | % | | — | | | — | % | | — | % |
| Paper Packaging | 3,224,189 | | | 0.58 | % | | 1.00 | % | | — | | | — | % | | — | % |
| Restaurants | 3,123,379 | | | 0.56 | % | | 0.97 | % | | 3,396,250 | | | 0.59 | % | | 0.98 | % |
| Property & Casualty Insurance | 2,566,875 | | | 0.46 | % | | 0.80 | % | | — | | | — | % | | — | % |
| Consumer Finance | 2,059,200 | | | 0.37 | % | | 0.64 | % | | — | | | — | % | | — | % |
OAKTREE STRATEGIC INCOME II, INC.
NOTES TO CONSOLIDATED FINANCIAL STATEMENTS
| | | | | | | | | | | | | | | | | | | | | | | | | | | | | | | | | | | |
| September 30, 2022 | | September 30, 2021 |
| Fair Value: | | | % of Total Investments | | % of Net Assets | | | | % of Total Investments | | % of Net Assets |
| Oil & Gas Refining & Marketing | $ | 2,031,903 | | | 0.36 | % | | 0.63 | % | | $ | 7,777,211 | | | 1.35 | % | | 2.24 | % |
| Leisure Products | 2,009,813 | | | 0.36 | % | | 0.62 | % | | 8,091,483 | | | 1.41 | % | | 2.34 | % |
| Systems Software | 1,825,066 | | | 0.33 | % | | 0.57 | % | | — | | | — | % | | — | % |
| Air Freight & Logistics | 1,357,516 | | | 0.24 | % | | 0.42 | % | | — | | | — | % | | — | % |
| Research & Consulting Services | 1,224,826 | | | 0.22 | % | | 0.38 | % | | 2,442,962 | | | 0.42 | % | | 0.71 | % |
| Diversified Banks | 1,092,952 | | | 0.20 | % | | 0.34 | % | | 1,144,401 | | | 0.20 | % | | 0.33 | % |
| Food Distributors | 1,081,854 | | | 0.19 | % | | 0.34 | % | | 1,501,725 | | | 0.26 | % | | 0.43 | % |
| Alternative Carriers | 961,234 | | | 0.17 | % | | 0.30 | % | | 1,001,020 | | | 0.17 | % | | 0.29 | % |
| Health Care Facilities | 709,757 | | | 0.13 | % | | 0.22 | % | | — | | | — | % | | — | % |
| Construction Materials | 697,527 | | | 0.12 | % | | 0.22 | % | | 847,865 | | | 0.15 | % | | 0.24 | % |
| Housewares & Specialties | 644,317 | | | 0.12 | % | | 0.20 | % | | 689,765 | | | 0.12 | % | | 0.20 | % |
| Specialty Chemicals | 565,243 | | | 0.10 | % | | 0.18 | % | | 732,453 | | | 0.13 | % | | 0.21 | % |
| Advertising | 211,594 | | | 0.04 | % | | 0.07 | % | | — | | | — | % | | — | % |
| Independent Power Producers & Energy Traders | — | | | — | % | | — | % | | 7,554,375 | | | 1.31 | % | | 2.18 | % |
| Airlines | — | | | — | % | | — | % | | 4,238,488 | | | 0.74 | % | | 1.22 | % |
| Interactive Media & Services | — | | | — | % | | — | % | | 4,033,053 | | | 0.70 | % | | 1.16 | % |
| Managed Health Care | — | | | — | % | | — | % | | 3,925,150 | | | 0.68 | % | | 1.13 | % |
| Thrifts & Mortgage Finance | — | | | — | % | | — | % | | 3,830,807 | | | 0.67 | % | | 1.11 | % |
| Forest Products | — | | | — | % | | — | % | | 1,964,238 | | | 0.34 | % | | 0.57 | % |
| Electric Utilities | — | | | — | % | | — | % | | 1,578,793 | | | 0.27 | % | | 0.46 | % |
| Electronic Components | — | | | — | % | | — | % | | 1,394,255 | | | 0.24 | % | | 0.40 | % |
| Food Retail | — | | | — | % | | — | % | | 250,000 | | | 0.04 | % | | 0.07 | % |
| Total | $ | 559,313,056 | | | 100.00 | % | | 173.74 | % | | $ | 575,429,432 | | | 100.00 | % | | 166.06 | % |
Fair Value Measurements
The following table presents the financial instruments carried at fair value as of September 30, 2022 on the Company's Consolidated Statements of Assets and Liabilities for each of the three levels of hierarchy established by ASC 820:
| | | | | | | | | | | | | | | | | | | | | | | | | | |
| | Level 1 | | Level 2 | | Level 3 | | Total |
| Senior secured debt | | $ | — | | | $ | 98,566,491 | | | $ | 445,722,946 | | | $ | 544,289,437 | |
| Subordinated debt | | — | | | 305,784 | | | 958,979 | | | 1,264,763 | |
| Common equity & warrants | | 562,114 | | | — | | | 2,268,363 | | | 2,830,477 | |
| Preferred equity | | — | | | — | | | 10,928,379 | | | 10,928,379 | |
| Total investments at fair value | | $ | 562,114 | | | $ | 98,872,275 | | | $ | 459,878,667 | | | $ | 559,313,056 | |
| Derivative asset | | — | | | 1,746,307 | | | — | | | 1,746,307 | |
| Total assets at fair value | | $ | 562,114 | | | $ | 100,618,582 | | | $ | 459,878,667 | | | $ | 561,059,363 | |
OAKTREE STRATEGIC INCOME II, INC.
NOTES TO CONSOLIDATED FINANCIAL STATEMENTS
The following table presents the financial instruments carried at fair value as of September 30, 2021 on the Company's Consolidated Statements of Assets and Liabilities for each of the three levels of hierarchy established by ASC 820:
| | | | | | | | | | | | | | | | | | | | | | | | | | |
| | Level 1 | | Level 2 | | Level 3 | | Total |
| Senior secured debt | | $ | — | | | $ | 117,763,997 | | | $ | 442,162,872 | | | $ | 559,926,869 | |
| Subordinated debt | | — | | | — | | | 3,888,632 | | | 3,888,632 | |
| Common equity & warrants | | 122,080 | | | — | | | 2,906,215 | | | 3,028,295 | |
| Preferred equity | | — | | | — | | | 8,585,636 | | | 8,585,636 | |
| Total investments at fair value | | $ | 122,080 | | | $ | 117,763,997 | | | $ | 457,543,355 | | | $ | 575,429,432 | |
| Derivative asset | | — | | | 618,004 | | | — | | | 618,004 | |
| Total assets at fair value | | $ | 122,080 | | | $ | 118,382,001 | | | $ | 457,543,355 | | | $ | 576,047,436 | |
When a determination is made to classify a financial instrument within Level 3 of the valuation hierarchy, the determination is based upon the fact that the unobservable factors are significant to the overall fair value measurement. However, Level 3 financial instruments typically have both unobservable or Level 3 components and observable components (i.e. components that are actively quoted and can be validated by external sources). Accordingly, the appreciation (depreciation) in the tables below includes changes in fair value due in part to observable factors that are part of the valuation methodology.
The principal value of the Company's credit facilities payable approximates fair value due to its variable rates and is included in Level 3 of the hierarchy. The principal value of the secured borrowings approximates fair value due to its short-term nature and is included in Level 3 of the hierarchy.
The following table provides a roll-forward of the changes in fair value from September 30, 2021 to September 30, 2022, for all investments for which the Company determined fair value using unobservable (Level 3) factors:
| | | | | | | | | | | | | | | | | | | | | | | | | | | | | | | | |
| | Senior Secured Debt | | Subordinated Debt | | Preferred Equity | | Common Equity & Warrants | | Total |
| Fair value as of September 30, 2021 | | $ | 442,162,872 | | | $ | 3,888,632 | | | $ | 8,585,636 | | | $ | 2,906,215 | | | $ | 457,543,355 | |
| Purchases | | 104,759,942 | | | 715,861 | | | 3,083,857 | | | 630,970 | | | 109,190,630 | |
| Sales and repayments | | (107,184,626) | | | (3,809,006) | | | — | | | (186,573) | | | (111,180,205) | |
| Transfers in (a)(c) | | 14,434,719 | | | — | | | — | | | — | | | 14,434,719 | |
| Transfers out (a)(b) | | (3,851,936) | | | — | | | — | | | (788,800) | | | (4,640,736) | |
| Capitalized PIK interest income | | 4,579,961 | | | 56,759 | | | — | | | — | | | 4,636,720 | |
| Accretion of OID | | 4,527,728 | | | 85,740 | | | — | | | — | | | 4,613,468 | |
| Net unrealized appreciation (depreciation) | | (13,797,305) | | | 20,993 | | | (741,114) | | | (299,838) | | | (14,817,264) | |
| Net realized gains (losses) | | 91,591 | | | — | | | — | | | 6,389 | | | 97,980 | |
| Fair value as of September 30, 2022 | | $ | 445,722,946 | | | $ | 958,979 | | | $ | 10,928,379 | | | $ | 2,268,363 | | | $ | 459,878,667 | |
| Net unrealized appreciation (depreciation) relating to Level 3 assets still held at September 30, 2022 and reported within net unrealized appreciation (depreciation) in the Consolidated Statement of Operations for the year ended September 30, 2022 | | $ | (12,501,981) | | | $ | (5,931) | | | $ | (741,114) | | | $ | (299,838) | | | $ | (13,548,864) | |
__________(a) There were transfers into/out of Level 3 from/to Level 2 for certain investments during the year ended September 30, 2022 as a result of a change in the number of market quotes available and/or a change in market liquidity.
(b) One transfer out was the result of a transaction in which Level 3 common equity was exchanged for Level 1 common equity.
(c) There was one transfer into Level 3 from Level 2 as a result of an investment restructuring in which Level 2 senior secured debt was exchanged for Level 3 senior secured debt.
OAKTREE STRATEGIC INCOME II, INC.
NOTES TO CONSOLIDATED FINANCIAL STATEMENTS
The following table provides a roll-forward of the changes in fair value from September 30, 2020 to September 30, 2021, for all investments for which the Company determined fair value using unobservable (Level 3) factors:
| | | | | | | | | | | | | | | | | | | | | | | | | | | | | | | | |
| | Senior Secured Debt | | Subordinated Debt | | Preferred Equity | | Common Equity & Warrants | | Total |
| Fair value as of September 30, 2020 | | $ | 205,373,831 | | | $ | 10,164,710 | | | $ | 118,004 | | | $ | 1,826,297 | | | $ | 217,482,842 | |
| Purchases | | 292,106,680 | | | 4,279,199 | | | 7,138,096 | | | 819,613 | | | 304,343,588 | |
| Sales and repayments | | (62,114,347) | | | (11,287,599) | | | — | | | — | | | (73,401,946) | |
| Transfers in (a) | | — | | | — | | | — | | | 854,309 | | | 854,309 | |
| Transfers out (a)(b) | | (3,417,435) | | | — | | | — | | | — | | | (3,417,435) | |
| PIK interest income | | 3,724,280 | | | — | | | — | | | — | | | 3,724,280 | |
| Accretion of OID | | 2,712,562 | | | 192,204 | | | — | | | — | | | 2,904,766 | |
| Net unrealized appreciation (depreciation) | | 3,656,049 | | | (757,820) | | | 1,329,536 | | | (594,004) | | | 3,633,761 | |
| Net realized gains (losses) | | 121,252 | | | 1,297,938 | | | — | | | — | | | 1,419,190 | |
| Fair value as of September 30, 2021 | | $ | 442,162,872 | | | $ | 3,888,632 | | | $ | 8,585,636 | | | $ | 2,906,215 | | | $ | 457,543,355 | |
| Net unrealized appreciation (depreciation) relating to Level 3 assets still held at September 30, 2021 and reported within net unrealized appreciation (depreciation) in the Consolidated Statement of Operations for the year ended September 30, 2021 | | $ | 5,574,772 | | | $ | (16,686) | | | $ | 1,329,535 | | | $ | (234,803) | | | $ | 6,652,818 | |
__________
(a) There was one transfer from senior secured debt to common equity and warrants during the year ended September 30, 2021 as a result of an investment restructuring, in which $0.9 million of senior secured debt was exchanged for $0.9 million of common equity.
(b) There were transfers from Level 3 to Level 2 for certain investments during the year ended September 30, 2021 as a result of a change in the number of market quotes available and/or a change in market liquidity.
Significant Unobservable Inputs for Level 3 Investments
The following table provides quantitative information related to the significant unobservable inputs for Level 3 investments, which were carried at fair value as of September 30, 2022:
| | | | | | | | | | | | | | | | | | | | | | | | | | | | | | | | | | | | | | | | | |
| Asset | | Fair Value | | Valuation Technique | | Unobservable Input | | Range | | Weighted
Average (a) |
| Senior secured debt | | $ | 371,353,394 | | | Market Yield | | Market Yield | | (b) | 10.0% | - | 30.0% | | 13.7% |
| | 74,369,552 | | | Broker Quotations | | Broker Quoted Price | | (c) | N/A | - | N/A | | N/A |
| Subordinated debt | | 958,979 | | | Market Yield | | Market Yield | | (b) | 18.0% | - | 20.0% | | 19.0% |
| Common equity & warrants & preferred equity | | 108,233 | | | Transaction Precedent | | Transaction Price | | (e) | N/A | - | N/A | | N/A |
| | 8,248,979 | | | Enterprise Value | | Revenue Multiple | | (d) | 0.6x | - | 10.1x | | 7.7x |
| | 4,839,530 | | | Enterprise Value | | EBITDA Multiple | | (d) | 4.5x | - | 20.0x | | 14.0x |
| Total | | $ | 459,878,667 | | | | | | | | | | | | |
_____________________
(a) Weighted averages are calculated based on fair value of investments.
(b) Used when market participant would take into account market yield when pricing the investment.
(c) The Adviser generally uses prices provided by an independent pricing service which are non-binding indicative prices on or near the valuation date as the primary basis for the fair value determinations for quoted senior secured debt investments. Since these prices are non-binding, they may not be indicative of fair value. The Adviser evaluates the quotations provided by pricing vendors and brokers based on available market information, including trading activity of the subject or similar securities, or by performing a comparable security analysis to ensure that fair values are reasonably estimated.
(d) Used when market participant would use such multiple when pricing the investment.
(e) Used when there is an observable transaction or pending event for the investment.
OAKTREE STRATEGIC INCOME II, INC.
NOTES TO CONSOLIDATED FINANCIAL STATEMENTS
The following table provides quantitative information related to the significant unobservable inputs for Level 3 investments, which were carried at fair value as of September 30, 2021:
| | | | | | | | | | | | | | | | | | | | | | | | | | | | | | | | | | | | | | | | | |
| Asset | | Fair Value | | Valuation Technique | | Unobservable Input | | Range | | Weighted
Average (a) |
| Senior secured debt | | $ | 337,518,859 | | | Market Yield | | Market Yield | | (b) | 4.0% | - | 30.0% | | 10.3% |
| | 104,644,013 | | | Broker Quotations | | Broker Quoted Price | | (c) | N/A | - | N/A | | N/A |
| Subordinated debt | | 3,888,632 | | | Market Yield | | Market Yield | | (b) | 12.0% | - | 14.0% | | 12.6% |
| Common equity & warrants & preferred equity | | 915,261 | | | Enterprise Value | | Revenue Multiple | | (d) | 1.0x | - | 11.2x | | 2.5x |
| | 9,722,281 | | | Enterprise Value | | EBITDA multiple | | (d) | 6.0x | - | 35.0x | | 30.5x |
| | 854,309 | | | Transactions Precedent | | Transaction price | | (e) | N/A | - | N/A | | N/A |
| Total | | $ | 457,543,355 | | | | | | | | | | | | |
_____________________
(a) Weighted averages are calculated based on fair value of investments.
(b) Used when market participant would take into account market yield when pricing the investment.
(c) The Company generally uses prices provided by an independent pricing service which are non-binding indicative prices on or near the valuation date as the primary basis for the fair value determinations for quoted senior secured debt investments. Since these prices are non-binding, they may not be indicative of fair value. The Company evaluates the quotations provided by pricing vendors and brokers based on available market information, including trading activity of the subject or similar securities, or by performing a comparable security analysis to ensure that fair values are reasonably estimated.
(d) Used when market participant would use such multiple when pricing the investment.
(e) Used when there is an observable transaction or pending event for the investment.
Under the market yield technique, the significant unobservable input used in the fair value measurement of the Company's investments in debt securities is the market yield. Increases or decreases in the market yield may result in a lower or higher fair value measurement, respectively.
Under the enterprise value technique, the significant unobservable input used in the fair value measurement of the Company's investments is the EBITDA, revenue or asset multiple, as applicable. Increases or decreases in the valuation multiples in isolation may result in a higher or lower fair value measurement, respectively.
Note 4. Fee Income
For the years ended September 30, 2022, 2021 and 2020, the Company recorded total fee income of $1,600,512, $4,155,818 and $2,315,769, respectively, of which $137,794, $69,626 and $50,329, respectively, was recurring in nature. Recurring fee income primarily consisted of servicing fees and exit fees.
Note 5. Share Data and Distributions
Earnings per Share
The following table sets forth the computation of basic and diluted earnings per share, pursuant to FASB ASC Topic 260-10, Earnings per Share, for the years ended September 30, 2022, 2021 and 2020:
| | | | | | | | | | | | | | | | | | | | |
| | Year ended September 30, 2022 | | Year ended September 30, 2021 | | Year ended September 30, 2020 |
| Earnings (loss) per common share — basic and diluted: | | | | | | |
| Net increase (decrease) in net assets resulting from operations | | $ | 12,135,818 | | | $ | 36,739,845 | | | $ | 22,307,607 | |
| Weighted average common shares outstanding | | 17,401,121 | | | 17,401,121 | | | 12,422,418 | |
| Earnings (loss) per common share — basic and diluted | | $ | 0.70 | | | $ | 2.11 | | | $ | 1.80 | |
OAKTREE STRATEGIC INCOME II, INC.
NOTES TO CONSOLIDATED FINANCIAL STATEMENTS
Changes in Net Assets
The following table presents the changes in net assets for the years ended September 30, 2022, 2021 and 2020:
| | | | | | | | | | | | | | | | | | | | | | | | | | | | | | | | |
| | Common Stock | | | | | | |
| | Shares | | Par Value | | Additional Paid-in-Capital | | Accumulated Distributable Earnings (Loss) | | Total Net Assets |
| Balance at September 30, 2019 | | 8,309,861 | | | $ | 8,310 | | | $ | 168,819,173 | | | $ | 2,799,267 | | | $ | 171,626,750 | |
| Net investment income | | — | | | — | | | — | | | 17,170,080 | | | 17,170,080 | |
| Net unrealized appreciation (depreciation) | | — | | | — | | | — | | | (1,439,671) | | | (1,439,671) | |
| Net realized gains (losses) | | — | | | — | | | — | | | 6,570,831 | | | 6,570,831 | |
| Provision for income tax (expense) benefit | | — | | | — | | | — | | | 6,367 | | | 6,367 | |
| Reclassification of additional paid-in-capital | | — | | | — | | | (189,082) | | | 189,082 | | | — | |
| Issuance of common stock | | 9,091,260 | | | 9,091 | | | 168,707,907 | | | — | | | 168,716,998 | |
| Distributions to stockholders | | — | | | — | | | — | | | (15,649,588) | | | (15,649,588) | |
| Balance at September 30, 2020 | | 17,401,121 | | | $ | 17,401 | | | $ | 337,337,998 | | | $ | 9,646,368 | | | $ | 347,001,767 | |
| Net investment income | | — | | | — | | | — | | | 26,592,831 | | | 26,592,831 | |
| Net unrealized appreciation (depreciation) | | — | | | — | | | — | | | 7,280,860 | | | 7,280,860 | |
| Net realized gains (losses) | | — | | | — | | | — | | | 2,992,242 | | | 2,992,242 | |
| Provision for income tax (expense) benefit | | — | | | — | | | — | | | (126,088) | | | (126,088) | |
| Distributions to stockholders | | — | | | — | | | — | | | (37,238,403) | | | (37,238,403) | |
| Balance at September 30, 2021 | | 17,401,121 | | | $ | 17,401 | | | $ | 337,337,998 | | | $ | 9,147,810 | | | $ | 346,503,209 | |
| Net investment income | | — | | | — | | | — | | | 32,880,762 | | | 32,880,762 | |
| Net unrealized appreciation (depreciation) | | — | | | — | | | — | | | (24,139,553) | | | (24,139,553) | |
| Net realized gains (losses) | | — | | | — | | | — | | | 3,323,075 | | | 3,323,075 | |
| Provision for income tax (expense) benefit | | — | | | — | | | — | | | 71,534 | | | 71,534 | |
| Distributions to stockholders | | — | | | — | | | — | | | (36,716,365) | | | (36,716,365) | |
| Balance at September 30, 2022 | | 17,401,121 | | | $ | 17,401 | | | $ | 337,337,998 | | | $ | (15,432,737) | | | $ | 321,922,662 | |
Capital Activity
As of September 30, 2022 and September 30, 2021, the Company completed drawdowns of $337,558,996, or 100%, of Capital Commitments from investors in connection with Private Offerings, of which $3,854,346 in Capital Commitments were made by one or more affiliates of the Adviser.
The Company has the authority to issue 250,000,000 shares of Common Stock, $0.001 per share par value and 100,000,000 shares of preferred stock, $0.001 per share par value. The following table summarizes total shares issued and proceeds related to capital drawdowns delivered pursuant to the Subscription Agreements for the Company’s Common Stock through September 30, 2022:
| | | | | | | | | | | | | | | | | | | | |
| | Shares Issued | | Price per Share | | Proceeds |
| August 6, 2018 (1) | | 770,869 | | | $ | 20.00 | | | $ | 15,417,385 | |
| September 17, 2018 | | 770,869 | | | 20.00 | | | 15,417,384 | |
| October 29, 2018 | | 1,060,964 | | | 19.85 | | | 21,060,130 | |
| November 15, 2018 | | 789,198 | | | 19.82 | | | 15,641,900 | |
| April 29, 2019 | | 1,655,314 | | | 20.40 | | | 33,768,400 | |
| August 30, 2019 | | 1,631,324 | | | 20.70 | | | 33,768,400 | |
| September 23, 2019 | | 1,631,323 | | | 20.70 | | | 33,768,399 | |
| March 26, 2020 (2) | | 3,263,385 | | | 20.68 | | | 67,486,799 | |
| April 30, 2020 (2) | | 5,827,875 | | | 17.37 | | | 101,230,199 | |
| Total | | 17,401,121 | | | | | $ | 337,558,996 | |
__________________
(1)Includes 50 shares issued to one or more affiliates of the Adviser on July 23, 2018.
OAKTREE STRATEGIC INCOME II, INC.
NOTES TO CONSOLIDATED FINANCIAL STATEMENTS
(2)For the March 26, 2020 and April 30, 2020 drawdowns, the shares issued exclude 2,418 shares and 4,318 shares, respectively, related to defaulted investors. In connection with these defaults, Capital Commitments and proceeds from capital drawdowns were each reduced by $125,000.
Distributions
Distributions to common stockholders are recorded on the ex-dividend date. The Company is required to distribute dividends each tax year to its stockholders of an amount generally at least equal to 90% of its investment company taxable income, determined without regard to any deduction for dividends paid, in order to be eligible for tax benefits allowed to a RIC under Subchapter M of the Code. The Company anticipates paying out as a distribution all or substantially all of those amounts. The amount to be paid out as a dividend is determined by the board of directors and is based on management’s estimate of the Company’s annual taxable income. Net realized capital gains, if any, may be distributed to stockholders or retained for reinvestment.
The following table reflects the distributions per share that the Company has paid on its common stock during the year ended September 30, 2022:
| | | | | | | | | | | | | | | | | | | | | | | | | | |
| Distribution Type | | Record Date | | Payment Date | | Amount
per Share | | Cash Distribution |
| Quarterly | | December 15, 2021 | | December 28, 2021 | | $ | 0.42 | | | $ | 7,308,472 | |
| Special | | December 15, 2021 | | December 28, 2021 | | 0.38 | | | 6,612,424 | |
| Quarterly | | March 15, 2022 | | March 28, 2022 | | 0.43 | | | 7,482,481 | |
| Quarterly | | June 15, 2022 | | June 30, 2022 | | 0.44 | | | 7,656,494 | |
| Quarterly | | September 15, 2022 | | September 27, 2022 | | 0.44 | | | 7,656,494 | |
| | | | | | $ | 2.11 | | | $ | 36,716,365 | |
The following table reflects the distributions per share that the Company has paid on its common stock during the year ended September 30, 2021:
| | | | | | | | | | | | | | | | | | | | | | | | | | |
| Distribution Type | | Record Date | | Payment Date | | Amount
per Share | | Cash Distribution |
| Quarterly | | December 15, 2020 | | December 31, 2020 | | $ | 0.35 | | | $ | 6,090,393 | |
| Special | | December 15, 2020 | | December 31, 2020 | | 0.62 | | | 10,788,696 | |
| Quarterly | | March 15, 2021 | | March 26, 2021 | | 0.35 | | | 6,090,393 | |
| Quarterly | | June 15, 2021 | | June 30, 2021 | | 0.40 | | | 6,960,449 | |
| Quarterly | | September 15, 2021 | | September 27, 2021 | | 0.42 | | | 7,308,472 | |
| | | | | | $ | 2.14 | | | $ | 37,238,403 | |
Note 6. Borrowings
CNB-1 Facility
On October 16, 2018, the Company entered into a revolving credit agreement (the “CNB-1 Loan Agreement”) between the Company, as borrower, and City National Bank (“CNB”), as lender. Prior to its termination, the CNB-1 Loan Agreement provided for a senior secured revolving credit facility (the “CNB-1 Facility”) of up to $60 million (the “CNB-1 Facility Maximum Commitment”) in aggregate principal amount, subject to the lesser of (i) a percentage of unfunded commitments from certain classes of eligible investors in the Company and (ii) the CNB-1 Facility Maximum Commitment and had a scheduled maturity date of October 15, 2020. On May 1, 2020, the Company repaid all borrowings outstanding under the CNB-1 Facility, following which the CNB-1 Facility was terminated.
Borrowings under the CNB-1 Facility bore interest at a rate equal to (a) the London Interbank Offered Rate ("LIBOR") for the selected period plus 1.65% for LIBOR loans or (b) the prime rate of CNB minus 0.25% for prime rate loans. There was a non-usage fee of 25 basis points per year on the unused portion of the CNB-1 Facility, payable quarterly.
The CNB-1 Facility was secured by a first priority security interest, subject to customary exceptions, in (i) all Capital Commitments, (ii) the Company's right to make capital calls, receive payment of capital contributions from investors and enforce payment of capital commitments and capital contributions under the Subscription Agreements with investors and other operative documents and (iii) a cash collateral account into which the capital contributions from investors are made. The
OAKTREE STRATEGIC INCOME II, INC.
NOTES TO CONSOLIDATED FINANCIAL STATEMENTS
Company made customary representations and warranties and was required to comply with various affirmative and negative covenants, reporting requirements and other customary requirements for similar credit facilities. The Company's borrowings, including under the CNB-1 Facility, were subject to the leverage restrictions contained in the Investment Company Act.
As of September 30, 2022 and September 30, 2021, the Company had no borrowings outstanding under the CNB-1 Facility. The Company’s borrowings under the CNB-1 Facility bore interest at a weighted average interest rate of 3.27% for the year ended September 30, 2020. For the year ended September 30, 2020, the Company recorded interest expense (inclusive of fees) of $1,769,383 related to the CNB-1 Facility.
CNB-2 Facility
On June 9, 2020 (the “CNB-2 Closing Date”), the Company entered into a loan and security agreement, which was subsequently amended on March 31, 2021 (as amended, the “CNB-2 Loan Agreement”) between the Company, as borrower, and CNB, as lender. The CNB-2 Loan Agreement provides for a senior secured revolving credit facility (the “CNB-2 Facility”) of up to $60 million (the “CNB-2 Facility Maximum Commitment”) in aggregate principal amount, subject to the lesser of (i) the borrowing base, which is an amount determined by applying different rates to eligible assets held by the Company based generally on the value of such assets and (ii) the CNB-2 Facility Maximum Commitment. The maturity date of the CNB-2 Facility is June 9, 2023.
Borrowings under the CNB-2 Facility bear interest at a rate equal to LIBOR for the selected period (subject to a floor of 0.25%) plus 2.50%. There is a non-usage fee of 50 basis points per year on the unused portion of the CNB-2 Facility, payable annually, if on any anniversary of the CNB-2 Closing Date, the average daily utilization of the CNB-2 Facility is less than $25 million over the prior 365-day period.
The CNB-2 Facility is secured by a first priority security interest in substantially all of the Company’s assets, including its portfolio investments but excluding those investments held in OSI 2 SPV (as defined below). The Company has made customary representations and warranties and is required to comply with various affirmative and negative covenants, reporting requirements and other customary requirements for similar credit facilities. The borrowings of the Company, including under the CNB-2 Facility, are subject to the leverage restrictions contained in the Investment Company Act.
As of September 30, 2022 and September 30, 2021, the Company had $37.0 million and $51.0 million, respectively, outstanding under the CNB-2 Facility. For the years ended September 30, 2022, 2021 and 2020, the Company’s borrowings under the CNB-2 Facility bore interest at a weighted average interest rate of 3.37%, 2.91% and 3.32%, respectively. For the years ended September 30, 2022, 2021 and 2020, the Company recorded interest expense (inclusive of fees) of $1,423,297, $1,302,400 and $183,244, respectively, related to the CNB-2 Facility.
Citibank Facility
On July 26, 2019 (the “Citibank Closing Date”), the Company and OSI 2 Senior Lending SPV, LLC ("OSI 2 SPV"), a wholly-owned and consolidated subsidiary of the Company, entered into a loan and security agreement, which was subsequently amended on September 20, 2019, July 2, 2020, December 31, 2020 and March 31, 2021 (as amended, the “Citibank Loan Agreement”) with the lenders from time to time party thereto and the other parties referenced below. Under the terms of the Citibank Loan Agreement, the Company serves as the collateral manager and seller and OSI 2 SPV serves as borrower with Citibank, N.A., as administrative agent, and Deutsche Bank Trust Company Americas, as collateral agent.
The Citibank Loan Agreement provides for a senior secured revolving credit facility (the “Citibank Facility”) of up to $250 million (the “Citibank Maximum Commitment”) in aggregate principal amount, subject to the lesser of (i) the borrowing base, which is an amount based on advance rates that vary depending on the class of assets and the value assigned to such assets under the Citibank Loan Agreement and (ii) the Citibank Maximum Commitment. The Citibank Facility has a forty-two (42) month reinvestment period (the “Reinvestment Period”) during which advances may be made and matures sixty-six (66) months from the Citibank Closing Date. Following the Reinvestment Period, OSI 2 SPV will be required to make certain mandatory amortization payments. Borrowings under the Citibank Facility bear interest payable quarterly at a rate per year equal to (a) in the case of a lender that is identified as a conduit lender under the Citibank Loan Agreement, the lesser of (i) the applicable commercial paper rate for such conduit lender and (ii) the LIBOR for a three month maturity and (b) for all other lenders under the Citibank Facility, LIBOR, plus, in each case, an applicable spread. During the Reinvestment Period, the applicable spread is the greater of (i) a weighted average rate of (x) 1.65% per year for broadly syndicated loans and (y) 2.25% per year for all other eligible loans and (ii) 1.85%. After the Reinvestment Period, the applicable spread is 3.00% per year. There is also a non-usage fee of (i) 0.40% per year for the first six months following the Citibank Closing Date (the “Ramp-Up Period”) and (ii) 0.50% per year thereafter, in each case, on the unused portion of the Citibank Facility, payable quarterly; provided that if after the Ramp-Up Period the unused portion of the Citibank Facility is greater than 30% of the commitments
OAKTREE STRATEGIC INCOME II, INC.
NOTES TO CONSOLIDATED FINANCIAL STATEMENTS
under the Citibank Facility, the non-usage fee will be based on an unused portion of 30% of the commitments under the Citibank Facility.
The Citibank Facility is secured by a first priority security interest in substantially all of OSI 2 SPV’s assets.
As part of the Citibank Facility, OSI 2 SPV is subject to certain limitations as to how borrowed funds may be used and the types of loans that are eligible to be acquired by OSI 2 SPV including, but not limited to, restrictions on sector concentrations, loan size, tenor and minimum investment ratings (or estimated ratings). The Citibank Facility also contains certain requirements relating to interest coverage, collateral quality and portfolio performance, certain violations of which could result in the acceleration of the amounts due under the Citibank Facility.
Under the Citibank Facility, the Company and OSI 2 SPV, as applicable, have made customary representations and warranties, and are required to comply with various affirmative and negative covenants, reporting requirements and other customary requirements for similar credit facilities.
OSI 2 SPV’s borrowings are non-recourse to the Company but are considered borrowings of the Company for purposes of complying with the asset coverage requirements under the Investment Company Act.
As of September 30, 2022 and September 30, 2021, the Company had $220.0 million and $200.0 million, respectively, outstanding under the Citibank Facility. The Company’s borrowings under the Citibank Facility bore interest at a weighted average interest rate of 3.00%, 2.32% and 2.91% for the years ended September 30, 2022, 2021 and 2020, respectively. For the years ended September 30, 2022, 2021 and 2020, the Company recorded interest expense (inclusive of fees) of $7,300,813, $3,999,650 and $2,692,069, respectively, related to the Citibank Facility.
Secured Borrowings
As of September 30, 2022, the Company had no secured borrowings outstanding. As of September 30, 2021, the Company had $10.0 million of secured borrowings outstanding, which were recorded as a result of certain securities that were sold and simultaneously repurchased at a premium, with amounts payable to the counterparty due on the repurchase settlement date, which is generally within 120 days of the trade date. The Company's secured borrowings bore interest at a weighted average rate of 3.43% and 3.23%, respectively, for the years ended September 30, 2022 and 2021. The Company recorded $274,617 and $194,922 of interest expense in connection with secured borrowings for the years ended September 30, 2022 and 2021, respectively.
Principal Payments
Scheduled principal payments for debt obligations as of September 30, 2022 are as follows:
| | | | | | | | | | | | | | | | | | | | | | | | | | | | | | | | | | | | | | |
| | | Payments due during fiscal years ended September 30, |
| | | Total | | 2023 | | 2024 | | 2025 | | 2026 | | 2027 and Thereafter |
| CNB-2 Facility | | $ | 37,000,000 | | | $ | 37,000,000 | | | $ | — | | | $ | — | | | $ | — | | | $ | — | |
| Citibank Facility | | 220,000,000 | | | — | | | — | | | 220,000,000 | | | — | | | — | |
| Total | | $ | 257,000,000 | | | $ | 37,000,000 | | | $ | — | | | $ | 220,000,000 | | | $ | — | | | $ | — | |
OAKTREE STRATEGIC INCOME II, INC.
NOTES TO CONSOLIDATED FINANCIAL STATEMENTS
Note 7. Taxable/Distributable Income
Taxable income differs from net increase (decrease) in net assets resulting from operations primarily due to: (1) unrealized appreciation (depreciation) on investments and foreign currency, as gains and losses are not included in taxable income until they are realized, (2) organizational and deferred offering costs and (3) the capital gains incentive fee accrual.
Presented below is a reconciliation of net increase (decrease) in net assets resulting from operations to taxable income for the years ended September 30, 2022, 2021 and 2020:
| | | | | | | | | | | | | | | | | | | | |
| | Year ended September 30, 2022 | | Year ended September 30, 2021 | | Year ended September 30, 2020 |
| Net increase (decrease) in net assets resulting from operations | | $ | 12,135,818 | | | $ | 36,739,845 | | | $ | 22,307,607 | |
| Net unrealized (appreciation) depreciation | | 24,139,553 | | | (7,280,860) | | | 1,439,671 | |
| Book/tax differences due to capital gains incentive fee | | (1,988,557) | | | 1,765,387 | | | 1,027,505 | |
| Book/tax difference due to organizational and deferred offering costs | | (30,407) | | | (30,407) | | | (30,407) | |
| Other book/tax differences | | (199,849) | | | 1,397,679 | | | (676,078) | |
| | | | | | |
| | | | | | |
| | | | | | |
| | | | | | |
| | | | | | |
| Taxable income (1) | | $ | 34,056,558 | | | $ | 32,591,644 | | | $ | 24,068,298 | |
__________________
(1)The Company's taxable income for the year ended September 30, 2022 is an estimate and will not be finally determined until the Company files its tax return. Therefore, the final taxable income may be different than the estimate.
For the year ended September 30, 2022, the Company recognized a total provision for income tax benefit of $71,534, which was primarily comprised of a deferred income tax benefit of $76,225 that resulted from unrealized depreciation on an investment held by a wholly-owned taxable subsidiary.
For the year ended September 30, 2021,the Company recognized a total provision for income tax expense of $126,088, which was comprised of a deferred income tax expense of $113,535 that resulted from unrealized appreciation on an investment held by a wholly-owned taxable subsidiary and a current tax expense of $12,553.
For the year ended September 30, 2020, the Company recognized a total provision for income tax benefit of $6,367, which was comprised of a current income tax benefit of $10,206 partially offset by a deferred income tax expense of $3,839 that resulted from unrealized appreciation on investments held by wholly-owned taxable subsidiaries.
As of September 30, 2022, the Company's tax year end, the components of accumulated undistributed income on a tax basis were as follows:
| | | | | |
| Undistributed ordinary income, net | $ | 1,570,630 | |
| Net realized capital gains | $ | 2,268,092 | |
| Unrealized losses, net | $ | (19,271,749) | |
The aggregate cost of investments for income tax purposes was $580,288,464 as of September 30, 2022. As of September 30, 2022, the aggregate gross unrealized appreciation for all investments in which there was an excess of value over cost for income tax purposes was $33,549,982. As of September 30, 2022, the aggregate gross unrealized depreciation for all investments in which there was an excess of cost for income tax purposes over value was $52,821,731. As of September 30, 2022, net unrealized depreciation based on the aggregate cost of investments for income tax purposes was $19,271,749.
Note 8. Concentration of Credit Risks
The Company deposits its cash with financial institutions and at times such balances may be in excess of the FDIC insurance limit. The Company limits its exposure to credit loss by depositing its cash with high credit quality financial institutions and monitoring their financial stability.
Note 9. Related Party Transactions
The Company has entered into an Investment Advisory Agreement with the Adviser. Pursuant to the Investment Advisory Agreement, the Company pays the Adviser a fee for investment advisory and management services consisting of two components - the Management Fee and the Incentive Fee (each as defined below).
OAKTREE STRATEGIC INCOME II, INC.
NOTES TO CONSOLIDATED FINANCIAL STATEMENTS
Management Fee
Prior to (i) the listing of the Company’s Common Stock on a national securities exchange or (ii) an initial public offering of the Company’s Common Stock that results in gross proceeds to the Company of at least $50 million and a listing of the Common Stock on a national securities exchange (each of (i) and (ii), a “Qualified Listing”), if any, the Adviser is entitled to receive quarterly in arrears a management fee (the “Management Fee”) equal to 1.00% per annum (the “Applicable Management Fee Percentage”) of the Company’s Gross Asset Value (as defined below); provided, that prior to a Qualified Listing, the Management Fee does not exceed 1.75% per annum of the Unleveraged Asset Value (as defined below). From and after the date of a Qualified Listing, if any, the Applicable Management Fee Percentage will increase to 1.50% per annum of the Company’s Gross Asset Value.
For purposes of calculating the Management Fee, the Gross Asset Value is determined by the Company’s board of directors (including any committee thereof). Until August 6, 2019, the Management Fee for each quarter was calculated based on the Company’s average Gross Asset Value at the end of each month during such calendar quarter (prior to taking into account any Incentive Fee); provided, that the Management Fee for the Company’s first calendar quarter was calculated based on the Company’s Gross Asset Value at the end of such calendar quarter (prior to taking into account any Incentive Fee). Following August 6, 2019, the Management Fee for each quarter is calculated based on the Company’s average Gross Asset Value at the end of such quarter and at the end of the preceding quarter (in each case, prior to taking into account any Incentive Fee); provided, that the Management Fee for the calendar quarter in which the Company consummates a Qualified Listing will be calculated based on the Company’s Gross Asset Value at the end of such calendar quarter (prior to taking into account any Incentive Fee). For the years ended September 30, 2022, 2021 and 2020, base management fees were $5,656,120, $5,277,116 and $3,689,499, respectively.
The term “Gross Asset Value” means the value of the Company’s gross assets, determined on a consolidated basis in accordance with GAAP, including portfolio investments purchased with borrowed funds and other forms of leverage, but excluding cash and cash equivalents.
The term “Unleveraged Asset Value” means the Gross Asset Value less the Company’s borrowings for investment purposes determined on a consolidated basis in accordance with GAAP (other than borrowings under the Company’s investor subscription credit facility that are repaid within 180 days following incurrence).
Incentive Fee
The Incentive Fee consists of two parts: the Investment Income Incentive Fee and the Capital Gains Incentive Fee (each defined below).
Investment Income Incentive Fee
The Investment Income Incentive Fee is calculated and payable quarterly in arrears based on the Company’s Pre-Incentive Fee Net Investment Income, which means consolidated interest income, dividend income and any other income (including any other fees (other than fees for providing managerial assistance), such as commitment, origination, structuring, diligence and consulting fees or other fees that the Company receives from portfolio companies) accrued during the calendar quarter, minus the operating expenses accrued for the quarter (including the Management Fee, Company expenses and any interest expense or fees on any credit facilities or outstanding debt, but excluding the Incentive Fee). The Pre-Incentive Fee Net Investment Income includes, in the case of investments with a deferred interest feature (such as OID, debt instruments with PIK interest and zero coupon securities), accrued income that has not yet been received in cash. For the avoidance of doubt, the Pre-Incentive Fee Net Investment Income does not include any realized capital gains, realized capital losses or unrealized capital appreciation or depreciation. The Pre-Incentive Fee Net Investment Income, expressed as a rate of return on the value of the Company’s net assets at the end of the immediately preceding calendar quarter, is compared to a hurdle of 1.50% per quarter (6% annualized) (the “Hurdle Rate”). The Company pays the Adviser an Investment Income Incentive Fee each quarter as follows:
(a)Hurdle Rate Return: No Investment Income Incentive Fee in any calendar quarter in which the Pre-Incentive Fee Net Investment Income does not exceed the Hurdle Rate;
(b)Catch-Up: 100% of the Pre-Incentive Fee Net Investment Income, if any, that exceeds the Hurdle Rate but is less than a 1.875% (7.5% annualized) rate of return on the value of the Company’s net assets in such calendar quarter (the
OAKTREE STRATEGIC INCOME II, INC.
NOTES TO CONSOLIDATED FINANCIAL STATEMENTS
“Catch-Up”), which is intended to provide the Adviser with 20% of the Pre-Incentive Fee Net Investment Income as if the Hurdle Rate did not apply, if the Pre-Incentive Fee Net Investment Income exceeds the Hurdle Rate in such calendar quarter; and
(c)80/20 Split: 20% of the Pre-Incentive Fee Net Investment Income, if any, that exceeds a 1.875% (7.5% annualized) rate of return on the value of the Company’s net assets in such calendar quarter, so that once the Hurdle Rate is reached and the Catch-Up in (b) immediately above is achieved, 20% of the Pre-Incentive Fee Net Investment Income thereafter is allocated to the Adviser.
The foregoing calculations will be appropriately prorated for any period of less than three months and adjusted for any issuances or repurchases of Common Stock during a quarter. For the years ended September 30, 2022, 2021 and 2020, Investment Income Incentive Fees were $7,723,049, $7,155,662 and $3,955,710, respectively.
Capital Gains Incentive Fee
In addition to the Investment Income Incentive Fee described above, the Adviser is entitled to receive a Capital Gains Incentive Fee (as defined below). The Capital Gains Incentive Fee is determined and payable in arrears as of the end of each calendar year. The Capital Gains Incentive Fee is equal to 20% of the realized capital gains, if any, on a cumulative basis from the date of the Initial Closing through the end of each calendar year, computed net of all realized capital losses on a cumulative basis and unrealized capital depreciation, less the aggregate amount of any previously paid Capital Gains Incentive Fee with respect to each of the investments in the Company’s portfolio, provided, that the Capital Gains Incentive Fee determined as of December 31, 2018 was calculated for a period of shorter than 12 calendar months to take into account any realized capital gains computed net of all realized capital losses and unrealized capital depreciation from the date of the Initial Closing through the end of 2018 (the “Capital Gains Incentive Fee,” and together with the Investment Income Incentive Fee, the “Incentive Fees”). As of September 30, 2022, the Company paid $1,496,334 of capital gains incentive fees cumulatively under the Investment Advisory Agreement
Although the Capital Gains Incentive Fee due to the Adviser is not payable until it is contractually due based on the Investment Advisory Agreement, the Company accrues this component at the end of each reporting period based on the Company’s realized capital gains, if any, on a cumulative basis from the date of the Initial Closing through the end of each reporting period, computed net of all realized capital losses on a cumulative basis and unrealized capital depreciation, less the aggregate amount of any previously paid Capital Gains Incentive Fee, as contractually included in the calculation of the Capital Gains Incentive Fee, plus the cumulative amount of unrealized capital appreciation. If such amount is positive at the end of a period, then the Company will accrue an incentive fee equal to 20% of such amount. If such amount is negative, then there will be no accrual for such period or an appropriate reduction in any amount previously accrued. U.S. GAAP requires that the Capital Gains Incentive Fee accrual consider cumulative unrealized capital appreciation in the calculation, as a Capital Gains Incentive Fee would be payable if such unrealized capital appreciation were realized. There can be no assurance that such unrealized capital appreciation will be realized in the future. For the year ended September 30, 2022, the Company reversed previously accrued Capital Gains Incentive Fees of $1,988,557. For the years ended September 30, 2021 and 2020, the Company accrued Capital Gains Incentive Fees of $2,029,815 and $1,027,505, respectively. As of September 30, 2022, there was no accrued capital gains incentive fee liability. As of September 30, 2021, the total accrued capital gains incentive fee liability was $3,220,463.
As of September 30, 2022 and September 30, 2021, the Company had a liability on its Consolidated Statements of Assets and Liabilities in the amounts of $3,272,662 and $6,433,876, respectively, reflecting the unpaid portion of the Base Management Fee and Incentive Fees payable to the Adviser.
Administration Agreement
The Company entered into an administration agreement (the “Administration Agreement”) with Oaktree Fund Administration, LLC (the “Administrator”), an affiliate of the Adviser. Pursuant to the Administration Agreement, the Administrator furnishes the Company with office facilities (certain of which are located in buildings owned by a Brookfield affiliate), equipment and clerical, bookkeeping and recordkeeping services at such facilities. Under the Administration Agreement, the Administrator also performs, or oversees the performance of, the Company’s required administrative services, which include, among other things, providing assistance in accounting, legal, compliance, operations, technology and investor relations, and being responsible for the financial records that the Company is required to maintain and preparing reports to stockholders and reports filed with the SEC. In addition, the Administrator assists the Company in determining and publishing the net asset value, overseeing the preparation and filing of tax returns and the printing and dissemination of reports to the
OAKTREE STRATEGIC INCOME II, INC.
NOTES TO CONSOLIDATED FINANCIAL STATEMENTS
Company’s stockholders, and generally overseeing the payment of the Company’s expenses and the performance of administrative and professional services rendered to the Company by others.
Payments under the Administration Agreement are equal to an amount that reimburses the Administrator for its costs and expenses incurred in performing its obligations under the Administration Agreement and providing personnel and facilities. The Administration Agreement may be terminated by either party without penalty upon 60 days’ written notice to the other party, by the vote of a majority of the Company’s outstanding voting securities, or by the vote of the Company’s directors or by the Administrator. In addition, our Administrator entered into a sub-administration agreement (the “Sub-Administration Agreement”) with State Street Bank and Trust Company (“State Street”), pursuant to which State Street provides certain administrative and professional services. The Company bears all of the costs and expenses of any sub-administration agreements that the Administrator enters into.
For the avoidance of doubt, the Company bears its allocable portion of the costs of the compensation, benefits, and related administrative expenses (including travel expenses) of the Company’s officers who provide operational and administrative services under the Administration Agreement, their respective staffs and other professionals who provide services to the Company (including, in each case, employees of the Administrator or an affiliate) who assist with the preparation, coordination, and administration of the foregoing or provide other “back office” or “middle office” financial or operational services to the Company. The Company reimburses the Adviser (or its affiliates) for an allocable portion of the compensation paid by the Adviser (or its affiliates) to such individuals (based on a percentage of time such individuals devote, on an estimated basis, to the Company’s business and affairs and to acting on the Company’s behalf). Our board of directors reviews the fees payable under the Administration Agreement to determine that these fees are reasonable and comparable to administrative services charged by unaffiliated third parties.
For the year ended September 30, 2022, the Company incurred $575,978 of expenses under the Administration Agreement, of which $462,867 was included in administrator expense and the remaining $113,111 was included in general and administrative expenses on the Consolidated Statements of Operations. For the year ended September 30, 2021, the Company incurred $499,710 of expenses under the Administration Agreement, of which $418,580 was included in administrator expense and the remaining $81,130 was included in general and administrative expenses on the Consolidated Statements of Operations. For the year ended September 30, 2020, the Company incurred $551,954 of expenses under the Administration Agreement, of which $470,898 was included in administrator expense and the remaining $81,056 was included in general and administrative expenses on the Consolidated Statements of Operations. As of September 30, 2022 and September 30, 2021, $920,645 and $1,055,391, respectively, was included in “Due to affiliates” in the Consolidated Statements of Assets and Liabilities, reflecting the unpaid portion of administrative expenses and other reimbursable expenses.
Placement Agent Agreement
The Company has entered into a Placement Agent Agreement with OCM Investments, LLC (the “Placement Agent”), an affiliate of the Adviser, which may require investors (other than investors sourced by the Company, the Adviser, the Placement Agent or their respective affiliates) to pay a distribution fee to the Placement Agent for its services. Although the Company does not pay any fees to the Placement Agent, the Company indemnifies the Placement Agent in connection with its activities.
OAKTREE STRATEGIC INCOME II, INC.
NOTES TO CONSOLIDATED FINANCIAL STATEMENTS
Note 10. Financial Highlights
| | | | | | | | | | | | | | | | | | | | |
| | Year ended September 30, 2022 | | Year ended September 30, 2021 | | Year ended September 30, 2020 |
| Net asset value at beginning of period | | $ | 19.91 | | | $ | 19.94 | | | $ | 20.65 | |
| Net investment income (1) | | 1.89 | | | 1.53 | | | 1.38 | |
| Net unrealized appreciation (depreciation) (1) | | (1.38) | | | 0.42 | | | (1.24) | |
| Net realized gains (losses) (1) | | 0.19 | | | 0.17 | | | 0.53 | |
| Provision for income taxes (1) | | — | | | (0.01) | | | — | |
| Distributions of net investment income to stockholders | | (1.87) | | | (1.74) | | | (1.38) | |
| Distributions of capital gains to stockholders | | (0.24) | | | (0.40) | | | — | |
| Net asset value at end of period | | $ | 18.50 | | | $ | 19.91 | | | $ | 19.94 | |
| Total return (2) | | 3.37 | % | | 11.03 | % | | 3.46 | % |
| Common stock outstanding at beginning of period | | 17,401,121 | | | 17,401,121 | | | 8,309,861 | |
| Common stock outstanding at end of period | | 17,401,121 | | | 17,401,121 | | | 17,401,121 | |
| Net assets at beginning of period | | $ | 346,503,209 | | | $ | 347,001,767 | | | $ | 171,626,750 | |
| Net assets at end of period | | $ | 321,922,662 | | | $ | 346,503,209 | | | $ | 347,001,767 | |
| Average net assets (3) | | $ | 337,581,435 | | | $ | 347,574,530 | | | $ | 239,649,143 | |
| Ratio of net investment income to average net assets | | 9.74 | % | | 7.65 | % | | 7.16 | % |
| Ratio of total expenses to average net assets | | 6.97 | % | | 6.47 | % | | 6.54 | % |
| Ratio of portfolio turnover to average investments at fair value | | 27.47 | % | | 47.55 | % | | 64.79 | % |
| Weighted average outstanding debt | | $ | 264,031,973 | | | $ | 180,967,198 | | | $ | 123,846,995 | |
| Average debt per share (1) | | $ | 15.17 | | | $ | 10.40 | | | $ | 9.97 | |
| Asset coverage ratio (4) | | 225.26 | % | | 232.78 | % | | 428.45 | % |
| | | | | |
| (1) | Calculated based upon weighted average shares outstanding for the period. |
| (2) | Total return is calculated as the change in net asset value (“NAV”) per share during the period, plus distributions per share or capital activity, if any, divided by the beginning NAV per share, assuming a dividend reinvestment price equal to the NAV per share at the beginning of the period. |
| (3) | Calculated based upon the weighted average net assets for the period. |
| (4) | Based on outstanding senior securities of $257.0 million, $261.0 million and $105.6 million as of September 30, 2022, 2021 and 2020, respectively. |
OAKTREE STRATEGIC INCOME II, INC.
NOTES TO CONSOLIDATED FINANCIAL STATEMENTS
Senior Securities
Information about the Company's senior securities (including debt securities and other indebtedness) is shown in the following table as of the fiscal years ended September 30, 2022, 2021 and 2020. | | | | | | | | | | | | | | |
| Class and Year | Total Amount Outstanding Exclusive of Treasury Securities(1) | Asset Coverage Per Unit(2) | Involuntary Liquidating Preference Per Unit(3) | Average Market Value Per Unit |
| | | | |
| CNB-2 Facility | | | | |
| Fiscal 2020 | $ | 5,000,000 | | $ | 4,285 | | — | | N/A |
| Fiscal 2021 | 51,000,000 | | 2,328 | | — | | N/A |
| Fiscal 2022 | 37,000,000 | | 2,253 | | — | | N/A |
| | | | |
| Citibank Facility | | | | |
| Fiscal 2020 | $ | 100,000,000 | | $ | 4,285 | | — | | N/A |
| Fiscal 2021 | 200,000,000 | | 2,328 | | — | | N/A |
| Fiscal 2022 | 220,000,000 | | 2,253 | | — | | N/A |
| | | | |
| Derivative Liability | | | | |
| Fiscal 2020 | $ | 647,889 | | $ | 4,285 | | — | | N/A |
| | | | |
| Secured Borrowings | | | | |
| Fiscal 2021 | $ | 9,969,425 | | 2,328 | | — | | N/A |
| | | | |
| Total Senior Securities | | | | |
| Fiscal 2020 | $ | 105,647,889 | | $ | 4,285 | | — | | N/A |
| Fiscal 2021 | 260,969,425 | | 2,328 | | — | | N/A |
| Fiscal 2022 | 257,000,000 | | 2,253 | | — | | N/A |
__________
(1)Total amount of each class of senior securities outstanding at the end of the period.
(2)The asset coverage ratio for a class of senior securities representing indebtedness is calculated as the Company's consolidated total assets, less all liabilities and indebtedness not represented by senior securities, divided by total senior securities representing indebtedness. This asset coverage ratio is multiplied by $1,000 to determine the “Asset Coverage Per Unit.”
(3)The amount to which such class of senior security would be entitled upon the involuntary liquidation of the issuer in preference to any security junior to it. The “-” indicates information that the Securities and Exchange Commission expressly does not require to be disclosed for certain types of senior securities.
OAKTREE STRATEGIC INCOME II, INC.
NOTES TO CONSOLIDATED FINANCIAL STATEMENTS
Note 11. Commitments and Contingencies
Off-Balance Sheet Arrangements
The Company is a party to financial instruments with off-balance sheet risk in the normal course of business to meet the financial needs of its portfolio companies. As indicated in the table below, as of September 30, 2022 and September 30, 2021, off-balance sheet arrangements consisted of $22,812,917 and $48,497,448, respectively, of unfunded commitments to provide debt and equity financing to certain of the Company's portfolio companies. Such commitments are subject to the portfolio company's satisfaction of certain financial and nonfinancial covenants and may involve, to varying degrees, elements of credit risk in excess of the amount recognized in the Consolidated Statements of Assets and Liabilities.
| | | | | | | | | | | | | | |
| | September 30, 2022 | | September 30, 2021 |
| BioXcel Therapeutics, Inc. | | $ | 2,757,002 | | | $ | — | |
| BAART Programs, Inc. | | 2,170,022 | | 1,087,000 | |
| iCIMs, Inc. | | 1,627,445 | | — | |
| Marinus Pharmaceuticals, Inc. | | 1,405,400 | | 4,497,280 | |
| Accupac, Inc. | | 1,287,825 | | 913,612 | |
| RumbleOn, Inc. | | 1,165,476 | | 3,939,637 | |
| Pluralsight, LLC | | 1,057,932 | | 1,057,932 | |
| Innocoll Pharmaceuticals Limited | | 1,006,516 | | — | |
| Grove Hotel Parcel Owner, LLC | | 992,930 | | — | |
| Mesoblast, Inc. | | 852,520 | | — | |
| Mindbody, Inc. | | 761,905 | | 761,905 | |
| Thrasio, LLC | | 666,700 | | 666,700 | |
| Dialyze Holdings, LLC | | 630,750 | | 630,750 | |
| OTG Management, LLC | | 610,476 | | 610,476 | |
| PRGX Global, Inc. | | 609,399 | | 609,399 | |
| Relativity ODA LLC | | 543,700 | | 543,700 | |
| MRI Software LLC | | 461,191 | | 693,399 | |
| Tahoe Bidco B.V. | | 420,825 | | — | |
| ASP-R-PAC Acquisition Co LLC | | 395,957 | | — | |
| Kings Buyer, LLC | | 368,876 | | — | |
| PFNY Holdings, LLC | | 366,409 | | — | |
| MHE Intermediate Holdings, LLC | | 357,143 | | 866,429 | |
| Berner Food & Beverage, LLC | | 336,585 | | 598,373 | |
| CorEvitas, LLC | | 334,500 | | 1,181,433 | |
| Acquia Inc. | | 277,412 | | 431,113 | |
| Apptio, Inc. | | 276,923 | | 276,923 | |
| Liquid Environmental Solutions Corporation | | 267,804 | | — | |
| Digital.AI Software Holdings, Inc. | | 217,758 | | 236,693 | |
| Assembled Brands Capital LLC | | 217,316 | | | 2,690,942 | |
| Telestream Holdings Corporation | | 150,300 | | | 360,720 | |
| 109 Montgomery Owner LLC | | 115,350 | | | 226,821 | |
| LSL Holdco, LLC | | 102,570 | | | — | |
| Coty Inc. | | — | | | 6,352,000 | |
| Athenex, Inc. | | — | | | 6,242,124 | |
| Gulf Operating, LLC | | — | | | 3,470,000 | |
| Latam Airlines Group S.A. | | — | | | 1,883,102 | |
| Sunland Asphalt & Construction, LLC | | — | | | 1,767,564 | |
| NeuAG, LLC | | — | | | 1,551,000 | |
| SumUp Holdings Luxembourg S.À.R.L. | | — | | | 1,406,325 | |
| Olaplex, Inc. | | — | | | 1,026,000 | |
| Thermacell Repellents, Inc. | | — | | | 833,333 | |
| SIO2 Medical Products, Inc. | | — | | | 617,786 | |
| The Avery | | — | | | 466,977 | |
| | $ | 22,812,917 | | | $ | 48,497,448 | |
OAKTREE STRATEGIC INCOME II, INC.
NOTES TO CONSOLIDATED FINANCIAL STATEMENTS
Note 12. Derivative Instruments
The Company enters into foreign currency forward contracts from time to time to help mitigate the impact that an adverse change in foreign exchange rates would have on the value of the Company’s investments denominated in foreign currencies.
In order to better define its contractual rights and to secure rights that will help the Company mitigate its counterparty risk, the Company entered into an International Swaps and Derivatives Association, Inc. Master Agreement ("ISDA Master Agreement") with its derivative counterparty, The Bank of New York Mellon. The ISDA Master Agreement permits a single net payment in the event of a default or similar event. As of September 30, 2022, no cash collateral has been pledged to cover obligations and no cash collateral has been received from the counterparty with respect to the Company's foreign currency forward contracts.
Net unrealized gains or losses on foreign currency forward contracts are included in “net unrealized appreciation (depreciation)” and net realized gains or losses on foreign currency forward contracts are included in “net realized gains (losses)” in the accompanying Consolidated Statements of Operations. Foreign currency forward contracts are considered undesignated derivative instruments.
Certain information related to the Company’s foreign currency forward contracts is presented below as of September 30, 2022.
| | | | | | | | | | | | | | | | | | | | | | | | | | | | | | | | | | | | | | |
| Description | | Notional Amount to be Purchased | | Notional Amount to be Sold | | Maturity Date | | Gross Amount of Recognized Assets | | Gross Amount of Recognized Liabilities | | Balance Sheet Location of Net Amounts |
| Foreign currency forward contract | | $ | 13,066,310 | | | € | 12,710,431 | | | 11/10/2022 | | $ | 580,858 | | | $ | — | | | Derivative asset |
| Foreign currency forward contract | | $ | 15,205,487 | | | £ | 12,568,533 | | | 11/10/2022 | | $ | 1,165,449 | | | $ | — | | | Derivative asset |
| | | | | | | | $ | 1,746,307 | | | $ | — | | | |
Certain information related to the Company’s foreign currency forward contracts is presented below as of September 30, 2021.
| | | | | | | | | | | | | | | | | | | | | | | | | | | | | | | | | | | | | | |
| Description | | Notional Amount to be Purchased | | Notional Amount to be Sold | | Maturity Date | | Gross Amount of Recognized Assets | | Gross Amount of Recognized Liabilities | | Balance Sheet Location of Net Amounts |
| Foreign currency forward contract | | $ | 13,551,234 | | | € | 11,534,208 | | | 11/12/2021 | | $ | 173,075 | | | $ | — | | | Derivative asset |
| Foreign currency forward contract | | $ | 17,392,336 | | | £ | 12,568,533 | | | 11/12/2021 | | $ | 444,929 | | | $ | — | | | Derivative asset |
| | | | | | | | $ | 618,004 | | | $ | — | | | |
Note 13. Pending Merger with OCSL
On September 14, 2022, we entered into the Merger Agreement, which provides that, subject to the conditions set forth in the Merger Agreement, Merger Sub will merge with and into us, with us continuing as the surviving company and as OCSL’s wholly-owned subsidiary and, immediately thereafter, we will merge with and into OCSL, with OCSL continuing as the surviving company. Both our board of directors and the board of directors of OCSL, including all of the respective independent directors, in each case, on the recommendation of a special committee comprised solely of certain independent directors of us or OCSL, as applicable, have approved the Merger Agreement and the transactions contemplated thereby.
At the Effective Time, each share of our common stock issued and outstanding immediately prior to the Effective Time (other than shares owned by OCSL or any of its consolidated subsidiaries (the “Cancelled Shares”)) will be converted into the right to receive a number of shares of OCSL Common Stock equal to the Exchange Ratio (as defined below), plus any cash (without interest) in lieu of fractional shares.
As of a mutually agreed date no earlier than 48 hours (excluding Sundays and holidays) prior to the Effective Time, which we refer as the “Determination Date”, each of us and OCSL will deliver to the other a calculation of its net asset value as of such date, in each case using a pre-agreed set of assumptions, methodologies and adjustments. We refer to such calculation with respect to us as the “Closing OSI2 Net Asset Value” and with respect to OCSL as the “Closing OCSL Net Asset Value”. Based on such calculations, the parties will calculate the “OSI2 Per Share NAV”, which will be equal to (i) the Closing OSI2 Net Asset Value divided by (ii) the number of shares of our common stock issued and outstanding as of the Determination Date
OAKTREE STRATEGIC INCOME II, INC.
NOTES TO CONSOLIDATED FINANCIAL STATEMENTS
(excluding any Cancelled Shares), and the “OCSL Per Share NAV”, which will be equal to (A) the Closing OCSL Net Asset Value divided by (B) the number of shares of OCSL Common Stock issued and outstanding as of the Determination Date. The “Exchange Ratio” will be equal to the quotient (rounded to four decimal places) of (i) the OSI2 Per Share NAV divided by (ii) the OCSL Per Share NAV.
We and OCSL will update and redeliver the Closing OSI2 Net Asset Value or the Closing OCSL Net Asset Value, respectively, in the event of a material change to such calculation between the Determination Date and the closing of the Mergers and if needed to ensure that the calculation is determined within 48 hours (excluding Sundays and holidays) prior to the Effective Time.
The Merger Agreement contains customary representations and warranties by each of us, OCSL and Oaktree. The Merger Agreement also contains customary covenants, including, among others, covenants relating to the operation of each of our and OCSL’s businesses during the period prior to the closing of the Mergers.
Consummation of the Mergers, which is currently anticipated to occur during the second fiscal quarter of 2023, is subject to certain closing conditions, including requisite approvals of our and OCSL’s stockholders and certain other closing conditions.
The Merger Agreement also contains certain termination rights in favor of us and OCSL, including if the Mergers are not completed on or before June 30, 2023 or if the requisite approvals of our or OCSL’s stockholders are not obtained. The Merger Agreement provides that, upon the termination of the Merger Agreement under certain circumstances, a third party acquiring us may be required to pay OCSL a termination fee of approximately $9.8 million. The Merger Agreement provides that, upon the termination of the Merger Agreement under certain circumstances, a third party acquiring OCSL may be required to pay to us a termination fee of approximately $37.9 million.
Note 14. Subsequent Events
The Company's management evaluated subsequent events through the date of issuance of the consolidated financial statements. There have been no subsequent events that occurred during such period that would require disclosure in, or would be required to be recognized in, the consolidated financial statements as of and for the year ended September 30, 2022, except as discussed below.
Distribution Declaration
On December 12, 2022, the Company's Board of Directors approved a quarterly distribution of $0.44 per share, payable in cash on December 27, 2022 to the Company's stockholders of record as of the close of business on December 15, 2022. Additionally, on December 12, 2022, the Company's Board of Directors approved a special distribution of $0.23 per share, payable in cash on December 27, 2022 to the Company's stockholders of record as of the close of business on December 15, 2022.
Item 9. Changes in and Disagreements with Accountants on Accounting and Financial Disclosure
Not applicable.
Item 9A. Controls and Procedures
(a) Evaluation of Disclosure Controls and Procedures
As of the end of the period covered by this report, management, with the participation of the Company’s Chief Executive Officer (principal executive officer) and Chief Financial Officer (principal financial officer), evaluated the effectiveness of our disclosure controls and procedures as of September 30, 2022. The term “disclosure controls and procedures,” as defined in Rules 13a-15(e) and 15d-15(e) under the Securities Exchange Act of 1934, as amended, or the Exchange Act, means controls and other procedures of a company that are designed to ensure that information required to be disclosed by a company in the reports that it files or submits under the Exchange Act is recorded, processed, summarized and reported, within the time periods specified in the SEC’s rules and forms. Disclosure controls and procedures include, without limitation, controls and procedures designed to ensure that information required to be disclosed by a company in the reports that it files or submits under the Exchange Act is accumulated and communicated to the company’s management, including its chief executive officer and chief financial officer, as appropriate to allow timely decisions regarding required disclosure. Management recognizes that any controls and procedures, no matter how well designed and operated, can provide only reasonable assurance of achieving their objectives, and management necessarily applies its judgment in evaluating the benefits of possible controls and procedures relative to their costs. Based on the evaluation of our disclosure controls and procedures as of September 30, 2022, our Chief Executive Officer and Chief Financial Officer concluded that our disclosure controls and procedures were effective, at the reasonable assurance level, in timely identifying, recording, processing, summarizing and reporting any material information relating to us that is required to be disclosed in the reports we file or submit under the Exchange Act.
(b) Management's Report on Internal Control Over Financial Reporting
Management is responsible for establishing and maintaining adequate internal control over financial reporting, as such term is defined in Rules 13a-15(f) and 15d-15(f) under the Exchange Act. A company's internal control over financial reporting is a process designed by, or under the supervision of, its chief executive officer and chief financial officer, and effected by such company's board of directors, management and other personnel to provide reasonable assurance regarding the reliability of financial reporting and the preparation of financial statements for external purposes in accordance with GAAP and includes those policies and procedures that:
(i) pertain to the maintenance of records that, in reasonable detail, accurately and fairly reflect the transactions and dispositions of the assets of the company;
(ii) provide reasonable assurance that transactions are recorded as necessary to permit preparation of financial statements in accordance with generally accepted accounting principles, and that receipts and expenditures of the company are being made only in accordance with authorizations of management and directors of the company; and
(iii) provide reasonable assurance regarding prevention or timely detection of unauthorized acquisition, use, or disposition of the company's assets that could have a material effect on the financial statements.
Because of its inherent limitations, internal control over financial reporting may not prevent or detect misstatements. Also, projections of any evaluation of effectiveness to future periods are subject to the risk that controls may become inadequate because of changes in conditions, or that the degree of compliance with the policies or procedures may deteriorate.
Management, with the participation of our Chief Executive Officer and Chief Financial Officer, has conducted an evaluation of the effectiveness of our internal control over financial reporting as of September 30, 2022, based on the framework set forth in Internal Control-Integrated Framework (2013) issued by the Committee of Sponsoring Organizations of the Treadway Commission (COSO). Based on this evaluation, management concluded that our internal control over financial reporting was effective as of September 30, 2022.
(c) Changes in Internal Controls Over Financial Reporting
There were no changes in our internal control over financial reporting that occurred during the three months ended September 30, 2022 that have materially affected, or are reasonably likely to materially affect, our internal control over financial reporting.
Item 9B. Other Information
None.
PART III
Item 10. Directors, Executive Officers and Corporate Governance
The Company’s business and affairs is managed under the oversight of our board of directors (the “Board”). The Board consists of four members. The Board may modify the number of its members in accordance with our amended and restated bylaws, except that the number of directors may never be fewer than one or greater than twelve and no decrease in the number of directors will shorten the term of any incumbent director. Pursuant to Section 56 of the Investment Company Act, a majority of the directors of the Board must be comprised of persons who are not “interested persons” of the Company, as defined in Section 2(a)(19) of the Investment Company Act. Therefore, under the Investment Company Act, a majority of the directors of the Board are independent. In addition, the Board has determined that it is appropriate that a majority of the directors meet the definition of “independent director” under the corporate governance standards of Nasdaq. We refer to our directors who are not “interested persons” under the Investment Company Act and who satisfy the independent director requirements of NASDAQ as “Independent Directors.”
Directors
Information regarding our Board is set forth below. The directors are divided into two groups — interested directors and Independent Directors. The interested director is an “interested person” of the Company, as defined in Section 2(a)(19) of the Investment Company Act.
| | | | | | | | | | | | | | | | | | | | | | | | | | |
Name, Address, and Age(1) | | Positions with Company – Length of Time Served; Term of Office | | Principal Occupation(s) During the Past Five Years | | Number of Companies in Fund Complex(2) Overseen by Director | | Other Directorships Held by Director or Nominee Director During the Past Five Years(3) |
| Interested Director | | | | | | | | |
| Armen Panossian (46) | | Class III Director, Chairman, Chief Executive Officer and Chief Investment Officer since 2019; term expires in 2024 | | Chairman, Chief Executive Officer and Chief Investment Officer of the Company; Chairman, Chief Executive Officer and Chief Investment Officer of Oaktree Strategic Credit Fund (“OSCF”) since December 2021; Chief Executive Officer and Chief Investment Officer of OCSL since 2019; Chief Executive Officer and Chief Investment Officer of Oaktree Strategic Income Corporation (“OCSI”) from September 2019 to March 2021; Managing Director and Head of Liquid Credit of OCM, as well as portfolio manager for OCM’s U.S. Senior Loan strategies | | 2 | | Trustee, OSCF (2021-present) |
| Independent Directors | | | | | | | | |
| Allison Keller (57) | | Class II Director since 2018; term expires in 2023 | | Since 2007, Executive Director and Chief Financial Officer of W.M. Keck Foundation; from 2007 through 2016, Ms. Keller was also the President of Oakmont Corporation, a private investment firm and family office assisting multi-generational, high net worth extended families and related private foundations. | | 2 | | Trustee, OSCF (2021-present) |
| Stephen Mosko (66) | | Class I Director since 2018; term expires in 2025 | | Chief Executive Officer of Village Roadshow Entertainment Group since October 2018; from 2015 to 2016, Mr. Mosko served as Chair of Sony Pictures Television for which he remains a consultant. Mr. Mosko also served as the President of Sony Pictures’ U.S. Television operation, Executive Vice President of Sales for Sony Pictures Television and Vice President of the Western Region for Columbia TriStar Television Distribution. | | 2 | | Trustee, OSCF (2021-present) |
| Deborah Gero (62) | | Class I Director since 2019; term expires in 2025 | | Until 2018, various positions with AIG, including as a Senior Managing Director and Deputy Chief Investment Officer of AIG Asset Management from 2012 to 2018 and Chief Risk Officer for the Life and Retirement division from 2009 to 2012 | | 3 | | Director, OCSL (2019-present); Trustee, OSCF (2021-present); Previously a member of the board of directors of OCSI |
_____________________
(1) The address of all directors is c/o Oaktree Strategic Income II, Inc., 333 South Grand Avenue, 28th Floor, Los Angeles, CA 90071.
(2) “Fund Complex” includes the Company, OCSL and OSCF, each a company that has elected to be regulated as a “business development company” under the Investment Company Act.
(3) Except as set forth in this table, none of the Company’s directors otherwise serves, or has served during the past five years, as a director of an investment company registered under the Investment Company Act or of a company with a class of securities registered pursuant to Section 12 of the Exchange Act or subject to the requirements of Section 15(d) of the Exchange Act.
Executive Officers who are not Directors
Information regarding our executive officers who are not directors is as follows:
| | | | | | | | | | | | | | |
| Name | | Age | | Position |
| Mathew Pendo | | 59 | | President |
| Matthew Stewart | | 38 | | Chief Operating Officer |
| Christopher McKown | | 41 | | Chief Financial Officer and Treasurer |
| Ashley Pak | | 44 | | Chief Compliance Officer |
The address for each of our executive officers is Oaktree Strategic Income II, Inc., c/o Oaktree Capital Management, L.P., 333 South Grand Avenue 28th Floor, Los Angeles, CA 90071.
Biographical Information
Additional biographical information regarding our current directors and executive officers is set forth below.
Interested Director
Armen Panossian. Mr. Panossian has been a member of the Board and has served as the Company’s Chairman, Chief Executive Officer and Chief Investment Officer since September 2019. Since December 2021, Mr. Panossian has also served as Chief Executive Officer, Chief Investment Officer and Chairman of OSCF. Mr. Panossian has also served as Chief Executive Officer and Chief Investment Officer of OCSL since September 2019. Mr. Panossian also served as the Chief Executive Officer and Chief Investment Officer of OCSI from September 2019 until OCSI merged with and into OCSL on March 19, 2021. In addition, Mr. Panossian is a managing director and OCM’s Head of Performing Credit where his responsibilities include oversight of the firm’s performing credit activities including the senior loan, high yield bond, private credit, convertibles, structured credit and emerging markets debt strategies. He also serves as a portfolio manager within the Global Private Debt and Global Credit strategies. Mr. Panossian joined OCM in 2007 as a senior member of its Global Opportunities group. In January 2014, he joined the U.S. Senior Loan team to assume co-portfolio management responsibilities and lead the development of OCM’s CLO business. Mr. Panossian joined OCM from Pequot Capital Management, where he worked on their distressed debt strategy. Mr. Panossian received a B.A. degree in economics with honors and distinction from Stanford University, where he was elected to Phi Beta Kappa. Mr. Panossian then went on to receive an M.S. degree in health services research from Stanford Medical School and J.D. and M.B.A. degrees from Harvard Law School and Harvard Business School. Mr. Panossian serves on the Advisory Board of the Stanford Institute for Economic Policy Research. He is a member of the State Bar of California.
Independent Directors
Deborah Gero. Ms. Gero has been a member of the Board since September 2019. Ms. Gero has also been a member of the board of directors of OCSL since March 2019 and a member of the board of trustees of OSCF since December 2021. Ms. Gero has held various positions with AIG, including as a Senior Managing Director and Deputy Chief Investment Officer of AIG Asset Management, where she was responsible for developing the firm’s investment strategy for approximately $300 billion of insurance company portfolios from 2012 to 2018. She joined AIG in 2009 and served as Chief Risk Officer for the Life and Retirement division until 2012. Before joining AIG, Ms. Gero was a consultant from 2003 to 2009, focusing on collateralized debt obligation investment management and investments in insurance companies. Prior to her work as a consultant, Ms. Gero spent eight years at AIG and its predecessor entities in a variety of capacities including Portfolio Manager of a $3 billion collateralized debt obligation portfolio and Corporate Actuary. Previous experiences include numerous actuarial and asset/liability management roles at Conseco, Inc., Tillinghast/Towers-Perrin and Pacific Mutual Life Insurance Company. Ms. Gero currently serves as a director of Newport Re, Ltd. and The Friends of the Brentwood Art Center and as a member of the Investment Committee of United Way of Greater Los Angeles. Ms. Gero has previously served as a director of OCSI, Aurora National Life Insurance Company and New California Life Holdings, as well as several insurance and asset management subsidiaries of AIG. Ms. Gero received a B.A. degree in mathematics from the University of Notre Dame. She is a CFA charterholder, a fellow in the Society of Actuaries and a member of the American Academy of Actuaries.
Stephen Mosko. Mr. Mosko has been a member of the Board and has served as a member of the Audit Committee since July 2018. Mr. Mosko has also been a member of the board of trustees of OSCF since December 2021. Since October 2018, Mr. Mosko has served as Chief Executive Officer of Village Roadshow Entertainment Group. Mr. Mosko formerly served as Chair of Sony Pictures Television for which he remains a consultant. Mr. Mosko also served as the President of Sony Pictures’
U.S. Television operation, Executive Vice President of Sales for Sony Pictures Television and Vice President of the Western Region for Columbia TriStar Television Distribution. Before joining Sony Pictures, Mr. Mosko held earlier career positions as Local Sales Manager of NBC affiliate WMAR-TV in Baltimore, and in Philadelphia as General Sales Manager of WTAF-TV and Vice President and Station Manager of WPHL-TV. Mr. Mosko has served as Chairman of the National Association of Television Program Executives; Chairman of the Academy of Television Arts & Sciences Foundation; Director of Game Show Network, LLC and Game Show Network; Director of The Advertising Council, Inc.; Member of the Board of Directors for the Celine Cousteau Film Fellowship; Member of the Executive Committee of the Los Angeles Board of Governors of The Paley Museum; Member of the National Board of Junior Achievement; Member of the Executive Board of the UCLA School of Theater, Film and Television; Director at Loyola Marymount University, Los Angeles; Member of the Philadelphia Police Department’s Drug Advisory Council; and President of the Philadelphia Ad Club. Mr. Mosko received his Bachelor of Arts in Communications from the University of Delaware. Mr. Mosko also received honorary degrees from Loyola Marymount University, Chapman University and the University of Delaware.
Allison Keller. Ms. Keller has been a member of the Board and has served as the Chair of the Audit Committee since July 2018. Ms. Keller has also been a member of the board of trustees of OSCF since December 2021. Since 2007, Ms. Keller has been the Executive Director and Chief Financial Officer of the W.M. Keck Foundation, a foundation focused primarily on promoting pioneering scientific discoveries as well as undergraduate education and, in Southern California, community programs. Ms. Keller manages the program, investment, staff and administrative activities while working closely with the foundation’s board of directors to develop the foundation’s vision and strategies. From 2007 through 2016, Ms. Keller was also the President of Oakmont Corporation, a private investment firm and family office assisting multi-generational, high net worth extended families and related private foundations. Previously, Ms. Keller was a corporate partner with O’Melveny & Myers LLP. Ms. Keller’s practice focused on raising public and private capital, counseling private and public company boards of directors on strategic transactions and corporate governance policies, negotiating business combinations and reviewing complex regulatory filings. Ms. Keller’s philanthropic work includes board service in both public and private higher education and K-12 education and medical research and education. Ms. Keller has also performed pro bono legal work for multiple community organizations in Los Angeles. Ms. Keller earned her A.B. from Princeton University and J.D. from UCLA School of Law.
Executive Officers
Mathew Pendo. Mr. Pendo has served as President of since August 2019. Mr. Pendo has served as President of OCSL and OSCF since August 2019 and December 2021, respectively. Mr. Pendo also currently serves as Managing Director, Head of Corporate Development and Capital Markets for OCM, which he joined in 2015, and as Chief Operating Officer of Oaktree Acquisition Corp. III since February 2021. Mr. Pendo previously served as Chief Operating Officer of OCSL from October 2017 to January 2022, as Chief Operating Officer and President of OCSI from October 2017 and August 2019, respectively, until March 2021, as Chief Operating Officer of the Company from July 2018 until December 2021 and as Chief Operating Officer of Oaktree Acquisition Corp. II. from August 2020 until June 2022.
Prior to joining OCM in 2015, Mr. Pendo was at the investment banking boutique of Sandler O’Neill Partners, where he was a managing director focused on the financial services industry. Prior thereto, Mr. Pendo was the chief investment officer of the Troubled Asset Relief Program (TARP) of the U.S. Department of the Treasury, where he was honored with the Distinguished Service Award. There, he built and managed a team of 20 professionals overseeing the Treasury’s $200 billion TARP investment activities across multiple industries including AIG, GM and the banks, and all levels of the capital structure. Mr. Pendo began his career at Merrill Lynch, where he spent 18 years, starting in their investment banking division before becoming managing director of the technology industry group. Subsequently, Mr. Pendo was a managing director at Barclays Capital, first serving as co-head of U.S. Investment Banking and then co-head of Global Industrials group. Mr. Pendo previously served as a member of the Board of Directors of Keypath Education, Inc., New IPT Holdings, LLC and SuperValue Inc. He received a bachelor’s degree in economics from Princeton University, cum laude.
Matthew Stewart. Mr. Stewart has served as Chief Operating Officer of the Company since December 2021. Mr. Stewart has also served as the Chief Operating Officer of OCSL and OSCF since December 2021. Mr. Stewart is a Senior Vice President and investment professional on OCM’s Strategic Credit team. Prior to joining OCM in 2017, Mr. Stewart was a vice president at Fifth Street Management. Prior thereto, he was a director at Stifel Nicolaus where he worked in the Leveraged Finance Group. Mr. Stewart began his career as a senior associate at BDO Consulting in the Business Restructuring group before moving on to serving as a vice president in the institutional fixed income business at Knight Capital Group. He received a B.B.A. in finance and a B.S. in accountancy from Villanova University. Mr. Stewart is a Certified Public Accountant (inactive) and CFA charterholder.
Christopher McKown. Mr. McKown has served as Chief Financial Officer and Treasurer of the Company since January 2022. Mr. McKown has also served as Chief Financial Officer and Treasurer of OCSL and OSCF since November 2021 and
December 2021, respectively. Mr. McKown joined OCM in 2011 and currently serves as a Managing Director responsible for fund accounting and reporting for OCM’s Strategic Credit strategy. Mr. McKown previously served as the Assistant Treasurer of the Company and OCSL and also served as Assistant Treasurer of OCSI until March 2021. Prior to joining OCM, Mr. McKown worked in the audit practice at KPMG LLP. Mr. McKown received a B.A. degree in business economics with a minor in accounting cum laude from the University of California, Los Angeles and is a Certified Public Accountant (inactive).
Ashley Pak. Ms. Pak has served as the Company’s Chief Compliance Officer since November 2021. Ms. Pak has also served as the Chief Compliance Officer of OCSL and OSCF since November 2021 and December 2021, respectively. Ms. Pak joined OCM in 2007 and currently serves as a Senior Vice President in the Compliance Department. Prior to joining OCM, she was a Compliance/Legal Specialist at Associated Securities Corp. Ms. Pak received a B.A. in Business Administration from Seattle University and an MBA from the University of Massachusetts, Amherst – Isenberg School of Management.
Committees of the Board of Directors
Our Board has established an audit committee (the “Audit Committee”). We do not have a nominating committee because we believe the function typically served by such committee is best handled by those trustees whose term is not expiring currently. We do not have a compensation committee because our executive officers do not receive any direct compensation from us.
Audit Committee
The Audit Committee is currently composed of Ms. Keller and Mr. Mosko, each of whom is an Independent Director. Ms. Keller serves as Chair of the Audit Committee. The Board has determined that Ms. Keller is an “audit committee financial expert” as that term is defined under Item 407 of Regulation S-K, as promulgated under the Exchange Act. Each of Ms. Keller and Mr. Mosko meets the current independence and experience requirements of Rule 10A-3 of the Exchange Act. The Audit Committee operates pursuant to a charter approved by the Board, which sets forth the responsibilities of the Audit Committee. A copy of the charter was attached as Attachment A to the Company’s definitive proxy statement for the fiscal year ended September 30, 2018, which the Company filed with the SEC on June 7, 2019. The Audit Committee’s responsibilities include selecting the Company’s independent registered public accounting firm, reviewing with such independent registered public accounting firm the planning, scope and results of their audit of the Company’s financial statements, pre-approving the fees for services performed, reviewing with the independent registered public accounting firm the adequacy of internal control systems, reviewing the Company’s annual financial statements, overseeing internal audit staff and periodic filings and receiving the Company’s audit reports and financial statements.
Code of Business Conduct
The Company has adopted a Code of Business Conduct which applies to, among others, executive officers, including the principal executive officer, principal financial officer, principal accounting officer or controller, or persons performing similar functions and all other officers, employees and directors of the Company.
There have been no material changes to our Code of Business Conduct or material waivers of Code of Business Conduct that apply to our Chief Executive Officer or Chief Financial Officer.
The Company undertakes to provide a copy of the Code of Business Conduct to any person, without charge, upon request. Requests for a copy of the Code of Business Conduct may be made in writing addressed to Oaktree Strategic Income II, Inc., 333 South Grand Avenue, 28th Floor, Los Angeles, CA 90071, Attention: General Counsel and Secretary.
Item 11. Executive Compensation
Compensation of Executive Officers
The Company does not currently have any employees and does not expect to have any employees. Services necessary for our business are provided by individuals who are employees of Oaktree or its affiliates or by subcontractors, pursuant to the terms of the Investment Advisory Agreement entered into by and between the Company and the Adviser, and the Administration Agreement entered into by and between the Company and the Administrator. Each of our executive officers is an employee of Oaktree or its affiliates and does not receive direct compensation from us. Our day‑to-day investment operations are managed by the Adviser. Most of the services necessary for the origination and administration of our investment portfolio are provided by investment professionals employed by the Adviser or its affiliates or by subcontractors.
Compensation of Independent Directors
Each Independent Director receives the following amounts for serving as a director of the Company: (i) a $50,000 annual fee; and (ii) an annual fee of $5,000 for the Chair of our Audit Committee.
The Independent Directors review their own compensation and recommend to the Board the appropriate level of compensation. In conducting their review, the Independent Directors use such information as they deem relevant, including compensation paid to directors of other BDCs of similar size and the time and effort required of the directors in fulfilling their responsibilities to the Company. The Board then determines the compensation of the Independent Directors. This level of compensation may be adjusted from time to time.
The following table sets forth information concerning total compensation earned by or paid to each of the Independent Directors during the fiscal year ended September 30, 2022. No compensation is expected to be paid to directors who are interested directors:
| | | | | | | | | | | | | | | | | |
| Fees Earned or Paid in Cash | | Total Compensation from the Company | | Total Compensation from the Fund Complex(1) |
| Allison Keller, Independent Director | $ | 55,000 | | | $ | 55,000 | | | $ | 107,538 | |
| Steven Mosko, Independent Director | $ | 50,000 | | | $ | 50,000 | | | $ | 102,538 | |
| Deborah Gero, Independent Director | $ | 50,000 | | | $ | 50,000 | | | $ | 283,468 | |
_____________________
(1) “Fund Complex” includes the Company, OCSL and OSCF, each a company that has elected to be regulated as a “business development company” under the Investment Company Act.
Item 12. Security Ownership of Certain Beneficial Owners and Management and Related Stockholder Matters
The following table sets forth, as of December 13, 2022, the beneficial ownership information of each director of the Company, as well as the Company’s executive officers, each person known to it to beneficially own 5% or more of the outstanding shares of its common stock, and the executive officers and directors as a group. Percentage of beneficial ownership is based on 17,401,121 shares of common stock outstanding as of December 13, 2022.
Beneficial ownership is determined in accordance with the rules of the SEC and includes voting or investment power with respect to the securities. Based upon the absence of filings with the SEC by persons reporting beneficial ownership of 5% or more of the Company’s common stock, the Company believes there are no such persons.
Unless otherwise indicated, the Company believes that each beneficial owner set forth in the table below has sole voting and investment power over the shares beneficially owned by such beneficial owner. The directors are divided into two groups — interested director and Independent Directors. The interested director is an “interested person” of the Company as defined in Section 2(a)(19) of the Investment Company Act. The address of all executive officers and directors is c/o Oaktree Strategic Income II, Inc., 333 South Grand Avenue, 28th Floor, Los Angeles, CA 90071.
| | | | | | | | | | | | | | |
| Name | | Number of Shares of Common Stock Owned Beneficially | | Percentage of Company Common Stock Outstanding |
| Interested Director: | | | | |
| Armen Panossian | | — | | | — | |
| Independent Directors: | | | | |
| Deborah Gero | | — | | | — | |
| Allison Keller | | — | | | — | |
| Steven Mosko | | — | | | — | |
| Executive Officers: | | | | |
| Christopher McKown | | — | | | — | |
| Mathew Pendo | | — | | | — | |
| Matthew Stewart | | — | | | — | |
| Ashley Pak | | — | | | — | |
All Executive Officers and Directors as a Group (1) | | | | |
| 5% Holders | | — | | | — | |
__________
(1) Amount only includes Section 16(a) reporting persons of the Company.
The following table sets forth, as of December 13, 2022, the dollar range of our equity securities that is beneficially owned by each of the current directors of the Company.
| | | | | | | | |
| Name | | Dollar Range of Equity Securities Beneficially Owned (1) |
| Interested Director: | | |
| Armen Panossian | | None |
| Independent Director: | | |
| Deborah Gero | | None |
| Allison Keller | | None |
| Steven Mosko | | None |
__________
(1) Beneficial ownership has been determined in accordance with Rule 16a-1(a)(2) of the Exchange Act.
Item 13. Certain Relationships and Related Transactions, and Director Independence
Investment Advisory Agreement
The Company has entered into an Investment Advisory Agreement with the Adviser. Pursuant to the Investment Advisory Agreement, the Company pays the Adviser a fee for investment advisory and management services consisting of two components - the Management Fee and the Incentive Fee (each as defined below).
Management Fee
Prior to (i) the listing of the Company’s Common Stock on a national securities exchange or (ii) an initial public offering of the Company’s Common Stock that results in gross proceeds to the Company of at least $50 million and a listing of the Common Stock on a national securities exchange (each of (i) and (ii), a “Qualified Listing”), if any, the Adviser is entitled to receive quarterly in arrears a management fee (the “Management Fee”) equal to 1.00% per annum (the “Applicable Management Fee Percentage”) of the Company’s Gross Asset Value (as defined below); provided, that prior to a Qualified Listing, the Management Fee does not exceed 1.75% per annum of the Unleveraged Asset Value (as defined below). From and after the date of a Qualified Listing, if any, the Applicable Management Fee Percentage will increase to 1.50% per annum of the Company’s Gross Asset Value.
For purposes of calculating the Management Fee, the Gross Asset Value is determined by the Company’s Board (including any committee thereof). Until August 6, 2019, the Management Fee for each quarter was calculated based on the Company’s average Gross Asset Value at the end of each month during such calendar quarter (prior to taking into account any Incentive Fee); provided, that the Management Fee for the Company’s first calendar quarter was calculated based on the Company’s Gross Asset Value at the end of such calendar quarter (prior to taking into account any Incentive Fee). Following August 6, 2019, the Management Fee for each quarter is calculated based on the Company’s average Gross Asset Value at the end of such quarter and at the end of the preceding quarter (in each case, prior to taking into account any Incentive Fee); provided, that the Management Fee for the calendar quarter in which the Company consummates a Qualified Listing will be calculated based on the Company’s Gross Asset Value at the end of such calendar quarter (prior to taking into account any Incentive Fee). For the year ended September 30, 2022, base management fees were $5,656,120.
The term “Gross Asset Value” means the value of the Company’s gross assets, determined on a consolidated basis in accordance with GAAP, including portfolio investments purchased with borrowed funds and other forms of leverage, but excluding cash and cash equivalents.
The term “Unleveraged Asset Value” means the Gross Asset Value less the Company’s borrowings for investment purposes determined on a consolidated basis in accordance with GAAP (other than borrowings under the Company’s investor subscription credit facility that are repaid within 180 days following incurrence).
Incentive Fee
The Incentive Fee consists of two parts: the Investment Income Incentive Fee and the Capital Gains Incentive Fee (each defined below).
Investment Income Incentive Fee
The Investment Income Incentive Fee is calculated and payable quarterly in arrears based on the Company’s Pre-Incentive Fee Net Investment Income, which means consolidated interest income, dividend income and any other income (including any other fees (other than fees for providing managerial assistance), such as commitment, origination, structuring, diligence and consulting fees or other fees that the Company receives from portfolio companies) accrued during the calendar quarter, minus the operating expenses accrued for the quarter (including the Management Fee, Company expenses and any interest expense or fees on any credit facilities or outstanding debt, but excluding the Incentive Fee). The Pre-Incentive Fee Net Investment Income includes, in the case of investments with a deferred interest feature (such as OID, debt instruments with PIK interest and zero coupon securities), accrued income that has not yet been received in cash. For the avoidance of doubt, the Pre-Incentive Fee Net Investment Income does not include any realized capital gains, realized capital losses or unrealized capital appreciation or depreciation. The Pre-Incentive Fee Net Investment Income, expressed as a rate of return on the value of the Company’s net assets at the end of the immediately preceding calendar quarter, is compared to a hurdle of 1.50% per quarter (6% annualized) (the “Hurdle Rate”). The Company pays the Adviser an Investment Income Incentive Fee each quarter as follows:
(a) Hurdle Rate Return: No Investment Income Incentive Fee in any calendar quarter in which the Pre-Incentive Fee Net Investment Income does not exceed the Hurdle Rate;
(b) Catch-Up: 100% of the Pre-Incentive Fee Net Investment Income, if any, that exceeds the Hurdle Rate but is less than a 1.875% (7.5% annualized) rate of return on the value of the Company’s net assets in such calendar quarter (the “Catch-Up”), which is intended to provide the Adviser with 20% of the Pre-Incentive Fee Net Investment Income as if the Hurdle Rate did not apply, if the Pre-Incentive Fee Net Investment Income exceeds the Hurdle Rate in such calendar quarter; and
(c) 80/20 Split: 20% of the Pre-Incentive Fee Net Investment Income, if any, that exceeds a 1.875% (7.5% annualized) rate of return on the value of the Company’s net assets in such calendar quarter, so that once the Hurdle Rate is reached and the Catch-Up in (a) immediately above is achieved, 20% of the Pre-Incentive Fee Net Investment Income thereafter is allocated to the Adviser.
The foregoing calculations will be appropriately prorated for any period of less than three months and adjusted for any issuances or repurchases of Common Stock during a quarter. For the year ended September 30, 2022, Investment Income Incentive Fees were $7,723,049.
Capital Gains Incentive Fee
In addition to the Investment Income Incentive Fee described above, the Adviser is entitled to receive a Capital Gains Incentive Fee (as defined below). The Capital Gains Incentive Fee is determined and payable in arrears as of the end of each calendar year. The Capital Gains Incentive Fee is equal to 20% of the realized capital gains, if any, on a cumulative basis from the date of the Initial Closing through the end of each calendar year, computed net of all realized capital losses on a cumulative basis and unrealized capital depreciation, less the aggregate amount of any previously paid Capital Gains Incentive Fee with respect to each of the investments in the Company’s portfolio, provided, that the Capital Gains Incentive Fee determined as of December 31, 2018 was calculated for a period of shorter than 12 calendar months to take into account any realized capital gains computed net of all realized capital losses and unrealized capital depreciation from the date of the Initial Closing through the end of 2018 (the “Capital Gains Incentive Fee,” and together with the Investment Income Incentive Fee, the “Incentive Fees”). As of September 30, 2022, the Company paid $1,496,334 of capital gains incentive fees cumulatively under the Investment Advisory Agreement.
Although the Capital Gains Incentive Fee due to the Adviser is not payable until it is contractually due based on the Investment Advisory Agreement, the Company accrues this component at the end of each reporting period based on the Company’s realized capital gains, if any, on a cumulative basis from the date of the Initial Closing through the end of each reporting period, computed net of all realized capital losses on a cumulative basis and unrealized capital depreciation, less the aggregate amount of any previously paid Capital Gains Incentive Fee, as contractually included in the calculation of the Capital Gains Incentive Fee, plus the cumulative amount of unrealized capital appreciation. If such amount is positive at the end of a period, then the Company will accrue an incentive fee equal to 20% of such amount. If such amount is negative, then there will be no accrual for such period or an appropriate reduction in any amount previously accrued. U.S. GAAP requires that the Capital Gains Incentive Fee accrual consider cumulative unrealized capital appreciation in the calculation, as a Capital Gains Incentive Fee would be payable if such unrealized capital appreciation were realized. There can be no assurance that such unrealized capital appreciation will be realized in the future. For the year ended September 30, 2022, the Company reversed
previously accrued Capital Gains Incentive Fees of $1,988,557. As of September 30, 2022, there was no accrued capital gains incentive fee liability.
Administration Agreement
The Company is externally administered pursuant to the Administration Agreement. Pursuant to the Administration Agreement, the Administrator furnishes the Company with office facilities (certain of which are located in buildings owned by a Brookfield affiliate), equipment and clerical, bookkeeping and recordkeeping services at such facilities. Under the Administration Agreement, the Administrator also performs, or oversees the performance of, the Company’s required administrative services, which include, among other things, providing assistance in accounting, legal, compliance, operations, technology and investor relations, and being responsible for the financial records that the Company is required to maintain and preparing reports to stockholders and reports filed with the SEC. In addition, the Administrator assists the Company in determining and publishing the net asset value, overseeing the preparation and filing of tax returns and the printing and dissemination of reports to the Company’s stockholders, and generally overseeing the payment of the Company’s expenses and the performance of administrative and professional services rendered to the Company by others.
Payments under the Administration Agreement are equal to an amount that reimburses the Administrator for its costs and expenses incurred in performing its obligations under the Administration Agreement and providing personnel and facilities. The Administration Agreement may be terminated by either party without penalty upon 60 days’ written notice to the other party, by the vote of a majority of the Company’s outstanding voting securities, or by the vote of the Company’s directors or by the Administrator. In addition, our Administrator entered into the Sub-Administration Agreement with State Street, pursuant to which State Street provides certain administrative and professional services. The Company bears all of the costs and expenses of any sub-administration agreements that the Administrator enters into.
For the avoidance of doubt, the Company bears its allocable portion of the costs of the compensation, benefits, and related administrative expenses (including travel expenses) of the Company’s officers who provide operational and administrative services under the Administration Agreement, their respective staffs and other professionals who provide services to the Company (including, in each case, employees of the Administrator or an affiliate) who assist with the preparation, coordination, and administration of the foregoing or provide other “back office” or “middle office” financial or operational services to the Company. The Company reimburses the Adviser (or its affiliates) for an allocable portion of the compensation paid by the Adviser (or its affiliates) to such individuals (based on a percentage of time such individuals devote, on an estimated basis, to the Company’s business and affairs and to acting on the Company’s behalf). Our board of directors reviews the fees payable under the Administration Agreement to determine that these fees are reasonable and comparable to administrative services charged by unaffiliated third parties.
For the year ended September 30, 2022, the Company incurred $575,978 of expenses under the Administration Agreement.
Placement Agent Agreement
The Company has entered into a Placement Agent Agreement with the Placement Agent, which may require investors (other than investors sourced by the Company, the Adviser, the Placement Agent or their respective affiliates) to pay a distribution fee to the Placement Agent for its services. Although the Company does not pay any fees to the Placement Agent, the Company indemnifies the Placement Agent in connection with its activities.
Co-Investment Relief
The Adviser has received exemptive relief from the SEC to allow certain managed funds and accounts, each of whose investment adviser is the Adviser or an investment adviser controlling, controlled by or under common control with the Adviser, as well as certain Oaktree proprietary accounts, to participate in negotiated co-investment transactions where doing so is consistent with the applicable registered fund’s or BDC’s investment objective and strategies as well as regulatory requirements and other pertinent factors, and pursuant to the conditions of the SEC order.
Review, Approval or Ratification of Transactions with Related Persons
The Independent Directors of the Company are required to review, approve or ratify any transactions with related persons (as such term is defined in Item 404 of Regulation S K).
Director Independence
For information regarding the independence of our directors, see “Directors, Executive Officers and Corporate Governance” in Part III, Item 10 of this Form 10-K.
Item 14. Principal Accountant Fees and Services
Independent Auditor’s Fees
The following table presents fees for professional services rendered by Ernst & Young LLP (“EY”) for the fiscal years ended September 30, 2022 and 2021.
| | | | | | | | | | | |
| 2022 | | 2021 |
| Audit Fees | $ | 285,000 | | | $ | 275,000 | |
| Audit-Related Fees | $ | — | | | $ | — | |
| Aggregate Non-Audit Fees: | | | |
| Tax Fees | $ | 60,500 | | | $ | 60,500 | |
| All Other Fees | — | | | — | |
| Total Aggregate Non-Audit Fees | $ | 60,500 | | | $ | 60,500 | |
| Total Fees | $ | 345,500 | | | $ | 335,500 | |
Audit Fees. Audit fees consist of fees billed for professional services rendered for the audit of the Company’s year-end financial statements and services that are normally provided by the independent registered public accounting firm in connection with statutory and regulatory filings.
Audit-Related Fees. Audit-related services consist of fees billed for assurance and related services that are reasonably related to the performance of the audit or review of the Company’s financial statements and are not reported under “Audit Fees.” These services include attest services that are not required by statute or regulation and consultations concerning financial accounting and reporting standards.
Tax Fees. Tax fees consist of fees billed for professional services for tax compliance. These services include assistance regarding federal, state and local tax compliance.
All Other Fees. All other fees would include fees for products and services other than the services reported above.
Aggregate Non-Audit Fees. Aggregate non-audit fees billed by EY to Oaktree and its affiliates who provide on-going services to the Company during the fiscal years ended September 30, 2022 and 2021 were $8,415,000 and $7,216,803, respectively. The Audit Committee does not consider the provision of such services to be incompatible with maintaining EY’s independence.
PART IV
Item 15. Exhibits and Financial Statement Schedule
(a) Documents filed as part of this annual report
The following reports and financial statements are set forth in Part II, Item 8 of this Form 10-K:
| | | | | |
| Report of Independent Registered Public Accounting Firm | |
| Consolidated Statements of Assets and Liabilities as of September 30, 2022 and 2021 | |
| Consolidated Statements of Operations for the years ended September 30, 2022, 2021 and 2020 | |
| Consolidated Statements of Changes in Net Assets for the years ended September 30, 2022, 2021 and 2020 | |
| Consolidated Statements of Cash Flows for the years ended September 30, 2022, 2021 and 2020 | |
| Consolidated Schedule of Investments as of September 30, 2022 | |
| Consolidated Schedule of Investments as of September 30, 2021 | |
| Notes to Consolidated Financial Statements | |
(b) Exhibits
The following exhibits are filed as part of this report or hereby incorporated by reference to exhibits previously filed with the SEC:
| | | | | | | | |
| Exhibit | | Description |
| | Agreement and Plan of Merger among Oaktree Strategic Income II, Inc., Oaktree Specialty Lending Corporation, Project Superior Merger Sub, Inc. and Oaktree Fund Advisors LLC (for the limited purposes set forth therein), dated as of September 14, 2022(1) |
| | Amended and Restated Certificate of Incorporation (2) |
| | Amended and Restated Bylaws (2) |
| | Form of Subscription Agreement (3) |
| | Description of Securities * |
| | Amended and Restated Investment Advisory Agreement, dated as of May 11, 2020, by and between the Company and Oaktree Fund Advisors, LLC. (4) |
| | Administration Agreement, dated as of September 30, 2019, by and between the Company and Oaktree Fund Administration, LLC (5) |
| | Form of Indemnification Agreement (2) |
| | Custody Agreement, dated as of July 31, 2018, by and between the Company and The Bank of New York Mellon (2) |
| | Loan and Security Agreement, dated as of July 26, 2019, by and among Oaktree Strategic Income II, Inc., OSI 2 Senior Lending SPV, LLC, each of the lenders from time to time party thereto, Citibank, N.A. and Deutsche Bank Trust Company Americas. (6) |
| | First Amendment to Loan and Security Agreement, dated as of September 20, 2019, by and among Oaktree Strategic Income II, Inc., OSI 2 Senior Lending SPV, LLC, each of the lenders from time to time party thereto, Citibank, N.A. and Deutsche Bank Trust Company Americas. (7) |
| | Second Amendment to Loan and Security Agreement, dated as of July 2, 2020, by and among Oaktree Strategic Income II, Inc., OSI 2 Senior Lending SPV, LLC, each of the lenders from time to time party thereto, and Citibank, N.A. (8) |
| | Loan and Security Agreement, dated as of June 9, 2020, by and between Oaktree Strategic Income II, Inc., as borrower, and City National Bank, as lender. (9) |
| | Third Amendment to Loan and Security Agreement, dated as of December 31, 2020, by and among Oaktree Strategic Income II, Inc., OSI 2 Senior Lending SPV, LLC, and Citibank, N.A.(10) |
| | Fourth Amendment to Loan and Security Agreement, dated as of March 31, 2021, by and among Oaktree Strategic Income II, Inc., OSI 2 Senior Lending SPV, LLC, and Citibank, N.A.(11) |
| | First Amendment to Loan and Security Agreement, dated as of March 31, 2021, by and between Oaktree Strategic Income II, Inc. and City National Bank.(12) |
| 21 | | Subsidiaries: ● OSI 2 Senior Lending SPV, LLC - Delaware |
| | Power of Attorney (included on the signature page hereto)* |
| | Certification of Chief Executive Officer (Principal Executive Officer) Pursuant to Rule 13a-14(a) of the Securities Exchange Act of 1934, as amended.* |
| | Certification of Chief Financial Officer (Principal Financial Officer) Pursuant to Rule 13a-14 of the Securities Exchange Act of 1934, as amended.* |
| | Certification of Chief Executive Officer (Principal Executive Officer) Pursuant to 18 U.S.C. Section 1350, as Adopted Pursuant to Section 906 of the Sarbanes-Oxley Act of 2002.* |
| | Certification of Chief Financial Officer (Principal Financial Officer) Pursuant to 18 U.S.C. Section 1350, as Adopted Pursuant to Section 906 of the Sarbanes-Oxley Act of 2002.* |
| | | | | |
| * | Filed herewith. |
| (1) | Incorporated by reference to the Company’s Form 8-K filed by the Company on September 15, 2022 (File No. 814-02181) |
| (2) | Incorporated by reference to the Company’s Form 10-12G filed by the Company on August 3, 2018 (File No. 000-55975) |
| (3) | Incorporated by reference to the Company’s Form 10-12G/A filed by the Company on October 2, 2018 (File No. 000-55975) |
| (4) | Incorporated by reference to Exhibit 10.1 to the Company's Quarterly Report on Form 10-Q filed by the Company on May 13, 2020 (File No. 814-01281) |
| (5) | Incorporated by reference to Exhibit 10.2 to the Company's Annual Report on Form 10-K, filed by the Company on December 18, 2019 (File No. 814-01281) |
| (6) | Incorporated by reference to Exhibit 10.1 to the Company's Quarterly Report on Form 10-Q, filed by the Company on August 14, 2019 (File No. 814-01281) |
| (7) | Incorporated by reference to Exhibit 10.8 to the Company’s Annual Report on Form 10-K filed by the Company on December 18, 2019 (File No. 814-01281) |
| (8) | Incorporated by reference to Exhibit 10.1 to the Company’s Form 8-K filed by the Company on July 8, 2020 (File No. 814-01281) |
| (9) | Incorporated by reference to Exhibit 10.1 to the Company’s Form 8-K filed by the Company on June 12, 2020 (File No. 814-01281) |
| (10) | Incorporated by reference to Exhibit 10.1 to the Company’s Form 8-K filed by the Company on January 6, 2021 (File No. 814-01281) |
| (11) | Incorporated by reference to Exhibit 10.1 to the Company’s Form 8-K filed by the Company on April 6, 2021 (File No. 814-01281) |
| (12) | Incorporated by reference to Exhibit 10.2 to the Company’s Form 8-K filed by the Company on April 6, 2021 (File No. 814-01281) |
Item 16. Form 10-K Summary
None.
SIGNATURES
Pursuant to the requirements of Section 13 or 15(d) of the Securities Exchange Act of 1934, the registrant has duly caused this report to be signed on its behalf by the undersigned, thereunto duly authorized.
| | | | | | | | |
| | |
| OAKTREE STRATEGIC INCOME II, INC. |
| |
| By: | | /s/ Armen Panossian |
| | Armen Panossian |
| | Chairman, Chief Executive Officer and Chief Investment Officer |
| |
| By: | | /s/ Christopher McKown |
| | Christopher McKown |
| | Chief Financial Officer and Treasurer |
Date: December 14, 2022
POWER OF ATTORNEY
KNOW ALL MEN BY THESE PRESENTS, that each person whose signature appears below hereby constitutes and appoints Armen Panossian and Christopher McKown, and each of them (with full power to each of them to act alone), his true and lawful attorneys-in-fact and agents, with full power of substitution and re-substitution, for him and on his behalf and in his name, place and stead, in any and all capacities, to sign, execute and file this Annual Report on Form 10-K for the fiscal year ended September 30, 2022, and any or all amendments to this Report, with all exhibits and any and all documents required to be filed with respect thereto, with the Securities and Exchange Commission or any other regulatory authority, granting unto such attorneys-in-fact and agents, and each of them, full power and authority to do and perform each and every act and thing appropriate or necessary to be done in order to effectuate the same, as fully to all intents and purposes as he himself might or could do in person, hereby ratifying and confirming all that such attorneys-in-fact and agents, or any of them, or their or his or her substitute or substitutes, may lawfully do or cause to be done by virtue hereof.
Pursuant to the requirements of the Securities Exchange Act of 1934, this report has been signed below by the following persons on behalf of the registrant and in the capacities and on the dates indicated.
| | | | | | | | | | | | | | |
| | | | |
| Signature | | Title | | Date |
| | |
/s/ Armen Panossian Armen Panossian
| | Chairman, Chief Executive Officer and Chief Investment Officer
(principal executive officer) | | December 14, 2022 |
| | |
/s/ Christopher McKown Christopher McKown | | Chief Financial Officer and Treasurer
(principal financial officer and
principal accounting officer) | | December 14, 2022 |
| | |
/s/ Deborah A. Gero Deborah A. Gero | | Director | | December 14, 2022 |
| | | | |
/s/ Allison Keller Allison Keller | | Director | | December 14, 2022 |
| | | | |
/s/ Steve Mosko Steve Mosko | | Director | | December 14, 2022 |