Q 1 Sports Results {In Billions} ESPN Domestic Revenues • Operating income increased vs. the prior year driven largely by a ESPN Domestic $4.0 $4.1 decrease in programming and production costs from the timing of ESPN International College Football Playoff games Star • Domestic affiliate revenue in Ql was comparable to the prior year, as an increase of 6% from higher contractual rates was offset by a commensurate decrease from fewer subscribers $0.4 $0.2 Q1'23 Q1'24 ESPN International • Lower results were driven by higher programming and production costs Operating Income (Loss){1) attributable to new soccer rights ESPN Domestic $0.3 ESPN International $0.0 ~tar Star Operating loss increased vs. the prior year as the airing of ICC Cricket ($0.0) ($0.1) ($0.1) World Cup in the current quarter compared to the ICC T20 World Cup in the prior-year quarter resulted in higher programming and production ($0.3) Q1'23 Q1'24 costs, partially offset by higher advertising revenue (1) Sports operating income also includes Equity in the Income of Investees of $3 million in Q1'23 and $13 million in Q1'24

Q 1 Experiences Results {In Billions) Revenues Domestic Parks & Experiences Domestic Parks & $6.1 Experiences lnt'I Parks & Experiences Consumer Products Q1'23 Operating Income • Operating income increased vs. the prior year driven by Shanghai Disney Domestic Parks & $2.1 $2.1 Resort and Hong Kong Disneyland Experiences • Shanghai Disney Resort growth was driven by higher volumes (open for lnt'I Parks & the full quarter vs. 58 days in Q1'23) and guest spending Experiences $0.7 $0.7 • Hong Kong Disneyland Resort performance was due to higher guest Consumer Products spending and volumes (benefited from the park being open for more $0.1 days in the current quarter), partially offset by higher costs driven by inflation and new guest offerings Q1'23 Q1'24 • A modest decrease in operating income vs. the prior year reflected lower $6.3 results at our domestic parks and resorts, largely offset by higher results at Disney Cruise Line • Tough comparisons at Walt Disney World coming off its 50th anniversary celebration in the prior year and significant cost pressures driven by wage increases $1.5 $1.4 • Growth at Disney Cruise Line was due to increases in average ticket prices and passenger cruise days, partially offset by higher costs Q1'24 International Parks & Experiences First Fiscal Quarter Ended December 30, 2023 I 18

APPENDIX First Fiscal Quarter Ended December 30, 2023 I 19
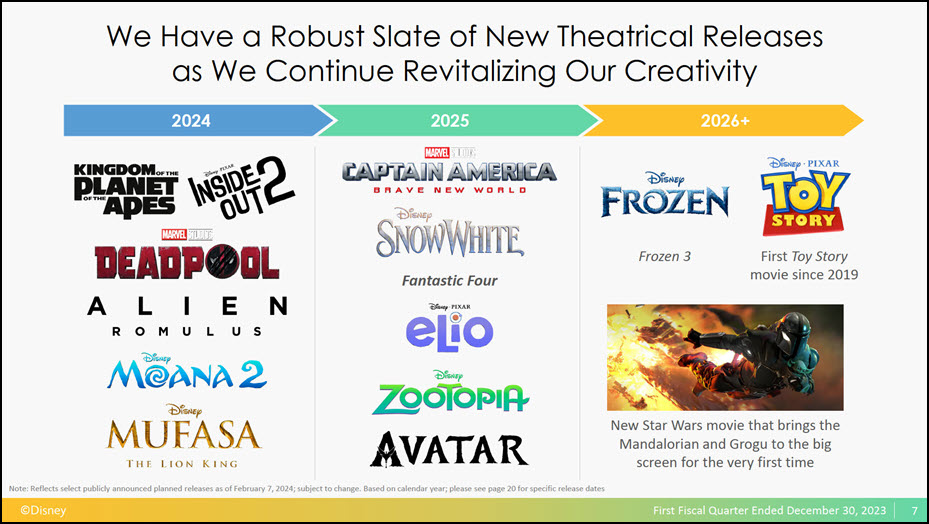
Select Upcoming Theatrical Releases (Reflects publicly announced planned releases as of February 7, 2024: list is not exhaustive: subject to change) Date Title April 5, 2024 The First Omen 20th Century May 10, 2024 Kingdom of the Planet ofthe Apes 20th Century May 31, 2024 Young Woman and the Sea Disney June 14, 2024 Inside Out 2 Pixar July 26, 2024 Untitled Oeadpool Movie Marvel August 16, 2024 Alien: Romulus 20th Century November 8, 2024 The Amateur 20th Century November 27, 2024 Moana 2 {Animated Sequel) Disney December 20, 2024 Mufasa: The Lion King Disney February 14, 2025 Captain America: Brave New World Marvel March 21, 2025 Snow White Disney May 2, 2025 Fantastic Four Marvel June 13, 2025 Elio Pixar June 27, 2025 Moana (Live Action) Disney July 25, 2025 Thunderbolts Marvel November 7, 2025 Blade Marvel November 26, 2025 Zootopia 2 Disney December 19, 2025 Avatar 3 20th Century
Select Upcoming Theatrical Releases (Reflects publicly announced planned releases as of February 7, 2024: list is not exhaustive: subject to change) Date Title April 5, 2024 The First Omen 20th Century May 10, 2024 Kingdom of the Planet ofthe Apes 20th Century May 31, 2024 Young Woman and the Sea Disney June 14, 2024 Inside Out 2 Pixar July 26, 2024 Untitled Oeadpool Movie Marvel August 16, 2024 Alien: Romulus 20th Century November 8, 2024 The Amateur 20th Century November 27, 2024 Moana 2 {Animated Sequel) Disney December 20, 2024 Mufasa: The Lion King Disney February 14, 2025 Captain America: Brave New World Marvel March 21, 2025 Snow White Disney May 2, 2025 Fantastic Four Marvel June 13, 2025 Elio Pixar June 27, 2025 Moana (Live Action) Disney July 25, 2025 Thunderbolts Marvel November 7, 2025 Blade Marvel November 26, 2025 Zootopia 2 Disney December 19, 2025 Avatar 3 20th Century
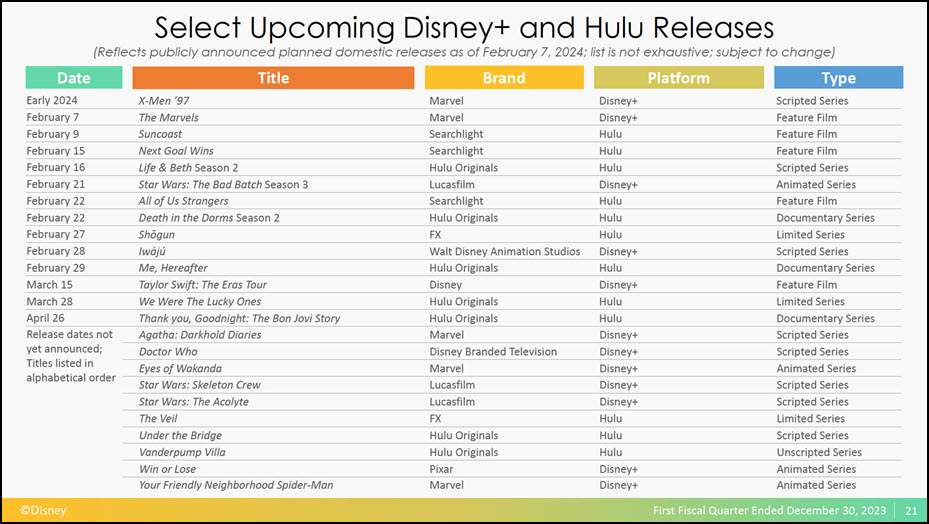
Select Upcoming Disney+ and Hulu Releases (Reflects publicly announced planned domestic releases as of February 7, 2024; list is not exhaustive; subject to change} Date Title Platform Type Early 2024 X-Men '97 Marvel Disney+ Scripted Series February 7 The Marvels Marvel Disney+ Feature Film February 9 Suncoast Searchlight Hulu Feature Film February 15 Next Goal Wins Searchlight Hulu Feature Film February 16 Life & Beth Season 2 Hulu Originals Hulu Scripted Series February 21 Star Wars: The Bad Batch Season 3 Lucasfilm Disney+ Animated Series February 22 All of Us Strangers Searchlight Hulu Feature Film February 22 Death in the Dorms Season 2 Hulu Originals Hulu Documentary Series February 27 Shogun FX Hulu Limited Series February 28 lwaju Walt Disney Animation Studios Disney+ Scripted Series February 29 Me, Hereafter Hulu Originals Hulu Documentary Series March 15 Taylor Swift: The Eras Tour Disney Disney+ Feature Film March 28 We Were The Lucky Ones Hulu Originals Hulu Limited Series April 26 Thank you, Goodnight: The Bon Jovi Story Hulu Originals Hulu Documentary Series Release dates not Agatha: Darkhold Diaries Marvel Disney+ Scripted Series yet announced; Doctor Who Disney Branded Television Disney+ Scripted Series Titles listed in alphabetical order Eyes of Wakonda Star Wars: Skeleton Crew Marvel Lucasfilm Disney+ Disney+ Animated Series Scripted Series Star Wars: The Acolyte Lucasfilm Disney+ Scripted Series The Veil FX Hulu Limited Series Under the Bridge Hulu Originals Hulu Scripted Series Vanderpump Villa Hulu Originals Hulu Unscripted Series Win or Lose Pixar Disney+ Animated Series Your Friendly Neighborhood Spider-Man Marvel Disney+ Animated Series
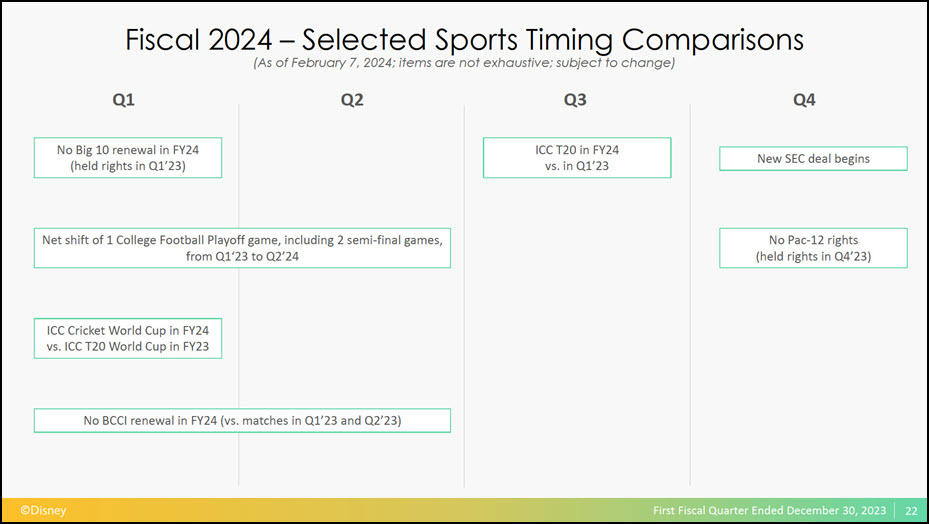
Fiscal 2024 -Selected Sports Timing Comparisons (As of February 7, 2024; items are not exhaustive; subject to change) Ql Q2 Q3 Q4 ICC T20 in FY24 No Big 10 renewal in FY24 New SEC deal begins (held rights in Q1'23) vs. in Q1'23 Net shift of 1 College Football Playoff game, including 2 semi-final games, No Pac-12 rights (held rights in Q4'23) from Q1'23 to Q2'24 ICC Cricket World Cup in FY24 vs. ICC T20 World Cup in FY23 No BCCI renewal in FY24 (vs. matches in Q1'23 and Q2'23) First Fiscal Quarter Ended December 30, 2023 I 22

Upcoming Parks and Experiences Openings & Events (Reflects publicly announced planned openings and events as of February 7, 2024; list is not exhaustive) Date Attraction / Event Location June 6, 2024 Fantasy Springs Tokyo Disney Resort June 2024 Disney Lookout Cay at Lighthouse Point Disney Cruise Line July 1, 2024 Disney Vacation Club Cabins at Fort Wilderness Resort Walt Disney World Resort December 21, 2024 Disney Treasure {Maiden Voyage) Disney Cruise Line Late 2024 Disney Vacation Club at Polynesian Resort Walt Disney World Resort 2024 Tiana's Bayou Adventure Disneyland Resort and Walt Disney World Resort 2024 New Star Tours Characters and Stories Disneyland Resort, Walt Disney World Resort, and Disneyland Paris 2024 EPCOT CommuniCore Hall and Plaza Walt Disney World Resort 2025 Storyliving by Disney -Cotino Welcomes First Residents Storyliving by Disney -Cotino Fiscal Year 2025 Disney Adventure (will operate in Southeast Asia) Disney Cruise Line Fiscal Year 2026 Third Wish-class ship Disney Cruise Line Note: Dates provided are based on calendar year unless otherwise specified
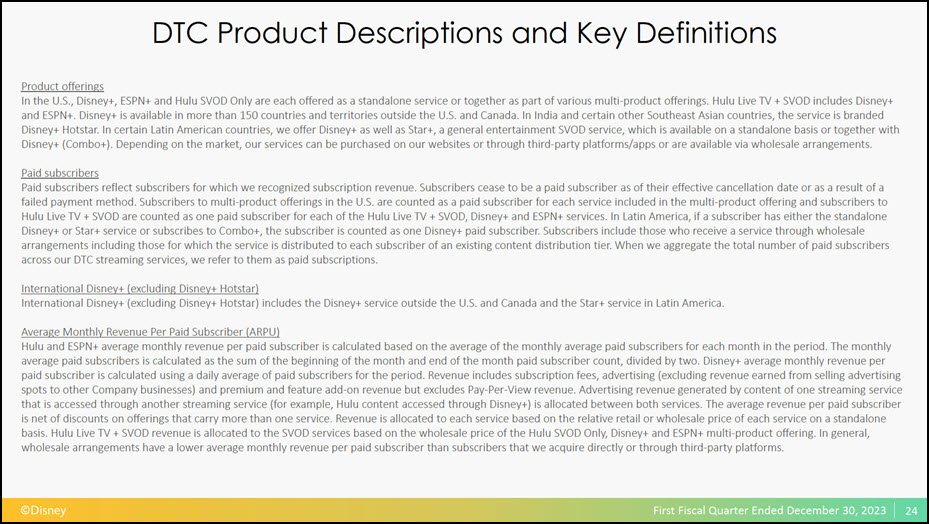
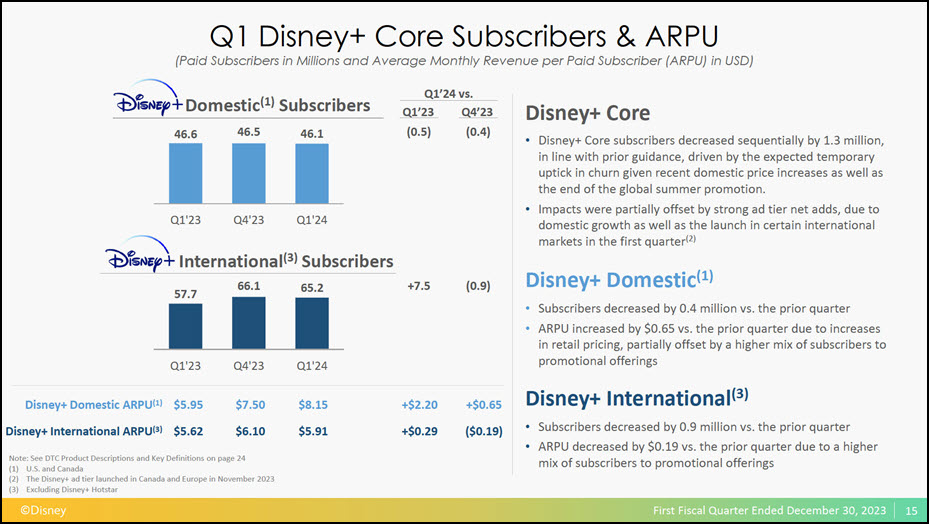
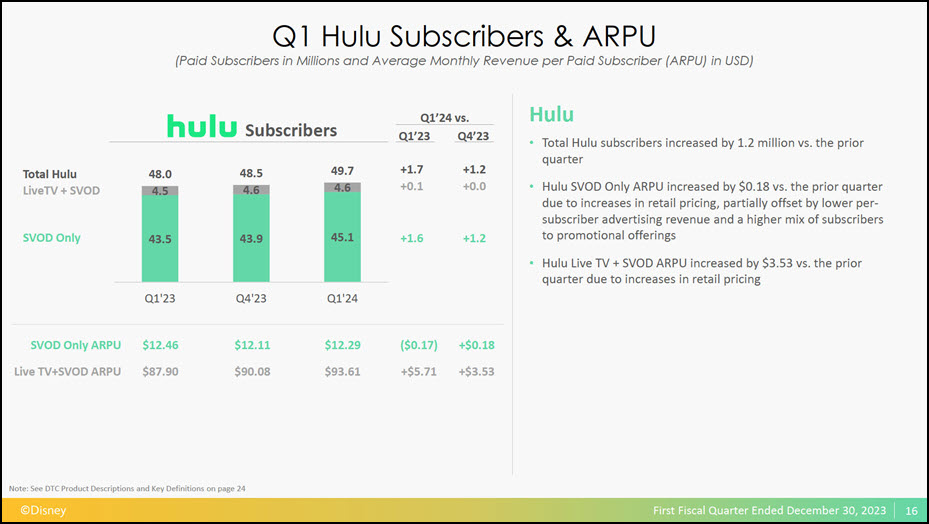
DTC Product Descriptions and Key Definitions Product offerings In the U.S., Disney+, ESPN+ and Hulu SVOD Only are each offered as a standalone service or together as part of various multi-product offerings. Hulu Live TV+ SVOD includes Disney+ and ESPN+. Disney+ is available in more than 150 countries and territories outside the U.S. and Canada. In India and certain other Southeast Asian countries, the service is branded Disney+ Hotstar. In certain Latin American countries, we offer Disney+ as well as Star+, a general entertainment SVOD service, which is available on a standalone basis or together with Disney+ (Combo+). Depending on the market, our services can be purchased on our websites or through third-party platforms/apps or are available via wholesale arrangements. Paid subscribers Paid subscribers reflect subscribers for which we recognized subscription revenue. Subscribers cease to be a paid subscriber as of their effective cancellation date or as a result of a failed payment method. Subscribers to multi-product offerings in the U.S. are counted as a paid subscriber for each service included in the multi-product offering and subscribers to Hulu Live TV+ SVOD are counted as one paid subscriber for each of the Hulu Live TV + SVOD, Disney+ and ESPN+ services. In Latin America, if a subscriber has either the standalone Disney+ or Star+ service or subscribes to Combo+, the subscriber is counted as one Disney+ paid subscriber. Subscribers include those who receive a service through wholesale arrangements including those for which the service is distributed to each subscriber of an existing content distribution tier. When we aggregate the total number of paid subscribers across our OTC streaming services, we refer to them as paid subscriptions. International Disney+ {excluding Disney+ Hotstar) International Disney+ (excluding Disney+ Hotstar) includes the Disney+ service outside the U.S. and Canada and the Star+ service in Latin America. Average Monthly Revenue Per Paid Subscriber {ARPU) Hulu and ESPN+ average monthly revenue per paid subscriber is calculated based on the average of the monthly average paid subscribers for each month in the period. The monthly average paid subscribers is calculated as the sum of the beginning of the month and end of the month paid subscriber count, divided by two. Disney+ average monthly revenue per paid subscriber is calculated using a daily average of paid subscribers for the period. Revenue includes subscription fees, advertising (excluding revenue earned from selling advertising spots to other Company businesses) and premium and feature add-on revenue but excludes Pay-Per-View revenue. Advertising revenue generated by content of one streaming service that is accessed through another streaming service (for example, Hulu content accessed through Disney+) is allocated between both services. The average revenue per paid subscriber is net of discounts on offerings that carry more than one service. Revenue is allocated to each service based on the relative retail or wholesale price of each service on a standalone basis. Hulu Live TV+ SVOD revenue is allocated to the SVOD services based on the wholesale price of the Hulu SVOD Only, Disney+ and ESPN+ multi-product offering. In general, wholesale arrangements have a lower average monthly revenue per paid subscriber than subscribers that we acquire directly or through third-party platforms. First Fiscal Quarter Ended December 30, 2023 I 24
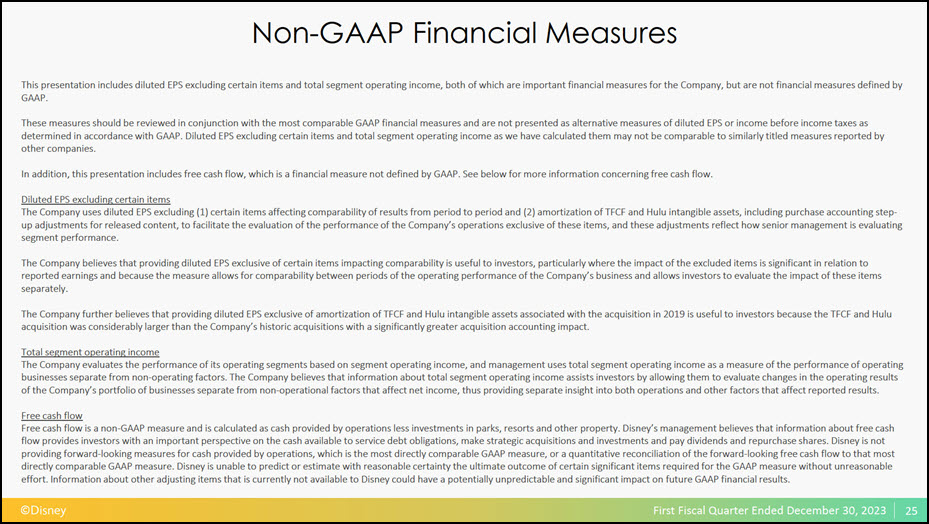
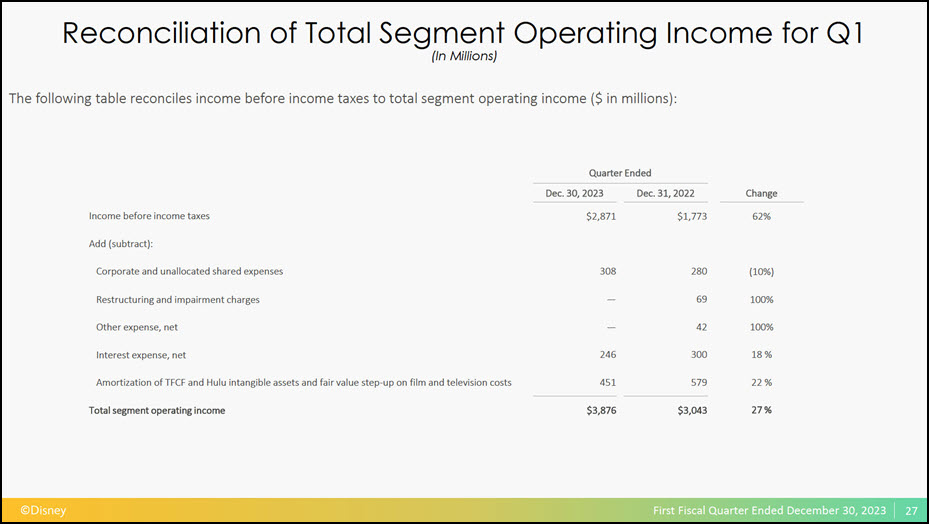
Non-GAAP Financial Measures This presentation includes diluted EPS excluding certain items and total segment operating income, both of which are important financial measures for the Company, but are not financial measures defined by GAAP. These measures should be reviewed in conjunction with the most comparable GAAP financial measures and are not presented as alternative measures of diluted EPS or income before income taxes as determined in accordance with GAAP. Diluted EPS excluding certain items and total segment operating income as we have calculated them may not be comparable to similarly titled measures reported by other companies. In addition, this presentation includes free cash flow, which is a financial measure not defined by GAAP. See below for more information concerning free cash flow. Diluted EPS excluding certain items The Company uses diluted EPS excluding {1) certain items affecting comparability of results from period to period and {2) amortization ofTFCF and Hulu intangible assets, including purchase accounting stepup adjustments for released content, to facilitate the evaluation of the performance of the Company's operations exclusive of these items, and these adjustments reflect how senior management is evaluating segment performance. The Company believes that providing diluted EPS exclusive of certain items impacting comparability is useful to investors, particularly where the impact of the excluded items is significant in relation to reported earnings and because the measure allows for comparability between periods of the operating performance of the Company's business and allows investors to evaluate the impact of these items separately. The Company further believes t hat providing diluted EPS exclusive of amortization of TFCF and Hulu intangible assets associated with the acquisition in 2019 is useful to investors because the TFCF and Hulu acquisition was considerably larger than the Company's historic acquisitions with a significantly greater acquisition accounting impact. Total segment operating income The Company evaluates the performance of its operating segments based on segment operating income, and management uses total segment operating income as a measure of the performance of operating businesses separate from non-operating factors. The Company believes that information about total segment operating income assists investors by allowing them to evaluate changes in the operating results of the Company's portfolio of businesses separate from non-operational factors that affect net income, thus providing separate insight into both operations and other factors that affect reported resu Its. Free cash flow Free cash flow is a non-GAAP measure and is calculated as cash provided by operations less investments in parks, resorts and other property. Disney's management believes t hat information about free cash flow provides investors with an important perspective on the cash available to service debt obligations, make strategic acquisitions and investments and pay dividends and repurchase shares. Disney is not providing forward-looking measures for cash provided by operations, which is the most directly comparable GAAP measure, or a quantitative reconciliation of the forward-looking free cash flow to that most directly comparable GAAP measure. Disney is unable to predict or estimate with reasonable certainty the ultimate outcome of certain significant items required for the GAAP measure without unreasonable effort. Information about other adjusting items that is currently not available to Disney could have a potentially unpredictable and significant impact on future GAAP financial results
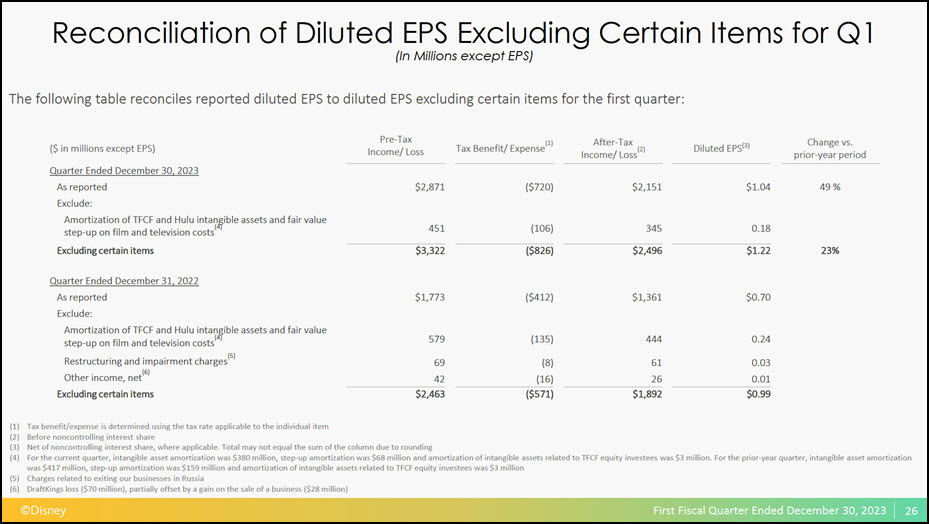
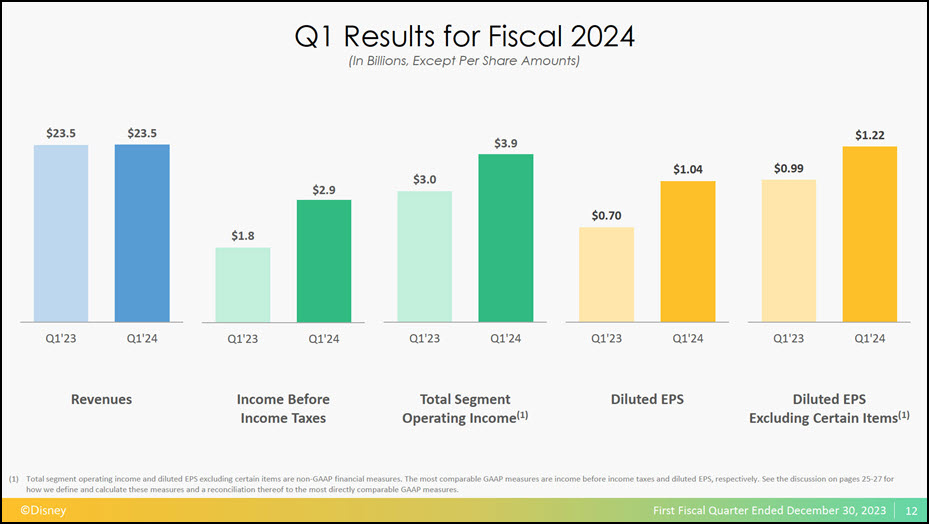
Reconciliation of Diluted EPS Excluding Certain Items for Q 1 {In Millions except EPS) The following table reconciles reported diluted EPS to diluted EPS excluding certain items for the first quarter: ($ in millions except EPS) Pre-Tax Income/ Loss (1) Tax Benefit/ Expense After-Tax (2) Income/ Loss Diluted EPs(3l Change vs. prior-year period Quarter Ended December 30, 2023 As reported $2,871 ($720) $2,151 $1.04 49% Exclude: Amortization of TFCF and Hulu intan41ible assets and fair value step-up on film and television costs( 451 (106) 345 0.18 Excluding certain items $3,322 ($826) $2,496 $1.22 23% Quarter Ended December 31, 2022 As reported $1,773 ($412) $1,361 $0.70 Exclude: Amortization of TFCF and Hulu intan~ible assets and fair value step-up on film and television costs'4 579 (135) 444 0.24 (5) Restructuring and impairment charges 69 (8) 61 0.03 0 h . (Glt er income, net 42 (16) 26 0.01 Excluding certain items $2,463 ($571) $1,892 $0.99 (1) Tax benefit/expense is determined using the tax rate applicable to the individual item (2) Before noncontrolling interest share (3) Net of noncontrolling interest share, where applicable. Total may not equal the sum ofthe column due to rounding (4) For the current quarter, intangible asset amortization was $380 million, step-up amortization was $68 million and amortization of intangible assets related to TFCF equity investees was $3 million. For the prior-year quarter, intangible asset amortization was $417 million, step-up amortization was $159 million and amortization of intangible assets related to TFCF equity investees was $3 million (5) Charges related to exiting our businesses in Russia (6) DraftKings loss ($70 million), partially offset by a gain on the sale of a business ($28 million)