Exhibit 99.2

A Global Disease, A Pioneering Treatment BALANCED Study Readout Akero Therapeutics, Inc. June 30, 2020

- CONFIDENTIAL - SAFE HARBOR This presentation has been prepared by Akero Therapeutics, Inc. (“we,” “us,” “our,” “Akero” or the “Company”) and is made for in formational purposes only and does not constitute an offer to sell or a solicitation of an offer to buy securities, nor shall there be any sale of any securities in an y state or jurisdiction in which such offer, solicitation or sale would be unlawful prior to registration or qualification under the securities laws of any such state or jurisdiction. Th e i nformation set forth herein does not purport to be complete or to contain all of the information you may desire. Statements contained herein are made as of the date of this pre sen tation unless stated otherwise, and neither this presentation, nor any sale of securities, shall under any circumstances create an implication that the information contained her ein is correct as of any time after such date or that information will be updated or revised to reflect information that subsequently becomes available or changes occurring a fte r the date hereof. This presentation may contain “forward - looking statements” within the meaning of the Private Securities Litigation Reform Act of 1995 relating to our business, operations, and financial conditions, including but not limited to current beliefs, expectations and assumptions regarding: the future of our bu siness; future plans and strategies, including our expectations around the therapeutic potential and clinical benefits of Efruxifermin; our development plans for Efruxifermin, inc luding our belief in the unique potential of Efruxifermin as a foundational NASH therapy; our preclinical and clinical results, including our top - line safety/tolerability, l aboratory measures and paired biopsy data from our Phase 2a BALANCED study; risks related to the competitive landscape; and the potential impact of COVID - 19 on strategy, our emplo yees, supply chain, future operations and clinical trials. Words such as, but not limited to, “look forward to,” “believe,” “expect,” “anticipate,” “estimate,” “intend ,” “plan,” “would,” “should” and “could,” and similar expressions or words, identify forward - looking statements. New risks and uncertainties may emerge from time to time, and it is n ot possible to predict all risks and uncertainties. Except as required by applicable law, we do not plan to publicly update or revise any forward - looking statements contained herein, whether as a result of any new information, future events, changed circumstances or otherwise. Although we believe the expectations reflected in such fo rwa rd - looking statements are reasonable, we can give no assurance that such expectations will prove to be correct. Accordingly, readers are cautioned not to place undue rel iance on these forward - looking statements. No representations or warranties (expressed or implied) are made about the accuracy of any such forward - looking statements. Certain information contained in this presentation relates to or is based on studies, publications, surveys and other data ob tai ned from third - party sources and the Company’s own internal estimates and research. While the Company believes these third - party sources to be reliable as of the date of this presentation, it has not independently verified, and makes no representation as to the adequacy, fairness, accuracy or completeness of, any information obtained from third - party sources. In addition, all of the market data included in this presentation involves a number of assumptions and limitations, and there can be no guarantee as to the accur acy or reliability of such assumptions. Finally, while we believe our own internal research is reliable, such research has not been verified by any independent source. 2

- CONFIDENTIAL - 3 INTRODUCING EFRUXIFERMIN Efruxifermin (EFX) ē - FRUX - i - FER - min (Formerly AKR - 001)

- CONFIDENTIAL - Histological Improvements Safety & Tolerability SUBSTANTIAL HISTOLOGIC IMPROVEMENTS AFTER ONLY 16 WEEKS 4 • Response rates for all EFX treated subjects who achieved at least a 30% liver fat reduction and had end - of - treatment biopsies (N=40): • 48% NASH resolution without worsening of fibrosis • 48% fibrosis improvement ≥1 stage without worsening of NAS • 28% fibrosis improvement ≥2 stage • 28% for combination of fibrosis improvement ≥1 stage and NASH resolution • EFX was generally well tolerated (N=79) with no discontinuations due to treatment - emergent adverse events (TEAEs) in 50mg dose group • Most frequent TEAEs were transient mild/moderate gastrointestinal events • No treatment - or dose - related effects on blood pressure, heart rate, or bone mineral density • Significant improvements in HbA1c, HOMA - IR, C - Peptide, and Adiponectin Improved Glycemic Control Weight Loss Improved Dyslipidemia • Reductions seen across all groups • Significant improvements in triglycerides, HDL, and non - HDL cholesterol across all dose groups

- CONFIDENTIAL - 5 BALANCED STUDY TRIAL DESIGN MRI - PDFF Liver Biopsy Screening Randomization EFX 70mg (n=20) QW SC Injection EFX 50mg (n=20) QW SC Injection EFX 28mg (n=20) QW SC Injection Placebo (n=20) QW SC Injection Safety Follow - Up Liver Biopsies for Responders Week 6 Week 12 Screening Post - Treatment PRIMARY ENDPOINT Absolute change from baseline in hepatic fat fraction (MRI - PDFF) at Week 12 PAIRED BIOPSIES Subjects achieving ≥30% relative reduction of hepatic fat at week 12 are eligible for post - treatment biopsy KEY INCLUSION CRITERIA • F1 - F3 NASH • NAS ≥4 • Liver fat ≥10% KEY SECONDARY EFFICACY ENDPOINTS • Relative Liver Fat • Response Rate • ALT KEY EXPLORATORY EFFICACY ENDPOINTS • 2 - Point NAS Improvement • Fibrosis Improvement • NASH Resolution • Serum Pro - C3 16 WEEKS
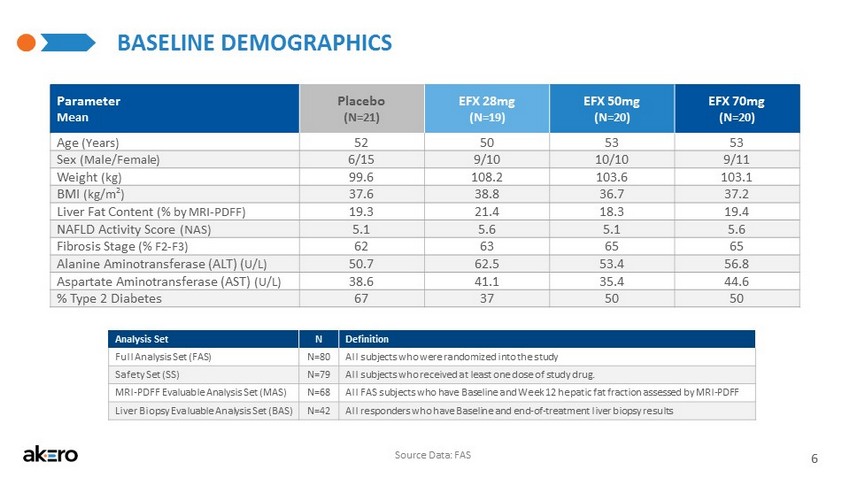
- CONFIDENTIAL - BASELINE DEMOGRAPHICS Parameter Mean Placebo (N=21) EFX 28mg (N=19) EFX 50mg (N=20) EFX 70mg (N=20) Age (Years) 52 50 53 53 Sex (Male/Female) 6/15 9/10 10/10 9/11 Weight (kg) 99.6 108.2 103.6 103.1 BMI (kg/m 2 ) 37.6 38.8 36.7 37.2 Liver Fat Content (% by MRI - PDFF) 19.3 21.4 18.3 19.4 NAFLD Activity Score (NAS) 5.1 5.6 5.1 5.6 Fibrosis Stage (% F2 - F3) 62 63 65 65 Alanine Aminotransferase (ALT) ( U/L) 50.7 62.5 53.4 56.8 Aspartate Aminotransferase (AST) (U/L) 38.6 41.1 35.4 44.6 % Type 2 Diabetes 67 37 50 50 6 Analysis Set N Definition Full Analysis Set (FAS) N=80 All subjects who were randomized into the study Safety Set (SS) N=79 All subjects who received at least one dose of study drug. MRI - PDFF Evaluable Analysis Set (MAS) N=68 All FAS subjects who have Baseline and Week 12 hepatic fat fraction assessed by MRI - PDFF Liver Biopsy Evaluable Analysis Set (BAS) N=42 All responders who have Baseline and end - of - treatment liver biopsy results Source Data: FAS

- CONFIDENTIAL - Response Rate 2 Proportion of subjects who had a Week 12 MRI - PDFF showing ≥30% relative reduction SUBSTANTIAL REDUCTIONS IN LIVER FAT AT WEEK 12 ACROSS ALL DOSE GROUPS 7 Placebo 28mg 50mg 70mg Mean Absolute Reduction in Liver Fat 1 Placebo 10% 28mg 100% 50mg 100% 70mg 100% *** p<0.001, versus placebo - 63% - 71% - 72% - 0% 1 Source Data: FAS; 2 Source Data: MAS - 12.3 *** - 13.4 *** - 14.1 *** Baseline 22.2% Liver Fat Week 12 2.0% Liver Fat Analyzed with Liver MultiScan MRI - PDFF Images for Subject 207 - 012 (50mg EFX)

- CONFIDENTIAL - -60% -50% -40% -30% -20% -10% 0% 10% BL W1 W4 W8 W12 W16 W20 Placebo 28mg 50mg 70mg ALT Mean Change from Baseline (%) REDUCTION IN HEPATOCYTE STRESS AND COLLAGEN SYNTHESIS ACROSS ALL DOSE GROUPS 8 * p<0.05, ** p<0.01, *** p<0.001, versus placebo (statistical significance tested only at Weeks 12, 16 and 20) Source Data: FAS; ANCOVA LS Mean *** *** ** Serum Pro - C3 Mean Change from Baseline to Week 16 Placebo +4% 28mg - 34% *** 50mg - 27% ** 70mg - 32% *** ** p<0.01 *** p<0.001, versus placebo *** *** *** Similar dose - related improvements observed for AST, GGT, ALP *** ** *

- CONFIDENTIAL - Mean NAS Reduction Change in NAS from Baseline after 16 weeks of dosing 0% 20% 40% 60% 80% 100% Overall 0% 20% 40% 60% 80% 100% Overall NAS Reduction ≥2 Points with no Worsening of Fibrosis 1,2 Placebo N=2 50% 1 * All EFX N=40 78% 31 28 mg N=13 77% 10 5 0mg N=13 77% 10 70mg N=14 79% 11 1 Endpoint recommended by FDA for Phase 2 clinical trials in NASH (F1 - F3) 2 Secondary and exploratory histological endpoints were not powered for statistical significance * A single placebo responder lost 25 pounds over 16 weeks (11% weight reduction) 9 CONSISTENT IMPROVEMENT IN STEATOHEPATITIS Placebo - 2.5 28mg - 2.9 50mg - 3.1 70mg - 3.6 The placebo arm was enriched for NAS endpoints because only 10% of placebo patients met the MRI - PDFF responder definition and had an end - of - treatment biopsy Source Data: BAS

- CONFIDENTIAL - HIGH RESPONSE RATES ON NASH RESOLUTION AFTER 16 WEEKS ACROSS ALL DOSES 10 Source Data: BAS 1 NAS score of 0 or 1 for lobular inflammation and a score of 0 for ballooning 2 Secondary and exploratory histological endpoints were not powered for statistical significance * A single placebo responder lost 25 pounds over 16 weeks (11% weight reduction) 0% 10% 20% 30% 40% 50% 60% 70% Overall 0% 10% 20% 30% 40% 50% 60% 70% Overall NASH Resolution 1,2 with No Worsening of Fibrosis Placebo N=2 50% 1 * All EFX N=40 48% 19 28 mg N=13 46% 6 5 0mg N=13 54% 7 70mg N=14 43% 6 Biopsy Reading • All baseline and end - of - treatment biopsies were centrally read by a single NASH - CRN pathologist • Baseline biopsies were not re - read with end - of - treatment biopsies • All biopsies were read blinded to both treatment assignment and patient

- CONFIDENTIAL - HIGH RATES OF FIBROSIS IMPROVEMENT AFTER 16 WEEKS ACROSS ALL TREATED PATIENTS 11 Source Data: BAS 0% 10% 20% 30% 40% 50% 60% 70% Overall 0% 10% 20% 30% 40% 50% 60% 70% Overall Fibrosis Improvement ≥1 Stage with No Worsening of NAS 1,2 1 Improvement in liver fibrosis greater than or equal to one stage and no worsening of NASH (defined as no increase in NAS for ballooning, inflammation, or steatosis) 2 Secondary and exploratory histological endpoints were not powered for statistical significance Placebo N=2 0% All EFX N=40 48% 19 28 mg N=13 46% 6 50 mg N=13 62% 8 70mg N=14 36% 5 ≥2 - Stage Improvement in Fibrosis 11 of 40 EFX patients (28%) had a ≥2 - stage improvement

- CONFIDENTIAL - 0% 10% 20% 30% 40% 50% 60% 70% Overall 0% 10% 20% 30% 40% 50% 60% 70% Overall ENCOURAGING RESPONSE RATES FOR BOTH FIBROSIS IMPROVEMENT AND NASH RESOLUTION AFTER 16 WEEKS 12 1 Subjects who achieve a NAS score of 0 or 1 for lobular inflammation and a score of 0 for ballooning AND Improvement in liver fibrosis greater than or equal to one stage 2 Secondary and exploratory histological endpoints were not powered for statistical significance Both Fibrosis Improvement ≥1 Stage and NASH Resolution 1,2 Placebo N=2 0% All EFX N=40 28% 11 28 mg N=13 31% 4 50 mg N=13 39 % 5 70mg N=14 14 % 2 Source Data: BAS
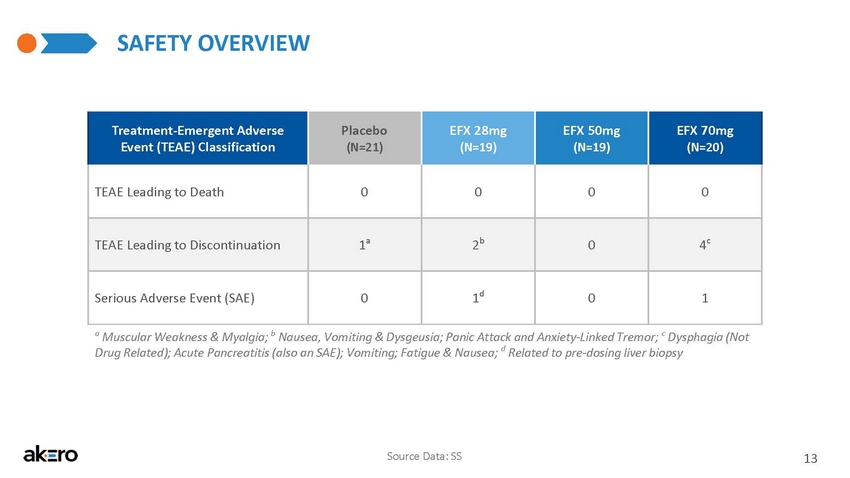
- CONFIDENTIAL - SAFETY OVERVIEW Source Data: SS 13 Treatment - Emergent Adverse Event (TEAE) Classification Placebo (N=21) EFX 28mg (N=19) EFX 50mg (N=19) EFX 70mg (N=20) TEAE Leading to Death 0 0 0 0 TEAE Leading to Discontinuation 1 a 2 b 0 4 c Serious Adverse Event (SAE) 0 1 d 0 1 a Muscular Weakness & Myalgia; b Nausea, Vomiting & Dysgeusia; Panic Attack, Anxiety & Tremor; c Dysphagia (Not Drug Related); Acute Pancreatitis (also an SAE); Vomiting; Fatigue & Nausea; d Related to pre - dosing liver biopsy

- CONFIDENTIAL - DRUG - RELATED TREATMENT - EMERGENT ADVERSE EVENTS (TEAE s) Most Common (>10%) Drug - Related AEs * Placebo (N=21) All EFX (N=58) EFX 28mg (N=19) EFX 50mg (N=19) EFX 70mg (N=20) Diarrhea 1 2 (10%) 21 (36%) 5 (26%) 10 (53%) 6 (30%) Nausea 0 (0%) 19 (33%) 6 (32%) 4 (21%) 9 (45%) Increased appetite 1 (5%) 13 (22%) 4 (21%) 4 (21%) 5 (25%) Vomiting 0 (0%) 9 (16%) 5 (26%) 2 (11%) 2 (10%) Frequent bowel movements 0 (0%) 8 (14%) 3 (16%) 2 (11%) 3 (15%) Abdominal pain 0 (0%) 7 (12%) 1 (5%) 3 (16%) 3 (15%) Injection site erythema 0 (0%) 7 (12%) 2 (11%) 0 (0%) 5 (25%) Injection site reaction 0 (0%) 6 (10%) 2 (11%) 1 (5%) 3 (15%) Fatigue 2 (10%) 6 (10%) 0 (0%) 1 (5%) 5 (25%) 14 *Across EFX dose groups 1 No study discontinuations due to diarrhea (see prior slide for all discontinuations) Other Safety Parameters Observed No treatment - related effects on: • Heart Rate • Systolic Blood Pressure • Diastolic Blood Pressure • Bone mineral density Source Data: SS

- CONFIDENTIAL - -50 -25 0 25 50 W16 CLINICALLY MEANINGFUL IMPROVEMENTS IN GLYCEMIC CONTROL AFTER 16 WEEKS Source Data: FAS; ANCOVA LS Mean 15 -20 0 20 40 60 80 100 120 W16 Adiponectin Placebo 28mg 50mg 70mg *** *** *** -40 -30 -20 -10 0 10 20 30 W16 C - Peptide Placebo 28mg 50mg 70mg ** ** ** -0.5 -0.4 -0.3 -0.2 -0.1 0.0 0.1 0.2 W16 HbA1c Placebo 28mg 50mg 70mg * ** HOMA - IR Placebo 28mg 50mg 70mg * * p<0.05, ** p<0.01, versus placebo * p<0.05, versus placebo ** p<0.01, versus placebo *** p<0.001, versus placebo Mean Change From Baseline to Week 16 (%) 1 1 HbA1c is presented in absolute percent change from baseline, whereas HOMA - IR, C - Peptide, and Adiponectin are presented in relative percent change from baseline - 0.1 - 0.4 - 0.5 - 17% - 26% - 49% - 24% - 26% - 33% +69% +88% +120% +0.1 +23% - 4% 1 ≈ +147%

- CONFIDENTIAL - -4 -3 -2 -1 0 W16 70mg * -4.0 -3.0 -2.0 -1.0 0.0 BL W1 W4 W8 W12 W16 Placebo 28mg 50mg 70mg Mean Change in Body Weight (kg) 16 WEIGHT LOSSES OBSERVED FOR ALL DOSE GROUPS: FIRST REPORT OF SIGNIFICANT WEIGHT LOSS FOR FGF21 CLASS * * Mean Change in Body Weight at Week 16 (kg) * p<0.05, versus placebo (statistical significance tested only at Weeks 12 and 16) Source Data: FAS; ANCOVA LS Mean * p<0.05, versus placebo Placebo 28mg 50mg - 0.3 - 2.3 - 3.7 + 0.1

- CONFIDENTIAL - IMPROVED LIPOPROTEIN PROFILE FOR CARDIOVASCULAR HEALTH Source Data: FAS; ANCOVA LS Mean 17 -15 -11 -7 -3 1 5 W16 LDL Cholesterol + 1% Placebo 28mg 50mg 70mg * -50 -40 -30 -20 -10 0 10 20 W16 - 37% - 45% - 43% + 8% Placebo 28mg 50mg 70mg *** *** *** Triglycerides 0 10 20 30 40 W16 HDL Cholesterol + 32% + 40% + 40% 0% Placebo 28mg 50mg 70mg *** *** *** -22 -17 -12 -7 -2 W16 Non - HDL Cholesterol - 20% - 13% - 15% 0% Placebo 28mg 50mg 70mg *** * ** *** p<0.001, versus placebo *** p<0.001, versus placebo * p<0.05, ** p<0.01, *** p<0.001, versus placebo * p<0.05, versus placebo Mean Change From Baseline to Week 16 (%) - 14% 0% - 3%

- CONFIDENTIAL - DEVELOPMENT LANDSCAPE: NASH RESOLUTION 18 Proportion of Subjects with Resolution of NASH without Worsening of Fibrosis 1 1 FDA Guidance for Industry: Noncirrhotic Nonalcoholic Steatohepatitis With Liver Fibrosis: Developing Drugs for Treatment (201 8) Note: These data are derived from different clinical trials at different points in time, with differences in trial design and patient populations. No head - to - head clinical trials have been conducted. Inventiva (2020) June 16 Corporate Presentation; NGM Bio (2020) June 3 Corporate Presentation; Harrison, S et al. (2019) Lancet 394(10213):2012 - 24; CymaBay (2020) March 12 Press Release; Novo Nordisk (2020) June 19 R&D Investor Presentation; Younossi Z et al. (2019) Lancet 394(10215):2184 - 96. All trademarks are the property of their respective owners. Pbo 20mg 50mg Increasing dosing duration Pbo 0.8g 1.2g Pbo 10mg 25mg Pbo 0.2mg 0.4mg Pbo All Pbo 1mg All EFX 50mg Intercept Ocaliva 78 Wks (Ph3) Daily Oral NGM Bio Aldafermin 24 Wks (Ph2a) Daily Injection (N=22) (N=50) Madrigal Resmetirom 36 Wks (Ph2a) Daily Oral (N=34) (N=79) (N=311) (N=308) Novo Nordisk Semaglutide 72 Wks (Ph2b) Daily Injection Cymabay Seladelpar 52 Wks (Ph2a) Daily Oral (N=25) (N=46) Inventiva Lanifibranor 24 Wks (Ph2b) Daily Oral (N=62) (N=69) Akero Efruxifermin 16 Wks (Ph2a) Weekly Injection (N=13) (N=80) (N=82) 9 % 24 % 25 % 15 % 8 % 26 % 23 % 49 % 48% 23 % 67 % 8 % 12 % 54 % (N=312) (N=78) (N=42) 19% 11% (N=40) (N=63) 40 % 47% 24 Wks 78 Wks

- CONFIDENTIAL - DEVELOPMENT LANDSCAPE: FIBROSIS IMPROVEMENT 19 Proportion of Subjects with ≥1 Stage Improvement in Fibrosis without Worsening of NAS 1 1 FDA Guidance for Industry: Noncirrhotic Nonalcoholic Steatohepatitis With Liver Fibrosis: Developing Drugs for Treatment (201 8) All EFX 50mg Pbo All Pbo 1mg Pbo 0.8g 1.2g Pbo 10mg 25mg Pbo 0.2mg 0.4mg Pbo 20mg 50mg Intercept Ocaliva 78 Wks (Ph3) Daily Oral NGM Bio Aldafermin 24 Wks (Ph2a) Daily Injection (N=22) (N=50) Madrigal Resmetirom 36 Wks (Ph2a) Daily Oral (N=34) (N=79) (N=311) (N=308) Novo Nordisk Semaglutide 72 Wks (Ph2b) Daily Injection Cymabay Seladelpar 52 Wks (Ph2a) Daily Oral (N=25) (N=46) Inventiva Lanifibranor 24 Wks (Ph2b) Daily Oral (N=62) (N=69) Akero Efruxifermin 16 Wks (Ph2a) Weekly Injection (N=13) (N=80) (N=82) (N=312) (N=78) (N=42) (N=40) (N=63) 18 % 38 % 29 % 24 % 12 % 18 % 23 % 34 % 36% 48 % 20 % 24% 37 % 32% 46 % 29% 62% 48% Increasing dosing duration Note: These data are derived from different clinical trials at different points in time, with differences in trial design and patient populations. No head - to - head clinical trials have been conducted. Inventiva (2020) June 16 Corporate Presentation; NGM Bio (2020) June 3 Corporate Presentation; Harrison, S et al. (2019) Lancet 394(10213):2012 - 24; CymaBay (2020) March 12 Press Release; Novo Nordisk (2020) June 19 R&D Investor Presentation; Younossi Z et al. (2019) Lancet 394(10215):2184 - 96. All trademarks are the property of their respective owners. 24 Wks 78 Wks
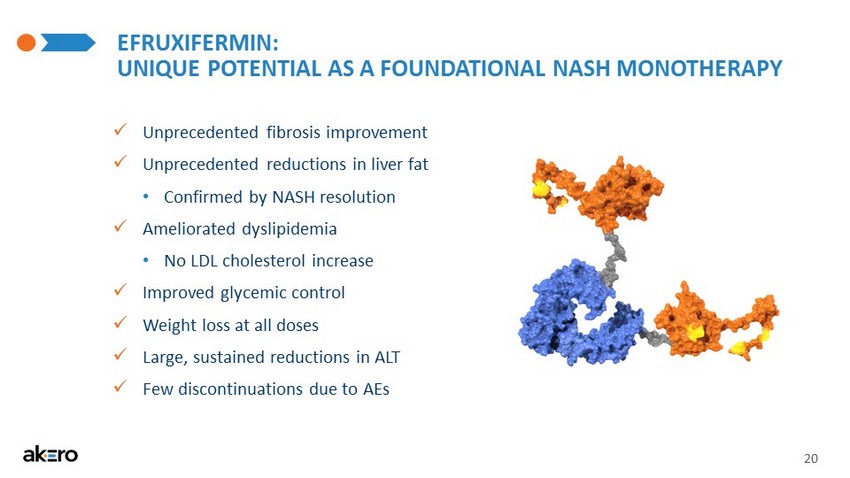
- CONFIDENTIAL - EFRUXIFERMIN: UNIQUE POTENTIAL AS A FOUNDATIONAL NASH MONOTHERAPY 20 x Unprecedented fibrosis improvement x Best - in - field reductions of liver fat • Confirmed by NASH resolution x Ameliorated dyslipidemia • No LDL cholesterol increase x Improved glycemic control x Weight loss at all doses x Large, sustained reductions in ALT x Few discontinuations due to AEs

A Global Disease, A Pioneering Treatment NASDAQ: AKRO