Filed by Sirius International Insurance Group, Ltd.
pursuant to Rule 425
under the Securities Act of 1933, as amended,
and deemed filed pursuant to Rule 14a-12
under the Securities Exchange Act of 1934, as amended
Filer: Sirius International Insurance Group, Ltd.
Subject Company: Easterly Acquisition Corp.
(SEC File No. 001-37522)

I NVESTOR P RESENTATION June 2018 Exhibit 99.2
2 DISCLAIMER IMPORTANT INFORMATION This presentation is for informational purposes only and has been prepared to assist interested parties in making their own e val uation with respect to the proposed business combination (the “Proposed Transaction”) between Easterly Acquisition Corp. (“Ea ste rly”) and Sirius International Insurance Group, Ltd. (“Sirius” or the “Company”) and for no other purpose. The information contain ed in this presentation does not purport to be all inclusive. The data contained herein is derived from various internal and ex ter nal sources. The information contained in this presentation is not, and should not be assumed to be, complete and does not prese nt all the information that investors may require or desire in considering the Proposed Transaction. It is not intended to form th e basis of any investment decision or any other decision in respect of the Proposed Transaction. Any data on past performance or modeli ng contained in this presentation is no indication as to future performance. Neither Easterly nor Sirius assume any obligation to update the information in this presentation. No securities commission or securities regulatory authority or other authority in the United States or any other jurisdiction ha s in any way passed upon the merits of the Proposed Transaction or the accuracy or adequacy of this presentation. NO OFFER OR SOLICITATION This presentation is neither an offer to sell, nor the solicitation of an offer to sell any securities, nor is it a solicitat ion of any vote, consent, or approval in any jurisdiction pursuant to or in connection with the Proposed Transaction or otherwise , nor shall there be any sale, issuance or transfer of securities in any jurisdiction in contravention of applicable law. No offering of securities s hal l be made except by means of a prospectus meeting the requirements of Section 10 of the Securities Act of 1933, as amended. ADDITIONAL INFORMATION AND WHERE TO FIND IT This communication relates to the Proposed Transaction and may be deemed to be solicitation material in respect of the Propos ed Transaction. In connection with the Proposed Transaction, Sirius intends to file with the SEC a Registration Statement on Fo rm F - 4 that will include a proxy statement of Easterly that also includes a prospectus of Sirius. After the Registration Statement on Form F - 4 is declared effective, Easterly will mail a proxy statement/prospectus to its stockholders in connection with Easterly’ s solicitation of proxies for the special meeting of Easterly stockholders to be held to approve the Proposed Transaction and related transa cti ons. This presentation does not contain all the information that should be considered concerning the Proposed Transaction, in clu ding relevant risk factors that will be included in the proxy statement/prospectus. It is not intended to provide the basis for an y i nvestment decision or any other decision in respect to the Proposed Transaction. Easterly stockholders and other interested p ers ons are advised to read the proxy statement/prospectus (including any documents incorporated by reference therein) when available, as th ese materials will contain important information about Sirius, Easterly, and the Proposed Transaction. Investors and stockhol der s can obtain free copies of the proxy statement/prospectus and other documents filed with the SEC by Easterly through the web si te maintained by the SEC at www.sec.gov. In addition, investors and stockholders can obtain free copies of the proxy statement/prospectus when available from Easterly by accessing Easterly’s website at www.easterlyacquisition.com. CERTAIN INFORMATION This presentation includes information based on independent industry publications and other sources. Although we believe that th e data presented is reliable, we have not independently verified such information. You should not construe the contents of thi s presentation as legal, accounting, business or tax advice and you should consult your own professional advisors as to the leg al, accounting, business, tax, financial or other matters contained herein. None of Easterly, Sirius, nor any of their respective a ffiliates, directors, officers, management, employees, representatives and advisors makes any representation or warranty, express or imp lie d, as to the accuracy or completeness of any of the information contained herein, or any other information (whether communica ted in written or oral form) transmitted or made available to you. Recipients of this presentation will be deemed to expressly di scl aim any and all liability of any of the foregoing persons relating to or resulting from the use of this presentation or such oth er information (including without limitation, any market analysis and financial projections that may be contained herein or provided in conn ect ion herewith) by you or any of your directors, partners, officers, employees, affiliates, agents and representatives. PARTICIPANTS IN SOLICITATION Easterly and Sirius, and their respective directors and executive officers, may be deemed participants in the solicitation of pro xies of Easterly stockholders in respect of the Proposed Transaction. Information about the directors and executive officers of Easterly and Sirius and more detailed information regarding the identity of all potential participants, and their direct and indirect int erests, by security holdings or otherwise, will be set forth in Sirius’ Registration Statement on Form F - 4 that will include a proxy statement of Easterly. Investors may obtain additional information about the interests of such participants by reading such proxy statemen t/p rospectus. FORWARD - LOOKING STATEMENTS This presentation contains “forward - looking statements” within the meaning of Section 21E of the Securities Exchange Act of 1934 , as amended, and the Private Securities Litigation Reform Act of 1995, known as the PSLRA. Forward - looking statements may relate to the Proposed Transaction and any other statements relating to future results, strategy and plans of Easterly and Si riu s (including certain projections and business trends, and statements which may be identified by the use of the words “plans,” “ex pects” or “does not expect,” “estimated,” “is expected,” “budget,” “scheduled,” “estimates,” “forecasts,” “intends,” “anticipates” or “ doe s not anticipate,” or “believes,” or variations of such words and phrases or state that certain actions, events or results “m ay” , “could”, “would”, “might”, “projects”, “will” or “will be taken”, “occur” or “be achieved”). Forward - looking statements are based on the opinions and estimates of management of Easterly or Sirius, as the case may be, as of the date such statements are made, and th ey are subject to known and unknown risks, uncertainties, assumptions and other factors that may cause the actual results, level of act ivity, performance or achievements to be materially different from those expressed or implied by such forward - looking statements . For Sirius, these risks and uncertainties include, but are not limited to, its revenues and operating performance, general econom ic conditions, industry trends, legislation or regulatory requirements affecting the businesses in which it is engaged, manageme nt of growth, amount of redemptions, its business strategy and plans, the sufficiency of Sirius’ asbestos and other reserves, the i mpa ct of emerging claims issues as well as other insurance and non - insurance litigation, the cost and availability of reinsurance c overage, catastrophe losses, fluctuations in insurance and reinsurance pricing, investigations or enforcement actions by governmental a uth orities, the result of future financing efforts and its dependence on key personnel. For Easterly, risks include, but are not li mited to, the risk of significant redemptions by Easterly’s stockholders, the inability to retain key personnel and the inability to ob tai n stockholder and regulatory approvals and to the inability to successfully close the transaction. Additional information on the se and other risks that may cause actual results and Easterly’s performance to differ materially is included in Easterly’s periodic report s fi led with the SEC, including but not limited to Easterly’s Form 10 - K for the year ended December 31, 2017 and subsequent Forms 10 - Q. Copies may be obtained by contacting Easterly. Readers are cautioned not to place undue reliance upon any forward - looking state ments, which speak only as of the date made. These forward - looking statements are made only as of the date hereof, and neither Easterly nor Sirius undertakes any obligation to update or revise the forward - looking statements, whether as a result of new inf ormation, future events or otherwise, except as required by law. PROJECTIONS Any estimates, forecasts or projections set forth in this presentation have been prepared by Sirius and/or Easterly managemen t i n good faith on a basis believed to be reasonable. Such estimates, forecasts and projections involve significant elements of s ubj ective judgment and analysis as well as risks (many of which are beyond our control). As such, no representation can be made as to t he attainability of our forecasts and projections. Investors are cautioned that such estimates, forecasts or projections have no t b een audited and have not been prepared in conformance with generally accepted accounting principles. For a listing of risks and o the r factors that could impact our ability to attain our projected results, please see “Forward - Looking Statements” above. USE OF NON - GAAP FINANCIAL MEASURES This communication includes non - GAAP financial measures. Definitions of these non - GAAP financial measures and reconciliations of th ese non - GAAP financial measures to the most directly comparable GAAP financial measures are included elsewhere in this communication.
3 T ABLE OF C ONTENTS Introduction to Sirius Group 4 Transaction Overview and Timing 18 Consolidated Financial Overview 12 Appendix 21
I NTRODUCTION TO S IRIUS G ROUP
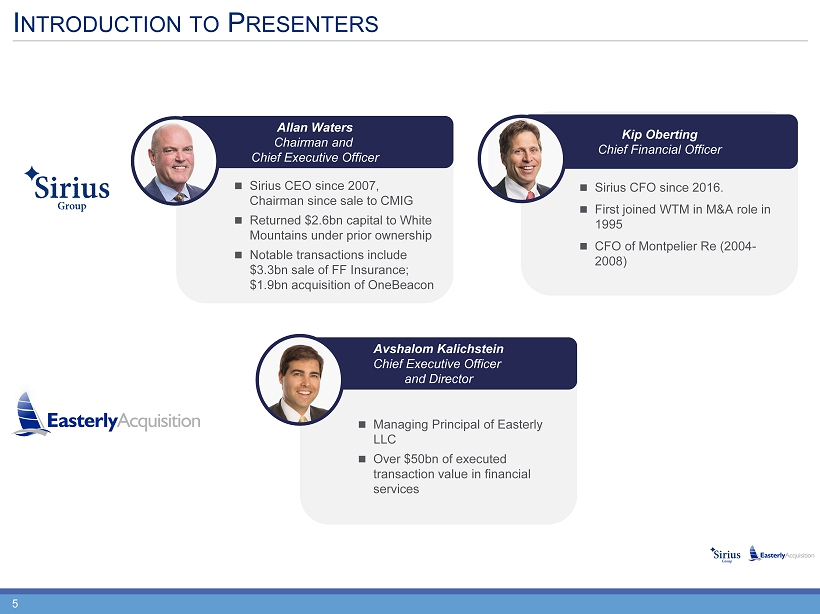
5 I NTRODUCTION TO P RESENTERS Sirius CEO since 2007, Chairman since sale to CMIG Returned $2.6bn capital to White Mountains under prior ownership Notable transactions include $3.3bn sale of FF Insurance; $1.9bn acquisition of OneBeacon Allan Waters Chairman and Chief Executive Officer Sirius CFO since 2016. First joined WTM in M&A role in 1995 CFO of Montpelier Re (2004 - 2008) Kip Oberting Chief Financial Officer Managing Principal of Easterly LLC Over $50bn of executed transaction value in financial services Avshalom Kalichstein Chief Executive Officer and Director
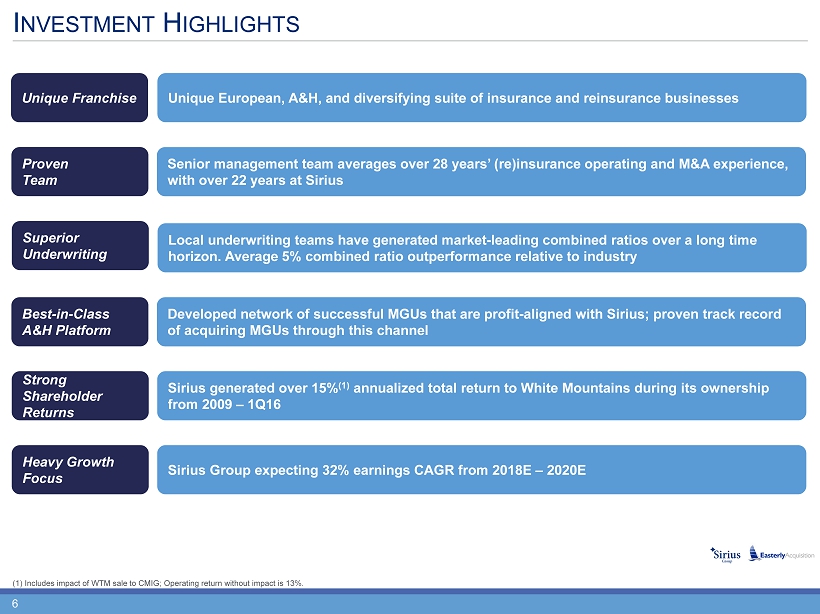
6 I NVESTMENT H IGHLIGHTS Unique European, A&H, and diversifying suite of insurance and reinsurance businesses Unique Franchise Developed network of successful MGUs that are profit - aligned with Sirius; proven track record of acquiring MGUs through this channel Best - in - Class A&H Platform Sirius generated over 15% (1) annualized total return to White Mountains during its ownership from 2009 – 1Q16 Strong Shareholder Returns Senior management team averages over 28 years’ (re)insurance operating and M&A experience, with over 22 years at Sirius Proven Team Sirius Group expecting 32% earnings CAGR from 2018E – 2020E Heavy Growth Focus (1) Includes impact of WTM sale to CMIG; Operating return without impact is 13%. Local underwriting teams have generated market - leading combined ratios over a long time horizon. Average 5% combined ratio outperformance relative to industry Superior Underwriting
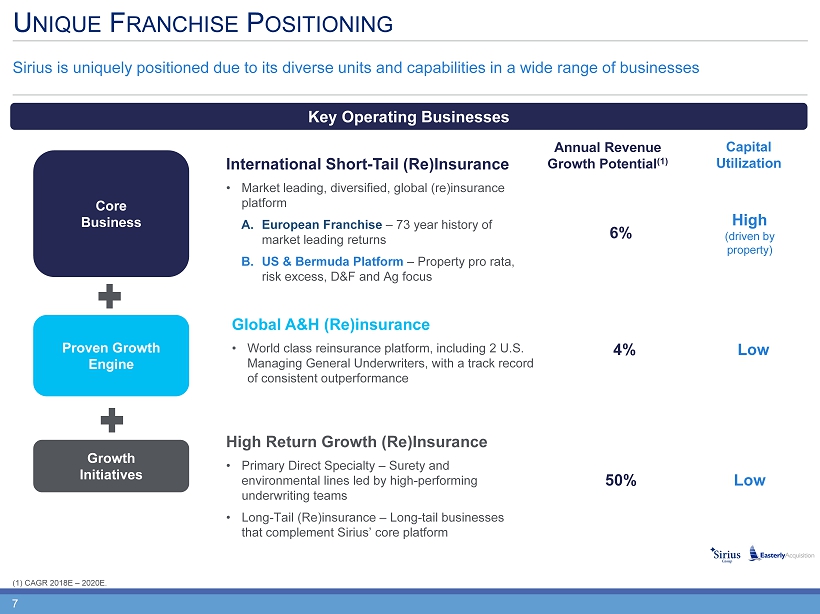
7 U NIQUE F RANCHISE P OSITIONING Sirius is uniquely positioned due to its diverse units and capabilities in a wide range of businesses Key Operating Businesses International Short - Tail (Re)Insurance • Market leading, diversified, global (re)insurance platform A. European Franchise – 73 year history of market leading returns B. US & Bermuda Platform – Property pro rata, risk excess, D&F and Ag focus Global A&H (Re)insurance • World class reinsurance platform, including 2 U.S. Managing General Underwriters, with a track record of consistent outperformance High Return Growth (Re)Insurance • Primary Direct Specialty – Surety and environmental lines led by high - performing underwriting teams • Long - Tail (Re)insurance – Long - tail businesses that complement Sirius’ core platform Growth Initiatives Core Business Proven Growth Engine Capital Utilization High (driven by property) Annual Revenue Growth Potential (1) 6% 4% 50% Low Low (1) CAGR 2018E – 2020E.
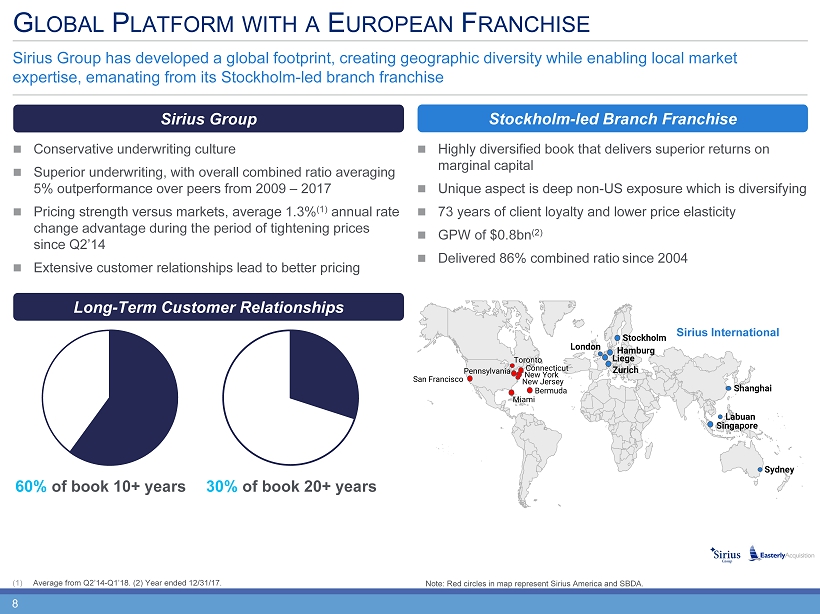
8 G LOBAL P LATFORM WITH A E UROPEAN F RANCHISE (1) Average from Q2’14 - Q1’18. (2) Year ended 12/31/17. Sirius Group has developed a global footprint, creating geographic diversity while enabling local market expertise, emanating from its Stockholm - led branch franchise Stockholm - led Branch Franchise Sirius Group Singapore New York Miami Bermuda Toronto Stockholm Hamburg Zurich London Liege Shanghai Labuan San Francisco Pennsylvania Connecticut New Jersey Sydney 30% of book 20+ years 60% of book 10+ years Conservative underwriting culture Superior underwriting, with overall combined ratio averaging 5% outperformance over peers from 2009 – 2017 Pricing strength versus markets, average 1.3% (1) annual rate change advantage during the period of tightening prices since Q2��14 Extensive customer relationships lead to better pricing Highly diversified book that delivers superior returns on marginal capital Unique aspect is deep non - US exposure which is diversifying 73 years of client loyalty and lower price elasticity GPW of $0.8bn (2) Delivered 86% combined ratio since 2004 Sirius International Note: Red circles in map represent Sirius America and SBDA. Long - Term Customer Relationships
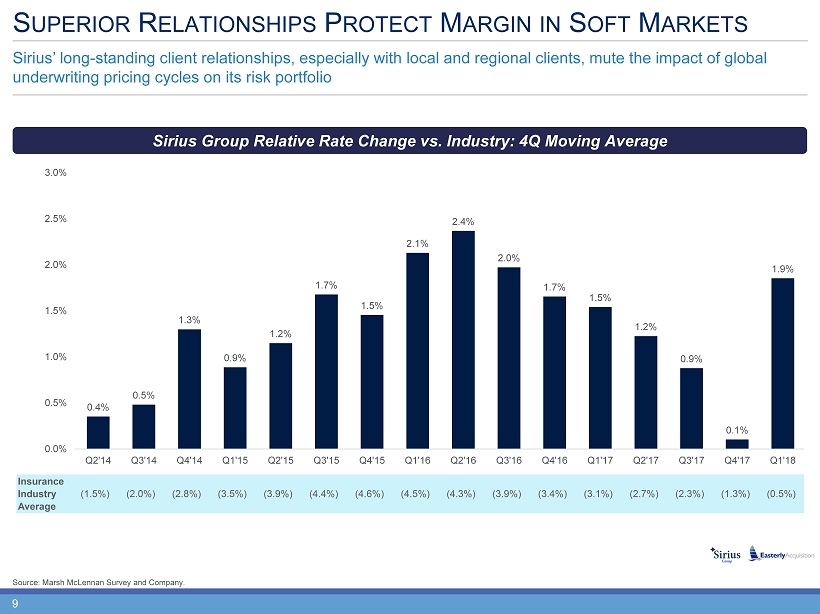
9 Insurance Industry Average (1.5%) (2.0%) (2.8%) (3.5%) (3.9%) (4.4%) (4.6%) (4.5%) (4.3%) (3.9%) (3.4%) (3.1%) (2.7%) (2.3%) (1.3%) (0.5%) 0.4% 0.5% 1.3% 0.9% 1.2% 1.7% 1.5% 2.1% 2.4% 2.0% 1.7% 1.5% 1.2% 0.9% 0.1% 1.9% 0.0% 0.5% 1.0% 1.5% 2.0% 2.5% 3.0% Q2'14 Q3'14 Q4'14 Q1'15 Q2'15 Q3'15 Q4'15 Q1'16 Q2'16 Q3'16 Q4'16 Q1'17 Q2'17 Q3'17 Q4'17 Q1'18 S UPERIOR R ELATIONSHIPS P ROTECT M ARGIN IN S OFT M ARKETS Source: Marsh McLennan Survey and Company. Sirius’ long - standing client relationships, especially with local and regional clients, mute the impact of global underwriting pricing cycles on its risk portfolio Sirius Group Relative Rate Change vs. Industry: 4Q Moving Average
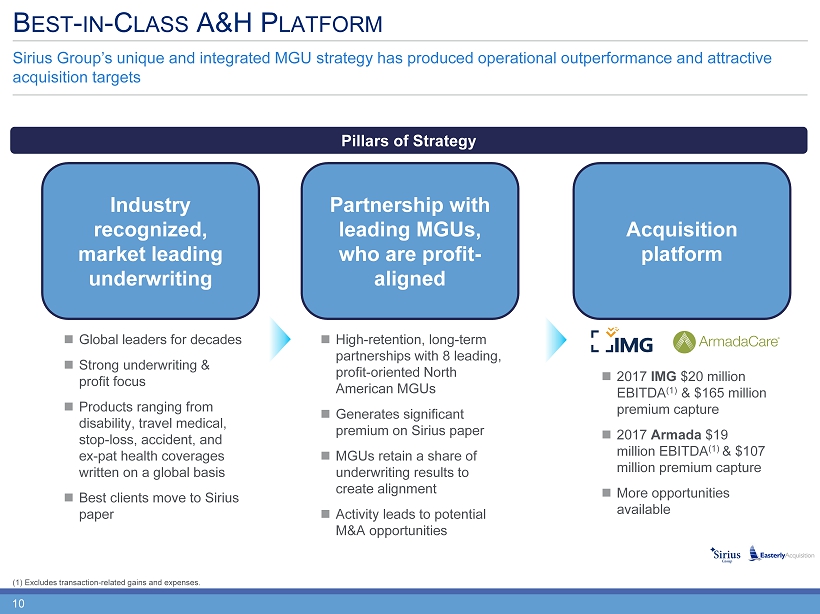
10 B EST - IN - C LASS A&H P LATFORM (1) Excludes transaction - related gains and expenses. Sirius Group’s unique and integrated MGU strategy has produced operational outperformance and attractive acquisition targets Pillars of Strategy Industry recognized, market leading underwriting Partnership with leading MGUs, who are profit - aligned Acquisition platform Global leaders for decades Strong underwriting & profit focus Products ranging from disability, travel medical, stop - loss, accident, and ex - pat health coverages written on a global basis Best clients move to Sirius paper High - retention, long - term partnerships with 8 leading, profit - oriented North American MGUs Generates significant premium on Sirius paper MGUs retain a share of underwriting results to create alignment Activity leads to potential M&A opportunities 2017 IMG $20 million EBITDA (1) & $165 million premium capture 2017 Armada $19 million EBITDA (1) & $107 million premium capture More opportunities available
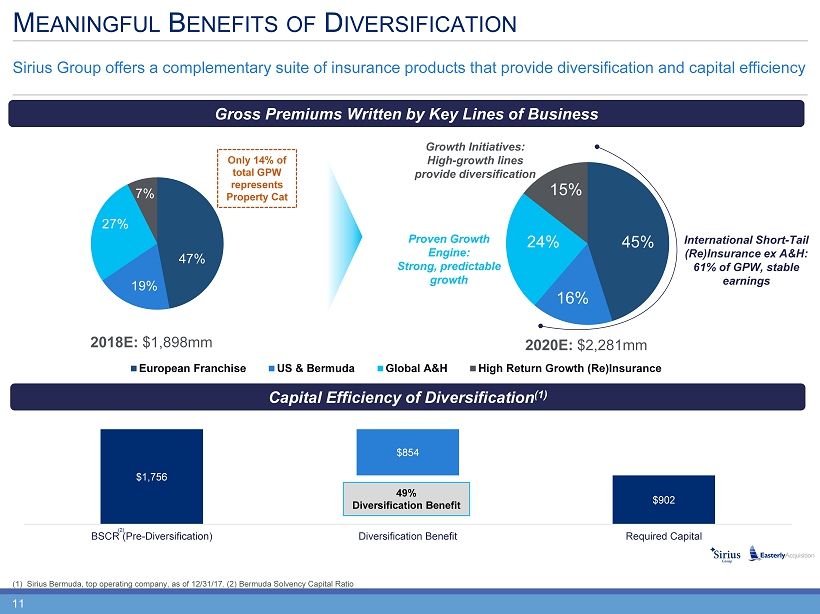
11 $1,756 $902 $854 BSCR (Pre-Diversification) Diversification Benefit Required Capital 47% 19% 27% 7% 45% 16% 24% 15% M EANINGFUL B ENEFITS OF D IVERSIFICATION (1) Sirius Bermuda, top operating company, as of 12/31/17. (2) Bermuda Solvency Capital Ratio Sirius Group offers a complementary suite of insurance products that provide diversification and capital efficiency Gross Premiums Written by Key Lines of Business Capital Efficiency of Diversification (1) 49% Diversification Benefit 2018E: $1,898mm 2020E: $2,281mm (2) International Short - Tail (Re)Insurance ex A&H: 61% of GPW, stable earnings Proven Growth Engine: Strong, predictable growth Growth Initiatives: High - growth lines provide diversification Only 14% of total GPW represents Property Cat European Franchise US & Bermuda Global A&H High Return Growth (Re)Insurance

C ONSOLIDATED F INANCIAL O VERVIEW
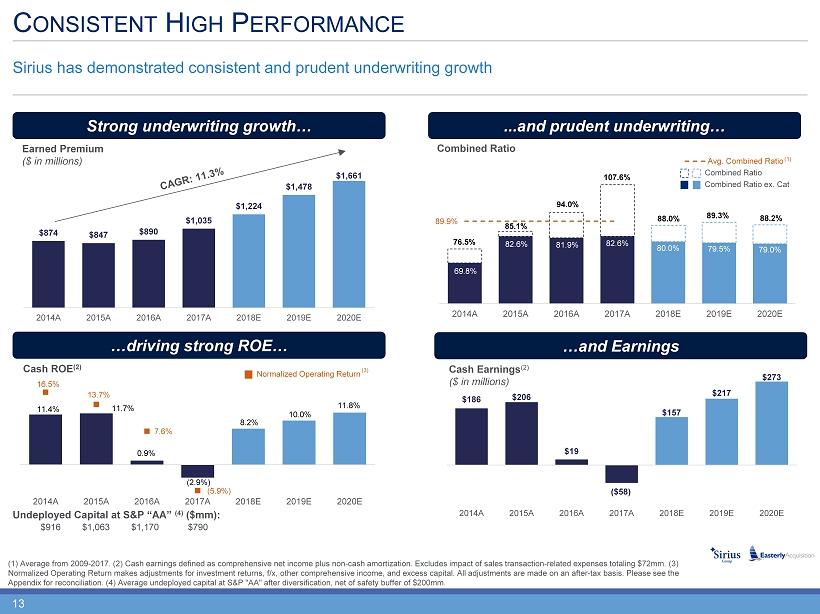
13 11.4% 11.7% 0.9% (2.9%) 8.2% 10.0% 11.8% 16.5% 13.7% 7.6% (5.9%) 2014A 2015A 2016A 2017A 2018E 2019E 2020E $186 $206 $19 ($58) $157 $217 $273 2014A 2015A 2016A 2017A 2018E 2019E 2020E $916 $1,063 $1,170 $790 69.8% 82.6% 81.9% 82.6% 80.0% 79.5% 79.0% 76.5% 85.1% 94.0% 107.6% 88.0% 89.3% 88.2% 89.9% 2014A 2015A 2016A 2017A 2018E 2019E 2020E Avg. Combined Ratio C ONSISTENT H IGH P ERFORMANCE ...and prudent underwriting… Strong underwriting growth… …and Earnings …driving strong ROE… Sirius has demonstrated consistent and prudent underwriting growth Earned Premium ($ in millions) Cash ROE (2) Combined Ratio Cash Earnings (2) ($ in millions) $874 $847 $890 $1,035 $1,224 $1,478 $1,661 2014A 2015A 2016A 2017A 2018E 2019E 2020E (1) Combined Ratio ex. Cat Combined Ratio Normalized Operating Return Undeployed Capital at S&P “AA” (4) ($mm): (1) Average from 2009 - 2017. (2) Cash earnings defined as comprehensive net income plus non - cash amortization. Excludes impact of sales transaction - related expenses totaling $72mm. (3) Normalized Operating Return makes adjustments for investment returns, f/x, other comprehensive income, and excess capital. Al l a djustments are made on an after - tax basis. Please see the Appendix for reconciliation. (4) Average undeployed capital at S&P "AA" after diversification, net of safety buffer of $200mm . (3)
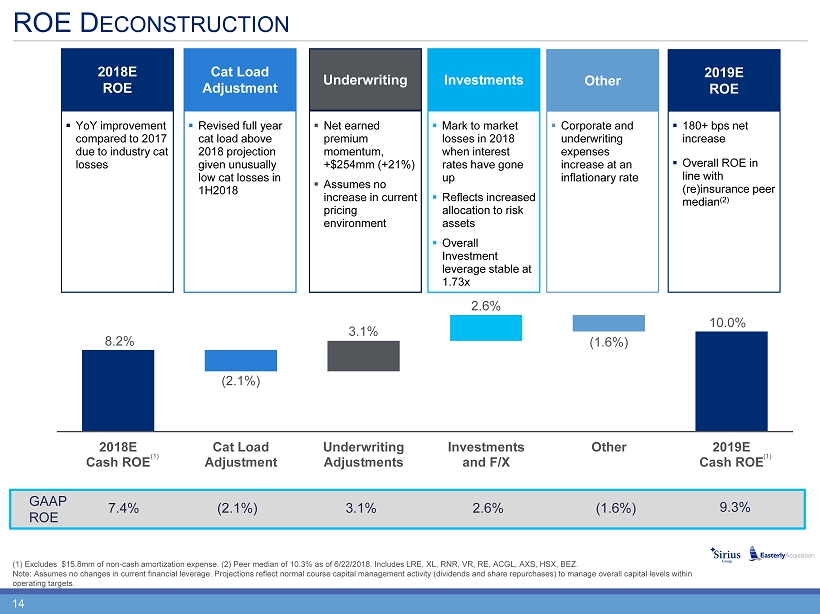
14 ROE D ECONSTRUCTION 2018E ROE Cat Load Adjustment Underwriting ▪ YoY improvement compared to 2017 due to industry cat losses ▪ Revised full year cat load above 2018 projection given unusually low cat losses in 1H2018 ▪ Net earned premium momentum, +$254mm (+21%) ▪ Assumes no increase in current pricing environment ▪ Mark to market losses in 2018 when interest rates have gone up ▪ Reflects increased allocation to risk assets ▪ Overall Investment leverage stable at 1.73x Investments ▪ 180+ bps net increase ▪ Overall ROE in line with (re)insurance peer median (2) 2019E ROE 8.2% 10.0% (2.1%) 3.1% 2.6% (1.6%) 2018E Cash ROE Cat Load Adjustment Underwriting Adjustments Investments and F/X Other 2019E Cash ROE ▪ Corporate and underwriting expenses increase at an inflationary rate Other GAAP ROE 7.4% (2.1%) 3.1% 2.6% (1.6%) 9.3% (1) Excludes $15.8mm of non - cash amortization expense. (2) Peer median of 10.3% as of 6/22/2018. Includes LRE, XL, RNR, VR, RE, ACGL, AXS, HSX, BEZ. Note: Assumes no changes in current financial leverage. Projections reflect normal course capital management activity (divide nds and share repurchases) to manage overall capital levels within operating targets. (1) (1)
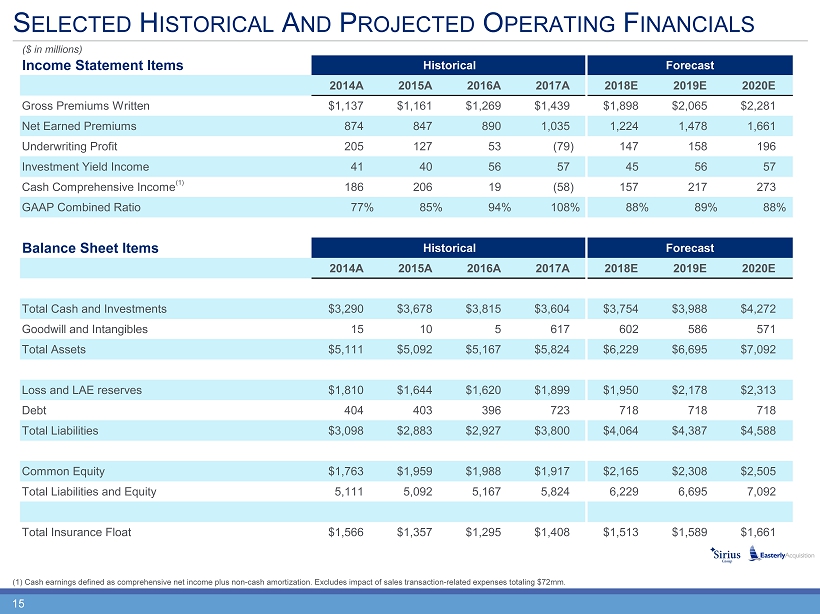
15 Income Statement Items Historical Forecast 2014A 2015A 2016A 2017A 2018E 2019E 2020E Gross Premiums Written $1,137 $1,161 $1,269 $1,439 $1,898 $2,065 $2,281 Net Earned Premiums 874 847 890 1,035 1,224 1,478 1,661 Underwriting Profit 205 127 53 (79) 147 158 196 Investment Yield Income 41 40 56 57 45 56 57 Cash Comprehensive Income 186 206 19 (58) 157 217 273 GAAP Combined Ratio 77% 85% 94% 108% 88% 89% 88% Balance Sheet Items Historical Forecast 2014A 2015A 2016A 2017A 2018E 2019E 2020E Total Cash and Investments $3,290 $3,678 $3,815 $3,604 $3,754 $3,988 $4,272 Goodwill and Intangibles 15 10 5 617 602 586 571 Total Assets $5,111 $5,092 $5,167 $5,824 $6,229 $6,695 $7,092 Loss and LAE reserves $1,810 $1,644 $1,620 $1,899 $1,950 $2,178 $2,313 Debt 404 403 396 723 718 718 718 Total Liabilities $3,098 $2,883 $2,927 $3,800 $4,064 $4,387 $4,588 Common Equity $1,763 $1,959 $1,988 $1,917 $2,165 $2,308 $2,505 Total Liabilities and Equity 5,111 5,092 5,167 5,824 6,229 6,695 7,092 Total Insurance Float $1,566 $1,357 $1,295 $1,408 $1,513 $1,589 $1,661 S ELECTED H ISTORICAL A ND P ROJECTED O PERATING F INANCIALS (1) Cash earnings defined as comprehensive net income plus non - cash amortization. Excludes impact of sales transaction - related e xpenses totaling $72mm. (1) ($ in millions)
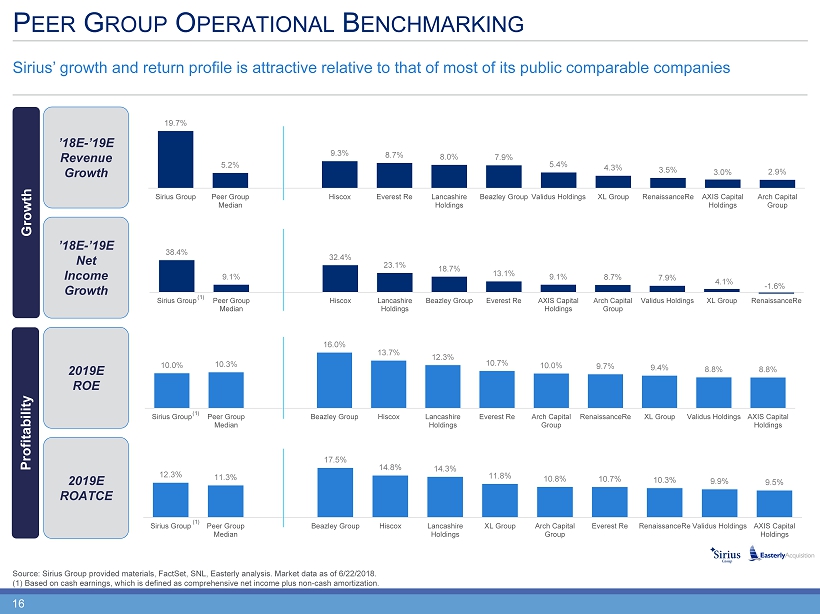
16 10.0% 10.3% 16.0% 13.7% 12.3% 10.7% 10.0% 9.7% 9.4% 8.8% 8.8% Sirius Group Peer Group Median Beazley Group Hiscox Lancashire Holdings Everest Re Arch Capital Group RenaissanceRe XL Group Validus Holdings AXIS Capital Holdings 12.3% 11.3% 17.5% 14.8% 14.3% 11.8% 10.8% 10.7% 10.3% 9.9% 9.5% Sirius Group Peer Group Median Beazley Group Hiscox Lancashire Holdings XL Group Arch Capital Group Everest Re RenaissanceRe Validus Holdings AXIS Capital Holdings 19.7% 5.2% 9.3% 8.7% 8.0% 7.9% 5.4% 4.3% 3.5% 3.0% 2.9% Sirius Group Peer Group Median Hiscox Everest Re Lancashire Holdings Beazley Group Validus Holdings XL Group RenaissanceRe AXIS Capital Holdings Arch Capital Group 38.4% 9.1% 32.4% 23.1% 18.7% 13.1% 9.1% 8.7% 7.9% 4.1% - 1.6% Sirius Group Peer Group Median Hiscox Lancashire Holdings Beazley Group Everest Re AXIS Capital Holdings Arch Capital Group Validus Holdings XL Group RenaissanceRe P EER G ROUP O PERATIONAL B ENCHMARKING Sirius’ growth and return profile is attractive relative to that of most of its public comparable companies Growth Source: Sirius Group provided materials, FactSet, SNL, Easterly analysis. Market data as of 6/22/2018. (1) Based on cash earnings, which is defined as comprehensive net income plus non - cash amortization. 2019E ROATCE Profitability 2019E ROE ’18E - ’19E Net Income Growth ’18E - ’19E Revenue Growth (1) (1) (1)
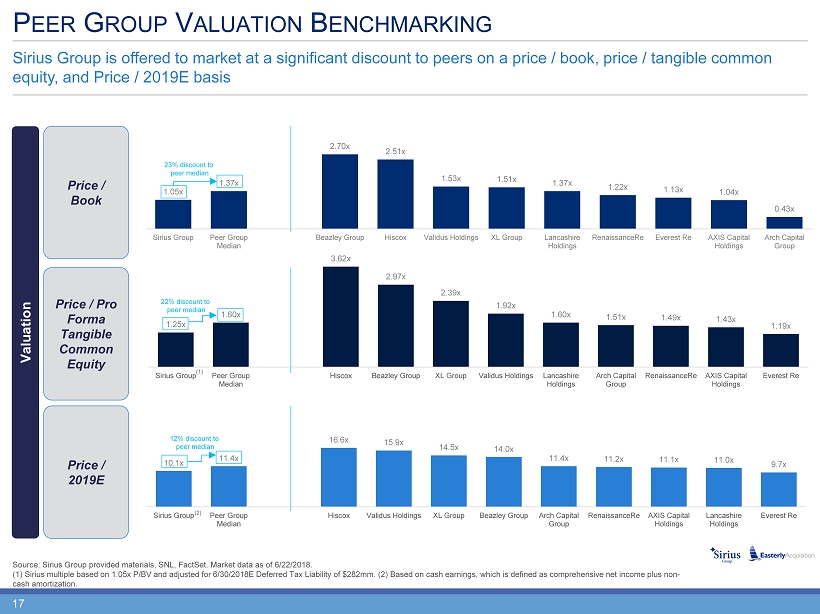
17 10.1x 11.4x 16.6x 15.9x 14.5x 14.0x 11.4x 11.2x 11.1x 11.0x 9.7x Sirius Group Peer Group Median Hiscox Validus Holdings XL Group Beazley Group Arch Capital Group RenaissanceRe AXIS Capital Holdings Lancashire Holdings Everest Re 1.25x 1.60x 3.62x 2.97x 2.39x 1.92x 1.60x 1.51x 1.49x 1.43x 1.19x Sirius Group Peer Group Median Hiscox Beazley Group XL Group Validus Holdings Lancashire Holdings Arch Capital Group RenaissanceRe AXIS Capital Holdings Everest Re 1.05x 1.37x 2.70x 2.51x 1.53x 1.51x 1.37x 1.22x 1.13x 1.04x 0.43x Sirius Group Peer Group Median Beazley Group Hiscox Validus Holdings XL Group Lancashire Holdings RenaissanceRe Everest Re AXIS Capital Holdings Arch Capital Group P EER G ROUP V ALUATION B ENCHMARKING Sirius Group is offered to market at a significant discount to peers on a price / book, price / tangible common equity, and Price / 2019E basis Source: Sirius Group provided materials, SNL, FactSet. Market data as of 6/22/2018. (1) Sirius multiple based on 1.05x P/BV and adjusted for 6/30/2018E Deferred Tax Liability of $282mm. (2) Based on cash earnings, which is defined as comprehensive net income plus non - cash amortization. Valuation Price / Book Price / Pro Forma Tangible Common Equity Price / 2019E 22% discount to peer median 12% discount to peer median 23% discount to peer median (1) (2)

T RANSACTION O VERVIEW AND T IMING
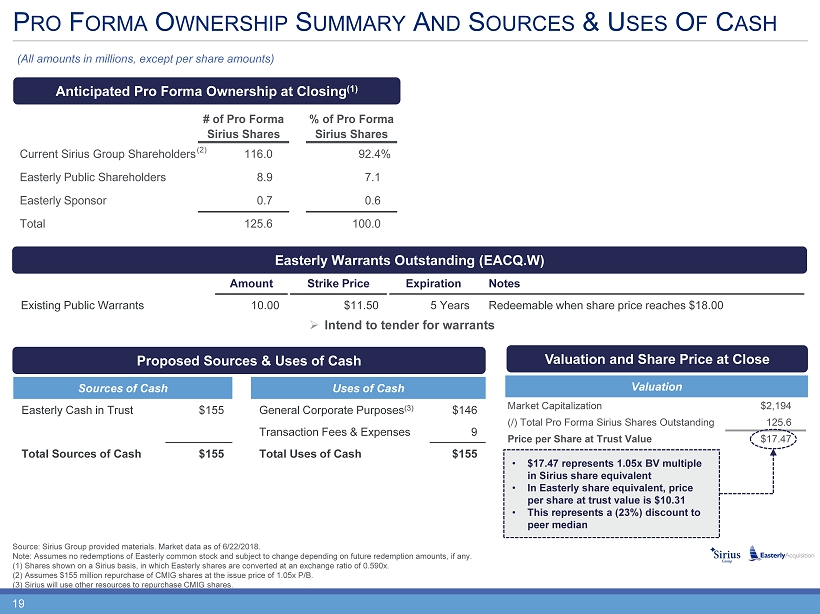
19 Market Capitalization $2,194 (/) Total Pro Forma Sirius Shares Outstanding 125.6 Price per Share at Trust Value $17.47 # of Pro Forma Sirius Shares % of Pro Forma Sirius Shares Current Sirius Group Shareholders 116.0 92.4% Easterly Public Shareholders 8.9 7.1 Easterly Sponsor 0.7 0.6 Total 125.6 100.0 P RO F ORMA O WNERSHIP S UMMARY A ND S OURCES & U SES O F C ASH Source: Sirius Group provided materials. Market data as of 6/22/2018. Note: A ssumes no redemptions of Easterly common stock and subject to change depending on future redemption amounts, if any. (1) Shares shown on a Sirius basis, in which Easterly shares are converted at an exchange ratio of 0.590x. (2) Assumes $155 million repurchase of CMIG shares at the issue price of 1.05x P/B. (3) Sirius will use other resources to repurchase CMIG shares. Anticipated Pro Forma Ownership at Closing (1) Easterly Warrants Outstanding (EACQ.W) (All amounts in millions, except per share amounts) Amount Strike Price Expiration Notes Existing Public Warrants 10.00 $11.50 5 Years Redeemable when share price reaches $18.00 Proposed Sources & Uses of Cash Valuation and Share Price at Close Sources of Cash Uses of Cash Easterly Cash in Trust $155 General Corporate Purposes (3) $146 Transaction Fees & Expenses 9 Total Sources of Cash $155 Total Uses of Cash $155 Valuation • $17.47 represents 1.05x BV multiple in Sirius share equivalent • In Easterly share equivalent, price per share at trust value is $10.31 • This represents a (23%) discount to peer median » Intend to tender for warrants (2)
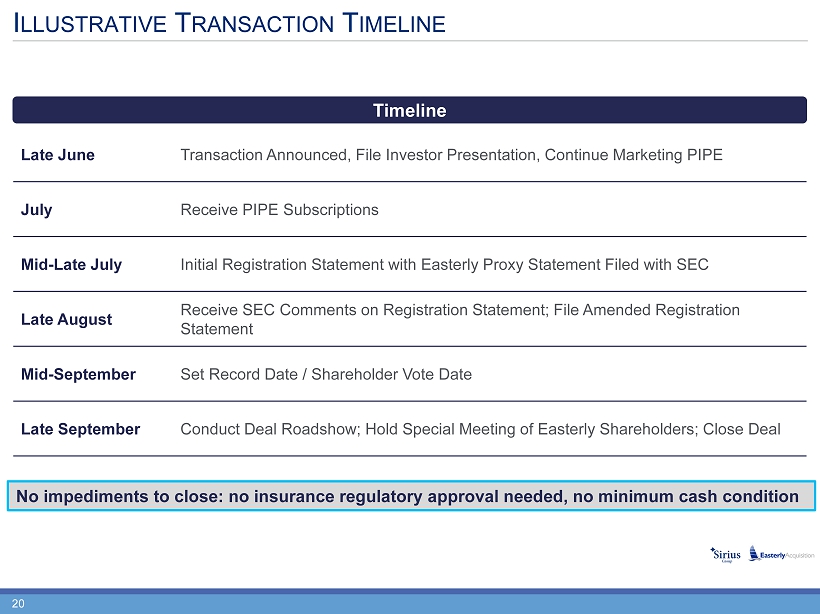
20 I LLUSTRATIVE T RANSACTION T IMELINE Late June Transaction Announced, File Investor Presentation, Continue Marketing PIPE July Receive PIPE Subscriptions Mid - Late July Initial Registration Statement with Easterly Proxy Statement Filed with SEC Late August Receive SEC Comments on Registration Statement; File Amended Registration Statement Mid - September Set Record Date / Shareholder Vote Date Late September Conduct Deal Roadshow; Hold Special Meeting of Easterly Shareholders; Close Deal Timeline No impediments to close: no insurance regulatory approval needed, no minimum cash condition

A PPENDIX
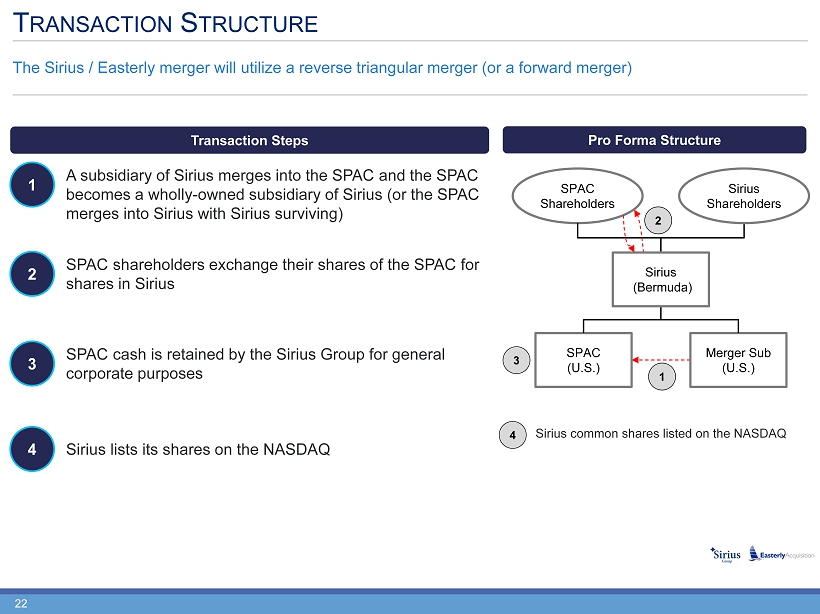
22 T RANSACTION S TRUCTURE The Sirius / Easterly merger will utilize a reverse triangular merger (or a forward merger) A subsidiary of Sirius merges into the SPAC and the SPAC becomes a wholly - owned subsidiary of Sirius (or the SPAC merges into Sirius with Sirius surviving) SPAC shareholders exchange their shares of the SPAC for shares in Sirius SPAC cash is retained by the Sirius Group for general corporate purposes SPAC (U.S.) Merger Sub (U.S.) SPAC Shareholders Sirius Shareholders Sirius (Bermuda) Sirius lists its shares on the NASDAQ Sirius common shares listed on the NASDAQ 1 2 3 4 Transaction Steps Pro Forma Structure 1 2 3 4

23 S UPERIOR U NDERWRITING M ARGINS Historical Combined Ratio Outperformance vs. Industry Relationship - driven, granular risk portfolio, combined with prudent underwriting has delivered superior and less volatile financial results (1) Represents published industry results as per S&P’s global reinsurance highlights for Top 40 Reinsurers. 2017 reflects cur ren tly available peer set. (1) Average Outperformance Sirius Reinsurance Industry Difference 2009-2017 90% 95% 5% -5.0% 0.0% 5.0% 10.0% 15.0% 2009 2010 2011 2012 2013 2014 2015 2016 2017
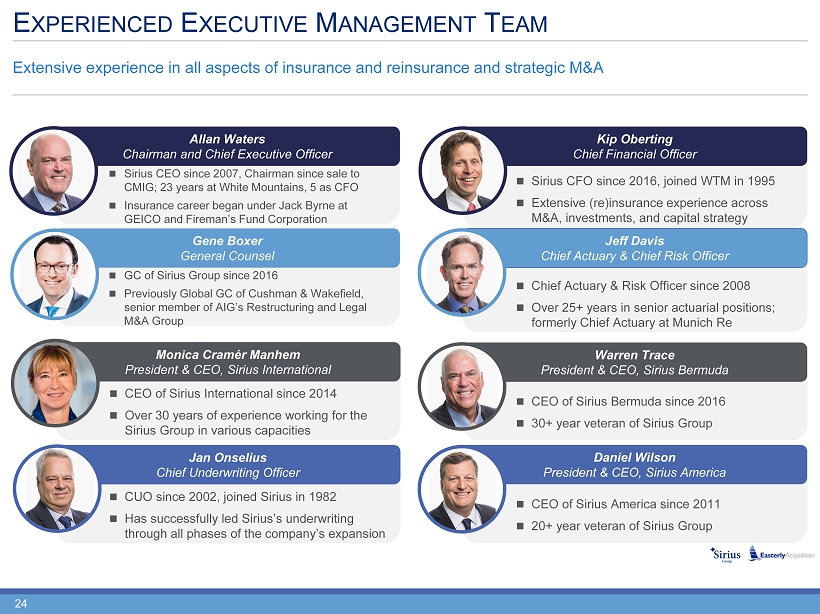
24 E XPERIENCED E XECUTIVE M ANAGEMENT T EAM Extensive experience in all aspects of insurance and reinsurance and strategic M&A Sirius CEO since 2007, Chairman since sale to CMIG; 23 years at White Mountains, 5 as CFO Insurance career began under Jack Byrne at GEICO and Fireman’s Fund Corporation Allan Waters Chairman and Chief Executive Officer Sirius CFO since 2016, joined WTM in 1995 Extensive (re)insurance experience across M&A, investments, and capital strategy Kip Oberting Chief Financial Officer CUO since 2002, joined Sirius in 1982 Has successfully led Sirius’s underwriting through all phases of the company’s expansion Jan Onselius Chief Underwriting Officer GC of Sirius Group since 2016 Previously Global GC of Cushman & Wakefield, senior member of AIG’s Restructuring and Legal M&A Group Gene Boxer General Counsel Chief Actuary & Risk Officer since 2008 Over 25+ years in senior actuarial positions; formerly Chief Actuary at Munich Re Jeff Davis Chief Actuary & Chief Risk Officer CEO of Sirius Bermuda since 2016 30+ year veteran of Sirius Group Warren Trace President & CEO, Sirius Bermuda CEO of Sirius International since 2014 Over 30 years of experience working for the Sirius Group in various capacities Monica Cramér Manhem President & CEO, Sirius International CEO of Sirius America since 2011 20+ year veteran of Sirius Group Daniel Wilson President & CEO, Sirius America
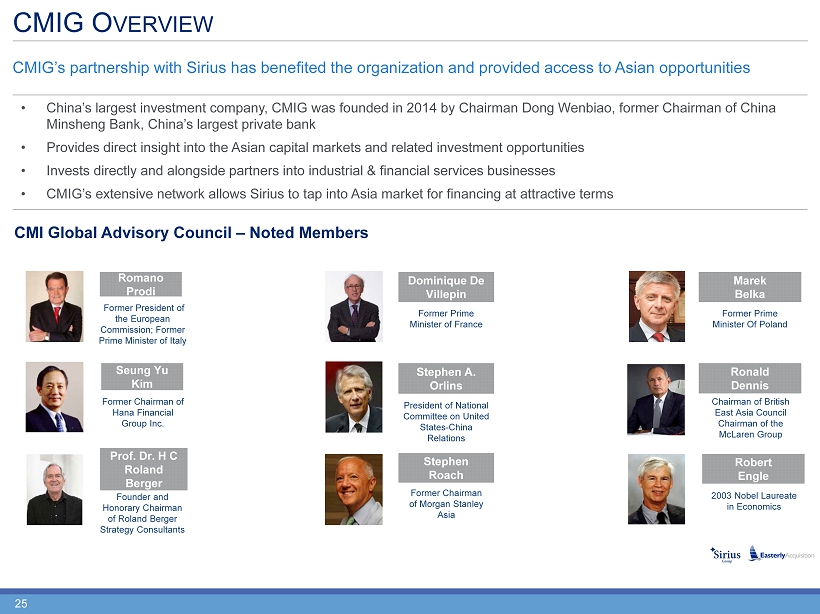
25 • China’s largest investment company, CMIG was founded in 2014 by Chairman Dong Wenbiao, former Chairman of China Minsheng Bank, China’s largest private bank • Provides direct insight into the Asian capital markets and related investment opportunities • Invests directly and alongside partners into industrial & financial services businesses • CMIG’s extensive network allows Sirius to tap into Asia market for financing at attractive terms CMIG O VERVIEW CMIG’s partnership with Sirius has benefited the organization and provided access to Asian opportunities Romano Prodi Former President of the European Commission; Former Prime Minister of Italy Seung Yu Kim Former Chairman of Hana Financial Group Inc. Prof. Dr. H C Roland Berger Founder and Honorary Chairman of Roland Berger Strategy Consultants Dominique De Villepin Former Prime Minister of France Stephen A. Orlins Stephen Roach President of National Committee on United States - China Relations Former Chairman of Morgan Stanley Asia Ronald Dennis Robert Engle Chairman of British East Asia Council Chairman of the McLaren Group 2003 Nobel Laureate in Economics Marek Belka Former Prime Minister Of Poland CMI Global Advisory Council – Noted Members
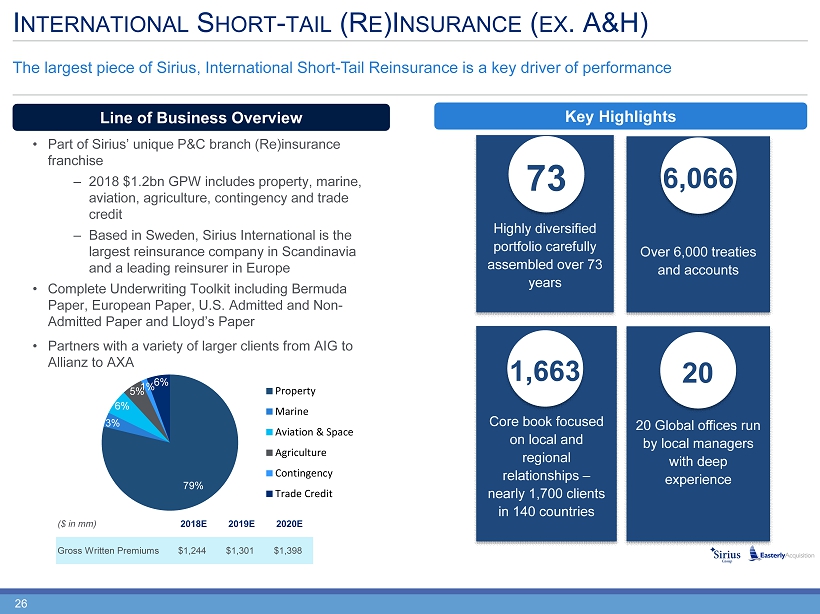
26 ($ in mm) 2018E 2019E 2020E Gross Written Premiums $1,244 $1,301 $1,398 The largest piece of Sirius, International Short - Tail Reinsurance is a key driver of performance I NTERNATIONAL S HORT - TAIL (R E )I NSURANCE ( EX . A&H) Key Highlights Over 6,000 treaties and accounts Core book focused on local and regional relationships – nearly 1,700 clients in 140 countries Highly diversified portfolio carefully assembled over 73 years 73 20 Global offices run by local managers with deep experience 6,066 1,663 Line of Business Overview 20 • Part of Sirius’ unique P&C branch (Re)insurance franchise ‒ 2018 $1.2bn GPW includes property, marine, aviation, agriculture, contingency and trade credit ‒ Based in Sweden, Sirius International is the largest reinsurance company in Scandinavia and a leading reinsurer in Europe • Complete Underwriting Toolkit including Bermuda Paper, European Paper, U.S. Admitted and Non - Admitted Paper and Lloyd’s Paper • Partners with a variety of larger clients from AIG to Allianz to AXA 79% 3% 6% 5% 1% 6% Property Marine Aviation & Space Agriculture Contingency Trade Credit
27 ($ in mm) 2018E 2019E 2020E Gross Written Premiums $514 $517 $554 Sirius’ market leading Global A&H platform is a proven growth engine G LOBAL A CCIDENT & H EALTH (R E )I NSURANCE Line of Business Overview • Global leaders across the full value chain writing $514 million of premium in 2018 ‒ Global reinsurance platform, US primary direct book, 2 U.S. MGU’s (travel & supplemental health) ‒ Longevity – 50% of the book is from relationships of 10 years or more • Wide range of specialty products ‒ Products ranging from disability, travel medical, stop - loss, accident, and ex - pat health coverages written on a global basis • Long - term partners, high persistency with superior profitability • Decade of consistent outperformance • Competitive positioning and product offerings significantly enhanced by IMG and Armada acquisitions
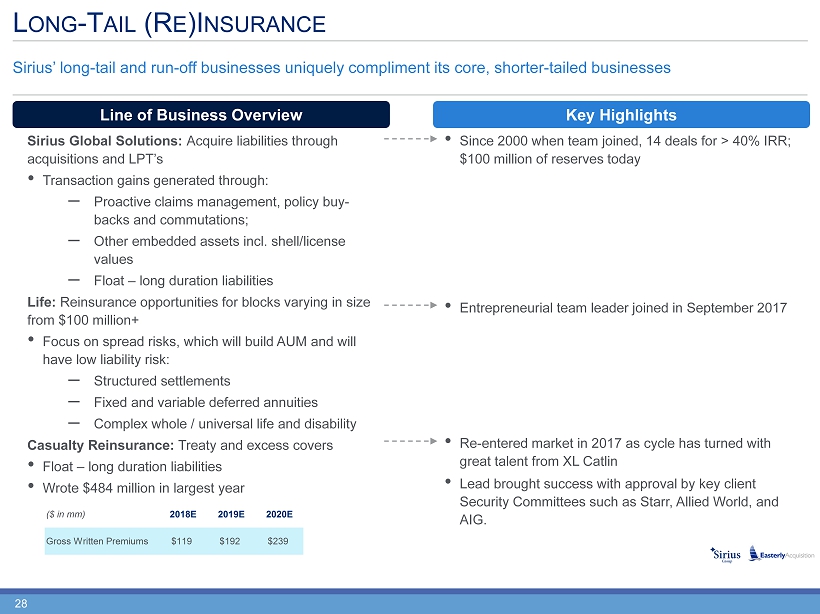
28 ($ in mm) 2018E 2019E 2020E Gross Written Premiums $119 $192 $239 Sirius’ long - tail and run - off businesses uniquely compliment its core, shorter - tailed businesses L ONG - T AIL (R E )I NSURANCE Line of Business Overview Key Highlights Sirius Global Solutions: Acquire liabilities through acquisitions and LPT’s • Transaction gains generated through: ‒ Proactive claims management, policy buy - backs and commutations; ‒ Other embedded assets incl. shell/license values ‒ Float – long duration liabilities Life: Reinsurance opportunities for blocks varying in size from $100 million+ • Focus on spread risks, which will build AUM and will have low liability risk: ‒ Structured settlements ‒ Fixed and variable deferred annuities ‒ Complex whole / universal life and disability Casualty Reinsurance: Treaty and excess covers • Float – long duration liabilities • Wrote $484 million in largest year • Since 2000 when team joined, 14 deals for > 40% IRR; $100 million of reserves today • Entrepreneurial team leader joined in September 2017 • Re - entered market in 2017 as cycle has turned with great talent from XL Catlin • Lead brought success with approval by key client Security Committees such as Starr, Allied World, and AIG.
29 ($ in mm) 2018E 2019E 2020E Gross Written Premiums $22 $55 $90 Though it is the smallest of Sirius’ key operating lines of business, the Primary Specialty business represents attractive growth opportunities P RIMARY S PECIALTY Consists of 2 primary businesses: • Surety: Wide variety of contracting and business bonding activities distributed through a network of third party agents ‒ Well respected and successful lead underwriter hired away from competitor as a result of M&A consolidation disruption at that firm • Environmental: Write a suite of products designed to cover the discovery at premises, or sudden and accidental release of, environmental contaminants. ‒ Team members with demonstrated record of success hired from US competitor Key Highlights Line of Business Overview • Attracted superior talent and positioned for long term, profitable growth • C omplementary products increase Sirius’ value to insurance brokerage community • Less volatile and capital efficient • Near - term small financial drag, long - term highly positive
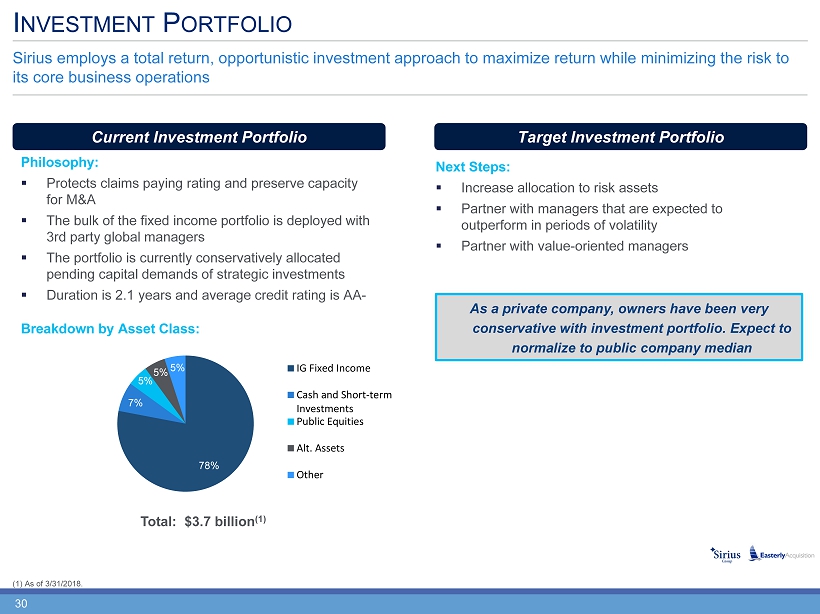
30 Sirius employs a total return, opportunistic investment approach to maximize return while minimizing the risk to its core business operations I NVESTMENT P ORTFOLIO (1) As of 3/31/2018. Current Investment Portfolio Target Investment Portfolio Philosophy: ▪ Protects claims paying rating and preserve capacity for M&A ▪ The bulk of the fixed income portfolio is deployed with 3rd party global managers ▪ The portfolio is currently conservatively allocated pending capital demands of strategic investments ▪ Duration is 2.1 years and average credit rating is AA - Breakdown by Asset Class: Next Steps: ▪ Increase allocation to risk assets ▪ Partner with managers that are expected to outperform in periods of volatility ▪ Partner with value - oriented managers Shift in the portfolio anticipated to result in investment return pick - up of [xx]bps Total: $3.7 billion (1) As a private company, owners have been very conservative with investment portfolio. Expect to normalize to public company median 78% 7% 5% 5% 5% IG Fixed Income Cash and Short-term Investments Public Equities Alt. Assets Other
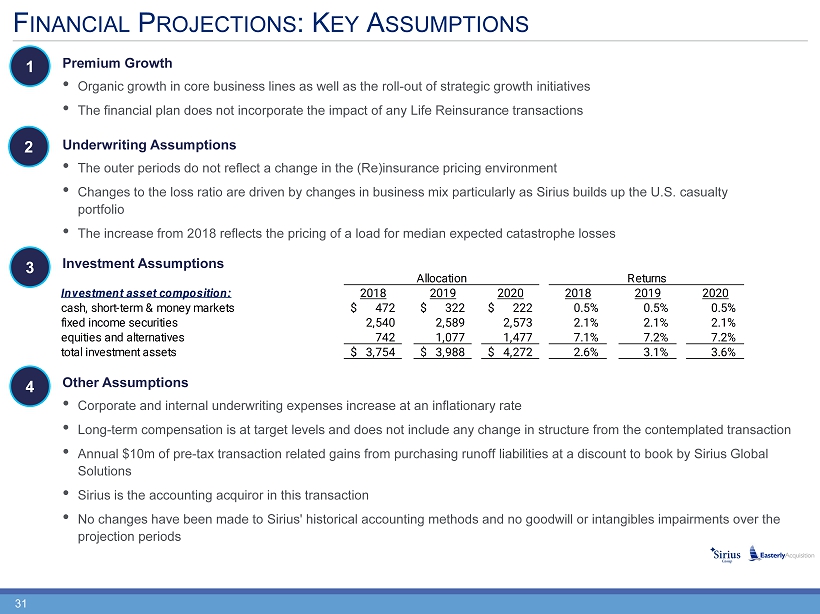
31 F INANCIAL P ROJECTIONS : K EY A SSUMPTIONS 1 2 Premium Growth • Organic growth in core business lines as well as the roll - out of strategic growth initiatives • The financial plan does not incorporate the impact of any Life Reinsurance transactions Underwriting Assumptions • The outer periods do not reflect a change in the (Re)insurance pricing environment • Changes to the loss ratio are driven by changes in business mix particularly as Sirius builds up the U.S. casualty portfolio • The increase from 2018 reflects the pricing of a load for median expected catastrophe losses 3 Investment Assumptions 4 Other Assumptions • Corporate and internal underwriting expenses increase at an inflationary rate • Long - term compensation is at target levels and does not include any change in structure from the contemplated transaction • Annual $10m of pre - tax transaction related gains from purchasing runoff liabilities at a discount to book by Sirius Global Solutions • Sirius is the accounting acquiror in this transaction • No changes have been made to Sirius' historical accounting methods and no goodwill or intangibles impairments over the projection periods Allocation Returns Investment asset composition: 2018 2019 2020 2018 2019 2020 cash, short-term & money markets 472$ 322$ 222$ 0.5% 0.5% 0.5% fixed income securities 2,540 2,589 2,573 2.1% 2.1% 2.1% equities and alternatives 742 1,077 1,477 7.1% 7.2% 7.2% total investment assets 3,754$ 3,988$ 4,272$ 2.6% 3.1% 3.6%
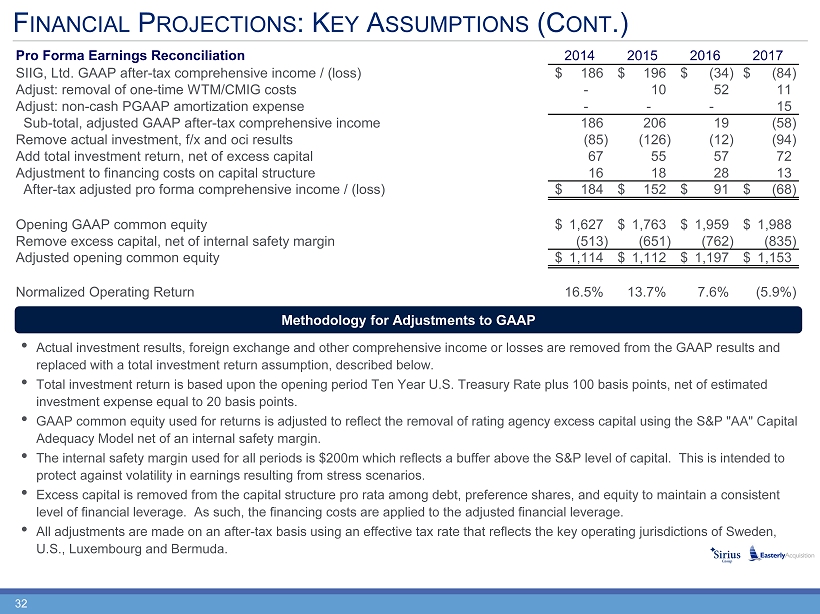
32 Pro Forma Earnings Reconciliation SIIG, Ltd. GAAP after-tax comprehensive income / (loss) 186$ 196$ (34)$ (84)$ Adjust: removal of one-time WTM/CMIG costs - 10 52 11 Adjust: non-cash PGAAP amortization expense - - - 15 Sub-total, adjusted GAAP after-tax comprehensive income 186 206 19 (58) Remove actual investment, f/x and oci results (85) (126) (12) (94) Add total investment return, net of excess capital 67 55 57 72 Adjustment to financing costs on capital structure 16 18 28 13 After-tax adjusted pro forma comprehensive income / (loss) 184$ 152$ 91$ (68)$ Opening GAAP common equity 1,627$ 1,763$ 1,959$ 1,988$ Remove excess capital, net of internal safety margin (513) (651) (762) (835) Adjusted opening common equity 1,114$ 1,112$ 1,197$ 1,153$ Normalized Operating Return 16.5% 13.7% 7.6% (5.9%) 2014 2015 2016 2017 • Actual investment results, foreign exchange and other comprehensive income or losses are removed from the GAAP results and replaced with a total investment return assumption, described below. • Total investment return is based upon the opening period Ten Year U.S. Treasury Rate plus 100 basis points, net of estimated investment expense equal to 20 basis points. • GAAP common equity used for returns is adjusted to reflect the removal of rating agency excess capital using the S&P "AA" Cap ita l Adequacy Model net of an internal safety margin. • The internal safety margin used for all periods is $200m which reflects a buffer above the S&P level of capital. This is int end ed to protect against volatility in earnings resulting from stress scenarios. • Excess capital is removed from the capital structure pro rata among debt, preference shares, and equity to maintain a consist ent level of financial leverage. As such, the financing costs are applied to the adjusted financial leverage. • All adjustments are made on an after - tax basis using an effective tax rate that reflects the key operating jurisdictions of Swed en, U.S., Luxembourg and Bermuda. F INANCIAL P ROJECTIONS : K EY A SSUMPTIONS (C ONT .) Methodology for Adjustments to GAAP