UNITED STATES
SECURITIES AND EXCHANGE COMMISSION
Washington, D.C. 20549
CERTIFIED SHAREHOLDER REPORT OF REGISTERED
MANAGEMENT INVESTMENT COMPANIES
Investment Company Act file number
811-23358
Angel Oak Financial Strategies Income Term Trust
(Exact name of registrant as specified in charter)
3344 Peachtree Rd. NE, Suite 1725
Atlanta, Georgia 30326
(Address of principal executive offices) (Zip code)
Dory S. Black, Esq., President
3344 Peachtree Rd. NE, Suite 1725
Atlanta, Georgia 30326
(Name and address of agent for service)
Douglas P. Dick
Stephen T. Cohen
Dechert LLP
1900 K Street NW
Washington, DC 20006
Registrant’s telephone number, including area code
Date of fiscal year end: January 31
Date of reporting period: July 31, 2022
Item 1. Reports to Stockholders.
(a)
Semi-Annual Report
July 31, 2022
Angel Oak Financial Strategies Income Term Trust
Angel Oak Capital Advisors, LLC
3344 Peachtree Road NE
Suite 1725
Atlanta, GA 30326
Table of Contents
Investment Results – (Unaudited)
Angel Oak Financial Strategies Income Term Trust
Total Return Based on a $10,000 Investment
The chart above assumes an initial investment of $10,000 made on May 31, 2019 (commencement of operations). Returns shown include the reinvestment of all dividends. Returns shown do not reflect the deduction of taxes that a shareholder would pay on Fund distributions or the sale of Fund shares. In the absence of fee waivers and reimbursements, when they are necessary to keep expenses at the expense cap, total return would be reduced. Past performance is not predictive of future performance. Investment return and principal value will fluctuate so that your shares, when redeemed, may be worth more or less than the original cost. Index returns do not reflect the effects of fees or expenses. It is not possible to invest directly in an index.
| | | | | |
| Market Price | | | | $14.80 | |
| NAV | | | | $16.33 | |
| Premium (Discount) to NAV | | | | (9.37% | ) |
Market Price Distribution Rate (1) | | | | 8.80% | |
| | | | 7.97% | |
(1) Distribution rates are not performance and are calculated by annualizing the most recent distribution per share and dividing by the NAV or Market Price, as applicable, as of the reported date. Distributions may be comprised of ordinary income, net capital gains, and/or a return of capital (“ROC”) of your investment in the Fund. Because the distribution rate may include a ROC, it should not be confused with yield or income. If the Fund estimates that a portion of its distribution may be comprised of amounts from sources other than net investment income in accordance with its policies and good accounting practices, the Fund will notify shareholders of the estimated composition of such distribution through a Section 19 Notice.
(For the Period Ended July 31, 2022)
| | | | | | |
| | | |
| | | | | | | |
| Angel Oak Financial Strategies Income Term Trust – NAV | | (7.94%) | | 0.13% | | 0.42% |
| Angel Oak Financial Strategies Income Term Trust – Market Price | | (11.83%) | | (2.59%) | | (2.24%) |
Bloomberg U.S. Aggregate Bond Index (3) | | (9.12%) | | (0.21%) | | 0.27% |
(1) Return figures reflect any change in price per share and assume the reinvestment of all distributions under the Fund’s dividend reinvestment plan. Returns shown do not reflect the deduction of taxes that a shareholder would pay on Fund distributions or the sale of Fund shares. In the absence of fee waivers and reimbursements, when they are necessary to keep expenses at the expense cap, total return would be reduced. Past performance is not predictive of future performance. Investment return and principal value will fluctuate so that your shares, when sold, may be worth more or less than the original cost. Index returns do not reflect the effects of fees or expenses. It is not possible to invest directly in an index.
1
Investment Results – (Unaudited) (continued)
(2) Inception date is May 31, 2019.
(3) The Bloomberg U.S. Aggregate Bond Index measures the performance of the investment-grade, fixed-rate bond market, including government and credit securities, agency pass-through securities, asset-backed securities and commercial mortgage-backed securities. Performance figures include the change in value of the bonds in the index and the reinvestment of interest. The index return does not reflect expenses, which have been deducted from the Fund’s return. You cannot invest directly in an index; however, an individual can invest in exchange-traded funds or other investment vehicles that attempt to track the performance of a benchmark index.
2
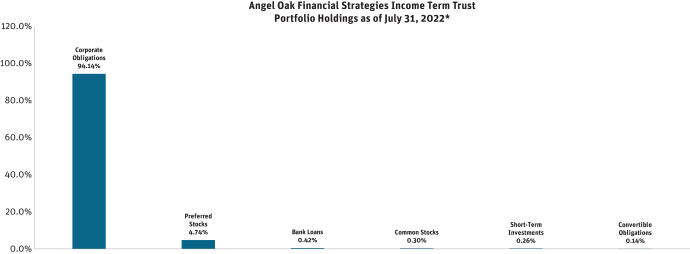
Portfolio Holdings – (Unaudited)
The investment objective of Angel Oak Financial Strategies Income Fund is to seek current income with a secondary objective of total return.
| * | As a percentage of total investments. The percentages presented in the table above may differ from those in the Schedule of Investments because the percentages in the Schedule of Investments are calculated based on net assets. |
3
Angel Oak Financial Strategies Income Term Trust
Statement of Assets and Liabilities
July 31, 2022 (Unaudited)
| | | | | |
| Assets | | | | | |
| Investments in unaffiliated securities at fair value* | | | | $581,786,495 | |
| Dividends and interest receivable | | | | 6,905,816 | |
| Prepaid expenses | | | | 31,840 | |
| | | | | |
| Total Assets | | | | 588,724,151 | |
| | | | | |
| |
| Liabilities | | | | | |
| Payable for reverse repurchase agreements | | | | 94,191,000 | |
| Payable for senior notes (net of unamortized deferred issuance costs of $876,831) | | | | 84,123,169 | |
| Interest payable for senior notes and reverse repurchase agreements | | | | 303,203 | |
| Payable to Adviser | | | | 652,751 | |
| Payable to administrator, fund accountant, and transfer agent | | | | 37,833 | |
| Payable to custodian | | | | 3,834 | |
| Other accrued expenses | | | | 63,584 | |
| | | | | |
| Total Liabilities | | | | 179,375,374 | |
| | | | | |
| Net Assets | | | | $409,348,777 | |
| | | | | |
| |
| Net Assets consist of: | | | | | |
| | | | $438,529,471 | |
| Total distributable earnings (accumulated deficit) | | | | (29,180,694 | ) |
| | | | | |
| Net Assets | | | | $409,348,777 | |
| | | | | |
| |
| Shares outstanding (unlimted number of shares authorized, no par value) | | | | 25,062,638 | |
| | | | | |
| Net asset value (“NAV”) and offering price per share | | | | $16.33 | |
| | | | | |
| |
| *Identified Cost: | | | | | |
| Investments in unaffiliated securities | | | | $593,306,277 | |
See accompanying notes which are an integral part of these financial statements.
4
Angel Oak Financial Strategies Income Term Trust
Statement of Operations
For the Period Ended July 31, 2022 (Unaudited)
| | | | | |
| Investment Income | | | | | |
| Interest | | | | $11,906,515 | |
| Dividends from unaffiliated investments | | | | 1,527,995 | |
| Dividends from affiliated investments | | | | 10,438 | |
| | | | | |
| Total Investment Income | | | | 13,444,948 | |
| | | | | |
| |
| Expenses | | | | | |
| Investment Advisory (See Note 6) | | | | 3,238,563 | |
| Interest & commissions (See Note 10) | | | | 1,738,465 | |
| Merger expense (See Note 1) | | | | 329,868 | |
| Service Fees (See Note 6) | | | | 167,925 | |
| Fund accounting | | | | 36,735 | |
| Legal | | | | 33,185 | |
| Trustee | | | | 23,985 | |
| Administration | | | | 23,524 | |
| Printing | | | | 22,094 | |
| Audit & tax | | | | 17,261 | |
| Registration | | | | 14,448 | |
| Transfer agent | | | | 10,871 | |
| Custodian | | | | 8,855 | |
| Compliance | | | | 6,335 | |
| Insurance | | | | 5,164 | |
| Miscellaneous | | | | 29,146 | |
| | | | | |
| Total Expenses | | | | 5,706,424 | |
| | | | | |
| Fees contractually waived by Adviser (See Note 6) | | | | (1,673 | ) |
| | | | | |
| Net Expenses | | | | 5,704,751 | |
| | | | | |
| Net Investment Income (Loss) | | | | $7,740,197 | |
| | | | | |
| |
| Realized and Unrealized Gain (Loss) on Investments | | | | | |
| Net realized gain (loss) on investments in unaffiliated securities | | | | ($33,733 | ) |
| Net realized gain (loss) on investments in affiliated securities | | | | (55,434 | ) |
| Net change in unrealized appreciation (depreciation) on unaffiliated investments | | | | (21,620,196 | ) |
| Net change in unrealized appreciation (depreciation) on affiliated investments | | | | (1,790 | ) |
| | | | | |
| Net realized and unrealized gain (loss) on investments | | | | (21,711,153 | ) |
| | | | | |
| Net increase (decrease) in net assets resulting from operations | | | | ($13,970,956 | ) |
| | | | | |
See accompanying notes which are an integral part of these financial statements.
5
Angel Oak Financial Strategies Income Term Trust
Statement of Cash Flows
For the Period Ended July 31, 2022 (Unaudited)
| | | | | |
| CASH FLOWS FROM OPERATING ACTIVITIES: | | | | | |
| Net (increase) decrease in net assets resulting from operations | | | | ($13,970,956 | ) |
Net adjustments to reconcile net increase in net assets from operations to net cash provided by (used in)
operating activities: | | | | | |
| Net amortization and accretion of premium and discount | | | | 415,653 | |
| Purchases of short-term investments, net | | | | 4,730,921 | |
| Purchases of investments | | | | (134,458,164 | ) |
| Proceeds from sales of long-term investments | | | | 13,736,970 | |
| Net change in unrealized appreciation (depreciation) on investments | | | | 21,621,986 | |
| Net realized gain (loss) on investments | | | | 89,167 | |
| Change in: | | | | | |
| Receivable for investments sold | | | | 4,612,743 | |
| Dividends and interest receivable | | | | (2,020,590 | ) |
| Prepaid expenses | | | | (15,778 | ) |
| Interest payable for senior notes and reverse repurchase agreements | | | | 119,646 | |
| Payable to Adviser | | | | 25,458 | |
| Payable to administrator, fund accountant and transfer agent | | | | 8,898 | |
| Payable to custodian | | | | 736 | |
| Other accrued expenses | | | | (73,305 | ) |
| | | | | |
| Net cash provided by (used in) operating activities | | | | ($105,176,615 | ) |
| | | | | |
| CASH FLOWS FROM FINANCING ACTIVITIES: | | | | | |
| Proceeds from shares sold | | | | 78,683,039 | |
| Distributions paid to shareholders | | | | (13,239,126 | ) |
| Purchases of reverse repurchase agreements | | | | 94,191,000 | |
| Proceeds from reverse repurchase agreements | | | | (54,365,000 | ) |
| Proceeds from senior notes | | | | (93,298 | ) |
| | | | | |
| Net cash provided by (used in) financing activities | | | | 105,176,615 | |
| | | | | |
| Net change in cash | | | | $— | |
| | | | | |
| CASH: | | | | | |
| Beginning Balance | | | | — | |
| | | | | |
| Ending Balance | | | | $— | |
| | | | | |
| SUPPLEMENTAL DISCLOSURES: | | | | | |
| Cash paid for interest | | | | $1,618,819 | |
| Cash held in money market investments | | | | $1,489,064 | |
See accompanying notes which are an integral part of these financial statements.
6
Angel Oak Financial Strategies Income Term Trust
Statements of Changes in Net Assets
| | | | | | | | | | |
| | | For the Period Ended
July 31, 2022
(Unaudited) | | For the Year Ended
January 31, 2022 |
| Increase (Decrease) in Net Assets due to: | | | | | | | | | | |
| Operations | | | | | | | | | | |
| Net investment income (loss) | | | | $7,740,197 | | | | | $12,231,817 | |
| Net realized gain (loss) on investment transactions and futures contracts | | | | (89,167 | ) | | | | 2,074,017 | |
| Net change in unrealized appreciation (depreciation) on investments and futures contracts | | | | (21,621,986 | ) | | | | 2,404,258 | |
| | | | | | | | | | |
| Net increase (decrease) in net assets resulting from operations | | | | (13,970,956 | ) | | | | 16,710,092 | |
| | | | | | | | | | |
| Distributions to Shareholders | | | | | | | | | | |
| Total distributions | | | | (7,740,197 | ) | | | | (12,621,982 | ) |
| Return of capital | | | | (5,478,574 | ) | | | | (8,858,520 | ) |
| | | | | | | | | | |
| Total distributions to shareholders | | | | (13,218,771 | ) | | | | (21,480,502 | ) |
| | | | | | | | | | |
| Capital Transactions | | | | | | | | | | |
| Proceeds from shares sold | | | | 78,683,039 | (a) | | | | — | |
| Proceeds from rights offering, net of offering costs | | | | — | | | | | 78,046,253 | |
| | | | | | | | | | |
| Net increase (decrease) in net assets resulting from capital transactions | | | | 78,683,039 | | | | | 78,046,253 | |
| | | | | | | | | | |
| Total Increase (Decrease) in Net Assets | | | | 51,493,312 | | | | | 73,275,843 | |
| | | | | | | | | | |
| Net Assets | | | | | | | | | | |
| Beginning of period | | | | 357,855,465 | | | | | 284,579,622 | |
| | | | | | | | | | |
| End of period | | | | $409,348,777 | | | | | $357,855,465 | |
| | | | | | | | | | |
| Share Transactions | | | | | | | | | | |
| Shares sold | | | | 4,757,307 | | | | | — | |
| Shares sold in connection with rights offering | | | | — | | | | | 5,076,333 | |
| | | | | | | | | | |
| Net increase (decrease) in share transactions | | | | 4,757,307 | | | | | 5,076,333 | |
| | | | | | | | | | |
| (a) | Includes proceeds from reorganization (see Note 1). |
See accompanying notes which are an integral part of these financial statements.
7
Angel Oak Financial Strategies Income Term Trust
Financial Highlights
(For a share outstanding during each period)
| | | | | | | | | | | | | | | | | | | | |
| | | For the
Period Ended
July 31, 2022
(Unaudited) | | For the
Year Ended
January 31,
2022 | | For the
Year Ended
January 31,
2021 | | For the
Period Ended
January 31,
2020 (a) |
| Selected Per Share Data: | | | | | | | | | | | | | | | | | | | | |
| Net asset value, beginning of period | | | | $17.62 | | | | | $18.69 | | | | | $20.53 | | | | | $20.00 | |
| | | | | | | | | | | | | | | | | | | | |
| | | | |
| Income from investment operations: | | | | | | | | | | | | | | | | | | | | |
| Net investment income (loss) | | | | 0.38 | | | | | 0.73 | (g) | | | | 0.82 | | | | | 0.55 | |
| Net realized and unrealized gain (loss) on investments | | | | (1.02 | ) | | | | 0.37 | | | | | (1.41 | ) | | | | 0.80 | |
| | | | | | | | | | | | | | | | | | | | |
| Total from investment operations | | | | (0.64 | ) | | | | 1.10 | | | | | (0.59 | ) | | | | 1.35 | |
| | | | | | | | | | | | | | | | | | | | |
| Less distributions to shareholders: | | | | | | | | | | | | | | | | | | | | |
| From net investment income | | | | (0.38 | ) | | | | (0.77 | ) | | | | (0.79 | ) | | | | (0.67 | ) |
| Return of capital | | | | (0.27 | ) | | | | (0.54 | ) | | | | (0.46 | ) | | | | (0.15 | ) |
| | | | | | | | | | | | | | | | | | | | |
| Total distributions | | | | (0.65 | ) | | | | (1.31 | ) | | | | (1.25 | ) | | | | (0.82 | ) |
| | | | | | | | | | | | | | | | | | | | |
| Capital share transactions: | | | | | | | | | | | | | | | | | | | | |
| Dilution due to rights offering | | | | – | | | | | (0.84 | )(h) | | | | – | | | | | – | |
| Offering costs due to rights offering | | | | – | | | | | (0.02 | )(h) | | | | – | | | | | – | |
| | | | | | | | | | | | | | | | | | | | |
| Total capital share transactions | | | | – | | | | | (0.86 | ) | | | | – | | | | | – | |
| | | | | | | | | | | | | | | | | | | | |
| | | | |
| Net asset value, end of period | | | | $16.33 | | | | | $17.62 | | | | | $18.69 | | | | | $20.53 | |
| | | | | | | | | | | | | | | | | | | | |
| | | | |
| Total return on net asset value (b)(c) | | | | (3.63 | %) | | | | 1.11 | % | | | | (2.71 | %) | | | | 6.89 | % |
| Total return on market value (b)(d) | | | | (6.63 | %) | | | | 2.99 | % | | | | (12.70 | %) | | | | 10.86 | % |
| | | | |
| Ratios and Supplemental Data: | | | | | | | | | | | | | | | | | | | | |
| Net assets, end of period (000’s omitted) | | | | $409,3 | 49 | | | | $357,8 | 55 | | | | $284,5 | 80 | | | | $236,4 | 62 |
| Ratio of expenses to average net assets before waiver and reimbursement/recoupment (e) | | | | 3.37 | % | | | | 3.22 | % | | | | 3.34 | % | | | | 2.41 | % |
| Ratio of expenses to average net assets before waiver and reimbursement/recoupment excluding interest expense (e) | | | | 2.15 | % | | | | 2.18 | % | | | | 2.25 | % | | | | 1.93 | % |
| Ratio of expenses to average net assets after waiver and reimbursement/recoupment (e) | | | | 3.37 | % | | | | 3.27 | % | | | | 3.20 | % | | | | 1.91 | % |
| Ratio of expenses to average net assets after waiver and reimbursement/recoupment excluding interest expense (e) | | | | 2.15 | % | | | | 2.23 | % | | | | 2.11 | % | | | | 1.43 | % |
| Ratio of expenses to average managed assets after waiver and reimbursement/recoupment excluding interest expense. Average managed assets represent the total assets of the fund, including the assets attributable to the proceeds from any forms of financial leverage, less liabilities, other than liabilites related to any form of leverage (e) | | | | 1.52 | % | | | | 1.59 | % | | | | 1.50 | % | | | | 1.25 | % |
| Ratio of net investment income (loss) to average net assets before waiver and reimbursement/recoupment (e) | | | | 4.58 | % | | | | 4.02 | % | | | | 4.05 | % | | | | 3.58 | % |
| Ratio of net investment income (loss) to average net assets after waiver and reimbursement/recoupment (e) | | | | 4.58 | % | | | | 3.97 | % | | | | 4.19 | % | | | | 4.08 | % |
| Portfolio turnover rate (b) | | | | 2.81 | % | | | | 13.82 | % | | | | 24.55 | % | | | | 21.14 | % |
| Credit facility and reverse repurchase agreements, end of period (000s) | | | | $178,3 | 14 | | | | $138,5 | 81 | | | | $116,3 | 63 | | | | $81,51 | 4 |
| Asset coverage per $1,000 unit of senior indebtedness (f) | | | | $3,29 | 6 | | | | $3,58 | 2 | | | | $3,44 | 6 | | | | $3,90 | 1 |
| (a) | | Fund commenced operations on May 31, 2019. |
| (b) | | Not annualized for periods less than one year. |
| (c) | | Total return on net asset value is computed based upon the net asset value of common stock on the first business day and the closing net asset value on the last business day of the period. Dividends and distributions are assumed to be reinvested at the prices obtained under the Fund’s dividend reinvestment plan. |
| (d) | | Total return on market value is computed based upon the New York Stock Exchange market price of the Fund’s shares and includes the effect of brokerage commissions. Dividends and distributions are assumed to be reinvested at the prices obtained under the Fund’s dividend reinvestment plan. |
| (e) | | Annualized for periods less than one year. |
| (f) | | Calculated by subtracting the Fund’s total liabilities (not including borrowings) from the Fund’s total assets and dividing by the total number of senior indebtedness units, where one unit equals $1,000 of senior indebtedness. |
| (g) | | Net investment income/(loss) per share has been calculated based on average shares outstanding during the period. |
| (h) | | Amount represents per share impact related to a rights offering. See Note 11. |
See accompanying notes which are an integral part of these financial statements.
8
Angel Oak Financial Strategies Income Term Trust
Schedule of Investments
July 31, 2022 (Unaudited)
| | | | | | | | | | |
| | | Principal
Amount | | Value |
| Bank Loans – 0.59% | | | | | | | | | | |
| BJ Services LLC, 0.000%, 1/28/2023 | | | | $1,200,584 | | | | | $1,128,549 | |
| JUUL Term Loan, 8.500% (3 Month LIBOR USD + 9.000%), 8/2/2023 (a) | | | | 926,000 | | | | | 851,920 | |
| Premier Brands, 9.006% (3 Month LIBOR USD + 8.250%), 3/20/2024 (a) | | | | 472,568 | | | | | 453,665 | |
| | | | | | | | | | |
| | |
TOTAL BANK LOANS
(Cost – $2,596,341) | | | | | | | | | $2,434,134 | |
| | | | | | | | | | |
| | |
| | Shares | | |
| Financial – 0.43% | | | | | | | | | | |
| AGNC Investment Corp. | | | | 30,500 | | | | | 384,605 | |
| Annaly Capital Management, Inc. | | | | 60,000 | | | | | 412,800 | |
| Ellington Financial, Inc. | | | | 15,750 | | | | | 252,787 | |
| New Residential Investment Corp. | | | | 25,000 | | | | | 272,750 | |
| PennyMac Mortgage Investment Trust | | | | 13,000 | | | | | 199,680 | |
| Redwood Trust, Inc. | | | | 25,750 | | | | | 222,995 | |
| | | | | | | | | | |
| | |
TOTAL COMMON STOCKS
(Cost – $2,020,603) | | | | | | | | | $1,745,617 | |
| | | | | | | | | | |
| | |
Convertible Obligations – 0.21% | | Principal
Amount | | |
| Financial – 0.21% | | | | | | | | | | |
| FedNat Holding Co., 5.000%, 4/19/2026 (b) | | | | $1,000,000 | | | | | 840,000 | |
| | | | | | | | | | |
| | |
TOTAL CONVERTIBLE OBLIGATIONS
(Cost – $1,000,000) | | | | | | | | | $840,000 | |
| | | | | | | | | | |
| Corporate Obligations – 133.80% | | | | | | | | | | |
| Financial – 133.80% | | | | | | | | | | |
| A10 Capital LLC, 5.875%, 8/17/2026 (b) | | | | 4,000,000 | | | | | 3,839,848 | |
| Allegiance Bancshares, Inc., 4.700% (SOFR + 3.392%), 10/1/2029 (a)(c) | | | | 1,750,000 | | | | | 1,757,338 | |
| Alpine Banks of Colorado, 5.875% (TSFR3M + 5.690%), 6/15/2030 (a)(b)(c) | | | | 4,000,000 | | | | | 4,071,921 | |
| Amalgamated Financial Corp., 3.250% (TSFR3M + 2.300%), 11/15/2031 (a) | | | | 2,600,000 | | | | | 2,415,755 | |
| Ameris Bancorp, 5.445% (3 Month LIBOR USD + 3.616%), 3/15/2027 (a) | | | | 2,510,000 | | | | | 2,513,193 | |
| Ameris Bancorp, 4.250% (TSFR3M + 2.940%), 12/15/2029 (a)(c) | | | | 2,250,000 | | | | | 2,219,128 | |
| Amur Equipment Finance, Inc., 6.125%, 3/15/2026 (b) | | | | 1,500,000 | | | | | 1,446,451 | |
| ANB Corp., 4.000% (TSFR3M + 3.875%), 9/30/2030 (a)(b)(c) | | | | 2,500,000 | | | | | 2,420,811 | |
| Arbor Realty Trust, Inc., 5.000%, 4/30/2026 | | | | 2,000,000 | | | | | 1,808,036 | |
| Arbor Realty Trust, Inc., 4.500%, 3/15/2027 (b) | | | | 1,500,000 | | | | | 1,315,857 | |
| Arena Finance LLC, 6.750%, 9/30/2025 (b)(c) | | | | 2,000,000 | | | | | 1,962,500 | |
| Avidbank Holdings, Inc., 5.000% (TSFR3M + 3.595%), 12/30/2029 (a)(b)(c) | | | | 6,000,000 | | | | | 5,935,676 | |
| B. Riley Financial, Inc., 6.375%, 2/28/2025 (d) | | | | 1,000,000 | | | | | 995,200 | |
| B. Riley Financial, Inc., 6.500%, 9/30/2026 (d) | | | | 298,650 | | | | | 294,708 | |
| B. Riley Financial, Inc., 5.500%, 3/31/2026 (d) | | | | 1,000,000 | | | | | 976,000 | |
| B. Riley Financial, Inc., 5.000%, 12/31/2026 (d) | | | | 2,000,000 | | | | | 1,864,000 | |
| B. Riley Financial, Inc., 6.000%, 1/31/2028 (d) | | | | 3,000,000 | | | | | 2,769,600 | |
| Banc of California, Inc., 5.250%, 4/15/2025 (c) | | | | 3,000,000 | | | | | 3,001,439 | |
| Bancorp Bank, 4.750%, 8/15/2025 (c) | | | | 1,500,000 | | | | | 1,486,627 | |
| BancPlus Corp., 6.000% (TSFR3M + 5.860%), 6/15/2030 (a)(b)(c) | | | | 5,000,000 | | | | | 5,106,373 | |
| Bank of California, 4.375% (SOFR + 4.195%), 10/30/2030 (a)(c) | | | | 1,675,000 | | | | | 1,598,700 | |
See accompanying notes which are an integral part of these financial statements.
9
Angel Oak Financial Strategies Income Term Trust
Schedule of Investments – (continued)
July 31, 2022 (Unaudited)
| | | | | | | | | | |
| | | Principal
Amount | | Value |
| Corporate Obligations – (continued) | | | | | | | | | | |
| Financial – (continued) | | | | | | | | | | |
| Bank of Commerce Holdings, 6.671% (3 Month LIBOR USD + 5.260%), 12/10/2025 (a)(b) | | | | $6,500,000 | | | | | $6,504,980 | |
| BankGuam Holding Co., 6.350% (3 Month LIBOR USD + 4.660%), 6/30/2029 (a) | | | | 9,000,000 | | | | | 8,970,474 | |
| BankGuam Holding Co., 4.750% (TSFR3M + 4.130%), 7/1/2031 (a)(b) | | | | 3,000,000 | | | | | 2,868,259 | |
| Banksouth Holding Co., 5.875% (3 Month LIBOR USD + 4.020%), 7/30/2029 (a)(b) | | | | 5,000,000 | | | | | 4,985,828 | |
| Banterra Bank, 6.000% (3 Month LIBOR USD + 4.120%), 6/7/2029 (a) | | | | 7,500,000 | | | | | 7,496,406 | |
| Bar Harbor Bankshares, 4.625% (TSFR3M + 3.270%), 12/1/2029 (a)(c) | | | | 6,000,000 | | | | | 5,914,656 | |
| BayCom Corp., 5.250% (SOFR + 5.210%), 9/15/2030 (a)(c) | | | | 2,000,000 | | | | | 1,980,612 | |
| BayFirst Financial Corp., 4.500% (SOFRINDX + 3.780%), 6/30/2031 (a)(b) | | | | 1,000,000 | | | | | 946,392 | |
| Berkshire Hills Bancorp, Inc., 5.500% (SOFR + 2.490%), 7/1/2032 (a) | | | | 1,000,000 | | | | | 1,017,365 | |
| Big Poppy Holdings, Inc., 6.500%, 7/1/2027 | | | | 3,500,000 | | | | | 3,500,000 | |
| Business Development Corp. of America, 4.750%, 12/30/2022 (b) | | | | 6,000,000 | | | | | 5,974,720 | |
| Business Development Corp. of America, 4.850%, 12/15/2024 (b)(c) | | | | 2,000,000 | | | | | 1,930,897 | |
| Byline Bancorp, Inc., 6.000% (TSFR3M + 5.880%), 7/1/2030 (a)(c) | | | | 6,000,000 | | | | | 6,178,632 | |
| Cadence Bancorp, 4.750% (3 Month LIBOR USD + 3.030%), 6/30/2029 (a)(c) | | | | 2,000,000 | | | | | 1,958,288 | |
| Capstar Financial Holdings, Inc., 5.250% (SOFR + 5.130%), 6/30/2030 (a)(c) | | | | 3,000,000 | | | | | 2,975,137 | |
| CB Financial Services, Inc., 3.875% (TSFR3M + 2.800%), 12/15/2031 (a)(b) | | | | 6,000,000 | | | | | 5,619,036 | |
| CB&T Holding Corp., 6.250% (TSFR3M + 6.015%), 12/15/2030 (a)(b) | | | | 5,000,000 | | | | | 5,100,000 | |
| Central Bancshares, Inc., 5.750% (3 Month LIBOR USD + 3.870%), 6/30/2029 (a)(b) | | | | 5,000,000 | | | | | 4,983,349 | |
| Central Pacific Financial Corp., 4.750% (TSFR3M + 4.560%), 11/1/2030 (a) | | | | 1,000,000 | | | | | 983,982 | |
| Citizens Community Bancorp, Inc., 6.000% (SOFR + 5.910%), 9/1/2030 (a)(b) | | | | 2,000,000 | | | | | 1,992,129 | |
| Citizens Community Bancorp, Inc., 4.750% (TSFR3M + 3.290%), 4/1/2032 (a)(b) | | | | 1,500,000 | | | | | 1,474,457 | |
| Clear Blue Financial Holdings LLC, 5.375%, 12/30/2028 (b)(c) | | | | 10,000,000 | | | | | 10,251,903 | |
| Clear Street Capital LLC, 6.000%, 10/15/2025 (b)(c) | | | | 5,000,000 | | | | | 4,956,441 | |
| CoastalSouth Bancshares, Inc., 5.950% (TSFR3M + 5.820%), 9/15/2030 (a)(b) | | | | 2,000,000 | | | | | 1,989,181 | |
| Colony Bankcorp, Inc., 5.250% (SOFRINDX + 5.250%), 5/20/2032 (a)(b) | | | | 1,000,000 | | | | | 988,065 | |
| Commercial Credit Group, Inc., 4.875%, 5/30/2026 (b)(c) | | | | 1,500,000 | | | | | 1,405,623 | |
| Community Financial Corp., 4.750% (TSFR3M + 4.580%), 10/15/2030 (a) | | | | 1,000,000 | | | | | 984,200 | |
Community Heritage Financial, Inc., 5.750% (3 Month LIBOR USD + 4.395%),
10/30/2029 (a)(b) | | | | 4,500,000 | | | | | 4,482,403 | |
| Congressional Bancshares, Inc., 5.750% (TSFR3M + 4.390%), 12/1/2029 (a)(b) | | | | 2,000,000 | | | | | 1,991,907 | |
| ConnectOne Bancorp, Inc., 5.200% (3 Month LIBOR USD + 2.840%), 2/1/2028 (a) | | | | 500,000 | | | | | 499,973 | |
| ConnectOne Bancorp, Inc., 5.750% (TSFR3M + 5.605%), 6/15/2030 (a)(c) | | | | 2,000,000 | | | | | 2,029,366 | |
| Cowen, Inc., 7.250%, 5/6/2024 (b)(c) | | | | 7,000,000 | | | | | 7,114,690 | |
| CRB Group, Inc., 6.500% (TSFR3M + 6.380%), 9/1/2030 (a)(b)(c) | | | | 3,750,000 | | | | | 3,808,251 | |
| Customers Bancorp, Inc., 2.875% (TSFR3M + 2.350%), 8/15/2031 (a) | | | | 1,000,000 | | | | | 917,151 | |
| Customers Bank, 6.125% (3 Month LIBOR USD + 3.443%), 6/26/2029 (a)(b)(c) | | | | 4,500,000 | | | | | 4,538,904 | |
| Dime Community Bancshares, Inc., 5.000% (TSFR3M + 2.180%), 5/15/2032 (a) | | | | 1,250,000 | | | | | 1,240,888 | |
| Durant Bancorp, Inc., 5.571% (3 Month LIBOR USD + 3.742%), 3/15/2027 (a)(b) | | | | 1,200,000 | | | | | 1,199,425 | |
| EF Holdco, Inc. / EF Cayman Holdings Ltd., 5.500%, 9/1/2022 (b) | | | | 4,000,000 | | | | | 3,996,117 | |
| EF Holdco, Inc. / EF Cayman Holdings Ltd., 5.875%, 4/1/2027 (b)(c) | | | | 5,000,000 | | | | | 4,705,949 | |
| Enterprise Bancorp, Inc., 5.250% (TSFR3M + 5.175%), 7/15/2030 (a) | | | | 3,500,000 | | | | | 3,515,058 | |
| Equity Bancshares, Inc., 7.000% (TSFR3M + 6.880%), 6/30/2030 (a)(c) | | | | 9,000,000 | | | | | 9,251,113 | |
| Evans Bancorp, Inc., 6.000% (SOFR + 5.900%), 7/15/2030 (a)(c) | | | | 4,000,000 | | | | | 4,076,630 | |
| FedNat Holding Co., 7.750%, 3/15/2029 (c) | | | | 7,000,000 | | | | | 6,440,000 | |
| Fidelity Bank, 5.875% (3 Month LIBOR USD + 3.630%), 5/31/2030 (a)(c) | | | | 12,000,000 | | | | | 12,181,291 | |
| Fidelity Federal Bancorp, 6.000% (TSFR3M + 4.650%), 11/1/2029 (a)(b)(c) | | | | 2,000,000 | | | | | 1,998,628 | |
| Fidelity Federal Bancorp, 4.500% (TSFR3M + 3.840%), 3/30/2031 (a)(b)(c) | | | | 1,000,000 | | | | | 950,327 | |
| Fidelity Financial Corp., 5.000% (TSFR3M + 2.470%), 4/30/2032 (a)(b) | | | | 5,000,000 | | | | | 4,964,434 | |
| Financial Institutions, Inc., 4.375% (TSFR3M + 4.265%), 10/15/2030 (a) | | | | 3,000,000 | | | | | 2,937,019 | |
See accompanying notes which are an integral part of these financial statements.
10
Angel Oak Financial Strategies Income Term Trust
Schedule of Investments – (continued)
July 31, 2022 (Unaudited)
| | | | | | | | | | |
| | | Principal
Amount | | Value |
| Corporate Obligations – (continued) | | | | | | | | | | |
| Financial – (continued) | | | | | | | | | | |
| FineMark Holdings, Inc., 5.875% (3 Month LIBOR USD + 2.970%), 6/30/2028 (a) | | | | $2,000,000 | | | | | $2,013,732 | |
| First Bancshares, Inc., 4.250% (TSFR3M + 4.126%), 10/1/2030 (a) | | | | 1,000,000 | | | | | 975,616 | |
| First Bank, 5.500% (TSFR3M + 5.380%), 6/1/2030 (a) | | | | 1,500,000 | | | | | 1,508,058 | |
| First Business Financial Services, Inc., 5.500% (SOFR + 4.332%), 8/15/2029 (a)(b)(c) | | | | 11,000,000 | | | | | 10,938,417 | |
| First Help Financial LLC, 6.000%, 11/15/2026 (b) | | | | 5,000,000 | | | | | 4,805,420 | |
| First Internet Bancorp, 6.000% (3 Month LIBOR USD + 4.114%), 6/30/2029 (a)(d) | | | | 7,427,800 | | | | | 7,398,089 | |
| First Midwest Capital Trust, 6.950%, 12/1/2033 | | | | 1,761,000 | | | | | 1,743,390 | |
| First Northwest Bancorp, 3.750% (SOFR + 3.000%), 3/30/2031 (a) | | | | 1,000,000 | | | | | 949,436 | |
| First Paragould Bankshares, Inc., 5.250% (3 Month LIBOR USD + 3.095%), 12/15/2027 (a)(b) | | | | 2,250,000 | | | | | 2,246,585 | |
| First Southwest Corp., 6.350% (3 Month LIBOR USD + 4.080%), 6/1/2029 (a)(b) | | | | 7,000,000 | | | | | 6,978,485 | |
| FirstBank, 4.500% (SOFR + 4.390%), 9/1/2030 (a)(c) | | | | 4,500,000 | | | | | 4,424,928 | |
| Firstsun Capital Bancorp, 6.000% (TSFR3M + 5.890%), 7/1/2030 (a)(b)(c) | | | | 6,500,000 | | | | | 6,595,741 | |
| Flagstar Bancorp, Inc., 4.125% (SOFR + 3.910%), 11/1/2030 (a)(c) | | | | 2,000,000 | | | | | 1,943,888 | |
| Flushing Financial Corp., 3.125% (TSFR3M + 2.035%), 12/1/2031 (a) | | | | 2,000,000 | | | | | 1,842,625 | |
| Georgia Banking Co., Inc., 4.125% (TSFR3M + 3.400%), 6/15/2031 (a)(b) | | | | 1,000,000 | | | | | 943,013 | |
| Golden Pear Funding HoldCo LLC, 6.375%, 12/22/2026 | | | | 5,000,000 | | | | | 4,870,537 | |
| Golden State Bancorp, 4.500% (TSFR3M + 3.350%), 12/15/2031 (a)(b) | | | | 1,000,000 | | | | | 942,255 | |
| Hallmark Financial Services, Inc., 6.250%, 8/15/2029 | | | | 9,382,000 | | | | | 8,490,710 | |
| Hanmi Financial Corp., 3.750% (TSFR3M + 3.100%), 9/1/2031 (a) | | | | 3,500,000 | | | | | 3,319,809 | |
| Happy Bancshares, Inc., 5.500% (TSFR3M + 5.345%), 7/31/2030 (a)(b) | | | | 4,500,000 | | | | | 4,549,977 | |
| HBT Financial, Inc., 4.500% (TSFR3M + 4.370%), 9/15/2030 (a)(b)(c) | | | | 3,000,000 | | | | | 2,924,069 | |
| Hilltop Holdings, Inc., 6.125% (TSFR3M + 5.800%), 5/15/2035 (a) | | | | 250,000 | | | | | 264,911 | |
| HomeStreet, Inc., 3.500% (TSFR3M + 2.150%), 1/30/2032 (a)(c) | | | | 3,000,000 | | | | | 2,800,711 | |
| Horizon Bancorp, Inc., 5.625% (TSFR3M + 5.490%), 7/1/2030 (a) | | | | 2,000,000 | | | | | 2,020,495 | |
| Independent Bank Corp., 5.950% (TSFR3M + 5.825%), 5/31/2030 (a)(b) | | | | 1,000,000 | | | | | 1,017,045 | |
| Independent Bank Group, Inc., 4.000% (TSFR3M + 3.885%), 9/15/2030 (a)(c) | | | | 3,000,000 | | | | | 2,990,404 | |
| Investar Holding Corp., 5.125% (SOFR + 3.752%), 12/30/2029 (a)(b) | | | | 4,000,000 | | | | | 3,955,212 | |
| Kingstone Cos, Inc., 5.500%, 12/30/2022 | | | | 5,195,000 | | | | | 5,127,660 | |
| Level One Bancorp, Inc., 4.750% (TSFR3M + 3.110%), 12/18/2029 (a) | | | | 2,000,000 | | | | | 1,969,683 | |
| Limestone Bancorp, Inc., 5.750% (3 Month LIBOR USD + 3.950%), 7/31/2029 (a)(b) | | | | 5,000,000 | | | | | 4,982,125 | |
| Luther Burbank Corp., 6.500%, 9/30/2024 (b)(c) | | | | 5,000,000 | | | | | 4,954,931 | |
| Malvern Bancorp, Inc., 5.556% (12 Month LIBOR USD + 4.145%), 2/15/2027 (a) | | | | 1,250,000 | | | | | 1,249,864 | |
| Maple Financial Holdings, Inc., 5.000% (TSFR3M + 4.670%), 2/15/2031 (a)(b) | | | | 2,000,000 | | | | | 1,920,378 | |
| Marble Point Loan Financing Ltd. / MPLF Funding I LLC, 7.500%, 10/16/2025 (b)(c) | | | | 1,500,000 | | | | | 1,550,588 | |
| Mercantile Bank Corp., 3.250% (SOFR + 2.120%), 1/30/2032 (a) | | | | 1,500,000 | | | | | 1,385,994 | |
| Meridian Corp., 5.375% (TSFR3M + 3.950%), 12/30/2029 (a)(c) | | | | 4,000,000 | | | | | 3,920,998 | |
| MidWestOne Financial Group, Inc., 5.750% (TSFR3M + 5.680%), 7/30/2030 (a)(c) | | | | 5,000,000 | | | | | 5,076,719 | |
| Millennium Consolidated Holdings LLC, 7.500%, 6/30/2023 (b) | | | | 2,000,000 | | | | | 2,001,371 | |
| Nano Financial Holdings, Inc., 7.000%, 7/1/2024 (b) | | | | 5,000,000 | | | | | 4,957,740 | |
National Bank of Indianapolis Corp., 5.500% (3 Month LIBOR USD + 4.209%),
9/15/2029 (a)(b) | | | | 7,000,000 | | | | | 6,958,996 | |
| NexBank Capital, Inc., 4.000% (TSFR3M + 3.390%), 8/15/2031 (a)(b) | | | | 2,000,000 | | | | | 1,897,800 | |
| NexBank Capital, Inc., 6.000%, 7/15/2032 (b) | | | | 1,500,000 | | | | | 1,534,437 | |
| Northern Bancorp, Inc., 4.750% (TSFR3M + 3.275%), 12/30/2029 (a)(b) | | | | 4,000,000 | | | | | 3,939,234 | |
| Northpointe Bancshares, Inc., 6.000% (TSFR3M + 4.905%), 9/30/2029 (a)(b)(c) | | | | 4,000,000 | | | | | 3,997,468 | |
| Northwest Bancshares, Inc., 4.000% (TSFR3M + 3.890%), 9/15/2030 (a) | | | | 1,000,000 | | | | | 958,173 | |
| Oakstar Bancshares, Inc., 4.250% (TSFR3M + 3.516%), 4/15/2031 (a)(b) | | | | 1,000,000 | | | | | 949,541 | |
| Obsidian Insurance Holdings, Inc., 6.500%, 12/30/2025 (b)(c) | | | | 5,000,000 | | | | | 4,900,000 | |
| Ohio National Financial Services, Inc., 6.625%, 5/1/2031 (b)(c) | | | | 6,000,000 | | | | | 6,192,129 | |
See accompanying notes which are an integral part of these financial statements.
11
Angel Oak Financial Strategies Income Term Trust
Schedule of Investments – (continued)
July 31, 2022 (Unaudited)
| | | | | | | | | | |
| | | Principal
Amount | | Value |
| Corporate Obligations – (continued) | | | | | | | | | | |
| Financial – (continued) | | | | | | | | | | |
| Olney Bancshares of Texas, Inc., 4.000% (TSFR3M + 3.320%), 3/15/2031 (a)(b) | | | | $1,000,000 | | | | | $942,379 | |
| Origin Bank, 4.250% (3 Month LIBOR USD + 2.820%), 2/15/2030 (a) | | | | 2,500,000 | | | | | 2,467,920 | |
| Pacific Premier Bancorp, Inc., 5.375% (TSFR3M + 5.170%), 6/15/2030 (a)(c) | | | | 5,000,000 | | | | | 5,030,619 | |
| Pacific Western Bank, 3.250% (TSFR3M + 2.520%), 5/1/2031 (a) | | | | 2,000,000 | | | | | 1,865,500 | |
| PCAP Holdings LP, 6.500%, 7/15/2028 (b)(c)(e) | | | | 2,000,000 | | | | | 1,860,000 | |
| PhenixFIN Corp., 5.250%, 11/1/2028 (d) | | | | 1,750,000 | | | | | 1,638,000 | |
| Piedmont Bancorp, Inc., 5.750% (TSFR3M + 5.615%), 9/1/2030 (a)(b) | | | | 2,500,000 | | | | | 2,472,831 | |
| Preferred Bank, 3.375% (TSFR3M + 2.780%), 6/15/2031 (a) | | | | 2,500,000 | | | | | 2,297,918 | |
| Premia Holdings Ltd., 6.900%, 9/23/2030 (b)(e) | | | | 9,000,000 | | | | | 9,090,000 | |
| Primis Financial Corp., 5.400% (TSFR3M + 5.310%), 9/1/2030 (a)(c) | | | | 2,000,000 | | | | | 2,006,068 | |
| Queensborough Co., 6.000% (TSFR3M + 5.880%), 10/15/2030 (a)(b) | | | | 3,000,000 | | | | | 3,042,960 | |
| RBB Bancorp, 4.000% (TSFR3M + 3.290%), 4/1/2031 (a) | | | | 1,500,000 | | | | | 1,412,323 | |
| Ready Capital Corp., 6.200%, 7/30/2026 (d) | | | | 5,491,700 | | | | | 5,304,982 | |
| Ready Capital Corp., 5.750%, 2/15/2026 (d) | | | | 2,000,000 | | | | | 1,910,400 | |
| Reliant Bancorp, Inc., 5.125% (TSFR3M + 3.765%), 12/15/2029 (a) | | | | 1,000,000 | | | | | 988,900 | |
| River Financial Corp., 4.000% (TSFR3M + 3.420%), 3/15/2031 (a)(b) | | | | 1,000,000 | | | | | 942,382 | |
| Salisbury Bancorp, Inc., 3.500% (SOFR + 2.800%), 3/31/2031 (a) | | | | 1,000,000 | | | | | 944,713 | |
| SCRE Intermediate Holdco LLC, 6.500%, 2/15/2027 (b) | | | | 2,000,000 | | | | | 1,876,304 | |
| Signature Bank, 4.125% (3 Month LIBOR USD + 2.559%), 11/1/2029 (a) | | | | 250,000 | | | | | 244,198 | |
| Silver Queen Financial Services, Inc., 5.500% (3 Month LIBOR USD + 3.338%), 12/1/2027 (a)(b)(c) | | | | 3,800,000 | | | | | 3,795,713 | |
| SmartFinancial, Inc., 5.625% (3 Month LIBOR USD + 2.550%), 10/2/2028 (a)(b)(c) | | | | 2,190,000 | | | | | 2,199,871 | |
| South Street Securities Funding LLC, 6.250%, 12/30/2026 (b) | | | | 6,000,000 | | | | | 5,816,618 | |
| Southern Financial Corp., 4.875% (TSFR3M + 3.930%), 10/20/2031 (a)(b) | | | | 1,500,000 | | | | | 1,436,640 | |
| Spirit of Texas Bancshares, Inc., 6.000% (TSFR3M + 5.920%), 7/31/2030 (a)(b) | | | | 5,000,000 | | | | | 5,069,056 | |
| Sterling Bancorp, 3.875% (TSFR3M + 3.690%), 11/1/2030 (a)(c) | | | | 1,000,000 | | | | | 987,315 | |
| Sterling Bancorp, Inc., 8.332% (3 Month LIBOR USD + 5.820%), 4/15/2026 (a)(b) | | | | 2,700,000 | | | | | 2,700,837 | |
| Sterling Bancorp, Inc., 4.000% (TSFR3M + 2.530%), 12/30/2029 (a) | | | | 200,000 | | | | | 194,526 | |
| Summit Financial Group, Inc., 3.250% (TSFR3M + 2.300%), 12/1/2031 (a) | | | | 2,000,000 | | | | | 1,852,427 | |
| Texas State Bankshares, Inc., 5.750% (3 Month LIBOR USD + 3.550%), 6/15/2029 (a)(b) | | | | 4,000,000 | | | | | 3,986,850 | |
| Transverse Insurance Group LLC, 6.000%, 12/15/2026 (b) | | | | 5,000,000 | | | | | 4,705,717 | |
| Trinitas Capital Management LLC, 6.000%, 7/30/2026 (b) | | | | 6,000,000 | | | | | 5,727,090 | |
| Trinity Capital, Inc., 7.000%, 1/16/2025 (d) | | | | 7,500,000 | | | | | 7,350,000 | |
| Triumph Bancorp, Inc., 4.875% (SOFR + 3.592%), 11/27/2029 (a)(c) | | | | 11,000,000 | | | | | 10,921,670 | |
| Tulsa Valley Bancshares Corp., 5.000% (TSFR3M + 4.210%), 4/15/2031 (a)(b) | | | | 1,250,000 | | | | | 1,198,064 | |
| United Insurance Holdings Corp., 6.250%, 12/15/2027 | | | | 6,170,000 | | | | | 6,027,909 | |
| Universal Insurance Holdings, Inc., 5.625%, 11/30/2026 | | | | 7,000,000 | | | | | 6,766,990 | |
| US Metro Bancorp, Inc., 5.650% (TSFR3M + 5.430%), 11/1/2030 (a)(b)(c) | | | | 3,000,000 | | | | | 2,942,903 | |
| VCT Holdings LLC, 6.000%, 12/30/2026 (b) | | | | 5,000,000 | | | | | 4,743,559 | |
| Velocity Commercial Capital LLC, 7.125%, 3/15/2027 (b) | | | | 3,000,000 | | | | | 2,846,268 | |
| Veritex Holdings, Inc., 4.750% (TSFR3M + 3.470%), 11/15/2029 (a) | | | | 1,750,000 | | | | | 1,724,643 | |
| Volunteer State Bancshares, Inc., 5.750% (TSFR3M + 4.365%), 11/15/2029 (a)(b) | | | | 2,000,000 | | | | | 2,015,055 | |
| VyStar Credit Union, 4.250%, 3/15/2032 (b) | | | | 3,000,000 | | | | | 2,886,740 | |
| White River Bancshares Co., 5.875% (TSFR3M + 4.420%), 12/31/2029 (a)(b) | | | | 5,000,000 | | | | | 4,981,910 | |
| Wintrust Financial Corp., 4.850%, 6/6/2029 | | | | 5,000,000 | | | | | 4,985,779 | |
| WT Holdings, Inc., 7.000%, 4/30/2023 (b) | | | | 2,700,000 | | | | | 2,676,712 | |
| Zais Group LLC, 7.000%, 11/15/2023 (b) | | | | 402,800 | | | | | 395,578 | |
| | | | | | | | | | |
| | |
TOTAL CORPORATE OBLIGATIONS
(Cost – $556,414,187) | | | | | | | | | $547,723,921 | |
| | | | | | | | | | |
See accompanying notes which are an integral part of these financial statements.
12
Angel Oak Financial Strategies Income Term Trust
Schedule of Investments – (continued)
July 31, 2022 (Unaudited)
| | | | | | | | | | |
| | |
| | Shares | | Value |
| Financial – 3.56% | | | | | | | | | | |
| Atlantic Union Bankshares Corp., 6.875% | | | | 20,000 | | | | | $511,800 | |
| B. Riley Financial, Inc., 7.375% | | | | 40,000 | | | | | 1,032,800 | |
| Clear Street Group, Inc., 7.000% (b)(e)(f) | | | | 80,000 | | | | | 1,880,000 | |
| CNB Financial Corp., 7.125% | | | | 40,000 | | | | | 1,046,800 | |
| Dime Community Bancshares, Inc., 5.500% | | | | 25,000 | | | | | 522,750 | |
| First Citizens BancShares, Inc., 5.375% | | | | 140,000 | | | | | 3,207,400 | |
| First Merchants Corp., 7.500% | | | | 40,000 | | | | | 1,046,000 | |
| Northpointe Bancshares, Inc., 8.250% (SOFR + 7.990%) (a)(b) | | | | 80,000 | | | | | 1,941,200 | |
| OceanFirst Financial Corp., 7.000% (SOFR + 6.845%) (a) | | | | 19,500 | | | | | 504,075 | |
| PacWest Bancorp, 7.750% (H15T5Y + 4.820%) (a) | | | | 20,000 | | | | | 518,000 | |
| Raymond James Financial, Inc., 6.750% (3 Month LIBOR USD + 3.985%) (a) | | | | 37,374 | | | | | 956,774 | |
| United Community Banks, Inc., 6.875% | | | | 20,000 | | | | | 520,000 | |
| United Fidelity Bank, 7.000% (b)(e) | | | | 1,000 | | | | | 892,000 | |
| | | | | | | | | | |
| | |
| | | | | | | | | 14,579,599 | |
| | | | | | | | | | |
| Real Estate Investment Trust – 3.17% | | | | | | | | | | |
| AGNC Investment Corp., 7.000% (3 Month LIBOR + 5.111%) (a) | | | | 40,000 | | | | | 968,400 | |
| Annaly Capital Management, Inc., 6.950% (3 Month LIBOR + 4.993%) (a) | | | | 40,000 | | | | | 967,600 | |
| Arbor Realty Trust, Inc., 6.250% | | | | 40,000 | | | | | 840,800 | |
| Dynex Capital, Inc., 6.900% (3 Month LIBOR + 5.461%) (a) | | | | 40,000 | | | | | 910,400 | |
| Ellington Financial, Inc., 6.250% (H15T5Y + 4.990%) (a) | | | | 80,000 | | | | | 1,620,800 | |
| Ellington Financial, Inc., 6.750% (3 Month LIBOR + 5.196%) (a) | | | | 20,000 | | | | | 427,400 | |
| Inpoint Commercial Real Estate Income, Inc., 6.750% | | | | 80,000 | | | | | 1,386,792 | |
| Lument Finance Trust, Inc., 7.875% | | | | 40,000 | | | | | 846,968 | |
| New Residential Investment Corp., 7.000% (H15T5Y + 6.223%) (a) | | | | 200,000 | | | | | 4,438,000 | |
| TPG RE Finance Trust, Inc., 6.250% | | | | 30,000 | | | | | 567,000 | |
| | | | | | | | | | |
| | | | | | | | | 12,974,160 | |
| | | | | | | | | | |
| | |
TOTAL PREFERRED STOCKS
(Cost – $29,786,082) | | | | | | | | | $27,553,759 | |
| | | | | | | | | | |
| Short-Term Investments – 0.36% | | | | | | | | | | |
| Money Market Funds – 0.36% | | | | | | | | | | |
| First American Government Obligations Fund, Class U, 1.459% (g) | | | | 1,489,064 | | | | | 1,489,064 | |
| | | | | | | | | | |
| | |
TOTAL SHORT-TERM INVESTMENTS
(Cost – $1,489,064) | | | | | | | | | $1,489,064 | |
| | | | | | | | | | |
| | |
TOTAL INVESTMENTS – 142.12%
(Cost – $593,306,277) | | | | | | | | | $581,786,495 | |
| | |
| Liabilities in Excess of Other Assets – (42.12%) | | | | | | | | | (172,437,718 | ) |
| | | | | | | | | | |
| | |
| NET ASSETS – 100.00% | | | | | | | | | $409,348,777 | |
| | | | | | | | | | |
LIBOR: London Inter-Bank Offered Rate
SOFR: Secured Overnight Financing Rate
SOFRINDX: Secured Overnight Financing Rate Compounded Index
TSFR3M: 3 Month Term Secured Overnight Financing Rate
H15T5Y: 5 Year Treasury Note Constant Maturity Rate
See accompanying notes which are an integral part of these financial statements.
13
Angel Oak Financial Strategies Income Term Trust
Schedule of Investments – (continued)
July 31, 2022 (Unaudited)
| (a) | Variable or floating rate security based on a reference index and spread. Certain securities are fixed to variable and currently in the fixed phase. Rate disclosed is the rate in effect as of July 31, 2022. |
| (b) | Security exempt from registration under Rule 144A or Section 4(a)(2) of the Securities Act of 1933. The security may be resold in transactions exempt from registration, normally to qualified institutional buyers. These securities are determined to be liquid by the Adviser, under the procedures established by the Fund’s Board of Trustees, unless otherwise denoted. At July 31, 2022, the value of these securities amounted to $310,359,926 or 75.82% of net assets. |
| (c) | All or a portion of the security has been pledged as collateral in connection with open reverse repurchase agreements. At July 31, 2022, the value of securities pledged amounted to $217,163,001. |
| (d) | Security issued as a “Baby Bond”, with a par value of $25 per bond. The principal balance disclosed above represents the issuer’s outstanding principal that corresponds to the bonds held in the Fund. |
| (e) | As of July 31, 2022, the Fund has fair valued these securities under the procedures established by the Fund’s Board of Trustees. The value of these securities amounted to $13,722,000 or 3.35% of net assets. Value determined using significant unobservable inputs. |
| (f) | Variable rate security. The coupon is based on an underlying pool of assets. Rate disclosed is the rate in effect as of July 31, 2022. |
| (g) | Rate disclosed is the seven day yield as of July 31, 2022. |
Schedule of Open Reverse Repurchase Agreements
| | | | | | | | | | | | | | | | | | | | |
| Counterparty | | Interest
Rate | | | Trade Date | | | Maturity Date | | | Net Closing
Amount | | | Face Value | |
| Lucid Management and Capital Partners LP | | | 3.221 | % | | | 7/14/2022 | | | | 8/11/2022 | | | $ | 38,814,008 | | | $ | 38,717,000 | |
| Lucid Management and Capital Partners LP | | | 3.406 | % | | | 7/15/2022 | | | | 8/11/2022 | | | | 829,112 | | | | 827,000 | |
| Lucid Management and Capital Partners LP | | | 3.502 | % | | | 7/26/2022 | | | | 8/11/2022 | | | | 3,141,883 | | | | 3,137,000 | |
| Lucid Management and Capital Partners LP | | | 3.733 | % | | | 7/14/2022 | | | | 10/13/2022 | | | | 42,095,508 | | | | 41,702,000 | |
| Lucid Management and Capital Partners LP | | | 3.933 | % | | | 7/14/2022 | | | | 10/13/2022 | | | | 9,905,509 | | | | 9,808,000 | |
| | | | | | | | | | | | | | | | | | | | |
| | | | | | | | | | | | | | | | | | $ | 94,191,000 | |
| | | | | | | | | | | | | | | | | | | | |
A reverse repurchase agreement, although structured as a sale and repurchase obligation, acts as a financing transaction under which the Fund will effectively pledge certain assets as collateral to secure a short-term loan. Generally, the other party to the agreement makes the loan in an amount less than the fair value of the pledged collateral. At the maturity of the reverse repurchase agreement, the Fund will be required to repay the loan and interest and correspondingly receive back its collateral. While used as collateral, the pledged assets continue to pay principal and interest which are for the benefit of the Fund.
See accompanying notes which are an integral part of these financial statements.
14
Angel Oak Financial Strategies Income Term Trust
Notes to the Financial Statements
July 31, 2022 (Unaudited)
NOTE 1. ORGANIZATION
Angel Oak Financial Strategies Income Term Trust (“FINS”) (the “Trust” or the “Fund”) is organized as a Delaware statutory trust under a Declaration of Trust dated June 14, 2018. The Trust is registered under the Investment Company Act of 1940, as amended (the “1940 Act”), as a
non-diversified
closed-end
management investment company listed on the New York Stock Exchange (“NYSE”). Please see the table below for a summary of Fund specific information:
| | | | |
| | | | Commencement of Operations |
| FINS | | Current Income & Total Return | | 05/31/19 |
The Fund will terminate on or before May 31, 2031 (the “Termination Date”); provided, that if the Board of Trustees (the “Board”) believes that, under then-current market conditions, it is in the best interest of the Fund to do so, the Fund may extend the Termination Date: (i) once for up to one year (i.e., up to May 31, 2032), and (ii) once for up to an additional six months (i.e., up to November 30, 2032), in each case upon the affirmative vote of a majority of the Board and without Shareholder approval. In determining whether to extend the Termination Date, the Board may consider the inability to sell the Fund’s assets in a time frame consistent with termination due to lack of market liquidity or other extenuating circumstances. Additionally, the Board may determine that market conditions are such that it is reasonable to believe that, with an extension, the Fund’s remaining assets will appreciate and generate income in an amount that, in the aggregate, is meaningful relative to the cost and expense of continuing the operation of the Fund.
At a meeting of the Board on March
30-31,
2022, the Board approved an Agreement and Plan of Reorganization (the “Plan”) providing for the transfer of all of the assets of Angel Oak Dynamic Financial Strategies Income Term Trust (“DYFN”) in exchange solely for newly issued common shares of beneficial interest of the Fund and the assumption by the Fund of the liabilities of DYFN and the distribution of common shares of beneficial interest of the Fund to the shareholders of DYFN and complete liquidation of DYFN (the “Reorganization”). The Plan was approved at a meeting of shareholders held on June 30, 2022.
The Reorganization closed as of the close of business July 29, 2022, as a
non-taxable
event. The Fund and DYFN bore the expenses relating to the Reorganization. Each Fund bore expenses directly attributable to such Fund, and the Funds bore its pro rata portion of expenses attributable to both Funds based on the Funds’ relative net assets. As of July 31, 2022, $329,868 of reorganization expenses were included in Merger expense line item that is reflected in the Statement of Operations. Under the terms of the Plan, shareholders of DYFN received shares of the Fund equal in U.S. dollar value to the interests of such shareholders in DYFN as of July 29, 2022. For financial reporting purposes, assets received, and shares issued by the Fund were recorded at fair value. The following table illustrates the specifics of the Reorganization:
| | | | | | | | | | | | | | | | | | | | | | | | |
| | | | | | Pre- Reorganzation Shares Outstanding | | | Pre- Reorganzation Net Asset Value | | | Post-
Reorganzation
Net Asset
Value | | | Post-
Reorganzation
Shares
Outstanding | | | | |
| FINS | | | $331,647,740 | | | | 20,305,331 | | | | $16.3330 | | | | $409,348,777 | | | | 25,062,638 | | | | 1.17319 | |
| DYFN | | | $77,701,037 | | | | 4,055,000 | | | | $19.1618 | | | | — | | | | — | | | | — | |
Because the combined investment portfolios have been managed as a single integrated portfolio since the Reorganization was completed, it is not practical to separate the amounts of revenue and earnings of DYFN that would have been included in the Fund’s Statement of Operations since July 29, 2022. Assuming the acquisition had been completed on February 1, 2022, the beginning of the annual reporting period of the Fund, the Fund’s pro forma results of operations for the current fiscal period would include net investment income (loss) of $3,858,197, net realized and unrealized gain (loss) on investments of $3,141,625, and net increase (decrease) in assets resulting from operations of $6,999,822.
NOTE 2. SIGNIFICANT ACCOUNTING POLICIES
The following is a summary of significant accounting policies consistently followed by the Fund in the preparation of its financial statements in accordance with the accounting principles generally accepted in the United States of America (“GAAP”). The Fund follows the investment company accounting and reporting guidance of the Financial Accounting Standards Board (“FASB”) Accounting Codification Topic 946 “Financial Services-Investment Companies.”
15
Angel Oak Financial Strategies Income Term Trust
Notes to the Financial Statements - (continued)
July 31, 2022 (Unaudited)
NOTE 2. SIGNIFICANT ACCOUNTING POLICIES – (continued)
Securities Valuation and Fair Value Measurements
: The Fund records its investments at fair value and in accordance with fair valuation accounting standards. The Fund has adopted fair valuation accounting standards which establish an authoritative definition of fair value and set out a hierarchy for measuring fair value. These standards require additional disclosures about the various inputs and valuation techniques used to develop the measurements of fair value and a discussion of changes in valuation techniques and related inputs, if any, during the period. In addition, these standards require expanded disclosure for each major category of assets. These inputs are summarized in the three broad levels listed below:
| | • | | Level 1: quoted prices in active markets for identical securities |
| | • | | Level 2: other significant observable inputs (including, but not limited to, quoted prices for similar securities, interest rates, prepayment speeds, credit risk, etc.) |
| | • | | Level 3: significant unobservable inputs (including the Fund’s own assumptions in determining fair value of investments based on the best information available) |
The inputs or methodology used for valuing securities are not an indication of the risks associated with investing in those securities.
Investments in registered
open-end
management investment companies, including money market funds, will be valued based upon the NAV of such investments and are categorized as Level 1 of the fair value hierarchy.
Fair values for long-term debt securities, including asset-backed securities (“ABS”), collateralized loan obligations (“CLOs”), corporate obligations and trust preferred securities are normally determined on the basis of valuations provided by independent pricing services. Vendors typically value such securities based on one or more inputs, including but not limited to, benchmark yields, transactions, bids, offers, quotations from dealers and trading systems, new issues, spreads and other relationships observed in the markets among comparable securities; and pricing models such as yield measurers calculated using factors such as cash flows, financial or collateral performance and other reference data. In addition to these inputs, ABS may utilize cash flows, prepayment information, default rates, delinquency and loss assumptions, collateral characteristics, credit enhancements and specific deal information. Securities that use similar valuation techniques and inputs are categorized as Level 2 of the fair value hierarchy. To the extent the significant inputs are unobservable; the values generally would be categorized as Level 3.
Equity securities, including preferred stocks, that are traded on a national securities exchange, except those listed on the Nasdaq Global Market
®
, Nasdaq Global Select Market
®
, and the Nasdaq Capital Market
®
exchanges (collectively, “Nasdaq”), are valued at the last sale price at the close of that exchange. Securities traded on Nasdaq will be valued at the Nasdaq Official Closing Price. If, on a particular day, an exchange-listed or Nasdaq security does not trade, then: (i) the security shall be valued at the mean between the most recent quoted bid and asked prices at the close of the exchange; or (ii) the security shall be valued at the latest sales price on the Composite Market (defined below) for the day such security is being valued. “Composite Market” means a consolidation of the trade information provided by national securities and foreign exchanges and
markets as published by a pricing service. In the event market quotations or Composite Market pricing are not readily available, fair value will be determined in accordance with the procedures adopted by the Board. All equity securities that are not traded on a listed exchange are valued at the last sale price at the close of the
over-the
counter market. If a
non-exchange
listed security does not trade on a particular day, then the mean between the last quoted bid and asked price will be used as long as it continues to reflect the value of the security. If the mean is not available, then bid price can be used as long as the bid price continues to reflect the value of the security. Otherwise, fair value will be determined in accordance with the procedures adopted by the Board. These securities will generally be categorized as Level 3 securities. When using the market quotations or close prices provided by the pricing service and when the market is considered active, the security will be classified as a Level 1 security. Sometimes, an equity security owned by the Fund will be valued by the pricing service with factors other than market quotations or when the market is considered inactive. When this happens, the security will be classified as a Level 2 security.
Short term debt securities having a maturity of 60 days or less are generally valued at amortized cost, which approximates fair market value. These investments are categorized as Level 2 of the fair value hierarchy. Reverse repurchase agreements and repurchase agreements are priced at their acquisition cost, and assessed for credit adjustments, which represents fair value. These securities will generally be categorized as Level 2 securities.
16
Angel Oak Financial Strategies Income Term Trust
Notes to the Financial Statements - (continued)
July 31, 2022 (Unaudited)
NOTE 2. SIGNIFICANT ACCOUNTING POLICIES – (continued)
Participation Loans are priced by a third-party pricing service. These firms primarily obtain their market color from model inputs based on business, economic, market, and other conditions. The principal sources of information used to conduct valuation include historical and projected financial information, governing legal documents, discussions with related personnel, remittance data and various other documents and schedules available from public or private sources. These securities will be categorized as Level 2 securities.
Securities may be fair valued in accordance with the fair valuation procedures approved by the Board. The Valuation and Risk Management Oversight Committee is generally responsible for overseeing the Fund’s valuation processes and reports quarterly to the Board. The Valuation and Risk Management Oversight Committee has delegated to the Valuation Committee of the Valuation Designee the
responsibilities for making all necessary determinations of the fair value of portfolio securities and other assets for which market quotations are not readily available or if the prices obtained from independent pricing services are deemed to be unreliable indicators of market or fair value. Representatives of the Valuation Designee’s Valuation Committee report quarterly to the Valuation and Risk Management Oversight Committee.
The following is a summary of the investments by their inputs used to value the Fund’s net assets as of July 31, 2022:
| | | | | | | | | | | | | | | | |
| | | | | | | | | | | | | |
| Assets | | | | | | | | | | | | | | | | |
| Bank Loans | | | $– | | | | $2,434,134 | | | | $– | | | | $2,434,134 | |
| Common Stocks | | | 1,745,617 | | | | – | | | | – | | | | 1,745,617 | |
| Convertible Obligations | | | – | | | | 840,000 | | | | – | | | | 840,000 | |
| Corporate Obligations | | | – | | | | 536,773,921 | | | | 10,950,000 | | | | 547,723,921 | |
| Preferred Stocks | | | 22,336,484 | | | | 2,445,275 | | | | 2,772,000 | | | | 27,553,759 | |
| Short-Term Investments | | | 1,489,064 | | | | – | | | | – | | | | 1,489,064 | |
| Total | | | $25,571,165 | | | | $542,493,330 | | | | $13,722,000 | | | | $581,786,495 | |
| Other Financial Instruments | | | | | | | | | | | | | | | | |
| Liabilities | | | | | | | | | | | | | | | | |
| Reverse Repurchase Agreements | | | $– | | | | $94,191,000 | | | | $– | | | | $94,191,000 | |
See the Schedule of Investments for further disaggregation of investment categories. During the period ended July 31, 2022, the Fund recognized $4,743,559 of transfers from Level 3 to Level 2 due to an increase in relevant market activity. See the summary of quantitative information about Level 3 Fair Value Measurements for more information.
The following is a reconciliation of investments in which significant unobservable inputs (Level 3) were used in determining fair value:
| | | | | | | | | | | | | | | | | | |
| | | | | Amortization/
Accretion/
Distributions | | | | Change in Net
Unrealized
Appreciation
(Depreciation) | | | | | | | | | | |
| Corporate Obligations | | $11,097,500 | | ($4,789) | | $– | | ($452,179) | | $5,053,027 | | $– | | $– | | ($4,743,559) | | $10,950,000 |
| Preferred Stocks | | $2,000,000 | | $– | | $– | | ($228,000) | | $1,000,000 | | $– | | $– | | $– | | $2,772,000 |
The total change in unrealized appreciation (depreciation) included in the Statement of Operations attributable to Level 3 investments still held at July 31, 2022 is ($423,738).
17
Angel Oak Financial Strategies Income Term Trust
Notes to the Financial Statements - (continued)
July 31, 2022 (Unaudited)
NOTE 2. SIGNIFICANT ACCOUNTING POLICIES – (continued)
The following is a summary of quantitative information about Level 3 Fair Value Measurements:
| | | | | | | | | | | | | | |
| | | | | | | | | | | | Weighted Average
Unobservable Input | |
| Corporate Obligations | | $ | 10,950,000 | | | Broker
Quote | | Third party | | $93.00-$101.00 | | | $99.55 | |
| Preferred Stocks | | | $2,772,000 | | | Consensus
Pricing | | Trading colors of
comparable securities
and other deals with
similar coupons and
characteristics | | $23.50-$892.00 | | $ | 93.86 | |
Federal Income Taxes:
The Fund intends to elect and continue to qualify to be taxed as a “regulated investment company” under Subchapter M of the Internal Revenue Code of 1986, as amended. If so qualified, the Fund generally will not be subject to federal income tax to the extent it distributes substantially all of its net investment income and capital gains to shareholders. The Fund generally intends to operate in a manner such that it will not be liable for federal income or excise taxes.
The Fund has adopted financial reporting rules regarding recognition and measurement of tax positions taken or expected to be taken on a tax return. The Fund recognizes interest and penalties, if any, related to unrecognized tax benefits as income tax expense on the Statement of Operations. During the period ended July 31, 2022, the Fund did not incur any interest or penalties. The Fund has reviewed all open tax years and major jurisdictions and concluded that no provision for income tax is required in the Fund’s financial statements. The Fund’s Federal and state income and Federal excise tax returns for which the applicable statutes of limitations have not expired are subject to examination by the Internal Revenue Service and state departments of revenue.
Security Transactions and Income Recognition:
Investment security transactions are accounted for on trade date. Gains and losses realized on sales of securities are determined on a specific identification basis. Interest income and expense is recorded on an accrual basis. Discounts and premiums on securities purchased are accreted or amortized using the effective yield method, based on each security’s estimated life and recoverable principal and recorded in interest income on the Statement of Operations. Dividend income and corporate transactions, if any, are recorded on the
ex-date.
Paydown gains and losses on mortgage related and other ABS are recorded as components of interest income on the Statement of Operations. Payments received from certain investments held by the Fund may be comprised of dividends, capital gains and return of capital. The Fund originally estimates the expected classification of such payments. The amounts may subsequently be reclassified upon receipt of the information from the issuer. The actual character of distributions to the Fund’s shareholders will be reflected in the Form 1099 received by shareholders after the end of the calendar year.
Distributions to Shareholders:
Distributions from the Fund’s net investment income are declared and paid monthly. The Fund intends to distribute its net realized long term capital gains and net realized short term capital gains, if any, at least annually. Distributions to shareholders, which are determined in accordance with income tax regulations, are recorded on the
ex-dividend
date. The treatment for financial reporting purposes of distributions made to shareholders during the period from net investment income or net realized capital gains may differ from their ultimate treatment for federal income tax purposes. These differences are caused primarily by differences in the timing of the recognition of certain components of income, expense or realized capital gain for federal income tax purposes. Where such differences are permanent in nature, they are reclassified in the components of the net assets based on their ultimate characterization for federal income tax purposes. Any such reclassifications will have no effect on net assets, results of operations or net asset value per share of the Fund. For the year ended January 31, 2022, certain differences were reclassified. These differences were primarily related to distribution reclassifications and return of capital distributions; the amounts did not affect net assets. The reclassifications were as follows:
| | |
| | Distributable earnings
(accumulated deficit) |
| ($49,501) | | $49,501 |
18
Angel Oak Financial Strategies Income Term Trust
Notes to the Financial Statements - (continued)
July 31, 2022 (Unaudited)
NOTE 2. SIGNIFICANT ACCOUNTING POLICIES – (continued)
Share Valuation
: The NAV per share of the Fund is calculated by dividing the sum of the value of the securities held by the Fund, plus cash and other assets, minus all liabilities (including estimated accrued expenses) by the total number of shares outstanding, rounded to the nearest cent. The Fund’s NAV will not be calculated on the days on which the New York Stock Exchange is closed for trading.
Use of Estimates:
The preparation of financial statements in conformity with GAAP requires management to make estimates and assumptions that affect the reported amounts of assets and liabilities and disclosure of contingent assets and liabilities at the date of the financial statements, as well as the reported amounts of income and expenses during the period. Actual results could differ from those estimates.
Indemnifications:
Under the Fund’s organizational documents, the Fund will indemnify its officers and trustees for certain liabilities that may arise from performance of their duties to the Fund. Additionally, in the normal course of business, the Fund enters into contracts that contain a variety of representations and warranties which provide general indemnifications. The Fund’s maximum exposure under these arrangements is unknown, as this would involve future claims that may be made against the Fund that have not yet occurred.
Cash and Cash Equivalents:
Cash and cash equivalents are highly liquid assets including coin, currency and short-term investments that typically mature in
30-90
days. Short-term investments can include U.S. Government and government agency securities, investment grade money market instruments, investment grade fixed-income securities, repurchase agreements, commercial paper and cash equivalents. Cash equivalents are extremely low risk assets that are liquid and easily converted into cash. These investments are only considered equivalents if they are readily available and are not restricted by some agreement. When the Adviser believes market, economic or political conditions are unfavorable for investors, the Adviser may invest up to 100% of a Fund’s net assets in cash, cash equivalents or other short-term investments. Unfavorable market or economic conditions may include excessive volatility or a prolonged general decline in the securities markets, or the U.S. economy. The Adviser also may invest in these types of securities or hold cash while looking for suitable investment opportunities or to maintain liquidity. Included in Investments in unaffiliated securities at fair value on the Statement of Assets and Liabilities are investments in First American money market funds held at major financial institutions totaling $1,489,064.
Reverse Repurchase Agreements:
A reverse repurchase agreement is the sale by the Fund of a security to a party for a specified price, with the simultaneous agreement by the Fund to repurchase that security from that party on a future date at a higher price. Proceeds from securities sold under reverse repurchase agreements are reflected as a liability on the Statement of Assets and Liabilities. Interest payments made are recorded as a component of interest expense on the Statement of Operations. Reverse repurchase agreements involve the risk that the counterparty will become subject to bankruptcy or other insolvency proceedings or fail to return a security to the Fund. In such situations, the Fund may incur losses as a result of a possible decline in the value of the underlying security during the period while the Fund seeks to enforce their rights, a possible lack of access to income on the underlying security during this period, or expenses of enforcing its rights. The Fund will segregate assets determined to be liquid by the Adviser or otherwise cover its obligations under reverse repurchase agreements.
The gross obligations for secured borrowing by the type of collateral pledged and remaining time to maturity on reverse repurchase contracts is as follows:
| | | | | | | | | | | | | | | | | | | | |
Reverse Repurchase Agreements | | | | | | | | | | | | | | | |
| Corporate Obligations | | $ | – | | | $ | 42,681,000 | | | $ | 51,510,000 | | | $ | – | | | $ | 94,191,000 | |
| Total | | $ | – | | | $ | 42,681,000 | | | $ | 51,510,000 | | | $ | – | | | $ | 94,191,000 | |
| Gross amount of reverse repurchase agreements in Balance Sheet Offsetting Information Table | | | $ | 94,191,000 | |
| Amounts related to agreements not included in offsetting disclosure in Balance Sheet Offsetting Information Table | | | | $– | |
NOTE 3. RISKS ASSOCIATED WITH PORTFOLIO ASSETS
Subordinated Debt of Banks and Diversified Financial Companies:
The Fund may invest in subordinated debt securities, sometimes also called “junior debt,” which are debt securities for which the issuer’s obligations to make principal and interest
19
Angel Oak Financial Strategies Income Term Trust
Notes to the Financial Statements - (continued)
July 31, 2022 (Unaudited)
NOTE 3. RISKS ASSOCIATED WITH PORTFOLIO ASSETS – (continued)
payment are secondary to the issuer’s payment obligations to more senior debt securities. Such investments will consist primarily of debt issued by community banks or savings intuitions (or their holding companies), which are subordinated to senior debt issued by the banks and deposits held by the bank, but are senior to trust preferred obligations, preferred stock and common stock issued by the bank.
High Yield Securities:
The Fund may invest in below investment grade securities, including certain securities issued by U.S. community banks and other financial institutions. These “high-yield” securities, also known as “junk bonds,” will generally be rated BB or lower by S&P or will be of equivalent quality rating from another Nationally Recognized Statistical Ratings Organization, or if unrated, considered by the Adviser to be of comparable quality.
Structured Products:
The Fund may invest in certain structured products, including community bank debt securitizations. Normally, structured products are privately offered and sold (that is, they are not registered under the securities laws); however, an active dealer market may exist for structured products that qualify for Rule 144A transactions. The risks of an investment in a structured product depend largely on the type of the collateral securities and the class of the structured product in which the Fund invests. In addition to the normal interest rate, default and other risks of fixed income securities, structured products carry additional risks, including the possibility that distributions from collateral securities will not be adequate to make interest or other payments, the quality of the collateral may decline in value or default, the Fund may invest in Structured Products that are subordinate to other classes, values may be volatile and disputes with the issuer may produce unexpected investment results.
Common and Preferred Stocks:
The Fund may invest in common and preferred stock. Common stock represents an equity (ownership) interest in a company, and usually possesses voting rights and earns dividends. Dividends on common stock are not fixed but are declared at the discretion of the issuer. Common stock generally represents the riskiest investment in a company. In addition, common stock generally has the greatest appreciation and depreciation potential because increases and decreases in earnings are usually reflected in a company’s stock price. The Fund may also invest in preferred stock. Preferred stock is a class of stock having a preference over common stock as to the payment of dividends and the recovery of investment should a company be liquidated, although preferred stock is usually junior to the debt securities of the issuer. Preferred stock typically does not possess voting rights and its market value may change based on changes in interest rates.
The fundamental risk of investing in stock is the risk that the value of the stock might decrease. Stock values fluctuate in response to the activities an individual company or in response to general market and/or economic conditions. Historically, common stocks have provided greater long-term returns and have entailed greater short-term risks than preferred stocks, fixed income, and money market investments. The market values of all securities, including common and preferred stocks, is based upon the market’s perception of value and not necessarily the book value of an issuer or other objective measures of a company’s worth. If you invest in the Fund, you should be willing to accept the risks of the stock market (to the extent that a Fund invests in common stock) and should consider an investment in the Fund only as a part of your overall investment portfolio.
Bank Loans and Participations:
The Fund may invest in bank loans and participations, including first-lien, second-lien and unitranche loans of any credit quality, maturity or duration. The bank loans and participations in which the Fund will invest may have fixed or floating interest rates, may be senior or subordinated, may be levered loans, and may be rated below investment grade or unrated. The Fund may invest in bank loans through assignments (whereby the Fund assumes the position of the lender to the borrower) or loan participation (whereby the Fund purchases all or a portion of the economic interest in a loan). “Unitranche” loans are loans that combine both senior and subordinate debt into a single loan under which the borrower pays an interest rate intended to reflect the relative risk of the secured and unsecured components of the loan.
NOTE 4. FUND CERTIFICATION
The Fund is listed for trading on the NYSE and has filed with the NYSE its annual chief executive officer certification regarding compliance with the NYSE’s listing standards. The Fund filed with the SEC the certification of its chief executive officer and principal financial officer required by Section 302 of the Sarbanes-Oxley Act.
20
Angel Oak Financial Strategies Income Term Trust
Notes to the Financial Statements - (continued)
July 31, 2022 (Unaudited)
NOTE 5. DERIVATIVE TRANSACTIONS
Balance Sheet Offsetting Information
During the ordinary course of business, the Fund may enter into transactions subject to enforceable netting agreements or other similar arrangements (“netting agreements”). Generally, the right to offset in netting agreements allows the Fund to offset any exposure to a specific counterparty with any collateral received or delivered to that counterparty based on the terms of the agreement. Generally, the Fund manages its cash collateral and securities collateral on a counterparty basis. As of July 31, 2022, the Fund was not subject to any netting agreements.
The following table provides a summary of offsetting financial liabilities and derivatives and the effect of derivative instruments on the Statement of Assets and Liabilities as of July 31, 2022.
| | | | | | | | | | | | |
| | | | | | | | | Gross Amounts Not Offset in Statement of Assets and Liabilities |
| | | | | | | | | | | | | |
| Reverse Repurchase Agreements | | $94,191,000 | | $– | | $94,191,000 | | $94,191,000 | | $– | | $– |
In some instances, the actual collateral received/pledged may be more than the amounts disclosed herein.
NOTE 6. FEES AND OTHER RELATED PARTY TRANSACTIONS
Under the terms of the investment advisory agreement, on behalf of the Fund (the “Agreement”), the Adviser manages the Fund’s investments subject to oversight of the Trustees. As compensation for its management services, the Fund is obligated to pay the Adviser a fee computed and accrued daily and paid monthly at an annual rate of 1.35% of the average daily Managed Assets (as defined below) of the Fund. Managed Assets includes total assets (including any assets attributable to borrowing for investment purposes) minus the sum of the Fund’s accrued liabilities (other than liabilities representing borrowings for investment purposes) (“Managed Assets”).
The Adviser has also contractually agreed to waive its fees and/or reimburse certain expenses (exclusive of any management fees, taxes, interest on borrowings, dividends on securities sold short, brokerage commissions, acquired fund fees and expenses, expenses incurred in connection with any merger or reorganization and extraordinary expenses) to limit the Fund’s Total Annual Fund Operating Expenses to 0.25% of the Fund’s Managed Assets through at least May 31, 2023 (the “Limitation Period”). Separately, the Adviser contractually agreed to waive its fees and/or reimburse certain expenses (exclusive of any
front-end
sales loads, taxes, interest on borrowings, dividends on securities sold short, brokerage commissions, acquired fund fees and expenses, expenses incurred in connection with any merger or reorganization and extraordinary expenses) to limit the Fund’s Total Annual Fund Operating Expenses to 2.50% of the Fund’s net assets (together with the 0.25% expense limitation, the “Expense Limits”) through June 5, 2022. The 0.25% Expense Limit may be eliminated at any time by the Board, on behalf of the Funds, upon 60 days’ written notice to the Adviser. Prior to the end of the Limitation Period, the Expense Limits may not be terminated by the Adviser without the consent of the Board of Trustees. Each Expense Limit is subject to repayment by the Fund within 36 months following the month in which that particular waiver and/or reimbursement occurred, provided that the Fund is able to make the repayment without exceeding the expense limitations described above or the expense limitation in effect at the time of the reimbursement (whichever is lower).
In addition, the Adviser has contractually agreed to waive the amount of the Fund’s management fee to the extent necessary to offset the proportionate share of the management fees incurred by the Fund through its investment in underlying funds for which the Adviser also serves as investment adviser (affiliated investments). This contractual waiver is not subject to recoupment by the Adviser. This arrangement may only be changed or eliminated by the Board of Trustees upon 60 days’ written notice to the Adviser. During the period ended July 31, 2022, the Adviser waived $1,673 of management fees of underlying funds.
Destra Capital Investments LLC (“Destra”) provides investor support services in connection with the ongoing operation of the Fund. Such services include providing ongoing contact with respect to the Fund and its performance with financial advisors that
21
Angel Oak Financial Strategies Income Term Trust
Notes to the Financial Statements - (continued)
July 31, 2022 (Unaudited)
NOTE 6. FEES AND OTHER RELATED PARTY TRANSACTIONS – (continued)
are representatives of financial intermediaries, and communicating with the NYSE specialist for the Shares, and with the
closed-end
fund analyst community regarding the Fund on a regular basis. The Fund paid Destra a service fee in an annual amount equal to 0.07% of the average daily value of the Fund’s Managed Assets through the applicable termination date.
U.S. Bancorp Fund Services, LLC, doing business as U.S. Bank Global Fund Services (“Fund Services”), an indirect wholly-owned subsidiary of U.S. Bancorp, serves as the Fund’s Administrator (“Administrator”) and, in that capacity, performs various administrative and accounting services for the Fund. Fund Services also serves as the Fund’s fund accountant and transfer agent. The Administrator prepares various federal and state regulatory filings, reports and returns for the Fund; prepares reports and materials to be supplied to the Trustees; monitors the activities of the Fund’s custodian; coordinates the preparation and payment of the Fund’s expenses and reviews the Fund’s expense accruals. As compensation for its services, the Administrator is entitled to a monthly fee at an annual rate based upon the average daily net assets of the Fund. U.S. Bank, N.A. (the “Custodian”) serves as custodian to the Fund.
Certain officers, Trustees and shareholders of the Fund are also owners or employees of the Adviser.
NOTE 7. INVESTMENT TRANSACTIONS
For the period ended July 31, 2022, purchases and sales of investment securities, other than short-term investments and short-term U.S. Government securities, were as follows:
For the period ended July 31, 2022, there were no long-term purchases or long-term sales of U.S. Government securities for the Fund.
NOTE 8. INVESTMENTS IN AFFILIATES
The Fund’s ownership of shares of affiliates represents holdings for which the Fund and the underlying investee fund have the same investment adviser or where the investee fund’s investment adviser is under common control with the Fund’s investment adviser.
The Fund had the following investments in affiliates during the period ended July 31, 2022:
| | | | | | | | | | | | | | | | |
| | Value as of
February 1,
2022 | | | | | | Unrealized
Appreciation
(Depreciation) on
Investments in
Affiliates | | | | | | | | Net Realized
Gain (Loss)
on
Investments
in Affiliates |
| DYFN | | $352,296 | | $– | | ($295,072) | | ($1,790) | | $– | | – | | $10,438 | | ($55,434) |
NOTE 9. FEDERAL TAX INFORMATION
The tax characterization of distributions paid for the year ended January 31, 2022 and January 31, 2021, were as follows:
| | | | |
| | | | | |
| Distributions paid from: | | | | |
| Ordinary Income | | $12,621,982 | | $11,280,742 |
| Net Long-Term Capital Gain | | – | | – |
| Return of Capital | | 8,858,520 | | 6,149,847 |
| Total | | $21,480,502 | | $17,430,589 |
22
Angel Oak Financial Strategies Income Term Trust
Notes to the Financial Statements - (continued)
July 31, 2022 (Unaudited)
NOTE 9. FEDERAL TAX INFORMATION – (continued)
At January 31, 2022, the components of distributable earnings (accumulated deficit) on a tax basis were as follows:
| | |
| | | |
| Tax Cost of Investments | | $478,256,963 |
| Unrealized Appreciation* | | 12,110,099 |
| Unrealized Depreciation* | | (2,444,034) |
| Net Unrealized Appreciation (Depreciation)* | | $9,666,065 |
| Undistributed Ordinary Income | | – |
| Undistributed Long-Term Gain (Loss) | | – |
| Accumulated Gain (Loss) | | $– |
| Other Accumulated Gain (Loss) | | (11,657,032) |
| Distributable Earnings (Accumulated Deficit) | | ($1,990,967) |
| * | Represents aggregated amounts of investments and reverse repurchase agreements in the Fund. |
The temporary differences between book basis and tax basis in the Fund are primarily attributable to amortization of callable bonds.
As of January 31, 2022, the Fund had available for federal tax purposes an unused capital loss carryforward of $11,635,837. For the year ended January 31, 2022, the Fund utilized $1,737,425 of capital loss carryforward.
To the extent these carryforwards are used to offset future gains, it is probable that the amount offset will not be distributed to shareholders. The carryforward expires as follows:
| | |
| | | |
| No expiration short-term | | $11,635,837 |
| No expiration long-term | | $– |
| Total | | $11,635,837 |
Certain capital losses incurred after October 31 and within the current taxable year, are deemed to arise on the first business day of the Fund’s following taxable year. For the tax year ended January 31, 2022, the Fund did not defer any post-October losses.
NOTE 10. SENIOR NOTES
On July 8, 2021, the Fund issued senior unsecured notes (“Notes”) in an aggregate amount of $85,000,000 in two fixed-rate series. The Notes were issued in private placement offerings to institutional investors and are not listed on any exchange or automated quotation system. The note purchase agreement (the “Agreement”) contains various covenants related to other indebtedness and limits on the Fund’s overall leverage. Under the 1940 Act and the terms of the Notes, the Fund may not declare dividends or make other distributions on shares of its common stock or make purchases of such shares if, at any time of the declaration, distribution or purchase, asset coverage with respect to senior securities representing indebtedness (including the Notes) would be less than 300%.
The table below sets forth a summary of the key terms of each series of Notes outstanding at July 31, 2022.
| | | | | | | | | | | | |
| | Principal
Outstanding
July 31, 2022 | | | | | | | | | | |
| A | | $40,000,000 | | Semi-Annual | | $412,111 | | $36,608,378 | | 2.35% | | July 8, 2026 |
| B | | $45,000,000 | | Semi-Annual | | $464,720 | | $40,552,772 | | 2.80% | | July 8, 2028 |
23
Angel Oak Financial Strategies Income Term Trust
Notes to the Financial Statements - (continued)
July 31, 2022 (Unaudited)
NOTE 10. SENIOR NOTES – (continued)
The carrying value of the Notes on the Statement of Assets and Liabilities is equal to the principal amount of the Notes less unamortized offering costs. The estimated fair value of the notes was calculated, for disclosure purposes, based on estimated market yields for comparable debt instruments with similar maturity and terms. The Fund would categorize the Senior Notes as Level 2 in the fair value hierarchy.
The Fund shall at all times maintain a current rating given by a Nationally Recognized Statistical Rating Organization (“NRSRO”) of at least Investment Grade with respect to the Notes and shall not at any time have any rating given by a NRSRO of less than Investment Grade with respect to the Notes. The Notes have been assigned an ‘A1’ long-term rating by Moody’s Investors Service.
The aggregate accrued interest payable on the Notes as of July 31, 2022, was $140,556 and is included in the Interest Payable for senior notes and reverse repurchase agreements line item in the Statement of Assets and Liabilities. The Fund paid an origination fee of $854,000 and other expenses on July 13, 2021, which was paid upfront and is being accrued for daily over the life of the Notes. During the period ended July 31, 2022, $1,208,399 of interest expense and origination fees were included in the Interest and commissions expense line item that is reflected in the Statement of Operations.
At July 31, 2022, the Fund was in compliance with all covenants under the Agreement.
NOTE 11. CAPITAL TRANSACTIONS
The Board approved a rights offering to participating shareholders of record as of September 20, 2021, which were in turn allowed to subscribe for new common shares of the Fund. Record date shareholders received one right for each common share held on record date. For every three rights held, a holder of the rights was entitled to buy one new common share of the Fund. Record date shareholders who fully exercised all rights initially issued to them in the primary subscription were entitled to buy those common shares that were not purchased by other record date shareholders. The subscription price per common share (the “Subscription Price”) was determined based on a formula equal to 92.5% of the average of the last reported sales price of a common share of the Fund on the NYSE on the layoff/expiration dates and each of the four immediately preceding trading days (the “Formula Price”). However, the Formula Price was less than 86% of the Fund’s NAV per common share at the close of trading on the NYSE on the layoff/expiration dates, therefore the Subscription Price used was based on 86% of the Fund’s NAV per common share at the close of trading on the NYSE on those days. Offering costs were charged to paid-in-capital upon the exercise of the rights.
The shares of common stock issued, subscription price, and offering costs for the rights offering were as follows:
| | | | | | |
| | | | | | |
| October 6, 2021 | | 410,000 | | $16.15 | | $37,920 |
| October 11, 2021 | | 300,000 | | $16.10 | | $27,746 |
| October 14, 2021 | | 4,366,333 | | $16.06 | | $403,834 |
NOTE 12. ACCOUNTING PRONOUNCEMENTS
In March 2020, FASB issued ASU
2020-04,
Reference Rate Reform. The amendments in ASU
No. 2020-04
provide optional expedients and exceptions for applying U.S. GAAP to contracts, hedging relationships, and other transactions affected by reference rate reform if certain criteria are met. In January 2021, the FASB issued ASU
No. 2021-01,
which clarifies that certain provisions in Topic 848, if elected by an entity, apply to derivative instruments that use an interest rate for margining, discounting, or contract price alignment that is modified as a result of reference rate reform. The ASUs are effective for all entities as of March 12, 2020 through December 31, 2022. The Fund did not utilize the optional expedients and exceptions provided by ASU
No. 2020-04
and ASU
No. 2021-01
during the period ended July 31, 2022.
24
Angel Oak Financial Strategies Income Term Trust
Notes to the Financial Statements - (continued)
July 31, 2022 (Unaudited)
NOTE 12. ACCOUNTING PRONOUNCEMENTS – (continued)
In June 2022, the FASB issued Accounting Standards Update 2022-03, which amends Fair Value Measurement (Topic 820): Fair Value Measurement of Equity Securities Subject to Contractual Sale Restrictions (“ASU 2022-03”). ASU 2022-03 clarifies guidance for fair value measurement of an equity security subject to a contractual sale restriction and establishes new disclosure requirements for such equity securities. ASU 2022-03 is effective for fiscal years beginning after December 15, 2023 and for interim periods within those fiscal years, with early adoption permitted. Management is currently evaluating the impact of these amendments on the financial statements.
NOTE 13. MACROECONOMIC RISKS
The COVID-19 pandemic, the Russian-Ukrainian war, and resulting supply chain disruptions, geopolitical risks, and economic sanctions have disrupted economic markets and the prolonged economic impact is uncertain. The operational and financial performance of the issuers of securities in which the Fund invests depends on future developments, including the duration, spread, and conclusion of these global events, and such uncertainty may in turn impact the value of the Fund’s investments.
NOTE 14. SUBSEQUENT EVENT
Management of the Fund has evaluated the need for disclosures and/or adjustments resulting from subsequent events through the date these financial statements were issued. This evaluation did not result in any subsequent events that necessitated disclosures and/or adjustments.
25
Additional Information (Unaudited)
1. Shareholder Notification of Federal Tax Status
For the taxable year ended January 31, 2022, certain dividends paid by the Fund may be subject to a maximum tax rate of 20% as provided for by the Jobs and Growth Tax Relief Reconciliation Act of 2003. The Fund intends to designate the maximum amount allowable as taxed at a maximum rate of 20%.
For the taxable year ended January 31, 2022, the Fund paid qualified dividend income of 0.00%.
For the taxable year ended January 31, 2022, the percentage of ordinary income dividends paid by the Fund that qualifies for the dividends received deduction available to corporations was 0.00%.
For the taxable year ended January 31, 2022, the Fund did not pay any ordinary income distributions that are designated as short-term capital gain distributions under Internal Revenue Section 871(k)2(c).
For the taxable year ended January 31, 2022, the percentage of taxable ordinary income distributions for the Fund that is designated as interest related dividends under Internal Revenue 871(k)1(c) was 88.45%.
2. Disclosure of Portfolio Holdings
The Fund will file a complete schedule of portfolio holdings with the Securities and Exchange Commission (“SEC”) for the first and third quarters of each fiscal year on Part F of Form
N-PORT.
The Fund’s Part F of Form
N-PORT
is available on the SEC’s website at
http://www.sec.gov
and may be reviewed and copied at the SEC’s Public Reference Room in Washington, D.C. Information on the operation of the Public Reference Room may be obtained by calling
(800) SEC-0230.
3. Proxy Voting Policies and Procedures
A description of the policies and procedures that the Fund uses to determine how to vote proxies related to portfolio securities and information regarding how the Fund voted those proxies during the most recent twelve month period ended June 30, is available without charge upon request by (1) calling the Fund at (855)
751-4324
and (2) from Fund documents filed with the SEC on the SEC’s website at
www.sec.gov
.
4. Annual Meeting of Shareholders
At the Annual Meeting of Shareholders held on June 30, 2022, shareholders approved the election of Andrea N. Mullins and Keith M. Schappert as Class II Trustees to the Board of Trustees to serve a three-year term expiring in 2025 based on the following results:
| | | | | | | | | | | | |
| | | | | | | | | | |
| To Elect Andrea N. Mullins | | | 14,417,075 | | | | 998,518 | | | | 109,441 | |
| To Elect Keith M. Schappert | | | 14,427,256 | | | | 984,349 | | | | 113,431 | |
Shareholders also approved the issuance of additional common shares of beneficial interest of the Fund in connection with the reorganization of Angel Oak Dynamic Financial Strategies Income Term Trust, another closed-end fund, with and into the Fund based on the following results:
| | | | | | | | | | | | |
| | | | | | | | | | |
| To Approve Share Issuance | | | 14,634,788 | | | | 768,832 | | | | 106,573 | |
Lastly, shareholders were asked to approve the amendment of the Fund’s Declaration of Trust to extend the termination date of the Fund from May 31, 2031, to June 30, 2035, which subsequently did not receive affirmative vote based on the following results:
| | | | | | | | | | | | |
| | | | | | | | | | |
| To Approve Term Extension | | | 2,108,670 | | | | 5,793,768 | | | | 57,939 | |
26
5. Dividend Reinvestment Plan
Pursuant to the Fund’s Dividend Reinvestment Plan (the “Plan”), distributions of dividends and capital gains are automatically reinvested in Shares of the Fund by Fund Services, as Plan Agent. Unless a Shareholder indicates another option on the account application or otherwise
opts-out,
Shareholders holding at least one full Share of the Fund will be automatically enrolled in the Plan. Shareholders who do not participate in the Plan will receive all distributions in cash.
If the Fund declares a dividend or distribution payable either in cash or in Shares of the Fund and the market price of Shares on the payment date for the distribution or dividend equals or exceeds the Fund’s NAV per Share, the Fund will issue Shares to participants at a value equal to the higher of NAV or 95% of the market price. The number of additional Shares to be credited to each participant’s account will be determined by dividing the dollar amount of the distribution or dividend by the higher of NAV or 95% of the market price. If the market price is lower than NAV, or if dividends or distributions are payable only in cash, then participants will receive Shares purchased by the Plan Agent on participants’ behalf on the NYSE or otherwise on the open market. If the market price exceeds NAV before the Plan Agent has completed its purchases, the average per Share purchase price may exceed NAV, resulting in fewer Shares being acquired than if the Fund had issued new Shares.
There are no brokerage charges with respect to Shares issued directly by the Fund. However, whenever Shares are purchased or sold on the NYSE or otherwise on the open market, each participant will pay a pro rata portion of brokerage trading fees. Currently, dividend reinvestment plan participants that direct the sale of Shares through the Plan Agent are subject to a $25.00 fee plus a sales commission of $4.95.
The reinvestment of dividends and net capital gains distributions does not relieve participants of any income tax that may be payable on such dividends or distributions. Purchases of additional Shares of the Fund will be made on the open market. There is no transaction fee, and each participant will pay a pro rata share of brokerage commissions incurred in connection with purchases made on the open market. Shareholders can also sell Fund Shares held in the Plan account at any time by contacting the Plan Agent by telephone or in writing. The Plan Agent will mail a check to you (less applicable brokerage trading fees) on the settlement date, which is three business days after your Shares have been sold. If you choose to sell your Shares through your broker, you will need to request that the Plan Agent electronically transfer your Shares to your broker through the Direct Registration System.
Shareholders participating in the Plan may withdraw from the Plan at any time by contacting the Plan Agent by telephone or in writing. Such termination will be effective immediately if the notice is received by the Plan Agent prior to any dividend or distribution record date; otherwise, such termination will be effective on the first trading day after the payment date for such dividend or distribution, with respect to any subsequent dividend or distribution. If you withdraw, your Shares will be credited to your account; or, if you wish, the Plan Agent will sell your full and fractional Shares and send you the proceeds, less a fee currently set at $25.00 and less a sales commission currently set at $4.95. If a Shareholder does not maintain at least one whole Share in the Plan account, the Plan Agent may terminate such Shareholder’s participation in the Plan after written notice. Upon termination, Shareholders will be sent a check for the cash value of any fractional Share in the Plan account, less any applicable broker commissions and taxes. Experience under the Plan may indicate that changes are desirable. Accordingly, the Fund and the Plan Agent reserve the right to amend or terminate the Plan. Participants generally will receive written notice at least 60 days before the effective date of any amendment. In the case of termination, participants will receive written notice at least 60 days before the record date for the payment of any dividend or distribution by the Funds.
All correspondence or additional information about the Plan should be directed to Fund Services in writing at 615 East Michigan Street, Milwaukee, Wisconsin 53202.
6. Compensation of Trustees
Each Trustee who is not an “interested person” (i.e., an “Independent Trustee”) of the Fund Complex (which includes affiliated registrants not discussed in this report) receives an annual retainer of $65,000
(pro-rated
for any periods less than one year), paid quarterly as well as $12,000 for attending each regularly scheduled meeting in connection with his or her service on the Board. In addition, each Committee Chair as well as the Chair of the Board receives additional annual compensation of $12,000
(pro-rated
for any periods less than one year). Independent Trustees are permitted for reimbursement of
expenses incurred in connection with attendance at meetings.
Prior to November 1, 2021, the Independent Trustees received an annual retainer of $58,000 (pro-rated for any periods less than one year), paid quarterly as well as $12,000 for attending each regularly scheduled meeting in connection with his or her service on the Board. In addition, each Committee Chair received additional annual compensation of $12,000 (pro-rated for any periods less than one year).
27
7. Trustees and Officers
The business of the Fund is managed under the direction of the Board. The Board formulates the general policies of the Fund and meets periodically to review the Fund’s performance, monitor investment activities and practices, and discuss other matters affecting the Fund. The Trustees are fiduciaries for the Fund’s shareholders and are governed by the laws of the State of Delaware in this regard. The names and addresses of the Trustees and officers of the Fund are listed below along with a description of their principal occupations over at least the last five years. The address of each Trustee and Officer of the Fund is c/o Angel Oak Capital Advisors, LLC, 3344 Peachtree Road NE, Suite 1725, Atlanta, GA 30326.
| | | | | | | | | | |
| | | | | | | | | | |
|
Ira P. Cohen 1959 | | Independent Trustee, Chair (Class III) | | Trustee since 2018, Chair since 2019; 3 year term | | Executive Vice President, Recognos Financial (investment industry data analysis provider) (2015-2021); Independent financial services consultant (since 2005). | | 11 | | Trustee, Valued Advisers Trust (since 2010); Trustee, Griffin Institutional Access Credit Fund (since 2017); Trustee, Griffin Institutional Access Real Estate Fund (since 2014); Trustee, Angel Oak Funds Trust (since 2014); Trustee, Angel Oak Strategic Credit Fund (since 2017); Trustee, Angel Oak Dynamic Financial Strategies Income Term Trust (since 2019); Trustee, U.S. Fixed Income Trust (since 2019); Angel Oak Credit Opportunities Term Trust (since 2021). |
Alvin R. Albe, Jr. 1953 | | Independent Trustee (Class I) | | Since 2018; 3 year term | | Retired. | | 11 | | Trustee, Angel Oak Funds Trust (since 2014); Trustee, Angel Oak Strategic Credit Fund (since 2017); Trustee, Angel Oak Dynamic Financial Strategies Income Term Trust (since 2019); Angel Oak Credit Opportunities Term Trust (since 2021). |
28
| | | | | | | | | | |
| | | | | | | | | | |
Keith M. Schappert 1951 | | Independent Trustee (Class II) | | Since 2018; 3 year term | | President, Schappert Consulting LLC (investment industry consulting) (since 2008). | | 11 | | Trustee, Mirae Asset Discovery Funds (since 2010); Director, Commonfund Capital, Inc. (since 2015); Director, The Commonfund (since 2012); Director, Calamos Asset Management, Inc. (2012-2017); Trustee, Angel Oak Funds Trust (since 2014); Trustee, Angel Oak Strategic Credit Fund (since 2017); Trustee, Angel Oak Dynamic Financial Strategies Income Term Trust (since 2019); Angel Oak Credit Opportunities Term Trust (since 2021). |
Andrea N. Mullins 1967 | | Independent Trustee (Class II) | | Since 2019; 3 year term | | Private Investor; Independent Contractor, SWM Advisors (since 2014). | | 11 | | Trustee, Valued Advisors Trust (since 2013, Chair since 2017); Trustee, Angel Oak Funds Trust (since 2019); Trustee, Angel Oak Strategic Credit Fund (since 2019); Trustee, Angel Oak Dynamic Financial Strategies Income Term Trust (since 2019); Angel Oak Credit Opportunities Term Trust (since 2021); Trustee and Audit Committee Chair, Cushing Mutual Funds Trust (since 2021); Trustee and Audit Committee Chair, Cushing MLP & Infrastructure Fund (since 2021); Trustee and Audit Committee Chair, Cushing Nextgen Infrastructure Income Fund (since 2021). |
29
| | | | | | | | | | |
| | | | | | | | | | |
| Interested Trustees |
Samuel R. Dunlap, III 1979 | | Interested Trustee (Class I) | | Since 2022; 3 year term | | Chief Investment Officer-Public Strategies, Angel Oak Capital Advisors, LLC (investment management) (since 2009). | | 11 | | Trustee, Angel Oak Funds Trust (since 2019); Trustee, Angel Oak Strategic Credit Fund (since 2019); Trustee, Angel Oak Dynamic Financial Strategies Income Term Trust (since 2019); Trustee, Angel Oak Credit Opportunities Term Trust (since 2021). |
| (1) | The Fund Complex includes the Fund, each series of Angel Oak Funds Trust, Angel Oak Strategic Credit Fund, Angel Oak Dynamic Financial Strategies Income Term Trust, and Angel Oak Credit Opportunities Term Trust. |
| (2) | The Trustees of the Fund who are not “interested persons” of the Fund as defined in the 1940 Act (“Independent Trustees”). |
30
| | | | | | |
| | | | Term of Office and Length of Time Served | | Principal Occupation(s) During Past 5 Years |
| Officers |
Dory S. Black, Esq. 1975 | | President | | Since 2019; indefinite term | | General Counsel, Angel Oak Companies (since 2014). |
Adam Langley 1967 | | Chief Compliance Officer | | Since 2019; indefinite term | | Chief Compliance Officer, Angel Oak Capital Advisors, LLC (since 2015); Chief Compliance Officer, Buckhead One Financial Opportunities, LLC (since 2015); Chief Compliance Officer, Angel Oak Capital Partners II, LLC (since 2016); Chief Compliance Officer of Falcons I, LLC (since 2018); Chief Compliance Officer, Hawks I, LLC (since 2018); Chief Compliance Officer, Angel Oak Commercial Real Estate Solutions (2021-2022); Chief Compliance Officer, Angel Oak Funds Trust (since 2015); Chief Compliance Officer, Angel Oak Strategic Credit Fund (since 2017); Chief Compliance Officer, Angel Oak Dynamic Financial Strategies Income Term Trust (since 2019); Chief Compliance Officer, Angel Oak Credit Opportunities Fund (since 2021); Chief Operating Officer, Angel Oak Capital Advisors, LLC (since 2021). |
Kevin Sluss 1982 | | Secretary | | Since 2022; indefinite term | | Chief Risk Officer, Angel Oak Capital Advisors, LLC (since 2022), Quantitative Analytics and Model Development Manager, PNC Bank (2019-2022); Quantitative Analytics and Model Development Analyst, PNC Bank (2016-2019). |
Daniel Fazioli 1981 | | Treasurer | | Since 2019; indefinite term | | Chief Accounting Officer, Angel Oak Capital Advisors, LLC (since 2015). |
Each officer holds office at the pleasure of the Board.
31
INVESTMENT ADVISER
Angel Oak Capital Advisors, LLC
3344 Peachtree Road NE, Suite 1725
Atlanta, GA 30326
SHAREHOLDER SERVICER
Destra Capital Advisors LLC
444 West Lake Street, Suite 1700
Chicago, IL 60606
INDEPENDENT REGISTERED PUBLIC ACCOUNTING FIRM
Cohen & Company, Ltd.
1350 Euclid Avenue, Suite 800
Cleveland, OH 44115
LEGAL COUNSEL
Dechert LLP
1900 K Street NW
Washington, DC 20006
CUSTODIAN
U.S. Bank National Association
1555 North Rivercenter Drive, Suite 302
Milwaukee, WI 53202
ADMINISTRATOR, TRANSFER AGENT, AND FUND ACCOUNTANT
U.S Bancorp Fund Services, LLC
615 East Michigan Street
Milwaukee, WI 53202
SAR-FINS
(b) Not applicable.
Item 2. Code of Ethics.
Not applicable for semi-annual reports.
Item 3. Audit Committee Financial Expert.
Not applicable for semi-annual reports.
Item 4. Principal Accountant Fees and Services.
Not applicable for semi-annual reports.
Item 5. Audit Committee of Listed Registrants.
Not applicable for semi-annual reports.
Item 6. Investments.
Schedule of Investments is included as part of the report to shareholders filed under Item 1 of this Form.
Item 7. Disclosure of Proxy Voting Policies and Procedures for Closed-End Management Investment Companies.
Not applicable for semi-annual reports.
Item 8. Portfolio Managers of Closed-End Management Investment Companies.
Not applicable for semi-annual reports.
Item 9. Purchases of Equity Securities by Closed-End Management Investment Company and Affiliated Purchasers.
There were no purchases made by or on behalf of the Registrant or any “affiliated purchaser,” as defined in Rule 10b-18(a)(3) under the Securities Exchange Act of 1934, as amended, of shares of the Registrant’s equity securities that are registered by the Registrant pursuant to Section 12 of the Exchange Act made in the period covered by this report.
Item 10. Submission of Matters to a Vote of Security Holders.
There have been no material changes to the procedures by which shareholders may recommend nominees to the registrant’s board of trustees.
1
Item 11. Controls and Procedures.
| (a) | The Registrant’s Principal Executive Officer and Principal Financial Officer have reviewed the Registrant’s disclosure controls and procedures (as defined in Rule 30a-3(c) under the Investment Company Act of 1940 (the “Act”)) as of a date within 90 days of the filing of this report, as required by Rule 30a-3(b) under the Act and Rules 13a-15(b) or 15d-15(b) under the Securities Exchange Act of 1934. Based on their review, such officers have concluded that the disclosure controls and procedures are effective in ensuring that information required to be disclosed in this report is appropriately recorded, processed, summarized and reported and made known to them by others within the Registrant and by the Registrant’s service provider. |
| (b) | There were no changes in the Registrant’s internal control over financial reporting (as defined in Rule 30a-3(d) under the Act) that occurred during the period covered by this report that have materially affected, or are reasonably likely to materially affect, the Registrant’s internal control over financial reporting. |
Item 12. Disclosure of Securities Lending Activities for Closed-End Management Investment Companies
The registrant did not engage in securities lending activities during the fiscal period reported on this Form N-CSR.
Item 13. Exhibits.
| (a) | (1) Any code of ethics or amendment thereto, that is the subject of the disclosure required by Item 2, to the extent that the registrant intends to satisfy Item 2 requirements through filing an exhibit. Not Applicable. |
(2) A separate certification for each principal executive officer and principal financial officer pursuant to Section 302 of the Sarbanes-Oxley Act of 2002. Filed herewith.
(3) Any written solicitation to purchase securities under Rule 23c-1 under the Act sent or given during the period covered by the report by or on behalf of the registrant to 10 or more persons. Not applicable.
(4) Change in the registrant’s independent public accountant. There was no change in the registrant’s independent public accountant for the period covered by this report.
2
SIGNATURES
Pursuant to the requirements of the Securities Exchange Act of 1934 and the Investment Company Act of 1940, the registrant has duly caused this report to be signed on its behalf by the undersigned, thereunto duly authorized.
| | | | |
| | (Registrant) | | Angel Oak Financial Strategies Income Term Trust |
| | | | |
| | By (Signature and Title)* | | /s/ Dory S. Black |
| | | | Dory S. Black, President (Principal Executive Officer) |
Pursuant to the requirements of the Securities Exchange Act of 1934 and the Investment Company Act of 1940, this report has been signed below by the following persons on behalf of the registrant and in the capacities and on the dates indicated.
| | | | |
| | By (Signature and Title)* | | /s/ Dory S. Black |
| | | | Dory S. Black, President (Principal Executive Officer) |
| | | | |
| | By (Signature and Title)* | | /s/ Daniel Fazioli |
| | | | Daniel Fazioli, Treasurer (Principal Financial Officer) |
| * | Print the name and title of each signing officer under his or her signature. |