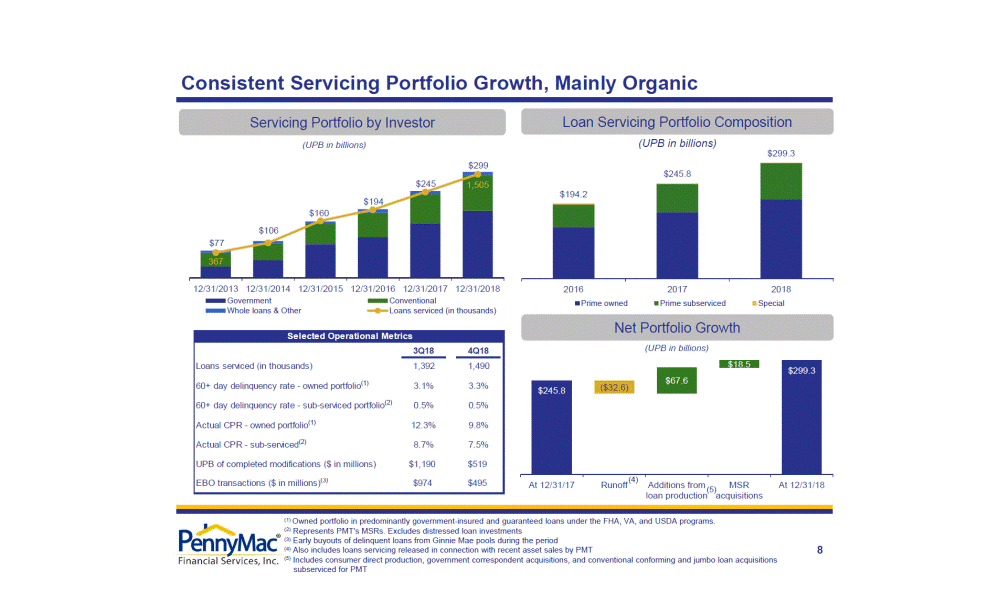
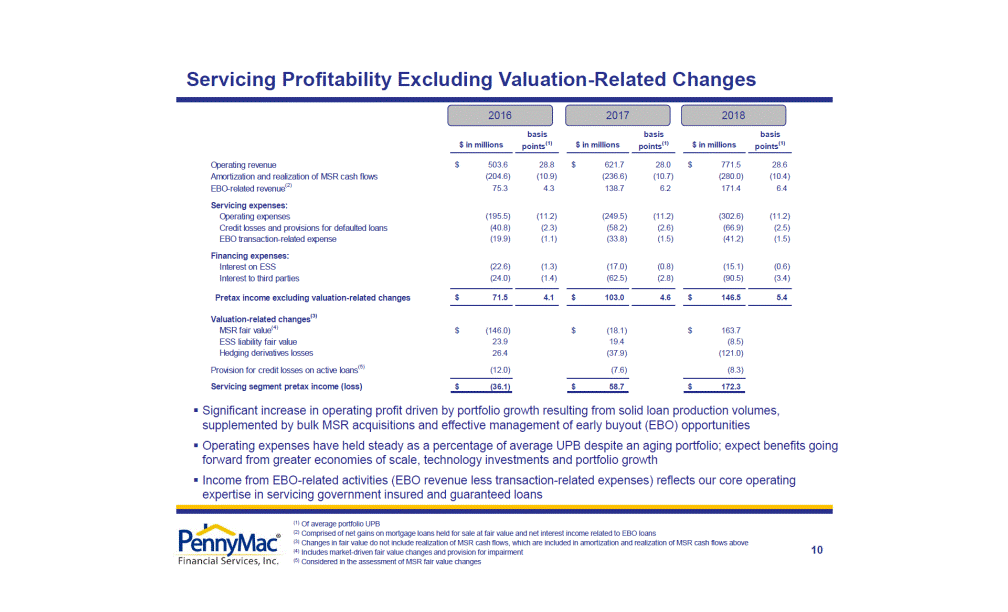
8 (UPB in billions) Servicing Portfolio by Investor Consistent Servicing Portfolio Growth, Mainly Organic (UPB in billions) Net Portfolio Growth (UPB in billions) Loan Servicing Portfolio Composition (1) Owned portfolio in predominantly government-insured and guaranteed loans under the FHA, VA, and USDA programs. (2) Represents PMT’s MSRs. Excludes distressed loan investments (3) Early buyouts of delinquent loans from Ginnie Mae pools during the period (4) Also includes loans servicing released in connection with recent asset sales by PMT (5) Includes consumer direct production, government correspondent acquisitions, and conventional conforming and jumbo loan acquisitions subserviced for PMT (4) (5) Selected Operational Metrics 3Q18 4Q18 Loans serviced (in thousands) 1,392 1,490 active 60+ delinquent loan count at 9/30 27,361 30,799 34,063 Total Active loan count 1,101,540 1,210,136 1,327,909 60+ day delinquency rate - owned portfolio(1) 3.1% 3.3% 60+ day delinquency rate - sub-serviced portfolio(2) 0.5% 0.5% Actual CPR - owned portfolio(1) 12.3% 9.8% Actual CPR - sub-serviced(2) 8.7% 7.5% UPB of completed modifications ($ in millions) $1,190 $519 202.5876 252.4324 EBO transactions ($ in millions)(3) $974 $495 24.60% Mods april $156,499,812 may $232,017,737 june $190,688,715 $579,206,264 july $168,300,513 august $166,142,010 september $147,022,051 total $481,464,574 October $107,375,225 November $120,350,445 December $152,331,212 Jan-18 $148,068,128 82.9 82.81 Feb-18 $161,501,296 84.15 82.25 Mar-18 $232,078,182 83.64 84.24 Apr-18 $263,621,523 May-18 $352,396,248 Jun-18 $422,310,309 Jul-18 $640,948,400 Aug-18 $318,787,262 Sep-18 $230,209,253 Oct-18 $187,594,848 Nov-18 $163,217,525 Dec-18 $168,389,955 4Q18 $519,202,328 $194.2 $245.8 $299.3 2016 2017 2018 Prime owned Prime subserviced Special $245.8 $299.3 ($32.6) $67.6 $18.5 At 12/31/17 Runoff Additions from loan production MSR acquisitions At 12/31/18 $77 $106 $160 $194 $245 $299 367 1,505 0 200 400 600 800 1000 1200 1400 1600 1800 $0 $50 $100 $150 $200 $250 $300 $350 12/31/2013 12/31/2014 12/31/2015 12/31/2016 12/31/2017 12/31/2018 Government Conventional Whole loans & Other Loans serviced (in thousands)
