Exhibit 99.2

First Quarter 2020 Earnings Report

Forward - Looking Statements 2 This presentation contains forward - looking statements within the meaning of Section 21E of the Securities Exchange Act of 1934, as amended, regardinrg management’s beliefs, estimates, projections and assumptions with respect to, among other things, the Company’s financial res ult s, future operations, business plans and investment strategies, as well as industry and market conditions, all of which are subject to change. Words like “b eli eve,” “expect,” “anticipate,” “promise,” “plan,” and other expressions or words of similar meanings, as well as future or conditional verbs such as “will,” “w ould,” “should,” “could,” or “may” are generally intended to identify forward - looking statements. Actual results and operations for any future period may vary material ly from those projected herein and from past results discussed herein. These forward - looking statements include statements regarding the Company’s corporate reorga nization, the expected benefits of such reorganization and the related impact on existing stakeholders, estimates regarding future market capitaliza tio n and the anticipated financial impact of the corporate reorganization. Factors which could cause actual results to differ materially from historical results or those anticipated include, but are not limit ed to: our exposure to risks of loss and disruptions in operations resulting from adverse weather conditions, man - made or natural disasters, climate change and pande mics such as COVID - 19;the continually changing federal, state and local laws and regulations applicable to the highly regulated industry in which we operate; lawsuits or go ver nmental actions that may result from any noncompliance with the laws and regulations applicable to our businesses; the mortgage lendi ng and servicing - related regulations promulgated by the Consumer Financial Protection Bureau and its enforcement of these regulations; our dependence on U.S. government - sponsored entities and changes in their current roles or their guarantees or guidelines; changes to government mortgage modification pr ogr ams; the licensing and operational requirements of states and other jurisdictions applicable to the Company’s businesses, to which our bank competit ors are not subject; foreclosure delays and changes in foreclosure practices; certain banking regulations that may limit our business activities; changes in m acr oeconomic and U.S. real estate market conditions; difficulties inherent in growing loan production volume; difficulties inherent in adjusting the size of ou r o perations to reflect changes in business levels; purchase opportunities for mortgage servicing rights and our success in winning bids; changes in prevailing interest rat es; expected discontinuation of LIBOR; increases in loan delinquencies and defaults; our reliance on PennyMac Mortgage Investment Trust (NYSE: PMT) as a significant source of financing for, and revenue related to, our mortgage banking business; any required additional capital and liquidity to support business grow th that may not be available on acceptable terms, if at all; our obligation to indemnify third - party purchasers or repurchase loans if loans that we originate, acquire, service or assist in the fulfillment of, fail to meet certain criteria or characteristics or under other circumstances; our obligation to indemnify PM T i f our services fail to meet certain criteria or characteristics or under other circumstances; decreases in the returns on the assets that we select and manage for our cli ent s, and our resulting management and incentive fees; the extensive amount of regulation applicable to our investment management segment; conflicts of interest in allocating our services and investment opportunities among us and our advised entities; the effect of public opinion on our reputation; our recent growth ; o ur ability to effectively identify, manage, monitor and mitigate financial risks; our initiation of new business activities or expansion of existing business act ivi ties; our ability to detect misconduct and fraud; and our ability to mitigate cybersecurity risks and cyber incidents;; our ability to pay dividends to our stockhol der s; and our organizational structure and certain requirements in our charter documents. You should not place undue reliance on any forward - looking statement and should consider all of the uncertainties and risks describe d above, as well as those more fully discussed in reports and other documents filed by the Company with the Securities and Exchange Commission from tim e t o time. The Company undertakes no obligation to publicly update or revise any forward - looking statements or any other information contained herein, and the statements made in this presentation are current as of the date of this presentation only

First Quarter Highlights 3 ▪ Net income was $306.2 million; diluted earnings per share (EPS) were $3.73 – Record earnings driven by continued strong production results combined with substantial gains on our interest rate hedge investments which more than offset fair value losses on mortgage servicing rights (MSRs) – Book value per share increased to $29.85 from $26.26 at December 31, 2019 – In March, repurchased approximately 238,000 shares of PFSI’s common stock for an approximate cost of $4.1 million and a weighted average price of $ 17.31 per share – PFSI’s Board of Directors declared a first quarter cash dividend of $0.12 per share, payable on May 28, 2020 to common stockholders of record as of May 18, 2020 ▪ Record Production segment pretax income of $240.1 million, up 18% from 4Q19 and 411% from 1Q19 driven by record volumes in the direct lending channels and elevated margins across all channels – Direct lending locks were a record $9.9 billion in unpaid principal balance (UPB), up 38% from 4Q19 and 229% from 1Q19 o $7.2 billion in UPB of locks in the consumer direct channel; $2.8 billion in UPB of locks in the broker direct channel – Government correspondent lock volume totaled $14.9 billion in UPB, down 8% Q/Q and up 101% Y/Y – Total loan acquisitions and originations were $35.4 billion in UPB, down 17% from 4Q19 and up 113% from 1Q19 – Correspondent acquisitions of conventional loans fulfilled for PennyMac Mortgage Investment Trust (NYSE: PMT) were $16.2 billion in UPB, down 21% from 4Q19 and up 99% from 1Q19
4 ▪ Record servicing segment pretax income of $170.8 million, versus a pretax loss of $5.1 million in 4Q19 and pretax income of $ 11.2 million in 1Q19 – Valuation - related items included $920.3 million in MSR fair value losses offset by $1.1 billion in hedging and other gains; net impact on pretax income was $130.8 million and on EPS was $1.17 – Pretax income excluding valuation - related items was $42.3 million, up 8% from 4Q19 and 20% from 1Q19 – Servicing portfolio grew to $384.2 billion in UPB, up 4% from December 31, 2019 and 18% from March 31, 2019 ▪ Investment Management segment pretax income was $ 3.8 million, down from $ 5.2 million in 4Q19 and up from $2.1 million in 1Q19 – Revenue of $ 9.9 million, down 16% from 4Q19 and up 12% from 1Q19 – Net assets under management (AUM) were $ 1.8 billion, down 26% from December 31, 2019 driven by a reduction in PMT’s shareholders’ equity Notable activity after quarter - end: ▪ In April, after more than a year in development, PennyMac Financial announced an enhancement to PNMAC GMSR ISSUER TRUST, to provide private market financing for Ginnie Mae servicing advances – PFSI currently has $600 million of committed capacity available to finance Ginnie Mae MSRs and servicing advances First Quarter Highlights (continued)

Developments That Have Affected the Mortgage Markets 5 ▪ Substantial slowdown in the economy related to COVID - 19 and public health measures ‒ Over the last six weeks 30.3 million workers have filed jobless claims, evidencing increased hardships for homeowners and borrowers leading to expectations for higher delinquencies in the future ▪ In response the federal government enacted the CARES Act, providing $2 trillion of fiscal stimulus as well as granting homeowners with federally backed mortgages up to 12 months of forbearance if impacted directly or indirectly by COVID - 19 ‒ Requests for forbearance designed to reduce consumer credit losses but increase the advance obligations for mortgage servicers, putting strain on the liquidity of undercapitalized sellers/servicers ▪ Financial markets have also experienced substantial volatility and reduced liquidity ‒ In response, the Federal Reserve reduced the Fed Funds rate to near zero and the Federal Open Market Committee announced it would purchase at least $500 billion of Treasury securities and at least $200 billion of Agency mortgage - backed securities to support liquidity ‒ Significant decline in the value of many credit assets, including government - sponsored enterprise (GSE) credit risk transfer (CRT) – driven by increased expectations for delinquencies and actual losses in addition to increased returns required by market participants ‒ Reduction of servicing asset values driven by the estimated impact on servicing costs and liquidity from higher expected delinquencies as a result of forbearance ▪ PFSI’s strong balance sheet, low leverage and disciplined approach to liquidity management have been critically important in this market environment; total liquidity has increased since February
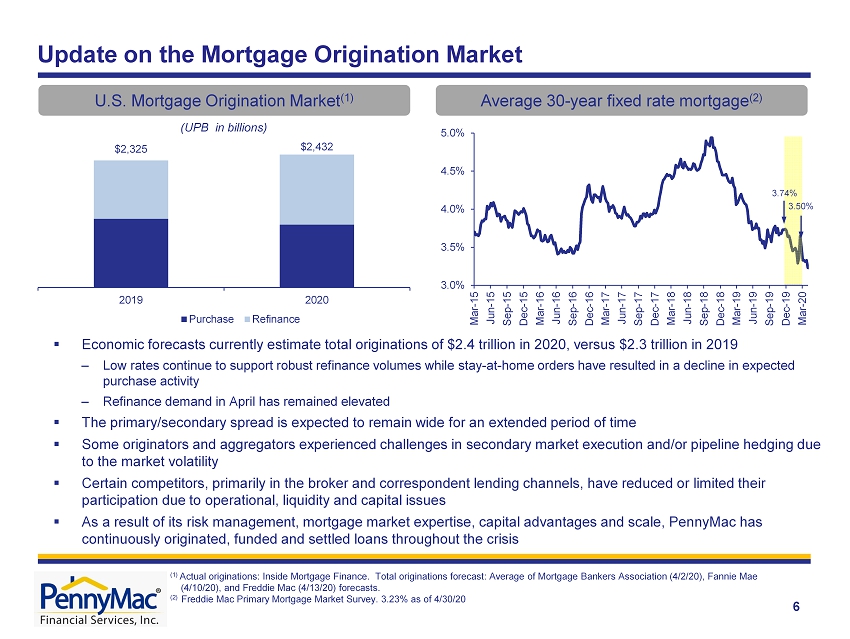
3.0% 3.5% 4.0% 4.5% 5.0% Mar-15 Jun-15 Sep-15 Dec-15 Mar-16 Jun-16 Sep-16 Dec-16 Mar-17 Jun-17 Sep-17 Dec-17 Mar-18 Jun-18 Sep-18 Dec-18 Mar-19 Jun-19 Sep-19 Dec-19 Mar-20 Update on the Mortgage Origination Market 6 U.S. Mortgage Origination Market (1) (UPB in billions) (1) Actual originations: Inside Mortgage Finance. Total originations forecast: Average of Mortgage Bankers Association (4/2/20), Fa nnie Mae (4/10/20), and Freddie Mac (4/13/20) forecasts. (2) Freddie Mac Primary Mortgage Market Survey. 3.23% as of 4/30/20 $2,325 $2,432 2019 2020 Purchase Refinance Average 30 - year fixed rate mortgage (2) 3.74% 3.50% ▪ Economic forecasts currently estimate total originations of $2.4 trillion in 2020, versus $2.3 trillion in 2019 ‒ Low rates continue to support robust refinance volumes while stay - at - home orders have resulted in a decline in expected purchase activity ‒ Refinance demand in April has remained elevated ▪ The primary/secondary spread is expected to remain wide for an extended period of time ▪ Some originators and aggregators experienced challenges in secondary market execution and/or pipeline hedging due to the market volatility ▪ Certain competitors, primarily in the broker and correspondent lending channels, have reduced or limited their participation due to operational, liquidity and capital issues ▪ As a result of its risk management, mortgage market expertise, capital advantages and scale, PennyMac has continuously originated, funded and settled loans throughout the crisis
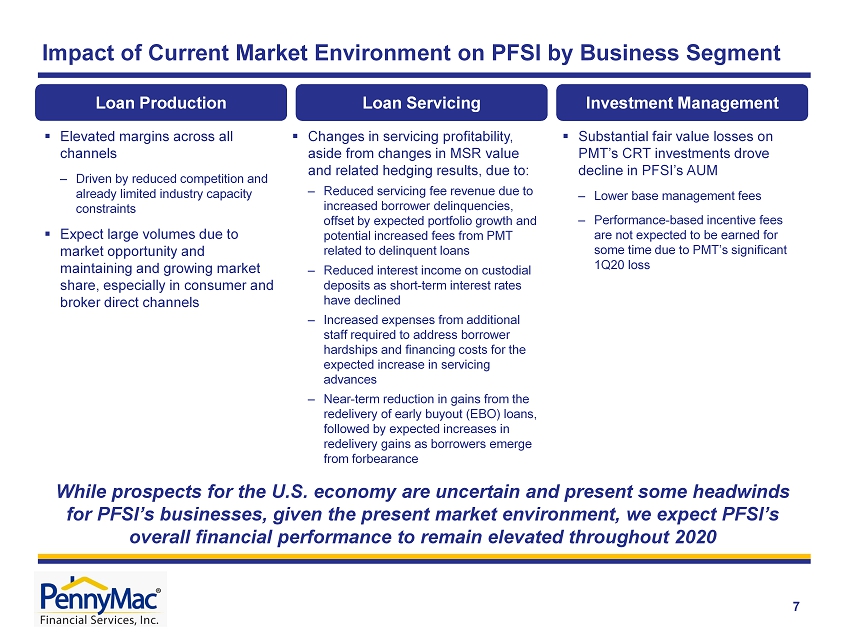
7 Impact of Current Market Environment on PFSI by Business Segment Loan Production Loan Servicing Investment Management ▪ Elevated margins across all channels ‒ Driven by reduced competition and already limited industry capacity constraints ▪ Expect large volumes due to market opportunity and maintaining and growing market share, especially in consumer and broker direct channels ▪ Substantial fair value losses on PMT’s CRT investments drove decline in PFSI’s AUM ‒ Lower base management fees ‒ Performance - based incentive fees are not expected to be earned for some time due to PMT’s significant 1Q20 loss ▪ Changes in servicing profitability, aside from changes in MSR value and related hedging results, due to: ‒ Reduced servicing fee revenue due to increased borrower delinquencies, offset by expected portfolio growth and potential increased fees from PMT related to delinquent loans ‒ Reduced interest income on custodial deposits as short - term interest rates have declined ‒ Increased expenses from additional staff required to address borrower hardships and financing costs for the expected increase in servicing advances ‒ Near - term reduction in gains from the redelivery of early buyout (EBO) loans, followed by expected increases in redelivery gains as borrowers emerge from forbearance While prospects for the U.S. economy are uncertain and present some headwinds for PFSI’s businesses, given the present market environment, we expect PFSI’s overall financial performance to remain elevated throughout 2020
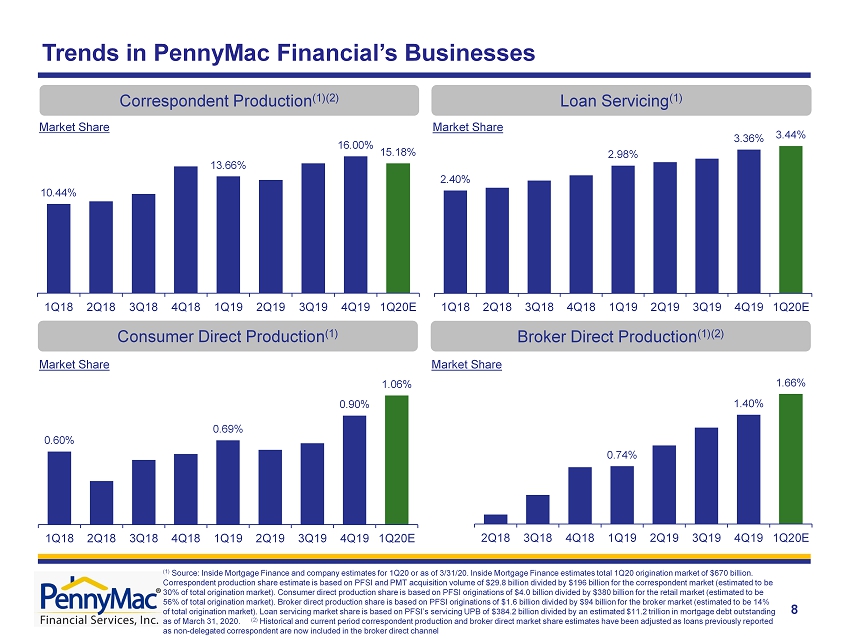
Correspondent Production (1)(2) Market Share Market Share Consumer Direct Production (1 ) Loan Servicing (1) Market Share Broker Direct Production (1)(2) Market Share 8 Trends in PennyMac Financial’s Businesses (1) Source: Inside Mortgage Finance and company estimates for 1Q20 or as of 3/31/20. Inside Mortgage Finance estimates total 1Q20 o rigination market of $670 billion. Correspondent production share estimate is based on PFSI and PMT acquisition volume of $29.8 billion divided by $196 billion for the correspondent market (estimated to be 30% of total origination market). Consumer direct production share is based on PFSI originations of $4.0 billion divided by $380 billion for the retail market (estimated to be 56% of total origination market). Broker direct production share is based on PFSI originations of $1.6 b illion divided by $94 billion for the broker market (estimated to be 14% of total origination market). Loan servicing market share is based on PFSI’s servicing UPB of $384.2 billion divided by an es tim ated $11.2 trillion in mortgage debt outstanding as of March 31, 2020. (2) Historical and current period correspondent production and broker direct market share estimates have been adjusted as loans p re viously reported as non - delegated correspondent are now included in the broker direct channel 2.40% 2.98% 3.36% 3.44% 1Q18 2Q18 3Q18 4Q18 1Q19 2Q19 3Q19 4Q19 1Q20E 10.44% 13.66% 16.00% 15.18% 1Q18 2Q18 3Q18 4Q18 1Q19 2Q19 3Q19 4Q19 1Q20E 0.74% 1.40% 1.66% 2Q18 3Q18 4Q18 1Q19 2Q19 3Q19 4Q19 1Q20E 0.60% 0.69% 0.90% 1.06% 1Q18 2Q18 3Q18 4Q18 1Q19 2Q19 3Q19 4Q19 1Q20E
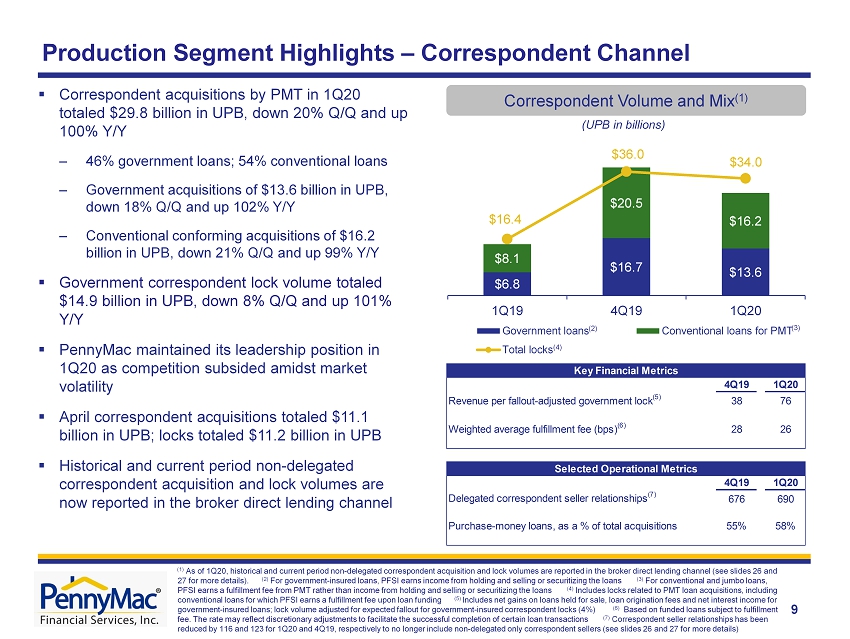
$6.8 $16.7 $13.6 $8.1 $20.5 $16.2 $16.4 $36.0 $34.0 1Q19 4Q19 1Q20 Government loans Conventional loans for PMT Total locks 9 (UPB in billions) Correspondent Volume and Mix (1) Production Segment Highlights – Correspondent Channel (3) (4) ▪ Correspondent acquisitions by PMT in 1Q20 totaled $29.8 billion in UPB, down 20% Q/Q and up 100% Y/Y – 46% government loans; 54% conventional loans – Government acquisitions of $ 13.6 billion in UPB, down 1 8 % Q/Q and up 102% Y/Y – Conventional conforming acquisitions of $16.2 billion in UPB, down 21% Q/Q and up 99% Y/Y ▪ Government correspondent lock volume totaled $14.9 billion in UPB, down 8 % Q/Q and up 101% Y/Y ▪ PennyMac maintained its leadership position in 1Q20 as competition subsided amidst market volatility ▪ April correspondent acquisitions totaled $11.1 billion in UPB; locks totaled $11.2 billion in UPB ▪ Historical and current period non - delegated correspondent acquisition and lock volumes are now reported in the broker direct lending channel (1) As of 1Q20, historical and current period non - delegated correspondent acquisition and lock volumes are reported in the broker d irect lending channel (see slides 26 and 27 for more details). (2) For government - insured loans, PFSI earns income from holding and selling or securitizing the loans (3) For conventional and jumbo loans, PFSI earns a fulfillment fee from PMT rather than income from holding and selling or securitizing the loans (4) Includes locks related to PMT loan acquisitions, including conventional loans for which PFSI earns a fulfillment fee upon loan funding (5) Includes net gains on loans held for sale, loan origination fees and net interest income for government - insured loans; lock volume adjusted for expected fallout for government - insured correspondent locks (4%) (6) Based on funded loans subject to fulfillment fee. The rate may reflect discretionary adjustments to facilitate the successful completion of certain loan transactions (7) Correspondent seller relationships has been reduced by 116 and 123 for 1Q20 and 4Q19, respectively to no longer include non - delegated only correspondent sellers (see slides 26 and 27 for more details) (2) 4Q19 1Q20 Revenue per fallout-adjusted government lock (5) 38 76 Weighted average fulfillment fee (bps) (6) 28 26 4Q19 1Q20 Delegated correspondent seller relationships (7) 676 690 Purchase-money loans, as a % of total acquisitions 55% 58% Key Financial Metrics Selected Operational Metrics
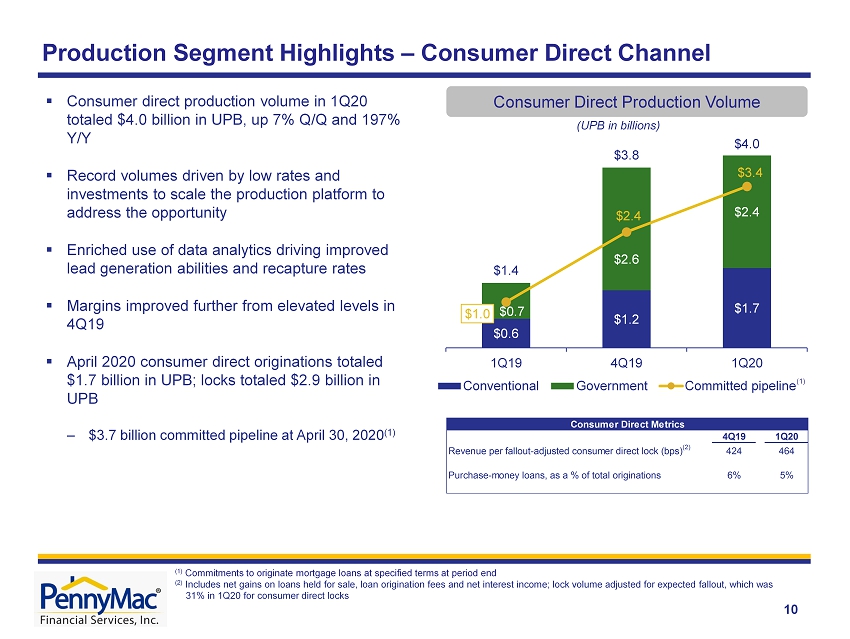
$0.6 $1.2 $1.7 $0.7 $2.6 $2.4 $1.4 $3.8 $4.0 $1.0 $2.4 $3.4 1Q19 4Q19 1Q20 Conventional Government Committed pipeline (UPB in b illions ) Consumer Direct Production Volume 10 Production Segment Highlights – Consumer Direct Channel (1) (1) Commitments to originate mortgage loans at specified terms at period end (2) Includes net gains on loans held for sale, loan origination fees and net interest income; lock volume adjusted for expected fallout , which was 31% in 1Q20 for consumer direct locks ▪ Consumer direct production volume in 1Q20 totaled $4.0 billion in UPB, up 7 % Q/Q and 197% Y/Y ▪ Record volumes driven by low rates and investments to scale the production platform to address the opportunity ▪ Enriched use of data analytics driving improved lead generation abilities and recapture rates ▪ Margins improved further from elevated levels in 4Q19 ▪ April 2020 consumer direct originations totaled $1.7 billion in UPB; locks totaled $2.9 billion in UPB – $3.7 billion committed pipeline at April 30, 2020 (1) 4Q19 1Q20 Revenue per fallout-adjusted consumer direct lock (bps) (2) 424 464 Purchase-money loans, as a % of total originations 6% 5% Consumer Direct Metrics

$0.2 $0.9 $1.2 $0.1 $0.5 $0.4 $0.4 $1.4 $1.6 $0.3 $0.6 $1.2 1Q19 4Q19 1Q20 Conventional loans Government loans Committed pipeline 11 Production Segment Highlights – Broker Direct Channel Broker Direct Production Volume (1) (UPB in b illions ) (2) (1) As of 1Q20, historical and current period non - delegated correspondent acquisition and lock volumes are reported in the broker di rect lending channel (see pages 26 and 27 for more details). For guaranteed non - delegated loans, PFSI earns income from holding and selling or securitizing the loans. ( 2 ) Commitments to originate mortgage loans at specified terms at period end; as of 1Q20 non - delegated loans were reclassified to the broker direct channel. Committed pipeline for 1Q20 includes $576M in non - delegated loans (3) Includes net gains on loans held for sale, loan origination fees and net interest income; lock volume adjusted for expected fallout, which was 23% in 1Q20 for broker direct locks (4) Non - delegated correspondent sellers previously reported as correspondent sellers under the correspondent channel ▪ Historical and current period non - delegated correspondent acquisition and lock volumes are now reported in the broker direct lending channel ▪ Broker direct production volume in 1Q20 totaled $1.6 b illion in UPB, up 10% Q/Q and up from $369 million in 1Q19 ▪ Lock volume of $2.8 billion in UPB, up 62% Q/Q and up from $0.7 b illion in 1Q19 ▪ Approved brokers totaled 1,074 at March 31, 2020, up 11% from December 31, 2019 ▪ Continue to increase capacity to address elevated demand and grow market position ▪ April 2020 broker direct originations totaled $700 million in UPB; locks totaled $1.3 b illion in UPB – $1.6 billion committed pipeline at April 30, 2020 (2) 4Q19 1Q20 Revenue per fallout-adjusted broker direct lock (bps) (3) 116 162 Approved brokers 968 1,074 Non-delegated only correspondent sellers (4) 123 116 Purchase-money loans, as a % of total originations 41% 33% Broker Direct Metrics

$368.7 $384.2 $(22.2) $35.4 $2.4 At 12/31/19 Runoff Additions from loan production MSR acquisitions At 3/31/20 (1) 12 Servicing Segment Highlights (1) Owned portfolio in predominantly government - insured and guaranteed loans under the FHA (53%), VA (38%), and USDA (9%) programs; delinquency data based on loan count (i.e., not UPB) (2) Represents PMT’s MSRs. Excludes distressed loan investments (3) Early buyouts of delinquent loans from Ginnie Mae pools during the period (4) Also includes loans servicing released in connection with recent asset sales by PMT (5) Includes consumer direct production, government correspondent acquisitions, and conventional conforming and jumbo loan acquis it ions subserviced for PMT (UPB in billions ) ▪ Servicing portfolio totaled $384.2 billion in UPB at March 31, 2020, up 4% Q/Q and 18% Y/Y ▪ Strong production volumes continue to support portfolio growth despite elevated prepayment activity ▪ Modest decrease in delinquency rate at March 31 driven by seasonal factors; expected to significantly increase due to COVID - 19 hardships and forbearance Loan Servicing Portfolio Composition Net Portfolio Growth (UPB in billions ) (4) (5) $324.7 $368.7 $384.2 3/31/2019 12/31/2019 3/31/2020 Prime owned Prime subserviced and other 4Q19 1Q20 Loans serviced (in thousands) 1,778 1,839 60+ day delinquency rate - owned portfolio (1) 3.7% 3.3% 60+ day delinquency rate - sub-serviced portfolio (2) 0.4% 0.4% Actual CPR - owned portfolio (1) 21.0% 20.6% Actual CPR - sub-serviced (2) 20.0% 19.2% UPB of completed modifications ($ in millions) $546 $713 EBO loan volume ($ in millions) (3) $1,682 $1,637 Selected Operational Metrics
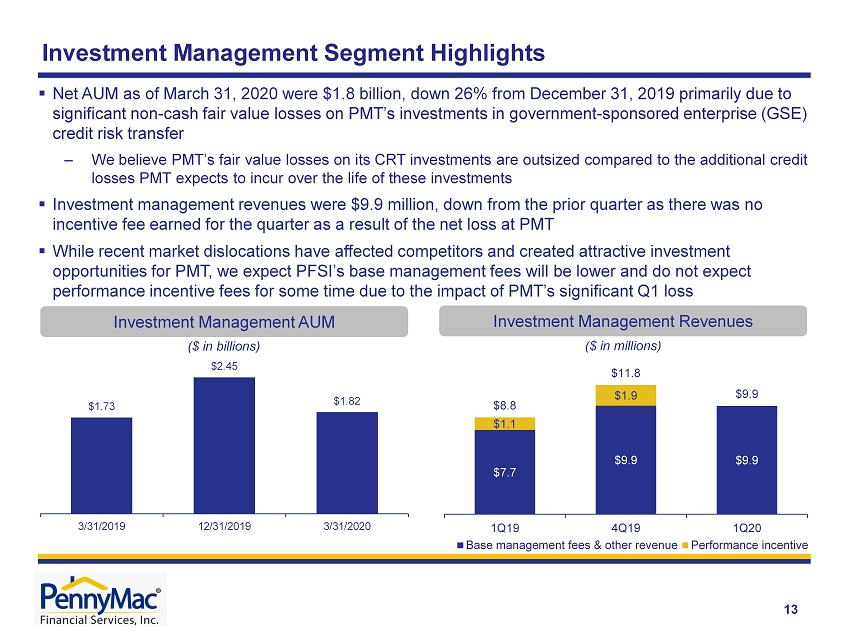
Investment Management Revenues (1) 13 Investment Management Segment Highlights Investment Management AUM ($ in billions ) ▪ Net AUM as of March 31, 2020 were $1.8 billion, down 26% from Dec ember 31, 2019 primarily due to significant non - cash fair value losses on PMT’s investments in government - sponsored enterprise (GSE) credit risk transfer ‒ We believe PMT’s fair value losses on its CRT investments are outsized compared to the additional credit losses PMT expects to incur over the life of these investments ▪ Investment management revenues were $9.9 million, down from the prior quarter as there was no incentive fee earned for the quarter as a result of the net loss at PMT ▪ While recent market dislocations have affected competitors and created attractive investment opportunities for PMT, we expect PFSI’s base management fees will be lower and do not expect performance incentive fees for some time due to the impact of PMT’s significant Q1 loss ($ in millions ) $7.7 $9.9 $9.9 $1.1 $1.9 $8.8 $11.8 $9.9 1Q19 4Q19 1Q20 Base management fees & other revenue Performance incentive $1.73 $2.45 $1.82 3/31/2019 12/31/2019 3/31/2020

14 MSR Valuation Changes and Offsets ($ in millions) Hedging Approach Continues to Moderate the Volatility of PFSI’s Results Note: Figures may not sum exactly due to rounding ▪ PFSI seeks to moderate the impact of interest rate changes on the fair value of its MSR asset through a comprehensive hedge strategy that also considers production - related income ▪ MSR fair value decreased significantly in 1Q20 – Expectations for increased prepayment activity in the future related to lower interest rates – Higher expected cost to service due to increases in delinquencies – Increased returns demanded by market participants – Decrease represented approximately 31% of the fair value at December 31, 2019 ▪ Hedging and other gains more than offset MSR fair value losses – Utilizing option coverage for significant movements in rates provided substantial benefit in 1Q20 ($164.9) $160.6 ($920.3) $138.6 ($194.6) $1,051.1 $47.0 $203.3 $240.1 1Q19 4Q19 1Q20 MSR fair value change before recognition of realization of cash flows Hedging and other gains (losses) Production pretax income

15 (1) Of average portfolio UPB, annualized (2) Comprised of net gains on mortgage loans held for sale at fair value and net interest income related to EBO loans (3) Changes in fair value do not include realization of MSR cash flows, which are included in a mortization and realization of MSR cash flows above (4) Includes fair value changes and provision for impairment (5) Considered in the assessment of MSR fair value changes 1Q20 Servicing Profitability Excluding Valuation - Related Changes 1Q20 ▪ Operating revenue decreased Q/Q driven by decreased income from custodial deposits due to lower earnings rates ▪ Operating expenses decreased as a percentage of the average servicing portfolio; full quarter of cost savings related to Serv ici ng Systems Environment (SSE) offset by seasonally higher expenses in Q1 related to payroll taxes and benefits ▪ Interest shortfall from prepayments decreased modestly Q/Q but remains elevated ▪ Credit losses and provisions for defaulted loans decreased Q/Q due to a combination of seasonality and initiatives related to lo ss mitigation ▪ EBO - related income increased Q/Q driven by gains from the reperformance of loans bought out in prior periods 4Q19 1 Q19 $ in millions basis points (1) $ in millions basis points (1) $ in millions basis points (1) Operating revenue 225.0$ 29.2 273.0$ 30.4 266.5$ 28.3 Realization of MSR cash flows (92.5) (12.0) (113.1) (12.6) (114.9) (12.2) EBO loan-related revenue (2) 35.1 4.6 40.3 4.5 47.8 5.1 Servicing expenses: Operating expenses (75.8) (9.8) (80.5) (9.0) (84.1) (8.9) Interest shortfall (4.3) (0.6) (16.5) (1.8) (14.9) (1.6) Credit losses and provisions for defaulted loans (15.1) (2.0) (23.8) (2.6) (16.0) (1.7) EBO loan transaction-related expense (10.7) (1.4) (18.5) (2.1) (18.6) (2.0) Financing expenses: Interest on ESS (3.1) (0.4) (2.2) (0.2) (2.0) (0.2) Interest to third parties (23.3) (3.0) (19.7) (2.2) (21.6) (2.3) Pretax income excluding valuation-related changes 35.3$ 4.6 39.1$ 4.4 42.3$ 4.5 Valuation-related changes (3) MSR fair value (4) (164.9) 160.6 (920.3) ESS liability fair value 4.1 (2.3) 14.5 Hedging derivatives gains 134.6 (192.4) 1,036.6 Provision for credit losses on active loans (5) 2.2 (10.2) (2.3) Servicing segment pretax income 11.2$ (5.1)$ 170.8$ Average servicing portfolio UPB 308,212$ 359,022$ 377,295$
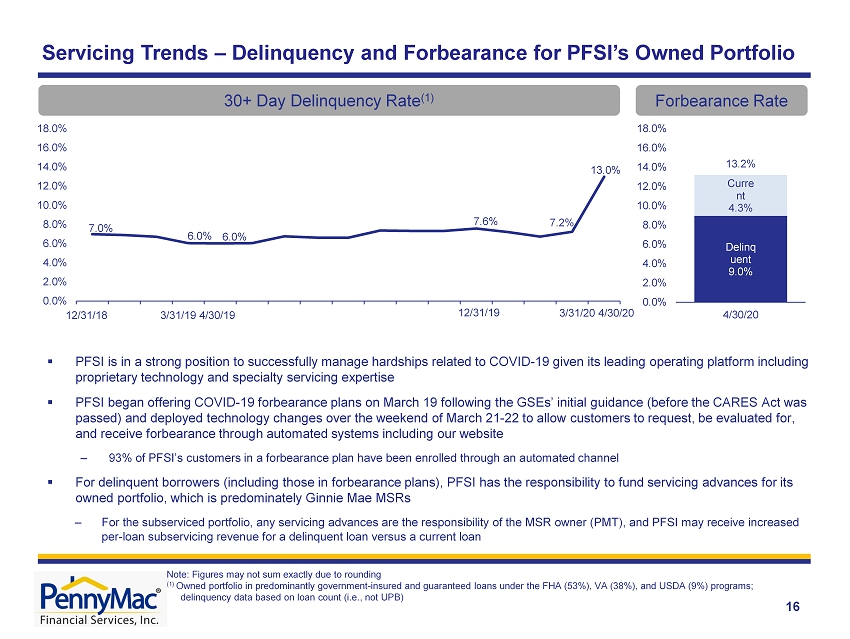
7.0% 6.0% 6.0% 7.6% 7.2% 13.0% 0.0% 2.0% 4.0% 6.0% 8.0% 10.0% 12.0% 14.0% 16.0% 18.0% 12/31/18 3/31/19 6/30/19 9/30/19 12/31/19 3/31/20 Servicing Trends – Delinquency and Forbearance for PFSI’s Owned Portfolio 16 ▪ PFSI is in a strong position to successfully manage hardships related to COVID - 19 given its leading operatin g platform including proprietary technology and specialty servicing expertise ▪ PFSI began offering COVID - 19 forbearance plans on March 19 following the GSEs’ initial guidance (before the CARES Act was passed) and deployed technology changes over the weekend of March 21 - 22 to allow customers to request, be evaluated for, and receive forbearance through automated systems including our website – 93 % of PFSI’s customers in a forbearance plan have been enrolled through an automated channel ▪ For delinquent borrowers (including those in forbearance plans), PFSI has the responsibility to fund servicing advances for i ts owned portfolio, which is predominately Ginnie Mae MSRs ‒ For the subserviced portfolio, any servicing advances are the responsibility of the MSR owner (PMT), and PFSI may receive increased per - loan subservicing revenue for a delinquent loan versus a current loan 30+ Day Delinquency Rate (1) 12/31/18 3/31/19 4/30/19 12/31/19 3/31/20 4/30/20 Forbearance Rate Note: Figures may not sum exactly due to rounding ( 1) Owned portfolio in predominantly government - insured and guaranteed loans under the FHA (53%), VA (38%), and USDA (9%) programs; delinquency data based on loan count (i.e., not UPB) Delinq uent 9.0% Curre nt 4.3% 13.2% 0.0% 2.0% 4.0% 6.0% 8.0% 10.0% 12.0% 14.0% 16.0% 18.0% 4/30/20
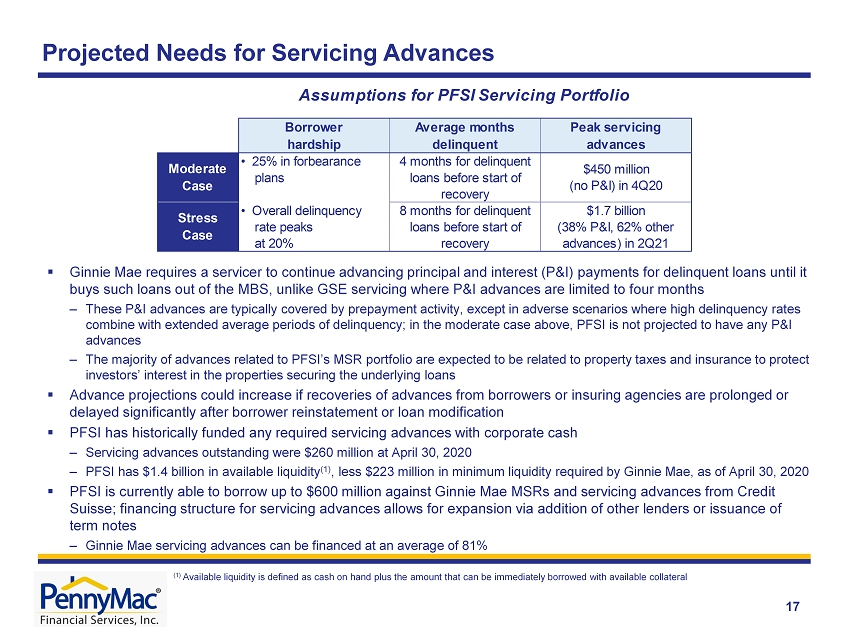
17 Projected Needs for Servicing Advances ▪ Ginnie Mae requires a servicer to continue advancing principal and interest (P&I) payments for delinquent loans until it buys such loans out of the MBS, unlike GSE servicing where P&I advances are limited to four months ‒ These P&I advances are typically covered by prepayment activity, except in adverse scenarios where high delinquency rates combine with extended average periods of delinquency; in the moderate case above, PFSI is not projected to have any P&I advances ‒ The majority of advances related to PFSI’s MSR portfolio are expected to be related to property taxes and insurance to protec t investors’ interest in the properties securing the underlying loans ▪ Advance projections could increase if recoveries of advances from borrowers or insuring agencies are prolonged or delayed significantly after borrower reinstatement or loan modification ▪ PFSI has historically funded any required servicing advances with corporate cash ‒ Servicing advances outstanding were $260 million at April 30, 2020 ‒ PFSI has $1.4 billion in available liquidity (1) , less $223 million in minimum liquidity required by Ginnie Mae, as of April 30, 2020 ▪ PFSI is currently able to borrow up to $600 million against Ginnie Mae MSRs and servicing advances from Credit Suisse; financing structure for servicing advances allows for expansion via addition of other lenders or issuance of term notes ‒ Ginnie Mae servicing advances can be financed at an average of 81% (1 ) Available liquidity is defined as cash on hand plus the amount that can be immediately borrowed with available collateral Borrower hardship Average months delinquent Peak servicing advances Moderate Case 4 months for delinquent loans before start of recovery $450 million (no P&I) in 4Q20 Stress Case 8 months for delinquent loans before start of recovery $1.7 billion (38% P&I, 62% other advances) in 2Q21 Assumptions for PFSI Servicing Portfolio • 25% in forbearance plans • Overall delinquency rate peaks at 20%

Appendix

▪ Complex and highly regulated mortgage industry requires effective governance, compliance and operating systems ▪ Operating platform has been developed organically and is highly scalable ▪ Commitment to strong corporate governance, compliance and risk management since inception ▪ PFSI is well positioned for continued growth in this market and regulatory environment Loan Production Loan Servicing Investment Management ▪ Servicing for owned MSRs and subservicing for PMT ▪ Major loan servicer for Fannie Mae, Freddie Mac and Ginnie Mae ▪ Industry - leading capabilities in special servicing ▪ Organic growth results from loan production, supplemented by MSR acquisitions and PMT investment activity ▪ External manager of PMT, which invests in mortgage - related assets: – GSE credit risk transfers – MSRs and ESS – Investments in prime non - Agency MBS and asset - backed securities ▪ Synergistic partnership with PMT ▪ Correspondent aggregation of newly originated loans from third - party sellers – PFSI earns gains on delegated government - insured and non - delegated loans – Fulfillment fees for PMT’s delegated conventional loans ▪ Consumer direct origination of conventional and government - insured loans ▪ Broker direct origination launched in 2018 19 Overview of PennyMac Financial’s Businesses

PennyMac Financial Is a Strong Independent Mortgage Company 20 ▪ Comprehensive mortgage platform and balanced model with leading production and servicing businesses ▪ Strong balance sheet with low leverage versus competitors – Debt to equity of 2.7x ▪ Diversified liquidity sources and term debt that finances the largest long - term asset (MSRs) – Unique and cost effective funding structures with strong bank partnerships to support growth ▪ Well - developed and sophisticated risk management structure combines extensive market expertise with technology to identify and monitor risks across the enterprise ▪ PFSI’s strong balance sheet, low leverage, and disciplined approach to liquidity management have proven critically important in the current market environment Considerable oversight from State regulators, the CFPB, GSEs, ratings agencies and bank counterparties As of March 31, 2020 ($ in millions) Mortgage Servicing Rights $2,194 Servicing Advances $300 Cash & Short - term Investments, receivables, other $1,875 Loans eligible for repurchase $981 Loans Held for Sale $5,542 Stockholders' Equity $2,364 MSR Financing $1,345 ESS Financing $157 Other Liabilities & Payables $1,121 Liability for loans eligible for repurchase $981 Warehouse Financing $4,923 $10,891 $10,891 Assets Liabilities & Equity

▪ MSR financing structure to include servicer advances 21 PFSI Has Developed in a Sustainable Manner for Long - Term Growth ▪ Disciplined growth to address the demands of the GSEs, Agencies, regulators and our financing partners - Since inception, PennyMac has focused on building and testing processes and systems before adding significant transaction volumes ▪ Highly experienced management team has created a robust corporate governance system centered on compliance, risk management and quality control ▪ Operations launched; de novo build of legacy - free mortgage servicer ▪ Raised $500 million of capital in private opportunity funds ▪ PMT formed in an initial public offering raising $320 million ▪ Correspondent group established with a focus on operations development and process design ▪ Added servicing leadership for prime portfolio and to drive scalable growth ▪ Correspondent system launches ▪ Expanded infrastructure with flagship operations facility in Moorpark, CA ▪ Correspondent leadership team expands ▪ Expanded infrastructure in Tampa, FL ▪ Became largest non - bank correspondent aggregator ▪ PFSI completed initial public offering ▪ Expanded infrastructure in Fort Worth, TX ▪ Continued organic growth ▪ Servicing UPB reaches $100 billion ▪ Stockholders’ equity surpasses $1 billion ▪ Substantial growth in consumer direct capacity ▪ Issued MSR - backed term notes ▪ PFSI completes corporate reorganization ▪ Launched proprietary, cloud - based Servicing Systems Environment (SSE) Period End: Employees: 2008 2009 2010 2011 2012 2013 2014 2015 2016 2017 2018 2019 2008 2009 2010 2011 2012 2013 2014 2015 2016 2017 2018 2019 2020 (1) 72 128 230 435 1,008 1,373 1,816 2,523 3,099 3,248 3,460 4,215 4,458 2020 (1) 2020 figure is as of March 31, 2020
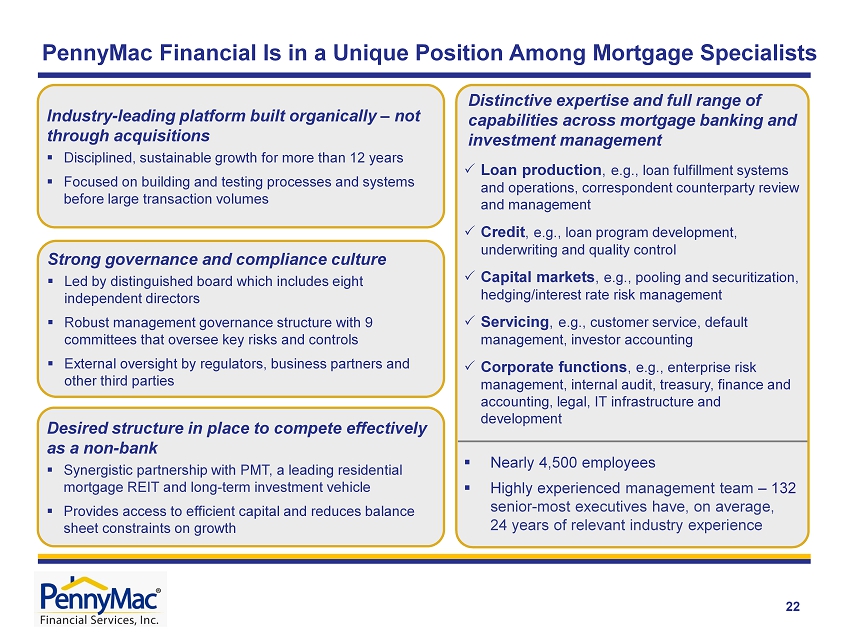
22 Industry - leading platform built organically – not through acquisitions ▪ Disciplined, sustainable growth for more than 12 years ▪ Focused on building and testing processes and systems before large transaction volumes Distinctive expertise and full range of capabilities across mortgage banking and investment management Loan production , e.g., loan fulfillment systems and operations, correspondent counterparty review and management Credit , e.g., loan program development, underwriting and quality control Capital markets , e.g., pooling and securitization, hedging/interest rate risk management Servicing , e.g., customer service, default management, investor accounting Corporate functions , e.g., enterprise risk management, internal audit, treasury, finance and accounting, legal, IT infrastructure and development ▪ Nearly 4,500 employees ▪ Highly experienced management team – 132 senior - most executives have, on average, 24 years of relevant industry experience Strong governance and compliance culture ▪ Led by distinguished board which includes eight independent directors ▪ Robust management governance structure with 9 committees that oversee key risks and controls ▪ External oversight by regulators, business partners and other third parties Desired structure in place to compete effectively as a non - bank ▪ Synergistic partnership with PMT, a leading residential mortgage REIT and long - term investment vehicle ▪ Provides access to efficient capital and reduces balance sheet constraints on growth PennyMac Financial Is in a Unique Position Among Mortgage Specialists

23 Why Are MSR Sales Occurring? How Do MSRs Come to Market? ▪ Large servicers may sell MSRs due to operational pressures, regulatory capital constraints for banks and a re - focus on core customers/businesses ▪ Independent mortgage banks sell MSRs from time to time due to a need for capital ▪ Opportunities may arise in the current market driven by dislocation and liquidity concerns ▪ Intermittent large bulk portfolio sales ($10+ billion in UPB) – Require considerable coordination with selling institutions and Agencies ▪ Mini - bulk sales (typically $500 million to $5 billion in UPB) ▪ Flow/co - issue MSR transactions (monthly commitments, typically $20 - $100 million in UPB) – Alternative delivery method typically from larger independent originators Which MSR Transactions Are Attractive? ▪ GSE and Ginnie Mae servicing in which PFSI has distinctive expertise ▪ MSRs sold and operational servicing transferred to PFSI (not subserviced by a third party) ▪ Measurable representation and warranty liability for PFSI PFSI is uniquely positioned to be a successful acquirer of MSRs • Proven track record of complex MSR and distressed loan transfers • Operational platform that addresses the demands of the Agencies, regulators and financing partners • Physical capacity in place to sustain servicing portfolio growth plans • Potential co - investment opportunity for PMT in the ESS Opportunity in MSR Acquisitions

24 Excess Servicing Spread (e.g., 12.5bp) MSR Asset (e.g., 25bp servicing fee) Acquired by PFSI from Third - Party Seller (1) ▪ PMT has co - invested in Agency MSRs acquired from third - party sellers by PFSI; presently only related to certain Ginnie Mae MSRs ▪ PMT acquires the right to receive the ESS cash flows over the life of the underlying loans ▪ PFSI owns the MSRs and services the loans (1) The contractual servicer and MSR owner is PLS, an indirect wholly - owned subsidiary of PFSI (2) Subject and subordinate to Agency rights (under the related servicer or issuer guide ) and, as applicable, to PFSI’s pledge of MSRs under a note payable; does not change the contractual servicing fee paid by the Agency to the servicer Excess Servicing Spread (2) ▪ Interest income from a portion of the contractual servicing fee – Realized yield dependent on prepayment speeds and recapture Base MSR ▪ Income from a portion of the contractual servicing fee ▪ Also entitled to ancillary income ▪ Bears expenses of performing loan servicing activities ▪ Required to advance certain payments largely for delinquent loans Base MSR (e.g., 12.5bp) Acquired by PMT from PFSI (1) Example transaction: actual transaction details may vary materially PFSI’s Mortgage Servicing Rights Investments in Partnership with PMT
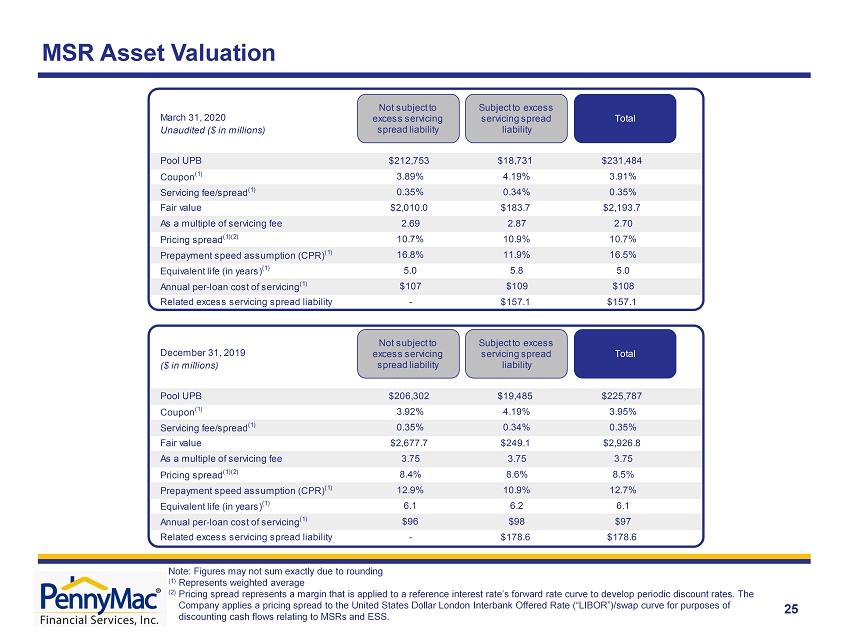
25 MSR Asset Valuation Note: Figures may not sum exactly due to rounding (1) Represents weighted average (2) Pricing spread represents a margin that is applied to a reference interest rate’s forward rate curve to develop periodic disc oun t rates. The Company applies a pricing spread to the United States Dollar London Interbank Offered Rate (“LIBOR”)/swap curve for purposes of discounting cash flows relating to MSRs and ESS. Pool UPB $212,753 $18,731 $231,484 Coupon (1) 3.89% 4.19% 3.91% Servicing fee/spread (1) 0.35% 0.34% 0.35% Fair value $2,010.0 $183.7 $2,193.7 As a multiple of servicing fee 2.69 2.87 2.70 Pricing spread (1)(2) 10.7% 10.9% 10.7% Prepayment speed assumption (CPR) (1) 16.8% 11.9% 16.5% Equivalent life (in years) (1) 5.0 5.8 5.0 Annual per-loan cost of servicing (1) $107 $109 $108 Related excess servicing spread liability - $157.1 $157.1 Pool UPB $206,302 $19,485 $225,787 Coupon (1) 3.92% 4.19% 3.95% Servicing fee/spread (1) 0.35% 0.34% 0.35% Fair value $2,677.7 $249.1 $2,926.8 As a multiple of servicing fee 3.75 3.75 3.75 Pricing spread (1)(2) 8.4% 8.6% 8.5% Prepayment speed assumption (CPR) (1) 12.9% 10.9% 12.7% Equivalent life (in years) (1) 6.1 6.2 6.1 Annual per-loan cost of servicing (1) $96 $98 $97 Related excess servicing spread liability - $178.6 $178.6 March 31, 2020 Unaudited ($ in millions) December 31, 2019 ($ in millions) Total Subject to excess servicing spread liability Not subject to excess servicing spread liability Total Subject to excess servicing spread liability Not subject to excess servicing spread liability
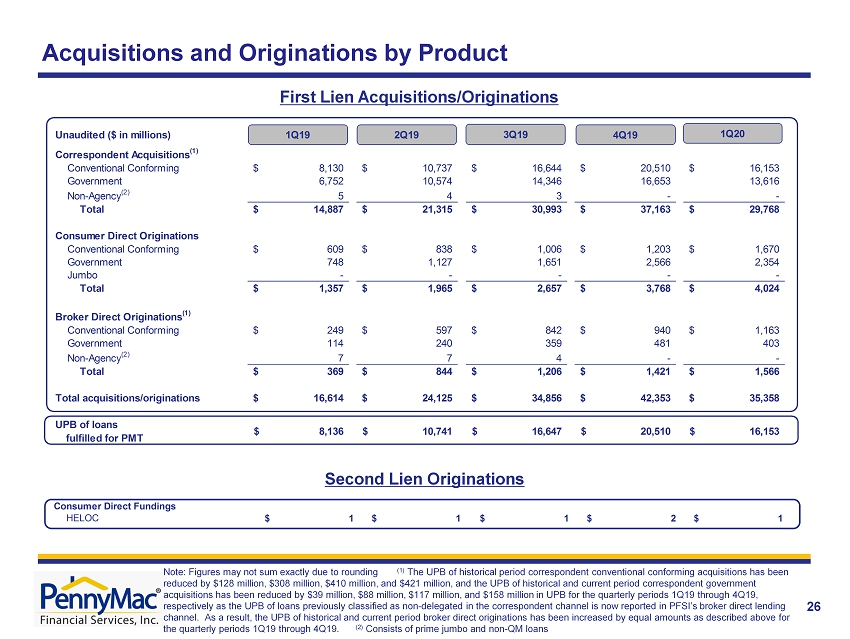
26 Note: Figures may not sum exactly due to rounding (1 ) The UPB of historical period correspondent conventional conforming acquisitions has been reduced by $128 million, $308 million, $410 million, and $421 million, and the UPB of historical and current period correspondent government acquisitions has been reduced by $39 million, $88 million, $117 million , and $158 million in UPB for the quarterly periods 1Q19 through 4Q19, respectively as the UPB of loans previously classified as non - delegated in the correspondent channel is now reported in PFSI’s broker direct lending channel. As a result, the UPB of historical and current period broker direct originations has been increased by equal amounts as descr ibe d above for the quarterly periods 1Q19 through 4Q19. (2) Consists of prime jumbo and non - QM loans Acquisitions and Originations by Product First Lien Acquisitions/Originations Second Lien Originations Consumer Direct Fundings HELOC 1$ 1$ 1$ 2$ 1$ Unaudited ($ in millions) Correspondent Acquisitions (1) Conventional Conforming 8,130$ 10,737$ 16,644$ 20,510$ 16,153$ Government 6,752 10,574 14,346 16,653 13,616 Non-Agency (2) 5 4 3 - - Total 14,887$ 21,315$ 30,993$ 37,163$ 29,768$ Consumer Direct Originations Conventional Conforming 609$ 838$ 1,006$ 1,203$ 1,670$ Government 748 1,127 1,651 2,566 2,354 Jumbo - - - - - Total 1,357$ 1,965$ 2,657$ 3,768$ 4,024$ Broker Direct Originations (1) Conventional Conforming 249$ 597$ 842$ 940$ 1,163$ Government 114 240 359 481 403 Non-Agency (2) 7 7 4 - - Total 369$ 844$ 1,206$ 1,421$ 1,566$ Total acquisitions/originations 16,614$ 24,125$ 34,856$ 42,353$ 35,358$ UPB of loans fulfilled for PMT 8,136$ 10,741$ 16,647$ 20,510$ 16,153$ 1Q19 2Q19 4Q19 3Q19 1Q20
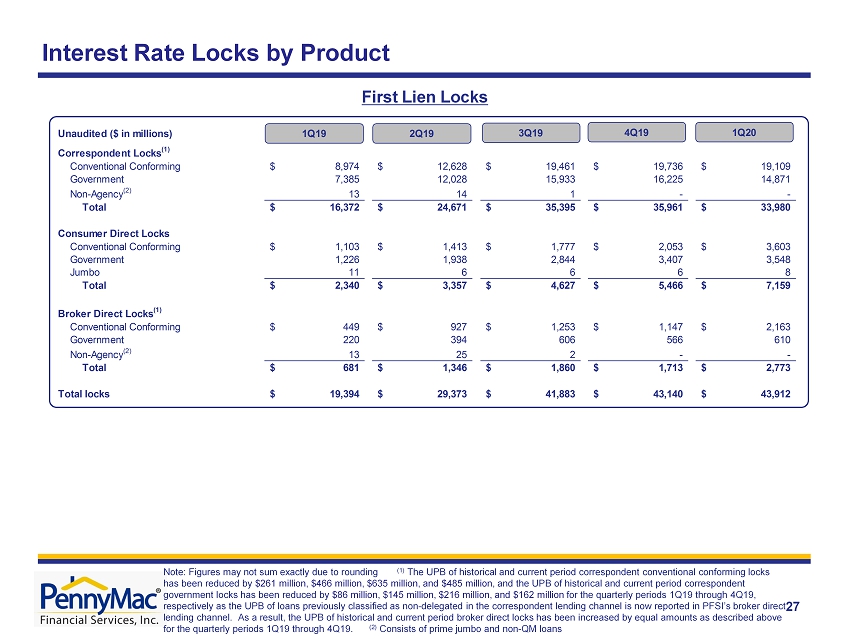
27 Interest Rate Locks by Product First Lien Locks Unaudited ($ in millions) Correspondent Locks (1) Conventional Conforming 8,974$ 12,628$ 19,461$ 19,736$ 19,109$ Government 7,385 12,028 15,933 16,225 14,871 Non-Agency (2) 13 14 1 - - Total 16,372$ 24,671$ 35,395$ 35,961$ 33,980$ Consumer Direct Locks Conventional Conforming 1,103$ 1,413$ 1,777$ 2,053$ 3,603$ Government 1,226 1,938 2,844 3,407 3,548 Jumbo 11 6 6 6 8 Total 2,340$ 3,357$ 4,627$ 5,466$ 7,159$ Broker Direct Locks (1) Conventional Conforming 449$ 927$ 1,253$ 1,147$ 2,163$ Government 220 394 606 566 610 Non-Agency (2) 13 25 2 - - Total 681$ 1,346$ 1,860$ 1,713$ 2,773$ Total locks 19,394$ 29,373$ 41,883$ 43,140$ 43,912$ 1Q19 2Q19 3Q19 4Q19 1Q20 Note: Figures may not sum exactly due to rounding (1 ) The UPB of historical and current period correspondent conventional conforming locks has been reduced by $261 million, $466 million, $635 million , and $485 million , and the UPB of historical and current period correspondent government locks has been reduced by $86 million, $145 million, $216 million, and $162 million for the quarterly periods 1Q19 through 4Q19, respectively as the UPB of loans previously classified as non - delegated in the correspondent lending channel is now reported in PFSI’s broker direct lending channel. As a result, the UPB of historical and current period broker direct locks has been increased by equal amounts as described ab ove for the quarterly periods 1Q19 through 4Q19. (2) Consists of prime jumbo and non - QM loans
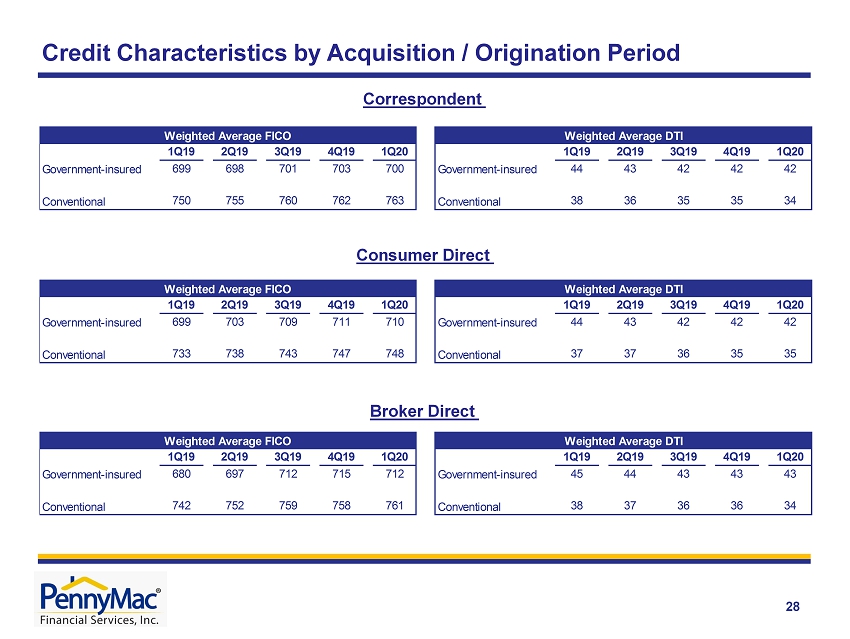
28 Credit Characteristics by Acquisition / Origination Period Correspondent Consumer Direct Broker Direct 1Q19 2Q19 3Q19 4Q19 1Q20 1Q19 2Q19 3Q19 4Q19 1Q20 Government-insured 699 698 701 703 700 Government-insured 44 43 42 42 42 Conventional 750 755 760 762 763 Conventional 38 36 35 35 34 Weighted Average DTIWeighted Average FICO 1Q19 2Q19 3Q19 4Q19 1Q20 1Q19 2Q19 3Q19 4Q19 1Q20 Government-insured 699 703 709 711 710 Government-insured 44 43 42 42 42 Conventional 733 738 743 747 748 Conventional 37 37 36 35 35 Weighted Average DTIWeighted Average FICO 1Q19 2Q19 3Q19 4Q19 1Q20 1Q19 2Q19 3Q19 4Q19 1Q20 Government-insured 680 697 712 715 712 Government-insured 45 44 43 43 43 Conventional 742 752 759 758 761 Conventional 38 37 36 36 34 Weighted Average DTIWeighted Average FICO