Exhibit 99.2

Fourth Quarter 2020 Earnings Report

Forward - Looking Statements 2 This presentation contains forward - looking statements within the meaning of Section 21E of the Securities Exchange Act of 1934, as amended, regarding management’s beliefs, estimates, projections and assumptions with respect to, among other things, the Company’s financial res ult s, future operations, business plans and investment strategies, as well as industry and market conditions, all of which are subject to change. Words like “b eli eve,” “expect,” “anticipate,” “promise,” “project,” “plan,” and other expressions or words of similar meanings, as well as future or conditional verbs such as “will,” “would,” “should,” “could,” or “may” are generally intended to identify forward - looking statements. Actual results and operations for any future period may var y materially from those projected herein and from past results discussed herein. These forward - looking statements include, but are not limited to, statements rega rding the future impact of COVID - 19 on our business and financial operations, future loan delinquencies and forbearances, projected servicing advances requ irements and other business and financial expectations. Factors which could cause actual results to differ materially from historical results or those an tic ipated include, but are not limited to: our exposure to risks of loss and disruptions in operations resulting from adverse weather conditions, man - made or natural disas ters, climate change and pandemics such as COVID - 19; failure to modify, resell or refinance early buyout loans; the continually changing federal, state a nd local laws and regulations applicable to the highly regulated industry in which we operate; lawsuits or governmental actions that may result from any no nco mpliance with the laws and regulations applicable to our businesses; the mortgage lending and servicing - related regulations promulgated by the Consumer Fin ancial Protection Bureau and its enforcement of these regulations; our dependence on U.S. government - sponsored entities and changes in their current roles or their guarantees or guidelines; changes to government mortgage modification programs; the licensing and operational requirements of states and other jurisdic tio ns applicable to the Company’s businesses, to which our bank competitors are not subject; foreclosure delays and changes in foreclosure practices; ch anges in macroeconomic and U.S. real estate market conditions; difficulties inherent in growing loan production volume; difficulties inherent in adjusti ng the size of our operations to reflect changes in business levels; purchase opportunities for mortgage servicing rights and our success in winning bids; changes in pre vailing interest rates; our substantial amount of indebtedness; expected discontinuation of LIBOR; increases in loan delinquencies and defaults; our reli anc e on PennyMac Mortgage Investment Trust (NYSE: PMT) as a significant source of financing for, and revenue related to, our mortgage banking business; ma intaining sufficient capital and liquidity to support business growth including compliance with financial covenants;; our obligation to indemnify third - party pur chasers or repurchase loans if loans that we originate, acquire, service or assist in the fulfillment of, fail to meet certain criteria or characteristics or unde r o ther circumstances; our obligation to indemnify PMT if our services fail to meet certain criteria or characteristics or under other circumstances; decreases in the re turns on the assets that we select and manage for our clients, and our resulting management and incentive fees; the extensive amount of regulation applicable to ou r investment management segment; conflicts of interest in allocating our services and investment opportunities among us and our advised entities; the ef fect of public opinion on our reputation; our recent growth; our ability to effectively identify, manage, monitor and mitigate financial risks; our initiat ion or expansion of new business activities or strategies; our ability to detect misconduct and fraud; our ability to mitigate cybersecurity risks and cyber incidents; o ur ability to pay dividends to our stockholders; and our organizational structure and certain requirements in our charter documents. You should not place undue rel iance on any forward - looking statement and should consider all of the uncertainties and risks described above, as well as those more fully discussed in re por ts and other documents filed by the Company with the Securities and Exchange Commission from time to time. The Company undertakes no obligation to publicly u pda te or revise any forward - looking statements or any other information contained herein, and the statements made in this presentation are current as of the date of this presentation only. This presentation contains financial information calculated other than in accordance with U.S. generally accepted accounting pri nciples (“GAAP”), such as pretax income excluding valuation items that provide a meaningful perspective on the Company’s business results since the Company ut ili zes this information to evaluate and manage the business. Non - GAAP disclosure has limitations as an analytical tool and should not be viewed as a subst itute for financial information determined in accordance with GAAP.

Fourth Quarter Highlights 3 ▪ Net income was $452.8 million; diluted earnings per share (EPS) were $5.97 – Strong earnings driven by core production and servicing results partially offset by fair value losses on mortgages servicing rights (MSRs) and associated hedging and other losses – Repurchased approximately 1.6 million shares of PFSI’s common stock for an approximate cost of $89.3 million – Book value per share increased 15% to $47.80 from $41.67 at September 30, 2020 – PFSI’s Board of Directors declared a fourth quarter cash dividend of $0.20 per share, a 33 percent increase from the prior quarter, payable on February 25, 2021, to common stockholders of record as of February 12, 2021 ▪ Production segment pretax income of $572.6 million, down 7% from 3Q20 and up 182% from 4Q19, driven by strong performance across all channels – Direct lending locks were a record $18.6 billion in unpaid principal balance (UPB), up 13% from 3Q20 and 158% from 4Q19 o $ 12.8 billion in UPB of locks in the consumer direct channel; $5.7 billion in UPB of locks in the broker direct channel – Government correspondent lock volume totaled $19.7 billion in UPB, down 2% from 3Q20 and up 22% from 4Q19 – Total loan acquisitions and originations were a record $69.4 billion in UPB, up 28% from 3Q20 and 64% from 4Q19 – Correspondent acquisitions of conventional loans fulfilled for PennyMac Mortgage Investment Trust (NYSE: PMT) were a record $38.0 billion in UPB, up 39% from 3Q20 and 85% from 4Q19
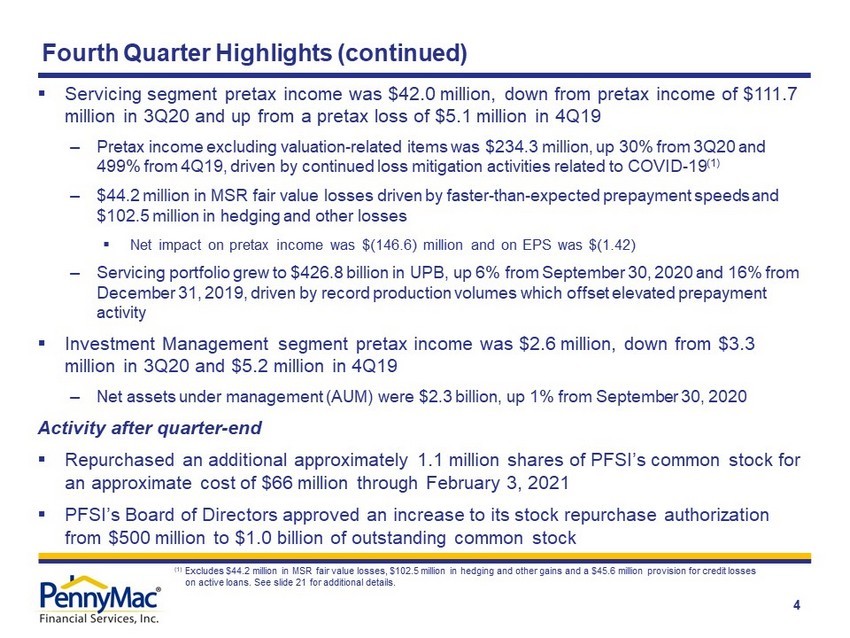
4 ▪ Servicing segment pretax income was $42.0 million, down from pretax income of $111.7 million in 3Q20 and up from a pretax loss of $5.1 million in 4Q19 – Pretax income excluding valuation - related items was $234.3 million, up 30% from 3Q20 and 499% from 4Q19, driven by continued loss mitigation activities related to COVID - 19 (1) – $44.2 million in MSR fair value losses driven by faster - than - expected prepayment speeds and $102.5 million in hedging and other losses ▪ Net impact on pretax income was $(146.6) million and on EPS was $(1.42) – Servicing portfolio grew to $426.8 billion in UPB, up 6% from September 30, 2020 and 16% from December 31, 2019, driven by record production volumes which offset elevated prepayment activity ▪ Investment Management segment pretax income was $2.6 million, down from $3.3 million in 3Q20 and $5.2 million in 4Q19 – Net assets under management (AUM) were $2.3 billion, up 1% from September 30, 2020 Activity after quarter - end ▪ Repurchased an additional approximately 1.1 million shares of PFSI’s common stock for an approximate cost of $66 million through February 3, 2021 ▪ PFSI’s Board of Directors approved an increase to its stock repurchase authorization from $500 million to $1.0 billion of outstanding common stock Fourth Quarter Highlights (continued) (1) Excludes $44.2 million in MSR fair value losses, $102.5 million in hedging and other gains and a $45.6 million provision for cr edit losses on active loans. See slide 21 for additional details.
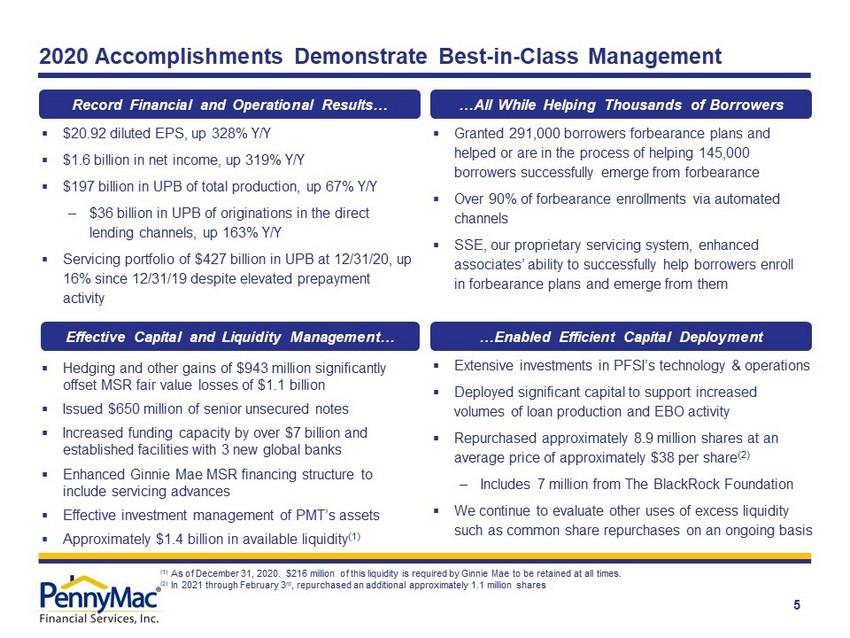
5 2020 Accomplishments Demonstrate Best - in - Class Management Record Financial and Operational Results… ▪ $20.92 diluted EPS, up 328% Y/Y ▪ $1.6 billion in net income, up 319% Y/Y ▪ $197 billion in UPB of total production, up 67% Y/Y ‒ $36 billion in UPB of originations in the direct lending channels, up 163% Y/Y ▪ Servicing portfolio of $427 billion in UPB at 12/31/20, up 16% since 12/31/19 despite elevated prepayment activity …All While Helping Thousands of Borrowers ▪ Granted 291,000 borrowers forbearance plans and helped or are in the process of helping 145,000 borrowers successfully emerge from forbearance ▪ Over 90% of forbearance enrollments via automated channels ▪ SSE, our proprietary servicing system, enhanced associates’ ability to successfully help borrowers enroll in forbearance plans and emerge from them Effective Capital and Liquidity Management… ▪ Hedging and other gains of $943 million significantly offset MSR fair value losses of $1.1 billion ▪ Issued $650 million of senior unsecured notes ▪ Increased funding capacity by over $7 billion and established facilities with 3 new global banks ▪ Enhanced Ginnie Mae MSR financing structure to include servicing advances ▪ Effective investment management of PMT’s assets ▪ Approximately $ 1.4 billion in available liquidity (1) …Enabled Efficient Capital Deployment ▪ Extensive investments in PFSI’s technology & operations ▪ Deployed significant capital to support increased volumes of loan production and EBO activity ▪ Repurchased approximately 8.9 million shares at an average price of approximately $38 per share (2) ‒ Includes 7 million from The BlackRock Foundation ▪ We continue to evaluate other uses of excess liquidity such as common share repurchases on an ongoing basis (1) As of December 31, 2020. $216 million of this liquidity is required by Ginnie Mae to be retained at all times. (2) In 2021 through February 3 rd , repurchased an additional approximately 1.1 million shares
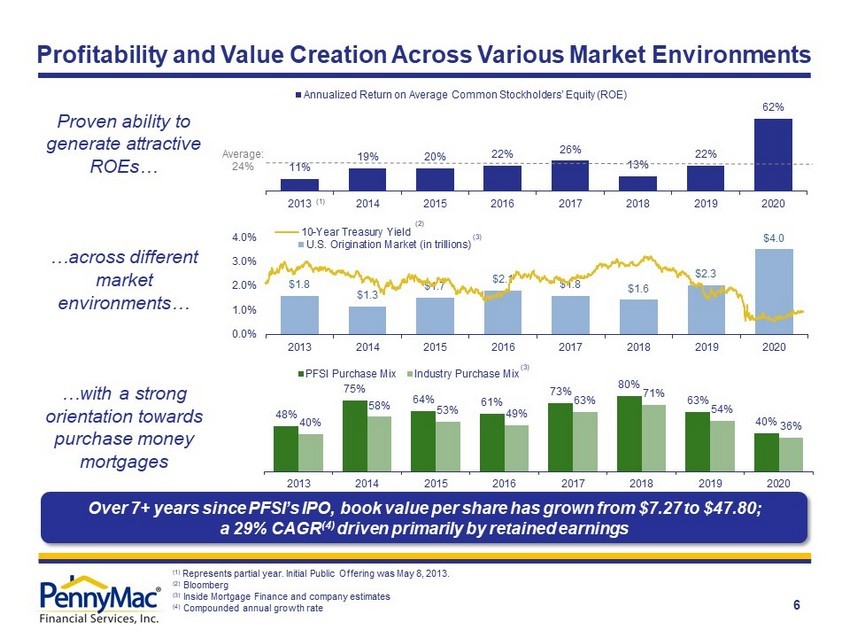
48% 75% 64% 61% 73% 80% 63% 40% 40% 58% 53% 49% 63% 71% 54% 36% 2013 2014 2015 2016 2017 2018 2019 2020 PFSI Purchase Mix Industry Purchase Mix 11% 19% 20% 22% 26% 13% 22% 62% 2013 2014 2015 2016 2017 2018 2019 2020 Annualized Return on Average Common Stockholders’ Equity (ROE) 6 (1) Represents partial year. Initial Public Offering was May 8, 2013. (2) Bloomberg (3) Inside Mortgage Finance and company estimates (4) Compounded annual growth rate Profitability and Value Creation Across Various Market Environments Proven ability to generate attractive ROEs… …across different market environments… …with a strong orientation towards purchase money mortgages Average: 24% (1) (2) (3) $1.8 $1.3 $1.7 $2.1 $1.8 $1.6 $2.3 $4.0 2013 2014 2015 2016 2017 2018 2019 2020 U.S. Origination Market (in trillions) 0.0% 1.0% 2.0% 3.0% 4.0% 10-Year Treasury Yield (3) Over 7+ years since PFSI’s IPO, book value per share has grown from $7.27 to $47.80; a 29% CAGR (4) driven primarily by retained earnings

0.0% 1.0% 2.0% 3.0% 4.0% 5.0% Average 30-year fixed rate mortgage Primary / Secondary Spread $1.3 $1.5 $1.6 $1.1 $2.5 $1.7 $2.3 $4.0 $3.3 2019 2020 2021E Purchase Refinance 7 Origination Market Remains Historically Strong (1) Actual originations: Inside Mortgage Finance. Total originations forecast: Average of Mortgage Bankers Association (1/20/21), Fa nnie Mae (1/11/21), and Freddie Mac (1/14/21) forecasts. (2) Freddie Mac Primary Mortgage Market Survey. 2.73% as of 1/28/21 (3) Bloomberg: Difference between Freddie Mac US Mortgage Market Survey 30 Year Homeowner Commitment Rate (NMCMFUS) Index and the 30 - Year Fannie Mae or Freddie Mac Par Coupon (MTGEFNCL) Index U.S. Mortgage Origination Market (1) (UPB in trillions) Rates Remain Low and Margins Remain Wide ▪ Economic forecasts for 2021 total originations have increased to over $3.3 trillion, another robust market supported by low mortgage interest rates ‒ Mortgage rates remain near all - time lows despite the recent increase in the ten - year treasury yield ‒ The Federal Reserve is expected to hold interest rates near zero through 2023 ‒ Purchase originations in 2021 are forecasted to increase again while refinance originations are expected to be down from 2020 levels (2) (3)

$59 $172 - $15 $262 $103 $147 $147 $543 2017 2018 2019 2020 Pretax Income Pretax Income Excluding Valuation Related Changes 8 Direct Lending and Servicing Are Driving PFSI’s Earnings Growth Servicing Pretax Income Production Pretax Income ($ in millions) ($ in millions) Note: Does not include pretax income from non - segment activities which was $32.9 million in 2017 and $1.1 million in 2018, which primarily represents Repricing of payable to exchanged Private National Mortgage Acceptance Company, LLC unitholders under a tax receiv abl e agreement. $32.0 million was the result of the change in the federal income tax rate under the Tax Cuts and Jobs Act of 2017. (1) Valuation - related changes include MSR fair value changes before recognition of realization of cash flows, related hedging and o ther gains (losses), and provision for credit losses on active loans considered in the assessment of MSR fair value changes – see slide 22. (1) $239 $87 $528 $1,964 2017 2018 2019 2020 Estimated Contribution from Direct Lending (CDL & BDL) ▪ Faster growth direct lending channels (consumer and broker direct) are significant contributors to PFSI’s earnings growth ▪ Servicing income reflects growing portfolio, economies of scale and loss mitigation activities ▪ We continue to expect PFSI’s exceptional financial performance to persist through 2021

Correspondent Production (1) Consumer Direct Production (1) 9 PFSI Is an Established Leader With a Growing Presence Across Mortgage Banking (market share) (market share) (market share) Broker Direct Production (1) Servicing (market share) Growth Drivers Increasing Contribution from Higher - Margin Direct Lending Channels Investments in Industry - Leading Businesses Provide Stable Foundation Growth Drivers ▪ Technology - enabled efficiency ▪ Scaled fulfillment operation ▪ Growing customer base with servicing portfolio of almost 2 million customers ▪ Non - portfolio origination growth ▪ Proprietary technology ▪ Low cost structure ▪ Operational scale ▪ Hedging expertise ▪ Loss mitigation capabilities (1) Historical market share estimates based on Inside Mortgage Finance. Inside Mortgage Finance estimates $4.040 trillion in total origination volume. Over the same period, we estimate the correspondent channel represented 22.5% of the overall origination market; we e sti mate that retail represented 64.0% of the overall origination market; and we estimate that broker represented 13.5% of the overall origination market. N/A 10.5% 11.9% 15.5% 17.7% 2017 2018 2019 2020 0.5% 0.5% 0.7% 1.0% 2017 2018 2019 2020 0.3% 0.9% 2.2% 2017 2018 2019 2020 2.3% 2.7% 3.3% 3.8% 12/31/17 12/31/18 12/31/19 12/31/20

10 Technology Initiatives In Place for Growth in Direct Lending ▪ Enhance lead generation capabilities and use of data analytics ▪ Increase use of digital marketing to drive non - portfolio originations ▪ Improve ability for borrowers to self - service ▪ Improves experience for the consumer and broker ▪ Improves productivity in sales and operations ▪ Enables higher volumes and reduced cost to originate ▪ Further reduce loan cycle duration via portal and workflow enhancements ▪ Extend best - in - class tools and solutions to brokers ▪ Enhance brokers’ ability to self - service ▪ Further automate and improve the production and distribution of loan documents ▪ Increase use of online closings and expansion of fulfillment automation ▪ Improve access to data in real time and on demand Fulfillment Enhancements Drive Efficiencies Across All Production Platforms Consumer Direct Broker Direct
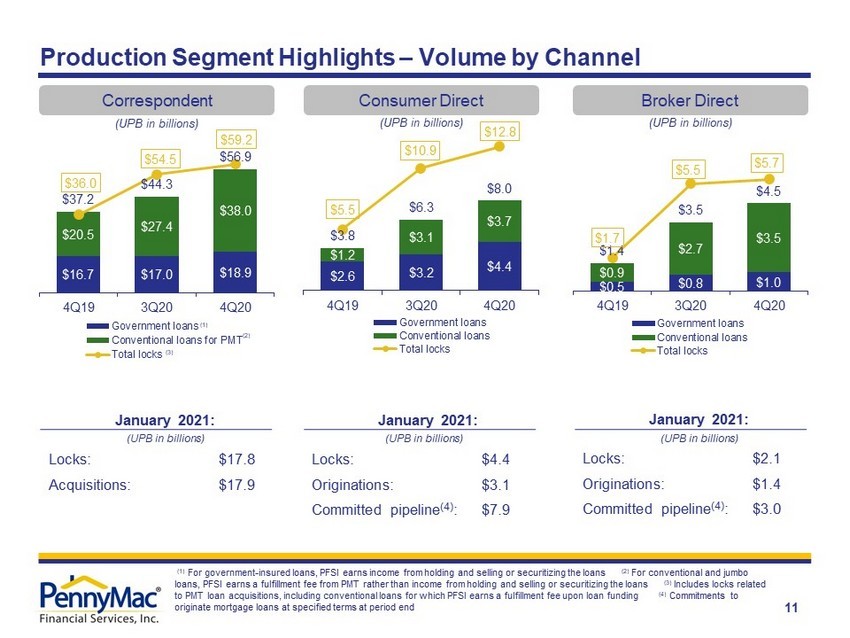
$2.6 $3.2 $4.4 $1.2 $3.1 $3.7 $3.8 $6.3 $8.0 $5.5 $10.9 $12.8 4Q19 3Q20 4Q20 Government loans Conventional loans Total locks $0.5 $0.8 $1.0 $0.9 $2.7 $3.5 $1.4 $3.5 $4.5 $1.7 $5.5 $5.7 4Q19 3Q20 4Q20 Government loans Conventional loans Total locks $16.7 $17.0 $18.9 $20.5 $27.4 $38.0 $37.2 $44.3 $56.9 $36.0 $54.5 $59.2 4Q19 3Q20 4Q20 Government loans Conventional loans for PMT Total locks 11 Production Segment Highlights – Volume by Channel (UPB in billions) Correspondent Consumer Direct Broker Direct (UPB in billions) (UPB in billions) (1) (2) (3) (1) For government - insured loans, PFSI earns income from holding and selling or securitizing the loans (2) For conventional and jumbo loans, PFSI earns a fulfillment fee from PMT rather than income from holding and selling or securitizing the loans (3) Includes locks related to PMT loan acquisitions, including conventional loans for which PFSI earns a fulfillment fee upon loan funding (4) Commitments to originate mortgage loans at specified terms at period end January 2021: (UPB in billions) Locks: $17.8 Acquisitions: $17.9 January 2021: (UPB in billions) Locks: $4.4 Originations: $3.1 Committed pipeline (4) : $7.9 January 2021: (UPB in billions) Locks: $2.1 Originations: $1.4 Committed pipeline (4) : $3.0

12 Production Segment Highlights – Business Trends by Channel Correspondent Consumer Direct Broker Direct ▪ PennyMac remained the largest correspondent aggregator in the U.S. ▪ Significant growth in conventional correspondent market share as a result of PennyMac’s low cost structure and operational consistency in the channel ▪ Government correspondent margins continued to trend towards more normalized levels ▪ Continue to originate record volumes as a result of: ‒ Advanced modeling and analytics ‒ Growth in sales and fulfillment capacity ‒ Efficient and low cost infrastructure ▪ Non - portfolio interest rate lock commitments in 4Q20 totaled $1.3 billion, up from $906 million in 3Q20 and $94 million in 4Q19 ▪ Margins decreased modestly in 4Q20, but remained elevated relative to historical levels ▪ Continued growth Q/Q in both lock and funding volumes as a result of the increase in approved brokers and our larger presence in the channel ‒ Approved brokers totaled 1,574 at December 31, 2020, up 11% from September 30 ‒ Approximately 12,000 brokers and non - delegated sellers active in the market ▪ Margins continue to decrease from peak levels in 2Q20 but remain high on a historical basis Record production volumes across all channels in 4Q20 enabled by PennyMac’s low - cost and efficient fulfillment process

$401.9 $426.8 ($44.5) $69.4 At 9/30/20 Runoff Additions from loan production At 12/31/20 (1) 13 Servicing Segment Highlights (1) Owned portfolio in predominantly government - insured and guaranteed loans under the FHA (52%), VA (29%), and USDA (12%) programs. Delinquency data based on loan count (i.e., not UPB). CPR = Conditional Prepayment Rate. (2) Represents PMT’s MSRs. Excludes distressed loan investments (3) UPB of completed modifications includes loss mitigation efforts associated with partial claims programs (4) Early buyouts of delinquent loans from Ginnie Mae pools during the period (5) Also includes loans servicing released in connection with any asset sales by PMT (6) Includes consumer direct production, government correspondent acquisitions, and conventional conforming and jumbo loan acquisitions subserviced for PMT (UPB in billions) ▪ Servicing portfolio totaled $426.8 billion in UPB at December 31, 2020, up 6% Q/Q and 16% Y/Y ▪ Record production volumes led to portfolio growth despite elevated prepayment activity ▪ Modest decrease in delinquency rates as borrowers began to emerge from forbearance plans ▪ Substantial increase in modifications and EBO loan volume related to loss mitigation efforts with borrowers emerging from COVID - 19 forbearance plans Loan Servicing Portfolio Composition Net Portfolio Growth (UPB in billions) (5) (6) $368.7 $401.9 $426.8 12/31/2019 9/30/2020 12/31/2020 Prime owned Prime subserviced and other 3Q20 4Q20 Loans serviced (in thousands) 1,870 1,947 60+ day delinquency rate - owned portfolio (1) 11.4% 10.2% 60+ day delinquency rate - sub-serviced portfolio (2) 3.7% 2.7% Actual CPR - owned portfolio (1) 29.7% 32.5% Actual CPR - sub-serviced (2) 39.2% 38.9% UPB of completed modifications ($ in millions) (3) $3,975 $6,291 EBO loan volume ($ in millions) (4) $2,739 $5,014 Selected Operational Metrics
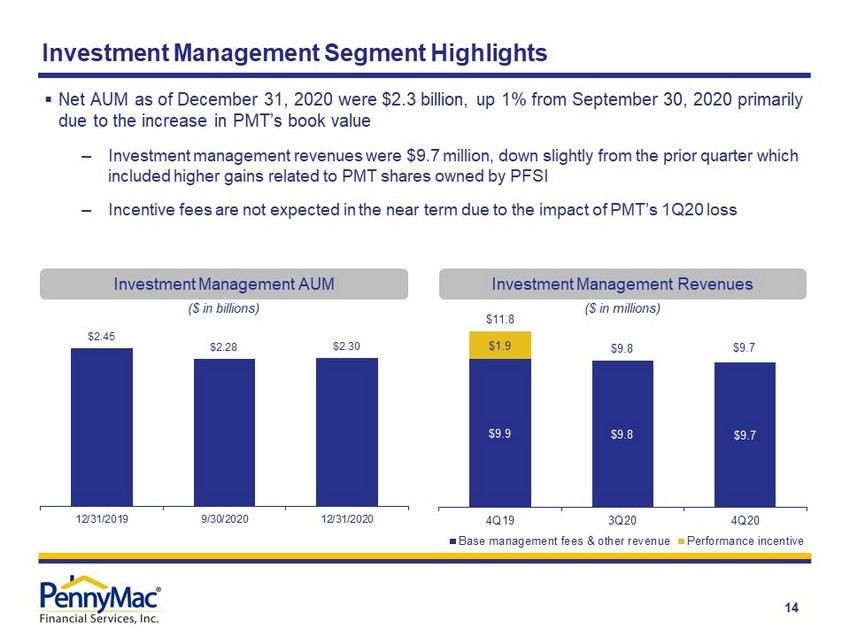
Investment Management Revenues (1) 14 Investment Management Segment Highlights Investment Management AUM ($ in billions) ▪ Net AUM as of December 31, 2020 were $2.3 billion, up 1% from September 30 , 2020 primarily due to the increase in PMT’s book value – Investment management revenues were $9.7 million, down slightly from the prior quarter which included higher gains related to PMT shares owned by PFSI – Incentive fees are not expected in the near term due to the impact of PMT’s 1Q20 loss ($ in millions) $9.9 $2.45 $2.28 $2.30 12/31/2019 9/30/2020 12/31/2020 $9.9 $9.8 $9.7 $1.9 $11.8 $9.8 $9.7 4Q19 3Q20 4Q20 Base management fees & other revenue Performance incentive

15 Trends in Delinquencie s, Forbearance and Loss Mitigation 30+ Day Delinquency Rate and Forbearance Trend (1) ▪ In PFSI’s predominately government MSR portfolio, approximately 235,000 borrowers were enrolled in a forbearance plan in 2020 – Through December 31st, approximately 115,000 borrowers exited or are in the process of exiting their forbearance plan ▪ Servicing advances outstanding increased to approximately $ 454 million at December 31 , 2020, from $346 million at September 30 primarily due to seasonal property tax payments – Advances are expected to continue increasing over the next 6 to 12 months – No P&I advances are outstanding, as prepayment activity continues to sufficiently cover remittance obligations ▪ Of the 1.8% reduction in forbearance related to re - performance – 0.8% were forbearances that remained current or went delinquent and subsequently became current – 1.0% were FHA Partial Claims or completed modifications ▪ Elevated EBO activity is expected to continue in 2021 Forbearance Outcomes (2) Beginning Period Forbearance Ending Period Forbearance Note: Figures may not sum due to rounding (1) Owned MSR portfolio. Delinquency and forbearance data based on loan count (i.e. not UPB). As of 12/31/20, 30+ day delinquency un its amounted to 160,069, forbearance units amounted to 98,530, total portfolio units were 1,266,802, and portfolio UPB was $252 billion. (2) Forbearance outcomes based on loan count as a percentage of beginning period loans in forbearance. 1.7% 10.6% 9.0% 7.3% 4.7% 1.9% 1.1% 0.5% 6.4% 12.4% 10.1% 7.8% 7.6% 7.2% 15.1% 14.1% 12.6% Dec-19 Mar-20 Jun-20 Sep-20 Dec-20 Delinquent in Forbearance Current in Forbearance 30+ Day Delinquency Rate 7.8% 10.1% 1.8% 1.4% 0.3% 0.2% 6.4% 1.4% 9/30/20 Re- performing Active Loss Mitigation Paid- in-full 30+ DQ not in forbearance Extended New forbearances 12/31/20
Appendix

▪ Complex and highly regulated mortgage industry requires effective governance, compliance and operating systems ▪ Operating platform has been developed organically and is highly scalable ▪ Commitment to strong corporate governance, compliance and risk management since inception ▪ PFSI is well positioned for continued growth in this market and regulatory environment Loan Production Loan Servicing Investment Management ▪ Servicing for owned MSRs and subservicing for PMT ▪ Major loan servicer for Fannie Mae, Freddie Mac and Ginnie Mae ▪ Industry - leading capabilities in special servicing ▪ Organic growth results from loan production, supplemented by MSR acquisitions and PMT investment activity ▪ External manager of PMT, which invests in mortgage - related assets: – GSE credit risk transfers – MSRs and ESS – Investments in prime non - Agency MBS and asset - backed securities ▪ Synergistic partnership with PMT ▪ Correspondent aggregation of newly originated loans from third - party sellers – PFSI earns gains on delegated government - insured and non - delegated loans – Fulfillment fees for PMT’s delegated conventional loans ▪ Consumer direct origination of conventional and government - insured loans ▪ Broker direct origination launched in 2018 17 Overview of PennyMac Financial’s Businesses

18 PFSI’s Mortgage Banking Franchise Has Substantial Long - Term Value ▪ Substantially all Fannie Mae, Freddie Mac and Ginnie Mae - eligible loans ▪ Diversified business through correspondent, consumer direct and broker direct channels ‒ Correspondent and broker direct channels in particular allow PFSI to access purchase - money volume ▪ Lacks the fixed overhead of the traditional, retail origination model ▪ Recurring fee income business captured over the life of the loan ▪ In the event of higher interest rates, expected life of the loan would increase resulting in a more valuable MSR asset ▪ These dynamics create a natural hedge to production income Drives leads for new consumer direct originations x Industry - leading operating platform with more than 6,600 PennyMac’ers across the U.S. x 1.9 million valuable, ongoing consumer relationships in the servicing business x Proprietary technology assets, including systems with capabilities well beyond leading industry vendors x Unparalleled capabilities to analyze and price large volumes of loans with real - time market updates (1) Inside Mortgage Finance for the twelve months ended December 31, 2020 (2) Inside Mortgage Finance as of September 30, 2020 (3) As of December 31, 2020 In both businesses, scale and efficiency are critical for success Large volumes of production create “flywheel” to grow servicing portfolio Loan Production 3 rd largest in the U.S. (1) ($197 billion in UPB in the last 12 months) Loan Servicing 7 th largest in the U.S. (2) ($427 billion in UPB) (3)
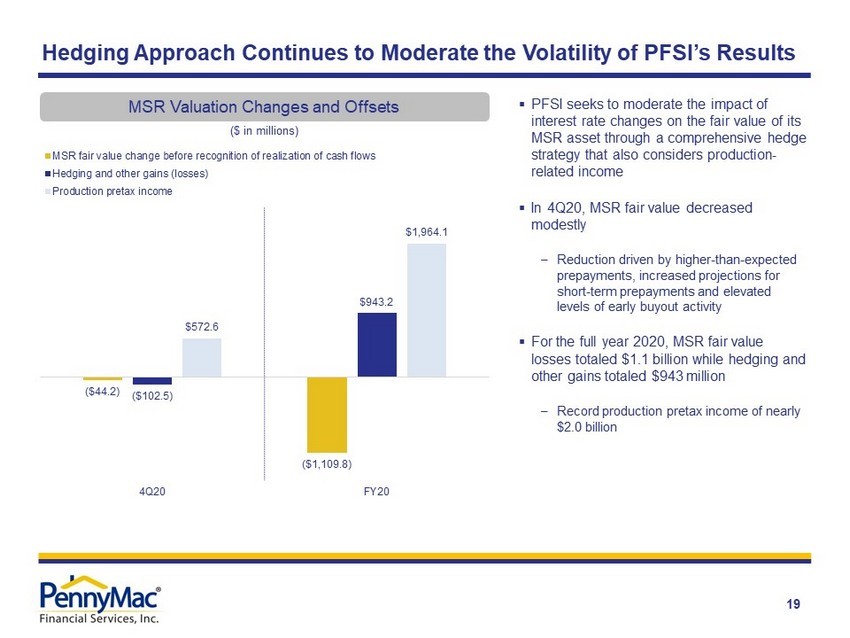
($44.2) ($1,109.8) ($102.5) $943.2 $572.6 $1,964.1 4Q20 FY20 MSR fair value change before recognition of realization of cash flows Hedging and other gains (losses) Production pretax income 19 MSR Valuation Changes and Offsets ($ in millions) Hedging Approach Continues to Moderate the Volatility of PFSI’s Results ▪ PFSI seeks to moderate the impact of interest rate changes on the fair value of its MSR asset through a comprehensive hedge strategy that also considers production - related income ▪ In 4Q20, MSR fair value decreased modestly – Reduction driven by higher - than - expected prepayments, increased projections for short - term prepayments and elevated levels of early buyout activity ▪ For the full year 2020, MSR fair value losses totaled $1.1 billion while hedging and other gains totaled $943 million – Record production pretax income of nearly $2.0 billion

20 Drivers of Production Segment Profitability 4Q20 (1) Expected revenue net of direct origination costs at time of lock (2) Reflects hedging, pricing and execution changes, timing of revenue recognition, and other items (3) Costs are fully allocated Production expenses net of Loan origination expense ▪ Direct lending channels (consumer and broker direct) have outsized impact on Production earnings – represented 20% of fallout adjusted lock volume in 4Q20, but over 70% of segment pretax income ▪ Production revenue margins remain elevated especially in the direct lending channels – revenue per fallout adjusted lock for PFSI’s own account was 217 basis points in 4Q20, down slightly from 236 basis points in 3Q20 ▪ Costs (3) vary by channel – range from approximately 15 basis points in correspondent to 150 basis points in consumer direct; as the mix shift towards direct lending continues, production expenses as a percentage of fallout adjusted locks are expected to trend higher 3Q20 4Q19 Fallout Adjusted Locks Margin / Fulfillment Fee (bps) (1) Revenue Contribution (net of Loan origination Expense) % of Production Revenue Fallout Adjusted Locks Margin / Fulfillment Fee (bps) (1) Revenue Contribution (net of Loan origination expense) % of Production Revenue Fallout Adjusted Locks Margin / Fulfillment Fee (bps) (1) Revenue Contribution (net of Loan origination expense) % of Production Revenue Government Correspondent 15,738$ 39 61.4$ 20% 18,315$ 64 117.3$ 15% 18,180$ 51 93.5$ 12% Consumer Direct 3,881 424 164.5 53% 8,208 543 445.7 57% 8,984 533 478.8 63% Broker Direct 1,319 116 15.3 5% 4,368 268 117.1 15% 4,351 205 89.0 12% Other (2) n/a n/a 8.7 3% n/a n/a 50.4 6% n/a n/a 22.0 3% Total PFSI account revenues (net of Loan origination expense) 20,938$ 119 249.9$ 81% 30,891$ 236 730.5$ 93% 31,515$ 217 683.3$ 90% PMT Conventional Correspondent 18,749 31 58.3 19% 30,036 18 54.8 7% 36,610 20 72.6 10% Total Production revenues (net of Loan origination expense) 78 308.2$ 100% 129 785.3$ 100% 111 755.9$ 100% Production expenses (less Loan origination expense) 26 104.9$ 34% 28 172.1$ 22% 27 183.2$ 24% Production segment pretax income 51 203.3$ 66% 101 613.3$ 78% 84 572.6$ 76% 68,126$ 60,927$ 39,687$

21 (1) Of average portfolio UPB, annualized (2) Comprised of net gains on mortgage loans held for sale at fair value and net interest income related to EBO loans (3) Consists of interest shortfall and recording and release fees (4) Changes in fair value do not include realization of MSR cash flows, which are included in amortization and realization of MSR c ash flows above (5) Includes fair value changes and provision for impairment (6) Considered in the assessment of MSR fair value changes Servicing Profitability Excluding Valuation - Related Changes 4Q20 4Q19 3Q20 ▪ Operating revenue increased $10.8 million Q/Q driven by higher fees from a growing servicing portfolio ▪ EBO loan - related revenue increased significantly to $233.3 million as a result of loss mitigation activity on loans emerging from forbearance while related expenses were modest as most of the loans bought out returned to performing status immediately ▪ Payoff - related expense from prepayments remains elevated and increased $8.3 million Q/Q ▪ Valuation - related changes include $45.6 million in provisions for credit losses on active loans driven by higher delinquencies related to COVID - 19 $ in millions basis points (1) $ in millions basis points (1) $ in millions basis points (1) Operating revenue 273.0$ 30.4 261.4$ 26.4 272.2$ 26.3 Realization of MSR cash flows (113.1) (12.6) (90.2) (9.1) (89.6) (8.7) EBO loan-related revenue (2) 40.3 4.5 170.2 17.2 233.3 22.5 Servicing expenses: Operating expenses (80.5) (9.0) (94.4) (9.5) (91.1) (8.8) Payoff-related expense (3) (23.0) (2.6) (31.2) (3.1) (39.5) (3.8) Credit losses and provisions for defaulted loans (17.2) (1.9) (13.0) (1.3) (12.6) (1.2) EBO loan transaction-related expense (18.5) (2.1) (1.2) (0.1) (5.9) (0.6) Financing expenses: Interest on ESS (2.2) (0.2) (2.1) (0.2) (2.0) (0.2) Interest to third parties (19.7) (2.2) (20.1) (2.0) (30.6) (3.0) Pretax income excluding valuation-related changes 39.1$ 4.4 179.5$ 18.1 234.3$ 22.6 Valuation-related changes (4) MSR fair value (5) 160.6 (37.0) (44.2) ESS liability fair value (2.3) 3.1 6.7 Hedging derivatives gains (losses) (192.4) 6.5 (109.1) Provision for credit losses on active loans (6) (10.2) (40.5) (45.6) Servicing segment pretax income (5.1)$ 111.7$ 42.0$ Average servicing portfolio UPB 359,022$ 396,422$ 414,351$
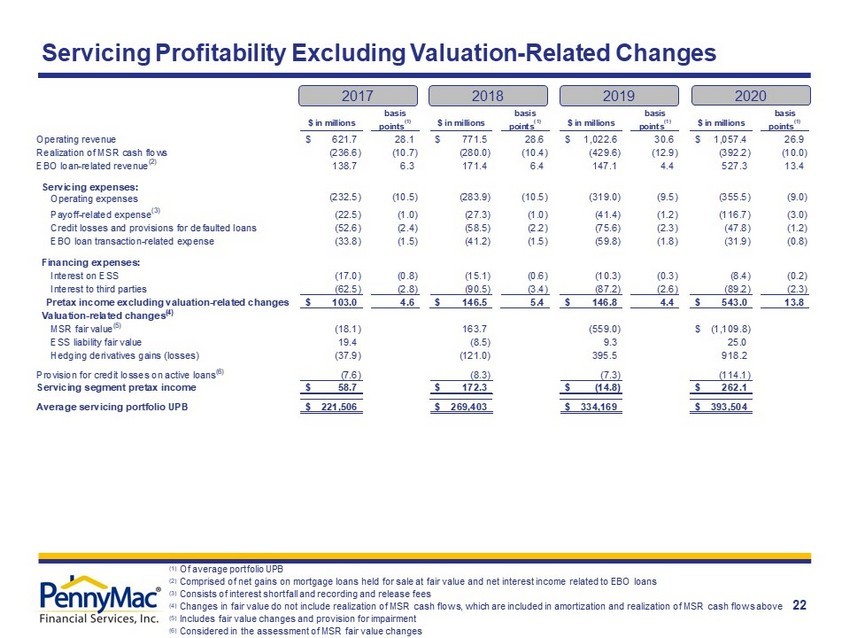
22 (1) Of average portfolio UPB (2) Comprised of net gains on mortgage loans held for sale at fair value and net interest income related to EBO loans (3) Consists of interest shortfall and recording and release fees (4) Changes in fair value do not include realization of MSR cash flows, which are included in amortization and realization of MSR c ash flows above (5) Includes fair value changes and provision for impairment (6) Considered in the assessment of MSR fair value changes Servicing Profitability Excluding Valuation - Related Changes 2019 2017 2018 2020 $ in millions basis points (1) $ in millions basis points (1) $ in millions basis points (1) $ in millions basis points (1) Operating revenue 621.7$ 28.1 771.5$ 28.6 1,022.6$ 30.6 1,057.4$ 26.9 Realization of MSR cash flows (236.6) (10.7) (280.0) (10.4) (429.6) (12.9) (392.2) (10.0) EBO loan-related revenue (2) 138.7 6.3 171.4 6.4 147.1 4.4 527.3 13.4 Servicing expenses: Operating expenses (232.5) (10.5) (283.9) (10.5) (319.0) (9.5) (355.5) (9.0) Payoff-related expense (3) (22.5) (1.0) (27.3) (1.0) (41.4) (1.2) (116.7) (3.0) Credit losses and provisions for defaulted loans (52.6) (2.4) (58.5) (2.2) (75.6) (2.3) (47.8) (1.2) EBO loan transaction-related expense (33.8) (1.5) (41.2) (1.5) (59.8) (1.8) (31.9) (0.8) Financing expenses: Interest on ESS (17.0) (0.8) (15.1) (0.6) (10.3) (0.3) (8.4) (0.2) Interest to third parties (62.5) (2.8) (90.5) (3.4) (87.2) (2.6) (89.2) (2.3) Pretax income excluding valuation-related changes 103.0$ 4.6 146.5$ 5.4 146.8$ 4.4 543.0$ 13.8 Valuation-related changes (4) MSR fair value (5) (18.1) 163.7 (559.0) (1,109.8)$ ESS liability fair value 19.4 (8.5) 9.3 25.0 Hedging derivatives gains (losses) (37.9) (121.0) 395.5 918.2 Provision for credit losses on active loans (6) (7.6) (8.3) (7.3) (114.1) Servicing segment pretax income 58.7$ 172.3$ (14.8)$ 262.1$ Average servicing portfolio UPB 221,506$ 269,403$ 334,169$ 393,504$
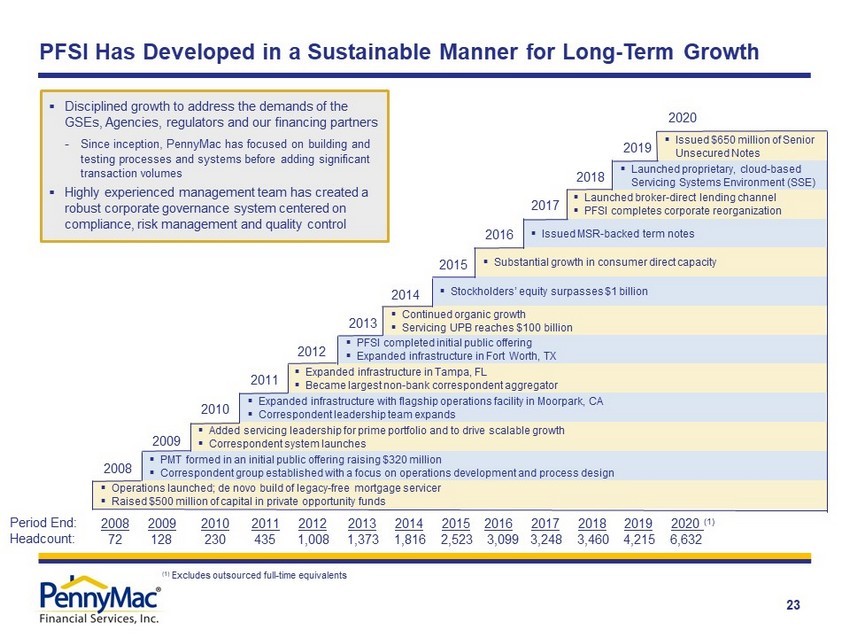
▪ Issued $650 million of Senior Unsecured Notes 23 PFSI Has Developed in a Sustainable Manner for Long - Term Growth ▪ Disciplined growth to address the demands of the GSEs, Agencies, regulators and our financing partners - Since inception, PennyMac has focused on building and testing processes and systems before adding significant transaction volumes ▪ Highly experienced management team has created a robust corporate governance system centered on compliance, risk management and quality control ▪ Operations launched; de novo build of legacy - free mortgage servicer ▪ Raised $500 million of capital in private opportunity funds ▪ PMT formed in an initial public offering raising $320 million ▪ Correspondent group established with a focus on operations development and process design ▪ Added servicing leadership for prime portfolio and to drive scalable growth ▪ Correspondent system launches ▪ Expanded infrastructure with flagship operations facility in Moorpark, CA ▪ Correspondent leadership team expands ▪ Expanded infrastructure in Tampa, FL ▪ Became largest non - bank correspondent aggregator ▪ PFSI completed initial public offering ▪ Expanded infrastructure in Fort Worth, TX ▪ Continued organic growth ▪ Servicing UPB reaches $100 billion ▪ Stockholders’ equity surpasses $1 billion ▪ Substantial growth in consumer direct capacity ▪ Issued MSR - backed term notes ▪ Launched broker - direct lending channel ▪ PFSI completes corporate reorganization ▪ Launched proprietary, cloud - based Servicing Systems Environment (SSE) Period End: Headcount: 2008 2009 2010 2011 2012 2013 2014 2015 2016 2017 2018 2019 2008 2009 2010 2011 2012 2013 2014 2015 2016 2017 2018 2019 2020 (1) 72 128 230 435 1,008 1,373 1,816 2,523 3,099 3,248 3,460 4,215 6,632 2020 (1) Excludes outsourced full - time equivalents
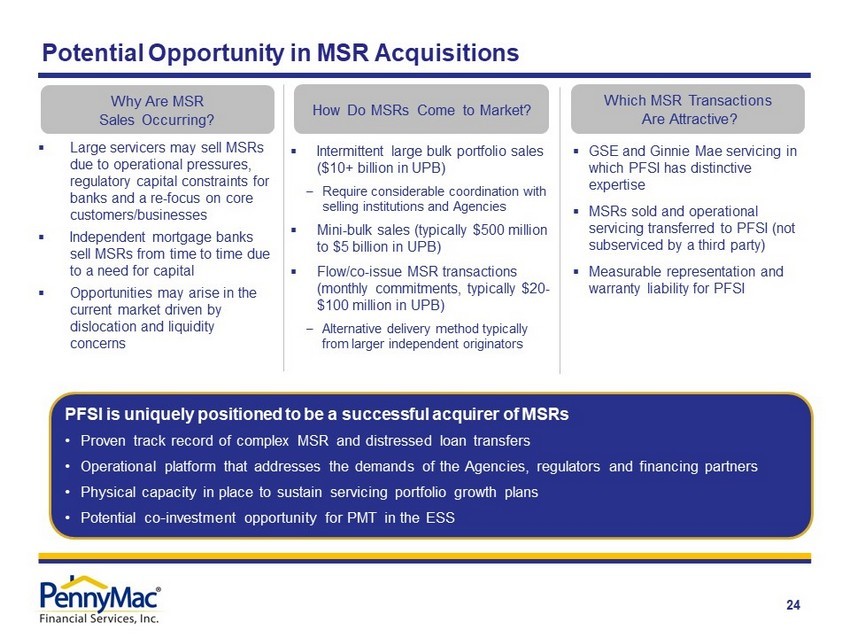
24 Why Are MSR Sales Occurring? How Do MSRs Come to Market? ▪ Large servicers may sell MSRs due to operational pressures, regulatory capital constraints for banks and a re - focus on core customers/businesses ▪ Independent mortgage banks sell MSRs from time to time due to a need for capital ▪ Opportunities may arise in the current market driven by dislocation and liquidity concerns ▪ Intermittent large bulk portfolio sales ($10+ billion in UPB) – Require considerable coordination with selling institutions and Agencies ▪ Mini - bulk sales (typically $500 million to $5 billion in UPB) ▪ Flow/co - issue MSR transactions (monthly commitments, typically $20 - $100 million in UPB) – Alternative delivery method typically from larger independent originators Which MSR Transactions Are Attractive? ▪ GSE and Ginnie Mae servicing in which PFSI has distinctive expertise ▪ MSRs sold and operational servicing transferred to PFSI (not subserviced by a third party) ▪ Measurable representation and warranty liability for PFSI PFSI is uniquely positioned to be a successful acquirer of MSRs • Proven track record of complex MSR and distressed loan transfers • Operational platform that addresses the demands of the Agencies, regulators and financing partners • Physical capacity in place to sustain servicing portfolio growth plans • Potential co - investment opportunity for PMT in the ESS Potential Opportunity in MSR Acquisitions
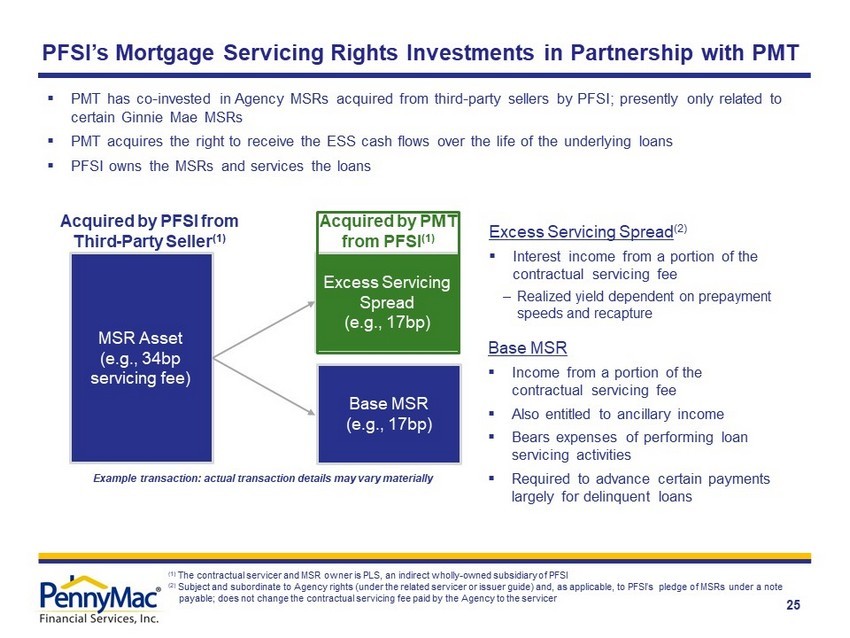
25 Excess Servicing Spread (e.g., 17bp) MSR Asset (e.g., 34bp servicing fee) Acquired by PFSI from Third - Party Seller (1) ▪ PMT has co - invested in Agency MSRs acquired from third - party sellers by PFSI; presently only related to certain Ginnie Mae MSRs ▪ PMT acquires the right to receive the ESS cash flows over the life of the underlying loans ▪ PFSI owns the MSRs and services the loans (1) The contractual servicer and MSR owner is PLS, an indirect wholly - owned subsidiary of PFSI (2) Subject and subordinate to Agency rights (under the related servicer or issuer guide) and, as applicable, to PFSI’s pledge of MS Rs under a note payable; does not change the contractual servicing fee paid by the Agency to the servicer Excess Servicing Spread (2) ▪ Interest income from a portion of the contractual servicing fee – Realized yield dependent on prepayment speeds and recapture Base MSR ▪ Income from a portion of the contractual servicing fee ▪ Also entitled to ancillary income ▪ Bears expenses of performing loan servicing activities ▪ Required to advance certain payments largely for delinquent loans Base MSR (e.g., 17bp) Acquired by PMT from PFSI (1) Example transaction: actual transaction details may vary materially PFSI’s Mortgage Servicing Rights Investments in Partnership with PMT

26 MSR Asset Valuation Pool UPB $223,088 $15,323 $238,411 Coupon (1) 3.57% 4.18% 3.61% Servicing fee/spread 0.35% 0.34% 0.35% Prepayment speed assumption (CPR) 13.9% 11.7% 13.7% Fair value $2,420.4 $160.8 $2,581.2 As a multiple of servicing fee 3.14 3.05 3.13 Related excess servicing spread liability - $131.8 $131.8 December 31, 2020 Unaudited ($ in millions) Total Subject to excess servicing spread Not subject to excess servicing

27 Note: Figures may not sum exactly due to rounding (1) Consists of prime jumbo and non - QM loans Acquisitions and Originations by Product First Lien Acquisitions/Originations Second Lien Originations Unaudited ($ in millions) Correspondent Acquisitions Conventional Conforming 20,510$ 16,153$ 18,900$ 27,351$ 37,986$ Government 16,653 13,616 10,991 16,977 18,923 Non-Agency (1) - - - - - Total 37,163$ 29,768$ 29,890$ 44,328$ 56,908$ Consumer Direct Originations Conventional Conforming 1,203$ 1,670$ 2,475$ 3,091$ 3,659$ Government 2,566 2,354 2,647 3,240 4,356 Jumbo - - - - - Total 3,768$ 4,024$ 5,122$ 6,331$ 8,015$ Broker Direct Originations Conventional Conforming 940$ 1,163$ 2,136$ 2,657$ 3,527$ Government 481 403 481 845 956 Non-Agency (1) - - - - - Total 1,421$ 1,566$ 2,617$ 3,502$ 4,484$ Total acquisitions/originations 42,353$ 35,358$ 37,630$ 54,161$ 69,407$ UPB of loans fulfilled for PMT 20,510$ 16,153$ 18,900$ 27,351$ 37,986$ 4Q19 2Q20 1Q20 4Q20 3Q20 Consumer Direct Fundings HELOC 3$ 2$ 1$ 0$ 0$
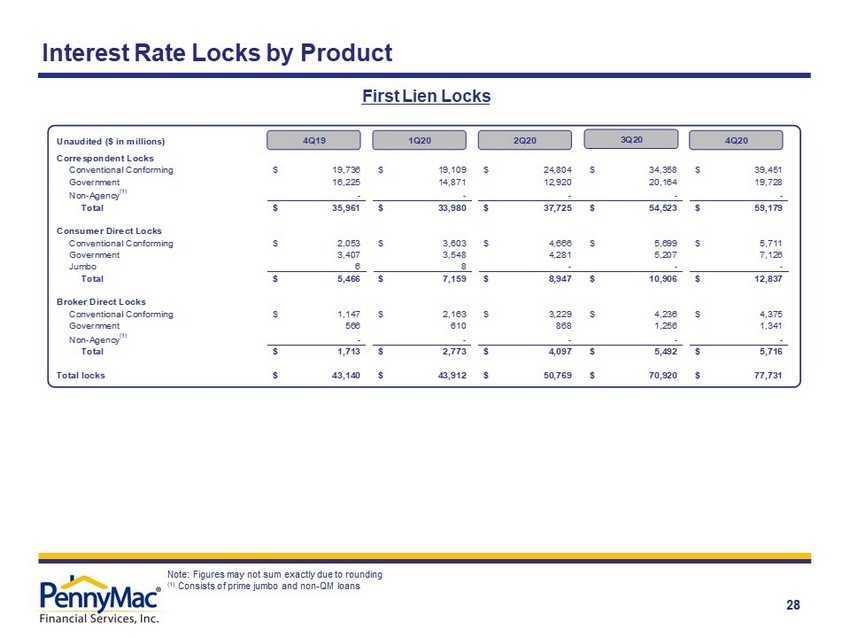
28 Interest Rate Locks by Product First Lien Locks Note: Figures may not sum exactly due to rounding (1) Consists of prime jumbo and non - QM loans Unaudited ($ in millions) Correspondent Locks Conventional Conforming 19,736$ 19,109$ 24,804$ 34,358$ 39,451$ Government 16,225 14,871 12,920 20,164 19,728 Non-Agency (1) - - - - - Total 35,961$ 33,980$ 37,725$ 54,523$ 59,179$ Consumer Direct Locks Conventional Conforming 2,053$ 3,603$ 4,666$ 5,699$ 5,711$ Government 3,407 3,548 4,281 5,207 7,126 Jumbo 6 8 - - - Total 5,466$ 7,159$ 8,947$ 10,906$ 12,837$ Broker Direct Locks Conventional Conforming 1,147$ 2,163$ 3,229$ 4,236$ 4,375$ Government 566 610 868 1,256 1,341 Non-Agency (1) - - - - - Total 1,713$ 2,773$ 4,097$ 5,492$ 5,716$ Total locks 43,140$ 43,912$ 50,769$ 70,920$ 77,731$ 4Q19 2Q20 1Q20 4Q20 3Q20

29 Credit Characteristics by Acquisition / Origination Period Correspondent Consumer Direct Broker Direct 4Q19 1Q20 2Q20 3Q20 4Q20 4Q19 1Q20 2Q20 3Q20 4Q20 Government-insured 703 700 719 715 714 Government-insured 42 42 37 37 36 Conventional 762 763 769 772 768 Conventional 35 34 32 32 33 Weighted Average DTIWeighted Average FICO 4Q19 1Q20 2Q20 3Q20 4Q20 4Q19 1Q20 2Q20 3Q20 4Q20 Government-insured 711 710 719 719 720 Government-insured 42 42 41 40 39 Conventional 747 748 752 756 759 Conventional 35 35 33 32 32 Weighted Average DTIWeighted Average FICO 4Q19 1Q20 2Q20 3Q20 4Q20 4Q19 1Q20 2Q20 3Q20 4Q20 Government-insured 715 712 738 756 753 Government-insured 43 43 42 45 43 Conventional 758 761 767 770 768 Conventional 36 34 32 32 32 Weighted Average DTIWeighted Average FICO