Exhibit 99.2

3Q23 EARNINGS REPORT PennyMac Financial Services, Inc. October 2023
2 This presentation contains forward - looking statements within the meaning of Section 21E of the Securities Exchange Act of 1934, as amended, regarding management’s beliefs, estimates, projections and assumptions with respect to, among other things, our financial results, future operations, business plans and in vestment strategies, as well as industry and market conditions, all of which are subject to change. Words like “believe,” “expect,” “anticipate,” “promise,” “project,” “plan,” and other expression s o r words of similar meanings, as well as future or conditional verbs such as “will,” “would,” “should,” “could,” or “may” are generally intended to identify forward - looking statements. Actual results and o perations for any future period may vary materially from those projected herein and from past results discussed herein. These forward - looking statements include, but are not limited to, statements rega rding future changes in interest rates, prepayment rates and the housing market; future loan origination, servicing and production, including future production, operating and hedge expenses; fu ture loan delinquencies and forbearances; future earnings and return on equity as well as other business and financial expectations. Factors which could cause actual results to differ materially fr om historical results or those anticipated include, but are not limited to: interest rate changes; changes in real estate values, housing prices and housing sales; the continually changing federal, sta te and local laws and regulations applicable to the highly regulated industry in which we operate; lawsuits or governmental actions that may result from any noncompliance with the laws and regulations ap pli cable to our business; the mortgage lending and servicing - related regulations promulgated by the Consumer Financial Protection Bureau and its enforcement of these regulations; our dependence on U.S. government - sponsored entities and changes in their current roles or their guarantees or guidelines; changes to government mortgage modification programs; the licensing and operational req uirements of states and other jurisdictions applicable to our business, to which our bank competitors are not subject; foreclosure delays and changes in foreclosure practices; changes in mac roeconomic and U.S. real estate market conditions; difficulties inherent in adjusting the size of our operations to reflect changes in business levels; purchase opportunities for mortgage s erv icing rights and our success in winning bids; our substantial amount of indebtedness; increases in loan delinquencies, defaults and forbearances; our reliance on PennyMac Mortgage Investment Trust (NY SE: PMT) as a significant contributor to our mortgage banking business; maintaining sufficient capital and liquidity and compliance with financial covenants; our obligation to indemnify t hir d - party purchasers or repurchase loans if loans that we originate, acquire, service or assist in the fulfillment of, fail to meet certain criteria or characteristics or under other circumstanc es; our obligation to indemnify PMT if our services fail to meet certain criteria or characteristics or under other circumstances; investment management and incentive fees; conflicts of interest in allocating o ur services and investment opportunities among us and our advised entities; the effect of public opinion on our reputation; our exposure to risks of loss and disruptions in operations resulti ng from adverse weather conditions, man - made or natural disasters, climate change and pandemics; our ability to effectively identify, manage and hedge our credit, interest rate, prepayment, liquidity and climate risks; our initiation or expansion of new business activities or strategies; our ability to detect misconduct and fraud; our ability to mitigate cybersecurity risks and cyber incidents; our abi lity to pay dividends to our stockholders; and our organizational structure and certain requirements in our charter documents. You should not place undue reliance on any forward - looking statement and shou ld consider all of the uncertainties and risks described above, as well as those more fully discussed in reports and other documents filed by the Company with the Securities and Exchange Commi ssi on from time to time. The Company undertakes no obligation to publicly update or revise any forward - looking statements or any other information contained herein, and the statements made in t his presentation are current as of the date of this presentation only. This presentation contains financial information calculated other than in accordance with U.S. generally accepted accounting pri nciples (“GAAP”), such as pretax income excluding valuation - related items that provide a meaningful perspective on the Company’s business results since the Company utilizes this information to eva luate and manage the business. Non - GAAP disclosure has limitations as an analytical tool and should not be viewed as a substitute for financial information determined in accordance wi th GAAP. FORWARD - LOOKING STATEMENTS
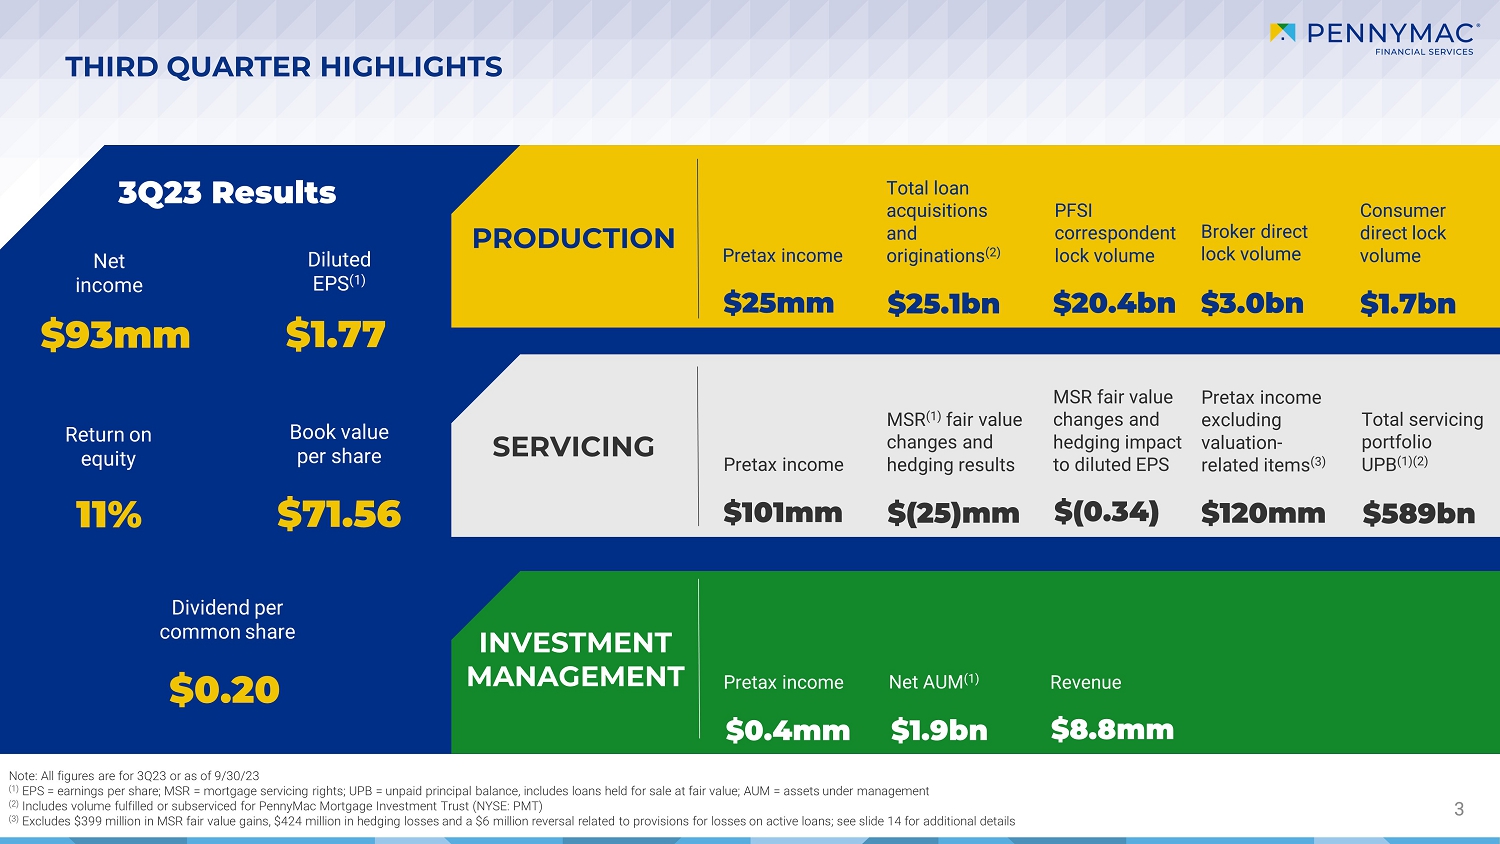
3 3 THIRD QUARTER HIGHLIGHTS PRODUCTION INVESTMENT MANAGEMENT Net income $93mm 3Q23 Results Diluted EPS ( $1.77 Return on equity 11% Book value per share $71.56 Dividend per common share $0.20 Pretax income $25mm $1.7bn PFSI correspondent lock volume $20.4bn Broker direct lock volume $3.0bn $25.1bn Pretax income $0.4mm Net AUM ( $1.9bn Revenue $8.8mm Note: All figures are for 3Q23 or as of 9/30/23 (1) EPS = earnings per share; MSR = mortgage servicing rights; UPB = unpaid principal balance, includes loans held for sale at fa ir value; AUM = assets under management (2) Includes volume fulfilled or subserviced for PennyMac Mortgage Investment Trust (NYSE: PMT) (3) Excludes $399 million in MSR fair value gains, $424 million in hedging losses and a $6 million reversal related to provisions f or losses on active loans; see slide 14 for additional details SERVICING Pretax income $101mm MSR ( fair value changes and hedging results $(25)mm Pretax income excluding valuation related items ( $120mm MSR fair value changes and hedging impact to diluted EPS $(0.34) Total servicing portfolio UPB (1)( $589bn Total loan acquisitions and originations ( Consumer direct lock volume
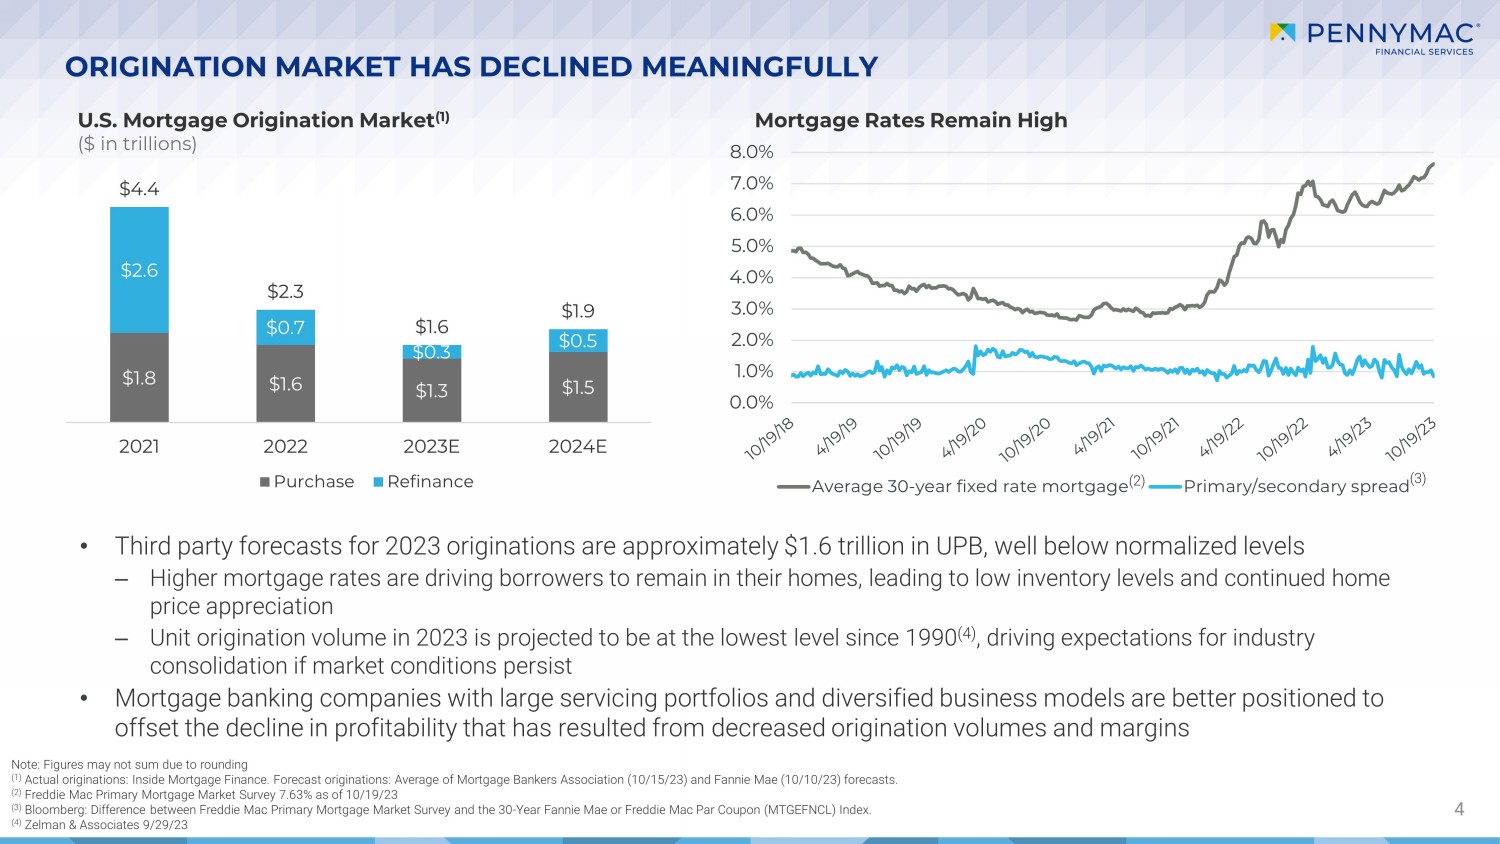
0.0% 1.0% 2.0% 3.0% 4.0% 5.0% 6.0% 7.0% 8.0% Average 30-year fixed rate mortgage Primary/secondary spread ORIGINATION MARKET HAS DECLINED MEANINGFULLY 4 U.S. Mortgage Origination Market (1) ($ in trillions) Mortgage Rates Remain High • Third party forecasts for 2023 originations are approximately $1.6 trillion in UPB, well below normalized levels ‒ Higher mortgage rates are driving borrowers to remain in their homes, leading to low inventory levels and continued home price appreciation ‒ Unit origination volume in 2023 is projected to be at the lowest level since 1990 (4) , driving expectations for industry consolidation if market conditions persist • Mortgage banking companies with large servicing portfolios and diversified business models are better positioned to offset the decline in profitability that has resulted from decreased origination volumes and margins Note: Figures may not sum due to rounding (1) Actual originations: Inside Mortgage Finance. F orecast originations: Average of Mortgage Bankers Association (10/15/23) and Fannie Mae (10/10/23) forecasts. (2) Freddie Mac Primary Mortgage Market Survey 7.63% as of 10/19/23 (3) Bloomberg: Difference between Freddie Mac Primary Mortgage Market Survey and the 30 - Year Fannie Mae or Freddie Mac Par Coupon ( MTGEFNCL) Index. (4) Zelman & Associates 9/29/23 (2) (3) $1.8 $1.6 $1.3 $1.5 $2.6 $0.7 $0.3 $0.5 $4.4 $2.3 $1.6 $1.9 2021 2022 2023E 2024E Purchase Refinance
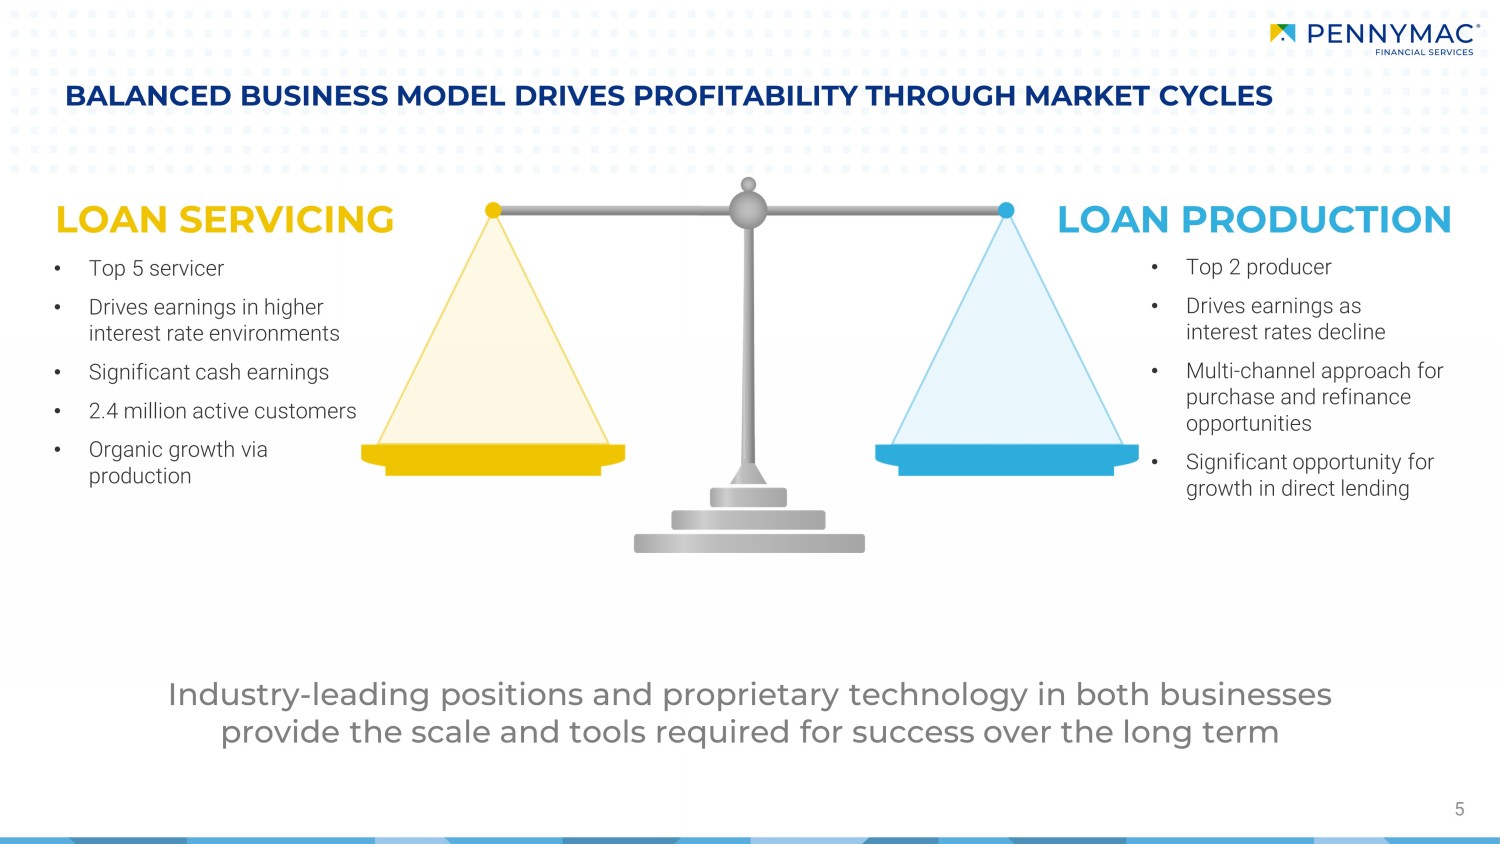
BALANCED BUSINESS MODEL DRIVES PROFITABILITY THROUGH MARKET CYCLES 5 Industry - leading positions and proprietary technology in both businesses provide the scale and tools required for success over the long term • Top 5 servicer • Drives earnings in higher interest rate environments • Significant cash earnings • 2.4 million active customers • Organi c growth via production LOAN SERVICING LOAN PRODUCTION • Top 2 producer • Drives earnings as interest rates decline • Multi - channel approach for purchase and refinance opportunities • Significant opportunity for growth in direct lending
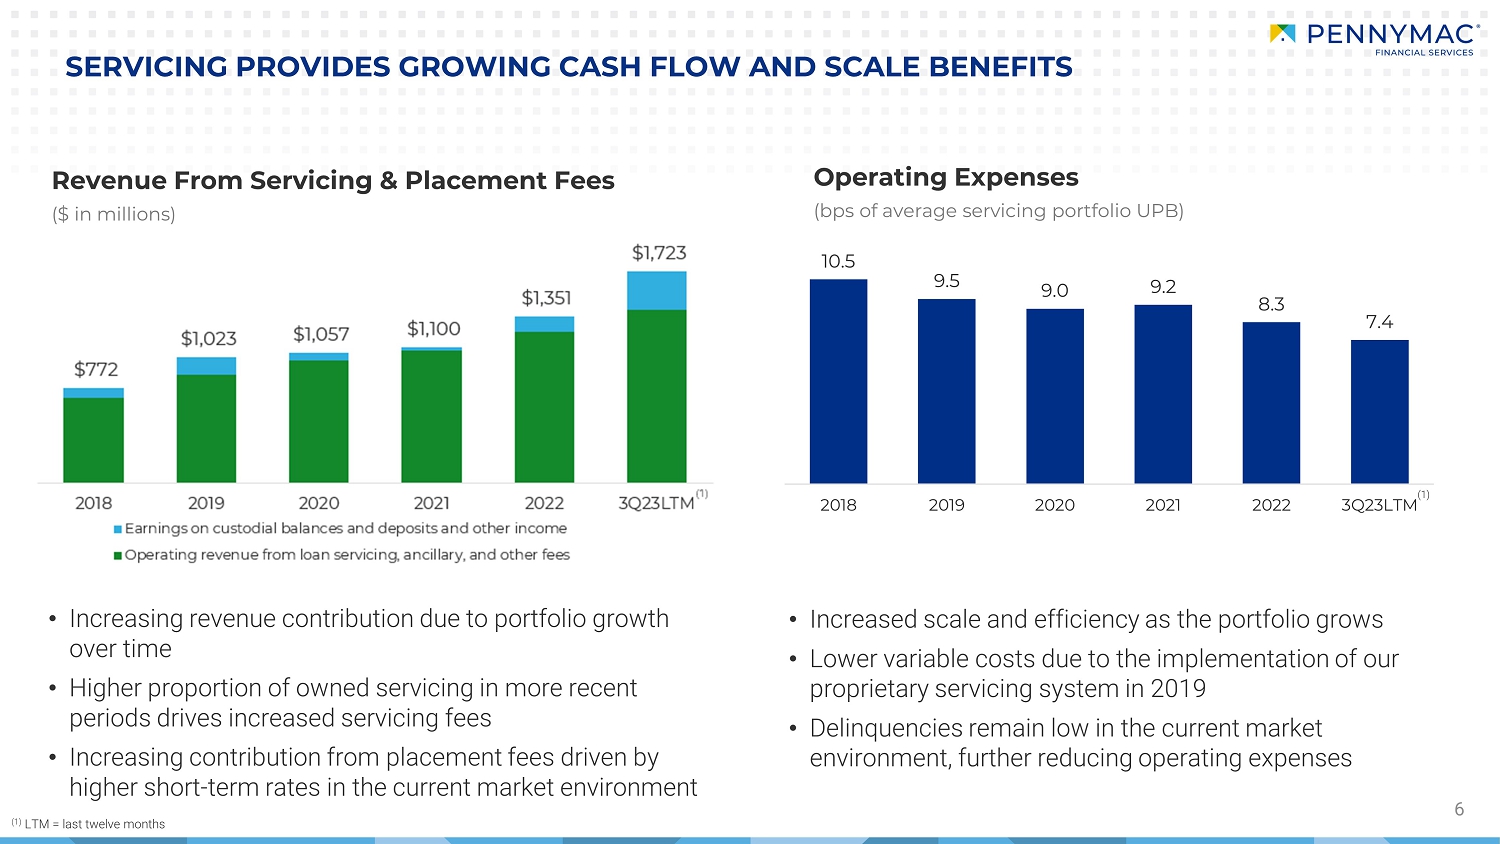
10.5 9.5 9.0 9.2 8.3 7.4 2018 2019 2020 2021 2022 3Q23LTM 6 Operating Expenses (bps of average servicing portfolio UPB) Revenue From Servicing Placement Fees ($ in millions) SERVICING PROVIDES GROWING CASH FLOW AND SCALE BENEFITS o Increasing revenue contribution due to portfolio growth over time o Higher proportion of owned servicing in more recent periods drives increased servicing fees o Increasing contribution from placement fees driven by higher short term rates in the current market environment o Increased scale and efficiency as the portfolio grows o Lower variable costs due to the implementation of our proprietary servicing system in 2019 o Delinquencies remain low in the current market environment, further reducing operating expenses (1) LTM = l ast twelve months (1) (1)
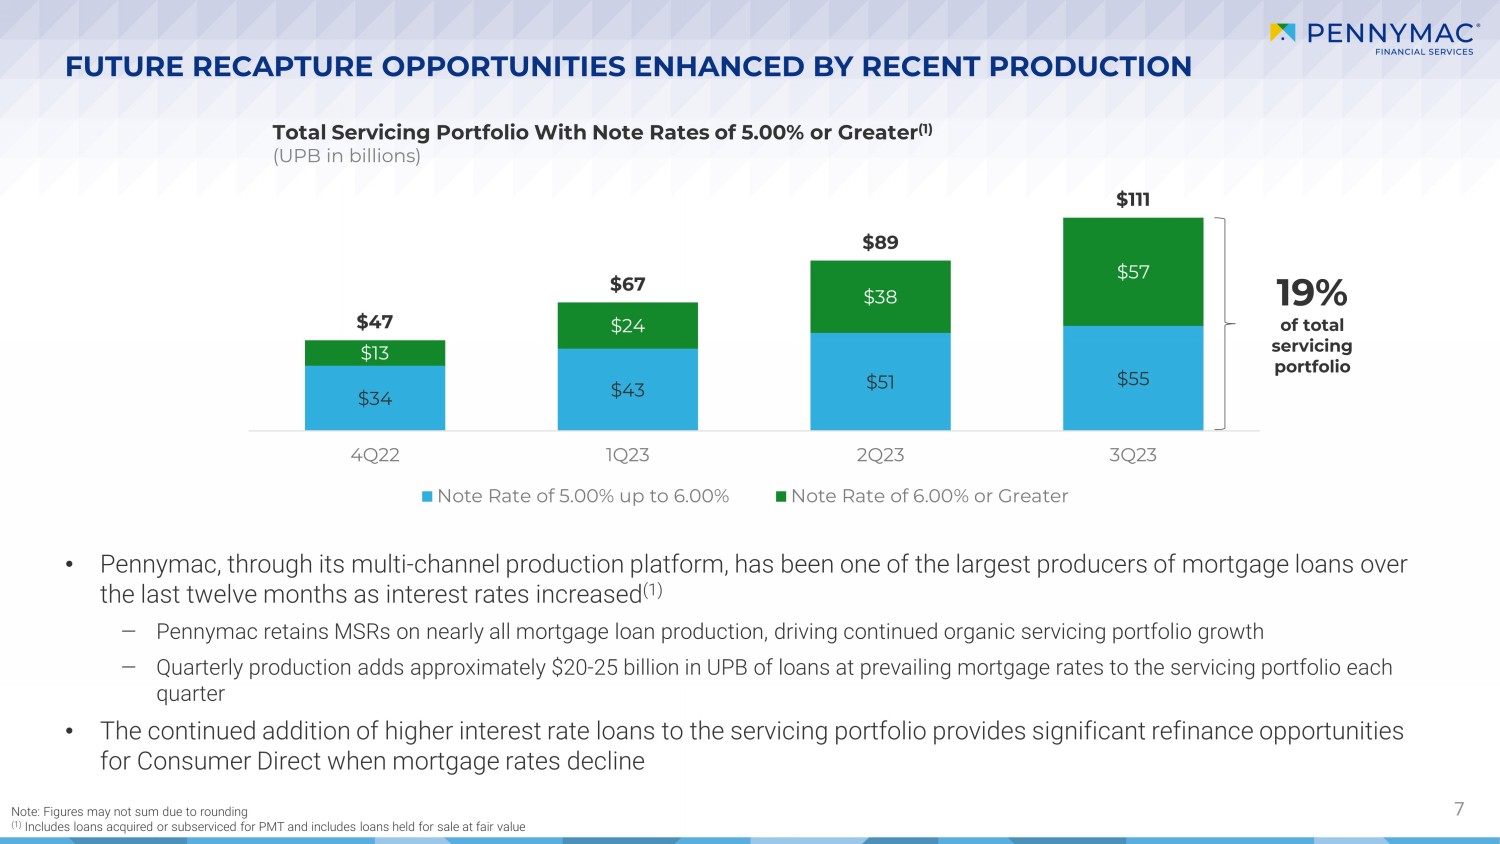
$34 $43 $51 $55 $13 $24 $38 $57 $47 $67 $89 $111 4Q22 1Q23 2Q23 3Q23 Note Rate of 5.00% up to 6.00% Note Rate of 6.00% or Greater Total Servicing Portfolio With Note Rates of 5.00% or Greater (1) (UPB in bill ions) FUTURE RECAPTURE OPPORTUNITIES ENHANCED BY RECENT PRODUCTION 7 • Pennymac, through its multi - channel production platform, has been one of the largest producers of mortgage loans over the last twelve months as interest rates increased (1) ‒ Pennymac retains MSRs on nearly all mortgage loan production, driving continued organic servicing portfolio growth ‒ Quarterly production adds approximately $20 - 25 billion in UPB of loans at prevailing mortgage rates to the servicing portfolio e ach quarter • The continued addition of higher interest rate loans to the servicing portfolio provides significant refinance opportunities for Consumer Direct when mortgage rates decline Note: Figures may not sum due to rounding (1) Includes loans acquired or subserviced for PMT and includes loans held for sale at fair value 19% of total servicing portfolio
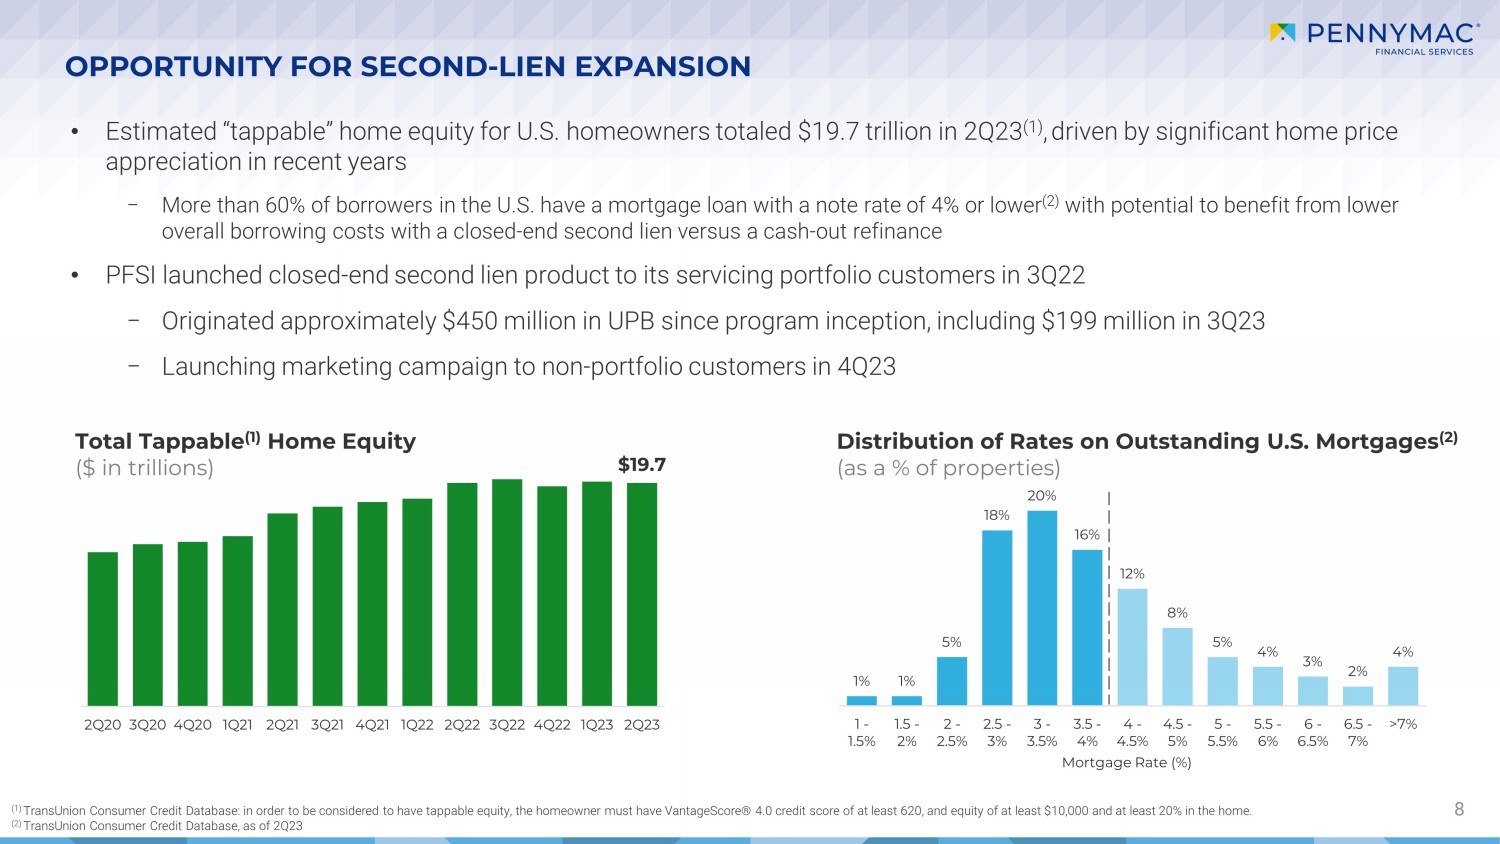
$19.7 2Q20 3Q20 4Q20 1Q21 2Q21 3Q21 4Q21 1Q22 2Q22 3Q22 4Q22 1Q23 2Q23 1% 1% 5% 18% 20% 16% 12% 8% 5% 4% 3% 2% 4% 1 - 1.5% 1.5 - 2% 2 - 2.5% 2.5 - 3% 3 - 3.5% 3.5 - 4% 4 - 4.5% 4.5 - 5% 5 - 5.5% 5.5 - 6% 6 - 6.5% 6.5 - 7% >7% Mortgage Rate (%) OPPORTUNITY FOR SECOND - LIEN EXPANSION 8 Distribution of Rates on Outstanding U.S. Mortgages (2) (as a % of properties) (1) TransUnion Consumer Credit Database: in order to be considered to have tappable equity, the homeowner must have VantageScore ® 4.0 credit score of at least 620, and equity of at least $10,000 and at least 20% in the home. (2) TransUnion Consumer Credit Database, as of 2Q23 Total Tappable (1) Home Equity ($ in trillions) • Estimated “tappable” home equity for U.S. homeowners totaled $19.7 trillion in 2Q23 (1) , driven by significant home price appreciation in recent years − More than 60% of borrowers in the U.S. have a mortgage loan with a note rate of 4% or lower (2) with potential to benefit from lower overall borrowing costs with a closed - end second lien versus a cash - out refinance • PFSI launched closed - end second lien product to its servicing portfolio customers in 3Q22 − Originated approximately $450 million in UPB since program inception, including $199 million in 3Q23 − Launching marketing campaign to non - portfolio customers in 4Q23
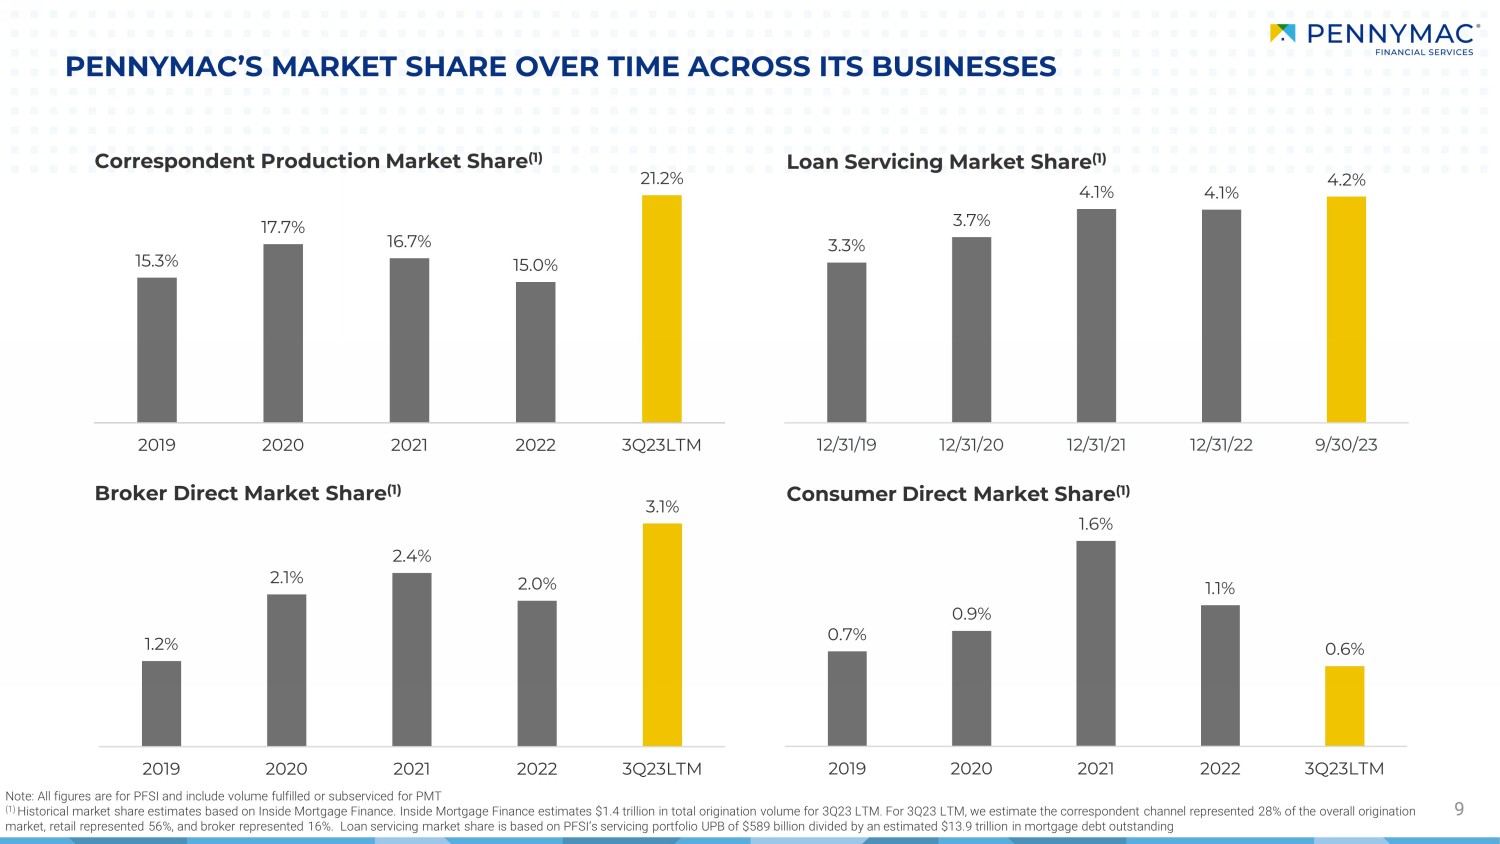
PENNYMAC’S MARKET SHARE OVER TIME ACROSS ITS BUSINESSES 9 Loan Servicing Market Share (1) Correspondent Production Market Share (1) Broker Direct Market Share (1) Consumer Direct Market Share (1) Note: All figures are for PFSI and include volume fulfilled or subserviced for PMT (1) Historical market share estimates based on Inside Mortgage Finance. Inside Mortgage Finance estimates $1.4 trillion in total ori gination volume for 3Q23 LTM. For 3Q23 LTM, we estimate the correspondent channel represented 28% of the overall origination market, retail represented 56%, and broker represented 16%. Loan servicing market share is based on PFSI’s servicing portfol io UPB of $589 billion divided by an estimated $13.9 trillion in mortgage debt outstanding 15.3% 17.7% 16.7% 15.0% 21.2% 2019 2020 2021 2022 3Q23LTM 3.3% 3.7% 4.1% 4.1% 4.2% 12/31/19 12/31/20 12/31/21 12/31/22 9/30/23 0.7% 0.9% 1.6% 1.1% 0.6% 2019 2020 2021 2022 3Q23LTM 1.2% 2.1% 2.4% 2.0% 3.1% 2019 2020 2021 2022 3Q23LTM
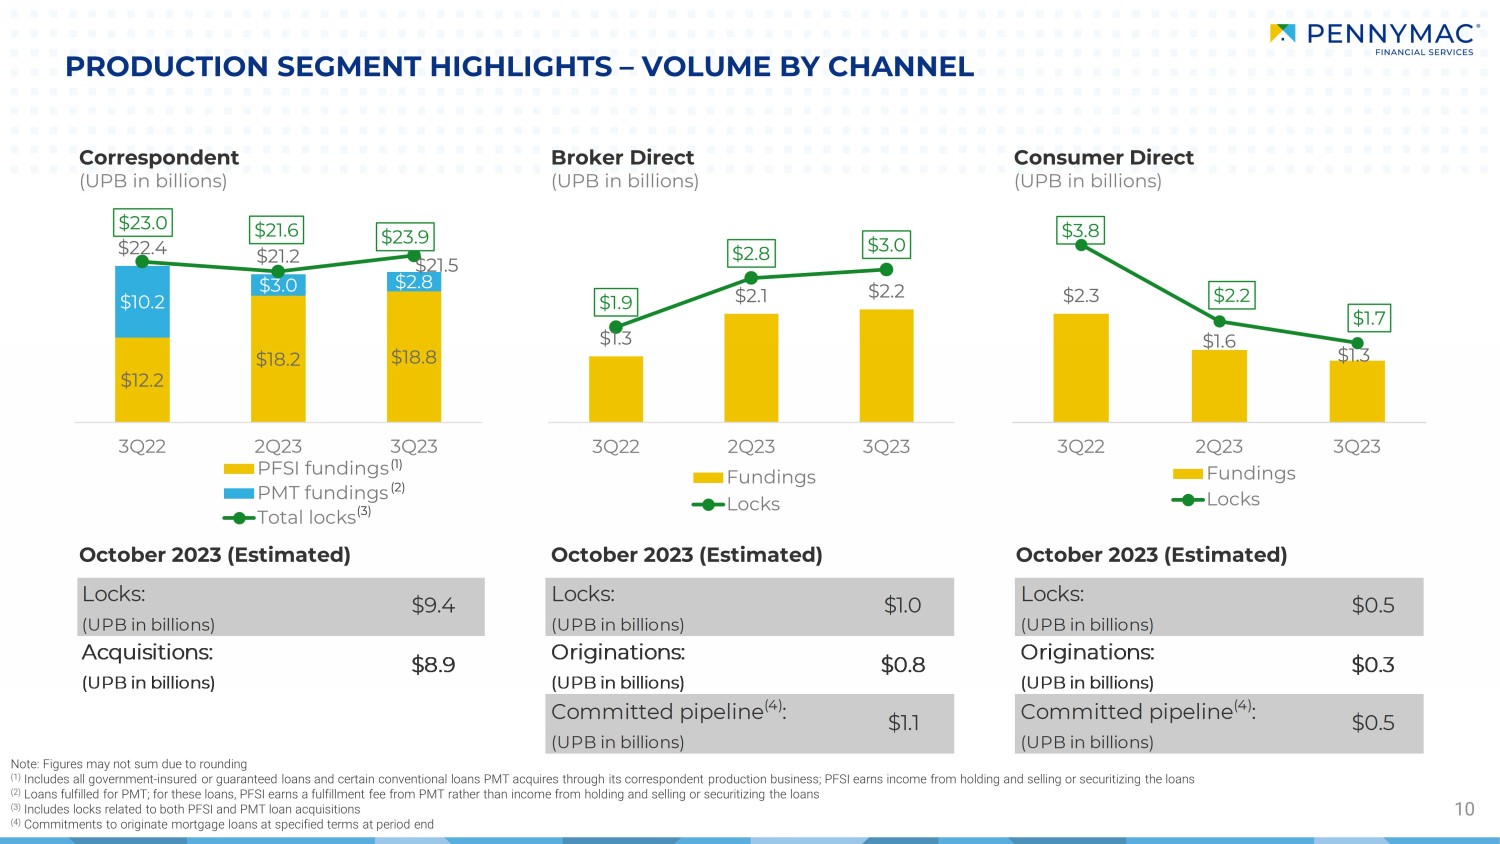
$12.2 $18.2 $18.8 $10.2 $3.0 $2.8 $22.4 $21.2 $21.5 $23.0 $21.6 $23.9 3Q22 2Q23 3Q23 PFSI fundings PMT fundings Total locks 10 PRODUCTION SEGMENT HIGHLIGHTS – VOLUME BY CHANNEL Broker Direct (UPB in billions) Consumer Direct (UPB in billions) October 2023 (Estimated) October 2023 (Estimated) October 2023 (Estimated) Note: Figures may not sum due to rounding (1) Includes all government - insured or guaranteed loans and certain conventional loans PMT acquires through its correspondent produ ction business; PFSI earns income from holding and selling or securitizing the loans (2) Loans fulfilled for PMT; for these loans, PFSI earns a fulfillment fee from PMT rather than income from holding and selling o r securitizing the loans (3) Includes locks related to both PFSI and PMT loan acquisitions (4) Commitments to originate mortgage loans at specified terms at period end (1) (2) (3) Correspondent (UPB in billions) $1.3 $2.1 $2.2 $1.9 $2.8 $3.0 3Q22 2Q23 3Q23 Fundings Locks $2.3 $1.6 $1.3 $3.8 $2.2 $1.7 3Q22 2Q23 3Q23 Fundings Locks Locks: (UPB in billions) $9.4 Locks: (UPB in billions) $1.0 Locks: (UPB in billions) $0.5 Acquisitions: (UPB in billions) $8.9 Originations: (UPB in billions) $0.8 Originations: (UPB in billions) $0.3 Committed pipeline (4) : (UPB in billions) $1.1 Committed pipeline (4) : (UPB in billions) $0.5
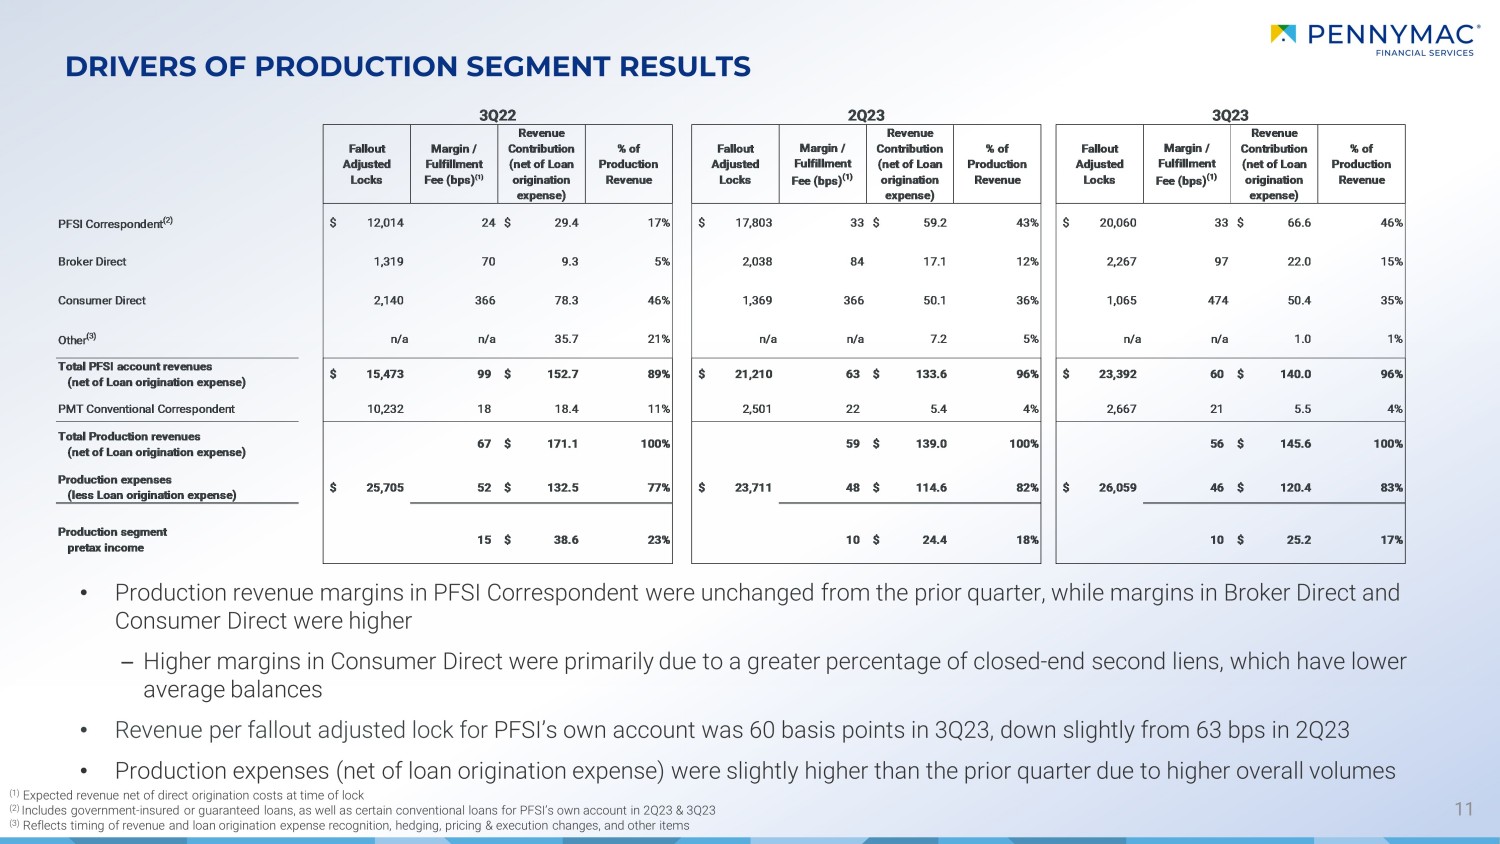
11 DRIVERS OF PRODUCTION SEGMENT RESULTS (1) Expected revenue net of direct origination costs at time of lock (2) Includes government - insured or guaranteed loans, as well as certain conventional loans for PFSI’s own account in 2Q23 & 3Q23 (3) Reflects timing of revenue and loan origination expense recognition, hedging, pricing & execution changes, and other items • Production revenue margins in PFSI Correspondent were unchanged from the prior quarter, while margins in Broker Direct and Consumer Direct were higher – Higher margins in Consumer Direct were primarily due to a greater percentage of closed - end second liens, which have lower average balances • Revenue per fallout adjusted lock for PFSI’s own account was 60 basis points in 3Q23, down slightly from 63 bps in 2Q23 • Production expenses (net of loan origination expense) were slightly higher than the prior quarter due to higher overall volum es Fallout Adjusted Locks Margin / Fulfillment Fee (bps) (1) Revenue Contribution (net of Loan origination expense) % of Production Revenue Fallout Adjusted Locks Margin / Fulfillment Fee (bps) (1) Revenue Contribution (net of Loan origination expense) % of Production Revenue Fallout Adjusted Locks Margin / Fulfillment Fee (bps) (1) Revenue Contribution (net of Loan origination expense) % of Production Revenue PFSI Correspondent (2) 12,014$ 24 29.4$ 17% 17,803$ 33 59.2$ 43% 20,060$ 33 66.6$ 46% Broker Direct 1,319 70 9.3 5% 2,038 84 17.1 12% 2,267 97 22.0 15% Consumer Direct 2,140 366 78.3 46% 1,369 366 50.1 36% 1,065 474 50.4 35% Other (3) n/a n/a 35.7 21% n/a n/a 7.2 5% n/a n/a 1.0 1% Total PFSI account revenues (net of Loan origination expense) 15,473$ 99 152.7$ 89% 21,210$ 63 133.6$ 96% 23,392$ 60 140.0$ 96% PMT Conventional Correspondent 10,232 18 18.4 11% 2,501 22 5.4 4% 2,667 21 5.5 4% Total Production revenues (net of Loan origination expense) 67 171.1$ 100% 59 139.0$ 100% 56 145.6$ 100% Production expenses (less Loan origination expense) 25,705$ 52 132.5$ 77% 23,711$ 48 114.6$ 82% 26,059$ 46 120.4$ 83% Production segment pretax income 15 38.6$ 23% 10 24.4$ 18% 10 25.2$ 17% 3Q232Q233Q22
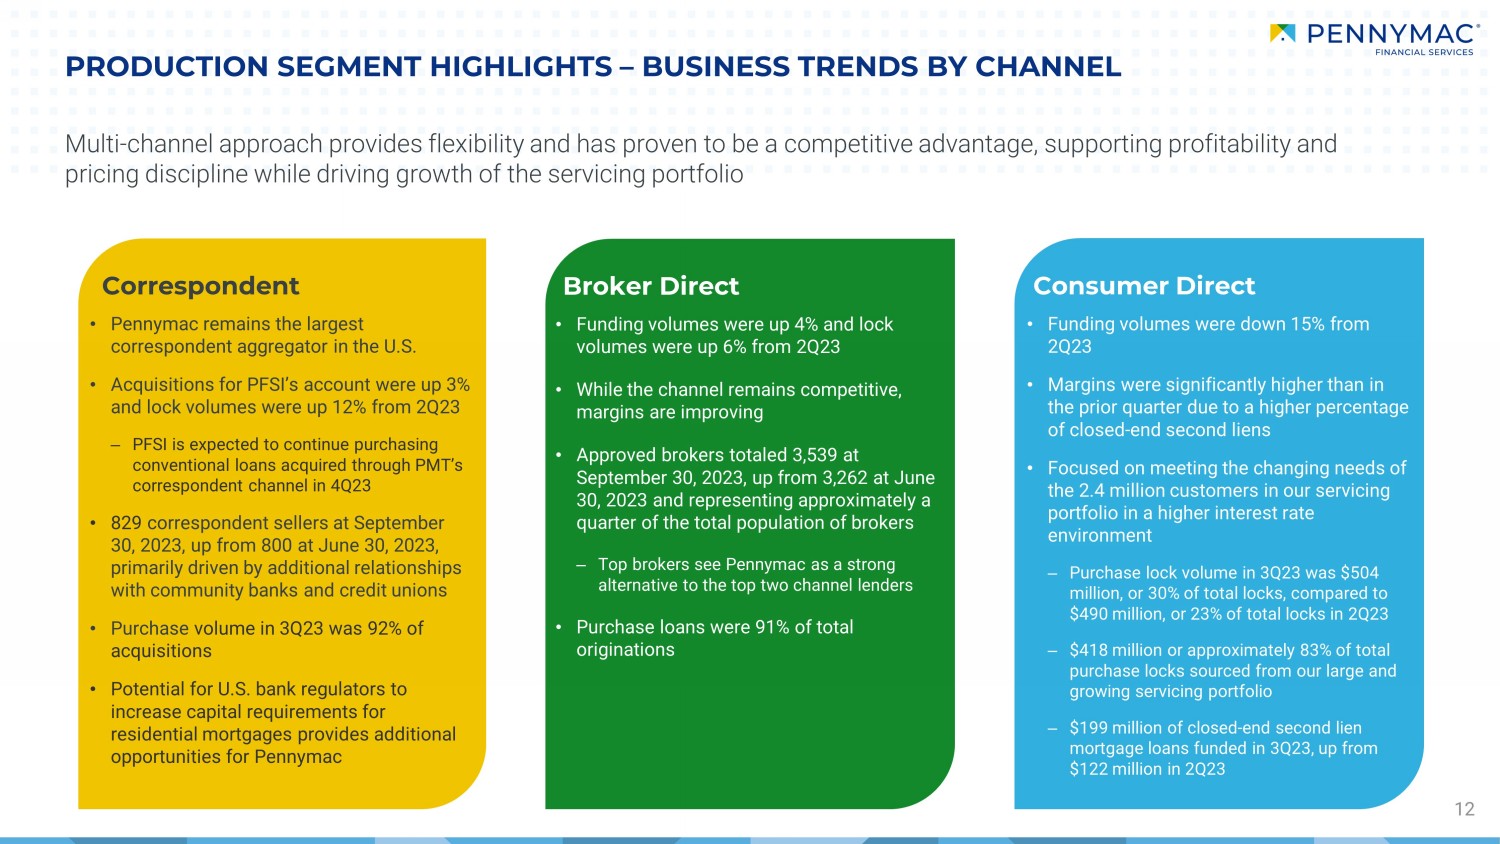
PRODUCTION SEGMENT HIGHLIGHTS – BUSINESS TRENDS BY CHANNEL 12 • Pennymac remains the largest correspondent aggregator in the U.S. • Acquisitions for PFSI’s account were up 3% and lock volumes were up 12% from 2Q23 ‒ PFSI is expected to continue purchasing conventional loans acquired through PMT’s correspondent channel in 4Q23 • 829 correspondent sellers at September 30, 2023, up from 800 at June 30, 2023, primarily driven by additional relationships with community banks and credit unions • Purchase volume in 3Q23 was 92% of acquisitions • Potential for U.S. bank regulators to increase capital requirements for residential mortgages provides additional opportunities for Pennymac • Funding volumes were up 4% and lock volumes were up 6% from 2Q23 • While the channel remains competitive, margins are improving • Approved brokers totaled 3,539 at September 30, 2023, up from 3,262 at June 30, 2023 and representing approximately a quarter of the total population of brokers ‒ Top brokers see Pennymac as a strong alternative to the top two channel lenders • Purchase loans were 91% of total originations • Funding volumes were down 15% from 2Q23 • Margins were significantly higher than in the prior quarter due to a higher percentage of closed - end second liens • Focused on meeting the changing needs of the 2.4 million customers in our servicing portfolio in a higher interest rate environment ‒ Purchase lock volume in 3Q23 was $504 million, or 30% of total locks, compared to $490 million, or 23% of total locks in 2Q23 ‒ $418 million or approximately 83% of total purchase locks sourced from our large and growing servicing portfolio ‒ $199 million of closed - end second lien mortgage loans funded in 3Q23, up from $122 million in 2Q23 C orrespondent Broker Direct C onsumer Direct Multi - channel approach provides flexibility and has proven to be a competitive advantage, supporting profitability and pricing discipline while driving growth of the servicing portfolio
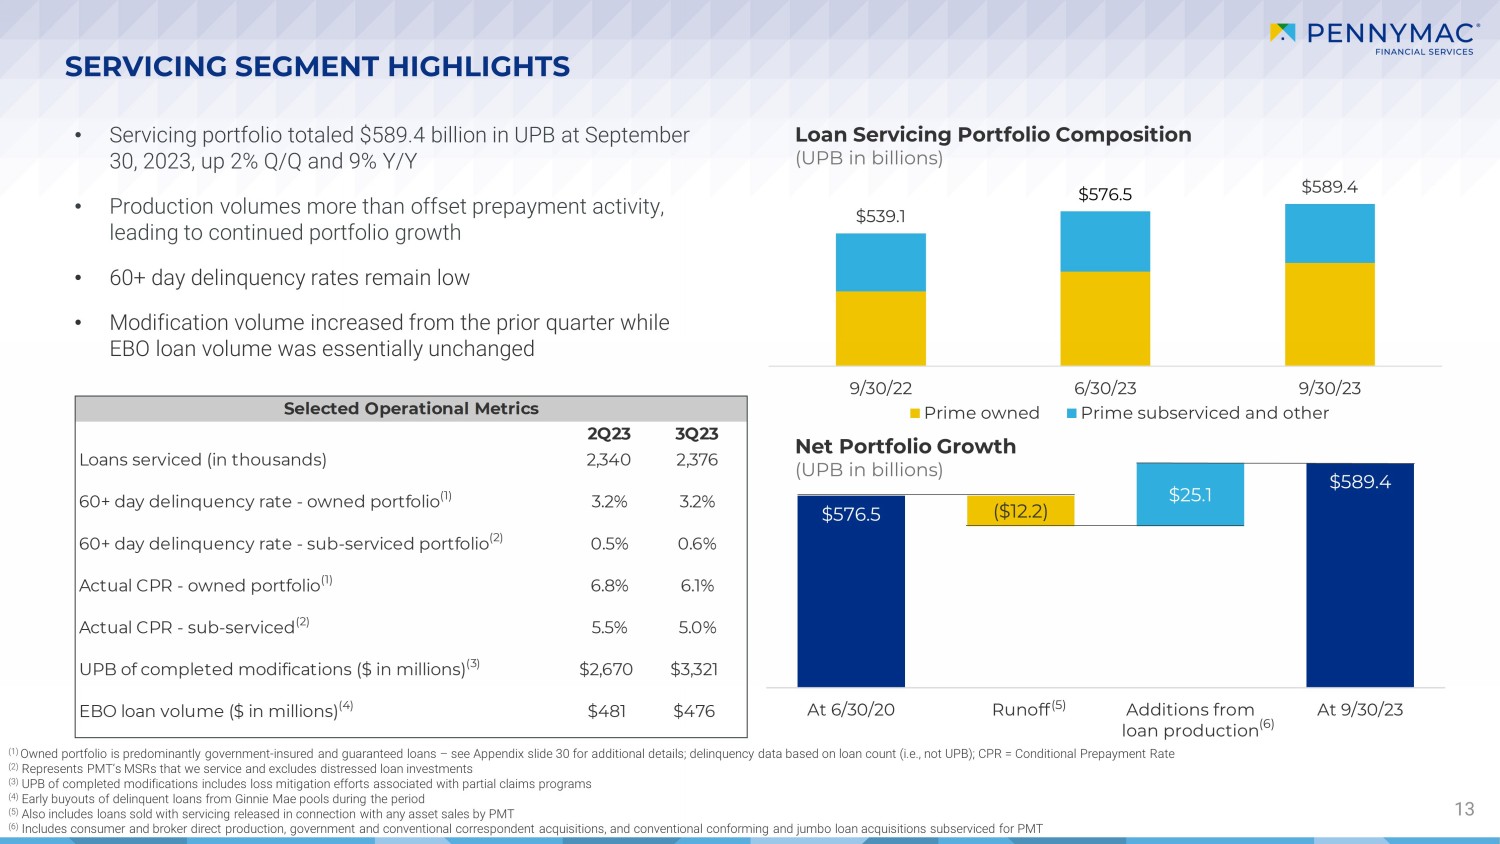
$539.1 $576.5 $589.4 9/30/22 6/30/23 9/30/23 Prime owned Prime subserviced and other $576.5 $589.4 ($12.2) $25.1 At 6/30/20 Runoff Additions from loan production At 9/30/23 SERVICING SEGMENT HIGHLIGHTS 13 • Servicing portfolio totaled $589.4 billion in UPB at September 30, 2023, up 2% Q/Q and 9% Y/Y • Production volumes more than offset prepayment activity, leading to continued portfolio growth • 60+ day delinquency rates remain low • Modification volume increased from the prior quarter while EBO loan volume was essentially unchanged Loan Servicing Portfolio Composition (UPB in billions) Net Portfolio Growth (UPB in billions) (1) Owned portfolio is predominantly government - insured and guaranteed loans – see Appendix slide 30 for additional details; delinqu ency data based on loan count (i.e., not UPB); CPR = Conditional Prepayment Rate (2) Represents PMT’s MSRs that we service and excludes distressed loan investments (3) UPB of completed modifications includes loss mitigation efforts associated with partial claims programs (4) Early buyouts of delinquent loans from Ginnie Mae pools during the period (5) Also includes loans sold with servicing released in connection with any asset sales by PMT (6) Includes consumer and broker direct production, government and conventional correspondent acquisitions, and conventional conf or ming and jumbo loan acquisitions subserviced for PMT (5) (6) 2Q23 3Q23 Loans serviced (in thousands) 2,340 2,376 60+ day delinquency rate - owned portfolio (1) 3.2% 3.2% 60+ day delinquency rate - sub-serviced portfolio (2) 0.5% 0.6% Actual CPR - owned portfolio (1) 6.8% 6.1% Actual CPR - sub-serviced (2) 5.5% 5.0% UPB of completed modifications ($ in millions) (3) $2,670 $3,321 EBO loan volume ($ in millions) (4) $481 $476 Selected Operational Metrics
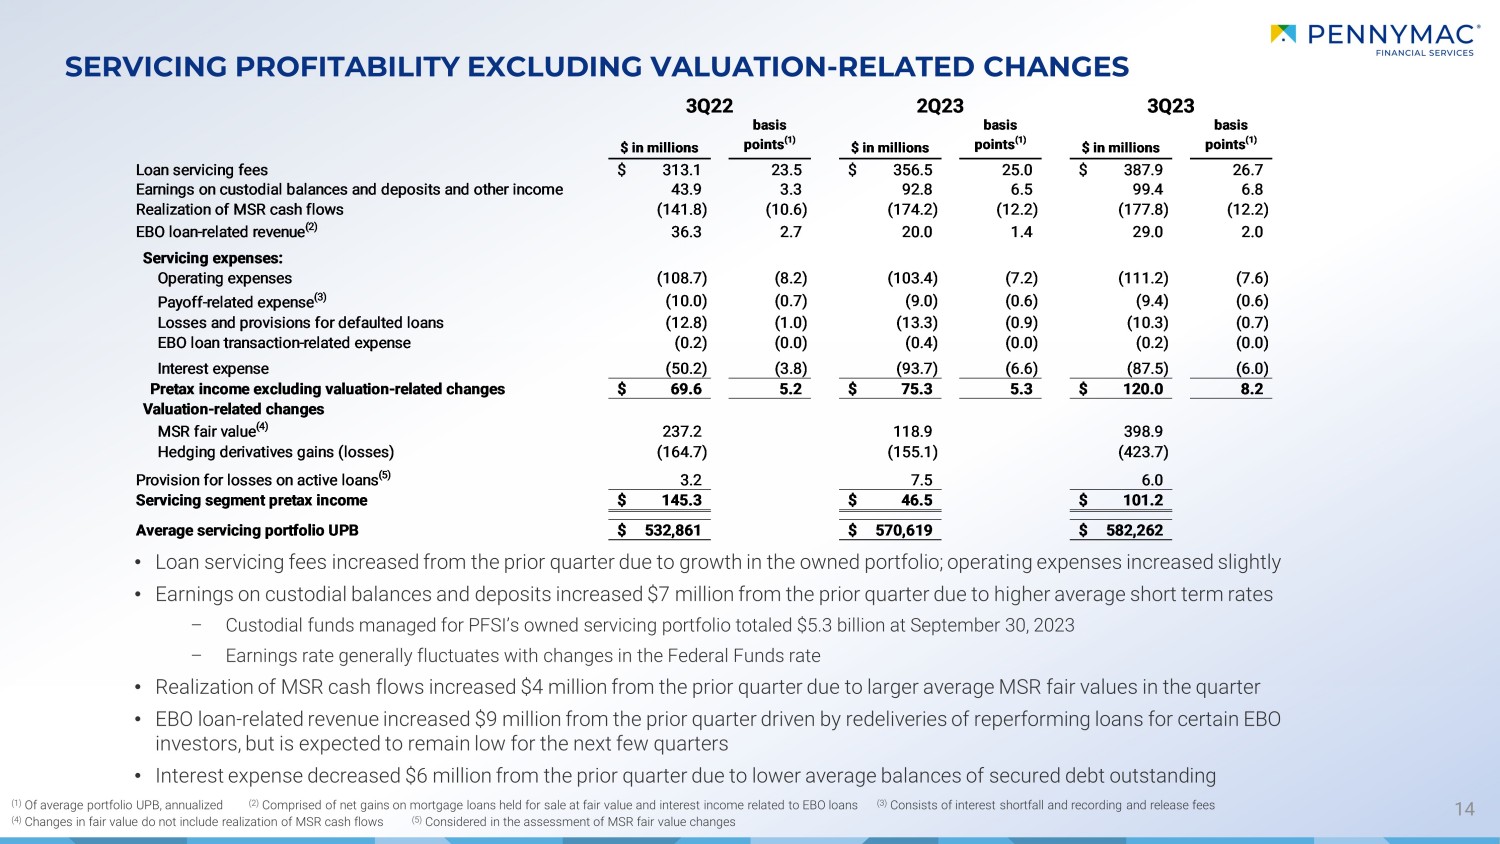
SERVICING PROFITABILITY EXCLUDING VALUATION - RELATED CHANGES 14 • Loan servicing fees increased from the prior quarter due to growth in the owned portfolio; operating expenses increased sligh tly • Earnings on custodial balances and deposits increased $7 million from the prior quarter due to higher average short term rate s – Custodial funds managed for PFSI’s owned servicing portfolio totaled $5.3 billion at September 30, 2023 – Earnings rate generally fluctuates with changes in the Federal Funds rate • Realization of MSR cash flows increased $4 million from the prior quarter due to larger average MSR fair values in the quarte r • EBO loan - related revenue increased $9 million from the prior quarter driven by redeliveries of reperforming loans for certain EB O investors, but is expected to remain low for the next few quarters • Interest expense decreased $6 million from the prior quarter due to lower average balances of secured debt outstanding (1) Of average portfolio UPB, annualized (2) Comprised of net gains on mortgage loans held for sale at fair value and interest income related to EBO loans (3) Consists of interest shortfall and recording and release fees (4) Changes in fair value do not include realization of MSR cash flows (5) Considered in the assessment of MSR fair value changes $ in millions basis points (1) $ in millions basis points (1) $ in millions basis points (1) Loan servicing fees 313.1$ 23.5 356.5$ 25.0 387.9$ 26.7 Earnings on custodial balances and deposits and other income 43.9 3.3 92.8 6.5 99.4 6.8 Realization of MSR cash flows (141.8) (10.6) (174.2) (12.2) (177.8) (12.2) EBO loan-related revenue (2) 36.3 2.7 20.0 1.4 29.0 2.0 Servicing expenses: Operating expenses (108.7) (8.2) (103.4) (7.2) (111.2) (7.6) Payoff-related expense (3) (10.0) (0.7) (9.0) (0.6) (9.4) (0.6) Losses and provisions for defaulted loans (12.8) (1.0) (13.3) (0.9) (10.3) (0.7) EBO loan transaction-related expense (0.2) (0.0) (0.4) (0.0) (0.2) (0.0) Interest expense (50.2) (3.8) (93.7) (6.6) (87.5) (6.0) Pretax income excluding valuation-related changes 69.6$ 5.2 75.3$ 5.3 120.0$ 8.2 Valuation-related changes MSR fair value (4) 237.2 118.9 398.9 Hedging derivatives gains (losses) (164.7) (155.1) (423.7) Provision for losses on active loans (5) 3.2 7.5 6.0 Servicing segment pretax income 145.3$ 46.5$ 101.2$ Average servicing portfolio UPB 532,861$ 570,619$ 582,262$ 3Q233Q22 2Q23
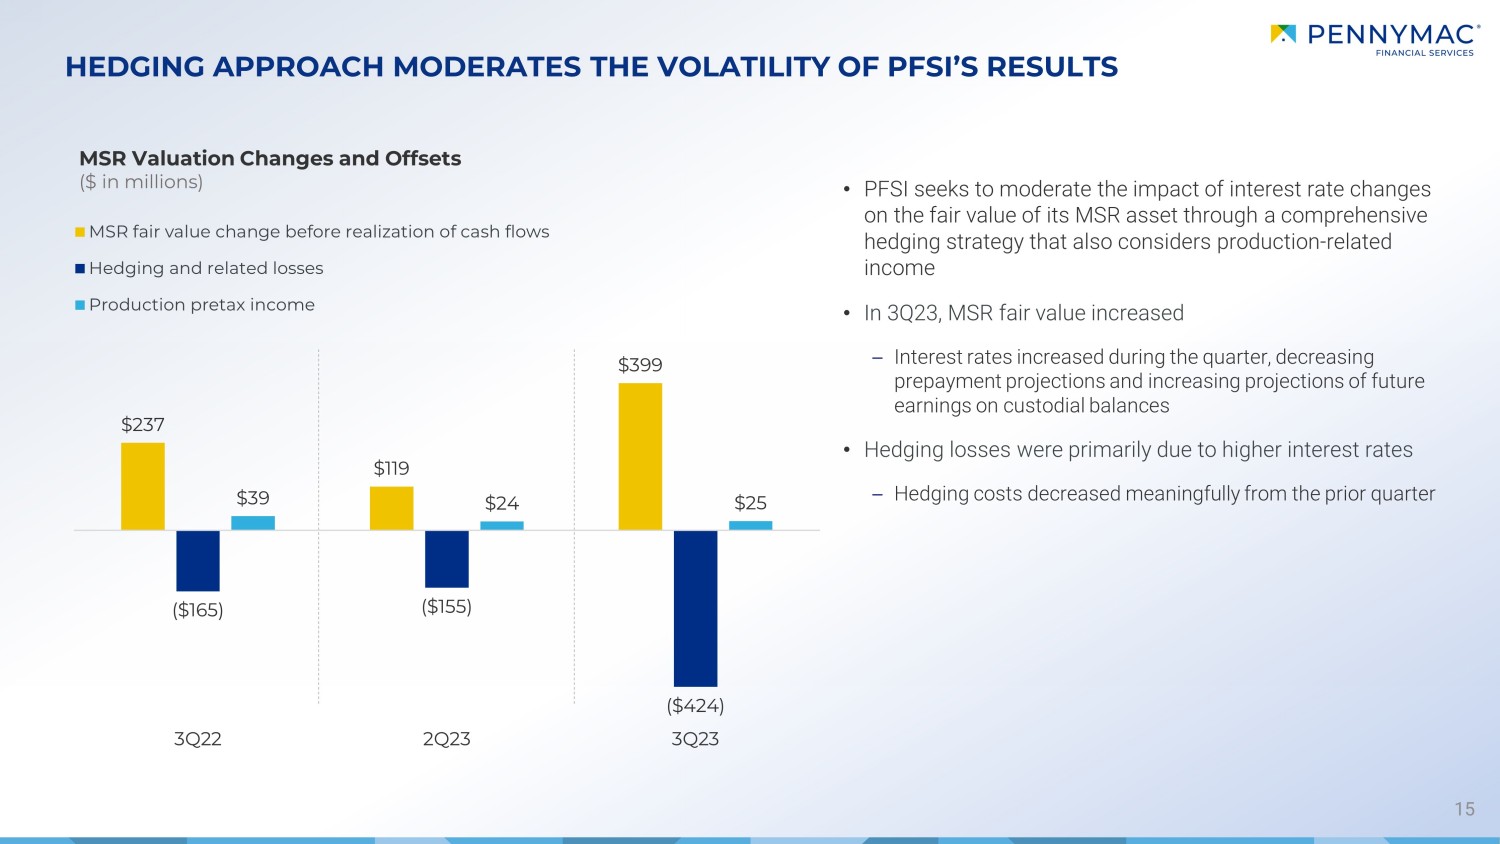
15 HEDGING APPROACH MODERATES THE VOLATILITY OF PFSI’S RESULTS MSR Valuation Changes and Offsets ($ in millions) • PFSI seeks to moderate the impact of interest rate changes on the fair value of its MSR asset through a comprehensive hedging strategy that also considers production - related income • In 3Q23, MSR fair value increased – Interest rates increased during the quarter, decreasing prepayment projections and increasing projections of future earnings on custodial balances • Hedging losses were primarily due to higher interest rates – Hedging costs decreased meaningfully from the prior quarter $237 $119 $399 ($165) ($155) ($424) $39 $24 $25 3Q22 2Q23 3Q23 MSR fair value change before realization of cash flows Hedging and related losses Production pretax income
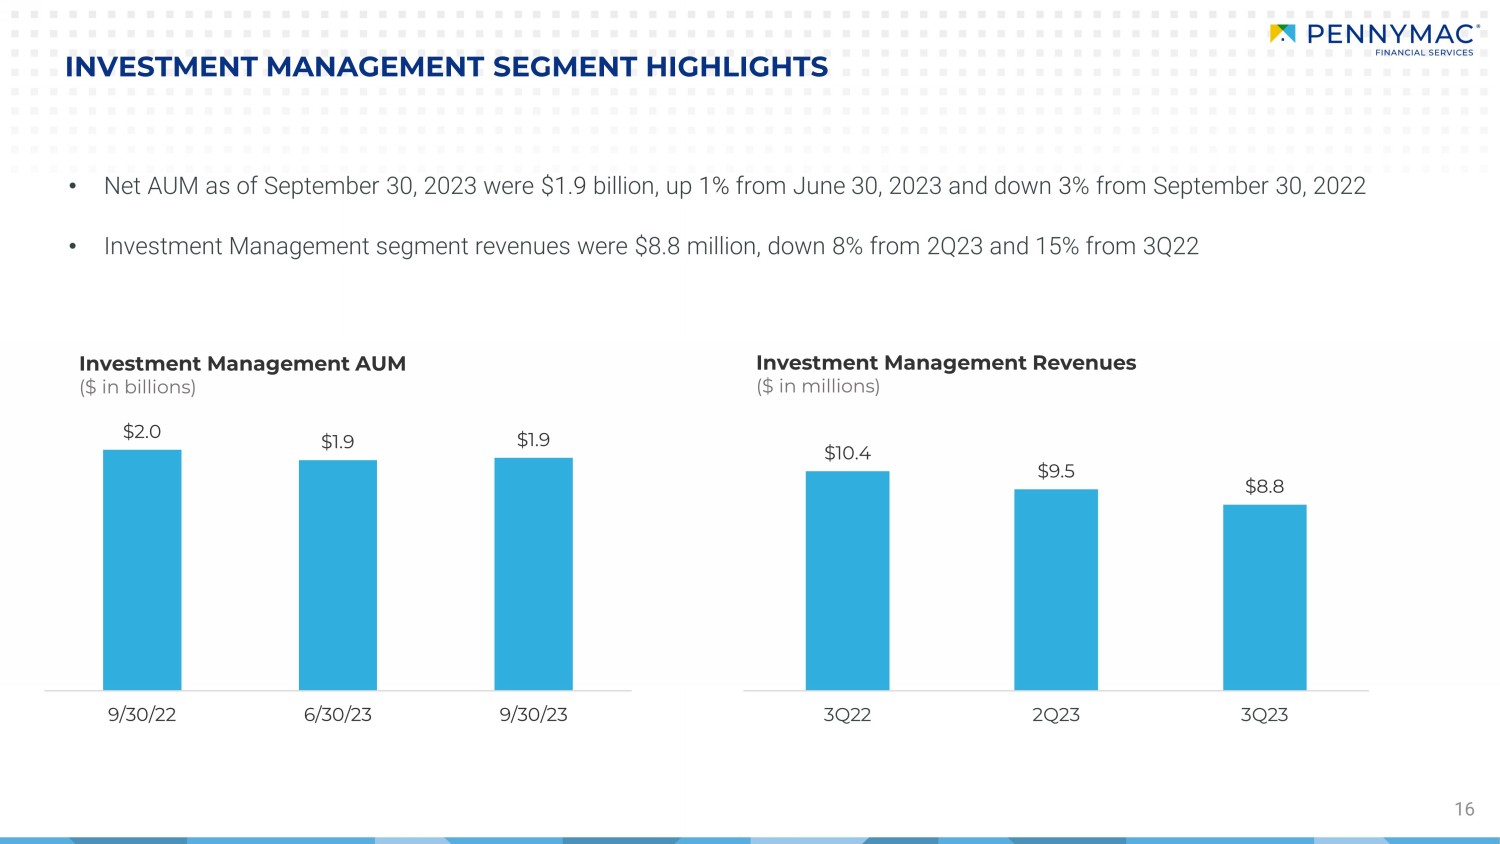
INVESTMENT MANAGEMENT SEGMENT HIGHLIGHTS 16 • Net AUM as of September 30, 2023 were $ 1.9 billion, up 1% from June 30, 2023 and down 3 % from September 30, 2022 • Investment Management segment revenues were $8.8 million, down 8% from 2Q23 and 15% from 3Q22 Investment Management AUM ($ in billions) Investment Management Revenues ($ in millions) $10.4 $9.5 $8.8 3Q22 2Q23 3Q23 $2.0 $1.9 $1.9 9/30/22 6/30/23 9/30/23

APPENDIX
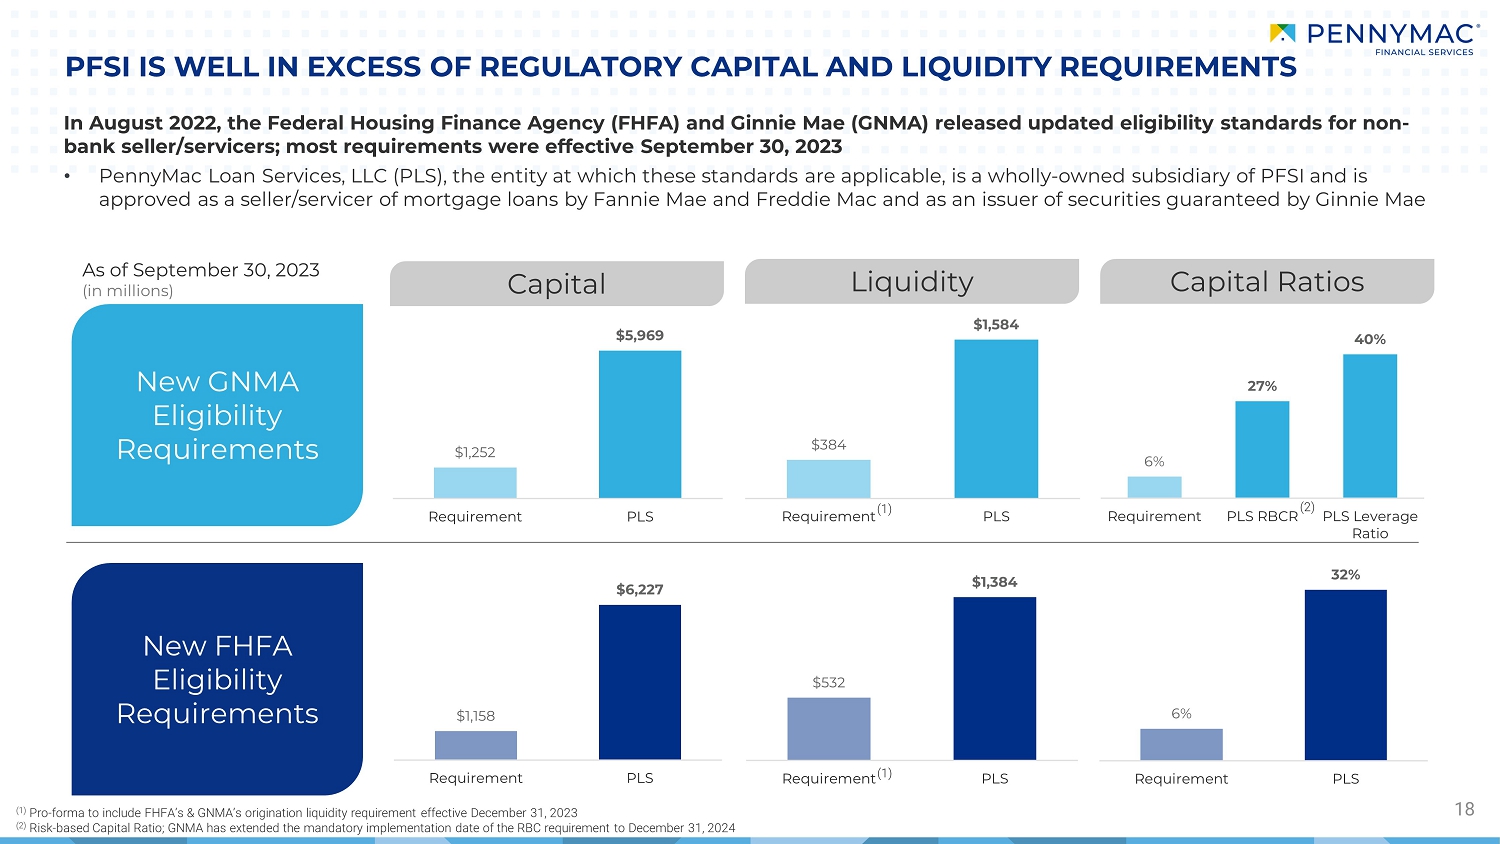
6% 27% 40% Requirement PLS RBCR PLS Leverage Ratio In August 2022, the Federal Housing Finance Agency (FHFA) and Ginnie Mae (GNMA) released updated eligibility standards for non bank seller/servicers; most requirements were effective September 30, 2023 o PennyMac Loan Services, LLC (PLS), the entity at which these standards are applicable, is a wholly owned subsidiary of PFSI and is approved as a seller/servicer of mortgage loans by Fannie Mae and Freddie Mac and as an issuer of securities guaranteed by Gi nni e Mae PFSI IS WELL IN EXCESS OF REGULATORY CAPITAL AND LIQUIDITY REQUIREMENTS 18 New GNMA Eligibility Requirements New FHFA Eligibility Requirements Capital Liquidity Capital Ratios (1) Pro forma to include FHFA's GNMA's origination liquidity requirement effective December 31, 2023 (2) Risk based Capital Ratio; GNMA has extended the mandatory implementation date of the RBC requirement to December 31, 2024 As of September 30, 2023 (in millions) (2) $1,158 $6,227 Requirement PLS 6% 32% Requirement PLS $1,252 $5,969 Requirement PLS $532 $1,384 Requirement PLS (1) (1) $384 $1,584 Requirement PLS
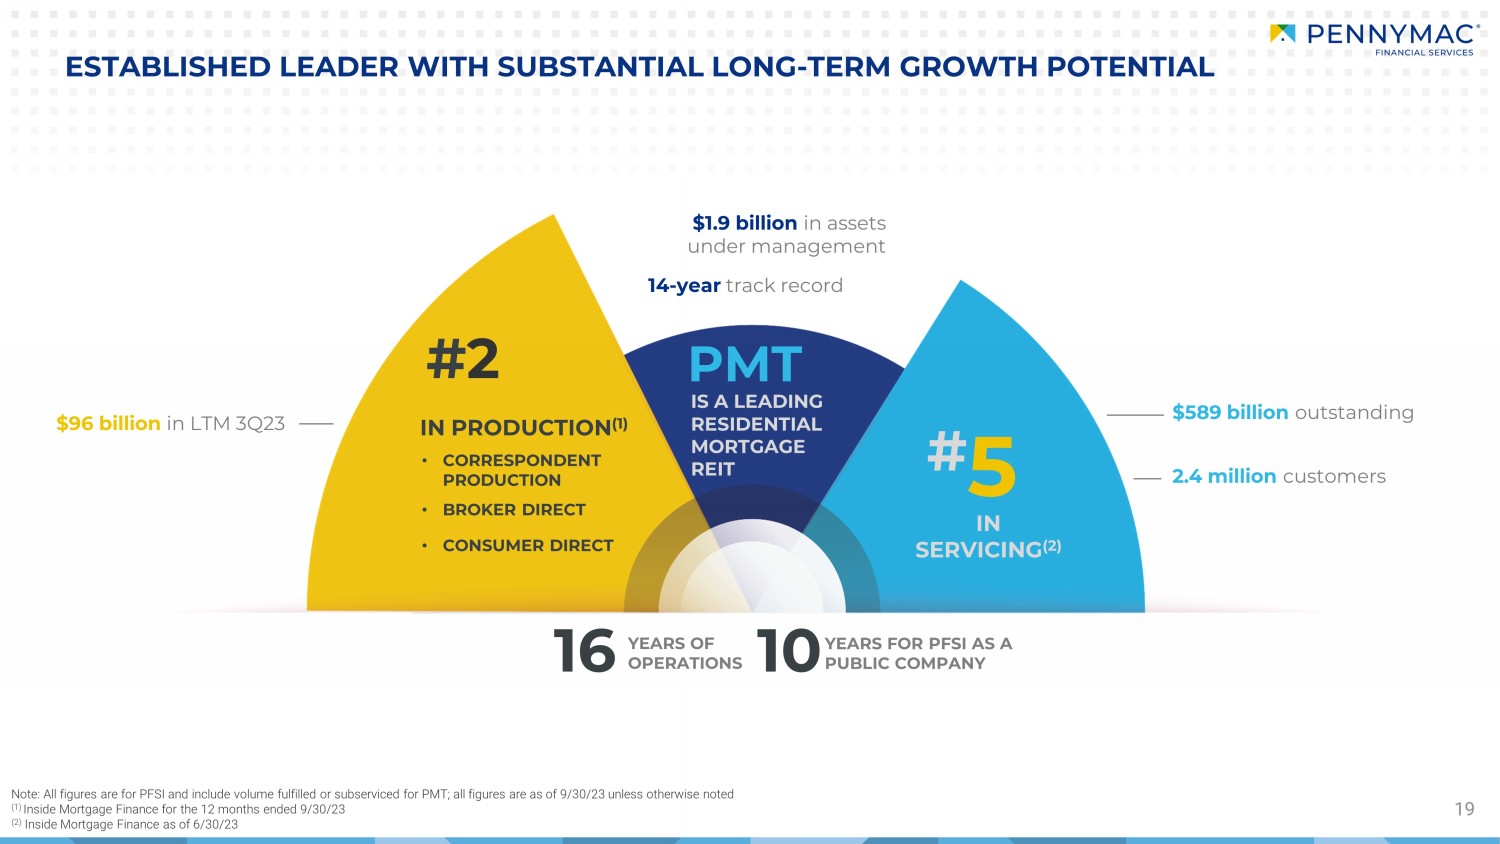
19 ESTABLISHED LEADER WITH SUBSTANTIAL LONG - TERM GROWTH POTENTIAL $589 billion outstanding IN SER VIC ING (2) YEARS FOR PFSI AS A PUBLIC COMPANY 16 YEARS OF OPERATIONS PMT # 2 • CORRESPONDENT PRODUCTION • BROKER DIRECT • CONSUMER DIRECT IN PRODUCTION (1) IS A LEADING RESIDENTIAL MORTGAGE REIT # 5 Note: All figures are for PFSI and include volume fulfilled or subserviced for PMT; all figures are as of 9/30/23 unless othe rwi se noted (1) Inside Mortgage Finance for the 12 months ended 9/30/23 (2) Inside Mortgage Finance as of 6/30/23 $1.9 billion in assets under management 14 - year track record 2.4 million customers $96 billion in LTM 3Q23 10
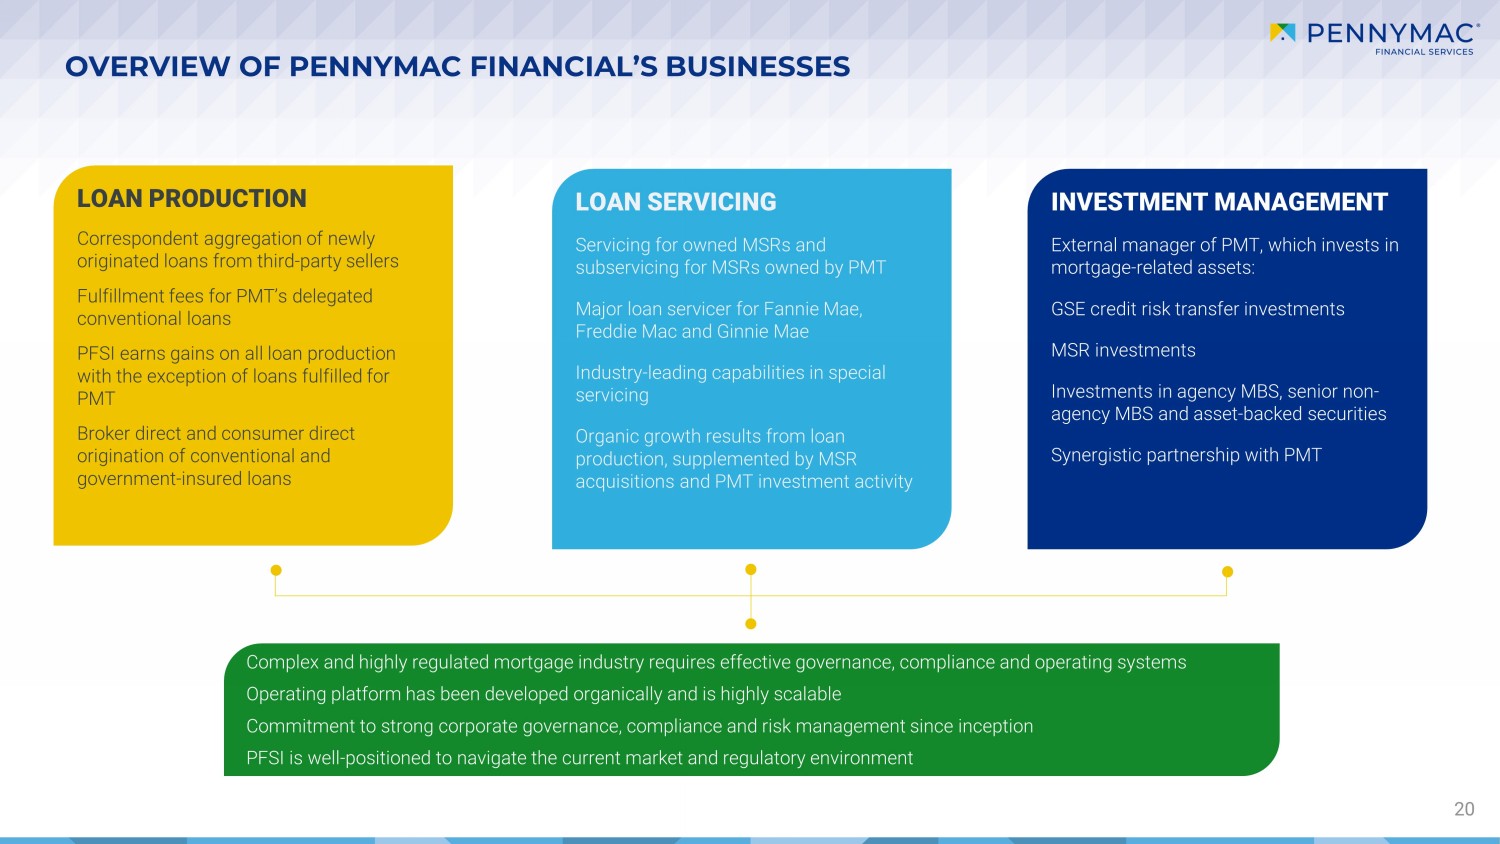
OVERVIEW OF PENNYMAC FINANCIAL’S BUSINESSES 20 LOAN PRODUCTION Correspondent aggregation of newly originated loans from third - party sellers Fulfillment fees for PMT’s delegated conventional loans PFSI earns gains on all loan production with the exception of loans fulfilled for PMT Broker direct and consumer direct origination of conventional and government - insured loans LOAN SERVICING Servicing for owned MSRs and subservicing for MSRs owned by PMT Major loan servicer for Fannie Mae, Freddie Mac and Ginnie Mae Industry - leading capabilities in special servicing Organic growth results from loan production, supplemented by MSR acquisitions and PMT investment activity INVESTMENT MANAGEMENT External manager of PMT, which invests in mortgage - related assets: GSE credit risk transfer investments MSR investments Investments in agency MBS, senior non - agency MBS and asset - backed securities Synergistic partnership with PMT Complex and highly regulated mortgage industry requires effective governance, compliance and operating systems Operating platform has been developed organically and is highly scalable Commitment to strong corporate governance, compliance and risk management since inception PFSI is well - positioned to navigate the current market and regulatory environment
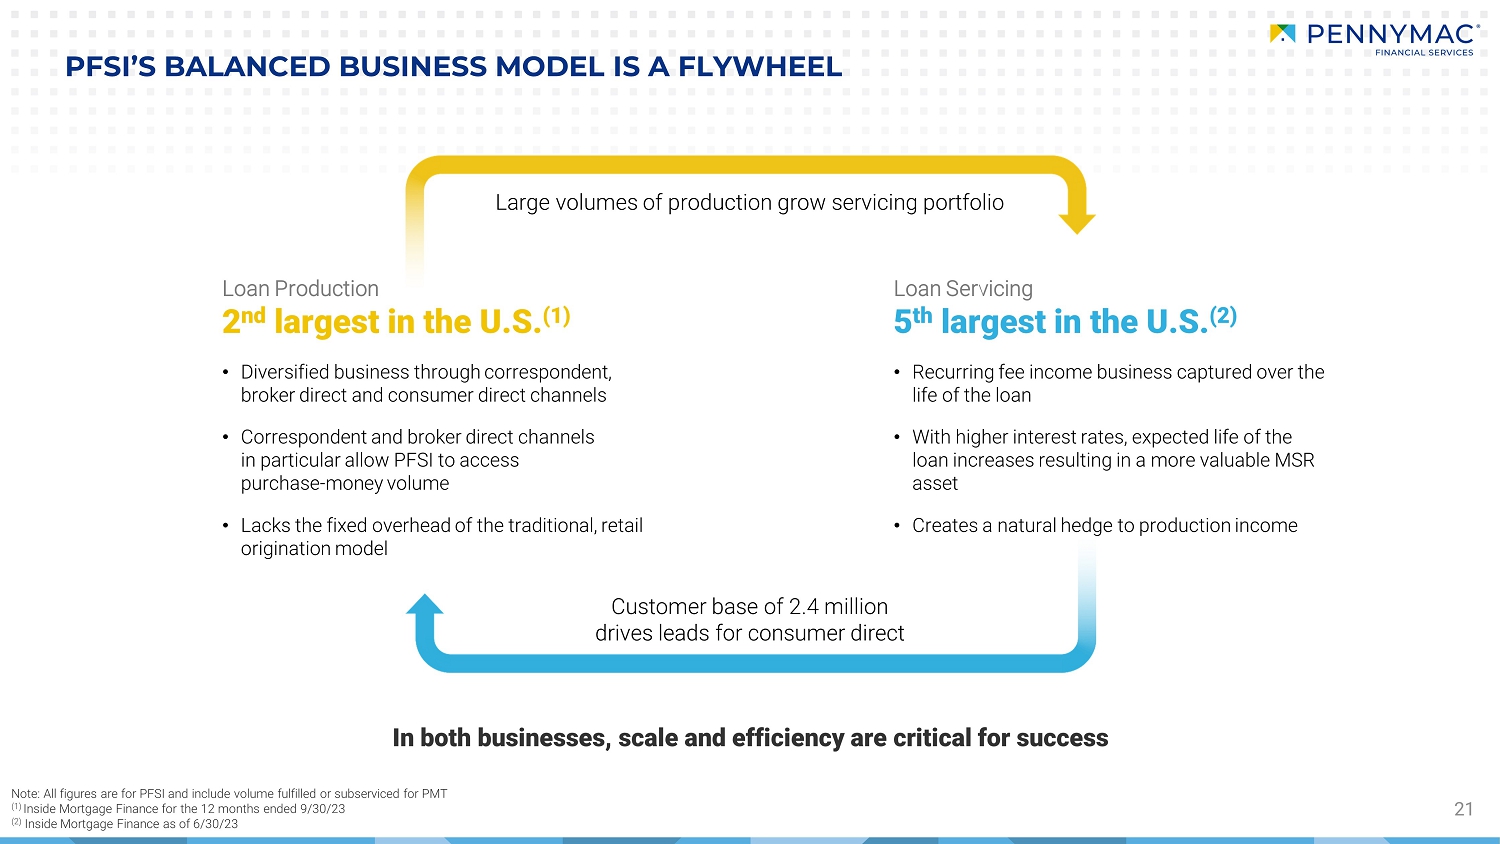
21 PFSI'S BALANCED BUSINESS MODEL IS A FLYWHEEL o Diversified business through correspondent, broker direct and consumer direct channels o Correspondent and broker direct channels in particular allow PFSI to access purchase money volume o Lacks the fixed overhead of the traditional, retail origination model o Recurring fee income business captured over the life of the loan o With higher interest rates, expected life of the loan increases resulting in a more valuable MSR asset o Creates a natural hedge to production income Customer base of 2.4 million drives leads for consumer direct Large volumes of production grow servicing portfolio Loan Production 2 nd largest in the U.S. S.( Loan Servicing 5 th largest in the U.S. S.( In both businesses, scale and efficiency are critical for success Note: All figures are for PFSI and include volume fulfilled or subserviced for PMT (1) Inside Mortgage Finance for the 12 months ended 9/30/23 (2) Inside Mortgage Finance as of 6/30/23
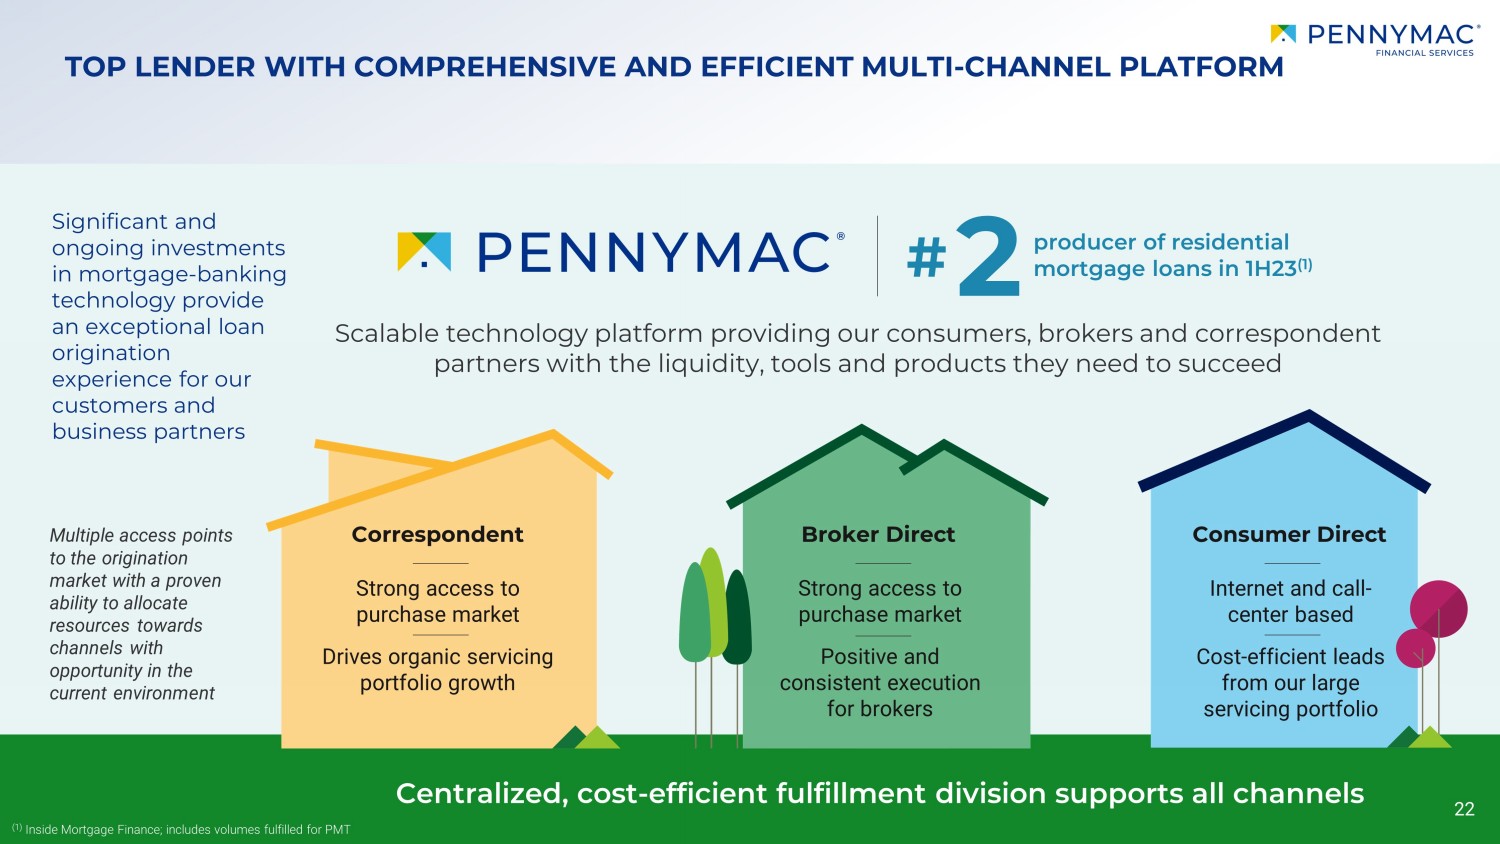
TOP LENDER WITH COMPREHENSIVE AND EFFICIENT MULTI - CHANNEL PLATFORM 22 Centralized, cost - efficient fulfillment division supports all channels Multiple access points to the origination market with a proven ability to allocate resources towards channels with opportunity in the current environment Significant and ongoing investments in mortgage - banking technology provide an exceptional loan o rigination experience for our customers and business partners Scalable technology platform providing our consumers , brokers and correspondent partners with the liquidity, tools and products they need to succeed 2 producer of residential mortgage loans in 1H23 (1) (1) Inside Mortgage Finance; includes volumes fulfilled for PMT # Strong access to purchase market Drives organic servicing portfolio growth Strong access to purchase market Positive and consistent execution for brokers Internet and call - center based Cost - efficient leads from our large servicing portfolio Correspondent Broker Direct Consumer Direct 22
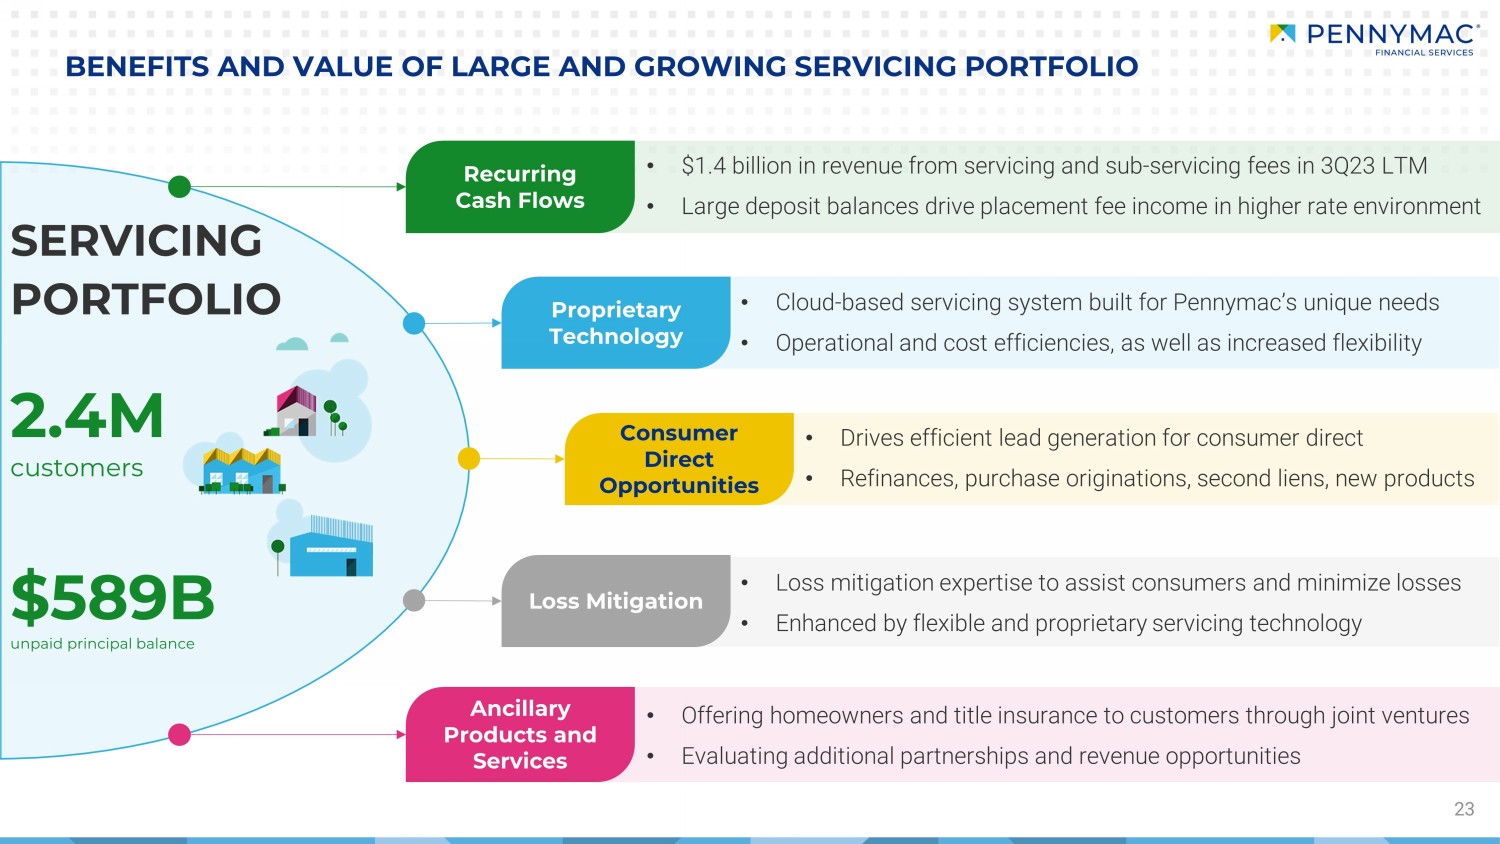
• Offering homeowners and title insurance to customers through joint ventures • Evaluating additional partnerships and revenue opportunities 23 • $ 1.4 b illion in revenue from servicing and sub - servicing fees in 3Q23 LTM • Large deposit balances drive placement fee income in higher rate environment • Cloud - based servicing system built for Pennymac’s unique needs • Operational and cost efficiencies, as well as increased flexibility • Drives efficient lead generation for consumer direct • Refinances, purchase originations, second liens, new products • Loss mitigation expertise to assist consumers and minimize losses • Enhanced by flexible and proprietary servicing technology BENEFITS AND VALUE OF LARGE AND GROWING SERVICING PORTFOLIO SERVICING PORTFOLIO Recurring Cash Flows Proprietary Technology Consumer Direct Opportunities Loss Mitigation Ancillary Products and Services 2.4M customers $589B unpaid principal balance
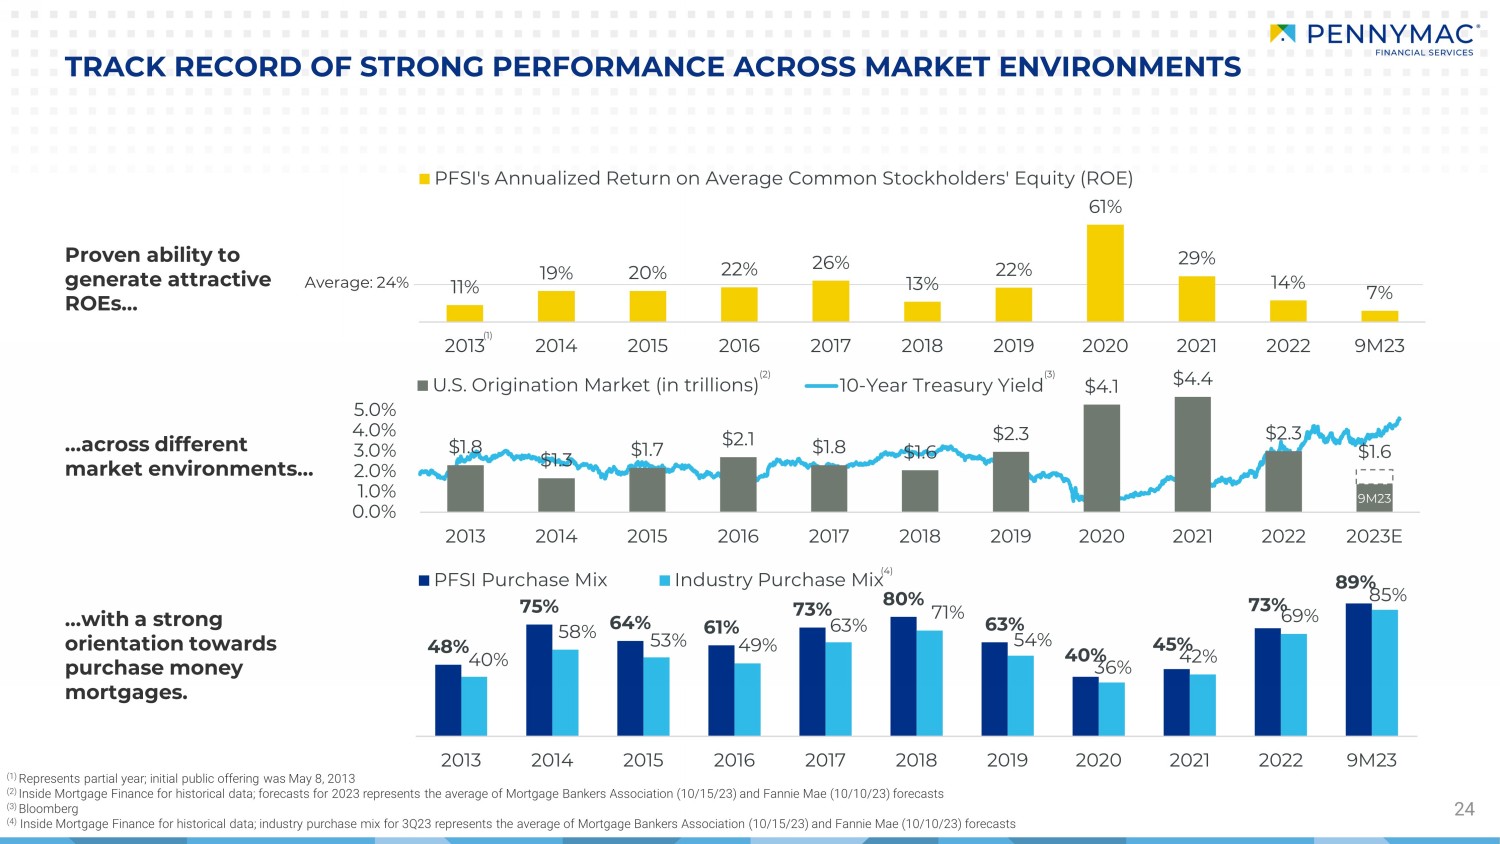
0.0% 1.0% 2.0% 3.0% 4.0% 5.0% 10-Year Treasury Yield 9M23 $1.8 $1.3 $1.7 $2.1 $1.8 $1.6 $2.3 $4.1 $4.4 $2.3 $1.6 2013 2014 2015 2016 2017 2018 2019 2020 2021 2022 2023E U.S. Origination Market (in trillions) 48% 75% 64% 61% 73% 80% 63% 40% 45% 73% 89% 40% 58% 53% 49% 63% 71% 54% 36% 42% 69% 85% 2013 2014 2015 2016 2017 2018 2019 2020 2021 2022 9M23 PFSI Purchase Mix Industry Purchase Mix Proven ability to generate attractive ROEs… 24 TRACK RECORD OF STRONG PERFORMANCE ACROSS MARKET ENVIRONMENTS …across different market environments… …with a strong orientation towards purchase money mortgages. (1) Represents partial year ; in itial public o ffering was May 8, 2013 (2) Inside Mortgage Finance for historical data; forecasts for 2023 represents the average of Mortgage Bankers Association (10/15/23) and Fannie Mae (10/10/23) forecasts (3) Bloomberg (4) Inside Mortgage Finance for historical data; industry purchase mix for 3 Q23 represents the average of Mortgage Bankers Association (10/15/23) and Fannie Mae (10/10/23) forecasts (1) (2) (3) (4) Average: 24% 11% 19% 20% 22% 26% 13% 22% 61% 29% 14% 7% 2013 2014 2015 2016 2017 2018 2019 2020 2021 2022 9M23 PFSI's Annualized Return on Average Common Stockholders' Equity (ROE)
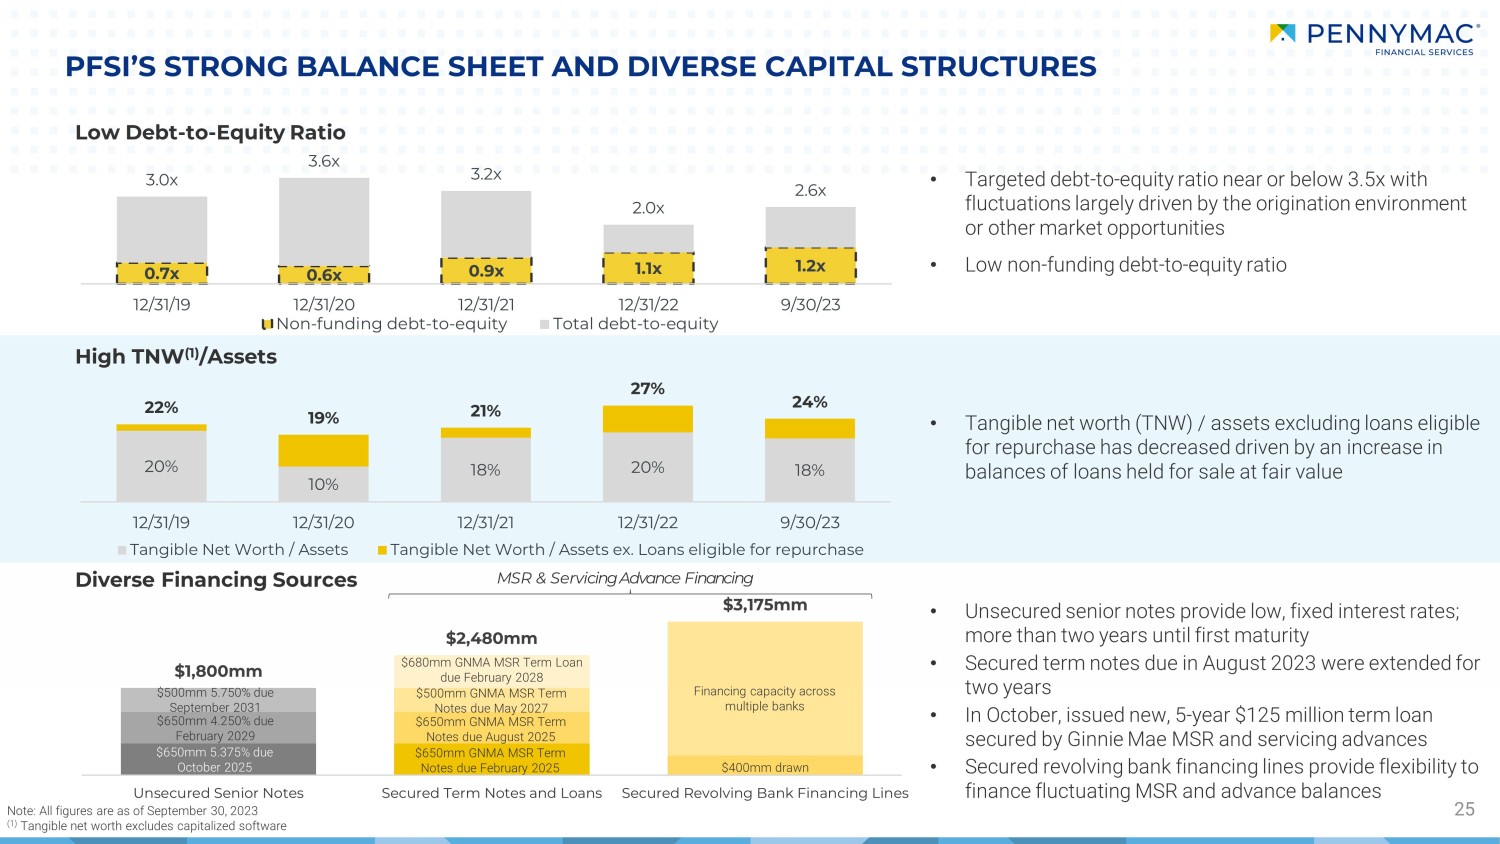
$1,800mm $2,480mm $3,175mm Unsecured Senior Notes Secured Term Notes and Loans Secured Revolving Bank Financing Lines 20% 10% 18% 20% 18% 22% 19% 21% 27% 24% 12/31/19 12/31/20 12/31/21 12/31/22 9/30/23 Tangible Net Worth / Assets Tangible Net Worth / Assets ex. Loans eligible for repurchase PFSI’S STRONG BALANCE SHEET AND DIVERSE CAPITAL STRUCTURES 25 Low Debt - to - Equity Ratio Diverse Financing Sources High TNW (1) /Assets • Tangible net worth (TNW) / assets excluding loans eligible for repurchase has de creased driven by an increase in balances of loans held for sale at fair value $650mm 5.375% due October 2025 • Targeted debt - to - equity ratio near or below 3.5x with fluctuations largely driven by the origination environment or other market opportunities • Low non - funding debt - to - equity ratio • U nsecured senior notes provide low, fixed interest rates; more than two years until first maturity • Secured term notes due in August 2023 were extended for two years • In October, issued new, 5 - year $125 million term loan secured by Ginnie Mae MSR and servicing advances • Secured revolving bank financing lines provide flexibility to finance fluctuating MSR and advance balances MSR & Servicing Advance Financing Note: All figures are as of September 30, 2023 (1) Tangible net worth excludes capitalized software $500mm 5.750% due September 2031 $650mm 4.250% due February 2029 $500mm GNMA MSR Term Notes due May 2027 $650mm GNMA MSR Term Notes due February 2025 $650mm GNMA MSR Term Notes due August 2025 $ 680 mm GNMA MSR Term Loan due February 2028 Financing capacity across multiple banks $ 400 mm drawn 0.7x 0.6x 0.9x 1.1x 1.2x 3.0x 3.6x 3.2x 2.0x 2.6x 12/31/19 12/31/20 12/31/21 12/31/22 9/30/23 Non-funding debt-to-equity Total debt-to-equity
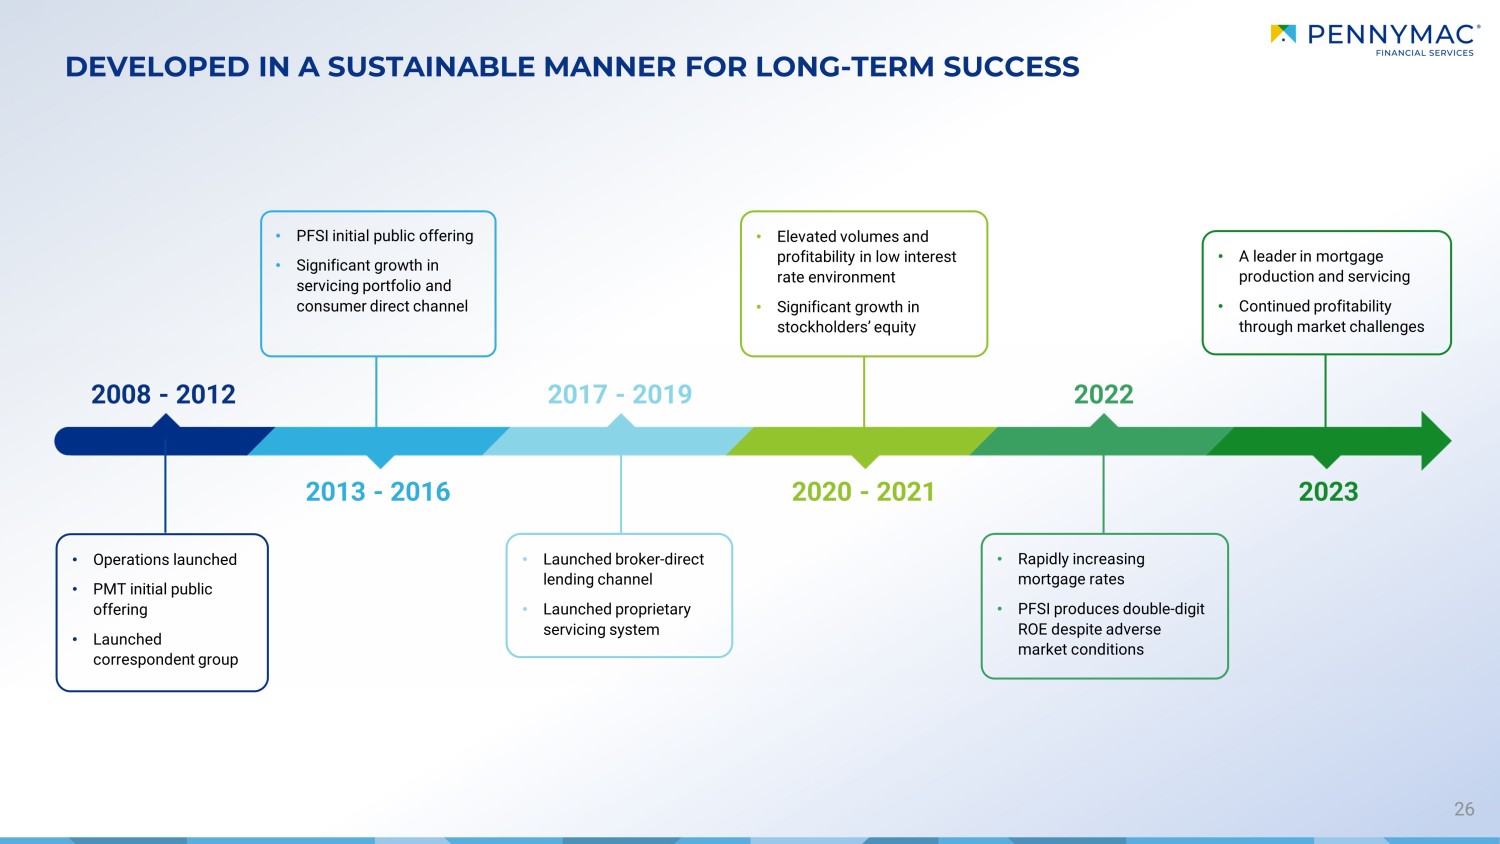
DEVELOPED IN A SUSTAINABLE MANNER FOR LONG - TERM SUCCESS 26 • Operations launched • PMT initial public offering • Launched correspondent group • PFSI initial public offering • Significant growth in servicing portfolio and consumer direct channel • Launched broker - direct lending channel • Launched proprietary servicing system • Elevated volumes and profitability in low interest rate environment • Significant growth in stockholders’ equity • A leader in mortgage production and servicing • Continued profitability through market challenges • Rapidly increasing mortgage rates • PFSI produces double - digit ROE despite adverse market conditions 2008 - 2012 2013 - 2016 2017 - 2019 2020 - 2021 2022 2023
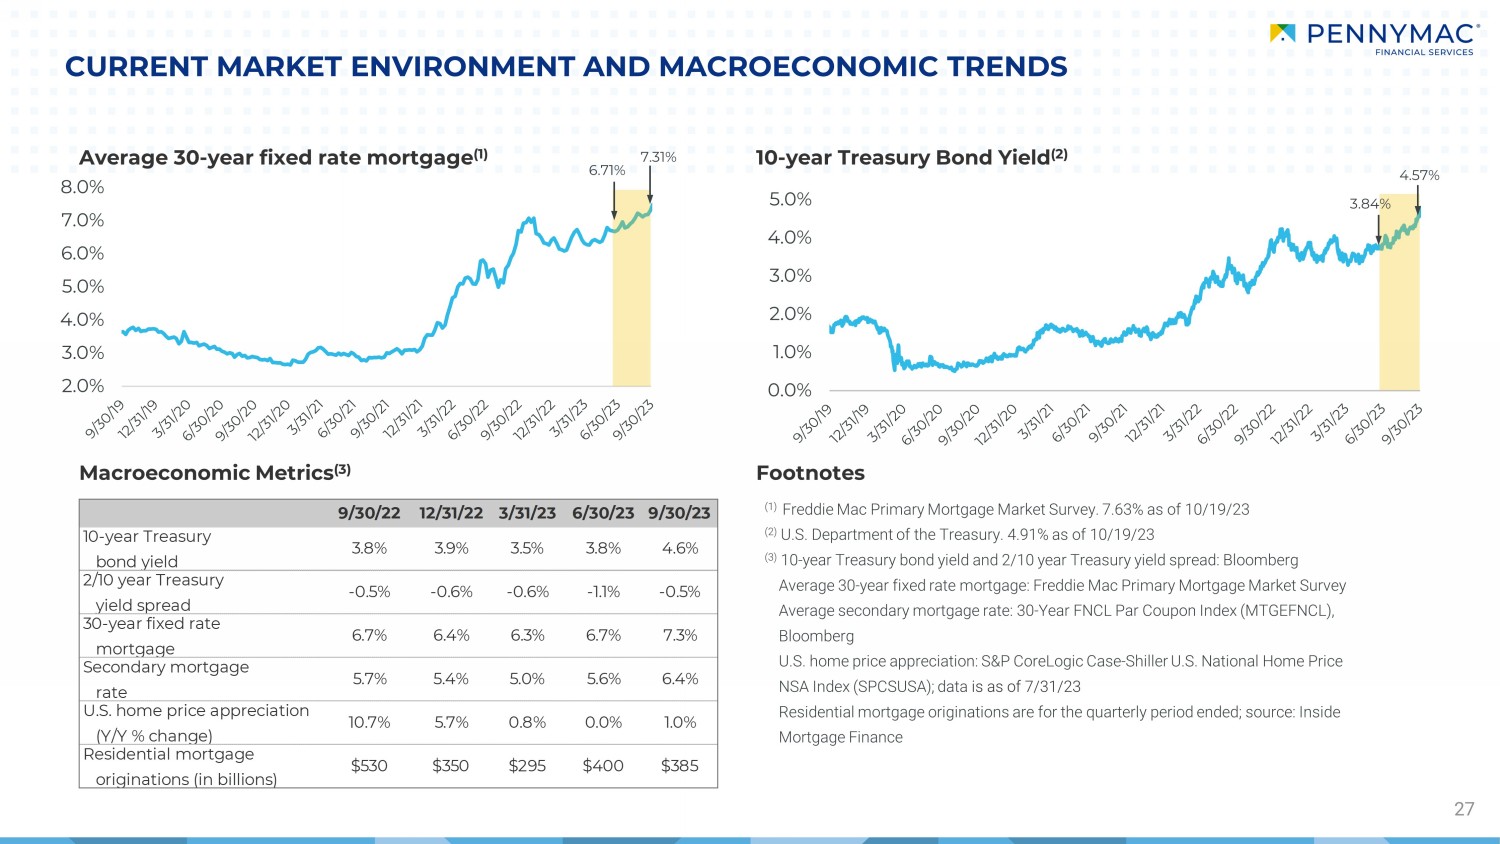
2.0% 3.0% 4.0% 5.0% 6.0% 7.0% 8.0% 0.0% 1.0% 2.0% 3.0% 4.0% 5.0% Average 30 - year fixed rate mortgage (1) 6.71% 3.84% CURRENT MARKET ENVIRONMENT AND MACROECONOMIC TRENDS 27 Macroeconomic Metrics (3) Footnotes (1) Freddie Mac Primary Mortgage Market Survey. 7.63% as of 10/19/23 (2) U.S. Department of the Treasury. 4.91% as of 10/19/23 (3) 10 - year Treasury bond yield and 2/10 year Treasury yield spread: Bloomberg Average 30 - year fixed rate mortgage: Freddie Mac Primary Mortgage Market Survey Average secondary mortgage rate: 30 - Year FNCL Par Coupon Index (MTGEFNCL), Bloomberg U.S. home price appreciation: S&P CoreLogic Case - Shiller U.S. National Home Price NSA Index (SPCSUSA); data is as of 7/31/23 Residential mortgage originations are for the quarterly period ended; source: Inside Mortgage Finance 10 - year Treasury Bond Yield (2) 4.57% 7.31% 9/30/22 12/31/22 3/31/23 6/30/23 9/30/23 10-year Treasury bond yield 3.8% 3.9% 3.5% 3.8% 4.6% 2/10 year Treasury yield spread -0.5% -0.6% -0.6% -1.1% -0.5% 30-year fixed rate mortgage 6.7% 6.4% 6.3% 6.7% 7.3% Secondary mortgage rate 5.7% 5.4% 5.0% 5.6% 6.4% U.S. home price appreciation (Y/Y % change) 10.7% 5.7% 0.8% 0.0% 1.0% Residential mortgage originations (in billions) $530 $350 $295 $400 $385
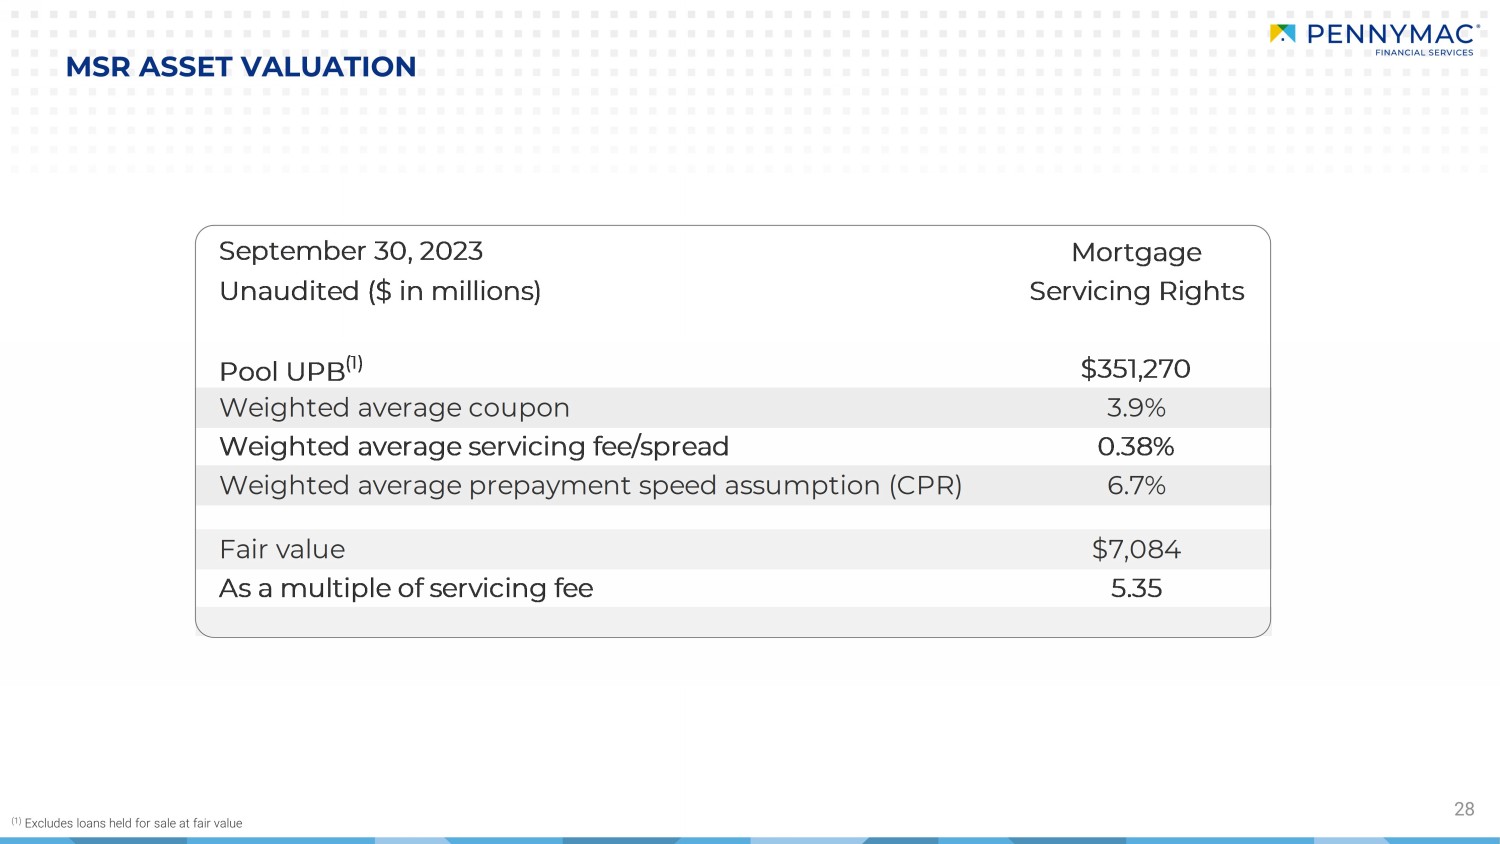
28 MSR ASSET VALUATION (1) Excludes loans held for sale at fair value Mortgage Servicing Rights Pool UPB (1) $351,270 Weighted average coupon 3.9% Weighted average servicing fee/spread 0.38% Weighted average prepayment speed assumption (CPR) 6.7% Fair value $7,084 As a multiple of servicing fee 5.35 September 30, 2023 Unaudited ($ in millions)
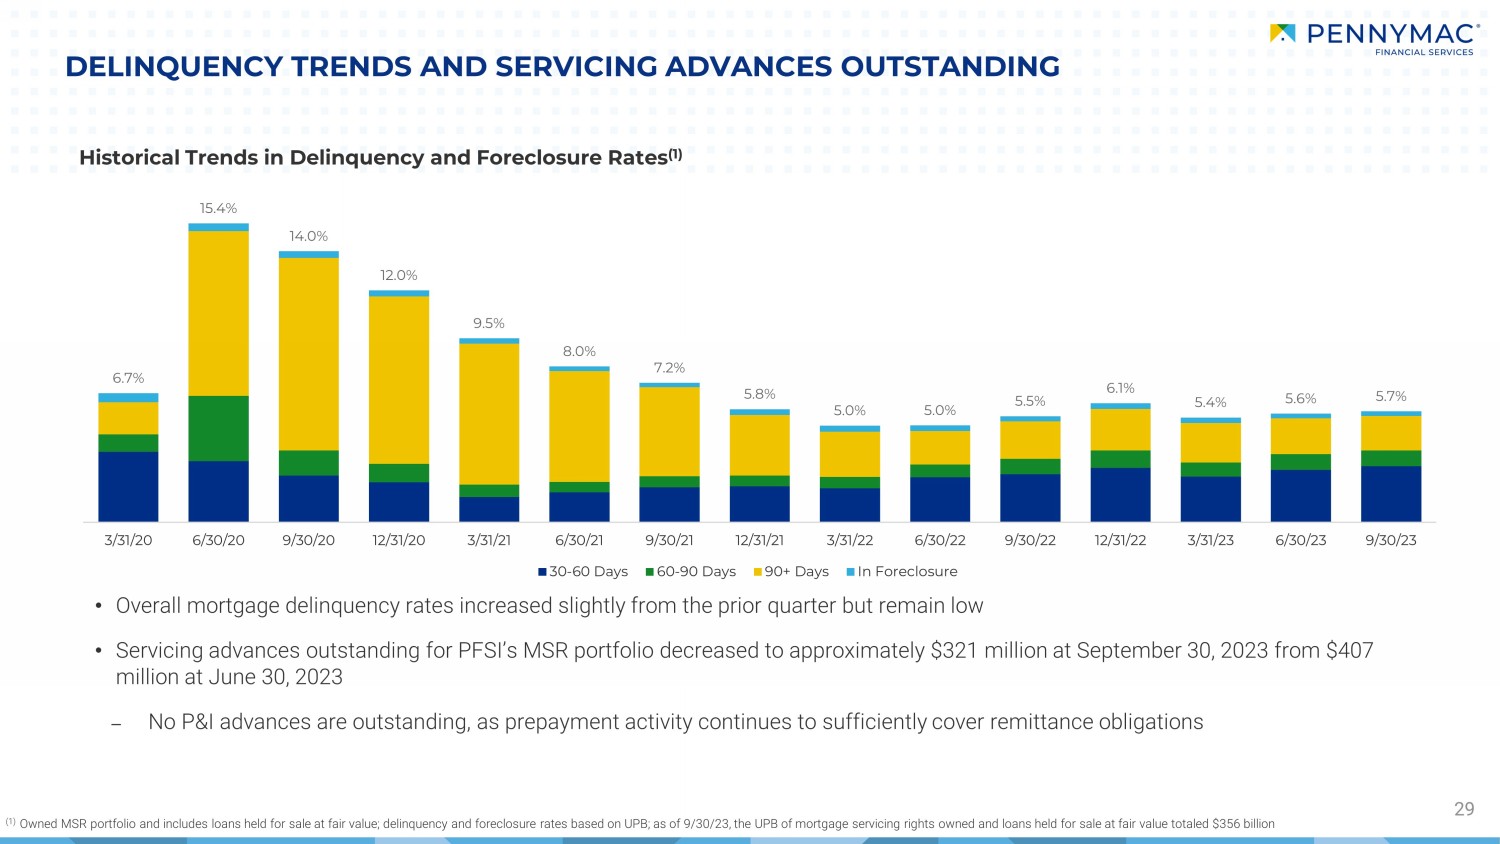
• Overall mortgage delinquency rates increased slightly from the prior quarter but remain low • Servicing advances outstanding for PFSI’s MSR portfolio decreased to approximately $321 million at September 30, 2023 from $4 07 million at June 30, 2023 – No P&I advances are outstanding, as prepayment activity continues to sufficiently cover remittance obligations DELINQUENCY TRENDS AND SERVICING ADVANCES OUTSTANDING 29 Historical Trends in Delinquency and Foreclosure Rates (1) (1) Owned MSR portfolio and includes loans held for sale at fair value; delinquency and foreclosure rates based on UPB; as of 9/3 0/2 3, the UPB of mortgage servicing rights owned and loans held for sale at fair value totaled $356 billion 6.7% 15.4% 14.0% 12.0% 9.5% 8.0% 7.2% 5.8% 5.0% 5.0% 5.5% 6.1% 5.4% 5.6% 5.7% 3/31/20 6/30/20 9/30/20 12/31/20 3/31/21 6/30/21 9/30/21 12/31/21 3/31/22 6/30/22 9/30/22 12/31/22 3/31/23 6/30/23 9/30/23 30-60 Days 60-90 Days 90+ Days In Foreclosure
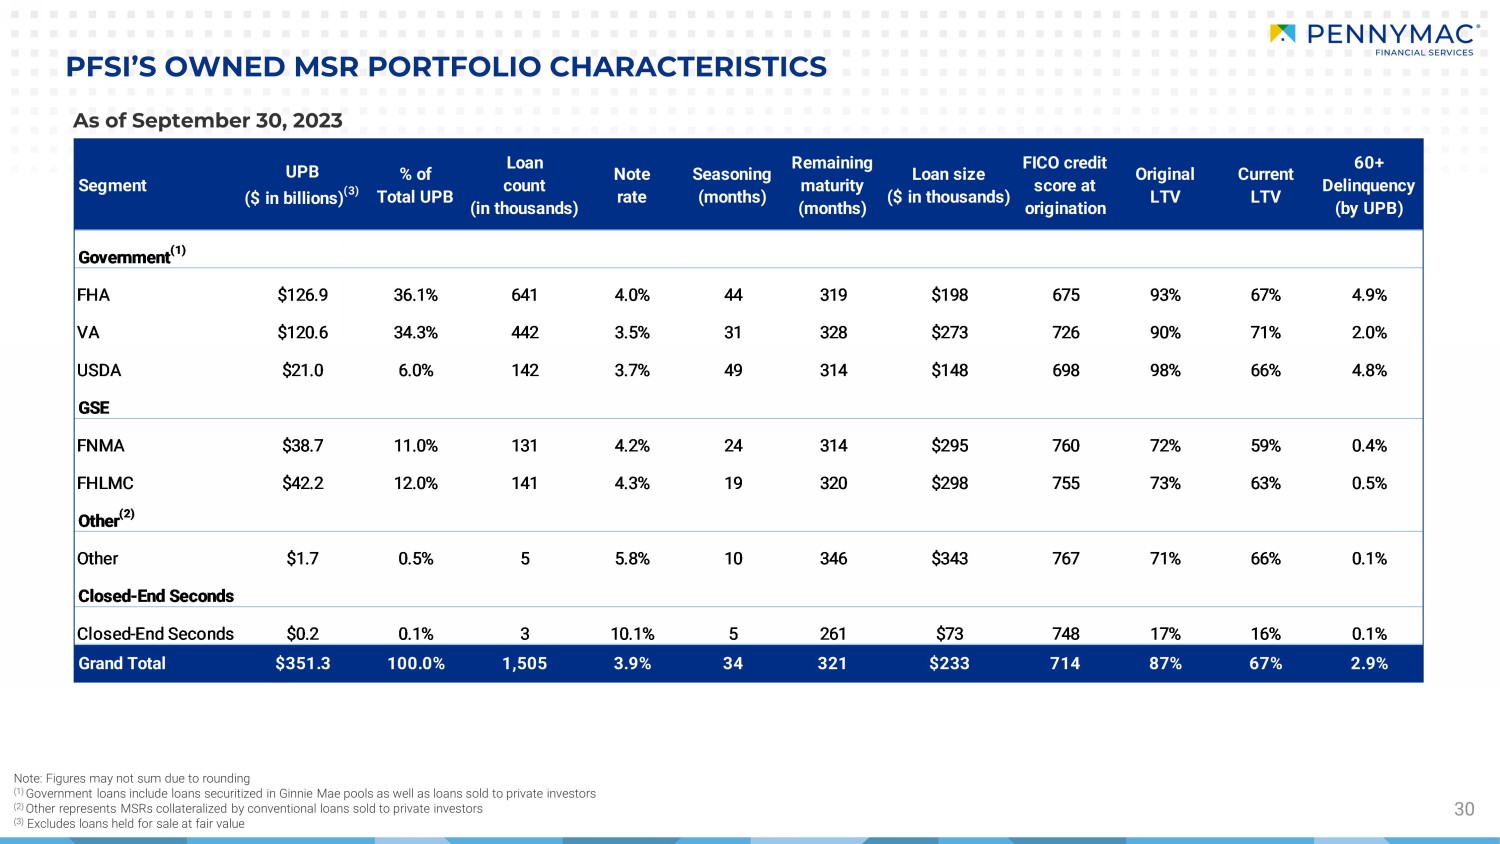
30 PFSI’S OWNED MSR PORTFOLIO CHARACTERISTICS Note: Figures may not sum due to rounding (1) Government loans include loans securitized in Ginnie Mae pools as well as loans sold to private investors (2) Other represents MSRs collateralized by conventional loans sold to private investors (3) Excludes loans held for sale at fair value As of September 30, 2023 Segment UPB ($ in billions) (3) % of Total UPB Loan count (in thousands) Note rate Seasoning (months) Remaining maturity (months) Loan size ($ in thousands) FICO credit score at origination Original LTV Current LTV 60+ Delinquency (by UPB) Government (1) FHA $126.9 36.1% 641 4.0% 44 319 $198 675 93% 67% 4.9% VA $120.6 34.3% 442 3.5% 31 328 $273 726 90% 71% 2.0% USDA $21.0 6.0% 142 3.7% 49 314 $148 698 98% 66% 4.8% GSE FNMA $38.7 11.0% 131 4.2% 24 314 $295 760 72% 59% 0.4% FHLMC $42.2 12.0% 141 4.3% 19 320 $298 755 73% 63% 0.5% Other (2) Other $1.7 0.5% 5 5.8% 10 346 $343 767 71% 66% 0.1% Closed-End Seconds Closed-End Seconds $0.2 0.1% 3 10.1% 5 261 $73 748 17% 16% 0.1% Grand Total $351.3 100.0% 1,505 3.9% 34 321 $233 714 87% 67% 2.9%
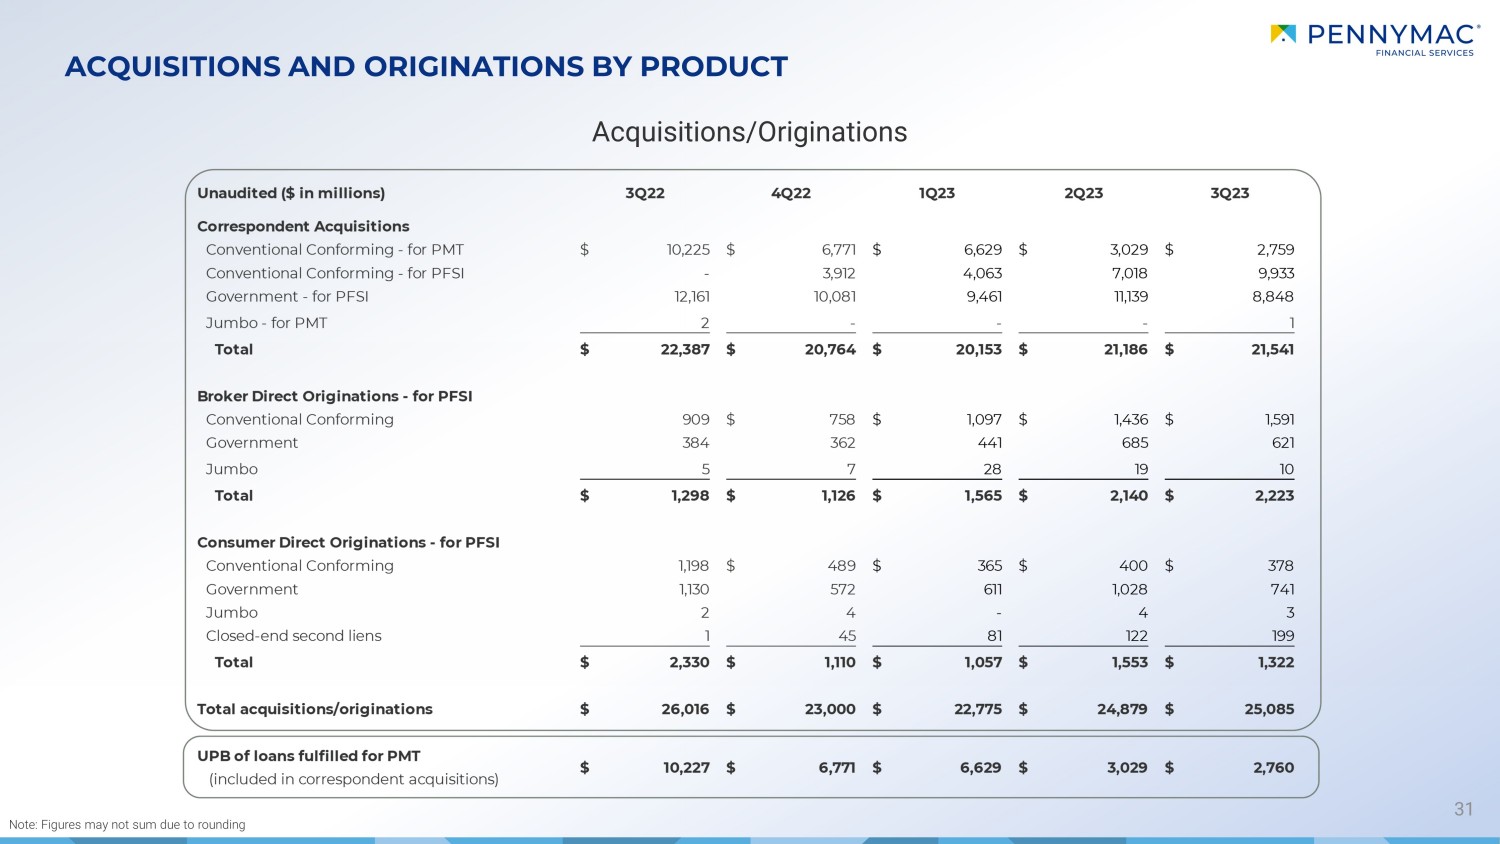
ACQUISITIONS AND ORIGINATIONS BY PRODUCT 31 Acquisitions/Originations Note: Figures may not sum due to rounding Unaudited ($ in millions) 3Q22 4Q22 1Q23 2Q23 3Q23 Correspondent Acquisitions Conventional Conforming - for PMT 10,225$ 6,771$ 6,629$ 3,029$ 2,759$ Conventional Conforming - for PFSI - 3,912 4,063 7,018 9,933 Government - for PFSI 12,161 10,081 9,461 11,139 8,848 Jumbo - for PMT 2 - - - 1 Total 22,387$ 20,764$ 20,153$ 21,186$ 21,541$ Broker Direct Originations - for PFSI Conventional Conforming 909 758$ 1,097$ 1,436$ 1,591$ Government 384 362 441 685 621 Jumbo 5 7 28 19 10 Total 1,298$ 1,126$ 1,565$ 2,140$ 2,223$ Consumer Direct Originations - for PFSI Conventional Conforming 1,198 489$ 365$ 400$ 378$ Government 1,130 572 611 1,028 741 Jumbo 2 4 - 4 3 Closed-end second liens 1 45 81 122 199 Total 2,330$ 1,110$ 1,057$ 1,553$ 1,322$ Total acquisitions/originations 26,016$ 23,000$ 22,775$ 24,879$ 25,085$ UPB of loans fulfilled for PMT (included in correspondent acquisitions) 10,227$ 6,771$ 6,629$ 3,029$ 2,760$
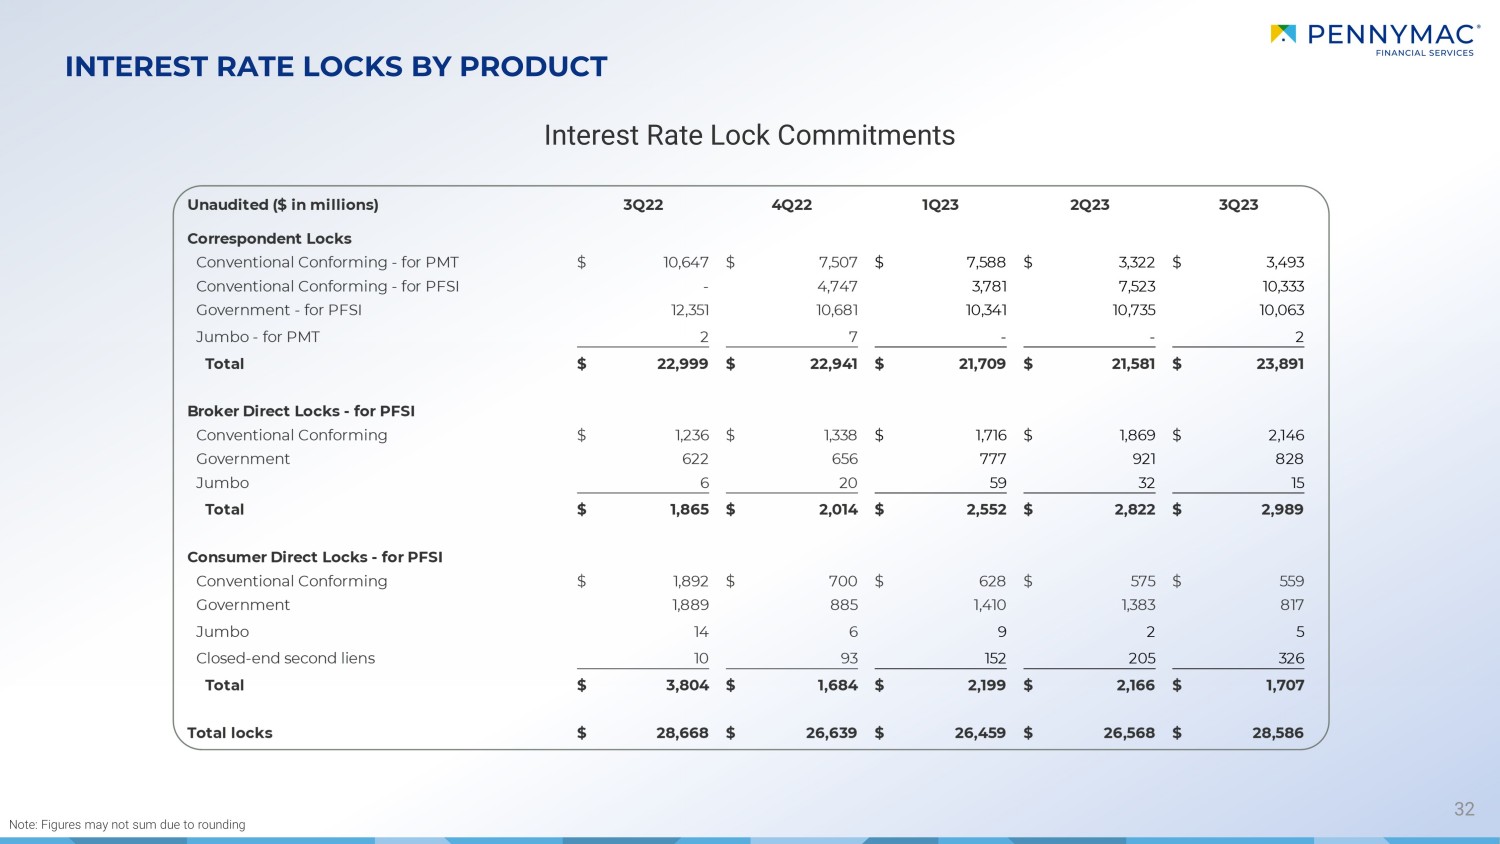
INTEREST RATE LOCKS BY PRODUCT 32 Note: Figures may not sum due to rounding Interest Rate Lock Commitments Unaudited ($ in millions) 3Q22 4Q22 1Q23 2Q23 3Q23 Correspondent Locks Conventional Conforming - for PMT 10,647$ 7,507$ 7,588$ 3,322$ 3,493$ Conventional Conforming - for PFSI - 4,747 3,781 7,523 10,333 Government - for PFSI 12,351 10,681 10,341 10,735 10,063 Jumbo - for PMT 2 7 - - 2 Total 22,999$ 22,941$ 21,709$ 21,581$ 23,891$ Broker Direct Locks - for PFSI Conventional Conforming 1,236$ 1,338$ 1,716$ 1,869$ 2,146$ Government 622 656 777 921 828 Jumbo 6 20 59 32 15 Total 1,865$ 2,014$ 2,552$ 2,822$ 2,989$ Consumer Direct Locks - for PFSI Conventional Conforming 1,892$ 700$ 628$ 575$ 559$ Government 1,889 885 1,410 1,383 817 Jumbo 14 6 9 2 5 Closed-end second liens 10 93 152 205 326 Total 3,804$ 1,684$ 2,199$ 2,166$ 1,707$ Total locks 28,668$ 26,639$ 26,459$ 26,568$ 28,586$
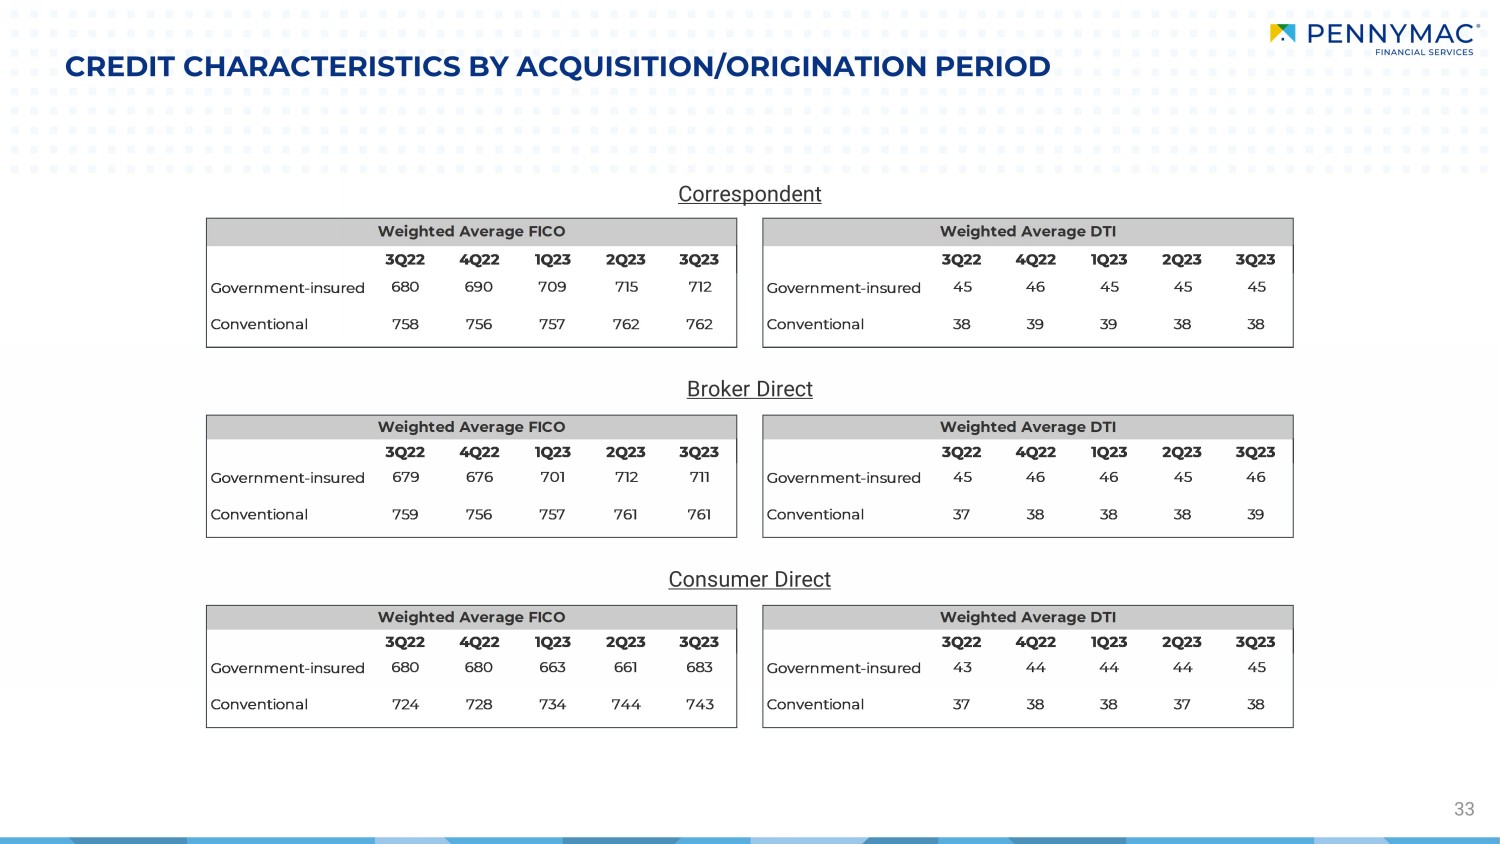
CREDIT CHARACTERISTICS BY ACQUISITION/ORIGINATION PERIOD 33 Correspondent Broker Direct Consumer Direct 3Q22 4Q22 1Q23 2Q23 3Q23 3Q22 4Q22 1Q23 2Q23 3Q23 Government-insured 680 690 709 715 712 Government-insured 45 46 45 45 45 Conventional 758 756 757 762 762 Conventional 38 39 39 38 38 3Q22 4Q22 1Q23 2Q23 3Q23 3Q22 4Q22 1Q23 2Q23 3Q23 Government-insured 679 676 701 712 711 Government-insured 45 46 46 45 46 Conventional 759 756 757 761 761 Conventional 37 38 38 38 39 3Q22 4Q22 1Q23 2Q23 3Q23 3Q22 4Q22 1Q23 2Q23 3Q23 Government-insured 680 680 663 661 683 Government-insured 43 44 44 44 45 Conventional 724 728 734 744 743 Conventional 37 38 38 37 38 Weighted Average FICO Weighted Average DTI Weighted Average FICO Weighted Average DTI Weighted Average FICO Weighted Average DTI
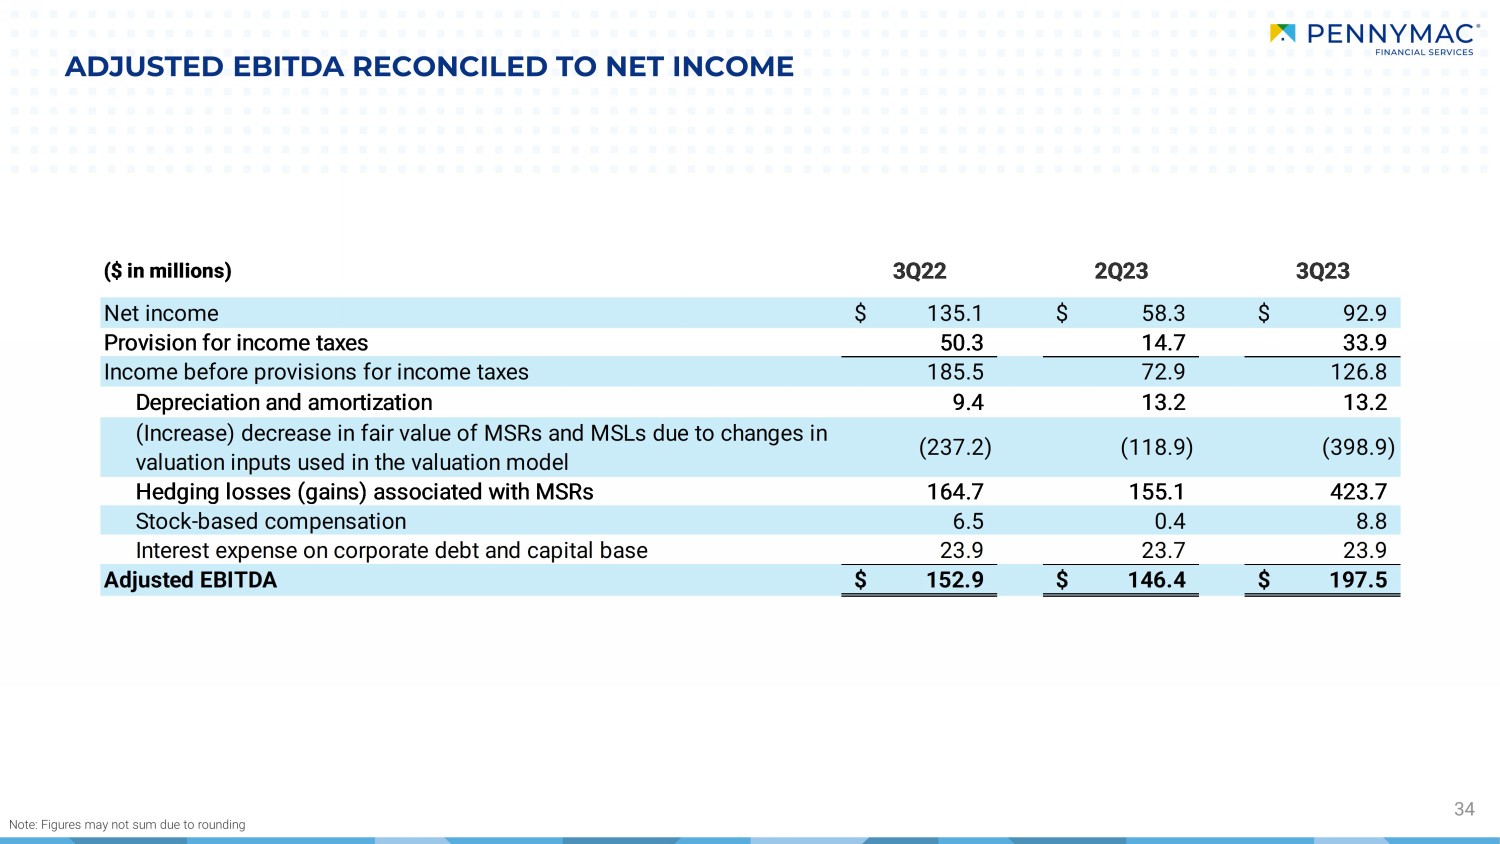
ADJUSTED EBITDA RECONCILED TO NET INCOME 34 Note: Figures may not sum due to rounding ($ in millions) 3Q22 2Q23 3Q23 Net income 135.1$ 58.3$ 92.9$ Provision for income taxes 50.3 14.7 33.9 Income before provisions for income taxes 185.5 72.9 126.8 Depreciation and amortization 9.4 13.2 13.2 (Increase) decrease in fair value of MSRs and MSLs due to changes in valuation inputs used in the valuation model (237.2) (118.9) (398.9) Hedging losses (gains) associated with MSRs 164.7 155.1 423.7 Stock-based compensation 6.5 0.4 8.8 Interest expense on corporate debt and capital base 23.9 23.7 23.9 Adjusted EBITDA 152.9$ 146.4$ 197.5$