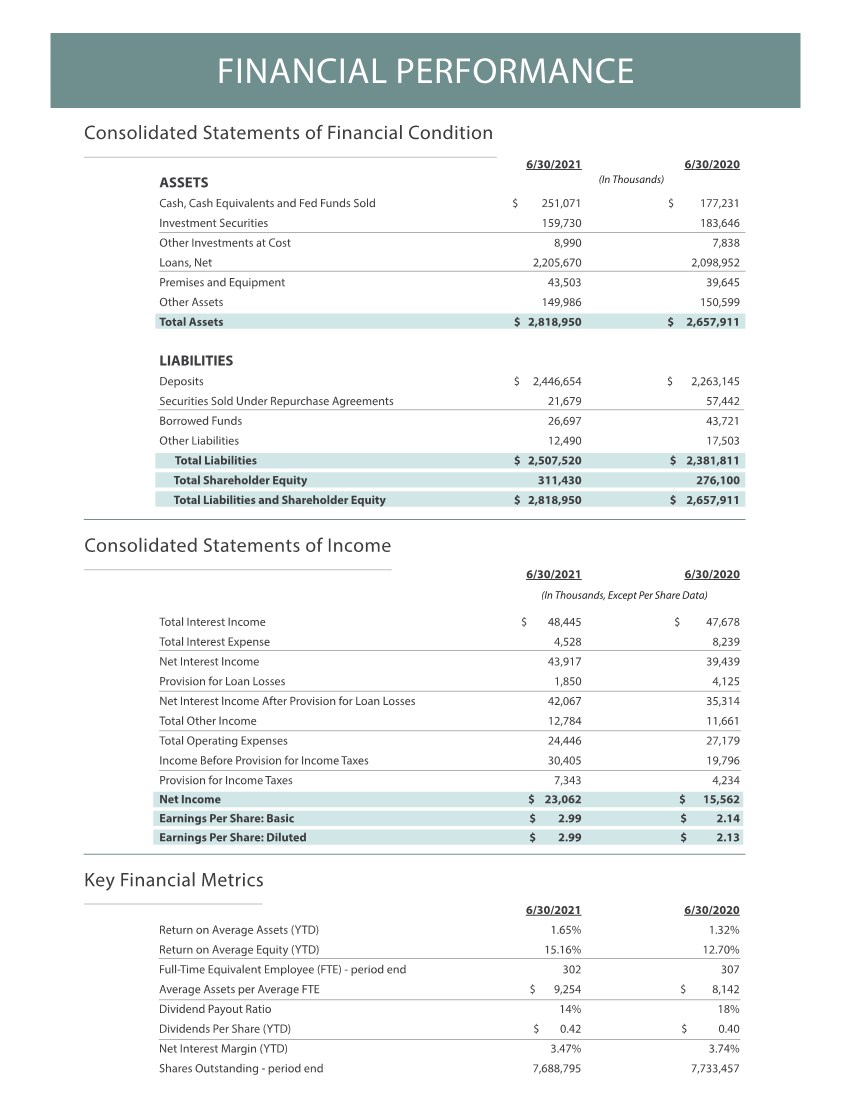
| FINANCIAL PERFORMANCE Consolidated Statements of Financial Condition 6/30/2021 6/30/2020 Return on Average Assets (YTD) 1.65% 1.32% Return on Average Equity (YTD) 15.16% 12.70% Full-Time Equivalent Employee (FTE) - period end 302 307 Average Assets per Average FTE $ 9,254 $ 8,142 Dividend Payout Ratio 14% 18% Dividends Per Share (YTD) $ 0.42 $ 0.40 Net Interest Margin (YTD) 3.47% 3.74% Shares Outstanding - period end 7,688,795 7,733,457 Key Financial Metrics 6/30/2021 6/30/2020 ASSETS Cash, Cash Equivalents and Fed Funds Sold $ 251,071 $ 177,231 Investment Securities 159,730 183,646 Other Investments at Cost 8,990 7,838 Loans, Net 2,205,670 2,098,952 Premises and Equipment 43,503 39,645 Other Assets 149,986 150,599 Total Assets $ 2,818,950 $ 2,657,911 LIABILITIES Deposits $ 2,446,654 $ 2,263,145 Securities Sold Under Repurchase Agreements 21,679 57,442 Borrowed Funds 26,697 43,721 Other Liabilities 12,490 17,503 Total Liabilities $ 2,507,520 $ 2,381,811 Total Shareholder Equity 311,430 276,100 Total Liabilities and Shareholder Equity $ 2,818,950 $ 2,657,911 6/30/2021 6/30/2020 Total Interest Income $ 48,445 $ 47,678 Total Interest Expense 4,528 8,239 Net Interest Income 43,917 39,439 Provision for Loan Losses 1,850 4,125 Net Interest Income After Provision for Loan Losses 42,067 35,314 Total Other Income 12,784 11,661 Total Operating Expenses 24,446 27,179 Income Before Provision for Income Taxes 30,405 19,796 Provision for Income Taxes 7,343 4,234 Net Income $ 23,062 $ 15,562 Earnings Per Share: Basic $ 2.99 $ 2.14 Earnings Per Share: Diluted $ 2.99 $ 2.13 Consolidated Statements of Income (In Thousands) (In Thousands, Except Per Share Data) |


