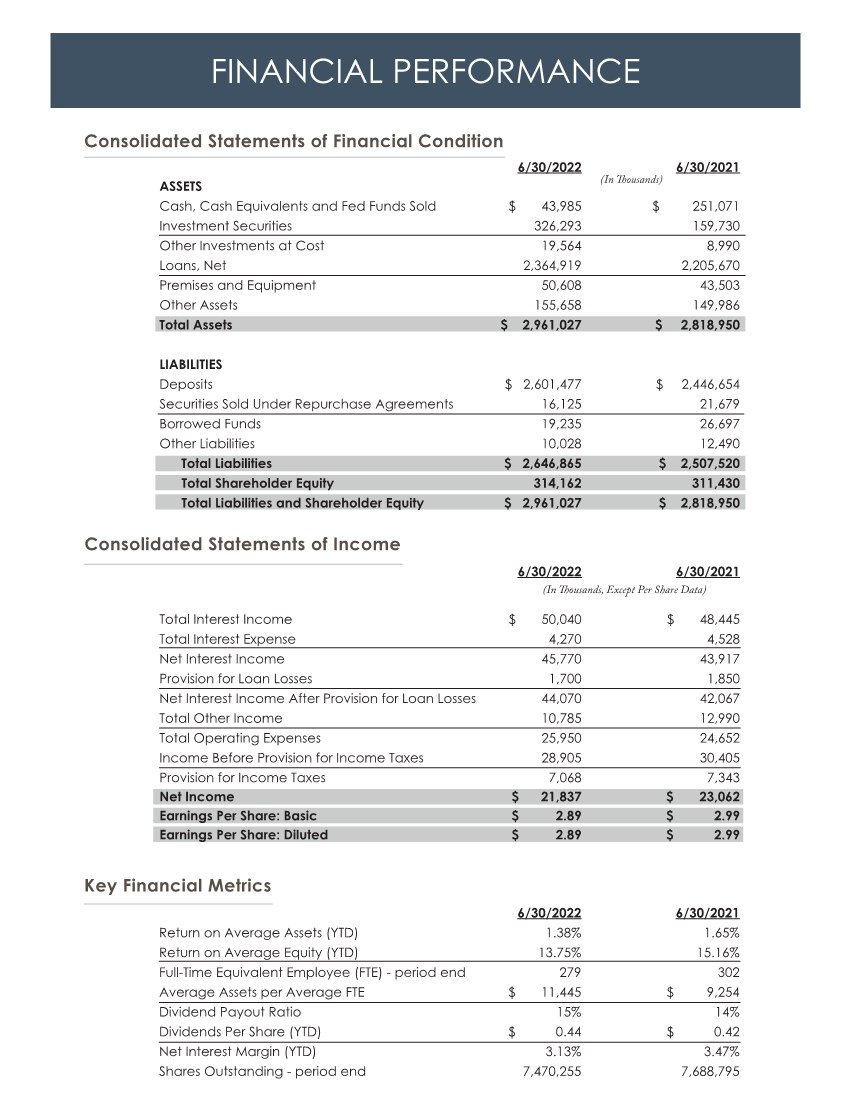
| 6/30/2022 6/30/2021 Return on Average Assets (YTD) 1.38% 1.65% Return on Average Equity (YTD) 13.75% 15.16% Full-Time Equivalent Employee (FTE) - period end 279 302 Average Assets per Average FTE $ 11,445 $ 9,254 Dividend Payout Ratio 15% 14% Dividends Per Share (YTD) $ 0.44 $ 0.42 Net Interest Margin (YTD) 3.13% 3.47% Shares Outstanding - period end 7,470,255 7,688,795 6/30/2022 6/30/2021 ASSETS Cash, Cash Equivalents and Fed Funds Sold $ 43,985 $ 251,071 Investment Securities 326,293 159,730 Other Investments at Cost 19,564 8,990 Loans, Net 2,364,919 2,205,670 Premises and Equipment 50,608 43,503 Other Assets 155,658 149,986 Total Assets $ 2,961,027 $ 2,818,950 LIABILITIES Deposits $ 2,601,477 $ 2,446,654 Securities Sold Under Repurchase Agreements 16,125 21,679 Borrowed Funds 19,235 26,697 Other Liabilities 10,028 12,490 Total Liabilities $ 2,646,865 $ 2,507,520 Total Shareholder Equity 314,162 311,430 Total Liabilities and Shareholder Equity $ 2,961,027 $ 2,818,950 6/30/2022 6/30/2021 Total Interest Income $ 50,040 $ 48,445 Total Interest Expense 4,270 4,528 Net Interest Income 45,770 43,917 Provision for Loan Losses 1,700 1,850 Net Interest Income After Provision for Loan Losses 44,070 42,067 Total Other Income 10,785 12,990 Total Operating Expenses 25,950 24,652 Income Before Provision for Income Taxes 28,905 30,405 Provision for Income Taxes 7,068 7,343 Net Income $ 21,837 $ 23,062 Earnings Per Share: Basic $ 2.89 $ 2.99 Earnings Per Share: Diluted $ 2.89 $ 2.99 FINANCIAL PERFORMANCE Consolidated Statements of Financial Condition Key Financial Metrics Consolidated Statements of Income (In Thousands) (In Thousands, Except Per Share Data) |