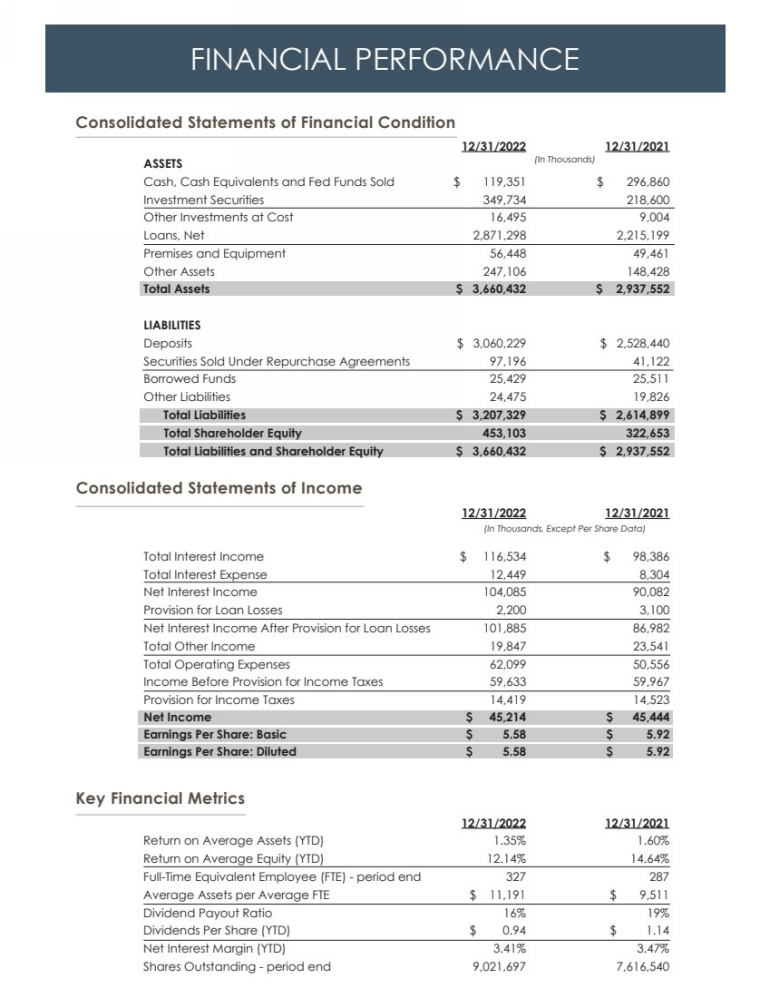
| 12/31/2022 12/31/2021 Return on Average Assets (YTD) 1.35% 1.60% Return on Average Equity (YTD) 12.14% 14.64% Full-Time Equivalent Employee (FTE) - period end 327 287 Average Assets per Average FTE $ 11,191 $ 9,511 Dividend Payout Ratio 16% 19% Dividends Per Share (YTD) $ 0.94 $ 1.14 Net Interest Margin (YTD) 3.41% 3.47% Shares Outstanding - period end 9,021,697 7,616,540 12/31/2022 12/31/2021 ASSETS Cash, Cash Equivalents and Fed Funds Sold $ 119,351 $ 296,860 Investment Securities 349,734 218,600 Other Investments at Cost 16,495 9,004 Loans, Net 2,871,298 2,215,199 Premises and Equipment 56,448 49,461 Other Assets 247,106 148,428 Total Assets $ 3,660,432 $ 2,937,552 LIABILITIES Deposits $ 3,060,229 $ 2,528,440 Securities Sold Under Repurchase Agreements 97,196 41,122 Borrowed Funds 25,429 25,511 Other Liabilities 24,475 19,826 Total Liabilities $ 3,207,329 $ 2,614,899 Total Shareholder Equity 453,103 322,653 Total Liabilities and Shareholder Equity $ 3,660,432 $ 2,937,552 12/31/2022 12/31/2021 Total Interest Income $ 116,534 $ 98,386 Total Interest Expense 12,449 8,304 Net Interest Income 104,085 90,082 Provision for Loan Losses 2,200 3,100 Net Interest Income After Provision for Loan Losses 101,885 86,982 Total Other Income 19,847 23,541 Total Operating Expenses 62,099 50,556 Income Before Provision for Income Taxes 59,633 59,967 Provision for Income Taxes 14,419 14,523 Net Income $ 45,214 $ 45,444 Earnings Per Share: Basic $ 5.58 $ 5.92 Earnings Per Share: Diluted $ 5.58 $ 5.92 FINANCIAL PERFORMANCE Consolidated Statements of Financial Condition Key Financial Metrics Consolidated Statements of Income (In Thousands) (In Thousands, Except Per Share Data) |