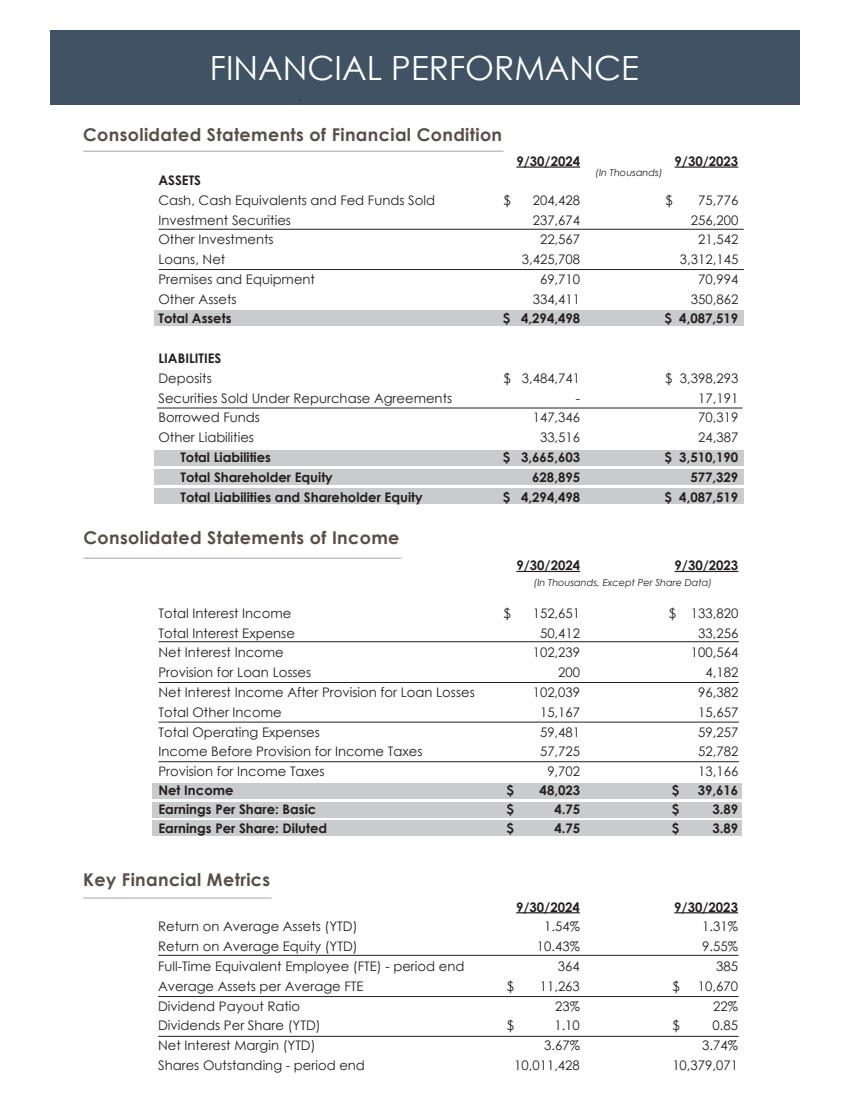
| FINANCIAL PERFORMANCE 9/30/2024 9/30/2023 Return on Average Assets (YTD) 1.54% 1.31% Return on Average Equity (YTD) 10.43% 9.55% Full-Time Equivalent Employee (FTE) - period end 364 385 Average Assets per Average FTE $ 11,263 $ 10,670 Dividend Payout Ratio 23% 22% Dividends Per Share (YTD) $ 1.10 $ 0.85 Net Interest Margin (YTD) 3.67% 3.74% Shares Outstanding - period end 10,011,428 10,379,071 9/30/2024 9/30/2023 ASSETS Cash, Cash Equivalents and Fed Funds Sold $ 204,428 $ 75,776 Investment Securities 237,674 256,200 Other Investments 22,567 21,542 Loans, Net 3,425,708 3,312,145 Premises and Equipment 69,710 70,994 Other Assets 334,411 350,862 Total Assets $ 4,294,498 $ 4,087,519 LIABILITIES Deposits $ 3,484,741 $ 3,398,293 Securities Sold Under Repurchase Agreements - 17,191 Borrowed Funds 147,346 70,319 Other Liabilities 33,516 24,387 Total Liabilities $ 3,665,603 $ 3,510,190 Total Shareholder Equity 628,895 577,329 Total Liabilities and Shareholder Equity $ 4,294,498 $ 4,087,519 9/30/2024 9/30/2023 Total Interest Income $ 152,651 $ 133,820 Total Interest Expense 50,412 33,256 Net Interest Income 102,239 100,564 Provision for Loan Losses 200 4,182 Net Interest Income After Provision for Loan Losses 102,039 96,382 Total Other Income 15,167 15,657 Total Operating Expenses 59,481 59,257 Income Before Provision for Income Taxes 57,725 52,782 Provision for Income Taxes 9,702 13,166 Net Income $ 48,023 $ 39,616 Earnings Per Share: Basic $ 4.75 $ 3.89 Earnings Per Share: Diluted $ 4.75 $ 3.89 Consolidated Statements of Financial Condition Key Financial Metrics Consolidated Statements of Income (In Thousands) (In Thousands, Except Per Share Data) |