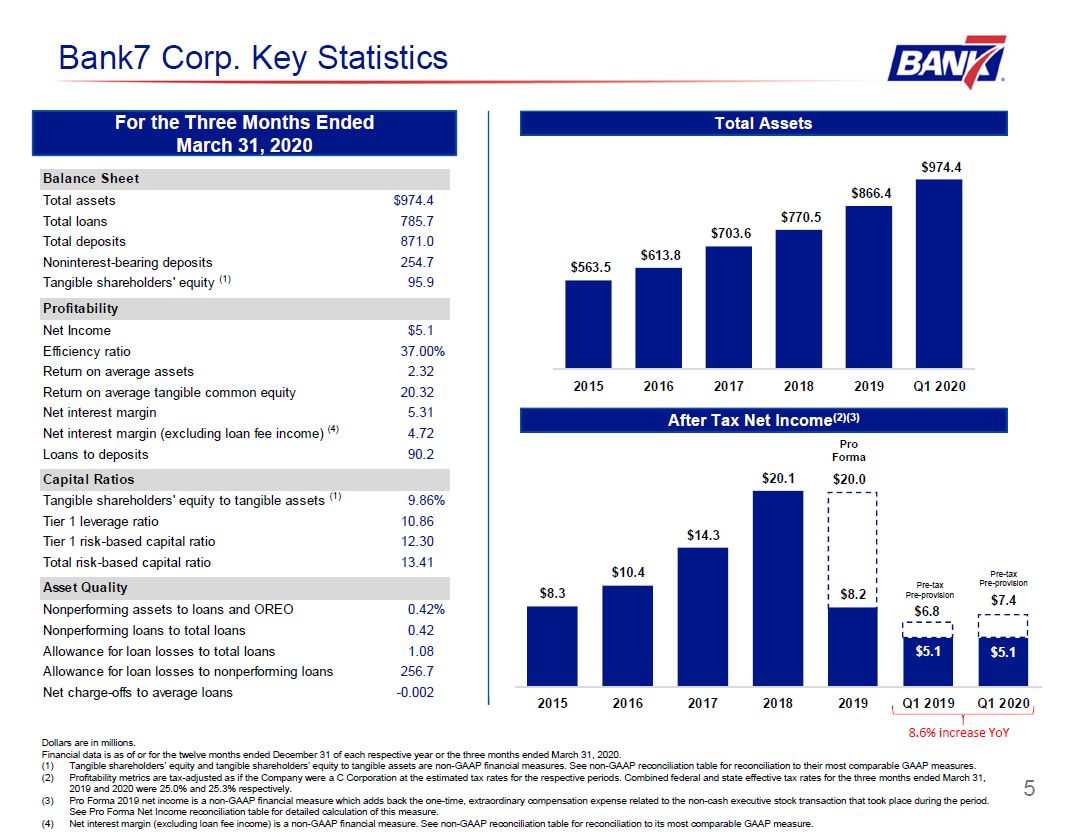
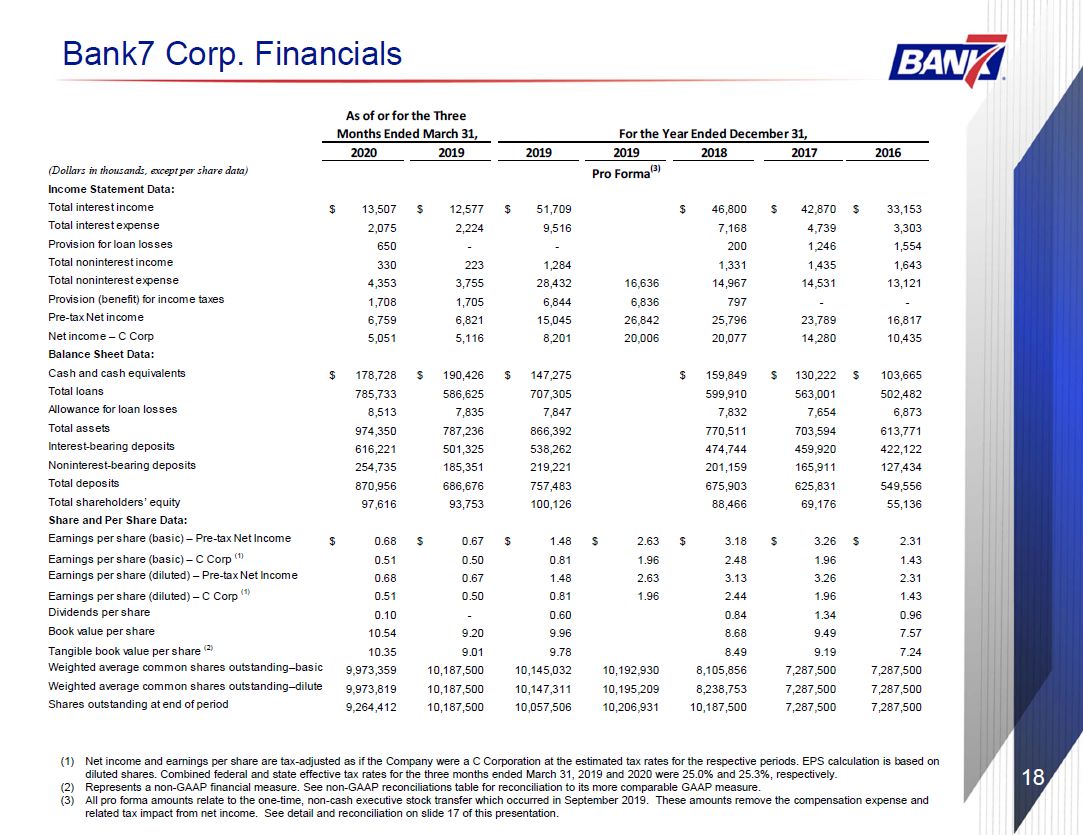
Bank7 Corp. Financials Net income and earnings per share are tax-adjusted as if the Company were a C Corporation at the estimated tax rates for the respective periods. EPS calculation is based on diluted shares. Combined federal and state effective tax rates for the three months ended March 31, 2019 and 2020 were 25.0% and 25.3%, respectively.Represents a non-GAAP financial measure. See non-GAAP reconciliations table for reconciliation to its more comparable GAAP measure.All pro forma amounts relate to the one-time, non-cash executive stock transfer which occurred in September 2019. These amounts remove the compensation expense and related tax impact from net income. See detail and reconciliation on slide 17 of this presentation. 18 (Dollars in thousands, except per share data) Income Statement Data: Total interest income $ 13,507 $ 12,577 $ 51,709 $ 46,800 $ 42,870 $ 33,153 Total interest expense 2,075 2,224 9,516 7,168 4,739 3,303 Provision for loan losses 650 - - 200 1,246 1,554 Total noninterest income 330 223 1,284 1,331 1,435 1,643 Total noninterest expense 4,353 3,755 28,432 16,636 14,967 14,531 13,121 Provision (benefit) for income taxes 1,708 1,705 6,844 6,836 797 - - Pre-tax Net income 6,759 6,821 15,045 26,842 25,796 23,789 16,817 Net income – C CorpBalance Sheet Data: 5,051 5,116 8,201 20,006 20,077 14,280 10,435 Cash and cash equivalents $ 178,728 $ 190,426 $ 147,275 $ 159,849 $ 130,222 $ 103,665 Total loans 785,733 586,625 707,305 599,910 563,001 502,482 Allowance for loan losses 8,513 7,835 7,847 7,832 7,654 6,873 Total assets 974,350 787,236 866,392 770,511 703,594 613,771 Interest-bearing deposits 616,221 501,325 538,262 474,744 459,920 422,122 Noninterest-bearing deposits 254,735 185,351 219,221 201,159 165,911 127,434 Total deposits 870,956 686,676 757,483 675,903 625,831 549,556 Total shareholders’ equityShare and Per Share Data: 97,616 93,753 100,126 88,466 69,176 55,136 Earnings per share (basic) – Pre-tax Net Income $ 0.68 $ 0.67 $ 1.48 $ 2.63 $ 3.18 $ 3.26 $ 2.31 Earnings per share (basic) – C Corp (1) 0.51 0.50 0.81 1.96 2.48 1.96 1.43 Earnings per share (diluted) – Pre-tax Net Income 0.68 0.67 1.48 2.63 3.13 3.26 2.31 Earnings per share (diluted) – C Corp (1) 0.51 0.50 0.81 1.96 2.44 1.96 1.43 Dividends per share 0.10 - 0.60 0.84 1.34 0.96 Book value per share 10.54 9.20 9.96 8.68 9.49 7.57 Tangible book value per share (2) 10.35 9.01 9.78 8.49 9.19 7.24 Weighted average common shares outstanding–basic 9,973,359 10,187,500 10,145,032 10,192,930 8,105,856 7,287,500 7,287,500 Weighted average common shares outstanding–dilute 9,973,819 10,187,500 10,147,311 10,195,209 8,238,753 7,287,500 7,287,500 Shares outstanding at end of period 9,264,412 10,187,500 10,057,506 10,206,931 10,187,500 7,287,500 7,287,500 As of or for the Three Months Ended March 31, For the Year Ended December 31, 2020 2019 2019 2019 2018 2017 2016 Pro Forma(3)