Free signup for more
- Track your favorite companies
- Receive email alerts for new filings
- Personalized dashboard of news and more
- Access all data and search results
Filing tables
Filing exhibits
BSVN similar filings
- 17 May 24 Submission of Matters to a Vote of Security Holders
- 12 Apr 24 Results of Operations and Financial Condition
- 20 Mar 24 Amendments to Articles of Incorporation or Bylaws
- 29 Jan 24 Results of Operations and Financial Condition
- 26 Oct 23 Results of Operations and Financial Condition
- 20 Jul 23 Results of Operations and Financial Condition
- 22 May 23 Submission of Matters to a Vote of Security Holders
Filing view
External links
Exhibit 99.2
0 Q4 and Full Year 2023 Earnings Release January 29, 2024
1 Earnings Release: Q4 2023 and Full Year BSVN – Corporate Overview Consistently ranked by S & P Global Market Intelligence as one of the Top Performing Community Banks in the United States Reliable strength in ROATCE, well capitalized, with sufficient liquidity Stable deposits, excellent liquidity, and a properly matched balance sheet Disciplined credit culture that adheres to a robust risk management framework resulting in strong historical credit quality Experienced and talented bankers focused on high-touch personalized service, targeting entrepreneurs and their commercial banking needs Positioned in dynamic markets, with a commercial banking emphasis delivering services via a branch-lite model Shareholder alignment due to 58% insider ownership Dollars in thousands, all data as of December 31, 2023, unless indicated otherwise To illustrate impact of certain Q4 2023 items, see slide 3. BSVN adopted the CECL model (ASC326) on 1/1/2023 using the modified retrospective method. The presented allowance for periods prior to 1/1/2023 is under the incurred loss model (pre-ASC326). Annual Quarterly 2023 2022 % Change Q4 2023 Actual Q4 2023 Event Adj.(1) Q3 2023 % Change Total assets $ 1,771,666 $ 1,584,169 11.8% $ 1,771,666 $ 1,772,399 0.0% Total loans 1,360,839 1,270,457 7.1% 1,360,839 1,392,777 -2.3% Total deposits 1,591,391 1,431,400 11.2% 1,591,391 11,968 1,593,572 -0.1% Net income 28,275 29,638 -4.6% 1,070 7,853 -86.4% Pre-provision pre-tax earnings 58,384 43,852 33.1% 17,062 15,902 14,370 18.7% Earnings per share 3.05 3.22 -5.2% 0.12 1.30 0.85 -86.4% Net interest margin, ex. loan fees 4.60% 4.38% 5.0% 4.50% 27.7% 4.50% 0.0% ROATCE 19.3% 23.9% -19.5% 2.9% 20.1% -85.7% Allowance for credit losses / total loans (2) 1.45% 1.16% 24.8% 1.45% 1.48% -2.4%
2 Earnings Release: Q4 2023 and Full Year Q4 and Full Year Overview Grew deposits $160.00 million YoY or 11.18% in spite of challenging macroeconomic conditions Uninsured deposits represent 28.19% of total deposits, compared to 29.62% for Q4 2022; adjusted uninsured deposits represent 14.72% of total deposits (1) The sum of cash plus unpledged securities and undrawn lines-of-credit equals $409.207 million, which significantly exceeds adjusted uninsured deposits of $234 million(1), a 1.75x coverage Stable Quality Deposits & Liquidity Dollars in thousands, all data as of December 31,2023, unless indicated otherwise See slide 4 for adjusted uninsured deposit calculation Net of $901.21 million of gross loans that reprice daily, and $85.80 million of those loans that are at their ceiling Loan growth and expense discipline drove our PPE to a record $58.38 million, a 33.14% increase YoY We continue to benefit from a low efficiency ratio of 36.07% for the year Record PPE & Low Efficiency Ratio Strong earnings and low dividend payout ratio builds capital rapidly Capital ratios remain strong and exceed the “well capitalized” guidelines CET 1 Capital: 11.49% Tier 1 Leverage: 9.54% Debt free Balance Sheet No HTM securities Prudent Capital Management Proven ability to successfully manage NIM in varying interest rate environments as we continue to operate within historical ranges $1.04 billion or 76.56% of loans reprice in 1 year or less, with $815.41 million(2) or 59.82% repricing daily AOCI is only $6.15 million; the average investment portfolio duration is ~2.0 years, with $100 million of U.S. Treasuries or 56.34% of the total investment portfolio maturing in Q1 of 2024 Proven & Consistent Balance Sheet Management
3 Earnings Release: Q4 2023 and Full Year Q4 Adjusted Financials Dollars in thousands, all data as of December 31,2023, unless indicated otherwise Adjustments present Non-GAAP measurements. For other Non-GAAP measurements presented throughout the presentation, see reconciliations in the appendix on slides 20 and 21 Diluted earnings per share Adjusted Financials are provided to illustrate the negative impact to BSVN’s earnings for events related to a single loan relationship: A partial loan charge-off of $16.50 million with a remaining specific reserve of $2 million, quarter-to-date provision expense of $15.50 million Acquired oil and gas assets related to this loan relationship. The corresponding Q4 oil and gas operations resulted in gross revenues of $6.00 million, gross expenses of $4.84 million, and pre-tax income of $1.16 million PERFORMANCE Earnings per share(2) $ 0.12 $ 1.18 $ 1.30 RETURN ON AVERAGE Tangible common equity 2.86 24.88 27.75 (Do llars in thousands, except per share data) Dec 31, 2023 Adjustments Adjusted Dec 31, 2023 INCOME STATEMENT DATA Provision for credit losses 15,500 (15,500) - Total noninterest income 6,769 (6,000) 769 Total noninterest expense 11,005 (4,840) 6,165 Provision for income taxes 491 3,442 3,933 Pre-tax net income 1,561 14,340 15,901 Net income 1,070 10,898 11,968 For the Three Months Ended (1)
4 Earnings Release: Q4 2023 and Full Year Liquidity and Asset Sensitivity Dollars in thousands, all data as of December 31,2023, unless indicated otherwise (1) Includes $901.24 million of loans that reprice daily, with $85.80 million of those loans being at their ceiling Asset Sensitivity < 1 year 1 to 2 years 2 to 3 years > 3 years Total Earning Assets: Cash and cash equivalents, and interest-bearing time deposits $ 197,476 $ 1,245 $ - $ 198,721 - $ Gross Loans 110,747 74,980 133,791 1,363,096 Securities 105,669 4,634 7,172 52,012 169,487 Total $ 1,346,723 $ 116,626 $ 82,152 $ 185,803 $ 1,731,304 % of Total 77.79% 6.74% 4.75% 10.73% 100.00% 1,043,578(1) Uninsured deposits total $448.66 million or 28.19% of total deposits; however, after deductions for insider owned, and also collateralized deposits, adjusted uninsured deposits are $234 million, which is 14.72% of total deposits Cash, securities, and undrawn lines of credit totaled $409.21 million, providing a 1.75x coverage of adjusted uninsured deposits Uninsured Deposits | Cash/Liquidity Q4 2023 Uninsured Deposits 448,659 $ Less: Insider Deposits > $1 Million (96,230) Less: Collateralized Deposits (118,152) Adjusted Uninsured Deposits 234,277 $ Q4 2023 198,721 Cash and cash equivalents, and interest-bearing time deposits $ Undrawn Lines-of-Credit 159,151 Unpledged Securities 51,335 Cash/Available Liquidity 409,207 $
5 Earnings Release: Q4 2023 and Full Year Deposit Composition Deposit Growth & Composition Core and non-interest bearing accounts have shown steady growth(1) CAGR since 2019: 16.0% Dollars in millions (1) Includes interest bearing and non-interest bearing demand deposit, money market, and savings accounts 28.9% 27.2% 30.1% 30.7% 30.3% 71.1% 72.8% 69.9% 69.3% 69.7% $757.5 $905.5 $1,217.5 $1,429.3 $1,591.4 2019 2020 2021 2022 2023 Noninterest-bearing deposits Interest-bearing deposits Noninterest-bearing demand $482.3 / 30.3% NOW deposits $451.5 / 28.4% Money Markets $250.7 / 15.8% Savings $150.1 / 9.4% Time deposits < $250K $169.7 / 10.7% Time deposits > $250K $87.1 / 5.5%
6 Earnings Release: Q4 2023 and Full Year Consistent Net Interest Margin Financial data is for the twelve months ended of each respective year and as of the three months ended September 30, 2023 and December 31, 2023 Net interest margin (excluding loan fee income) is a non-GAAP financial measure, see Appendix for reconciliation to the most comparable GAAP measure for this metric 4.78% 4.48% 4.38% 4.38% 4.60% 4.50% 4.50% 0.56% 0.53% 0.74% 0.44% 0.37% 0.37% 0.35% 5.35% 5.01% 5.12% 4.82% 4.97% 4.87% 4.85% 2019 2020 2021 2022 2023 Q3 2023 Q4 2023 Loan Fee Income Contribution Net interest margin continues to show strength due to disciplined loan pricing, a healthy amount of non-interest bearing deposits, and our asset sensitive balance sheet
7 Earnings Release: Q4 2023 and Full Year Diluted Earnings Per Share 5.22% Decrease $2.05 $2.55 $3.22 $3.05 $0.50 $- $1.50 $1.00 $2.00 $2.50 $3.00 $4.00 $3.50 2023 $1.96 Pro Forma $0.81 20191 2020 2021 2022 Year-over-year EPS: $3.05 for 2023, a 5.22% decrease from 2022 No share repurchases during the year Tangible Book Value Per Share CAGR since 2018: 15.5% $8.49 $9.78 $11.69 $12.93 $14.69 $17.49 $14.00 $12.00 $10.00 $8.00 $6.00 $4.00 $2.00 $- $20.00 $18.00 $16.00 2018 2019 2020 2021 2022 2023 Consistently strong earnings increased TBV despite three factors: $0.85 per share paid for an all-cash acquisition in Q4 2021 $0.67 per share AOCI unrealized loss from investments $2.67 per share paid in cash dividends, since IPO Consistent Capital Accumulation / Strong Compounder Dollars are in thousands, except for per share data (1) Pro Forma 2019 is a non-GAAP financial measure which adds back the one-time, extraordinary compensation expense related to the non-cash executive stock transaction that took place during the period See 2019 Pro Forma Net Income reconciliation table for detailed calculation of this measure YE 2018 Q4 2023 % Change $ Change Total tangible shareholders’ equity $ 86,471 $ 160,837 86.0% $ 74,366 Shares outstanding 10,187.5 9,197.7 -9.7% (989.8) Tangible book value per share $ 8.49 $ 17.49 106.0% $ 9.00 Cash dividends per share since IPO as a % of 2018 TBV per share 31.5% $ 2.67 Overall Increase: 137.5% $ 11.67
8 Earnings Release: Q4 2023 and Full Year Return on Average Tangible Common Equity (1)(2) 5 year average: 20.7% 19.14% 20.13% 23.92% 19.25% 5.00% 0.00% 15.00% 10.00% 20.00% 30.00% 25.00% 2019 2020 2021 2022 2023 Efficiency Ratio (2) 5 year average: 37.3% 65.36% 36.03% 36.76% 39.29% 36.07% 30.00% 20.00% 10.00% 0.00% 50.00% 40.00% 60.00% 80.00% 70.00% 2019 2020 2021 2022 2023 Return on Average Assets (1)(2) 5 year average: 2.1% 2.03% 2.21% 2.02% 1.68% 1.00% 0.50% 0.00% 1.50% 2.00% 2.50% 3.00% 2019 2020 2021 2022 2023 Reliable Top Performer Financial data is as of or for the twelve months ended December 31 of each respective Pro Forma YTD ROAA, ROATCE and efficiency ratio are non-GAAP financial measures, see Appendix for reconciliation to the most comparable GAAP measures for these metrics Source: S&P Global Market Intelligence. 20.90% Pro Forma 2.51% 11..0033%% Pro Forma ROATCE remained strong, despite the negative event disclosed in Q3 and Q4, and outperformed 89% of all public banks reported through Q3(2) Performance ratios remain strong and within historical ranges, despite a provision expense of $15.50 million during the quarter Pro Forma 88..6610%% 38.83%
9 Earnings Release: Q4 2023 and Full Year Consistently Outperforming Peers 1.50% 1.47% 1.51% 1.47% 1.50% 1.13% 3.36% 3.29% 3.29% 3.44% 2.99% 3.35% 0.50% 0.00% 1.00% 2.00% 1.50% 2.50% 3.00% 4.00% 3.50% 2018 2019 2020 2021 2022 Q3 2023 Peers BSVN Income Statement as a Percentage of Average Assets PPE to Average Assets vs Peers Dollars are in thousands Peer group is defined as exchange-traded banks nationwide with assets between $500mm-$5bn (145 banks); Source: S&P Global Market Intelligence. Excludes one-time, non-cash executive stock transfer compensation expense of $11.8 million. As of Q3 2023, the latest data available. 2019 Peer Group Median(1) BSVN(2) 2020 Peer Group Median(1) BSVN 2021 Peer Group Median(1) BSVN 2022 Peer Group Median(1) BSVN Q3 2023(3) Peer Group Median(1) BSVN Net Interest Income 3.41% 5.28% 3.19% 4.97% 3.09% 5.09% 3.25% 4.74% 2.93% 4.84% Pre-provision pre-tax earnings 1.47% 3.36% 1.50% 3.29% 1.45% 3.44% 1.49% 2.99% 1.13% 3.35% Provision Expense 0.09% 0.00% 0.29% 0.56% 0.02% 0.40% 0.08% 0.31% 0.05% 0.97% Net Income 1.09% 2.51% 0.98% 2.03% 1.13% 2.21% 1.09% 2.02% 0.80% 1.82% ROATCE 10.79% 20.92% 10.47% 19.14% 13.45% 20.13% 14.09% 23.92% 10.54% 20.06% Net Interest Margin 3.67% 5.35% 3.41% 5.01% 3.33% 5.12% 3.47% 4.82% 3.12% 4.87% Efficiency Ratio 63.72% 38.26% 62.26% 36.03% 61.82% 36.76% 61.05% 39.30% 66.92% 33.61%
10 Earnings Release: Q4 2023 and Full Year Maximizing Employee Base (3) $11.1 $11.1 $12.9 $14.4 2.08% 1.95% 1.96% 1.99% 5.00% 4.50% 4.00% 3.50% 3.00% 2.50% 2.00% 1.50% 1.00% 0.50% 0.00% $- $4.0 $2.0 $6.0 $16.0 $14.0 $12.0 $10.0 $8.0 2019 2020 2021 Assets / FTE Employee (Millions) 2022 2023 Noninterest expense to average assets PPE(1) 33.14% increase 18.73% increase Strength in Core Earnings $43.9 $58.4 $14.4 $17.1 $10.0 $- $20.0 $30.0 $40.0 $35.1 $31.2 $60.0 $50.0 $70.0 2019 2020 2021 2022 2023 Q3 2023 Q4 2023 Dollars are in millions Financial data is as of or for the twelve months ended December 31 of each respective year and as of or for the three months ended September 30, 2023 and December 31, 2023 Pre-provision, pre-tax earnings (“PPE”) is a non-GAAP financial measure. See appendix for reconciliation to their most comparable GAAP measure Pro Forma 2019 is a non-GAAP financial measure which adds back the one-time, extraordinary compensation expense related to the non-cash executive stock transaction that took place during the period. See 2019 Pro Forma Net Income reconciliation table for detailed calculation of this measure Pro Forma noninterest expense to average assets is a non-GAAP financial measure. See appendix for reconciliation to their most comparable GAAP measure $o1r5m.1 Pro F a $26.8 $15.1 Record PPE: PPE of $58.38 million, an increase of 33.14% as compared to 2022 Strong PPE was driven by: Disciplined loan pricing Rising rates and our asset sensitive balance sheet Expense discipline We achieve maximum productivity by: Utilizing a branch-lite model Hiring fewer but better FTEs Operating an efficient delivery system with a strict adherence to processes 3.56% Actual 1.85% Pro Forma $12.7 2 2
11 Earnings Release: Q4 2023 and Full Year $280.8 $338.8 $469.3 $518.9 $540.4 $167.0 $194.0 $199.9 $244.3 $298.5 $158.6 $204.3 $245.1 $327.6 $334.6 $102.1 $102.0 $116.7 $182.8 $190.5 $708.6 $839.1 $1,273.6 $1,031.0 $1,364.0 $0 $200 $400 $600 $800 $1,000 $1,200 $1,400 2019 2020 2021 2022 2023 Other Hospitality C&I Energy Loan Portfolio Trends CAGR Since 2019: 17.8% Loan Portfolio Trends – Selected Categories Dollars are in millions 14.0% 24.5% 21.9% 39.6%
12 Earnings Release: Q4 2023 and Full Year Loan Portfolio Distribution Dollars are in millions. Data as of December 31, 2023 1-4 family (commercial purpose) $100.5 / 7.4% Owner-occupied CRE $110.6 / 8.1% Hospitality - operational properties CRE $277.6 / 20.4% Non-owner-occupied CRE $130.3 / 9.6% Energy - exploration & production $126.8 / 9.3% Energy - mineral / royalty interest $10.6 / 0.8% Energy - service companies $43.0 / 3.2% Energy - midstream $10.1 / 0.7% Commercial and industrial $334.6 / 24.5% PPP Loans $2.0 / 0.1% Consumer $20.2 / 1.5% Agricultural Non-Farmland $25.4 / 1.9% Agricultural Farmland $41.1 / 3.0% Hospitality construction $20.9 / 1.5% Commercial construction $53.7 / 3.9% 1-4 family construction $56.6 / 4.1% Loan Portfolio Selected Categories Industry YE 2023 % of Total Loans YE 2022 % of Total Loans Commercial & Industrial $ 334.60 24.53% $ 327.58 25.72% Hospitality 298.50 21.88% 244.27 19.18% Energy 190.50 13.97% 182.83 14.36%
13 Earnings Release: Q4 2023 and Full Year Diverse CRE Portfolio Dollars are in millions. Data as of December 31, 2023 Diverse commercial real estate lending activity in Texas and Oklahoma with an emphasis in the DFW, Oklahoma City, and Tulsa metros Minimal office and retail loans with over- weighting in each segment to owner- occupied properties No office exposure to downtown metropolitan locations Office Loan Average Size: Owner Occupied — $0.69 million Non-Owner Occupied — $0.93 million Construction lending activity primarily in Oklahoma City and the Dallas metroplex with an emphasis on entry level homes with established homebuilders Limited lot and development lending activity Hospitality niche managed by seasoned professionals with proven track record through various economic cycles CONSTRUCTION OWNER OCCUPIED Industrial $46.2 / 6.2% Office $38.2 / 5.1% Retail $19.9 / 2.7% Restaurant $5.5 / 0.7% Other $0.9 / 0.1% 1-4 Family - Commercial $56.6 / 7.5% 1-4 Family Lots $22.5 / 3.0% Hospitality $20.9 / 2.8% Comm Lots $7.5 / 1.0% Raw Land $10.0 / 1.3% Industrial $1.8 / 0.2% Office $2.4 / 0.3% Retail $2.7 / 0.4% Restaurant $2.1 / 0.3% Mulltifamily $2.7 / 0.4% Other $2.0 / 0.3% Hospitality $277.7 / 37.0% 1-4 Family - Commercial $97.6 / 13.0% Multifamily $19.1 / 2.5% Retail $65.5 / 8.7% Office $21.3 / 2.8% Restaurant $10.0 / 1.3% Industrial $9.9 / 1.3% Other $7.5 / 1.0%
14 Earnings Release: Q4 2023 and Full Year Hotel Portfolio by Class Midscale $155.52 / 52.1% Upper Midscale $70.12 / 23.5% Upscale $0.00 / 0.0% Luxury $0.00 / 0.0% Economy $72.91 / 24.4% Hotel Portfolio by Location 3.56% Actual Hospitality Loan Portfolio Detail Dollars are in millions, data as December 31, 2023 No historical NCOs in the hospitality segment Blue collar portfolio that is well-protected by the “cycle-down” effect of a recession Geographically concentrated in TX (85%) and other markets with favorable economic conditions Loans personally guaranteed by experienced owner/operators with operating history spanning decades of economic cycles Diversified lending to many reputable brands Consistent underwriting fundamentals with disciplined equity requirements, debt coverage ratio requirements, personal recourse, and rapid amortization Average loan size of $4.95 million Hotel Portfolio by Location 73.65% 11.14% 15.21% 0% 20% 40% 60% 80% 100% Outstanding Balance Dallas / Ft. Worth Metro Area Other Texas Metros Other
15 Earnings Release: Q4 2023 and Full Year Strategic Growth in Dynamic Markets Dollars are in millions 2014 2015 2016 2017 2018 2019 2020 2021 2022 2023 LPO opened in Tulsa, OK, full-service branch opened in Frisco, TX Oklahoma acquisition Full-service branch opened in Tulsa, OK Completed IPO Full-service branch opened in Irving, TX LPO opened in Irving, TX Kansas acquisition Total Assets CAGR Since 2014: 15.6% $479.5 $563.5 $613.8 $703.6 $770.5 $866.4 $1,016.7 $1,350.5 $1,584.2 $1,771.7 $400.0 $200.0 $- $600.0 $800.0 $1,000.0 $1,200.0 $1,400.0 $1,600.0 $1,800.0
16 Earnings Release: Q4 2023 and Full Year Earnings-driven Capital Shock-absorption Earnings-driven cushion far exceeds regulatory capital minimums as illustrated over a two-year period, consistent with DFAST parameters(1) Dollars are in thousands above assumes no cash dividends and is simply an illustration and should not be considered a projection or forward-looking guidance of any kind DFAST = Dodd-Frank Act Stress Test Excess capital to target ratio expressed in % is the difference between the actual ratio and regulatory minimum divided by the regulatory minimum Excess capital to target ratio expressed in $ is the excess capital % multiplied by either average assets or risk-weighted assets, assuming a static balance sheet over the next 24 months Trailing twelve months PPE of $58.4 million extrapolated over two years Regulatory Minimum Target Ratios Q4 2023 Capital Ratios Excess Capital to Target Excess Capital to Target Ratio Expressed in %(2) Ratio Expressed in $(3) Add: PPE Cushion(4) Total Shock Absorption Ability Prior to Hitting Reg Minimums Tier 1 Leverage 5.00% 9.54% 90.85% $ 79,919 + $ 116,768 = $ 196,687 CET1 7.00% 11.49% 64.16% $ 65,351 + $ 116,768 = $ 182,119 Tier 1 Risk Based Capital 8.50% 11.49% 35.19% $ 43,525 + $ 116,768 = $ 160,293 Total Risk Based Capital 10.50% 12.74% 21.36% $ 32,636 + $ 116,768 = $ 149,404
17 Appendix
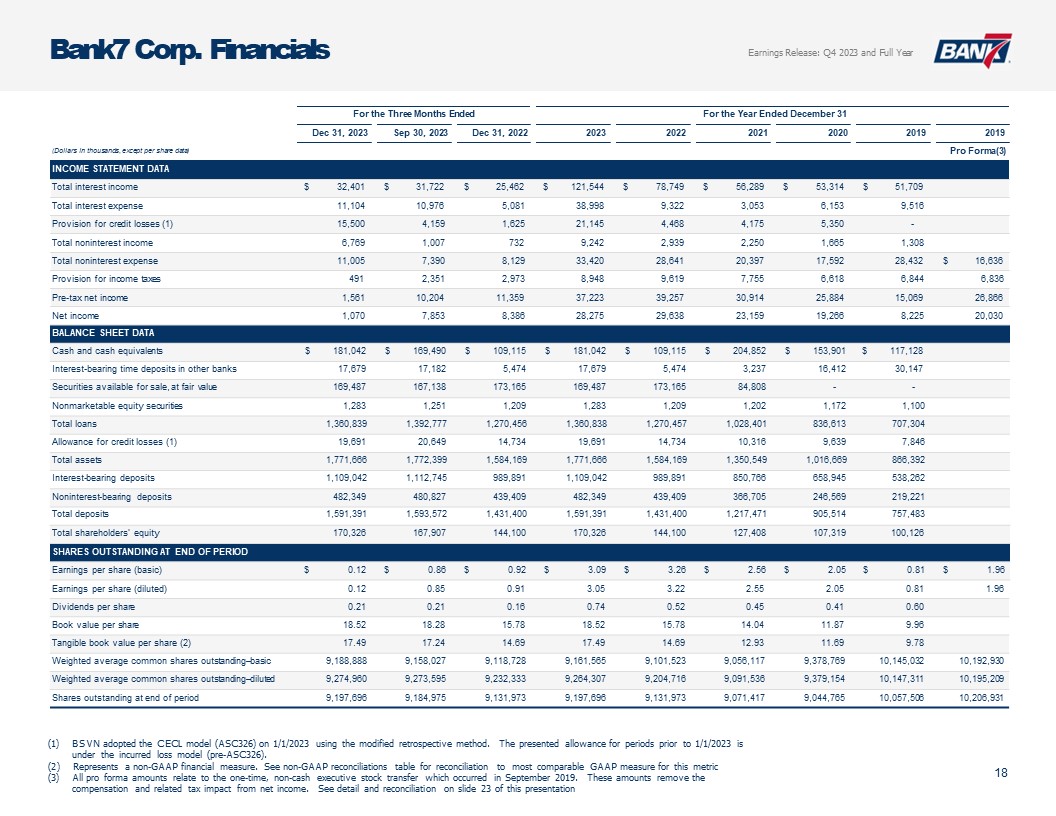
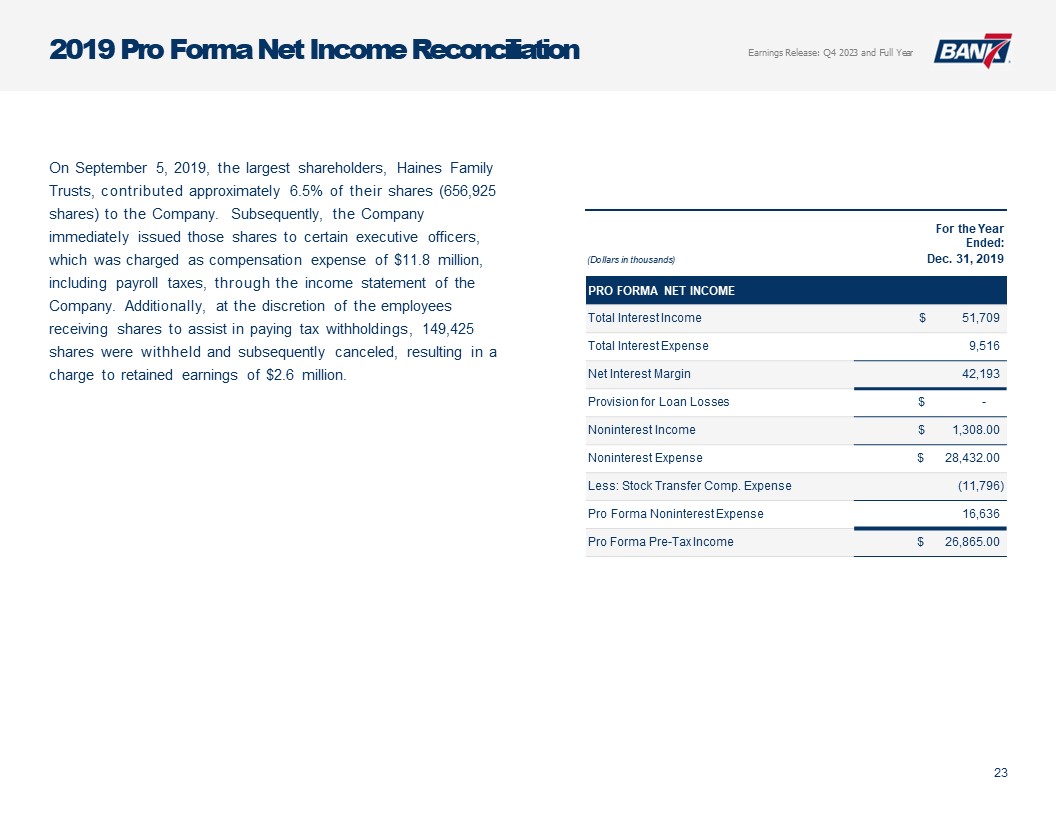
18 Earnings Release: Q4 2023 and Full Year Bank7 Corp. Financials BSVN adopted the CECL model (ASC326) on 1/1/2023 using the modified retrospective method. The presented allowance for periods prior to 1/1/2023 is under the incurred loss model (pre-ASC326). Represents a non-GAAP financial measure. See non-GAAP reconciliations table for reconciliation to most comparable GAAP measure for this metric All pro forma amounts relate to the one-time, non-cash executive stock transfer which occurred in September 2019. These amounts remove the compensation and related tax impact from net income. See detail and reconciliation on slide 23 of this presentation BALANCE SHEET DATA Cash and cash equivalents $ 181,042 $ 169,490 $ 109,115 $ 181,042 $ 109,115 $ 204,852 $ 153,901 $ 117,128 Interest-bearing time deposits in other banks 17,679 17,182 5,474 17,679 5,474 3,237 16,412 30,147 Securities available for sale, at fair value 169,487 167,138 173,165 169,487 173,165 84,808 - - Nonmarketable equity securities 1,283 1,251 1,209 1,283 1,209 1,202 1,172 1,100 Total loans 1,360,839 1,392,777 1,270,456 1,360,838 1,270,457 1,028,401 836,613 707,304 Allowance for credit losses (1) 19,691 20,649 14,734 19,691 14,734 10,316 9,639 7,846 Total assets 1,771,666 1,772,399 1,584,169 1,771,666 1,584,169 1,350,549 1,016,669 866,392 Interest-bearing deposits 1,109,042 1,112,745 989,891 1,109,042 989,891 850,766 658,945 538,262 Noninterest-bearing deposits 482,349 480,827 439,409 482,349 439,409 366,705 246,569 219,221 Total deposits 1,591,391 1,593,572 1,431,400 1,591,391 1,431,400 1,217,471 905,514 757,483 Total shareholders’ equity 170,326 167,907 144,100 170,326 144,100 127,408 107,319 100,126 SHARES OUTSTANDING AT END OF PERIOD Earnings per share (basic) $ 0.12 $ 0.86 $ 0.92 $ 3.09 $ 3.26 $ 2.56 $ 2.05 $ 0.81 $ 1.96 Earnings per share (diluted) 0.12 0.85 0.91 3.05 3.22 2.55 2.05 0.81 1.96 Dividends per share 0.21 0.21 0.16 0.74 0.52 0.45 0.41 0.60 Book value per share 18.52 18.28 15.78 18.52 15.78 14.04 11.87 9.96 Tangible book value per share (2) 17.49 17.24 14.69 17.49 14.69 12.93 11.69 9.78 Weighted average common shares outstanding–basic 9,188,888 9,158,027 9,118,728 9,161,565 9,101,523 9,056,117 9,378,769 10,145,032 10,192,930 Weighted average common shares outstanding–diluted 9,274,960 9,273,595 9,232,333 9,264,307 9,204,716 9,091,536 9,379,154 10,147,311 10,195,209 Shares outstanding at end of period 9,197,696 9,184,975 9,131,973 9,197,696 9,131,973 9,071,417 9,044,765 10,057,506 10,206,931 Dec 31, 2023 Sep 30, 2023 Dec 31, 2022 2023 2022 For the Year Ended December 31 2021 2020 2019 2019 (Dollars in thousands, except per share data) Pro Forma(3) INCOME STATEMENT DATA Total interest income $ 32,401 $ 31,722 $ 25,462 $ 121,544 $ 78,749 $ 56,289 $ 53,314 $ 51,709 Total interest expense 11,104 10,976 5,081 38,998 9,322 3,053 6,153 9,516 Provision for credit losses (1) 15,500 4,159 1,625 21,145 4,468 4,175 5,350 - Total noninterest income 6,769 1,007 732 9,242 2,939 2,250 1,665 1,308 Total noninterest expense 11,005 7,390 8,129 33,420 28,641 20,397 17,592 28,432 $ 16,636 Provision for income taxes 491 2,351 2,973 8,948 9,619 7,755 6,618 6,844 6,836 Pre-tax net income 1,561 10,204 11,359 37,223 39,257 30,914 25,884 15,069 26,866 Net income 1,070 7,853 8,386 28,275 29,638 23,159 19,266 8,225 20,030 For the Three Months Ended
19 Earnings Release: Q4 2023 and Full Year Bank7 Corp. Performance Ratios Annualized Efficiency ratio is calculated by dividing noninterest expense by the sum of net interest income on a tax equivalent basis and noninterest income Represents a non-GAAP financial measure, see non-GAAP reconciliations table for reconciliation to the most comparable GAAP measure for this metric Ratios are based on Bank level financial information rather than consolidated information. At December 31, 2023, Tier 1 leverage ratio, Tier 1 risk based capital ratio, and total risk-based capital ratios were 9.54%, 11.49%, and 12.74% respectively for the Company All pro forma amounts relate to the one-time, non-cash executive stock transfer which occurred in September 2019. These amounts remove the compensation expense and related tax impact from net income. See detail and reconciliation on slide 23 of this presentation Dec 31, 2023 Sep 30, 2023 Dec 31, 2022 2023 2022 2021 2020 2019 2019 (Dollars in thousands, except per share data) Pro Forma(5) RETURN ON AVERAGE(1) Assets 0.24% 1.82% 2.15% 1.68% 2.02% 2.21% 2.03% 1.03% 2.51% Tangible common equity 2.86 20.06 25.78 19.25 23.92 20.13 19.14 8.61 20.92 Shareholders’ equity 2.69 18.89 24.04 18.06 22.13 26.41 18.82 8.44 20.53 Yield on earning assets 7.38 7.44 6.56 7.31 5.46 5.42 5.67 6.55 Yield on loans 8.36 8.52 7.48 8.35 6.51 6.16 6.37 7.58 Yield on loans excluding fees 7.91 8.06 7.02 7.89 5.96 5.30 5.76 6.88 Cost of funds 2.77 2.83 1.43 2.57 0.70 0.33 0.73 1.37 Cost of int bearing deposits 3.99 3.90 2.11 3.60 1.05 0.48 1.05 1.89 Cost of total deposits 2.77 2.83 1.43 2.57 0.70 0.33 0.73 1.37 Net interest margin 4.85 4.87 5.25 4.97 4.82 5.12 5.01 5.35 Net interest margin excluding loan fees 4.50 4.50 4.87 4.60 4.38 4.38 4.48 4.78 Noninterest expense to average assets 2.48 1.71 2.08 1.99 1.96 1.95 1.85 3.56 2.08 Efficiency ratio (2) 38.94 33.61 38.14 36.07 39.29 36.76 36.03 65.36 38.26 Loan to deposit ratio 85.51 87.40 88.89 85.51 88.89 84.47 92.39 93.38 Liquidity ratio 16.05 20.85 16.17 16.05 16.17 28.42 25.48 19.22 CREDIT QUALITY RATIOS Nonperforming assets to total assets 1.64% 2.88% 1.13% 1.64% 1.13% 0.77% 1.63% 0.38% Nonperforming assets to total loans and OREO 2.13 3.67 1.42 2.13 1.42 1.01 1.98 0.47 Nonperforming loans to total loans 2.13 3.67 1.42 2.13 1.42 1.01 1.98 0.47 Allowance for credit losses to nonperforming loans 67.98 40.41 81.95 67.98 81.95 99.37 58.29 235.47 Allowance for credit losses to total loans 1.45 1.48 1.16 1.45 1.16 1.00 1.15 1.11 Net charge-offs to average loans 4.80 0.00 0.01 1.26 0.01 0.39 0.43 (0.00) CAPITAL RATIOS Total shareholders’ equity to total assets 9.61% 9.47% 9.10% 9.61% 9.10% 9.43% 10.56% 11.56% Tangible equity to tangible assets (3) 9.13 7.88 8.52 9.13 8.52 8.75 10.42 11.37 Tier 1 leverage ratio (4) 9.54 9.75 9.18 9.54 9.18 10.55 10.78 11.65 Tier 1 risk-based capital ratio (4) 11.50 11.39 11.26 11.50 11.26 11.53 13.51 14.28 Total risk-based capital ratio (4) 12.75 12.64 12.42 12.75 12.42 12.54 14.75 15.42 For the Three Months Ended For the Year Ended December 31
20 Earnings Release: Q4 2023 and Full Year Non-GAAP Reconciliations Dec 31, 2023 Sep 30, 2023 Dec 31, 2022 2023 2022 2021 2020 2019 (Dollars in thousands, except per share data) TANGIBLE SHAREHOLDERS’ EQUITY Total shareholders equity $ 170,326 $ 167,907 $ 144,100 $ 170,326 $ 144,100 $ 127,408 $ 107,319 $ 100,126 Goodwill and other intangibles (9,489) (9,565) (9,939) (9,489) (9,939) (10,122) (1,583) (1,789) Tangible shareholders’ equity 160,837 158,342 134,161 160,837 134,161 117,286 105,736 98,337 TANGIBLE ASSETS Total assets $ 1,771,666 $ 1,772,399 $ 1,584,169 $ 1,771,666 $ 1,584,169 $ 1,350,549 $ 1,016,669 $ 866,392 Tangible assets 1,762,177 1,762,834 1,574,230 1,762,177 1,574,230 1,340,427 1,015,086 864,603 AVERAGE TANGIBLE COMMON EQUITY Average shareholders equity $ 157,719 $ 164,964 $ 135,968 $ 156,551 $ 144,097 $ 117,053 $ 102,359 $ 97,431 Add back: average net unrealized loss on debt securities 8,525 8,680 10,198 8,570 6,682 - - - Less: average goodwill and other Intangibles (9,539) (9,616) (9,441) (9,688) (9,995) (2,030) (1,684) (1,893) Average tangible common equity 156,706 164,028 136,725 155,432 140,784 115,023 100,675 95,538 End of period common shares outstanding 9,197,696 9,184,975 9,131,973 9,197,696 9,131,973 9,071,417 9,044,765 10,057,506 Book value per share 18.52 18.28 15.78 18.52 15.78 14.04 11.87 9.96 Tangible book value per share 17.49 17.24 14.69 17.49 14.69 12.93 11.69 9.78 Total shareholders’ equity to total assets 9.61% 9.47% 9.10% 9.61% 9.10% 9.43% 10.56% 11.56% Tangible shareholders’ equity to tangible assets 9.13% 8.98% 8.52% 9.13% 8.52% 8.75% 10.42% 11.37% LOAN INTEREST INCOME (Excluding loan fees): Total loan interest income, including fees $ 28,727 $ 28,880 $ 23,806 $ 109,843 $ 74,403 $ 55,768 $ 52,450 $ 48,200 Loan fee income (1,550) (1,579) (1,471) (6,099) (6,278) (7,787) (5,035) (4,443) Loan interest income excluding loan fees 27,177 27,301 22,335 103,744 68,125 47,981 47,415 43,757 Average total loans $ 1,362,533 $ 1,344,038 $ 1,262,864 $ 1,315,578 $ 1,143,380 $ 905,804 $ 823,228 $ 636,274 Yield on loans 8.36% 8.52% 7.48% 8.35% 6.51% 6.16% 6.37% 7.58% Yield on loans (excluding loan fee income) 7.91% 8.06% 7.02% 7.89% 5.96% 5.30% 5.76% 6.88% NET INTEREST MARGIN (Excluding loan fees): Net interest income $ 21,297 $ 20,746 $ 20,381 $ 82,546 $ 69,427 $ 53,236 $ 47,161 $ 42,193 Loan fee income (1,550) (1,579) (1,471) (6,099) (6,278) (7,787) (5,035) (4,443) Net interest income excluding loan fees 19,747 19,167 18,910 76,447 63,149 45,449 42,126 37,750 Average earning assets $ 1,742,068 $ 1,691,463 $ 1,539,698 $ 1,661,860 $ 1,441,140 $ 1,038,773 $ 940,890 $ 789,009 Net interest margin 4.85% 4.87% 5.25% 4.97% 4.82% 5.12% 5.01% 5.35% Net interest margin (excluding loan fee income) 4.50% 4.50% 4.87% 4.60% 4.38% 4.38% 4.48% 4.78% Less: goodwill and other Intangibles (9,489) (9,565) (9,939) (9,489) (9,939) (10,122) (1,583) (1,789) For the Three Months Ended For the Year Ended December 31
21 Earnings Release: Q4 2023 and Full Year Non-GAAP Reconciliations -- Continued Dec 31, 2023 Sep 30, 2023 Dec 31, 2022 2023 2022 2021 2020 2019 (Dollars in thousands, except per share data) PRE-PROVISION PRE-TAX EARNINGS Net Income $ 1,070 $ 7,853 $ 8,386 $ 28,275 $ 29,638 $ 23,159 $ 19,266 $ 8,225 Income Tax Expense 491 2,351 2,973 8,948 9,619 7,755 6,618 6,844 Pre-tax net income 1,561 10,204 11,359 37,223 39,257 30,914 25,884 15,069 Add back: Provision for credit losses 15,500 4,159 1,625 21,145 4,468 4,175 5,350 - Add back: (Gain)Loss on sales/calls of AFS debt securities 1 7 - 16 127 - - - Pre-provision pre-tax earnings 17,062 14,370 12,984 58,384 43,852 35,089 31,234 15,069 For the Three Months Ended For the Year Ended December 31
22 Earnings Release: Q4 2023 and Full Year Available-for-Sale Securities Portfolio Investment Portfolio Dollars are in millions. All mortgage-backed securities and collateralized mortgage obligations are issued and/or guaranteed by U.S. government agencies or U.S. government-sponsored entities. Total investment securities of $169.5 million as of December 31, 2023 Weighted Average Duration: 2.0 Years Book Yield: 1.75% Municipal - Taxable $7.26 / 4.3% Municipal - Tax Exempt $18.60 / 11.0% U.S. Treasuries $104.66 / 61.7% Mortgage Backed Securities $34.50 / 20.4% U.S. Federal Agencies $0.13 / 0.1% Corporate $4.34 / 2.6%
23 Earnings Release: Q4 2023 and Full Year 2019 Pro Forma Net Income Reconciliation On September 5, 2019, the largest shareholders, Haines Family Trusts, contributed approximately 6.5% of their shares (656,925 shares) to the Company. Subsequently, the Company immediately issued those shares to certain executive officers, which was charged as compensation expense of $11.8 million, including payroll taxes, through the income statement of the Company. Additionally, at the discretion of the employees receiving shares to assist in paying tax withholdings, 149,425 shares were withheld and subsequently canceled, resulting in a charge to retained earnings of $2.6 million. PRO FORMA NET INCOME Total Interest Income $ 51,709 Total Interest Expense 9,516 Net Interest Margin 42,193 Provision for Loan Losses $ - Noninterest Income $ 1,308.00 Noninterest Expense $ 28,432.00 Less: Stock Transfer Comp. Expense (11,796) Pro Forma Noninterest Expense 16,636 Pro Forma Pre-Tax Income $ 26,865.00 (Do llars in thousands) For the Year Ended: Dec. 31, 2019
24 Earnings Release: Q4 2023 and Full Year Legal Information and Distribution This presentation and oral statements made regarding the subject of this presentation contain forward-looking statements. These forward-looking statements are subject to significant uncertainties because they are based upon: the amount and timing of future changes in interest rates, market behavior, and other economic conditions; future laws, regulations, and accounting principles; changes in regulatory standards and examination policies, and a variety of other matters. These other matters include, among other things, the impact of COVID-19 on the United States economy and our operations, the direct and indirect effect of economic conditions on interest rates, credit quality, loan demand, liquidity, and monetary and supervisory policies of banking regulators. These forward-looking statements reflect Bank7 Corp.’s current views with respect to, among other things, future events and Bank7 Corp.’s financial performance. Any statements about Bank7 Corp.’s expectations, beliefs, plans, predictions, forecasts, objectives, assumptions or future events or performance are not historical facts and may be forward-looking. These statements are often, but not always, made through the use of words or phrases such as “anticipate,” “believes,” “can,” “could,” “may,” “predicts,” “potential,” “should,” “will,” “estimate,” “plans,” “projects,” “continuing,” “ongoing,” “expects,” “intends” and similar words or phrases. Any or all of the forward-looking statements in (or conveyed orally regarding) this presentation may turn out to be inaccurate. The inclusion of or reference to forward- looking information in this presentation should not be regarded as a representation by Bank7 Corp. or any other person that the future plans, estimates or expectations contemplated by Bank7 Corp. will be achieved. Bank7 Corp. has based these forward-looking statements largely on its current expectations and projections about future events and financial trends that Bank7 Corp. believes may affect its financial condition, results of operations, business strategy and financial needs. Bank7 Corp.’s actual results could differ materially from those anticipated in such forward-looking statements as a result of risks, uncertainties and assumptions that are difficult to predict. If one or more events related to these or other risks or uncertainties materialize, or if Bank7 Corp.’s underlying assumptions prove to be incorrect, actual results may differ materially from what Bank7 Corp. anticipates. You are cautioned not to place undue reliance on forward-looking statements. Further, any forward-looking statement speaks only as of the date on which it is made and Bank7 Corp. undertakes no obligation to update or revise any forward-looking statement to reflect events or circumstances after the date on which the statement is made or to reflect the occurrence of unanticipated events, except as may be required by law. All forward-looking statements herein are qualified by these cautionary statements. Within this presentation, we reference certain market, industry and demographic data, forecasts and other statistical information. We have obtained this data, forecasts and information from various independent, third party industry sources and publications. Nothing in the data, forecasts or information used or derived from third party sources should be construed as advice. Some data and other information are also based on our good faith estimates, which are derived from our review of industry publications and surveys and independent sources. We believe that these sources and estimates are reliable, but have not independently verified them. Statements as to our market position are based on market data currently available to us. Although we are not aware of any misstatements regarding the economic, employment, industry and other market data presented herein, these estimates involve inherent risks and uncertainties and are based on assumptions that are subject to change. This presentation includes certain non-GAAP financial measures, including pro forma net income, tax-adjusted net income, tax-adjusted earnings per share, tax-adjusted return on average assets and tax-adjusted return on average shareholders’ equity. These non-GAAP financial measures and any other non-GAAP financial measures that we discuss in this presentation should not be considered in isolation, and should be considered as additions to, and not substitutes for or superior to, measures of financial performance prepared in accordance with GAAP. There are a number of limitations related to the use of these non-GAAP financial measures versus their nearest GAAP equivalents. For example, other companies may calculate non-GAAP financial measures differently or may use other measures to evaluate their performance, all of which could reduce the usefulness of Bank7 Corp.’s non-GAAP financial measures as tools for comparison. See the table in the appendix of this presentation for a reconciliation of the non-GAAP financial measures used in (or conveyed orally during) this presentation to their most directly comparable GAAP financial measures.
25