Owl Rock Technology Finance Corp. March 2022 4Q’21 Update Exhibit 99.1
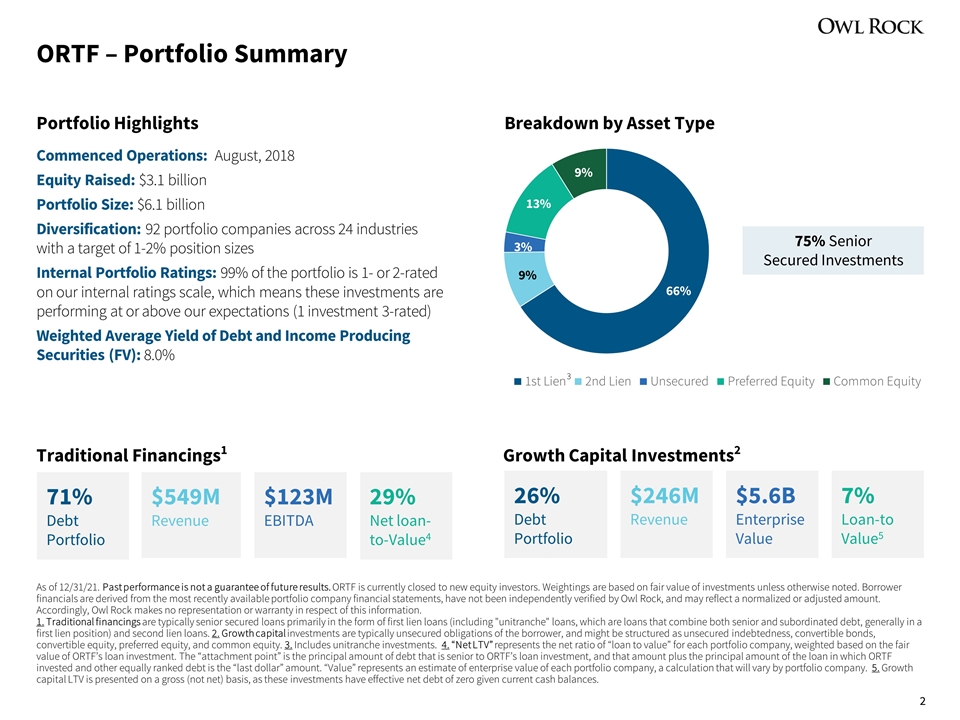
ORTF – Portfolio Summary As of 12/31/21. Past performance is not a guarantee of future results. ORTF is currently closed to new equity investors. Weightings are based on fair value of investments unless otherwise noted. Borrower financials are derived from the most recently available portfolio company financial statements, have not been independently verified by Owl Rock, and may reflect a normalized or adjusted amount. Accordingly, Owl Rock makes no representation or warranty in respect of this information. 1. Traditional financings are typically senior secured loans primarily in the form of first lien loans (including "unitranche" loans, which are loans that combine both senior and subordinated debt, generally in a first lien position) and second lien loans. 2. Growth capital investments are typically unsecured obligations of the borrower, and might be structured as unsecured indebtedness, convertible bonds, convertible equity, preferred equity, and common equity. 3. Includes unitranche investments. 4. “Net LTV” represents the net ratio of “loan to value” for each portfolio company, weighted based on the fair value of ORTF’s loan investment. The “attachment point” is the principal amount of debt that is senior to ORTF’s loan investment, and that amount plus the principal amount of the loan in which ORTF invested and other equally ranked debt is the “last dollar” amount. “Value” represents an estimate of enterprise value of each portfolio company, a calculation that will vary by portfolio company. 5. Growth capital LTV is presented on a gross (not net) basis, as these investments have effective net debt of zero given current cash balances. Portfolio Highlights Breakdown by Asset Type Traditional Financings1 Growth Capital Investments2 Commenced Operations: August, 2018 Equity Raised: $3.1 billion Portfolio Size: $6.1 billion Diversification: 92 portfolio companies across 24 industries with a target of 1-2% position sizes Internal Portfolio Ratings: 99% of the portfolio is 1- or 2-rated on our internal ratings scale, which means these investments are performing at or above our expectations (1 investment 3-rated) Weighted Average Yield of Debt and Income Producing Securities (FV): 8.0% 71% Debt Portfolio $123M EBITDA $549M Revenue 29% Net loan-to-Value4 26% Debt Portfolio $5.6B Enterprise Value $246M Revenue 7% Loan-to Value5 3 75% Senior Secured Investments
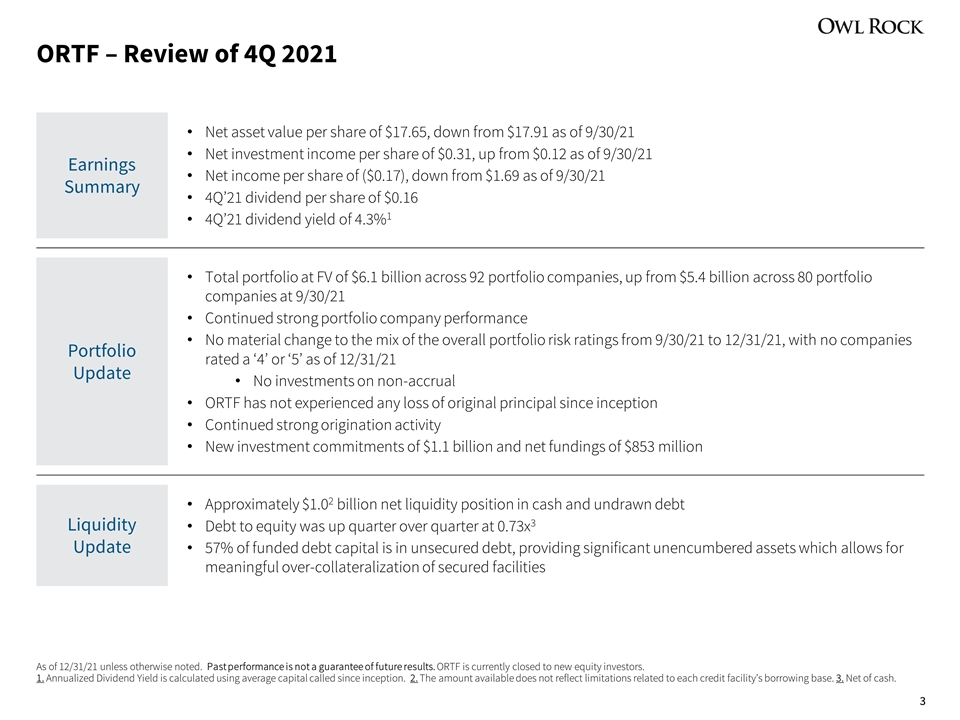
ORTF – Review of 4Q 2021 As of 12/31/21 unless otherwise noted. Past performance is not a guarantee of future results. ORTF is currently closed to new equity investors. 1. Annualized Dividend Yield is calculated using average capital called since inception. 2. The amount available does not reflect limitations related to each credit facility’s borrowing base. 3. Net of cash. Earnings Summary Net asset value per share of $17.65, down from $17.91 as of 9/30/21 Net investment income per share of $0.31, up from $0.12 as of 9/30/21 Net income per share of ($0.17), down from $1.69 as of 9/30/21 4Q’21 dividend per share of $0.16 4Q’21 dividend yield of 4.3%1 Portfolio Update Total portfolio at FV of $6.1 billion across 92 portfolio companies, up from $5.4 billion across 80 portfolio companies at 9/30/21 Continued strong portfolio company performance No material change to the mix of the overall portfolio risk ratings from 9/30/21 to 12/31/21, with no companies rated a ‘4’ or ‘5’ as of 12/31/21 No investments on non-accrual ORTF has not experienced any loss of original principal since inception Continued strong origination activity New investment commitments of $1.1 billion and net fundings of $853 million Liquidity Update Approximately $1.02 billion net liquidity position in cash and undrawn debt Debt to equity was up quarter over quarter at 0.73x3 57% of funded debt capital is in unsecured debt, providing significant unencumbered assets which allows for meaningful over-collateralization of secured facilities
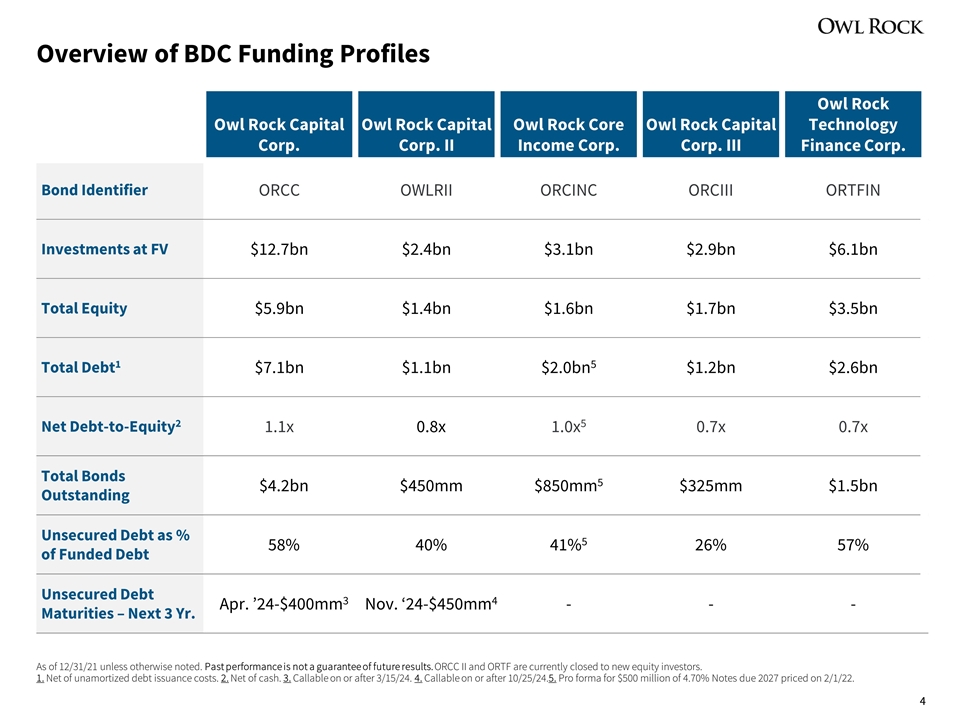
Overview of BDC Funding Profiles As of 12/31/21 unless otherwise noted. Past performance is not a guarantee of future results. ORCC II and ORTF are currently closed to new equity investors. 1. Net of unamortized debt issuance costs. 2. Net of cash. 3. Callable on or after 3/15/24. 4. Callable on or after 10/25/24.5. Pro forma for $500 million of 4.70% Notes due 2027 priced on 2/1/22. Owl Rock Capital Corp. Owl Rock Capital Corp. II Owl Rock Core Income Corp. Owl Rock Capital Corp. III Owl Rock Technology Finance Corp. Bond Identifier ORCC OWLRII ORCINC ORCIII ORTFIN Investments at FV $12.7bn $2.4bn $3.1bn $2.9bn $6.1bn Total Equity $5.9bn $1.4bn $1.6bn $1.7bn $3.5bn Total Debt1 $7.1bn $1.1bn $2.0bn5 $1.2bn $2.6bn Net Debt-to-Equity2 1.1x 0.8x 1.0x5 0.7x 0.7x Total Bonds Outstanding $4.2bn $450mm $850mm5 $325mm $1.5bn Unsecured Debt as % of Funded Debt 58% 40% 41%5 26% 57% Unsecured Debt Maturities – Next 3 Yr. Apr. ’24-$400mm3 Nov. ‘24-$450mm4 - - -

Strong Credit Performance As of 12/31/21. Source: BDC Collateral, Company filings. ORCC II and ORTF are currently closed to new equity investors. 1. Excludes revolvers, delayed draw term loans, and letters of credit when disclosed in schedules of investments, and positions marked at 0 or NA. 2. Based on fair value. Includes investments rated 3-5 according to Owl Rock internal rating system. 3. Net of cash. 4. Pro forma for $500 million of 4.70% Notes due 2027 priced on 2/1/22. 4
Past performance is not a guide to future results and is not indicative of expected realized returns. Assets Under Management (“AUM”) refers to the assets that the Owl Rock manages and are generally equal to the sum of (i) net asset value (“NAV”); (ii) drawn and undrawn debt; and (iii) uncalled capital commitments. This presentation contains proprietary information regarding Blue Owl Capital Inc. (“Blue Owl”), its affiliates and investment program, funds sponsored by Blue Owl, including the Owl Rock Funds, the Dyal Funds and the Oak Street Funds (collectively the “Blue Owl Funds”) as well as investment held by the Blue Owl Funds. This presentation and the information contained in this presentation may not be reproduced or distributed to persons other than the recipient or its advisors. The views expressed and, except as otherwise indicated, the information provided are as of the report date and are subject to change, update, revision, verification, and amendment, materially or otherwise, without notice, as market or other conditions change. Since these conditions can change frequently, there can be no assurance that the trends described herein will continue or that any forecasts are accurate. In addition, certain of the statements contained in this presentation may be statements of future expectations and other forward-looking statements that are based on the current views and assumptions of Blue Owl and involve known and unknown risks and uncertainties (including those discussed below) that could cause actual results, performance, or events to differ materially from those expressed or implied in such statements. These statements may be forward-looking by reason of context or identified by words such as “may, will, should, expects, plans, intends, anticipates, believes, estimates, predicts, potential or continue” and other similar expressions. Neither Blue Owl, its affiliates, nor any of Blue Owl’s or its affiliates' respective advisers, members, directors, officers, partners, agents, representatives or employees or any other person (collectively the “Blue Owl Entities”) is under any obligation to update or keep current the information contained in this document. This presentation contains information from third party sources which Blue Owl has not verified. No representation or warranty, express or implied, is given by or on behalf of the Blue Owl Entities as to the accuracy, fairness, correctness or completeness of the information or opinions contained in this presentation and no liability whatsoever (in negligence or otherwise) is accepted by the Blue Owl Entities for any loss howsoever arising, directly or indirectly, from any use of this presentation or its contents, or otherwise arising in connection therewith. Performance Information: Where performance returns have been included in this presentation, Blue Owl has included herein important information relating to the calculation of these returns as well as other pertinent performance related definitions. All investments are subject to risk, including the loss of the principal amount invested. These risks may include limited operating history, uncertain distributions, inconsistent valuation of the portfolio, changing interest rates, leveraging of assets, reliance on the investment advisor, potential conflicts of interest, payment of substantial fees to the investment advisor and the dealer manager, potential illiquidity, and liquidation at more or less than the original amount invested. Diversification will not guarantee profitability or protection against loss. Performance may be volatile, and the NAV may fluctuate. This presentation is for informational purposes only and is not an offer or a solicitation to sell or subscribe for any fund and does not constitute investment, legal, regulatory, business, tax, financial, accounting, or other advice or a recommendation regarding any securities of Blue Owl, of any fund or vehicle managed by Blue Owl, or of any other issuer of securities. Only a definitive offering document can make such an offer. Neither the Securities and Exchange Commission, the Attorney General of the State of New York nor any state securities commission has approved or disapproved of these securities or determined if the definitive offering document is truthful or complete. Any representation to the contrary is a criminal offense. Capital commitments may be solicited through Blue Owl Capital Securities LLC, Member of FINRA/SIPC, as Dealer Manager. Copyright© Blue Owl Capital Inc. 2022. All rights reserved. This presentation is proprietary and may not to be reproduced, transferred, or distributed in any form without prior written permission from Blue Owl. It is delivered on an “as is” basis without warranty or liability. All individual charts, graphs and other elements contained within the information are also copyrighted works and may be owned by a party other than Blue Owl. By accepting the information, you agree to abide by all applicable copyright and other laws, as well as any additional copyright notices or restrictions contained in the information. Important Information


