UNITED STATES
SECURITIES AND EXCHANGE COMMISSION
Washington, D.C. 20549
FORM N-CSR
CERTIFIED SHAREHOLDER REPORT OF REGISTERED
MANAGEMENT INVESTMENT COMPANIES
Investment Company Act file number: 811-23368
1WS Credit Income Fund
(Exact name of registrant as specified in charter)
299 Park Avenue, 25th Floor
New York, New York 10171
(Address of principal executive offices)
Kurt A. Locher
c/o 1WS Credit Income Fund
Chief Executive Officer
299 Park Avenue, 25th Floor
New York, New York 10171
(Name and Address of Agent for Service)
Registrant’s telephone number, including area code: (212) 377-4810
Date of fiscal year end: October 31
Date of reporting period: November 1, 2020 – April 30, 2021
Item 1. Reports to Stockholders.
(a)
Beginning on January 1, 2021, as permitted by regulations adopted by the U.S. Securities and Exchange Commission, paper copies of the Fund’s annual and semi-annual shareholder reports are no longer sent by mail, unless you specifically request paper copies of the reports. Instead, the reports are made available on the Fund’s website at www.1wscapital.com and you will be notified by mail each time a report is posted and provided with a website link to access the report.
If you already elected to receive shareholder reports electronically, you will not be affected by this change and you need not take any action. You may elect to receive shareholder reports and other communications from the Fund electronically by calling (833) 834-4923 or by contacting your financial intermediary, such as a broker-dealer or bank.
You may elect to receive all future shareholder reports in paper free of charge. If you invest through a financial intermediary, you can contact your financial intermediary to request that you continue to receive paper copies of your shareholder reports. If you invest directly with the Fund, you can call (833) 834-4923 to let the Fund know you wish to continue receiving paper copies of your shareholder reports. Your election to receive reports in paper will apply to all funds held in your account if you invest through a financial intermediary.
Table of Contents
| Fund Commentary | 2 |
| Consolidated Schedule of Investments | 8 |
| Consolidated Statement of Assets and Liabilities | 15 |
| Consolidated Statement of Operations | 16 |
| Consolidated Statement of Changes in Net Assets | 17 |
| Consolidated Statement of Cash Flows | 18 |
| Consolidated Financial Highlights | 20 |
| Notes to Consolidated Financial Statements | 21 |
| Additional Information | 33 |
| Privacy Policy | 34 |
| 1WS Credit Income Fund | Fund Commentary |
| April 30, 2021 (Unaudited) |
The 1WS Credit Income Fund (the “Fund”) is a closed-end interval fund launched in March 2019. As of April 30, 2021, the Fund has gross assets under management of approximately $133 million (approximately $105 million net assets). The Fund is a non-diversified, closed-end investment management company with an investment objective seeking attractive risk-adjusted total returns through generating income and capital appreciation by investing primarily in a wide array of predominantly structured credit and securitized debt instruments.
Overview
The Covid-19 recovery theme gained momentum during the fourth quarter of 2020 and remained well entrenched throughout Q1 2021. Early vaccine distribution within the U.S. progressed at a better than expected rate, and the general relaxing of business closures and stay at home orders have many economists forecasting near record strength in U.S. Gross Domestic Product (GDP) for the second half of the year.
Extremely accommodative monetary policies around the world have supported asset inflation. As the economy continues to recover, credit investors face the increasing challenge of identifying attractively priced investment opportunities as the majority of sectors have largely rebounded from last year's lows. Equity values are setting new highs and generic credit spreads in many cases have returned to historic lows.
Over the intermediate term, rising growth expectations for the U.S. economy should provide a supportive backdrop for credit, generally. Corporate borrowers continue to benefit from the unprecedented monetary policy support, which has kept interest rates relatively low and supported open and liquid capital markets. This has allowed many corporate borrowers to raise cash to bridge liquidity concerns, as well as refinance and term out existing debt, which continues to fuel record or near record gross issuance across corporate sectors. Citing the substantial reduction in default activity and levels of distressed debt over the last several months, a better than expected economic recovery to begin the year, sizeable fiscal stimulus package, and continued rollout of vaccines across the globe, JPMorgan revised down both their high-yield bond and leveraged loan default forecasts to 2% for 2021. This is down from a 3.5% forecast at the beginning of the year, and compares with long term averages of 3.4% and 3.0% for bonds and loans, respectively. Consumer sectors have been supported by unprecedented fiscal stimulus in the form of direct payments to individuals, enhanced and extended unemployment benefits as well as a number of loan forbearance programs, all of which were intended to help individuals bridge the gap to recovery. In addition, with consumption impacted by pandemic driven behavioral changes we have seen significant declines in consumer debt balances with borrowers paying down outstanding liabilities with declines in discretionary spending.
As the broader U.S. economic outlook continues to improve, we believe the fundamental backdrop over the intermediate term should remain accommodative, credit spreads, for the most part however, already reflect this constructive outlook. With benchmark Sovereign yields still relatively low, demand for yield/return remains strong. This is encouraging many investors to reach further out the risk spectrum, down in credit and longer in duration which is compressing risk premiums and flattening credit curves across many sectors (Exhibit 1). Finding attractively priced credit exposure for which investors are being adequately compensated for the embedded risk has become increasingly challenging in the generic securities markets.
Net Return Performance as of 4/30/21*
| Calendar YTD | ITD | |
| OWSCX (Commencement of Operations 3/4/2019) | 5.62% | 18.71% |
| Bloomberg Barclays U.S. Aggregate Bond Index1 | -2.61% | 12.71% |
| ICE BofAML U.S. High Yield Index2 | 2.01% | 16.45% |
| * | OWSCX returns are presented net of all fees and expenses, benchmark returns are gross. |
Performance data quoted represents past performance, which is not a guarantee of future results. Current performance may be lower or higher than the performance quoted. The principal value and investment return of an investment will fluctuate so that your shares, when redeemed, may be worth more or less than their original cost. You can obtain performance data current to the most recent month end by calling (833) 834-4923 or visiting www.1wscapital.com. Investors cannot invest directly in an index.
| 1 | Bloomberg Barclays US Aggregate Bond Index is a market capitalization-weighted index, meaning the securities in the index are weighted according to the market size of each bond type. Investors cannot invest directly in an index. |
| 2 | ICE BofAML US High Yield Master II TR Index value, which tracks the performance of US dollar denominated below investment grade rated corporate debt publically issued in the US domestic market. Investors cannot invest directly in an index |
| 2 | www.1wscapital.com |
| 1WS Credit Income Fund | Fund Commentary |
| April 30, 2021 (Unaudited) |
Portfolio Composition1 and Gross Return Attribution2
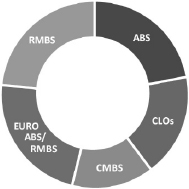
| Portfolio | Gross Return | |
| Composition | Attribution | |
| Asset Type | 4/30/2021 | YTD |
| Asset-Backed Securities (ABS) | 22.1% | 1.28% |
| Collateralized Loan Obligations (CLOs) | 17.8% | 1.23% |
| Commercial Mortgage-Backed Securities (CMBS) | 14.1% | 0.84% |
| European ABS & RMBS | 22.8% | 0.66% |
| Residential Mortgage-Backed Securities (RMBS) | 23.2% | 1.01% |
| Cash & Other | – | 0.59% |
| Interest Rate Hedges | – | 0.72% |
| Total | 100.0% | 6.34% |
| 1 | The Portfolio composition as of 4/30/21 differs from the portfolio composition for any point prior to such date and is subject to change at any time. |
| 2 | Returns by asset type are calculated by taking the specific asset type’s contribution to the Fund’s gross return for the period 2021 YTD through 4/30/21 and multiplying it by the gross return of the Fund over the same period. The Fund’s gross return and returns by asset type are comprised of total investment income and realized and unrealized gain/loss on investments before taking into consideration fees and operating expenses. |
Structured credit, after lagging broader credit markets in the second half of last year, has outperformed and recaptured much of the implied discount. This spread tightening was most notable among investment grade credits and other exposures with little or no risk of future impairment.
However, there still remains fundamental uncertainty across many consumer and business sectors, particularly those most impacted by the Covid-19 related lockdowns. Lingering effects will likely remain for some time into the future, even after headline risks dissipate and the economy adjusts to a new normal. The full impact of fiscal stimulus, loan forbearance, and other programs meant to help bridge the gap to recovery is yet unknown. Structural changes to how and where we live, work and travel have made forecasting future asset performance in many cases more challenging. As a result, there is far less consensus around loss adjusted expected returns across a range of asset classes, loans and structured securities lower in the capital structure with exposure to these varying expectations. We believe these differing fundamental expectations have widened risk premiums and offer attractive investment opportunities for those with the requisite underwriting expertise.

Our investment focus remains on identifying investments that we believe will benefit from differentiated fundamental expectations. In our opinion, fundamental uncertainty leverages our long history of underwriting credit and securitization structures across the breadth of structured assets and can provide excess return opportunities.
| Semi-Annual Report | April 30, 2021 | 3 |
| 1WS Credit Income Fund | Fund Commentary |
| April 30, 2021 (Unaudited) |
First Calendar Quarter Review
At the beginning of the year we highlighted that we believed 2021 would likely be especially challenging for long-only fixed income investors, particularly those constrained to investment grade credits and those lacking the flexibility to actively manage risk exposures. The Federal Reserve continues to reiterate its commitment to low rates. However, investors are forward looking and as the path to economic recovery gains momentum, investors have begun pricing the eventual end of these historically accommodative monetary policies. During the first quarter, 10-year Treasury yields increased 83 basis points, nearly doubling from where they began the year. Despite tighter credit spreads, fixed income total returns were eroded by duration losses from rising Treasury yields. For instance, the total return for the Bloomberg/Barclays Investment Grade Credit Index was down –4.65% in Q1. Higher rated benchmarks, which are generally backed by longer maturity loans, realized the largest duration losses. Our investment mandate provides the flexibility to use select leverage and derivatives to manage risk exposures and optimize risk-adjusted return opportunities.
We have been selling out of a number of positions more recently, as the economy continues to recover and security valuations have appreciated significantly. In large part we have been reducing those positions which we believe have realized their expected return potential and currently offer little more than generic market risk exposure. Many of these were in investment grade credits, primarily in U.S. consumer ABS (as defined below), which have repriced significantly and, in our opinion, no longer offer acceptable returns. We have reinvested in European ABS and RMBS (as defined below) sectors whereby we continue to find what we believe are attractive opportunities, both outright and risk-adjusted relative to U.S. comparables. Consistent across all of our cash bond portfolios, we have sold down positions reaching target return expectations. However, spreads have thus far lagged the recovery in the U.S. and credit curves remain meaningfully steeper in our opinion. We have been adding a diverse mix of securities across both the ABS and RMBS sectors from both the new issue as well as secondary markets. Within the ABS sector, we have added predominantly consumer and auto loans with a diverse set of European country exposures. Our present focus within the RMBS sector continues to be in the U.K. Nonconforming and Buy-To-Let (BTL) sectors, but we also continue to find tactical opportunities in both Dutch and Irish RMBS.
We believe that commercial real estate (CRE) debt and select sectors within CMBS continue to represent some of the best intermediate and longer term fundamental opportunities. We have largely exited higher credits and conduit exposures, which we had added last year, as market spreads returned to pre-Covid-19 lows. While valuations have improved across all sectors, uncertainty continues to resonate within many of the hardest hit CRE sectors including retail and hospitality. In many cases we expect CRE opportunities to be property specific as the economic reopening evolves.
Within the securities market our current focus is in fulcrum exposures of primarily single asset single borrower (SASB) deals. This is where we can best leverage our fundamental credit underwriting. Our approach has centered on identifying individual properties or portfolios that have experienced some degree of operating stress during the pandemic. In many cases, the uncertainty in forecasting future property level economics has led to substantial declines in the value of the mortgage debt (CMBS) used to finance the real estate. We have significant resources dedicated to re-underwriting properties and existing capital structures. This is necessary when trying to identify situations whereby our basis in the real estate Loan-To-Value (LTV), adjusted for a potentially difficult operating environment over the intermediate term, and the returns offered by buying bonds at material discounts with expectations of par recovery. In our opinion, opportunities exist across property types. We believe Hospitality, retail and select office sectors have experienced the most or expected future underperformance. Any number of factors influence outcomes and a detailed understanding of debt structure, sponsor, mezzanine, special servicer and control dynamics are areas where we believe we add significant value in identifying attractive risk adjusted opportunities.
Fundamentally, we believe U.S. consumer backed sectors both ABS as well as RMBS continue to offer attractive relative value opportunities. The challenge is finding the right opportunities which offer credit convexity whereby we can leverage our fundamental credit outlook and underwriting. Despite the significant economic dislocation and rise in unemployment as a result of Covid-19 lockdowns and business closures, consumer fundamentals have remained much stronger than early concerns and in many cases relative to pre-Covid-19 experience in our opinion. Of course, unprecedented fiscal stimulus has gone far in supporting many of hardest hit consumer sectors including direct payments to individuals, extended and enhanced unemployment benefits as well as loan forbearance programs. These have all helped to bridge the gap for many consumers until the economy recovers. This is not to say that there has not been nor that there is not any significant consumer distress within the economy, but, in aggregate, delinquencies and losses have remained well below early expectations and this has supported the recovery of credit spreads across most sectors. In the RMBS sector we continue to focus on fulcrum exposures primarily off of legacy pools whereby differentiated fundamental views can continue to offer attractive upside credit convexity.
| 4 | www.1wscapital.com |
| 1WS Credit Income Fund | Fund Commentary |
| April 30, 2021 (Unaudited) |
In our view, the CLO sector has largely repriced from last year’s correction as corporate default expectations have fallen significantly. As mentioned earlier, JPMorgan is now forecasting corporate defaults in both the bond and leveraged loan sectors to decline to 2% in 2021 and 2022. This has created a strong fundamental backdrop for the sector, generally, and supported the recovery in spreads. Despite the spread recovery, CLOs remain among the highest yielding securities within the credit sector. Retail flows into the loan market have been positive in part due to the floating rate coupons and concern over rising interest rates. We have begun to see several large institutional investors returning to the CLO sector after having stepped away following the correction last year. We continue to trade securities within the sector in an attempt to capture relative value opportunities. Our CLO portfolio strategy has generally been focused on shorter duration exposures where we believe we can capture credit spread roll-down as the securities approach the end of their reinvestment period and begin to deleverage.
Summary Conclusion
While structured credit has recovered from March 2020 lows, a significant percentage of consumer credit, real estate debt and below investment grade corporate credit backing the vast majority of securitized products have not repriced to the same degree as other credit alternatives in our opinion. Continued uncertainties around the magnitude and duration of Covid-19 shutdowns, the level and persistence of high unemployment and the ultimate effectiveness of fiscal programs in support of consumers and hard hit sectors of our economy have made forecasting fundamentals more difficult. In turn, this has led to higher risk premiums as compensation for many sectors and securities within structured credit. This fundamental uncertainty has led to a slower recovery in many structured credit sectors, in our opinion, while increasing relative returns available as compared to corporate debt and other alternatives. We believe we are well positioned to capitalize on these opportunities and that our investment mandate provides the flexibility to use select leverage and derivatives to manage risk exposures and optimize risk-adjusted return opportunities.
| Semi-Annual Report | April 30, 2021 | 5 |
| 1WS Credit Income Fund | Fund Commentary |
| April 30, 2021 (Unaudited) |
Investing in the Fund may be considered speculative and involves a high degree of risk, including the risk of possible substantial loss of your investment.
Prior to investing, Investors should carefully consider the investment objectives, risks, charges and expenses of 1WS Credit Income Fund. This and other important information about the Fund is contained in the prospectus, which can be obtained by calling (833) 834-4923 or visiting www.1wscapital.com. The prospectus should be read carefully before investing.
1WS Credit Income Fund is distributed by ALPS Distributors, Inc. ALPS Distributors, Inc. is not affiliated with 1WS Capital Advisors, LLC or One William Street Capital Management, L.P.
Additional Risk Disclosures
Past performance is not a guarantee of future results. There is no assurance that the Fund will meet its investment objective.
Limited liquidity is provided to shareholders only through the Fund’s quarterly repurchase offers for no less than 5% of the Fund’s shares outstanding at net asset value. There is no guarantee that a shareholders will be able to sell all of the shares they desire to sell in a quarterly repurchase offer. The Fund is suitable only for investors who can bear the risks associated with the limited liquidity of the Fund and should be viewed as a long-term investment. The Fund’s investments may be negatively affected by the broad investment environment in the real estate market, the debt market and/or the equity securities market. The value of the Fund’s investments will increase or decrease based on changes in the prices of the investments it holds. This will cause the value of the Fund’s shares to increase or decrease. The Fund is “non-diversified” under the Investment Company Act of 1940 and, thus, changes in the financial condition or market value of a single issuer may cause a greater fluctuation in the Fund’s net asset value than in a “diversified” fund. Diversification does not eliminate the risk of experiencing investment losses. The Fund is not intended to be a complete investment program. The Fund expects most of its investments to be in securities that are rated below investment grade or would be rated below investment grade if they were rated. Below investment grade instruments or “junk securities” are particularly susceptible to economic downturns compared to higher rated investments. While the Fund may employ hedging techniques to seek to minimize interest rate risk, there can be no assurance that it will engage in such techniques at any given time or that such techniques would be successful. As such, the Fund is subject to interest rate risk and may decline in value as interest rates rise. The Fund may use leverage to achieve its investment objective, which involves risks, including the increased likelihood of net asset value volatility and the increased risk that fluctuations in interest rates on borrowings will reduce the return to investors. In addition to the normal risks associated with investing, investing in international and emerging markets involves risk of capital loss from unfavorable fluctuations in currency values, differences in generally accepted accounting principles or from social, economic or political instability in other nations. The Fund may employ hedging techniques to seek to minimize foreign currency risk. There can be no assurance that it will engage in such techniques at any given time or that such techniques would be successful. The Fund may invest in derivatives, which, depending on market conditions and the type of derivative, are more volatile than other investments and could magnify the Fund’s gains or losses. An investment in shares should be considered only by investors who can assess and bear the illiquidity and other risks associated with such an investment.
Market risk may affect a single issuer, sector of the economy, industry or the market as a whole. Mortgage-backed and asset-backed securities are affected by interest rates, financial health of issuers/originators, creditworthiness of entities providing credit enhancements and the value of underlying assets. Fixed-income securities present issuer default risk. Prepayment and extension risk exists because a loan, bond or other investment may be called, prepaid or redeemed before maturity and similar yielding investments may not be available for purchase. Structured finance securities may present risks similar to those of the other types of debt obligations in which the Fund may invest and, in fact, such risks may be of greater significance in the case of structured finance securities. Investing in structured finance securities may be affected by a variety of factors, including priority in the capital structure of the issuer thereof, the availability of any credit enhancement, and the level and timing of payments and recoveries on and the characteristics of the underlying receivables, loans or other assets that are being securitized, among others. Market or other (e.g., interest rate) environments may adversely affect the liquidity of Fund investments, negatively impacting their price. Generally, the less liquid the market at the time the Fund sells a holding, the greater the risk of loss or decline of value to the Fund. See the Fund’s prospectus for information on these and other risks.
There can be no assurance that the Fund will achieve its investment objective. Many of the Fund’s investments may be considered speculative and subject to increased risk. Neither One William Street Capital Management, LP nor 1WS Capital Advisors, LLC has managed a 1940-Act registered product prior to managing the Fund. Investing in the Fund involves risks, including the risk that you may receive little or no return on your investment or that you may lose part or all of your investment. The ability of the Fund to achieve its investment objective depends, in part, on the ability of the Adviser to allocate effectively the assets of the Fund among the various securities and investments in which the Fund invests. There can be no assurance that the actual allocations or investment selections will be effective in achieving the Fund’s investment objective or delivering positive returns.
The information provided is not intended to be a forecast of future events, a guarantee of future results or investment advice, so actual outcomes and results may differ significantly from the views expressed. These views are subject to change at any time based upon economic, market or other conditions and the portfolio manager disclaims any responsibility to update such views. The views expressed in this report reflect the current views of the portfolio manager as of April 30th, 2021.
| 6 | www.1wscapital.com |
| 1WS Credit Income Fund | Fund Commentary |
| April 30, 2021 (Unaudited) |
Definitions
ABS: Asset-Backed Securities are instruments secured by financial, physical, and/or intangible assets (e.g., receivables or pools of receivables), and investments in any assets/instruments underlying the foregoing structured/secured obligations.
Basis Points (bps): A basis point is a common unit of measurement for interest rates and credit spreads and is equal to one hundredth of one percent.
Bloomberg/Barclays U.S. Aggregate Bond Index: The index is a broad-based flagship benchmark that measures the investment grade, US dollar-denominated, fixed-rate taxable bond market. The index includes Treasuries, government-related and corporate securities, MBS (agency fixed-rate pass-throughs), ABS and CMBS (agency and non-agency).
Bloomberg/Barclays U.S. Investment Grade Credit Index: The index measures the investment grade, fixed-rate, taxable corporate bond market
CLO: Collateralized Loan Obligations are instruments that represent debt and equity tranches of collateralized loan obligations and collateralized debt obligations.
CMBS: Commercial Mortgage-Backed Securities are fixed income instruments that are secured by mortgage loans on commercial real property.
HY CDX: Markit CDX North America High Yield in composed of 100 non-investment grade, distributed among 2 sub-indices: B, BB. All entities are domiciled in North America. Market CDX indices roll every 6 months in March & September.
ICE BofA US High Yield Index: ICE BofA US High Yield Index tracks the performance of US dollar denominated below investment grade corporate debt publicly issued in the US domestic market.
J.P. Morgan Investment Grade (IG) Credit Index: The J.P. Morgan US Investment Grade (IG) index measures the performance of the investment grade dollar denominated US corporate bond market.
J.P. Morgan High Yield (HY) Credit Index: The J.P. Morgan US High Yield (HY) credit index measures the performance of the domestic US high yield corporate bond market.
Loan-To-Value: Loan-To-Value is the ratio between the loan amount and the value of the underlying asset. Lenders use this when evaluating the risks associated with a loan opportunity.
RMBS: Residential Mortgage-Backed Securities are securities that may be secured by interests in a single residential mortgage loan or a pool of mortgagee loans secured by residential property.
| Semi-Annual Report | April 30, 2021 | 7 |
| 1WS Credit Income Fund | Consolidated Schedule of Investments |
| April 30, 2021 (Unaudited) |
| Description | Rate | Maturity Date(a) | Principal Amount | Value | ||||||||
| MORTGAGE-BACKED SECURITIES (54.13%) | ||||||||||||
| Residential (39.70%) | ||||||||||||
| APS Resecuritization Trust, Series 2014-1, Class 1M(b)(c) | 1.58% | 08/28/54 | $ | 2,207,357 | $ | 566,629 | ||||||
| Banc of America Funding , Series 2007-5, Class CA8(c)(d) | 5.35% - 1M US L | 07/25/37 | 3,377,965 | 671,877 | ||||||||
| Bear Stearns Mortgage Funding Trust, Series 2006-AR1, Class 1A2(c) | 1M US L + 0.25% | 07/25/36 | 386,939 | 494,933 | ||||||||
| Bear Stearns Mortgage Funding Trust, Series 2006-AR5, Class 2A2(c) | 1M US L + 0.23% | 01/25/37 | 1,137,944 | 1,440,979 | ||||||||
| Bellemeade Re, Ltd., Series 2021-1A, Class M2(b)(c) | 30D US SOFR + 4.85% | 03/25/31 | 500,000 | 504,150 | ||||||||
| CIT Mortgage Loan Trust, Series 2007-1, Class 1M2(b)(c)(e) | 1M US L + 1.75% | 05/25/22 | 1,000,000 | 883,800 | ||||||||
| Citicorp Residential Mortgage Trust, Series 2006-2, Class M2(f) | 5.26% | 09/25/36 | 2,000,000 | 1,979,200 | ||||||||
| Countrywide Alternative Loan Trust, Series 2005-13CB, Class A1(c)(e) | 1M US L + 0.50% | 05/25/35 | 534,951 | 468,724 | ||||||||
| Countrywide Alternative Loan Trust, Series 2005-64CB, Class 1A17 | 5.50% | 12/25/35 | 288,581 | 192,513 | ||||||||
| Countrywide Alternative Loan Trust, Series 2007-16CB, Class 2A1(c)(e) | 1M US L + 0.45% | 08/25/37 | 1,280,470 | 500,023 | ||||||||
| Delft 2020 BV, Series 2020-1, Class F(c) | 3.30% - 3M EUR L | 04/17/23 | € | 500,000 | 592,652 | |||||||
| Domi BV, Series 2020-1, Class F(c) | 3M EUR L + 6.50% | 04/15/52 | 500,000 | 604,133 | ||||||||
| Domi BV, Series 2020-1, Class X1(c) | 3M EUR L + 4.95% | 04/15/52 | 327,918 | 395,424 | ||||||||
| Domi BV, Series 2020-1, Class X2(c) | 3M EUR L + 6.75% | 04/15/52 | 500,000 | 613,210 | ||||||||
| Eagle RE, Ltd., Series 2021-1, Class M2(b)(c)(e) | 30D US SOFR + 4.45% | 10/25/33 | $ | 500,000 | 501,700 | |||||||
| Finsbury Square PLC, Series 2019-3, Class X(c) | 3M SONIA IR + 3.90% | 12/16/69 | £ | 196,850 | 271,913 | |||||||
| First Franklin Mortgage Loan Trust, Series 2005-FF12, Class M3(c) | 1M US L + 0.75% | 11/25/36 | $ | 1,948,901 | 1,466,548 | |||||||
| Fremont Home Loan Trust, Series 2004-C, Class M3(c) | 1M US L + 1.73% | 08/25/34 | 136,348 | 142,211 | ||||||||
| GSAA Home Equity Trust, Series 2007-8, Class A4(c) | 1M US L + 0.60% | 08/25/37 | 547,743 | 327,550 | ||||||||
| GSAMP Trust, Series 2005-WMC1, Class M2(c)(e) | 1M US L + 0.78% | 09/25/35 | 721,789 | 659,427 | ||||||||
| GSR Mortgage Loan Trust, Series 2005-5F, Class B1(c)(e) | 5.71% | 06/25/35 | 451,895 | 461,249 | ||||||||
| HSI Asset Securitization Corp. Trust, Series 2006-OPT2, Class M5(c)(e) | 1M US L + 0.81% | 01/25/36 | 1,000,000 | 826,100 | ||||||||
| JP Morgan Mortgage Acquisition Corp., Series 2005-OPT2, Class M7(c) | 1M US L + 2.48% | 12/25/35 | 208,456 | 221,922 | ||||||||
| JP Morgan Mortgage Acquisition Corp., Series 2006-FRE2, Class M3(c) | 1M US L + 0.56% | 02/25/36 | 814,558 | 714,611 | ||||||||
| JP Morgan Mortgage Acquisition Trust, Series 2006-HE2, Class M2(c) | 1M US L + 0.32% | 07/25/36 | 1,043,655 | 1,208,553 | ||||||||
| JP Morgan Mortgage Trust, Series 2005-A5, Class TB1(c) | 2.91% | 08/25/35 | 188,304 | 185,423 | ||||||||
| JP Morgan Resecuritization Trust, Series 2015-3, Class 3A2(b)(f) | 5.36% | 09/26/37 | 394,939 | 339,806 | ||||||||
| Jubilee Place BV, Series 2021-1, Class X(c) | 5.00% - 3M EUR L | 07/17/58 | € | 500,000 | 605,636 | |||||||
| Lanebrook Mortgage Transaction PLC, Series 2020-1, Class E(b) | 3M SONIA IR + 5.00% | 09/12/24 | £ | 500,000 | 730,020 | |||||||
| Lansdowne Mortgage Securities No 1 PLC, Series 2006-1, Class M2(c) | 0.84% - 3M EUR L | 06/15/45 | € | 500,000 | 403,898 | |||||||
| Lehman Mortgage Trust, Series 2007-5, Class 6A1(c)(e) | 1M US L + 0.32% | 10/25/36 | $ | 892,593 | 485,392 | |||||||
| Merrill Lynch Mortgage Investors Trust HE1, Series 2006-HE1, Class M2(c)(e) | 1M US L + 0.60% | 12/25/36 | 2,000,000 | 1,898,800 | ||||||||
| Miravet SARL, Series 2019-1, Class E(c) | 3M EUR L + 3.00% | 05/26/65 | € | 500,000 | 540,654 | |||||||
| Miravet SARL - Compartment, Series 2020-1, Class E(c) | 3M EUR L + 4.00% | 05/26/65 | 1,000,000 | 1,103,069 | ||||||||
| Nationstar Home Equity Loan Trust, Series 2007-B, Class M2(c) | 1M US L + 0.47% | 04/25/37 | $ | 1,027,596 | 1,467,509 | |||||||
| New Century Home Equity Loan Trust, Series 2004-A, Class MI1(c)(e) | 4.22% | 08/25/34 | 755,333 | 775,576 | ||||||||
| New Century Home Equity Loan Trust, Series 2005-2, Class M6(c) | 1M US L + 1.02% | 06/25/35 | 302,999 | 301,424 | ||||||||
| Nomura Home Equity Loan, Inc. Home Equity Loan Trust, Series 2006-HE2, Class M2(c)(e) | 1M US L + 0.34% | 03/25/36 | 2,796,520 | 2,485,267 | ||||||||
| Ownit Mortgage Loan Trust, Series 2005-4, Class M1(c)(e) | 1M US L + 0.83% | 08/25/36 | 1,254,108 | 1,210,339 | ||||||||
| Popular ABS Mortgage Pass-Through Trust, Series 2005-5, Class MF1(f) | 3.70% | 11/25/35 | 390,850 | 295,952 | ||||||||
| Popular ABS Mortgage Pass-Through Trust, Series 2005-D, Class M1(e)(f) | 3.64% | 01/25/36 | 389,212 | 358,386 | ||||||||
| Residential Accredit Loans, Inc., Series 2006-Q05, Class 1A2(c)(e) | 1M US L + 0.19% | 05/25/46 | 935,062 | 904,018 | ||||||||
| Residential Accredit Loans, Inc., Series 2006-QS9, Class 1A16(c)(e) | 1M US L + 0.65% | 07/25/36 | 655,265 | 487,452 | ||||||||
| Residential Accredit Loans, Inc., Series 2006-QS9, Class 1A5(c)(e) | 1M US L + 0.70% | 07/25/36 | 966,040 | 711,682 | ||||||||
| Residential Mortgage Securities 31 PLC, Series 2018-31, Class F2(c) | 3M GBP L + 4.00% | 09/20/21 | £ | 509,000 | 697,257 | |||||||
| Residential Mortgage Securities 32 PLC, Series 2020-32X, Class F1(c) | 3M SONIA IR + 6.50% | 06/20/70 | 500,000 | 741,483 | ||||||||
| See Notes to Consolidated Financial Statements. | |
| 8 | www.1wscapital.com |
| 1WS Credit Income Fund | Consolidated Schedule of Investments |
| April 30, 2021 (Unaudited) |
| Description | Rate | Maturity Date(a) | Principal Amount | Value | ||||||||
| MORTGAGE-BACKED SECURITIES (continued) | ||||||||||||
| Soundview Home Loan Trust, Series 2005-OPT4, Class M2(c)(e) | 1M US L + 0.83% | 12/25/35 | $ | 672,699 | $ | 669,201 | ||||||
| Soundview Home Loan Trust, Series 2007-NS1, Class M1(c)(e) | 1M US L + 0.35% | 01/25/37 | 912,765 | 888,668 | ||||||||
| Stratton Mortgage Funding, Series 2021-2X, Class X(c) | 3M SONIA IR + 4.00% | 07/20/60 | £ | 957,287 | 1,315,312 | |||||||
| Structured Asset Investment Loan Trust, Series 2005-9, Class M2(c)(e) | 1M US L + 0.68% | 11/25/35 | $ | 539,080 | 560,320 | |||||||
| Structured Asset Investment Loan Trust, Series 2006-BNC3, Class A4(c)(e) | 1M US L + 0.31% | 09/25/36 | 860,000 | 529,330 | ||||||||
| SYON 2020-2, Class B | 6.27% | 12/17/27 | £ | 1,136,937 | 1,664,526 | |||||||
| Tower Bridge Funding, Series 2021-1, Class X(c) | 3M SONIA IR + 4.50% | 04/21/24 | 359,000 | 497,034 | ||||||||
| Tower Bridge Funding PLC, Series 2020-1, Class E(c) | 3M SONIA IR + 2.50% | 09/20/63 | 500,000 | 721,458 | ||||||||
| Tower Bridge Funding PLC, Series 2020-1, Class X(c) | 3M SONIA IR + 5.25% | 09/20/63 | $ | 186,101 | 253,415 | |||||||
| Triangle Re, Ltd., Series 2021-2, Class M1C(b)(c) | 1M US L + 4.50% | 10/25/33 | 500,000 | 505,050 | ||||||||
| Twin Bridges PLC, Series 2021-1, Class X2(c) | 3M SONIA IR + 5.00% | 03/12/26 | £ | 363,000 | 490,390 | |||||||
| Wells Fargo Mortgage Backed Securities Trust, Series 2007-1, Class A4 | 5.75% | 02/25/37 | – | (g) | 74,053 | |||||||
| Wells Fargo Mortgage Backed Securities Trust, Series 2007-1, Class A8 | 5.75% | 02/25/37 | – | (g) | 52,450 | |||||||
| $ | 41,660,281 | |||||||||||
| Commercial (14.43%) | ||||||||||||
| Ashford Hospitality Trust, Series 2018-ASHF, Class C(b)(c) | 1M US L + 1.40% | 04/15/35 | $ | 500,000 | 499,400 | |||||||
| Ashford Hospitality Trust, Series 2018-ASHF, Class D(b)(c) | 1M US L + 2.10% | 04/16/35 | 554,000 | 545,745 | ||||||||
| Atrium Hotel Portfolio Trust, Series 2018-ATRM, Class F(b)(c)(e) | 1M US L + 4.00% | 06/15/21 | 1,194,000 | 1,013,228 | ||||||||
| BAMLL Commercial Mortgage Securities Trust, Series 2019-AHT, Class C(b)(c) | 1M US L + 2.00% | 03/15/34 | 1,097,000 | 1,090,089 | ||||||||
| CGDB Commercial Mortgage Trust, Series 2019-MOB, Class F(b)(c) | 1M US L + 2.55% | 11/15/21 | 526,000 | 523,370 | ||||||||
| CGDB Commercial Mortgage Trust, Series 2019-MOB, Class G(b)(c) | 1M US L + 2.99% | 11/15/21 | 1,524,000 | 1,474,470 | ||||||||
| CLNY Trust, Series 2019-IKPR, Class C(b)(c) | 1M US L + 1.68% | 11/15/21 | 556,000 | 553,220 | ||||||||
| Commercial Mortgage Trust, Series 2014-FL5, Class KH2(b)(c) | 1M US L + 4.50% | 08/15/31 | 934,304 | 801,913 | ||||||||
| Commercial Mortgage Trust, Series 2015-CR24, Class D(c) | 3.46% | 08/12/25 | 274,000 | 248,628 | ||||||||
| Credit Suisse Mortgage Trust, Series 2019-UVIL, Class D(b)(c) | 3.39% | 12/17/29 | 307,000 | 280,445 | ||||||||
| Fontainebleau Miami Beach Trust, Series 2019-FBLU, Class C(b) | 3.75% | 12/10/24 | 500,000 | 518,600 | ||||||||
| Great Wolf Trust, Series 2019-WOLF, Class C(b)(c) | 1M US L + 1.63% | 12/15/24 | 500,000 | 497,800 | ||||||||
| Great Wolf Trust, Series 2019-WOLF, Class D(b)(c) | 1M US L + 1.93% | 12/15/24 | 750,000 | 741,075 | ||||||||
| Hilton Orlando Trust, Series 2018-ORL, Class D(b)(c) | 1M US L + 1.85% | 12/15/34 | 750,000 | 748,350 | ||||||||
| J.P. Morgan Chase Commercial Mortgage Securities Trust, Series 2016-WIKI, Class B(b)(e) | 3.20% | 10/05/21 | 750,000 | 746,625 | ||||||||
| J.P. Morgan Chase Commercial Mortgage Securities Trust, Series 2016-WIKI, Class C(b) | 3.55% | 10/05/21 | 750,000 | 751,800 | ||||||||
| J.P. Morgan Chase Commercial Mortgage Securities Trust, Series 2016-WIKI, Class D(b)(c) | 4.14% | 10/05/21 | 652,000 | 645,284 | ||||||||
| J.P. Morgan Chase Commercial Mortgage Securities Trust, Series 2017-FL11, Class D(b)(c) | 1M US L + 2.14% | 10/15/32 | 500,000 | 484,350 | ||||||||
| J.P. Morgan Chase Commercial Mortgage Securities Trust, Series 2017-FL11, Class E(b)(c) | 1M US L + 4.02% | 10/15/32 | 504,000 | 471,996 | ||||||||
| JPMBB Commercial Mortgage Securities Trust, Series 2014-C21, Class D(b)(c) | 4.81% | 07/17/24 | 526,000 | 506,591 | ||||||||
| Morgan Stanley Bank of America Merrill Lynch Trust, Series 2015-C20, Class A4(e) | 3.25% | 12/17/24 | 1,000,000 | 1,075,200 | ||||||||
| SLIDE, Series 2018-FUN, Class D(b)(c)(e) | 1M US L + 1.85% | 06/15/21 | 947,893 | 931,305 | ||||||||
| $ | 15,149,484 | |||||||||||
| TOTAL MORTGAGE-BACKED SECURITIES (Cost $50,642,746) | $ | 56,809,765 | ||||||||||
| See Notes to Consolidated Financial Statements. | |
| Semi-Annual Report | April 30, 2021 | 9 |
| 1WS Credit Income Fund | Consolidated Schedule of Investments |
| April 30, 2021 (Unaudited) |
| Description | Rate | Maturity Date(a) | Principal Amount | Value | |||||||||
| ASSET-BACKED SECURITIES (36.81%) | |||||||||||||
| American Credit Acceptance Receivables Trust, Series 2020-1, Class E(b) | 3.32% | 03/13/26 | $ | 243,000 | $ | 249,682 | |||||||
| AutoFlorence 1 Srl, Series 2019-1, Class E(c) | 4.50% - 1M EUR L | 12/25/42 | € | 365,365 | 443,436 | ||||||||
| Autonoria Spain 2019, Series 2019-SP, Class F(c) | 4.00% - 1M EUR L | 12/25/35 | 433,820 | 522,501 | |||||||||
| BL Consumer Credit 2021, Series 2021-1, Class G | 5.80% | 09/25/38 | 410,000 | 496,622 | |||||||||
| CFG Investments, Ltd., Series 2021-1, Class A(b)(e) | 4.70% | 11/20/24 | $ | 1,350,000 | 1,371,330 | ||||||||
| CFG Investments, Ltd., Series 2021-1, Class B(b)(e) | 5.82% | 10/20/25 | 1,196,000 | 1,199,827 | |||||||||
| CFG Investments, Ltd., Series 2021-1, Class C(b) | 7.48% | 05/20/26 | 500,000 | 502,050 | |||||||||
| CIG Auto Receivables Trust 2020-1, Series 2020-1A, Class E(b)(e) | 4.43% | 02/12/27 | 1,150,000 | 1,184,615 | |||||||||
| College Ave Student Loans LLC, Series 2021-A, Class C(b)(e) | 2.92% | 02/25/32 | 500,000 | 503,800 | |||||||||
| Countrywide Asset-Backed Certificates, Series 2005-2, Class M6(c) | 1M US L + 2.03% | 08/25/35 | 516,171 | 522,365 | |||||||||
| CPS Auto Trust, Series 2018-C, Class E(b) | 6.07% | 09/15/25 | 500,000 | 526,850 | |||||||||
| Credito Real USA Auto Receivables Trust 2021-1, Series 2021-1A, Class C(b) | 4.37% | 06/17/24 | 1,108,000 | 1,107,889 | |||||||||
| Diamond Resorts Owner Trust 2021-1, Series 2021-1A, Class C(b)(e) | 2.70% | 11/21/33 | 549,000 | 552,623 | |||||||||
| Diamond Resorts Owner Trust 2021-1, Series 2021-1A, Class D(b)(e) | 3.83% | 11/21/33 | 500,000 | 503,750 | |||||||||
| Dowson PLC, Series 2020-1, Class D(c) | 1M SONIA IR + 4.50% | 04/20/27 | £ | 376,000 | 520,571 | ||||||||
| Dowson PLC, Series 2021-1, Class D(c) | 1M SONIA IR + 3.20% | 03/20/28 | 363,000 | 502,572 | |||||||||
| Dowson PLC, Series 2021-1, Class E(c) | 1M SONIA IR + 4.45% | 03/20/28 | 363,000 | 502,572 | |||||||||
| Dowson PLC, Series 2021-1, Class F(c) | 1M SONIA IR + 6.45% | 03/20/28 | 363,000 | 502,572 | |||||||||
| E-Carat 11 PLC, Series 2020-11, Class G | 1M SONIA IR + 5.00% | 01/18/24 | 481,351 | 666,296 | |||||||||
| Exeter Automobile Receivables Trust, Series 2019-2X, Class E(b) | 4.68% | 06/15/23 | $ | 1,730,000 | 1,819,095 | ||||||||
| Exeter Automobile Receivables Trust 2019-1, Series 2019-1A, Class E(b)(e) | 5.20% | 03/15/23 | 480,000 | 505,008 | |||||||||
| Exeter Automobile Receivables Trust 2020-2, Series 2020-2A, Class E(b)(e) | 7.19% | 07/15/24 | 832,000 | 920,109 | |||||||||
| Freed ABS Trust, Series 2020-FP1, Class C(b) | 4.37% | 03/18/27 | 500,000 | 513,700 | |||||||||
| FTA Santander Consumo 4, Series 2021-4, Class E | 4.90% | 09/18/32 | € | 500,000 | 613,210 | ||||||||
| FTA Santander Consumo 4, Series 2021-4, Class F | 6.50% | 09/18/32 | 500,000 | 605,636 | |||||||||
| GLS Auto Receivables Issuer Trust 2020-2, Series 2020-2A, Class D(b)(e) | 7.48% | 04/15/27 | $ | 1,560,000 | 1,733,316 | ||||||||
| Honours PLC, Series 2006-2, Class B(c) | 1M GBP L + 1.00% | 04/10/29 | £ | 592,977 | 595,688 | ||||||||
| KeyCorp Student Loan Trust, Series 2006-A, Class 2C(c)(e) | 3M US L + 1.15% | 03/27/42 | $ | 2,000,000 | 1,660,600 | ||||||||
| Latitude Australia Credit Card Master Trust, Series 2017-2, Class E(c) | 5.01% | 08/22/23 | AUD | 502,000 | 393,793 | ||||||||
| Lendingpoint Asset Securitization Trust, Series 2019-1X, Class C | 4.50% | 12/15/21 | $ | 1,842,259 | 1,855,154 | ||||||||
| LL ABS Trust 2019-1, Series 2019-1A, Class C(b) | 5.07% | 03/15/27 | 500,000 | 508,200 | |||||||||
| LL ABS Trust 2020-1, Series 2020-1A, Class C(b) | 6.54% | 11/15/23 | 500,000 | 522,500 | |||||||||
| National Collegiate Student Loan Trust, Series 2005-3, Class B(c) | 1M US L + 0.50% | 07/27/37 | 1,846,000 | 1,462,586 | |||||||||
| National Collegiate Student Loan Trust, Series 2006-3, Class B(c)(e) | 1M US L + 0.36% | 01/26/32 | 784,000 | 639,195 | |||||||||
| National Collegiate Student Loan Trust, Series 2007-1, Class A4(c)(e) | 1M US L + 0.31% | 10/25/33 | 1,183,621 | 1,124,795 | |||||||||
| National Collegiate Student Loan Trust, Series 2007-4, Class A3A2(c) | 3.62% | 03/25/38 | 107,000 | 107,377 | |||||||||
| Pagaya AI Debt Selection Trust, Series 2021-1, Class C(b) | 4.09% | 11/15/27 | 1,070,000 | 1,076,420 | |||||||||
| Sierra Timeshare 2020-2 Receivables Funding LLC, Series 2020-2A, Class D(b)(e) | 6.59% | 07/20/37 | 535,140 | 554,245 | |||||||||
| Silk Finance No 5, Series 2020-5, Class D | 7.25% | 02/25/35 | € | 500,000 | 619,041 | ||||||||
| SoFi Consumer Loan Program , Series 2020-1, Class R1(b)(h) | N/A(i) | 01/25/29 | $ | 14,000 | 456,289 | ||||||||
| SoFi Consumer Loan Program LLC, Series 2017-4, Class R2(b)(h) | N/A(i) | 05/26/26 | 9,390 | 305,169 | |||||||||
| SoFi Professional Loan Program, Series 2019-BX, Class R1(h) | N/A(i) | 08/17/48 | 56,770 | 1,262,439 | |||||||||
| SoFi Professional Loan Program, Series 2020-A, Class R1(b)(h) | N/A(i) | 05/15/46 | 10,000 | 560,526 | |||||||||
| Sofi Professional Loan Program , Series 2018-D, Class R1(b)(h) | N/A(i) | 02/25/48 | 21,839 | 422,318 | |||||||||
| SoFi Professional Loan Program LLC, Series 2017-D, Class R1(b)(h) | N/A(i) | 09/25/40 | 16,181 | 450,758 | |||||||||
| SoFi Professional Loan Program LLC, Series 2019-A, Class R1(b)(h) | N/A(i) | 06/15/48 | 32,016 | 616,727 | |||||||||
| Structured Asset Investment Loan Trust, Series 2005-8, Class M2(c)(e) | 1M US L + 0.75% | 10/25/35 | 953,858 | 954,526 | |||||||||
| United Auto Credit Securitization Trust, Series 2021-1, Class E(b) | 2.58% | 01/10/24 | 500,000 | 505,500 | |||||||||
| See Notes to Consolidated Financial Statements. | |
| 10 | www.1wscapital.com |
| 1WS Credit Income Fund | Consolidated Schedule of Investments |
| April 30, 2021 (Unaudited) |
| Description | Rate | Maturity Date(a) | Principal Amount | Value | |||||||||
| ASSET-BACKED SECURITIES (continued) | |||||||||||||
| Upstart Securitization Trust, Series 2019-3, Class C(b)(e) | 5.38% | 01/21/30 | $ | 750,000 | $ | 775,275 | |||||||
| Upstart Securitization Trust, Series 2020-3, Class C(b) | 6.25% | 11/20/30 | 1,250,000 | 1,335,750 | |||||||||
| Zip Master Trust, Series 2021-1, Class D(c) | 1M BBSW + 3.70% | 04/10/24 | AUD | 500,000 | 386,139 | ||||||||
| Zip Master Trust, Series 2021-1, Class E(c) | 1M BBSW + 5.70% | 04/10/24 | 500,000 | 386,138 | |||||||||
| TOTAL ASSET-BACKED SECURITIES (Cost $37,738,995) | $ | 38,629,145 | |||||||||||
| COLLATERALIZED LOAN OBLIGATIONS (17.24%)(b)(c) | |||||||||||||
| ALM XVIII, Ltd., Series 2018-18A, Class DR(e) | 3M US L + 5.50% | 01/15/28 | 275,000 | $ | 271,012 | ||||||||
| Anchorage Capital CLO 3-R, Ltd., Series 2018-3RA, Class E(e) | 3M US L + 5.50% | 01/28/31 | 551,000 | 532,211 | |||||||||
| Anchorage Capital CLO 5-R, Ltd., Series 2018-5RA, Class E | 3M US L + 5.40% | 01/15/30 | 508,000 | 499,821 | |||||||||
| Anchorage Capital CLO, Ltd., Series 2015-6X, Class ER | 3M US L + 6.35% | 07/15/30 | 700,000 | 691,040 | |||||||||
| Anchorage Capital CLO, Ltd., Series 2016-8X, Class ER | 3M US L + 5.75% | 07/28/28 | 500,000 | 492,700 | |||||||||
| Apex Credit CLO, LLC, Series 2015-2X, Class ER | 3M US L + 6.10% | 10/17/26 | 500,000 | 475,150 | |||||||||
| Bain Capital Credit CLO 2018-1, Series 2018-1A, Class E | 3M US L + 5.35% | 04/23/31 | 563,000 | 529,727 | |||||||||
| Barings CLO, Ltd. 2013-I, Series 2017-IA, Class ER | 3M US L + 5.20% | 01/20/28 | 514,000 | 490,921 | |||||||||
| Battalion CLO XV, Ltd., Series 2020-15A, Class E | 3M US L + 6.35% | 01/17/33 | 506,000 | 500,839 | |||||||||
| BlueMountain CLO 2016-1, Ltd., Series 2018-1A, Class ER | 3M US L + 5.55% | 04/20/27 | 296,000 | 291,530 | |||||||||
| BlueMountain CLO, Ltd., Series 2018-1X, Class ER | 3M US L + 5.55% | 04/20/27 | 500,000 | 492,450 | |||||||||
| Carlyle Global Market Strategies CLO 2015-1, Ltd., Series 2019-1A, Class ER(e) | 3M US L + 6.94% | 07/20/31 | 1,095,000 | 1,094,343 | |||||||||
| Dryden Senior Loan Fund, Series 2015-38X, Class SUB(h) | N/A(i) | 07/15/30 | 1,415,000 | 749,950 | |||||||||
| Elevation CLO 2021-12, Ltd., Series 2021-12A, Class E | 3M US L + 7.27% | 04/20/32 | 510,000 | 499,902 | |||||||||
| Galaxy XIX CLO, Ltd., Series 2017-19A, Class D1R | 3M US L + 6.53% | 07/24/30 | 507,000 | 500,156 | |||||||||
| Gallatin CLO IX, Ltd., Series 2018-1A, Class E(e) | 3M US L + 5.47% | 01/21/28 | 805,000 | 798,319 | |||||||||
| KKR CLO 10, Ltd., Series 2017-10, Class ER | 3M US L + 6.50% | 09/15/29 | 505,000 | 503,283 | |||||||||
| KVK CLO 2013-1, Ltd., Series 2017-1A, Class ER(e) | 3M US L + 5.94% | 01/14/28 | 500,000 | 499,800 | |||||||||
| MP CLO, Ltd., Series 2015-2X, Class ER | 3M US L + 5.45% | 10/28/27 | 750,000 | 707,175 | |||||||||
| Oaktree CLO 2019-3, Ltd., Series 2019-3A, Class E | 3M US L + 6.77% | 07/20/31 | 517,000 | 512,657 | |||||||||
| OCP CLO 2014-5, Ltd., Series 2018-5A, Class DR | 3M US L + 5.70% | 04/26/31 | 525,000 | 509,933 | |||||||||
| OCP CLO 2014-6, Ltd., Series 2017-6A, Class DR | 3M US L + 6.52% | 10/17/30 | 757,000 | 743,601 | |||||||||
| Race Point VIII CLO, Ltd., Series 2017-8A, Class ER(e) | 3M US L + 6.85% | 02/20/30 | 640,000 | 612,032 | |||||||||
| Romark CLO II, Ltd., Series 2018-2A, Class D | 3M US L + 6.25% | 07/25/31 | 531,000 | 515,070 | |||||||||
| Shackleton CLO, Ltd., Series 2017-8X, Class ER | 3M US L + 5.34% | 10/20/27 | 1,000,000 | 953,800 | |||||||||
| Sound Point CLO III-R, Ltd., Series 2018-2RA, Class E | 3M US L + 6.00% | 04/15/29 | 1,500,000 | 1,373,550 | |||||||||
| Sound Point CLO XVII, Series 2017-3A, Class D(e) | 3M US L + 6.50% | 10/20/30 | 526,000 | 513,639 | |||||||||
| Taberna Preferred Funding, Ltd., Series 2005-3X, Class B1(j) | 3M US L + 0.80% | 02/05/36 | 1,000,000 | 365,000 | |||||||||
| Venture CDO, Ltd., Series 2016-23X, Class ER | 3M US L + 5.95% | 07/19/28 | 500,000 | 475,950 | |||||||||
| Voya CLO, Ltd., Series 2014-2X, Class SUB(h) | N/A(i) | 04/17/30 | 761,000 | 153,189 | |||||||||
| Wind River CLO, Ltd., Series 2016-1X, Class ER | 3M US L + 5.55% | 07/15/28 | 750,000 | 744,450 | |||||||||
| TOTAL COLLATERALIZED LOAN OBLIGATIONS (Cost $17,508,762) | $ | 18,093,200 | |||||||||||
| See Notes to Consolidated Financial Statements. | |
| Semi-Annual Report | April 30, 2021 | 11 |
| 1WS Credit Income Fund | Consolidated Schedule of Investments |
| April 30, 2021 (Unaudited) |
| Shares | Value | |||||||
| PREFERRED STOCKS (0.60%)(c)(k) | ||||||||
| New York Mortgage Trust, Inc., Series D | 8,071 | $ | 197,740 | |||||
| New York Mortgage Trust, Inc., Series E | 17,808 | 432,734 | ||||||
| TOTAL PREFERRED STOCKS (Cost $482,862) | $ | 630,474 | ||||||
| 7-Day | ||||||||||||
| Yield | Shares | Value | ||||||||||
| MONEY MARKET FUNDS (11.85%) | ||||||||||||
| BlackRock Liquidity Funds T-Fund | 0.03% | 9,737,014 | $ | 9,737,014 | ||||||||
| BNY Mellon U.S. Treasury Fund, Institutional Class | 0.01% | 2,698,881 | 2,698,881 | |||||||||
| TOTAL MONEY MARKET FUNDS (Cost $12,435,895) | $ | 12,435,895 | ||||||||||
| Value | ||||
| TOTAL INVESTMENTS (120.63%) (Cost $118,809,260) | $ | 126,598,479 | ||
| Liabilities in Excess of Other Assets (-20.63%)(l) | (21,652,532 | ) | ||
| NET ASSETS (100.00%) | $ | 104,945,947 | ||
Percentages above are stated as a percentage of net assets as of April 30, 2021
Investment Abbreviations:
LIBOR - London Interbank Offered Rate
EURIBOR - Euro Interbank Offered Rate
SONIA - Sterling Over Night Index Average
BOBL - German Federal Government Bond
GILT - United Kingdom Federal Government Bond
BBSW - Bank Bill Swap Rate
SOFR - Secured Overnight Financing Rate
Reference Rates:
1M GBP L - 1 Month GBP LIBOR as of April 30, 2021 was 0.05%
3M GBP L - 3 Month GBP LIBOR as of April 30, 2021 was 0.08%
1M EUR L - 1 Month EURIBOR as of April 30, 2021 was (0.56)%
3M EUR L - 3 Month EURIBOR as of April 30, 2021 was (0.54)%
1M US L - 1 Month USD LIBOR as of April 30, 2021 was 0.11%
3M US L - 3 Month USD LIBOR as of April 30, 2021 was 0.18%
1M SONIA - 1 Month SONIA as of April 30, 2021 was 0.05%
3M SONIA - 3 Month SONIA as of April 30, 2021 was 0.05%
1M BBSW - 1 Month BBSW as of April 30, 2021 was 0.02%
30D US SOFR - 30 Day US SOFR as of April 30, 2021 was 0.01%
| (a) | The maturity date for credit investments represents the expected maturity. Many of the instruments are callable through cash flows on the underlying or other call features. Expected maturity may be earlier than legal maturity. |
| (b) | Securities not registered under the Securities Act of 1933, as amended (the "Securities Act"). These securities generally involve certain transfer restrictions and may be sold in the ordinary course of business in transactions exempt from registration. As of April 30, 2021, the aggregate market value of those securities was $57,233,332, representing 54.54% of net assets. |
| See Notes to Consolidated Financial Statements. | |
| 12 | www.1wscapital.com |
| 1WS Credit Income Fund | Consolidated Schedule of Investments |
| April 30, 2021 (Unaudited) |
| (c) | Floating or variable rate security. The Reference Rate is described above. Interest rate shown reflects the rate in effect at April 30, 2021. For securities based on a published reference rate and spread, the reference rate and spread are indicated in the description above. Certain variable rate securities are not based on a published reference rate and spread but are determined by the issuer or agent and are based on current market conditions. These securities do not indicate a reference rate and spread in their description above. |
| (d) | Interest only security. |
| (e) | On April 30, 2021, all or a portion of these securities were pledged as collateral for reverse repurchase agreements in the amount of $36,408,295. |
| (f) | Step bond. Coupon changes periodically based upon a predetermined schedule. Interest rate disclosed is that which is in effect at April 30, 2021. |
| (g) | Security principal paid in full; the value of the security at April 30, 2021 is expected to be received from the liquidation of the security's trust. |
| (h) | The level 3 assets were a result of unavailable quoted prices from an active market or the unavailability of other significant observable inputs. |
| (i) | This security is a residual or equity position that does not have a stated interest rate. This residual or equity position is entitled to recurring distributions which are generally equal to the remaining cash flow of payments made by underlying securities less contractual payments to debt holders and fund expenses. |
| (j) | Security is in default as of April 30, 2021, and is therefore non-income producing. (k) Perpetual maturity. (l) Includes cash being held as collateral for derivatives and reverse repurchase agreements. |
DERIVATIVE INSTRUMENTS
FUTURES CONTRACTS
| Description | Counterparty | Position | Contracts | Expiration Date | Notional Value | Value and Unrealized Appreciation/ (Depreciation) | ||||||||||
| 10-YEAR U.S. TREASURY NOTES FUTURES | Wells Fargo Securities, LLC | Short | 9 | June 2021 | $ | (1,188,281 | ) | $ | 17,437 | |||||||
| 2-YEAR U.S. TREASURY NOTES FUTURES | Wells Fargo Securities, LLC | Short | 5 | June 2021 | (1,103,789 | ) | (75 | ) | ||||||||
| 5-YEAR U.S. TREASURY NOTES FUTURES | Wells Fargo Securities, LLC | Short | 336 | June 2021 | (41,643,000 | ) | 256,650 | |||||||||
| AUD/USD CURRENCY FUTURES | Wells Fargo Securities, LLC | Short | 15 | June 2021 | (1,155,900 | ) | (4,223 | ) | ||||||||
| EUR/USD CURRENCY FUTURES | Wells Fargo Securities, LLC | Short | 51 | June 2021 | (7,670,719 | ) | (74,680 | ) | ||||||||
| EURO BOBL FUTURES | Wells Fargo Securities, LLC | Short | 3 | June 2021 | (485,940 | ) | 841 | |||||||||
| GBP/USD CURRENCY FUTURES | Wells Fargo Securities, LLC | Short | 128 | June 2021 | (11,048,800 | ) | 75,679 | |||||||||
| LONG GILT FUTURES | Wells Fargo Securities, LLC | Short | 1 | June 2021 | (176,318 | ) | 1,688 | |||||||||
| $ | (64,472,747 | ) | $ | 273,317 | ||||||||||||
| See Notes to Consolidated Financial Statements. | |
| Semi-Annual Report | April 30, 2021 | 13 |
| 1WS Credit Income Fund | Consolidated Schedule of Investments |
| April 30, 2021 (Unaudited) |
CREDIT DEFAULT SWAP CONTRACTS - SELL PROTECTION (OVER THE COUNTER)(a)
| Reference Obligations | Counterparty | Fixed Deal Receive Rate | Currency | Maturity Date | Implied Credit Spread at April 30, 2021(b) | Notional Amount(c) | Value | Upfront Premiums Received/(Paid) | Unrealized Appreciation/ (Depreciation) | |||||||||||||||||||||||
| The Markit CDX High Yield Series 33 Index Tranche 15-25 | Morgan Stanley | 5.00 | % | USD | 6/20/24 | 2.09 | % | 5,000,000 | $ | (107,900 | ) | $ | 125,000 | $ | 17,100 | |||||||||||||||||
| $ | (107,900 | ) | $ | 125,000 | $ | 17,100 | ||||||||||||||||||||||||||
Credit default swaps pay quarterly.
| (a) | If the Fund is a seller of protection and a credit event occurs, as defined under the terms of that particular swap agreement, the Fund will either (i) pay to the buyer of protection an amount equal to the notional amount of the swap and take delivery of the referenced obligation or underlying securities comprising the referenced index or (ii) pay a net settlement amount in the form of cash or securities equal to the notional amount of the swap less the recovery value of the referenced obligation or underlying securities comprising the referenced index. |
| (b) | Implied credit spreads, represented in absolute terms, utilized in determining the market value of credit default swap agreements as of period end serve as an indicator of the current status of the payment/performance risk and represent the likelihood or risk of default for the credit derivative. The implied credit spread of a particular referenced entity reflects the cost of buying/selling protection and may include upfront payments required to be made to enter into the agreement. Wider credit spreads represent a deterioration of the referenced entity’s credit soundness and a greater likelihood or risk of default or other credit event occurring as defined under the terms of the agreement. |
| (c) | The maximum potential amount the Fund could be required to pay as a seller of credit protection or receive as a buyer of credit protection if a credit event occurs as defined under the terms of that particular swap agreement. |
| See Notes to Consolidated Financial Statements. | |
| 14 | www.1wscapital.com |
| 1WS Credit Income Fund | Consolidated Statement of Assets and Liabilities |
| April 30, 2021 (Unaudited) |
| ASSETS: | ||||
| Investments, at fair value (Cost $118,809,260) | $ | 126,598,479 | ||
| Cash | 812,054 | |||
| Foreign Currency, at value (Cost $2,281,624) | 2,302,071 | |||
| Unrealized appreciation on credit default swap contracts | 17,100 | |||
| Receivable on credit default swap contracts | 27,778 | |||
| Variation margin receivable | 173,892 | |||
| Receivable for investment securities sold | 1,003,728 | |||
| Interest receivable | 242,366 | |||
| Capital shares sold receivable | 409,225 | |||
| Deposits held with brokers for derivatives and reverse repurchase agreements | 1,360,628 | |||
| Prepaid expenses and other assets | 20,544 | |||
| Total Assets | 132,967,865 | |||
| LIABILITIES: | ||||
| Payable for swap contracts premiums | 125,000 | |||
| Payable for investment securities purchased | 2,793,036 | |||
| Payable for reverse repurchase agreements, including accrued interest of $25,608 | 24,713,168 | |||
| Variation margin payable on futures contracts | 13,891 | |||
| Net payable to Adviser | 102,582 | |||
| Accrued fund accounting, administration and compliance fees payable | 84,328 | |||
| Other payables and accrued expenses | 189,913 | |||
| Total Liabilities | 28,021,918 | |||
| Net Assets Attributable to Shareholders | $ | 104,945,947 | ||
| COMPOSITION OF NET ASSETS ATTRIBUTABLE TO SHARES: | ||||
| Paid-in capital | $ | 98,234,008 | ||
| Total distributable earnings | 6,711,939 | |||
| Net Assets Attributable to Shareholders | $ | 104,945,947 | ||
| NET ASSET VALUE | ||||
| Class I: | ||||
| Net assets | $ | 104,945,947 | ||
| Shares outstanding (unlimited shares authorized, par value $0.001 per share) | 4,994,603 | |||
| Net Asset Value per Share | $ | 21.01 | ||
| See Notes to Consolidated Financial Statements. | |
| Semi-Annual Report | April 30, 2021 | 15 |
| 1WS Credit Income Fund | Consolidated Statement of Operations |
| For the Six Months Ended April 30, 2021 (Unaudited) | ||||
| INVESTMENT INCOME: | ||||
| Dividends on short term money market funds | $ | 25,668 | ||
| Interest | 3,050,676 | |||
| Total Investment Income | 3,076,344 | |||
| EXPENSES: | ||||
| Investment advisory fee | 989,038 | |||
| Fund Accounting and Administration fees | 212,135 | |||
| Compliance fees | 17,380 | |||
| Legal fees | 46,118 | |||
| Audit fees | 70,083 | |||
| Trustees' fees and expenses | 35,337 | |||
| Transfer agent fees | 120,362 | |||
| Interest on reverse repurchase agreements | 283,058 | |||
| Other expenses | 75,725 | |||
| Total Expenses | 1,849,236 | |||
| Less expenses reimbursed by Adviser (See Note 4) | (247,474 | ) | ||
| Less advisory fees waived (See Note 4) | (164,840 | ) | ||
| Net Expenses | 1,436,922 | |||
| Net Investment Income | 1,639,422 | |||
| REALIZED AND UNREALIZED GAIN/(LOSS) ON INVESTMENTS: | ||||
| Net realized gain/(loss) on: | ||||
| Investment securities | 1,437,434 | |||
| Credit default swap contracts | 922,721 | |||
| Futures contracts | (20,540 | ) | ||
| Foreign currency transactions | 205,793 | |||
| Net realized gain: | 2,545,408 | |||
| Change in unrealized appreciation/(depreciation) on: | ||||
| Investment securities | 6,010,427 | |||
| Credit default swap contracts | 833,119 | |||
| Futures contracts | 140,401 | |||
| Foreign currency transactions | 22,349 | |||
| Net unrealized gain: | 7,006,296 | |||
| Net Realized and Unrealized Gain on Investments | 9,551,704 | |||
| Net Increase in Net Assets Attributable to Shares from Operations | $ | 11,191,126 | ||
| See Notes to Consolidated Financial Statements. | |
| 16 | www.1wscapital.com |
| 1WS Credit Income Fund | Consolidated Statement of Changes in Net Assets |
| For the Six Months Ended April 30, 2021 (Unaudited) | For the Year Ended October 31, 2020 | |||||||
| FROM OPERATIONS: | ||||||||
| Net investment income | $ | 1,639,422 | $ | 2,460,999 | ||||
| Net realized gain/(loss) | 2,545,408 | (911,745 | ) | |||||
| Net change in unrealized appreciation/(depreciation) | 7,006,296 | (1,166,501 | ) | |||||
| Net Increase in Net Assets Attributable to Shares from Operations | 11,191,126 | 382,753 | ||||||
| DISTRIBUTIONS TO SHAREHOLDERS: | ||||||||
| From distributable earnings | (2,909,644 | ) | (3,224,132 | ) | ||||
| From tax return of capital | – | (1,857,223 | ) | |||||
| Net Decrease in Net Assets from Distributions to Shareholders | (2,909,644 | ) | (5,081,355 | ) | ||||
| Proceeds from sale of shares | 19,749,337 | 21,586,975 | ||||||
| Cost of shares redeemed | (10,151,557 | ) | (3,951,238 | ) | ||||
| Net asset value of shares issued to shareholders from reinvestment of dividends | 275,516 | 252,408 | ||||||
| Net Increase from Capital Share Transactions | 9,873,296 | 17,888,145 | ||||||
| Net Increase in Net Assets | 18,154,778 | 13,189,543 | ||||||
| NET ASSETS: | ||||||||
| Beginning of year/period | 86,791,169 | 73,601,626 | ||||||
| End of year/period | $ | 104,945,947 | $ | 86,791,169 | ||||
| OTHER INFORMATION: | ||||||||
| Capital Share Transactions: | ||||||||
| Beginning shares | 4,516,582 | 3,611,972 | ||||||
| Shares sold | 956,571 | 1,109,418 | ||||||
| Shares issued as reinvestment of dividends | 13,433 | 13,557 | ||||||
| Shares redeemed | (491,983 | ) | (218,365 | ) | ||||
| Ending Shares | 4,994,603 | 4,516,582 | ||||||
| See Notes to Consolidated Financial Statements. | |
| Semi-Annual Report | April 30, 2021 | 17 |
| 1WS Credit Income Fund | Consolidated Statement of Cash Flows |
| For the Six Months Ended April 30, 2021 (Unaudited) |
| CASH FLOWS FROM OPERATING ACTIVITIES: | ||||
| Net increase in net assets from operations | $ | 11,191,126 | ||
| Adjustments to reconcile net increase/(decrease) in net assets from operations to net cash provided by (used in) operating activities: | ||||
| Purchases of investment securities | (53,729,156 | ) | ||
| Proceeds from disposition of investment securities | 53,557,590 | |||
| Discounts (accreted)/premiums amortized | 200,054 | |||
| Net realized (gain)/loss on: | ||||
| Investment securities | (1,437,434 | ) | ||
| Credit default swap contracts | (922,721 | ) | ||
| Net change in unrealized (appreciation)/depreciation on: | ||||
| Investment securities | (6,010,427 | ) | ||
| Credit default swap contracts | (833,119 | ) | ||
| Net purchase of short-term investments | (582,400 | ) | ||
| (Increase)/Decrease in assets: | ||||
| Receivable due from advisor | – | |||
| Variation margin receivable | (151,054 | ) | ||
| Interest receivable | (16,719 | ) | ||
| Receivable on credit default swap contracts | 2,153 | |||
| Prepaid offering costs | – | |||
| Prepaid expenses and other assets | (7,272 | ) | ||
| Increase/(Decrease) in liabilities: | ||||
| Variation margin payable on futures contracts | 13,891 | |||
| Payable for swap contracts premiums | (980,659 | ) | ||
| Net payable to adviser | 56,022 | |||
| Accrued fund accounting and administration fees payable | 30,453 | |||
| Interest payable on reverse repurchase agreements | (26,990 | ) | ||
| Other payables and accrued expenses | 20,366 | |||
| Net Cash Provided by Operating Activities | $ | 373,704 | ||
| CASH FLOWS FROM FINANCING ACTIVITIES: | ||||
| Cash payments from reverse repurchase agreements | $ | 135,332,360 | ||
| Cash payments for reverse repurchase agreements | (142,739,360 | ) | ||
| Proceeds from shares sold | 19,345,412 | |||
| Cost of shared redeemed | (10,151,557 | ) | ||
| Distributions paid to shareholders | (2,634,128 | ) | ||
| Net Cash Used in Financing Activities | $ | (847,273 | ) | |
| Effect of exchange rates on cash | $ | 21,910 | ||
| Net Decrease in Cash, Restricted Cash and Foreign Rates on Cash | $ | (451,659 | ) | |
| Cash and restricted cash, beginning balance | $ | 4,926,412 | ||
| Cash and restricted cash, ending balance | $ | 4,474,753 | ||
| SUPPLEMENTAL DISCLOSURE OF CASH FLOW INFORMATION: | ||||
| Cash paid on interest expense on reverse repurchase agreements | $ | 310,048 | ||
| Reinvestment of distributions | $ | 275,516 | ||
| See Notes to Consolidated Financial Statements. | |
| 18 | www.1wscapital.com |
| 1WS Credit Income Fund | Consolidated Statement of Cash Flows |
| For the Six Months Ended April 30, 2021 (Unaudited) |
THE FOLLOWING TABLE PROVIDES A RECONCILIATION OF RESTRICTED CASH AND UNRESTRICTED CASH AND FOREIGN CURRENCY WITHIN THE CONSOLIDATED STATEMENT OF ASSETS AND LIABILITIES
| April 30, 2021 | October 31, 2020 | |||||||
| Unrestricted cash and foreign currency | $ | 3,114,125 | $ | 2,084,475 | ||||
| Restricted cash within Deposits with brokers for derivatives and reverse repurchase agreements | $ | 1,360,628 | $ | 2,841,937 | ||||
| Unrestricted Cash and Restricted Cash(a) | $ | 4,474,753 | $ | 4,926,412 | ||||
| (a) | Unrestricted cash and restricted cash as of April 30, 2021 includes $927,574 of margin posted as collateral on futures contracts and $433,054 of margin posted as collateral on credit default contracts. Unrestricted cash and restricted cash as of October 31, 2020 includes $738,952 of margin posted as collateral on futures contracts, and $2,102,985 of margin posted as collateral on credit default contracts. All collateral is considered to be restricted cash, which is included in Deposits held with brokers for derivatives and reverse repurchase agreements on the Consolidated Statement of Assets and Liabilities. |
| See Notes to Consolidated Financial Statements. | |
| Semi-Annual Report | April 30, 2021 | 19 |
| 1WS Credit Income Fund | Consolidated Financial Highlights |
| For a Share Outstanding Throughout the Period Presented |
| For the Six Months Ended April 30, 2021 (Unaudited) | For the Year Ended October 31, 2020 | For the Period March 4, 2019 (Commencement of Operations) to October 31, 2019 | ||||||||||
| PER SHARE OPERATING PERFORMANCE: | ||||||||||||
| Net asset value - beginning of period | $ | 19.22 | $ | 20.38 | $ | 20.00 | ||||||
| INCOME/(LOSS) FROM INVESTMENT OPERATIONS: | ||||||||||||
| Net investment income(a) | 0.34 | 0.59 | 0.35 | |||||||||
| Net realized and unrealized gain/(loss) on investments | 2.05 | (0.55 | ) | 0.63 | ||||||||
| Total Income from Investment Operations | 2.39 | 0.04 | 0.98 | |||||||||
| DISTRIBUTIONS TO SHAREHOLDERS: | ||||||||||||
| From net investment income | (0.60 | ) | (0.77 | ) | (0.60 | ) | ||||||
| From tax return of capital | – | (0.43 | ) | – | ||||||||
| Total Distributions to Shareholders | (0.60 | ) | (1.20 | ) | (0.60 | ) | ||||||
| Net asset value per share - end of period | $ | 21.01 | $ | 19.22 | $ | 20.38 | ||||||
| Total Investment Return - Net Asset Value(b) | 12.55 | % | 0.53 | % | 4.92 | % | ||||||
| RATIOS AND SUPPLEMENTAL DATA: | ||||||||||||
| Net assets attributable to shares, end of period (000s) | $ | 104,946 | $ | 86,791 | $ | 73,602 | ||||||
| Ratio of actual expenses to average net assets including fee waivers and reimbursements | 2.96 | %(c) | 2.55 | % | 1.52 | %(c) | ||||||
| Ratio of actual expenses to average net assets excluding fee waivers and reimbursements | 3.81 | %(c) | 4.02 | % | 4.11 | %(c)(d) | ||||||
| Ratio of net investment income to average net assets | 3.27 | %(c) | 3.07 | % | 2.57 | %(c) | ||||||
| Portfolio turnover rate | 46.78 | %(e) | 79.44 | % | 25.84 | %(e) | ||||||
| (a) | Calculated using average shares outstanding. |
| (b) | Total investment return is calculated assuming a purchase of a share at the opening on the first day and a sale at closing on the last day of the period reported. Dividends and distributions are assumed for purposes of this calculation to be reinvested at prices obtained under the Fund's dividend reinvestment plan. Total investment return does not reflect brokerage commissions, if any, and are not annualized. |
| (c) | These ratios to average net assets have been annualized. |
| (d) | These ratios to average net assets have been annualized except the non-recurring organizational expenses which have not been annualized. |
| (e) | Percentage represents the results for the period and is not annualized. |
| See Notes to Consolidated Financial Statements. | |
| 20 | www.1wscapital.com |
| 1WS Credit Income Fund | Notes to Consolidated Financial Statements |
| April 30, 2021 (Unaudited) |
NOTE 1. ORGANIZATION
1WS Credit Income Fund (“1WS Credit” or the “Fund”) is a Delaware statutory trust registered under the Investment Company Act of 1940, as amended (the “1940 Act”), as a non-diversified, closed-end management investment company that continuously offers its shares of beneficial interest (‘‘Shares’’). 1WS Credit operates as an interval fund under Rule 23c-3 of the 1940 Act and, as such, has adopted a policy to make quarterly repurchase offers at a price equal to net asset value (‘‘NAV’’) per Share of at least 5% of outstanding Shares.
1WS Credit’s investment objective is to seek attractive risk-adjusted total returns through generating income and capital appreciation. 1WS Credit will seek to achieve its investment objective by investing primarily in a wide array of structured credit and securitized debt instruments. There can be no assurance that the Fund’s investment objective will be achieved.
1WS Credit was organized as a Delaware statutory trust on July 20, 2018 pursuant to an Agreement and Declaration of Trust governed by the laws of the State of Delaware. 1WS Credit had no operations from that date to March 4, 2019, commencement of operations, other than those related to organizational matters and the registration of its Shares under applicable securities laws. 1WS Credit wholly owns and consolidates 1WSCI Sub I, LLC (the “Cayman Islands SPV”), an exempted company incorporated in the Cayman Islands on February 22, 2019. The Cayman Islands SPV is an investment vehicle formed to make certain investments on behalf of 1WS Credit. 1WS Credit is the managing and sole member of the Cayman Islands SPV pursuant to a limited liability agreement dated March 1, 2019. Where context requires, the “Fund” includes both the Fund and the Cayman Island SPV.
1WS Capital Advisors, LLC (the “Adviser” or “1WS”) serves as the investment adviser of the Fund. 1WS is a Delaware limited liability company that is registered as an investment adviser with the Securities and Exchange Commission (the ‘‘SEC’’) under the Investment Advisers Act of 1940 (the “Advisers Act”). The Adviser is controlled by its managing member, One William Street Capital Management, L.P. (“OWS”), which is also registered with the SEC as an investment adviser. The Fund’s portfolio manager and other personnel of the Adviser have substantial experience in managing investments and investment funds, including funds which have investment programs similar to that of the Fund.
Institutional Class (“Class I”) Shares (which are not subject to any sales load or asset-based distribution fee) of the Fund are being offered on a continuous basis at the NAV per Share calculated each day. The Fund received exemptive relief from the SEC to issue multiple classes of Shares and to impose asset-based distribution fees as applicable. For the period ended April 30, 2021, only the Class I Shares were offered.
NOTE 2. SIGNIFICANT ACCOUNTING POLICIES
Basis of Presentation: The accompanying consolidated financial statements are prepared in accordance with accounting principles generally accepted in the United States of America (“GAAP”) and are stated in United States dollars. The Fund is considered an investment company under GAAP and follows the accounting and reporting guidance for investment companies under Financial Accounting Standards Board’s (“FASB”) Accounting Standards Codification (“ASC”) 946, Financial Services-Investment Companies, including accounting for investments at fair value.
The preparation of these consolidated financial statements in accordance with GAAP requires management to make certain estimates and assumptions that affect the amounts reported in the consolidated financial statement and accompanying notes. The Adviser believes that the estimates utilized in preparing the financial statements are reasonable and prudent; however, actual results could differ from such estimates and the differences could be material.
Consolidation: 1WS Credit consolidates its investment in the Cayman Islands SPV because 1WS Credit is the sole shareholder of this entity. In accordance with ASC 810, Consolidation, the accompanying consolidated financial statements include the Cayman Islands SPV’s assets and liabilities and results of operations. All investments held by the Cayman Islands SPV are disclosed in the Consolidated Schedule of Investments. All intercompany accounts and transactions have been eliminated upon consolidation.
Investment Transactions: Investment transactions are accounted for on a trade-date basis for financial reporting purposes and amounts payable or receivable for trades not settled at the time of period end are reflected as liabilities and assets, respectively. Interest is recorded on an accrual basis. Realized gains and losses on investment transactions reflected in the consolidated statement of operations are recorded on a first-in, first-out basis. Premiums on fixed-income securities and discounts on non-distressed fixed-income securities are amortized and recorded within interest income in the consolidated statement of operations.
The Fund may enter into derivative contracts for hedging purposes or to gain synthetic exposures to certain investments (“Derivatives”). Derivatives are financial instruments whose values are based on an underlying asset, index, or reference rate and include futures, swaps, swaptions, options, or other financial instruments with similar characteristics.
| Semi-Annual Report | April 30, 2021 | 21 |
| 1WS Credit Income Fund | Notes to Consolidated Financial Statements |
| April 30, 2021 (Unaudited) |
The Board of Trustees (the “Board”) has adopted valuation policies and procedures for the Fund and has delegated the day-to-day responsibility for fair value determinations to the Adviser and the Administrator (defined below). The Fund’s valuation committee (the “Valuation Committee”) (comprised of officers of the Adviser and established pursuant to the policies and procedures adopted by the Board) has the day-to-day responsibility for overseeing the implementation of the Fund’s valuation policies and procedures and fair value determinations (subject to review and ratification by the Board).
Fund Valuation: Institutional Class Shares are offered at NAV. NAV per Share is determined daily. The Fund’s NAV per share is calculated by subtracting liabilities (including accrued expenses and indebtedness) from the total assets of the Fund (the value of the investments plus cash or other assets, including interest accrued but not yet received) and dividing the result by the total number of Shares outstanding at each day's end.
NOTE 3. PORTFOLIO VALUATION:
ASC 820 Fair Value Measurement defines fair value as an exit price representing the amount that would be received to sell an asset or paid to transfer a liability in an orderly transaction between market participants. ASC 820 establishes a fair value hierarchy for inputs used in measuring fair value and maximizes the use of observable inputs and minimizes the use of unobservable inputs by prioritizing the use of the most observable input when available.
Valuation inputs broadly refer to the assumptions market participants would use in pricing the asset or liability, including assumptions about risk. ASC 820 distinguishes between: (i) observable inputs, which are based on market data obtained from parties independent of the reporting entity, and (ii) unobservable inputs, which reflect the Adviser’s own assumptions about the judgments market participants would use. A financial instrument’s level within the fair value hierarchy is based on the lowest level of any input that is deemed significant to the fair value measurement. When a valuation uses multiple inputs from varying levels of the fair value hierarchy, the hierarchy level is determined based on the lowest level input that is significant to the fair value measurement in its entirety.
| Level 1— | Inputs that are unadjusted, quoted prices in active markets for identical assets or liabilities. |
| Level 2— | Inputs (other than quoted prices included in Level 1) that are observable, either directly or indirectly. |
| Level 3— | Inputs that are unobservable and reflect the Adviser’s best estimate of what market participants would use in pricing the asset or liability. This includes situations where there is little, if any, market activity for the asset or liability. |
Generally, the Fund expects to be able to obtain pricing from independent third-party sources on many of its investments. However, in certain circumstances where such inputs are difficult or impractical to obtain or such inputs are deemed unreliable, we may fair value certain investments using internal manager marks. As of April 30, 2021, no investments held by the Fund were valued using internal manager marks.
The following factors may be pertinent in determining fair value: security covenants, call protection provisions and information rights; cash flows, the nature and realizable value of any collateral; the debt instrument's ability to make payments; the principal markets and financial environment in which the debt instrument operates; publicly available financial ratios of peer companies; changes in interest rates for similar debt instruments; and enterprise values, among other relevant factors.
Determination of fair value involves subjective judgments and estimates not susceptible to substantiation by auditing procedures. Due to the inherent uncertainty of determining the fair value of investments that do not have readily available market quotations, the fair value of these investments may differ significantly from the values that would have been used had such market quotations existed for such investments, and any such differences could be material. Accordingly, under current accounting standards, the notes to the Fund’s consolidated financial statements will refer to the uncertainty with respect to the possible effect of such valuations, and any change in such valuations, on the Fund’s financial statements.
| 22 | www.1wscapital.com |
| 1WS Credit Income Fund | Notes to Consolidated Financial Statements |
| April 30, 2021 (Unaudited) |
The following tables summarize the Fund’s financial instruments classified as assets and liabilities measured at fair value by level within the fair value hierarchy as of April 30, 2021:
| Investments in Securities at Value | Level 1 | Level 2 | Level 3 | Total | ||||||||||||
| Residential Mortgage-Backed Securities | $ | – | $ | 41,660,281 | $ | – | $ | 41,660,281 | ||||||||
| Commercial Mortgage-Backed Securities | – | 15,149,484 | – | 15,149,484 | ||||||||||||
| Asset-Backed Securities | – | 34,604,919 | 4,074,226 | 38,679,145 | ||||||||||||
| Collateralized Loan Obligations | – | 17,190,061 | 903,139 | 18,093,200 | ||||||||||||
| Preferred Stocks | 630,474 | – | – | 630,474 | ||||||||||||
| Money Market Funds | 12,435,895 | – | – | 12,435,895 | ||||||||||||
| Total | $ | 13,066,369 | $ | 108,604,745 | $ | 4,977,365 | $ | 126,648,479 | ||||||||
| Derivative Instruments | ||||||||||||||||
| Assets: | ||||||||||||||||
| Future Contracts | $ | 352,295 | $ | – | $ | – | $ | 352,295 | ||||||||
| Credit Default Swap Contracts | – | 17,100 | – | 17,100 | ||||||||||||
| Liabilities: | ||||||||||||||||
| Future Contracts | $ | (78,978 | ) | – | – | (78,978 | ) | |||||||||
| Total | $ | 273,317 | $ | 17,100 | $ | – | $ | 290,417 | ||||||||
There were no changes in valuation technique. Collateralized Loan Obligation Securities that represent the residual, first loss tranches were transferred from Level 2 to Level 3 as they are generally thinly traded.
The following table discloses the purchase of Level 3 portfolio investments as well as the value of transfers into or out of Level 3 for the period ended April 30, 2021 of the Fund’s Level 3 portfolio investments:
| Asset-Backed Securities | Collateralized Loan Obligations | Total | ||||||||||
| Balance as of October 31, 2020 | $ | 2,018,243 | $ | – | $ | 2,018,243 | ||||||
| Accrued discount/ premium | (191,109 | ) | – | (191,109 | ) | |||||||
| Realized Gain/(Loss) | – | – | – | |||||||||
| Change in Unrealized Appreciation/(Depreciation) | (441,153 | ) | – | (441,153 | ) | |||||||
| Purchases | 2,688,245 | – | 2,688,245 | |||||||||
| Transfer into Level 3 | – | 903,139 | 903,139 | |||||||||
| Transfer out of Level 3 | – | – | – | |||||||||
| Balance as of April 30, 2021 | $ | 4,074,226 | $ | 903,139 | $ | 4,977,365 | ||||||
| Net change in unrealized appreciation/(depreciation) attributable to Level 3 investments held at April 30, 2021 | $ | (441,153 | ) | $ | 105,588 | $ | (335,565 | ) | ||||
The following table presents additional information about the valuation methodologies and inputs used for investments that are measured at fair value and categorized within Level 3 as of April 30, 2021:
Quantitative Information about Level 3 Fair Value Measurements
| Asset Class | Fair Value | Valuation Technique | Unobservable Inputs | Value/Range |
| Asset-Backed Securities | $4,074,226 | Broker pricing | Indicative quote | $1,926.31-$5,605.26 (1) |
| Collateralized Loan Obligations | $903,139 | Broker pricing | Indicative quote | $20.13- $53 |
| (1) | Input is based on the total market value of the outstanding loan, of which the Fund owns between 1-10%. |
Federal Income Taxes: The Fund has elected to be treated as a regulated investment company under the Internal Revenue Code of 1986, as amended (the ‘‘Code’’). The Fund intends to elect to be treated for federal income tax purposes, and intends to qualify annually, as a regulated investment company (a ‘‘RIC’’) under Subchapter M of the Internal Revenue Code (the ‘‘Code’’). As a RIC, the Fund generally will not have to pay Fund-level federal income taxes on any ordinary income or capital gains that the Fund distributes to shareholders from our tax earnings and profits.
| Semi-Annual Report | April 30, 2021 | 23 |
| 1WS Credit Income Fund | Notes to Consolidated Financial Statements |
| April 30, 2021 (Unaudited) |
For the period ended April 30, 2021, the Fund did not have a tax liability. The Fund files U.S. federal, state, and local tax returns as required. The Fund’s tax returns are subject to examination by the relevant tax authorities until expiration of the applicable statute of limitations which is generally three years after the filing of the tax return for federal purposes and four years for most state returns.
Distributions to Shareholders: The Fund intends to declare and pay substantially all of its net investment income to shareholders in the form of dividends on a quarterly basis. The Fund also intends to distribute substantially all net realized capital gains at least annually.
NOTE 4. FEES AND EXPENSES
Investment Advisory: Under an investment advisory agreement between the Fund and the Adviser (the “Advisory Agreement”), the Fund pays the Adviser a fee at the annualized rate of 1.50% of the daily gross assets of the Fund (the “Management Fee”). For the one-year period beginning on March 1, 2021, the Adviser has voluntarily agreed to reduce the Management Fee to 1.25% of the Fund’s daily gross assets.
Expense Limitation and Reimbursement Agreement: Pursuant to an expense limitation and reimbursement agreement (the “Expense Limitation Agreement”), the Adviser agrees to waive the fees payable to it under the Investment Advisory Agreement and/or to pay or absorb operating expenses of the Fund, including, without limitation, organization and offering expenses (excluding brokerage and transactional expenses; borrowing and other investment-related costs and fees including interest and commitment fees; short dividend expense; acquired fund fees; taxes; litigation and indemnification expenses; judgments; and extraordinary expenses not incurred in the ordinary course of the Fund’s business – collectively, the “Exclusions”), to the extent necessary to limit the Other Expenses of the Institutional Class Shares of the Fund (as set forth in the Fund’s Prospectus) less the Exclusions to 0.50% per annum of the Fund’s daily gross assets. The Expense Limitation Agreement will remain in effect until March 1, 2022, unless and until the Trustees approve its modification or termination.
As of April 30, 2021, the advisor reimbursed fees under the Expense Limitation Agreement which are recoupable as follows:
| Expires October 31, 2022 | Expires October 31, 2023 | Expires October 31, 2024 |
| $789,616 | $775,982 | $247,474 |
Officer and Trustee Compensation: The Fund pays each member of the Board of Trustees who is not a director, officer, employee or affiliate of OWS a $15,000 annual retainer, $2,500 per board meeting and $1,000 for each committee meeting. The Chair of the Audit Committee and Nominating Committee each receives an additional $5,000 annual retainer. None of the executive officers receive compensation from the Fund.
Distribution and Servicing Fees: The Fund has entered into a distribution agreement (the ‘‘Distribution Agreement’’) with ALPS Distributors, Inc. (the ‘‘Distributor’’), pursuant to which the Distributor is serving as the Fund’s principal underwriter and acts as the distributor of the Fund’s Shares on a best efforts basis, subject to various conditions.
Fund Administration and Accounting Fees and Expenses: ALPS Fund Services, Inc. ("ALPS" or the "Administrator") serves as the Fund’s administrator and provides various administration, fund accounting, investor accounting and taxation services to the Fund (which are in addition to the services provided by the Adviser, as described above). In consideration of these services, the Fund pays the Administrator, on a monthly basis. The Fund will reimburse the Administrator for certain out-of-pocket expenses incurred on behalf of the Fund.
Compliance Fees: ALPS Fund Services, Inc. provides Chief Compliance Officer Services to the Fund. Additionally, ALPS provides services in monitoring and testing the policies and procedures of the Fund in conjunction with requirements under Rule 38a-1 under the 1940 Act. ALPS is compensated under the Chief Compliance Officer Services Agreement.
Legal Fees: Kramer Levin Naftalis & Frankel LLP serves as counsel to the Fund.
Audit Fees: Deloitte & Touche LLP acts as independent registered public accountant for the Fund and in such capacity audits the Fund’s annual financial statements.
Custodian: The Bank of New York Mellon serves as the Fund’s primary custodian.
Transfer Agent: DST Systems, Inc. (“DST”) serves as the Transfer Agent to the Fund. Under the Transfer Agency Agreement, DST is responsible for maintaining all shareholder records of the Fund.
| 24 | www.1wscapital.com |
| 1WS Credit Income Fund | Notes to Consolidated Financial Statements |
| April 30, 2021 (Unaudited) |
NOTE 5. SECURITIES TRANSACTIONS
Purchases and sales of investments, excluding short-term obligations and including maturities and paydowns, transacted for the period ended April 30, 2021, were as follows:
Cost of Investments Purchased | Proceeds from Investments Sold |
| $ 55,822,618 | $ 54,239,979 |
NOTE 6. INVESTMENTS
Under normal investment conditions, the Fund will invest at least 80% of its assets (including borrowings for investment purposes) in debt obligations.
The securities/instruments acquired by the Fund may include all types of debt and other obligations (‘‘Credit Investments’’), and may have varying terms with respect to collateralization, seniority or subordination, purchase price, convertibility, interest payments and maturity, and may consist of the following: (i) residential and commercial mortgage-backed securities (‘‘MBS’’), as well as real estate loans or pools of such loans; (ii) asset-backed securities (‘‘ABS’’), or other instruments secured by financial, physical, and/or intangible assets (e.g., receivables or pools of receivables), and investments in any assets/instruments underlying the foregoing structured/secured obligations; (iii) debt and equity tranches of collateralized loan obligations (‘‘CLOs’’) and collateralized debt obligations (‘‘CDOs’’); (iv) public and private senior and mezzanine, senior secured or unsecured bonds/loans; and (v) other income producing securities, including investment grade debt, debentures and notes, and deferred interest, payment-in-kind or zero coupon bonds/notes. The Fund may invest without limit in CLOs or CDOs, including the equity tranches of such vehicles.
The Fund may also invest indirectly in any of the foregoing instruments through: (i) investing in other funds, including exchange traded funds (‘‘ETFs’’) and up to 15% of its net assets in funds that are excluded from the definition of ‘‘investment company’’ under the 1940 Act solely by reason of Section 3(c)(1) or Section 3(c)(7) of the 1940 Act, that are primarily invested in Credit Investments (except that investments in MBS, ABS, CLOs or CDOs and other Credit Investments that are not hedge funds or private equity funds are not subject to such 15% limitation); or (ii) entering into derivatives, including long and short positions in credit default swaps, total return swaps, forward contracts, futures and other similar transactions. The Fund may also use derivatives for cash management purposes, to modify interest rate exposure or to hedge positions. The Fund may invest in derivatives without limit, subject to adherence to applicable asset coverage and/or segregation requirements of the 1940 Act. (The Fund counts the foregoing indirect investments in debt obligations towards the Fund’s requirement to invest at least 80% of its assets in debt obligations.)
The Fund anticipates that many Credit Investments will be rated below investment grade by rating agencies or would be rated below investment grade if they were rated. Credit Investments that are rated below investment grade (commonly referred to as ‘‘high yield’’ securities or ‘‘junk bonds’’) are regarded as having predominantly speculative characteristics with respect to the issuer’s capacity to pay interest and repay principal.
In seeking to achieve the Fund’s objective, the Fund may also invest a portion of its net assets in (i) U.S. and foreign government obligations, and highly-rated debt instruments (e.g., commercial paper); and (ii) long and short positions in public or private equity securities, which can include ETFs and real estate investment trusts.
The Fund intends to add leverage to its portfolio through direct borrowing and/or through entering into reverse repurchase agreements. Certain of the Fund’s investments may require leverage to achieve the desired risk-adjusted return profile deployed by the Fund.
At any given time, a substantial portion of our portfolio may be illiquid, subjecting the Fund to increased credit risk. If a borrower or obligor or other counterparty on an instrument underlying a Credit Investment is unable to make its payments, we may be greatly limited in our ability to recover any outstanding principal and interest (or other applicable amounts) under such Credit Investment. Our Shares therefore should be purchased only by investors who could afford a possible substantial loss of their investment. There is no geographic or currency limitation on the securities or instruments acquired by the Fund. The Fund may purchase debt or equity securities of non-U.S. governments and corporate entities domiciled outside of the United States, including emerging markets issuers.
| Semi-Annual Report | April 30, 2021 | 25 |
| 1WS Credit Income Fund | Notes to Consolidated Financial Statements |
| April 30, 2021 (Unaudited) |
NOTE 7. DERIVATIVE INSTRUMENTS
The Fund may enter into derivative transactions in connection with its investing activities. These instruments derive their value, primarily or partially, from the underlying asset, indices, reference rate, or a combination of these factors. Derivatives are subject to various risks similar to non-derivative instruments, such as interest, market, and credit risk.
The Fund is subject to interest rate exposures, both directly and indirectly. Direct interest rate exposure can result from holding fixed rate bonds, the value of which may decrease if interest rates rise. Additionally, indirect interest rate exposure can result from certain securitization transactions that contain mismatches between the rate of interest earned on the underlying loans and/or receivables as compared to the rate of interest due on the securities. To hedge this risk for cases in which the Fund deems it effective, the Fund may enter into futures contracts, interest rate swaps, other interest rate options, or securities sold, not yet purchased.
The Fund is also subject to credit risk in the normal course of pursuing its investment objectives. In addition to the specific credit risk, in particular investment securities, the Fund is exposed to broader market credit risk. To hedge this risk, the Fund may enter into a variety of instruments, including credit default swaps, futures, options, and swaptions.
The market value of derivative instruments generally may change in a manner that amplify market movements relative to the underlying asset or reference rate. As a result of adverse market movements, the Fund’s derivatives instruments could cause the Fund to suffer losses that magnify the market value changes of the underlying asset or reference rate. This use of embedded leverage allows the Fund to increase its market value exposure relative to its net assets and can substantially increase the volatility of the Fund’s performance.
Additionally, in instances where the Fund is using derivatives to hedge risk exposures held by the Fund, there are also risks that those derivatives may not perform as expected relative to the Fund positions intended to be hedged which could result in losses for the hedged positions.
Derivatives are also subject to the risk of possible regulatory changes which could adversely affect the availability and performance of derivative securities, make them more costly and limit or restrict their use by the Fund, which could prevent the Fund from implementing its investment strategies and adversely affect returns.
Futures Contracts: Futures contracts are commitments to either purchase or sell a financial instrument or commodity at a future date for a specified price. Upon entering into futures contracts, the Fund is required to deposit with the broker, either in cash or securities, an initial margin in an amount equal to a certain percentage of the contract amount. Subsequent changes in market value of the contract (which may require additional margin to be deposited) are recorded for financial statement purposes as unrealized gains or losses.
The Fund may use futures contracts to hedge against changes in the value of financial instruments or changes in interest rates. Upon entering into such futures contracts, the Fund bears the risk of interest rates or financial instruments’ prices moving adversely to the positions. With futures, counterparty risk is mitigated as these contracts are exchange-traded and the exchange’s clearinghouse guarantees against non-performance by the counterparty.
Credit Default Swaps and Credit Default Tranches: In a typical credit default swap, the Fund receives (if a buyer) or provides (if a seller) protection against certain credit events involving one or more specified reference entities. The buyer of a credit default swap is generally obligated to pay the seller a periodic stream of payments over the term of the contract in return for a contingent payment upon the occurrence of a defined credit event on the reference obligation which may be a single security, a basket of securities, or a specified credit index. The applicable credit events are established at the inception of the transaction and generally include bankruptcy, insolvency, and failure to meet payment obligations when due, among other events. After a credit event occurs, the contingent payment payable by the seller to the buyer may be mitigated or reduced by segregated collateral and netting arrangements between the counterparties to the transaction.
A credit default tranche is a type of credit default swap that allows an investor to gain exposure to a particular portion of the loss distribution on a specified credit index. Tranches are defined by attachment and detachment points that specify the range of exposure to which an investor is receiving or providing protection with respect to the specified credit index.
| 26 | www.1wscapital.com |
| 1WS Credit Income Fund | Notes to Consolidated Financial Statements |
| April 30, 2021 (Unaudited) |
The Fund may enter into credit default swaps or credit default tranches to hedge against changes in the value of, or to gain exposure to, the market, certain sectors of the market, or specific issuers. Upon the occurrence of a defined credit event, the difference between the value of the reference obligation and the swap’s notional amount is recorded as realized gain or loss. Upon entering into a credit default swap, as a seller of protection or a buyer of protection, the Fund bears exposure to changes in market pricing of risk related to the reference obligations. Additionally, the Fund is exposed to counterparty risk to the extent the fair value of the credit default swap exceeds the collateral posted. Credit default swaps are either centrally cleared swaps or executed bilaterally under standard form ISDA master agreements entered into with each counterparty.
Any upfront payments made or received upon entering into a credit default swap contract are treated as part of the cost and any fluctuations are reflected as part of the unrealized gain (loss) on valuation. Upon termination of the swap contract, the amount included in the cost is reversed and becomes part of the credit default swap’s realized gain (loss). For credit default swap contracts, the upfront payments serve as an indicator of the current status of the payment/performance risk. The fair value of a credit default swap contract represents the amount of upfront payment that would be required to enter into such swap as of a measurement date. Upfront payments vary inversely to the price of debt issued by the reference entity. Increasing fair values for credit default swap contracts, in absolute terms when compared to the notional amount of the swap, represent a deterioration of the market pricing of the reference entity’s debt.
The following is a summary of the derivative instruments fair value and the location and effect of derivative instruments held directly by the Fund for the period ended April 30, 2021:
| Consolidated Statement of Assets and Liabilities | Consolidated Statement of Operations | |||||||||||||||
| Derivative Assets Fair Value(a) | Derivative Liabilities Fair Value(a) | Net Realized Gain/ (Loss) | Net Change in Unrealized Appreciation / (Depreciation) | |||||||||||||
| Futures contracts | 352,295 | (78,978 | ) | (20,540 | ) | 140,401 | ||||||||||
| Credit default swap contracts | $ | 17,100 | $ | – | $ | 922,721 | $ | 833,119 | ||||||||
| Total derivatives | $ | 369,395 | $ | (78,978 | ) | $ | 902,181 | $ | 973,520 | |||||||
| (a) | Includes the cumulative appreciation/depreciation of futures contracts and swap contracts as reported in the Consolidated Schedule of Investments. Only the current day's variation margin receivable of $173,892 for futures is reported within the Consolidated Statement of Assets and Liabilities. Total cumulative appreciation/depreciation on futures contracts as shown on the table above is reported on the Consolidated Statement of Investments. |
The average short notional value and number of short futures contracts outstanding during the period ended April 30, 2021 was $58,825,773 and 496, respectively. The average notional value of credit default swap contracts related to the sale of protection outstanding during the period ended April 30, 2021 was $454,629.
| Semi-Annual Report | April 30, 2021 | 27 |
| 1WS Credit Income Fund | Notes to Consolidated Financial Statements |
| April 30, 2021 (Unaudited) |
Offsetting Arrangements: Certain derivative contracts and reverse repurchase agreements are executed under standardized netting agreements. A netting arrangement creates an enforceable right of set-off that becomes effective, and affects the realization of settlement on individual assets, liabilities and collateral amounts, only following a specified event of default or early termination. Default events may include the failure to make payments or deliver securities timely, material adverse changes in financial condition or insolvency, the breach of minimum regulatory capital requirements, or loss of license, charter or other legal authorization necessary to perform under the contract. These agreements mitigate counterparty credit risk by providing for a single net settlement with a counterparty of all financial transactions covered by the agreement in an event of default as defined under such agreement. Futures contracts are centrally cleared and not subject to master netting agreements, thus are not included on the tables below.
Offsetting of Derivatives and Reverse Repurchase Agreements Assets
April 30, 2021
| Gross Amounts Not Offset in the Statements of Assets and Liabilities | ||||||||||||||||||||||||
| Gross Amounts of Recognized Assets | Gross Amounts Offset in the Statements of Assets and Liabilities | Net Amounts Presented in the Statements of Assets and Liabilities | Financial Instruments(a) | Cash Collateral Received(a) | Net Amount Receivable | |||||||||||||||||||
| Credit default swap contract | $ | 17,100 | $ | – | $ | 17,100 | $ | (17,100 | ) | $ | – | $ | – | |||||||||||
| Total | $ | 17,100 | $ | – | $ | 17,100 | $ | (17,100 | ) | $ | – | $ | – | |||||||||||
Offsetting of Derivatives and Reverse Repurchase Agreements Liabilities
April 30, 2021
| Gross Amounts Not Offset in the Statements of Assets and Liabilities | ||||||||||||||||||||||||
| Gross Amounts of Recognized Liabilities | Gross Amounts Offset in the Statements of Assets and Liabilities | Net Amounts Presented in the Statements of Assets and Liabilities | Financial Instruments(a) | Cash Collateral Pledged(a) | Net Amount Payable | |||||||||||||||||||
| Reverse repurchase agreements | $ | 24,713,168 | $ | – | $ | 24,713,168 | $ | (24,713,168 | ) | $ | – | $ | – | |||||||||||
| Total | $ | 24,713,168 | $ | – | $ | 24,713,168 | $ | (24,713,168 | ) | $ | – | $ | – | |||||||||||
| (a) | These amounts are limited to the derivatives asset/liability balance and, accordingly, do not include excess collateral received/pledged. |
NOTE 8. LEVERAGE
The Fund may obtain leverage in seeking to achieve its investment objective, including obtaining financing to make investments in Credit Investments. The Fund may obtain leverage through direct borrowing and/or through entering into reverse repurchase agreements.
In a reverse repurchase agreement, the Fund delivers a security in exchange for cash to a financial institution, the counterparty, with a simultaneous agreement to repurchase the same or substantially the same security at an agreed upon price and date. Reverse repurchase agreements are generally recorded at their contractual amounts, including accrued interest, as specified in each respective agreement. Securities sold are held on terms that may permit the counterparty to sell or re-pledge the securities subject to certain limitations. Such securities sold are held as collateral and are generally valued daily by the counterparty. The Fund may be required to deliver additional collateral or may demand the counterparty to return collateral pledged, as deemed necessary to ensure that the fair value of the underlying collateral remains sufficient to cover the contractual amount. Cash received in exchange for securities delivered plus accrued interest payments to be made by the Fund to counterparties are reflected as a liability on the Consolidated Statement of Assets and Liabilities. Interest payments made by the Fund to counterparties are recorded as a component of interest expense on the Consolidated Statement of Operations. The total amount of securities pledged, or partially pledged, at April 30, 2021 was $36,408,295. During the period ended April 30, 2021, the average amount of reverse repurchase agreements outstanding was $32,477,886, at a weighted average interest rate of 1.73%.
| 28 | www.1wscapital.com |
| 1WS Credit Income Fund | Notes to Consolidated Financial Statements |
| April 30, 2021 (Unaudited) |
The following table indicates the total amount of reverse repurchased agreements, including accrued interest, reconciled to the Fund’s liability as of April 30, 2021:
Remaining contractual maturity of the agreements
| Less than 30 days | 30-90 days | Greater than 90 days | Total | |||||||||||||
| Asset-Backed Securities | $ | 267,591 | $ | 6,161,376 | $ | 2,483,575 | $ | 8,912,542 | ||||||||
| Commercial Mortgage-Backed Securities | – | 1,941,168 | 856,927 | 2,798,094 | ||||||||||||
| Residential Mortgage-Backed Securities | 360,000 | 7,801,391 | 2,377,503 | 10,538,893 | ||||||||||||
| Collateralized Loan Obligations | – | 1,783,078 | 680,559 | 2,463,638 | ||||||||||||
| Total | $ | 627,591 | $ | 17,687,012 | $ | 6,398,564 | $ | 24,713,168 | * | |||||||
| * | The total reverse repurchase agreement balance includes $24,713,168 of financing with extendable provisions that automatically renew per the terms of the respective reverse repurchase agreements. |
Leverage can have the effect of magnifying the Fund’s exposure to changes in the value of its assets and may also result in increased volatility in the Fund’s NAV. This means the Fund will have the potential for greater gains, as well as the potential for greater losses, than if the Fund owned its assets on an unleveraged basis. The value of an investment in the Fund will be more volatile and other risks tend to be compounded if and to the extent that the Fund is exposed to leverage directly or indirectly.
NOTE 9. REPURCHASE OFFERS
The Fund is an interval fund and, as such, has adopted a fundamental policy to make quarterly repurchase offers at a price equal to the NAV per Share as of the Repurchase Pricing Date (i.e., the date that will be used to determine the Fund’s NAV applicable to the repurchase offer), of between 5% and 25% of the Shares outstanding. Subject to applicable law and approval of the Board, for each quarterly repurchase offer, the Fund currently expects to offer to repurchase 5% of the Fund’s outstanding Shares at NAV, which is the minimum amount permitted. The Fund will make quarterly repurchase offers in the months of March, June, September and December. There is no guarantee that shareholders will be able to sell all of the shares they desire in a repurchase offer because shareholders, in total, may wish to sell more than the percentage of the Fund’s Shares being repurchased.
During the period ended April 30, 2021, the Fund completed two quarterly repurchase offers. In each offer, the Fund offered to repurchase no less than 5% of the number of its outstanding Shares as of the Repurchase Pricing Date. The repurchase offer dated January 15, 2021 was not oversubscribed. The repurchase offer dated April 14, 2021 was oversubscribed and the Fund repurchased shares on a pro-rata basis. Shareholders received approximately 34% of the total number of shares tendered. The result of these repurchase offers were as follows:
| Repurchase Offer #1 | Repurchase Offer #2 | |
| Repurchase Commencement Date | 12/18/2020 | 03/17/2021 |
| Repurchase Request Deadline | 01/15/2021 | 04/14/2021 |
| Repurchase Pricing Date | 01/15/2021 | 04/14/2021 |
| Repurchased Amount | $4,731,333 | $5,420,224 |
| Repurchased Shares | 232,270 | 259,714 |
NOTE 10. PRINCIPAL RISKS
In the normal course of business, the Fund invests in financial instruments and enters into financial transactions where risk of potential loss may exist from things such as changes in the market (market risk) or failure or inability of the other party to a transaction to perform (credit and counterparty risk). See below for a detailed description of select principal risks. For a more comprehensive list of potential risks the Fund may be subject to, please refer to the Fund’s Prospectus and Statement of Additional Information (“SAI”).
| Semi-Annual Report | April 30, 2021 | 29 |
| 1WS Credit Income Fund | Notes to Consolidated Financial Statements |
| April 30, 2021 (Unaudited) |
Investment and Market Risk: The Fund may invest in credit-sensitive investments. Until such investments are sold or mature, the Fund is exposed to risks, including interest rate and spread risks, as well as credit and structural risks relating to whether the cash flows from the underlying assets will be sufficient in amount and timing to make expected payments on the securities. The Adviser monitors the risk parameters and expected volatility of the Fund’s overall portfolio and attempts to manage concentrations of the portfolio in any particular investment holding, strategy, or market. Additionally, the Adviser seeks to control portfolio risks through selective sizing of positions based on a regular evaluation of each investment’s risk and reward characteristics. Regular mark-to-market portfolio monitoring helps the Adviser monitor the investments. The Adviser has also developed a proprietary risk management system and uses statistical and cash flow models to monitor portfolio risk, as well as individual position specific risk.
While the Adviser generally seeks to hedge certain portfolio risks, the Adviser will not, in general, attempt to hedge all market, interest rate or other risks in the portfolio, and it may elect to only partially hedge certain risks. Specifically, the Adviser may determine that it is economically unattractive, or otherwise undesirable, to hedge certain risks and instead may rely on diversification to offset such risks.
Repurchase Offers Risk: An investment in the Fund is suitable only for long-term investors who can bear the risks associated with the limited liquidity of the Shares. The Fund is an “interval fund” and, in order to provide liquidity to shareholders, the Fund, subject to applicable law, will conduct repurchase offers of the Fund’s outstanding Shares at NAV, subject to approval of the Board. The Fund believes that these repurchase offers are generally beneficial to the Fund’s shareholders, and repurchases generally will be funded from available cash, cash from the sale of Shares or sales of portfolio securities. However, repurchase offers and the need to fund repurchase obligations may affect the ability of the Fund to be fully invested or force the Fund to maintain a higher percentage of its assets in liquid investments, which may harm the Fund’s investment performance. Moreover, diminution in the size of the Fund through repurchases may result in untimely sales of portfolio securities (with associated imputed transaction costs, which may be significant), and may limit the ability of the Fund to participate in new investment opportunities or to achieve its investment objective. The Fund may accumulate cash by holding back (i.e., not reinvesting) payments received in connection with the Fund’s investments and cash from the sale of Shares. The Fund believes that it can meet the maximum potential amount of the Fund’s repurchase obligations. If at any time cash and other liquid assets held by the Fund are not sufficient to meet the Fund’s repurchase obligations, the Fund intends, if necessary, to sell investments. In addition, if the Fund borrows to finance repurchases, interest on that borrowing will negatively affect shareholders who do not tender their Shares by increasing the Fund’s expenses and reducing any net investment income.
Leverage Risk: Under current market conditions, the Fund may utilize leverage in an amount up to 33⅓% of the Fund’s total assets principally through outstanding senior securities representing indebtedness (“Borrowings”). The Fund may obtain leverage through direct borrowing and/or through entering into reverse repurchase agreements that create leverage. Reverse repurchase agreements are agreements in which a Fund sells a security to a counterparty, such as a bank or broker-dealer, in return for cash and agrees to repurchase that security at a mutually agreed upon price and time. Reverse repurchase agreements carry the risk that the market value of the security sold by the Fund may decline in value, requiring the Fund to post the additional collateral or to repurchase the security. Reverse repurchase agreements also may be viewed as a form of borrowing, and borrowed assets used for investment creates leverage risk. Leverage can create an interest expense that may lower the Fund’s overall returns. Leverage presents the opportunity for increased net income and capital gains, but may also exaggerate the Fund’s volatility and risk of loss. In connection with the Fund’s investments in reverse repurchase agreements, the Fund will segregate or designate cash or other liquid assets in accordance with its policies and procedures. Such segregation or designation will not limit a Fund’s exposure to losses.
Counterparty Credit Risk: The Fund attempts to control credit risk exposure to trading counterparties and brokers through internal monitoring procedures. A significant portion of the Fund’s positions, including cash, are held at major financial institutions. All security transactions of the Fund are transacted with approved brokers and cleared through major securities firms. In the event the brokers are unable to fulfill their obligations, the Fund could be subject to credit risk.
A primary difference in risks associated with bilateral OTC contracts and exchange-traded contracts/centrally cleared swaps involves the nature of credit and liquidity risks. Unlike exchange-traded instruments or centrally cleared swaps, in which performance may be backed by the exchange or clearing corporation, bilateral OTC contracts require the performance of a specific counterparty and it’s posting of collateral. In the event of a default by such counterparty, the Fund could be exposed to potential losses. The Fund seeks to reduce its credit risk on bilateral OTC contracts by only transacting with high credit-standing counterparties. In addition, the Fund further mitigates the risk of counterparty non- performance by requiring counterparties to pledge cash and/or securities to collateralize unrealized gains on bilateral OTC contracts, in accordance with the terms of International Swaps and Derivatives Association (“ISDA”) agreements.
Liquidity Risk: The Fund needs cash liquidity in order to settle trading obligations, meet margin calls on derivatives, meeting margin calls and repayments on maturing financial arrangements, and meet repurchase offers. The Adviser actively monitors and manages the current and future sources of and draws on liquidity (cash and cash equivalents) as well as liquid securities.
Credit Risk: Credit risk is the risk that the value of debt securities in the Fund’s portfolio may decline because the issuer may default and fail to pay interest or repay principal when due. Rating agencies assign credit ratings to debt securities to indicate their credit risk. Lower rated or unrated debt securities held by the Fund may present increased credit risk as compared to higher-rated debt securities.
| 30 | www.1wscapital.com |
| 1WS Credit Income Fund | Notes to Consolidated Financial Statements |
| April 30, 2021 (Unaudited) |
Non-Diversified Fund Risk: The Fund is classified as “non-diversified” under the 1940 Act. As a result, the Fund can invest a greater portion of its assets in obligations of a single issuer than a “diversified” fund. The Fund may therefore be more susceptible than a diversified fund to being adversely affected by any single corporate, economic, political or regulatory occurrence.
Interest Rate Risk: Interest rate risk arises from the possibility that changes in interest rates will affect the value of financial instruments. The Fund may be exposed to risks associated with the effects of fluctuations in the prevailing levels of market interest rates on their financial position and cash flows. The Fund may be exposed to interest rate risk as a result of mismatches or gaps in the amounts of assets and liabilities that mature or reprice in a given period.
The United Kingdom’s Financial Conduct Authority, which regulates LIBOR, announced that it intends to phase out LIBOR by the end of 2021 with the exception of USD LIBOR which will phase out in 2023. Various financial industry groups have begun planning for that transition, however, there remains uncertainty regarding the future utilization of LIBOR and the nature of any replacement rate. It is expected that a number of private-sector banks currently reporting information used to set LIBOR will stop doing so after 2021 when their current reporting commitment ends, which could either cause LIBOR to stop publication immediately or cause LIBOR’s regulator to determine that its quality has degraded to the degree that it is no longer representative of its underlying market. The U.S. Federal Reserve, in conjunction with the Alternative Reference Rates Committee, a steering committee comprised of large U.S. financial institutions, intends to replace the U.S. dollar LIBOR with the Secured Overnight Funding Rate (SOFR), a new index calculated by short-term repurchase agreements, backed by U.S. Treasury securities. Abandonment of or modifications to LIBOR could have adverse impacts and represent a significant risk on newly issued financial instruments and existing financial instruments which reference LIBOR. While some instruments may contemplate a scenario where LIBOR is no longer available by providing for an alternative rate setting methodology, not all instruments may have such provisions and there is significant uncertainty regarding the effectiveness of any such alternative methodologies. Abandonment of or modifications to LIBOR could lead to significant short-term and long-term uncertainty and market instability and the extent to which that may impact the Fund may vary depending on various factors, which include, but are not limited to: (i) existing fallback or termination provisions in individual contracts and (ii) whether, how, and when industry participants develop and adopt new successor reference rates and/or fallbacks for both legacy and new instruments. In addition, the transition to a successor rate could potentially cause (i) increased volatility or illiquidity in markets for instruments that currently rely on LIBOR, (ii) a reduction in the value of certain instruments held by the Fund, or (iii) reduced effectiveness of related Fund transactions, such as hedging. It remains uncertain how such changes would be implemented and the effects such changes would have on the Fund, issuers of instruments in which the Fund invests and financial markets generally.
Foreign Currency Risk: The Fund may invest a portion of its assets in non-U.S. currencies, or in instruments denominated in non-U.S. currencies, the prices of which are determined with reference to currencies other than the U.S. Dollar. The Fund, however, values its securities and other assets in U.S. Dollars. The Fund generally seeks to hedge all or any portion of its foreign currency exposure. To the extent the Fund’s investments in foreign currency exposure are not hedged, the value of the Fund’s assets will fluctuate with U.S. Dollar exchange rates as well as the price changes of the Fund’s investments in the various local markets and currencies.
CDO and CLO Risk: The Fund may invest in CDOs and/or CLOs which are subject to the following risks: (i) distributions from collateral securities will not be adequate to make interest or other payments; (ii) the quality of the collateral may decline in value or default; (iii) CDOs and/or CLOs typically will have no significant underlying assets other than their underlying senior secured debt obligations or loans and payments on the CDOs and/or CLOs are and will be payable solely from the cash flows from such senior secured debt obligations and/or loans; (iv) CDOs and/or CLOs are typically highly levered, and therefore the CDO and/or CLO interests that the Fund may invest in are subject to a higher risk of total loss; (v) investments in CDOs and/or CLOs may be riskier and less transparent to the Fund and its shareholders than direct investments in the underlying companies; (vi) the potential for interruption and deferral of cash flow to Fund investments in the equity and junior debt tranches of CDOs and/or CLOs; (vii) interests in CDOs and/or CLOs may be illiquid; (viii) investments in foreign CDOs and/or CLOs may involve significant risks in addition to the risks inherent in U.S. CDOs and/or CLOs; (ix) the Fund may invest with collateral managers that have no or limited performance or operating history; (x) the inability of a CDO or CLO collateral manager to reinvest the proceeds of any prepayments may adversely affect the Fund; (xi) the loans underlying the CDOs and/or CLOs may be sold and replaced resulting in a loss to the Fund; (xii) the Fund may not have direct rights against the underlying borrowers or obligors comprising the CDOs and/or CLOs’ investments or the entities that sponsored the CDOs and/or CLOs; and (xiii) investments in equity and junior debt tranches of CDOs and/or CLOs will likely be subordinate to the other debt tranches of such CDOs and/or CLOs, and are subject to a higher degree of risk of total loss.
Commercial Mortgage-Backed Securities (“CMBS”) and Residential Mortgage-Backed Securities (“RMBS”) Risk: CMBS and RMBS are mortgage-backed securities that may be secured by interests in a single commercial or residential mortgage loan or a pool of mortgage loans secured by commercial or residential property. CMBS and RMBS may be senior, subordinate, interest-only, principal-only, investment-grade, non-investment grade or unrated. The Fund may acquire CMBS and RMBS from private originators as well as from other mortgage loan investors, including savings and loan associations, mortgage bankers, commercial banks, finance companies and investment banks. The credit quality of any CMBS and RMBS issue depends primarily on the credit quality of the underlying mortgage loans. At any one time, a portfolio of mortgage-backed securities may be backed by commercial or residential mortgage loans with disproportionately large aggregate principal amounts secured by properties in only a few states or regions. As a result, the commercial or residential mortgage loans may be more susceptible to geographic risks relating to such areas, such as adverse economic conditions, adverse events affecting industries located in such areas and natural hazards affecting such areas, than would be the case for a pool of mortgage loans having more diverse property locations.
| Semi-Annual Report | April 30, 2021 | 31 |
| 1WS Credit Income Fund | Notes to Consolidated Financial Statements |
| April 30, 2021 (Unaudited) |
Coronavirus Risk: The outbreak of the novel coronarvirus (“COVID-19”) in many countries continues to adversely impact global commercial activity, and has contributed to significant volatility in financial markets. The global impact of the outbreak has created significant disruption in supply chains and economic activity. The rapid development and fluidity of this situation precludes any prediction as to the ultimate adverse impact of COVID-19. Any longer-term impact on operations and performance will depend to a large extent on future developments and actions taken by authorities and other entities to contain COVID-19 and its economic impact. Nevertheless, COVID-19 continues to present material uncertainty and risk with respect to the performance of the Fund.
NOTE 11. TAX BASIS INFORMATION
Distributions are determined in accordance with federal income tax regulations, which differ from GAAP, and, therefore, may differ significantly in amount or character from net investment income and realized gains for financial reporting purposes. The amounts and characteristics of tax basis distributions and composition of distributable earnings/ (accumulated losses) are finalized at the Fund's fiscal year-end.
The amount of net unrealized appreciation/(depreciation) and the cost of investment securities for tax purposes, including short-term securities at April 30, 2021, were as follows:
| Cost of investments for income tax purposes | $ | 118,809,260 | ||
| Gross appreciation (excess of value over tax cost) | $ | 8,886,831 | ||
| Gross depreciation (excess of tax cost over value) | (1,097,612 | ) | ||
| Net unrealized appreciation/(depreciation) | $ | 7,789,219 | ||
The tax character of distributions paid for the period ended October 31, 2020 was as follows:
| 2020 | ||||
| Distributions Paid From: | ||||
| Ordinary Income | $ | 3,224,132 | ||
| Return of Capital | 1,857,223 | |||
| Total | $ | 5,081,355 | ||
NOTE 12. SUBSEQUENT EVENTS
In preparing these financial statements, the Fund’s management has evaluated events and transactions through the date the financial statements were issued.
The Fund notified shareholders of a quarterly repurchase offer on June 14, 2021. The Fund intends to complete the quarterly repurchase offer on July 14, 2021.
On May 3, 2021, the Fund commenced operations of the A-2 Share Class. The Class A-2 shares are subject to a maximum sales charge of 3% of the offering price and are subject to ongoing distribution and shareholder servicing fees of 0.75% (on an annualized basis) of the net asset value of the Class A-2 shares that may be used to compensate intermediaries for selling shares of the Fund and providing shareholder services.
Management has determined that there were no other subsequent events requiring disclosure.
| 32 | www.1wscapital.com |
| 1WS Credit Income Fund | Additional Information |
| April 30, 2021 (Unaudited) |
Portfolio Information. The Fund files its complete schedule of portfolio holdings with the Securities and Exchange Commission (the “SEC”) for the first and third quarters of each fiscal year on Form N-PORT, and for reporting periods ended prior to April 30, 2020, on Form N-Q. The Fund’s Forms N-Q or N-PORT will be available on the Fund’s website located at http://www.1wscapital.com or on the SEC’s website at https://www.sec.gov.
Proxy Information. The policies and procedures used to determine how to vote proxies relating to securities held by the Fund are available without charge, upon request, by calling 1-833-834-4923, on the Fund’s website located at https://www.1wscapital.com, and on the SEC’s website at https://www.sec.gov.
Information regarding how the Fund voted proxies relating to portfolio securities during the most recent twelve-month period ended June 30 is available on Form N-PX by August 31 of each year without charge, upon request, by calling 1-833-834-4923, on the Fund’s website located at www.1wscapital.com, and on the SEC’s website at https://www.sec.gov.
| Semi-Annual Report | April 30, 2021 | 33 |
| 1WS Credit Income Fund | Privacy Policy |
Your privacy is very important to us. This Privacy Notice sets forth the policies of 1WS Credit Income Fund (the “Fund”) with respect to non-public personal information of its investors, prospective investors and former investors. These policies apply to all investors and may be changed at any time, provided a notice of such change is given to you.
To the extent you provide us with personal information, such as your address, social security number, assets and/or income information: (i) in a subscription agreement and related documents; and (ii) in correspondence and conversations with the Fund’s representatives; and (iii) through transactions in the Fund, please be advised that:
We do not disclose any of this personal information about our investors, prospective investors or former investors to anyone, other than to our affiliates, such as our attorneys, auditors, brokers, regulators and certain service providers, in such case, only as necessary to facilitate the acceptance of your investment and management of the Fund and in accordance with applicable laws. It may be necessary, under anti-money laundering and similar laws, to disclose information about the Fund’s investors in order to accept subscriptions from them. We will also release information about you if you direct us to do so, if compelled to do so by law, or in connection with any government or self-regulatory organization request or investigation.
We may also disclose information you provide to us to third party institutions, such as prime brokers. If such a disclosure is made, the Fund will require such third parties to treat your private information with confidentiality.
We seek to carefully safeguard your private information and, to that end, restrict access to non-public personal information about you to those employees and other persons who need to know the information to enable the Fund to provide services to you. We maintain physical, electronic and procedural safeguards to protect your non-public personal information.
| 34 | www.1wscapital.com |
Intentionally Left Blank

| (b) | Not applicable. |
Item 2. Code of Ethics.
Not applicable to semi-annual report.
Item 3. Audit Committee Financial Expert.
Not applicable to semi-annual report.
Item 4. Principal Accountant Fees and Services.
Not applicable to semi-annual report.
Item 5. Audit Committee of Listed Registrants.
Not applicable to semi-annual report.
Item 6. Investments.
| (a) | The registrant’s Schedule of Investments as of the close of the reporting period is included in the Report to Stockholders filed under Item 1 of this Form N-CSR. |
| (b) | Not applicable. |
Item 7. Disclosure of Proxy Voting Policies and Procedures for Closed-End Management Investment Companies.
Not applicable to semi-annual report.
Item 8. Portfolio Managers of Closed-End Management Investment Companies.
(a) Not applicable to semi-annual report.
(b) Not applicable.
Item 9. Purchases of Equity Securities by Closed-End Management Investment Company and Affiliated Purchasers.
Not applicable.
Item 10. Submission of Matters to a Vote of Security Holders.
None.
Item 11. Controls and Procedures.
| (a) | The registrant’s principal executive and principal financial officers, or persons performing similar functions, have concluded that the registrant’s disclosure controls and procedures (as defined in Rule 30a-3(c) under the Investment Company Act of 1940, as amended (the “1940 Act”) (17 CFR 270.30a-3(c))) are effective, as of a date within 90 days of the filing date of the report that includes the disclosure required by this paragraph, based on their evaluation of these controls and procedures required by Rule 30a-3(b) under the 1940 Act (17 CFR 270.30a-3(b)) and Rules 13a-15(b) or 15d-15(b) under the Securities Exchange Act of 1934, as amended (17 CFR 240.13a-15(b) or 240.15d-15(b)). |
| (b) | There were no changes in the registrant’s internal control over financial reporting (as defined in Rule 30a-3(d) under the Act (17 CFR 270.30a-3(d)) that occurred during the period covered by this report that have materially affected or are reasonably likely to materially affect the registrant’s internal control over financial reporting. |
Item 12. Disclosure of Securities Lending Activities for Closed-End Management Investment Companies.
Not applicable.
Item 13. Exhibits.
| (a)(1) | Not applicable to semi-annual report. |
| (a)(2) | The certifications required by Rule 30a-2(a) under the 1940 Act, as amended, and Section 302 of the Sarbanes-Oxley Act of 2002 are attached hereto as Ex99.Cert. |
SIGNATURES
Pursuant to the requirements of the Securities Exchange Act of 1934 and the Investment Company Act of 1940, the registrant has duly caused this report to be signed on its behalf by the undersigned, thereunto duly authorized.
1WS Credit Income Fund
| By: | /s/ Kurt A. Locher | |
| Kurt A. Locher, Chief Executive Officer | ||
| (Principal Executive Officer) | ||
| Date: | July 1, 2021 |
Pursuant to the requirements of the Securities Exchange Act of 1934 and the Investment Company Act of 1940, this report has been signed below by the following persons on behalf of the registrant and in the capacities and on the dates indicated.
| By: | /s/ Kurt A. Locher | |
| Kurt A. Locher, Chief Executive Officer | ||
| (Principal Executive Officer) | ||
| Date: | July 1, 2021 |
| By: | /s/ Stephanie Dolan | |
| Stephanie Dolan, Chief Financial Officer and Principal Accounting Officer | ||
| Date: | July 1, 2021 |