1 Fiscal 2025 second quarter results Peter Konieczny CEO Michael Casamento CFO February 4, 2025 US EST February 5, 2025 Australia EDT Exhibit 99.2
2 Disclaimers Cautionary Statement Regarding Forward-Looking Statements This document contains certain statements that are “forward-looking statements” within the meaning of the safe harbor provisions of the U.S. Private Securities Litigation Reform Act of 1995. Forward-looking statements are generally identified with words like “believe,” “expect,” “target,” “project,” “may,” “could,” “would,” “approximately,” “possible,” “will,” “should,” “intend,” “plan,” “anticipate,” "commit," “estimate,” “potential,” "ambitions," “outlook,” or “continue,” the negative of these words, other terms of similar meaning, or the use of future dates. Such statements, including projections as to the anticipated benefits of the proposed Transaction (as defined herein), the impact of the proposed Transaction on Amcor's business and future financial and operating results and prospects, and the amount and timing of synergies from the proposed Transaction, are based on the current estimates, assumptions, projections and expectations of the management of Amcor and are qualified by the inherent risks and uncertainties surrounding future expectations generally. Actual results could differ materially from those currently anticipated due to a number of risks and uncertainties many of which are beyond Amcor's control. Neither Amcor nor any of its respective directors, executive officers, or advisors, provide any representation, assurance, or guarantee that the occurrence of the events expressed or implied in any forward-looking statements will actually occur or if any of them do occur, what impact they will have on the business, results of operations or financial condition of Amcor. Should any risks and uncertainties develop into actual events, these developments could have a material adverse effect on Amcor's business, the proposed Transaction and the ability to successfully complete the proposed Transaction and realize its expected benefits. Risks and uncertainties that could cause actual results to differ from expectations include, but are not limited to: occurrence of any event, change or other circumstance that could give rise to the termination of the Agreement and Plan of Merger ("Merger Agreement") in connection with the proposed merger (the "Transaction“) of Amcor and Berry Global Group, Inc. ("Berry"); risk that the conditions to the completion of the proposed Transaction with Berry (including shareholder and regulatory approvals) are not satisfied in a timely manner or at all; risks arising from the integration of the Amcor and Berry businesses; risk that the anticipated benefits of the proposed Transaction may not be realized when expected or at all; risk of unexpected costs or expenses resulting from the proposed Transaction; risk of litigation related to the proposed Transaction; risks related to the disruption of management's time from ongoing business operations as a result of the proposed Transaction; risk that the proposed Transaction may have an adverse effect on our ability to retain key personnel and customers; general economic, market and social developments and conditions; evolving legal, regulatory and tax regimes under which we operate; potential business uncertainty, including changes to existing business relationships, during the pendency of the proposed Transaction that could affect our financial performance; changes in consumer demand patterns and customer requirements in numerous industries; the loss of key customers, a reduction in their production requirements, or consolidation among key customers; significant competition in the industries and regions in which we operate; an inability to expand our current business effectively through either organic growth, including product innovation, investments, or acquisitions; challenging global economic conditions; impacts of operating internationally; price fluctuations or shortages in the availability of raw materials, energy, and other inputs which could adversely affect our business; production, supply, and other commercial risks, including counterparty credit risks, which may be exacerbated in times of economic volatility; pandemics, epidemics, or other disease outbreaks; an inability to attract and retain our global executive team and our skilled workforce and manage key transitions; labor disputes and an inability to renew collective bargaining agreements at acceptable terms; physical impacts of climate change; cybersecurity risks, which could disrupt our operations or risk of loss of our sensitive business information; failures or disruptions in our information technology systems which could disrupt our operations, compromise customer, employee, supplier, and other data; a significant increase in our indebtedness or a downgrade in our credit rating could reduce our operating flexibility and increase our borrowing costs and negatively affect our financial condition and results of operations; rising interest rates that increase our borrowing costs on our variable rate indebtedness and could have other negative impacts; foreign exchange rate risk; a significant write-down of goodwill and/or other intangible assets; a failure to maintain an effective system of internal control over financial reporting; an inability of our insurance policies, including our use of a captive insurance company, to provide adequate protection against all of the risks we face; an inability to defend our intellectual property rights or intellectual property infringement claims against us; litigation, including product liability claims or litigation related to Environmental, Social, and Governance ("ESG"), matters or regulatory developments; increasing scrutiny and changing expectations from investors, customers, suppliers, and governments with respect to our ESG practices and commitments resulting in additional costs or exposure to additional risks; changing ESG government regulations including climate-related rules; changing environmental, health, and safety laws; changes in tax laws or changes in our geographic mix of earnings; and other risks and uncertainties are supplemented by those identified from time to time in our filings with the Securities and Exchange Commission (the “SEC”), including without limitation, those described under Part I, "Item 1A - Risk Factors” in our Annual Report on Form 10-K for the fiscal year ended June 30, 2024 and as updated by our quarterly reports on Form 10-Q. You can obtain copies of Amcor’s filings with the SEC for free at the SEC’s website (www.sec.gov). Forward-looking statements included herein are made only as of the date hereof and Amcor does not undertake any obligation to update any forward-looking statements, or any other information in this communication, as a result of new information, future developments or otherwise, or to correct any inaccuracies or omissions in them which become apparent, except as expressly required by law. All forward-looking statements in this communication are qualified in their entirety by this cautionary statement. It should also be noted that projected financial information for the combined businesses of Amcor and Berry is based on management’s estimates, assumptions and projections and has not been prepared in conformance with the applicable accounting requirements of Regulation S-X relating to pro forma financial information, and the required pro forma adjustments have not been applied and are not reflected therein. These measures are provided for illustrative purposes, are based on an arithmetic sum of the relevant historical financial measures of Amcor and Berry and do not reflect pro forma adjustments. None of this information should be considered in isolation from, or as a substitute for, the historical financial statements of Amcor or Berry. Important risk factors could cause actual future results and other future events to differ materially from those currently estimated by management, including, but not limited to, the risks that: a condition to the closing of the proposed Transaction may not be satisfied; a regulatory approval that may be required for the proposed Transaction is delayed, is not obtained or is obtained subject to conditions that are not anticipated; Amcor is unable to achieve the synergies and value creation contemplated by the proposed Transaction; Amcor is unable to promptly and effectively integrate Berry’s businesses; management’s time and attention is diverted on Transaction-related issues; disruption from the Transaction makes it more difficult to maintain business, contractual and operational relationships; the credit ratings of the combined company declines following the proposed Transaction; legal proceedings are instituted against Amcor, Berry or the combined company; or Amcor, Berry or the combined company is unable to retain key personnel. Presentation of non-GAAP information Included in this release are measures of financial performance that are not calculated in accordance with U.S. GAAP. These measures include adjusted EBITDA and EBITDA (calculated as earnings before interest and tax and depreciation and amortization), adjusted EBIT and EBIT (calculated as earnings before interest and tax), adjusted net income, adjusted earnings per share, adjusted free cash flow, net debt, expected annual cash flow after the consummation of the proposed Transaction, synergies from the proposed Transaction, adjusted cash EPS accretion and return on investment (in connection with the proposed Transaction). In arriving at these non-GAAP measures, we exclude items that either have a non-recurring impact on the income statement or which, in the judgment of our management, are items that, either as a result of their nature or size, could, were they not singled out, potentially cause investors to extrapolate future performance from an improper base. Note that while amortization of acquired intangible assets is excluded from non-GAAP adjusted financial measures, the revenue of the acquired entities and all other expenses unless otherwise stated, are reflected in our non-GAAP financial performance earnings measures. While not all inclusive, examples of these items include: material restructuring programs, including associated costs such as employee severance, pension and related benefits, impairment of property and equipment and other assets, accelerated depreciation, termination
3 Disclaimers continued payments for contracts and leases, contractual obligations, and any other qualifying costs related to restructuring plans; material sales and earnings from disposed or ceased operations and any associated profit or loss on sale of businesses or subsidiaries; changes in the fair value of economic hedging instruments on commercial paper and contingent purchase consideration; pension settlements; impairments in goodwill and equity method investments; material acquisition compensation and transaction costs such as due diligence expenses, professional and legal fees, and integration costs; material purchase accounting adjustments for inventory; amortization of acquired intangible assets from business combination; gains or losses on significant property and divestitures and significant property and other impairments, net of insurance recovery; certain regulatory and legal matters; impacts from highly inflationary accounting; expenses related to the Company's Chief Executive Officer transition; and impacts related to the Russia-Ukraine conflict. Amcor also evaluates performance on a comparable constant currency basis, which measures financial results assuming constant foreign currency exchange rates used for translation based on the average rates in effect for the comparable prior year period. In order to compute comparable constant currency results, we multiply or divide, as appropriate, current-year U.S. dollar results by the current year average foreign exchange rates and then multiply or divide, as appropriate, those amounts by the prior-year average foreign exchange rates. We then adjust for other items affecting comparability. While not all inclusive, examples of items affecting comparability include the difference between sales or earnings in the current period and the prior period related to disposed or ceased operations. Comparable constant currency net sales performance also excludes the impact from passing through movements in raw material costs. Management has used and uses these measures internally for planning, forecasting and evaluating the performance of the Company’s reporting segments and certain of the measures are used as a component of Amcor’s Board of Directors’ measurement of Amcor’s performance for incentive compensation purposes. Amcor believes that these non-GAAP measures are useful to enable investors to perform comparisons of current and historical performance of the Company. For each of these non-GAAP financial measures, a reconciliation to the most directly comparable U.S. GAAP financial measure has been provided herein. These non-GAAP financial measures should not be construed as an alternative to results determined in accordance with U.S. GAAP. The Company provides guidance on a non-GAAP basis as we are unable to predict with reasonable certainty the ultimate outcome and timing of certain significant forward-looking items without unreasonable effort. These items include but are not limited to the impact of foreign exchange translation, restructuring program costs, asset impairments, possible gains and losses on the sale of assets, and certain tax related events. These items are uncertain, depend on various factors, and could have a material impact on U.S. GAAP earnings and cash flow measures for the guidance period. This presentation also includes certain projections of non-GAAP financial measures related to the combined company after the consummation of the proposed Transaction. Due to the high variability and difficulty in making accurate forecasts and projections in connection with the results of the combined company after the consummation of the proposed Transaction, together with certain information excluded from these projected non-GAAP financial measures not being ascertainable or accessible, Amcor is unable to quantify certain amounts that would be required to be included in the most directly comparable GAAP financial measures without unreasonable effort. Consequently, no disclosure of estimated comparable GAAP financial measures for such projected non-GAAP financial measures and no reconciliation of projected non-GAAP financial measure for the combined company to directly comparable GAAP measures has been included in this presentation. Important Information for Investors and Shareholders This communication does not constitute an offer to sell or the solicitation of an offer to buy or exchange any securities or a solicitation of any vote or approval in any jurisdiction. It does not constitute a prospectus or prospectus equivalent document. No offering of securities shall be made except by means of a prospectus meeting the requirements of Section 10 of the U.S. Securities Act of 1933, as amended. In connection with the proposed transaction between Amcor and Berry, on January 13, 2025, Amcor filed with the SEC a registration statement on Form S-4, as amended on January 21, 2025, containing a joint proxy statement of Amcor and Berry that also constitutes a prospectus of Amcor. The registration statement was declared effective by the SEC on January 23, 2025 and Amcor and Berry commenced mailing the definitive joint proxy statement/prospectus to their respective shareholders on or about January 23, 2025. INVESTORS AND SECURITY HOLDERS OF AMCOR AND BERRY ARE URGED TO READ THE DEFINITIVE JOINT PROXY STATEMENT/PROSPECTUS AND OTHER DOCUMENTS FILED OR THAT WILL BE FILED WITH THE SEC CAREFULLY AND IN THEIR ENTIRETY BECAUSE THEY CONTAIN OR WILL CONTAIN IMPORTANT INFORMATION. Investors and security holders may obtain free copies of the registration statement and the definitive joint proxy statement/prospectus and other documents filed with the SEC by Amcor or Berry through the website maintained by the SEC at http://www.sec.gov. Copies of the documents filed with the SEC by Amcor are available free of charge on Amcor's website at amcor.com under the tab “Investors” and under the heading “Financial Information” and subheading “SEC Filings.” Copies of the documents filed with the SEC by Berry are available free of charge on Berry's website at berryglobal.com under the tab “Investors” and under the heading “Financials” and subheading “SEC Filings.” Certain Information Regarding Participants Amcor, Berry, and their respective directors and executive officers may be considered participants in the solicitation of proxies from the shareholders of Amcor and Berry in connection with the proposed transaction. Information about the directors and executive officers of Amcor is set forth in its Annual Report on Form 10-K for the year ended June 30, 2024, which was filed with the SEC on August 16, 2024, its proxy statement for its 2024 annual meeting, which was filed with the SEC on September 24, 2024, and its Current Report on Form 8-K, which was filed with the SEC on January 6, 2025. Information about the directors and executive officers of Berry is set forth in its Annual Report on Form 10-K for the year ended September 28, 2024, which was filed with the SEC on November 26, 2024, and its proxy statement for its 2025 annual meeting, which was filed with the SEC on January 7, 2025. Information about the directors and executive officers of Amcor and Berry and other information regarding the potential participants in the proxy solicitations and a description of their direct and indirect interests, by security holdings or otherwise, are contained in the definitive joint proxy statement/prospectus filed with the SEC and other relevant materials filed with or to be filed with the SEC regarding the proposed transaction when they become available. To the extent holdings of Amcor's or Berry's securities by its directors or executive officers have changed since the amounts set forth in the definitive joint proxy statement/prospectus, such changes have been or will be reflected on Initial Statements of Beneficial Ownership on Form 3 or Statements of Beneficial Ownership on Form 4 filed with the SEC. You may obtain these documents (when they become available) free of charge through the website maintained by the SEC at http://www.sec.gov and from Amcor's or Berry's website as described above.
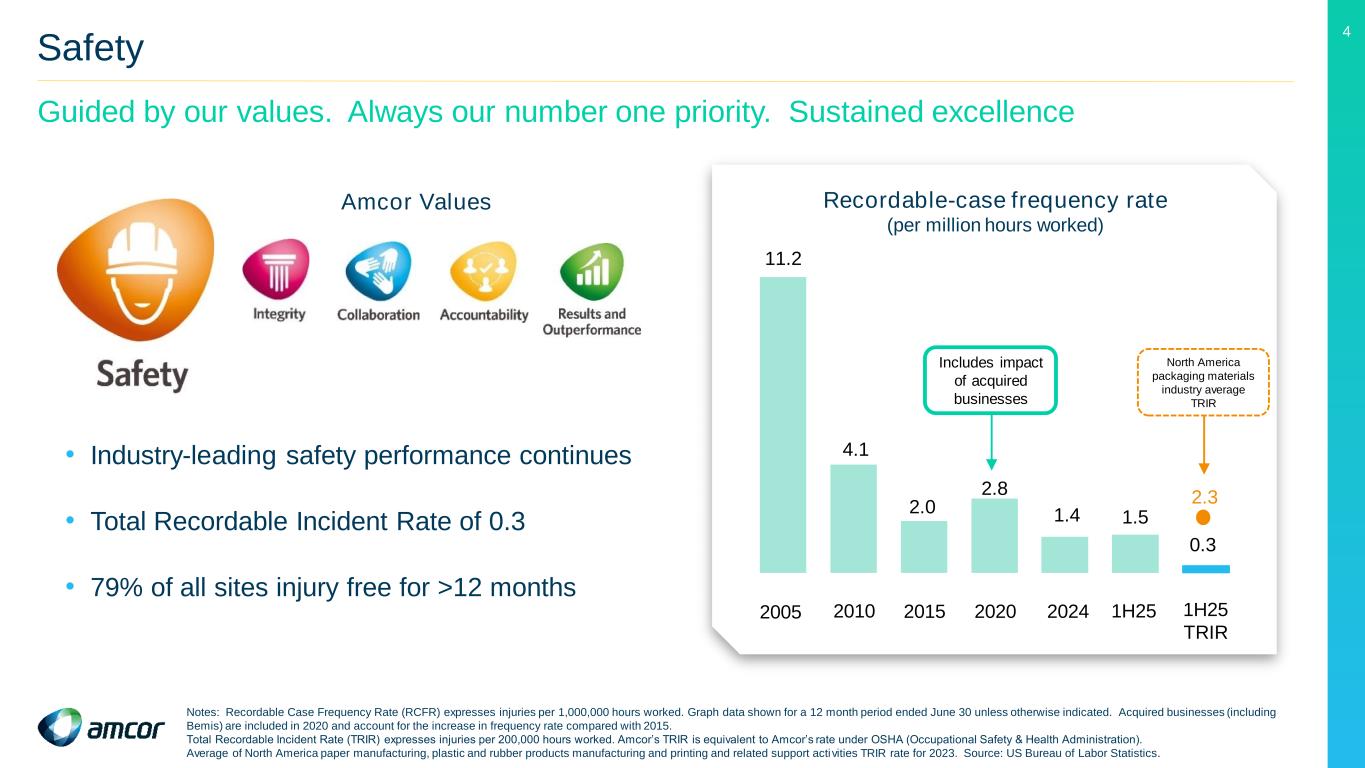
4 Safety Guided by our values. Always our number one priority. Sustained excellence Notes: Recordable Case Frequency Rate (RCFR) expresses injuries per 1,000,000 hours worked. Graph data shown for a 12 month period ended June 30 unless otherwise indicated. Acquired businesses (including Bemis) are included in 2020 and account for the increase in frequency rate compared with 2015. Total Recordable Incident Rate (TRIR) expresses injuries per 200,000 hours worked. Amcor’s TRIR is equivalent to Amcor’s rate under OSHA (Occupational Safety & Health Administration). Average of North America paper manufacturing, plastic and rubber products manufacturing and printing and related support activities TRIR rate for 2023. Source: US Bureau of Labor Statistics. Amcor Values • Industry-leading safety performance continues • Total Recordable Incident Rate of 0.3 • 79% of all sites injury free for >12 months 11.2 4.1 2.0 2.8 1.4 [x.x] Recordable-case frequency rate (per million hours worked) 1H25 TRIR Includes impact of acquired businesses 201520102005 2020 2024 1H25 2.3 0.3 1.5 North America packaging materials industry average TRIR
5 Key messages • Second quarter result in-line with expectations • Further sequential improvement in volume growth • Reaffirming full year guidance • Berry Global combination: accelerates growth; enhances earnings and cash generation
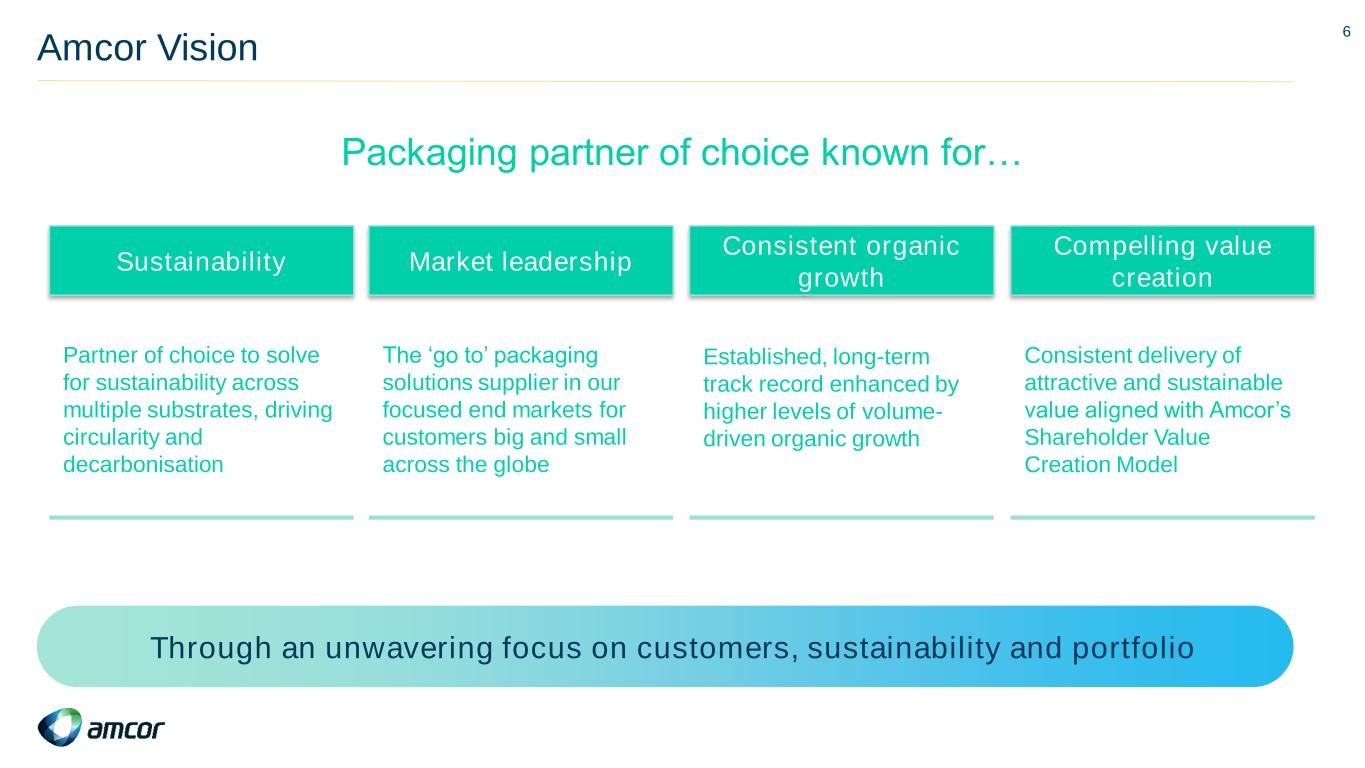
6 Amcor Vision Established, long-term track record enhanced by higher levels of volume- driven organic growth Consistent delivery of attractive and sustainable value aligned with Amcor’s Shareholder Value Creation Model Partner of choice to solve for sustainability across multiple substrates, driving circularity and decarbonisation The ‘go to’ packaging solutions supplier in our focused end markets for customers big and small across the globe Market leadershipSustainability Compelling value creation Consistent organic growth Packaging partner of choice known for… Through an unwavering focus on customers, sustainability and portfolio
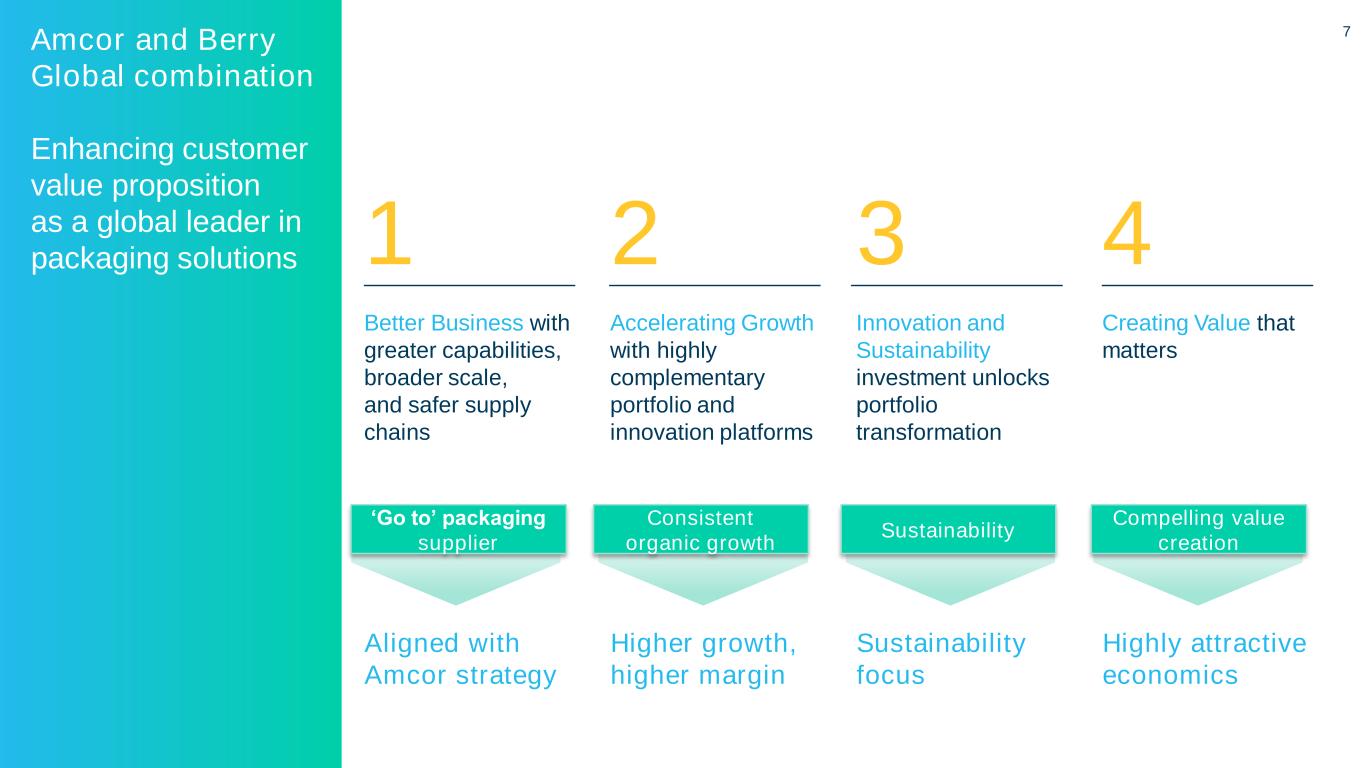
7Amcor and Berry Global combination Enhancing customer value proposition as a global leader in packaging solutions Better Business with greater capabilities, broader scale, and safer supply chains Accelerating Growth with highly complementary portfolio and innovation platforms Innovation and Sustainability investment unlocks portfolio transformation Creating Value that matters 1 2 3 4 Aligned with Amcor strategy Higher growth, higher margin Sustainability focus Highly attractive economics Sustainability ‘Go to’ packaging supplier Consistent organic growth Compelling value creation
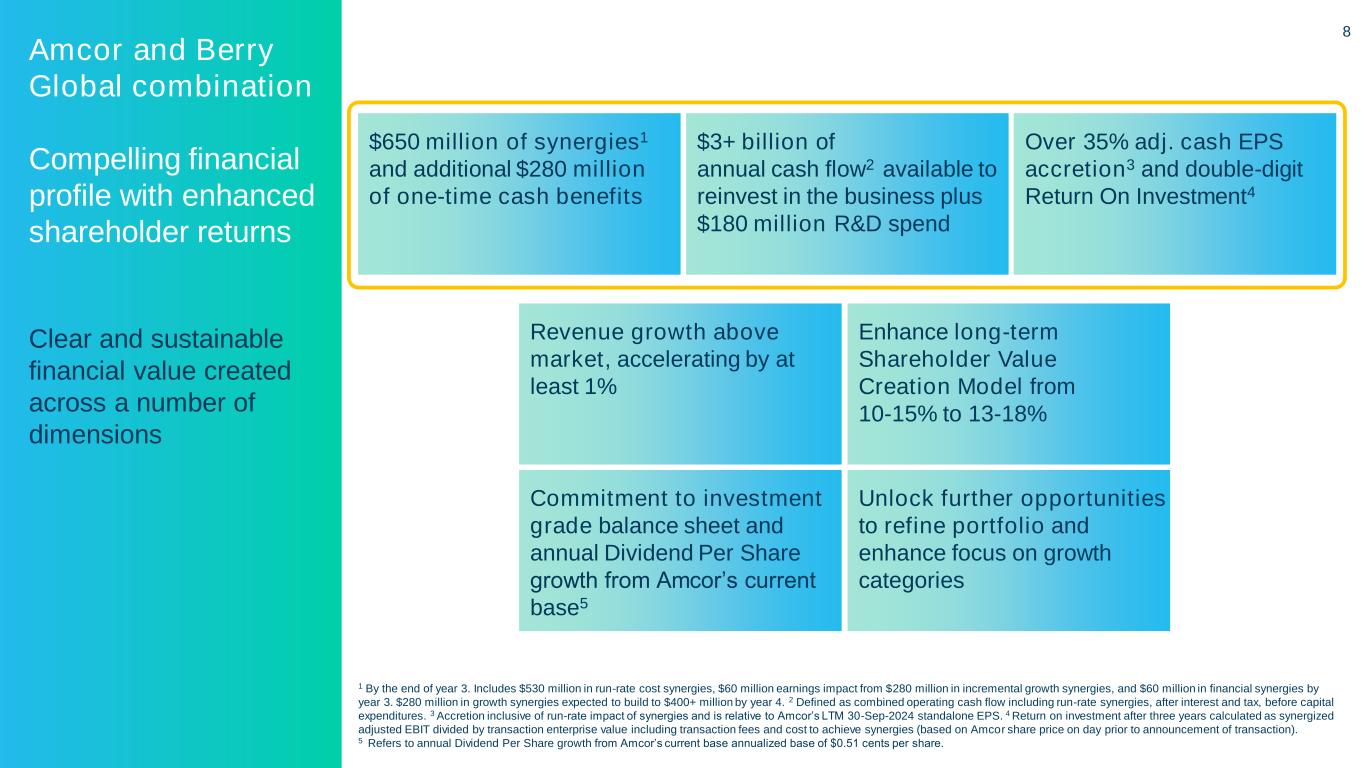
8 Amcor and Berry Global combination Compelling financial profile with enhanced shareholder returns Clear and sustainable financial value created across a number of dimensions Commitment to investment grade balance sheet and annual Dividend Per Share growth from Amcor’s current base5 Unlock further opportunities to refine portfolio and enhance focus on growth categories Enhance long-term Shareholder Value Creation Model from 10-15% to 13-18% Revenue growth above market, accelerating by at least 1% $650 million of synergies1 and additional $280 million of one-time cash benefits Over 35% adj. cash EPS accretion3 and double-digit Return On Investment4 $3+ billion of annual cash flow2 available to reinvest in the business plus $180 million R&D spend 1 By the end of year 3. Includes $530 million in run-rate cost synergies, $60 million earnings impact from $280 million in incremental growth synergies, and $60 million in financial synergies by year 3. $280 million in growth synergies expected to build to $400+ million by year 4. 2 Defined as combined operating cash flow including run-rate synergies, after interest and tax, before capital expenditures. 3 Accretion inclusive of run-rate impact of synergies and is relative to Amcor’s LTM 30-Sep-2024 standalone EPS. 4 Return on investment after three years calculated as synergized adjusted EBIT divided by transaction enterprise value including transaction fees and cost to achieve synergies (based on Amcor share price on day prior to announcement of transaction). 5 Refers to annual Dividend Per Share growth from Amcor’s current base annualized base of $0.51 cents per share.
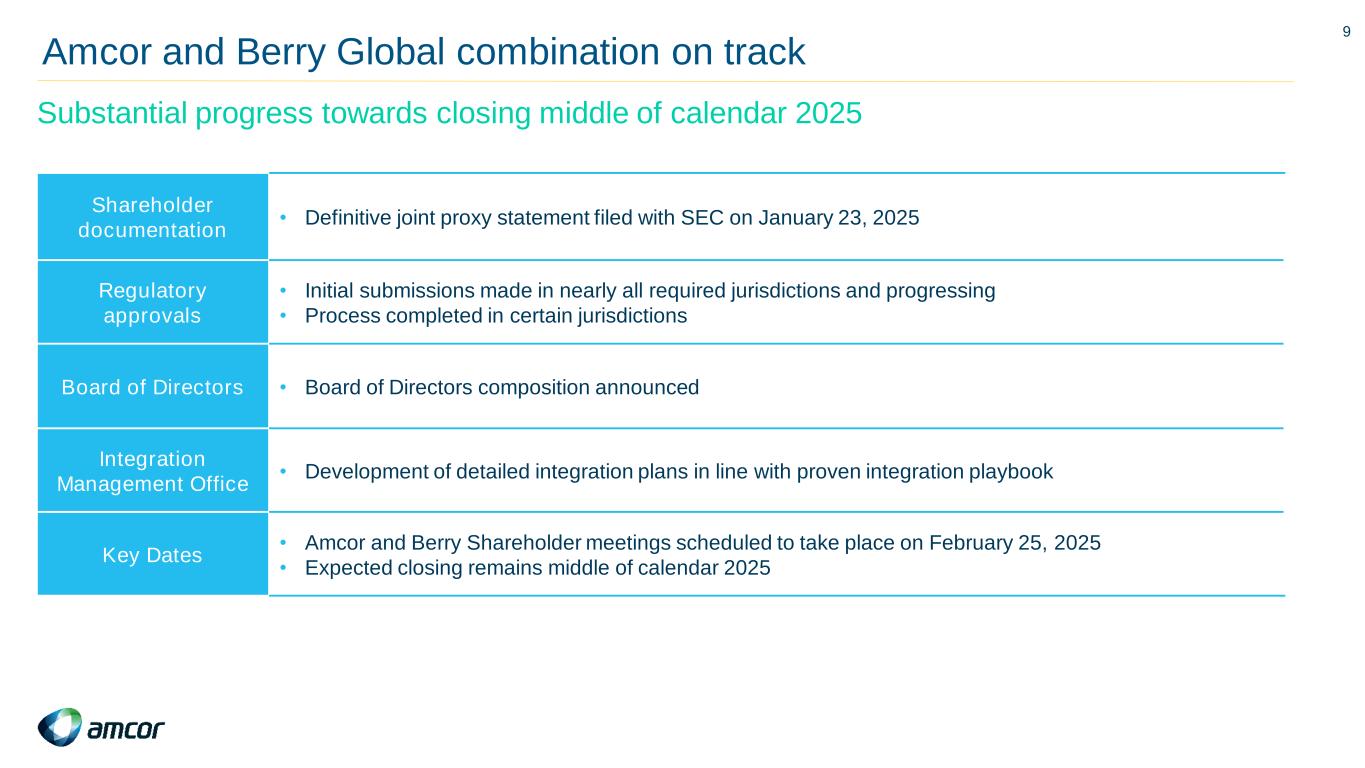
9 Shareholder documentation • Definitive joint proxy statement filed with SEC on January 23, 2025 Regulatory approvals • Initial submissions made in nearly all required jurisdictions and progressing • Process completed in certain jurisdictions Board of Directors • Board of Directors composition announced Integration Management Office • Development of detailed integration plans in line with proven integration playbook Key Dates • Amcor and Berry Shareholder meetings scheduled to take place on February 25, 2025 • Expected closing remains middle of calendar 2025 Substantial progress towards closing middle of calendar 2025 Amcor and Berry Global combination on track
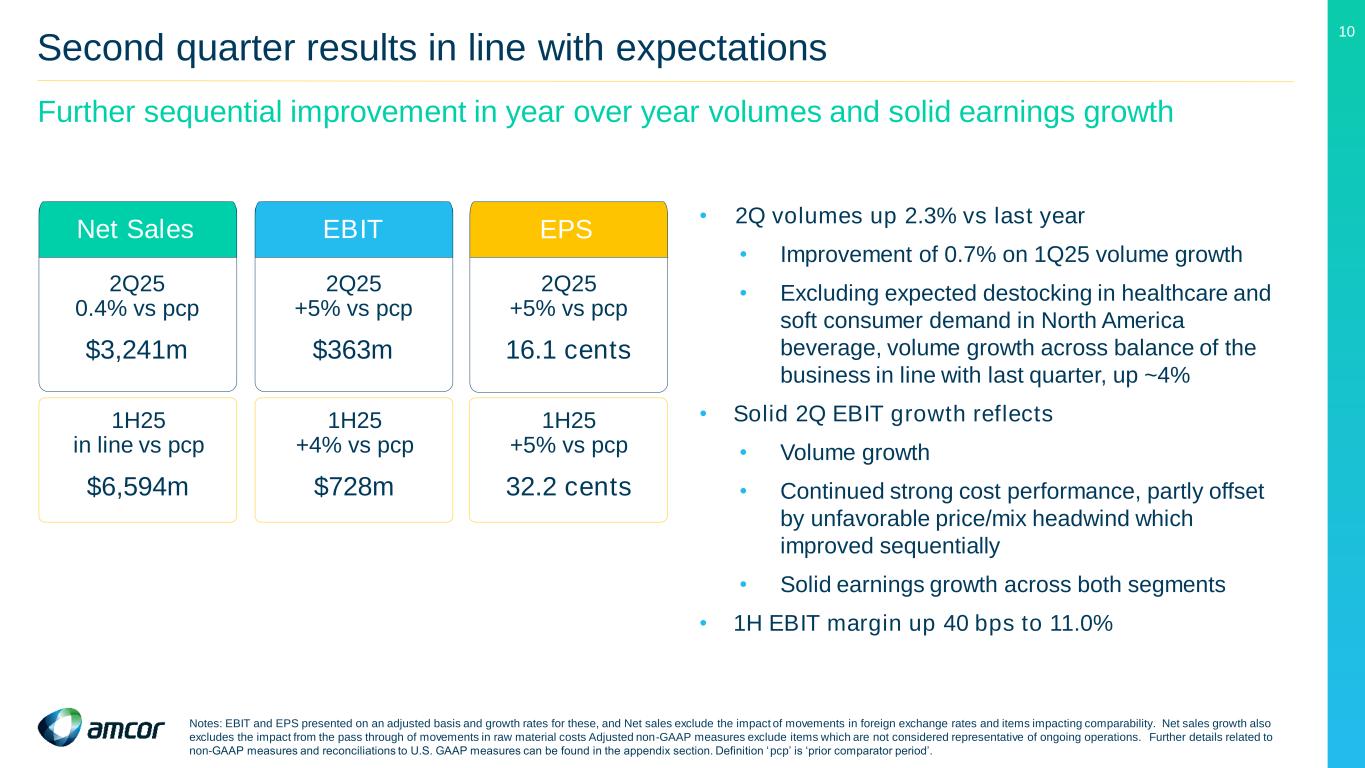
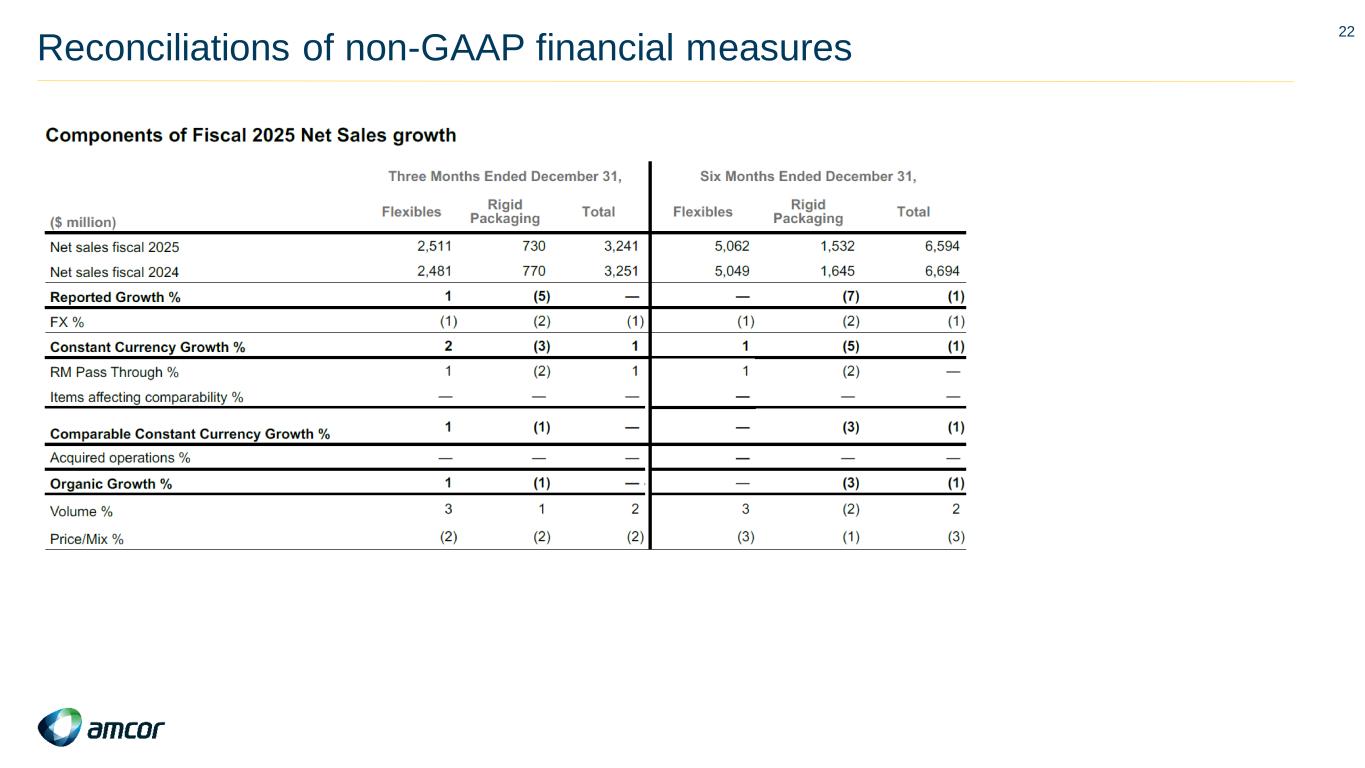
10 Second quarter results in line with expectations Further sequential improvement in year over year volumes and solid earnings growth 2Q25 0.4% vs pcp $3,241m Net Sales EBIT EPS 2Q25 +5% vs pcp $363m 2Q25 +5% vs pcp 16.1 cents 1H25 in line vs pcp $6,594m 1H25 +4% vs pcp $728m 1H25 +5% vs pcp 32.2 cents • 2Q volumes up 2.3% vs last year • Improvement of 0.7% on 1Q25 volume growth • Excluding expected destocking in healthcare and soft consumer demand in North America beverage, volume growth across balance of the business in line with last quarter, up ~4% • Solid 2Q EBIT growth reflects • Volume growth • Continued strong cost performance, partly offset by unfavorable price/mix headwind which improved sequentially • Solid earnings growth across both segments • 1H EBIT margin up 40 bps to 11.0% Notes: EBIT and EPS presented on an adjusted basis and growth rates for these, and Net sales exclude the impact of movements in foreign exchange rates and items impacting comparability. Net sales growth also excludes the impact from the pass through of movements in raw material costs Adjusted non-GAAP measures exclude items which are not considered representative of ongoing operations. Further details related to non-GAAP measures and reconciliations to U.S. GAAP measures can be found in the appendix section. Definition ‘pcp’ is ‘prior comparator period’.

11 Flexibles segment Net Sales and volume growth, price/mix headwind abating and strong cost performance December quarter highlights • Net sales up 1%; Volumes up 3% • As expected, destocking continued in healthcare but abated; price/mix headwind improved sequentially as a result • Volumes up MSD excluding healthcare destocking • Adjusted EBIT up 4% reflecting volume growth and favorable cost performance, partly offset by unfavorable price/mix 1H 2025 highlights • Net sales in line with prior year; Volumes up 3% • Unfavorable price/mix of 3% primarily driven by lower healthcare volumes • Adjusted EBIT up 4% reflecting volume growth and favorable cost performance, partly offset by unfavorable price/mix $m 2Q24 2Q25 CCC ∆ Net sales 2,481 2,511 +1% Adjusted EBIT 312 322 +4% Adjusted EBIT margin 12.6% 12.8% New product launch in Amcor’s AmFiber Performance Paper Food grade packaging with 80% recycled content Notes: CCC refers to Comparable Constant Currency. CCC growth reconciliations can be found in the appendix. Non-GAAP measures exclude items which are not considered representative of ongoing operations. Further details related to non-GAAP measures including Adjusted EBIT and reconciliations to U.S. GAAP measures can be found in the appendix. MSD refers to Mid Single Digits. $m 1H24 1H25 CCC ∆ Net sales 5,049 5,062 -% Adjusted EBIT 634 651 +4% Adjusted EBIT margin 12.6% 12.9%
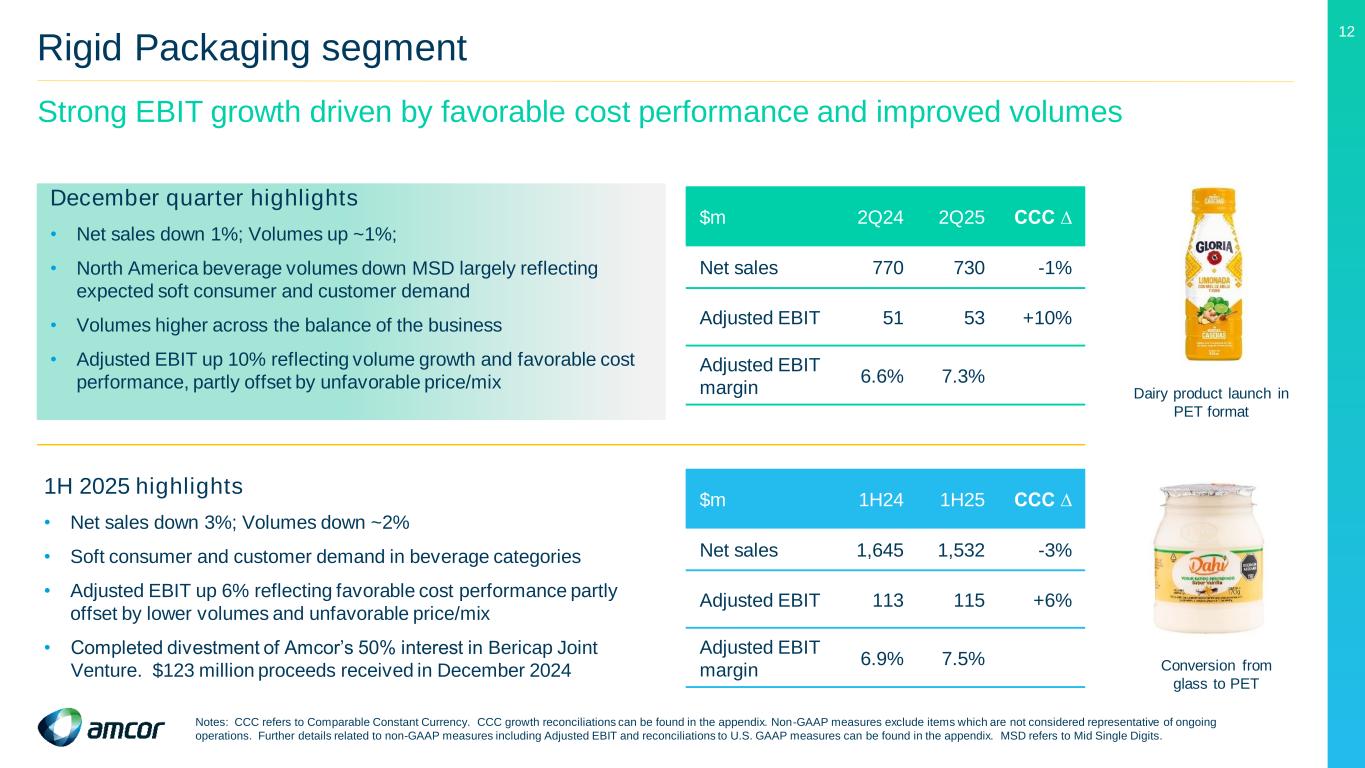
12 Rigid Packaging segment Strong EBIT growth driven by favorable cost performance and improved volumes December quarter highlights • Net sales down 1%; Volumes up ~1%; • North America beverage volumes down MSD largely reflecting expected soft consumer and customer demand • Volumes higher across the balance of the business • Adjusted EBIT up 10% reflecting volume growth and favorable cost performance, partly offset by unfavorable price/mix 1H 2025 highlights • Net sales down 3%; Volumes down ~2% • Soft consumer and customer demand in beverage categories • Adjusted EBIT up 6% reflecting favorable cost performance partly offset by lower volumes and unfavorable price/mix • Completed divestment of Amcor’s 50% interest in Bericap Joint Venture. $123 million proceeds received in December 2024 $m 2Q24 2Q25 CCC ∆ Net sales 770 730 -1% Adjusted EBIT 51 53 +10% Adjusted EBIT margin 6.6% 7.3% Dairy product launch in PET format Conversion from glass to PET Notes: CCC refers to Comparable Constant Currency. CCC growth reconciliations can be found in the appendix. Non-GAAP measures exclude items which are not considered representative of ongoing operations. Further details related to non-GAAP measures including Adjusted EBIT and reconciliations to U.S. GAAP measures can be found in the appendix. MSD refers to Mid Single Digits. $m 1H24 1H25 CCC ∆ Net sales 1,645 1,532 -3% Adjusted EBIT 113 115 +6% Adjusted EBIT margin 6.9% 7.5%
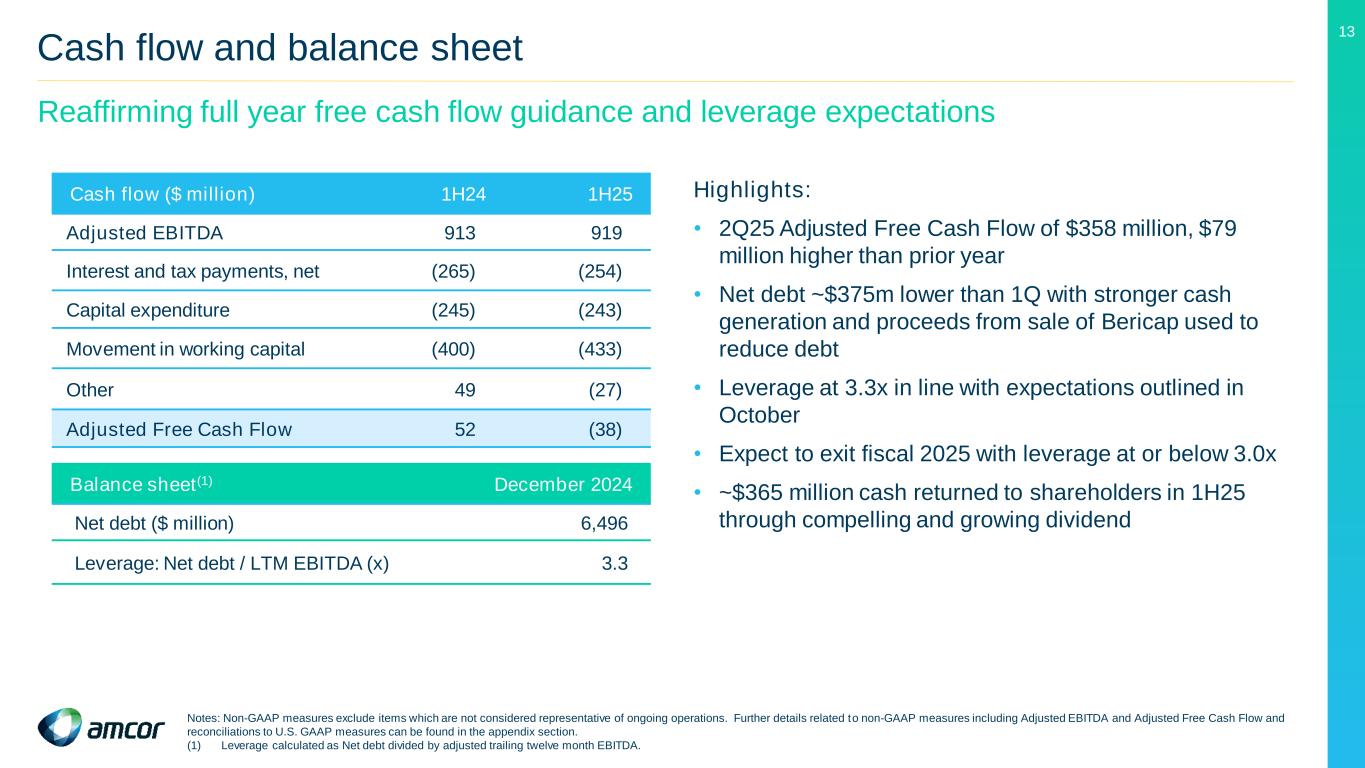
13 Cash flow and balance sheet Reaffirming full year free cash flow guidance and leverage expectations Cash flow ($ million) 1H24 1H25 Adjusted EBITDA 913 919 Interest and tax payments, net (265) (254) Capital expenditure (245) (243) Movement in working capital (400) (433) Other 49 (27) Adjusted Free Cash Flow 52 (38) Balance sheet(1) December 2024 Net debt ($ million) 6,496 Leverage: Net debt / LTM EBITDA (x) 3.3 Highlights: • 2Q25 Adjusted Free Cash Flow of $358 million, $79 million higher than prior year • Net debt ~$375m lower than 1Q with stronger cash generation and proceeds from sale of Bericap used to reduce debt • Leverage at 3.3x in line with expectations outlined in October • Expect to exit fiscal 2025 with leverage at or below 3.0x • ~$365 million cash returned to shareholders in 1H25 through compelling and growing dividend Notes: Non-GAAP measures exclude items which are not considered representative of ongoing operations. Further details related to non-GAAP measures including Adjusted EBITDA and Adjusted Free Cash Flow and reconciliations to U.S. GAAP measures can be found in the appendix section. (1) Leverage calculated as Net debt divided by adjusted trailing twelve month EBITDA.

14 Fiscal 2025 guidance reaffirmed For the year ended June 30, 2025, the Company continues to expect • Adjusted EPS of approximately 72 to 76 cents per share which represents comparable constant currency growth of 3% to 8% (includes approximately 4% headwind related to normalization of incentive compensation payments) compared with 70.2 cents per share in fiscal 2024. • Assuming current exchange rates prevail through fiscal 2025, movements in exchange rates are not expected to have a material impact on reported EPS • Net interest expense is expected to be between $290 to $300 million • Effective tax rate is expected to be between 19% and 20% • Adjusted Free Cash Flow of approximately $900 million to $1,000 million. Amcor’s guidance contemplates a range of factors which create a higher degree of uncertainty and additional complexity when estimating future financial results. Refer to slide 2 for further information. Reconciliations of the fiscal 2025 projected non-GAAP measures are not included herein because the individual components are not known with certainty as individual financial statements for fiscal 2025 have not been completed. Amcor's guidance does not factor in any potential impact from the merger with Berry Global which may arise if the transaction closes before fiscal 2025 year end.
15 Appendix slides Supplementary schedules and reconciliations

16 FX translation impact 1H25 currency impact EUR 20-30% Other currencies(2) 20-30% USD 45-55% EUR:USD Euro stronger vs USD, Average USD to EUR rate 1H25 0.9238 vs 1H24 0.9244 1H25 USD million impact on Adjusted Net income 0% 0 Other currencies(2):USD Other currencies weighted average vs USD weaker for 1H25 vs 1H24 average rates 1H25 USD million impact on Adjusted Net income (8%) (9) (1) Approximate ranges based on adjusted Net income by currency. (2) Includes all currencies other than USD and EUR Total currency impact $ million Adjusted EBIT (11) Adjusted Net income (9) Combined Net income currency exposures(1)
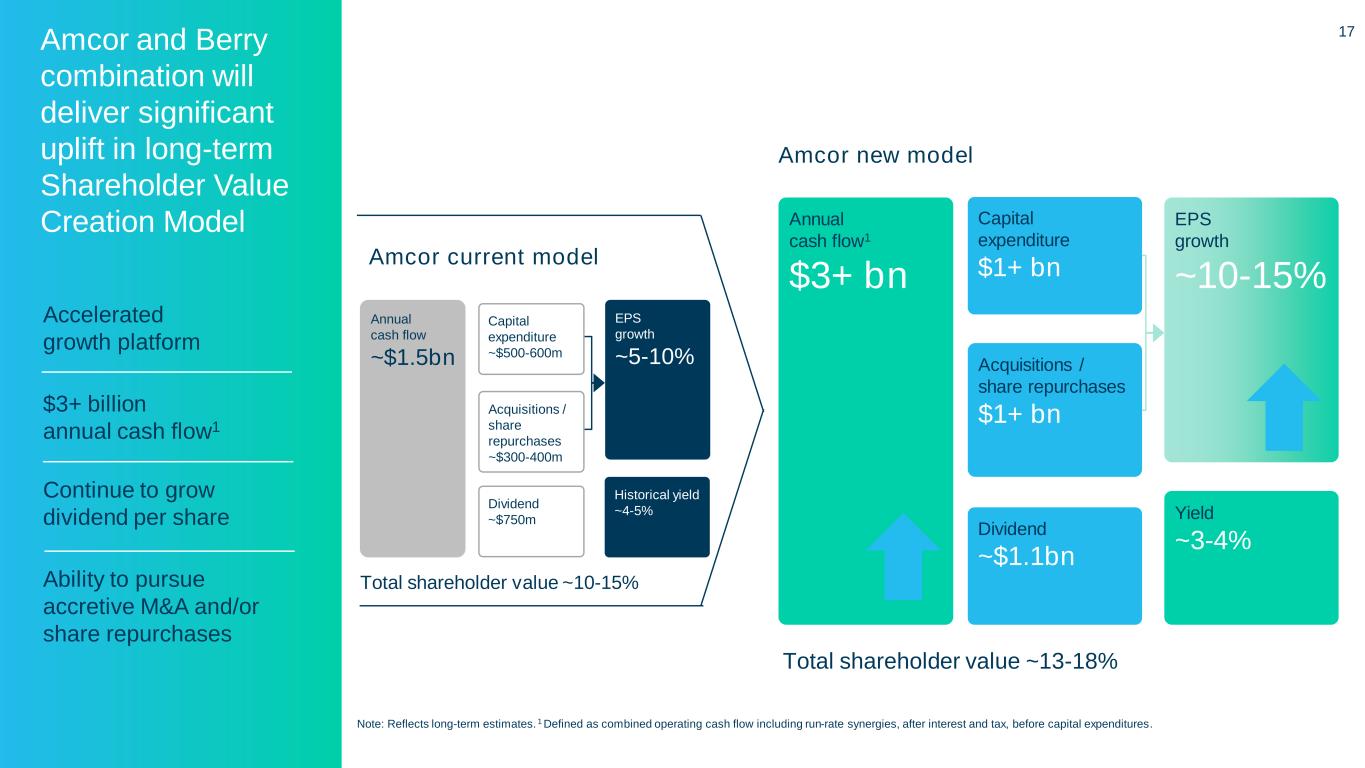
17 Amcor current model Dividend ~$1.1bn Capital expenditure $1+ bn Total shareholder value ~13-18% EPS growth ~10-15% Acquisitions / share repurchases $1+ bn Yield ~3-4% Amcor new model Dividend ~$750m Capital expenditure ~$500-600m Acquisitions / share repurchases ~$300-400m Annual cash flow ~$1.5bn Total shareholder value ~10-15% EPS growth ~5-10% Historical yield ~4-5% Annual cash flow1 $3+ bn Amcor and Berry combination will deliver significant uplift in long-term Shareholder Value Creation Model Accelerated growth platform $3+ billion annual cash flow1 Continue to grow dividend per share Ability to pursue accretive M&A and/or share repurchases Note: Reflects long-term estimates. 1 Defined as combined operating cash flow including run-rate synergies, after interest and tax, before capital expenditures.

18 Reconciliations of non-GAAP financial measures
19 Reconciliations of non-GAAP financial measures
20 Reconciliations of non-GAAP financial measures

21 Reconciliations of non-GAAP financial measures
22 Reconciliations of non-GAAP financial measures


