Exhibit 99.1
| AAR CORP. Investor Day October 6, 2010 |

| This presentation includes certain statements relating to future results, which are forward-looking statements as that term is defined in the Private Securities Litigation Reform Act of 1995. These forward-looking statements are based on beliefs of Company management, as well as assumptions and estimates based on information currently available to the Company, and are subject to certain risks and uncertainties that could cause actual results to differ materially from historical results or those anticipated, including those factors discussed under Item 1A, entitled “Risk Factors,” included in the Company’s May 31, 2010 Form 10-K. Should one or more of these risks or uncertainties materialize adversely, or should underlying assumptions or estimates prove incorrect, actual results may vary materially from those described. These events and uncertainties are difficult or impossible to predict accurately and many are beyond the Company’s control. The Company assumes no obligation to update any forward-looking statements to reflect events or circumstances after the date of such statements or to reflect the occurrence of anticipated or unanticipated events. For additional information, see the comments included in AAR’s filings with the Securities and Exchange Commission. Forward-Looking Statements 2 |
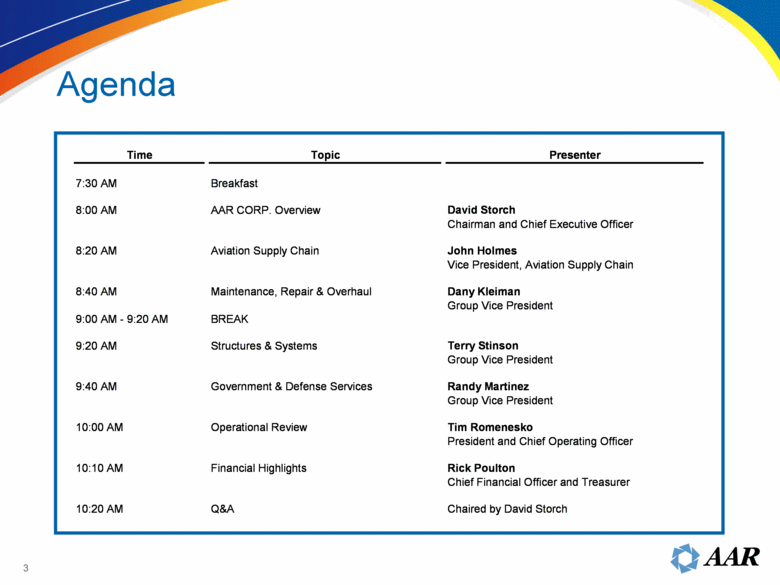
| Agenda Time Topic Presenter 7:30 AM Breakfast 8:00 AM AAR CORP. Overview David Storch Chairman and Chief Executive Officer 8:20 AM Aviation Supply Chain John Holmes Vice President, Aviation Supply Chain 8:40 AM Maintenance, Repair & Overhaul Dany Kleiman Group Vice President 9:00 AM - 9:20 AM BREAK 9:20 AM Structures & Systems Terry Stinson Group Vice President 9:40 AM Government & Defense Services Randy Martinez Group Vice President 10:00 AM Operational Review Tim Romenesko President and Chief Operating Officer 10:10 AM Financial Highlights Rick Poulton Chief Financial Officer and Treasurer 10:20 AM Q&A Chaired by David Storch 3 |
| AAR CORP. Overview David Storch Chairman and Chief Executive Officer |
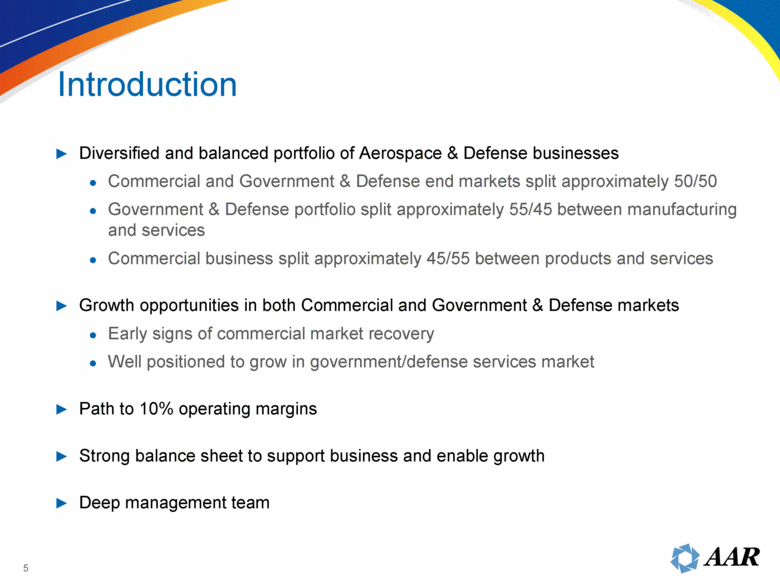
| Diversified and balanced portfolio of Aerospace & Defense businesses Commercial and Government & Defense end markets split approximately 50/50 Government & Defense portfolio split approximately 55/45 between manufacturing and services Commercial business split approximately 45/55 between products and services Growth opportunities in both Commercial and Government & Defense markets Early signs of commercial market recovery Well positioned to grow in government/defense services market Path to 10% operating margins Strong balance sheet to support business and enable growth Deep management team Introduction 5 |
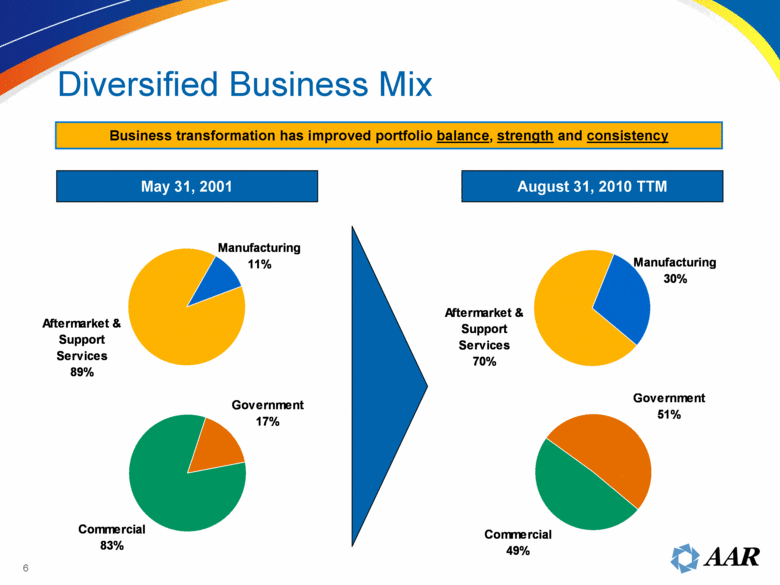
| Diversified Business Mix May 31, 2001 August 31, 2010 TTM Business transformation has improved portfolio balance, strength and consistency Commercial 49% Government 51% Commercial 83% Government 17% Aftermarket & Support Services 70% Manufacturing 30% Manufacturing 11% Aftermarket & Support Services 89% 6 |
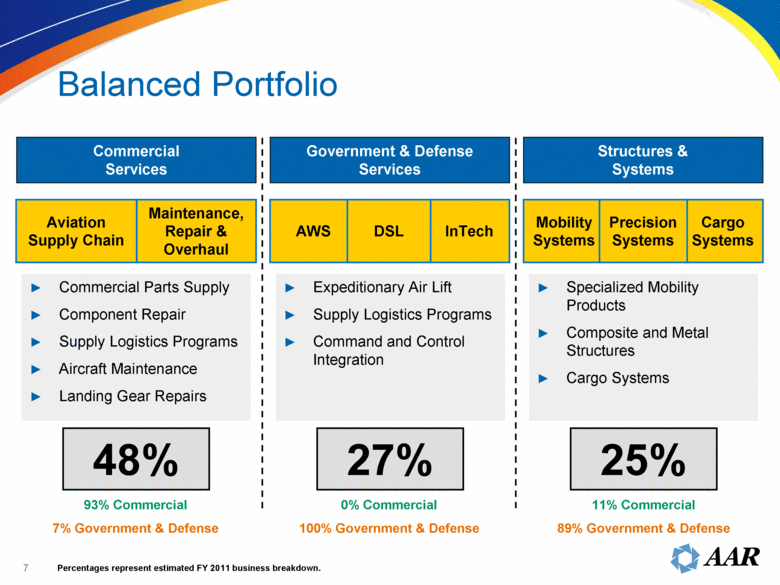
| Balanced Portfolio 48% 27% 25% Commercial Parts Supply Component Repair Supply Logistics Programs Aircraft Maintenance Landing Gear Repairs Commercial Services Government & Defense Services Structures & Systems Aviation Supply Chain Maintenance, Repair & Overhaul Mobility Systems Cargo Systems Precision Systems AWS InTech DSL Percentages represent estimated FY 2011 business breakdown. Expeditionary Air Lift Supply Logistics Programs Command and Control Integration Specialized Mobility Products Composite and Metal Structures Cargo Systems 93% Commercial 7% Government & Defense 0% Commercial 100% Government & Defense 11% Commercial 89% Government & Defense 7 |
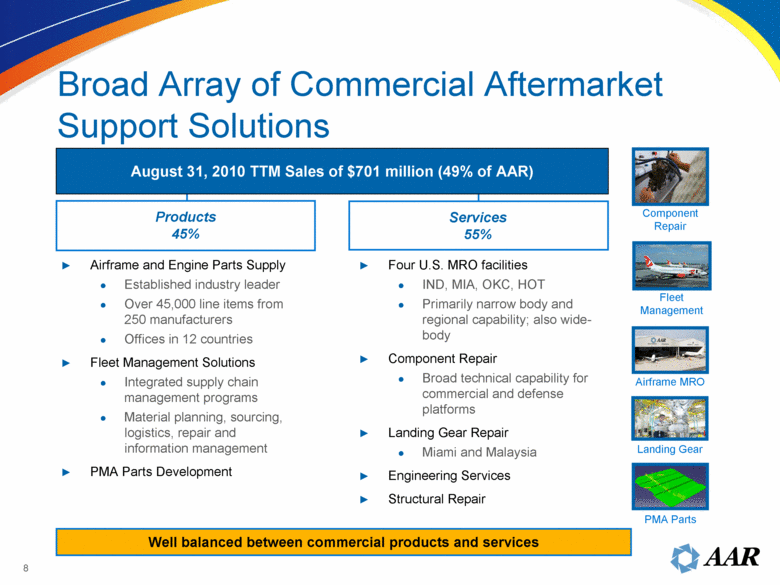
| Services 55% Four U.S. MRO facilities IND, MIA, OKC, HOT Primarily narrow body and regional capability; also wide-body Component Repair Broad technical capability for commercial and defense platforms Landing Gear Repair Miami and Malaysia Engineering Services Structural Repair Airframe and Engine Parts Supply Established industry leader Over 45,000 line items from 250 manufacturers Offices in 12 countries Fleet Management Solutions Integrated supply chain management programs Material planning, sourcing, logistics, repair and information management PMA Parts Development Component Repair Fleet Management Airframe MRO Landing Gear Products 45% Broad Array of Commercial Aftermarket Support Solutions August 31, 2010 TTM Sales of $701 million (49% of AAR) Well balanced between commercial products and services PMA Parts 8 |
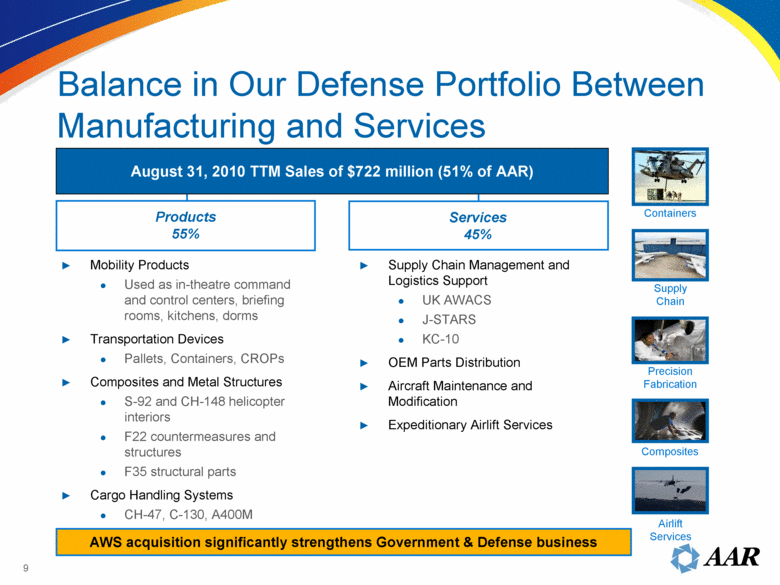
| Services 45% Supply Chain Management and Logistics Support UK AWACS J-STARS KC-10 OEM Parts Distribution Aircraft Maintenance and Modification Expeditionary Airlift Services Mobility Products Used as in-theatre command and control centers, briefing rooms, kitchens, dorms Transportation Devices Pallets, Containers, CROPs Composites and Metal Structures S-92 and CH-148 helicopter interiors F22 countermeasures and structures F35 structural parts Cargo Handling Systems CH-47, C-130, A400M Supply Chain Composites Products 55% Balance in Our Defense Portfolio Between Manufacturing and Services August 31, 2010 TTM Sales of $722 million (51% of AAR) AWS acquisition significantly strengthens Government & Defense business Airlift Services Containers Precision Fabrication 9 |
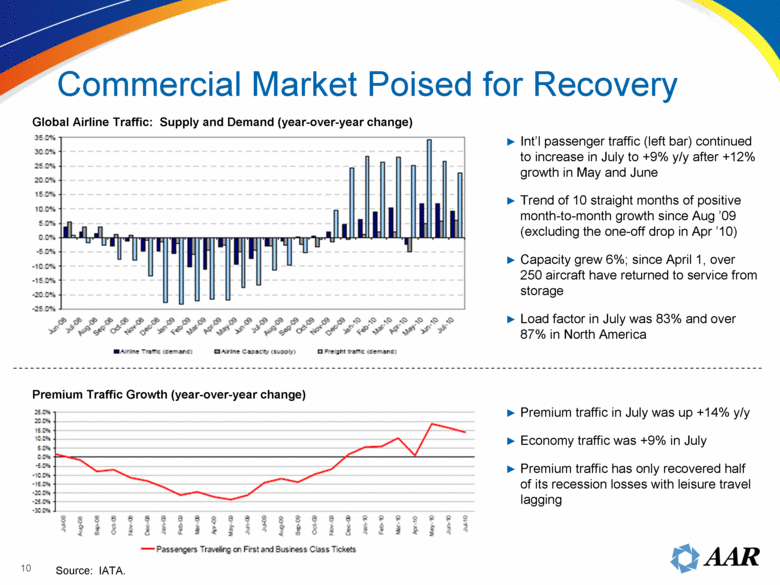
| Int’l passenger traffic (left bar) continued to increase in July to +9% y/y after +12% growth in May and June Trend of 10 straight months of positive month-to-month growth since Aug ’09 (excluding the one-off drop in Apr ’10) Capacity grew 6%; since April 1, over 250 aircraft have returned to service from storage Load factor in July was 83% and over 87% in North America Source: IATA. Premium traffic in July was up +14% y/y Economy traffic was +9% in July Premium traffic has only recovered half of its recession losses with leisure travel lagging Global Airline Traffic: Supply and Demand (year-over-year change) Premium Traffic Growth (year-over-year change) Commercial Market Poised for Recovery 10 |
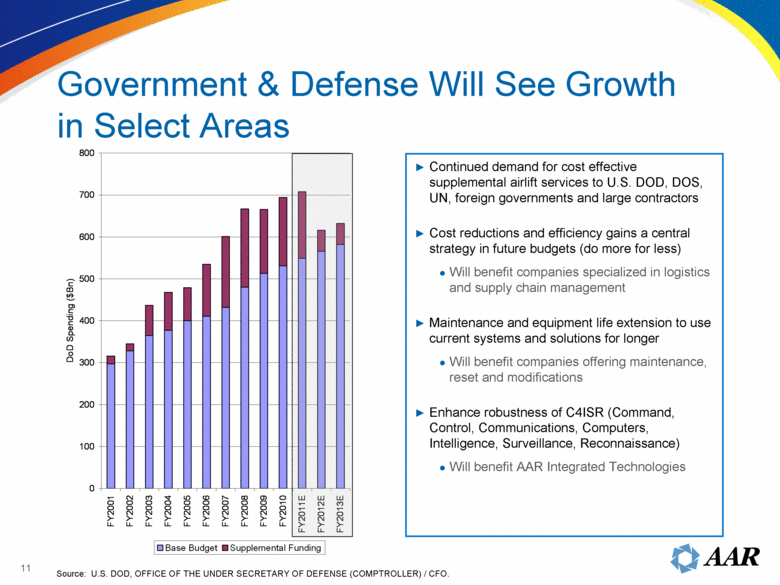
| Government & Defense Will See Growth in Select Areas Continued demand for cost effective supplemental airlift services to U.S. DOD, DOS, UN, foreign governments and large contractors Cost reductions and efficiency gains a central strategy in future budgets (do more for less) Will benefit companies specialized in logistics and supply chain management Maintenance and equipment life extension to use current systems and solutions for longer Will benefit companies offering maintenance, reset and modifications Enhance robustness of C4ISR (Command, Control, Communications, Computers, Intelligence, Surveillance, Reconnaissance) Will benefit AAR Integrated Technologies Source: U.S. DOD, OFFICE OF THE UNDER SECRETARY OF DEFENSE (COMPTROLLER) / CFO. 0 100 200 300 400 500 600 700 800 FY2001 FY2002 FY2003 FY2004 FY2005 FY2006 FY2007 FY2008 FY2009 FY2010 FY2011E FY2012E FY2013E DoD Spending ($Bn) Base Budget Supplemental Funding 11 |
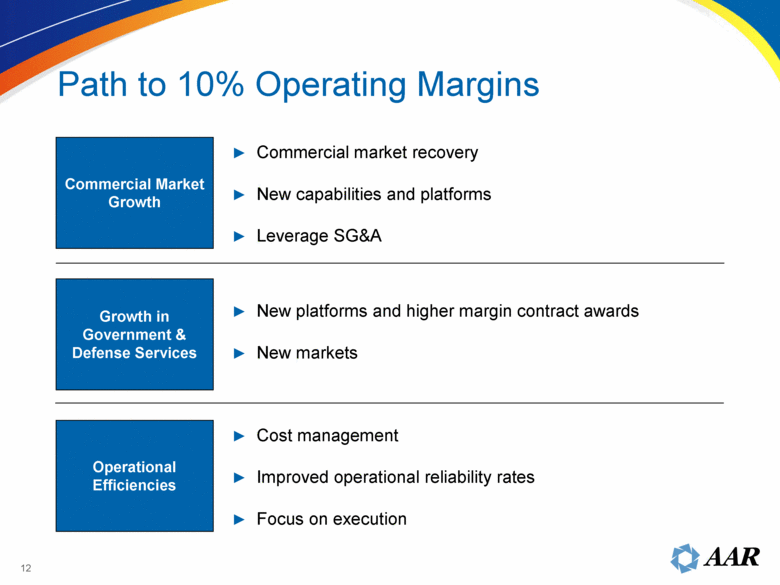
| 12 Path to 10% Operating Margins Commercial market recovery New capabilities and platforms Leverage SG&A Commercial Market Growth Growth in Government & Defense Services Operational Efficiencies New platforms and higher margin contract awards New markets Cost management Improved operational reliability rates Focus on execution |
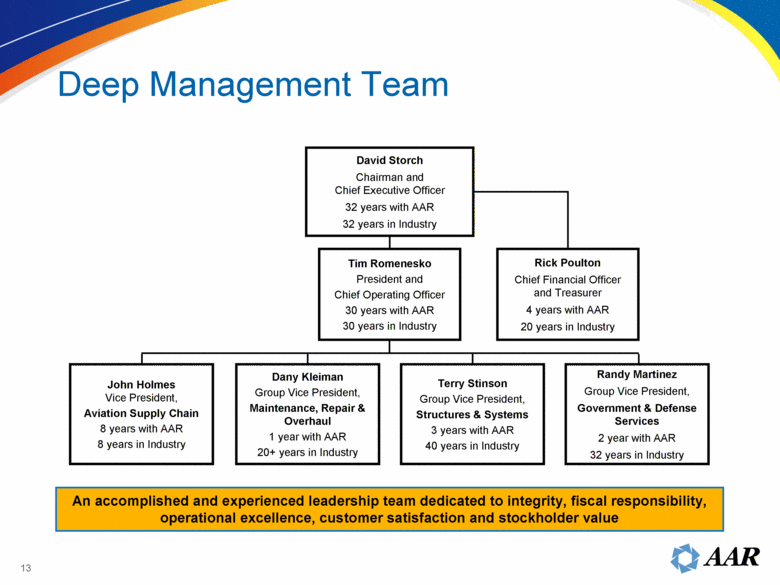
| Rick Poulton Chief Financial Officer and Treasurer 4 years with AAR 20 years in Industry An accomplished and experienced leadership team dedicated to integrity, fiscal responsibility, operational excellence, customer satisfaction and stockholder value Randy Martinez Group Vice President, Government & Defense Services 2 year with AAR 32 years in Industry John Holmes Vice President, Aviation Supply Chain 8 years with AAR 8 years in Industry Terry Stinson Group Vice President, Structures & Systems 3 years with AAR 40 years in Industry Dany Kleiman Group Vice President, Maintenance, Repair & Overhaul 1 year with AAR 20+ years in Industry Tim Romenesko President and Chief Operating Officer 30 years with AAR 30 years in Industry David Storch Chairman and Chief Executive Officer 32 years with AAR 32 years in Industry Deep Management Team 13 |
| Aviation Supply Chain John Holmes Vice President, Aviation Supply Chain |

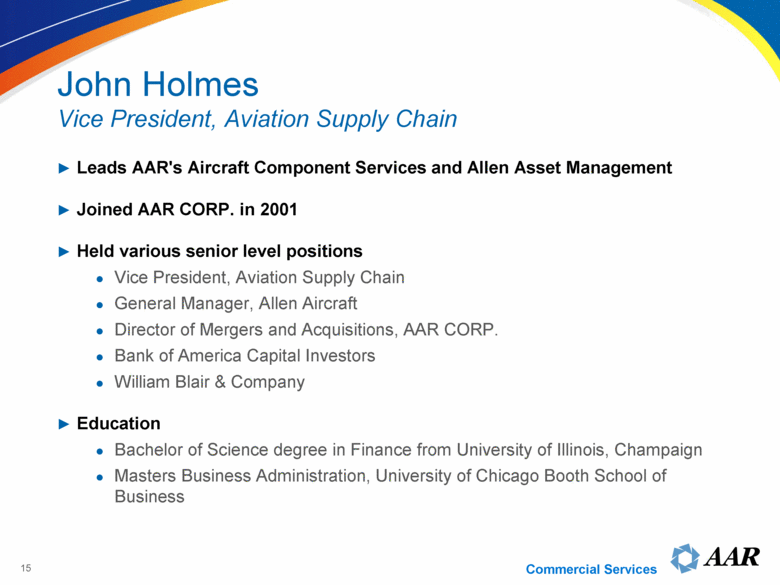
| 15 Leads AAR's Aircraft Component Services and Allen Asset Management Joined AAR CORP. in 2001 Held various senior level positions Vice President, Aviation Supply Chain General Manager, Allen Aircraft Director of Mergers and Acquisitions, AAR CORP. Bank of America Capital Investors William Blair & Company Education Bachelor of Science degree in Finance from University of Illinois, Champaign Masters Business Administration, University of Chicago Booth School of Business John Holmes Vice President, Aviation Supply Chain Commercial Services |
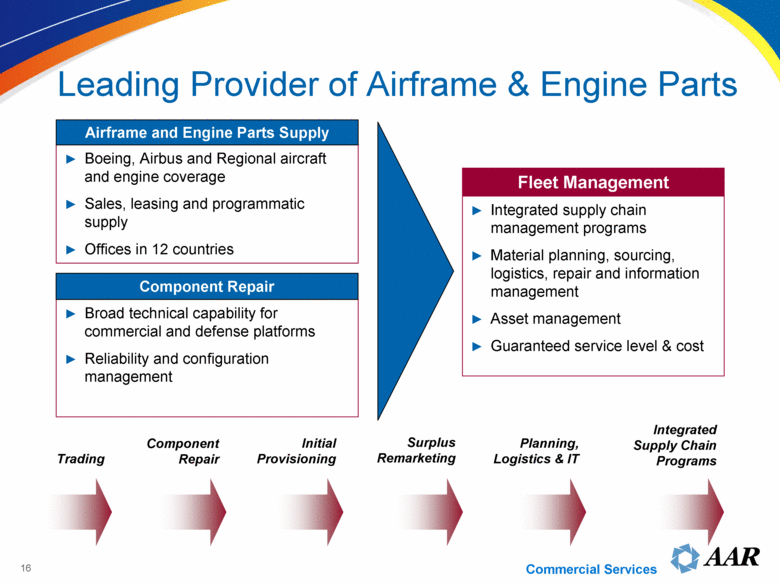
| Leading Provider of Airframe & Engine Parts Boeing, Airbus and Regional aircraft and engine coverage Sales, leasing and programmatic supply Offices in 12 countries Airframe and Engine Parts Supply Broad technical capability for commercial and defense platforms Reliability and configuration management Component Repair Integrated supply chain management programs Material planning, sourcing, logistics, repair and information management Asset management Guaranteed service level & cost Fleet Management Integrated Supply Chain Programs Planning, Logistics & IT Surplus Remarketing Initial Provisioning Component Repair Trading Commercial Services 16 |
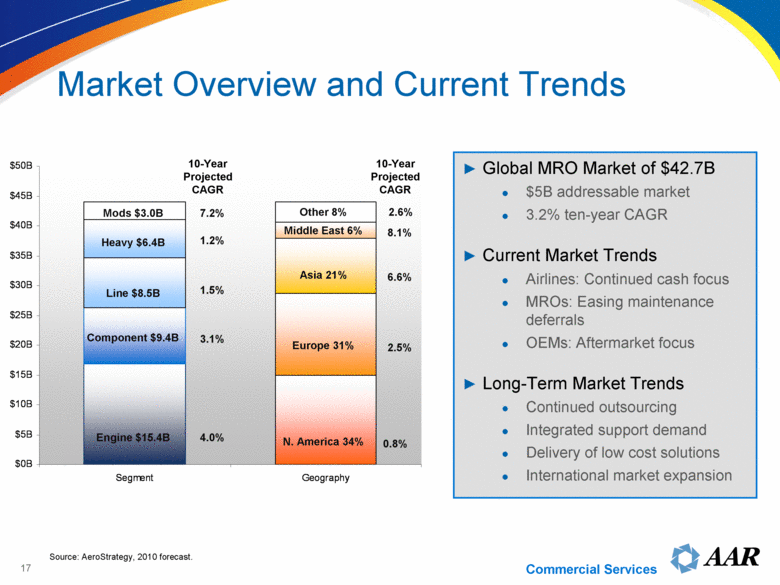
| Market Overview and Current Trends Engine $15.4B Mods $3.0B Heavy $6.4B Component $9.4B Line $8.5B Global MRO Market of $42.7B $5B addressable market 3.2% ten-year CAGR Current Market Trends Airlines: Continued cash focus MROs: Easing maintenance deferrals OEMs: Aftermarket focus Long-Term Market Trends Continued outsourcing Integrated support demand Delivery of low cost solutions International market expansion Source: AeroStrategy, 2010 forecast. Europe 31% N. America 34% Asia 21% Middle East 6% Other 8% 10-Year Projected CAGR 1.5% 4.0% 3.1% 10-Year Projected CAGR 7.2% 1.2% 6.6% 0.8% 2.5% 8.1% 2.6% Commercial Services $0B $5B $10B $15B $20B $25B $30B $35B $40B $45B $50B Segment Geography 17 |
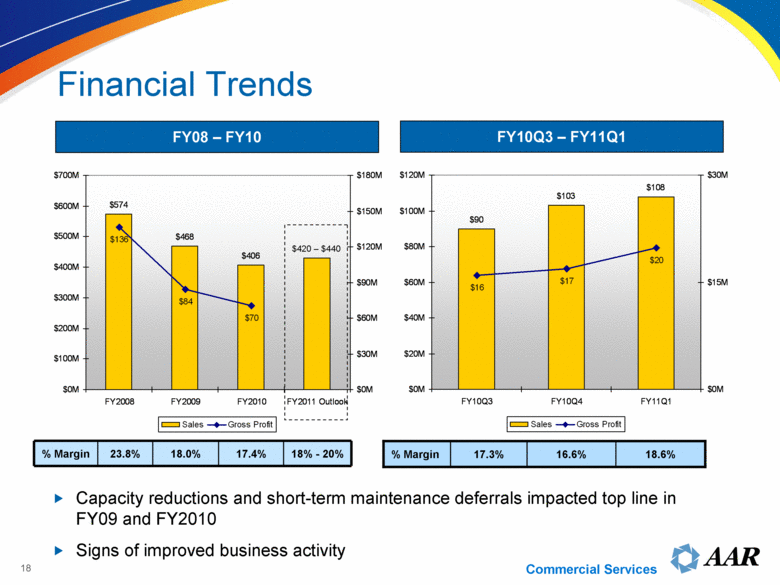
| Financial Trends 18 Capacity reductions and short-term maintenance deferrals impacted top line in FY09 and FY2010 Signs of improved business activity FY08 – FY10 FY10Q3 – FY11Q1 18.6% 16.6% 17.3% % Margin $420 – $440 % Margin 23.8% 18.0% 17.4% 18% - 20% Commercial Services $574 $468 $406 $136 $84 $70 $0M $100M $200M $300M $400M $500M $600M $700M FY2008 FY2009 FY2010 FY2011 Outlook $0M $30M $60M $90M $120M $150M $180M Sales Gross Profit $90 $103 $108 $16 $17 $20 $0M $20M $40M $60M $80M $100M $120M FY10Q3 FY10Q4 FY11Q1 $0M $15M $30M Sales Gross Profit |
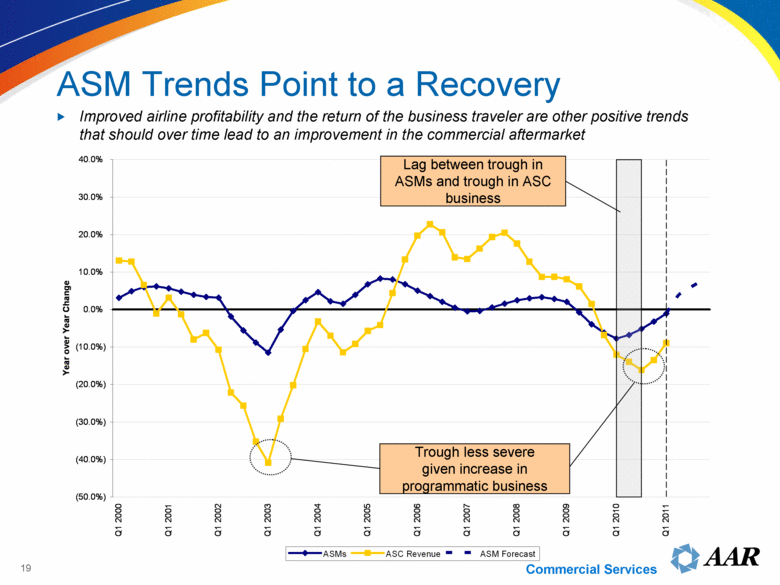
| Improved airline profitability and the return of the business traveler are other positive trends that should over time lead to an improvement in the commercial aftermarket ASM Trends Point to a Recovery Trough less severe given increase in programmatic business Lag between trough in ASMs and trough in ASC business Commercial Services (50.0%) (40.0%) (30.0%) (20.0%) (10.0%) 0.0% 10.0% 20.0% 30.0% 40.0% Q1 2000 Q1 2001 Q1 2002 Q1 2003 Q1 2004 Q1 2005 Q1 2006 Q1 2007 Q1 2008 Q1 2009 Q1 2010 Q1 2011 Year over Year Change ASMs ASC Revenue ASM Forecast 19 |
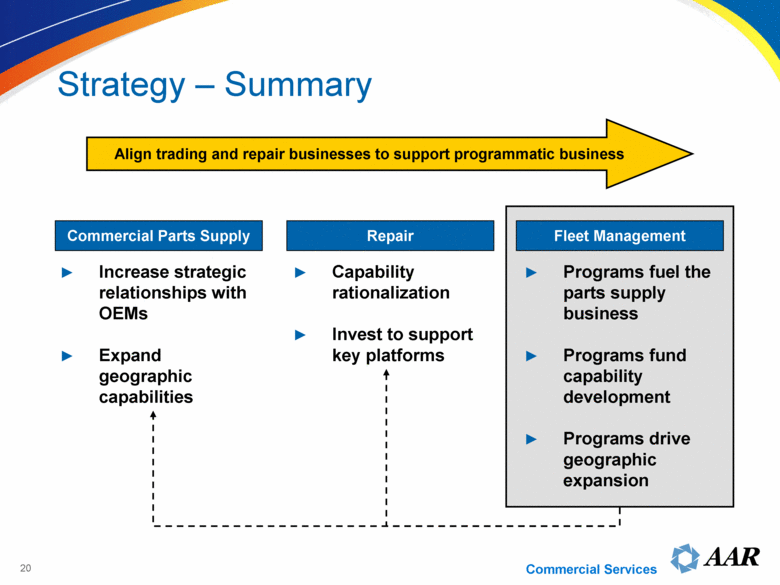
| Strategy – Summary Increase strategic relationships with OEMs Expand geographic capabilities Align trading and repair businesses to support programmatic business Capability rationalization Invest to support key platforms Programs fuel the parts supply business Programs fund capability development Programs drive geographic expansion Commercial Parts Supply Repair Fleet Management Commercial Services 20 |
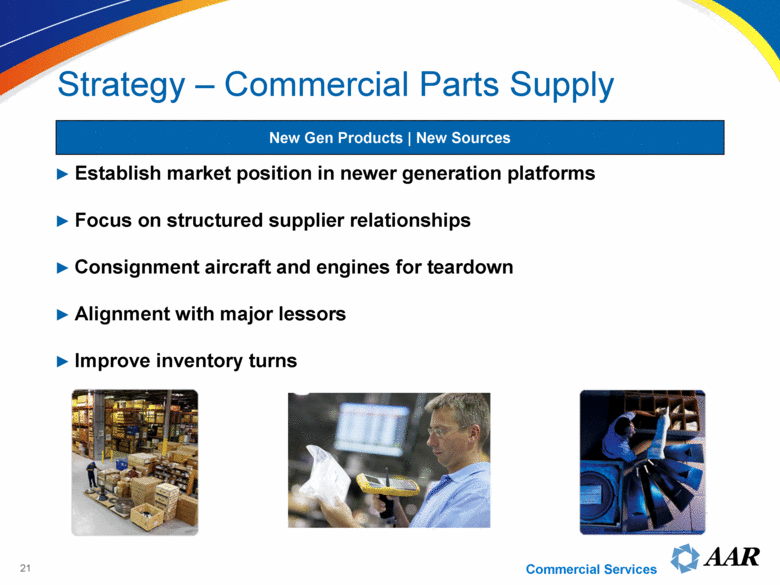
| Strategy – Commercial Parts Supply New Gen Products | New Sources Establish market position in newer generation platforms Focus on structured supplier relationships Consignment aircraft and engines for teardown Alignment with major lessors Improve inventory turns Commercial Services 21 |
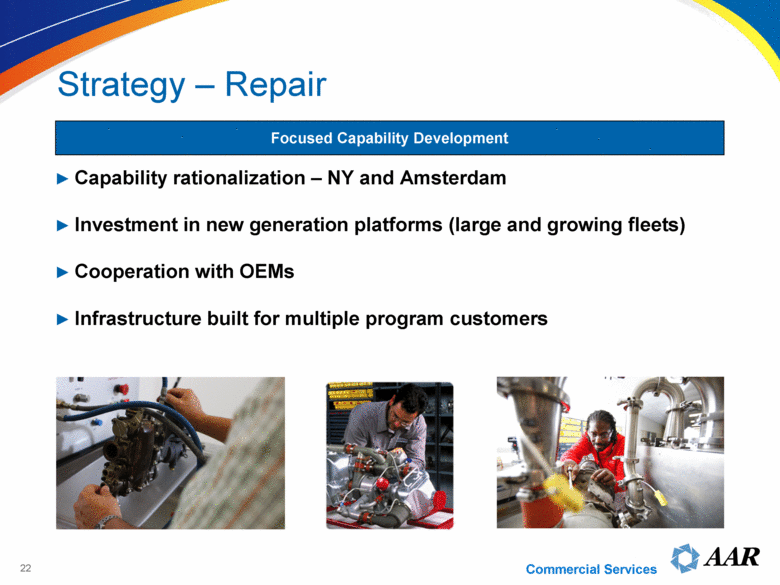
| Strategy – Repair Capability rationalization – NY and Amsterdam Investment in new generation platforms (large and growing fleets) Cooperation with OEMs Infrastructure built for multiple program customers Focused Capability Development Commercial Services 22 |
| Strategy – Fleet Management Air Canada Jazz: Full support for 70 regional jets Leverage existing inventory pool Foundation for growth with Air Canada Gulf Air: Inventory management – 33 Airbus and EJet First Airbus and EJet support program IT enhancements Gulf Region footprint Fleet Management Programs Leverage sourcing and repair infrastructure Offer highly customized operational solutions Drive lower cost through inventory optimization Form partnerships and alliances where necessary Program Examples Commercial Services 23 |
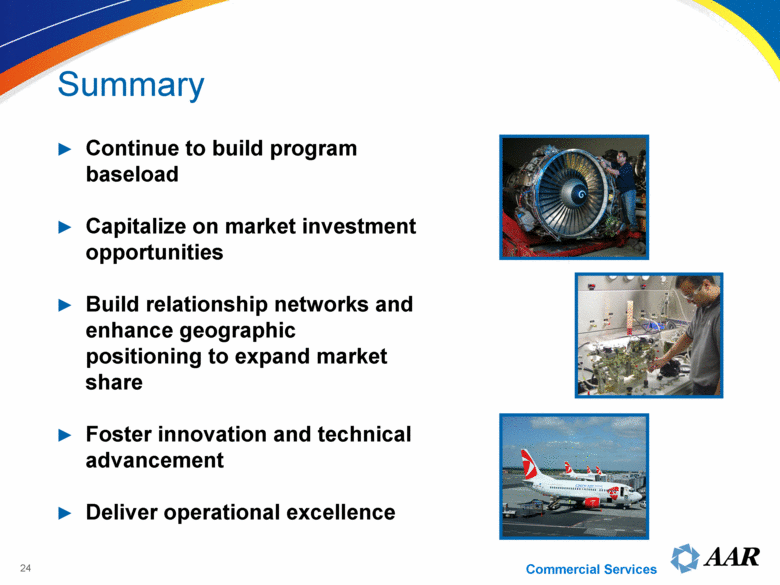
| Continue to build program baseload Capitalize on market investment opportunities Build relationship networks and enhance geographic positioning to expand market share Foster innovation and technical advancement Deliver operational excellence Summary Commercial Services 24 |
| Maintenance, Repair & Overhaul Dany Kleiman Group Vice President |
| Dany Kleiman Group Vice President, MRO Leads AAR’s Maintenance, Repair and Overhaul business, Landing Gear, PMA and Engineering Services Joined AAR CORP. in 2009 Career Highlights Israel Aerospace Industries Corporate VP & GM Bedek Aviation Group COO GM Production Division & Business Jet Programs of IAI’s Commercial Aircraft Group ISRAVIATION VP of Operations and Chief Engineer Major in Israeli Air-Force – 8 years of service Education BSE in Aeronautical Engineering from Israel Institute of Technology in Technion, Haifa, Israel 26 Commercial Services |

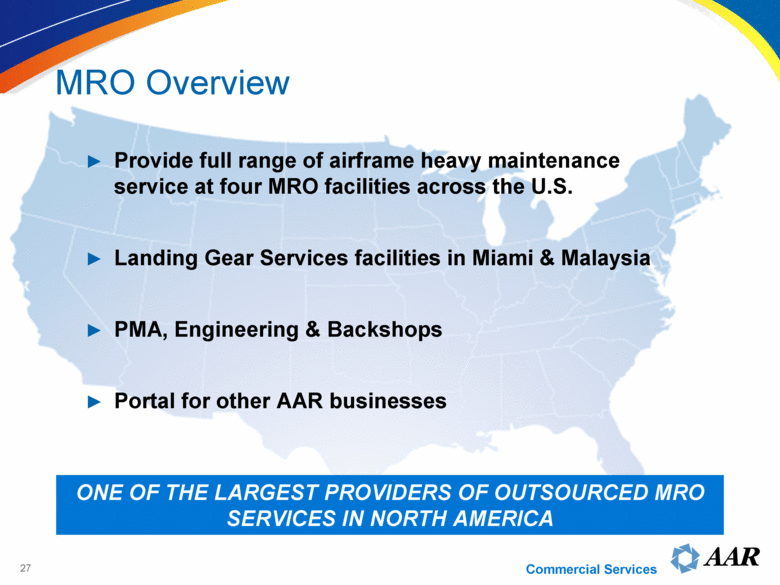
| 27 Provide full range of airframe heavy maintenance service at four MRO facilities across the U.S. Landing Gear Services facilities in Miami & Malaysia PMA, Engineering & Backshops Portal for other AAR businesses ONE OF THE LARGEST PROVIDERS OF OUTSOURCED MRO SERVICES IN NORTH AMERICA Commercial Services MRO Overview |
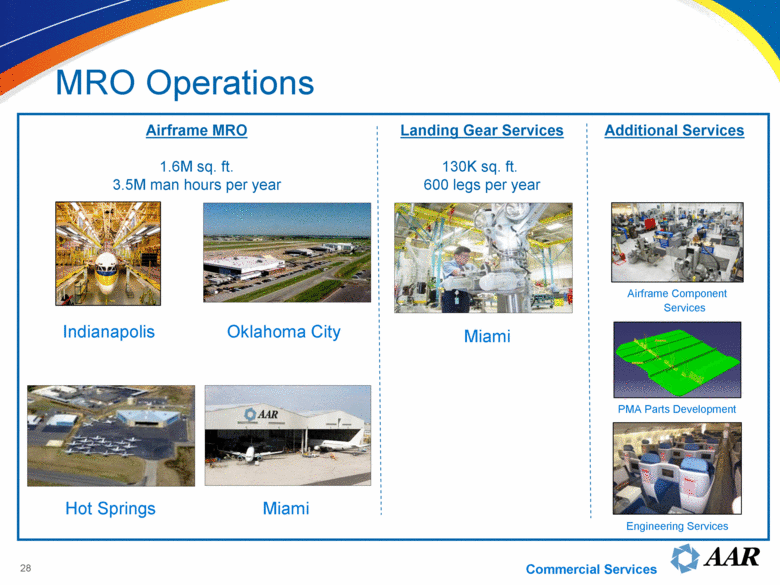
| MRO Operations Miami Hot Springs Indianapolis Miami Oklahoma City Airframe Component Services Engineering Services Landing Gear Services 130K sq. ft. 600 legs per year Airframe MRO 1.6M sq. ft. 3.5M man hours per year Additional Services PMA Parts Development Commercial Services 28 |
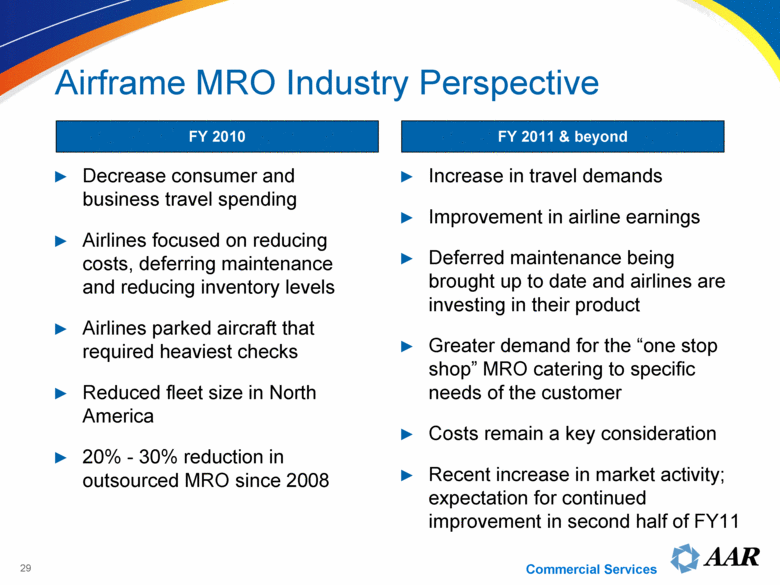
| Decrease consumer and business travel spending Airlines focused on reducing costs, deferring maintenance and reducing inventory levels Airlines parked aircraft that required heaviest checks Reduced fleet size in North America 20% - 30% reduction in outsourced MRO since 2008 FY 2010 FY 2011 & beyond Increase in travel demands Improvement in airline earnings Deferred maintenance being brought up to date and airlines are investing in their product Greater demand for the “one stop shop” MRO catering to specific needs of the customer Costs remain a key consideration Recent increase in market activity; expectation for continued improvement in second half of FY11 Commercial Services Airframe MRO Industry Perspective 29 |
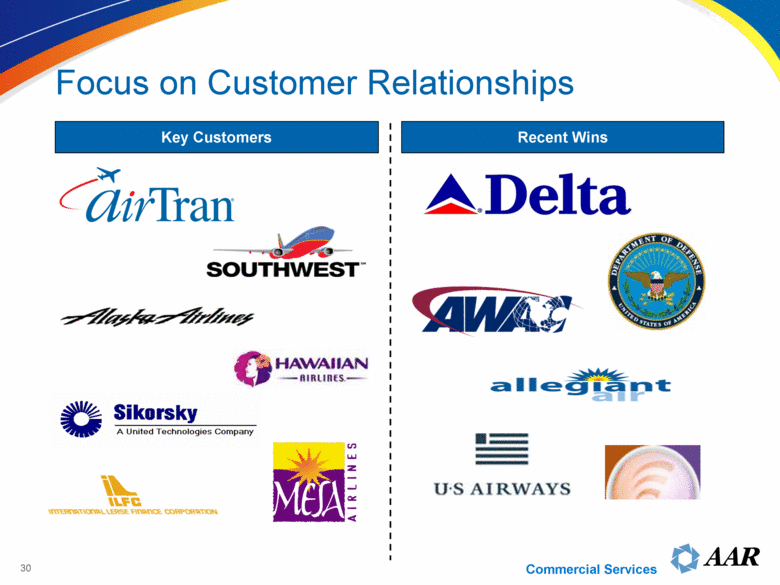
| Key Customers Recent Wins Commercial Services Focus on Customer Relationships 30 |
| Best Value to Customer Improve Execution Top quality fully integrated service provider Exceed customer expectations Bundle services and additional value added product lines Flexibility to our customers Cost competitive “One MRO” concept for all facilities Quality and safety management program LEAN implementation to enhance operational excellence Consolidate and leverage procurement efforts Leverage infrastructure for additional revenue Commercial Services Plan for Higher Profitability & Cash Generation 31 |

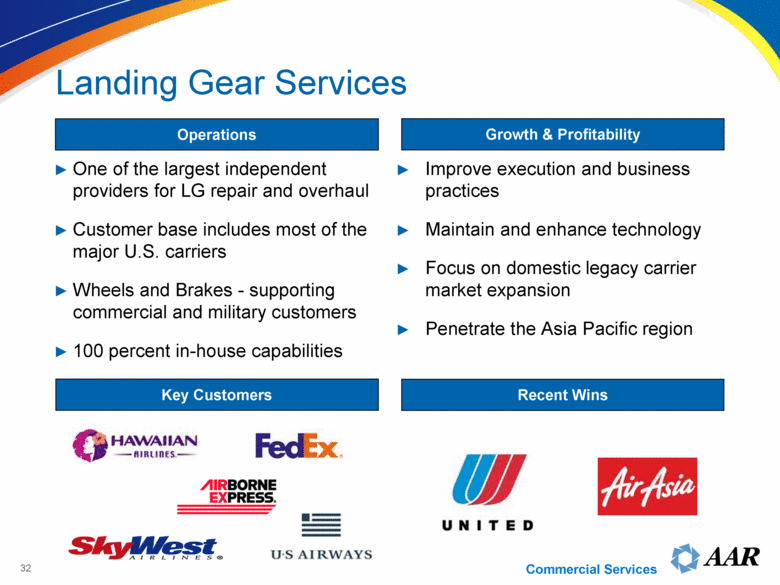
| One of the largest independent providers for LG repair and overhaul Customer base includes most of the major U.S. carriers Wheels and Brakes - supporting commercial and military customers 100 percent in-house capabilities Improve execution and business practices Maintain and enhance technology Focus on domestic legacy carrier market expansion Penetrate the Asia Pacific region Operations Growth & Profitability Key Customers Recent Wins Commercial Services Landing Gear Services 32 |
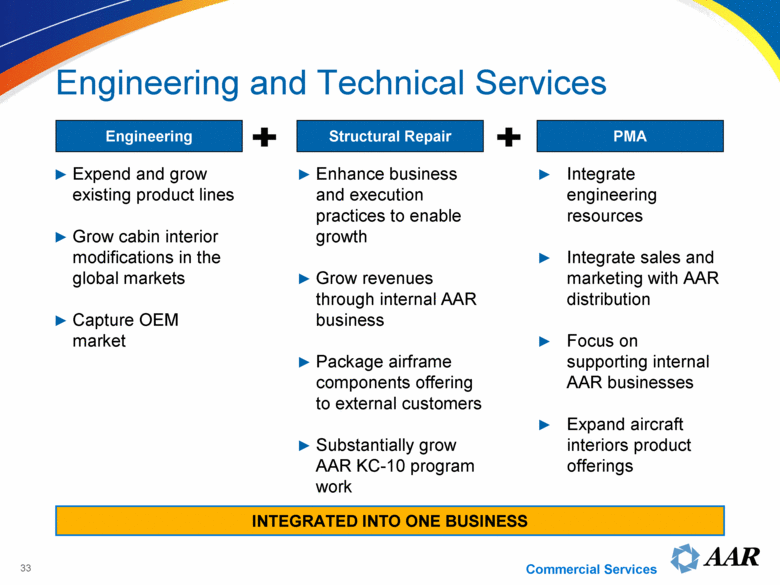
| Expend and grow existing product lines Grow cabin interior modifications in the global markets Capture OEM market Enhance business and execution practices to enable growth Grow revenues through internal AAR business Package airframe components offering to external customers Substantially grow AAR KC-10 program work Integrate engineering resources Integrate sales and marketing with AAR distribution Focus on supporting internal AAR businesses Expand aircraft interiors product offerings Engineering Structural Repair PMA INTEGRATED INTO ONE BUSINESS Commercial Services Engineering and Technical Services 33 |
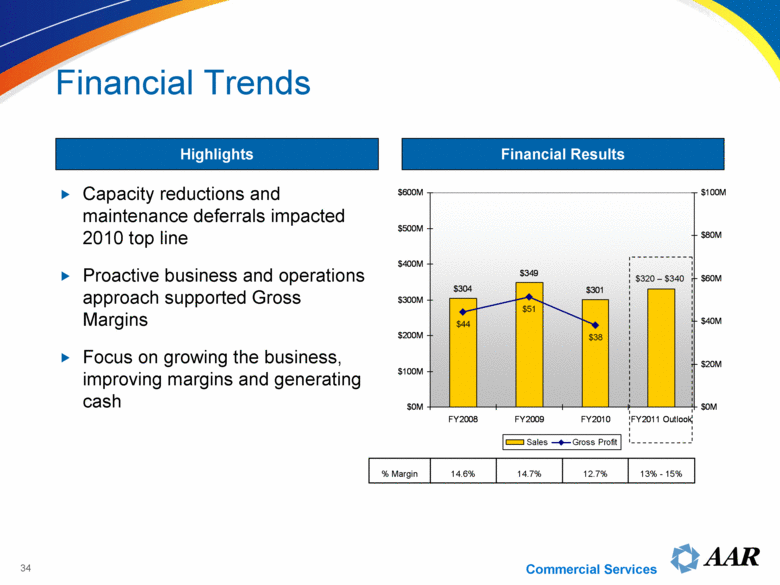
| 34 Capacity reductions and maintenance deferrals impacted 2010 top line Proactive business and operations approach supported Gross Margins Focus on growing the business, improving margins and generating cash Highlights Financial Results 13% - 15% 12.7% 14.7% 14.6% % Margin $320 – $340 Commercial Services Financial Trends $304 $349 $301 $44 $51 $38 $0M $100M $200M $300M $400M $500M $600M FY2008 FY2009 FY2010 FY2011 Outlook $0M $20M $40M $60M $80M $100M Sales Gross Profit |
| “Top Quality Fully Integrated Service Provider” Increase market share Innovative product line offering Improve execution Drive efficiencies Enhance profitability and cash generation Commercial Services Outlook & Summary 35 |
| Structures & Systems Terry Stinson Group Vice President |
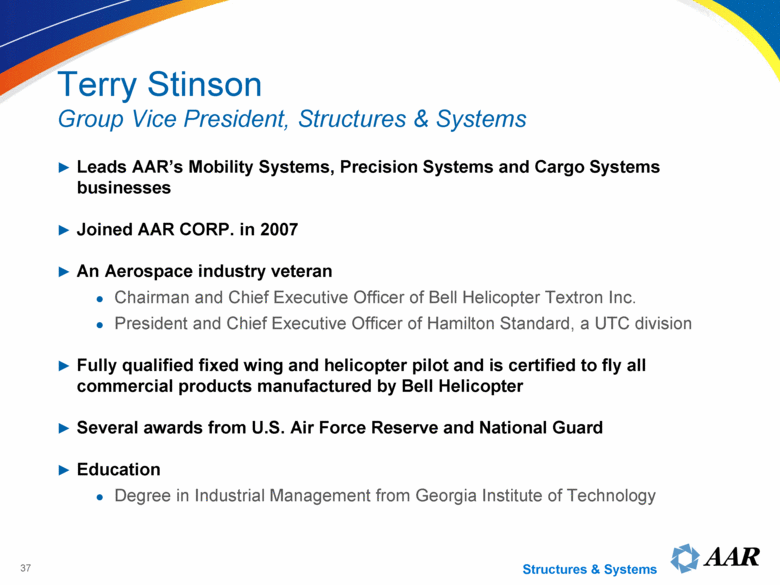
| 37 Leads AAR’s Mobility Systems, Precision Systems and Cargo Systems businesses Joined AAR CORP. in 2007 An Aerospace industry veteran Chairman and Chief Executive Officer of Bell Helicopter Textron Inc. President and Chief Executive Officer of Hamilton Standard, a UTC division Fully qualified fixed wing and helicopter pilot and is certified to fly all commercial products manufactured by Bell Helicopter Several awards from U.S. Air Force Reserve and National Guard Education Degree in Industrial Management from Georgia Institute of Technology Terry Stinson Group Vice President, Structures & Systems Structures & Systems |
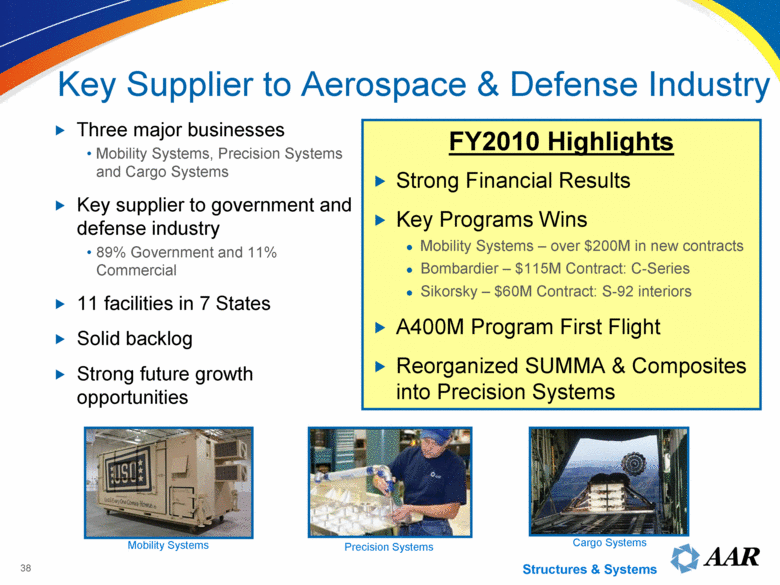
| Three major businesses Mobility Systems, Precision Systems and Cargo Systems Key supplier to government and defense industry 89% Government and 11% Commercial 11 facilities in 7 States Solid backlog Strong future growth opportunities Key Supplier to Aerospace & Defense Industry 38 Mobility Systems Cargo Systems FY2010 Highlights Strong Financial Results Key Programs Wins Mobility Systems – over $200M in new contracts Bombardier – $115M Contract: C-Series Sikorsky – $60M Contract: S-92 interiors A400M Program First Flight Reorganized SUMMA & Composites into Precision Systems Precision Systems Structures & Systems |
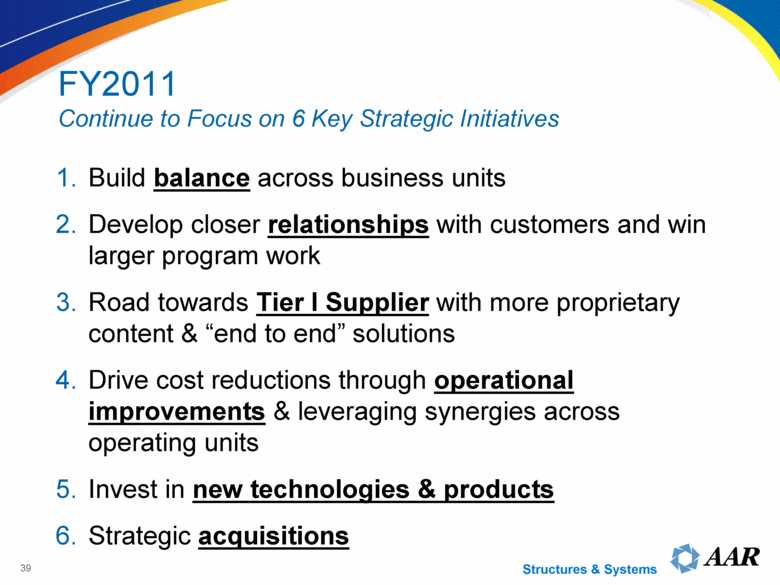
| FY2011 Continue to Focus on 6 Key Strategic Initiatives 1. Build balance across business units 2. Develop closer relationships with customers and win larger program work 3. Road towards Tier I Supplier with more proprietary content & “end to end” solutions 4. Drive cost reductions through operational improvements & leveraging synergies across operating units 5. Invest in new technologies & products 6. Strategic acquisitions 39 Structures & Systems |
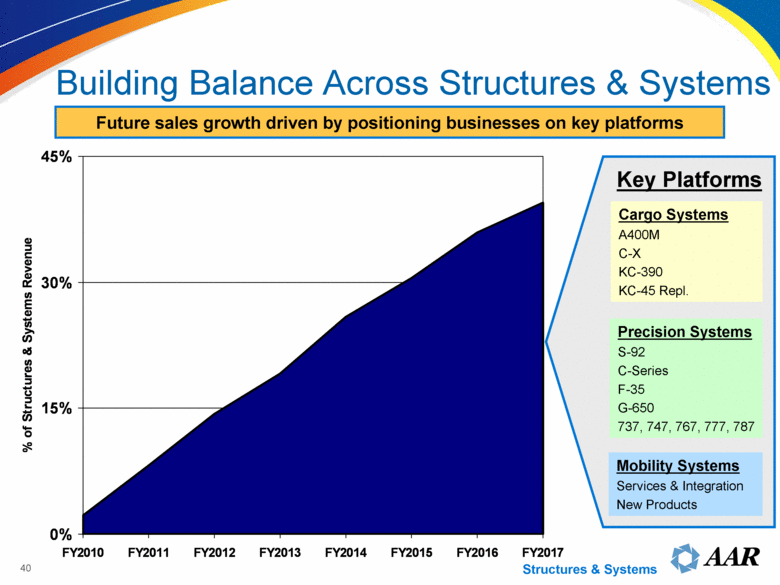
| Building Balance Across Structures & Systems Future sales growth driven by positioning businesses on key platforms 40 Cargo Systems A400M C-X KC-390 KC-45 Repl. Precision Systems S-92 C-Series F-35 G-650 737, 747, 767, 777, 787 Key Platforms Mobility Systems Services & Integration New Products Structures & Systems 0% 15% 30% 45% FY2010 FY2011 FY2012 FY2013 FY2014 FY2015 FY2016 FY2017 % of Structures & Systems Revenue |
| Cargo Systems |

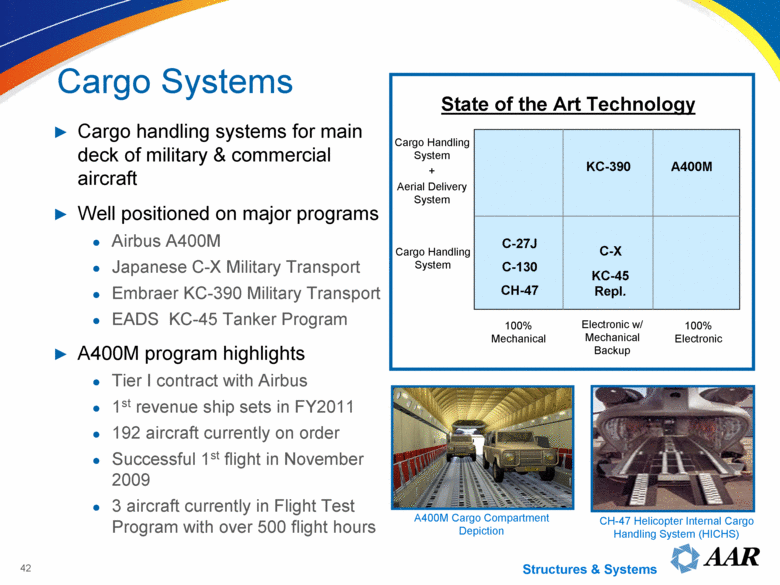
| Cargo handling systems for main deck of military & commercial aircraft Well positioned on major programs Airbus A400M Japanese C-X Military Transport Embraer KC-390 Military Transport EADS KC-45 Tanker Program A400M program highlights Tier I contract with Airbus 1st revenue ship sets in FY2011 192 aircraft currently on order Successful 1st flight in November 2009 3 aircraft currently in Flight Test Program with over 500 flight hours 42 State of the Art Technology 100% Mechanical 100% Electronic Electronic w/ Mechanical Backup Cargo Handling System Cargo Handling System + Aerial Delivery System A400M KC-390 C-X KC-45 Repl. C-27J C-130 CH-47 A400M Cargo Compartment Depiction CH-47 Helicopter Internal Cargo Handling System (HICHS) Structures & Systems Cargo Systems |
| Acquisitions Invest in New Technology & Products Continuous Improvements Tier I Supplier Customer Relationships Build Balance Capitalize on Technology & Systems Integration capabilities Grow share of conversion market Enter commercial OEM market Diversify into complimentary areas Maintain & grow Tier I relationships with key customers Continue to invest in next generation capabilities Evaluate acquisitions to grow market share 43 Structures & Systems Cargo Systems Excellence in Cargo System Technology & Systems Integration |

| Precision Systems |

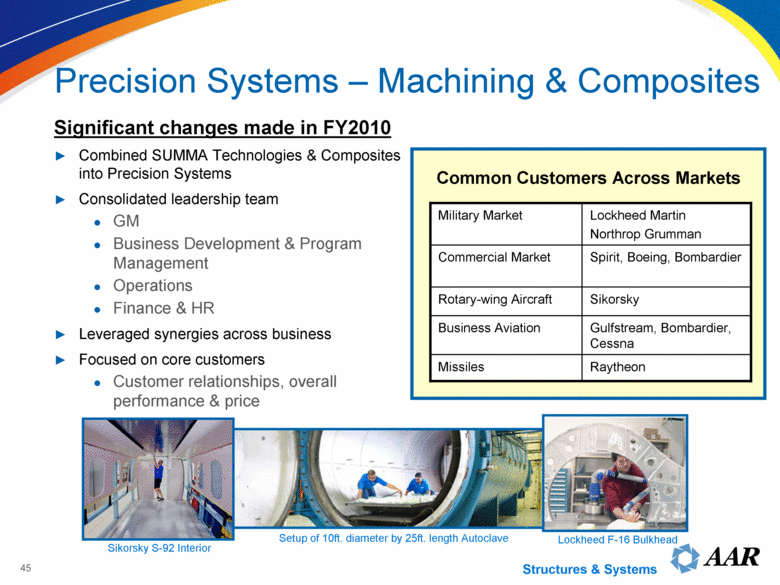
| Common Customers Across Markets Significant changes made in FY2010 Combined SUMMA Technologies & Composites into Precision Systems Consolidated leadership team GM Business Development & Program Management Operations Finance & HR Leveraged synergies across business Focused on core customers Customer relationships, overall performance & price Gulfstream, Bombardier, Cessna Business Aviation Spirit, Boeing, Bombardier Commercial Market Sikorsky Rotary-wing Aircraft Raytheon Missiles Lockheed Martin Northrop Grumman Military Market Sikorsky S-92 Interior Setup of 10ft. diameter by 25ft. length Autoclave Lockheed F-16 Bulkhead Structures & Systems Precision Systems – Machining & Composites 45 |
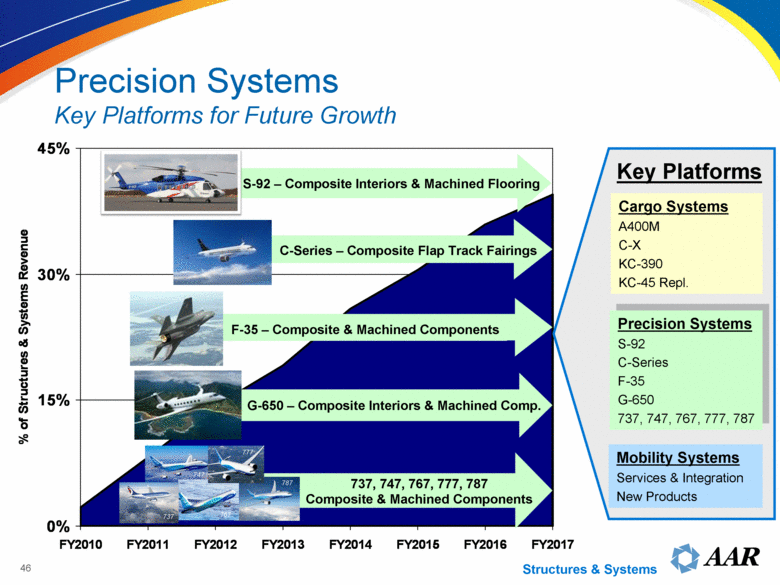
| Precision Systems Key Platforms for Future Growth G-650 – Composite Interiors & Machined Comp. C-Series – Composite Flap Track Fairings F-35 – Composite & Machined Components S-92 – Composite Interiors & Machined Flooring 46 737, 747, 767, 777, 787 Composite & Machined Components 787 747 767 777 737 Cargo Systems A400M C-X KC-390 KC-45 Repl. Precision Systems S-92 C-Series F-35 G-650 737, 747, 767, 777, 787 Key Platforms Mobility Systems Services & Integration New Products Structures & Systems 0% 15% 30% 45% FY2010 FY2011 FY2012 FY2013 FY2014 FY2015 FY2016 FY2017 % of Structures & Systems Revenue |
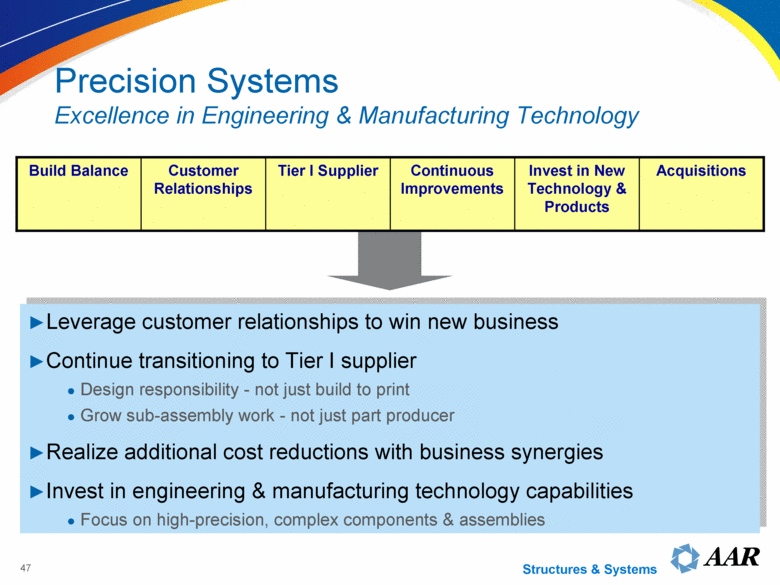
| Leverage customer relationships to win new business Continue transitioning to Tier I supplier Design responsibility - not just build to print Grow sub-assembly work - not just part producer Realize additional cost reductions with business synergies Invest in engineering & manufacturing technology capabilities Focus on high-precision, complex components & assemblies 47 Acquisitions Invest in New Technology & Products Continuous Improvements Tier I Supplier Customer Relationships Build Balance Structures & Systems Precision Systems Excellence in Engineering & Manufacturing Technology |
| Mobility Systems |
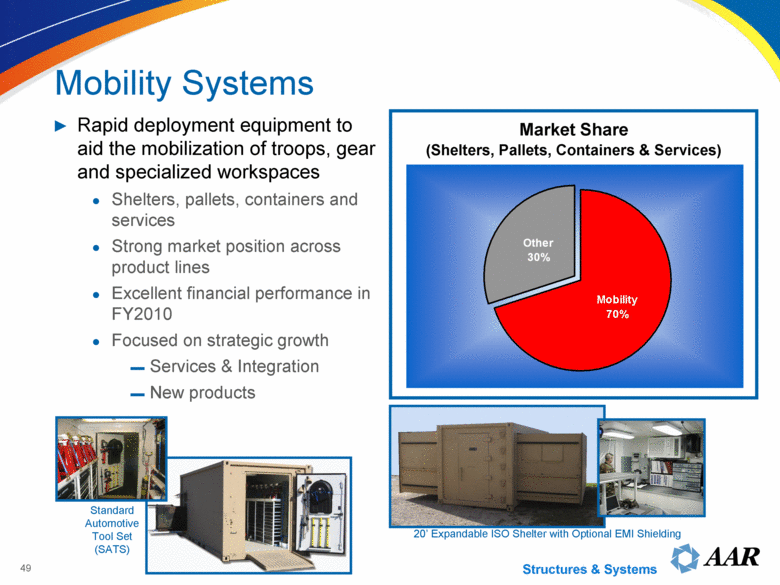
| 49 Standard Automotive Tool Set (SATS) 20’ Expandable ISO Shelter with Optional EMI Shielding Rapid deployment equipment to aid the mobilization of troops, gear and specialized workspaces Shelters, pallets, containers and services Strong market position across product lines Excellent financial performance in FY2010 Focused on strategic growth Services & Integration New products Market Share (Shelters, Pallets, Containers & Services) Structures & Systems Mobility Systems Mobility 70% Other 30% |
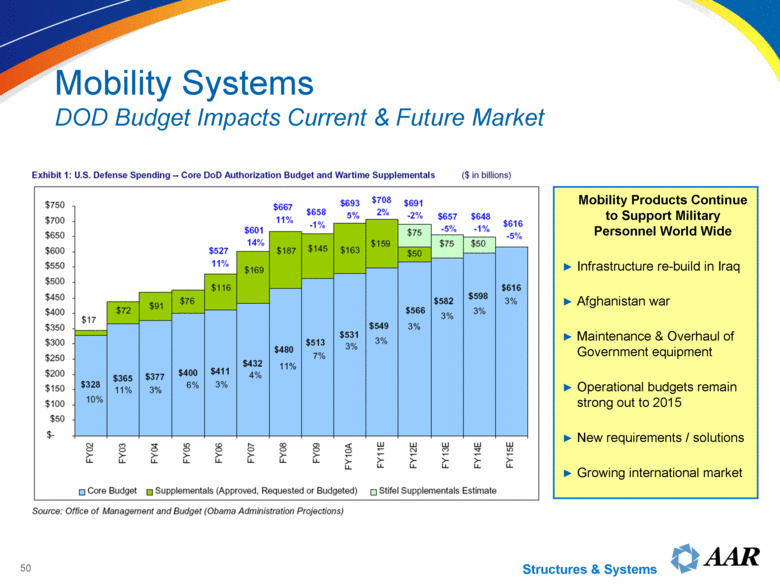
| Mobility Systems DOD Budget Impacts Current & Future Market Mobility Products Continue to Support Military Personnel World Wide Infrastructure re-build in Iraq Afghanistan war Maintenance & Overhaul of Government equipment Operational budgets remain strong out to 2015 New requirements / solutions Growing international market Structures & Systems Source Office of Management and Budget (Obama Administration Projections) 50 |
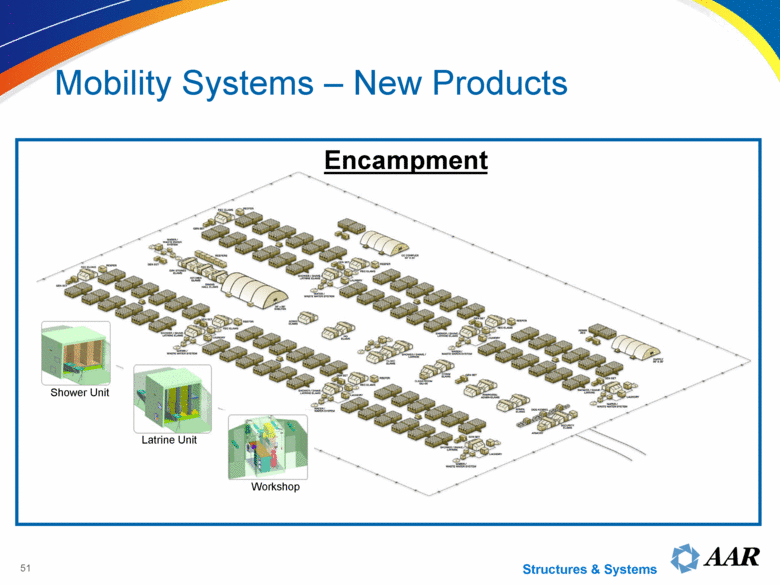
| Encampment 51 Shower Unit Latrine Unit Workshop Structures & Systems Mobility Systems – New Products |
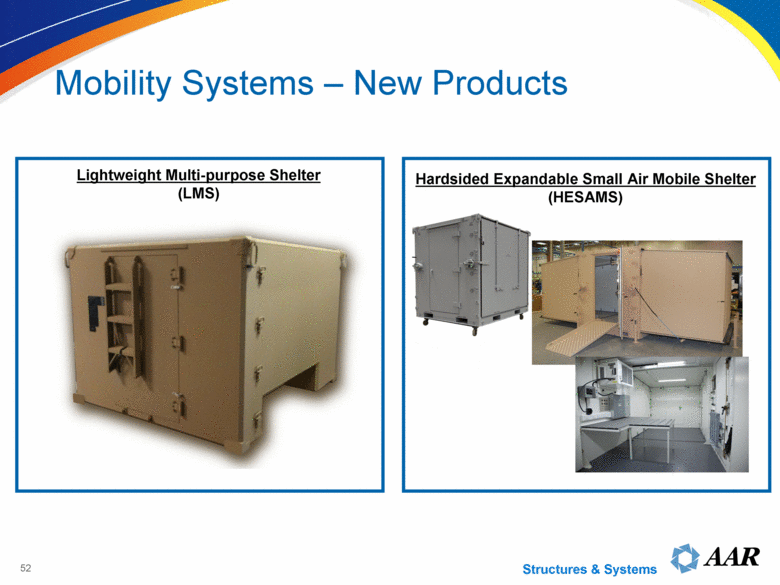
| Hardsided Expandable Small Air Mobile Shelter (HESAMS) 52 Lightweight Multi-purpose Shelter (LMS) Structures & Systems Mobility Systems – New Products |
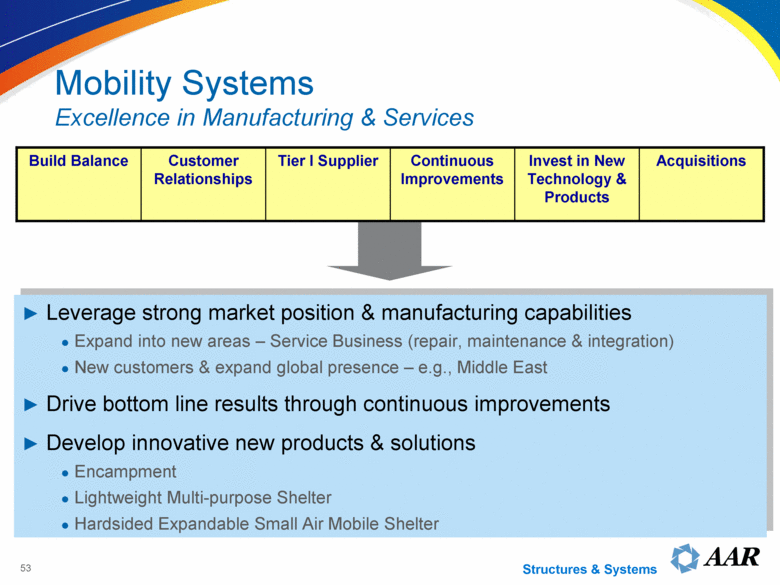
| Leverage strong market position & manufacturing capabilities Expand into new areas – Service Business (repair, maintenance & integration) New customers & expand global presence – e.g., Middle East Drive bottom line results through continuous improvements Develop innovative new products & solutions Encampment Lightweight Multi-purpose Shelter Hardsided Expandable Small Air Mobile Shelter 53 Acquisitions Invest in New Technology & Products Continuous Improvements Tier I Supplier Customer Relationships Build Balance Structures & Systems Mobility Systems Excellence in Manufacturing & Services |
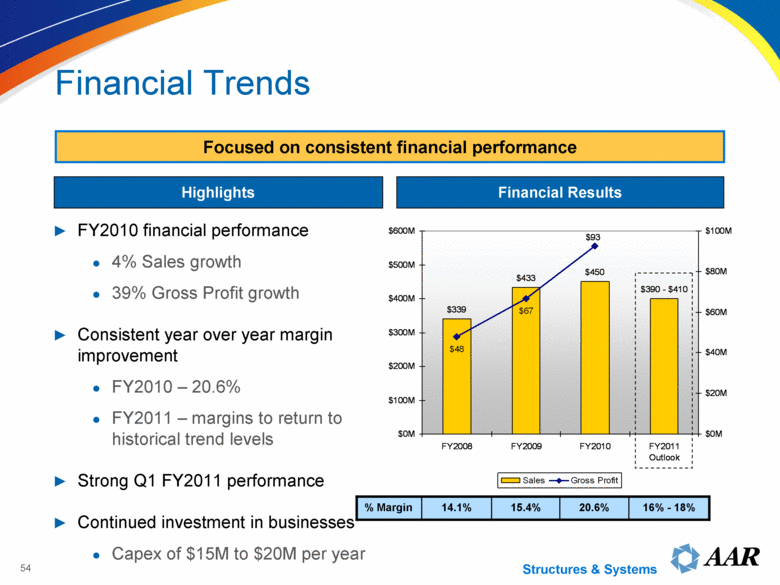
| 54 FY2010 financial performance 4% Sales growth 39% Gross Profit growth Consistent year over year margin improvement FY2010 – 20.6% FY2011 – margins to return to historical trend levels Strong Q1 FY2011 performance Continued investment in businesses Capex of $15M to $20M per year Highlights Financial Results 20.6% 16% - 18% 15.4% 14.1% % Margin Focused on consistent financial performance Structures & Systems Financial Trends $339 $433 $450 $390 - $410 $48 $67 $93 $0M $100M $200M $300M $400M $500M $600M FY2008 FY2009 FY2010 FY2011 Outlook $0M $20M $40M $60M $80M $100M Sales Gross Profit |
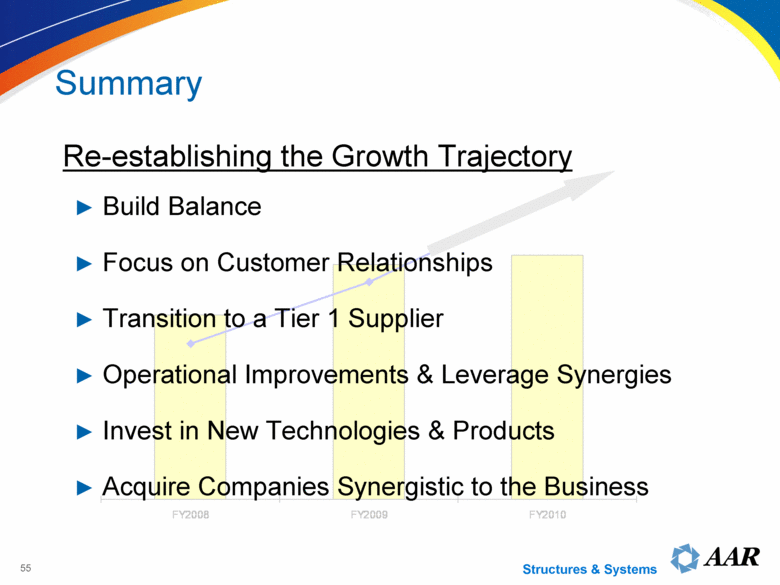
| Build Balance Focus on Customer Relationships Transition to a Tier 1 Supplier Operational Improvements & Leverage Synergies Invest in New Technologies & Products Acquire Companies Synergistic to the Business 55 Re-establishing the Growth Trajectory Structures & Systems Summary |
| Government & Defense Services Randy Martinez Group Vice President |

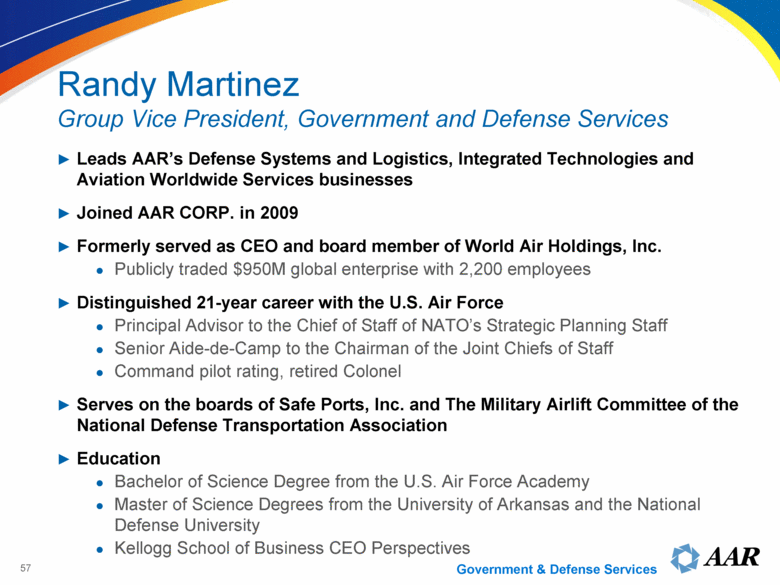
| Leads AAR’s Defense Systems and Logistics, Integrated Technologies and Aviation Worldwide Services businesses Joined AAR CORP. in 2009 Formerly served as CEO and board member of World Air Holdings, Inc. Publicly traded $950M global enterprise with 2,200 employees Distinguished 21-year career with the U.S. Air Force Principal Advisor to the Chief of Staff of NATO’s Strategic Planning Staff Senior Aide-de-Camp to the Chairman of the Joint Chiefs of Staff Command pilot rating, retired Colonel Serves on the boards of Safe Ports, Inc. and The Military Airlift Committee of the National Defense Transportation Association Education Bachelor of Science Degree from the U.S. Air Force Academy Master of Science Degrees from the University of Arkansas and the National Defense University Kellogg School of Business CEO Perspectives Randy Martinez Group Vice President, Government and Defense Services Government & Defense Services 57 |
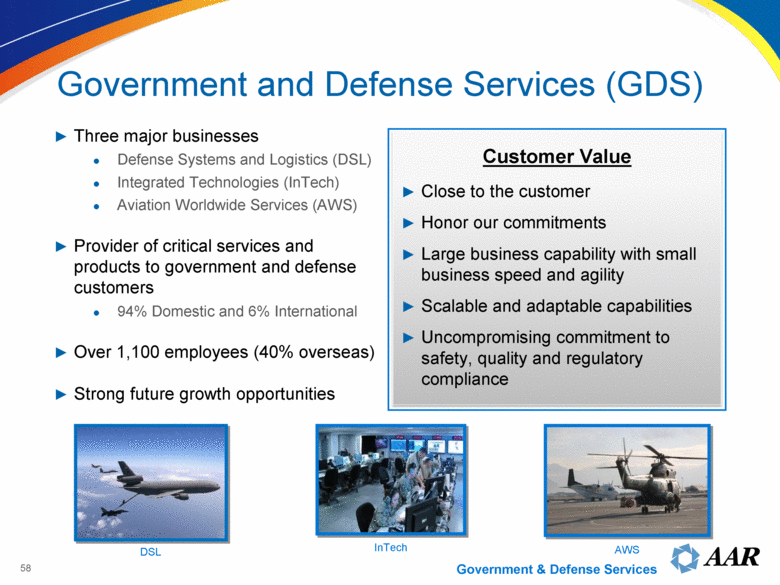
| Three major businesses Defense Systems and Logistics (DSL) Integrated Technologies (InTech) Aviation Worldwide Services (AWS) Provider of critical services and products to government and defense customers 94% Domestic and 6% International Over 1,100 employees (40% overseas) Strong future growth opportunities Government and Defense Services (GDS) DSL InTech AWS Close to the customer Honor our commitments Large business capability with small business speed and agility Scalable and adaptable capabilities Uncompromising commitment to safety, quality and regulatory compliance Customer Value Government & Defense Services 58 |
| Formation of Government and Defense Services group Highest annual revenue, gross margin and operating profit in DSL history KC-10 supply chain award InTech (formerly Brown International) repositioned strategy and streamlined operations Aviation Worldwide Services acquisition Expanded global presence Key Strengths and Business Highlights Diversified portfolio of products and services to government and defense customers Support U.S. and foreign governments and OEMs for mission critical programs Defensible market niches Offers services and capabilities in areas of budgetary priority Strong business development pipeline Key Highlights Key Strengths Government & Defense Services 59 |
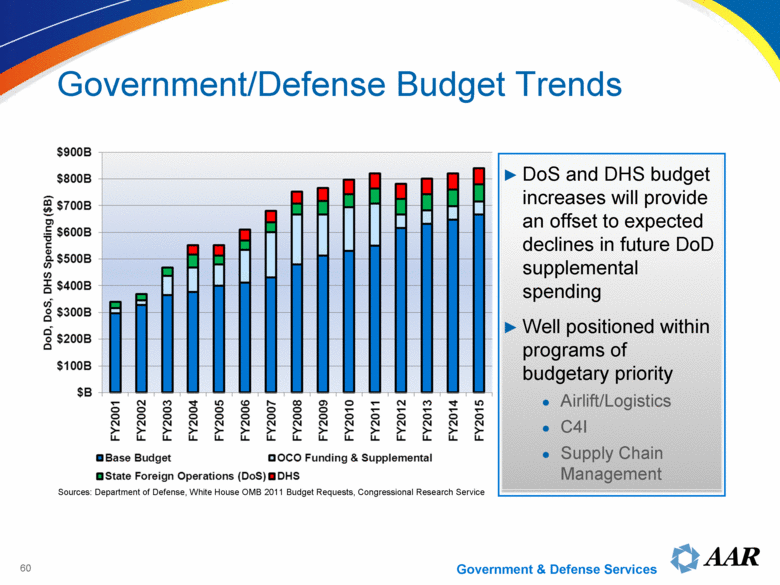
| Sources: Department of Defense, White House OMB 2011 Budget Requests, Congressional Research Service Government/Defense Budget Trends DoS and DHS budget increases will provide an offset to expected declines in future DoD supplemental spending Well positioned within programs of budgetary priority Airlift/Logistics C4I Supply Chain Management Government & Defense Services 60 |
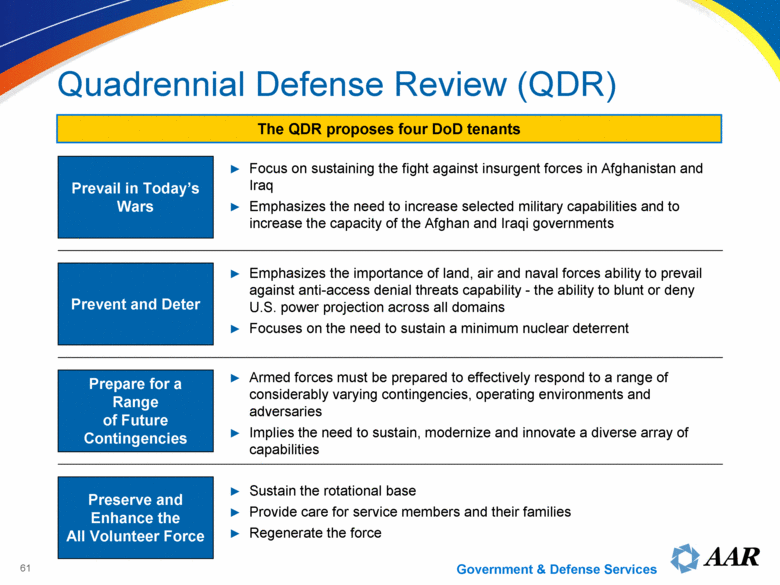
| Quadrennial Defense Review (QDR) The QDR proposes four DoD tenants Focus on sustaining the fight against insurgent forces in Afghanistan and Iraq Emphasizes the need to increase selected military capabilities and to increase the capacity of the Afghan and Iraqi governments Prevail in Today’s Wars Emphasizes the importance of land, air and naval forces ability to prevail against anti-access denial threats capability - the ability to blunt or deny U.S. power projection across all domains Focuses on the need to sustain a minimum nuclear deterrent Prevent and Deter Armed forces must be prepared to effectively respond to a range of considerably varying contingencies, operating environments and adversaries Implies the need to sustain, modernize and innovate a diverse array of capabilities Prepare for a Range of Future Contingencies Sustain the rotational base Provide care for service members and their families Regenerate the force Preserve and Enhance the All Volunteer Force Government & Defense Services 61 |
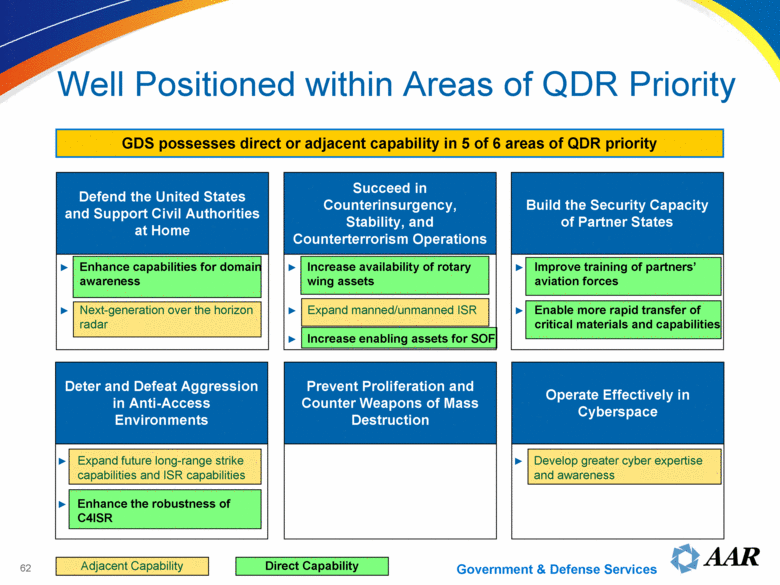
| Well Positioned within Areas of QDR Priority GDS possesses direct or adjacent capability in 5 of 6 areas of QDR priority Government & Defense Services Enhance capabilities for domain awareness Next-generation over the horizon radar Increase availability of rotary wing assets Expand manned/unmanned ISR Increase enabling assets for SOF Improve training of partners’ aviation forces Enable more rapid transfer of critical materials and capabilities Expand future long-range strike capabilities and ISR capabilities Enhance the robustness of C4ISR Develop greater cyber expertise and awareness Defend the United States and Support Civil Authorities at Home Succeed in Counterinsurgency, Stability, and Counterterrorism Operations Build the Security Capacity of Partner States Deter and Defeat Aggression in Anti-Access Environments Prevent Proliferation and Counter Weapons of Mass Destruction Operate Effectively in Cyberspace Adjacent Capability Direct Capability 62 |
| Defense Systems and Logistics |
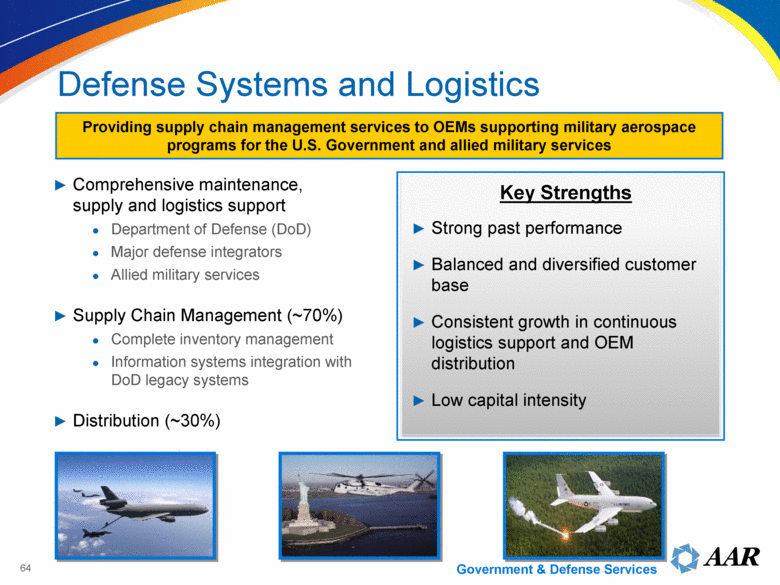
| Comprehensive maintenance, supply and logistics support Department of Defense (DoD) Major defense integrators Allied military services Supply Chain Management (~70%) Complete inventory management Information systems integration with DoD legacy systems Distribution (~30%) Strong past performance Balanced and diversified customer base Consistent growth in continuous logistics support and OEM distribution Low capital intensity Providing supply chain management services to OEMs supporting military aerospace programs for the U.S. Government and allied military services Key Strengths Government & Defense Services Defense Systems and Logistics 64 |
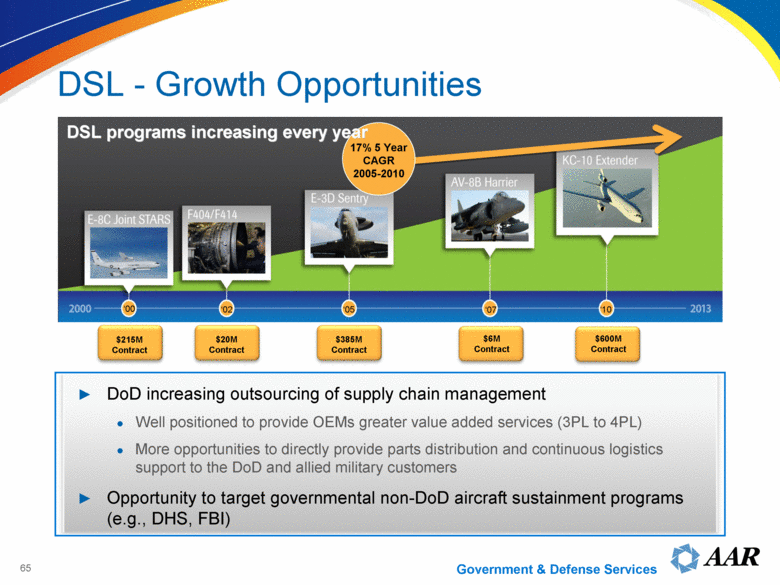
| DSL - Growth Opportunities 17% 5 Year CAGR 2005-2010 DSL programs increasing every year $600M Contract $385M Contract $20M Contract $215M Contract $6M Contract DoD increasing outsourcing of supply chain management Well positioned to provide OEMs greater value added services (3PL to 4PL) More opportunities to directly provide parts distribution and continuous logistics support to the DoD and allied military customers Opportunity to target governmental non-DoD aircraft sustainment programs (e.g., DHS, FBI) ‘02 ‘05 ‘07 ‘10 ‘00 Government & Defense Services E-8C Joint STARS F404/F414 E-3D Sentry AV-8B Harrier KC-10 Extender 2000 2013 65 |
| Integrated Technologies |

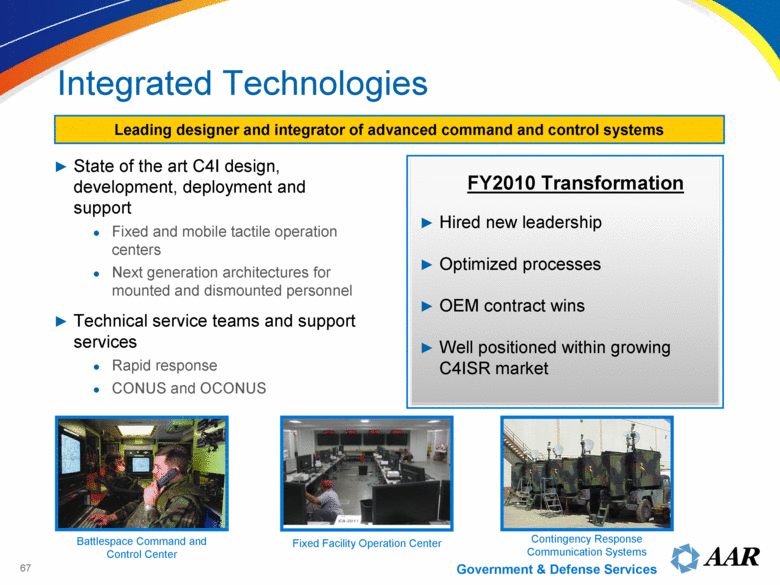
| State of the art C4I design, development, deployment and support Fixed and mobile tactile operation centers Next generation architectures for mounted and dismounted personnel Technical service teams and support services Rapid response CONUS and OCONUS Hired new leadership Optimized processes OEM contract wins Well positioned within growing C4ISR market Leading designer and integrator of advanced command and control systems Contingency Response Communication Systems Fixed Facility Operation Center Battlespace Command and Control Center FY2010 Transformation Government & Defense Services Integrated Technologies 67 |
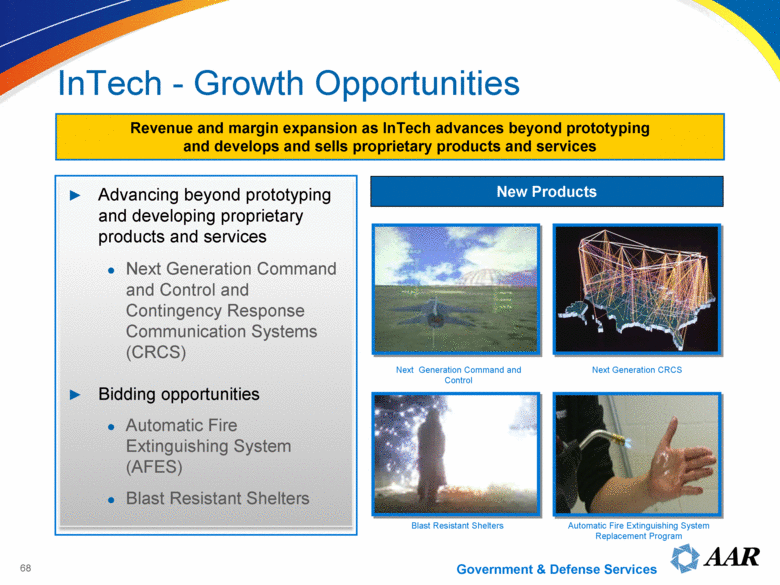
| Advancing beyond prototyping and developing proprietary products and services Next Generation Command and Control and Contingency Response Communication Systems (CRCS) Bidding opportunities Automatic Fire Extinguishing System (AFES) Blast Resistant Shelters InTech - Growth Opportunities New Products Blast Resistant Shelters Next Generation Command and Control Automatic Fire Extinguishing System Replacement Program Next Generation CRCS Revenue and margin expansion as InTech advances beyond prototyping and develops and sells proprietary products and services Government & Defense Services 68 |
| Aviation Worldwide Services |

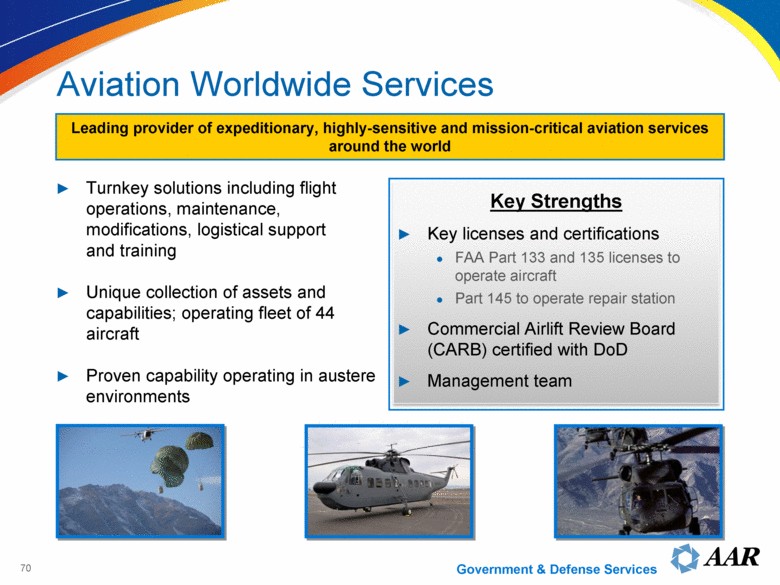
| Turnkey solutions including flight operations, maintenance, modifications, logistical support and training Unique collection of assets and capabilities; operating fleet of 44 aircraft Proven capability operating in austere environments Leading provider of expeditionary, highly-sensitive and mission-critical aviation services around the world Key licenses and certifications FAA Part 133 and 135 licenses to operate aircraft Part 145 to operate repair station Commercial Airlift Review Board (CARB) certified with DoD Management team Key Strengths Government & Defense Services Aviation Worldwide Services 70 |
| Aviation Worldwide Services Post Acquisition Highlights Task Accomplishments Upgrade Leadership Team Reorganized and simplified reporting structure Hired outstanding leaders Safety and Compliance Focus on relationship with the FAA and key customers Top to bottom compliance review Relentless focus on safety and compliance Improve Operational Reliability Focus on mission capable rates In-sourced supply chain management Instituted process driven maintenance planning Relocation and Re-branding Relocation in calendar year 2011 Renaming and re-branding tied to relocation Government & Defense Services 71 |
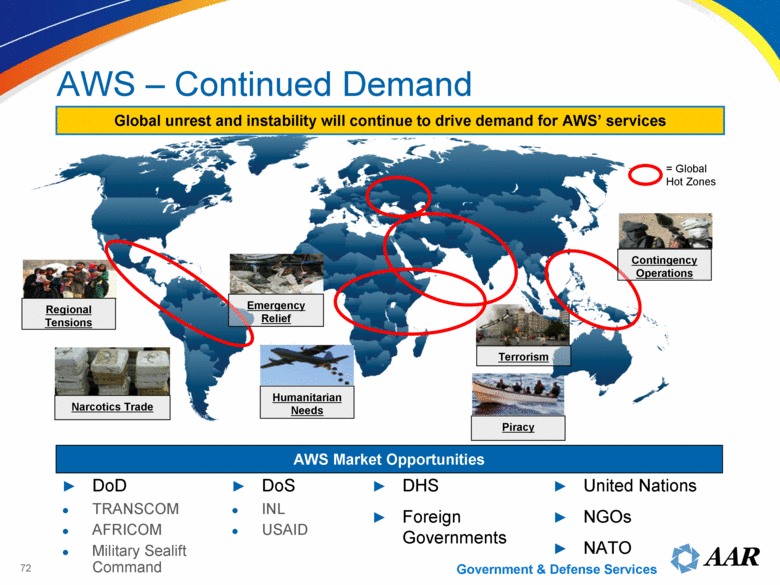
| AWS – Continued Demand Global unrest and instability will continue to drive demand for AWS’ services = Global Hot Zones Regional Tensions DoD TRANSCOM AFRICOM Military Sealift Command DoS INL USAID United Nations NGOs NATO DHS Foreign Governments AWS Market Opportunities Narcotics Trade Piracy Terrorism Humanitarian Needs Emergency Relief Contingency Operations Government & Defense Services 72 |
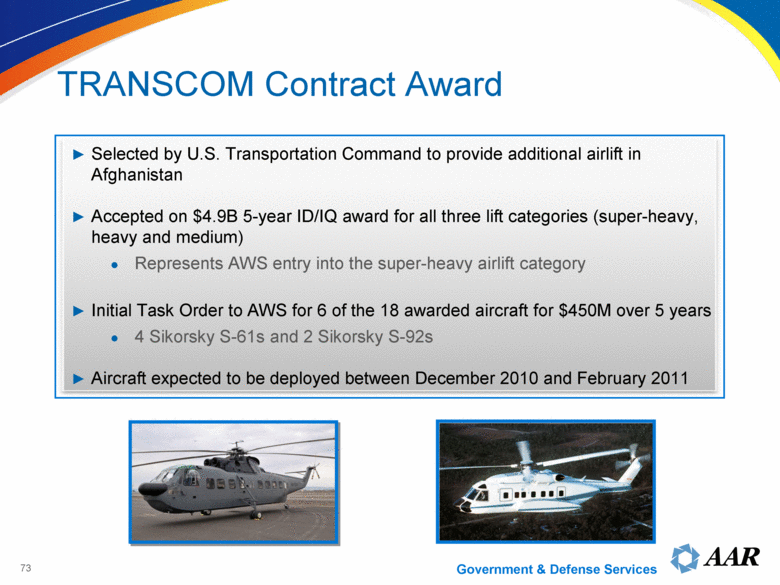
| Selected by U.S. Transportation Command to provide additional airlift in Afghanistan Accepted on $4.9B 5-year ID/IQ award for all three lift categories (super-heavy, heavy and medium) Represents AWS entry into the super-heavy airlift category Initial Task Order to AWS for 6 of the 18 awarded aircraft for $450M over 5 years 4 Sikorsky S-61s and 2 Sikorsky S-92s Aircraft expected to be deployed between December 2010 and February 2011 Government & Defense Services TRANSCOM Contract Award 73 |
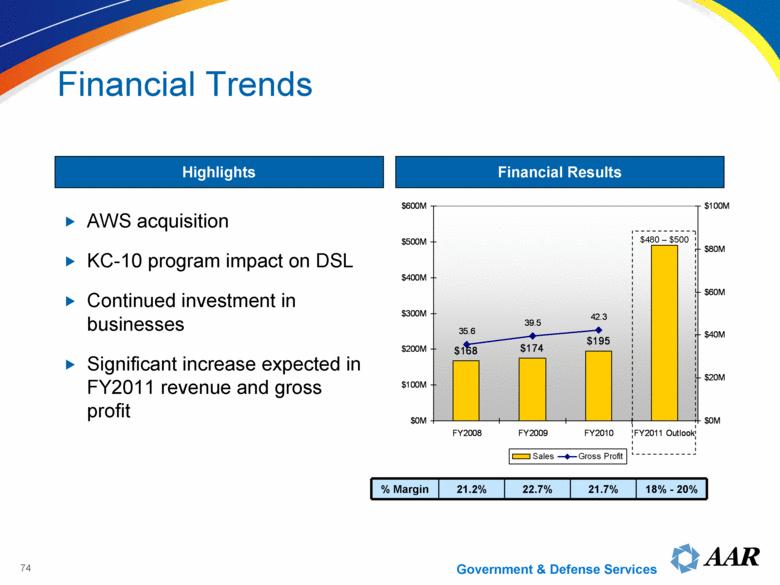
| Highlights Financial Results % Margin 21.2% 22.7% 21.7% 18% - 20% AWS acquisition KC-10 program impact on DSL Continued investment in businesses Significant increase expected in FY2011 revenue and gross profit $480 – $500 Government & Defense Services Financial Trends $174 $195 $168 42.3 39.5 35.6 $0M $100M $200M $300M $400M $500M $600M FY2008 FY2009 FY2010 FY2011 Outlook $0M $20M $40M $60M $80M $100M Sales Gross Profit 74 |
| Move up the value chain into higher margin products and services Continue to diversify customer base Utilize cross-GDS synergies and better enable opportunity outflow to other AAR business units Build sustainable pipeline of new business Continue to upgrade leadership teams Government & Defense Services Summary 75 |
| Operational Review Tim Romenesko President and Chief Operating Officer |
| 77 Timothy Romenesko President and Chief Operating Officer Responsible for maximizing the performance of AAR’s operating units and implementing the Company’s strategies for growth Joined AAR CORP. in 1981 Named Vice President and Chief Financial Officer in 1994 Named President and Chief Operating Officer in 2007 Elected to AAR CORP. Board of Directors in 2007 Education BA from St. Norbert College MBA from DePaul University Holds a CPA designation in Illinois and is a member of the Financial Executives Institute and the Illinois CPA Society Kellogg School of Business CEO Perspectives |
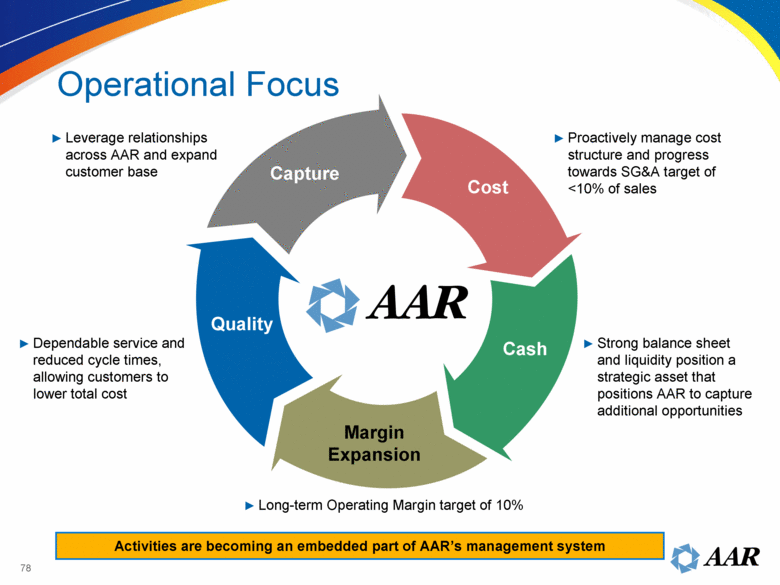
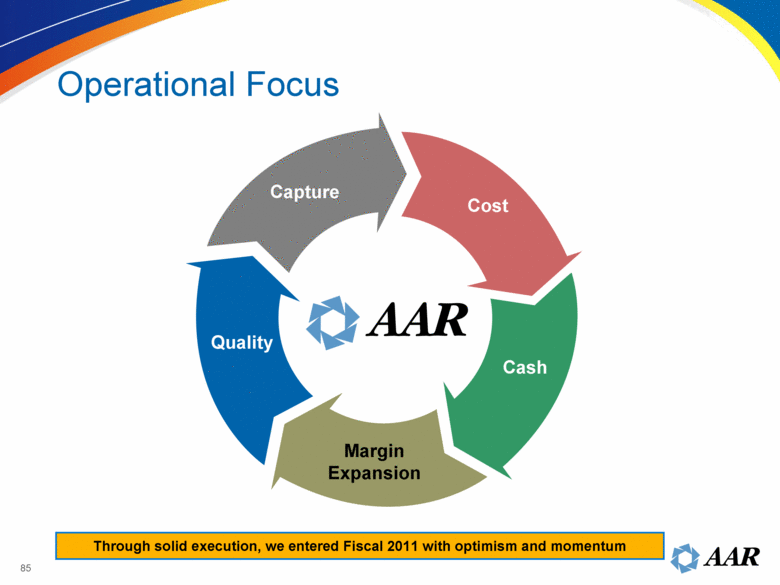
| Operational Focus Activities are becoming an embedded part of AAR’s management system Cost Cash Margin Expansion Quality Capture Dependable service and reduced cycle times, allowing customers to lower total cost Leverage relationships across AAR and expand customer base Strong balance sheet and liquidity position a strategic asset that positions AAR to capture additional opportunities Proactively manage cost structure and progress towards SG&A target of <10% of sales Long-term Operating Margin target of 10% 78 |
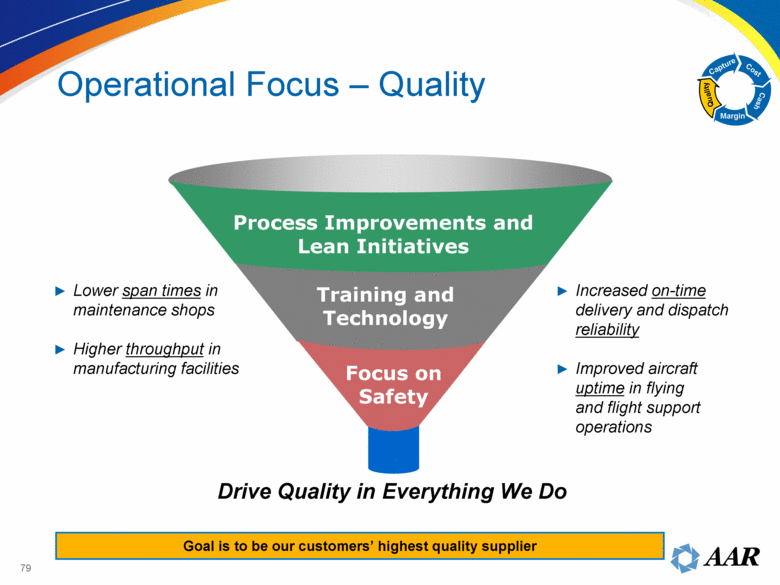
| Drive Quality in Everything We Do Goal is to be our customers’ highest quality supplier Operational Focus – Quality Cost Cash Margin Quality Capture Process Improvements and Lean Initiatives Training and Technology Focus on Safety Lower span times in maintenance shops Higher throughput in manufacturing facilities Increased on-time delivery and dispatch reliability Improved aircraft uptime in flying and flight support operations 79 |
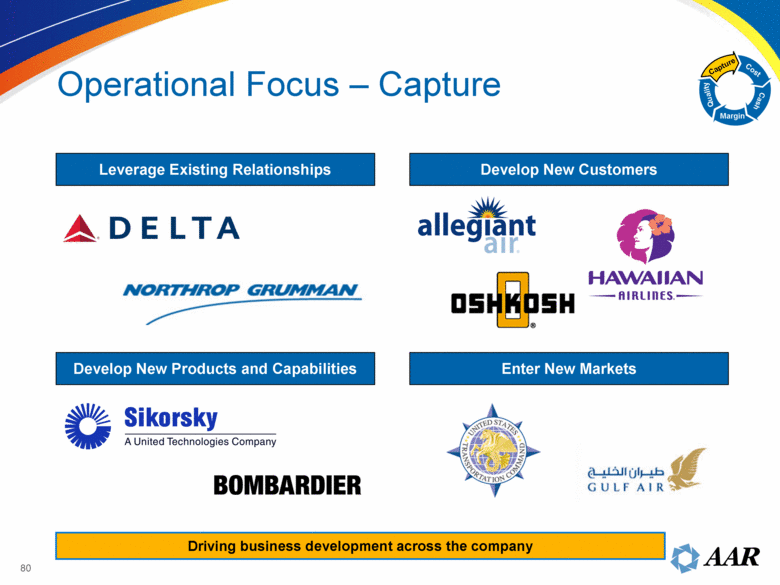
| Driving business development across the company Operational Focus – Capture Cost Cash Margin Quality Capture Leverage Existing Relationships Develop New Customers Develop New Products and Capabilities Enter New Markets 80 |
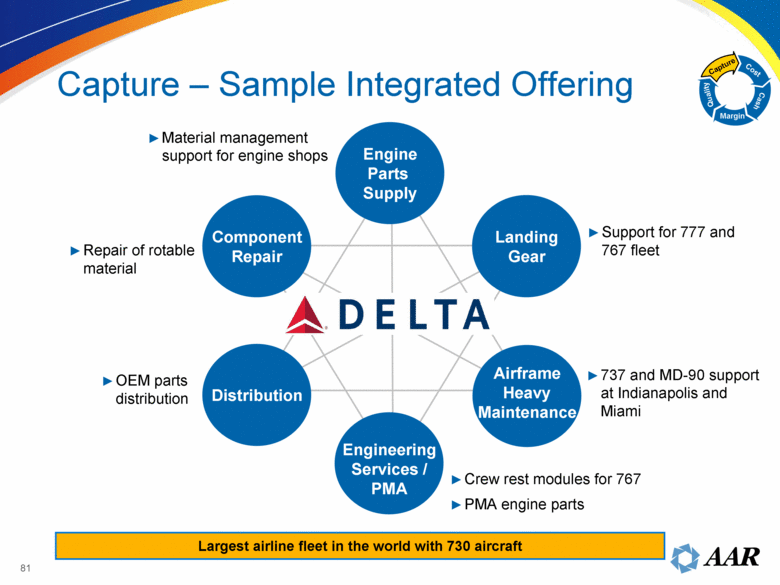
| Engineering Services / PMA Distribution Airframe Heavy Maintenance Component Repair Landing Gear Engine Parts Supply Support for 777 and 767 fleet 737 and MD-90 support at Indianapolis and Miami OEM parts distribution Material management support for engine shops Repair of rotable material Crew rest modules for 767 PMA engine parts Capture – Sample Integrated Offering Cost Cash Margin Quality Capture Largest airline fleet in the world with 730 aircraft 81 |
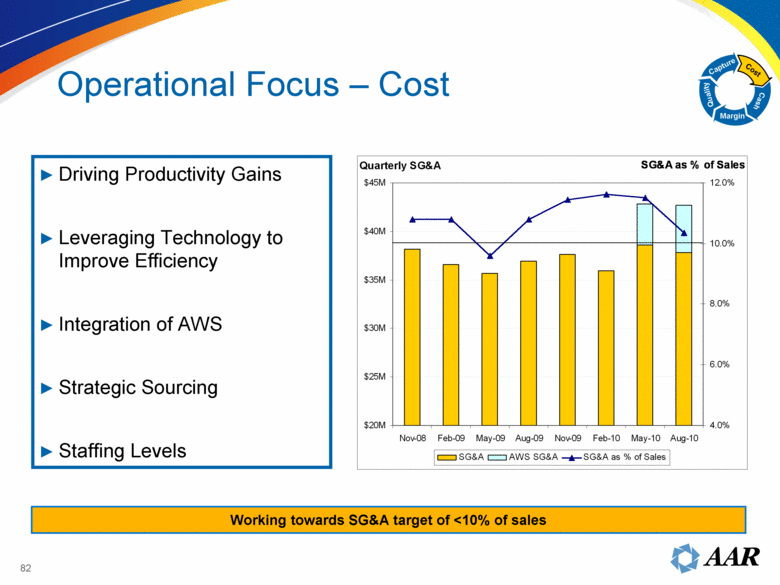
| Working towards SG&A target of <10% of sales Driving Productivity Gains Leveraging Technology to Improve Efficiency Integration of AWS Strategic Sourcing Staffing Levels Operational Focus – Cost Cost Cash Margin Quality Capture Quarterly SG&A $20M $25M $30M $35M $40M $45M Nov-08 Feb-09 May-09 Aug-09 Nov-09 Feb-10 May-10 Aug-10 4.0% 6.0% 8.0% 10.0% 12.0% SG&A AWS SG&A SG&A as % of Sales SG&A as % of Sales 82 |
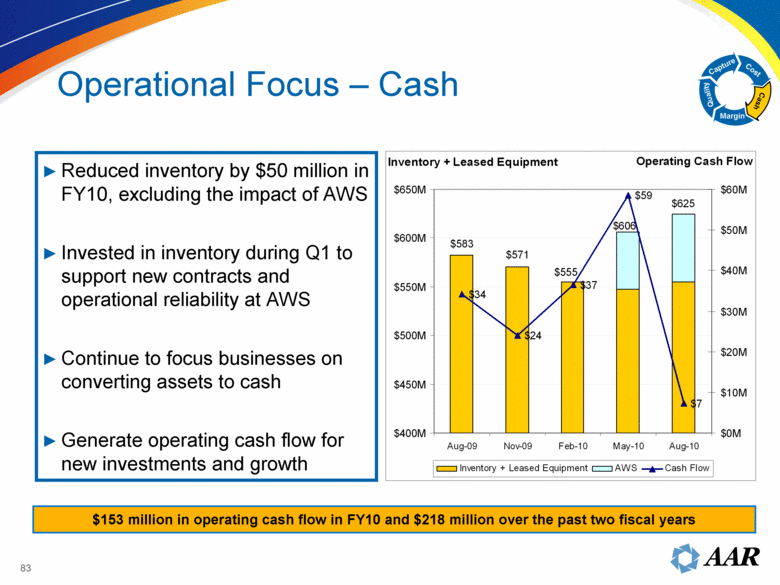
| 83 Reduced inventory by $50 million in FY10, excluding the impact of AWS Invested in inventory during Q1 to support new contracts and operational reliability at AWS Continue to focus businesses on converting assets to cash Generate operating cash flow for new investments and growth $153 million in operating cash flow in FY10 and $218 million over the past two fiscal years Operational Focus – Cash Cost Cash Margin Quality Capture Inventory + Leased Equipment $625 $606 $555 $571 $583 $34 $24 $37 $59 $7 $400M $450M $500M $550M $600M $650M Aug-09 Nov-09 Feb-10 May-10 Aug-10 $0M $10M $20M $30M $40M $50M $60M Inventory + Leased Equipment AWS Cash Flow Operating Cash Flow |
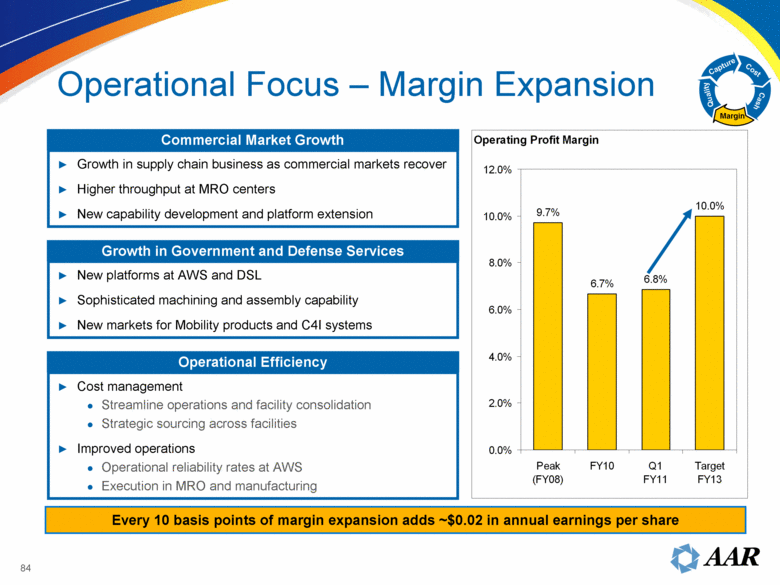
| 84 Every 10 basis points of margin expansion adds ~$0.02 in annual earnings per share Operational Focus – Margin Expansion Cost Cash Margin Quality Capture Commercial Market Growth Growth in supply chain business as commercial markets recover Higher throughput at MRO centers New capability development and platform extension Growth in Government and Defense Services New platforms at AWS and DSL Sophisticated machining and assembly capability New markets for Mobility products and C4I systems Operational Efficiency Cost management Streamline operations and facility consolidation Strategic sourcing across facilities Improved operations Operational reliability rates at AWS Execution in MRO and manufacturing Operating Profit Margin 9.7% 6.7% 6.8% 10.0% 0.0% 2.0% 4.0% 6.0% 8.0% 10.0% 12.0% Peak (FY08) FY10 Q1 FY11 Target FY13 |
| Operational Focus Through solid execution, we entered Fiscal 2011 with optimism and momentum Cost Cash Margin Expansion Quality Capture 85 |
| Financial Highlights Rick Poulton Vice President, Chief Financial Officer and Treasurer |

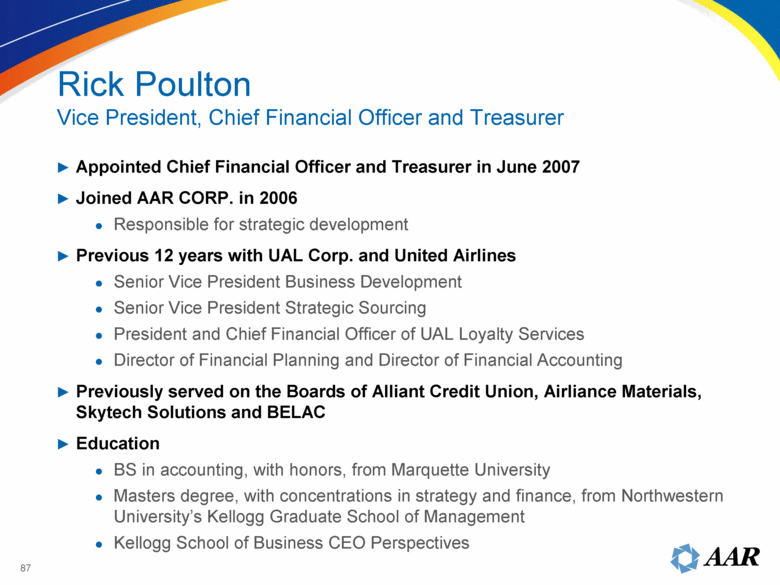
| 87 Appointed Chief Financial Officer and Treasurer in June 2007 Joined AAR CORP. in 2006 Responsible for strategic development Previous 12 years with UAL Corp. and United Airlines Senior Vice President Business Development Senior Vice President Strategic Sourcing President and Chief Financial Officer of UAL Loyalty Services Director of Financial Planning and Director of Financial Accounting Previously served on the Boards of Alliant Credit Union, Airliance Materials, Skytech Solutions and BELAC Education BS in accounting, with honors, from Marquette University Masters degree, with concentrations in strategy and finance, from Northwestern University’s Kellogg Graduate School of Management Kellogg School of Business CEO Perspectives Rick Poulton Vice President, Chief Financial Officer and Treasurer |
| Diversified revenue stream with momentum Strong balance sheet with low leverage Modest debt maturities for next few years Financially strong position to support business and enable growth Key Financial Highlights 88 |
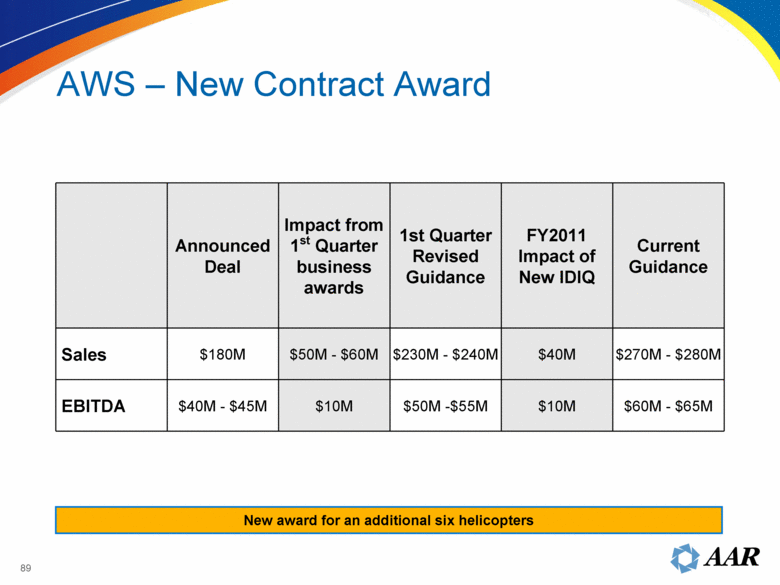
| AWS – New Contract Award Announced Deal Impact from 1st Quarter business awards 1st Quarter Revised Guidance FY2011 Impact of New IDIQ Current Guidance Sales $180M $50M - $60M $230M - $240M $40M $270M - $280M EBITDA $40M - $45M $10M $50M -$55M $10M $60M - $65M New award for an additional six helicopters 89 |
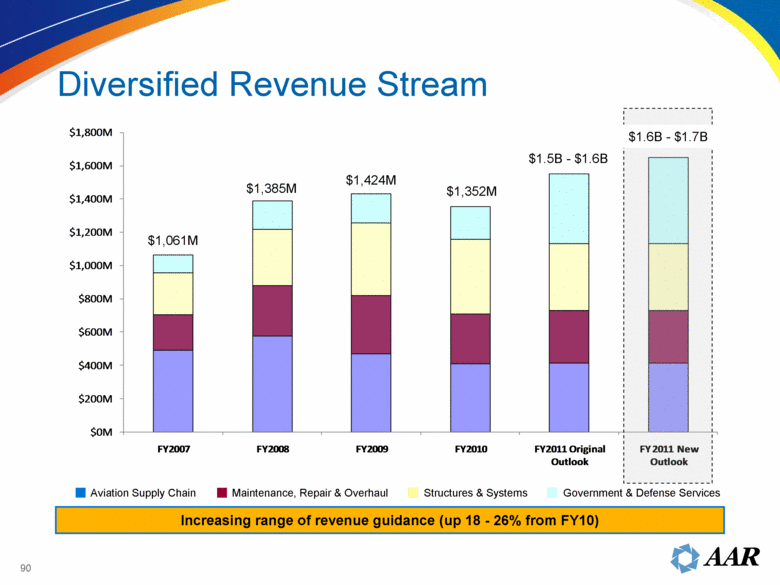
| Aviation Supply Chain Maintenance, Repair & Overhaul Structures & Systems Government & Defense Services Increasing range of revenue guidance (up 18 - 26% from FY10) $1,061M $1,385M $1,424M $1,352M Diversified Revenue Stream $1.5B - $1.6B $1.6B - $1.7B $0M $200M $400M $600M $800M $1,000M $1,200M $1,400M $1,600M $1,800M FY2007 FY2008 FY2009 FY2010 FY2011 Original Outlook FY 2011 New Outlook 90 |
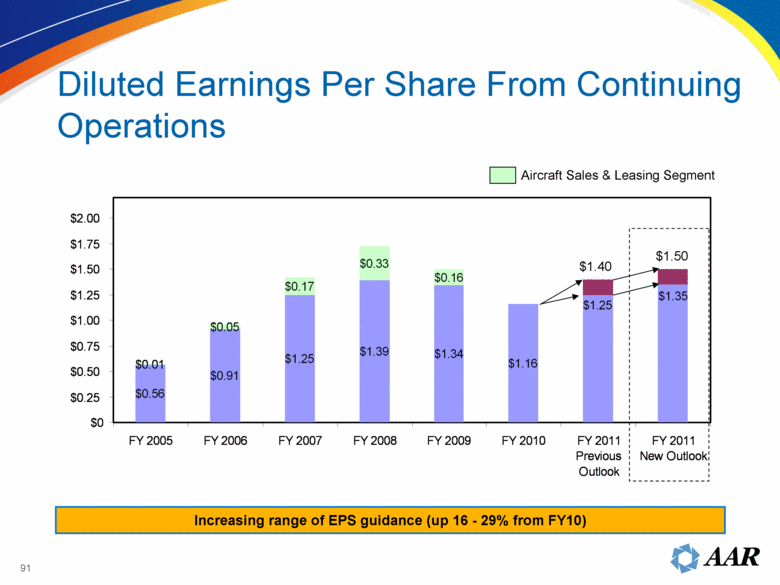
| Diluted Earnings Per Share From Continuing Operations Aircraft Sales & Leasing Segment Increasing range of EPS guidance (up 16 - 29% from FY10) $1.40 $1.50 $0.56 $0.91 $1.25 $1.39 $1.34 $1.16 $0.01 $0.05 $0.33 $1.35 $1.25 $0.17 $0.16 $0 $0.25 $0.50 $0.75 $1.00 $1.25 $1.50 $1.75 $2.00 FY 2005 FY 2006 FY 2007 FY 2008 FY 2009 FY 2010 FY 2011 Previous Outlook FY 2011 New Outlook 91 |
| Strong Balance Sheet with Low Leverage Total Debt / Total Capitalization Net Debt / EBITDA Equity Debt at face value. Pro Forma EBITDA for full year AWS in FY 2010 and TTM. TTM is for the twelve months ending August 31, 2010. (2,3) (1) (1) (2) Debt (3) 1.9x 2.3x 1.9x 2.3x 2.2x 0.0x 0.5x 1.0x 1.5x 2.0x 2.5x 3.0x FY 2007 FY 2008 FY 2009 FY 2010 TTM 39% 44% 39% 39% 39% 61% 56% 61% 61% 61% 0% 20% 40% 60% 80% 100% FY 2007 FY 2008 FY 2009 FY 2010 TTM 92 |

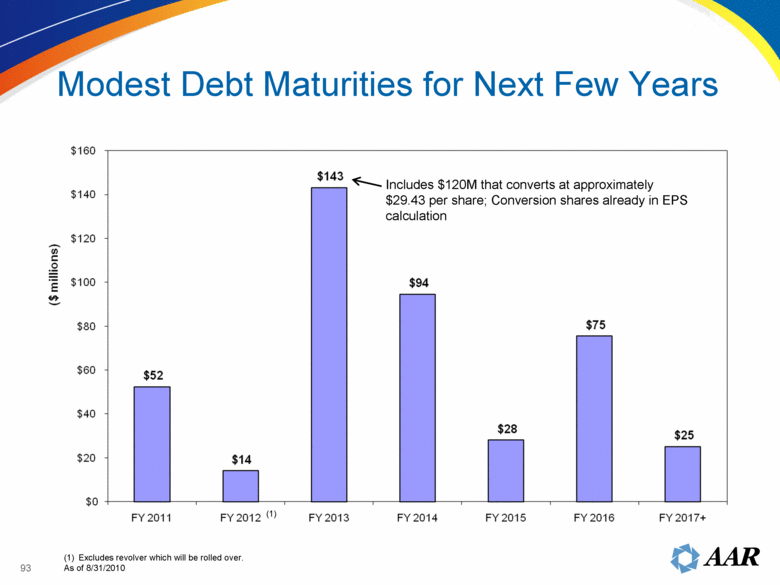
| Modest Debt Maturities for Next Few Years Includes $120M that converts at approximately $29.43 per share; Conversion shares already in EPS calculation (1) Excludes revolver which will be rolled over. As of 8/31/2010 ($ millions) $0 $20 $40 $60 $80 $100 $120 $140 $160 $52 $14 $143 $94 $28 $75 $25 FY 2011 FY 2012 (1) FY 2013 FY 2014 FY 2015 FY 2016 FY2017+ 93 |
| Well Positioned for Targeted Investments Free Cash Flow and Incremental Borrowing Capacity Debt Reduction Repurchase Stock Organic Investments Supply Chain Programs Manufacturing Business Expansion Aircraft acquisition to support AWS growth Acquisitions Actively reviewing several opportunities to enhance capabilities and drive scale into the business Strong Foundation Low near-term maturities Generating free cash flow from operations 94 |

| Valued Near Historical Lows 2009 EBITDA excludes $31.1M of impairment charges. EBITDA for 5/31/2010 and 8/31/2010 TTM includes pro forma 12 month results for AWS. Enterprise value for TTM is based on the close on October 1, 2010. (1) (2,3) (2) 95 |
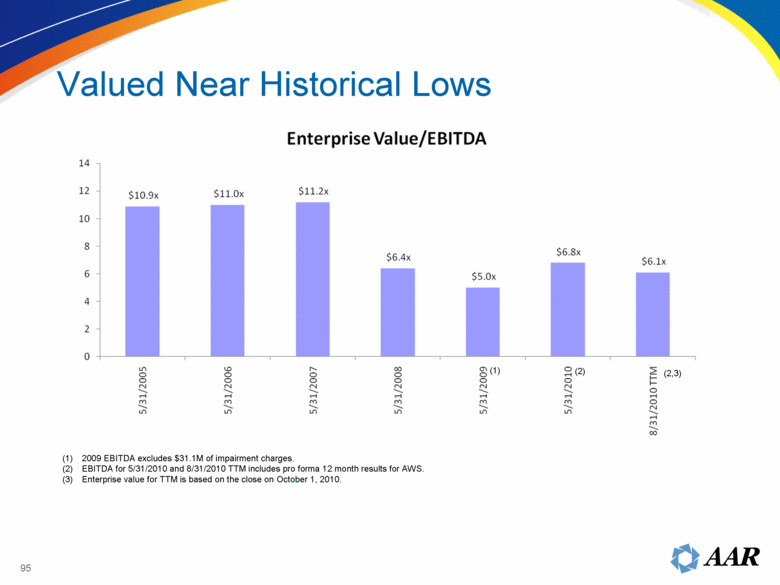
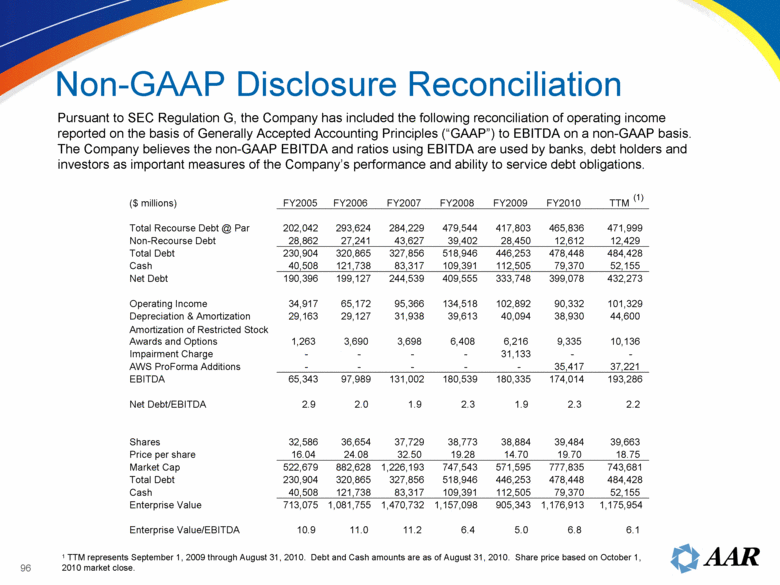
| Non-GAAP Disclosure Reconciliation Pursuant to SEC Regulation G, the Company has included the following reconciliation of operating income reported on the basis of Generally Accepted Accounting Principles (“GAAP”) to EBITDA on a non-GAAP basis. The Company believes the non-GAAP EBITDA and ratios using EBITDA are used by banks, debt holders and investors as important measures of the Company’s performance and ability to service debt obligations. 1 TTM represents September 1, 2009 through August 31, 2010. Debt and Cash amounts are as of August 31, 2010. Share price based on October 1, 2010 market close. (1) ($ millions) FY2005 FY2006 FY2007 FY2008 FY2009 FY2010 TTM Total Recourse Debt @ Par 202,042 293,624 284,229 479,544 417,803 465,836 471,999 Non-Recourse Debt 28,862 27,241 43,627 39,402 28,450 12,612 12,429 Total Debt 230,904 320,865 327,856 518,946 446,253 478,448 484,428 Cash 40,508 121,738 83,317 109,391 112,505 79,370 52,155 Net Debt 190,396 199,127 244,539 409,555 333,748 399,078 432,273 Operating Income 34,917 65,172 95,366 134,518 102,892 90,332 101,329 Depreciation & Amortization 29,163 29,127 31,938 39,613 40,094 38,930 44,600 Amortization of Restricted Stock Awards and Options 1,263 3,690 3,698 6,408 6,216 9,335 10,136 Impairment Charge - - - - 31,133 - - AWS ProForma Additions - - - - - 35,417 37,221 EBITDA 65,343 97,989 131,002 180,539 180,335 174,014 193,286 Net Debt/EBITDA 2.9 2.0 1.9 2.3 1.9 2.3 2.2 Shares 32,586 36,654 37,729 38,773 38,884 39,484 39,663 Price per share 16.04 24.08 32.50 19.28 14.70 19.70 18.75 Market Cap 522,679 882,628 1,226,193 747,543 571,595 777,835 743,681 Total Debt 230,904 320,865 327,856 518,946 446,253 478,448 484,428 Cash 40,508 121,738 83,317 109,391 112,505 79,370 52,155 Enterprise Value 713,075 1,081,755 1,470,732 1,157,098 905,343 1,176,913 1,175,954 Enterprise Value/EBITDA 10.9 11.0 11.2 6.4 5.0 6.8 6.1 96 |