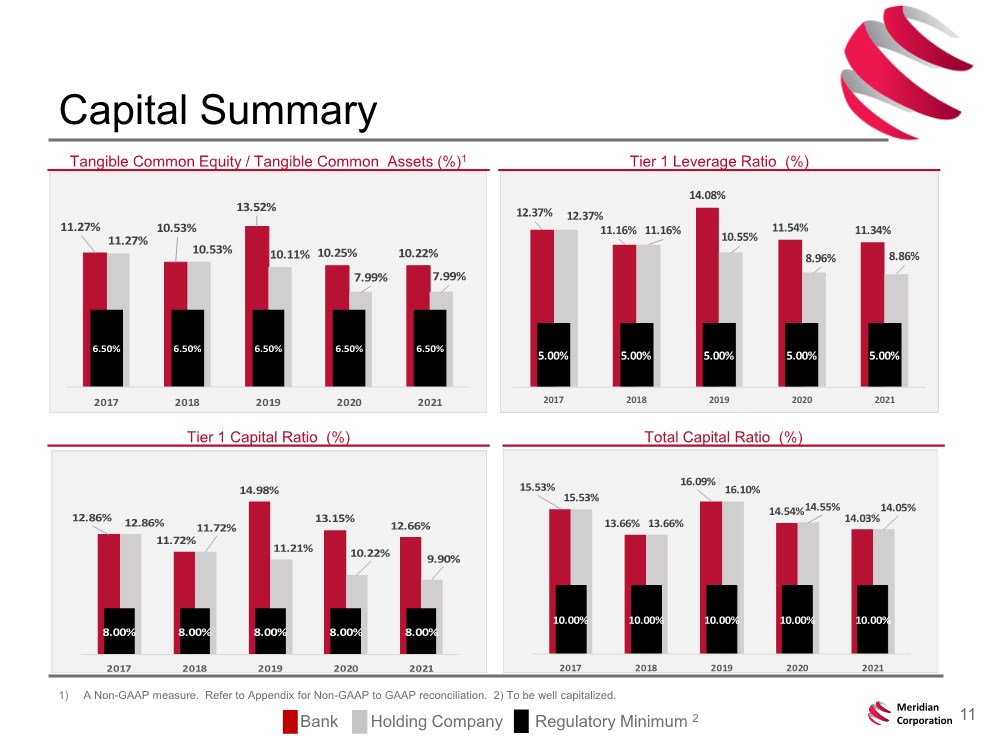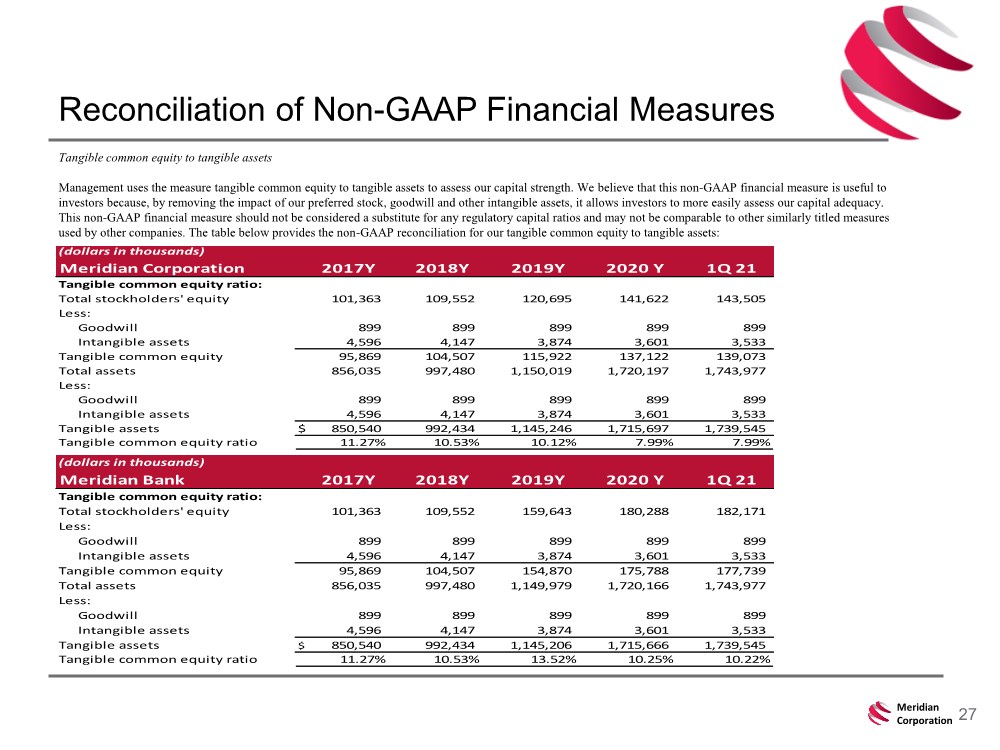
| 27 Meridian Corporation Reconciliation of Non-GAAP Financial Measures Tangible common equity to tangible assets Management uses the measure tangible common equity to tangible assets to assess our capital strength. We believe that this non-GAAP financial measure is useful to investors because, by removing the impact of our preferred stock, goodwill and other intangible assets, it allows investors to more easily assess our capital adequacy. This non-GAAP financial measure should not be considered a substitute for any regulatory capital ratios and may not be comparable to other similarly titled measures used by other companies. The table below provides the non-GAAP reconciliation for our tangible common equity to tangible assets: (dollars in thousands) Meridian Corporation 2017Y 2018Y 2019Y 2020 Y 1Q 21 Tangible common equity ratio: Total stockholders' equity 101,363 109,552 120,695 141,622 143,505 Less: Goodwill 899 899 899 899 899 Intangible assets 4,596 4,147 3,874 3,601 3,533 Tangible common equity 95,869 104,507 115,922 137,122 139,073 Total assets 856,035 997,480 1,150,019 1,720,197 1,743,977 Less: Goodwill 899 899 899 899 899 Intangible assets 4,596 4,147 3,874 3,601 3,533 Tangible assets $ 850,540 992,434 1,145,246 1,715,697 1,739,545 Tangible common equity ratio 11.27% 10.53% 10.12% 7.99% 7.99% (dollars in thousands) Meridian Bank 2017Y 2018Y 2019Y 2020 Y 1Q 21 Tangible common equity ratio: Total stockholders' equity 101,363 109,552 159,643 180,288 182,171 Less: Goodwill 899 899 899 899 899 Intangible assets 4,596 4,147 3,874 3,601 3,533 Tangible common equity 95,869 104,507 154,870 175,788 177,739 Total assets 856,035 997,480 1,149,979 1,720,166 1,743,977 Less: Goodwill 899 899 899 899 899 Intangible assets 4,596 4,147 3,874 3,601 3,533 Tangible assets $ 850,540 992,434 1,145,206 1,715,666 1,739,545 Tangible common equity ratio 11.27% 10.53% 13.52% 10.25% 10.22% |