united states
securities and exchange commission
washington, d.c. 20549
form n-csr
certified shareholder report of registered management
investment companies
| Investment Company Act file number: | 811-23373 |
| Exchange Place Advisors Trust |
| (Exact name of registrant as specified in charter) |
| 225 Pictoria Drive, Suite 450 |
| Cincinnati, OH 45246 |
(Address of principal executive offices) (Zip code)
The Corporation Trust Company
Corporation Trust Center
1209 Orange Street
Wilmington, DE 19801
(Name and address of agent for service)
With Copies To:
Stacy H. Louizos, Esq.
Blank Rome LLP
1271 Avenue of the Americas
New York, NY 10020
(212) 885-5147
| Registrant's telephone number, including area code: | (513) 587-3400 | |
| Date of fiscal year end: | May 31 | |
| Date of reporting period: | November 30, 2024 | |
Item 1. Reports to Stockholders.
North Square Core Plus Bond Fund
Semi-Annual Shareholder Report - November 30, 2024
This semi-annual shareholder report contains important information about North Square Core Plus Bond Fund (the "Fund") for the period of June 1, 2024, to November 30, 2024. You can find additional information about the Fund at https://northsquareinvest.com/fund-reports-holdings/. You can also request this information by contacting us at 1-855-551-5521. This report describes changes to the Fund that occurred during the reporting period as described below in Material Fund Changes.
What were the Fund’s costs for the last six months?
(based on a hypothetical $10,000 investment)
| Class Name | Costs of a $10,000 investment | Costs paid as a percentage of a $10,000 investment |
|---|
| Class I | $56 | 1.08% |
|---|
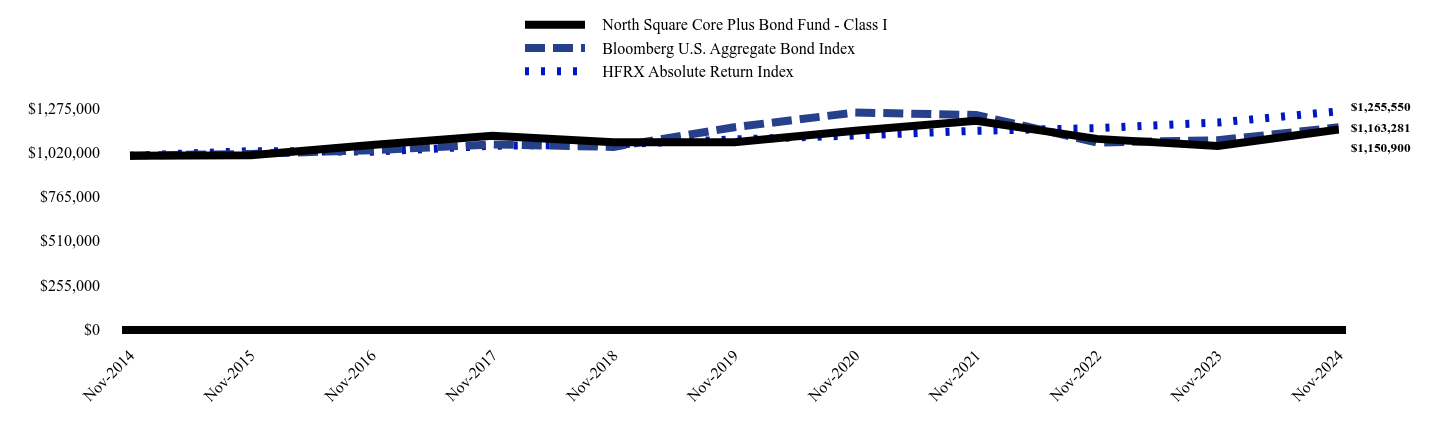
How has the Fund performed over the last ten years?
Total Return Based on $1,000,000 Investment
| North Square Core Plus Bond Fund - Class I | Bloomberg U.S. Aggregate Bond Index | HFRX Absolute Return Index |
|---|
| Nov-2014 | $1,000,000 | $1,000,000 | $1,000,000 |
|---|
| Nov-2015 | $1,002,695 | $1,009,702 | $1,026,234 |
|---|
| Nov-2016 | $1,061,978 | $1,031,630 | $1,023,014 |
|---|
| Nov-2017 | $1,114,936 | $1,064,786 | $1,056,813 |
|---|
| Nov-2018 | $1,077,415 | $1,050,494 | $1,064,867 |
|---|
| Nov-2019 | $1,077,503 | $1,163,856 | $1,093,682 |
|---|
| Nov-2020 | $1,143,531 | $1,248,630 | $1,116,068 |
|---|
| Nov-2021 | $1,200,703 | $1,234,230 | $1,143,488 |
|---|
| Nov-2022 | $1,096,644 | $1,075,757 | $1,158,479 |
|---|
| Nov-2023 | $1,055,787 | $1,088,449 | $1,190,972 |
|---|
| Nov-2024 | $1,150,900 | $1,163,281 | $1,255,550 |
|---|
- Net Assets$18,171,455
- Number of Portfolio Holdings211
- Advisory Fee (net of waivers)$16,478
- Portfolio Turnover242%
Average Annual Total Returns
| 1 Year | 5 Years | 10 Years |
|---|
| North Square Core Plus Bond Fund - Class I | 9.01% | 1.33% | 1.42% |
|---|
| Bloomberg U.S. Aggregate Bond Index | 6.88% | -0.01% | 1.52% |
|---|
| HFRX Absolute Return Index | 5.42% | 2.80% | 2.30% |
|---|
The performance results shown above in the line chart and the average annual total returns table for periods prior to September 23, 2024 represent the performance of the Trilogy Alternative Return Fund (the "Predecessor Fund") which converted into the Fund and is attributable to the Fund moving forward. The fund's performance has not been restated to reflect any differences paid by the Predecessor Fund and those paid by the fund.
Effective September 27, 2024, the Fund made changes to its principal investment strategies. Accordingly, the performance shown for periods prior to September 27, 2024, is based on the Fund's prior principal investment strategies and may not be representative of the Fund's performance under its current principal investment strategies. In connection with changes to the Fund’s investment objectives and principal investment strategies, the Fund’s primary benchmark index changed from the HFRX Absolute Return Index to the Bloomberg U.S. Aggregate Bond Index. The Adviser believes this benchmark index more closely aligns with the investment objectives and principal investment strategies of the Fund. Investors cannot invest directly in an index or benchmark.
The Fund's past performance is not a good predictor of how the Fund will perform in the future. The graph and table do not reflect the deduction of taxes that a shareholder would pay on fund distributions or redemption of fund shares.
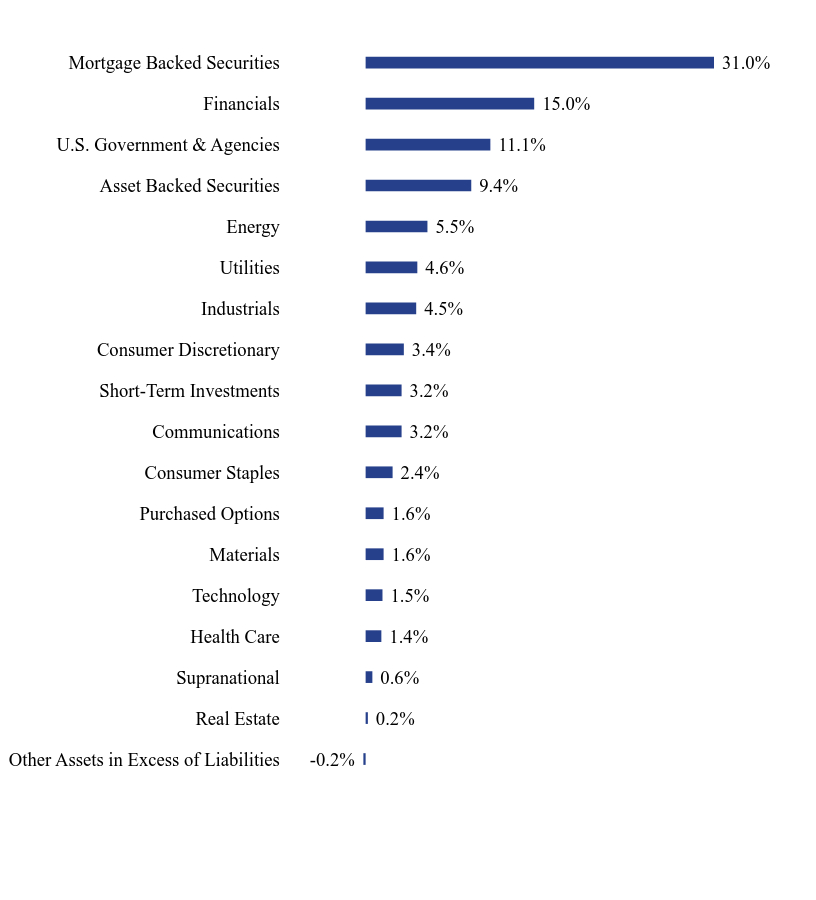
What did the Fund invest in?
Composition of Net Assets (% of net assets)
| Value | Value |
|---|
| Other Assets in Excess of Liabilities | -0.2% |
| Real Estate | 0.2% |
| Supranational | 0.6% |
| Health Care | 1.4% |
| Technology | 1.5% |
| Materials | 1.6% |
| Purchased Options | 1.6% |
| Consumer Staples | 2.4% |
| Communications | 3.2% |
| Short-Term Investments | 3.2% |
| Consumer Discretionary | 3.4% |
| Industrials | 4.5% |
| Utilities | 4.6% |
| Energy | 5.5% |
| Asset Backed Securities | 9.4% |
| U.S. Government & Agencies | 11.1% |
| Financials | 15.0% |
| Mortgage Backed Securities | 31.0% |
Top 10 Holdings (% of net assets)
| Holding Name | % of Net Assets |
| First American Treasury Obligations Fund, Class X | 3.2% |
| United States Treasury Note/Bond | 2.4% |
| Federal National Mortgage Association | 2.3% |
| Federal Home Loan Banks | 1.6% |
| E-mini S&P 500 Index | 1.6% |
| Freddie Mac Pool | 1.4% |
| United States Treasury Note/Bond | 1.3% |
| United States Treasury Note/Bond | 1.3% |
| United States Treasury Note/Bond | 1.3% |
| Federal Home Loan Banks | 1.3% |
This is a summary of certain changes to the Fund since September 27, 2024. For more complete information you may review the Fund’s prospectus, which is available upon request at 1-855-551-5521 or on the Fund's website at https://northsquareinvest.com/fund-reports-holdings/
On September 27, 2024, the Fund changed its name from the North Square Trilogy Alternative Return Fund to the North Square Core Plus Bond Fund. In conjunction with the change of the Fund's name, the Fund changed: its investment objective to seek high current income and long-term capital appreciation; its principal investment strategies and principal risks to reflect the Fund's principal investments in fixed income investments; and its sub-advisers to CSM Advisors, LLC and Red Cedar Investment Management, LLC. For more information on these changes, please review Fund's Prospectus dated September 27, 2024.
Where can I find additional information about the Fund?
Additional information is available on the Fund's website (https://northsquareinvest.com/fund-reports-holdings/), including its:
Prospectus
Financial information
Holdings
Proxy voting information
North Square Core Plus Bond Fund - Class I (STTIX)
Semi-Annual Shareholder Report - November 30, 2024
North Square Dynamic Small Cap Fund
Semi-Annual Shareholder Report - November 30, 2024
This semi-annual shareholder report contains important information about North Square Dynamic Small Cap Fund (the "Fund") for the period of June 1, 2024, to November 30, 2024. You can find additional information about the Fund at https://northsquareinvest.com/fund-reports-holdings/. You can also request this information by contacting us at 1-855-551-5521.
What were the Fund’s costs for the last six months?
(based on a hypothetical $10,000 investment)
| Class Name | Costs of a $10,000 investment | Costs paid as a percentage of a $10,000 investment |
|---|
| Class A | $67 | 1.24% |
|---|
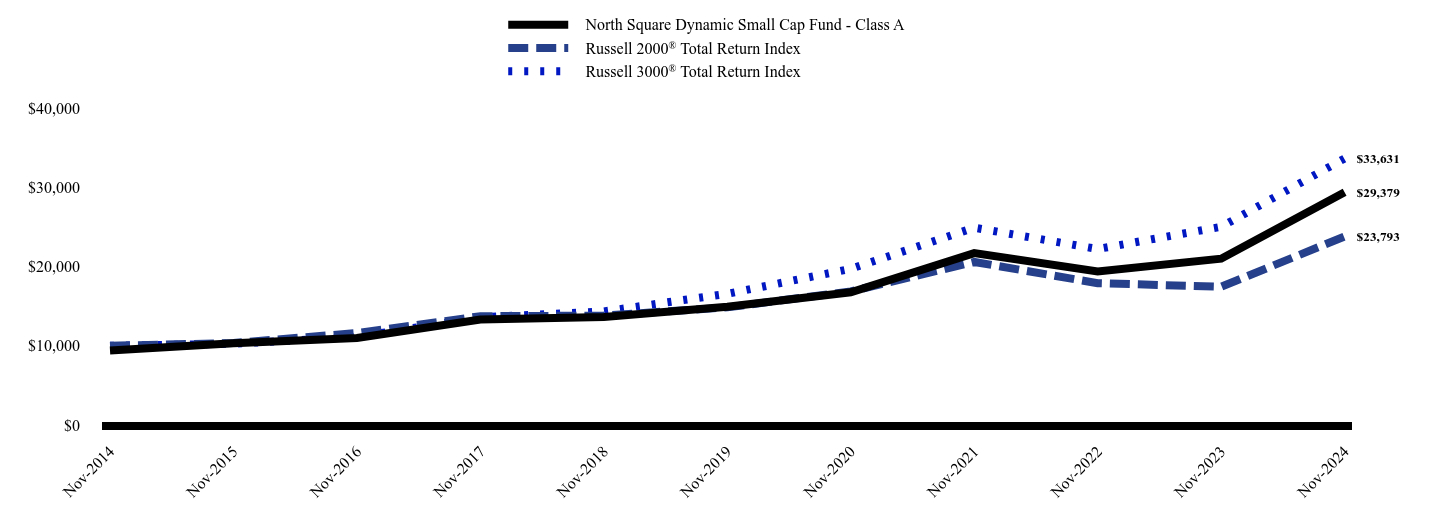
How has the Fund performed over the last 10 years?
Total Return Based on $10,000 Investment
| North Square Dynamic Small Cap Fund - Class A | Russell 2000® Total Return Index | Russell 3000® Total Return Index |
|---|
| Nov-2014 | $9,413 | $10,000 | $10,000 |
|---|
| Nov-2015 | $10,325 | $10,351 | $10,258 |
|---|
| Nov-2016 | $10,990 | $11,601 | $11,111 |
|---|
| Nov-2017 | $13,323 | $13,728 | $13,585 |
|---|
| Nov-2018 | $13,635 | $13,807 | $14,336 |
|---|
| Nov-2019 | $14,934 | $14,844 | $16,557 |
|---|
| Nov-2020 | $16,740 | $16,862 | $19,706 |
|---|
| Nov-2021 | $21,690 | $20,576 | $24,897 |
|---|
| Nov-2022 | $19,363 | $17,898 | $22,207 |
|---|
| Nov-2023 | $20,983 | $17,439 | $25,007 |
|---|
| Nov-2024 | $29,379 | $23,793 | $33,631 |
|---|
- Net Assets$425,278,772
- Number of Portfolio Holdings243
- Advisory Fee (net of waivers)$1,255,188
- Portfolio Turnover87%
Average Annual Total Returns
| 1 Year | 5 Years | 10 years |
|---|
| North Square Dynamic Small Cap Fund - Class A | | | |
|---|
| Without Load | 40.01% | 14.49% | 12.05% |
|---|
| With Load | 31.99% | 13.15% | 11.38% |
|---|
Russell 2000® Total Return Index | 36.43% | 9.90% | 9.05% |
|---|
Russell 3000® Total Return Index | 34.49% | 15.23% | 12.89% |
|---|
The performance results shown above in the line chart and the average annual total returns table for periods prior to May 10, 2019 represent the performance of the Oak Ridge Multi Strategy Fund (the "Predecessor Fund") which converted into the Fund and is attributable to the Fund moving forward. The Fund's performance has not been restated to reflect any differences in expenses paid by the Predecessor Fund and those paid by the Fund.
The Fund's past performance is not a good predictor of how the Fund will perform in the future. The graph and table do not reflect the deduction of taxes that a shareholder would pay on fund distributions or redemption of fund shares.
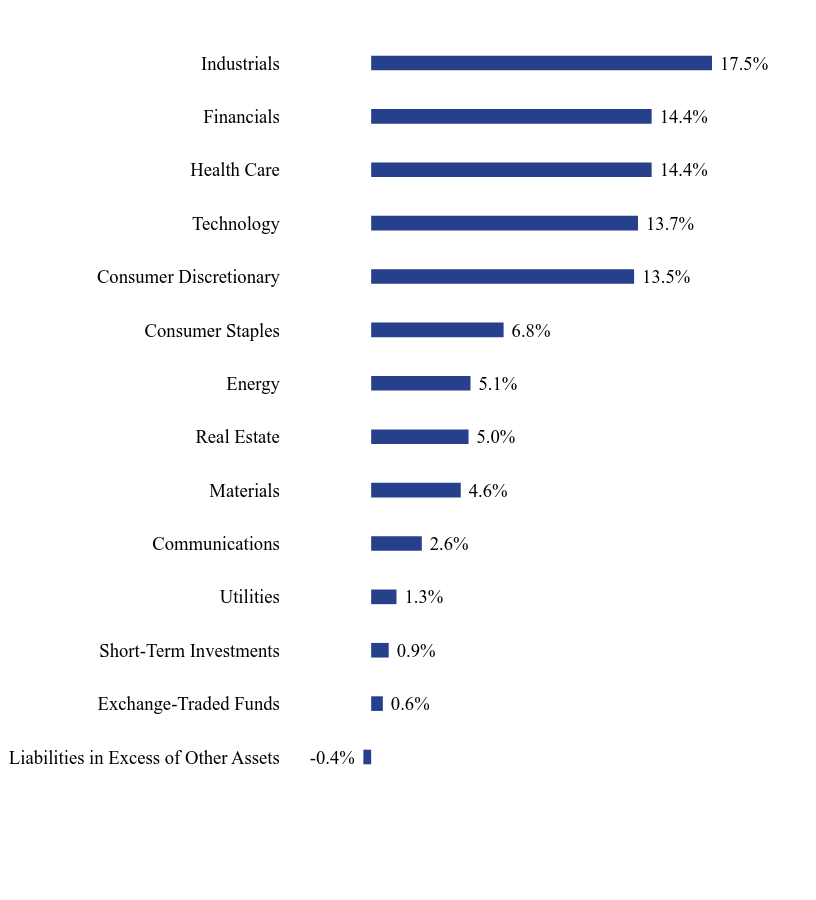
What did the Fund invest in?
Composition of Net Assets (% of net assets)
| Value | Value |
|---|
| Liabilities in Excess of Other Assets | -0.4% |
| Exchange-Traded Funds | 0.6% |
| Short-Term Investments | 0.9% |
| Utilities | 1.3% |
| Communications | 2.6% |
| Materials | 4.6% |
| Real Estate | 5.0% |
| Energy | 5.1% |
| Consumer Staples | 6.8% |
| Consumer Discretionary | 13.5% |
| Technology | 13.7% |
| Health Care | 14.4% |
| Financials | 14.4% |
| Industrials | 17.5% |
Top 10 Holdings (% of net assets)
| Holding Name | % of Net Assets |
| Itron, Inc. | 1.5% |
| BellRing Brands, Inc. | 1.5% |
| Axos Financial, Inc. | 1.5% |
| Mueller Industries, Inc. | 1.5% |
| Louisiana-Pacific Corp. | 1.5% |
| Frontdoor, Inc. | 1.4% |
| Atkore, Inc. | 1.4% |
| Coca-Cola Consolidated, Inc. | 1.3% |
| Affiliated Managers Group, Inc. | 1.2% |
| RingCentral, Inc., Class A | 1.2% |
No material changes occurred during the period ended November 30, 2024.
Where can I find additional information about the Fund?
Additional information is available on the Fund's website (https://northsquareinvest.com/fund-reports-holdings/), including its:
Prospectus
Financial information
Holdings
Proxy voting information
North Square Dynamic Small Cap Fund - Class A (ORSAX)
Semi-Annual Shareholder Report - November 30, 2024
North Square Dynamic Small Cap Fund
Semi-Annual Shareholder Report - November 30, 2024
This semi-annual shareholder report contains important information about North Square Dynamic Small Cap Fund (the "Fund") for the period of June 1, 2024, to November 30, 2024. You can find additional information about the Fund at https://northsquareinvest.com/fund-reports-holdings/. You can also request this information by contacting us at 1-855-551-5521.
What were the Fund’s costs for the last six months?
(based on a hypothetical $10,000 investment)
| Class Name | Costs of a $10,000 investment | Costs paid as a percentage of a $10,000 investment |
|---|
| Class I | $54 | 0.99% |
|---|
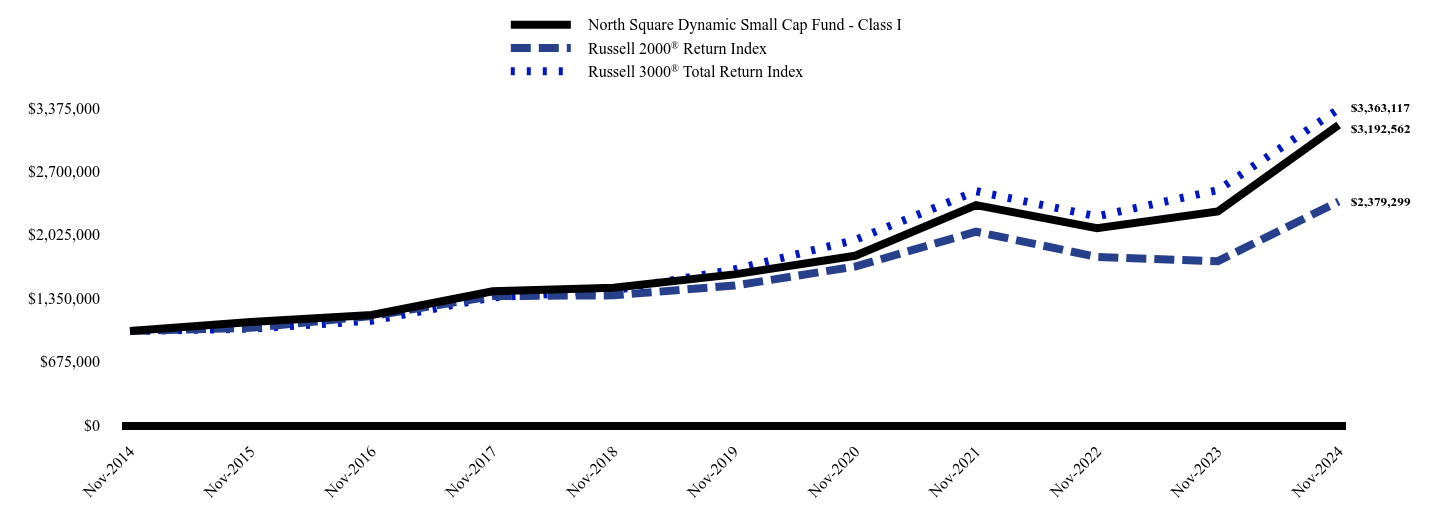
How has the Fund performed over the last 10 years?
Total Return Based on $1,000,000 Investment
| North Square Dynamic Small Cap Fund - Class I | Russell 2000® Return Index | Russell 3000® Total Return Index |
|---|
| Nov-2014 | $999,997 | $1,000,000 | $1,000,000 |
|---|
| Nov-2015 | $1,097,628 | $1,035,071 | $1,025,831 |
|---|
| Nov-2016 | $1,171,153 | $1,160,075 | $1,111,055 |
|---|
| Nov-2017 | $1,423,364 | $1,372,801 | $1,358,510 |
|---|
| Nov-2018 | $1,460,367 | $1,380,676 | $1,433,590 |
|---|
| Nov-2019 | $1,603,461 | $1,484,422 | $1,655,661 |
|---|
| Nov-2020 | $1,801,897 | $1,686,212 | $1,970,628 |
|---|
| Nov-2021 | $2,340,506 | $2,057,601 | $2,489,677 |
|---|
| Nov-2022 | $2,094,715 | $1,789,835 | $2,220,728 |
|---|
| Nov-2023 | $2,274,157 | $1,743,926 | $2,500,731 |
|---|
| Nov-2024 | $3,192,562 | $2,379,299 | $3,363,117 |
|---|
- Net Assets$425,278,772
- Number of Portfolio Holdings243
- Advisory Fee (net of waivers)$1,255,188
- Portfolio Turnover87%
Average Annual Total Returns
| 1 Year | 5 Years | 10 Years |
|---|
| North Square Dynamic Small Cap Fund - Class I | 40.38% | 14.77% | 12.30% |
|---|
Russell 2000® Return Index | 36.43% | 9.90% | 9.05% |
|---|
Russell 3000® Total Return Index | 34.49% | 15.23% | 12.89% |
|---|
The performance results shown above in the line chart and the average annual total returns table for periods prior to May 10, 2019 represent the performance of the Oak Ridge Multi Strategy Fund (the "Predecessor Fund") which converted into the Fund and is attributable to the Fund moving forward. The Fund's performance has not been restated to reflect any differences in expenses paid by the Predecessor Fund and those paid by the Fund.
The Fund's past performance is not a good predictor of how the Fund will perform in the future. The graph and table do not reflect the deduction of taxes that a shareholder would pay on fund distributions or redemption of fund shares.
What did the Fund invest in?
Composition of Net Assets (% of net assets)
| Value | Value |
|---|
| Liabilities in Excess of Other Assets | -0.4% |
| Exchange-Traded Funds | 0.6% |
| Short-Term Investments | 0.9% |
| Utilities | 1.3% |
| Communications | 2.6% |
| Materials | 4.6% |
| Real Estate | 5.0% |
| Energy | 5.1% |
| Consumer Staples | 6.8% |
| Consumer Discretionary | 13.5% |
| Technology | 13.7% |
| Health Care | 14.4% |
| Financials | 14.4% |
| Industrials | 17.5% |
Top 10 Holdings (% of net assets)
| Holding Name | % of Net Assets |
| Itron, Inc. | 1.5% |
| BellRing Brands, Inc. | 1.5% |
| Axos Financial, Inc. | 1.5% |
| Mueller Industries, Inc. | 1.5% |
| Louisiana-Pacific Corp. | 1.5% |
| Frontdoor, Inc. | 1.4% |
| Atkore, Inc. | 1.4% |
| Coca-Cola Consolidated, Inc. | 1.3% |
| Affiliated Managers Group, Inc. | 1.2% |
| RingCentral, Inc., Class A | 1.2% |
No material changes occurred during the period ended November 30, 2024.
Where can I find additional information about the Fund?
Additional information is available on the Fund's website (https://northsquareinvest.com/fund-reports-holdings/), including its:
Prospectus
Financial information
Holdings
Proxy voting information
North Square Dynamic Small Cap Fund - Class I (ORSIX)
Semi-Annual Shareholder Report - November 30, 2024
North Square Kennedy MicroCap Fund
Semi-Annual Shareholder Report - November 30, 2024
This semi-annual shareholder report contains important information about North Square Kennedy MicroCap Fund (the "Fund") for the period of June 10, 2024, to November 30, 2024. You can find additional information about the Fund at https://northsquareinvest.com/fund-reports-holdings/. You can also request this information by contacting us at 1-855-551-5521.
What were the Fund’s costs for the reporting period?
(based on a hypothetical $10,000 investment)
| Class Name | Costs of a $10,000 investment | Costs paid as a percentage of a $10,000 investment |
|---|
| Class I | $72 | 1.47% |
|---|
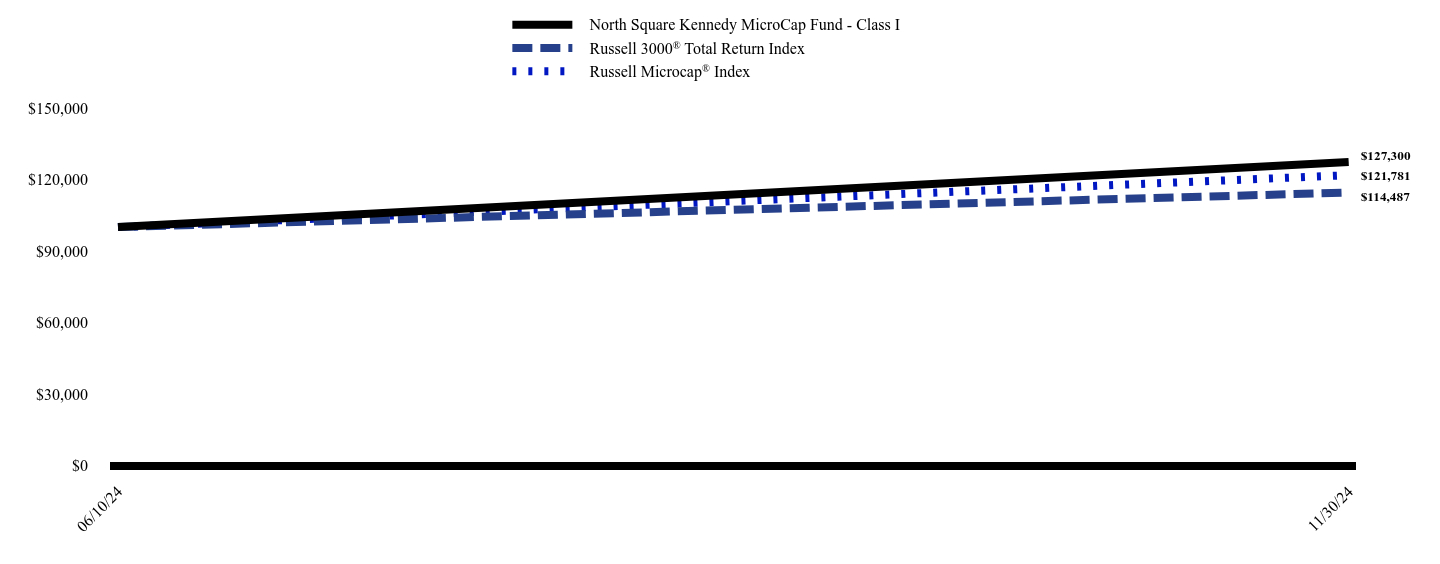
How has the Fund performed since inception?
Total Return Based on $100,000 Investment
| North Square Kennedy MicroCap Fund - Class I | Russell 3000® Total Return Index | Russell Microcap® Index |
|---|
| 06/10/24 | $100,000 | $100,000 | $100,001 |
|---|
| 11/30/24 | $127,300 | $114,487 | $121,781 |
|---|
- Net Assets$12,463,230
- Number of Portfolio Holdings122
- Advisory Fee (net of waivers)$0
- Portfolio Turnover46%
Average Annual Total Returns
| Since Inception (June 10, 2024) |
|---|
| North Square Kennedy MicroCap Fund - Class I | 27.30% |
|---|
Russell 3000® Total Return Index | 14.49% |
|---|
Russell Microcap® Index | 21.80% |
|---|
The Fund's past performance is not a good predictor of how the Fund will perform in the future. The graph and table do not reflect the deduction of taxes that a shareholder would pay on fund distributions or redemption of fund shares.
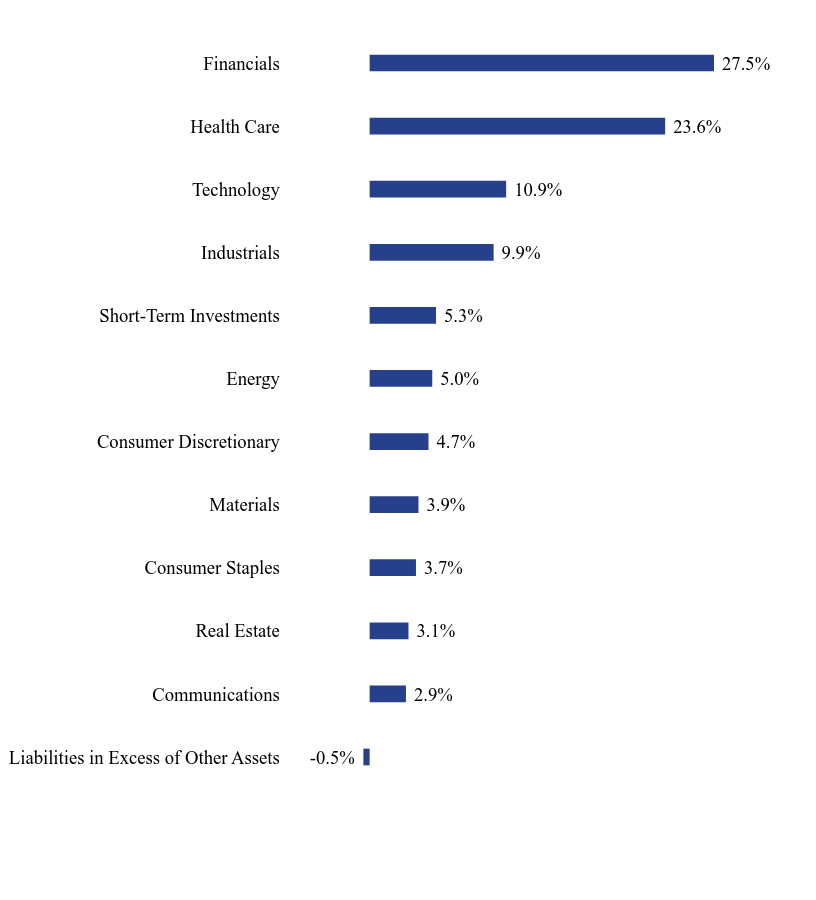
What did the Fund invest in?
Composition of Net Assets (% of net assets)
| Value | Value |
|---|
| Liabilities in Excess of Other Assets | -0.5% |
| Communications | 2.9% |
| Real Estate | 3.1% |
| Consumer Staples | 3.7% |
| Materials | 3.9% |
| Consumer Discretionary | 4.7% |
| Energy | 5.0% |
| Short-Term Investments | 5.3% |
| Industrials | 9.9% |
| Technology | 10.9% |
| Health Care | 23.6% |
| Financials | 27.5% |
Top 10 Holdings (% of net assets)
| Holding Name | % of Net Assets |
| First American Treasury Obligations Fund, Class X | 5.3% |
| Southern States Bancshares, Inc. | 2.8% |
| Northeast Bank | 2.4% |
| Universal Technical Institute, Inc. | 2.3% |
| Third Coast Bancshares, Inc. | 2.0% |
| Riley Exploration Permian, Inc. | 2.0% |
| Oportun Financial Corp. | 1.7% |
| SunOpta, Inc. | 1.5% |
| Capital Bancorp, Inc. | 1.5% |
| Powerfleet, Inc. | 1.5% |
No material changes occurred during the period ended November 30, 2024.
Where can I find additional information about the Fund?
Additional information is available on the Fund's website (https://northsquareinvest.com/fund-reports-holdings/), including its:
Prospectus
Financial information
Holdings
Proxy voting information
North Square Kennedy MicroCap Fund - Class I (NKMCX)
Semi-Annual Shareholder Report - November 30, 2024
North Square Multi Strategy Fund
Semi-Annual Shareholder Report - November 30, 2024
This semi-annual shareholder report contains important information about North Square Multi Strategy Fund (the "Fund") for the period of June 1, 2024, to November 30, 2024. You can find additional information about the Fund at https://northsquareinvest.com/fund-reports-holdings/. You can also request this information by contacting us at 1-855-551-5521.
What were the Fund’s costs for the last six months?
(based on a hypothetical $10,000 investment)
| Class Name | Costs of a $10,000 investment | Costs paid as a percentage of a $10,000 investment |
|---|
| Class A | $51 | 0.96% |
|---|
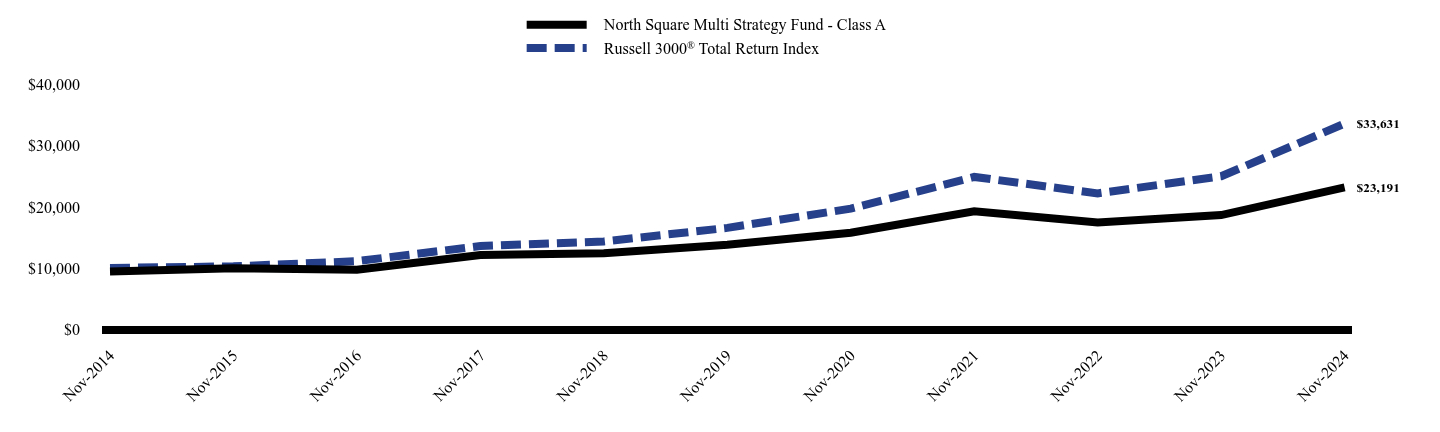
How has the Fund performed over the last ten years?
Total Return Based on $10,000 Investment
| North Square Multi Strategy Fund - Class A | Russell 3000® Total Return Index |
|---|
| Nov-2014 | $9,426 | $10,000 |
|---|
| Nov-2015 | $9,937 | $10,258 |
|---|
| Nov-2016 | $9,720 | $11,111 |
|---|
| Nov-2017 | $12,122 | $13,585 |
|---|
| Nov-2018 | $12,420 | $14,336 |
|---|
| Nov-2019 | $13,814 | $16,557 |
|---|
| Nov-2020 | $15,775 | $19,706 |
|---|
| Nov-2021 | $19,270 | $24,897 |
|---|
| Nov-2022 | $17,427 | $22,207 |
|---|
| Nov-2023 | $18,658 | $25,007 |
|---|
| Nov-2024 | $23,191 | $33,631 |
|---|
- Net Assets$42,323,927
- Number of Portfolio Holdings12
- Advisory Fee (net of waivers)$38,045
- Portfolio Turnover5%
Average Annual Total Returns
| 1 Year | 5 Years | 10 Years |
|---|
| North Square Multi Strategy Fund - Class A | | | |
|---|
| Without Load | 24.30% | 10.92% | 9.42% |
|---|
| With Load | 17.15% | 9.62% | 8.78% |
|---|
Russell 3000® Total Return Index | 34.49% | 15.23% | 12.89% |
|---|
The performance results shown above in the line chart and the average annual total returns table for periods prior to May 10, 2019 represent the performance of the Oak Ridge Multi Strategy Fund (the "Predecessor Fund") which converted into the Fund and is attributable to the Fund moving forward. The Fund's performance has not been restated to reflect any differences in expenses paid by the Predecessor Fund and those paid by the Fund.
Effective July 18, 2017, the Predecessor Fund made certain changes to its principal investment strategies. Accordingly, the Predecessor Fund's performance for the periods prior to July 18, 2017, is based on the Predecessor Fund's prior principal investment strategies and may not be representative of the Predecessor Fund's performance with its amended investment strategies, which are substantially identical to that of the Fund.
The Fund's past performance is not a good predictor of how the Fund will perform in the future. The graph and table do not reflect the deduction of taxes that a shareholder would pay on fund distributions or redemption of fund shares.
What did the Fund invest in?
Composition of Net Assets (% of net assets)
| Value | Value |
|---|
| Liabilities in Excess of Other Assets | -0.1% |
| Short-Term Investments | 1.3% |
| Fixed Income | 23.3% |
| Equity | 75.4% |
Top 10 Holdings (% of net assets)
| Holding Name | % of Net Assets |
| North Square Dynamic Small Cap Fund, Class I | 17.5% |
| North Square Altrinsic International Equity Fund, Class I | 13.6% |
| North Square Preferred and Income Securities Fund, Class I | 12.3% |
| North Square McKee Bond Fund, Class I | 11.0% |
Vanguard® Dividend Appreciation ETF | 10.6% |
Vanguard® Value ETF | 7.5% |
| North Square Advisory Research Small Value Fund, Class I | 6.8% |
Invesco® S&P 500® GARP ETF | 6.3% |
Vanguard® Growth ETF | 5.7% |
iShares® Core S&P 500® ETF | 5.0% |
No material changes occurred during the period ended November 30, 2024.
Where can I find additional information about the Fund?
Additional information is available on the Fund's website (https://northsquareinvest.com/fund-reports-holdings/), including its:
Prospectus
Financial information
Holdings
Proxy voting information
North Square Multi Strategy Fund - Class A (ORILX)
Semi-Annual Shareholder Report - November 30, 2024
North Square Multi Strategy Fund
Semi-Annual Shareholder Report - November 30, 2024
This semi-annual shareholder report contains important information about North Square Multi Strategy Fund (the "Fund") for the period of June 1, 2024, to November 30, 2024. You can find additional information about the Fund at https://northsquareinvest.com/fund-reports-holdings/. You can also request this information by contacting us at 1-855-551-5521.
What were the Fund’s costs for the last six months?
(based on a hypothetical $10,000 investment)
| Class Name | Costs of a $10,000 investment | Costs paid as a percentage of a $10,000 investment |
|---|
| Class I | $37 | 0.70% |
|---|
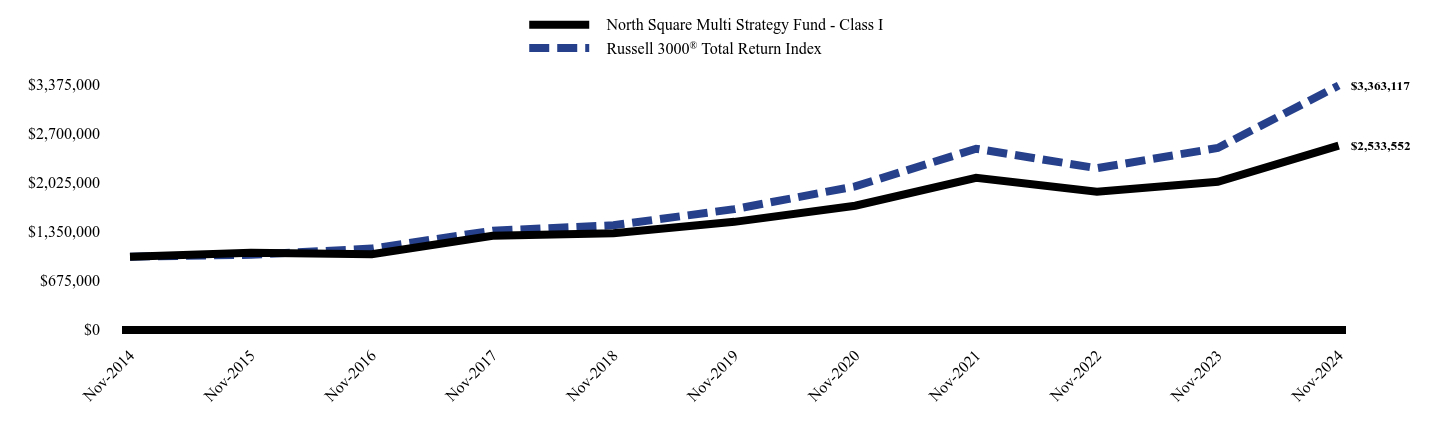
How has the Fund performed over the last ten years?
Total Return Based on $1,000,000 Investment
| North Square Multi Strategy Fund - Class I | Russell 3000® Total Return Index |
|---|
| Nov-2014 | $1,000,000 | $1,000,000 |
|---|
| Nov-2015 | $1,054,774 | $1,025,831 |
|---|
| Nov-2016 | $1,032,161 | $1,111,055 |
|---|
| Nov-2017 | $1,287,437 | $1,358,510 |
|---|
| Nov-2018 | $1,323,116 | $1,433,590 |
|---|
| Nov-2019 | $1,480,415 | $1,655,661 |
|---|
| Nov-2020 | $1,703,050 | $1,970,628 |
|---|
| Nov-2021 | $2,089,161 | $2,489,677 |
|---|
| Nov-2022 | $1,894,977 | $2,220,728 |
|---|
| Nov-2023 | $2,032,715 | $2,500,731 |
|---|
| Nov-2024 | $2,533,552 | $3,363,117 |
|---|
- Net Assets$42,323,927
- Number of Portfolio Holdings12
- Advisory Fee (net of waivers)$38,045
- Portfolio Turnover5%
Average Annual Total Returns
| 1 Year | 5 Years | 10 Years |
|---|
| North Square Multi Strategy Fund - Class I | 24.64% | 11.34% | 9.74% |
|---|
Russell 3000® Total Return Index | 34.49% | 15.23% | 12.89% |
|---|
The performance results shown above in the line chart and the average annual total returns table for periods prior to May 10, 2019 represent the performance of the Oak Ridge Multi Strategy Fund (the "Predecessor Fund") which converted into the Fund and is attributable to the Fund moving forward. The Fund's performance has not been restated to reflect any differences in expenses paid by the Predecessor Fund and those paid by the Fund.
Effective July 18, 2017, the Predecessor Fund made certain changes to its principal investment strategies. Accordingly, the Predecessor Fund's performance for the periods prior to July 18, 2017, is based on the Predecessor Fund's prior principal investment strategies and may not be representative of the Predecessor Fund's performance with its amended investment strategies, which are substantially identical to that of the Fund.
The Fund's past performance is not a good predictor of how the Fund will perform in the future. The graph and table do not reflect the deduction of taxes that a shareholder would pay on fund distributions or redemption of fund shares.
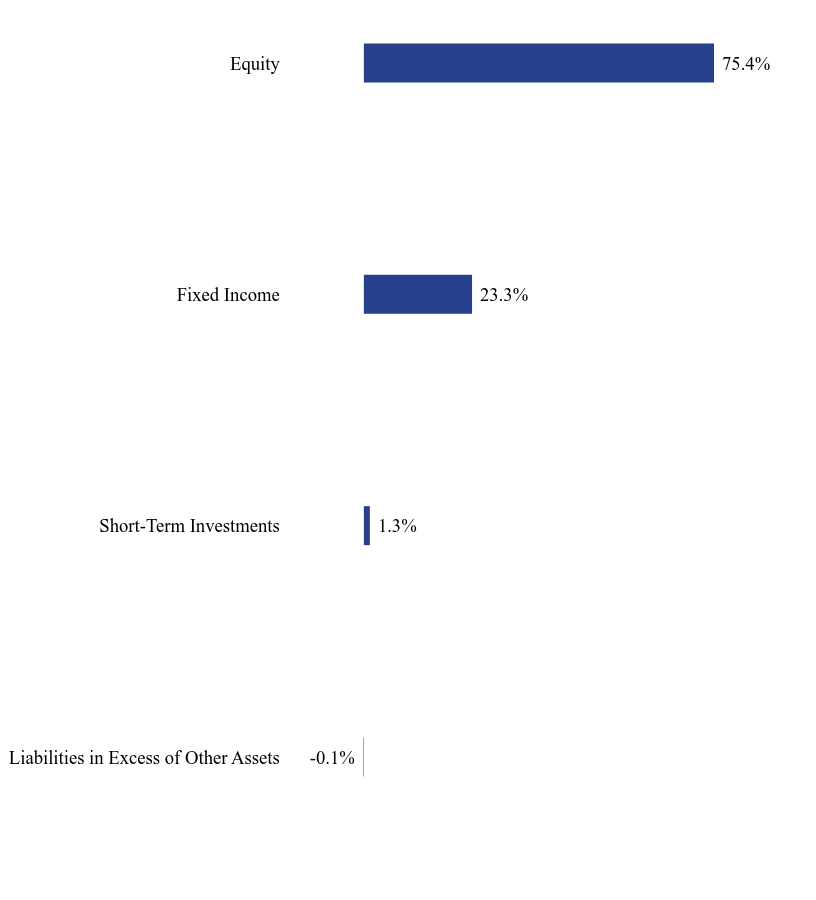
What did the Fund invest in?
Composition of Net Assets (% of net assets)
| Value | Value |
|---|
| Liabilities in Excess of Other Assets | -0.1% |
| Short-Term Investments | 1.3% |
| Fixed Income | 23.3% |
| Equity | 75.4% |
Top 10 Holdings (% of net assets)
| Holding Name | % of Net Assets |
| North Square Dynamic Small Cap Fund, Class I | 17.5% |
| North Square Altrinsic International Equity Fund, Class I | 13.6% |
| North Square Preferred and Income Securities Fund, Class I | 12.3% |
| North Square McKee Bond Fund, Class I | 11.0% |
Vanguard® Dividend Appreciation ETF | 10.6% |
Vanguard® Value ETF | 7.5% |
| North Square Advisory Research Small Value Fund, Class I | 6.8% |
Invesco® S&P 500® GARP ETF | 6.3% |
Vanguard® Growth ETF | 5.7% |
iShares® Core S&P 500® ETF | 5.0% |
No material changes occurred during the period ended November 30, 2024.
Where can I find additional information about the Fund?
Additional information is available on the Fund's website (https://northsquareinvest.com/fund-reports-holdings/), including its:
Prospectus
Financial information
Holdings
Proxy voting information
North Square Multi Strategy Fund - Class I (PORYX)
Semi-Annual Shareholder Report - November 30, 2024
North Square Preferred and Income Securities Fund
Semi-Annual Shareholder Report - November 30, 2024
This semi-annual shareholder report contains important information about North Square Preferred and Income Securities Fund (the "Fund") for the period of June 1, 2024, to November 30, 2024. You can find additional information about the Fund at https://northsquareinvest.com/fund-reports-holdings/. You can also request this information by contacting us at 1-855-551-5521.
What were the Fund’s costs for the last six months?
(based on a hypothetical $10,000 investment)
| Class Name | Costs of a $10,000 investment | Costs paid as a percentage of a $10,000 investment |
|---|
| Class I | $50 | 0.96% |
|---|
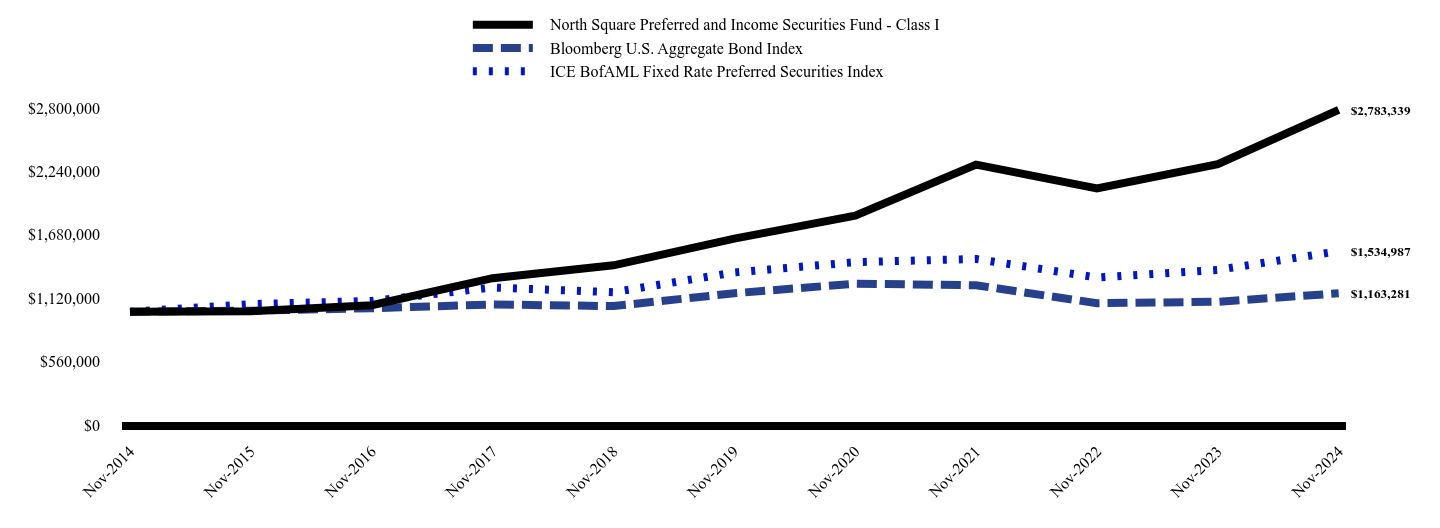
How has the Fund performed over the last ten years?
Total Return Based on $1,000,000 Investment
| North Square Preferred and Income Securities Fund - Class I | Bloomberg U.S. Aggregate Bond Index | ICE BofAML Fixed Rate Preferred Securities Index |
|---|
| Nov-2014 | $1,000,000 | $1,000,000 | $1,000,000 |
|---|
| Nov-2015 | $1,004,700 | $1,009,702 | $1,067,866 |
|---|
| Nov-2016 | $1,058,114 | $1,031,630 | $1,096,103 |
|---|
| Nov-2017 | $1,297,133 | $1,064,786 | $1,214,181 |
|---|
| Nov-2018 | $1,410,680 | $1,050,494 | $1,173,065 |
|---|
| Nov-2019 | $1,645,827 | $1,163,856 | $1,347,576 |
|---|
| Nov-2020 | $1,848,972 | $1,248,630 | $1,438,222 |
|---|
| Nov-2021 | $2,299,148 | $1,234,230 | $1,466,708 |
|---|
| Nov-2022 | $2,089,309 | $1,075,757 | $1,302,512 |
|---|
| Nov-2023 | $2,304,377 | $1,088,449 | $1,370,005 |
|---|
| Nov-2024 | $2,783,339 | $1,163,281 | $1,534,987 |
|---|
- Net Assets$253,815,416
- Number of Portfolio Holdings78
- Advisory Fee (net of waivers)$796,379
- Portfolio Turnover44%
Average Annual Total Returns
| 1 Year | 5 Years | 10 Years |
|---|
| North Square Preferred and Income Securities Fund - Class I | 20.78% | 11.08% | 10.78% |
|---|
| Bloomberg U.S. Aggregate Bond Index | 6.88% | -0.01% | 1.52% |
|---|
| ICE BofAML Fixed Rate Preferred Securities Index | 12.04% | 2.64% | 4.38% |
|---|
The Fund adopted the historical performance of the Oak Ridge Dividend Growth Fund (the “Predecessor Fund”), which was reorganized into the Fund on May 10, 2019. Fund performance results above for the period prior to that date represent the performance of the Predecessor Fund. Effective January 11, 2022, the Fund made changes to its investment objective and principal investment strategies. Accordingly, the performance prior to January 11, 2022, is based on the Fund's prior investment objective and principal investment strategies and may not be representative of the Fund's performance under its current principal investment strategies.
The Fund's past performance is not a good predictor of how the Fund will perform in the future. The graph and table do not reflect the deduction of taxes that a shareholder would pay on fund distributions or redemption of fund shares.
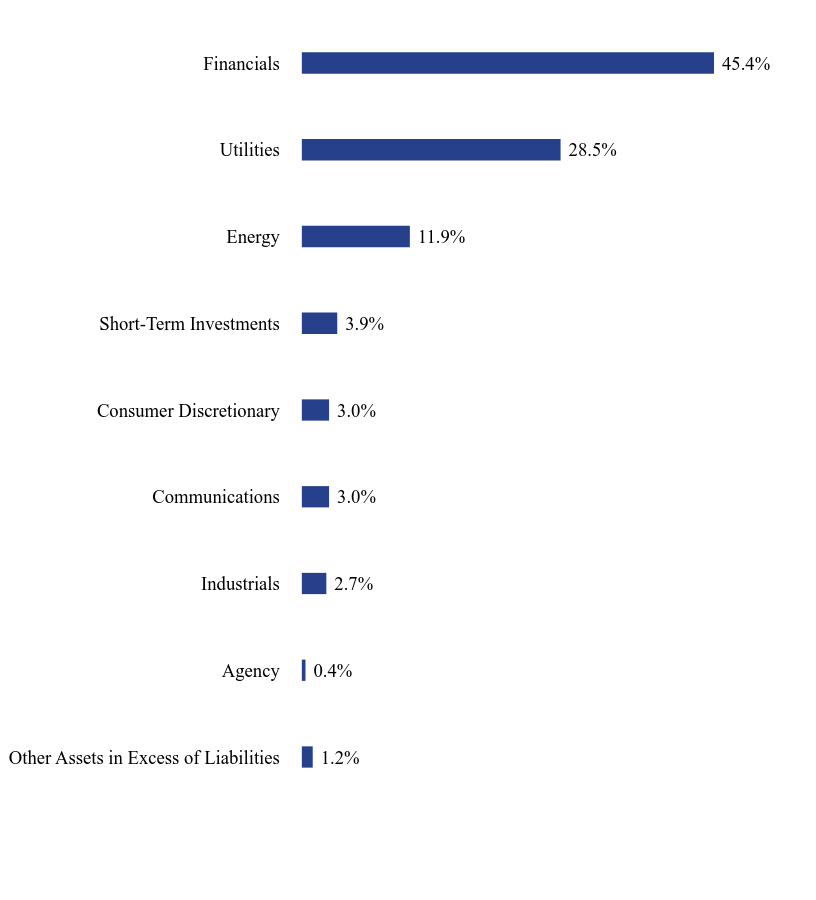
What did the Fund invest in?
Composition of Net Assets (% of net assets)
| Value | Value |
|---|
| Other Assets in Excess of Liabilities | 1.2% |
| Agency | 0.4% |
| Industrials | 2.7% |
| Communications | 3.0% |
| Consumer Discretionary | 3.0% |
| Short-Term Investments | 3.9% |
| Energy | 11.9% |
| Utilities | 28.5% |
| Financials | 45.4% |
Top 10 Holdings (% of net assets)
| Holding Name | % of Net Assets |
| Vistra Corp., 8.875%, 12/31/49 | 3.3% |
| Energy Transfer LP, 6.625%, Perpetual | 3.2% |
| KeyCorp, 5.000%, Perpetual | 2.9% |
| AltaGas Ltd., 7.200%, 10/15/54 | 2.8% |
| Stanley Black & Decker, Inc., 4.000%, 03/15/60 | 2.7% |
| Deutsche Bank AG, 4.789%, 12/31/49 | 2.7% |
| Algonquin Power & Utilities Corp., 4.750%, 01/18/82 | 2.6% |
| South Bow Canadian Infrastructure Holdings Ltd., 7.500%, 03/1/55 | 2.6% |
| Ally Financial, Inc., 4.700%, Perpetual | 2.5% |
| CenterPoint Energy, Inc., 6.850%, 02/15/55 | 2.4% |
No material changes occurred during the period ended November 30, 2024.
Where can I find additional information about the Fund?
Additional information is available on the Fund's website (https://northsquareinvest.com/fund-reports-holdings/), including its:
Prospectus
Financial information
Holdings
Proxy voting information
North Square Preferred and Income Securities Fund - Class I (ORDNX)
Semi-Annual Shareholder Report - November 30, 2024
North Square Spectrum Alpha Fund
Semi-Annual Shareholder Report - November 30, 2024
This semi-annual shareholder report contains important information about North Square Spectrum Alpha Fund (the "Fund") for the period of June 1, 2024, to November 30, 2024. You can find additional information about the Fund at https://northsquareinvest.com/fund-reports-holdings/. You can also request this information by contacting us at 1-855-551-5521.
What were the Fund’s costs for the last six months?
(based on a hypothetical $10,000 investment)
| Class Name | Costs of a $10,000 investment | Costs paid as a percentage of a $10,000 investment |
|---|
| Class A | $71 | 1.30% |
|---|
How has the Fund performed over the last ten years?
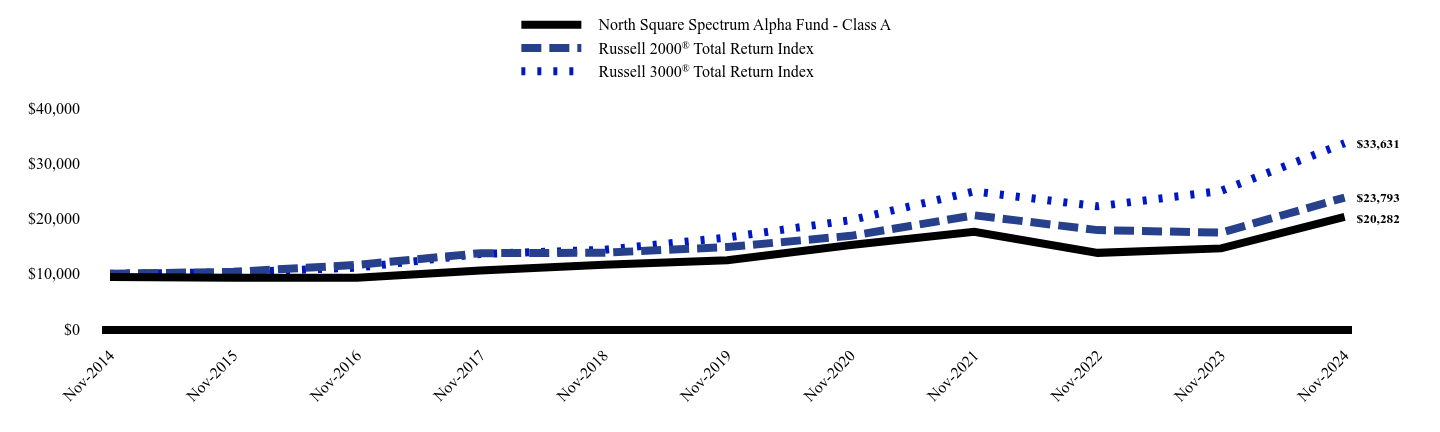
Total Return Based on $10,000 Investment
| North Square Spectrum Alpha Fund - Class A | Russell 2000® Total Return Index | Russell 3000® Total Return Index |
|---|
| Nov-2014 | $9,425 | $10,000 | $10,000 |
|---|
| Nov-2015 | $9,270 | $10,351 | $10,258 |
|---|
| Nov-2016 | $9,292 | $11,601 | $11,111 |
|---|
| Nov-2017 | $10,601 | $13,728 | $13,585 |
|---|
| Nov-2018 | $11,641 | $13,807 | $14,336 |
|---|
| Nov-2019 | $12,443 | $14,844 | $16,557 |
|---|
| Nov-2020 | $15,219 | $16,862 | $19,706 |
|---|
| Nov-2021 | $17,579 | $20,576 | $24,897 |
|---|
| Nov-2022 | $13,783 | $17,898 | $22,207 |
|---|
| Nov-2023 | $14,594 | $17,439 | $25,007 |
|---|
| Nov-2024 | $20,282 | $23,793 | $33,631 |
|---|
- Net Assets (In Millions)$86,997
- Number of Holdings5
- Advisory Fee$80,976
- Portfolio turnover14%
Average Annual Total Returns
| 1 Year | 5 Years | 10 Years |
|---|
| North Square Spectrum Alpha Fund - Class A | | | |
|---|
| Without Load | 38.98% | 10.27% | 7.97% |
|---|
| With Load | 31.04% | 8.97% | 7.33% |
|---|
Russell 2000® Total Return Index | 36.43% | 9.90% | 9.05% |
|---|
Russell 3000® Total Return Index | 34.49% | 15.23% | 12.89% |
|---|
The performance results shown above in the line chart and the average annual total returns table for periods prior to May 10, 2019 represent the performance of the Oak Ridge Small Cap Growth Fund (the "Predecessor Fund") which converted into the Fund and is attributable to the Fund moving forward. The Fund's performance has not been restated to reflect any differences in expenses paid by the Predecessor Fund and those paid by the Fund.
Effective January 11, 2022, the Fund made certain changes to its principal investment strategies. Accordingly, the Fund's performance for the periods prior to January 11, 2022, is based on the prior principal investment strategies and may not be representative of the Fund's performance under its current principal investment strategies.
The Fund's past performance is not a good predictor of how the Fund will perform in the future. The graph and table do not reflect the deduction of taxes that a shareholder would pay on fund distributions or redemption of fund shares.
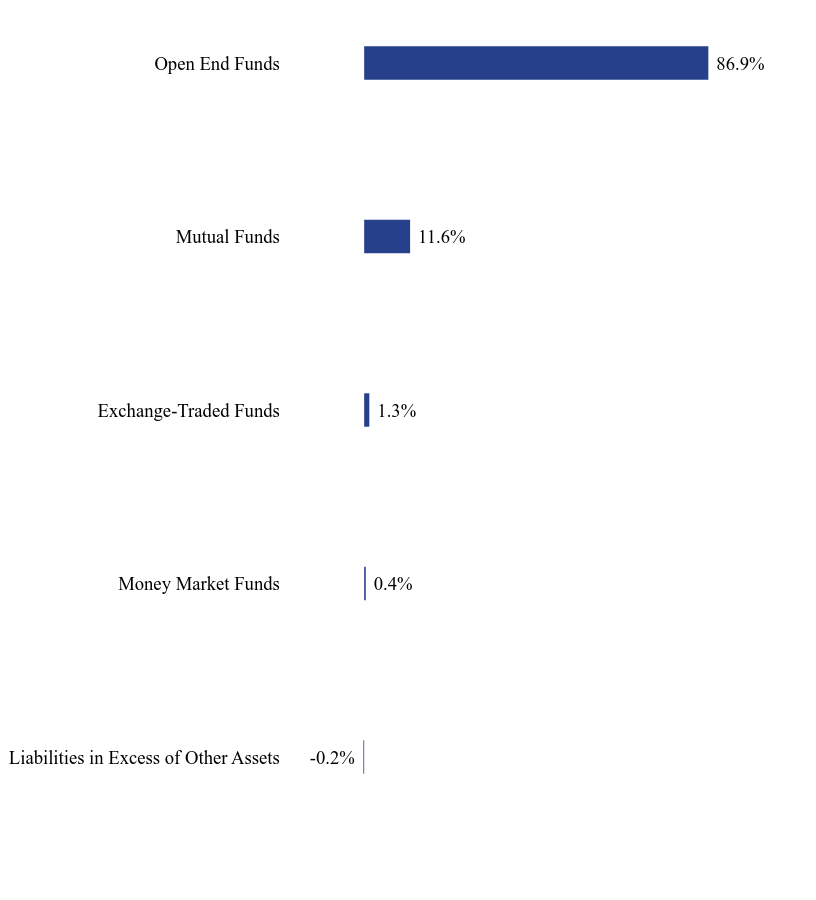
What did the Fund invest in?
Composition of Net Assets (% of net assets)
| Value | Value |
|---|
| Liabilities in Excess of Other Assets | -0.2% |
| Money Market Funds | 0.4% |
| Exchange-Traded Funds | 1.3% |
| Mutual Funds | 11.6% |
| Open End Funds | 86.9% |
Top Holdings (% of net assets)
| Holding Name | % of Net Assets |
| North Square Dynamic Small Cap Fund, Class I | 60.9% |
| North Square Advisory Research Small Value Fund, Class I | 26.0% |
| North Square Kennedy MicroCap Fund, Class I | 11.6% |
iShares® Russell 2000 ETF | 1.3% |
| First American Treasury Obligations Fund, Class X | 0.4% |
No material changes occurred during the period ended November 30, 2024.
Where can I find additional information about the Fund?
Additional information is available on the Fund's website (https://northsquareinvest.com/fund-reports-holdings/), including its:
Prospectus
Financial information
Holdings
Proxy voting information
North Square Spectrum Alpha Fund - Class A (ORIGX)
Semi-Annual Shareholder Report - November 30, 2024
North Square Spectrum Alpha Fund
Semi-Annual Shareholder Report - November 30, 2024
This semi-annual shareholder report contains important information about North Square Spectrum Alpha Fund (the "Fund") for the period of June 1, 2024, to November 30, 2024. You can find additional information about the Fund at https://northsquareinvest.com/fund-reports-holdings/. You can also request this information by contacting us at 1-855-551-5521.
What were the Fund’s costs for the last six months?
(based on a hypothetical $10,000 investment)
| Class Name | Costs of a $10,000 investment | Costs paid as a percentage of a $10,000 investment |
|---|
| Class I | $58 | 1.05% |
|---|
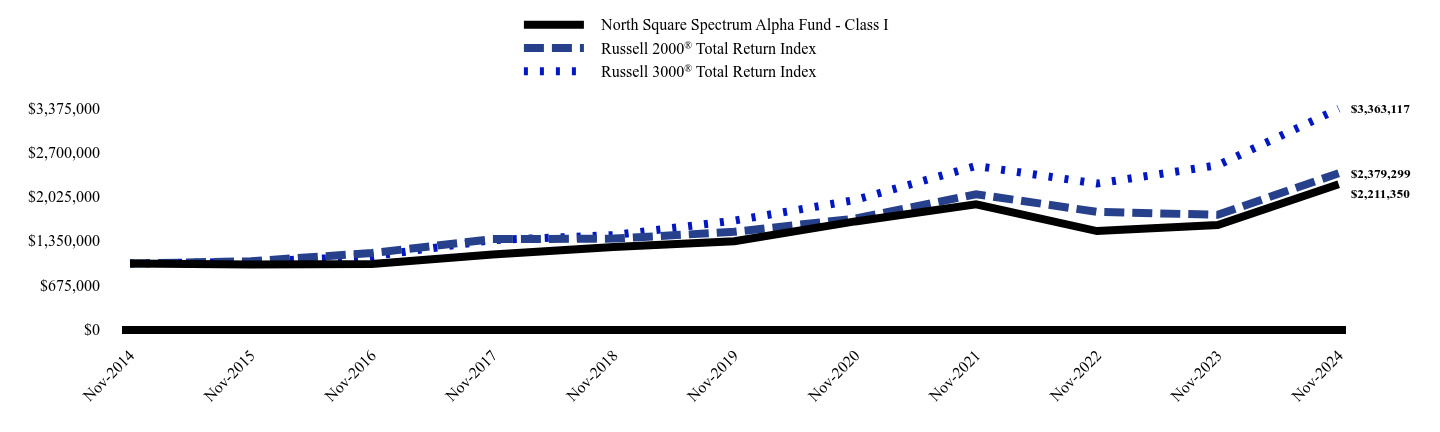
How has the Fund performed over the last ten years?
Total Return Based on $1,000,000 Investment
| North Square Spectrum Alpha Fund - Class I | Russell 2000® Total Return Index | Russell 3000® Total Return Index |
|---|
| Nov-2014 | $1,000,000 | $1,000,000 | $1,000,000 |
|---|
| Nov-2015 | $986,688 | $1,035,071 | $1,025,831 |
|---|
| Nov-2016 | $992,843 | $1,160,075 | $1,111,055 |
|---|
| Nov-2017 | $1,136,410 | $1,372,801 | $1,358,510 |
|---|
| Nov-2018 | $1,250,959 | $1,380,676 | $1,433,590 |
|---|
| Nov-2019 | $1,340,446 | $1,484,422 | $1,655,661 |
|---|
| Nov-2020 | $1,643,005 | $1,686,212 | $1,970,628 |
|---|
| Nov-2021 | $1,903,196 | $2,057,601 | $2,489,677 |
|---|
| Nov-2022 | $1,496,070 | $1,789,835 | $2,220,728 |
|---|
| Nov-2023 | $1,587,878 | $1,743,926 | $2,500,731 |
|---|
| Nov-2024 | $2,211,350 | $2,379,299 | $3,363,117 |
|---|
- Net Assets (In Millions)$86,997
- Number of Holdings5
- Advisory Fee$80,976
- Portfolio turnover14%
Average Annual Total Returns
| 1 Year | 5 Years | 10 Years |
|---|
| North Square Spectrum Alpha Fund - Class I | 39.26% | 10.53% | 8.26% |
|---|
Russell 2000® Total Return Index | 36.43% | 9.90% | 9.05% |
|---|
Russell 3000® Total Return Index | 34.49% | 15.23% | 12.89% |
|---|
The performance results shown above in the line chart and the average annual total returns table for periods prior to May 10, 2019 represent the performance of the Oak Ridge Small Cap Growth Fund (the "Predecessor Fund") which converted into the Fund and is attributable to the Fund moving forward. The Fund's performance has not been restated to reflect any differences in expenses paid by the Predecessor Fund and those paid by the Fund.
Effective January 11, 2022, the Fund made certain changes to its principal investment strategies. Accordingly, the Fund's performance for the periods prior to January 11, 2022, is based on the prior principal investment strategies and may not be representative of the Fund's performance under its current principal investment strategies.
The Fund's past performance is not a good predictor of how the Fund will perform in the future. The graph and table do not reflect the deduction of taxes that a shareholder would pay on fund distributions or redemption of fund shares.
What did the Fund invest in?
Composition of Net Assets (% of net assets)
| Value | Value |
|---|
| Liabilities in Excess of Other Assets | -0.2% |
| Money Market Funds | 0.4% |
| Exchange-Traded Funds | 1.3% |
| Mutual Funds | 11.6% |
| Open End Funds | 86.9% |
Top Holdings (% of net assets)
| Holding Name | % of Net Assets |
| North Square Dynamic Small Cap Fund, Class I | 60.9% |
| North Square Advisory Research Small Value Fund, Class I | 26.0% |
| North Square Kennedy MicroCap Fund, Class I | 11.6% |
iShares® Russell 2000 ETF | 1.3% |
| First American Treasury Obligations Fund, Class X | 0.4% |
No material changes occurred during the period ended November 30, 2024.
Where can I find additional information about the Fund?
Additional information is available on the Fund's website (https://northsquareinvest.com/fund-reports-holdings/), including its:
Prospectus
Financial information
Holdings
Proxy voting information
North Square Spectrum Alpha Fund - Class I (ORIYX)
Semi-Annual Shareholder Report - November 30, 2024
North Square Tactical Defensive Fund
Semi-Annual Shareholder Report - November 30, 2024
This semi-annual shareholder report contains important information about North Square Tactical Defensive Fund (the "Fund") for the period of June 1, 2024, to November 30, 2024. You can find additional information about the Fund at https://northsquareinvest.com/fund-reports-holdings/. You can also request this information by contacting us at 1-855-551-5521.
What were the Fund’s costs for the last six months?
(based on a hypothetical $10,000 investment)
| Class Name | Costs of a $10,000 investment | Costs paid as a percentage of a $10,000 investment |
|---|
| Class A | $100 | 1.95% |
|---|
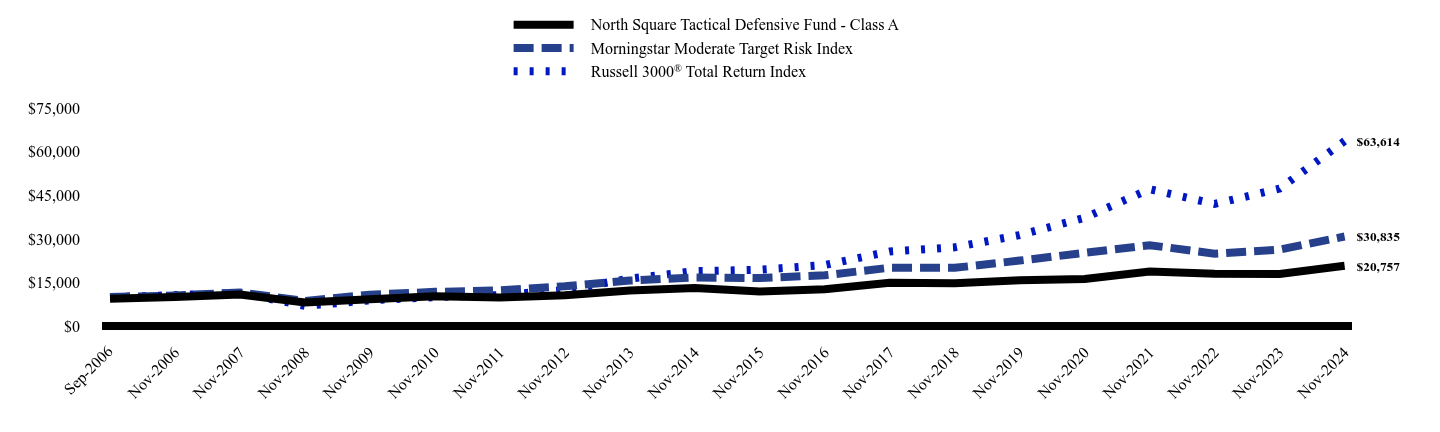
How has the Fund performed over the last ten years?
Total Return Based on $10,000 Investment
| North Square Tactical Defensive Fund - Class A | Morningstar Moderate Target Risk Index | Russell 3000® Total Return Index |
|---|
| Sep-2006 | $9,428 | $10,000 | $10,000 |
|---|
| Nov-2006 | $10,027 | $10,572 | $10,688 |
|---|
| Nov-2007 | $10,890 | $11,594 | $11,441 |
|---|
| Nov-2008 | $8,158 | $8,701 | $6,996 |
|---|
| Nov-2009 | $9,296 | $10,842 | $8,896 |
|---|
| Nov-2010 | $10,333 | $11,805 | $10,020 |
|---|
| Nov-2011 | $9,861 | $12,315 | $10,721 |
|---|
| Nov-2012 | $10,661 | $13,704 | $12,431 |
|---|
| Nov-2013 | $12,292 | $15,690 | $16,373 |
|---|
| Nov-2014 | $13,147 | $16,765 | $18,915 |
|---|
| Nov-2015 | $11,971 | $16,551 | $19,404 |
|---|
| Nov-2016 | $12,682 | $17,491 | $21,016 |
|---|
| Nov-2017 | $14,896 | $20,099 | $25,697 |
|---|
| Nov-2018 | $14,768 | $20,063 | $27,117 |
|---|
| Nov-2019 | $15,826 | $22,559 | $31,317 |
|---|
| Nov-2020 | $16,264 | $25,215 | $37,275 |
|---|
| Nov-2021 | $18,836 | $27,853 | $47,093 |
|---|
| Nov-2022 | $18,039 | $24,935 | $42,006 |
|---|
| Nov-2023 | $17,949 | $26,321 | $47,302 |
|---|
| Nov-2024 | $20,757 | $30,835 | $63,614 |
|---|
- Net Assets$57,564,623
- Number of Portfolio Holdings7
- Advisory Fee (net of waivers)$334,622
- Portfolio Turnover93%
Average Annual Total Returns
| 1 Year | 5 Years | 10 Years |
|---|
| North Square Tactical Defensive Fund - Class A | | | |
|---|
| Without Load | 15.64% | 5.57% | 4.67% |
|---|
| With Load | 9.03% | 4.33% | 4.05% |
|---|
| Morningstar Moderate Target Risk Index | 17.15% | 6.45% | 6.28% |
|---|
Russell 3000® Total Return Index | 34.49% | 15.23% | 12.89% |
|---|
The performance results shown above in the line chart and the average annual total returns table for periods prior to June 11, 2021 represent the performance of the Stadion Tactical Defensive Fund (the "Predecessor Fund") which converted into the Fund and is attributable to the Fund moving forward. The Fund's performance has not been restated to reflect any differences in expenses paid by the Predecessor Fund and those paid by the Fund.
The Morningstar Moderate Target Risk Index is representative of a broader market and range of securities than is found in the Fund’s portfolio. Individuals cannot invest directly in an index; however, an individual may invest in exchange-traded funds or other investment vehicles that attempt to track the performance of a benchmark index.
The Fund's past performance is not a good predictor of how the Fund will perform in the future. The graph and table do not reflect the deduction of taxes that a shareholder would pay on fund distributions or redemption of fund shares.
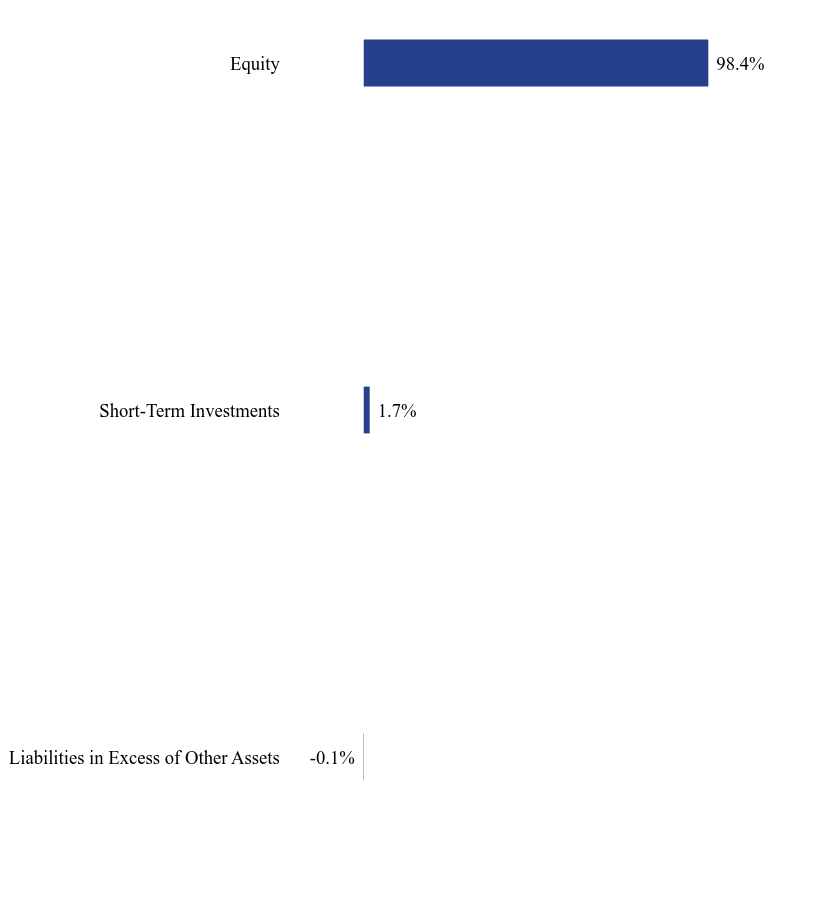
What did the Fund invest in?
Composition of Net Assets (% of net assets)
| Value | Value |
|---|
| Liabilities in Excess of Other Assets | -0.1% |
| Short-Term Investments | 1.7% |
| Equity | 98.4% |
Top Holdings (% of net assets)
| Holding Name | % of Net Assets |
SPDR® Portfolio S&P 500® ETF | 27.2% |
SPDR® Dow Jones Industrial Average ETF Trust | 23.8% |
iShares® Core S&P 500® ETF | 23.7% |
SPDR® Portfolio Developed World ex-US ETF | 14.9% |
SPDR® Portfolio Emerging Markets ETF | 5.4% |
SPDR® Portfolio S&P 600® Small Cap ETF | 3.4% |
This report describes changes to the Fund that occurred during the reporting period.
Where can I find additional information about the Fund?
Additional information is available on the Fund's website (https://northsquareinvest.com/fund-reports-holdings/), including its:
Prospectus
Financial information
Holdings
Proxy voting information
North Square Tactical Defensive Fund - Class A (ETFRX)
Semi-Annual Shareholder Report - November 30, 2024
North Square Tactical Defensive Fund
Semi-Annual Shareholder Report - November 30, 2024
This semi-annual shareholder report contains important information about North Square Tactical Defensive Fund (the "Fund") for the period of June 1, 2024, to November 30, 2024. You can find additional information about the Fund at https://northsquareinvest.com/fund-reports-holdings/. You can also request this information by contacting us at 1-855-551-5521.
What were the Fund’s costs for the last six months?
(based on a hypothetical $10,000 investment)
| Class Name | Costs of a $10,000 investment | Costs paid as a percentage of a $10,000 investment |
|---|
| Class C | $69 | 1.35% |
|---|
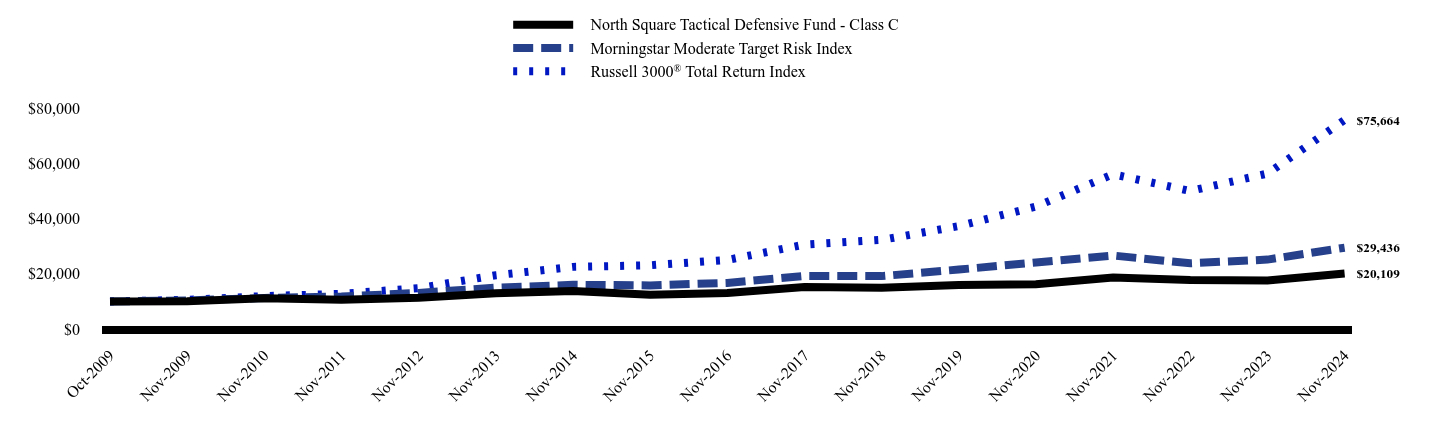
How has the Fund performed over the last ten years?
Total Return Based on $10,000 Investment
| North Square Tactical Defensive Fund - Class C | Morningstar Moderate Target Risk Index | Russell 3000® Total Return Index |
|---|
| Oct-2009 | $10,000 | $10,000 | $10,000 |
|---|
| Nov-2009 | $10,103 | $10,350 | $10,582 |
|---|
| Nov-2010 | $11,149 | $11,270 | $11,918 |
|---|
| Nov-2011 | $10,564 | $11,756 | $12,751 |
|---|
| Nov-2012 | $11,327 | $13,082 | $14,785 |
|---|
| Nov-2013 | $12,943 | $14,978 | $19,474 |
|---|
| Nov-2014 | $13,747 | $16,004 | $22,498 |
|---|
| Nov-2015 | $12,418 | $15,800 | $23,079 |
|---|
| Nov-2016 | $13,064 | $16,697 | $24,997 |
|---|
| Nov-2017 | $15,215 | $19,187 | $30,564 |
|---|
| Nov-2018 | $14,977 | $19,153 | $32,253 |
|---|
| Nov-2019 | $15,928 | $21,535 | $37,250 |
|---|
| Nov-2020 | $16,246 | $24,071 | $44,336 |
|---|
| Nov-2021 | $18,674 | $26,590 | $56,013 |
|---|
| Nov-2022 | $17,742 | $23,804 | $49,963 |
|---|
| Nov-2023 | $17,534 | $25,127 | $56,262 |
|---|
| Nov-2024 | $20,109 | $29,436 | $75,664 |
|---|
- Net Assets$57,564,623
- Number of Portfolio Holdings7
- Advisory Fee (net of waivers)$334,622
- Portfolio Turnover93%
Average Annual Total Returns
| 1 Year | 5 Years | 10 Years |
|---|
| North Square Tactical Defensive Fund - Class C | | | |
|---|
| Without Load | 14.69% | 4.77% | 3.88% |
|---|
| With Load | 13.69% | 4.77% | 3.88% |
|---|
| Morningstar Moderate Target Risk Index | 17.15% | 6.45% | 6.28% |
|---|
Russell 3000® Total Return Index | 34.49% | 15.23% | 12.89% |
|---|
The performance results shown above in the line chart and the average annual total returns table for periods prior to June 11, 2021 represent the performance of the Stadion Tactical Defensive Fund (the "Predecessor Fund") which converted into the Fund and is attributable to the Fund moving forward. The Fund's performance has not been restated to reflect any differences in expenses paid by the Predecessor Fund and those paid by the Fund.
The Morningstar Moderate Target Risk Index is representative of a broader market and range of securities than is found in the Fund’s portfolio. Individuals cannot invest directly in an index; however, an individual may invest in exchange-traded funds or other investment vehicles that attempt to track the performance of a benchmark index.
The Fund's past performance is not a good predictor of how the Fund will perform in the future. The graph and table do not reflect the deduction of taxes that a shareholder would pay on fund distributions or redemption of fund shares.
What did the Fund invest in?
Composition of Net Assets (% of net assets)
| Value | Value |
|---|
| Liabilities in Excess of Other Assets | -0.1% |
| Short-Term Investments | 1.7% |
| Equity | 98.4% |
Top Holdings (% of net assets)
| Holding Name | % of Net Assets |
SPDR® Portfolio S&P 500® ETF | 27.2% |
SPDR® Dow Jones Industrial Average ETF Trust | 23.8% |
iShares® Core S&P 500® ETF | 23.7% |
SPDR® Portfolio Developed World ex-US ETF | 14.9% |
SPDR® Portfolio Emerging Markets ETF | 5.4% |
SPDR® Portfolio S&P 600® Small Cap ETF | 3.4% |
This report describes changes to the Fund that occurred during the reporting period.
Where can I find additional information about the Fund?
Additional information is available on the Fund's website (https://northsquareinvest.com/fund-reports-holdings/), including its:
Prospectus
Financial information
Holdings
Proxy voting information
North Square Tactical Defensive Fund - Class C (ETFZX)
Semi-Annual Shareholder Report - November 30, 2024
North Square Tactical Defensive Fund
Semi-Annual Shareholder Report - November 30, 2024
This semi-annual shareholder report contains important information about North Square Tactical Defensive Fund (the "Fund") for the period of June 1, 2024, to November 30, 2024. You can find additional information about the Fund at https://northsquareinvest.com/fund-reports-holdings/. You can also request this information by contacting us at 1-855-551-5521.
What were the Fund’s costs for the last six months?
(based on a hypothetical $10,000 investment)
| Class Name | Costs of a $10,000 investment | Costs paid as a percentage of a $10,000 investment |
|---|
| Class I | $87 | 1.70% |
|---|
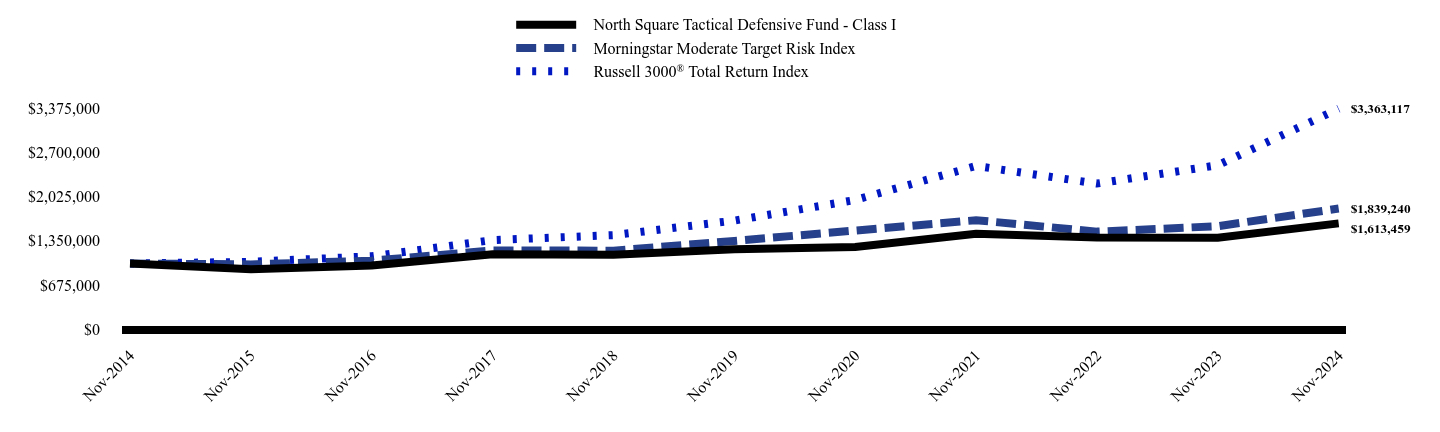
How has the Fund performed over the last ten years?
Total Return Based on $1,000,000 Investment
| North Square Tactical Defensive Fund - Class I | Morningstar Moderate Target Risk Index | Russell 3000® Total Return Index |
|---|
| Nov-2014 | $1,000,000 | $1,000,000 | $1,000,000 |
|---|
| Nov-2015 | $912,221 | $987,210 | $1,025,831 |
|---|
| Nov-2016 | $969,874 | $1,043,307 | $1,111,055 |
|---|
| Nov-2017 | $1,140,566 | $1,198,892 | $1,358,510 |
|---|
| Nov-2018 | $1,134,276 | $1,196,711 | $1,433,590 |
|---|
| Nov-2019 | $1,216,651 | $1,345,588 | $1,655,661 |
|---|
| Nov-2020 | $1,253,032 | $1,504,027 | $1,970,628 |
|---|
| Nov-2021 | $1,454,397 | $1,661,405 | $2,489,677 |
|---|
| Nov-2022 | $1,396,019 | $1,487,340 | $2,220,728 |
|---|
| Nov-2023 | $1,392,634 | $1,570,001 | $2,500,731 |
|---|
| Nov-2024 | $1,613,459 | $1,839,240 | $3,363,117 |
|---|
- Net Assets$57,564,623
- Number of Portfolio Holdings7
- Advisory Fee (net of waivers)$334,622
- Portfolio Turnover93%
Average Annual Total Returns
| 1 Year | 5 Years | 10 Years |
|---|
| North Square Tactical Defensive Fund - Class I | 15.86% | 5.81% | 4.90% |
|---|
| Morningstar Moderate Target Risk Index | 17.15% | 6.45% | 6.28% |
|---|
Russell 3000® Total Return Index | 34.49% | 15.23% | 12.89% |
|---|
The performance results shown above in the line chart and the average annual total returns table for periods prior to June 11, 2021 represent the performance of the Stadion Tactical Defensive Fund (the "Predecessor Fund") which converted into the Fund and is attributable to the Fund moving forward. The Fund's performance has not been restated to reflect any differences in expenses paid by the Predecessor Fund and those paid by the Fund.
The Morningstar Moderate Target Risk Index is representative of a broader market and range of securities than is found in the Fund’s portfolio. Individuals cannot invest directly in an index; however, an individual may invest in exchange-traded funds or other investment vehicles that attempt to track the performance of a benchmark index.
The Fund's past performance is not a good predictor of how the Fund will perform in the future. The graph and table do not reflect the deduction of taxes that a shareholder would pay on fund distributions or redemption of fund shares.
What did the Fund invest in?
Composition of Net Assets (% of net assets)
| Value | Value |
|---|
| Liabilities in Excess of Other Assets | -0.1% |
| Short-Term Investments | 1.7% |
| Equity | 98.4% |
Top Holdings (% of net assets)
| Holding Name | % of Net Assets |
SPDR® Portfolio S&P 500® ETF | 27.2% |
SPDR® Dow Jones Industrial Average ETF Trust | 23.8% |
iShares® Core S&P 500® ETF | 23.7% |
SPDR® Portfolio Developed World ex-US ETF | 14.9% |
SPDR® Portfolio Emerging Markets ETF | 5.4% |
SPDR® Portfolio S&P 600® Small Cap ETF | 3.4% |
This report describes changes to the Fund that occurred during the reporting period.
Where can I find additional information about the Fund?
Additional information is available on the Fund's website (https://northsquareinvest.com/fund-reports-holdings/), including its:
Prospectus
Financial information
Holdings
Proxy voting information
North Square Tactical Defensive Fund - Class I (ETFWX)
Semi-Annual Shareholder Report - November 30, 2024
North Square Tactical Growth Fund
Semi-Annual Shareholder Report - November 30, 2024
This semi-annual shareholder report contains important information about North Square Tactical Growth Fund (the "Fund") for the period of June 1, 2024, to November 30, 2024. You can find additional information about the Fund at https://northsquareinvest.com/fund-reports-holdings/. You can also request this information by contacting us at 1-855-551-5521.
What were the Fund’s costs for the last six months?
(based on a hypothetical $10,000 investment)
| Class Name | Costs of a $10,000 investment | Costs paid as a percentage of a $10,000 investment |
|---|
| Class A | $82 | 1.55% |
|---|
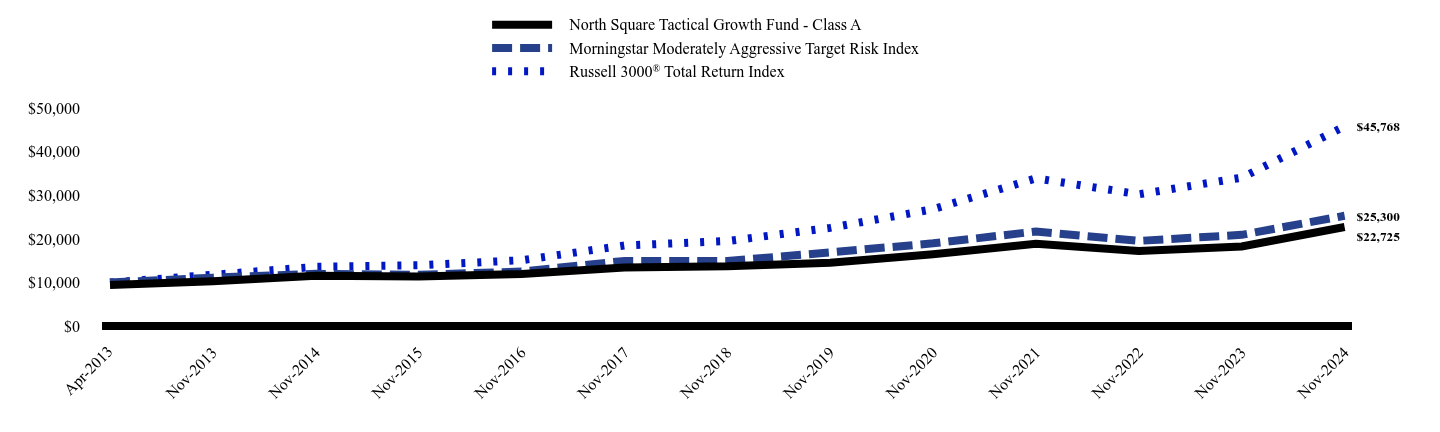
How has the Fund performed over the last ten years?
Total Return Based on $10,000 Investment
| North Square Tactical Growth Fund - Class A | Morningstar Moderately Aggressive Target Risk Index | Russell 3000® Total Return Index |
|---|
| Apr-2013 | $9,422 | $10,000 | $10,000 |
|---|
| Nov-2013 | $10,296 | $11,131 | $11,780 |
|---|
| Nov-2014 | $11,548 | $11,992 | $13,609 |
|---|
| Nov-2015 | $11,378 | $11,786 | $13,960 |
|---|
| Nov-2016 | $11,938 | $12,537 | $15,120 |
|---|
| Nov-2017 | $13,476 | $14,959 | $18,488 |
|---|
| Nov-2018 | $13,725 | $14,944 | $19,510 |
|---|
| Nov-2019 | $14,553 | $16,918 | $22,532 |
|---|
| Nov-2020 | $16,490 | $18,986 | $26,818 |
|---|
| Nov-2021 | $18,863 | $21,700 | $33,882 |
|---|
| Nov-2022 | $17,220 | $19,549 | $30,222 |
|---|
| Nov-2023 | $18,257 | $20,932 | $34,032 |
|---|
| Nov-2024 | $22,725 | $25,300 | $45,768 |
|---|
- Net Assets$557,556,772
- Number of Portfolio Holdings11
- Advisory Fee (net of waivers)$2,745,825
- Portfolio Turnover13%
Average Annual Total Returns
| 1 Year | 5 Years | 10 Years |
|---|
| North Square Tactical Growth Fund - Class A | | | |
|---|
| Without Load | 24.47% | 9.32% | 7.00% |
|---|
| With Load | 17.31% | 8.04% | 6.37% |
|---|
| Morningstar Moderately Aggressive Target Risk Index | 20.87% | 8.38% | 7.75% |
|---|
Russell 3000® Total Return Index | 34.49% | 15.23% | 12.89% |
|---|
The performance results shown above in the line chart and the average annual total returns table for periods prior to June 11, 2021 represent the performance of the Stadion Tactical Growth Fund (the "Predecessor Fund") which converted into the Fund and is attributable to the Fund moving forward. The Fund's performance has not been restated to reflect any differences in expenses paid by the Predecessor Fund and those paid by the Fund.
The Morningstar Moderately Target Risk Index is representative of a broader market and range of securities than is found in the Fund’s portfolio. Individuals cannot invest directly in an index; however, an individual may invest in exchange-traded funds or other investment vehicles that attempt to track the performance of a benchmark index.
The Fund's past performance is not a good predictor of how the Fund will perform in the future. The graph and table do not reflect the deduction of taxes that a shareholder would pay on fund distributions or redemption of fund shares.
What did the Fund invest in?
Composition of Net Assets (% of net assets)
| Value | Value |
|---|
| Liabilities in Excess of Other Assets | -0.1% |
| Fixed Income | 4.8% |
| Short-Term Investments | 8.0% |
| Exchange-Traded Funds | 29.4% |
| Equity | 57.9% |
Top Holdings (% of net assets)
| Holding Name | % of Net Assets |
| Invesco QQQ Trust, Series 1 | 15.4% |
| Vanguard Growth ETF | 15.2% |
SPDR® S&P 500® ETF Trust | 14.0% |
| Vanguard Value ETF | 11.6% |
iShares® Russell 2000 ETF | 9.5% |
Financial Select Sector SPDR® Fund | 6.3% |
iShares® Russell 3000 ETF | 5.8% |
iShares® Core High Dividend ETF | 5.0% |
iShares® 3-7 Year Treasury Bond ETF | 4.8% |
iShares® MSCI Eurozone ETF | 4.6% |
No material changes occurred during the period ended November 30, 2024.
Where can I find additional information about the Fund?
Additional information is available on the Fund's website (https://northsquareinvest.com/fund-reports-holdings/), including its:
Prospectus
Financial information
Holdings
Proxy voting information
North Square Tactical Growth Fund - Class A (ETFAX)
Semi-Annual Shareholder Report - November 30, 2024
North Square Tactical Growth Fund
Semi-Annual Shareholder Report - November 30, 2024
This semi-annual shareholder report contains important information about North Square Tactical Growth Fund (the "Fund") for the period of June 1, 2024, to November 30, 2024. You can find additional information about the Fund at https://northsquareinvest.com/fund-reports-holdings/. You can also request this information by contacting us at 1-855-551-5521.
What were the Fund’s costs for the last six months?
(based on a hypothetical $10,000 investment)
| Class Name | Costs of a $10,000 investment | Costs paid as a percentage of a $10,000 investment |
|---|
| Class C | $61 | 1.15% |
|---|
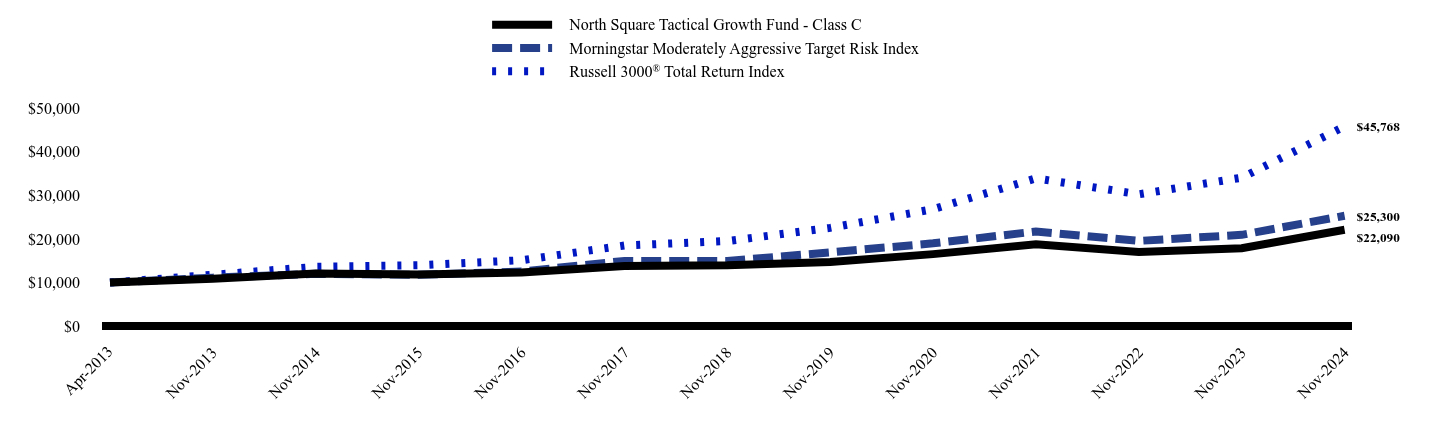
How has the Fund performed over the last ten years?
Total Return Based on $10,000 Investment
| North Square Tactical Growth Fund - Class C | Morningstar Moderately Aggressive Target Risk Index | Russell 3000® Total Return Index |
|---|
| Apr-2013 | $10,000 | $10,000 | $10,000 |
|---|
| Nov-2013 | $10,871 | $11,131 | $11,780 |
|---|
| Nov-2014 | $12,103 | $11,992 | $13,609 |
|---|
| Nov-2015 | $11,840 | $11,786 | $13,960 |
|---|
| Nov-2016 | $12,321 | $12,537 | $15,120 |
|---|
| Nov-2017 | $13,802 | $14,959 | $18,488 |
|---|
| Nov-2018 | $13,957 | $14,944 | $19,510 |
|---|
| Nov-2019 | $14,688 | $16,918 | $22,532 |
|---|
| Nov-2020 | $16,515 | $18,986 | $26,818 |
|---|
| Nov-2021 | $18,753 | $21,700 | $33,882 |
|---|
| Nov-2022 | $16,985 | $19,549 | $30,222 |
|---|
| Nov-2023 | $17,871 | $20,932 | $34,032 |
|---|
| Nov-2024 | $22,090 | $25,300 | $45,768 |
|---|
- Net Assets$557,556,772
- Number of Portfolio Holdings11
- Advisory Fee (net of waivers)$2,745,825
- Portfolio Turnover13%
Average Annual Total Returns
| 1 Year | 5 Years | 10 Years |
|---|
| North Square Tactical Growth Fund - Class C | | | |
|---|
| Without Load | 23.61% | 8.50% | 6.20% |
|---|
| With Load | 22.61% | 8.50% | 6.20% |
|---|
| Morningstar Moderately Aggressive Target Risk Index | 20.87% | 8.38% | 7.75% |
|---|
Russell 3000® Total Return Index | 34.49% | 15.23% | 12.89% |
|---|
The performance results shown above in the line chart and the average annual total returns table for periods prior to June 11, 2021 represent the performance of the Stadion Tactical Growth Fund (the "Predecessor Fund") which converted into the Fund and is attributable to the Fund moving forward. The Fund's performance has not been restated to reflect any differences in expenses paid by the Predecessor Fund and those paid by the Fund.
The Morningstar Moderately Target Risk Index is representative of a broader market and range of securities than is found in the Fund’s portfolio. Individuals cannot invest directly in an index; however, an individual may invest in exchange-traded funds or other investment vehicles that attempt to track the performance of a benchmark index.
The Fund's past performance is not a good predictor of how the Fund will perform in the future. The graph and table do not reflect the deduction of taxes that a shareholder would pay on fund distributions or redemption of fund shares.
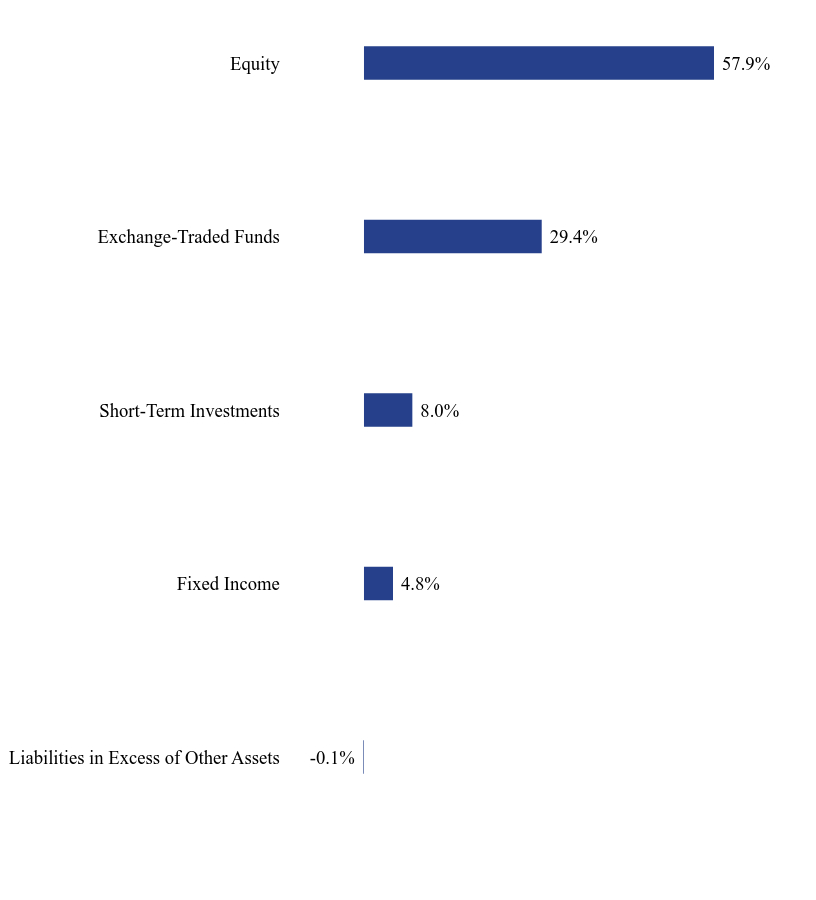
What did the Fund invest in?
Composition of Net Assets (% of net assets)
| Value | Value |
|---|
| Liabilities in Excess of Other Assets | -0.1% |
| Fixed Income | 4.8% |
| Short-Term Investments | 8.0% |
| Exchange-Traded Funds | 29.4% |
| Equity | 57.9% |
Top Holdings (% of net assets)
| Holding Name | % of Net Assets |
| Invesco QQQ Trust, Series 1 | 15.4% |
| Vanguard Growth ETF | 15.2% |
SPDR® S&P 500® ETF Trust | 14.0% |
| Vanguard Value ETF | 11.6% |
iShares® Russell 2000 ETF | 9.5% |
Financial Select Sector SPDR® Fund | 6.3% |
iShares® Russell 3000 ETF | 5.8% |
iShares® Core High Dividend ETF | 5.0% |
iShares® 3-7 Year Treasury Bond ETF | 4.8% |
iShares® MSCI Eurozone ETF | 4.6% |
No material changes occurred during the period ended November 30, 2024.
Where can I find additional information about the Fund?
Additional information is available on the Fund's website (https://northsquareinvest.com/fund-reports-holdings/), including its:
Prospectus
Financial information
Holdings
Proxy voting information
North Square Tactical Growth Fund - Class C (ETFCX)
Semi-Annual Shareholder Report - November 30, 2024
North Square Tactical Growth Fund
Semi-Annual Shareholder Report - November 30, 2024
This semi-annual shareholder report contains important information about North Square Tactical Growth Fund (the "Fund") for the period of June 1, 2024, to November 30, 2024. You can find additional information about the Fund at https://northsquareinvest.com/fund-reports-holdings/. You can also request this information by contacting us at 1-855-551-5521.
What were the Fund’s costs for the last six months?
(based on a hypothetical $10,000 investment)
| Class Name | Costs of a $10,000 investment | Costs paid as a percentage of a $10,000 investment |
|---|
| Class I | $70 | 1.30% |
|---|
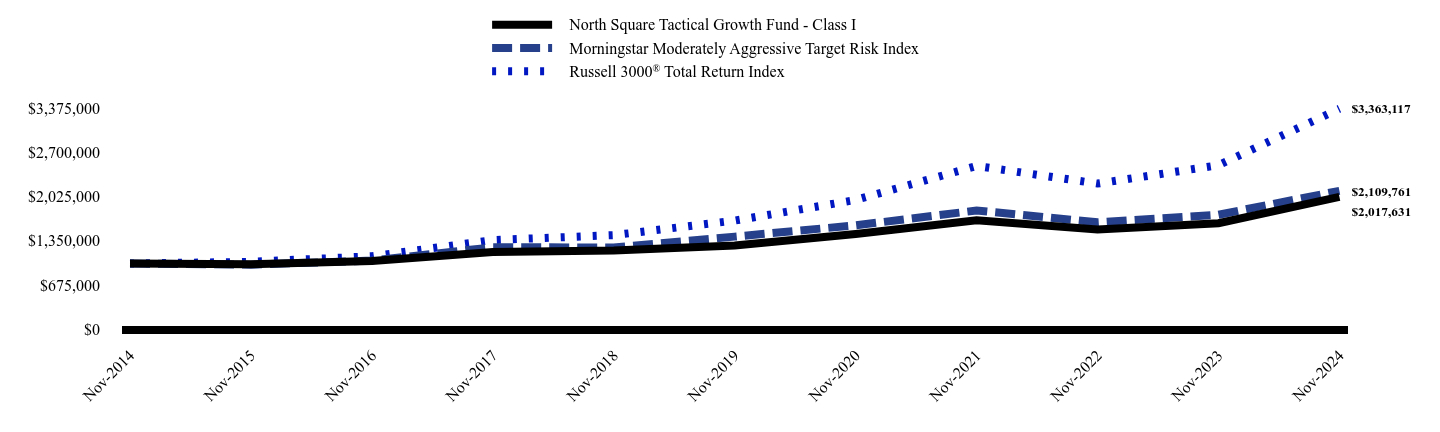
How has the Fund performed over the last ten years?
Total Return Based on $1,000,000 Investment
| North Square Tactical Growth Fund - Class I | Morningstar Moderately Aggressive Target Risk Index | Russell 3000® Total Return Index |
|---|
| Nov-2014 | $1,000,000 | $1,000,000 | $1,000,000 |
|---|
| Nov-2015 | $988,362 | $982,789 | $1,025,831 |
|---|
| Nov-2016 | $1,038,767 | $1,045,453 | $1,111,055 |
|---|
| Nov-2017 | $1,175,949 | $1,247,466 | $1,358,510 |
|---|
| Nov-2018 | $1,200,387 | $1,246,166 | $1,433,590 |
|---|
| Nov-2019 | $1,275,163 | $1,410,823 | $1,655,661 |
|---|
| Nov-2020 | $1,449,724 | $1,583,202 | $1,970,628 |
|---|
| Nov-2021 | $1,661,532 | $1,809,560 | $2,489,677 |
|---|
| Nov-2022 | $1,520,706 | $1,630,182 | $2,220,728 |
|---|
| Nov-2023 | $1,616,391 | $1,745,521 | $2,500,731 |
|---|
| Nov-2024 | $2,017,631 | $2,109,761 | $3,363,117 |
|---|
- Net Assets$557,556,772
- Number of Portfolio Holdings11
- Advisory Fee (net of waivers)$2,745,825
- Portfolio Turnover13%
Average Annual Total Returns
| 1 Year | 5 Years | 10 Years |
|---|
| North Square Tactical Growth Fund - Class I | 24.82% | 9.61% | 7.27% |
|---|
| Morningstar Moderately Aggressive Target Risk Index | 20.87% | 8.38% | 7.75% |
|---|
Russell 3000® Total Return Index | 34.49% | 15.23% | 12.89% |
|---|
The performance results shown above in the line chart and the average annual total returns table for periods prior to June 11, 2021 represent the performance of the Stadion Tactical Growth Fund (the "Predecessor Fund") which converted into the Fund and is attributable to the Fund moving forward. The Fund's performance has not been restated to reflect any differences in expenses paid by the Predecessor Fund and those paid by the Fund.
The Morningstar Moderately Target Risk Index is representative of a broader market and range of securities than is found in the Fund’s portfolio. Individuals cannot invest directly in an index; however, an individual may invest in exchange-traded funds or other investment vehicles that attempt to track the performance of a benchmark index.
The Fund's past performance is not a good predictor of how the Fund will perform in the future. The graph and table do not reflect the deduction of taxes that a shareholder would pay on fund distributions or redemption of fund shares.
What did the Fund invest in?
Composition of Net Assets (% of net assets)
| Value | Value |
|---|
| Liabilities in Excess of Other Assets | -0.1% |
| Fixed Income | 4.8% |
| Short-Term Investments | 8.0% |
| Exchange-Traded Funds | 29.4% |
| Equity | 57.9% |
Top Holdings (% of net assets)
| Holding Name | % of Net Assets |
| Invesco QQQ Trust, Series 1 | 15.4% |
| Vanguard Growth ETF | 15.2% |
SPDR® S&P 500® ETF Trust | 14.0% |
| Vanguard Value ETF | 11.6% |
iShares® Russell 2000 ETF | 9.5% |
Financial Select Sector SPDR® Fund | 6.3% |
iShares® Russell 3000 ETF | 5.8% |
iShares® Core High Dividend ETF | 5.0% |
iShares® 3-7 Year Treasury Bond ETF | 4.8% |
iShares® MSCI Eurozone ETF | 4.6% |
No material changes occurred during the period ended November 30, 2024.
Where can I find additional information about the Fund?
Additional information is available on the Fund's website (https://northsquareinvest.com/fund-reports-holdings/), including its:
Prospectus
Financial information
Holdings
Proxy voting information
North Square Tactical Growth Fund - Class I (ETFOX)
Semi-Annual Shareholder Report - November 30, 2024
Item 2. Code of Ethics.
Not applicable – disclosed with annual report
Item 3. Audit Committee Financial Expert.
Not applicable – disclosed with annual report
Item 5. Audit Committee of Listed Registrants.
Not applicable – disclosed with annual report
Item 6. Investments.
The Registrant’s schedule of investments in unaffiliated issuers is included in the Financial Statements under Item 7 of this form.
Item 7. Financial Statements and Financial Highlights for Open-End Management Investment Companies.

SEMI-ANNUAL FINANCIAL STATEMENTS NORTH SQUARE SPECTRUM ALPHA FUND NORTH SQUARE DYNAMIC SMALL CAP FUND NORTH SQUARE MULTI STRATEGY FUND NORTH SQUARE PREFERRED AND INCOME SECURITIES FUND NORTH SQUARE TACTICAL GROWTH FUND NORTH SQUARE TACTICAL DEFENSIVE FUND NORTH SQUARE CORE PLUS BOND FUND NORTH SQUARE KENNEDY MICROCAP FUND NOVEMBER 30, 2024 |
 North Square Investments | www.northsquareinvest.com
North Square Funds
Table of Contents
| | |
Schedules of Investments | 1 |
Statements of Assets and Liabilities | 34 |
Statements of Operations | 37 |
Statements of Changes in Net Assets | 39 |
Financial Highlights | 46 |
Notes to Financial Statements | 61 |
Supplemental Information | 80 |
This report and the financial statements contained herein are provided for the general information of the shareholders of the North Square Funds. This report is not authorized for distribution to prospective investors in the Funds unless preceded or accompanied by an effective prospectus.
www.northsquareinvest.com
North Square Spectrum Alpha Fund
Schedule of Investments (Unaudited)
November 30, 2024
| | Shares | | | | Fair Value | |
| | | | | EXCHANGE-TRADED FUNDS — 1.3% | | | | |
| | | 4,600 | | iShares® Russell 2000 ETF | | $ | 1,112,602 | |
| | | | | TOTAL EXCHANGE-TRADED FUNDS (Cost $1,021,339) | | | 1,112,602 | |
| | | | | | | | | |
| | | | | MUTUAL FUNDS — 98.5% | | | | |
| | | 1,576,800 | | North Square Advisory Research Small Value Fund, Class I(b) | | | 22,642,848 | |
| | | 3,059,062 | | North Square Dynamic Small Cap Fund, Class I(a)(c) | | | 52,952,366 | |
| | | 795,232 | | North Square Kennedy MicroCap Fund, Class I(a) | | | 10,123,300 | |
| | | | | TOTAL MUTUAL FUNDS (Cost $65,287,546) | | | 85,718,514 | |
| | | | | | | | | |
| | | | | SHORT-TERM INVESTMENTS — 0.4% | | | | |
| | | 343,424 | | First American Treasury Obligations Fund, Class X, 4.55%(d) | | | 343,424 | |
| | | | | TOTAL SHORT-TERM INVESTMENTS (Cost $343,424) | | | 343,424 | |
| | | | | TOTAL INVESTMENTS — 100.2% (Cost $66,652,309) | | $ | 87,174,540 | |
| | | | | Liabilities in Excess of Other Assets— (0.2)% | | | (177,441 | ) |
| | | | | NET ASSETS — 100.0% | | $ | 86,997,099 | |
(a) | Affiliated Company. See Note 11. |
(b) | Represents an investment greater than 25% of the Fund’s net assets. Performance of the Fund may be adversely impacted by concentrated investments in securities. As of November 30, 2024, the percentage of net assets invested in North Square Advisory Research Small Value Fund, Class I was 26.0 % of the Fund. |
(c) | Represents an investment greater than 25% of the Fund’s net assets. Performance of the Fund may be adversely impacted by concentrated investments in securities. As of November 30, 2024, the percentage of net assets invested in North Square Dynamic Small Cap Fund, Class I was 60.9% of the Fund. |
(d) | Rate disclosed is the seven day effective yield as of November 30, 2024. |
ETF - Exchange-Traded Fund
See accompanying Notes to Financial Statements.
1
North Square Dynamic Small Cap Fund
Schedule of Investments (Unaudited)
November 30, 2024
| | Shares | | | | Fair Value | |
| | | | | COMMON STOCKS — 98.9% | | | | |
| | | | | COMMUNICATIONS — 2.6% | | | | |
| | | | | INTERNET MEDIA & SERVICES — 0.8% | | | | |
| | | 208,180 | | Eventbrite, Inc., Class A(a) | | $ | 732,794 | |
| | | 25,890 | | MediaAlpha, Inc.(a) | | | 326,991 | |
| | | 60,960 | | Yelp, Inc.(a) | | | 2,329,891 | |
| | | | | | | | 3,389,676 | |
| | | | | PUBLISHING & BROADCASTING — 0.1% | | | | |
| | | 59,430 | | Gray Television, Inc. | | | 253,766 | |
| | | | | | | | | |
| | | | | TELECOMMUNICATIONS — 1.7% | | | | |
| | | 12,870 | | IDT Corp., Class B(a) | | | 664,607 | |
| | | 41,280 | | Iridium Communications, Inc.(a) | | | 1,226,842 | |
| | | 130,790 | | Telephone and Data Systems, Inc. | | | 4,470,401 | |
| | | 18,370 | | United States Cellular Corp.(a) | | | 1,165,760 | |
| | | | | | | | 7,527,610 | |
| | | | | TOTAL COMMUNICATIONS | | | 11,171,052 | |
| | | | | | | | | |
| | | | | CONSUMER DISCRETIONARY — 13.5% | | | | |
| | | | | AUTOMOTIVE — 0.8% | | | | |
| | | 147,193 | | American Axle & Manufacturing Holdings, Inc.(a) | | | 972,946 | |
| | | 204,160 | | Dana, Inc. | | | 2,041,599 | |
| | | 3,270 | | Dorman Products, Inc.(a) | | | 457,735 | |
| | | | | | | | 3,472,280 | |
| | | | | CONSUMER SERVICES — 2.1% | | | | |
| | | 21,410 | | Adtalem Global Education, Inc.(a) | | | 1,957,088 | |
| | | 51,390 | | Coursera, Inc.(a) | | | 408,551 | |
| | | 19,800 | | Grand Canyon Education, Inc.(a) | | | 3,258,882 | |
| | | 10,040 | | Stride, Inc.(a) | | | 1,072,975 | |
| | | 62,790 | | Upbound Group, Inc. | | | 2,159,348 | |
| | | | | | | | 8,856,844 | |
| | | | | E-COMMERCE DISCRETIONARY — 1.1% | | | | |
| | | 56,380 | | Chewy, Inc.(a) | | | 1,883,656 | |
| | | 80,970 | | Revolve Group, Inc.(a) | | | 2,921,397 | |
| | | | | | | | 4,805,053 | |
| | | | | HOME CONSTRUCTION — 3.5% | | | | |
| | | 31,520 | | Century Communities, Inc. | | | 2,848,147 | |
| | | 21,126 | | Forestar Group, Inc.(a) | | | 630,611 | |
| | | 34,105 | | Griffon Corp. | | | 2,875,052 | |
| | | 34,211 | | Interface, Inc. | | | 908,302 | |
| | | 25,500 | | M/I Homes, Inc.(a) | | | 4,208,264 | |
| | | 4,430 | | Taylor Morrison Home Corp.(a) | | | 327,244 | |
| | | 73,030 | | TRI Pointe Homes, Inc.(a) | | | 3,178,996 | |
| | | | | | | | 14,976,616 | |
| | | | | | | | | |
See accompanying Notes to Financial Statements.
2
North Square Dynamic Small Cap Fund
Schedule of Investments (Unaudited) – Continued
November 30, 2024
| | Shares | | | | Fair Value | |
| | | | | COMMON STOCKS (Continued) | | | | |
| | | | | CONSUMER DISCRETIONARY (Continued) | | | | |
| | | | | LEISURE FACILITIES & SERVICES — 3.3% | | | | |
| | | 124,720 | | Life Time Group Holdings, Inc.(a) | | $ | 3,026,954 | |
| | | 59,350 | | OneSpaWorld Holdings Ltd. | | | 1,127,057 | |
| | | 254,040 | | Rush Street Interactive, Inc.(a) | | | 3,663,257 | |
| | | 21,340 | | St. Joe Company (The) | | | 1,090,047 | |
| | | 90,140 | | Travel + Leisure Co.(a) | | | 5,036,122 | |
| | | | | | | | 13,943,437 | |
| | | | | RETAIL - DISCRETIONARY — 2.6% | | | | |
| | | 4,850 | | Abercrombie & Fitch Co., Class A(a) | | | 725,997 | |
| | | 146,850 | | Aspen Aerogels, Inc.(a) | | | 2,173,380 | |
| | | 36,620 | | Beacon Roofing Supply, Inc.(a) | | | 4,138,791 | |
| | | 9,915 | | BlueLinx Holdings, Inc.(a) | | | 1,246,316 | |
| | | 1,470 | | Freshpet, Inc.(a) | | | 224,984 | |
| | | 29,390 | | MarineMax, Inc.(a) | | | 1,008,665 | |
| | | 58,290 | | Mister Car Wash Inc.(a) | | | 466,320 | |
| | | 18,302 | | Rush Enterprises, Inc., Class A | | | 1,133,809 | |
| | | | | | | | 11,118,262 | |
| | | | | WHOLESALE - DISCRETIONARY — 0.1% | | | | |
| | | 4,671 | | Eplus, Inc.(a) | | | 377,697 | |
| | | | | TOTAL CONSUMER DISCRETIONARY | | | 57,550,189 | |
| | | | | | | | | |
| | | | | CONSUMER STAPLES — 6.8% | | | | |
| | | | | BEVERAGES — 1.6% | | | | |
| | | 4,200 | | Coca-Cola Consolidated, Inc. | | | 5,478,018 | |
| | | 23,240 | | National Beverage Corp. | | | 1,147,824 | |
| | | | | | | | 6,625,842 | |
| | | | | FOOD — 2.5% | | | | |
| | | 81,420 | | BellRing Brands, Inc.(a) | | | 6,388,213 | |
| | | 26,010 | | Cal-Maine Foods, Inc. | | | 2,538,836 | |
| | | 51,380 | | Vital Farms, Inc.(a) | | | 1,705,816 | |
| | | | | | | | 10,632,865 | |
| | | | | HOUSEHOLD PRODUCTS — 1.6% | | | | |
| | | 132,210 | | Honest Co., Inc. (The)(a) | | | 1,096,021 | |
| | | 10,940 | | Inter Parfums, Inc. | | | 1,506,000 | |
| | | 44,560 | | Spectrum Brands Holdings, Inc. | | | 4,097,292 | |
| | | | | | | | 6,699,313 | |
| | | | | RETAIL - CONSUMER STAPLES — 0.5% | | | | |
| | | 21,811 | | PriceSmart, Inc. | | | 1,957,320 | |
| | | 2,430 | | Sprouts Farmers Market, Inc.(a) | | | 375,386 | |
| | | | | | | | 2,332,706 | |
| | | | | TOBACCO & CANNABIS — 0.2% | | | | |
| | | 15,510 | | Turning Point Brands, Inc. | | | 960,069 | |
| | | | | | | | | |
See accompanying Notes to Financial Statements.
3
North Square Dynamic Small Cap Fund
Schedule of Investments (Unaudited) – Continued
November 30, 2024
| | Shares | | | | Fair Value | |
| | | | | COMMON STOCKS (Continued) | | | | |
| | | | | CONSUMER STAPLES (Continued) | | | | |
| | | | | WHOLESALE - CONSUMER STAPLES — 0.4% | | | | |
| | | 35,620 | | Chefs’ Warehouse, Inc. (The)(a) | | $ | 1,592,570 | |
| | | | | TOTAL CONSUMER STAPLES | | | 28,843,365 | |
| | | | | | | | | |
| | | | | ENERGY — 5.1% | | | | |
| | | | | OIL & GAS PRODUCERS — 2.0% | | | | |
| | | 22,840 | | Civitas Resources, Inc. | | | 1,184,939 | |
| | | 46,923 | | NextDecade Corp.(a) | | | 339,723 | |
| | | 115,880 | | Par Pacific Holdings, Inc.(a) | | | 2,019,788 | |
| | | 103,310 | | Plains GP Holdings LP, Class A(a) | | | 2,068,267 | |
| | | 86,156 | | Sitio Royalties Corp., Class A | | | 2,041,897 | |
| | | 16,270 | | SM Energy Co. | | | 735,241 | |
| | | | | | | | 8,389,855 | |
| | | | | OIL & GAS SERVICES & EQUIPMENT — 2.7% | | | | |
| | | 51,870 | | Ameresco, Inc., Class A(a) | | | 1,461,178 | |
| | | 169,050 | | Archrock, Inc. | | | 4,331,060 | |
| | | 82,757 | | Expro Group Holdings N.V.(a) | | | 1,149,495 | |
| | | 100,860 | | Helix Energy Solutions Group, Inc.(a) | | | 1,078,193 | |
| | | 100,160 | | Oceaneering International, Inc.(a) | | | 3,002,797 | |
| | | 35,580 | | Solaris Oilfield Infrastructure, Inc., Class A(a) | | | 877,047 | |
| | | | | | | | 11,899,770 | |
| | | | | RENEWABLE ENERGY — 0.4% | | | | |
| | | 22,160 | | American Superconductor Corp.(a) | | | 754,770 | |
| | | 72,500 | | Green Plains, Inc.(a) | | | 783,000 | |
| | | | | | | | 1,537,770 | |
| | | | | TOTAL ENERGY | | | 21,827,395 | |
| | | | | | | | | |
| | | | | FINANCIALS — 14.4% | | | | |
| | | | | ASSET MANAGEMENT — 2.4% | | | | |
| | | 28,130 | | Affiliated Managers Group, Inc. | | | 5,275,500 | |
| | | 84,370 | | Federated Hermes, Inc., Class B | | | 3,606,818 | |
| | | 19,050 | | Patria Investments Ltd.(a) | | | 227,838 | |
| | | 3,796 | | Virtus Investment Partners, Inc. | | | 937,498 | |
| | | | | | | | 10,047,654 | |
| | | | | BANKING — 9.2% | | | | |
| | | 34,080 | | Ameris Bancorp | | | 2,395,142 | |
| | | 75,920 | | Axos Financial, Inc.(a) | | | 6,289,971 | |
| | | 206,960 | | Banc of California, Inc. | | | 3,565,921 | |
| | | 86,150 | | Bank OZK | | | 4,304,916 | |
| | | 115,379 | | BankUnited, Inc. | | | 4,853,995 | |
| | | 15,785 | | Customers Bancorp, Inc.(a) | | | 891,063 | |
See accompanying Notes to Financial Statements.
4
North Square Dynamic Small Cap Fund
Schedule of Investments (Unaudited) – Continued
November 30, 2024
| | Shares | | | | Fair Value | |
| | | | | COMMON STOCKS (Continued) | | | | |
| | | | | FINANCIALS (Continued) | | | | |
| | | | | BANKING (Continued) | | | | |
| | | 153,900 | | First BanCorp | | $ | 3,182,652 | |
| | | 36,300 | | First Foundation, Inc.(a) | | | 288,585 | |
| | | 7,300 | | Hancock Whitney Corp. | | | 433,474 | |
| | | 22,408 | | Hanmi Financial Corp. | | | 592,692 | |
| | | 6,110 | | Heartland Financial USA, Inc.(a) | | | 412,853 | |
| | | 26,280 | | Independent Bank Corp. | | | 1,902,409 | |
| | | 17,870 | | International Bancshares Corp. | | | 1,306,833 | |
| | | 24,920 | | Live Oak Bancshares, Inc. | | | 1,181,208 | |
| | | 18,529 | | Meta Financial Group, Inc. | | | 1,554,213 | |
| | | 27,510 | | OFG Bancorp | | | 1,249,504 | |
| | | 50,500 | | Pacific Premier Bancorp, Inc. | | | 1,434,200 | |
| | | 4,150 | | ServisFirst Bancshares, Inc. | | | 397,487 | |
| | | 35,470 | | Synovus Financial Corp. | | | 2,024,273 | |
| | | 9,400 | | Western Alliance Bancorp | | | 879,934 | |
| | | | | | | | 39,141,325 | |
| | | | | INSTITUTIONAL FINANCIAL SERVICES — 0.2% | | | | |
| | | 40,750 | | Perella Weinberg Partners | | | 1,046,053 | |
| | | | | | | | | |
| | | | | INSURANCE — 0.8% | | | | |
| | | 39,740 | | Brighthouse Financial, Inc.(a) | | | 2,077,209 | |
| | | 21,400 | | NMI Holdings, Inc., Class A(a) | | | 855,786 | |
| | | 4,860 | | Root, Inc.(a) | | | 485,077 | |
| | | | | | | | 3,418,072 | |
| | | | | SPECIALTY FINANCE — 1.8% | | | | |
| | | 26,620 | | Dave Inc.(a) | | | 2,626,861 | |
| | | 33,682 | | Enact Holdings, Inc. | | | 1,185,943 | |
| | | 32,840 | | LendingClub Corp.(a) | | | 546,458 | |
| | | 38,330 | | Marathon Digital Holdings, Inc.(a) | | | 1,051,009 | |
| | | 44,820 | | PROG Holdings, Inc. | | | 2,180,941 | |
| | | | | | | | 7,591,212 | |
| | | | | TOTAL FINANCIALS | | | 61,244,316 | |
| | | | | | | | | |
| | | | | HEALTH CARE — 14.4% | | | | |
| | | | | BIOTECH & PHARMA — 9.3% | | | | |
| | | 211,380 | | Acadia Pharmaceuticals, Inc.(a) | | | 3,449,721 | |
| | | 68,690 | | Acelyrin, Inc.(a) | | | 312,540 | |
| | | 92,380 | | ADMA Biologics, Inc.(a) | | | 1,857,762 | |
| | | 50,700 | | Amicus Therapeutics, Inc.(a) | | | 505,986 | |
| | | 140,190 | | Amneal Pharmaceuticals, Inc.(a) | | | 1,159,371 | |
| | | 119,275 | | Apellis Pharmaceuticals, Inc.(a) | | | 4,047,000 | |
| | | 449,740 | | Ardelyx, Inc.(a) | | | 2,550,026 | |
| | | 51,540 | | Arvinas, Inc.(a) | | | 1,377,149 | |
| | | 189,930 | | BioCryst Pharmaceuticals, Inc.(a) | | | 1,424,475 | |
See accompanying Notes to Financial Statements.
5
North Square Dynamic Small Cap Fund
Schedule of Investments (Unaudited) – Continued
November 30, 2024
| | Shares | | | | Fair Value | |
| | | | | COMMON STOCKS (Continued) | | | | |
| | | | | HEALTH CARE (Continued) | | | | |
| | | | | BIOTECH & PHARMA (Continued) | | | | |
| | | 34,560 | | Blueprint Medicines Corp.(a) | | $ | 3,330,892 | |
| | | 17,990 | | Celldex Therapeutics, Inc.(a) | | | 493,646 | |
| | | 90,860 | | Cogent Biosciences, Inc.(a) | | | 864,079 | |
| | | 47,930 | | Dyne Therapeutics, Inc.(a) | | | 1,467,137 | |
| | | 42,760 | | Edgewise Therapeutics, Inc.(a) | | | 1,411,080 | |
| | | 60,750 | | Harmony Biosciences Holdings, Inc.(a) | | | 2,106,203 | |
| | | 29,401 | | iTeos Therapeutics Inc.(a) | | | 251,379 | |
| | | 33,650 | | Janux Therapeutics Inc.(a) | | | 1,521,317 | |
| | | 20,829 | | Kiniksa Pharmaceuticals International PLC(a) | | | 459,904 | |
| | | 70,330 | | Kura Oncology, Inc.(a) | | | 776,443 | |
| | | 64,950 | | Merus NV(a) | | | 2,912,358 | |
| | | 5,200 | | Mirum Pharmaceuticals, Inc.(a) | | | 240,344 | |
| | | 26,658 | | Protagonist Therapeutics, Inc.(a) | | | 1,167,620 | |
| | | 143,170 | | Relay Therapeutics, Inc.(a) | | | 672,899 | |
| | | 5,015 | | Rhythm Pharmaceuticals, Inc.(a) | | | 311,131 | |
| | | 143,400 | | Syndax Pharmaceuticals(a) | | | 2,397,648 | |
| | | 8,740 | | Ultragenyx Pharmaceutical, Inc.(a) | | | 416,286 | |
| | | 11,360 | | Viridian Therapeutics Inc.(a) | | | 244,808 | |
| | | 50,910 | | Xenon Pharmaceuticals, Inc.(a) | | | 2,170,293 | |
| | | | | | | | 39,899,497 | |
| | | | | HEALTH CARE FACILITIES & SERVICES — 1.4% | | | | |
| | | 73,270 | | Accolade, Inc.(a) | | | 282,822 | |
| | | 423,930 | | Agilon Health, Inc.(a) | | | 886,014 | |
| | | 24,410 | | GeneDx Holdings Corp.(a) | | | 1,913,500 | |
| | | 113,600 | | Owens & Minor, Inc.(a) | | | 1,530,192 | |
| | | 22,070 | | Pennant Group, Inc. (The)(a) | | | 688,143 | |
| | | 35,316 | | Progyny, Inc.(a) | | | 549,870 | |
| | | | | | | | 5,850,541 | |
| | | | | MEDICAL EQUIPMENT & DEVICES — 3.7% | | | | |
| | | 209,942 | | 10X Genomics, Inc., Class A(a) | | | 3,338,078 | |
| | | 16,530 | | AtriCure Inc.(a) | | | 597,725 | |
| | | 42,730 | | Castle Biosciences, Inc.(a) | | | 1,293,864 | |
| | | 9,880 | | Inspire Medical Systems, Inc.(a) | | | 1,904,469 | |
| | | 9,510 | | LivaNova PLC(a) | | | 499,275 | |
| | | 32,380 | | Orthofix Medical, Inc.(a) | | | 632,381 | |
| | | 22,980 | | RxSight, Inc.(a) | | | 1,077,302 | |
| | | 64,407 | | STAAR Surgical Co.(a) | | | 1,874,244 | |
| | | 16,167 | | Surmodics, Inc.(a) | | | 637,788 | |
| | | 86,750 | | Veracyte, Inc.(a) | | | 3,725,913 | |
| | | | | | | | 15,581,039 | |
| | | | | TOTAL HEALTH CARE | | | 61,331,077 | |
| | | | | | | | | |
See accompanying Notes to Financial Statements.
6
North Square Dynamic Small Cap Fund
Schedule of Investments (Unaudited) – Continued
November 30, 2024
| | Shares | | | | Fair Value | |
| | | | | COMMON STOCKS (Continued) | | | | |
| | | | | INDUSTRIALS — 17.5% | | | | |
| | | | | AEROSPACE & DEFENSE — 0.5% | | | | |
| | | 66,220 | | Leonardo DRS, Inc.(a) | | $ | 2,302,469 | |
| | | | | | | | | |
| | | | | COMMERCIAL SUPPORT SERVICES — 2.4% | | | | |
| | | 63,134 | | ABM Industries, Inc. | | | 3,609,371 | |
| | | 37,300 | | Brady Corp., Class A | | | 2,793,397 | |
| | | 21,780 | | Cimpress PLC(a) | | | 1,748,934 | |
| | | 4,997 | | CorVel Corp.(a) | | | 1,825,904 | |
| | | 6,360 | | Viad Corp.(a) | | | 284,419 | |
| | | | | | | | 10,262,025 | |
| | | | | ELECTRICAL EQUIPMENT — 5.3% | | | | |
| | | 62,980 | | Atkore, Inc. | | | 5,939,644 | |
| | | 60,267 | | Atmus Filtration Technologies Inc. | | | 2,608,958 | |
| | | 21,120 | | Badger Meter, Inc. | | | 4,579,238 | |
| | | 54,800 | | Itron, Inc.(a) | | | 6,495,444 | |
| | | 29,409 | | Napco Security Technologies, Inc.(a) | | | 1,153,715 | |
| | | 7,960 | | Powell Industries, Inc. | | | 2,128,345 | |
| | | | | | | | 22,905,344 | |
| | | | | ENGINEERING & CONSTRUCTION — 4.9% | | | | |
| | | 12,490 | | Arcosa, Inc. | | | 1,356,914 | |
| | | 102,530 | | Frontdoor, Inc.(a) | | | 6,008,257 | |
| | | 27,140 | | Granite Construction, Inc. | | | 2,696,902 | |
| | | 10,930 | | IES Holdings, Inc.(a) | | | 3,386,715 | |
| | | 57,850 | | Primoris Services Corp. | | | 4,842,623 | |
| | | 3,410 | | Sterling Construction Co., Inc.(a) | | | 663,075 | |
| | | 61,509 | | Tutor Perini Corp.(a) | | | 1,671,815 | |
| | | | | | | | 20,626,301 | |
| | | | | INDUSTRIAL INTERMEDIATE PRODUCTS — 1.5% | | | | |
| | | 77,230 | | Mueller Industries, Inc. | | | 6,237,867 | |
| | | | | | | | | |
| | | | | INDUSTRIAL SUPPORT SERVICES — 0.1% | | | | |
| | | 4,100 | | H&E Equipment Services, Inc. | | | 244,934 | |
| | | | | | | | | |
| | | | | MACHINERY — 0.9% | | | | |
| | | 3,400 | | Albany International Corp., Class A | | | 281,860 | |
| | | 142,750 | | Mueller Water Products, Inc. | | | 3,574,460 | |
| | | | | | | | 3,856,320 | |
| | | | | MARINE TRANSPORTATION — 0.9% | | | | |
| | | 24,470 | | Matson, Inc. | | | 3,748,315 | |
| | | | | | | | | |
See accompanying Notes to Financial Statements.
7
North Square Dynamic Small Cap Fund
Schedule of Investments (Unaudited) – Continued
November 30, 2024
| | Shares | | | | Fair Value | |
| | | | | COMMON STOCKS (Continued) | | | | |
| | | | | INDUSTRIALS (Continued) | | | | |
| | | | | TRANSPORTATION & LOGISTICS — 0.4% | | | | |
| | | 28,640 | | Ardmore Shipping Corp. | | $ | 319,622 | |
| | | 11,280 | | Genco Shipping & Trading Ltd. | | | 179,014 | |
| | | 72,060 | | Sun Country Airlines Holdings, Inc.(a) | | | 1,036,943 | |
| | | | | | | | 1,535,579 | |
| | | | | TRANSPORTATION EQUIPMENT — 0.6% | | | | |
| | | 50,020 | | Blue Bird Corp.(a) | | | 2,033,313 | |
| | | 3,720 | | Greenbrier Companies, Inc. (The) | | | 252,960 | |
| | | 5,570 | | Trinity Industries, Inc. | | | 209,989 | |
| | | | | | | | 2,496,262 | |
| | | | | TOTAL INDUSTRIALS | | | 74,215,416 | |
| | | | | | | | | |
| | | | | MATERIALS — 4.6% | | | | |
| | | | | CHEMICALS — 1.2% | | | | |
| | | 171,300 | | Huntsman Corp. | | | 3,354,053 | |
| | | 3,810 | | Minerals Technologies, Inc. | | | 310,782 | |
| | | 121,966 | | Tronox Holdings PLC, Class A(a) | | | 1,475,789 | |
| | | | | | | | 5,140,624 | |
| | | | | FORESTRY, PAPER & WOOD PRODUCTS — 2.0% | | | | |
| | | 14,690 | | Boise Cascade Co. | | | 2,168,244 | |
| | | 51,720 | | Louisiana-Pacific Corp. | | | 6,113,304 | |
| | | | | | | | 8,281,548 | |
| | | | | METALS & MINING — 0.4% | | | | |
| | | 34,380 | | Century Aluminum Co.(a) | | | 784,896 | |
| | | 8,830 | | Kaiser Aluminum Corp. | | | 717,702 | |
| | | 27,230 | | SunCoke Energy, Inc. | | | 339,286 | |
| | | | | | | | 1,841,884 | |
| | | | | STEEL — 1.0% | | | | |
| | | 22,190 | | Carpenter Technology Corp. | | | 4,305,748 | |
| | | | | | | | | |
| | | | | TOTAL MATERIALS | | | 19,569,804 | |
| | | | | | | | | |
| | | | | REAL ESTATE — 5.0% | | | | |
| | | | | REAL ESTATE OWNERS & DEVELOPERS — 0.6% | | | | |
| | | 20,880 | | McGrath RentCorp(a) | | | 2,544,228 | |
| | | | | | | | | |
| | | | | REAL ESTATE SERVICES — 1.6% | | | | |
| | | 127,410 | | Anywhere Real Estate, Inc.(a) | | | 624,309 | |
| | | 81,480 | | Compass, Inc., Class A(a) | | | 577,693 | |
| | | 94,900 | | Corporate Office Properties Trust | | | 3,126,955 | |
| | | 79,660 | | Cushman & Wakefield PLC(a) | | | 1,218,798 | |
| | | 78,520 | | eXp World Holdings, Inc. | | | 1,087,502 | |
| | | | | | | | 6,635,257 | |
See accompanying Notes to Financial Statements.
8
North Square Dynamic Small Cap Fund
Schedule of Investments (Unaudited) – Continued
November 30, 2024
| | Shares | | | | Fair Value | |
| | | | | COMMON STOCKS (Continued) | | | | |
| | | | | REAL ESTATE (Continued) | | | | |
| | | | | REIT — 2.8% | | | | |
| | | 7,230 | | American Healthcare REIT, Inc. | | $ | 215,526 | |
| | | 89,670 | | Brandywine Realty Trust | | | 502,152 | |
| | | 9,960 | | Community Healthcare Trust, Inc. | | | 188,244 | |
| | | 257,077 | | Hudson Pacific Properties, Inc. | | | 989,746 | |
| | | 8,630 | | Kite Realty Group Trust | | | 237,929 | |
| | | 243,450 | | Outfront Media, Inc. | | | 4,676,675 | |
| | | 83,160 | | Park Hotels & Resorts, Inc. | | | 1,293,138 | |
| | | 35,070 | | Tanger Factory Outlet Centers, Inc. | | | 1,296,538 | |
| | | 55,620 | | The Macerich Co. | | | 1,179,700 | |
| | | 290,340 | | Uniti Group, Inc. | | | 1,715,910 | |
| | | | | | | | 12,295,558 | |
| | | | | TOTAL REAL ESTATE | | | 21,475,043 | |
| | | | | | | | | |
| | | | | TECHNOLOGY — 13.7% | | | | |
| | | | | SEMICONDUCTORS — 2.2% | | | | |
| | | 34,452 | | ACM Research, Inc., Class A(a) | | | 592,230 | |
| | | 23,730 | | Alpha & Omega Semiconductor Ltd.(a) | | | 984,083 | |
| | | 30,390 | | Ambarella, Inc.(a) | | | 2,174,405 | |
| | | 5,170 | | Cirrus Logic, Inc.(a) | | | 540,007 | |
| | | 3,010 | | Impinj, Inc.(a) | | | 578,552 | |
| | | 75,000 | | Rambus, Inc.(a) | | | 4,335,749 | |
| | | | | | | | 9,205,026 | |
| | | | | SOFTWARE — 6.5% | | | | |
| | | 36,340 | | ACI Worldwide, Inc.(a) | | | 2,064,839 | |
| | | 50,120 | | Alarm.com Holdings, Inc.(a) | | | 3,264,817 | |
| | | 33,570 | | Alignment Healthcare, Inc.(a) | | | 423,318 | |
| | | 33,740 | | Alkami Technology, Inc.(a) | | | 1,331,718 | |
| | | 11,561 | | Appfolio, Inc., Class A(a) | | | 2,933,604 | |
| | | 20,370 | | AvePoint Inc.(a) | | | 359,531 | |
| | | 14,310 | | Bandwidth, Inc., Class A(a) | | | 300,939 | |
| | | 5,990 | | CommVault Systems, Inc.(a) | | | 1,027,824 | |
| | | 243,266 | | DoubleVerify Holdings, Inc.(a) | | | 4,945,598 | |
| | | 50,510 | | Olo, Inc.(a) | | | 368,218 | |
| | | 160,330 | | Oscar Health, Inc.(a) | | | 2,778,519 | |
| | | 59,630 | | PROS Holdings, Inc.(a) | | | 1,381,627 | |
| | | 136,580 | | RingCentral, Inc., Class A(a) | | | 5,139,504 | |
| | | 21,480 | | SEMrush Holdings, Inc.(a) | | | 292,128 | |
| | | 84,910 | | Weave Communications, Inc.(a) | | | 1,160,720 | |
| | | | | | | | 27,772,904 | |
| | | | | TECHNOLOGY HARDWARE — 2.3% | | | | |
| | | 56,110 | | A10 Networks, Inc.(a) | | | 956,676 | |
| | | 65,140 | | Arlo Technologies, Inc.(a) | | | 730,871 | |
| | | 80,460 | | Harmonic, Inc.(a) | | | 1,031,497 | |
See accompanying Notes to Financial Statements.
9
North Square Dynamic Small Cap Fund
Schedule of Investments (Unaudited) – Continued
November 30, 2024
| | Shares | | | | Fair Value | |
| | | | | COMMON STOCKS (Continued) | | | | |
| | | | | TECHNOLOGY (Continued) | | | | |
| | | | | TECHNOLOGY HARDWARE (Continued) | | | | |
| | | 9,940 | | NETGEAR, Inc.(a) | | $ | 244,524 | |
| | | 175,940 | | Pitney Bowes Inc. | | | 1,418,076 | |
| | | 19,130 | | Plexus Corp.(a) | | | 3,144,971 | |
| | | 79,310 | | TTM Technologies, Inc.(a) | | | 1,933,578 | |
| | | 16,950 | | Turtle Beach Corp.(a) | | | 293,405 | |
| | | | | | | | 9,753,598 | |
| | | | | TECHNOLOGY SERVICES — 2.7% | | | | |
| | | 32,050 | | Cleanspark, Inc.(a) | | | 459,918 | |
| | | 13,250 | | DXC Technology Co.(a) | | | 298,125 | |
| | | 10,660 | | Euronet Worldwide, Inc.(a) | | | 1,120,686 | |
| | | 52,890 | | ExlService Holdings, Inc.(a) | | | 2,451,980 | |
| | | 33,940 | | Integral Ad Science Holding Corp.(a) | | | 379,449 | |
| | | 57,950 | | LiveRamp Holdings, Inc.(a) | | | 1,759,362 | |
| | | 38,700 | | Maximus, Inc. | | | 2,883,149 | |
| | | 5,728 | | MoneyLion, Inc.(a) | | | 525,258 | |
| | | 15,146 | | Paymentus Holdings, Inc.(a) | | | 572,670 | |
| | | 39,990 | | Riot Blockchain, Inc.(a) | | | 505,874 | |
| | | 102,670 | | Sabre Corp.(a) | | | 401,440 | |
| | | | | | | | 11,357,911 | |
| | | | | TOTAL TECHNOLOGY | | | 58,089,439 | |
| | | | | | | | | |
| | | | | UTILITIES — 1.3% | | | | |
| | | | | ELECTRIC UTILITIES — 1.3% | | | | |
| | | 87,090 | | Clearway Energy, Inc., Class C | | | 2,568,284 | |
| | | 27,500 | | Hawaiian Electric Industries, Inc.(a) | | | 285,725 | |
| | | 56,010 | | Portland General Electric Co. | | | 2,683,999 | |
| | | | | | | | 5,538,008 | |
| | | | | TOTAL UTILITIES | | | 5,538,008 | |
| | | | | | | | | |
| | | | | TOTAL COMMON STOCKS (Cost $353,381,138) | | | 420,855,104 | |
| | | | | | | | | |
| | | | | EXCHANGE-TRADED FUNDS — 0.6% | | | | |
| | | 9,850 | | iShares® Russell 2000 ETF | | | 2,382,420 | |
| | | | | TOTAL EXCHANGE-TRADED FUNDS (Cost $2,348,777) | | | 2,382,420 | |
| | | | | | | | | |
| | | | | RIGHTS — 0.0%(b) | | | | |
| | | | | BIOTECH & PHARMA — 0.0%(b) | | | | |
| | | 29,400 | | Novartis A.G. CVR(a) | | | — | |
| | | | | TOTAL RIGHTS (Cost $—) | | | — | |
| | | | | | | | | |
See accompanying Notes to Financial Statements.
10
North Square Dynamic Small Cap Fund
Schedule of Investments (Unaudited) – Continued
November 30, 2024
| | Shares | | | | Fair Value | |
| | | | | SHORT-TERM INVESTMENTS — 0.9% | | | | |
| | | 3,635,939 | | First American Treasury Obligations Fund, Class X, 4.55%(c) | | $ | 3,635,939 | |
| | | | | TOTAL SHORT-TERM INVESTMENTS (Cost $3,635,939) | | | 3,635,939 | |
| | | | | TOTAL INVESTMENTS — 100.4% (Cost $359,365,854) | | $ | 426,873,463 | |
| | | | | Liabilities in Excess of Other Assets — (0.4)% | | | (1,594,691 | ) |
| | | | | NET ASSETS — 100.0% | | $ | 425,278,772 | |
(a) | Non-income producing security. |
(b) | Percentage rounds to less than 0.1%. |
(c) | Rate disclosed is the seven day effective yield as of November 30, 2024. |
ETF - Exchange-Traded Fund
LTD - Limited Company
NV - Naamioze Vennootschap
PLC - Public Limited Company
REIT- Real Estate Investment Trust
See accompanying Notes to Financial Statements.
11
North Square Multi Strategy Fund
Schedule of Investments (Unaudited)
November 30, 2024
| | Shares | | | | Fair Value | |
| | | | | EXCHANGE-TRADED FUNDS — 35.2% | | | | |
| | | 23,600 | | Invesco® S&P 500® GARP ETF | | $ | 2,653,820 | |
| | | 3,530 | | iShares® Core S&P 500® ETF | | | 2,135,897 | |
| | | 21,900 | | Vanguard® Dividend Appreciation ETF | | | 4,482,492 | |
| | | 5,900 | | Vanguard® Growth ETF | | | 2,413,867 | |
| | | 17,585 | | Vanguard® Value ETF | | | 3,198,184 | |
| | | | | TOTAL EXCHANGE-TRADED FUNDS (Cost $11,416,269) | | | 14,884,260 | |
| | | | | | | | | |
| | | | | MUTUAL FUNDS — 63.6% | | | | |
| | | 201,154 | | North Square Advisory Research Small Value Fund, Class I(a) | | | 2,888,568 | |
| | | 497,475 | | North Square Altrinsic International Equity Fund, Class I(a) | | | 5,735,885 | |
| | | 427,394 | | North Square Dynamic Small Cap Fund, Class I(a) | | | 7,398,188 | |
| | | 79,523 | | North Square Kennedy MicroCap Fund, Class I(a) | | | 1,012,330 | |
| | | 522,964 | | North Square McKee Bond Fund, Class I(a) | | | 4,643,919 | |
| | | 242,297 | | North Square Preferred and Income Securities Fund, Class I(a) | | | 5,228,776 | |
| | | | | TOTAL MUTUAL FUNDS (Cost $21,007,351) | | | 26,907,666 | |
| | | | | | | | | |
| | | | | SHORT-TERM INVESTMENTS — 1.3% | | | | |
| | | 571,454 | | First American Treasury Obligations Fund, Class X, 4.55%(b) | | | 571,454 | |
| | | | | TOTAL SHORT-TERM INVESTMENTS (Cost $571,454) | | | 571,454 | |
| | | | | TOTAL INVESTMENTS — 100.1% (Cost $32,995,074) | | $ | 42,363,380 | |
| | | | | Liabilities in Excess of Other Assets — (0.1)% | | | (39,453 | ) |
| | | | | NET ASSETS — 100.0% | | $ | 42,323,927 | |
(a) | Affiliated Company. See Note 11. |
(b) | Rate disclosed is the seven day effective yield as of November 30, 2024. |
ETF - Exchange-Traded Fund
See accompanying Notes to Financial Statements.
12
North Square Preferred and Income Securities Fund
Schedule of Investments (Unaudited)
November 30, 2024
| | Shares | | | | Fair Value | |
| | | | | PREFERRED STOCKS — 1.9% | | | | |
| | | | | FINANCIALS — 1.9% | | | | |
| | | | | ASSET MANAGEMENT — 1.9% | | | | |
| | | 5,000,000 | | Charles Schwab Corp. (The), Series D, 5.95% | | $ | 4,836,661 | |
| | | | | | | | | |
| | | | | TOTAL PREFERRED STOCKS (Cost $4,679,820) | | | 4,836,661 | |
| | | | | | | | | |
| | Principal
Amount ($) | | | | | | |
| | | | | CORPORATE BONDS — 92.6% | | | | |
| | | | | COMMUNICATIONS — 3.0% | | | | |
| | | | | ENTERTAINMENT CONTENT — 1.4% | | | | |
| | | 3,800,000 | | Paramount Global, 6.250%, 02/28/57(a) | | | 3,599,452 | |
| | | | | | | | | |
| | | | | TELECOMMUNICATIONS — 1.6% | | | | |
| | | 5,000,000 | | Vodafone Group PLC, 5.125%, (H15T5Y + 307bps), 06/04/81(a),(b) | | | 3,902,427 | |
| | | | | | | | | |
| | | | | CONSUMER DISCRETIONARY — 3.0% | | | | |
| | | | | AUTOMOTIVE — 3.0% | | | | |
| | | 3,000,000 | | General Motors Financial Co., Inc., 6.500%, 12/30/49(a) | | | 3,029,034 | |
| | | 4,757,000 | | General Motors Financial Co., Inc., 5.750%, Perpetual(a) | | | 4,643,878 | |
| | | | | | | | 7,672,912 | |
| | | | | ENERGY — 11.9% | | | | |
| | | | | OIL & GAS PRODUCERS — 11.9% | | | | |
| | | 5,000,000 | | BP Capital Markets PLC, 6.125%, (H15T5Y + 167bps), 06/18/55(a) | | | 4,998,520 | |
| | | 5,500,000 | | Enbridge, Inc., 7.200%, (H15T5Y + 297bps), 06/27/54(a) | | | 5,724,433 | |
| | | 2,000,000 | | Enbridge, Inc., 5.500%, (TSFR3M + 68bps), 07/15/77(a) | | | 1,939,360 | |
| | | 8,315,000 | | Energy Transfer LP, 6.625%, (US0003M + 416bps), Perpetual(a) | | | 8,229,191 | |
| | | 6,250,000 | | South Bow Canadian Infrastructure Holdings Ltd., 7.500%, (H15T5Y + 367bps), 03/01/55(a),(b) | | | 6,546,238 | |
| | | 2,892,000 | | TransCanada Trust, 5.300%, 03/15/77 | | | 2,817,973 | |
| | | | | | | | 30,255,715 | |
| | | | | FINANCIALS — 43.5% | | | | |
| | | | | ASSET MANAGEMENT — 2.5% | | | | |
| | | 3,000,000 | | UBS Group AG, 3.875%, (H15T5Y + 310bps), Perpetual(a) | | | 2,863,371 | |
| | | 3,000,000 | | UBS Group AG, 4.375%, Perpetual(a) | | | 2,562,500 | |
| | | 1,000,000 | | UBS Group Inc., 6.850%, (USISSO05 + 363bps), 12/31/49(a),(b) | | | 989,408 | |
| | | | | | | | 6,415,279 | |
| | | | | BANKING — 32.8% | | | | |
| | | 2,000,000 | | Banco Bilbao Vizcaya Argentaria SA, 6.125%, (USSW5 + 387bps), 02/16/49(a) | | | 1,911,500 | |
| | | 2,000,000 | | Banco Bilbao Vizcaya Argentaria SA, 6.000%, 12/31/49 | | | 2,137,270 | |
| | | 1,000,000 | | Banco de Sabadell SA, 5.000%, (EUSA5 + 517bps), 11/19/77 | | | 1,023,067 | |
| | | 1,000,000 | | Banco Santander SA, 3.625%, (EUAMDB05 + 376bps), 12/31/49 | | | 930,277 | |
| | | 6,000,000 | | Banco Santander SA, 8.000%, (H15T5Y + 391bps), 12/31/49(a) | | | 6,196,980 | |
| | | 6,000,000 | | Barclays PLC, 4.375%, (H15T5Y + 341bps), 12/31/49(a) | | | 5,384,679 | |
| | | 5,000,000 | | CaixaBank SA, 3.625%, (EUSA5 + 386bps), Perpetual(a) | | | 4,771,155 | |
See accompanying Notes to Financial Statements.
13
North Square Preferred and Income Securities Fund
Schedule of Investments (Unaudited) – Continued
November 30, 2024
| | Principal
Amount ($) | | | | Fair Value | |
| | | | | CORPORATE BONDS (Continued) | | | | |
| | | | | FINANCIALS (Continued) | | | | |
| | | | | BANKING (Continued) | | | | |
| | | 1,000,000 | | Citigroup Inc., %, (H15T5Y + 257bps), 12/31/49(a) | | $ | 999,065 | |
| | | 2,000,000 | | Citigroup, Inc., 3.875%, Perpetual(a) | | | 1,938,256 | |
| | | 6,100,000 | | Citigroup, Inc., 4.150%, Perpetual(a) | | | 5,869,498 | |
| | | 4,405,000 | | Citizens Financial Group, Inc., 4.000%, Perpetual(a) | | | 4,194,859 | |
| | | 2,662,000 | | Comerica, Inc., 5.625%, Perpetual(a) | | | 2,656,672 | |
| | | 2,000,000 | | Commerzbank AG, 4.250%, (EUSA5 + 439bps), 04/09/71(a) | | | 1,976,741 | |
| | | 7,000,000 | | Deutsche Bank AG, 4.789%, (USISOA05 + 436bps), 12/31/49(a) | | | 6,873,125 | |
| | | 1,000,000 | | HSBC Holdings PLC, 6.875%, (H15T5Y + 330bps), 12/31/49(a) | | | 1,003,459 | |
| | | 1,000,000 | | HSBC Holdings PLC, 6.950%, (H15T5Y + 319bps), 12/31/49(a) | | | 1,007,559 | |
| | | 1,248,000 | | Huntington Bancshares, Inc., 4.450%, Perpetual(a) | | | 1,199,593 | |
| | | 4,185,000 | | ING Groep NV, 3.875%, (H15T5Y + 286bps), Perpetual(a) | | | 3,766,709 | |
| | | 3,500,000 | | ING Groep NV, 4.250%, (H15T5Y + 286bps), Perpetual(a) | | | 2,864,151 | |
| | | 7,614,000 | | KeyCorp, 5.000%, Perpetual(a) | | | 7,409,854 | |
| | | 6,408,000 | | M&T Bank Corp., 3.500%, Perpetual(a) | | | 5,988,240 | |
| | | 4,500,000 | | NatWest Group PLC, 4.600%, Perpetual(a) | | | 3,839,731 | |
| | | 5,000,000 | | Raiffeisen Bank International AG, 4.500%, (EUAMDB05 + 388bps), 12/31/49(a) | | | 4,969,991 | |
| | | 4,800,000 | | Svenska Handelsbanken AB, 4.750%, Perpetual(a) | | | 4,350,060 | |
| | | | | | | | 83,262,491 | |
| | | | | INSURANCE — 1.6% | | | | |
| | | 6,078,000 | | Liberty Mutual Group, Inc., 4.300%, 02/01/61(b) | | | 3,952,545 | |
| | | | | | | | | |
| | | | | SPECIALTY FINANCE — 6.6% | | | | |
| | | 6,635,000 | | Ally Financial, Inc. Series B, 4.700%, (H15T5Y + 387bps), Perpetual(a) | | | 6,273,852 | |
| | | 4,700,000 | | Capital One Financial Corp., 3.950%, Perpetual(a) | | | 4,501,914 | |
| | | 6,100,000 | | Discover Financial Services Series C, 5.500%, 10/31/69(a) | | | 5,960,321 | |
| | | | | | | | 16,736,087 | |
| | | | | INDUSTRIALS — 2.7% | | | | |
| | | | | MACHINERY — 2.7% | | | | |
| | | 7,000,000 | | Stanley Black & Decker, Inc., 4.000%, (H15T5Y + 266bps), 03/15/60(a) | | | 6,905,873 | |
| | | | | | | | | |
| | | | | UTILITIES — 28.5% | | | | |
| | | | | ELECTRIC UTILITIES — 25.7% | | | | |
| | | 7,000,000 | | Algonquin Power & Utilities, Corp., 4.750%, 01/18/82(a) | | | 6,608,746 | |
| | | 2,050,000 | | American Electric Power Co., Inc., 6.950%, (H15T5Y + 268bps), 12/15/54(a) | | | 2,146,989 | |
| | | 3,945,000 | | American Electric Power Co., Inc., 3.875%, (H15T5Y + 268bps), 02/15/62(a) | | | 3,746,836 | |
| | | 6,000,000 | | CenterPoint Energy, Inc., 6.850%, (H15T5Y + 295bps), 02/15/55(a) | | | 6,208,508 | |
| | | 4,751,000 | | CMS Energy Corp., 4.750%, (H15T5Y + 412bps), 06/01/50(a) | | | 4,508,188 | |
| | | 500,000 | | Dominion Energy Inc., 6.625%, (H15T5Y + 221bps), 05/15/55(a) | | | 513,550 | |
| | | 5,500,000 | | Duke Energy Corp., 6.450%, (H15T5Y + 259bps), 09/01/54(a) | | | 5,597,438 | |
| | | 6,301,000 | | Duke Energy Corp., 3.250%, (H15T5Y + 232bps), 01/15/82(a) | | | 5,857,122 | |
See accompanying Notes to Financial Statements.
14
North Square Preferred and Income Securities Fund
Schedule of Investments (Unaudited) – Continued
November 30, 2024
| | Principal
Amount ($) | | | | Fair Value | |
| | | | | CORPORATE BONDS (Continued) | | | | |
| | | | | UTILITIES (Continued) | | | | |
| | | | | ELECTRIC UTILITIES (Continued) | | | | |
| | | 5,000,000 | | Emera, Inc., 6.750%, 06/15/76(a) | | $ | 5,069,685 | |
| | | 2,000,000 | | EUSHI Finance, Inc., 7.625%, 12/15/54(a),(b) | | | 2,072,912 | |
| | | 5,500,000 | | NextEra Energy Capital Holdings, Inc., 6.750%, (H15T5Y + 246bps), 06/15/54(a) | | | 5,737,762 | |
| | | 3,502,000 | | NiSource Inc., 6.375%, (H15T5Y + 253bps), 03/31/55(a) | | | 3,525,269 | |
| | | 4,848,000 | | NRG Energy, Inc., 10.250%, (H15T5Y + 592bps), 12/31/49(a),(b) | | | 5,389,381 | |
| | | 7,725,000 | | Vistra Corp., 8.875%, (H15T5Y + 505bps), 12/31/49(a),(b) | | | 8,302,327 | |
| | | | | | | | 65,284,713 | |
| | | | | GAS & WATER UTILITIES — 2.8% | | | | |
| | | 7,000,000 | | AltaGas Ltd., 7.200%, (H15T5Y + 357bps), 10/15/54(a),(b) | | | 7,166,073 | |
| | | | | | | | | |
| | | | | TOTAL CORPORATE BONDS (Cost $222,696,712) | | | 235,153,567 | |
| | | | | | | | | |
| | | | | NON U.S. GOVERNMENT & AGENCIES — 0.4% | | | | |
| | | | | GOVERNMENT SPONSORED — 0.4% | | | | |
| | | 1,000,000 | | CoBank ACB, 7.125%, (H15T5Y + 282%), 12/31/49(a) | | | 1,018,684 | |
| | | | | TOTAL NON U.S. GOVERNMENT & AGENCIES (Cost $1,000,000) | | | 1,018,684 | |
| | | | | | | | | |
| | Shares | | | | | | |
| | | | | SHORT-TERM INVESTMENTS — 3.9% | | | | |
| | | 9,814,696 | | First American Treasury Obligations Fund, Class X, 4.55%(c) | | | 9,814,696 | |
| | | | | TOTAL SHORT-TERM INVESTMENTS (Cost $9,814,696) | | | 9,814,696 | |
| | | | | TOTAL INVESTMENTS — 98.8% (Cost $238,191,228) | | $ | 250,823,608 | |
| | | | | Other Assets in Excess of Liabilities — 1.2% | | | 2,991,808 | |
| | | | | NET ASSETS — 100.0% | | $ | 253,815,416 | |
(a) | Variable rate security. Interest rate resets periodically. The rate shown is the effective interest rate as of November 30, 2024. For securities based on a published reference rate and spread, the reference rate and spread (in basis points) are indicated parenthetically. Certain variable rate securities are not based on a published reference rate and spread but are determined by the issuer or agent and are based on current market conditions. These securities, therefore, do not indicate a reference rate and spread. |
(b) | Security exempt from registration under Rule 144A or Section 4(2) of the Securities Act of 1933. The security may be resold in transactions exempt from registration, normally to qualified institutional buyers. As of November 30, 2024 the total market value of 144A securities is $37,433,949 or 14.8% of net assets. |
(c) | Rate disclosed is the seven day effective yield as of November 30, 2024. |
See accompanying Notes to Financial Statements.
15
North Square Preferred and Income Securities Fund
SCHEDULE OF FUTURES CONTRACTS (Unaudited)
November 30, 2024
Contracts | | Short Contracts | | | Expiration | | | Notional
Amount | | | Value and
Unrealized
Appreciation | |
(128) | Euro FX Future | | | 12/17/2024 | | | $ | (16,917,600 | ) | | $ | 697,125 | |
| | | | | | | | | | | | | | | $ | 697,125 | |
See accompanying Notes to Financial Statements.
16
North Square Tactical Growth Fund
Schedule of Investments (Unaudited)
November 30, 2024
| | Shares | | | | Fair Value | |
| | | | | EXCHANGE-TRADED FUNDS — 92.1% | | | | |
| | | 688,900 | | Financial Select Sector SPDR® Fund | | $ | 35,368,126 | |
| | | 168,575 | | Invesco QQQ Trust, Series 1 | | | 85,929,421 | |
| | | 226,700 | | iShares® 3-7 Year Treasury Bond ETF | | | 26,553,371 | |
| | | 230,900 | | iShares® Core High Dividend ETF | | | 28,003,552 | |
| | | 531,500 | | iShares® MSCI Eurozone ETF | | | 25,437,590 | |
| | | 93,400 | | iShares® Russell 3000 ETF | | | 32,335,080 | |
| | | 218,900 | | iShares® Russell 2000 ETF | | | 52,945,343 | |
| | | 129,440 | | SPDR® S&P 500® ETF Trust | | | 77,994,072 | |
| | | 206,787 | | Vanguard Growth ETF | | | 84,602,765 | |
| | | 354,498 | | Vanguard Value ETF | | | 64,472,551 | |
| | | | | TOTAL EXCHANGE-TRADED FUNDS (Cost $294,195,991) | | | 513,641,871 | |
| | | | | | | | | |
| | | | | SHORT-TERM INVESTMENTS — 8.0% | | | | |
| | | 44,673,412 | | First American Treasury Obligations Fund, Class X, 4.55%(a) | | | 44,673,412 | |
| | | | | TOTAL SHORT-TERM INVESTMENTS (Cost $44,673,412) | | | 44,673,412 | |
| | | | | TOTAL INVESTMENTS — 100.1% (Cost $338,869,403) | | $ | 558,315,283 | |
| | | | | Liabilities in Excess of Other Assets — (0.1)% | | | (758,511 | ) |
| | | | | NET ASSETS — 100.0% | | $ | 557,556,772 | |
(a) | Rate disclosed is the seven day effective yield as of November 30, 2024. |
ETF | - Exchange-Traded Fund |
MSCI - Morgan Stanley Capital International
SPDR - Standard & Poor’s Depositary Receipt
See accompanying Notes to Financial Statements.
17
North Square Tactical Defensive Fund
Schedule of Investments (Unaudited)
November 30, 2024
| | Shares | | | | Fair Value | |
| | | | | EXCHANGE-TRADED FUNDS — 98.4% | | | | |
| | | 22,500 | | iShares® Core S&P 500® ETF | | $ | 13,614,075 | |
| | | 30,500 | | SPDR® Dow Jones Industrial Average ETF Trust | | | 13,727,745 | |
| | | 239,200 | | SPDR® Portfolio Developed World ex-US ETF | | | 8,568,144 | |
| | | 79,400 | | SPDR® Portfolio Emerging Markets ETF | | | 3,128,360 | |
| | | 220,800 | | SPDR® Portfolio S&P 500® ETF(a) | | | 15,652,512 | |
| | | 40,100 | | SPDR® Portfolio S&P 600® Small Cap ETF | | | 1,972,118 | |
| | | | | TOTAL EXCHANGE-TRADED FUNDS (Cost $49,884,781) | | | 56,662,954 | |
| | | | | | | | | |
| | | | | SHORT-TERM INVESTMENTS — 1.7% | | | | |
| | | 965,582 | | First American Treasury Obligations Fund, Class X, 4.55%(b) | | | 965,582 | |
| | | | | TOTAL SHORT-TERM INVESTMENTS (Cost $965,582) | | | 965,582 | |
| | | | | TOTAL INVESTMENTS — 100.1% (Cost $50,850,363) | | $ | 57,628,536 | |
| | | | | Liabilities in Excess of Other Assets — (0.1)% | | | (63,913 | ) |
| | | | | NET ASSETS — 100.0% | | $ | 57,564,623 | |
(a) | Represents an investment greater than 25% of the Fund’s net assets. Performance of the Fund may be adversely impacted by concentrated investments in securities. As of November 30, 2024, the percentage of net assets invested in SPDR® S&P 500® ETF Trust was 27.19% of the Fund. The financial statements and portfolio holdings for these securities can be found at www.sec.gov. |
(b) | Rate disclosed is the seven day effective yield as of November 30, 2024. |
ETF - Exchange-Traded Fund
SPDR - Standard & Poor’s Depositary Receipt
See accompanying Notes to Financial Statements.
18
North Square Core Plus Bond Fund
Schedule of Investments (Unaudited)
November 30, 2024
| | Shares | | | | Fair Value | |
| | | | | PREFERRED STOCKS — 0.4% | | | | |
| | | | | FINANCIALS — 0.4% | | | | |
| | | 2,750 | | Synchrony Financial - Series B, 4.500% | | $ | 72,875 | |
| | | | | | | | | |
| | | | | TOTAL PREFERRED STOCKS (Cost $70,708) | | | 72,875 | |
| | | | | | | | | |
| | Principal
Amount ($) | | | | | | |
| | | | | ASSET BACKED SECURITIES — 9.4% | | | | |
| | | 128,279 | | Bear Stearns Asset Backed Securities I Trust, Series 2004-HE7 M1, 5.602%, (TSFR1M + 11bps), 08/25/34(a) | | | 126,057 | |
| | | 175,000 | | BMW Vehicle Lease Trust, Series 2024-2 A3, 4.180%, 02/25/27 | | | 174,053 | |
| | | 150,000 | | BXP Trust 2017-CQHP A, 5.507%, (TSFR1M + 5bps), 11/15/34(a),(b) | | | 144,619 | |
| | | 122,000 | | Capital One Prime Auto Receivables Trust 2023-2 A3, 5.820%, 06/15/28 | | | 124,279 | |
| | | 120,000 | | Dell Equipment Finance Trust 2023-3, 5.930%, 06/22/26(b) | | | 121,535 | |
| | | 70,000 | | GS Mortgage Securities Trust 2013-GC10 D, 4.537%, 02/10/46(a),(b) | | | 68,362 | |
| | | 60,000 | | Honda Auto Receivables 2024-3 Owner Trust A3, 4.570%, 10/21/27 | | | 60,132 | |
| | | 137,118 | | Impac CMB Trust Series 2005-4 1M1, 5.347%, (TSFR1M + 11bps), 05/25/35(a) | | | 130,530 | |
| | | 132,815 | | JPMorgan Chase Commercial Mortgage Securities, Series 2019-MFP D, 6.316%, (TSFR1M + 5bps), 07/15/36(a),(b) | | | 131,869 | |
| | | 95,000 | | Mercedes-Benz Auto Lease Trust, Series 2024-A A3, 5.320%, 02/16/27 | | | 96,274 | |
| | | 206,000 | | Morgan Stanley Bank of America Merrill Lynch Trust, Series 2012-C5 E, 4.641%, 08/15/45(a),(b) | | | 200,891 | |
| | | 128,941 | | Morgan Stanley Bank of America Merrill Lynch Trust, Series 2014-C17, 3.500%, 08/15/47(b) | | | 124,964 | |
| | | 151,881 | | Morgan Stanley Capital I Trust, Series 2011-C2, 5.211%, 06/15/44(a),(b) | | | 150,483 | |
| | | 45,000 | | Verizon Master Trust, Series 2024-3 A1A, 5.340%, 04/22/30 | | | 45,870 | |
| | | | | TOTAL ASSET BACKED SECURITIES (Cost $1,694,375) | | | 1,699,918 | |
| | | | | | | | | |
| | | | | CORPORATE BONDS — 42.9% | | | | |
| | | | | COMMUNICATIONS — 3.2% | | | | |
| | | | | CABLE & SATELLITE — 0.7% | | | | |
| | | 95,000 | | Cable One, Inc., 4.000%, 11/15/30(b) | | | 79,277 | |
| | | 60,000 | | Comcast Corp., 3.250%, 11/01/39 | | | 47,363 | |
| | | | | | | | 126,640 | |
| | | | | ENTERTAINMENT CONTENT — 1.4% | | | | |
| | | 54,000 | | AMC Networks, Inc., 10.250%, 01/15/29(b) | | | 57,464 | |
| | | 54,000 | | AMC Networks, Inc., 4.250%, 02/15/29 | | | 41,102 | |
| | | 45,000 | | Fox Corp., 6.500%, 10/13/33 | | | 48,313 | |
| | | 75,000 | | Paramount Global, 6.250%, 02/28/57(a) | | | 71,041 | |
| | | 45,000 | | Walt Disney Co. (The), 3.500%, 05/13/40 | | | 37,434 | |
| | | | | | | | 255,354 | |
| | | | | INTERNET MEDIA & SERVICES — 0.5% | | | | |
| | | 20,000 | | Meta Platforms Inc., 5.600%, 05/15/53 | | | 21,054 | |
| | | 82,000 | | Ziff Davis, Inc., 4.625%, 10/15/30(b) | | | 76,756 | |
| | | | | | | | 97,810 | |
See accompanying Notes to Financial Statements.
19
North Square Core Plus Bond Fund
Schedule of Investments (Unaudited) – Continued
November 30, 2024
| | Principal
Amount ($) | | | | Fair Value | |
| | | | | CORPORATE BONDS (continued) | | | | |
| | | | | COMMUNICATIONS (continued) | | | | |
| | | | | TELECOMMUNICATIONS — 0.6% | | | | |
| | | 20,000 | | AT&T, Inc., 4.350%, 03/01/29 | | $ | 19,794 | |
| | | 20,000 | | Verizon Communications, Inc., 4.780%, 02/15/35(b) | | | 19,509 | |
| | | 85,000 | | Verizon Communications, Inc., 2.650%, 11/20/40 | | | 60,657 | |
| | | | | | | | 99,960 | |
| | | | | CONSUMER DISCRETIONARY — 3.4% | | | | |
| | | | | APPAREL & TEXTILE PRODUCTS — 0.3% | | | | |
| | | 47,000 | | General Motors Financial Co., Inc., 5.550%, Perpetual | | | 48,066 | |
| | | | | | | | | |
| | | | | AUTOMOTIVE — 0.9% | | | | |
| | | 45,000 | | American Honda Finance Corp., 2.000%, 03/24/28 | | | 41,525 | |
| | | 45,000 | | Ford Motor Co. Class B, 3.250%, 02/12/32 | | | 38,404 | |
| | | 10,000 | | General Motors Financial Co., Inc., 4.300%, 04/06/29 | | | 9,737 | |
| | | 75,000 | | General Motors Financial Co., Inc., 5.750%, 03/30/66(a) | | | 73,216 | |
| | | | | | | | 162,882 | |
| | | | | CONSUMER SERVICES — 0.4% | | | | |
| | | 82,000 | | Rent-A-Center, Inc., 6.375%, 02/15/29(b) | | | 80,466 | |
| | | | | | | | | |
| | | | | LEISURE FACILITIES & SERVICES — 0.9% | | | | |
| | | 82,000 | | Full House Resorts, Inc., 8.250%, 02/15/28(b) | | | 81,790 | |
| | | 20,000 | | McDonald’s Corp., 3.600%, 07/01/30 | | | 18,988 | |
| | | 40,000 | | Starbucks Corp., 4.900%, 02/15/31 | | | 40,569 | |
| | | 20,000 | | Starbucks Corp., 5.000%, 02/15/34 | | | 20,050 | |
| | | | | | | | 161,397 | |
| | | | | RETAIL - DISCRETIONARY — 0.9% | | | | |
| | | 68,000 | | BlueLinx Holdings, Inc., 6.000%, 11/15/29(b) | | | 66,778 | |
| | | 54,000 | | Gap, Inc. (The), 3.875%, 10/01/31(b) | | | 47,543 | |
| | | 54,000 | | GYP Holdings III Corp., 4.625%, 05/01/29(b) | | | 51,377 | |
| | | | | | | | 165,698 | |
| | | | | CONSUMER STAPLES — 2.4% | | | | |
| | | | | BEVERAGES — 0.5% | | | | |
| | | 40,000 | | Coca-Cola Co. (The), 5.000%, 05/13/34 | | | 40,970 | |
| | | 40,000 | | Keurig Dr Pepper, Inc., 5.200%, 03/15/31 | | | 40,832 | |
| | | | | | | | 81,802 | |
| | | | | FOOD — 1.0% | | | | |
| | | 68,000 | | BellRing Brands, Inc., 7.000%, 03/15/30(b) | | | 70,708 | |
| | | 54,000 | | Herbalife Nutrition Ltd., 7.875%, 09/01/25(b) | | | 54,097 | |
| | | 54,000 | | HLF Financing SaRL, LLC, 12.250%, 04/15/29(b) | | | 56,987 | |
| | | | | | | | 181,792 | |
| | | | | HOUSEHOLD PRODUCTS — 0.2% | | | | |
| | | 35,000 | | Procter & Gamble Co. (The), 4.550%, 01/29/34 | | | 35,035 | |
| | | | | | | | | |
See accompanying Notes to Financial Statements.
20
North Square Core Plus Bond Fund
Schedule of Investments (Unaudited) – Continued
November 30, 2024
| | Principal
Amount ($) | | | | Fair Value | |
| | | | | CORPORATE BONDS (continued) | | | | |
| | | | | CONSUMER STAPLES (continued) | | | | |
| | | | | RETAIL - CONSUMER STAPLES — 0.1% | | | | |
| | | 20,000 | | Kroger Co. (The), 5.500%, 09/15/54 | | $ | 19,841 | |
| | | | | | | | | |
| | | | | TOBACCO & CANNABIS — 0.6% | | | | |
| | | 30,000 | | Philip Morris International, Inc., 5.125%, 02/15/30 | | | 30,554 | |
| | | 82,000 | | Turning Point Brands, Inc., 5.625%, 02/15/26(b) | | | 81,969 | |
| | | | | | | | 112,523 | |
| | | | | ENERGY — 5.5% | | | | |
| | | | | OIL & GAS PRODUCERS — 4.2% | | | | |
| | | 21,000 | | BP Capital Markets America, Inc., 4.893%, 09/11/33 | | | 20,835 | |
| | | 109,000 | | California Resources Corp., 8.250%, 06/15/29(b) | | | 111,934 | |
| | | 19,000 | | ConocoPhillips Co., 5.000%, 01/15/35 | | | 19,060 | |
| | | 50,000 | | ConocoPhillips Co., 5.300%, 05/15/53 | | | 49,175 | |
| | | 25,000 | | Energy Transfer LP, 6.400%, 12/01/30 | | | 26,715 | |
| | | 75,000 | | Energy Transfer LP, 6.625%, (US0003M + 416bps), Perpetual(a) | | | 74,225 | |
| | | 55,000 | | Enterprise Products Operating LLC, 4.950%, 02/15/35 | | | 54,705 | |
| | | 30,000 | | Enterprise Products Operating LLC, 4.800%, 02/01/49 | | | 27,557 | |
| | | 80,000 | | Exxon Mobil Corp., 4.327%, 03/19/50 | | | 69,821 | |
| | | 82,000 | | Permian Resources Operating LLC, 5.875%, 07/01/29(b) | | | 81,646 | |
| | | 45,000 | | Phillips 66 Co., 5.250%, 06/15/31 | | | 45,833 | |
| | | 75,000 | | South Bow Canadian Infrastructure Holdings Ltd., 7.500%, (H15T5Y + 367bps), 03/01/55(a),(b) | | | 78,554 | |
| | | 40,000 | | TotalEnergies Capital SA, 5.488%, 04/05/54 | | | 40,398 | |
| | | 68,000 | | Vital Energy, Inc., 7.875%, 04/15/32(b) | | | 66,950 | |
| | | | | | | | 767,408 | |
| | | | | OIL & GAS SERVICES & EQUIPMENT — 1.3% | | | | |
| | | 54,000 | | Helix Energy Solutions Group, Inc., 9.750%, 03/01/29(b) | | | 58,385 | |
| | | 82,000 | | Nabors Industries, Inc., 7.375%, 05/15/27(b) | | | 82,323 | |
| | | 82,000 | | Noble Finance II LLC, 8.000%, 04/15/30(b) | | | 84,037 | |
| | | | | | | | 224,745 | |
| | | | | FINANCIALS — 14.6% | | | | |
| | | | | ASSET MANAGEMENT — 0.3% | | | | |
| | | 25,000 | | Charles Schwab Corp. (The), 5.643%, (SOFR + 221bps), 05/19/29(a) | | | 25,711 | |
| | | 24,441 | | United Airlines 2023-1 Class A Pass Through Trust, Series 2023-1, 5.800%, 07/15/36 | | | 25,365 | |
| | | | | | | | 51,076 | |
| | | | | BANKING — 9.7% | | | | |
| | | 200,000 | | Banco Bilbao Vizcaya Argentaria SA, 6.125%, (USSW5 + 387bps), 02/16/49(a) | | | 191,150 | |
| | | 200,000 | | Banco Santander SA, 8.000%, (H15T5Y + 391bps), 12/31/49(a) | | | 206,565 | |
| | | 140,000 | | Bank of America Corp., 1.658%, 03/11/27(a) | | | 134,573 | |
| | | 35,000 | | Bank of Montreal, 4.640%, (SOFR + 125bps), 09/10/30(a) | | | 34,737 | |
| | | 200,000 | | Barclays PLC, 4.375%, (H15T5Y + 341bps), 12/31/49(a) | | | 179,489 | |
| | | 200,000 | | CaixaBank SA, 3.625%, (EUSA5 + 386bps), Perpetual(a),(b) | | | 190,846 | |
| | | 40,000 | | Canadian Imperial Bank of Commerce, 5.260%, 04/08/29 | | | 40,785 | |
See accompanying Notes to Financial Statements.
21
North Square Core Plus Bond Fund
Schedule of Investments (Unaudited) – Continued
November 30, 2024
| | Principal
Amount ($) | | | | Fair Value | |
| | | | | CORPORATE BONDS (continued) | | | | |
| | | | | FINANCIALS (continued) | | | | |
| | | | | BANKING (continued) | | | | |
| | | 40,000 | | Citigroup, Inc., 5.174%, (SOFR + 136bps), 02/13/30 | | $ | 40,439 | |
| | | 200,000 | | ING Groep NV, 4.250%, (H15T5Y + 286bps), Perpetual(a) | | | 163,666 | |
| | | 50,000 | | JPMorgan Chase & Co., 5.299%, (SOFR + 145bps), 07/24/29(a) | | | 50,874 | |
| | | 100,000 | | KeyCorp, 5.000%, Perpetual(a) | | | 97,319 | |
| | | 200,000 | | NatWest Group PLC, 4.600%, Perpetual(a) | | | 170,655 | |
| | | 12,000 | | PNC Financial Services Group Inc. (The), 6.875%, (SOFR + 2bps), 10/20/34(a) | | | 13,411 | |
| | | 25,000 | | Royal Bank of Canada, 4.650%, (SOFR + 108bps), 10/18/30(a) | | | 24,893 | |
| | | 45,000 | | Toronto-Dominion Bank (The), 4.693%, 09/15/27 | | | 45,081 | |
| | | 35,000 | | Toronto-Dominion Bank (The), 4.994%, 04/05/29 | | | 35,396 | |
| | | 20,000 | | Toronto-Dominion Bank (The), 3.200%, 03/10/32 | | | 17,915 | |
| | | 6,000 | | Truist Financial Corp., 7.161%, (SOFR + 245bps), 10/30/29(a) | | | 6,458 | |
| | | 30,000 | | Wells Fargo & Co., 5.574%, (SOFR + 174bps), 07/25/29(a) | | | 30,761 | |
| | | 40,000 | | Wells Fargo & Co., 6.303%, (SOFR + 179bps), 10/23/29(a) | | | 42,079 | |
| | | 40,000 | | Wells Fargo & Co., 4.897%, (SOFR + 210bps), 07/25/33(a) | | | 39,561 | |
| | | | | | | | 1,756,653 | |
| | | | | INSTITUTIONAL FINANCIAL SERVICES — 1.7% | | | | |
| | | 45,000 | | Bank of New York Mellon Corp. (The), 5.060%, 07/22/32 | | | 45,584 | |
| | | 25,000 | | Goldman Sachs Bank, 5.414%, (SOFR + 75bps), 05/21/27(a) | | | 25,216 | |
| | | 90,000 | | Goldman Sachs Group, Inc. (The), 1.431%, 03/09/27(a) | | | 86,264 | |
| | | 105,000 | | Goldman Sachs Group, Inc. (The), 1.992%, 01/27/32(a) | | | 88,282 | |
| | | 65,000 | | Morgan Stanley, 1.593%, 05/04/27(a) | | | 62,129 | |
| | | | | | | | 307,475 | |
| | | | | SPECIALTY FINANCE — 2.9% | | | | |
| | | 100,000 | | Ally Financial, Inc. Series B, 4.700%, (H15T5Y + 387bps), 08/15/69(a) | | | 94,557 | |
| | | 35,000 | | American Express Co., 5.284%, (SOFR + 142bps), 07/26/35(a) | | | 35,504 | |
| | | 82,000 | | Bread Financial Holdings, Inc., 9.750%, 03/15/29(b) | | | 88,118 | |
| | | 20,000 | | Capital One Financial Corp., 1.878%, 11/02/27(a) | | | 18,894 | |
| | | 25,000 | | Capital One Financial Corp., 6.209%, 06/08/29(a) | | | 25,977 | |
| | | 10,000 | | Capital One Financial Corp., 5.463%, (SOFR + 156bps), 07/26/30(a) | | | 10,139 | |
| | | 100,000 | | Capital One Financial Corp., 3.950%, Perpetual(a) | | | 95,786 | |
| | | 100,000 | | Discover Financial Services, 5.500%, 10/31/69(a) | | | 97,711 | |
| | | 82,000 | | Springleaf Finance Corp., 5.375%, 11/15/29 | | | 79,890 | |
| | | | | | | | 546,576 | |
| | | | | HEALTH CARE — 1.4% | | | | |
| | | | | BIOTECH & PHARMA — 0.5% | | | | |
| | | 25,000 | | Amgen, Inc., 5.650%, 03/02/53 | | | 25,519 | |
| | | 28,000 | | Eli Lilly & Co., 5.000%, 02/09/54 | | | 27,281 | |
| | | 35,000 | | Johnson & Johnson, 4.900%, 06/01/31 | | | 35,834 | |
| | | | | | | | 88,634 | |
| | | | | HEALTH CARE FACILITIES & SERVICES — 0.9% | | | | |
| | | 20,000 | | Cigna Group (The), 5.000%, 05/15/29 | | | 20,225 | |
| | | 82,000 | | DaVita Inc., 4.625%, 06/01/30(b) | | | 76,862 | |
See accompanying Notes to Financial Statements.
22
North Square Core Plus Bond Fund
Schedule of Investments (Unaudited) – Continued
November 30, 2024
| | Principal
Amount ($) | | | | Fair Value | |
| | | | | CORPORATE BONDS (continued) | | | | |
| | | | | HEALTH CARE (continued) | | | | |
| | | | | HEALTH CARE FACILITIES & SERVICES (continued) | | | | |
| | | 25,000 | | UnitedHealth Group, Inc., 5.300%, 02/15/30 | | $ | 25,793 | |
| | | 50,000 | | UnitedHealth Group, Inc., 5.150%, 07/15/34 | | | 50,905 | |
| | | | | | | | 173,785 | |
| | | | | INDUSTRIALS — 4.5% | | | | |
| | | | | AEROSPACE & DEFENSE — 0.5% | | | | |
| | | 75,000 | | Boeing Co., 4.875%, 05/01/25 | | | 74,919 | |
| | | 15,000 | | Northrop Grumman Corp., 3.250%, 01/15/28 | | | 14,424 | |
| | | | | | | | 89,343 | |
| | | | | COMMERCIAL SUPPORT SERVICES — 0.4% | | | | |
| | | 82,000 | | Deluxe Corp., 8.000%, 06/01/29(b) | | | 79,379 | |
| | | | | | | | | |
| | | | | DIVERSIFIED INDUSTRIALS — 0.3% | | | | |
| | | 50,000 | | Honeywell International, Inc., 4.750%, 02/01/32 | | | 50,104 | |
| | | | | | | | | |
| | | | | ELECTRICAL EQUIPMENT — 0.6% | | | | |
| | | 82,000 | | Atkore, Inc., 4.250%, 06/01/31(b) | | | 74,571 | |
| | | 25,000 | | Johnson Controls International PLC, 5.500%, 04/19/29 | | | 25,793 | |
| | | | | | | | 100,364 | |
| | | | | ENGINEERING & CONSTRUCTION — 0.4% | | | | |
| | | 68,000 | | Tutor Perini Corp., 11.875%, 04/30/29(b) | | | 75,783 | |
| | | | | | | | | |
| | | | | MACHINERY — 1.1% | | | | |
| | | 20,000 | | John Deere Capital Corp., 4.900%, 03/07/31 | | | 20,290 | |
| | | 20,000 | | John Deere Capital Corp., 4.400%, 09/08/31 | | | 19,702 | |
| | | 75,000 | | Stanley Black & Decker, Inc., 4.000%, (H15T5Y + 266bps), 03/15/60(a) | | | 73,992 | |
| | | 82,000 | | Titan International Inc., 7.000%, 04/30/28 | | | 80,665 | |
| | | | | | | | 194,649 | |
| | | | | TRANSPORTATION & LOGISTICS — 0.5% | | | | |
| | | 80,000 | | Burlington Northern Santa Fe, LLC, 4.550%, 09/01/44 | | | 72,957 | |
| | | 17,000 | | United Parcel Service, Inc., 5.150%, 05/22/34 | | | 17,404 | |
| | | | | | | | 90,361 | |
| | | | | TRANSPORTATION EQUIPMENT — 0.7% | | | | |
| | | 54,000 | | Allison Transmission Holdings, Inc., 5.875%, 06/01/29(b) | | | 54,379 | |
| | | 82,000 | | Wabash National Corp., 4.500%, 10/15/28(b) | | | 76,301 | |
| | | | | | | | 130,680 | |
| | | | | MATERIALS — 1.6% | | | | |
| | | | | METALS & MINING — 1.6% | | | | |
| | | 82,000 | | Alliance Resource Operating Partners LP, 8.625%, 06/15/29(b) | | | 86,581 | |
| | | 109,000 | | Eldorado Gold Corp., 6.250%, 09/01/29(b) | | | 108,023 | |
| | | 109,000 | | SunCoke Energy, Inc., 4.875%, 06/30/29(b) | | | 100,791 | |
| | | | | | | | 295,395 | |
See accompanying Notes to Financial Statements.
23
North Square Core Plus Bond Fund
Schedule of Investments (Unaudited) – Continued
November 30, 2024
| | Principal
Amount ($) | | | | Fair Value | |
| | | | | CORPORATE BONDS (continued) | | | | |
| | | | | REAL ESTATE — 0.2% | | | | |
| | | | | REAL ESTATE INVESTMENT TRUSTS — 0.2% | | | | |
| | | 35,000 | | American Tower Corp., 3.800%, 08/15/29 | | $ | 33,550 | |
| | | | | | | | | |
| | | | | TECHNOLOGY — 1.5% | | | | |
| | | | | SEMICONDUCTORS — 0.2% | | | | |
| | | 25,000 | | Broadcom, Inc., 4.350%, 02/15/30 | | | 24,513 | |
| | | 15,000 | | Intel Corp., 5.700%, 02/10/53 | | | 14,329 | |
| | | | | | | | 38,842 | |
| | | | | SOFTWARE — 1.0% | | | | |
| | | 54,000 | | Consensus Cloud Solutions Inc., 6.500%, 10/15/28(b) | | | 53,508 | |
| | | 35,000 | | Oracle Corp., 2.300%, 03/25/28 | | | 32,571 | |
| | | 52,000 | | Oracle Corp., 3.600%, 04/01/40 | | | 42,276 | |
| | | 54,000 | | ZoomInfo Technologies LLC/ZoomInfo Finance Corp., 3.875%, 02/01/29(b) | | | 49,616 | |
| | | | | | | | 177,971 | |
| | | | | TECHNOLOGY HARDWARE — 0.3% | | | | |
| | | 34,000 | | Apple, Inc., 2.950%, 09/11/49 | | | 24,052 | |
| | | 30,000 | | Cisco Systems, Inc., 4.950%, 02/26/31 | | | 30,560 | |
| | | | | | | | 54,612 | |
| | | | | UTILITIES — 4.6% | | | | |
| | | | | ELECTRIC UTILITIES — 3.8% | | | | |
| | | 40,000 | | Alabama Power Co., 3.450%, 10/01/49 | | | 29,954 | |
| | | 75,000 | | Algonquin Power & Utilities, Corp., 4.750%, 01/18/82(a) | | | 70,808 | |
| | | 15,000 | | Berkshire Hathaway Energy Co., 3.700%, 07/15/30 | | | 14,334 | |
| | | 10,000 | | Consolidated Edison Co. of New York, Inc., 5.700%, 05/15/54 | | | 10,558 | |
| | | 105,000 | | Duke Energy Carolinas LLC, 5.300%, 02/15/40 | | | 106,693 | |
| | | 20,000 | | Entergy Corp., 1.900%, 06/15/28 | | | 18,232 | |
| | | 35,000 | | Florida Power & Light Co., 5.300%, 04/01/53 | | | 35,607 | |
| | | 110,000 | | MidAmerican Energy Co., 4.250%, 07/15/49 | | | 94,965 | |
| | | 40,000 | | NextEra Energy Capital Holdings, Inc., 4.900%, 02/28/28 | | | 40,279 | |
| | | 15,000 | | NextEra Energy Capital Holdings, Inc., 2.250%, 06/01/30 | | | 13,175 | |
| | | 75,000 | | NRG Energy, Inc., 10.250%, (H15T5Y + 592bps), 12/31/49(a),(b) | | | 83,375 | |
| | | 25,000 | | Pacific Gas and Electric Co., 4.550%, 07/01/30 | | | 24,463 | |
| | | 55,000 | | Virginia Electric and Power Co., 5.450%, 04/01/53 | | | 55,545 | |
| | | 75,000 | | Vistra Corp., 8.875%, (H15T5Y + 505bps), 12/31/49(a) | | | 80,605 | |
| | | | | | | | 678,593 | |
| | | | | GAS & WATER UTILITIES — 0.8% | | | | |
| | | 75,000 | | AltaGas Ltd., 7.200%, (H15T5Y + 357bps), 10/15/54(a),(b) | | | 76,779 | |
| | | 82,000 | | Suburban Propane Partners LP, 5.000%, 06/01/31(b) | | | 74,697 | |
| | | | | | | | 151,476 | |
| | | | | TOTAL CORPORATE BONDS (Cost $7,849,738) | | | 7,786,720 | |
| | | | | | | | | |
| | | | | MORTGAGE-BACKED SECURITIES — 31.0% | | | | |
| | | 166,193 | | Fannie Mae Pool, 3.500%, 12/01/34 | | | 159,624 | |
See accompanying Notes to Financial Statements.
24
North Square Core Plus Bond Fund
Schedule of Investments (Unaudited) – Continued
November 30, 2024
| | Principal
Amount ($) | | | | Fair Value | |
| | | | | MORTGAGE-BACKED SECURITIES (continued) | | | | |
| | | 104,358 | | Fannie Mae Pool, 3.500%, 10/13/37 | | $ | 96,842 | |
| | | 192,304 | | Fannie Mae Pool, 4.500%, 07/01/40 | | | 190,019 | |
| | | 96,330 | | Fannie Mae Pool, 4.000%, 01/01/41 | | | 92,907 | |
| | | 195,572 | | Fannie Mae Pool, 5.000%, 11/01/46 | | | 195,100 | |
| | | 116,853 | | Fannie Mae Pool, 4.000%, 06/01/47 | | | 111,247 | |
| | | 113,794 | | Fannie Mae Pool, 3.500%, 09/01/49 | | | 102,208 | |
| | | 144,213 | | Fannie Mae Pool, 3.500%, 11/01/49 | | | 132,140 | |
| | | 79,419 | | Fannie Mae Pool, 3.000%, 09/01/50 | | | 70,388 | |
| | | 147,261 | | Fannie Mae Pool, 3.500%, 09/01/50 | | | 134,000 | |
| | | 65,522 | | Fannie Mae Pool, 2.500%, 05/01/51 | | | 55,662 | |
| | | 52,648 | | Fannie Mae Pool, 3.000%, 05/01/51 | | | 46,455 | |
| | | 92,995 | | Fannie Mae Pool, 2.500%, 06/01/51 | | | 79,028 | |
| | | 144,205 | | Fannie Mae Pool, 2.500%, 10/01/51 | | | 121,597 | |
| | | 141,217 | | Fannie Mae Pool, 5.500%, 09/01/56 | | | 146,115 | |
| | | 215,944 | | Fannie Mae REMICS Series 11, 5.000%, 02/25/51 | | | 215,408 | |
| | | 30,000 | | Federal Farm Credit Banks Funding Corp., 1.790%, 07/21/31 | | | 25,522 | |
| | | 64,000 | | Federal Farm Credit Banks Funding Corp., 1.730%, 09/02/31 | | | 54,031 | |
| | | 128,000 | | Federal Home Loan Banks, 2.170%, 10/29/29 | | | 116,410 | |
| | | 265,000 | | Federal Home Loan Banks, 2.375%, 01/28/32 | | | 230,660 | |
| | | 295,000 | | Federal Home Loan Banks, 5.920%, 05/23/34 | | | 295,800 | |
| | | 99,000 | | Federal Home Loan Mortgage Corp., 1.500%, 10/29/32 | | | 79,718 | |
| | | 30,000 | | Federal Home Loan Mortgage Corp., 1.460%, 08/17/35 | | | 22,018 | |
| | | 550,000 | | Federal National Mortgage Association, 1.600%, 08/24/35 | | | 410,140 | |
| | | 61,782 | | Freddie Mac Gold Pool, 4.000%, 08/01/45 | | | 58,896 | |
| | | 147,568 | | Freddie Mac Pool, 2.000%, 09/01/41 | | | 125,678 | |
| | | 298,107 | | Freddie Mac Pool, 2.000%, 11/01/41 | | | 254,804 | |
| | | 90,607 | | Freddie Mac Pool, 2.500%, 04/01/42 | | | 79,081 | |
| | | 67,777 | | Freddie Mac Pool, 3.000%, 05/01/42 | | | 60,677 | |
| | | 112,800 | | Freddie Mac Pool, 3.000%, 07/01/51 | | | 99,377 | |
| | | 82,267 | | Freddie Mac Pool, 2.500%, 02/01/52 | | | 69,500 | |
| | | 82,515 | | Freddie Mac Pool, 3.500%, 04/01/52 | | | 75,206 | |
| | | 260,193 | | Freddie Mac Pool, 3.000%, 05/01/52 | | | 229,158 | |
| | | 142,681 | | Freddie Mac Pool, 5.000%, 07/01/52 | | | 140,505 | |
| | | 162,974 | | Freddie Mac REMICS, 3.000%, 05/15/43 | | | 159,041 | |
| | | 199,949 | | Ginnie Mae II Pool, 2.500%, 08/20/50 | | | 169,144 | |
| | | 129,831 | | Ginnie Mae II Pool, 2.500%, 12/20/50 | | | 108,763 | |
| | | 204,644 | | Ginnie Mae II Pool, 2.000%, 03/20/51 | | | 165,121 | |
| | | 219,505 | | Ginnie Mae II Pool, 5.000%, 11/20/52 | | | 216,911 | |
| | | 213,047 | | Ginnie Mae II Pool, 5.500%, 09/01/53(a) | | | 214,774 | |
| | | 134,890 | | Government National Mortgage Association Series 65, 5.500%, 02/20/48 | | | 135,487 | |
| | | 43,647 | | Government National Mortgage Association Series 189, 2.500%, 10/20/51 | | | 36,243 | |
| | | 60,000 | | Government National Mortgage Association Series 8, 5.000%, 01/20/54 | | | 59,404 | |
| | | | | TOTAL MORTGAGE-BACKED SECURITIES (Cost $5,732,345) | | | 5,640,809 | |
| | | | | | | | | |
See accompanying Notes to Financial Statements.
25
North Square Core Plus Bond Fund
Schedule of Investments (Unaudited) – Continued
November 30, 2024
| | Principal
Amount ($) | | | | Fair Value | |
| | | | | NON U.S. GOVERNMENT & AGENCIES — 0.6% | | | | |
| | | | | SUPRANATIONAL — 0.6% | | | | |
| | | 147,000 | | International Bank for Reconstruction & Development, 2.700%, 12/28/37 | | $ | 117,216 | |
| | | | | TOTAL NON U.S. GOVERNMENT & AGENCIES (Cost $112,576) | | | 117,216 | |
| | | | | | | | | |
| | | | | U.S. GOVERNMENT & AGENCIES — 11.1% | | | | |
| | | | | U.S. TREASURY BONDS — 5.4% | | | | |
| | | 174,000 | | United States Treasury Note/Bond, 4.125%, 11/15/27 | | | 174,061 | |
| | | 172,000 | | United States Treasury Note/Bond, 3.625%, 09/30/31 | | | 166,867 | |
| | | 175,000 | | United States Treasury Note/Bond, 4.250%, 11/15/34 | | | 175,807 | |
| | | 229,000 | | United States Treasury Note/Bond, 4.625%, 11/15/44 | | | 233,741 | |
| | | 243,000 | | United States Treasury Note/Bond, 4.250%, 02/15/54 | | | 237,342 | |
| | | | | | | | 987,818 | |
| | | | | U.S. TREASURY NOTES — 5.7% | | | | |
| | | 188,000 | | United States Treasury Note/Bond, 4.625%, 09/15/26 | | | 189,304 | |
| | | 453,000 | | United States Treasury Note/Bond, 3.500%, 09/30/29 | | | 441,375 | |
| | | 158,000 | | United States Treasury Note/Bond, 4.125%, 10/31/29 | | | 158,265 | |
| | | 242,000 | | United States Treasury Note/Bond, 4.250%, 08/15/54 | | | 236,668 | |
| | | | | | | | 1,025,612 | |
| | | | | TOTAL U.S. GOVERNMENT & AGENCIES (Cost $2,013,512) | | | 2,013,430 | |
| | | | | | | | | |
| | | | | Description | | Contracts | | | Expiration
Date | | | Exercise Price | | | Notional Value | | | | | |
| | | | | PURCHASED CALL OPTIONS — 1.6% | | | | | | | | | | | | | | | | |
| | | | | E-mini S&P 500 Index | | | 50 | | | | 03/21/2025 | | | $ | 6,200 | | | $ | 15,128,750 | | | | 295,000 | |
| | | | | TOTAL PURCHASED CALL OPTIONS (Cost — $219,562) | | | | | | | | | | | 295,000 | |
| | | | | SHORT-TERM INVESTMENTS — 3.2% | | | | |
| | | 578,236 | | First American Treasury Obligations Fund, Class X, 4.55%(d) | | | 578,236 | |
| | | | | TOTAL SHORT-TERM INVESTMENTS (Cost $578,236) | | | 578,236 | |
| | | | | TOTAL INVESTMENTS — 100.2% (Cost $18,271,052) | | $ | 18,204,204 | |
| | | | | Liabilities in Excess of Other Assets — (0.2)% | | | (32,749 | ) |
| | | | | NET ASSETS — 100.0% | | $ | 18,171,455 | |
(a) | Variable rate security. Interest rate resets periodically. The rate shown is the effective interest rate as of November 30, 2024. For securities based on a published reference rate and spread, the reference rate and spread (in basis points) are indicated parenthetically. Certain variable rate securities are not based on a published reference rate and spread but are determined by the issuer or agent and are based on current market conditions. These securities, therefore, do not indicate a reference rate and spread. |
(b) | Security exempt from registration under Rule 144A or Section 4(2) of the Securities Act of 1933. The security may be resold in transactions exempt from registration, normally to qualified institutional buyers. As of November 30, 2024, the total market value of 144A securities is 3,570,641 or 19.6% of net assets. |
(c) | Rate disclosed is the seven day effective yield as of November 30, 2024. |
See accompanying Notes to Financial Statements.
26
North Square Core Plus Bond Fund
Schedule of Future COntracts (Unaudited)
November 30, 2024
Contracts | | Long Contracts | | | Expiration Date | | | Notional
Amount | | | Value and
Unrealized
Appreciation
(Depreciation) | |
2 | US Treasury Long Bond Futures | | | 03/21/2025 | | | $ | 239,000 | | | $ | 2,125 | |
5 | US Treasury Long Bond Futures | | | 03/21/2025 | | | | 635,938 | | | | 7,344 | |
| | | | | | | | | | | | | | | $ | 9,469 | |
| | Short Contracts | | | | | | | | | | |
(18) | E-Mini S&P 500 Future | | | 12/23/2024 | | | $ | (5,446,351 | ) | | $ | (106,338 | ) |
| | | | | | | | | | | | | | | $ | (106,338 | ) |
See accompanying Notes to Financial Statements.
27
North Square Kennedy MicroCap Fund
Schedule of Investments (Unaudited)
November 30, 2024
| | Shares | | | | Fair Value | |
| | | | | COMMON STOCKS — 95.2% | | | | |
| | | | | COMMUNICATIONS — 2.9% | | | | |
| | | | | ADVERTISING & MARKETING — 1.0% | | | | |
| | | 7,567 | | Magnite, Inc.(a) | | $ | 127,051 | |
| | | | | | | | | |
| | | | | COMMERCIAL SUPPORT SERVICES — 0.6% | | | | |
| | | 22,281 | | Advantage Solutions, Inc.(a) | | | 79,320 | |
| | | | | | | | | |
| | | | | ENTERTAINMENT CONTENT — 0.5% | | | | |
| | | 6,204 | | Inspired Entertainment, Inc.(a) | | | 59,682 | |
| | | | | | | | | |
| | | | | PUBLISHING & BROADCASTING — 0.8% | | | | |
| | | 5,973 | | Thryv Holdings, Inc.(a) | | | 94,493 | |
| | | | | TOTAL COMMUNICATIONS | | | 360,546 | |
| | | | | | | | | |
| | | | | CONSUMER DISCRETIONARY — 4.7% | | | | |
| | | | | CONSUMER SERVICES — 3.7% | | | | |
| | | 20,859 | | Legacy Education Inc.(a) | | | 171,252 | |
| | | 11,043 | | Universal Technical Institute, Inc.(a) | | | 285,683 | |
| | | | | | | | 456,935 | |
| | | | | HOUSEHOLD DURABLES — 0.4% | | | | |
| | | 4,265 | | Universal Electronics, Inc.(a) | | | 49,389 | |
| | | | | | | | | |
| | | | | LEISURE PRODUCTS — 0.2% | | | | |
| | | 1,614 | | Revelyst, Inc.(a) | | | 30,505 | |
| | | | | | | | | |
| | | | | RETAIL - DISCRETIONARY — 0.4% | | | | |
| | | 1,165 | | America’s Car-Mart, Inc.(a) | | | 53,776 | |
| | | | | TOTAL CONSUMER DISCRETIONARY | | | 590,605 | |
| | | | | | | | | |
| | | | | CONSUMER STAPLES — 3.7% | | | | |
| | | | | FOOD — 2.4% | | | | |
| | | 6,587 | | Nature’s Sunshine Products, Inc.(a) | | | 106,973 | |
| | | 24,891 | | SunOpta, Inc.(a) | | | 192,905 | |
| | | | | | | | 299,878 | |
| | | | | WHOLESALE - CONSUMER STAPLES — 1.3% | | | | |
| | | 3,536 | | Chefs’ Warehouse, Inc. (The)(a) | | | 158,095 | |
| | | | | TOTAL CONSUMER STAPLES | | | 457,973 | |
| | | | | | | | | |
| | | | | ENERGY — 5.0% | | | | |
| | | | | OIL & GAS PRODUCERS — 2.0% | | | | |
| | | 7,055 | | Riley Exploration Permian, Inc.(a) | | | 247,631 | |
| | | | | | | | | |
| | | | | OIL & GAS SERVICES & EQUIPMENT — 3.0% | | | | |
| | | 581 | | Flotek Industries, Inc.(a) | | | 4,939 | |
See accompanying Notes to Financial Statements.
28
North Square Kennedy MicroCap Fund
Schedule of Investments (Unaudited) – Continued
November 30, 2024
| | Shares | | | | Fair Value | |
| | | | | COMMON STOCKS (continued) |
| | | | | ENERGY (continued) | | | | |
| | | | | OIL & GAS SERVICES & EQUIPMENT (continued) |
| | | 26,332 | | MIND Technology, Inc.(a) | | $ | 102,695 | |
| | | 11,803 | | MRC Global, Inc.(a) | | | 164,887 | |
| | | 3,275 | | Thermon Group Holdings, Inc.(a) | | | 103,359 | |
| | | | | | | | 375,880 | |
| | | | | TOTAL ENERGY | | | 623,511 | |
| | | | | | | | | |
| | | | | FINANCIALS — 27.5% | | | | |
| | | | | ASSET MANAGEMENT — 0.8% | | | | |
| | | 6,569 | | Trinity Capital, Inc.(a) | | | 96,367 | |
| | | | | | | | | |
| | | | | BANKING — 12.5% | | | | |
| | | 5,757 | | Banc of California, Inc. | | | 99,193 | |
| | | 7,032 | | California BanCorp(a) | | | 126,013 | |
| | | 6,533 | | Capital Bancorp, Inc.(a) | | | 189,196 | |
| | | 9,997 | | Old Second Bancorp, Inc. | | | 185,944 | |
| | | 3,239 | | Origin Bancorp, Inc.(a) | | | 111,292 | |
| | | 9,237 | | Primis Financial Corp. | | | 115,463 | |
| | | 9,392 | | Southern States Bancshares, Inc.(a) | | | 349,569 | |
| | | 7,011 | | Third Coast Bancshares, Inc.(a) | | | 248,891 | |
| | | 4,212 | | Veritex Holdings, Inc. | | | 128,087 | |
| | | | | | | | 1,553,648 | |
| | | | | BANKS — 4.7% | | | | |
| | | 6,446 | | Carter Bankshares, Inc.(a) | | | 120,411 | |
| | | 6,639 | | Investar Holding Corp. | | | 158,141 | |
| | | 3,095 | | Northeast Bank(a) | | | 304,703 | |
| | | | | | | | 583,255 | |
| | | | | INSTITUTIONAL FINANCIAL SERVICES — 1.8% | | | | |
| | | 6,333 | | Amerant Bancorp, Inc.(a) | | | 157,502 | |
| | | 2,781 | | Perella Weinberg Partners | | | 71,388 | |
| | | | | | | | 228,890 | |
| | | | | INSURANCE — 3.2% | | | | |
| | | 18,378 | | Abacus Life, Inc.(a) | | | 150,332 | |
| | | 12,867 | | Crawford & Co.(a) | | | 152,474 | |
| | | 4,351 | | Tiptree, Inc.(a) | | | 99,159 | |
| | | | | | | | 401,965 | |
| | | | | SPECIALTY FINANCE — 3.6% | | | | |
| | | 2,138 | | Atlanticus Holdings Corp.(a) | | | 124,560 | |
| | | 3,640 | | Mid Penn Bancorp, Inc.(a) | | | 116,662 | |
| | | 52,508 | | Oportun Financial Corp.(a) | | | 208,982 | |
| | | | | | | | 450,204 | |
| | | | | THRIFTS & MORTGAGE FINANCE — 0.9% | | | | |
| | | 3,589 | | Timberland Bancorp, Inc.(a) | | | 116,248 | |
| | | | | TOTAL FINANCIALS | | | 3,430,577 | |
See accompanying Notes to Financial Statements.
29
North Square Kennedy MicroCap Fund
Schedule of Investments (Unaudited) – Continued
November 30, 2024
| | Shares | | | | Fair Value | |
| | | | | COMMON STOCKS (continued) |
| | | | | HEALTH CARE — 23.6% | | | | |
| | | | | BIOTECH & PHARMA — 8.6% | | | | |
| | | 5,880 | | Absci Corp.(a) | | $ | 17,934 | |
| | | 3,174 | | Acelyrin, Inc.(a) | | | 14,442 | |
| | | 418 | | ANI Pharmaceuticals, Inc.(a) | | | 23,922 | |
| | | 9,139 | | Annexon, Inc.(a) | | | 49,259 | |
| | | 2,940 | | Bicycle Therapeutics PLC - ADR(a) | | | 59,976 | |
| | | 8,127 | | Cogent Biosciences, Inc.(a) | | | 77,288 | |
| | | 7,205 | | CorMedix, Inc.(a) | | | 71,041 | |
| | | 3,006 | | Day One Biopharmaceuticals, Inc.(a) | | | 41,874 | |
| | | 24,956 | | Elutia, Inc.(a) | | | 103,318 | |
| | | 12,826 | | Exagen, Inc.(a) | | | 50,919 | |
| | | 4,274 | | iTeos Therapeutics, Inc.(a) | | | 36,543 | |
| | | 1,203 | | Janux Therapeutics, Inc.(a) | | | 54,388 | |
| | | 19,596 | | Kronos Bio, Inc.(a) | | | 18,616 | |
| | | 1,963 | | Oruka Therapeutics, Inc.(a) | | | 42,656 | |
| | | 49,392 | | Ovid therapeutics, Inc.(a) | | | 56,307 | |
| | | 1,550 | | Protagonist Therapeutics, Inc.(a) | | | 67,890 | |
| | | 1,762 | | Rigel Pharmaceuticals, Inc.(a) | | | 48,649 | |
| | | 11,364 | | Verastem, Inc.(a) | | | 60,684 | |
| | | 3,426 | | Verona Pharma PLC - ADR(a) | | | 135,771 | |
| | | 12,691 | | Xeris Biopharma Holdings, Inc.(a) | | | 41,626 | |
| | | | | | | | 1,073,103 | |
| | | | | BIOTECHNOLOGY — 1.7% | | | | |
| | | 543 | | Agios Pharmaceuticals, Inc.(a) | | | 32,249 | |
| | | 13,995 | | Aldeyra Therapeutics, Inc.(a) | | | 68,576 | |
| | | 22,113 | | Karyopharm Therapeutics, Inc.(a) | | | 18,688 | |
| | | 27,546 | | Puma Biotechnology, Inc.(a) | | | 93,380 | |
| | | | | | | | 212,893 | |
| | | | | HEALTH CARE FACILITIES & SERVICES — 3.8% | | | | |
| | | 25,881 | | Accolade, Inc.(a) | | | 99,901 | |
| | | 14,124 | | AdaptHealth Corp.(a) | | | 141,663 | |
| | | 9,206 | | DocGo, Inc.(a) | | | 39,862 | |
| | | 2,936 | | Fortrea Holdings, Inc.(a) | | | 61,803 | |
| | | 8,998 | | Owens & Minor, Inc.(a) | | | 121,203 | |
| | | 3,722 | | Quipt Home Medical Corp.(a) | | | 9,975 | |
| | | | | | | | 474,407 | |
| | | | | HEALTH CARE FACILITIES & SVCS — 0.8% | | | | |
| | | 996 | | U.S. Physical Therapy, Inc. | | | 98,365 | |
| | | | | | | | | |
| | | | | HEALTH CARE TECHNOLOGY — 1.4% | | | | |
| | | 19,658 | | Health Catalyst, Inc.(a) | | | 173,580 | |
| | | | | | | | | |
See accompanying Notes to Financial Statements.
30
North Square Kennedy MicroCap Fund
Schedule of Investments (Unaudited) – Continued
November 30, 2024
| | Shares | | | | Fair Value | |
| | | | | COMMON STOCKS (continued) |
| | | | | HEALTH CARE (continued) | | | | |
| | | | | MEDICAL EQUIPMENT & DEVICES — 6.5% | | | | |
| | | 4,995 | | AtriCure, Inc.(a) | | $ | 180,619 | |
| | | 15,087 | | Bioventus, Inc.(a) | | | 185,419 | |
| | | 2,436 | | CryoLife, Inc.(a) | | | 71,911 | |
| | | 9,072 | | Delcath Systems, Inc.(a) | | | 107,775 | |
| | | 483 | | ICU Medical, Inc.(a) | | | 79,193 | |
| | | 3,376 | | OrthoPediatrics Corp.(a) | | | 87,708 | |
| | | 4,710 | | Tactile Systems Technology, Inc.(a) | | | 92,033 | |
| | | | | | | | 804,658 | |
| | | | | PHARMACEUTICALS — 0.8% | | | | |
| | | 4,397 | | Avadel Pharmaceuticals PLC(a) | | | 48,631 | |
| | | 8,406 | | OptimizeRx Corp.(a) | | | 45,813 | |
| | | | | | | | 94,444 | |
| | | | | TOTAL HEALTH CARE | | | 2,931,450 | |
| | | | | | | | | |
| | | | | INDUSTRIALS — 9.9% | | | | |
| | | | | AEROSPACE & DEFENSE — 1.5% | | | | |
| | | 6,270 | | Park Aerospace Corp.(a) | | | 95,993 | |
| | | 4,927 | | Triumph Group, Inc.(a) | | | 94,845 | |
| | | | | | | | 190,838 | |
| | | | | COMMERCIAL SUPPORT SERVICES — 1.4% | | | | |
| | | 567 | | CRA International, Inc. | | | 110,582 | |
| | | 2,085 | | Healthcare Services Group, Inc.(a) | | | 25,729 | |
| | | 5,786 | | Quest Resource Holding Corp.(a) | | | 42,296 | |
| | | | | | | | 178,607 | |
| | | | | CONSTRUCTION & ENGINEERING — 0.4% | | | | |
| | | 2,456 | | NV5 Global, Inc.(a) | | | 53,443 | |
| | | | | | | | | |
| | | | | ELECTRICAL EQUIPMENT — 1.6% | | | | |
| | | 4,298 | | LSI Industries, Inc. | | | 87,850 | |
| | | 4,358 | | SMART Global Holdings, Inc.(a) | | | 79,054 | |
| | | 4,856 | | Stoneridge, Inc.(a) | | | 33,312 | |
| | | | | | | | 200,216 | |
| | | | | ENGINEERING & CONSTRUCTION — 0.1% | | | | |
| | | 1,967 | | Southland Holdings, Inc.(a) | | | 6,452 | |
| | | | | | | | | |
| | | | | INDUSTRIAL INTERMEDIATE PROD — 1.0% | | | | |
| | | 623 | | AZZ, Inc. | | | 58,026 | |
| | | 2,324 | | Insteel Industries, Inc. | | | 68,512 | |
| | | | | | | | 126,538 | |
| | | | | INDUSTRIAL SUPPORT SERVICES — 0.9% | | | | |
| | | 1,770 | | H&E Equipment Services, Inc. | | | 105,740 | |
| | | | | | | | | |
See accompanying Notes to Financial Statements.
31
North Square Kennedy MicroCap Fund
Schedule of Investments (Unaudited) – Continued
November 30, 2024
| | Shares | | | | Fair Value | |
| | | | | COMMON STOCKS (continued) |
| | | | | INDUSTRIALS (continued) | | | | |
| | | | | MACHINERY — 0.1% |
| | | 2,533 | | Titan International, Inc.(a) | | $ | 18,542 | |
| | | | | | | | | |
| | | | | PROFESSIONAL SERVICES — 1.6% | | | | |
| | | 3,712 | | Barrett Business Services, Inc. | | | 159,282 | |
| | | 317 | | VSE Corp.(a) | | | 37,171 | |
| | | | | | | | 196,453 | |
| | | | | TRANSPORTATION EQUIPMENT — 1.3% | | | | |
| | | 5,235 | | REV Group, Inc. | | | 162,390 | |
| | | | | TOTAL INDUSTRIALS | | | 1,239,219 | |
| | | | | | | | | |
| | | | | MATERIALS — 3.9% | | | | |
| | | | | CHEMICALS — 1.8% | | | | |
| | | 9,295 | | American Vanguard Corp.(a) | | | 55,863 | |
| | | 2,482 | | Koppers Holdings, Inc. | | | 95,457 | |
| | | 8,323 | | LSB Industries, Inc.(a) | | | 73,492 | |
| | | | | | | | 224,812 | |
| | | | | CONTAINERS & PACKAGING — 0.7% | | | | |
| | | 3,080 | | TriMas Corp.(a) | | | 81,374 | |
| | | | | | | | | |
| | | | | METALS & MINING — 1.4% | | | | |
| | | 875 | | Materion Corp. | | | 101,168 | |
| | | 1,643 | | Universal Stainless & Alloy Products, Inc.(a) | | | 72,982 | |
| | | | | | | | 174,150 | |
| | | | | TOTAL MATERIALS | | | 480,336 | |
| | | | | | | | | |
| | | | | REAL ESTATE — 3.1% | | | | |
| | | | | REIT – DIVERSIFIED — 1.5% | | | | |
| | | 5,534 | | CTO Realty Growth, Inc. | | | 112,949 | |
| | | | | | | | | |
| | | | | REIT – HOTELS & MOTELS — 0.9% | | | | |
| | | 19,715 | | Chatham Lodging Trust | | | 181,575 | |
| | | | | | | | | |
| | | | | REIT – INDUSTRIALS — 0.7% | | | | |
| | | 4,666 | | Plymouth Industrial REIT, Inc. | | | 87,441 | |
| | | | | TOTAL REAL ESTATE | | | 381,965 | |
| | | | | | | | | |
| | | | | TECHNOLOGY — 10.9% | | | | |
| | | | | ELECTRONIC EQUIPMENT, INSTRUMENTS & COMPONENTS — 2.0% | | | | |
| | | 10,002 | | Key Tronic Corp.(a) | | | 56,411 | |
| | | 26,794 | | Powerfleet, Inc.(a) | | | 188,630 | |
| | | | | | | | 245,041 | |
See accompanying Notes to Financial Statements.
32
North Square Kennedy MicroCap Fund
Schedule of Investments (Unaudited) – Continued
November 30, 2024
| | Shares | | | | Fair Value | |
| | | | | COMMON STOCKS (continued) |
| | | | | TECHNOLOGY (continued) | | | | |
| | | | | SEMICONDUCTORS & SEMICONDUCTOR EQUIPMENT — 0.3% | | | | |
| | | 3,910 | | Himax Technologies, Inc. - ADR(a) | | $ | 21,114 | |
| | | 5,179 | | MagnaChip Semiconductor Corp.(a) | | | 22,373 | |
| | | | | | | | 43,487 | |
| | | | | SOFTWARE — 4.3% | | | | |
| | | 8,143 | | Computer Programs & Systems, Inc.(a) | | | 146,167 | |
| | | 8,286 | | Evolent Health, Inc., Class A(a) | | | 107,055 | |
| | | 6,340 | | IBEX Ltd.(a) | | | 129,970 | |
| | | 4,153 | | Red Violet, Inc.(a) | | | 152,831 | |
| | | | | | | | 536,023 | |
| | | | | TECHNOLOGY HARDWARE — 2.9% | | | | |
| | | 2,782 | | Aviat Networks, Inc.(a) | | | 44,039 | |
| | | 11,625 | | Infinera Corp.(a) | | | 76,841 | |
| | | 3,546 | | Kornit Digital Ltd.(a) | | | 112,763 | |
| | | 10,571 | | PlayAGS, Inc.(a) | | | 122,835 | |
| | | | | | | | 356,478 | |
| | | | | TECHNOLOGY HARDWARE, STORAGE & PERIPHERALS — 0.2% | | | | |
| | | 9,871 | | Intevac, Inc.(a) | | | 27,540 | |
| | | | | | | | | |
| | | | | TECHNOLOGY SERVICES — 1.2% | | | | |
| | | 104,970 | | FiscalNote Holdings, Inc.(a) | | | 91,828 | |
| | | 5,695 | | Pagaya Technologies Ltd.(a) | | | 62,246 | |
| | | | | | | | 154,074 | |
| | | | | TOTAL TECHNOLOGY | | | 1,362,643 | |
| | | | | TOTAL COMMON STOCKS (Cost $9,676,110) | | | 11,858,825 | |
| | | | | | | | | |
| | | | | SHORT-TERM INVESTMENTS — 5.3% | | | | |
| | | 666,105 | | First American Treasury Obligations Fund, Class X, 4.55%(b) | | | 666,105 | |
| | | | | TOTAL SHORT-TERM INVESTMENTS (Cost $666,105) | | | 666,105 | |
| | | | | TOTAL INVESTMENTS — 100.5% (Cost $10,342,215) | | $ | 12,524,930 | |
| | | | | Liabilities in Excess of Other Assets — (0.5)% | | | (61,700 | ) |
| | | | | NET ASSETS — 100.0% | | $ | 12,463,230 | |
(a) | Non-income producing security. |
(b) | Rate disclosed is the seven day effective yield as of November 30, 2024. |
See accompanying Notes to Financial Statements.
33
Statements of Assets and Liabilities
As of November 30, 2024 (Unaudited)
| | North Square
Spectrum
Alpha Fund | | | North Square
Dynamic Small
Cap Fund | | | North Square
Multi Strategy
Fund | | | North Square
Preferred
and Income
Securities Fund | |
Assets | | | | | | | | | | | | | | | | |
Investments, at cost | | $ | 1,364,763 | | | $ | 359,365,854 | | | $ | 12,673,181 | | | $ | 238,191,228 | |
Investments in affiliated issuers, at cost | | | 65,287,546 | | | | — | | | | 20,321,893 | | | | — | |
Investments, at value | | $ | 11,579,326 | | | $ | 426,873,463 | | | $ | 16,468,044 | | | $ | 250,823,608 | |
Investments in affiliated issuers, at value | | | 75,595,214 | | | | — | | | | 25,895,336 | | | | — | |
Cash | | | — | | | | 11,610 | | | | — | | | | 232,254 | |
Receivable for fund shares sold | | | 17,877 | | | | 215,447 | | | | 449 | | | | 139,733 | |
Dividends and interest receivable | | | 1,561 | | | | 351,600 | | | | 1,428 | | | | 3,778,861 | |
Tax reclaims receivable | | | — | | | | — | | | | — | | | | 22,969 | |
Prepaid expenses | | | 32,152 | | | | 41,738 | | | | 26,533 | | | | 28,512 | |
Total Assets | | | 87,226,130 | | | | 427,493,858 | | | | 42,391,790 | | | | 255,025,937 | |
| | | | | | | | | | | | | | | | | |
Liabilities | | | | | | | | | | | | | | | | |
Payable for fund shares redeemed | | | 69,052 | | | | 96,687 | | | | 4,321 | | | | 8,539 | |
Payable for investments purchased | | | — | | | | 1,738,976 | | | | — | | | | 1,000,000 | |
Due to Adviser (Note 4) | | | 46,629 | | | | 248,827 | | | | 8,457 | | | | 158,299 | |
Distribution fees (Note 8) | | | 10,571 | | | | 10,528 | | | | 6,837 | | | | — | |
Shareholder servicing fees (Note 7) | | | 32,940 | | | | 8,126 | | | | 13,655 | | | | — | |
Fund administration fees | | | 41,887 | | | | 62,513 | | | | 19,554 | | | | 37,755 | |
Due to Trustees | | | 3,038 | | | | 8,879 | | | | 1,750 | | | | 4,958 | |
Other accrued expenses | | | 24,914 | | | | 40,550 | | | | 13,289 | | | | 970 | |
Total Liabilities | | | 229,031 | | | | 2,215,086 | | | | 67,863 | | | | 1,210,521 | |
| | | | | | | | | | | | | | | | | |
Net Assets | | $ | 86,997,099 | | | $ | 425,278,772 | | | $ | 42,323,927 | | | $ | 253,815,416 | |
| | | | | | | | | | | | | | | | | |
Net Assets consist of: | | | | | | | | | | | | | | | | |
Paid-in capital (par value of $0.01 per share with an unlimited number of shares authorized) | | | 69,844,348 | | | | 336,332,158 | | | | 31,341,530 | | | | 235,340,607 | |
Accumulated earnings | | | 17,152,721 | | | | 88,946,614 | | | | 10,982,397 | | | | 18,474,809 | |
Net Assets | | $ | 86,997,099 | | | $ | 425,278,772 | | | $ | 42,323,927 | | | $ | 253,815,416 | |
| | | | | | | | | | | | | | | | | |
Class A Shares: | | | | | | | | | | | | | | | | |
Net assets applicable to shares outstanding | | $ | 53,372,778 | | | $ | 53,373,511 | | | $ | 33,976,791 | | | | | |
Shares of beneficial interest issued and outstanding | | | 5,966,089 | | | | 3,092,591 | | | | 1,812,964 | | | | | |
Net asset value, redemption and offering price per share | | $ | 8.95 | | | $ | 17.26 | | | $ | 18.74 | | | | | |
Maximum sales charge (5.75% of offering price)* | | $ | 0.55 | | | $ | 1.05 | | | $ | 1.14 | | | | | |
Maximum offering price to public | | $ | 9.50 | | | $ | 18.31 | | | $ | 19.88 | | | | | |
Class I Shares: | | | | | | | | | | | | | | | | |
Net assets applicable to shares outstanding | | $ | 33,624,321 | | | $ | 371,905,261 | | | $ | 8,347,136 | | | $ | 253,815,415 | |
Shares of beneficial interest issued and outstanding | | | 2,863,594 | | | | 21,490,040 | | | | 407,808 | | | | 11,760,062 | |
Net asset value, redemption and offering price per share | | $ | 11.74 | | | $ | 17.31 | | | $ | 20.47 | | | $ | 21.58 | |
* | No sales charge applies on investments of $500,000 or more, but a Contingent Deferred Sales Charge (“CDSC”) of 1% will be imposed on certain redemptions of such shares within 12 months of the date of purchase. |
See accompanying Notes to Financial Statements.
34
Statements of Assets and Liabilities – Continued
As of November 30, 2024 (Unaudited)
| | North Square
Tactical Growth
Fund | | | North Square
Tactical
Defensive Fund | | | North Square
Core Plus
Bond Fund | | | North Square
Kennedy
MicroCap Fund | |
Assets | | | | | | | | | | | | | | | | |
Investments, at cost | | $ | 338,869,403 | | | $ | 50,850,363 | | | $ | 18,271,052 | | | $ | 10,342,215 | |
Investments, at value | | $ | 558,315,283 | | | $ | 57,628,536 | | | $ | 18,204,204 | | | $ | 12,524,930 | |
Cash | | | — | | | | — | | | | — | | | | — | |
Cash at broker for futures contracts | | | — | | | | — | | | | 92,113 | | | | — | |
Receivable for fund shares sold | | | 67,053 | | | | 1,076 | | | | — | | | | — | |
Receivable for investments sold | | | — | | | | — | | | | — | | | | 298 | |
Receivable for net variation margin on futures contracts | | | — | | | | — | | | | — | | | | — | |
Dividends and interest receivable | | | 132,252 | | | | 10,184 | | | | 139,617 | | | | 7,219 | |
Tax reclaims receivable | | | — | | | | — | | | | — | | | | — | |
Receivable from Adviser | | | — | | | | — | | | | 4,709 | | | | — | |
Receivable for interest sold | | | — | | | | — | | | | — | | | | — | |
Deferred offering costs | | | 1,706 | | | | 225 | | | | 136 | | | | — | |
Prepaid expenses | | | 38,825 | | | | 36,958 | | | | 32,070 | | | | — | |
Total Assets | | | 558,555,119 | | | | 57,676,979 | | | | 18,472,849 | | | | 12,532,447 | |
| | | | | | | | | | | | | | | | | |
Liabilities | | | | | | | | | | | | | | | | |
Bank overdraft | | | — | | | | — | | | | 26,788 | | | | — | |
Payable for fund shares redeemed | | | 71,874 | | | | 5,631 | | | | 460 | | | | — | |
Payable for distributions to shareholders | | | — | | | | — | | | | — | | | | — | |
Payable for investments purchased | | | — | | | | — | | | | 249,649 | | | | 307 | |
Due to Adviser (Note 4) | | | 469,257 | | | | 56,992 | | | | — | | | | 9,502 | |
Distribution fees (Note 8) | | | 70,919 | | | | 6,618 | | | | — | | | | — | |
Shareholder servicing fees (Note 7) | | | 102,395 | | | | 4,193 | | | | 5,604 | | | | 10,077 | |
Fund administration fees | | | 150,959 | | | | 21,304 | | | | 11,652 | | | | 27,526 | |
Due to Trustees | | | 18,830 | | | | 2,287 | | | | 960 | | | | 2,646 | |
Other accrued expenses | | | 114,113 | | | | 15,331 | | | | 6,281 | | | | 19,159 | |
Total Liabilities | | | 998,347 | | | | 112,356 | | | | 301,394 | | | | 69,217 | |
| | | | | | | | | | | | | | | | | |
Net Assets | | $ | 557,556,772 | | | $ | 57,564,623 | | | $ | 18,171,455 | | | $ | 12,463,230 | |
| | | | | | | | | | | | | | | | | |
Net Assets consist of: | | | | | | | | | | | | | | | | |
Paid-in capital | | | 330,481,516 | | | | 59,271,221 | | | | 15,594,545 | | | | 9,700,934 | |
Accumulated earnings (deficits) | | | 227,075,256 | | | | (1,706,598 | ) | | | 2,576,910 | | | | 2,762,296 | |
Net Assets | | $ | 557,556,772 | | | $ | 57,564,623 | | | $ | 18,171,545 | | | $ | 12,463,230 | |
See accompanying Notes to Financial Statements.
35
Statements of Assets and Liabilities – Continued
As of November 30, 2024 (Unaudited)
| | North Square
Tactical Growth
Fund | | | North Square
Tactical
Defensive Fund | | | North Square
Core Plus
Bond Fund | | | North Square
Kennedy
MicroCap Fund | |
Class A Shares: | | | | | | | | | | | | | | | | |
Net assets applicable to shares outstanding | | $ | 103,961,410 | | | $ | 20,090,143 | | | | | | | | | |
Shares of beneficial interest issued and outstanding | | | 6,342,996 | | | | 1,087,246 | | | | | | | | | |
Net asset value, redemption and offering price per share | | $ | 16.39 | | | $ | 18.48 | | | | | | | | | |
Maximum sales charge (5.75% of offering price)* | | $ | 1.00 | | | $ | 1.13 | | | | | | | | | |
Maximum offering price to public | | $ | 17.39 | | | $ | 19.61 | | | | | | | | | |
Class C Shares: | | | | | | | | | | | | | | | | |
Net assets applicable to shares outstanding | | $ | 61,571,752 | | | $ | 3,151,015 | | | | | | | | | |
Shares of beneficial interest issued and outstanding | | | 4,069,642 | | | | 192,118 | | | | | | | | | |
Net asset value, redemption and offering price per share | | $ | 15.13 | | | $ | 16.40 | | | | | | | | | |
Class I Shares: | | | | | | | | | | | | | | | | |
Net assets applicable to shares outstanding | | $ | 392,023,610 | | | $ | 34,323,465 | | | | 18,171,545 | | | $ | 12,463,230 | |
Shares of beneficial interest issued and outstanding | | | 23,323,147 | | | | 1,799,407 | | | | 1,713,769 | | | | 978,865 | |
Net asset value, redemption and offering price per share | | $ | 16.81 | | | $ | 19.07 | | | $ | 110.60 | | | $ | 12.73 | |
* | No sales charge applies on investments of $500,000 or more, but a Contingent Deferred Sales Charge (“CDSC”) of 1% will be imposed on certain redemptions of such shares within 12 months of the date of purchase. |
See accompanying Notes to Financial Statements.
36
Statements of Operations
For the Six Months Ended November 30, 2024 (Unaudited)
| | North Square
Spectrum
Alpha Fund | | | North Square
Dynamic Small
Cap Fund | | | North Square
Multi Strategy
Fund | | | North Square
Preferred
and Income
Securities Fund | |
Investment Income | | | | | | | | | | | | | | | | |
Dividend income | | $ | 14,255 | | | $ | 2,350,213 | | | $ | 314,121 | | | $ | — | |
Interest income | | | 16,199 | | | | 61,467 | | | | 10,348 | | | | 5,598,938 | |
Foreign dividend taxes withheld | | | — | | | | (8,824 | ) | | | — | | | | 22,969 | |
Total investment income | | | 30,454 | | | | 2,402,856 | | | | 324,469 | | | | 5,621,907 | |
| | | | | | | | | | | | | | | | | |
Expenses | | | | | | | | | | | | | | | | |
Adviser fees (Note 3) | | | 80,976 | | | | 1,449,175 | | | | 102,750 | | | | 756,855 | |
Distribution fees - Class A (Note 7) | | | 61,513 | | | | 59,456 | | | | 40,866 | | | | — | |
Transfer agent fees and expenses | | | 44,828 | | | | 5,429 | | | | 16,537 | | | | 723 | |
Fund administration fees | | | 35,135 | | | | 113,437 | | | | 18,683 | | | | 69,241 | |
Shareholder servicing fees - Class A (Note 6) | | | 29,526 | | | | 35,674 | | | | 16,346 | | | | — | |
Registration fees | | | 24,406 | | | | 33,903 | | | | 23,176 | | | | 20,288 | |
Shareholder servicing fees - Class I (Note 6) | | | 23,825 | | | | 41,172 | | | | 4,203 | | | | 20,181 | |
Legal fees | | | 6,910 | | | | 21,832 | | | | 3,452 | | | | 13,325 | |
Shareholder reporting fees | | | 6,284 | | | | 13,873 | | | | 2,446 | | | | 6,554 | |
Custody fees | | | 6,028 | | | | 13,024 | | | | 5,089 | | | | 8,526 | |
Trustees’ fees and expenses | | | 5,947 | | | | 17,771 | | | | 3,185 | | | | 10,970 | |
Audit fees | | | 4,293 | | | | 15,851 | | | | 2,367 | | | | 9,940 | |
Fund accounting fees | | | 3,761 | | | | 3,761 | | | | 3,761 | | | | 9,770 | |
Chief compliance officer fees (Note 3) | | | 2,891 | | | | 8,439 | | | | 1,451 | | | | 4,989 | |
Insurance | | | 1,603 | | | | 3,064 | | | | 751 | | | | 1,624 | |
Interest expense | | | 402 | | | | — | | | | — | | | | — | |
Pricing | | | 12 | | | | 2,095 | | | | 55 | | | | 3,442 | |
Other expenses | | | 10,338 | | | | 15,680 | | | | 6,600 | | | | 11,010 | |
Total expenses | | | 348,678 | | | | 1,853,636 | | | | 251,718 | | | | 947,438 | |
Fees contractually recouped (waived) by Adviser | | | 139,615 | | | | (193,987 | ) | | | (64,705 | ) | | | 39,524 | |
Net operating expenses | | | 488,293 | | | | 1,659,649 | | | | 187,013 | | | | 986,962 | |
Net investment income (loss) | | | (457,839 | ) | | | 743,207 | | | | 137,456 | | | | 4,634,945 | |
| | | | | | | | | | | | | | | | | |
Net Realized and Change in Unrealized Gain (Loss) on Investments | | | | | | | | | | | | | | | | |
Net realized gain (loss) on: | | | | | | | | | | | | | | | | |
Investments | | | 582,416 | | | | 16,063,055 | | | | 87,352 | | | | 4,208,962 | |
Affiliated issuers | | | 1,989,430 | | | | — | | | | 639,363 | | | | — | |
Futures contracts | | | — | | | | — | | | | — | | | | (114,263 | ) |
Foreign currency | | | — | | | | — | | | | — | | | | (36,626 | ) |
Net realized gain (loss) | | | 2,571,846 | | | | 16,063,055 | | | | 726,715 | | | | 4,058,073 | |
Net change in unrealized appreciation (depreciation) on: | | | | | | | | | | | | | | | | |
Investments | | | (190,513 | ) | | | 39,216,252 | | | | 1,607,814 | | | | 3,534,490 | |
Affiliated issuers | | | 12,177,322 | | | | — | | | | 1,682,830 | | | | — | |
Futures contracts | | | — | | | | — | | | | — | | | | 658,075 | |
Foreign currency | | | — | | | | — | | | | — | | | | (2,250 | ) |
Net change in unrealized appreciation | | | 11,986,809 | | | | 39,216,252 | | | | 3,290,644 | | | | 4,190,315 | |
Net realized and change in unrealized gain on investments and foreign currency | | | 14,558,655 | | | | 55,279,307 | | | | 4,017,359 | | | | 8,248,388 | |
Net increase in net assets resulting from operations | | $ | 14,100,816 | | | $ | 56,022,514 | | | $ | 4,154,815 | | | $ | 12,883,333 | |
See accompanying Notes to Financial Statements.
37
Statements of Operations – Continued
For the Six Months Ended November 30, 2024 (Unaudited)
| | North Square
Tactical Growth
Fund | | | North Square
Tactical
Defensive Fund | | | North Square
Core Plus
Bond Fund | | | North Square
Kennedy
MicroCap Fund | |
Investment Income | | | | | | | | | | | | | | | | |
Dividend income | | $ | 3,648,784 | | | $ | 471,818 | | | | 208,498 | | | $ | 36,766 | |
Interest income | | | 1,378,549 | | | | 104,835 | | | | 171,288 | | | | 8,414 | |
Foreign dividend taxes withheld | | | — | | | | — | | | | 571 | | | | (4 | ) |
Total investment income | | | 5,027,333 | | | | 576,653 | | | | — | | | | 45,176 | |
| | | | | | | | | | | | | | | | | |
Expenses | | | | | | | | | | | | | | | | |
Adviser fees (Note 3) | | | 2,838,017 | | | | 353,505 | | | | 90,430 | | | | 53,020 | |
Distribution fees - Class C (Note 7) | | | 301,072 | | | | 16,412 | | | | 4,792 | | | | — | |
Fund administration fees | | | 214,112 | | | | 25,324 | | | | 10,151 | | | | 16,689 | |
Shareholder servicing fees - Class I (Note 6) | | | 150,139 | | | | 24,828 | | | | 12,794 | | | | 6,628 | |
Distribution fees - Class A (Note 6) | | | 124,820 | | | | 25,218 | | | | 917 | | | | — | |
Transfer agent fees and expenses | | | 92,645 | | | | 13,710 | | | | 2,234 | | | | 9,539 | |
Legal fees | | | 44,209 | | | | 4,724 | | | | 1,597 | | | | 3,487 | |
Shareholder servicing fees - Class A (Note 6) | | | 34,950 | | | | 10,087 | | | | 440 | | | | (3,444 | ) |
Registration fees | | | 34,306 | | | | 37,296 | | | | 34,958 | | | | 13,118 | |
Trustees’ fees and expenses | | | 32,997 | | | | 4,133 | | | | 1,850 | | | | 2,947 | |
Audit fees | | | 28,460 | | | | 3,000 | | | | 1,003 | | | | 1,803 | |
Shareholder reporting fees | | | 25,401 | | | | 3,183 | | | | 1,651 | | | | 3,403 | |
Shareholder servicing fees - Class C (Note 6) | | | 21,076 | | | | 2,462 | | | | 671 | | | | — | |
Chief compliance officer fees (Note 3) | | | 18,125 | | | | 1,981 | | | | 678 | | | | 1,301 | |
Insurance | | | 9,980 | | | | 1,139 | | | | 501 | | | | 669 | |
Custody fees | | | 9,117 | | | | 4,364 | | | | 4,808 | | | | 4,253 | |
Fund accounting fees | | | 3,761 | | | | 3,761 | | | | 9,628 | | | | 3,629 | |
Pricing | | | 101 | | | | 62 | | | | 916 | | | | 892 | |
Other expenses | | | 27,913 | | | | 7,337 | | | | 5,120 | | | | 4,497 | |
Total expenses | | | 4,011,201 | | | | 542,526 | | | | 184,779 | | | | 125,875 | |
Fees contractually waived by Adviser | | | (92,192 | ) | | | (18,883 | ) | | | (73,951 | ) | | | (60,637 | ) |
Net operating expenses | | | 3,919,009 | | | | 523,643 | | | | 110,828 | | | | 65,238 | |
Net investment income (loss) | | | 1,108,324 | | | | 53,010 | | | | 269,529 | | | | (20,062 | ) |
| | | | | | | | | | | | | | | | | |
Net Realized and Change in Unrealized Gain (Loss) on Investments | | | | | | | | | | | | | | | | |
Net realized gain (loss) on: | | | | | | | | | | | | | | | | |
Investments | | | (895,229 | ) | | | (1,001,065 | ) | | | 5,159,694 | | | | 599,644 | |
Purchased Options | | | — | | | | — | | | | (21,938 | ) | | | — | |
Futures contracts | | | — | | | | — | | | | 37,9135 | | | | — | |
Net realized gain (loss) | | | (895,229 | ) | | | (1,001,065 | ) | | | 5,175,669 | | | | 599,644 | |
Net change in unrealized appreciation on: | | | | | | | | | | | | | | | | |
Investments | | | 55,263,065 | | | | 3,671,315 | | | | (4,626,231 | ) | | | 2,182,715 | |
Written Options | | | — | | | | — | | | | (282,781 | ) | | | — | |
Purchased Options | | | — | | | | — | | | | 800,504 | | | | — | |
Futures contracts | | | — | | | | — | | | | (96,869 | ) | | | — | |
Net change in unrealized appreciation | | | 55,263,065 | | | | 3,671,315 | | | | (4,205,377 | ) | | | 2,182,715 | |
Net realized and change in unrealized gain on investments and foreign currency | | | 54,367,836 | | | | 2,670,250 | | | | 970,292 | | | | 2,782,359 | |
Net increase in net assets resulting from operations | | $ | 55,476,160 | | | $ | 2,723,260 | | | | 1,239,821 | | | $ | 2,762,297 | |
See accompanying Notes to Financial Statements.
38
Statements of Changes in Net Assets
| | | North Square Spectrum Alpha Fund | | | North Square Dynamic
Small Cap Fund | |
| | | For the
Six Months
Ended
November 30,
2024
(Unaudited) | | | For the
Year Ended
May 31,
2024 | | | For the
Six Months
Ended
November 30,
2024
(Unaudited) | | | For the
Year Ended
May 31,
2024 | |
Increase (Decrease) in Net Assets due to: | | | | | | | | | | | | | | | | |
Operations | | | | | | | | | | | | | | | | |
Net investment income (loss) | | $ | (457,839 | ) | | $ | (660,029 | ) | | $ | 743,207 | | | $ | 174,509 | |
Net realized gain (loss) on investments and foreign currency translations | | | 2,571,846 | | | | (2,841,220 | ) | | | 16,063,055 | | | | 17,803,088, | |
Net change in unrealized appreciation on investments and foreign currency translations | | | 11,986,809 | | | | 23,365,620 | | | | 39,216,252 | | | | 25,883,930 | |
Net increase in net assets resulting from operations | | | 14,100,816 | | | | 19,864,371 | | | | 56,022,514 | | | | 43,861,527 | |
| | | | | | | | | | | | | | | | | |
Distributions to Shareholders | | | | | | | | | | | | | | | | |
Class A | | | — | | | | — | | | | — | | | | (43,484 | ) |
Class I | | | — | | | | — | | | | — | | | | (213,029 | ) |
Total distributions | | | — | | | | — | | | | — | | | | (256,513 | ) |
| | | | | | | | | | | | | | | | | |
Capital Transactions - Class A | | | | | | | | | | | | | | | | |
Proceeds from shares sold | | | 508,611 | | | | 1,576,816 | | | | 3,215,121 | | | | 38,833,380 | |
Reinvestment of distributions | | | — | | | | — | | | | — | | | | 43,473 | |
Amount paid for shares redeemed | | | (4,217,130 | ) | | | (9,453,686 | ) | | | (2,855,602 | ) | | | (5,156,994 | ) |
Total Class A | | | (3,708,519 | ) | | | (7,876,870 | ) | | | 359,519 | | | | 33,719,859 | |
Capital Transactions - Class I | | | | | | | | | | | | | | | | |
Proceeds from shares sold | | | 441,917 | | | | 3,630,776 | | | | 148,429,747 | | | | 114,015,380 | |
Reinvestment of distributions | | | — | | | | — | | | | — | | | | 212,781 | |
Amount paid for shares redeemed | | | (5,437,123 | ) | | | (7,340,364 | ) | | | (28,424,495 | ) | | | (21,384,160 | ) |
Total Class I | | | (4,995,206 | ) | | | (3,709,588 | ) | | | 120,005,252 | | | | 92,844,001 | |
Net increase (decrease) in net assets resulting from capital transactions | | | (8,703,725 | ) | | | (11,586,458 | ) | | | 120,364,771 | | | | 126,563,860 | |
Total Increase in Net Assets | | | 5,397,091 | | | | 8,277,913 | | | | 176,387,285 | | | | 170,168,874 | |
| | | | | | | | | | | | | | | | | |
Net Assets | | | | | | | | | | | | | | | | |
Beginning of period | | | 81,600,008 | | | | 73,322,095 | | | | 248,891,487 | | | | 78,722,613 | |
End of period | | $ | 86,997,099 | | | $ | 81,600,008 | | | $ | 425,278,772 | | | $ | 248,891,487 | |
| | | | | | | | | | | | | | | | | |
Share Transactions - Class A | | | | | | | | | | | | | | | | |
Shares sold | | | 64,097 | | | | 239,895 | | | | 205,082 | | | | 3,254,039 | |
Shares issued in reinvestment of distributions | | | — | | | | — | | | | — | | | | 3,136 | |
Shares redeemed | | | (531,151 | ) | | | (1,386,077 | ) | | | (184,611 | ) | | | (377,252 | ) |
Total Class A | | | (467,054 | ) | | | (1,146,182 | ) | | | 20,471 | | | | 2,879,923 | |
| | | | | | | | | | | | | | | | | |
Share Transactions - Class I | | | | | | | | | | | | | | | | |
Shares sold | | | 42,226 | | | | 422,819 | | | | 9,478,274 | | | | 8,573,875 | |
Shares issued in reinvestment of distributions | | | — | | | | — | | | | — | | | | 15,352 | |
Shares redeemed | | | (522,501 | ) | | | (826,174 | ) | | | (1,842,110 | ) | | | (1,606,084 | ) |
Total Class I | | | (480,275 | ) | | | (403,355 | ) | | | 7,636,164 | | | | 6,983,143 | |
| | | | | | | | | | | | | | | | | |
Net increase (decrease) in shares outstanding | | | (947,329 | ) | | | (1,549,537 | ) | | | 7,656,635 | | | | 9,863,066 | |
See accompanying Notes to Financial Statements.
39
Statements of Changes in Net Assets – Continued
| | | North Square Multi Strategy Fund | |
| | | For the
Six Months
Ended
November 30,
2024
(Unaudited) | | | For the
Year Ended
May 31,
2024 | |
Increase (Decrease) in Net Assets due to: | | | | | | | | |
Operations | | | | | | | | |
Net investment income | | $ | 137,456 | | | $ | 351,454 | |
Net realized gain on investments and foreign currency translations | | | 726,715 | | | | 544,193 | |
Net change in unrealized appreciation on investments and foreign currency translations | | | 3,290,644 | | | | 6,827,212 | |
Net increase in net assets resulting from operations | | | 4,154,815 | | | | 7,742,859 | |
| | | | | | | | | |
Distributions to Shareholders | | | | | | | | |
Class A | | | — | | | | (371,931 | ) |
Class I | | | — | | | | (126,915 | ) |
Total distributions | | | — | | | | (498,846 | ) |
| | | | | | | | | |
Capital Transactions - Class A | | | | | | | | |
Proceeds from shares sold | | | 149,067 | | | | 575,113 | |
Reinvestment of distributions | | | — | | | | 357,964 | |
Amount paid for shares redeemed | | | (1,537,894 | ) | | | (4,964,468 | ) |
Total Class A | | | (1,388,827 | ) | | | (4,031,391 | ) |
Capital Transactions - Class I | | | | | | | | |
Proceeds from shares sold | | | 585,165 | | | | 2,470,536 | |
Reinvestment of distributions | | | — | | | | 123,201 | |
Amount paid for shares redeemed | | | (1,515,511 | ) | | | (4,171,290 | ) |
Total Class I | | | (930,346 | ) | | | (1,577,553 | ) |
Net decrease in net assets resulting from capital transactions | | | (2,319,173 | ) | | | (5,608,944 | ) |
Total Increase in Net Assets | | | 1,835,642 | | | | 1,635,069 | |
| | | | | | | | | |
Net Assets | | | | | | | | |
Beginning of period | | | 40,488,285 | | | | 38,853,216 | |
End of period | | $ | 42,323,927 | | | $ | 40,488,285 | |
| | | | | | | | | |
Share Transactions - Class A | | | | | | | | |
Shares sold | | | 8,488 | | | | 37,274 | |
Shares issued in reinvestment of distributions | | | — | | | | 22,387 | |
Shares redeemed | | | (87,405 | ) | | | (315,990 | ) |
Total Class A | | | (78,917 | ) | | | (256,329 | ) |
| | | | | | | | | |
Share Transactions - Class I | | | | | | | | |
Shares sold | | | 30,306 | | | | 145,423 | |
Shares issued in reinvestment of distributions | | | — | | | | 7,068 | |
Shares redeemed | | | (78,310 | ) | | | (242,272 | ) |
Total Class I | | | (48,004 | ) | | | (89,781 | ) |
| | | | | | | | | |
Net decrease in shares outstanding | | | (126,921 | ) | | | (346,110 | ) |
See accompanying Notes to Financial Statements.
40
Statements of Changes in Net Assets – Continued
| | | North Square Preferred and
Income Securities Fund | | | North Square Tactical Growth Fund | |
| | | For the
Six Months
Ended
November 30,
2024
(Unaudited) | | | For the
Year Ended
May 31,
2024 | | | For the
Six Months
Ended
November 30,
2024
(Unaudited) | | | For the
Year Ended
May 31,
2024 | |
Increase (Decrease) in Net Assets due to: | | | | | | | | | | | | | | | | |
Operations | | | | | | | | | | | | | | | | |
Net investment income | | $ | 4,634,945 | | | $ | 4,233,578 | | | $ | 1,108,324 | | | $ | 3,211,349 | |
Net realized gain (loss) on investments and foreign currency translations | | | 4,058,073 | | | | 2,775,248 | | | | (895,229 | ) | | | 12,872,568 | |
Net change in unrealized appreciation on investments and foreign currency translations | | | 4,190,315 | | | | 9,175,381 | | | | 55,263,065 | | | | 61,867,791 | |
Net increase in net assets resulting from operations | | | 12,883,333 | | | | 16,184,207 | | | | 55,476,160 | | | | 77,951,708 | |
| | | | | | | | | | | | | | | | | |
Distributions to Shareholders | | | | | | | | | | | | | | | | |
From Earnings | | | | | | | | | | | | | | | | |
Class A | | | — | | | | — | | | | — | | | | (701,954 | ) |
Class C | | | — | | | | — | | | | — | | | | — | |
Class I | | | (4,422,788 | ) | | | (3,314,596 | ) | | | — | | | | (3,377,358 | ) |
From Return of Capital | | | | | | | | | | | | | | | | |
Class A | | | — | | | | — | | | | — | | | | — | |
Class C | | | — | | | | — | | | | — | | | | — | |
Class I | | | — | | | | (839,988 | ) | | | — | | | | — | |
Total distributions | | | (4,422,788 | ) | | | (4,154,584 | ) | | | — | | | | (4,079,312 | ) |
| | | | | | | | | | | | | | | | | |
Capital Transactions - Class A | | | | | | | | | | | | | | | | |
Proceeds from shares sold | | | | | | | | | | | 8,971,205 | | | | 21,245,150 | |
Proceeds from redemption fees(a) | | | | | | | | | | | — | | | | 770 | |
Reinvestment of distributions | | | | | | | | | | | — | | | | 629,468 | |
Amount paid for shares redeemed | | | | | | | | | | | (9,636,169 | ) | | | (26,357,167 | ) |
Total Class A | | | | | | | | | | | (664,964 | ) | | | (4,481,779 | ) |
Capital Transactions - Class C | | | | | | | | | | | | | | | | |
Proceeds from shares sold | | | | | | | | | | | 1,761,040 | | | | 4,230,080 | |
Reinvestment of distributions | | | | | | | | | | | — | | | | — | |
Amount paid for shares redeemed | | | | | | | | | | | (6,187,049 | ) | | | (24,963,389 | ) |
Total Class C | | | | | | | | | | | (4,426,009 | ) | | | (20,733,309 | ) |
Capital Transactions - Class I | | | | | | | | | | | | | | | | |
Proceeds from shares sold | | | 119,759,706 | | | | 104,780,929 | | | | 22,138,542 | | | | 65,165,888 | |
Reinvestment of distributions | | | 4,422,789 | | | | 4,154,584 | | | | — | | | | 2,972,288 | |
Amount paid for shares redeemed | | | (23,213,527 | ) | | | (23,156,057 | ) | | | (30,399,210 | ) | | | (72,805,759 | ) |
Total Class I | | | 100,968,968 | | | | 85,779,456 | | | | (8,260,668 | ) | | | (4,667,583 | ) |
Net increase (decrease) in net assets resulting from capital transactions | | | 100,968,968 | | | | 85,779,456 | | | | (13,351,641 | ) | | | (29,882,671 | ) |
Total Increase in Net Assets | | | 109,429,513 | | | | 97,809,079 | | | | 42,124,519 | | | | 43,989,725 | |
| | | | | | | | | | | | | | | | | |
Net Assets | | | | | | | | | | | | | | | | |
Beginning of period | | | 144,385,903 | | | | 46,576,824 | | | | 515,432,253 | | | | 471,442,528 | |
End of period | | $ | 253,815,416 | | | $ | 144,385,903 | | | $ | 557,556,772 | | | $ | 515,432,253 | |
| | | | | | | | | | | | | | | | | |
See accompanying Notes to Financial Statements.
41
Statements of Changes in Net Assets – Continued
| | | North Square Preferred and
Income Securities Fund | | | North Square Tactical Growth Fund | |
| | | For the
Six Months
Ended
November 30,
2024
(Unaudited) | | | For the
Year Ended
May 31,
2024 | | | For the
Six Months
Ended
November 30,
2024
(Unaudited) | | | For the
Year Ended
May 31,
2024 | |
Share Transactions - Class A | | | | | | | | | | | | | | | | |
Shares sold | | | | | | | | | | | 585,124 | | | | 1,577,034 | |
Shares issued in reinvestment of distributions | | | | | | | | | | | — | | | | 45,647 | |
Shares redeemed | | | | | | | | | | | (620,395 | ) | | | (1,936,331 | ) |
Total Class A | | | | | | | | | | | (35,271 | ) | | | (313,650 | ) |
| | | | | | | | | | | | | | | | | |
Share Transactions - Class C | | | | | | | | | | | | | | | | |
Shares sold | | | | | | | | | | | 122,307 | | | | 329,200 | |
Shares issued in reinvestment of distributions | | | | | | | | | | | — | | | | — | |
Shares redeemed | | | | | | | | | | | (434,749 | ) | | | (1,995,428 | ) |
Total Class C | | | | | | | | | | | (312,442 | ) | | | (1,666,228 | ) |
| | | | | | | | | | | | | | | | | |
Share Transactions - Class I | | | | | | | | | | | | | | | | |
Shares sold | | | 5,658,171 | | | | 5,370,868 | | | | 1,392,318 | | | | 4,663,326 | |
Shares issued in reinvestment of distributions | | | 207,716 | | | | 214,556 | | | | — | | | | 210,651 | |
Shares redeemed | | | (1,090,616 | ) | | | (1,208,295 | ) | | | (1,911,782 | ) | | | (5,171,853 | ) |
Total Class I | | | 4,775,271 | | | | 4,377,129 | | | | (519,464 | ) | | | (297,876 | ) |
| | | | | | | | | | | | | | | | | |
Net increase (decrease) in shares outstanding | | | 4,775,271 | | | | 4,377,129 | | | | (867,177 | ) | | | (2,277,754 | ) |
See accompanying Notes to Financial Statements.
42
Statements of Changes in Net Assets – Continued
| | | North Square Tactical
Defensive Fund | | | North Square Core Plus Bond Fund | |
| | | For the
Six Months
Ended
November 30,
2024
(Unaudited) | | | For the
Year Ended
May 31,
2024 | | | For the
Six Months
Ended
November 30,
2024
(Unaudited) | | | For the
Year Ended
May 31,
2024 | |
Increase (Decrease) in Net Assets due to: | | | | | | | | | | | | | | | | |
Operations | | | | | | | | | | | | | | | | |
Net investment income | | $ | 53,010 | | | $ | 544,283 | | | $ | 269,529 | | | $ | 416,796 | |
Net realized gain (loss) on investments | | | (1,001,065 | ) | | | 4,094,815 | | | | 5,175,669 | | | | (17,094 | ) |
Net change in unrealized appreciation (depreciation) on investments | | | 3,671,315 | | | | 3,185,548 | | | | (4,205,377 | ) | | | (440,424 | ) |
Net increase (decrease) in net assets resulting from operations | | | 2,723,260 | | | | 7,824,646 | | | | 1,239,821 | | | | (40,722 | ) |
| | | | | | | | | | | | | | | | | |
Distributions to Shareholders | | | | | | | | | | | | | | | | |
Class A | | | — | | | | — | | | | — | | | | (28,157 | ) |
Class C | | | — | | | | — | | | | — | | | | (13,206 | ) |
Class I | | | — | | | | — | | | | (378,016 | ) | | | (369,458 | ) |
Total distributions | | | — | | | | — | | | | (378,016 | ) | | | (410,821 | ) |
| | | | | | | | | | | | | | | | | |
Capital Transactions - Class A | | | | | | | | | | | | | | | | |
Proceeds from shares sold | | | 162,552 | | | | 818,462 | | | | | | | | 596,335 | |
Reinvestment of distributions | | | — | | | | — | | | | | | | | 27,840 | |
Amount paid for shares redeemed | | | (1,458,119 | ) | | | (3,413,638 | ) | | | | | | | (807,600 | ) |
Total Class A | | | (1,295,567 | | | | (2,595,176 | ) | | | | | | | (183,425 | ) |
Capital Transactions - Class C | | | | | | | | | | | | | | | | |
Proceeds from shares sold | | | 72,900 | | | | 94,402 | | | | | | | | — | |
Reinvestment of distributions | | | — | | | | — | | | | | | | | 13,206 | |
Amount paid for shares redeemed | | | (377,269 | ) | | | (1,223,271 | ) | | | | | | | (1,233,778 | ) |
Total Class C | | | (304,369 | ) | | | (1,128,869 | ) | | | | | | | (1,220,572 | ) |
Capital Transactions - Class I | | | | | | | | | | | | | | | | |
Proceeds from shares sold | | | 2,051,371 | | | | 2,439,688 | | | | 1,099 | | | | 1,098,323 | |
Reinvestment of distributions | | | — | | | | — | | | | 788,521 | | | | 369,457 | |
Amount paid for shares redeemed | | | (1,306,363 | ) | | | (11,399,115 | ) | | | (2,112,811 | ) | | | (7,775,863 | ) |
Total Class I | | | 745,008 | | | | (8,959,427 | ) | | | (1,323,191 | ) | | | (6,308,083 | ) |
Net decrease in net assets resulting from capital transactions | | | (854,928 | ) | | | (12,683,472 | ) | | | (1,323,191 | ) | | | (7,712,080 | ) |
Total Decrease in Net Assets | | | 1,868,332 | | | | (4,858,826 | ) | | | (461,386 | ) | | | (8,163,623 | ) |
| | | | | | | | | | | | | | | | | |
Net Assets | | | | | | | | | | | | | | | | |
Beginning of year | | | 55,696,291 | | | | 60,555,117 | | | | 18,632,841 | | | | 26,796,464 | |
End of year | | $ | 57,564,623 | | | $ | 55,696,291 | | | $ | 18,171,455 | | | $ | 18,632,841 | |
| | | | | | | | | | | | | | | | | |
See accompanying Notes to Financial Statements.
43
Statements of Changes in Net Assets – Continued
| | | North Square Tactical
Defensive Fund | | | North Square Core Plus Bond Fund | |
| | | For the
Six Months
Ended
November 30,
2024
(Unaudited) | | | For the
Year Ended
May 31,
2024 | | | For the
Six Months
Ended
November 30,
2024
(Unaudited) | | | For the
Year Ended
May 31,
2024 | |
Share Transactions - Class A | | | | | | | | | | | | | | | | |
Shares sold | | | 9,180 | | | | 51,284 | | | | | | | | 58,803 | |
Shares issued in reinvestment of distributions | | | — | | | | — | | | | | | | | 2,793 | |
Shares redeemed | | | (81,698 | ) | | | (208,049 | ) | | | | | | | (79,887 | ) |
Total Class A | | | (72,518 | ) | | | (156,765 | ) | | | | | | | (18,291 | ) |
| | | | | | | | | | | | | | | | | |
Share Transactions - Class C | | | | | | | | | | | | | | | | |
Shares sold | | | 4,576 | | | | 6,527 | | | | | | | | — | |
Shares issued in reinvestment of distributions | | | — | | | | — | | | | | | | | 1,361 | |
Shares redeemed | | | (23,668 | ) | | | (84,627 | ) | | | | | | | (125,752 | ) |
Total Class C | | | (19,092 | ) | | | (78,100 | ) | | | | | | | (124,391 | ) |
| | | | | | | | | | | | | | | | | |
Share Transactions - Class I | | | | | | | | | | | | | | | | |
Shares sold | | | 111,064 | | | | 145,990 | | | | 289,604 | | | | 108,405 | |
Shares issued in reinvestment of distributions | | | — | | | | — | | | | 35,763 | | | | 36,835 | |
Shares redeemed | | | (70,326 | ) | | | (673,086 | ) | | | (195,233 | ) | | | (765,198 | ) |
Total Class I | | | 40,738 | | | | (527,096 | ) | | | 130,134 | | | | (619,958 | ) |
| | | | | | | | | | | | | | | | | |
Net increase (decrease) in shares outstanding | | | (50,872 | ) | | | (761,961 | ) | | | 130,134 | | | | (762,640 | ) |
See accompanying Notes to Financial Statements.
44
Statements of Changes in Net Assets – Continued
| | | North Square
Kennedy
MicroCap Fund | |
| | | For the
Period Ended
November 30,
2024(a)
(Unaudited) | |
Increase (Decrease) in Net Assets due to: | | | | |
Operations | | | | |
Net investment loss | | $ | (20,062 | ) |
Net realized gain on investments and foreign currency translations | | | 599,644 | |
Net change in unrealized appreciation on investments and foreign currency translations | | | 2,182,714 | |
Net increase in net assets resulting from operations | | | 2,762,296 | |
| | | | | |
Distributions to Shareholders | | | | |
Capital Transactions - Class I | | | | |
Proceeds from shares sold | | | 9,700,934 | |
Total Class I | | | 9,700,934 | |
Net increase in net assets resulting from capital transactions | | | 9,700,934 | |
Total Increase in Net Assets | | | 12,463,230 | |
| | | | | |
Net Assets | | | | |
Beginning of period | | | — | |
End of period | | $ | 12,463,230 | |
| | | | | |
Share Transactions - Class I | | | | |
Shares sold | | | 978,865 | |
Total Class I | | | 978,865 | |
| | | | | |
Net increase in shares outstanding | | | 978,865 | |
| | | | | |
(a) | For the period June 10, 2024 (commencement of operations) to November 30, 2024. |
See accompanying Notes to Financial Statements.
45
North Square Spectrum Alpha Fund
Financial Highlights
Class A
(For a share outstanding during each period)
| | | For the
Six Months
Ended
November 30,
2024 | | | For the Years Ended May 31, | |
| | | (Unaudited) | | | 2024 | | | 2023 | | | 2022 | | | 2021 | | | 2020 | |
Selected Per Share Data: | | | | | | | | | | | | | | | | | | | | | | | | |
Net asset value, beginning of period | | $ | 7.54 | | | $ | 5.88 | | | $ | 10.78 | | | $ | 15.36 | | | $ | 12.07 | | | $ | 13.89 | |
| | | | | | | | | | | | | | | | | | | | | | | | | |
Investment operations: | | | | | | | | | | | | | | | | | | | | | | | | |
Net investment loss(a) | | | (0.05 | ) | | | (0.06 | )(b) | | | (0.09 | )(b) | | | (0.19 | )(b) | | | (0.17 | ) | | | (0.15 | ) |
Net realized and unrealized gain (loss) | | | 1.46 | | | | 1.72 | | | | (0.28 | ) | | | (2.26 | ) | | | 5.34 | | | | 0.44 | |
Total from investment operations | | | 1.41 | | | | 1.66 | | | | (0.37 | ) | | | (2.45 | ) | | | 5.17 | | | | 0.29 | |
| | | | | | | | | | | | | | | | | | | | | | | | | |
Less distributions: | | | | | | | | | | | | | | | | | | | | | | | | |
From net realized gains | | | — | | | | — | | | | (4.53 | ) | | | (2.13 | ) | | | (1.88 | ) | | | (2.11 | ) |
Total distributions | | | — | | | | — | | | | (4.53 | ) | | | (2.13 | ) | | | (1.88 | ) | | | (2.11 | ) |
| | | | | | | | | | | | | | | | | | | | | | | | | |
Net asset value, end of period | | $ | 8.95 | | | $ | 7.54 | | | $ | 5.88 | | | $ | 10.78 | | | $ | 15.36 | | | $ | 12.07 | |
| | | | | | | | | | | | | | | | | | | | | | | | | |
Total Return(c) | | | 18.70 | %(d) | | | 28.23 | % | | | (2.25 | )% | | | (19.05 | )% | | | 43.47 | % | | | 1.16 | % |
| | | | | | | | | | | | | | | | | | | | | | | | | |
Ratios and Supplemental Data: | | | | | | | | | | | | | | | | | | | | | | | | |
Net assets, end of period (in thousands) | | $ | 53,373 | | | $ | 48,531 | | | $ | 44,532 | | | $ | 56,319 | | | $ | 87,291 | | | $ | 73,973 | |
Ratio of expenses to average net assets: | | | | | | | | | | | | | | | | | | | | | | | | |
Before fee waived(g) | | | 0.94 | %(e) | | | 0.94 | % | | | 0.92 | % | | | 1.34 | % | | | 1.75 | % | | | 2.06 | % |
After fees waived(g) | | | 1.30 | %(e) | | | 1.30 | % | | | 1.30 | % | | | 1.36 | %(f) | | | 1.39 | % | | | 1.39 | % |
Ratio of net investment loss to average net assets: | | | | | | | | | | | | | | | | | | | | | | | | |
Before fees waived(g) | | | (0.87 | )%(e) | | | (0.56 | )% | | | (0.70 | )% | | | (1.29 | )% | | | (1.54 | )% | | | (1.78 | )% |
After fees waived(g) | | | (1.23 | )%(e) | | | (0.93 | )% | | | (1.07 | )% | | | (1.31 | )% | | | (1.18 | )% | | | (1.11 | )% |
Portfolio turnover rate(h) | | | 14 | %(d) | | | 11 | % | | | 7 | % | | | 104 | % | | | 33 | % | | | 38 | % |
(a) | Based on average shares outstanding for the period. |
(b) | Recognition of net investment income by the Fund is affected by the timing of the declaration of dividends by the underlying investment companies in which the Fund invests. The ratio does not include net investment income of the investment companies in which the Fund invests. |
(c) | Total returns would have been lower had expenses not been waived by the Adviser. Returns shown do not reflect the deduction of taxes that a shareholder would pay on Fund distributions or the redemption of Fund shares. |
(f) | Effective January 11, 2022, the expense cap decreased from 1.39% to 1.30%. |
(g) | Does not include expenses of the investment companies in which the Fund invests. |
(h) | Portfolio turnover is calculated on the basis of the Fund as a whole, without distinguishing among the classes of shares. |
See accompanying Notes to Financial Statements.
46
North Square Spectrum Alpha Fund
Financial Highlights
Class I
(For a share outstanding during each period)
| | | For the
Six Months
Ended
November 30,
2024 | | | For the Years Ended May 31, | |
| | | (Unaudited) | | | 2024 | | | 2023 | | | 2022 | | | 2021 | | | 2020 | |
Selected Per Share Data: | | | | | | | | | | | | | | | | | | | | | | | | |
Net asset value, beginning of period | | $ | 9.89 | | | $ | 7.68 | | | $ | 12.60 | | | $ | 17.59 | | | $ | 13.58 | | | $ | 15.35 | |
| | | | | | | | | | | | | | | | | | | | | | | | | |
Investment operations: | | | | | | | | | | | | | | | | | | | | | | | | |
Net investment income (loss)(a) | | | (0.05 | ) | | | (0.06 | )(b) | | | (0.08 | )(b) | | | (0.17 | )(b) | | | (0.15 | ) | | | (0.13 | ) |
Net realized and unrealized gain (loss) | | | 1.90 | | | | 2.27 | | | | (0.31 | ) | | | (2.69 | ) | | | 6.04 | | | | 0.47 | |
Total from investment operations | | | 1.85 | | | | 2.21 | | | | (0.39 | ) | | | (2.86 | ) | | | 5.89 | | | | 0.34 | |
| | | | | | | | | | | | | | | | | | | | | | | | | |
Less distributions: | | | | | | | | | | | | | | | | | | | | | | | | |
From net realized gains | | | — | | | | — | | | | (4.53 | ) | | | (2.13 | ) | | | (1.88 | ) | | | (2.11 | ) |
Total distributions | | | — | | | | — | | | | (4.53 | ) | | | (2.13 | ) | | | (1.88 | ) | | | (2.11 | ) |
| | | | | | | | | | | | | | | | | | | | | | | | | |
Net asset value, end of period | | $ | 11.74 | | | $ | 9.89 | | | $ | 7.68 | | | $ | 12.60 | | | $ | 17.59 | | | $ | 13.58 | |
| | | | | | | | | | | | | | | | | | | | | | | | | |
Total Return(c) | | | 18.71 | %(d) | | | 28.78 | % | | | (2.08 | )% | | | (18.90 | )% | | | 43.92 | % | | | 1.41 | % |
| | | | | | | | | | | | | | | | | | | | | | | | | |
Ratios and Supplemental Data: | | | | | | | | | | | | | | | | | | | | | | | | |
Net assets, end of period (in thousands) | | $ | 33,624 | | | $ | 33,069 | | | $ | 28,790 | | | $ | 39,308 | | | $ | 61,121 | | | $ | 40,165 | |
Ratio of expenses to average net assets: | | | | | | | | | | | | | | | | | | | | | | | | |
Before fee waived(h) | | | 0.72 | %(e) | | | 0.73 | % | | | 0.72 | % | | | 1.12 | % | | | 1.51 | %(f) | | | 1.78 | % |
After fees waived(h) | | | 1.05 | %(e) | | | 1.05 | % | | | 1.05 | % | | | 1.11 | %(g) | | | 1.08 | % | | | 1.14 | % |
Ratio of net investment loss to average net assets: | | | | | | | | | | | | | | | | | | | | | | | | |
Before fee waived(h) | | | (0.65 | )%(e) | | | (0.34 | )% | | | (0.48 | )% | | | (1.07 | )% | | | (1.31 | )%(f) | | | (1.50 | )% |
After fees waived(h) | | | (0.97 | )%(e) | | | (0.67 | )% | | | (0.81 | )% | | | (1.06 | )% | | | (0.87 | )% | | | (0.86 | )% |
Portfolio turnover rate(i) | | | 14 | %(d) | | | 11 | % | | | 7 | % | | | 104 | % | | | 33 | % | | | 38 | % |
(a) | Based on average shares outstanding for the period. |
(b) | Recognition of net investment income by the Fund is affected by the timing of the declaration of dividends by the underlying investment companies in which the Fund invests. The ratio does not include net investment income of the investment companies in which the Fund invests. |
(c) | Total returns would have been lower had expenses not been waived by the Adviser. Returns shown do not reflect the deduction of taxes that a shareholder would pay on Fund distributions or the redemption of Fund shares. |
(f) | Ratios exclude the 12b-1 refund. |
(g) | Effective January 11, 2022, the expense cap decreased from 1.14% to 1.05%. |
(h) | Does not include expenses of the investment companies in which the Fund invests. |
(i) | Portfolio turnover is calculated on the basis of the Fund as a whole, without distinguishing among the classes of shares. |
See accompanying Notes to Financial Statements.
47
North Square Dynamic Small Cap Fund
Financial Highlights
Class A
(For a share outstanding during each period)
| | | For the
Six Months
Ended
November 30,
2024
(Unaudited) | | | For the
Year Ended
May 31,
2024 | | | For the
Period Ended
May 31,
2023(a) | |
Selected Per Share Data: | | | | | | | | | | | | |
Net asset value, beginning of period | | $ | 14.69 | | | $ | 11.15 | | | $ | 11.26 | |
| | | | | | | | | | | | | |
Investment operations: | | | | | | | | | | | | |
Net investment income (loss)(b) | | | 0.02 | | | | (0.01 | ) | | | 0.03 | |
Net realized and unrealized gain (loss) | | | 2.55 | | | | 3.56 | | | | (0.14 | )(f) |
Total from investment operations | | | 2.57 | | | | 3.55 | | | | (0.11 | ) |
| | | | | | | | | | | | | |
Less distributions: | | | | | | | | | | | | |
Net investment income | | | — | | | | (0.01 | ) | | | — | |
Total distributions | | | — | | | | (0.01 | ) | | | — | |
| | | | | | | | | | | | | |
Net asset value, end of period | | $ | 17.26 | | | $ | 14.69 | | | $ | 11.15 | |
| | | | | | | | | | | | | |
Total Return(c) | | | 17.49 | %(d) | | | 31.88 | % | | | (0.98 | )%(d) |
| | | | | | | | | | | | | |
Ratios and Supplemental Data: | | | | | | | | | | | | |
Net assets, end of period (in thousands) | | $ | 53,374 | | | $ | 45,120 | | | $ | 2,143 | |
Ratio of expenses to average net assets: | | | | | | | | | | | | |
Before fee waived | | | 1.46 | %(e) | | | 1.54 | % | | | 1.54 | %(e) |
After fees waived | | | 1.24 | %(e) | | | 1.24 | % | | | 1.24 | %(e) |
Ratio of net investment gain (loss) to average net assets: | | | | | | | | | | | | |
Before fee waived | | | 0.02 | %(e) | | | (0.36 | )% | | | 2.99 | %(e) |
After fees waived | | | 0.25 | %(e) | | | (0.06 | )% | | | 3.29 | %(e) |
Portfolio turnover rate(g) | | | 87 | %(d) | | | 174 | % | | | 188 | % |
(a) | For the period May 1, 2023 (commencement of operations) to May 31, 2023. |
(b) | Based on average shares outstanding for the period. |
(c) | Total returns would have been lower had expenses not been waived by the Adviser. Returns shown do not reflect the deduction of taxes that a shareholder would pay on Fund distributions or the redemption of Fund shares. |
(f) | The amount shown for a share outstanding throughout the year may not correlate with the Statement of Operations for the year due to the timing of sales and redemptions of Fund shares in relation to income earned, class specific expense structure, and/or fluctuating market value of the investments of the Fund. |
(g) | Portfolio turnover is calculated on the basis of the Fund as a whole, without distinguishing among the classes of shares. |
See accompanying Notes to Financial Statements.
48
North Square Dynamic Small Cap Fund
Financial Highlights
Class I
(For a share outstanding during each period)
| | | For the
Six Months
Ended
November 30,
2024 | | | For the Years Ended May 31, | |
| | | (Unaudited) | | | 2024 | | | 2023 | | | 2022 | | | 2021 | | | 2020 | |
Selected Per Share Data: | | | | | | | | | | | | | | | | | | | | | | | | |
Net asset value, beginning of period | | $ | 14.71 | | | $ | 11.15 | | | $ | 11.09 | | | $ | 18.27 | | | $ | 11.46 | | | $ | 11.54 | |
| | | | | | | | | | | | | | | | | | | | | | | | | |
Investment operations: | | | | | | | | | | | | | | | | | | | | | | | | |
Net investment income (loss)(a) | | | 0.04 | | | | 0.02 | | | | 0.01 | | | | 0.01 | | | | (0.04 | ) | | | 0.02 | |
Net realized and unrealized gain (loss) | | | 2.56 | | | | 3.56 | | | | 0.07 | | | | (1.00 | ) | | | 7.14 | | | | (0.07 | ) |
Total from investment operations | | | 2.60 | | | | 3.58 | | | | 0.08 | | | | (0.99 | ) | | | 7.10 | | | | (0.05 | ) |
| | | | | | | | | | | | | | | | | | | | | | | | | |
Less distributions: | | | | | | | | | | | | | | | | | | | | | | | | |
Net investment income | | | — | | | | (0.02 | ) | | | (0.02 | ) | | | — | | | | (0.01 | ) | | | (0.03 | ) |
From net realized gains | | | — | | | | — | | | | — | | | | (6.19 | ) | | | (0.28 | ) | | | — | |
Total distributions | | | — | | | | (0.02 | ) | | | (0.02 | ) | | | (6.19 | ) | | | (0.29 | ) | | | (0.03 | ) |
| | | | | | | | | | | | | | | | | | | | | | | | | |
Net asset value, end of period | | $ | 17.31 | | | $ | 14.71 | | | $ | 11.15 | | | $ | 11.09 | | | $ | 18.27 | | | $ | 11.46 | |
| | | | | | | | | | | | | | | | | | | | | | | | | |
Total Return(b) | | | 17.68 | %(c) | | | 32.14 | % | | | 0.76 | % | | | (10.43 | )% | | | 62.34 | % | | | (0.44 | )% |
| | | | | | | | | | | | | | | | | | | | | | | | | |
Ratios and Supplemental Data: | | | | | | | | | | | | | | | | | | | | | | | | |
Net assets, end of period (in thousands) | | $ | 371,905 | | | $ | 203,772 | | | $ | 76,580 | | | $ | 78,983 | | | $ | 20,369 | | | $ | 15,500 | |
Ratio of expenses to average net assets: | | | | | | | | | | | | | | | | | | | | | | | | |
Before fee waived | | | 1.09 | %(d) | | | 1.18 | % | | | 1.33 | % | | | 1.36 | % | | | 1.67 | % | | | 2.23 | % |
After fees waived | | | 0.99 | %(d) | | | 0.99 | % | | | 0.99 | % | | | 1.00 | %(e) | | | 1.15 | % | | | 1.15 | % |
Ratio of net investment gain (loss) to average net assets: | | | | | | | | | | | | | | | | | | | | | | | | |
Before fee waived | | | 0.39 | %(d) | | | (0.04 | )% | | | (0.21 | )% | | | (0.30 | )% | | | (0.82 | )% | | | (0.91 | )% |
After fees waived | | | 0.50 | %(d) | | | 0.15 | % | | | 0.12 | % | | | 0.06 | % | | | (0.30 | )% | | | 0.17 | % |
Portfolio turnover rate(g) | | | 87 | %(c) | | | 174 | % | | | 188 | % | | | 177 | % | | | 179 | % | | | 170 | % |
(a) | Based on average shares outstanding for the period. |
(b) | Total returns would have been lower had expenses not been waived by the Adviser. Returns shown do not reflect the deduction of taxes that a shareholder would pay on Fund distributions or the redemption of Fund shares. |
(e) | Effective July 1, 2021, the expense cap decreased from 1.15% to 0.99%. |
(g) | Portfolio turnover is calculated on the basis of the Fund as a whole, without distinguishing among the classes of shares. |
See accompanying Notes to Financial Statements.
49
North Square Multi Strategy Fund
Financial Highlights
Class A
(For a share outstanding during each period)
| | | For the
Six Months
Ended
November 30,
2024 | | | For the Years Ended May 31, | |
| | | (Unaudited) | | | 2024 | | | 2023 | | | 2022 | | | 2021 | | | 2020 | |
Selected Per Share Data: | | | | | | | | | | | | | | | | | | | | | | | | |
Net asset value, beginning of period | | $ | 16.95 | | | $ | 14.17 | | | $ | 21.10 | | | $ | 23.57 | | | $ | 16.93 | | | $ | 16.92 | |
| | | | | | | | | | | | | | | | | | | | | | | | | |
Investment operations: | | | | | | | | | | | | | | | | | | | | | | | | |
Net investment income (loss)(a)(h) | | | 0.05 | | | | 0.12 | | | | 0.19 | | | | 1.98 | | | | (0.09 | ) | | | (0.05 | ) |
Net realized and unrealized gain (loss) | | | 1.74 | | | | 2.84 | | | | (0.53 | ) | | | (2.97 | ) | | | 6.73 | | | | 1.25 | |
Total from investment operations | | | 1.79 | | | | 2.96 | | | | (0.34 | ) | | | (0.99 | ) | | | 6.64 | | | | 1.20 | |
| | | | | | | | | | | | | | | | | | | | | | | | | |
Less distributions: | | | | | | | | | | | | | | | | | | | | | | | | |
Net investment income | | | — | | | | (0.18 | ) | | | (2.11 | ) | | | — | | | | — | | | | (1.19 | ) |
From net realized gains | | | — | | | | — | | | | (4.48 | ) | | | (1.48 | ) | | | — | | | | — | |
Total distributions | | | — | | | | (0.18 | ) | | | (6.59 | ) | | | (1.48 | ) | | | — | | | | (1.19 | ) |
| | | | | | | | | | | | | | | | | | | | | | | | | |
Net asset value, end of period | | $ | 18.74 | | | $ | 16.95 | | | $ | 14.17 | | | $ | 21.10 | | | $ | 23.57 | | | $ | 16.93 | |
| | | | | | | | | | | | | | | | | | | | | | | | | |
Total Return(b) | | | 10.56 | %(c) | | | 20.99 | % | | | (0.57 | )% | | | (4.94 | )% | | | 39.20 | % | | | 6.63 | % |
| | | | | | | | | | | | | | | | | | | | | | | | | |
Ratios and Supplemental Data: | | | | | | | | | | | | | | | | | | | | | | | | |
Net assets, end of period (in thousands) | | $ | 33,977 | | | $ | 32,062 | | | $ | 30,433 | | | $ | 37,762 | | | $ | 45,140 | | | $ | 35,278 | |
Ratio of expenses to average net assets: | | | | | | | | | | | | | | | | | | | | | | | | |
Before fee waived(e)(f) | | | 1.27 | %(d) | | | 0.94 | % | | | 1.23 | % | | | 0.79 | % | | | 0.92 | % | | | 1.34 | % |
After fees waived(e)(f) | | | 0.96 | %(d) | | | 0.94 | % | | | 0.92 | % | | | 0.79 | % | | | 1.13 | % | | | 1.20 | % |
Ratio of net investment gain (loss) to average net assets: | | | | | | | | | | | | | | | | | | | | | | | | |
Before fee waived(e) | | | 0.30 | %(d) | | | 0.74 | % | | | 0.79 | % | | | 8.41 | % | | | (0.23 | )% | | | (0.40 | )% |
After fees waived(e) | | | 0.62 | %(d) | | | 0.74 | % | | | 1.10 | % | | | 8.41 | % | | | (0.44 | )% | | | (0.26 | )% |
Portfolio turnover rate(g) | | | 5 | %(c) | | | 12 | % | | | 13 | % | | | 65 | % | | | 15 | % | | | 7 | % |
(a) | Based on average shares outstanding for the period. |
(b) | Total returns would have been lower had expenses not been waived by the Adviser. Returns shown do not reflect the deduction of taxes that a shareholder would pay on Fund distributions or the redemption of Fund shares. |
(e) | Does not include expenses of the investment companies in which the Fund invests. |
(f) | The Adviser does not receive management fees for Fund assets invested in other series of the Trust advised by the Adviser (affiliated investments). |
(g) | Portfolio turnover is calculated on the basis of the Fund as a whole, without distinguishing among the classes of shares. |
(h) | Recognition of net investment income (loss) by the Fund is affected by the timing of the declaration of dividends by the underlying investment companies in which the Fund invests. |
See accompanying Notes to Financial Statements.
50
North Square Multi Strategy Fund
Financial Highlights
Class I
(For a share outstanding during each period)
| | | For the
Six Months
Ended
November 30,
2024 | | | For the Years Ended May 31, | |
| | | (Unaudited) | | | 2024 | | | 2023 | | | 2022 | | | 2021 | | | 2020 | |
Selected Per Share Data: | | | | | | | | | | | | | | | | | | | | | | | | |
Net asset value, beginning of period | | $ | 18.49 | | | $ | 15.43 | | | $ | 22.33 | | | $ | 24.83 | | | $ | 17.73 | | | $ | 17.59 | |
| | | | | | | | | | | | | | | | | | | | | | | | | |
Investment operations: | | | | | | | | | | | | | | | | | | | | | | | | |
Net investment income (loss)(a)(i) | | | 0.08 | | | | 0.18 | | | | 0.25 | | | | 2.22 | | | | 0.06 | | | | (0.01 | ) |
Net realized and unrealized gain (loss) | | | 1.90 | | | | 3.10 | | | | (0.56 | ) | | | (3.24 | ) | | | 7.04 | | | | 1.36 | |
Total from investment operations | | | 1.98 | | | | 3.28 | | | | (0.31 | ) | | | (1.02 | ) | | | 7.10 | | | | 1.35 | |
| | | | | | | | | | | | | | | | | | | | | | | | | |
Less distributions: | | | | | | | | | | | | | | | | | | | | | | | | |
Net investment income | | | — | | | | (0.22 | ) | | | (2.11 | ) | | | — | | | | — | | | | (1.21 | ) |
From net realized gains | | | — | | | | — | | | | (4.48 | ) | | | (1.48 | ) | | | — | | | | — | |
Total distributions | | | — | | | | (0.22 | ) | | | (6.59 | ) | | | (1.48 | ) | | | — | | | | (1.21 | ) |
| | | | | | | | | | | | | | | | | | | | | | | | | |
Net asset value, end of period | | $ | 20.47 | | | $ | 18.49 | | | $ | 15.43 | | | $ | 22.33 | | | $ | 24.83 | | | $ | 17.73 | |
| | | | | | | | | | | | | | | | | | | | | | | | | |
Total Return(b) | | | 10.71 | %(c) | | | 21.34 | % | | | (0.38 | )% | | | (4.79 | )% | | | 40.07 | % | | | 7.17 | % |
| | | | | | | | | | | | | | | | | | | | | | | | | |
Ratios and Supplemental Data: | | | | | | | | | | | | | | | | | | | | | | | | |
Net assets, end of period (in thousands) | | $ | 8,347 | | | $ | 8,426 | | | $ | 8,420 | | | $ | 10,136 | | | $ | 10,592 | | | $ | 5,851 | |
Ratio of expenses to average net assets: | | | | | | | | | | | | | | | | | | | | | | | | |
Before fee waived(f)(g) | | | 1.02 | %(d) | | | 0.70 | % | | | 0.99 | % | | | 0.54 | % | | | 0.67 | %(e) | | | 0.92 | % |
After fees waived(f)(g) | | | 0.70 | %(d) | | | 0.70 | % | | | 0.68 | % | | | 0.54 | % | | | 0.43 | % | | | 0.90 | % |
Ratio of net investment gain (loss) to average net assets: | | | | | | | | | | | | | | | | | | | | | | | | |
Before fee waived(f) | | | 0.55 | %(d) | | | 1.06 | % | | | 1.03 | % | | | 8.92 | % | | | 0.05 | %(e) | | | (0.10 | )% |
After fees waived(f) | | | 0.87 | %(d) | | | 1.06 | % | | | 1.34 | % | | | 8.92 | % | | | 0.29 | % | | | (0.08 | )% |
Portfolio turnover rate(h) | | | 5 | %(c) | | | 12 | % | | | 13 | % | | | 65 | % | | | 15 | % | | | 7 | % |
(a) | Based on average shares outstanding for the period. |
(b) | Total returns would have been lower had expenses not been waived by the Adviser. Returns shown do not reflect the deduction of taxes that a shareholder would pay on Fund distributions or the redemption of Fund shares. |
(e) | Ratios exclude the 12b-1 refund. |
(f) | Does not include expenses of the investment companies in which the Fund invests. |
(g) | The Adviser does not receive management fees for Fund assets invested in other series of the Trust advised by the Adviser (affiliated investments). |
(h) | Portfolio turnover is calculated on the basis of the Fund as a whole, without distinguishing among the classes of shares. |
(i) | Recognition of net investment income (loss) by the Fund is affected by the timing of the declaration of dividends by the underlying investment companies in which the Fund invests. |
See accompanying Notes to Financial Statements.
51
North Square Preferred and Income Securities Fund
Financial Highlights
Class I
(For a share outstanding during each period)
| | | For the
Six Months
Ended
November 30,
2024 | | | For the Years Ended May 31, | |
| | | (Unaudited) | | | 2024 | | | 2023 | | | 2022 | | | 2021 | | | 2020 | |
Selected Per Share Data: | | | | | | | | | | | | | | | | | | | | | | | | |
Net asset value, beginning of period | | $ | 20.67 | | | $ | 17.86 | | | $ | 20.96 | | | $ | 23.32 | | | $ | 17.47 | | | $ | 16.25 | |
| | | | | | | | | | | | | | | | | | | | | | | | | |
Investment operations: | | | | | | | | | | | | | | | | | | | | | | | | |
Net investment income(a) | | | 0.49 | | | | 0.99 | | | | 1.09 | | | | 0.41 | | | | 0.21 | | | | 0.24 | |
Net realized and unrealized gain (loss) | | | 0.86 | | | | 2.77 | | | | (0.89 | ) | | | (0.55 | ) | | | 6.18 | | | | 1.28 | |
Total from investment operations | | | 1.35 | | | | 3.76 | | | | 0.20 | | | | (0.14 | ) | | | 6.39 | | | | 1.52 | |
| | | | | | | | | | | | | | | | | | | | | | | | | |
Less distributions: | | | | | | | | | | | | | | | | | | | | | | | | |
Net investment income | | | (0.44 | ) | | | (0.76 | ) | | | (0.65 | ) | | | (0.38 | ) | | | (0.18 | ) | | | (0.25 | ) |
From net realized gains | | | — | | | | — | | | | (2.31 | ) | | | (1.84 | ) | | | (0.36 | ) | | | (0.05 | ) |
Return of capital | | | — | | | | (0.19 | ) | | | (0.34 | ) | | | — | | | | — | | | | — | |
Total distributions | | | (0.44 | ) | | | (0.95 | ) | | | (3.30 | ) | | | (2.22 | ) | | | (0.54 | ) | | | (0.30 | ) |
| | | | | | | | | | | | | | | | | | | | | | | | | |
Net asset value, end of period | | $ | 21.58 | | | $ | 20.67 | | | $ | 17.86 | | | $ | 20.96 | | | $ | 23.32 | | | $ | 17.47 | |
| | | | | | | | | | | | | | | | | | | | | | | | | |
Total Return(b) | | | 6.60 | %(c) | | | 21.51 | % | | | 1.25 | % | | | (1.49 | )% | | | 37.06 | % | | | 9.35 | % |
| | | | | | | | | | | | | | | | | | | | | | | | | |
Ratios and Supplemental Data: | | | | | | | | | | | | | | | | | | | | | | | | |
Net assets, end of period (in thousands) | | $ | 253,815 | | | $ | 144,386 | | | $ | 46,577 | | | $ | 25,793 | | | $ | 16,186 | | | $ | 11,146 | |
Ratio of expenses to average net assets: | | | | | | | | | | | | | | | | | | | | | | | | |
Before fee waived | | | 0.92 | %(d) | | | 1.04 | % | | | 1.20 | % | | | 1.27 | % | | | 1.44 | %(e) | | | 1.89 | % |
After fees waived | | | 0.96 | %(d) | | | 0.97 | % | | | 0.97 | % | | | 0.99 | %(f) | | | 1.00 | % | | | 1.00 | % |
Ratio of net investment gain to average net assets: | | | | | | | | | | | | | | | | | | | | | | | | |
Before fee waived | | | 4.54 | %(d) | | | 5.00 | % | | | 5.41 | % | | | 1.50 | % | | | 0.59 | %(e) | | | 0.47 | % |
After fees waived | | | 4.51 | %(d) | | | 5.07 | % | | | 5.64 | % | | | 1.78 | % | | | 1.03 | % | | | 1.36 | % |
Portfolio turnover rate(g) | | | 44 | %(c) | | | 115 | % | | | 260 | % | | | 179 | % | | | 28 | % | | | 18 | % |
(a) | Based on average shares outstanding for the period. |
(b) | Total returns would have been lower had expenses not been waived by the Adviser. Returns shown do not reflect the deduction of taxes that a shareholder would pay on Fund distributions or the redemption of Fund shares. |
(e) | Ratios exclude the 12b-1 refund. |
(f) | Effective January 11, 2022, the expense cap decreased from 1.00% to 0.97%. |
(g) | Portfolio turnover is calculated on the basis of the Fund as a whole, without distinguishing among the classes of shares. |
See accompanying Notes to Financial Statements.
52
North Square Tactical Growth Fund
Financial Highlights
Class A
(For a share outstanding during each period)
| | | For the
Six Months
Ended
November 30,
2024 | | | For the Years Ended May 31, | |
| | | (Unaudited) | | | 2024 | | | 2023 | | | 2022(a) | | | 2021 | | | 2020 | |
Selected Per Share Data: | | | | | | | | | | | | | | | | | | | | | | | | |
Net asset value, beginning of period | | $ | 14.79 | | | $ | 12.74 | | | $ | 13.59 | | | $ | 15.15 | | | $ | 11.81 | | | $ | 11.62 | |
| | | | | | | | | | | | | | | | | | | | | | | | | |
Investment operations: | | | | | | | | | | | | | | | | | | | | | | | | |
Net investment income (loss)(b)(f) | | | 0.02 | | | | 0.08 | | | | 0.06 | | | | (0.03 | ) | | | (0.09 | ) | | | 0.05 | |
Net realized and unrealized gain (loss) | | | 1.58 | | | | 2.08 | | | | 0.02 | | | | (0.80 | ) | | | 3.43 | | | | 0.72 | |
Total from investment operations | | | 1.60 | | | | 2.16 | | | | 0.08 | | | | (0.83 | ) | | | 3.34 | | | | 0.77 | |
| | | | | | | | | | | | | | | | | | | | | | | | | |
Less distributions: | | | | | | | | | | | | | | | | | | | | | | | | |
Net investment income | | | — | | | | (0.09 | ) | | | (0.06 | ) | | | — | | | | — | | | | (0.06 | ) |
From net realized gains | | | — | | | | (0.02 | ) | | | (0.87 | ) | | | (0.73 | ) | | | — | | | | (0.52 | ) |
Total distributions | | | — | | | | (0.11 | ) | | | (0.93 | ) | | | (0.73 | ) | | | — | | | | (0.58 | ) |
| | | | | | | | | | | | | | | | | | | | | | | | | |
Net asset value, end of period | | $ | 16.39 | | | $ | 14.79 | | | $ | 12.74 | | | $ | 13.59 | | | $ | 15.15 | | | $ | 11.81 | |
| | | | | | | | | | | | | | | | | | | | | | | | | |
Total Return(c) | | | 10.82 | %(d) | | | 16.99 | % | | | 1.04 | % | | | (5.93 | )% | | | 28.28 | % | | | 6.53 | % |
| | | | | | | | | | | | | | | | | | | | | | | | | |
Ratios and Supplemental Data: | | | | | | | | | | | | | | | | | | | | | | | | |
Net assets, end of period (in thousands) | | $ | 103,961 | | | $ | 94,310 | | | $ | 85,244 | | | $ | 92,843 | | | $ | 97,180 | | | $ | 81,511 | |
Ratio of expenses to average net assets: | | | | | | | | | | | | | | | | | | | | | | | | |
Before fee waived(h) | | | 1.58 | %(e) | | | 1.62 | % | | | 1.74 | % | | | 1.61 | % | | | 1.55 | % | | | 1.56 | % |
After fees waived(h) | | | 1.55 | %(e) | | | 1.55 | % | | | 1.55 | % | | | 1.55 | % | | | 1.55 | % | | | 1.55 | % |
Ratio of net investment gain (loss) to average net assets: | | | | | | | | | | | | | | | | | | | | | | | | |
Before fee waived(h) | | | 0.29 | %(e) | | | 0.51 | % | | | 0.24 | % | | | (0.27 | )% | | | (0.70 | )% | | | 0.39 | % |
After fees waived(h) | | | 0.31 | %(e) | | | 0.58 | % | | | 0.43 | % | | | (0.21 | )% | | | (0.70 | )% | | | 0.40 | % |
Portfolio turnover rate(g) | | | 13 | %(d) | | | 66 | % | | | 96 | % | | | 67 | % | | | 79 | % | | | 128 | % |
(a) | Effective June 11, 2021, the Stadion Tactical Growth Fund Class A converted to the North Square Tactical Growth Fund Class A. See Note 1. |
(b) | Based on average shares outstanding for the period. |
(c) | Total returns would have been lower had expenses not been waived by the Adviser. Returns shown do not reflect the deduction of taxes that a shareholder would pay on Fund distributions or the redemption of Fund shares. |
(f) | Recognition of net investment income (loss) by the Fund is affected by the timing of the declaration of dividends by the underlying investment companies in which the Fund invests. |
(g) | Portfolio turnover is calculated on the basis of the Fund as a whole, without distinguishing among the classes of shares. |
(h) | Does not include expenses of the investment companies in which the Fund invests. |
See accompanying Notes to Financial Statements.
53
North Square Tactical Growth Fund
Financial Highlights
Class C
(For a share outstanding during each period)
| | | For the
Six Months
Ended
November 30,
2024 | | | For the Years Ended May 31, | |
| | | (Unaudited) | | | 2024 | | | 2023 | | | 2022(a) | | | 2021 | | | 2020 | |
Selected Per Share Data: | | | | | | | | | | | | | | | | | | | | | | | | |
Net asset value, beginning of period | | $ | 13.70 | | | $ | 11.80 | | | $ | 12.69 | | | $ | 14.30 | | | $ | 11.24 | | | $ | 11.14 | |
| | | | | | | | | | | | | | | | | | | | | | | | | |
Investment operations: | | | | | | | | | | | | | | | | | | | | | | | | |
Net investment loss(b)(f) | | | (0.03 | ) | | | (0.02 | )(h) | | | (0.04 | )(h) | | | (0.13 | ) | | | (0.19 | ) | | | (0.04 | )(h) |
Net realized and unrealized gain (loss) | | | 1.46 | | | | 1.92 | | | | 0.03 | | | | (0.75 | ) | | | 3.25 | | | | 0.69 | |
Total from investment operations | | | 1.43 | | | | 1.90 | | | | (0.01 | ) | | | (0.88 | ) | | | 3.06 | | | | 0.65 | |
| | | | | | | | | | | | | | | | | | | | | | | | | |
Less distributions: | | | | | | | | | | | | | | | | | | | | | | | | |
Net investment income | | | — | | | | — | | | | (0.01 | ) | | | — | | | | — | | | | (0.03 | ) |
From net realized gains | | | — | | | | — | | | | (0.87 | ) | | | (0.73 | ) | | | — | | | | (0.52 | ) |
Total distributions | | | — | | | | — | | | | (0.88 | ) | | | (0.73 | ) | | | — | | | | (0.55 | ) |
| | | | | | | | | | | | | | | | | | | | | | | | | |
Net asset value, end of period | | $ | 15.13 | | | $ | 13.70 | | | $ | 11.80 | | | $ | 12.69 | | | $ | 14.30 | | | $ | 11.24 | |
| | | | | | | | | | | | | | | | | | | | | | | | | |
Total Return(c) | | | 10.44 | %(d) | | | 16.10 | % | | | 0.31 | % | | | (6.61 | )% | | | 27.22 | % | | | 5.73 | % |
| | | | | | | | | | | | | | | | | | | | | | | | | |
Ratios and Supplemental Data: | | | | | | | | | | | | | | | | | | | | | | | | |
Net assets, end of period (in thousands) | | $ | 61,572 | | | $ | 60,037 | | | $ | 71,369 | | | $ | 84,867 | | | $ | 106,291 | | | $ | 95,291 | |
Ratio of expenses to average net assets: | | | | | | | | | | | | | | | | | | | | | | | | |
Before fee waived(i) | | | 2.32 | %(e) | | | 2.37 | % | | | 2.50 | % | | | 2.37 | % | | | 2.31 | % | | | 2.33 | % |
After fees waived(i) | | | 2.30 | %(e) | | | 2.30 | % | | | 2.30 | % | | | 2.30 | % | | | 2.30 | % | | | 2.30 | % |
Ratio of net investment loss to average net assets: | | | | | | | | | | | | | | | | | | | | | | | | |
Before fee waived(i) | | | (0.44 | )%(e) | | | (0.22 | )% | | | (0.51 | )% | | | (1.02 | )% | | | (1.46 | )% | | | (0.36 | )% |
After fees waived(i) | | | (0.42 | )%(e) | | | (0.15 | )% | | | (0.31 | )% | | | (0.95 | )% | | | (1.45 | )% | | | (0.33 | )% |
Portfolio turnover rate(g) | | | 13 | %(d) | | | 66 | % | | | 96 | % | | | 67 | % | | | 79 | % | | | 128 | % |
(a) | Effective June 11, 2021, the Stadion Tactical Growth Fund Class C converted to the North Square Tactical Growth Fund Class C. See Note 1. |
(b) | Based on average shares outstanding for the period. |
(c) | Total returns would have been lower had expenses not been waived by the Adviser. Returns shown do not reflect the deduction of taxes that a shareholder would pay on Fund distributions or the redemption of Fund shares. |
(f) | Recognition of net investment income (loss) by the Fund is affected by the timing of the declaration of dividends by the underlying investment companies in which the Fund invests. |
(g) | Portfolio turnover is calculated on the basis of the Fund as a whole, without distinguishing among the classes of shares. |
(h) | The amount shown for a share outstanding throughout the year may not correlate with the Statement of Operations for the year due to the timing of sales and redemptions of Fund shares in relation to income earned, class specific expense structure, and/or fluctuating market value of the investments of the Fund. |
(i) | Does not include expenses of the investment companies in which the Fund invests. |
See accompanying Notes to Financial Statements.
54
North Square Tactical Growth Fund
Financial Highlights
Class I
(For a share outstanding during each period)
| | | For the
Six Months
Ended
November 30,
2024 | | | For the Years Ended May 31, | |
| | | (Unaudited) | | | 2024 | | | 2023 | | | 2022(a) | | | 2021 | | | 2020 | |
Selected Per Share Data: | | | | | | | | | | | | | | | | | | | | | | | | |
Net asset value, beginning of period | | $ | 15.14 | | | $ | 13.04 | | | $ | 13.87 | | | $ | 15.42 | | | $ | 12.00 | | | $ | 11.77 | |
| | | | | | | | | | | | | | | | | | | | | | | | | |
Investment operations: | | | | | | | | | | | | | | | | | | | | | | | | |
Net investment income (loss)(b)(i) | | | 0.05 | | | | 0.11 | | | | 0.09 | | | | 0.01 | | | | (0.06 | ) | | | 0.08 | |
Net realized and unrealized gain (loss) | | | 1.62 | | | | 2.13 | | | | 0.03 | | | | (0.83 | ) | | | 3.48 | | | | 0.74 | |
Total from investment operations | | | 1.67 | | | | 2.24 | | | | 0.12 | | | | (0.82 | ) | | | 3.42 | | | | 0.82 | |
| | | | | | | | | | | | | | | | | | | | | | | | | |
Less distributions: | | | | | | | | | | | | | | | | | | | | | | | | |
Net investment income | | | — | | | | (0.12 | ) | | | (0.08 | ) | | | — | | | | — | (c) | | | (0.07 | ) |
From net realized gains | | | — | | | | (0.02 | ) | | | (0.87 | ) | | | (0.73 | ) | | | — | | | | (0.52 | ) |
Total distributions | | | — | | | | (0.14 | ) | | | (0.95 | ) | | | (0.73 | ) | | | — | | | | (0.59 | ) |
| | | | | | | | | | | | | | | | | | | | | | | | | |
Net asset value, end of period | | $ | 16.81 | | | $ | 15.14 | | | $ | 13.04 | | | $ | 13.87 | | | $ | 15.42 | | | $ | 12.00 | |
| | | | | | | | | | | | | | | | | | | | | | | | | |
Total Return(d) | | | 11.03 | %(e) | | | 17.25 | % | | | 1.33 | % | | | (5.71 | )% | | | 28.53 | % | | | 6.88 | % |
| | | | | | | | | | | | | | | | | | | | | | | | | |
Ratios and Supplemental Data: | | | | | | | | | | | | | | | | | | | | | | | | |
Net assets, end of period (in thousands) | | $ | 392,024 | | | $ | 361,085 | | | $ | 314,829 | | | $ | 344,653 | | | $ | 391,964 | | | $ | 314,646 | |
Ratio of expenses to average net assets: | | | | | | | | | | | | | | | | | | | | | | | | |
Before fee waived(g) | | | 1.34 | %(f) | | | 1.37 | % | | | 1.50 | % | | | 1.38 | % | | | 1.33 | % | | | 1.34 | % |
After fees waived(g) | | | 1.30 | %(f) | | | 1.30 | % | | | 1.30 | % | | | 1.30 | % | | | 1.30 | % | | | 1.30 | % |
Ratio of net investment gain (loss) to average net assets: | | | | | | | | | | | | | | | | | | | | | | | | |
Before fee waived(g) | | | 0.53 | %(f) | | | 0.74 | % | | | 0.48 | % | | | (0.03 | )% | | | (0.48 | )% | | | 0.62 | % |
After fees waived(g) | | | 0.57 | %(f) | | | 0.81 | % | | | 0.68 | % | | | 0.05 | % | | | (0.45 | )% | | | 0.66 | % |
Portfolio turnover rate(h) | | | 13 | %(e) | | | 66 | % | | | 96 | % | | | 67 | % | | | 79 | % | | | 128 | % |
(a) | Effective June 11, 2021, the Stadion Tactical Growth Fund Class I converted to the North Square Tactical Growth Fund Class I. See Note 1. |
(b) | Based on average shares outstanding for the period. |
(c) | Rounds to less than $0.005 per share. |
(d) | Total returns would have been lower had expenses not been waived by the Adviser. Returns shown do not reflect the deduction of taxes that a shareholder would pay on Fund distributions or the redemption of Fund shares. |
(g) | Does not include expenses of the investment companies in which the Fund invests. |
(h) | Portfolio turnover is calculated on the basis of the Fund as a whole, without distinguishing among the classes of shares. |
(i) | Recognition of net investment income (loss) by the Fund is affected by the timing of the declaration of dividends by the underlying investment companies in which the Fund invests. |
See accompanying Notes to Financial Statements.
55
North Square Tactical Defensive Fund
Financial Highlights
Class A
(For a share outstanding during each period)
| | | For the
Six Months
Ended
November 30,
2024 | | | For the Years Ended May 31, | |
| | | (Unaudited) | | | 2024 | | | 2023 | | | 2022(a) | | | 2021 | | | 2020 | |
Selected Per Share Data: | | | | | | | | | | | | | | | | | | | | | | | | |
Net asset value, beginning of period | | $ | 17.62 | | | $ | 15.42 | | | $ | 16.05 | | | $ | 16.00 | | | $ | 12.41 | | | $ | 13.52 | |
| | | | | | | | | | | | | | | | | | | | | | | | | |
Investment operations: | | | | | | | | | | | | | | | | | | | | | | | | |
Net investment income (loss)(b)(h) | | | 0.01 | | | | 0.13 | | | | 0.05 | | | | (0.11 | ) | | | (0.10 | ) | | | 0.07 | |
Net realized and unrealized gain (loss) | | | 0.85 | | | | 2.07 | | | | (0.68 | ) | | | 0.16 | | | | 3.69 | | | | (1.12 | ) |
Total from investment operations | | | 0.86 | | | | 2.20 | | | | (0.63 | ) | | | 0.05 | | | | 3.59 | | | | (1.05 | ) |
| | | | | | | | | | | | | | | | | | | | | | | | | |
Less distributions: | | | | | | | | | | | | | | | | | | | | | | | | |
Net investment income | | | — | | | | — | | | | — | | | | — | | | | — | | | | (0.06 | ) |
Total distributions | | | — | | | | — | | | | — | | | | — | | | | — | | | | (0.06 | ) |
| | | | | | | | | | | | | | | | | | | | | | | | | |
Net asset value, end of period | | $ | 18.48 | | | $ | 17.62 | | | $ | 15.42 | | | $ | 16.05 | | | $ | 16.00 | | | $ | 12.41 | |
| | | | | | | | | | | | | | | | | | | | | | | | | |
Total Return(c) | | | 4.88 | %(d) | | | 14.27 | % | | | (3.93 | )% | | | 0.30 | % | | | 28.93 | % | | | (7.85 | )% |
| | | | | | | | | | | | | | | | | | | | | | | | | |
Ratios and Supplemental Data: | | | | | | | | | | | | | | | | | | | | | | | | |
Net assets, end of period (in thousands) | | $ | 20,090 | | | $ | 20,434 | | | $ | 20,302 | | | $ | 23,392 | | | $ | 20,302 | | | $ | 18,526 | |
Ratio of expenses to average net assets: | | | | | | | | | | | | | | | | | | | | | | | | |
Before fee waived(f) | | | 1.94 | %(e) | | | 1.97 | % | | | 1.97 | % | | | 1.86 | % | | | 1.87 | % | | | 1.85 | % |
After fees waived(f) | | | 1.91 | %(e) | | | 1.96 | % | | | 1.95 | % | | | 1.86 | % | | | 1.87 | % | | | 1.85 | % |
Ratio of net investment gain (loss) to average net assets: | | | | | | | | | | | | | | | | | | | | | | | | |
Before fee waived(f) | | | 0.07 | %(e) | | | 0.79 | % | | | 0.25 | % | | | (0.65 | )% | | | (0.71 | )% | | | 0.47 | % |
After fees waived(f) | | | 0.10 | %(e) | | | 0.80 | % | | | 0.29 | % | | | (0.65 | )% | | | (0.71 | )% | | | 0.47 | % |
Portfolio turnover rate(g) | | | 93 | %(d) | | | 296 | % | | | 677 | % | | | 289 | % | | | 350 | % | | | 522 | % |
(a) | Effective June 11, 2021, the Stadion Tactical Defensive Fund Class A converted to the North Square Tactical Defensive Fund Class A. See Note 1. |
(b) | Based on average shares outstanding for the period. |
(c) | Total returns would have been lower had expenses not been waived by the Adviser. Returns shown do not reflect the deduction of taxes that a shareholder would pay on Fund distributions or the redemption of Fund shares. |
(f) | Does not include expenses of the investment companies in which the Fund invests. |
(g) | Portfolio turnover is calculated on the basis of the Fund as a whole, without distinguishing among the classes of shares. |
(h) | Recognition of net investment income (loss) by the Fund is affected by the timing of the declaration of dividends by the underlying investment companies in which the Fund invests. |
See accompanying Notes to Financial Statements.
56
North Square Tactical Defensive Fund
Financial Highlights
Class C
(For a share outstanding during each period)
| | | For the
Six Months
Ended
November 30,
2024 | | | For the Years Ended May 31, | |
| | | (Unaudited) | | | 2024 | | | 2023 | | | 2022(a) | | | 2021 | | | 2020 | |
Selected Per Share Data: | | | | | | | | | | | | | | | | | | | | | | | | |
Net asset value, beginning of period | | $ | 15.70 | | | $ | 13.84 | | | $ | 14.52 | | | $ | 14.59 | | | $ | 11.40 | | | $ | 12.51 | |
| | | | | | | | | | | | | | | | | | | | | | | | | |
Investment operations: | | | | | | | | | | | | | | | | | | | | | | | | |
Net investment income (loss)(b)(h) | | | (0.05 | ) | | | 0.01 | | | | (0.07 | )(i) | | | (0.21 | ) | | | (0.19 | ) | | | (0.03 | )(i) |
Net realized and unrealized gain (loss) | | | 0.75 | | | | 1.85 | | | | (0.61 | ) | | | 0.14 | | | | 3.38 | | | | (1.03 | ) |
Total from investment operations | | | 0.70 | | | | 1.86 | | | | (0.68 | ) | | | (0.07 | ) | | | 3.19 | | | | (1.06 | ) |
| | | | | | | | | | | | | | | | | | | | | | | | | |
Less distributions: | | | | | | | | | | | | | | | | | | | | | | | | |
Net investment income | | | — | | | | — | | | | — | | | | — | | | | — | | | | (0.05 | ) |
Total distributions | | | — | | | | — | | | | — | | | | — | | | | — | | | | (0.05 | ) |
| | | | | | | | | | | | | | | | | | | | | | | | | |
Net asset value, end of period | | $ | 16.40 | | | $ | 15.70 | | | $ | 13.84 | | | $ | 14.52 | | | $ | 14.59 | | | $ | 11.40 | |
| | | | | | | | | | | | | | | | | | | | | | | | | |
Total Return(c) | | | 4.46 | %(d) | | | 13.44 | % | | | (4.68 | )% | | | (0.49 | )% | | | 27.98 | % | | | (8.54 | )% |
| | | | | | | | | | | | | | | | | | | | | | | | | |
Ratios and Supplemental Data: | | | | | | | | | | | | | | | | | | | | | | | | |
Net assets, end of period (in thousands) | | $ | 3,151 | | | $ | 3,316 | | | $ | 4,005 | | | $ | 7,265 | | | $ | 11,711 | | | $ | 13,586 | |
Ratio of expenses to average net assets: | | | | | | | | | | | | | | | | | | | | | | | | |
Before fee waived(f) | | | 2.64 | %(e) | | | 2.75 | % | | | 2.74 | % | | | 2.62 | % | | | 2.62 | % | | | 2.61 | % |
After fees waived(f) | | | 2.56 | %(e) | | | 2.71 | % | | | 2.70 | % | | | 2.62 | % | | | 2.62 | % | | | 2.61 | % |
Ratio of net investment gain (loss) to average net assets: | | | | | | | | | | | | | | | | | | | | | | | | |
Before fee waived(f) | | | (0.67 | )%(e) | | | 0.02 | % | | | (0.52 | )% | | | (1.37 | )% | | | (1.42 | )% | | | (0.24 | )% |
After fees waived(f) | | | (0.59 | )%(e) | | | 0.06 | % | | | (0.48 | )% | | | (1.37 | )% | | | (1.42 | )% | | | (0.24 | )% |
Portfolio turnover rate(g) | | | 93 | %(d) | | | 296 | % | | | 677 | % | | | 289 | % | | | 350 | % | | | 522 | % |
(a) | Effective June 11, 2021, the Stadion Tactical Defensive Fund Class C converted to the North Square Tactical Defensive Fund Class C. See Note 1. |
(b) | Based on average shares outstanding for the period. |
(c) | Total returns would have been lower had expenses not been waived by the Adviser. Returns shown do not reflect the deduction of taxes that a shareholder would pay on Fund distributions or the redemption of Fund shares. |
(f) | Does not include expenses of the investment companies in which the Fund invests. |
(g) | Portfolio turnover is calculated on the basis of the Fund as a whole, without distinguishing among the classes of shares. |
(h) | Recognition of net investment income (loss) by the Fund is affected by the timing of the declaration of dividends by the underlying investment companies in which the Fund invests. |
(i) | The amount shown for a share outstanding throughout the year may not correlate with the Statement of Operations for the year due to the timing of sales and redemptions of Fund shares in relation to income earned, class specific expense structure, and/or fluctuating market value of the investments of the Fund. |
See accompanying Notes to Financial Statements.
57
North Square Tactical Defensive Fund
Financial Highlights
Class I
(For a share outstanding during each period)
| | | For the
Six Months
Ended
November 30,
2024 | | | For the Years Ended May 31, | |
| | | (Unaudited) | | | 2024 | | | 2023 | | | 2022(a) | | | 2021 | | | 2020 | |
Selected Per Share Data: | | | | | | | | | | | | | | | | | | | | | | | | |
Net asset value, beginning of period | | $ | 18.17 | | | $ | 15.86 | | | $ | 16.47 | | | $ | 16.39 | | | $ | 12.69 | | | $ | 13.79 | |
| | | | | | | | | | | | | | | | | | | | | | | | | |
Investment operations: | | | | | | | | | | | | | | | | | | | | | | | | |
Net investment income (loss)(b)(h) | | | 0.03 | | | | 0.18 | | | | 0.09 | | | | (0.07 | ) | | | (0.07 | ) | | | 0.09 | |
Net realized and unrealized gain (loss) | | | 0.87 | | | | 2.13 | | | | (0.70 | ) | | | 0.15 | | | | 3.77 | | | | (1.13 | ) |
Total from investment operations | | | 0.90 | | | | 2.31 | | | | (0.61 | ) | | | 0.08 | | | | 3.70 | | | | (1.04 | ) |
| | | | | | | | | | | | | | | | | | | | | | | | | |
Less distributions: | | | | | | | | | | | | | | | | | | | | | | | | |
Net investment income | | | — | | | | — | | | | — | | | | — | | | | — | | | | (0.06 | ) |
Total distributions | | | — | | | | — | | | | — | | | | — | | | | — | | | | (0.06 | ) |
| | | | | | | | | | | | | | | | | | | | | | | | | |
Net asset value, end of period | | $ | 19.07 | | | $ | 18.17 | | | $ | 15.86 | | | $ | 16.47 | | | $ | 16.39 | | | $ | 12.69 | |
| | | | | | | | | | | | | | | | | | | | | | | | | |
Total Return(c) | | | 4.95 | %(d) | | | 14.56 | % | | | (3.70 | )% | | | 0.46 | % | | | 29.16 | % | | | (7.61 | )% |
| | | | | | | | | | | | | | | | | | | | | | | | | |
Ratios and Supplemental Data: | | | | | | | | | | | | | | | | | | | | | | | | |
Net assets, end of period (in thousands) | | $ | 34,323 | | | $ | 31,947 | | | $ | 36,249 | | | $ | 42,354 | | | $ | 44,999 | | | $ | 46,311 | |
Ratio of expenses to average net assets: | | | | | | | | | | | | | | | | | | | | | | | | |
Before fee waived(f) | | | 1.71 | %(e) | | | 1.77 | % | | | 1.77 | % | | | 1.66 | % | | | 1.68 | % | | | 1.66 | % |
After fees waived(f) | | | 1.63 | %(e) | | | 1.70 | % | | | 1.70 | % | | | 1.66 | % | | | 1.68 | % | | | 1.66 | % |
Ratio of net investment gain (loss) to average net assets: | | | | | | | | | | | | | | | | | | | | | | | | |
Before fee waived(f) | | | 0.23 | %(e) | | | 1.02 | % | | | 0.47 | % | | | (0.44 | )% | | | (0.50 | )% | | | 0.65 | % |
After fees waived(f) | | | 0.31 | %(e) | | | 1.09 | % | | | 0.53 | % | | | (0.44 | )% | | | (0.50 | )% | | | 0.65 | % |
Portfolio turnover rate(g) | | | 93 | %(d) | | | 296 | % | | | 677 | % | | | 289 | % | | | 350 | % | | | 522 | % |
(a) | Effective June 11, 2021, the Stadion Tactical Defensive Fund Class I converted to the North Square Tactical Defensive Fund Class I. See Note 1. |
(b) | Based on average shares outstanding for the period. |
(c) | Total returns would have been lower had expenses not been waived by the Adviser. Returns shown do not reflect the deduction of taxes that a shareholder would pay on Fund distributions or the redemption of Fund shares. |
(f) | Does not include expenses of the investment companies in which the Fund invests. |
(g) | Portfolio turnover is calculated on the basis of the Fund as a whole, without distinguishing among the classes of shares. |
(h) | Recognition of net investment income (loss) by the Fund is affected by the timing of the declaration of dividends by the underlying investment companies in which the Fund invests. |
See accompanying Notes to Financial Statements.
58
North Square Core Plus Bond Fund
Financial Highlights
Class I
(For a share outstanding during each period)
| | | For the
Six Months
Ended
November 30,
2024 | | | For the Years Ended May 31, | |
| | | (Unaudited) | | | 2024 | | | 2023 | | | 2022(a) | | | 2021 | | | 2020 | |
Selected Per Share Data: | | | | | | | | | | | | | | | | | | | | | | | | |
Net asset value, beginning of period | | $ | 10.15 | | | $ | 10.33 | | | $ | 11.05 | | | $ | 11.71 | | | $ | 10.76 | | | $ | 10.40 | |
| | | | | | | | | | | | | | | | | | | | | | | | | |
Investment operations: | | | | | | | | | | | | | | | | | | | | | | | | |
Net investment income(b)(h) | | | 0.17 | | | | 0.17 | | | | 0.13 | | | | 0.05 | | | | 0.09 | | | | 0.15 | |
Net realized and unrealized gain (loss) | | | 0.51 | | | | (0.17 | ) | | | (0.74 | ) | | | (0.68 | ) | | | 0.98 | | | | 0.41 | |
Total from investment operations | | | 0.68 | | | | 0.0 | | | | (0.61 | ) | | | (0.63 | ) | | | 1.07 | | | | 0.56 | |
| | | | | | | | | | | | | | | | | | | | | | | | | |
Less distributions: | | | | | | | | | | | | | | | | | | | | | | | | |
Net investment income | | | (0.23 | ) | | | (0.21 | ) | | | (0.11 | ) | | | (0.03 | ) | | | (0.11 | ) | | | (0.20 | ) |
From net realized gains | | | — | | | | — | | | | — | | | | — | | | | (0.01 | ) | | | — | |
Total distributions | | | (0.23 | ) | | | (0.21 | ) | | | (0.11 | ) | | | (0.03 | ) | | | (0.12 | ) | | | (0.20 | ) |
| | | | | | | | | | | | | | | | | | | | | | | | | |
Net asset value, end of period | | $ | 10.60 | | | $ | 10.15 | | | $ | 10.33 | | | $ | 11.05 | | | $ | 11.71 | | | $ | 10.76 | |
| | | | | | | | | | | | | | | | | | | | | | | | | |
Total Return(c) | | | 6.66 | % | | | 0.33 | % | | | (5.56 | )% | | | (5.45 | )% | | | 9.98 | % | | | 5.39 | % |
| | | | | | | | | | | | | | | | | | | | | | | | | |
Ratios and Supplemental Data: | | | | | | | | | | | | | | | | | | | | | | | | |
Net assets, end of period (in thousands) | | $ | 18,171 | | | $ | 16,070 | | | $ | 22,767 | | | $ | 35,788 | | | $ | 39,552 | | | $ | 42,622 | |
Ratio of expenses to average net assets: | | | | | | | | | | | | | | | | | | | | | | | | |
Before fee waived(f) | | | 4.01 | %(e) | | | 2.08 | % | | | 1.89 | % | | | 1.68 | % | | | 1.79 | % | | | 1.72 | % |
After fees waived(f) | | | 3.15 | %(e) | | | 1.38 | % | | | 1.38 | % | | | 1.38 | % | | | 1.38 | % | | | 1.38 | % |
Ratio of net investment gain to average net assets: | | | | | | | | | | | | | | | | | | | | | | | | |
Before fees waived(f) | | | 1.28 | %(e) | | | 1.28 | % | | | 0.73 | % | | | 0.13 | % | | | 0.43 | % | | | 1.09 | % |
After fees waived(f) | | | 1.97 | %(e) | | | 1.97 | % | | | 1.24 | % | | | 0.43 | % | | | 0.84 | % | | | 1.43 | % |
Portfolio turnover rate(g) | | | 242 | %(d) | | | 4 | % | | | 8 | % | | | 16 | % | | | 11 | % | | | 21 | % |
(a) | Effective June 11, 2021, the Stadion Trilogy Alternative Return Fund Class A converted to the North Square Trilogy Alternative Return Fund Class A. See Note 1. |
(b) | Based on average shares outstanding for the period. |
(c) | Total returns would have been lower had expenses not been waived by the Adviser. Returns shown do not reflect the deduction of taxes that a shareholder would pay on Fund distributions or the redemption of Fund shares. |
(f) | Does not include expenses of the investment companies in which the Fund invests. |
(g) | Portfolio turnover is calculated on the basis of the Fund as a whole, without distinguishing among the classes of shares. |
(h) | Recognition of net investment income (loss) by the Fund is affected by the timing of the declaration of dividends by the underlying investment companies in which the Fund invests |
See accompanying Notes to Financial Statements.
59
North Square Kennedy MicroCap Fund
Financial Highlights
Class I
(For a share outstanding during each period)
| | | For the
Period
Ended
November 30,
2024(a) | |
| | | (Unaudited) | |
Selected Per Share Data: | | | | |
Net asset value, beginning of period | | $ | 10.00 | |
| | | | | |
Investment operations: | | | | |
Net investment income(b)(h) | | | (0.02 | ) |
Net realized and unrealized gain | | | 2.75 | |
Total from investment operations | | | 2.73 | |
| | | | | |
Less distributions: | | | | |
Net investment income | | | — | |
Total distributions | | | — | |
| | | | | |
Net asset value, end of period | | $ | 12.73 | |
| | | | | |
Total Return(c) | | | 27.30 | %(d) |
| | | | | |
Ratios and Supplemental Data: | | | | |
Net assets, end of period (in thousands) | | $ | 12,463 | |
Ratio of expenses to average net assets: | | | | |
Before fee waived(f) | | | 2.84 | %(e) |
After fees waived(f) | | | 1.47 | %(e) |
Ratio of net investment gain (loss) to average net assets: | | | | |
Before fees waived(f) | | | (1.82 | )%(e) |
After fees waived(f) | | | (0.45 | )%(e) |
Portfolio turnover rate(g) | | | 46 | %(d) |
(a) | For the period June 10, 2024 (commencement of operations) to November 30, 2024. |
(b) | Based on average shares outstanding for the period. |
(c) | Total returns would have been lower had expenses not been waived by the Adviser. Returns shown do not reflect the deduction of taxes that a shareholder would pay on Fund distributions or the redemption of Fund shares. |
(f) | Does not include expenses of the investment companies in which the Fund invests. |
(g) | Portfolio turnover is calculated on the basis of the Fund as a whole, without distinguishing among the classes of shares. |
(h) | Recognition of net investment income (loss) by the Fund is affected by the timing of the declaration of dividends by the underlying investment companies in which the Fund invests. |
See accompanying Notes to Financial Statements.
60
North Square Funds
Notes to Financial Statements
November 30, 2024 (Unaudited)
Note 1 – Organization
North Square Spectrum Alpha Fund (“Spectrum Alpha” or “Spectrum Alpha Fund”), North Square Dynamic Small Cap Fund (“Dynamic Small Cap” or “Dynamic Small Cap Fund”), North Square Multi Strategy Fund (“Multi Strategy” or “Multi Strategy Fund”), North Square Preferred and Income Securities Fund (“Preferred and Income Securities” or “Preferred and Income Securities Fund”), North Square Tactical Growth Fund (“Tactical Growth” or “Tactical Growth Fund”), North Square Tactical Defensive Fund (“Tactical Defensive” or “Tactical Defensive Fund”), North Square Core Plus Bond Fund (formerly known as North Square Trilogy Alternative Return Fund (“Core Plus Bond” or “Core Plus Bond Fund”)) and North Square Kennedy MicroCap Fund (“Kennedy MicroCap” or “Kennedy MicroCap Fund”) are organized as a series of Exchange Place Advisors Trust (formerly, North Square Investments Trust), a Delaware statutory trust (the “Trust”) which is registered as an open-end management investment company under the Investment Company Act of 1940, as amended (the “1940 Act”). The Funds are diversified funds. The Trust Agreement permits the Board of Trustees (the “Board”) to issue an unlimited number of shares of beneficial interest of separate series. The Funds are each a series currently authorized by the Board.
The Spectrum Alpha Fund’s primary investment objective is to provide capital appreciation. Effective January 11, 2022, the Fund made certain changes to its principal investment strategies, including the modification of the strategies to become a “fund of funds” that invests primarily in affiliated mutual funds. Prior to January 11, 2022, the Fund invested primarily in equity securities of small capitalization companies. Effective January 11, 2022, the Fund’s sub-adviser also changed. The Fund has adopted the historical performance of the Oak Ridge Small Cap Growth Fund (the “Predecessor Fund”) as a result of a reorganization consummated after the close of business on May 10, 2019, in which the Fund acquired all of the assets, subject to the liabilities,of the Predecessor Fund. Please see the Fund’s Prospectus for additional information on the Predecessor Fund.
The Dynamic Small Cap Fund’s primary investment objective is long-term capital appreciation. The Fund has adopted the historical performance of the Oak Ridge Dynamic Small Cap Fund (the “Predecessor Fund”) as a result of a reorganization consummated after the close of business on May 10, 2019, in which the Fund acquired all of the assets, subject to the liabilities, of the Predecessor Fund. Please see the Fund’s Prospectus for additional information on the Predecessor Fund.
The Multi Strategy Fund’s primary investment objective is to provide capital appreciation. The Fund has adopted the historical performance of the Oak Ridge Multi Strategy Fund (the “Predecessor Fund”) as a result of a reorganization consummated after the close of business on May 10, 2019, in which the Fund acquired all of the assets, subject to the liabilities, of the Predecessor Fund. Please see the Fund’s Prospectus for additional information on the Predecessor Fund.
The Preferred and Income Securities Fund’s primary investment objective is to seek total return through current income and capital appreciation. Effective January 11, 2022, the Fund made certain changes to its investment objective and principal investment strategies, including the modification of the strategies to invest in a portfolio of preferred and debt securities issued by U.S. and non-U.S. companies. Prior to January 11, 2022, the Fund invested primarily in equity securities that had a record of paying dividends over at least a trailing one year period. Effective January 11, 2022, the Fund’s sub-adviser also changed. The Fund has adopted the historical performance of the Oak Ridge Dividend Growth Fund (the “Predecessor Fund”) as a result of a reorganization consummated after the close of business on May 10, 2019, in which the Fund acquired all of the assets, subject to the liabilities, of the Predecessor Fund. Please see the Fund’s Prospectus for additional information on the Predecessor Fund.
The Tactical Growth Fund’s primary investment objective is to seek long-term capital appreciation. The Fund has adopted the historical performance of the Stadion Tactical Growth Fund (the “Predecessor Fund”), a former series of Stadion Investment Trust, as a result of a reorganization consummated after the close of business on June 11, 2021 (“Reorganization”), in which the Fund acquired all of the assets, subject to the liabilities, of the Predecessor Fund. Please see the Fund’s Prospectus for additional information on the Predecessor Fund.
The Tactical Defensive Fund’s primary investment objective is to seek capital appreciation. The Fund has adopted the historical performance of the Stadion Tactical Defensive Fund (the “Predecessor Fund”), a former series of Stadion Investment Trust, as a result of a reorganization consummated after the close of business on June 11, 2021 (“Reorganization”), in which the Fund acquired all of the assets, subject to the liabilities, of the Predecessor Fund. Please see the Fund’s Prospectus for additional information on the Predecessor Fund.
The Core Plus Bond Fund’s primary investment objective is to seek high current income and long-term capital appreciation. Effective September 27, 2024, the Fund changed its name from the North Square Trilogy Alternative Return Fund and made certain changes to its investment objective and principal investment strategies, including the modification of the strategies to invest, under normal market conditions, at least 65% of its net assets in investment grade debt securities. The Fund may also invest in non-investment grade debt securities, and may employ a derivatives overlay strategy to, among other things, adjust the risk profile of the Fund’s portfolio. The Fund has adopted the historical performance of the Stadion Trilogy Alternative Return Fund, (the “Predecessor Fund”) a former series of
61
North Square Funds
Notes to Financial Statements – Continued
November 30, 2024 (Unaudited)
Stadion Investment Trust, as a result of a reorganization consummated after the close of business on June 11, 2021 (“Reorganization”), in which the Fund acquired all of the assets, subject to the liabilities, of the Stadion Trilogy Alternative Return Fund. Please see the Fund’s Prospectus for additional information on the Predecessor Fund.
The Kennedy MicroCap Fund’s primary investment objective is to provide capital appreciation. The Fund commenced operations on June 10, 2024.
The shares of each class represent an interest in the same portfolio of investments of their respective Fund and have equal rights as to voting, redemptions, dividends and liquidation, subject to the approval of the Trustees. Income, expenses (other than expenses attributable to a specific class) and realized and unrealized gains and losses on investments are allocated to each class of shares in proportion to their relative shares outstanding. Shareholders of a class that bears distribution and service expenses under the terms of a distribution plan have exclusive voting rights to that distribution plan.
Each Fund is an investment company and accordingly follows the investment company accounting and reporting guidance of the Financial Accounting Standards Board (FASB) Accounting Standard Codification Topic 946 “Financial Services—Investment Companies”.
Note 2 – Accounting Policies
The following is a summary of the significant accounting policies consistently followed by the Funds in the preparation of their financial statements. The preparation of financial statements in conformity with accounting principles generally accepted in the United States of America (“GAAP”) requires management to make estimates and assumptions that affect the reported amounts of assets and liabilities and disclosure of contingent assets and liabilities at the date of the financial statements and the reported amounts of increases and decreases in net assets from operations during the reporting period. Actual results could differ from these estimates.
(a) Valuation of Investments
Each Fund values equity securities at the last reported sale price on the principal exchange or in the principal over-the-counter (“OTC”) market in which such securities are traded, as of the close of regular trading on the NYSE on the day the securities are being valued or, if the last-quoted sales price is not readily available, the securities will be valued at the last bid or the mean between the last available bid and ask price. Securities traded on the Nasdaq are valued at the Nasdaq Official Closing Price (“NOCP”). Investments in open-end investment companies are valued at the daily closing net asset value of the respective investment company. Debt securities are valued by utilizing a price supplied by independent pricing service providers. The independent pricing service providers may use various valuation methodologies including matrix pricing and other analytical pricing models as well as market transactions and dealer quotations. These models generally consider such factors as yields or prices of bonds of comparable quality, type of issue, coupon, maturity, ratings and general market conditions. Exchange-traded options on securities and indices purchased or sold by the Funds generally will be valued at the mean of the last bid and ask prices. If a price is not readily available for a portfolio security, the security will be valued at fair value (the amount which the Fund might reasonably expect to receive for the security upon its current sale) as determined in good faith by the Fund’s Adviser, as Valuation Designee, subject to review and approval by the Valuation Committee, pursuant to procedures adopted by the Board of Trustees (the “Board”). The actions of the Valuation Committee are subsequently reviewed by the Board at its next regularly scheduled board meeting. The Valuation Committee meets as needed.
Fair value pricing may be applied to foreign securities held by the Funds upon the occurrence of an event after the close of trading on non-U.S. markets but before the close of trading on the NYSE when each Fund’s NAV is determined. If the event may result in a material adjustment to the price of the Fund’s foreign securities once non-U.S. markets open on the following business day (such as, for example, a significant surge or decline in the U.S. market), the Fund may value such foreign securities at fair value, taking into account the effect of such event, in order to calculate the Fund’s NAV. Other types of portfolio securities that the Fund may fair value include, but are not limited to: (1) investments that are illiquid or traded infrequently, including “restricted” securities and private placements for which there is no public market; (2) investments for which, in the judgment of the adviser, the market price is stale; (3) securities of an issuer that has entered into a restructuring; (4) securities for which trading has been halted or suspended; and (5) fixed income securities for which there is not a current market value quotation.
The pricing service will use a statistical analyses and quantitative models to adjust local prices using factors such as subsequent movement and changes in the prices of indexes, securities and exchange rates in other markets in determining fair value as of the time the Fund calculates the NAVs. The Board receives a report on all securities that were fair valued by the Adviser during the quarter.
62
North Square Funds
Notes to Financial Statements – Continued
November 30, 2024 (Unaudited)
In December 2020, the SEC adopted a new rule providing a framework for fund valuation practices (“Rule 2a-5”). Rule 2a-5 establishes requirements for determining fair value in good faith for purposes of the 1940 Act. Rule 2a-5 permits fund boards to designate certain parties to perform fair value determinations, subject to board oversight and certain other conditions. Rule 2a-5 also defines when market quotations are “readily available” for purposes of the 1940 Act and the threshold for determining whether a fund must fair value a security. In connection with Rule 2a-5, the SEC also adopted related recordkeeping requirements and rescinded previously issued guidance, including with respect to the role of a board in determining fair value and the accounting and auditing of fund investments. The Funds are in compliance with Rule 2a-5, which had a compliance date of September 8, 2022.
(b) Purchased/Written Option Contracts
Certain of the Funds may write or purchase option contracts to adjust risk and return of its overall investment positions. When a Fund writes or purchases an option, an amount equal to the premium received or paid by the Fund is recorded as a liability or an asset and is subsequently adjusted to the current market value of the option written or purchased. Premiums received or paid from writing or purchasing options that expire unexercised are treated by a Fund on the expiration date as realized gains or losses. The difference between the premium and the amount paid or received on affecting a closing purchase or sale transaction, including brokerage commissions, is also treated as a realized gain or loss. If an option is exercised, the premium paid or received is added to or subtracted from the cost of the purchase or proceeds from the sale in determining whether a Fund has realized a gain or loss on investment transactions. Investing in purchased and written options contracts exposes the Funds to equity price risk. For the six months ended November 30, 2024, only the Core Plus Bond Fund engaged in option contracts. Additional information regarding such activity may be found in Note 10.
(c) Futures Contracts
Certain of the Funds may use futures contracts to adjust risk and return of its overall investment positions. During the period the futures contracts are open, changes in the value of the contracts are recognized as unrealized gains or losses by “marking to market” on a daily basis to reflect the market value of the contracts at the end of each day’s trading. Variation margin payments are received or made depending upon whether unrealized gains or losses are incurred. When the contracts are closed, the Fund recognizes a realized gain or loss equal to the difference between the proceeds from, or cost of, the closing transaction and the Fund’s basis in the contract. If a Fund is unable to liquidate a futures contract and/or enter into an offsetting closing transaction, a Fund would continue to be subject to market risk with respect to the value of the contracts. For the six months ended November 30, 2024, Preferred and Income Securities Fund and the Core Plus Bond Fund engaged in futures contracts. Additional information regarding such activity may be found in Note 11.
(d) Investment Transactions, Investment Income and Expenses
Investment transactions are accounted for on the trade date. Realized gains and losses on investments are determined on the identified cost basis. Dividend income is recorded net of applicable withholding taxes on the ex-dividend date and interest income is recorded on an accrual basis. Withholding taxes on foreign dividends, if applicable, are paid (a portion of which may be reclaimable) or provided for in accordance with the applicable country’s tax rules and rates and are disclosed in the Statements of Operations. Withholding tax reclaims are filed in certain countries to recover a portion of the amounts previously withheld. The Funds record a reclaim receivable based on a number of factors, including a jurisdiction’s legal obligation to pay reclaims as well as payment history and market convention. Discounts or premiums on debt securities are accreted or amortized to interest income over the lives of the respective securities using the effective interest method. Income and expenses of the Funds are allocated on a pro rata basis to each class of shares. Expenses incurred by the Trust with respect to more than one fund are allocated in proportion to the net assets of each fund except where allocation of direct expenses to each fund or an alternative allocation method can be more appropriately made. Expenses such as distribution and service fees pursuant to Rule 12b-1, transfer agent fees and expenses with respect to the Funds, that are specific to individual share classes, are accrued directly to the respective share class.
(e) Federal Income Taxes
Each Fund intends to comply with the requirements of Subchapter M of the Internal Revenue Code applicable to regulated investment companies and to distribute substantially all of its net investment income and any net realized gains to its shareholders. Therefore, no provision is made for federal income or excise taxes. Due to the timing of dividend distributions and the differences in accounting for income and realized gains and losses for financial statement and federal income tax purposes, the fiscal year in which amounts are distributed may differ from the year in which the income and realized gains and losses are recorded by the Funds.
Accounting for Uncertainty in Income Taxes (the “Income Tax Statement”) requires an evaluation of tax positions taken (or expected to be taken) in the course of preparing a Fund’s tax returns to determine whether these positions meet a “more-likely-than-not” standard that, based on the technical merits, have a more than fifty percent likelihood of being sustained by a taxing authority upon examination. A
63
North Square Funds
Notes to Financial Statements – Continued
November 30, 2024 (Unaudited)
tax position that meets the “more-likely-than-not” recognition threshold is measured to determine the amount of benefit to recognize in the financial statements. Each Fund recognizes interest and penalties, if any, related to unrecognized tax benefits as income tax expense in the Statement of Operations.
The Income Tax Statement requires management of the Funds to analyze tax positions taken in the prior three open tax years, if any, and tax positions expected to be taken in the Funds’ current tax year, as defined by the IRS statute of limitations for all major jurisdictions, including federal tax authorities and certain state tax authorities. As of and during the previous three tax year ends and the interim tax period since then, the Funds did not have a liability for any unrecognized tax benefits. The Funds have no examination in progress and are not aware of any tax positions for which it is reasonably possible that the total amounts of unrecognized tax benefits will significantly change in the next twelve months.
(f) Distributions to Shareholders
The Preferred and Income Securities Fund and Core Plus Bond Fund will make distributions of net investment income monthly. The Spectrum Alpha Fund, Dynamic Small Cap Fund, Multi Strategy Fund, Tactical Growth Fund, Tactical Defensive Fund, and Kennedy MicroCap Fund will make distributions of net investment income, if any, at least annually. Each Fund makes distributions of its net capital gains, if any, at least annually. Distributions to shareholders are recorded on the ex-dividend date. The amount and timing of distributions are determined in accordance with federal income tax regulations, which may differ from GAAP.
The character of distributions made during the year from net investment income or net realized gains may differ from the characterization for federal income tax purposes due to differences in the recognition of income, expense and gain (loss) items for financial statement and tax purposes.
(g) Line of Credit
During the six months ended November 30, 2024, the Trust, on behalf of the Funds, entered into a short-term credit agreement (“Line of Credit”) with U.S. Bank, N.A., expiring on June 11, 2025. The Line of Credit is intended to provide short-term financing, if necessary, subject to certain restrictions, in connection with shareholder redemptions. Under the terms of the agreement, The Trust may borrow up to the lesser of $50,000,000 or 15% of each Fund’s daily market value (10% for Small Cap Value Fund).
Fund | | Average Daily
Loan Balance(a) | | | Weighted Average
Interest Rate | | | Number of Days
Outstanding(b) | | | Interest Expense
Accrued | | | Maximum Loan
Outstanding | |
Spectrum Alpha Fund | | $ | 1,701,000 | | | | 8.50 | % | | | 1 | | | $ | 402 | | | $ | 1,701,000 | |
(a) | Averages based on the number of days outstanding. |
(b) | Number of Days Outstanding represents the total days during the six months ended November 30, 2024, that a Fund utilized the Line of Credit. |
64
North Square Funds
Notes to Financial Statements – Continued
November 30, 2024 (Unaudited)
Note 3 – Investment Advisory and Other Agreements
The Trust, on behalf of the Funds, entered into an Investment Advisory Agreement (the “Agreement”) with North Square Investments, LLC (the “Adviser” or “NSI”). Under the terms of the Agreement, the Funds pay a monthly investment advisory fee to the Adviser based on each Fund’s average daily net assets. Fees paid to the Adviser for the six months ended November 30, 2024, are reported on the Statements of Operations. The annual and tiered rates are listed by Fund in the below table:
Fund | Investment
Advisory Fees |
Spectrum Alpha Fund | 0.20% |
Dynamic Small Cap Fund | 0.90% |
Multi Strategy Fund | 0.00%-0.50%(a) |
Preferred and Income Securities Fund | 0.75% |
Tactical Growth Fund | |
First $150 million | 1.25% |
$150 million up to $500 million | 1.00% |
Thereafter | 0.85% |
Tactical Defensive Fund | |
First $150 million | 1.25% |
$150 million up to $500 million | 1.00% |
Thereafter | 0.85% |
Core Plus Bond Fund | 0.38% |
Kennedy MicroCap Fund | 1.20% |
(a) | The annual advisory fee is calculated as follows: (i) 0.00% for Fund assets invested in other series of the Trust advised by the Adviser (“affiliated investments”) and (ii) 0.50% for Fund assets invested in non-affiliated investments. For the six months ended November 30, 2024, the amount of advisory fees waived due to affiliated investments is reported under “Affiliated fund fee waived” on the Statements of Operations. |
The Adviser engages Algert Global LLC (“Algert Global”) to serve as the sub-adviser to the Dynamic Small Cap Fund, Red Cedar Investment Management, LLC (“Red Cedar”) to serve as the sub-adviser to the Preferred and Income Securities Fund and Core Plus Bond Fund, and Kennedy Capital Management LLC (“Kennedy Capital”) to serve as the sub-adviser to the Kennedy MicroCap Fund. During the semi-annual reporting period ending November 30, 2024, the Adviser engaged NSI Retail Advisors, LLC (“NSI Retail”) as the sub-adviser to the Spectrum Alpha Fund, Multi Strategy Fund, Tactical Growth Fund and Tactical Defensive Fund. On December 3-4, 2024, and subsequent to this reporting period, the Board of the Trust approved the novation, effective on December 20, 2024, of the sub-advisory agreement between the Advisor and NSI Retail to CSM respect to the Spectrum Alpha Fund, Multi Strategy Fund, Tactical Growth Fund and Tactical Defensive Fund with the effect that on that date CSM became the sub-adviser to those Funds. Additional information about this novation can be found in the Supplement dated December 20. 2024 to each Fund’s Prospectus, Summary Prospectus and Statement of Additional Information each dated September 27, 2024.
The Adviser has contractually agreed to waive its fee and, if necessary, to absorb other operating expenses to ensure that total annual operating expenses (excluding taxes, leverage interest, brokerage commissions, dividend and interest expenses on short sales, acquired fund fees and expenses as determined in accordance with Form N-1A, expenses incurred in connection with any merger or reorganization,
65
North Square Funds
Notes to Financial Statements – Continued
November 30, 2024 (Unaudited)
or extraordinary expenses such as litigation expenses) are limited. The agreements are effective until the dates listed below and may be terminated before those dates only by the Trust’s Board. The table below contains the agreement expiration and expense cap by Fund and by Class:
| | | | Total Limit on Annual Operating Expenses | |
Fund | Agreement Expires | | Class A
Shares(a) | | | Class C
Shares(a) | | | Class I
Shares(a) | |
Spectrum Alpha Fund | September 30, 2026 | | | 1.30 | % | | | — | | | | 1.05 | % |
Dynamic Small Cap Fund | September 30, 2029 | | | 1.24 | % | | | — | | | | 0.99 | % |
Multi Strategy Fund | September 30, 2029 | | | 1.56 | % | | | — | | | | 1.32 | % |
Preferred and Income Securities Fund | September 30, 2029 | | | — | | | | — | | | | 0.97 | % |
Tactical Growth Fund | September 30, 2026 | | | 1.30 | %(b) | | | 1.30 | %(b) | | | 1.30 | %(b) |
Tactical Defensive Fund | September 30, 2026 | | | 1.70 | %(b) | | | 1.70 | %(b) | | | 1.70 | %(b) |
Core Plus Bond Fund | September 30, 2026 | | | — | | | | — | | | | 0.60 | % |
Kennedy MicroCap Fund | September 30, 2025 | | | — | | | | — | | | | 1.47 | % |
(a) | The total limit on annual operating expenses is calculated based on each Fund’s average daily net assets. |
(b) | Exclusive of payments under a Rule 12b-1 Distribution Plan. |
The Adviser is permitted to seek reimbursement from the Funds, subject to certain limitations, of fees waived or payments made to the Fund for a period ending thirty-six months after the date of the waiver or payment. This reimbursement may be requested from the Fund if the reimbursement will not cause the Fund’s annual expense ratio to exceed the lesser of (a) the expense limitation amount in effect at the time such fees were waived or payments made, or (b) the expense limitation amount in effect at the time of the reimbursement. For the six months ended November 30, 2024, the Spectrum Alpha Fund recouped $139,615 and the Preferred and Income Securities Fund recouped $39,524, respectively.
The Adviser may recapture all or a portion of this amount no later than the dates stated below:
| | | Spectrum Alpha
Fund | | | Dynamic Small
Cap Fund | | | Multi Strategy
Fund | | | Preferred and
Income Securities
Fund | |
May 31, 2025 | | $ | 65,224 | | | $ | 108,606 | | | $ | — | | | $ | 33,001 | |
May 31, 2026 | | | — | | | | 238,812 | | | | — | | | | 94,057 | |
May 31, 2027 | | | — | | | | 336,562 | | | | 131,602 | | | | 58,223 | |
November 30, 2027 | | | — | | | | 193,987 | | | | 62,526 | | | | 499 | |
| | | $ | 65,224 | | | $ | 877,967 | | | $ | 194,128 | | | $ | 185,780 | |
| | | Tactical Growth
Fund | | | Tactical Defensive
Fund | | | Core Plus Bond
Fund | | | Kennedy
MicroCap Fund | |
May 31, 2025 | | $ | 260,940 | | | $ | — | | | $ | 124,575 | | | $ | — | |
May 31, 2026 | | | 952,355 | | | | 36,128 | | | | 156,673 | | | | — | |
May 31, 2027 | | | 360,461 | | | | 28,263 | | | | 153,994 | | | | — | |
November 30, 2027 | | | 91,756 | | | | 18,883 | | | | — | | | | 61,540 | |
| | | $ | 1,665,512 | | | $ | 83,274 | | | $ | 435,242 | | | $ | 61,540 | |
Ultimus Fund Solutions, LLC (the “Administrator”) serves as the Funds’ fund accountant, transfer agent and administrator. The Funds’ allocated fees incurred for fund accounting, transfer agency and fund administration for the six months ended November 30, 2024, are reported on the Statements of Operations.
Foreside Fund Services, LLC a wholly-owned subsidiary of Foreside Financial Group, LLC (d/b/a ACA Group) serves as the Funds’ distributor (the “Distributor”). The Distributor does not receive compensation from the Funds for its distribution services; the Adviser pays the Distributor a fee for its distribution related services.
66
North Square Funds
Notes to Financial Statements – Continued
November 30, 2024 (Unaudited)
Northern Lights Compliance Services, LLC (“NLCS”), an affiliate of the Administrator, provides a Chief Compliance Officer to the Trust, as well as related compliance services pursuant to a consulting agreement between NLCS and the Trust. The Funds’ allocated fees incurred for compliance services for the six months ended November 30, 2024, are reported on the Statements of Operations.
Effective January 1, 2025, each Independent Trustee receives from the Trust an annual retainer of $50,000, plus an annual fee per Fund of $2,000, plus reimbursement of related expenses. The Chairperson of the Board receives an additional annual retainer of $18,750, and each of the Chairs of the Audit Committee and the Governance Committee receives an additional annual retainer of $7,500 and $3,000, respectively. Prior to January 1, 2025, each Independent Trustee received from the Trust an annual retainer of $50,000, plus an annual fee per Fund of $1,666.67, plus reimbursement of related expenses. Prior to January 1. 2025, the Chairperson of the Board received an additional annual retainer of $6,250, and each of the Chairs of the Audit Committee and the Governance Committee received an additional annual retainer of $2,500 and $1,250, respectively. Effective November 3, 2023, each Independent Trustee receives $2,000 for each special in-person or telephonic meeting attended. The Independent Trustees may waive part of the annual retainer fees from time to time. The Trust has no pension or retirement plan. No other entity affiliated with the Trust pays any compensation to the Trustees. The Trust does not pay any compensation to the Interested Trustee or the Trust’s officers.
Certain officers and a Trustee of the Trust are also employees of the Administrator or NLCS and such persons are not paid by the Funds for serving in such capacities.
Note 4 – Federal Income Taxes
At November 30, 2024, gross unrealized appreciation and depreciation of investments, based on cost for federal income tax purposes were as follows:
| | | Spectrum Alpha
Fund | | | Dynamic Small
Cap Fund | | | Multi Strategy
Fund | | | Preferred and
Income Securities
Fund | |
Tax cost of investments | | $ | 66,767,915 | | | $ | 361,120,592 | | | $ | 33,030,987 | | | $ | 238,093,335 | |
Gross unrealized appreciation | | | 20,522,231 | | | | 74,248,241 | | | | 9,285,130 | | | | 13,071,979 | |
Gross unrealized depreciation | | | (115,606 | ) | | | (8,495,370 | ) | | | 47,263 | | | | (341,592 | ) |
Net unrealized appreciation (depreciation) on investments | | $ | 20,406,625 | | | $ | 65,752,871 | | | $ | 9,332,393 | | | $ | 12,730,387 | |
| | | Tactical Growth
Fund | | | Tactical Defensive
Fund | | | Core Plus Bond
Fund | | | Kennedy
MicroCap Fund | |
Tax cost of investments | | $ | 338,869,404 | | | $ | 50,850,363 | | | $ | 17,893,677 | | | $ | 10,342,215 | |
Gross unrealized appreciation | | | 219,477,345 | | | | 6,778,173 | | | | 527,811 | | | | 2,515,520 | |
Gross unrealized depreciation | | | (31,466 | ) | | | — | | | | (217,284 | ) | | | (332,805 | ) |
Net unrealized appreciation (depreciation) on investments | | $ | 219,445,879 | | | $ | 6,778,173 | | | $ | 310,527 | | | $ | 2,182,715 | |
The difference between cost amounts for financial statement and federal income tax purposes is due primarily to timing differences in recognizing certain gains and losses in security transactions.
67
North Square Funds
Notes to Financial Statements – Continued
November 30, 2024 (Unaudited)
As of May 31, 2024, the components of accumulated earnings (deficit) on a tax basis for the Funds were as follows:
| | | Spectrum Alpha
Fund | | | Dynamic Small
Cap Fund | | | Multi Strategy
Fund | | | Preferred and
Income Securities
Fund | |
| | | 2024 | | | 2024 | | | 2024 | | | 2024 | |
Undistributed ordinary income | | $ | — | | | $ | 1,875,529 | | | $ | 331,370 | | | $ | — | |
Accumulated capital and other losses | | | (5,367,881 | ) | | | — | | | | — | | | | (665,546 | ) |
Undistributed capital gains | | | — | | | | 4,511,952 | | | | 454,463 | | | | — | |
Other temporary difference | | | — | | | | — | | | | — | | | | 1,483,813 | |
Unrealized appreciation (depreciation) on investments | | | 8,419,816 | | | | 26,536,619 | | | | 6,041,749 | | | | 9,195,997 | |
Total accumulated deficit | | $ | 3,051,935 | | | $ | 32,924,100 | | | $ | 6,827,582 | | | $ | 10,014,264 | |
| | | Tactical Growth
Fund | | | Tactical Defensive
Fund | | | Core Plus Bond
Fund | |
| | | 2024 | | | 2024 | | | 2024 | |
Undistributed ordinary income | | $ | — | | | $ | 544,283 | | | $ | 118,250 | |
Accumulated capital and other losses | | | — | | | | (8,080,999 | ) | | | (2,822,180 | ) |
Undistributed capital gains | | | 7,241,507 | | | | — | | | | — | |
Other temporary difference | | | — | | | | — | | | | — | |
Unrealized appreciation (depreciation) on investments | | | 164,182,814 | | | | 3,106,857 | | | | 4,419,035 | |
Total accumulated deficit | | $ | 171,424,321 | | | $ | (4,429,859 | ) | | $ | 1,715,105 | |
The tax character of distributions paid for the fiscal year ended May 31, 2024, were as follows:
| | | Spectrum Alpha
Fund | | | Dynamic Small
Cap Fund | | | Multi Strategy
Fund | |
| | | 2024 | | | 2024 | | | 2024 | |
Distributions paid from: | | | | | | | | | | | | |
Ordinary income | | $ | — | | | $ | 256,513 | | | $ | 498,846 | |
Long-term capital gains | | | — | | | | — | | | | — | |
Total distributions paid | | $ | — | | | $ | 256,513 | | | $ | 498,846 | |
| | | Preferred and
Income Securities
Fund | | | Tactical Growth
Fund | | | Tactical Defensive
Fund | |
| | | 2024 | | | 2024 | | | 2024 | |
Distributions paid from: | | | | | | | | | | | | |
Ordinary income | | $ | 3,314,596 | | | $ | 3,211,349 | | | $ | — | |
Long-term capital gains | | | — | | | | 867,963 | | | | — | |
Return of capital | | | 839,988 | | | | — | | | | — | |
Total distributions paid | | $ | 4,154,584 | | | $ | 4,079,312 | | | $ | — | |
68
North Square Funds
Notes to Financial Statements – Continued
November 30, 2024 (Unaudited)
| | | Tactical Defensive
Fund | | | Core Plus Bond
Fund | |
| | | 2024 | | | 2024 | |
Distributions paid from: | | | | | | | | |
Ordinary income | | $ | — | | | $ | 410,821 | |
Long-term capital gains | | | — | | | | — | |
Distributions paid from: | | | — | | | | — | |
Ordinary income | | | — | | | | — | |
Total distributions paid | | $ | — | | | $ | 410,821 | |
As of May 31, 2024, the following Funds have non-expiring capital loss carryforwards:
Fund | | Short-Term | | | Long-Term | |
Spectrum Alpha Fund | | $ | 131,021 | | | $ | 3,519,502 | |
Preferred and Income Securities Fund | | | 623,358 | | | | 42,189 | |
Tactical Defensive Fund | | | 8,080,999 | | | | — | |
Core Plus Bond Fund | | | 2,822,180 | | | | — | |
To the extent that a Fund may realize future net capital gains, those gains will be offset by any of its unused capital loss carryforward. Future capital loss carryover utilization in any given year may be subject to Internal Revenue Code limitations. During the fiscal year ended May 31, 2024, the Funds utilized capital loss carryforwards as follows:
Fund | | Short-Term | | | Long-Term | |
Dynamic Small Cap Fund | | $ | 11,931,483 | | | $ | — | |
Multi Strategy Fund | | | — | | | | — | |
Preferred and Income Securities Fund | | | 2,406,331 | | | | 340,418 | |
Tactical Growth Fund | | | 2,893,738 | | | | 1,694,586 | |
Tactical Defensive Fund | | | 3,603,097 | | | | — | |
Core Plus Bond Fund | | | 528,072 | | | | — | |
As of May 31, 2024, the Funds had the following qualified late-year ordinary losses and post-October losses which are deferred until fiscal year 2025 for tax purposes. Net late-year losses incurred after December 31, and within the taxable year are deemed to arise on the first day of the Fund’s next taxable year. Capital losses incurred after October 31 within that taxable year are deemed to arise on the first day of the Fund’s next taxable year.
Fund | | Late Year Losses | | | Post-October Losses | |
Spectrum Alpha Fund | | $ | 384,225 | | | $ | — | |
Note 5 – Investment Transactions
For the six months ended November 30, 2024, purchases and sales of investments were as follows:
Fund | | Purchases | | | Sales | |
Spectrum Alpha Fund | | $ | 11,515,204 | | | $ | 20,130,664 | |
Dynamic Small Cap Fund | | | 402,806,101 | | | | 282,522,018 | |
Multi Strategy Fund | | | 1,828,781 | | | | 3,870,192 | |
Preferred and Income Securities Fund | | | 18,706,212 | | | | 13,127,871 | |
Tactical Growth Fund | | | 163,706,671 | | | | 62,741,168 | |
Tactical Defensive Fund | | | 52,155,575 | | | | 52,970,398 | |
Core Plus Bond | | | 16,337,649 | | | | 23,427,716 | |
Kennedy MicroCap | | | 13,304,332 | | | | 4,228,166 | |
69
North Square Funds
Notes to Financial Statements – Continued
November 30, 2024 (Unaudited)
For the six months ended November 30, 2024, the Core Plus Bond Fund had purchases and sales of long-term U.S. government obligations of $5,105,707 and $3,402,699, respectively. Long-term purchases and sales of U.S. Government Obligations are excluded from purchases and sales of investments.
For the six months ended November 30, 2024, the Kennedy MicroCap Fund had purchases for in-kind transactions in the amount of $867,840.
Note 6 – Shareholder Servicing Plan
The Trust, on behalf of the Funds, has adopted a Shareholder Service Plan (the “Shareholder Service Plan”) with respect to each of the Fund’s Class A shares, Class C, and Class I shares, as applicable. Under the Shareholder Service Plan, the Funds may pay a fee at an annual rate of up to 0.15% of its average daily net assets attributable to Class A shares, Class C shares, and Class I shares, as applicable, to shareholder servicing agents. Shareholder servicing agents provide non-distribution administrative and support services to their customers, which may include establishing and maintaining accounts and records relating to shareholders, processing dividend and distribution payments from the Funds on behalf of shareholders, responding to routine inquiries from shareholders concerning their investments, assisting shareholders in changing dividend options, account designations and addresses, and other similar services.
For the six months ended November 30, 2024, shareholder servicing fees incurred are disclosed on the Statements of Operations.
Note 7 – Distribution Plan
The Trust, on behalf of each Fund, has adopted a Distribution Plan (the “Plan”) pursuant to Rule 12b-1 under the 1940 Act that allows each Fund to pay distribution fees for the sale and distribution of its Class A shares. The Plan provides for the payment of distribution fees at the annual rate of up to 0.25% of each Fund’s average daily net assets attributable to Class A shares and up to 1.00% of each Fund’s average daily net assets attributable to Class C shares, respectively.
For the six months ended November 30, 2024, distribution fees incurred with respect to Class A and Class C shares are disclosed on the Statements of Operations.
Note 8 – Indemnifications
In the normal course of business, the Funds enter into contracts that contain a variety of representations which provide general indemnifications. The Funds’ maximum exposure under these arrangements is unknown, as this would involve future claims that may be made against the Funds that have not yet occurred. However, the Funds expect the risk of loss to be remote.
Note 9 – Fair Value Measurements and Disclosure
Fair Value Measurements and Disclosures defines fair value, establishes a framework for measuring fair value in accordance with GAAP, and expands disclosure about fair value measurements. It also provides guidance on determining when there has been a significant decrease in the volume and level of activity for an asset or a liability, when a transaction is not orderly, and how that information must be incorporated into a fair value measurement.
Under Fair Value Measurements and Disclosures, various inputs are used in determining the value of the Funds’ investments. These inputs are summarized into three broad Levels as described below:
| | ● | Level 1 – Unadjusted quoted prices in active markets for identical assets or liabilities that the Fund has the ability to access. |
| | ● | Level 2 – Observable inputs other than quoted prices included in Level 1 that are observable for the asset or liability, either directly or indirectly. These inputs may include quoted prices for the identical instrument on an inactive market, prices for similar instruments, interest rates, prepayment speeds, credit risk, yield curves, default rates and similar data. |
| | ● | Level 3 – Unobservable inputs for the asset or liability, to the extent relevant observable inputs are not available, representing the Fund’s own assumptions about the assumptions a market participant would use in valuing the asset or liability, and would be based on the best information available. |
70
North Square Funds
Notes to Financial Statements – Continued
November 30, 2024 (Unaudited)
Options contracts are valued at the mean of the National Best Bid and Offer (NBBO) prices as determined by the Options Pricing Reporting Authority (ORPA) (which is the best bid and offer price across all of the option exchanges). If no bid price is readily available, the option shall be valued at the mean of the last quoted ask price and $0.00. If (i) no bid price is readily available, and (ii) no ask price is readily available, the option will be valued at the last valid NBBO mean price and are generally categorized as Level 2.
Futures contracts are carried at fair value using the primary exchange’s closing (settlement) price and are generally categorized in Level 1.
The availability of observable inputs can vary from security to security and is affected by a wide variety of factors, including for example, the type of security, whether the security is new and not yet established in the marketplace, the liquidity of markets, and other characteristics particular to the security. To the extent that valuation is based on models or inputs that are less observable or unobservable in the market, the determination of fair value requires more judgment. Accordingly, the degree of judgment exercised in determining fair value is greatest for instruments categorized in Level 3.
The inputs to measure fair value may fall into different Levels of the fair value hierarchy. In such cases, for disclosure purposes, the Level in the fair value hierarchy within which the fair value measurement falls in its entirety, is determined based on the lowest Level input that is significant to the fair value measurement in its entirety.
The inputs or methodology used for valuing securities are not an indication of the risk associated with investing in those securities. The following is a summary of the inputs used, as of November 30, 2024, in valuing the Funds’ assets carried at fair value:
Spectrum Alpha Fund | | Valuation Inputs | | | | |
Investments | | Level 1 | | | Level 2 | | | Level 3 | | | Total | |
Exchange-Traded Funds | | $ | 1,112,602 | | | $ | — | | | $ | — | | | $ | 1,112,602 | |
Mutual Funds | | | 85,718,514 | | | | — | | | | — | | | | 85,718,514 | |
Short-Term Investments | | | 343,424 | | | | — | | | | — | | | | 343,424 | |
Total | | $ | 87,174,540 | | | $ | — | | | $ | — | | | $ | 87,174,540 | |
Dynamic Small Cap Fund | | Valuation Inputs | | | | |
Investments | | Level 1 | | | Level 2 | | | Level 3 | | | Total | |
Common Stocks(a) | | $ | 420,855,105 | | | $ | — | | | $ | — | | | $ | 420,855,105 | |
Exchange-Traded Funds | | | 2,382,420 | | | | — | | | | — | | | | 2,382,420 | |
Rights | | | — | | | | — | | | | — | | | | — | |
Short-Term Investments | | | 3,635,939 | | | | — | | | | — | | | | 3,635,939 | |
Total | | $ | 426,873,464 | | | $ | — | | | $ | — | | | $ | 426,873,464 | |
Multi Strategy Fund | | Valuation Inputs | | | | |
Investments | | Level 1 | | | Level 2 | | | Level 3 | | | Total | |
Exchange-Traded Funds | | $ | 14,884,260 | | | $ | — | | | $ | — | | | $ | 14,884,260 | |
Mutual Funds | | | 26,907,666 | | | | — | | | | — | | | | 26,907,666 | |
Short-Term Investments | | | 571,454 | | | | — | | | | — | | | | 571,454 | |
Total | | $ | 42,363,380 | | | $ | — | | | $ | — | | | $ | 42,363,380 | |
71
North Square Funds
Notes to Financial Statements – Continued
November 30, 2024 (Unaudited)
Preferred and Income Securities Fund | | Valuation Inputs | | | | |
Investments | | Level 1 | | | Level 2 | | | Level 3 | | | Total | |
Preferred Stocks(a) | | $ | — | | | $ | 4,836,661 | | | $ | — | | | $ | 4,836,661 | |
Corporate Bonds(a) | | | — | | | | 235,153,567 | | | | — | | | | 235,153,567 | |
Non U.S. Government & Agencies | | | — | | | | 1,018,684 | | | | — | | | | 1,018,684 | |
Short-Term Investments | | | 9,814,696 | | | | — | | | | — | | | | 9,814,696 | |
Total | | $ | 9,814,696 | | | $ | 241,008,912 | | | $ | — | | | $ | 250,823,608 | |
| | | | | | | | | | | | | | | | | |
Futures Contracts(b) | | | | | | | | | | | | | | | | |
Assets | | $ | 697,125 | | | $ | — | | | $ | — | | | $ | 697,125 | |
Total | | $ | 697,125 | | | $ | — | | | $ | — | | | $ | 697,125 | |
Tactical Growth Fund | | Valuation Inputs | | | | |
Investments | | Level 1 | | | Level 2 | | | Level 3 | | | Total | |
Exchange-Traded Funds | | $ | 513,641,871 | | | $ | — | | | $ | — | | | $ | 513,641,871 | |
Short-Term Investments | | | 44,673,412 | | | | — | | | | — | | | | 44,673,412 | |
Total | | $ | 558,315,283 | | | $ | — | | | $ | — | | | $ | 558,315,283 | |
Tactical Defensive Fund | | Valuation Inputs | | | | |
Investments | | Level 1 | | | Level 2 | | | Level 3 | | | Total | |
Exchange-Traded Funds | | $ | 56,662,954 | | | $ | — | | | $ | — | | | $ | 56,662,954 | |
Short-Term Investments | | | 965,582 | | | | — | | | | — | | | | 965,582 | |
Total | | $ | 57,628,536 | | | $ | — | | | $ | — | | | $ | 57,628,536 | |
Core Plus Bond Fund | | Valuation Inputs | | | | |
Investments | | Level 1 | | | Level 2 | | | Level 3 | | | Total | |
Preferred Stocks(a) | | $ | 72,875 | | | $ | — | | | $ | — | | | $ | 72,875 | |
Asset Backed Securities | | | — | | | | 1,699,918 | | | | — | | | | 1,699,918 | |
Corporate Bonds(a) | | | — | | | | 7,786,720 | | | | — | | | | 7,786,720 | |
Mortgage-Backed Securities | | | — | | | | 5,640,809 | | | | — | | | | 5,640,809 | |
Non-U.S. Government & Agencies | | | — | | | | 117,216 | | | | — | | | | 117,216 | |
U.S. Government & Agencies | | | — | | | | 2,013,430 | | | | — | | | | 2,013,430 | |
Purchased Options | | | 295,000 | | | | — | | | | — | | | | 295,000 | |
Short-Term Investments | | | 578,236 | | | | — | | | | — | | | | 578,236 | |
Total | | $ | 946,111 | | | $ | 17,258,093 | | | $ | — | | | $ | 18,204,204 | |
| | | | | | | | | | | | | | | | | |
Futures Contracts(b) | | | | | | | | | | | | | | | | |
Assets | | $ | 9,469 | | | $ | — | | | $ | — | | | $ | 9,469 | |
Liabilities | | $ | (106,338 | ) | | $ | — | | | $ | — | | | $ | (106,338 | ) |
Total | | $ | (96,869 | ) | | $ | — | | | $ | — | | | $ | (96,869 | ) |
72
North Square Funds
Notes to Financial Statements – Continued
November 30, 2024 (Unaudited)
Kennedy MicroCap Fund | | Valuation Inputs | | | | |
Investments | | Level 1 | | | Level 2 | | | Level 3 | | | Total | |
Common Stocks(a) | | $ | 11,858,825 | | | $ | — | | | $ | — | | | $ | 11,858,825 | |
Short-Term Investments | | | 666,105 | | | | — | | | | — | | | | 666,105 | |
Total | | $ | 12,524,930 | | | $ | — | | | $ | — | | | $ | 12,524,930 | |
(a) | Refer to Schedule of Investments for sector and industry classifications. |
(b) | The amount shown represents the net unrealized appreciation/depreciation of the futures contracts. |
The Funds did not hold any assets at any time during the reporting period in which significant unobservable inputs were used in determining fair value; therefore, no reconciliation of Level 3 securities is included for this reporting period.
Note 10 – Investments in Affiliated Issuers
An affiliated issuer is an entity in which the Fund has ownership of at least 5% of the voting securities or any investment in a North Square Fund. Issuers that are affiliates of the Fund at period-end are noted in the Fund’s Schedule of Investments. Additional security purchases and the reduction of certain securities shares outstanding of existing portfolio holdings that were not considered affiliated in prior years may result in the Fund owning in excess of 5% of the outstanding shares at period-end. The table below reflects transactions during the period with entities that are affiliates as of November 30, 2024, and may include acquisitions of new investments, prior year holdings that became affiliated during the period and prior period affiliated holdings that are no longer affiliated as of period-end.
Spectrum Alpha Fund
| | | Value
Beginning of
Period | | | Purchases | | | Sales Proceeds | | | Net Realized
Gain (Loss) | | | Change in
Unrealized
Appreciation /
(Depreciation) | | | Value End of
Period | | | Dividend
Income | | | Capital Gain
Distributions | |
North Square Advisory Research Small Value Fund | | $ | 20,306,102 | | | $ | — | | | $ | (1,400,000 | ) | | $ | 103,718 | | | $ | 3,633,028 | | | $ | 22,642,848 | | | $ | — | | | $ | — | |
North Square Dynamic Small Cap Fund | | | 56,920,660 | | | | — | | | | (12,275,000 | ) | | | 1,885,711 | | | | 6,420,994 | | | | 52,952,365 | | | | — | | | | — | |
North Square Kennedy MicroCap Fund | | | — | | | | 8,000,000 | | | | — | | | | — | | | | 2,123,300 | | | | 10,123,300 | | | | — | | | | — | |
Total | | $ | 77,226,762 | | | $ | 8,000,000 | | | $ | (13,675,000 | ) | | $ | 1,989,429 | | | $ | 12,177,322 | | | $ | 85,718,513 | | | $ | — | | | $ | — | |
| | | Shares
Beginning of
Period | | | Purchases | | | Sales | | | Shares End of
Period | |
North Square Advisory Research Small Value Fund | | $ | 1,687,955 | | | | | | | $ | (111,155 | ) | | $ | 1,576,800 | |
North Square Dynamic Small Cap Fund | | | 3,869,521 | | | | | | | | (810,459 | ) | | | 3,059,062 | |
North Square Kennedy MicroCap Fund | | | — | | | | 795,232 | | | | — | | | | 795,232 | |
Total | | $ | 5,557,476 | | | $ | 795,232 | | | $ | (921,614 | ) | | $ | 5,431,094 | |
73
North Square Funds
Notes to Financial Statements – Continued
November 30, 2024 (Unaudited)
Multi Strategy Fund
| | | Value
Beginning of
Period | | | Purchases | | | Sales Proceeds | | | Net Realized
Gain (Loss) | | | Change in
Unrealized
Appreciation /
(Depreciation) | | | Value End of
Period | | | Dividend
Income | | | Capital Gain
Distributions | |
North Square Advisory Research Small Value Fund | | $ | 2,616,854 | | | $ | — | | | $ | (200,001 | ) | | $ | 23,580 | | | $ | 448,135 | | | $ | 2,888,568 | | | $ | — | | | $ | — | |
North Square Altrinsic International Equity Fund | | | 6,045,285 | | | | — | | | | (400,000 | ) | | | 20,271 | | | | 70,329 | | | | 5,735,885 | | | | — | | | | — | |
North Square Dynamic Small Cap Fund | | | 7,850,695 | | | | — | | | | (1,625,000 | ) | | | 298,327 | | | | 874,166 | | | | 7,398,188 | | | | — | | | | — | |
North Square Kennedy MicroCap Fund | | | — | | | | 800,000 | | | | — | | | | — | | | | 212,330 | | | | 1,012,330 | | | | — | | | | — | |
North Square McKee Bond | | | 4,184,532 | | | | 487,746 | | | | (150,000 | ) | | | (16,852 | ) | | | 138,493 | | | | 4,643,919 | | | | 14,864 | | | | — | |
North Square Preferred And Income Securities Fund | | | 5,901,416 | | | | 123,946 | | | | (1,050,000 | ) | | | 314,037 | | | | (60,623 | ) | | | 5,228,776 | | | | 86,749 | | | | — | |
Total | | $ | 26,598,782 | | | $ | 1,411,692 | | | $ | (3,425,001 | ) | | $ | 639,363 | | | $ | 1,682,830 | | | $ | 26,907,666 | | | $ | 101,613 | | | $ | — | |
| | | Shares
Beginning of
Period | | | Purchases | | | Sales | | | Shares End of
Period | |
North Square Advisory Research Small Value Fund | | $ | 217,527 | | | $ | — | | | $ | (16,373 | ) | | $ | 201,154 | |
North Square Altrinsic International Equity Fund | | | 532,624 | | | | — | | | | (35,149 | ) | | | 497,475 | |
North Square Dynamic Small Cap Fund | | | 533,698 | | | | — | | | | (106,304 | ) | | | 427,394 | |
North Square Kennedy MicroCap Fund | | | — | | | | 79,523 | | | | — | | | | 79,523 | |
North Square McKee Bond | | | 484,321 | | | | 55,328 | | | | (16,685 | ) | | | 522,964 | |
North Square Preferred And Income Securities Fund | | | 285,506 | | | | 5,880 | | | | (49,089 | ) | | | 242,297 | |
Total | | $ | 2,053,676 | | | $ | 140,731 | | | $ | (223,600 | ) | | $ | 1,970,807 | |
Note 11 – Derivative and Other Financial Instruments
At November 30, 2024, the Preferred and Income Securities Fund and the Core Plus Bond Fund held derivative and other financial instruments which are not subject to a master netting arrangement.
The following table provides a summary of offsetting financial liabilities and derivatives and the effect of derivative instruments on the Statement of Assets and Liabilities as of November 30, 2024:
Insert Derivatives Offset Table
The following table presents the fair value of derivative instruments for the Preferred and Income Securities Fund and the Core Plus Bond Fund as of November 30, 2024, as presented on the Fund’s Statement of Assets and Liabilities:
Location of Derivatives on Statements of Assets and Liabilities |
Derivatives | Asset Derivatives | Liability Derivatives | Fair Value |
Core Plus Bond Fund | | | |
Equity Price Risk: | | | |
Purchased Options | Investments, at value | | $ 295,000 |
74
North Square Funds
Notes to Financial Statements – Continued
November 30, 2024 (Unaudited)
The following table presents the results of the derivative trading and information related to volume for the year ended November 30, 2024, for the Preferred and Income Securities Fund and the Core Plus Bond Fund. The below captions of “Net Realized” and “Net Change in Unrealized” correspond to the captions in the Fund’s Statement of Operations.
Derivatives | Location of Gain (Loss) on Derivatives
on Statements of Operations | Realized Gain (Loss) on
Derivatives | Change in Unrealized
Appreciation
(Depreciation) on
Derivatives |
Preferred and Income Securities Fund | | | |
| | Net realized gain (loss) and change in unrealized appreciation (depreciation) on futures contracts | $ (114,263) | $ 658,075 |
Core Plus Bond Fund | | | |
Equity Price Risk: | | | |
Purchased Options | Net realized gain (loss) and change in unrealized appreciation (depreciation) on purchased options | (21,938) | 800,504 |
Written Options | Net realized gain and change in unrealized appreciation (depreciation) on written options | — | (282,781) |
Futures | Net realized gain and change in unrealized appreciation (depreciation) on written options | 37,913 | (96,869) |
The average monthly notional amount is shown as an indicator of volume. The average monthly notional amounts held in the Preferred and Income Securities Fund and the Core Plus Bond Fund during the six months ended November 30, 2024 were:
Derivatives | Derivatives | | Average Ending
Monthly Fair Value | |
Preferred and Income Securities Fund | Short Futures(a) | | | (9,734,776 | ) |
Core Plus Bond Fund | Purchased Options(a) | | $ | 764,123 | |
| | Written Options(b) | | | (883,021 | ) |
| | Long Futures(c) | | | 743,875 | |
(a) | Average based on the five months during the period that had activity. |
(b) | Average based on the three months during the period that had activity. |
(c) | Average based on the two months during the period that had activity. |
Note 12 – Underlying Investment in Other Investment Companies
Each Fund may invest a significant portion of its assets in shares of one or more investment companies, including ETFs, open-end and closed-end mutual funds and money market mutual funds. Each Fund will incur additional indirect expenses (acquired fund fees and expenses) to the extent it invests in shares of other investment companies. As of November 30, 2024, the Spectrum Alpha Fund had 98.5% of the value of its net assets invested in open-end mutual funds. As of November 30, 2024, the Multi Strategy Fund had 35.2% and 63.6% of the value of its net assets invested in ETFs and open-end mutual funds, respectively. As of November 30, 2024, the Tactical Growth Fund had 92.1% of the value of its net assets invested in ETFs. As of November 30, 2024, the Tactical Defensive Fund had 98.4% of the value of its net assets invested in ETFs. The financial statements of these ETFs and money market mutual funds can be found at www.sec.gov and should be read in conjunction with the Funds’ financial statements.
75
North Square Funds
Notes to Financial Statements – Continued
November 30, 2024 (Unaudited)
Note 13 – Principal Risk
Below are summaries of some, but not all, of the principal risks of investing in a Fund, each of which could adversely affect the Fund’s NAV, market price, yield, and total return. Further information about investment risks is available in the Fund’s prospectus and Statement of Additional Information.
North Square Spectrum Alpha Fund
Equity Risk. The value of the equity securities held by the Fund may fall due to general market and economic conditions, perceptions regarding the industries in which the issuers of securities held by the Fund participate, or factors relating to specific companies in which the Fund invests.
Micro-Cap, Small, and Mid-Sized Company Risk. Investments in micro-cap, small, and mid-sized companies may involve greater risks than investments in larger, more established companies. As compared to larger companies, micro-cap, small, and mid-sized companies may have limited management experience or depth, limited ability to generate or borrow capital needed for growth, and limited products or services, or operate in less established markets. Accordingly, securities of micro-cap, small, and mid-sized companies tend to be more sensitive to changing economic, market, and industry conditions and tend to be more volatile and less liquid than equity securities of larger companies, especially over the short term. The securities of micro-cap, small, and mid-sized companies tend to trade less frequently than those of larger, more established companies, which can adversely affect the pricing of these securities and the ability to sell these securities in the future.
North Square Dynamic Small Cap Fund
Equity Risk. The value of the equity securities held by the Fund may fall due to general market and economic conditions, perceptions regarding the industries in which the issuers of securities held by the Fund participate, or factors relating to specific companies in which the Fund invests.
Sector Focus Risk. The Fund may invest a larger portion of its assets in one or more sectors than many other mutual funds, and thus will be more susceptible to negative events affecting those sectors.
Small Cap Company Risk. The securities of small capitalization companies may be subject to more abrupt or erratic market movements and may have lower trading volumes or more erratic trading than securities of larger, more established companies or market averages in general. In addition, such companies typically are more likely to be adversely affected than large capitalization companies by changes in earning results, business prospects, investor expectations or poor economic or market conditions.
North Square Multi Strategy Fund
Equity Risk. The value of the equity securities held by the Fund may fall due to general market and economic conditions, perceptions regarding the industries in which the issuers of securities held by the Fund participate, or factors relating to specific companies in which the Fund invests.
Fixed Income Securities Risk. The prices of fixed income securities respond to economic developments, particularly interest rate changes, as well as to changes in an issuer’s credit rating or market perceptions about the creditworthiness of an issuer. Liquidity may decline unpredictably in response to overall economic conditions or credit tightening. For example, a general rise in interest rates may cause investors to move out of fixed income securities on a large scale, which could adversely affect the price and liquidity of fixed income securities and could also result in increased redemptions for the Fund.
North Square Preferred and Income Securities Fund
Fixed Income Securities Risk. The prices of fixed income securities respond to economic developments, particularly interest rate changes, as well as to changes in an issuer’s credit rating or market perceptions about the creditworthiness of an issuer. Typically, a rise in interest rates will cause a decline in the value of a fixed income security owned by the Fund. Generally, the market price of fixed income securities with longer maturities will increase or decrease more in response to changes in interest rates than shorter-term securities. Liquidity may decline unpredictably in response to overall economic conditions or credit tightening. For example, a general rise in interest rates may cause investors to move out of fixed income securities on a large scale, which could adversely affect the price and liquidity of fixed income securities and could also result in increased redemptions for the Fund.
76
North Square Funds
Notes to Financial Statements – Continued
November 30, 2024 (Unaudited)
Preferred Securities Risk. There are various risks associated with investing in preferred securities. These risks include deferral and omission of distributions; credit risk; subordination to bonds and other debt securities in a company’s capital structure; interest rate risk; prepayment and extension risk; call, reinvestment and income risk; liquidity risk; limited voting rights; and special redemption rights.
Sector Focus Risk, including Financial Sector Risk. The Fund may invest a larger portion of its assets in one or more sectors than many other mutual funds, and thus will be more susceptible to negative events affecting those sectors. The Fund may invest over 25% in the financials sector. The risks of investments in the financials sector include: extensive governmental regulation and/or nationalization that affects the scope of their activities, the prices they can charge and the amount of capital they must maintain; adverse effects from increases in interest rates; adverse effects on profitability by loan losses, which usually increase in economic downturns; the severe competition to which banks, insurance, and financial services companies may be subject; and increased inter-sector consolidation and competition in the financials sector. The impact of more stringent capital requirements, recent or future regulation on any individual financial company or recent or future regulation on the financials sector as a whole cannot be predicted.
North Square Tactical Growth Fund
Equity Risk. The value of the equity securities held by the Fund may fall due to general market and economic conditions, perceptions regarding the industries in which the issuers of securities held by the Fund participate, or factors relating to specific companies in which the Fund invests.
Fixed Income Securities Risk. The prices of fixed income securities respond to economic developments, particularly interest rate changes, as well as to changes in an issuer’s credit rating or market perceptions about the creditworthiness of an issuer. Liquidity may decline unpredictably in response to overall economic conditions or credit tightening. For example, a general rise in interest rates may cause investors to move out of fixed income securities on a large scale, which could adversely affect the price and liquidity of fixed income securities and could also result in increased redemptions for the Fund.
North Square Tactical Defensive Fund
Equity Risk. The value of the equity securities held by the Fund may fall due to general market and economic conditions, perceptions regarding the industries in which the issuers of securities held by the Fund participate, or factors relating to specific companies in which the Fund invests.
Fixed Income Securities Risk. The prices of fixed income securities respond to economic developments, particularly interest rate changes, as well as to changes in an issuer’s credit rating or market perceptions about the creditworthiness of an issuer. Liquidity may decline unpredictably in response to overall economic conditions or credit tightening. For example, a general rise in interest rates may cause investors to move out of fixed income securities on a large scale, which could adversely affect the price and liquidity of fixed income securities and could also result in increased redemptions for the Fund.
North Square Kennedy MicroCap Fund
Equity Risk. The value of the equity securities held by the Fund may fall due to general market and economic conditions, perceptions regarding the industries in which the issuers of securities held by the Fund participate, or factors relating to specific companies in which the Fund invests.
Growth-Oriented Investment Strategies Risk. Growth funds generally focus on stocks of companies believed to have above-average potential for growth in revenue and earnings. Growth securities typically are very sensitive to market movements because their market prices frequently reflect projections of future earnings or revenues, and when it appears that those expectations will not be met, the prices of growth securities typically fall.
Micro-Cap and Small-Cap-Sized Company Risk. The securities of micro- and small-capitalization companies may be subject to more abrupt or erratic market movements and may have lower trading volumes or more erratic trading than securities of larger, more established companies or market averages in general. In addition, such companies typically are more likely to be adversely affected than large-capitalization companies by changes in earning results, business prospects, investor expectations or poor economic or market conditions.
Sector Focus Risk. The Fund may from time to time invest a larger portion of its assets in one or more sectors than many other mutual funds, and thus will be more susceptible to negative events affecting those sectors.
77
North Square Funds
Notes to Financial Statements – Continued
November 30, 2024 (Unaudited)
Value-Oriented Investment Strategies Risk. Value stocks are those that are believed to be undervalued in comparison to their peers due to adverse business developments or other factors. Value investing is subject to the risk that the market will not recognize a security’s inherent value for a long time or at all, or that a stock judged to be undervalued may actually be appropriately priced or overvalued. In addition, during some periods (which may be extensive) value stocks generally may be out of favor in the markets.
North Square Core Plus Bond Fund
Fixed Income Securities Risk. The prices of fixed income securities respond to economic developments, particularly interest rate changes, as well as to changes in an issuer’s credit rating or market perceptions about the creditworthiness of an issuer. Liquidity may decline unpredictably in response to overall economic conditions or credit tightening. For example, a general rise in interest rates may cause investors to move out of fixed income securities on a large scale, which could adversely affect the price and liquidity of fixed income securities and could also result in increased redemptions for the Fund.
Mortgage-Backed and Asset-Backed Securities Risk. Mortgage-backed (including residential and commercial mortgage-backed) and asset-backed securities represent interests in “pools” of mortgages or other assets, including consumer loans or receivables held in trust. Mortgage-backed securities are subject to “prepayment risk” (the risk that borrowers will repay a loan more quickly in periods of falling interest rates) and “extension risk” (the risk that borrowers will repay a loan more slowly in periods of rising interest rates). If the Fund invests in mortgage-backed or asset-backed securities that are subordinated to other interests in the same pool, the Fund may only receive payments after the pool’s obligations to other investors have been satisfied. An unexpectedly high rate of defaults on the assets held by a pool may limit substantially the pool’s ability to make payments of principal or interest to the Fund, reducing the values of those securities or in some cases rendering them worthless. The Fund’s investments in other asset-backed securities are subject to risks similar to those associated with mortgage-backed securities, as well as additional risks associated with the nature of the assets and the servicing of those assets.
Principal Risks Relating to North Square Tactical Growth Fund, North Square Tactical Defensive Fund, North Square Spectrum Alpha Fund and North Square Multi Strategy Fund
Investment Companies Risk. A Fund may invest in investment companies, such as ETFs and mutual funds (including other funds managed or sub-advised by the Adviser or its affiliates (“North Square-Related Funds”)). Any such investment generally will reflect the risks of owning the underlying securities the investment company holds. It may also be more expensive for the Fund to invest in an ETF or mutual fund than to own the portfolio securities of these investment companies directly. Investing in investment companies involves additional expense based on the Fund’s pro rata share of other investment company’s operating expenses, including the management fees of unaffiliated funds in addition to those paid by the Fund. A Fund will pay brokerage commissions in connection with the purchase and sale of shares of ETFs. An ETF may also trade at a discount to its net asset value. In addition, a Fund may invest in underlying funds that invest a larger portion of their assets in one or more sectors than many other mutual funds, and thus will be more susceptible to negative events affecting those sectors. A Fund will be indirectly exposed to the risks of the portfolio assets held by an underlying fund in which the Fund invests, including, but not limited to, derivatives, currencies and leverage risk.
In addition to the risks associated with the underlying assets held by an ETF, investments in ETFs are subject to the following additional risks: (1) an ETF’s shares may trade above or below its net asset value; (2) an active trading market for the ETF’s shares may not develop or be maintained; (3) trading an ETF’s shares may be halted by the listing exchange; (4) a passively managed ETF may not track the performance of the reference asset; or underlying managed index and (5) a passively managed ETF may hold troubled securities. The Fund may invest in money market mutual funds. An investment in a money market mutual fund is not insured or guaranteed by the Federal Deposit Insurance Corporation or any other government agency. Certain money market mutual funds are not required to preserve the value of the Fund’s investment at $1.00 per share.
A Fund may invest in North Square-Related Funds in connection with any such investment. The Adviser or Sub-Adviser may be subject to potential conflicts of interest in selecting underlying funds because, among other reasons, the fees paid to it by North Square-Related Funds may be higher than the fees paid by other potential underlying funds and other benefits to the Adviser and Sub-Adviser may result from investments in North Square-Related Funds.
78
North Square Funds
Notes to Financial Statements – Continued
November 30, 2024 (Unaudited)
Note 13 – Sector Risk
If a Fund has significant investments in the securities of issuers within a particular sector or industry, any development affecting that sector or industry will have a greater impact on the value of the net assets of the Fund than would be the case if the Fund did not have significant investments in that sector or industry. In addition, this may increase the risk of loss in the Fund and increase the volatility of the Fund’s NAV per share. For instance, economic or market factors, regulatory changes or other developments may negatively impact all companies in a particular sector or industry, and therefore the value of the Fund’s portfolio will be adversely affected. As of November 30, 2024, the Preferred and Income Securities Fund had 43.5% and 28.5% of the value of its net assets invested in securities within the Financials and Utilities sectors, respectively. As of November 30, 2024 the Kennedy MicroCap Fund had 27.5% of the value of its net assets invested in securities within the Financials Sector. As of November 30, 2024, the Preferred and Income Securities Fund had 28.5% of the value of its net assets invested in securities within the Utilities sector.
Note 14 – Events Subsequent to the Fiscal Period End
The Funds have adopted financial reporting rules regarding subsequent events which require an entity to recognize in the financial statements the effects of all subsequent events that provide additional evidence about conditions that existed at the date of the balance sheet. Management has evaluated the Funds’ related events and transactions that occurred through the date of issuance of the Funds’ financial statements. Based upon this evaluation, management has determined there were no items requiring adjustment of the financial statements or additional disclosures.
79
North Square Funds
Supplemental Information (Unaudited)
Board Consideration of the Continuation of the Investment Advisory Agreement and Sub-Advisory Agreement
Section 15(c) of the Investment Company Act of 1940, as amended (the “1940 Act”), requires that each mutual fund’s board of trustees, including a majority of those trustees who are not “interested persons” of the fund, as defined in the 1940 Act (the “Independent Trustees”), initially approve, and annually review and consider the continuation of, the fund’s investment advisory and sub-advisory agreements. At a meeting held on June 25-26, 2024 (the “Meeting”), the Board of Trustees (the “Board”) of Exchange Place Advisors Trust (the “Trust”), including each of the Independent Trustees, unanimously voted to approve the continuation of: (i) the investment advisory agreement (the “Advisory Agreement”) between North Square Investments, LLC (the “Adviser” or “NSI”) and the Trust, on behalf of the North Square Spectrum Alpha Fund, the North Square Preferred and Income Securities Fund, the North Square Multi Strategy Fund, and the North Square Dynamic Small Cap Fund (each, a “Fund” and collectively, the “Funds”) and (ii) the investment sub-advisory agreement between the Adviser and Algert Global, LLC (“Algert” or the “Sub-Adviser”) with respect to the North Square Dynamic Small Cap Fund. The investment sub-advisory agreement with the Sub-Adviser is referred to as the “Sub-Advisory Agreement,” and the Advisory Agreement and the Sub-Advisory Agreement are collectively referred to as the “Agreements.”
In connection with its consideration of the Agreements proposed for continuation, the Board requested and reviewed responses from the Adviser and the Sub-Adviser to the Section 15(c) requests posed to the Adviser and Sub-Adviser on behalf of the Independent Trustees by Fund Counsel and supporting materials relating to those questions and responses, as well as other information and data provided. In this connection, the Board reviewed and discussed various information that had been provided prior to the Meeting, including the Advisory Agreement, the Sub-Advisory Agreement, a memorandum provided by independent counsel summarizing the requirements and guidelines relevant to the Board’s consideration of the approvals of such Agreements, the Adviser and the Sub-Adviser’s Form ADV Part 1A, brochures and brochure supplements, profitability information, comparative information about the Funds’ performance for periods ended March 31 2024, advisory fees and expense ratios, and other pertinent information. In addition, the Board considered such additional information as it deemed reasonably necessary, including information and data provided by the Adviser and Sub-Adviser during the course of the year, to evaluate the Agreements, as applicable, with respect to each Fund, including information provided in connection with the consideration of advisory agreements for other Funds in the Trust. The Board reviewed and discussed the Adviser and Sub-Adviser’s Section 15(c) responses and discussed various questions and information with representatives of the Adviser and Sub-Adviser at the Meeting. The Board also considered the materials and presentations by Trust officers and representatives of the Adviser and Sub-Adviser provided at the Meeting concerning the Agreements. Throughout the process, including at the Meeting, the Board had numerous opportunities to ask questions of, and request additional materials from, the Adviser and Sub-Adviser. The Independent Trustees were also advised by Independent Trustee counsel and met in executive sessions at which no representatives of management were present to consider the renewal of the Agreements with respect to each of the Funds. The Board also noted that the evaluation process with respect to the Adviser and the Sub-Adviser is an ongoing one. The Board, as noted above, also took into account information reviewed periodically throughout the year and in prior years that was relevant to its consideration of the Agreements, including performance, advisory fee and other expense information and discussions with the Funds’ portfolio managers, as well as such additional information it deemed relevant and appropriate in its judgement. The Board noted that the information received and considered by the Board in connection with the Meeting and throughout the year was both written and oral. The Board also noted that the evaluation process was performed on a Fund-by-Fund basis. Based on its evaluation of this information, the Board, including the Independent Trustees, unanimously approved the continuation of the Agreements with respect to each of the Funds for an additional one-year period.
In determining whether to approve the continuation of the Agreements, the members of the Board reviewed and evaluated information and factors they believed to be relevant and appropriate in the exercise of their reasonable business judgment. While individual members of the Board may have weighed certain factors differently, the Board’s determination to approve the Agreements with respect to each Fund was based on a comprehensive consideration of all information provided to the Board with respect to the approval of the Agreements. As noted, the Board was also furnished with an analysis of its fiduciary obligations in connection with its evaluation of the Agreements and, throughout the evaluation process, the Board was assisted by independent counsel. A more detailed summary of important, but not necessarily all, factors the Board considered with respect to its renewal of the Agreements with respect to each Fund is provided below. The Board also considered other factors, including conditions and trends prevailing generally in the economy, the securities markets, and the industry. The Board’s conclusions may be based in part on its consideration of the advisory arrangements in prior years and on the Board’s ongoing regular review of Fund performance and operations throughout the year.
80
North Square Funds
SUPPLEMENTAL INFORMATION (Unaudited) – Continued
Nature, Extent and Quality of Services
The Board considered information regarding the nature, extent and quality of services being provided to the Funds by the Adviser and Sub-Adviser. The Board considered, among other things, the terms of the Agreements and the range of services being provided by the Adviser and Sub-Adviser. The Board noted the non-investment advisory services being provided by the Adviser, including the supervision and coordination of the Funds’ service providers and the provision of related administrative and other services. The Board also considered the Adviser’s and the Sub-Adviser’s reputation, organizational structure, resources and overall financial strength, including economic and other support provided by affiliates of the Adviser or Sub-Adviser, if any, its willingness and commitment to consider and implement organizational and operational changes designed to enhance services to the Funds.
In addition, the Board considered the Adviser’s and Sub-Adviser’s professional personnel who provide or will provide services to the Funds, including the Adviser’s and Sub-Adviser’s ability and experience in attracting and retaining qualified personnel to service the Funds. In addition, the Board considered the compliance programs and compliance records and regulatory history of the Adviser and Sub-Adviser. The Board noted the Adviser’s and Sub-Adviser’s support of the Funds’ compliance control structure, including the resources that are devoted by the Adviser and Sub-Adviser in support of the Funds’ obligations pursuant to Rule 38a-1 under the 1940 Act and the efforts of the Adviser and Sub-Adviser to address cybersecurity risks and invest in business continuity planning. The Board also noted that on a regular basis it received and reviewed information from the Trust’s Chief Compliance Officer (“CCO”) regarding the Funds’ compliance policies and procedures established pursuant to Rule 38a-1 under the 1940 Act, which included evaluating the regulatory compliance systems of the Adviser and Sub-Adviser and procedures reasonably designed to ensure compliance with the federal securities laws. The Board also considered the Adviser and Sub-Adviser’s policies and procedures, including the Trust’s CCO’s review and evaluation of these policies and procedures, and that the CCO found them to be satisfactory. The Board also noted that it met separately, in executive session, with the CCO on a regular basis.
With respect to the Adviser, the Board considered the Funds’ ongoing and proposed operation in a “manager-of-managers” structure and reviewed the responsibilities that the Adviser has under this structure, including, but not limited to, monitoring and evaluating the performance of the Sub-Adviser, monitoring the Sub-Adviser for adherence to the stated investment objectives, strategies, policies and restrictions of the Funds, and supervising the Sub-Adviser with respect to the services that the Sub-Adviser currently provides under the Sub-Advisory Agreement. In this regard, the Board evaluated information about the nature and extent of responsibilities retained and significant risks assumed by the Adviser and not delegated to or assumed by the Sub-Adviser in connection with the services provided to the Funds. These responsibilities and risks include entrepreneurial risk and ongoing risks, including investment, operational, enterprise, litigation, regulatory and compliance risks. The Board also noted increased regulatory risk. The Board also considered the process used by the Adviser, consistent with this structure, to identify and recommend sub-advisers, and its ability to monitor and oversee sub-advisers and recommend replacement sub-advisers, when necessary, and provide other services under the Advisory Agreement. In addition, the Board considered its familiarity with the Adviser’s personnel obtained from the Board’s oversight of the Funds and of other funds in the Trust advised by the Adviser.
With respect to the Sub-Adviser, which provides day-to-day portfolio management services for the North Square Dynamic Small Cap Fund, subject to oversight by the Adviser, the Board considered, among other things, the quality of the Sub-Adviser’s investment personnel, its investment philosophies and processes, its investment research capabilities and resources, its financial condition, its performance record, its experience, its trade execution capabilities and its approach to managing risk. The Board also considered the experience of the Fund’s portfolio managers the number of accounts managed by the portfolio managers, and the Sub-Adviser’s approach for compensating the portfolio managers. Moreover, the Board considered that the Adviser has the oversight responsibility for conflicts of interest relating to the Fund. In considering the nature, extent, and quality of the services provided by the Sub-Adviser, the Board also took into account its knowledge of the Sub-Adviser’s management and the quality of the performance of its duties as a sub-adviser, acquired through discussions and reports during the preceding year and in past years. The Board concluded that the renewal of the Sub-Advisory Agreement was in the best interests of the Fund and its shareholders and, based on the information provided to it, does not involve a conflict of interest from which the Adviser, the Sub-Adviser, or any officer or Trustee of the Funds or any officer or board member of the Adviser derives an inappropriate advantage.
After consideration of the foregoing factors, among others, the Board concluded that the nature, extent and quality of services being provided or to be provided by the Adviser and the Sub-Adviser, taken as a whole, remain appropriate and consistent with the terms of the Advisory Agreement and the Sub-Advisory Agreement, as applicable. In addition, the Board concluded that each Fund was likely to continue to benefit from services being provided, or to be provided, under each of the Agreements.
81
North Square Funds
SUPPLEMENTAL INFORMATION (Unaudited) – Continued
Fund Performance
The Board reviewed the performance of each Fund for the different time periods presented in the Board meeting materials and throughout the year. The Board considered various data and materials provided by the Adviser concerning Fund performance, including a comparison of the investment performance of each Fund to its respective benchmark (or index), as well as comparative fee information provided by the Broadridge Financial Solutions, Inc., based on data produced by Morningstar Inc., an independent provider of investment company data (the “Broadridge Report”), comparing the investment performance of each Fund to a universe of peer funds.
The Board received information at the Meeting, and throughout the year, concerning, and discussing factors contributing to, the performance of the Funds relative to their respective benchmarks and universes for the relevant periods. The Board evaluated the explanations for any relative underperformance of a Fund during these periods, as well as to investment decisions and global economic and other factors that affected the Fund’s investment performance and whether each Fund had performed as expected over time, as well as any plans to address underperformance, if applicable. The Board also noted the Adviser’s discussion of any differences in the investment strategies of the Funds relative to their respective peer universe. The Board generally considered longer-term performance to be more important than short-term performance and also took into account factors including general market conditions; the “style” in which the Funds are managed, as applicable, and whether that style is in or out of favor in the market; issuer-specific information; and fund cash flows. In this regard, the Board also noted how selecting different time periods for performance calculations can produce significantly different results in terms of a Fund’s returns and peer ranking on a relative basis. The Board further acknowledged that longer-term performance could be impacted by even one period of significant outperformance or underperformance. The Board also considered that variations in performance among a Fund’s operating classes reflect variations in class expenses, which result in lower performance for higher expense classes.
Based on these considerations, the Board concluded that the Adviser and the Sub-Adviser continue to have the capability of providing satisfactory investment performance for the Funds, as applicable.
Advisory Fees and Expenses
The Board reviewed and considered the advisory fee rate of each Fund that is being paid to the Adviser under the Advisory Agreement and each Fund’s total net expense ratio. The Board also reviewed and considered the sub-advisory fee rates being paid by the Adviser to the Sub-Adviser for sub-advisory services.
The Board reviewed information in the Broadridge Report comparing each Fund’s advisory fee rate and total expense ratio relative to a group of its peer funds. While the Board recognized that comparisons between a Fund and its peer funds may be imprecise and non-determinative, the comparative information provided in the Broadridge Report was helpful to the Board in evaluating the reasonableness of each Fund’s advisory fees and total expense ratio.
The Board also took into account management’s discussion of each Fund’s expenses and also noted certain cost savings initiatives implemented by the Adviser across all of the Funds. The Board also noted that the Adviser had entered into fee waiver and expense reimbursement arrangements with respect to each of the Funds. The Board took into account the factors that the Adviser reported that contributed to any expenses that were relatively higher than the peer group comparative data.
The Board also received and considered information about the portion of the advisory fee that is being retained by the Adviser after payment of the fee to the Sub-Adviser for sub-advisory services. In assessing the reasonableness of this amount, the Board received and evaluated information about the nature and extent of responsibilities that are retained and risks that are assumed by Adviser and not delegated to or assumed by the Sub-Adviser, and about the Adviser’s on-going oversight services. The Board also considered that the sub-advisory fees being paid to the Sub-Adviser had been negotiated by the Adviser on an arm’s length basis and were paid by the Adviser and not the Fund. The Board considered the Adviser’s explanation that the sub-advisory fees are priced at a competitive level.
The Board also received and considered information about the nature and extent of services offered and fee rates charged by the Adviser and the Sub-Adviser to other types of clients with investment strategies similar to those of the Funds, if any. In this regard, the Board received information about the significantly greater scope of services, and compliance, reporting and other legal burdens and risks of managing registered mutual funds compared with those associated with managing assets of other types of clients, including non-mutual fund clients, such as institutional separate accounts.
82
North Square Funds
SUPPLEMENTAL INFORMATION (Unaudited) – Continued
As applicable, the Board also noted the Adviser’s representation that the services provided to each Fund are not duplicative of the advisory services provided to the underlying funds in which the Funds may invest and that the Adviser voluntarily waives each Fund’s management fee with respect to the amount of its net assets invested in an underlying affiliated fund.
Based on its consideration of the factors and information it deemed relevant, including those described here, the Board concluded that the compensation payable to the Adviser under the Advisory Agreement and to the Sub-Adviser under the Sub-Advisory Agreement with respect to each of the Funds were reasonable.
Profitability
The Board received and considered information concerning the Adviser’s costs of sponsoring the Funds and the profitability to the Adviser and its respective affiliates from providing services to the Funds. The Board noted that the levels of profitability may be affected by numerous factors. The Board also received information relating to the operations and profitability to the Sub-Adviser from providing services to the North Square Dynamic Small Cap Fund. The Board considered representations from the Adviser and the Sub-Adviser that the Sub-Adviser’s fees were negotiated at arm’s length on a Fund-by-Fund basis and that the sub-advisory fees are paid by the Adviser and not the Fund. Accordingly, the Board concluded that the profitability of the Sub-Adviser was a less relevant factor with respect to the Board’s consideration of the Sub-Advisory Agreement.
Based on its review, the Board determined that the profits reported by the Adviser and Sub-Adviser from services being provided to the Funds, if any, were not excessive.
Economies of Scale
The Board considered the potential for the Adviser to experience economies of scale in the provision of advisory services to each Fund as the Funds grew. The Board considered that the Adviser may share potential economies of scale from its advisory business in a variety of ways, including through fee waiver and expense reimbursement arrangements, services that benefit shareholders, competitive advisory fee rates set at the outset without regard to breakpoints, and investments in the business intended to enhance services available to shareholders. The Board also took into account management’s discussion of the Funds’ fee structures. The Board also considered the effect of each Fund’s growth in size on its performance and fees and that, if the Fund’s assets increase over time, the Fund may realize other economies of scale. The Independent Trustees recognized that, because each Fund’s sub-advisory fees are paid by the Adviser, and not the Fund, an analysis of economies of scale was more appropriate in the context of the Board’s consideration of the Advisory Agreement.
The Board concluded that, especially in light of the current stage of development of the Funds, the Adviser’s arrangements with respect to the Funds constituted a reasonable approach to sharing potential economies of scale with the Funds and their shareholders.
“Fall-Out” Benefits
The Board received and considered information regarding potential “fall-out” or ancillary benefits that the Adviser and its affiliates may receive as a result of their relationships with the Funds. The Board noted that ancillary benefits could include, among others, benefits directly attributable to other relationships with the Funds and benefits potentially derived from an increase in the Adviser’s business as a result of their relationships with the Funds. In addition, the Board considered the potential benefits, other than sub-advisory fees, that the Sub-Adviser and its affiliates may receive because of its relationships with the Funds, including the benefits of research services that may be available to the Sub-Adviser as a result of securities transactions effected for the North Square Dynamic Small Cap Fund and other investment advisory clients, as well as other benefits from increases in assets under management.
Based on its consideration of the factors and information it deemed relevant, including those described above, the Board did not find that any ancillary benefits that may be received by the Adviser and the Sub-Adviser and their respective affiliates to be unreasonable.
Conclusion
At the Meeting, after considering the above-described material factors and based on its robust deliberations and its evaluation of the information described above, and assisted by the advice of independent counsel, the Board, including the Independent Trustees, concluded that the approval of the renewal and continuation of the Agreements with respect to each Fund was in the best interest of each respective Fund and its shareholders.
83
North Square Funds
SUPPLEMENTAL INFORMATION (Unaudited) – Continued
Board Consideration of the Continuation of the Investment Advisory Agreement and Sub-Advisory Agreements
Section 15(c) of the Investment Company Act of 1940, as amended (the “1940 Act”), requires that each mutual fund’s board of trustees, including a majority of those trustees who are not “interested persons” of the fund, as defined in the 1940 Act (the “Independent Trustees”), initially approve, and annually review and consider the continuation of, the fund’s investment advisory and sub-advisory agreements. At a meeting held on September 24-25, 2024 (the “Meeting”), the Board of Trustees (the “Board”) of Exchange Place Advisors Trust (the “Trust”), including each of the Independent Trustees, unanimously voted to approve the continuation of: (i) the investment advisory agreement (the “Advisory Agreement”) between North Square Investments, LLC (the “Adviser” or “NSI”) and the Trust, on behalf of the North Square Trilogy Alternative Return Fund (to be renamed the North Square Core Plus Bond Fund), the North Square Dynamic Small Cap Fund, the North Square Multi Strategy Fund, the North Square Preferred and Income Securities Fund, the North Square Spectrum Alpha Fund, the North Square Tactical Defensive Fund, the North Square Tactical Growth Fund, and the North Square Trilogy Alternative Return Fund (each, a “Fund” and collectively, the “Funds”); (ii) the investment sub-advisory agreement with Algert Global, LLC (“Algert”) with respect to the North Square Dynamic Small Cap Fund; (iii) the investment sub-advisory agreement with NSI Retail Advisors, LLC (“NSI Retail”) for the North Square Multi Strategy Fund, North Square Spectrum Alpha Fund, North Square Tactical Defensive Fund, and North Square Tactical Growth Fund; and (iv) the investment sub-advisory agreement with Red Cedar Investment Management, LLC (“Red Cedar”) with respect to the North Square Preferred and Income Securities Fund (“Red Cedar”) and with Algert, and NSI Retail, the “Sub-Advisers”). The investment sub-advisory agreements with the Sub-Advisers are collectively referred to as the “Sub-Advisory Agreements,” and the Advisory Agreement and the Sub-Advisory Agreements are collectively referred to as the “Agreements.”
In connection with its consideration of the Agreements proposed for continuation, the Board requested and reviewed responses from the Adviser and the Sub-Advisers to the Section 15(c) requests posed to the Adviser and Sub-Advisers on behalf of the Independent Trustees by independent legal counsel and supporting materials relating to those questions and responses, as well as other information and data provided. In this connection, the Board reviewed and discussed various information that had been provided prior to the Meeting, including the Advisory Agreement, the Sub-Advisory Agreements, a memorandum provided by independent counsel summarizing the requirements and guidelines relevant to the Board’s consideration of the approvals of such Agreements, the Adviser and each Sub-Adviser’s Form ADV Part 1A, brochures and brochure supplements, profitability information, comparative information about the Funds’ performance, advisory fees and expense ratios, and other pertinent information. In addition, the Board considered such additional information as it deemed reasonably necessary, including information and data provided by the Adviser and Sub-Advisers during the course of the year, to evaluate the Agreements, as applicable, with respect to each Fund, including information provided in connection with the consideration of advisory and sub-advisory agreements for the Funds at Board meetings held on December 6-7, 2023 and June 25-26, 2024, as applicable. The Board reviewed and discussed the Adviser and Sub-Advisers’ Section 15(c) responses and discussed various questions and information with representatives of the Adviser and Sub-Advisers at the Meeting. The Board also considered the materials and presentations by Trust officers and representatives of the Adviser and Sub-Advisers provided at the Meeting and the prior meetings concerning the Agreements. Throughout the process, including at the Meeting, the Board had numerous opportunities to ask questions of, and request additional materials from, the Adviser and Sub-Advisers. The Independent Trustees were also advised by independent legal counsel and met in executive sessions at which no representatives of management were present to consider the renewal of the Agreements with respect to each of the Funds. The Board also noted that the evaluation process with respect to the Adviser and the Sub-Advisers is an ongoing one. The Board, as noted above, also took into account information reviewed periodically throughout the year and in prior years that was relevant to its consideration of the Agreements, including performance, advisory fee and other expense information and discussions with the Funds’ portfolio managers, as well as such additional information it deemed relevant and appropriate in its judgement. The Board noted that the information received and considered by the Board in connection with the Meeting and throughout the year was both written and oral. The Board also noted that the evaluation process was performed on a Fund-by-Fund basis. Based on its evaluation of this information, the Board, including the Independent Trustees, unanimously approved the continuation of the Agreements with respect to each of the Funds for an additional one-year period.
In determining whether to approve the continuation of the Agreements, the members of the Board reviewed and evaluated information and factors they believed to be relevant and appropriate in the exercise of their reasonable business judgment. While individual members of the Board may have weighed certain factors differently, the Board’s determination to approve the Agreements with respect to each Fund was based on a comprehensive consideration of all information provided to the Board with respect to the approval of the Agreements. As noted, the Board was also furnished with an analysis of its fiduciary obligations in connection with its evaluation of the Agreements and, throughout the evaluation process, the Board was assisted by independent legal counsel. A more detailed summary of important, but not necessarily all, factors the Board considered with respect to its renewal of the Agreements with respect to each Fund is provided below.
84
North Square Funds
SUPPLEMENTAL INFORMATION (Unaudited) – Continued
The Board also considered other factors, including conditions and trends prevailing generally in the economy, the securities markets, and the industry. The Board’s conclusions may be based in part on its consideration of the advisory arrangements in prior years and on the Board’s ongoing regular review of Fund performance and operations throughout the year.
Nature, Extent and Quality of Services
The Board considered information regarding the nature, extent and quality of services being provided to the Funds by the Adviser and Sub-Advisers. The Board considered, among other things, the terms of the Agreements and the range of services being provided by the Adviser and Sub-Advisers. The Board noted the non-investment advisory services being provided by the Adviser, including the supervision and coordination of the Funds’ service providers and the provision of related administrative and other services. The Board also considered the Adviser’s and each Sub-Adviser’s reputation, organizational structure, resources and overall financial strength, including economic and other support provided by affiliates of the Adviser or Sub-Advisers, if any, its willingness and commitment to consider and implement organizational and operational changes designed to enhance services to the Funds.
In addition, the Board considered the Adviser’s and Sub-Advisers’ professional personnel who provide or will provide services to the Funds, including the Adviser’s and each Sub-Adviser’s ability and experience in attracting and retaining qualified personnel to service the Funds. In addition, the Board considered the compliance programs and compliance records and regulatory history of the Adviser and Sub-Advisers. The Board noted the Adviser’s and Sub-Advisers’ support of the Funds’ compliance control structure, including the resources that are devoted by the Adviser and Sub-Advisers in support of the Funds’ obligations pursuant to Rule 38a-1 under the 1940 Act and the efforts of the Adviser and Sub-Advisers to address cybersecurity risks and invest in business continuity planning. The Board also noted that on a regular basis it received and reviewed information from the Trust’s Chief Compliance Officer (“CCO”) regarding the Funds’ compliance policies and procedures established pursuant to Rule 38a-1 under the 1940 Act, which included evaluating the regulatory compliance systems of the Adviser and Sub-Advisers and procedures reasonably designed to ensure compliance with the federal securities laws. The Board also considered the Adviser and Sub-Advisers’ policies and procedures, including the Trust’s CCO’s review and evaluation of these policies and procedures, and that the CCO found them to be satisfactory. The Board also noted that it met separately, in executive session, with the CCO on a regular basis.
With respect to the Adviser, the Board considered the Funds’ ongoing and proposed operation in a “manager-of-managers” structure and reviewed the responsibilities that the Adviser has under this structure, including, but not limited to, monitoring and evaluating the performance of the Sub-Advisers, monitoring the Sub-Advisers for adherence to the stated investment objectives, strategies, policies and restrictions of the Funds, and supervising the Sub-Advisers with respect to the services that the Sub-Advisers currently provide under the Sub-Advisory Agreements. In this regard, the Board evaluated information about the nature and extent of responsibilities retained and significant risks assumed by the Adviser and not delegated to or assumed by the Sub-Advisers in connection with the services provided to the Funds. These responsibilities and risks include entrepreneurial risk and ongoing risks, including investment, operational, enterprise, litigation, regulatory and compliance risks. The Board also noted increased regulatory risk. The Board also considered the process used by the Adviser, consistent with this structure, to identify and recommend sub-advisers, and its ability to monitor and oversee sub-advisers and recommend replacement sub-advisers, when necessary, and provide other services under the Advisory Agreement. In addition, the Board considered its familiarity with the Adviser’s personnel obtained from the Board’s oversight of the Funds and of other funds in the Trust advised by the Adviser, as well as the affiliation between the Adviser and NSI Retail and any potential conflicts of interest. The Board also took into account the Adviser’s discussion of the organizational structure of the affiliated Sub-Adviser and the services provided to the relevant Funds.
With respect to the Sub-Advisers, which provide day-to-day portfolio management services for the Funds, subject to oversight by the Adviser, the Board considered, among other things, the quality of each Sub-Adviser’s investment personnel, its investment philosophies and processes, its investment research capabilities and resources, its financial condition, its performance record, its experience, its trade execution capabilities and its approach to managing risk. The Board also considered the experience of each Fund’s portfolio managers the number of accounts managed by the portfolio managers, and each Sub-Adviser’s approach for compensating the portfolio managers. Moreover, the Board considered that the Adviser has the oversight responsibility for conflicts of interest relating to the Funds. In considering the nature, extent, and quality of the services provided by each of the Sub-Advisers, the Board also took into account its knowledge of each Sub-Advisers management and the quality of the performance of its duties as a sub-adviser, acquired through discussions and reports during the preceding year and in past years. The Board concluded that the renewal of the Sub-Advisory Agreements was in the best interests of the Funds and their shareholders and, based on the information provided to it, does not involve a conflict of interest from which the Adviser, a Sub-Adviser, or any officer or Trustee of the Funds or any officer or board member of the Adviser derives an inappropriate advantage.
85
North Square Funds
SUPPLEMENTAL INFORMATION (Unaudited) – Continued
After consideration of the foregoing factors, among others, the Board concluded that the nature, extent and quality of services being provided or to be provided by the Adviser and the Sub-Advisers, taken as a whole, remain appropriate and consistent with the terms of the Advisory Agreement and the Sub-Advisory Agreements, as applicable. In addition, the Board concluded that each Fund was likely to continue to benefit from services being provided, or to be provided, under each of the Agreements.
Fund Performance
The Board reviewed the performance of each Fund for the different time periods presented in the Board meeting materials and throughout the year. The Board considered various data and materials provided by the Advisers concerning Fund performance, including a comparison of the investment performance of each Fund to its respective benchmark (or index), as well as comparative fee information provided by the Broadridge Financial Solutions, Inc., based on data produced by Morningstar Inc., an independent provider of investment company data (the “Broadridge Report”), comparing the investment performance of each Fund to a universe of peer funds.
The Board received information at the Meeting, and throughout the year, concerning, and discussing factors contributing to, the performance of the Funds relative to their respective benchmarks and universes for the relevant periods. The Board evaluated the explanations for any relative underperformance of a Fund during these periods, as well as to investment decisions and global economic and other factors that affected the Fund’s investment performance and whether each Fund had performed as expected over time, as well as any plans to address underperformance, if applicable. The Board also noted the Adviser’s discussion of any differences in the investment strategies of the Funds relative to their respective peer universe. The Board generally considered longer-term performance to be more important than short-term performance and also took into account factors including general market conditions; the “style” in which the Funds are managed, as applicable, and whether that style is in or out of favor in the market; issuer-specific information; and fund cash flows. In this regard, the Board also noted how selecting different time periods for performance calculations can produce significantly different results in terms of a Fund’s returns and peer ranking on a relative basis. The Board further acknowledged that longer-term performance could be impacted by even one period of significant outperformance or underperformance. The Board also considered that variations in performance among a Fund’s operating classes reflect variations in class expenses, which result in lower performance for higher expense classes.
Based on these considerations, the Board concluded that the Adviser and the Sub-Advisers continue to have the capability of providing satisfactory investment performance for the Funds, as applicable.
Advisory Fees and Expenses
The Board reviewed and considered the advisory fee rate of each Fund that is being paid to the Adviser under the Advisory Agreement and each Fund’s total net expense ratio. The Board also reviewed and considered the sub-advisory fee rates being paid by the Adviser to each Sub-Adviser for sub-advisory services.
The Board reviewed information in the Broadridge Report comparing each Fund’s advisory fee rate and total expense ratio relative to a group of its peer funds. While the Board recognized that comparisons between a Fund and its peer funds may be imprecise and non-determinative, the comparative information provided in the Broadridge Report was helpful to the Board in evaluating the reasonableness of each Fund’s advisory fees and total expense ratio.
The Board also took into account management’s discussion of each Fund’s expenses and also noted certain cost savings initiatives implemented by the Adviser across all of the Funds. The Board also noted that the Adviser had entered into fee waiver and expense reimbursement arrangements with respect to each of the Funds. The Board took into account the factors that the Adviser reported that contributed to any expenses that were relatively higher than the peer group comparative data.
The Board also received and considered information about the portion of the advisory fee that is being retained by the Adviser after payment of the fee to each Sub-Adviser for sub-advisory services. In assessing the reasonableness of this amount, the Board received and evaluated information about the nature and extent of responsibilities that are retained and risks that are assumed by Adviser and not delegated to or assumed by the Sub-Advisers, and about the Adviser’s on-going oversight services. The Board also considered that the sub-advisory fees being paid to each Sub-Adviser had been negotiated by the Adviser on an arm’s length basis and were paid by the Adviser and not the respective Fund. The Board considered the Adviser’s explanation that the sub-advisory fees are priced at a competitive level. In the case of the North Square Multi Strategy Fund, the North Square Spectrum Alpha Fund, the North Square Tactical Defensive Fund, and the North Square Tactical Growth Fund, the Board considered and evaluated the fact that NSI Retail was affiliated with the Adviser.
86
North Square Funds
SUPPLEMENTAL INFORMATION (Unaudited) – Continued
The Board also received and considered information about the nature and extent of services offered and fee rates charged by the Adviser and the Sub-Advisers to other types of clients with investment strategies similar to those of the Funds, if any. In this regard, the Board received information about the significantly greater scope of services, and compliance, reporting and other legal burdens and risks of managing registered mutual funds compared with those associated with managing assets of other types of clients, including non-mutual fund clients, such as institutional separate accounts.
As applicable, the Board also noted the Adviser’s representation that the services provided to each Fund are not duplicative of the advisory services provided to the underlying funds in which the Funds may invest and that the Adviser voluntarily waives each Fund’s management fee with respect to the amount of its net assets invested in an underlying affiliated fund.
Based on its consideration of the factors and information it deemed relevant, including those described here, the Board concluded that the compensation payable to the Adviser under the Advisory Agreement and to the Sub-Advisers under the Sub-Advisory Agreements with respect to each of the Funds were reasonable.
Profitability
The Board received and considered information concerning the Adviser’s costs of sponsoring the Funds and the profitability to the Adviser and its respective affiliates from providing services to the Funds. The Board noted that the levels of profitability may be affected by numerous factors. The Board also received information relating to the operations and profitability to each Sub-Adviser from providing services to the Funds. The Board considered representations from the Adviser and each Sub-Adviser that the Sub-Adviser’s fees were negotiated at arm’s length on a Fund-by-Fund basis and that the sub-advisory fees are paid by the Adviser and not the Funds. Accordingly, the Board concluded that the profitability of each Sub-Adviser was a less relevant factor with respect to the Board’s consideration of the Sub-Advisory Agreements.
Based on its review, the Board determined that the profits reported by the Advisers from services being provided to the Funds, if any, were not excessive.
Economies of Scale
The Board considered the potential for the Adviser to experience economies of scale in the provision of advisory services to each Fund as the Funds grew. The Board considered that the Adviser may share potential economies of scale from its advisory business in a variety of ways, including through fee waiver and expense reimbursement arrangements, services that benefit shareholders, competitive advisory fee rates set at the outset without regard to breakpoints, and investments in the business intended to enhance services available to shareholders. The Board also took into account management’s discussion of the Funds’ fee structures. The Board also considered the effect of each Fund’s growth in size on its performance and fees and that, if the Fund’s assets increase over time, the Fund may realize other economies of scale. The Independent Trustees recognized that, because each Fund’s sub-advisory fees are paid by the Adviser, and not the Fund, an analysis of economies of scale was more appropriate in the context of the Board’s consideration of the Advisory Agreement.
The Board concluded that, especially in light of the current stage of development of the Funds, the Adviser’s arrangements with respect to the Funds constituted a reasonable approach to sharing potential economies of scale with the Funds and their shareholders.
“Fall-Out” Benefits
The Board received and considered information regarding potential “fall-out” or ancillary benefits that the Adviser and its affiliates may receive as a result of their relationships with the Funds. The Board noted that ancillary benefits could include, among others, benefits directly attributable to other relationships with the Funds and benefits potentially derived from an increase in the Adviser’s business as a result of their relationships with the Funds. In addition, the Board considered the potential benefits, other than sub-advisory fees, that the Sub-Advisers and their affiliates may receive because of their relationships with the Funds, including the benefits of research services that may be available to the Sub-Adviser as a result of securities transactions effected for the Funds and other investment advisory clients, as well as other benefits from increases in assets under management.
Based on its consideration of the factors and information it deemed relevant, including those described above, the Board did not find that any ancillary benefits that may be received by the Adviser and the Sub-Advisers and their respective affiliates to be unreasonable.
87
North Square Funds
SUPPLEMENTAL INFORMATION (Unaudited) – Continued
Conclusion
At the Meeting, after considering the above-described material factors and based on its robust deliberations and its evaluation of the information described above, and assisted by the advice of independent counsel, the Board, including the Independent Trustees, concluded that the approval of the renewal and continuation of the Agreements with respect to each Fund was in the best interest of each respective Fund and its shareholders.
88
North Square Funds
Adviser
North Square Investments, LLC
200 West Madison Street, Suite 2610
Chicago, IL 60606
Investment Sub-Adviser NSI Retail Advisors, LLC
2000 Ericsson Drive, Suite 100
Warrendale, PA 15086 | Investment Sub-Adviser Red Cedar Investment Management, LLC
333 Bridge Street NW, Suite 601
Grand Rapids, MI 49504 |
Investment Sub-Adviser Algert Global LLC
101 California Street, Suite 3240
San Francisco, CA 94111 | Investment Sub-Adviser Kennedy Capital Management LLC
10829 Olive Boulevard, Suite 100
St. Louis, MO 63141 |
Independent Registered Public Accounting Firm
Cohen & Company, Ltd.
1350 Euclid Avenue, Suite 800
Cleveland, OH 44115
Fund Administrator, Transfer Agent and Fund Accountant
Ultimus Fund Solutions, LLC
225 Pictoria Drive, Suite 450
Cincinnati, OH 45246
Custodian
U.S. Bank, N.A.
1555 North River Center Drive, Suite 302
Milwaukee, WI 53212
Distributor
Foreside Fund Services, LLC a wholly-owned subsidiary of Foreside Financial Group, LLC (d/b/a ACA Group)
Three Canal Plaza, Suite 100
Portland, ME 04101
www.foreside.com
FUND INFORMATION |
Fund Name | | Ticker | CUSIP |
North Square Spectrum Alpha Fund | Class A | ORIGX | 66263L304 |
North Square Spectrum Alpha Fund | Class I | ORIYX | 66263L858 |
North Square Dynamic Small Cap Fund | Class A | ORSAX | 66263L502 |
North Square Dynamic Small Cap Fund | Class I | ORSIX | 66263L825 |
North Square Multi Strategy Fund | Class A | ORILX | 66263L700 |
North Square Multi Strategy Fund | Class I | PORYX | 66263L833 |
North Square Preferred and Income Securities Fund | Class I | ORDNX | 66263L882 |
North Square Tactical Growth Fund | Class A | ETFAX | 66263L734 |
North Square Tactical Growth Fund | Class C | ETFCX | 66263L742 |
North Square Tactical Growth Fund | Class I | ETFOX | 66263L726 |
North Square Tactical Defensive Fund | Class A | ETFRX | 66263L718 |
North Square Tactical Defensive Fund | Class C | ETFZX | 66263L692 |
North Square Tactical Defensive Fund | Class I | ETFWX | 66263L684 |
North Square Trilogy Alternative Return Fund | Class A | STTGX | 66263L650 |
North Square Trilogy Alternative Return Fund | Class C | STTCX | 66263L668 |
North Square Trilogy Alternative Return Fund | Class I | STTIX | 66263L676 |
Proxy Voting Policies and Procedures
A description of the Funds’ proxy voting policies and procedures related to portfolio securities is available without charge, upon request, by calling the Funds at (855) 551-5521 or on the U.S. Securities and Exchange Commission’s (“SEC”) website at www.sec.gov.
Proxy Voting Record
Information regarding how the Funds voted proxies for portfolio securities, if applicable, during the most recent 12-month period ended June 30, is also available, without charge and upon request by calling (855) 551-5521 or by accessing the Funds’ Form N-PX on the SEC’s website at www.sec.gov.
Portfolio Holdings Disclosure
The Funds file a complete schedule of portfolio holdings with the U.S. Securities and Exchange Commission (the “SEC”) for the first and third quarters of each fiscal year as an exhibit to their reports on Form N-PORT. The Funds’ Form N-PORT reports are available on the SEC’s website at www.sec.gov and on the Funds’ website at www.northsquareinvest.com/fund-reports-holdings.
North Square Funds
c/o Ultimus Fund Solutions, LLC
225 Pictoria Drive, Suite 450
Cincinnati, Ohio 45246
1-855-551-5521
Item 8. Changes in and Disagreements with Accountants for Open-End Management Investment Companies.
Not applicable.
Item 9. Proxy Disclosures for Open-End Management Investment Companies.
Not applicable.
Item 10. Remuneration Paid to Directors, Officers, and Others of Open-End Management Investment Companies.
Included under Item 7
Item 11. Statement Regarding Basis for Approval of Investment Advisory Contract.
Included under Item 7
Item 12. Disclosure of Proxy Voting Policies and Procedures for Closed-End Management Investment Companies.
Not applicable.
Item 13. Portfolio Managers of Closed-End Management Investment Companies.
Not applicable.
Item 14. Purchases of Equity Securities by Closed-End Management Investment Company and Affiliated Purchasers.
Not applicable.
Item 15. Submission of Matters to a Vote of Security Holders.
None.
Item 16. Controls and Procedures.
(a) The registrant’s Principal Executive Officer and Principal Financial Officer have concluded that the registrant’s disclosure controls and procedures (as defined in Rule 30a-3(c) under the Act) are effective in design and operation and are sufficient to form the basis of the certifications required by Rule 30a-(2) under the Act, based on their evaluation of these disclosure controls and procedures as of a date within 90 days of this report on Form N-CSR.
(b) There were no changes in the registrant’s internal control over financial reporting (as defined in Rule 30a-3(d) under the Act) during the period covered by this report that have materially affected, or are reasonably likely to materially affect, the registrant’s internal control over financial reporting.
Item 17. Disclosure of Securities Lending Activities for Closed-End Management Investment Companies.
Not applicable.
Item 18. Recovery of Erroneously Awarded Compensation.
(a) Not applicable.
(b) Not applicable.
Item 19. Exhibits.
| (a)(1) | Not Applicable – disclosed with annual report |
SIGNATURES
Pursuant to the requirements of the Securities Exchange Act of 1934 and the Investment Company Act of 1940, the registrant has duly caused this report to be signed on its behalf by the undersigned, thereunto duly authorized.
| (Registrant) | Exchange Place Advisors Trust | |
| By (Signature and Title) | /s/ Ian Martin | |
| | Ian Martin, President and Principal Executive Officer | |
Pursuant to the requirements of the Securities Exchange Act of 1934 and the Investment Company Act of 1940, this report has been signed below by the following persons on behalf of the registrant and in the capacities and on the dates indicated.
| By (Signature and Title) | /s/ Ian Martin | |
| | Ian Martin, President and Principal Executive Officer | |
| By (Signature and Title) | /s/ Zachary P. Richmond | |
| | Zachary P. Richmond, Treasurer and Principal Financial Officer | |