UNITED STATES
SECURITIES AND EXCHANGE COMMISSION
Washington, D.C. 20549
FORM N-CSR
CERTIFIED SHAREHOLDER REPORT OF REGISTERED
MANAGEMENT INVESTMENT COMPANIES
| Investment Company Act file number : 811- 23373 |
| NORTH SQUARE INVESTMENTS TRUST |
| (Exact name of registrant as specified in charter) |
| 200 West Madison Street, Suite 2610 |
| Chicago, Illinois 60606 |
| (Address of principal executive offices) (Zip code) |
Alan E. Molotsky, Esq.
North Square Investments Trust
200 West Madison Street, Suite 2610
Chicago, Illinois 60606
(Name and address of agent for service)
| Registrant’s telephone number, including area code: | (312) 857-2160 |
| Date of fiscal year end: | October 31 |
| Date of reporting period: | October 31, 2023 |
Form N-CSR is to be used by management investment companies to file reports with the Commission not later than 10 days after the transmission to stockholders of any report that is required to be transmitted to stockholders under Rule 30e-1 under the Investment Company Act of 1940 (17 CFR 270.30e-1). The Commission may use the information provided on Form N-CSR in its regulatory, disclosure review, inspection and policymaking roles.
A registrant is required to disclose the information specified by Form N-CSR, and the Commission will make this information public. A registrant is not required to respond to the collection of information contained in Form N-CSR unless the Form displays a currently valid Office of Management and Budget ("OMB") control number. Please direct comments concerning the accuracy of the information collection burden estimate and any suggestions for reducing the burden to Secretary, Securities and Exchange Commission, 450 Fifth Street, NW, Washington, DC 20549-0609. The OMB has reviewed this collection of information under the clearance requirements of 44 U.S.C. § 3507.
Item 1. Reports to Stockholders.
| (a) |

| ANNUAL REPORT |
| NORTH SQUARE ADVISORY RESEARCH SMALL CAP VALUE FUND NORTH SQUARE ALTRINSIC INTERNATIONAL EQUITY FUND NORTH SQUARE MCKEE BOND FUND NORTH SQUARE STRATEGIC INCOME FUND October 31, 2023 |
 | North Square Investments | www.northsquareinvest.com |
North Square Funds
Table of Contents
| Shareholder Letters | 1 |
| Fund Performance | 7 |
| Schedules of Investments | 12 |
| Statements of Assets and Liabilities | 37 |
| Statements of Operations | 38 |
| Statements of Changes in Net Assets | 39 |
| Financial Highlights | 42 |
| Notes to Financial Statements | 48 |
| Report of Independent Registered Public Accounting Firm | 59 |
| Supplemental Information | 60 |
| Expense Examples | 72 |
This report and the financial statements contained herein are provided for the general information of the shareholders of the North Square Funds. This report is not authorized for distribution to prospective investors in the Funds unless preceded or accompanied by an effective prospectus.
www.northsquareinvest.com
| Discussion of North Square Advisory Research Small Cap Value Fund Performance |  |
A letter from Matthew Swaim, CFA, Managing Director, Christopher Harvey, CFA, Managing Director, and Bruce Zessar, J.D., CFA, Managing Director, Portfolio Managers of the North Square Advisory Research Small Cap Value Fund.
December 30, 2023
Dear Shareholder,
During the fund’s fiscal year (November 1, 2022 – October 31, 2023), the U.S. experienced a resilient economy while financial markets continued to be buffeted by concerns about inflation and the longer term effects of higher interest rates. GDP was strong, running at a 2.9% annualized rate during the 12-month period to 9/30/23 and at a rock solid 4.9% in the third calendar quarter of 2023. Unemployment remained low, under 4%, and it touched a generational low of 3.4% during the year.
Still, concerns about inflation remaining sticky led the Federal Reserve to continue rapidly increasing the target federal funds rate during the fund’s fiscal year. The federal funds rate started the year at a 3.00%-3.25% targeted range and ended the year at 5.25%-5.50%, the highest the federal funds rate has been since 2001. Inflation did moderate, with the Core Personal Consumption Expenditure Index (Core PCE) falling from 5.3% in October 2022 to 3.5% in October 2023 – but this remained a good distance from the Fed’s 2% target. Nevertheless, the Fed saw sufficient progress to stop raising rates after its July 2023 meeting, and subsequent to the fund’s fiscal year end, suggested that rate cuts are likely in 2024.
The combination of a strong economy with rising interest rates produced a mixed bag of performance across all asset classes. A group of tech stocks referred to as the “Magnificent Seven” racked up tremendous gains, while the rest of the equity market largely ran in place or declined.1 Given their weighting in benchmarks, the Magnificent Seven led the large cap S&P 500 Index to a 10.12% gain during the fund’s fiscal year. In contrast, the small cap Russell 2000 Index, which has no weighting in the Magnificent Seven, was down 8.62%. On the fixed income side, the Bloomberg US Aggregate Index (a leading index of the broad fixed income market) was basically flat, eking out a 0.36% gain.
As of October 31, 2023, the North Square Advisory Research Small Cap Value Fund declined 3.51% for the trailing 12 months (its fiscal year), versus a -9.93% decline for its primary benchmark, the Russell 2000 Value Total Return Index.
This is the second consecutive fiscal year where we are reporting significant relative outperformance, but continued negative absolute performance. We are pleased to protect capital whilst the market digests a large amount of macroeconomic news that has been challenging to stocks in the near term. We believe intrinsic value has been created by our businesses over the last two years that will be recognized in the stock prices as the market begins recovery.
At the portfolio company level, a strong performer was Miller Industries (MLR). Miller manufactures tow trucks, attaching specialized towing equipment through its portfolio of brands. In the years post COVID, the supply chain for their raw materials was disrupted, and Miller was challenged to deliver to its client base increasing backlog to all-time high levels. In the current fiscal year, supply chain pressure began to ease and deliveries began. These stock reacted positively to this operational improvement.
A weaker portfolio performer was First Interstate Banksystems, Inc. (FIBK). The banking sector experienced great volatility beginning in March of 2023 as several banking institutions had withdrawals of deposits and mark down on their bond portfolios. While FIBK deposits were stable, it did experience negative mark to market on its available for sale bond portfolio. We believe these issues to be short term in nature and that FIBK has adequate liquidity. This is demonstrated by the fact it maintained its generous dividend through the volatility. We continue to hold our position as we see value in the shares.
| 1 | The seven stocks are Apple, Microsoft, Alphabet, Amazon, Nvidia, Meta, and Tesla. The average return of these stocks during the fund’s fiscal year was 76.33%. Tesla was actually down 11.73% during the fiscal year, but it has had a strong 2023, up 60.72% for the period 12/31/22-10/31/23. |
1
Outlook
The past year has been a struggle in the financial markets, but we note significant progress in the Federal Reserve’s fight against inflation and the potential end of the rate rising cycle. Small cap shares offer tremendous value relative to other parts of the equity markets and believe shareholders will benefit as interest rate pressures ease.
As the Sub-advisor for the North Square Advisory Research Small Cap Value Fund responsible for the day-to-day management of the Fund we thank you for investing and look forward to updating you again in 2023.
Advisory Research, Inc.
The views in this letter are those of the Fund’s Sub-advisor as of December 30, 2023, and may not necessarily reflect the same views on a date thereafter. These views are intended to help shareholders in understanding the fund’s investment methodology and do not constitute investment advice.
Fund holdings and sector allocations are subject to change at any time. Please see the Schedule of Investments in this report for a complete list of Fund holdings.
Risk is inherent in all investing including an investment in the Fund. An investment in the Fund involves risk, including the following principal risks, among others: Equity Risk, Sector Focus Risk, Market Risk, Small-Cap Company Risk, Cybersecurity Risk, Preferred Securities Risk, Convertible Securities Risk, ETF Risk, Currency Risk, Emerging Market Risk, Value-Oriented Investment Strategies Risk, Foreign Investment Risk, and Management and Strategy Risk. Before you decide whether to invest in the Fund, carefully consider these risk factors associated with investing in the Fund, which may cause investors to lose money. There can be no assurance that the Fund will achieve its investment objective. An investment in the Fund is not a deposit of the bank and is not insured or guaranteed by the Federal Deposit Insurance Corporation or any other government agency.
2
| Discussion of North Square Altrinsic International Equity Fund Performance | |
December 30, 2023
Dear Shareholder,
Equity markets started 2023 on a strong note following the most challenging year for investors since the Global Financial Crisis. The first quarter of the year included two of the three largest bank failures in US history and the demise of the once venerable Credit Suisse, yet global equity markets delivered strong gains. Thereafter, volatility in stock, bond, currency, and commodity markets rose, as investors and economies grappled with an environment transitioning from one flooded with free money to one of rising interest rates.
International markets were pressured by an uncertain economic recovery and war in Europe, as well as a sluggish recovery in China. The rising prevalence and presumed impact of AI dominated headlines and drove the stock prices of associated companies to all-time highs. Toward the end of the third quarter, the world watched the October 7 terrorist attack by Hamas and the subsequent Israeli invasion of Gaza. The coverage and controversies of the conflict have pushed the war in Ukraine off the front pages, though the market’s response to both conflicts has been fairly muted. Ongoing risks across markets include war, excessive debt, economic imbalances, geopolitical tensions, and – importantly – those that are not yet known.
For the one-year period ended October 31, 2023, the North Square Altrinsic International Equity Fund gained 16.9% gross of fees (15.83% net), outperforming the MSCI EAFE (Net) Index’s 14.40% return.
The greatest sources of positive attribution for the fiscal year were positions in financials (SCOR, Everest Group, Sumitomo Mitsui Trust), consumer staples (Fomento Economico Mexicano (FEMSA), Haleon, Danone), and consumer discretionary (Trip.com, Sands China, Adidas). Investments in health care (Medtronic, BioNTech, Astellas Pharma) and industrials (Bureau Veritas, Kubota Corp) weighed on relative performance.
Both broad-based and stock-specific factors drove performance across the financials and consumer sectors. Our financials holdings are primarily concentrated in insurance, which is benefiting from an improving growth and competitive outlook, and in well-capitalized emerging markets banks that have opportunities to improve penetration in underbanked regions. Across consumer staples and consumer discretionary, our holdings include recognizable global brands that we believe can compound value through better cost management, tailwinds from structural category growth, a focus on shareholder returns, and/or better penetration among higher-margin premium products.
Lingering effects from the pandemic and near-term, industry-specific factors created challenges for our health care and industrials holdings. That said, our long-term outlook for our investments in these sectors is positive. One dynamic that negatively affected some of our health care holdings was the rising popularity of weight loss drugs. Obesity contributes to a variety of diseases, and many companies that offer drugs or services to treat symptoms or outcomes related to obesity declined as weight loss drugs soared. Competitive pressures and uncertainty over the prospects of the COVID-19 vaccine technology further weighed on holdings. Despite these headwinds, we believe the evolution of business models linked to scientific advancements and the increasing use of AI can support free cash flow growth in the medium term. Our industrials investments are poised to benefit from important trends including automation and urbanization, and the companies are global leaders in their respective areas, led by strong management teams employing good capital discipline. While our holdings have lagged the continued momentum of the broader market, they operate in attractive product categories with unique opportunities to drive accelerating growth.
The macroeconomic backdrop remains highly uncertain. Market volatility could increase as investors navigate through a period of evolving geopolitical, economic, and monetary policy conditions. However, we are in the early stages of improved operational performance, which should lead to accelerating financial returns for many international businesses. International markets feature a combination of improving company fundamentals and discounted valuations built upon several timely and compelling themes: leading multinational franchises that compound value; innovation and business transformation taking many companies from good to great; growth in emerging markets; and intensifying focus on capital management, including dividends and buybacks. The quality and embedded growth in international equities remain quite strong, providing an attractive outlook for years to come.
3
From the portfolio managers of the North Square Altrinsic International Equity Fund, thank you for investing.
Sincerely,
John Hock
John DeVita
Rich McCormick
Please note that the performance for the North Square International Equity Fund is presented gross of management fees and includes the reinvestment of all income. Gross returns will be reduced by investment advisory fees and other expenses that may be incurred in the management of the account. Past performance is not indicative of future results. The securities identified in this letter are not necessarily held by the Fund at the time of publication or thereafter, and should not be considered a recommendation or solicitation to purchase or sell these securities. It should not be assumed that any investment in these securities was, or will be, profitable. The outlook and opportunities noted in this letter are prospective and based upon the opinions of Altrinsic as of the date of this letter. There is no guarantee that we will be successful in our efforts to implement investment strategies that take advantage of such perceived opportunities.
4
| Discussion of North Square McKee Bond Fund Performance | |
A letter from Brian S. Allen, CFA, Chief Investment Officer and Portfolio Manager of the North Square McKee Bond Fund. 12/29/2023
A surprisingly resilient U.S. consumer confounded the widely held expectations for recession and Fed rate cuts as the year began. Buoyed by excess savings, higher home values, and the benefit of low-rate mortgages, continued spending on services (travel and entertainment) boosted GDP growth to an expected reading of approximately 2.5%, exceeding 2022’s experience.
Minimal change in market interest rates versus 12/31/2022 levels belied notable spikes in volatility during the year, which created several attractive relative value opportunities. Headlining the list of events was undoubtedly the second, third, and fourth largest bank failures in history, beginning in March. While the Federal Reserve, U.S. Treasury, and the FDIC contained the damage, it was not before a precipitous drop in Treasury yields and rise in volatility that exceeded 2020’s initial reaction to COVID. Yields on callable agency debt and brokered certificates of deposit lagged the move lower in Treasury yields, temporarily trading at spread levels on par with corporate securities.
The Fund also capitalized on the pivot in market interest rates and the coincident recovery in mortgage securities in October and (following the Fund’s year-end) November. Treasury securities yields reached 15-year highs, fueled by the Federal Reserve’s tough talk on inflation. Investor sentiment and positioning in bonds reached extremely defensive levels but soon reversed as inflation readings and the supply outlook for Treasury securities ultimately came in below expectations.
For the one-year period ending October 31, 2023, the Fund declined 0.19%, underperforming the Bloomberg US Aggregate Bond Index’s 0.36% return.
Though the rapid move lower in market interest rates is due for a pause, the outlook for core fixed income in 2024 is decidedly positive. With the Fed expected to reduce the Federal Funds rate several times while no longer providing the steadying demand of years past, opportunities to enhance performance should be available.
Kind Regards,
Brian S. Allen, CFA
Chief Investment Officer
CS McKee
5
| Discussion of North Square Strategic Income Fund Performance | |
Dear Shareholders,
The fiscal year 2023 began with many question marks as the Federal Reserve (“Fed”) was in the midst of a rate hike cycle which began the period with the upper bound of the Fed Funds rate at 3.25% and ended the period with the target at 5.5%. In fact, it was the most aggressive rate hike cycle in 50 years in terms of magnitude and time frame. Investors would have to look back to 2009 to find the last time interest rate volatility, as measured by the MOVE Index, remained this elevated for a period of 12 months. When Silicon Valley Bank collapsed in March due to a run on uninsured deposits and balance sheet mismanagement, it set off a chain reaction to other banks with similar characteristics and business models. Meanwhile, Swiss banking regulators were dealing with the unrelated collapse of Credit Suisse during the same time frame. Ultimately U.S. regulators responded with programs to bolster the banking system’s liquidity and calm the nerves of frightened depositors.
As the Fund entered the calendar year 2023, it was defensively positioned with regard to preferred and hybrid security exposure – both in terms of amount and credit quality. This was due to our belief that valuations were getting stretched in this space. Despite our relatively benign positioning, the Fund’s performance did not meet our standards as most preferred and hybrid security prices dropped in sympathy with many investors left to ponder whether the entire banking system was at risk. By the end of March, we became convinced that two of the three largest bank failures in United States history did not pose a systemic risk and that they were due to the idiosyncratic business models and management of those institutions. With that view, we gradually added to preferred and hybrid exposure during the last 2 weeks of March and into April until reaching approximately 50% by market value. By continuing to employ our management discipline and taking a long-term view, we were able to add exposure to securities that were substantially undervalued in our estimation.
During this “March Madness” episode, the Fed continued with its rate hike cycle, ultimately moving the upper bound of the Fed Funds target to 5.5% by the end of July. With inflation heading down toward the Fed’s target, many investors got comfortable with the notion that they may be done with the rate hike cycle. Despite this, the U.S. Treasury market continued to sell off, with 10-year Treasury yields moving from 3.96% from the end of July to 4.93% at the end of the fiscal year as investors grew weary of unprecedented budget deficits, record debt to GDP ratios, concerns about Treasury supply, and the downgrade of U.S. debt by Fitch Ratings from AAA to AA+. As this drama unfolded, preferreds and hybrids performed poorly in October due to general risk-off sentiment.
We believe the North Square Strategic Income Fund is poised to offer value going forward as preferreds and hybrids have still not recovered all their value from both the March and October sell-offs. With inflation heading in the right direction, the Fed might be patient before committing to further hikes. With the market pricing in rate cuts for 2024, the soft-landing could be within reach. For the fiscal year ended October 31, 2023, the Fund Class I Shares delivered a total return of -0.27%, while the benchmark as represented by the Bloomberg U.S. Aggregate Bond Index returned 0.36%. Despite underperforming on a relative basis, we believe we have served shareholders through active management and weathering the storm that impacted the preferred and hybrid space. We purchased securities and added exposure at what we believed to be attractive levels in March and April. This could lead to attractive returns as we move into the year 2024. On behalf of the investment team at Red Cedar Investment Management, we thank you for entrusting us with your investment needs and wish everyone an enjoyable holiday season and prosperous New Year.
Regards,
John L. Cassady III, CFA
Chief Investment Officer
Red Cedar Investment Management
6
| North Square Advisory Research Small Cap Value Fund |
| FUND PERFORMANCE at October 31, 2023 |
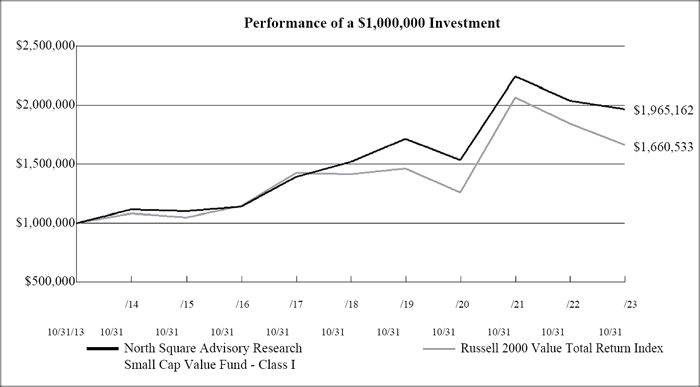
This graph compares a hypothetical $1,000,000 investment in the Fund, made on October 31, 2013, with a similar investment in the Russell 2000 Value Total Return Index. Results include the reinvestment of all dividends and capital gains.
The Russell 2000 Value Total Return Index measures the performance of the broad value segment of the U.S. equity value universe. It includes those Russell 2000 companies with lower price-to-book ratios and lower forecasted growth values. This index does not reflect expenses, fees or sales charge, which would lower performance. The index is unmanaged and is not available for investment.
Average Annual Total Returns
(for the periods ended October 31, 2023)
| 1 Year | 5 Year | 10 Year | |
| North Square Advisory Research Small Cap Value Fund - Class I | -3.51% | 5.30% | 6.99% |
| Russell 2000 Value Total Return Index | -9.93% | 3.26% | 5.20% |
Returns reflect the reinvestment of distributions made by the Fund, if any. The performance table above does not reflect the deduction of taxes that a shareholder would pay on Fund distributions or the redemption of Fund shares.
The Fund acquired all assets and assumed the liabilities of the Advisory Research Small Cap Value Fund (the “Predecessor Fund”) effective the close of business on February 21, 2020. The Predecessor Fund commenced investment operations on November 16, 2009. As a result of the reorganization, the Fund is the accounting successor of the Predecessor Fund. Performance results shown in the performance table above prior to February 21, 2020 reflect the performance of the Predecessor Fund. Effective January 11, 2022, the Fund changed names to the North Square Advisory Research Small Cap Value Fund (formerly, North Square Oak Ridge All Cap Value Fund) and changed investment strategy (Note 1).
Gross and net expense ratios for Class I shares were 1.24% and 0.94%, respectively, which were the amounts stated in the current prospectus dated February 28, 2023. For the Fund’s current one year expense ratios, please refer to the Financial Highlights section of this report. The Fund’s advisor has contractually agreed to waive its fees and/or pay for operating expenses of the Fund to ensure that total annual fund operating expenses do not exceed 0.94% of the average daily net assets of the Fund’s Class I shares. This agreement is in effect until February 28, 2024, and it may be terminated before that date only by the Trust’s Board of Trustees. In the absence of such waivers, the Fund’s returns would have been lower.
The performance data quoted here represents past performance and past performance is not a guarantee of future results. Investment return and principal value will fluctuate so that an investor’s shares, when redeemed, may be worth more or less than their original cost. Current performance may be lower or higher than the performance information quoted. The most recent month end performance may be obtained by calling 1-855-551-5521.
7
| North Square Altrinsic International Equity Fund |
| FUND PERFORMANCE at October 31, 2023 |
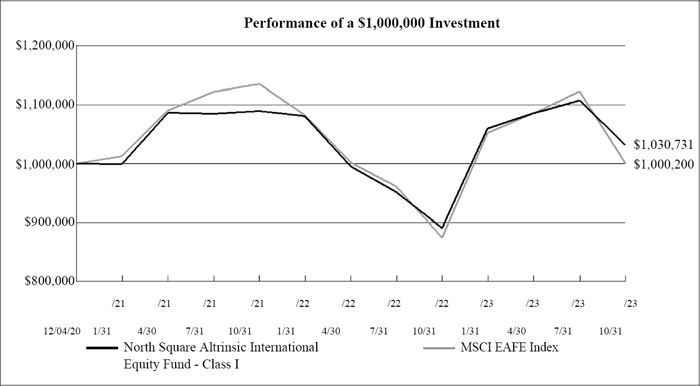
This graph compares a hypothetical $1,000,000 investment in the Fund, made at the Fund’s inception, with a similar investment in the MSCI EAFE Index. Results include the reinvestment of all dividends and capital gains.
The MSCI EAFE Index is an equity index which captures large and mid cap representation across 21 developed markets countries around the world, excluding the US and Canada. With 796 constituents, the index covers approximately 85% of the free float-adjusted market capitalization in each country. This index does not reflect expenses, fees or sales charge, which would lower performance. The index is unmanaged and is not available for investment.
Average Annual Total Returns
(for the periods ended October 31, 2023)
| Since Inception | ||
| 1 Year | (12/04/20) | |
| North Square Altrinsic International Equity Fund - Class I | 15.83% | 1.05% |
| MSCI EAFE Index | 14.40% | 0.01% |
Returns reflect the reinvestment of distributions made by the Fund, if any. The performance table above does not reflect the deduction of taxes that a shareholder would pay on Fund distributions or the redemption of Fund shares.
Gross and net expense ratios for Class I shares were 1.29% and 0.97%, respectively, which were the amounts stated in the current prospectus dated February 28, 2023. For the Fund’s current expense ratios, please refer to the Financial Highlights section of this report. The Fund’s advisor has contractually agreed to waive its fees and/or pay for operating expenses of the Fund to ensure that total annual fund operating expenses do not exceed 0.97% of the average daily net assets of the Fund’s Class I shares. This agreement is in effect until February 28, 2024, and it may be terminated before that date only by the Trust’s Board of Trustees. In the absence of such waivers, the Fund’s returns would have been lower.
The performance data quoted here represents past performance and past performance is not a guarantee of future results. Investment return and principal value will fluctuate so that an investor’s shares, when redeemed, may be worth more or less than their original cost. Current performance may be lower or higher than the performance information quoted. The most recent month end performance may be obtained by calling 1-855-551-5521.
8
| North Square McKee Bond Fund |
| FUND PERFORMANCE at October 31, 2023 |
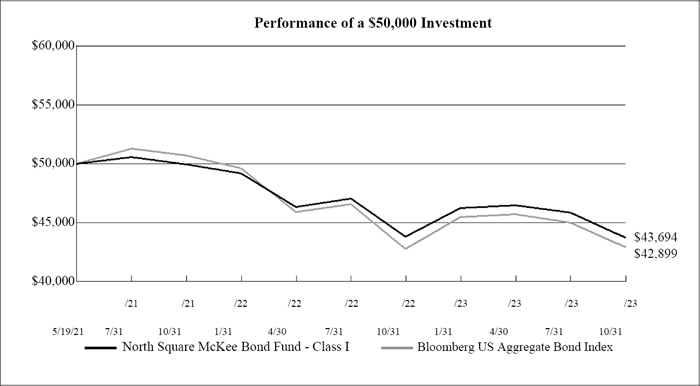
This graph compares a hypothetical $50,000 investment in the Fund’s Class I shares (the class with the largest net assets), made at the Fund’s inception, with a similar investment in the Bloomberg US Aggregate Bond Index. Results include the reinvestment of all dividends and capital gains.
The Bloomberg US Aggregate Bond Index is a broad-based flagship benchmark that measures the investment grade, US dollar denominated, fixed-rate taxable bond market. The index does not reflect expenses, fees or sales charge, which would lower performance. The index is unmanaged and is not available for investment.
Average Annual Total Returns
(for the periods ended October 31, 2023)
| Since Inception | Since Inception | ||
| 1 Year | (12/28/20) | (5/19/21) | |
| North Square McKee Bond Fund - Class I | -0.19% | N/A | -5.35% |
| North Square McKee Bond Fund - Class R6 | -0.07% | -4.79% | N/A |
| Bloomberg US Aggregate Bond Index | 0.36% | -6.18% | -6.06% |
| Bloomberg Intermediate Aggregate Bond Index* | 1.23% | -4.30% | -4.53% |
Returns reflect the reinvestment of distributions made by the Fund, if any. The performance table above does not reflect the deduction of taxes that a shareholder would pay on Fund distributions or the redemption of Fund shares.
Gross expense ratios for Class I and R6 shares were 0.57% and 0.58%, respectively, and net expense ratios for Class I and R6 shares were 0.47% and 0.28%, respectively, which were the amounts stated in the current prospectus dated February 28, 2023. For the Fund’s current expense ratios, please refer to the Financial Highlights section of this report. The Fund’s advisor has contractually agreed to waive its fees and/ or pay for operating expenses of the Fund to ensure that total annual fund operating expenses do not exceed 0.47% and 0.28% of the average daily net assets of the Fund’s Class I shares and Class R6 shares, respectively. This agreement is in effect until February 28, 2024, and it may be terminated before that date only by the Trust’s Board of Trustees. In the absence of such waivers, the Fund’s returns would have been lower.
| * | Effective January 6, 2023, the Bloomberg US Aggregate Bond Index has replaced the Bloomberg Intermediate Aggregate Bond Index as the Fund’s primary benchmark as the Bloomberg US Aggregate Bond Index is more closely aligned with the Fund’s principal investment strategies and portfolio holdings. |
The performance data quoted here represents past performance and past performance is not a guarantee of future results. Investment return and principal value will fluctuate so that an investor’s shares, when redeemed, may be worth more or less than their original cost. Current performance may be lower or higher than the performance information quoted. The most recent month end performance may be obtained by calling 1-855-551-5521.
9
| North Square Strategic Income Fund |
| FUND PERFORMANCE at October 31, 2023 |
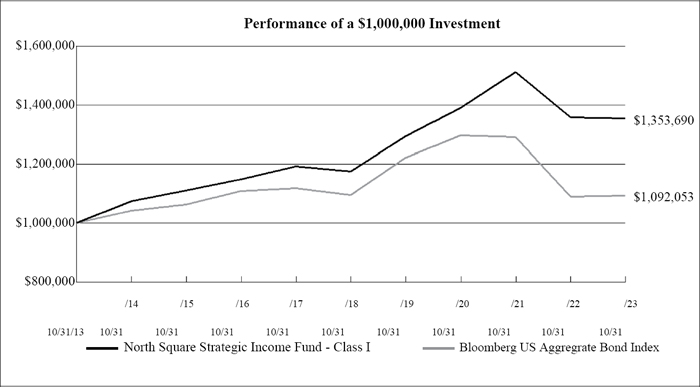
This graph compares a hypothetical $1,000,000 investment in the Fund, made on October 31, 2013, with a similar investment in the Bloomberg US Aggregate Bond Index. Results include the reinvestment of all dividends and capital gains.
The Bloomberg US Aggregate Bond Index is a broad-based flagship benchmark that measures the investment grade, US dollar denominated, fixed-rate taxable bond market. The index does not reflect expenses, fees or sales charge, which would lower performance. The index is unmanaged and is not available for investment.
Average Annual Total Returns
(for the periods ended October 31, 2023)
| 1 Year | 5 Year | 10 Year | Since Inception (02/28/23) | |
| North Square Strategic Income Fund - Class A | ||||
| Without Load | N/A | N/A | N/A | -4.48% |
| With Load(a) | N/A | N/A | N/A | -9.97% |
| North Square Strategic Income Fund - Class I | -0.27% | 2.86% | 3.07% | N/A |
| Bloomberg US Aggregate Bond Index | 0.36% | -0.06% | 0.88% | -3.16% |
| (a) | Maximum sales charge for Class A shares is 5.75%. No sales charge applies on investments of $500,000 or more, but a contingent deferred sales charge of 1% may be imposed on certain redemptions of such shares within 12 months of the date of purchase. |
Returns reflect the reinvestment of distributions made by the Fund, if any. The performance table above does not reflect the deduction of taxes that a shareholder would pay on Fund distributions or the redemption of Fund shares.
The Fund acquired all assets and assumed the liabilities of the Advisory Research Strategic Income Fund (the “Predecessor Fund”) effective the close of business on February 21, 2020. The Predecessor Fund commenced investment operations on December 31, 2012 after the conversion of a limited partnership account, the Advisory Research Value Income Fund, L.P. (the “Predecessor Account”), which commenced operations on June 30, 2003. As a result of each reorganization, the Fund is the accounting successor of each the Predecessor Fund and Predecessor Account. Performance results shown in the performance table above between February 21, 2020 and December 31, 2012 reflect the performance of the Predecessor Fund, and performance results shown prior to December 31, 2012 reflect the performance of the Predecessor Account. The Predecessor Account was not registered under the 1940 Act and therefore was
10
| North Square Strategic Income Fund |
| FUND PERFORMANCE at October 31, 2023 – Continued |
not subject to certain restrictions imposed by the 1940 Act on registered investment companies and by the Internal Revenue Code of 1986 on regulated investment companies. If the Predecessor Account had been registered under the 1940 Act, the Predecessor Account’s performance may have been adversely affected.
Gross expense ratios for Class A and I shares were 1.39% and 1.14%, respectively, and net expense ratios for Class A and I shares were 1.15% and 0.90%, respectively, which were the amounts stated in the current prospectus dated February 28, 2023. For the Fund’s current one year expense ratios, please refer to the Financial Highlights section of this report. The Fund’s advisor has contractually agreed to waive its fees and/or pay for operating expenses of the Fund to ensure that total annual fund operating expenses do not exceed 1.15% and 0.90% of the average daily net assets of the Fund’s Class A and Class I shares, respectively. This agreement is in effect until February 28, 2024, and it may be terminated before that date only by the Trust’s Board of Trustees. In the absence of such waivers, the Fund’s returns would have been lower.
The performance data quoted here represents past performance and past performance is not a guarantee of future results. Investment return and principal value will fluctuate so that an investor’s shares, when redeemed, may be worth more or less than their original cost. Current performance may be lower or higher than the performance information quoted. The most recent month end performance may be obtained by calling 1-855-551-5521.
11
| North Square Advisory Research Small Cap Value Fund |
| SCHEDULE OF INVESTMENTS |
| October 31, 2023 |
| Shares | Fair Value | |||||||
| COMMON STOCKS — 98.6% | ||||||||
| CONSUMER DISCRETIONARY — 25.3% | ||||||||
| AUTOMOTIVE — 6.0% | ||||||||
| 28,205 | Miller Industries, Inc. | $ | 1,025,816 | |||||
| HOME CONSTRUCTION — 4.9% | ||||||||
| 8,020 | M.D.C. Holdings, Inc. | 304,359 | ||||||
| 9,027 | Skyline Champion Corp.(a) | 529,253 | ||||||
| 833,612 | ||||||||
| LEISURE FACILITIES & SERVICES — 3.9% | ||||||||
| 10,995 | Monarch Casino & Resort, Inc. | 661,789 | ||||||
| LEISURE PRODUCTS — 2.6% | ||||||||
| 6,485 | Brunswick Corp. | 450,513 | ||||||
| RETAIL — DISCRETIONARY — 7.9% | ||||||||
| 3,830 | Asbury Automotive Group, Inc.(a) | 732,947 | ||||||
| 4,692 | Floor & Decor Holdings, Inc., Class A(a) | 386,621 | ||||||
| 10,585 | Foot Locker, Inc. | 222,179 | ||||||
| 1,341,747 | ||||||||
| TOTAL CONSUMER DISCRETIONARY | 4,313,477 | |||||||
| CONSUMER STAPLES — 5.1% | ||||||||
| WHOLESALE — CONSUMER STAPLES — 5.1% | ||||||||
| 15,102 | Performance Food Group Co.(a) | 872,292 | ||||||
| TOTAL CONSUMER STAPLES | 872,292 | |||||||
| ENERGY — 2.8% | ||||||||
| OIL & GAS PRODUCERS — 0.8% | ||||||||
| 1,455 | Denbury, Inc.(a) | 129,335 | ||||||
| OIL & GAS SERVICES & EQUIPMENT — 2.0% | ||||||||
| 11,305 | ChampionX Corp. | 348,194 | ||||||
| TOTAL ENERGY | 477,529 | |||||||
| FINANCIALS — 18.4% | ||||||||
| BANKING — 12.8% | ||||||||
| 18,367 | First Interstate BancSystem, Inc., Class A | 423,727 | ||||||
| 13,970 | First Merchants Corp. | 381,521 | ||||||
| 6,017 | Nicolet Bankshares, Inc.(a) | 438,158 | ||||||
| 6,383 | SouthState Corp. | 421,916 | ||||||
| 13,756 | Webster Financial Corp. | 522,315 | ||||||
| 2,187,637 | ||||||||
See accompanying Notes to Financial Statements.
12
| North Square Advisory Research Small Cap Value Fund |
| SCHEDULE OF INVESTMENTS – Continued |
| October 31, 2023 |
| Shares | Fair Value | |||||||
| COMMON STOCKS (Continued) | ||||||||
| CONSUMER DISCRETIONARY (Continued) | ||||||||
| INSURANCE — 5.6% | ||||||||
| 4,060 | Enstar Group, Ltd.(a) | $ | 962,098 | |||||
| TOTAL FINANCIALS | 3,149,735 | |||||||
| HEALTH CARE — 2.6% | ||||||||
| HEALTH CARE FACILITIES & SERVICES — 2.6% | ||||||||
| 6,155 | HealthEquity, Inc.(a) | 441,190 | ||||||
| TOTAL HEALTH CARE | 441,190 | |||||||
| INDUSTRIALS — 20.9% | ||||||||
| AEROSPACE & DEFENSE — 1.5% | ||||||||
| 11,155 | Spirit AeroSystems Holdings, Inc., Class A(a) | 252,103 | ||||||
| COMMERCIAL SUPPORT SERVICES — 6.1% | ||||||||
| 34,262 | First Advantage Corp. | 445,749 | ||||||
| 24,600 | Viad Corp.(a) | 596,058 | ||||||
| 1,041,807 | ||||||||
| ELECTRICAL EQUIPMENT — 3.5% | ||||||||
| 11,090 | Bel Fuse, Inc., Class B(a) | 600,856 | ||||||
| MACHINERY — 8.0% | ||||||||
| 2,705 | Alamo Group, Inc. | 433,612 | ||||||
| 38,102 | Gates Industrial Corp. PLC(a) | 416,074 | ||||||
| 5,065 | John Bean Technologies Corp. | 526,861 | ||||||
| 1,376,547 | ||||||||
| TRANSPORTATION EQUIPMENT — 1.8% | ||||||||
| 14,705 | Trinity Industries, Inc. | 306,305 | ||||||
| TOTAL INDUSTRIALS | 3,577,618 | |||||||
| MATERIALS — 9.7% | ||||||||
| CHEMICALS — 6.8% | ||||||||
| 28,319 | Element Solutions, Inc. | 516,255 | ||||||
| 21,195 | Valvoline, Inc. | 628,857 | ||||||
| 1,145,112 | ||||||||
| CONSTRUCTION MATERIALS — 1.4% | ||||||||
| 1,585 | Eagle Materials, Inc. | 243,947 | ||||||
| CONTAINERS & PACKAGING — 1.5% | ||||||||
| 2,135 | AptarGroup, Inc. | 261,046 | ||||||
| TOTAL MATERIALS | 1,650,105 | |||||||
See accompanying Notes to Financial Statements.
13
| North Square Advisory Research Small Cap Value Fund |
| SCHEDULE OF INVESTMENTS – Continued |
| October 31, 2023 |
| Shares | Fair Value | |||||||
| COMMON STOCKS (Continued) | ||||||||
| TECHNOLOGY — 13.8% | ||||||||
| SOFTWARE — 6.5% | ||||||||
| 47,450 | Alkami Technology, Inc.(a) | $ | 851,728 | |||||
| 4,060 | Blackbaud, Inc.(a) | 265,524 | ||||||
| 1,117,252 | ||||||||
| TECHNOLOGY SERVICES — 7.3% | ||||||||
| 14,245 | Cass Information Systems, Inc. | 538,603 | ||||||
| 9,445 | MAXIMUS, Inc. | 705,730 | ||||||
| 1,244,333 | ||||||||
| TOTAL TECHNOLOGY | 2,361,585 | |||||||
| TOTAL COMMON STOCKS (Cost $17,812,069) | 16,843,531 | |||||||
| SHORT-TERM INVESTMENTS — 1.3% | ||||||||
| 230,473 | First American Treasury Obligations Fund, Class X, 5.29% (Cost $230,473)(b) | 230,473 | ||||||
| TOTAL SHORT-TERM INVESTMENTS (Cost $230,473) | 230,473 | |||||||
| TOTAL INVESTMENTS — 99.9% (Cost $18,042,542) | $ | 17,074,004 | ||||||
| Other Assets in Excess of Liabilities — 0.1% | 11,734 | |||||||
| NET ASSETS — 100.0% | $ | 17,085,738 | ||||||
| (a) | Non-income producing security. |
| (b) | Rate disclosed is the seven day effective yield as of October 31, 2023. |
LTD - Limited Company
PLC - Public Limited Company
See accompanying Notes to Financial Statements.
14
| North Square Advisory Research Small Cap Value Fund |
| SUMMARY OF INVESTMENTS |
| As of October 31, 2023 |
| Percent of Total | ||||
| Security Type/Sector | Net Assets | |||
| Common Stocks | ||||
| Consumer Discretionary | 25.3 | % | ||
| Consumer Staples | 5.1 | % | ||
| Energy | 2.8 | % | ||
| Financials | 18.4 | % | ||
| Health Care | 2.6 | % | ||
| Industrials | 20.9 | % | ||
| Materials | 9.7 | % | ||
| Technology | 13.8 | % | ||
| Total Common Stocks | 98.6 | % | ||
| Short-Term Investment | 1.3 | % | ||
| Total Investments | 99.9 | % | ||
| Other Assets in Excess of Liabilities | 0.1 | % | ||
| Total Net Assets | 100.0 | % | ||
See accompanying Notes to Financial Statements.
15
| North Square Altrinsic International Equity Fund |
| SCHEDULE OF INVESTMENTS |
| October 31, 2023 |
| Shares | Fair Value | |||||||
| COMMON STOCKS — 92.0% | ||||||||
| Bermuda — 4.4% | ||||||||
| 19,365 | AXIS Capital Holdings Ltd. | $ | 1,105,742 | |||||
| 9,332 | Everest Re Group, Ltd. | 3,691,925 | ||||||
| 4,797,667 | ||||||||
| Brazil — 0.7% | ||||||||
| 326,047 | Lojas Renner SA(a) | 796,861 | ||||||
| Canada — 1.2% | ||||||||
| 12,623 | Agnico Eagle Mines Ltd. - ADR | 592,145 | ||||||
| 126,828 | Kinross Gold Corp. | 662,144 | ||||||
| 1,254,289 | ||||||||
| Cayman Islands — 2.9% | ||||||||
| 117,760 | Alibaba Group Holding Ltd.(a) | 1,212,348 | ||||||
| 81,940 | Baidu, Inc., Class A(a) | 1,075,775 | ||||||
| 320,777 | Sands China Ltd.(a) | 863,548 | ||||||
| 3,151,671 | ||||||||
| France — 12.9% | ||||||||
| 36,509 | AXA SA | 1,081,995 | ||||||
| 63,023 | Bureau Veritas SA | 1,435,813 | ||||||
| 47,778 | Cia Generale de Establissements Michelin SCA | 1,419,696 | ||||||
| 36,158 | Danone | 2,151,489 | ||||||
| 4,562 | Pernod Ricard SA(a) | 810,267 | ||||||
| 31,400 | Sanofi | 2,851,889 | ||||||
| 32,659 | SCOR SE | 975,213 | ||||||
| 47,364 | TotalEnergies SE | 3,167,276 | ||||||
| 13,893,638 | ||||||||
| Germany — 8.0% | ||||||||
| 4,744 | adidas AG | 843,690 | ||||||
| 10,327 | BioNTech SE - ADR(a) | 965,988 | ||||||
| 47,980 | Daimler Truck Holding AG | 1,507,846 | ||||||
| 6,398 | Deutsche Boerse AG | 1,053,300 | ||||||
| 31,795 | Deutsche Post AG | 1,236,940 | ||||||
| 13,264 | SAP SE | 1,779,488 | ||||||
| 9,057 | Siemens AG | 1,202,096 | ||||||
| 8,589,348 | ||||||||
| India — 2.1% | ||||||||
| 40,488 | HDFC Bank Ltd. - ADR | 2,289,596 | ||||||
| Ireland — 6.4% | ||||||||
| 24,038 | CRH PLC(a) | 1,289,310 | ||||||
| 31,921 | Medtronic, PLC | 2,252,346 | ||||||
| 14,397 | Willis Towers Watson PLC - ADR | 3,396,108 | ||||||
| 6,937,764 | ||||||||
| Israel — 2.6% | ||||||||
| 21,050 | Check Point Software Technologies Ltd.(a) | 2,825,963 | ||||||
See accompanying Notes to Financial Statements.
16
| North Square Altrinsic International Equity Fund |
| SCHEDULE OF INVESTMENTS – Continued |
| October 31, 2023 |
| Shares | Fair Value | |||||||
| COMMON STOCKS (Continued) | ||||||||
| Japan — 13.4% | ||||||||
| 19,676 | Daito Trust Construction Co. Ltd. | $ | 2,110,573 | |||||
| 23,182 | Eisai Co. Ltd. | 1,228,144 | ||||||
| 159,596 | Kubota Corp. | 2,146,446 | ||||||
| 34,493 | Makita Corp.(a) | 891,536 | ||||||
| 55,107 | MinebeaMitsumi, Inc.(a) | 864,039 | ||||||
| 29,895 | Sompo Holdings, Inc. | 1,295,051 | ||||||
| 14,519 | Sony Group Corp. | 1,207,094 | ||||||
| 55,783 | Sumitomo Mitsui Trust Holdings, Inc. | 2,091,684 | ||||||
| 39,244 | Suzuki Motor Corp. | 1,497,525 | ||||||
| 47,145 | Tokio Marine Holdings, Inc. | 1,054,739 | ||||||
| 14,386,831 | ||||||||
| Korea (Republic Of) — 5.1% | ||||||||
| 38,168 | Hana Financial Group, Inc. | 1,108,588 | ||||||
| 57,364 | KB Financial Group Inc. | 2,184,223 | ||||||
| 1,750 | Samsung Electronics Co. Ltd. - ADR | 2,188,332 | ||||||
| 5,481,143 | ||||||||
| Mexico — 2.2% | ||||||||
| 13,416 | Fomento Economico Mexicano, SAB de CV - ADR | 1,521,508 | ||||||
| 226,735 | Wal-Mart de Mexico SAB de CV | 812,382 | ||||||
| 2,333,890 | ||||||||
| Netherlands — 5.5% | ||||||||
| 31,643 | Akzo Nobel N.V.(a) | 2,123,189 | ||||||
| 15,909 | Euronext NV | 1,109,694 | ||||||
| 30,389 | Heineken N.V.(a) | 2,730,802 | ||||||
| 5,963,685 | ||||||||
| Peru — 0.8% | ||||||||
| 6,838 | Credicorp Ltd. | 854,476 | ||||||
| Singapore — 1.3% | ||||||||
| 202,564 | Singapore Exchange Ltd.(a) | 1,402,454 | ||||||
| Spain — 1.1% | ||||||||
| 150,285 | Banco Bilbao Vizcaya Argentaria SA | 1,182,565 | ||||||
| Sweden — 0.5% | ||||||||
| 25,446 | Assa Abloy AB, Class B | 542,353 | ||||||
| Switzerland — 10.7% | ||||||||
| 18,808 | Chubb Ltd. | 4,036,574 | ||||||
| 15,017 | Nestle S.A. | 1,619,468 | ||||||
| 10,119 | Novartis AG | 947,368 | ||||||
| 7,401 | Roche Holding AG | 1,907,373 | ||||||
| 19,496 | Sandoz Insurance Group AG(a) | 506,893 | ||||||
| 5,408 | Zurich Insurance Group AG | 2,568,844 | ||||||
| 11,586,520 | ||||||||
See accompanying Notes to Financial Statements.
17
| North Square Altrinsic International Equity Fund |
| SCHEDULE OF INVESTMENTS – Continued |
| October 31, 2023 |
| Shares | Fair Value | |||||||
| COMMON STOCKS (Continued) | ||||||||
| United Kingdom — 9.2% | ||||||||
| 48,253 | BP PLC - ADR | $ | 1,765,095 | |||||
| 71,005 | Diageo PLC | 2,684,802 | ||||||
| 158,400 | GSK PLC | 2,823,421 | ||||||
| 324,782 | Haleon PLC | 1,301,598 | ||||||
| 1,023,614 | Lloyds Banking Group PLC | 498,133 | ||||||
| 97,681 | Vodafone Group PLC - ADR | 902,572 | ||||||
| 9,975,621 | ||||||||
| United States — 1.0% | ||||||||
| 71,175 | Liberty Global PLC, Class A(a) | 1,107,483 | ||||||
| TOTAL COMMON STOCKS (Cost $102,804,087) | 99,353,818 | |||||||
| PREFERRED STOCKS — 2.4% | ||||||||
| Brazil — 1.4% | ||||||||
| 269,827 | Itau Unibanco Holdings SA(a) | 1,435,609 | ||||||
| Germany — 1.0% | ||||||||
| 15,430 | Henkel AG & Co. KGaA | 1,113,268 | ||||||
| TOTAL PREFERRED STOCKS (Cost $2,551,743) | 2,548,877 | |||||||
| SHORT-TERM INVESTMENTS — 5.1% | ||||||||
| 5,501,762 | First American Treasury Obligations Fund, Class X, 5.29%(b) | 5,501,762 | ||||||
| TOTAL SHORT-TERM INVESTMENTS (Cost $5,501,762) | 5,501,762 | |||||||
| TOTAL INVESTMENTS — 99.5% (Cost $110,857,592) | $ | 107,404,457 | ||||||
| OTHER ASSETS IN EXCESS OF LIABILITIES — 0.5% | 570,210 | |||||||
| NET ASSETS — 100.0% | $ | 107,974,667 | ||||||
| (a) | Non-income producing security. |
| (b) | Rate disclosed is the seven day effective yield as of October 31, 2023. |
ADR - American Depositary Receipt
SA - Société Anonyme
See accompanying Notes to Financial Statements.
18
| North Square Altrinsic International Equity Fund |
| SUMMARY OF INVESTMENTS |
| As of October 31, 2023 |
| Percent of Total | ||||
| Security Type/Sector | Net Assets | |||
| Common Stocks | ||||
| Communications | 2.9 | % | ||
| Consumer Discretionary | 6.1 | % | ||
| Consumer Staples | 13.7 | % | ||
| Energy | 4.6 | % | ||
| Financials | 30.5 | % | ||
| Health Care | 12.5 | % | ||
| Industrials | 8.3 | % | ||
| Materials | 4.3 | % | ||
| Real Estate | 2.0 | % | ||
| Technology | 8.2 | % | ||
| Total Common Stocks | 93.1 | % | ||
| Preferred Stocks | ||||
| Financials | 1.3 | % | ||
| Total Preferred Stocks | 1.3 | % | ||
| Short-Term Investments | 5.1 | % | ||
| Total Investments | 99.5 | % | ||
| Other Assets in Excess of Liabilities | 0.5 | % | ||
| Total Net Assets | 100.0 | % | ||
See accompanying Notes to Financial Statements.
19
| North Square McKee Bond Fund |
| SCHEDULE OF INVESTMENTS |
| October 31, 2023 |
| Principal | ||||||||
| Amount ($) | Fair Value | |||||||
| ASSET BACKED SECURITIES — 4.1% | ||||||||
| 400,000 | Aligned Data Centers Issuer LLC, 1.937%, 08/15/46(a) | $ | 348,998 | |||||
| 446,000 | American Credit Acceptance Receivables Trust 2021-2, 1.340%, 07/13/27(a) | 430,253 | ||||||
| 500,000 | AMSR 2019-SFR1 Trust, 2.774%, 01/20/39(a) | 451,860 | ||||||
| 200,000 | AMSR 2021-SFR2 Trust, 1.527%, 08/19/38(a) | 176,327 | ||||||
| 17,645 | Amur Equipment Finance Receivables IX LLC, 0.750%, 11/20/26(a) | 17,367 | ||||||
| 785,000 | Amur Equipment Finance Receivables X LLC, 2.200%, 01/20/28(a) | 730,218 | ||||||
| 16,447 | Burlington Northern and Santa Fe Railway Co. 2006-1 Pass Through Trust, 5.720%, 01/15/24 | 16,783 | ||||||
| 568,145 | Chesapeake Funding II LLC, 5.650%, 05/15/35(a) | 565,232 | ||||||
| 250,000 | Dell Equipment Finance Trust 2023-3, 5.930%, 06/22/26(a) | 249,676 | ||||||
| 20,332 | Flagship Credit Auto Trust 2021-3, 0.360%, 07/15/27(a) | 20,023 | ||||||
| 291,266 | NMEF Funding 2022-B LLC, 6.070%, 06/01/49(a) | 290,048 | ||||||
| 59,855 | Oportun Funding XIV LLC, 1.210%, 03/08/28(a) | 56,712 | ||||||
| 43,258 | Oscar US Funding X LLC, 3.270%, 05/11/26(a) | 43,111 | ||||||
| 35,003 | Oscar US Funding XII LLC, 0.700%, 04/10/25(a) | 34,673 | ||||||
| 528,000 | Tricon Residential 2022-SFR2 Trust, 3.856%, 04/19/39(a) | 488,034 | ||||||
| 230,732 | VMC Finance 2021-FL4 LLC, 6.549%, 06/18/36(a) | 227,231 | ||||||
| TOTAL ASSET BACKED SECURITIES (Cost $4,410,792) | 4,146,546 | |||||||
| CORPORATE BONDS — 28.3% | ||||||||
| COMMUNICATIONS — 2.3% | ||||||||
| CABLE & SATELLITE — 0.2% | ||||||||
| 300,000 | Comcast Corp., 3.250%, 11/01/39 | 206,993 | ||||||
| ENTERTAINMENT CONTENT — 0.7% | ||||||||
| 508,000 | Fox Corp., 6.500%, 10/13/33 | 496,380 | ||||||
| 325,000 | Walt Disney Co. (The), 3.500%, 05/13/40 | 233,768 | ||||||
| 730,148 | ||||||||
| INTERNET MEDIA & SERVICES — 0.1% | ||||||||
| 160,000 | Meta Platforms, Inc., 5.600%, 05/15/53 | 144,817 | ||||||
| TELECOMMUNICATIONS — 1.3% | ||||||||
| 94,000 | AT&T, Inc., 1.700%, 03/25/26 | 85,338 | ||||||
| 152,000 | AT&T, Inc., 5.400%, 02/15/34 | 139,716 | ||||||
| 629,000 | Verizon Communications, Inc., 2.100%, 03/22/28 | 536,720 | ||||||
| 775,000 | Verizon Communications, Inc., 2.650%, 11/20/40 | 468,757 | ||||||
| 1,230,531 | ||||||||
| CONSUMER DISCRETIONARY — 0.7% | ||||||||
| AUTOMOTIVE — 0.7% | ||||||||
| 218,000 | American Honda Finance Corp., 2.000%, 03/24/28 | 186,867 | ||||||
| 614,000 | General Motors Financial Co., Inc., 4.300%, 04/06/29 | 545,774 | ||||||
| 732,641 | ||||||||
| CONSUMER STAPLES — 1.3% | ||||||||
| TOBACCO & CANNABIS — 1.3% | ||||||||
| 354,000 | Altria Group, Inc., 6.875%, 11/01/33 | 351,305 | ||||||
See accompanying Notes to Financial Statements.
20
| North Square McKee Bond Fund |
| SCHEDULE OF INVESTMENTS – Continued |
| October 31, 2023 |
| Principal | ||||||||
| Amount ($) | Fair Value | |||||||
| CORPORATE BONDS (Continued) | ||||||||
| CONSUMER STAPLES (Continued) | ||||||||
| TOBACCO & CANNABIS (Continued) | ||||||||
| 545,000 | B.A.T. Capital Corp., 6.421%, 08/02/33 | $ | 513,825 | |||||
| 488,000 | Philip Morris International, Inc., 5.125%, 02/15/30 | 459,888 | ||||||
| 1,325,018 | ||||||||
| ENERGY — 2.4% | ||||||||
| OIL & GAS PRODUCERS — 2.4% | ||||||||
| 403,000 | Chevron USA, Inc., 3.250%, 10/15/29 | 358,288 | ||||||
| 514,000 | ConocoPhillips Co., 5.300%, 05/15/53 | 444,212 | ||||||
| 186,000 | Energy Transfer LP, 6.400%, 12/01/30 | 184,173 | ||||||
| 250,000 | Enterprise Products Operating LLC, 4.800%, 02/01/49 | 202,269 | ||||||
| 208,000 | Exxon Mobil Corp., 4.227%, 03/19/40 | 168,934 | ||||||
| 694,000 | Exxon Mobil Corp., 4.327%, 03/19/50 | 538,015 | ||||||
| 675,000 | TransCanada PipeLines Ltd., 2.500%, 10/12/31 | 509,494 | ||||||
| 2,405,385 | ||||||||
| FINANCIALS — 11.7% | ||||||||
| ASSET MANAGEMENT — 0.4% | ||||||||
| 178,000 | Charles Schwab Corp. (The), 5.853%, 05/19/34 (SOFR + 227bps)(b) | 163,344 | ||||||
| 257,000 | United Airlines 2023-1 Class A Pass Through Trust, 5.800%, 07/15/36 | 241,751 | ||||||
| 405,095 | ||||||||
| BANKING — 6.7% | ||||||||
| 1,352,000 | Bank of America Corp., 1.658%, 03/11/27 | 1,209,978 | ||||||
| 325,000 | Bank of America Corp., 5.872%, 09/15/34 | 306,171 | ||||||
| 345,000 | Bank of Montreal, 1.850%, 05/01/25 | 324,321 | ||||||
| 414,000 | Bank of Nova Scotia (The), 1.300%, 06/11/25 | 384,075 | ||||||
| 198,000 | F.N.B Corp., 5.150%, 08/05/32 | 190,186 | ||||||
| 220,000 | Federation des Caisses Desjardins du Quebec, 2.050%, 02/10/25(a) | 208,819 | ||||||
| 629,000 | JPMorgan Chase & Co., Inc., 1.578%, 04/22/27 (SOFR + 77bps)(b) | 561,305 | ||||||
| 160,000 | JPMorgan Chase & Co., Inc., 1.953%, 02/04/32 | 118,908 | ||||||
| 218,000 | PNC Financial Services Group Inc. (The), 6.875%, 10/20/34 | 217,959 | ||||||
| 71,000 | PNC Financial Services Group, Inc. (The), 5.582%, 06/12/29 | 68,004 | ||||||
| 374,000 | PNC Financial Services Group, Inc. (The), 6.037%, 10/28/33 | 352,357 | ||||||
| 300,000 | Royal Bank of Canada, 5.000%, 05/02/33 | 270,253 | ||||||
| 282,000 | Toronto-Dominion Bank, 1.200%, 06/03/26 | 250,092 | ||||||
| 394,000 | Toronto-Dominion Bank (The), 2.000%, 09/10/31 | 291,221 | ||||||
| 867,000 | US Bancorp, 4.653%, 02/01/29 | 800,483 | ||||||
| 779,000 | Wells Fargo & Co., 3.526%, 03/24/28 | 710,530 | ||||||
| 346,000 | Wells Fargo & Co., 4.897%, 07/25/33 (SOFR + 195bps)(b) | 304,248 | ||||||
| 6,568,910 | ||||||||
| INSTITUTIONAL FINANCIAL SERVICES — 2.9% | ||||||||
| 1,137,000 | Goldman Sachs Group, Inc. (The), 1.431%, 03/09/27 | 1,010,062 | ||||||
| 1,019,000 | Goldman Sachs Group, Inc. (The), 1.992%, 01/27/32 (SOFR + 90bps)(b) | 747,858 | ||||||
| 549,000 | Morgan Stanley, 0.790%, 05/30/25 | 529,588 | ||||||
| 695,000 | Morgan Stanley, 1.593%, 05/04/27 (SOFR + 77bps)(b) | 617,724 | ||||||
| 2,905,232 | ||||||||
See accompanying Notes to Financial Statements.
21
| North Square McKee Bond Fund |
| SCHEDULE OF INVESTMENTS – Continued |
| October 31, 2023 |
| Principal | ||||||||
| Amount ($) | Fair Value | |||||||
| CORPORATE BONDS (Continued) | ||||||||
| FINANCIALS (Continued) | ||||||||
| SPECIALTY FINANCE — 1.7% | ||||||||
| 851,000 | Capital One Financial Corp., 1.878%, 11/02/27 | $ | 730,360 | |||||
| 1,070,000 | Federal Farm Credit Banks Funding Corp., 4.800%, 04/13/33 | 990,501 | ||||||
| 1,720,861 | ||||||||
| HEALTH CARE — 1.1% | ||||||||
| BIOTECH & PHARMA — 0.8% | ||||||||
| 247,000 | Amgen, Inc., 5.650%, 03/02/53 | 217,417 | ||||||
| 250,000 | Gilead Sciences, Inc., 3.650%, 03/01/26 | 238,731 | ||||||
| 395,000 | Pfizer Investment Enterprises PTE Ltd., 5.110%, 05/19/43 | 346,954 | ||||||
| 803,102 | ||||||||
| HEALTH CARE FACILITIES & SERVICES — 0.3% | ||||||||
| 369,000 | CVS Health Corp., 3.750%, 04/01/30 | 321,160 | ||||||
| INDUSTRIALS — 2.7% | ||||||||
| AEROSPACE & DEFENSE — 1.0% | ||||||||
| 1,005,000 | Boeing Co., 4.875%, 05/01/25 | 987,612 | ||||||
| COMMERCIAL SUPPORT SERVICES — 0.2% | ||||||||
| 250,000 | Waste Connections Inc., 4.250%, 12/01/28 | 234,248 | ||||||
| MACHINERY — 0.2% | ||||||||
| 227,000 | John Deere Capital Corp., 4.700%, 06/10/30 | 213,791 | ||||||
| TRANSPORTATION & LOGISTICS — 1.3% | ||||||||
| 180,366 | BNSF Railway Co. 2015-1 Pass Through Trust, 3.442%, 06/16/28(a) | 166,654 | ||||||
| 725,000 | BNSF Railway Co. Pass Through Trust, 4.550%, 09/01/44 | 577,727 | ||||||
| 481,081 | FedEx Corp. 2020-1 Class AA Pass Through Trust, 1.875%, 02/20/34 | 378,675 | ||||||
| 17,304 | Union Pacific Railroad Co. 2005 Pass Through Trust, 5.082%, 01/02/29 | 16,859 | ||||||
| 137,390 | Union Pacific Railroad Co. 2014-1 Pass Through Trust, 3.227%, 05/14/26 | 129,916 | ||||||
| 1,269,831 | ||||||||
| MATERIALS — 0.3% | ||||||||
| CHEMICALS — 0.3% | ||||||||
| 306,000 | DuPont de Nemours, Inc., 4.493%, 11/15/25 | 298,270 | ||||||
| REAL ESTATE — 0.3% | ||||||||
| REAL ESTATE INVESTMENT TRUSTS — 0.3% | ||||||||
| 317,000 | American Tower Corp., 3.800%, 08/15/29 | 277,654 | ||||||
| TECHNOLOGY — 1.6% | ||||||||
| SEMICONDUCTORS — 0.1% | ||||||||
| 137,000 | Intel Corp., 5.700%, 02/10/53 | 122,704 | ||||||
See accompanying Notes to Financial Statements.
22
| North Square McKee Bond Fund |
| SCHEDULE OF INVESTMENTS – Continued |
| October 31, 2023 |
| Principal | ||||||||
| Amount ($) | Fair Value | |||||||
| CORPORATE BONDS (Continued) | ||||||||
| TECHNOLOGY (Continued) | ||||||||
| SOFTWARE — 0.7% | ||||||||
| 397,000 | Oracle Corp., 2.300%, 03/25/28 | $ | 341,038 | |||||
| 575,000 | Oracle Corp., 3.600%, 04/01/40 | 395,075 | ||||||
| 736,113 | ||||||||
| TECHNOLOGY HARDWARE — 0.6% | ||||||||
| 411,000 | Apple, Inc., 4.650%, 02/23/46 | 350,935 | ||||||
| 278,000 | Apple, Inc., 3.950%, 08/08/52 | 206,291 | ||||||
| 557,226 | ||||||||
| TECHNOLOGY SERVICES — 0.2% | ||||||||
| 200,000 | International Business Machines Corp., 1.700%, 10/01/52 | 174,647 | ||||||
| UTILITIES — 3.9% | ||||||||
| ELECTRIC UTILITIES — 3.9% | ||||||||
| 375,000 | Alabama Power Co., 3.450%, 10/01/49 | 236,730 | ||||||
| 876,000 | Duke Energy Carolinas LLC, 5.300%, 02/15/40 | 776,026 | ||||||
| 151,000 | Duke Energy Corp., 2.450%, 06/01/30 | 120,431 | ||||||
| 600,000 | Electricite de France SA, 6.250%, 05/23/33(a) | 583,531 | ||||||
| 330,000 | Florida Power & Light Co., 5.300%, 04/01/53 | 288,143 | ||||||
| 1,000,000 | MidAmerican Energy Co., 4.250%, 07/15/49 | 739,666 | ||||||
| 447,000 | NextEra Energy Capital Holdings, Inc., 2.250%, 06/01/30 | 348,519 | ||||||
| 239,000 | Pacific Gas and Electric Co., 6.400%, 06/15/33 | 224,401 | ||||||
| 200,000 | Virginia Electric and Power Co., 3.150%, 01/15/26 | 189,704 | ||||||
| 469,000 | Virginia Electric and Power Co., 5.450%, 04/01/53 | 400,264 | ||||||
| 3,907,415 | ||||||||
| TOTAL CORPORATE BONDS (Cost $30,912,850) | 28,279,404 | |||||||
| MORTGAGE-BACKED SECURITIES — 59.7% | ||||||||
| 163,487 | BBCMS Mortgage Trust 2022-C14, 1.727%, 02/18/55 | 151,007 | ||||||
| 8,900 | COMM 2012-CCRE4 Mortgage Trust, 2.853%, 10/17/45 | 8,142 | ||||||
| 300,000 | DBUBS 2017-BRBK Mortgage Trust, 3.452%, 10/12/34(a) | 272,735 | ||||||
| 136,780 | Ellington Financial Mortgage Trust 2020-1, 2.006%, 05/25/65(a) | 131,241 | ||||||
| 599,988 | EQUS 2021-EQAZ Mortgage Trust, 6.204%, 10/15/36(a) | 584,952 | ||||||
| 295,291 | Fannie Mae Pool, 4.000%, 05/15/27 | 260,755 | ||||||
| 32,190 | Fannie Mae Pool, 2.500%, 08/01/28 | 30,604 | ||||||
| 24,793 | Fannie Mae Pool, 5.000%, 11/01/29 | 23,825 | ||||||
| 6,598 | Fannie Mae Pool, 4.000%, 10/01/30 | 6,263 | ||||||
| 75,009 | Fannie Mae Pool, 4.500%, 05/01/31 | 69,842 | ||||||
| 61,257 | Fannie Mae Pool, 4.000%, 09/01/31 | 58,112 | ||||||
| 27,532 | Fannie Mae Pool, 4.500%, 01/01/32 | 25,686 | ||||||
| 17,899 | Fannie Mae Pool, 3.500%, 04/01/32 | 16,666 | ||||||
| 247,950 | Fannie Mae Pool, 3.000%, 05/01/33 | 224,686 | ||||||
| 66,936 | Fannie Mae Pool, 4.500%, 05/01/34 | 61,650 | ||||||
| 83,935 | Fannie Mae Pool, 4.000%, 06/01/34 | 78,552 | ||||||
See accompanying Notes to Financial Statements.
23
| North Square McKee Bond Fund |
| SCHEDULE OF INVESTMENTS – Continued |
| October 31, 2023 |
| Principal | ||||||||
| Amount ($) | Fair Value | |||||||
| MORTGAGE-BACKED SECURITIES (Continued) | ||||||||
| 116,907 | Fannie Mae Pool, 3.500%, 08/01/34 | $ | 107,567 | |||||
| 96,556 | Fannie Mae Pool, 3.500%, 12/01/34 | 88,691 | ||||||
| 42,997 | Fannie Mae Pool, 3.500%, 11/01/35 | 39,511 | ||||||
| 87,744 | Fannie Mae Pool, 4.000%, 11/01/35 | 82,794 | ||||||
| 287,153 | Fannie Mae Pool, 2.000%, 05/01/36 | 245,040 | ||||||
| 454,000 | Fannie Mae Pool, 2.000%, 03/01/37 | 389,254 | ||||||
| 100,345 | Fannie Mae Pool, 4.000%, 07/01/37 | 92,806 | ||||||
| 103,588 | Fannie Mae Pool, 3.500%, 10/13/37 | 87,624 | ||||||
| 95,304 | Fannie Mae Pool, 3.500%, 12/01/37 | 88,926 | ||||||
| 91,858 | Fannie Mae Pool, 4.000%, 12/01/37 | 86,945 | ||||||
| 65,846 | Fannie Mae Pool, 4.000%, 06/01/38 | 61,693 | ||||||
| 2,625 | Fannie Mae Pool, 4.000%, 03/01/39 | 2,343 | ||||||
| 272,356 | Fannie Mae Pool, 3.000%, 01/01/40 | 232,099 | ||||||
| 40,785 | Fannie Mae Pool, 4.500%, 01/01/40 | 37,679 | ||||||
| 30,566 | Fannie Mae Pool, 4.500%, 01/01/40 | 28,381 | ||||||
| 10,354 | Fannie Mae Pool, 4.500%, 07/01/40 | 9,566 | ||||||
| 306,175 | Fannie Mae Pool, 2.000%, 08/01/40 | 243,005 | ||||||
| 3,463 | Fannie Mae Pool, 4.000%, 09/01/40 | 3,096 | ||||||
| 70,482 | Fannie Mae Pool, 4.000%, 09/01/40 | 63,827 | ||||||
| 16,371 | Fannie Mae Pool, 4.500%, 09/01/40 | 15,125 | ||||||
| 197,323 | Fannie Mae Pool, 2.500%, 10/01/40 | 160,826 | ||||||
| 297,714 | Fannie Mae Pool, 3.000%, 10/01/40 | 249,265 | ||||||
| 236,928 | Fannie Mae Pool, 2.000%, 11/01/40 | 188,044 | ||||||
| 11,951 | Fannie Mae Pool, 4.500%, 11/01/40 | 10,996 | ||||||
| 28,994 | Fannie Mae Pool, 4.500%, 12/01/40 | 26,743 | ||||||
| 143,268 | Fannie Mae Pool, 2.000%, 01/01/41 | 113,668 | ||||||
| 5,230 | Fannie Mae Pool, 4.000%, 01/01/41 | 4,678 | ||||||
| 48,732 | Fannie Mae Pool, 4.000%, 01/01/41 | 43,609 | ||||||
| 26,181 | Fannie Mae Pool, 4.000%, 01/01/41 | 23,429 | ||||||
| 393,434 | Fannie Mae Pool, 2.500%, 02/01/41 | 319,865 | ||||||
| 349,643 | Fannie Mae Pool, 1.500%, 03/01/41 | 262,408 | ||||||
| 217,434 | Fannie Mae Pool, 2.500%, 03/01/41 | 177,037 | ||||||
| 69,725 | Fannie Mae Pool, 4.500%, 04/01/41 | 64,416 | ||||||
| 13,251 | Fannie Mae Pool, 4.500%, 05/01/41 | 12,217 | ||||||
| 460,610 | Fannie Mae Pool, 2.500%, 09/01/41 | 372,685 | ||||||
| 475,666 | Fannie Mae Pool, 2.500%, 10/01/41 | 386,340 | ||||||
| 8,806 | Fannie Mae Pool, 4.000%, 10/01/41 | 7,880 | ||||||
| 290,585 | Fannie Mae Pool, 2.500%, 11/01/41 | 233,423 | ||||||
| 18,506 | Fannie Mae Pool, 3.000%, 09/01/42 | 15,622 | ||||||
| 170,851 | Fannie Mae Pool, 3.000%, 04/01/43 | 141,722 | ||||||
| 277,518 | Fannie Mae Pool, 3.500%, 07/01/43 | 241,362 | ||||||
| 37,295 | Fannie Mae Pool, 3.500%, 01/01/44 | 32,424 | ||||||
| 341,632 | Fannie Mae Pool, 3.000%, 04/01/45 | 287,437 | ||||||
| 31,366 | Fannie Mae Pool, 3.500%, 12/01/45 | 27,055 | ||||||
See accompanying Notes to Financial Statements.
24
| North Square McKee Bond Fund |
| SCHEDULE OF INVESTMENTS – Continued |
| October 31, 2023 |
| Principal | ||||||||
| Amount ($) | Fair Value | |||||||
| MORTGAGE-BACKED SECURITIES (Continued) | ||||||||
| 154,836 | Fannie Mae Pool, 4.500%, 03/01/46 | $ | 143,054 | |||||
| 93,387 | Fannie Mae Pool, 3.000%, 04/01/46 | 77,369 | ||||||
| 170,270 | Fannie Mae Pool, 2.500%, 05/01/46 | 133,234 | ||||||
| 122,715 | Fannie Mae Pool, 3.000%, 06/01/46 | 103,361 | ||||||
| 86,664 | Fannie Mae Pool, 3.500%, 06/01/46 | 74,515 | ||||||
| 63,012 | Fannie Mae Pool, 3.000%, 10/01/46 | 52,092 | ||||||
| 5,732 | Fannie Mae Pool, 3.000%, 11/01/46 | 4,742 | ||||||
| 167,862 | Fannie Mae Pool, 3.000%, 02/01/47 | 138,832 | ||||||
| 709,345 | Fannie Mae Pool, 2.500%, 11/01/47 | 555,671 | ||||||
| 258,157 | Fannie Mae Pool, 2.500%, 12/01/47 | 202,230 | ||||||
| 45,760 | Fannie Mae Pool, 3.500%, 03/01/48 | 38,968 | ||||||
| 185,450 | Fannie Mae Pool, 2.500%, 04/01/48 | 145,371 | ||||||
| 99,961 | Fannie Mae Pool, 3.000%, 04/01/48 | 82,634 | ||||||
| 287,483 | Fannie Mae Pool, 3.500%, 08/01/48 | 243,167 | ||||||
| 94,728 | Fannie Mae Pool, 3.500%, 11/01/48 | 80,736 | ||||||
| 7,815 | Fannie Mae Pool, 4.500%, 11/01/48 | 7,103 | ||||||
| 122,882 | Fannie Mae Pool, 3.000%, 12/01/48 | 101,636 | ||||||
| 41,194 | Fannie Mae Pool, 3.000%, 02/01/49 | 33,950 | ||||||
| 16,880 | Fannie Mae Pool, 3.500%, 02/01/49 | 14,330 | ||||||
| 489,597 | Fannie Mae Pool, 3.500%, 09/01/49 | 401,398 | ||||||
| 91,370 | Fannie Mae Pool, 3.000%, 12/01/49 | 73,952 | ||||||
| 370,587 | Fannie Mae Pool, 2.500%, 04/01/50 | 279,611 | ||||||
| 262,556 | Fannie Mae Pool, 2.500%, 05/01/50 | 198,098 | ||||||
| 380,040 | Fannie Mae Pool, 2.500%, 06/01/50 | 297,038 | ||||||
| 136,140 | Fannie Mae Pool, 3.500%, 08/01/50 | 115,996 | ||||||
| 125,334 | Fannie Mae Pool, 2.500%, 10/01/50 | 98,256 | ||||||
| 378,989 | Fannie Mae Pool, 2.500%, 02/01/51 | 293,708 | ||||||
| 298,935 | Fannie Mae Pool, 2.000%, 03/01/51 | 225,017 | ||||||
| 334,367 | Fannie Mae Pool, 2.500%, 06/01/51 | 260,288 | ||||||
| 694,648 | Fannie Mae Pool, 2.500%, 06/01/51 | 541,670 | ||||||
| 1,273,617 | Fannie Mae Pool, 2.500%, 07/01/51 | 989,131 | ||||||
| 759,670 | Fannie Mae Pool, 2.500%, 08/01/51 | 586,202 | ||||||
| 270,518 | Fannie Mae Pool, 2.500%, 10/01/51 | 208,498 | ||||||
| 259,728 | Fannie Mae Pool, 3.000%, 01/01/52 | 208,876 | ||||||
| 419,314 | Fannie Mae Pool, 2.000%, 02/01/52 | 312,248 | ||||||
| 539,312 | Fannie Mae Pool, 2.000%, 02/01/52 | 401,774 | ||||||
| 372,558 | Fannie Mae Pool, 3.000%, 02/01/52 | 300,934 | ||||||
| 346,123 | Fannie Mae Pool, 6.500%, 01/01/53 | 345,054 | ||||||
| 208,895 | Fannie Mae Pool, 5.500%, 07/01/53 | 198,478 | ||||||
| 419,472 | Fannie Mae Pool, 6.000%, 09/01/53 | 411,332 | ||||||
| 495,117 | Fannie Mae Pool, 2.500%, 10/01/53 | 381,410 | ||||||
| 149,032 | Fannie Mae Pool, 4.000%, 07/01/56 | 129,459 | ||||||
| 8,521 | Fannie Mae REMICS, 5.500%, 01/25/26 | 8,417 | ||||||
| 88,090 | Fannie Mae REMICS, 4.000%, 04/25/33 | 83,041 | ||||||
See accompanying Notes to Financial Statements.
25
| North Square McKee Bond Fund |
| SCHEDULE OF INVESTMENTS – Continued |
| October 31, 2023 |
| Principal | ||||||||
| Amount ($) | Fair Value | |||||||
| MORTGAGE-BACKED SECURITIES (Continued) | ||||||||
| 3,176 | Fannie Mae REMICS, 5.000%, 08/25/35 | $ | 3,055 | |||||
| 228,000 | Fannie Mae REMICS, 3.500%, 10/25/37 | 207,422 | ||||||
| 127 | Fannie Mae REMICS, 2.000%, 07/25/41 | 126 | ||||||
| 35,379 | Fannie Mae REMICS, 2.000%, 12/25/41 | 30,699 | ||||||
| 109,344 | Fannie Mae REMICS, 3.500%, 02/25/43 | 96,467 | ||||||
| 420,839 | Fannie Mae REMICS, 3.000%, 06/25/43 | 393,493 | ||||||
| 4,043 | Fannie Mae REMICS, 3.500%, 08/25/43 | 3,942 | ||||||
| 66,788 | Fannie Mae REMICS, 2.000%, 10/25/44 | 56,905 | ||||||
| 35,385 | Fannie Mae REMICS, 3.000%, 04/25/45 | 31,570 | ||||||
| 78,431 | Fannie Mae REMICS, 3.500%, 09/25/48 | 70,640 | ||||||
| 62,675 | Fannie Mae REMICS, 3.000%, 07/25/49 | 52,232 | ||||||
| 382,915 | Fannie Mae REMICS, 5.000%, 01/25/53 | 363,839 | ||||||
| 9,204 | Fannie Mae REMICS, 3.500%, 06/25/53 | 8,227 | ||||||
| 12,868 | Fannie Mae Trust 2003-W8, 5.785%, 05/25/42 | 12,792 | ||||||
| 585,000 | Federal Agricultural Mortgage Corp., 4.170%, 05/24/29 | 547,207 | ||||||
| 500,000 | Federal Farm Credit Bank, 5.950%, 08/11/33 | 488,056 | ||||||
| 240,000 | Federal Farm Credit Bank, 2.700%, 06/21/41 | 156,121 | ||||||
| 318,000 | Federal Farm Credit Banks Funding Corp, 5.680%, 08/21/30 | 310,569 | ||||||
| 2,210,000 | Federal Farm Credit Banks Funding Corp, 5.700%, 09/05/30 | 2,159,691 | ||||||
| 705,000 | Federal Farm Credit Banks Funding Corp., 1.230%, 07/29/30 | 541,843 | ||||||
| 687,000 | Federal Farm Credit Banks Funding Corp., 2.950%, 02/17/32 | 570,300 | ||||||
| 247,000 | Federal Farm Credit Banks Funding Corp., 2.940%, 02/23/32 | 204,821 | ||||||
| 1,849,000 | Federal Farm Credit Banks Funding Corp., 3.000%, 03/08/32 | 1,539,388 | ||||||
| 317,000 | Federal Farm Credit Banks Funding Corp., 4.370%, 05/17/32 | 287,549 | ||||||
| 1,516,000 | Federal Farm Credit Banks Funding Corp., 4.700%, 06/29/32 | 1,398,532 | ||||||
| 600,000 | Federal Farm Credit Banks Funding Corp., 4.980%, 07/20/32 | 561,501 | ||||||
| 3,050,000 | Federal Farm Credit Banks Funding Corp., 2.390%, 01/19/33 | 2,376,228 | ||||||
| 1,378,000 | Federal Farm Credit Banks Funding Corp., 2.480%, 02/01/34 | 1,052,008 | ||||||
| 1,280,000 | Federal Farm Credit Banks Funding Corp., 2.550%, 12/21/34 | 938,646 | ||||||
| 1,355,000 | Federal Farm Credit Banks Funding Corp., 3.250%, 02/23/35 | 1,058,734 | ||||||
| 1,706,000 | Federal Farm Credit Banks Funding Corp., 3.360%, 02/23/37 | 1,333,726 | ||||||
| 250,000 | Federal Home Loan Banks, 2.640%, 02/25/32 | 202,657 | ||||||
| 415,000 | Federal Home Loan Banks, 6.220%, 09/13/33 | 407,232 | ||||||
| 1,000,000 | Federal Home Loan Banks, 1.500%, 09/30/33 | 702,033 | ||||||
| 685,000 | Federal Home Loan Banks, 2.750%, 02/22/34 | 535,952 | ||||||
| 360,000 | Federal Home Loan Banks, 2.900%, 02/18/37 | 258,286 | ||||||
| 1,270,000 | Federal Home Loan Banks, 3.000%, 02/24/37 | 922,072 | ||||||
| 255,000 | Federal Home Loan Banks, 6.100%, 08/25/38 | 246,535 | ||||||
| 2,326,000 | Federal National Mortgage Association, 1.600%, 08/24/35 | 1,482,744 | ||||||
| 4,650,000 | Federal National Mortgage Association, 1.630%, 09/14/35 | 2,973,261 | ||||||
| 57,893 | Freddie Mac Gold Pool, 4.500%, 05/01/31 | 54,200 | ||||||
| 5,064 | Freddie Mac Gold Pool, 4.000%, 09/01/31 | 4,810 | ||||||
| 36,848 | Freddie Mac Gold Pool, 3.500%, 06/01/33 | 34,105 | ||||||
| 97,009 | Freddie Mac Gold Pool, 4.000%, 11/01/33 | 91,184 | ||||||
See accompanying Notes to Financial Statements.
26
| North Square McKee Bond Fund |
| SCHEDULE OF INVESTMENTS – Continued |
| October 31, 2023 |
| Principal | ||||||||
| Amount ($) | Fair Value | |||||||
| MORTGAGE-BACKED SECURITIES (Continued) | ||||||||
| 12,648 | Freddie Mac Gold Pool, 3.500%, 07/01/36 | $ | 11,509 | |||||
| 21,580 | Freddie Mac Gold Pool, 4.500%, 12/01/39 | 19,967 | ||||||
| 21,093 | Freddie Mac Gold Pool, 4.000%, 01/01/41 | 18,904 | ||||||
| 39,792 | Freddie Mac Gold Pool, 3.000%, 11/01/42 | 33,635 | ||||||
| 83,603 | Freddie Mac Gold Pool, 3.500%, 12/01/42 | 73,571 | ||||||
| 242,873 | Freddie Mac Gold Pool, 3.000%, 12/01/46 | 201,252 | ||||||
| 549,452 | Freddie Mac Gold Pool, 3.000%, 12/01/46 | 455,176 | ||||||
| 61,019 | Freddie Mac Gold Pool, 3.000%, 01/01/47 | 50,543 | ||||||
| 40,019 | Freddie Mac Multifamily Structured Pass-Through Certificates, 4.649%, 01/25/46 | 39,744 | ||||||
| 569,144 | Freddie Mac Pool, 2.500%, 03/15/28 | 440,690 | ||||||
| 304,649 | Freddie Mac Pool, 3.500%, 06/15/29 | 256,038 | ||||||
| 492,004 | Freddie Mac Pool, 2.000%, 09/01/36 | 419,027 | ||||||
| 307,002 | Freddie Mac Pool, 3.000%, 07/01/38 | 264,185 | ||||||
| 402,464 | Freddie Mac Pool, 3.000%, 09/01/39 | 344,307 | ||||||
| 157,293 | Freddie Mac Pool, 2.500%, 04/01/42 | 126,467 | ||||||
| 409,510 | Freddie Mac Pool, 3.000%, 05/01/42 | 340,732 | ||||||
| 31,885 | Freddie Mac Pool, 3.500%, 01/01/48 | 27,227 | ||||||
| 139,730 | Freddie Mac Pool, 2.000%, 08/01/50 | 104,688 | ||||||
| 241,278 | Freddie Mac Pool, 2.500%, 11/01/50 | 186,801 | ||||||
| 191,036 | Freddie Mac Pool, 2.500%, 12/01/50 | 148,273 | ||||||
| 320,979 | Freddie Mac Pool, 2.000%, 02/01/51 | 237,839 | ||||||
| 460,727 | Freddie Mac Pool, 2.500%, 03/01/51 | 358,991 | ||||||
| 264,194 | Freddie Mac Pool, 2.000%, 05/01/51 | 202,053 | ||||||
| 1,040,484 | Freddie Mac Pool, 3.500%, 09/01/51 | 891,757 | ||||||
| 393,849 | Freddie Mac Pool, 2.000%, 11/01/51 | 291,377 | ||||||
| 511,283 | Freddie Mac Pool, 3.000%, 12/01/51 | 412,032 | ||||||
| 229,087 | Freddie Mac Pool, 2.500%, 02/01/52 | 177,247 | ||||||
| 459,000 | Freddie Mac Pool, 3.000%, 08/01/52 | 371,829 | ||||||
| 373,439 | Freddie Mac Pool, 6.000%, 05/01/53 | 364,609 | ||||||
| 299,081 | Freddie Mac Pool, 5.500%, 06/01/53 | 284,353 | ||||||
| 472,868 | Freddie Mac Pool, 5.500%, 09/01/53 | 450,254 | ||||||
| 7,555 | Freddie Mac REMICS, 4.500%, 09/15/25 | 7,460 | ||||||
| 109,992 | Freddie Mac REMICS, 3.500%, 08/15/27 | 106,969 | ||||||
| 114,316 | Freddie Mac REMICS, 3.000%, 08/15/40 | 109,296 | ||||||
| 121,857 | Freddie Mac REMICS, 2.000%, 09/15/41 | 109,301 | ||||||
| 13,606 | Freddie Mac REMICS, 2.000%, 12/15/41 | 11,936 | ||||||
| 53,653 | Freddie Mac REMICS, 3.000%, 05/15/43 | 50,532 | ||||||
| 19,851 | Freddie Mac REMICS, 3.000%, 11/15/43 | 19,038 | ||||||
| 84,921 | Freddie Mac REMICS, 2.000%, 03/25/44 | 75,407 | ||||||
| 170,443 | Freddie Mac REMICS, 3.000%, 08/15/44 | 155,062 | ||||||
| 279,661 | Freddie Mac REMICS, 3.000%, 06/25/48 | 238,762 | ||||||
| 125,638 | Freddie Mac REMICS, 1.000%, 04/25/49 | 96,281 | ||||||
| 460,085 | Freddie Mac REMICS, 4.000%, 10/25/49 | 422,601 | ||||||
| 52,349 | Freddie Mac REMICS, 1.000%, 01/25/50 | 35,831 | ||||||
See accompanying Notes to Financial Statements.
27
| North Square McKee Bond Fund |
| SCHEDULE OF INVESTMENTS – Continued |
| October 31, 2023 |
| Principal | ||||||||
| Amount ($) | Fair Value | |||||||
| MORTGAGE-BACKED SECURITIES (Continued) | ||||||||
| 177,117 | Freddie Mac REMICS, 3.250%, 04/15/53 | $ | 165,433 | |||||
| 36,818 | Freddie Mac REMICS, 3.000%, 01/15/55 | 34,330 | ||||||
| 93,812 | Freddie Mac Structured Pass-Through Certificates, 6.026%, 07/25/44(b) | 84,813 | ||||||
| 14,668 | Freddie Mac Structured Pass-Through Certificates, 5.826%, 10/25/44(b) | 13,097 | ||||||
| 20,546 | Ginnie Mae I Pool, 4.000%, 11/15/24 | 20,319 | ||||||
| 295,786 | Ginnie Mae I Pool, 3.020%, 09/15/41 | 243,109 | ||||||
| 294,908 | Ginnie Mae I Pool, 3.000%, 08/15/45 | 250,284 | ||||||
| 62,428 | Ginnie Mae II Pool, 3.500%, 04/20/27 | 60,709 | ||||||
| 23,440 | Ginnie Mae II Pool, 3.500%, 07/20/27 | 22,763 | ||||||
| 557,178 | Ginnie Mae II Pool, 3.500%, 12/20/34 | 512,073 | ||||||
| 52,595 | Ginnie Mae II Pool, 5.000%, 07/20/48 | 49,795 | ||||||
| 382,756 | Ginnie Mae II Pool, 3.500%, 01/20/50 | 330,606 | ||||||
| 479,069 | Ginnie Mae II Pool, 2.500%, 09/20/51 | 374,681 | ||||||
| 392,356 | Ginnie Mae II Pool, 3.000%, 10/20/51 | 324,297 | ||||||
| 368,504 | Ginnie Mae II Pool, 5.500%, 09/01/53 | 354,421 | ||||||
| 506,375 | Ginnie Mae II Pool, 6.000%, 09/20/53 | 498,007 | ||||||
| 144 | Government National Mortgage Association, 5.000%, 12/20/27 | 142 | ||||||
| 302,000 | Government National Mortgage Association, 6.000%, 03/20/42 | 298,536 | ||||||
| 97,307 | Government National Mortgage Association, 2.750%, 06/20/42 | 90,493 | ||||||
| 8,931 | Government National Mortgage Association, 2.250%, 09/16/44 | 8,430 | ||||||
| 27,072 | Government National Mortgage Association, 2.000%, 03/20/45 | 23,069 | ||||||
| 8,090 | Government National Mortgage Association, 2.500%, 10/20/45 | 7,633 | ||||||
| 17,207 | Government National Mortgage Association, 2.500%, 09/20/46 | 15,599 | ||||||
| 357,959 | Government National Mortgage Association, 2.000%, 03/20/50 | 280,721 | ||||||
| 133,710 | Government National Mortgage Association, 1.000%, 08/20/50 | 96,586 | ||||||
| 160,690 | Government National Mortgage Association, 1.250%, 05/20/51 | 118,495 | ||||||
| 1,704,559 | Government National Mortgage Association, 1.750%, 09/20/51 | 1,401,652 | ||||||
| 145,000 | ILPT Trust 2019-SURF, 4.145%, 02/13/41(a) | 127,954 | ||||||
| 413,000 | Morgan Stanley Capital I Trust 2016-UBS12, 3.596%, 12/17/49 | 377,268 | ||||||
| 337,000 | Morgan Stanley Capital I Trust 2016-UBS9, 3.594%, 03/17/49 | 313,967 | ||||||
| 925,000 | PSMC 2020-3 Trust, 3.000%, 11/25/50(a) | 668,095 | ||||||
| 430,000 | RLGH Trust 2021-TROT, 6.249%, 04/15/36(a) | 419,053 | ||||||
| 78,854 | Seasoned Credit Risk Transfer Trust, 2.000%, 11/25/60 | 65,915 | ||||||
| 334,000 | UBS Commercial Mortgage Trust, 2.921%, 10/18/52 | 274,699 | ||||||
| 424,186 | UMBS Freddie Mac Pool, 5.000%, 07/01/53 | 392,426 | ||||||
| 160,000 | Wells Fargo Commercial Mortgage Trust 2016-C35, 2.931%, 07/17/48 | 145,543 | ||||||
| 351,000 | Wells Fargo Commercial Mortgage Trust 2017-RB1, 3.635%, 03/15/50 | 318,081 | ||||||
| 140,298 | Wells Fargo Commercial Mortgage Trust 2021-SAVE, 6.599%, 02/15/40(a)(b) | 135,426 | ||||||
| TOTAL MORTGAGE-BACKED SECURITIES (Cost $68,966,418) | 59,730,195 | |||||||
See accompanying Notes to Financial Statements.
28
| North Square McKee Bond Fund |
| SCHEDULE OF INVESTMENTS – Continued |
| October 31, 2023 |
| Principal | ||||||||
| Amount ($) | Fair Value | |||||||
| NON-U.S. GOVERNMENT & AGENCIES — 1.9% | ||||||||
| SUPRANATIONAL — 1.9% | ||||||||
| 509,000 | International Bank for Reconstruction & Development, 5.750%, 06/27/33 | $ | 485,810 | |||||
| 360,000 | International Bank for Reconstruction & Development, 5.750%, 08/26/33 | 345,570 | ||||||
| 1,524,000 | International Bank for Reconstruction & Development, 2.700%, 12/28/37 | 1,077,208 | ||||||
| TOTAL NON-U.S. GOVERNMENT & AGENCIES (Cost $2,375,960) | 1,908,588 | |||||||
| U.S. GOVERNMENT NOTES/BONDS — 3.9% | ||||||||
| 1,578,000 | United States Treasury Note/Bond, 3.375%, 08/15/42 | 1,221,440 | ||||||
| 1,295,000 | United States Treasury Note, 3.000%, 08/15/52 | 888,593 | ||||||
| 1,803,000 | United States Treasury Note, 3.625%, 02/15/53 | 1,405,213 | ||||||
| 389,000 | United States Treasury Note/Bond, 4.625%, 09/30/30 | 382,496 | ||||||
| TOTAL U.S. GOVERNMENT NOTES/BONDS (Cost $4,084,685) | 3,897,742 | |||||||
| Shares | ||||||||
| SHORT-TERM INVESTMENTS — 2.6% | ||||||||
| 2,555,138 | First American Treasury Obligations Fund, Class X, 5.29%(c) | 2,555,138 | ||||||
| TOTAL SHORT-TERM INVESTMENTS (Cost $2,555,138) | 2,555,138 | |||||||
| TOTAL INVESTMENTS — 100.5% (Cost $113,305,843) | $ | 100,517,613 | ||||||
| Liabilities in Excess of Other Assets — (0.5)% | (535,950 | ) | ||||||
| NET ASSETS — 100.0% | $ | 99,981,663 | ||||||
| (a) | Security exempt from registration under Rule 144A or Section 4(2) of the Securities Act of 1933. The security may be resold in transactions exempt from registration, normally to qualified institutional buyers. As of October 31, 2023 the total market value of 144A securities is 7,428,223 or 7.4% of net assets. |
| (b) | Variable rate security. Interest rate resets periodically. The rate shown is the effective interest rate as of October 31, 2023. For securities based on a published reference rate and spread, the reference rate and spread (in basis points) are indicated parenthetically. Certain variable rate securities are not based on a published reference rate and spread but are determined by the issuer or agent and are based on current market conditions. These securities, therefore, do not indicate a reference rate and spread. |
| (c) | Rate disclosed is the seven day effective yield as of October 31, 2023. |
See accompanying Notes to Financial Statements.
29
| North Square McKee Bond Fund |
| SUMMARY OF INVESTMENTS |
| As of October 31, 2023 |
| Percent of Total | ||||
| Security Type/Sector | Net Assets | |||
| Asset Backed Securities | 6.9 | % | ||
| Corporate Bonds | ||||
| Communications | 2.3 | % | ||
| Consumer Discretionary | 0.7 | % | ||
| Consumer Staples | 1.3 | % | ||
| Energy | 2.4 | % | ||
| Financials | 11.6 | % | ||
| Health Care | 1.1 | % | ||
| Industrials | 2.7 | % | ||
| Materials | 0.3 | % | ||
| Real Estate | 0.3 | % | ||
| Technology | 1.6 | % | ||
| Utilities | 3.9 | % | ||
| Total Corporate Bonds | 28.2 | % | ||
| Mortgage Backed Securities | 9.1 | % | ||
| U.S. Government Agency Issues | 52.9 | % | ||
| Foreign Government Agency Issue | 0.8 | % | ||
| Short-Term Investment | 2.6 | % | ||
| Total Investments | 100.5 | % | ||
| Other Assets in Excess of Liabilities | -0.5 | % | ||
| Total Net Assets | 100.0 | % | ||
See accompanying Notes to Financial Statements.
30
| North Square Strategic Income Fund |
| SCHEDULE OF INVESTMENTS |
| October 31, 2023 |
| Shares | Fair Value | |||||||
| COMMON STOCKS — 8.0% | ||||||||
| ENERGY — 6.9% | ||||||||
| ENERGY EQUIPMENT & SERVICES — 1.0% | ||||||||
| 26,872 | Schlumberger Ltd. | $ | 1,495,696 | |||||
| OIL & GAS PRODUCERS — 3.2% | ||||||||
| 13,100 | ConocoPhillips | 1,556,280 | ||||||
| 7,000 | Exxon Mobil Corp. | 740,950 | ||||||
| 3,102 | Marathon Petroleum Corp. | 469,178 | ||||||
| 12,500 | Occidental Petroleum Corp. | 772,625 | ||||||
| 4,104 | Phillips 66 | 468,143 | ||||||
| 3,575 | Valero Energy Corp. | 454,025 | ||||||
| 4,461,201 | ||||||||
| OIL & GAS SERVICES & EQUIPMENT — 2.2% | ||||||||
| 45,018 | Baker Hughes Co., Class A | 1,549,520 | ||||||
| 40,211 | Halliburton Co. | 1,581,900 | ||||||
| 3,131,420 | ||||||||
| OIL, GAS & CONSUMABLE FUELS — 0.5% | ||||||||
| 5,000 | Chevron Corp. | 728,650 | ||||||
| TOTAL ENERGY | 9,816,967 | |||||||
| MATERIALS — 1.1% | ||||||||
| METALS & MINING — 1.1% | ||||||||
| 28,000 | BHP Group Ltd. — ADR | 1,597,680 | ||||||
| TOTAL MATERIALS | 1,597,680 | |||||||
| TOTAL COMMON STOCKS (Cost $11,793,618) | 11,414,647 | |||||||
| ASSET BACKED SECURITIES — 7.2% | ||||||||
| 1,504,582 | Aegis Asset Backed Securities Trust 2005-2, 6.159%, 06/25/35 | 1,390,257 | ||||||
| 1,698,000 | Aligned Data Centers Issuer LLC, 1.937%, 08/15/46(a) | 1,481,497 | ||||||
| 448,810 | Ameriquest Asset-Backed Pass-Through Certs Series 2004-R2, 6.084%, 04/25/34 | 437,041 | ||||||
| 720,411 | FBR Securitization Trust, 5.909%, 11/26/35 | 697,365 | ||||||
| 1,380,000 | HI-FI Music IP Issuer LP, 3.939%, 02/01/62(a) | 1,251,813 | ||||||
| 244,417 | HSI Asset Securitization Corp. Trust 2006-OPT3, 5.709%, 02/25/36 | 237,394 | ||||||
| 290,000 | JP Morgan Mortgage Acquisition Trust 2006-CH1, 5.759%, 07/25/36 | 282,611 | ||||||
| 451,987 | JP Morgan Mortgage Acquisition Trust 2007-CH3, 5.699%, 03/25/37 | 436,126 | ||||||
| 694,691 | Libra Solutions 2023-1 LLC, 7.000%, 02/15/25(a) | 691,525 | ||||||
| 898,892 | Long Beach Mortgage Loan Trust 2005-1, 6.714%, 02/25/35 | 862,983 | ||||||
| 145,434 | Oasis Securitization Funding LLC, 2.143%, 10/15/33(a) | 144,957 | ||||||
| 1,927,645 | Planet Fitness Master Issuer LLC, 3.251%, 12/05/51(a) | 1,721,963 | ||||||
| 97,019 | RAMP Series 2004-RS4 Trust, 6.414%, 04/25/34 | 96,699 | ||||||
| 561,932 | Renaissance Home Equity Loan Trust 2005-3, 5.140%, 11/25/35 | 549,546 | ||||||
| TOTAL ASSET BACKED SECURITIES (Cost $10,756,789) | 10,281,777 | |||||||
See accompanying Notes to Financial Statements.
31
| North Square Strategic Income Fund |
| SCHEDULE OF INVESTMENTS – Continued |
| October 31, 2023 |
| Principal | ||||||||
| Amount ($) | Fair Value | |||||||
| CORPORATE BONDS — 51.1% | ||||||||
| ENERGY — 5.3% | ||||||||
| OIL & GAS PRODUCERS — 5.3% | ||||||||
| 1,975,000 | Enbridge, Inc., 3.708%, 01/15/83 | $ | 1,832,018 | |||||
| 1,500,000 | Energy Transfer LP, 9.654%, 02/15/67 | 1,415,378 | ||||||
| 1,500,000 | Energy Transfer LP, 7.125%, 05/15/70(b) | 1,249,392 | ||||||
| 3,250,000 | Plains All American Pipeline LP, 9.736%, 12/31/49(b) | 3,070,317 | ||||||
| 7,567,105 | ||||||||
| FINANCIALS — 41.3% | ||||||||
| ASSET MANAGEMENT — 2.6% | ||||||||
| 4,000,000 | UBS Group AG, 6.875%, 08/07/71 | 3,781,540 | ||||||
| BANKING — 29.3% | ||||||||
| 3,500,000 | BNP Paribas SA, 4.625%, 01/12/71 | 2,768,690 | ||||||
| 2,100,000 | Citigroup Inc., 5.000%, 03/12/72 | 1,992,715 | ||||||
| 1,250,000 | Citigroup Inc., 3.875%, 05/18/72(b) | 1,051,144 | ||||||
| 3,000,000 | Citizens Financial Group, Inc., 6.375%, 01/06/68(b) | 2,454,456 | ||||||
| 2,926,000 | Comerica, Inc., 5.625%, 10/01/71 | 2,522,973 | ||||||
| 3,000,000 | Credit Agricole SA, 6.875%, 03/23/72 | 2,918,789 | ||||||
| 3,000,000 | Fifth Third Bancorp, 8.689%, 12/31/49(b) | 2,716,864 | ||||||
| 3,000,000 | HSBC Holdings PLC, 4.000%, 09/09/71 | 2,493,336 | ||||||
| 1,254,000 | HSBC Holdings PLC, 4.700%, 09/09/71 | 904,071 | ||||||
| 990,000 | Huntington Bancshares, Inc., 4.045%, 03/15/68 | 741,247 | ||||||
| 2,029,000 | Huntington Bancshares, Inc., 8.535%, 07/15/71 | 1,705,055 | ||||||
| 3,200,000 | ING Groep NV, 3.875%, 10/16/69 | 2,249,397 | ||||||
| 358,000 | JPMorgan Chase & Co., 4.600%, 08/01/68(b) | 334,431 | ||||||
| 3,500,000 | KeyCorp, 4.891, 12/15/65 | 2,339,929 | ||||||
| 1,650,000 | Lloyds Banking Group PLC, 8.000%, 03/27/70 | 1,453,002 | ||||||
| 25,000 | M&T Bank Corp., 5.125%, 05/01/71 | 18,947 | ||||||
| 1,000,000 | M&T Bank Corp., 5.000%, 02/01/72 | 798,750 | ||||||
| 3,000,000 | NatWest Group PLC, 4.600%, 09/30/71 | 1,942,734 | ||||||
| 1,000,000 | PNC Financial Services, 5.000%, 05/01/72 | 836,647 | ||||||
| 2,000,000 | Societe Generale SA, 4.750%, 11/26/71 | 1,611,022 | ||||||
| 3,500,000 | Standard Chartered PLC, 4.300%, 02/19/72 | 2,457,949 | ||||||
| 3,720,000 | Truist Financial Corp., 4.800%, 03/01/68 | 3,057,887 | ||||||
| 3,000,000 | US Bancorp, 5.300%, 04/15/71(b) | 2,361,440 | ||||||
| 41,731,475 | ||||||||
| INSTITUTIONAL FINANCIAL SERVICES — 3.0% | ||||||||
| 2,920,000 | Goldman Sachs Group, Inc. (The), 4.125%, 05/10/71 | 2,317,210 | ||||||
| 2,250,000 | Northern Trust Corp., 4.600%, 04/01/27 | 1,988,681 | ||||||
| 4,305,891 | ||||||||
| INSURANCE — 1.9% | ||||||||
| 3,000,000 | Corebridge Financial, Inc., 6.875%, 12/15/52(b) | 2,775,162 | ||||||
See accompanying Notes to Financial Statements.
32
| North Square Strategic Income Fund |
| SCHEDULE OF INVESTMENTS – Continued |
| October 31, 2023 |
| Principal | ||||||||
| Amount ($) | Fair Value | |||||||
| CORPORATE BONDS (Continued) | ||||||||
| FINANCIALS (Continued) | ||||||||
| SPECIALTY FINANCE — 4.5% | ||||||||
| 4,112,000 | Ally Financial, Inc., 4.700%, 08/15/69(b) | $ | 2,681,942 | |||||
| 3,000,000 | Capital One Financial Corp., 3.950%, 12/01/70 | 2,095,441 | ||||||
| 2,512,000 | Discover Financial Services, 5.500%, 10/31/69(b) | 1,684,661 | ||||||
| 6,462,044 | ||||||||
| UTILITIES — 4.5% | ||||||||
| ELECTRIC UTILITIES — 4.5% | ||||||||
| 4,000,000 | American Electric Power Co., Inc., 3.875%, 02/15/62 | 3,161,298 | ||||||
| 1,750,000 | Emera, Inc., 6.700%, 06/15/76 | 1,652,327 | ||||||
| 1,000,000 | NextEra Energy Capital Holdings, Inc., 3.800%, 03/15/82 | 804,990 | ||||||
| 874,000 | Vistra Corp., 7.000%, 06/15/72(a),(b) | 796,463 | ||||||
| 6,415,078 | ||||||||
| TOTAL CORPORATE BONDS (Cost $75,823,804) | 73,038,295 | |||||||
| MORTGAGE-BACKED SECURITIES — 27.6% | ||||||||
| 665,000 | CityLine Commercial Mortgage Trust 2016-CLNE, 2.871%, 11/13/31(a) | 613,172 | ||||||
| 490,777 | Colony Multifamily Mortgage Trust 2014-1, 6.424%, 02/20/29(a) | 483,832 | ||||||
| 2,538,002 | Fannie Mae Pool, 5.000%, 07/01/52 | 2,344,891 | ||||||
| 3,681,204 | Fannie Mae-Aces, 1.501%, 08/25/28(c) | 172,714 | ||||||
| 1,742,491 | Fannie Mae-Aces, 0.750%, 09/25/28 | 1,639,028 | ||||||
| 2,762,866 | Fannie Mae-Aces, 1.373%, 03/26/29(c) | 137,940 | ||||||
| 950,250 | Fannie Mae-Aces, 1.000%, 11/25/33 | 894,405 | ||||||
| 7,690,000 | Freddie Mac Multiclass Certificates Series 2015-P001, 1.826%, 10/27/28(c) | 524,230 | ||||||
| 19,738,827 | Freddie Mac Multifamily Structured Pass-Through Certificates, 1.114%, 01/25/26(c) | 288,682 | ||||||
| 490,779 | Freddie Mac Multifamily Structured Pass-Through Certificates, 1.298%, 12/25/26 | 450,423 | ||||||
| 39,989,262 | Freddie Mac Multifamily Structured Pass-Through Certificates, 1.624%, 01/25/27(c) | 1,526,646 | ||||||
| 30,000,000 | Freddie Mac Multifamily Structured Pass-Through Certificates, 0.607%, 03/25/27(c) | 453,444 | ||||||
| 30,893,000 | Freddie Mac Multifamily Structured Pass-Through Certificates, 0.605%, 08/25/27(c) | 498,459 | ||||||
| 816,836 | Freddie Mac Multifamily Structured Pass-Through Certificates, 1.679%, 12/25/27 | 730,920 | ||||||
| 25,000,000 | Freddie Mac Multifamily Structured Pass-Through Certificates, 1.979%, 04/27/29(c) | 1,416,293 | ||||||
| 13,164,891 | Freddie Mac Multifamily Structured Pass-Through Certificates, 1.083%, 06/25/29(c) | 552,299 | ||||||
| 7,570,000 | Freddie Mac Multifamily Structured Pass-Through Certificates, 1.916%, 04/25/30(c) | 716,101 | ||||||
| 7,249,000 | Freddie Mac Multifamily Structured Pass-Through Certificates, 1.985%, 04/25/30(c) | 694,519 | ||||||
| 17,239,374 | Freddie Mac Multifamily Structured Pass-Through Certificates, 1.528%, 07/25/30(c) | 1,224,830 | ||||||
| 3,332,000 | Freddie Mac Multifamily Structured Pass-Through Certificates, 1.704%, 08/25/30(c) | 290,203 | ||||||
| 1,835,000 | Freddie Mac Multifamily Structured Pass-Through Certificates, 3.287%, 04/25/48(c) | 290,230 | ||||||
| 2,750,000 | Freddie Mac Multifamily Structured Pass-Through Certificates, 2.722%, 01/25/49(c) | 376,081 | ||||||
| 1,715,000 | Freddie Mac Multifamily Structured Pass-Through Certificates, 2.711%, 02/25/49(c) | 237,781 | ||||||
| 2,938,010 | Freddie Mac Pool, 5.500%, 06/01/53 | 2,793,223 | ||||||
| 1,000,000 | FREMF 2015-K45 Mortgage Trust, 3.733%, 04/25/48(a) | 962,396 | ||||||
| 2,500,000 | FREMF 2015-K50 Mortgage Trust, 3.909%, 10/25/48(a) | 2,394,024 | ||||||
| 1,445,000 | FREMF 2016-K55 Mortgage Trust, 4.301%, 04/25/49(a) | 1,365,383 | ||||||
| 301,404,692 | FREMF 2016-K59 Mortgage Trust, 0.100%, 11/25/49(a),(c) | 656,761 | ||||||
See accompanying Notes to Financial Statements.
33
| North Square Strategic Income Fund |
| SCHEDULE OF INVESTMENTS – Continued |
| October 31, 2023 |
| Principal | ||||||||
| Amount ($) | Fair Value | |||||||
| MORTGAGE-BACKED SECURITIES (Continued) | ||||||||
| 2,803,095 | Ginnie Mae II Pool, 3.000%, 09/20/52 | $ | 2,317,957 | |||||
| 3,817,437 | Ginnie Mae II Pool, 3.500%, 02/20/53 | 3,274,301 | ||||||
| 3,803,380 | Ginnie Mae II Pool, 2.500%, 03/20/53 | 3,040,015 | ||||||
| 1,715,558 | Government National Mortgage Association, 0.791%, 12/16/56(c) | 70,694 | ||||||
| 4,569,550 | Government National Mortgage Association, 1.272%, 09/16/60(c) | 371,286 | ||||||
| 1,234,132 | Government National Mortgage Association, 1.042%, 11/16/60(c) | 85,988 | ||||||
| 6,935,787 | Government National Mortgage Association, 0.976%, 05/16/63(c) | 463,711 | ||||||
| 7,267,066 | Government National Mortgage Association, 0.986%, 05/16/63(c) | 493,590 | ||||||
| 8,441,105 | Government National Mortgage Association, 0.992%, 05/16/63(c) | 590,578 | ||||||
| 1,500,000 | Independence Plaza Trust 2018-INDP, 4.158%, 07/12/35(a) | 1,375,794 | ||||||
| 2,755,867 | UMBS Fannie Mae Pool, 5.000%, 03/01/53 | 2,546,941 | ||||||
| TOTAL MORTGAGE-BACKED SECURITIES (Cost $40,602,823) | 39,359,765 | |||||||
| Expiration | Exercise | Notional | |||||||||||||||||
| Description | Contracts | Date | Price | Value | Fair Value | ||||||||||||||
| CALL OPTIONS PURCHASED — 0.2% | |||||||||||||||||||
| S&P500 E-Mini Index | 200 | 12/15/2023 | $ | 4,350 | $ | 42,120,000 | 327,500 | ||||||||||||
| TOTAL CALL OPTIONS PURCHASED (Cost — $247,500) | 327,500 | ||||||||||||||||||
| Shares | ||||||||
| SHORT TERM INVESTMENTS — 3.7% | ||||||||
| 5,070,610 | First American Treasury Obligations Fund, Class X, 5.29%(d) | 5,070,610 | ||||||
| TOTAL SHORT TERM INVESTMENTS (Cost $5,070,610) | 5,070,610 | |||||||
| TOTAL INVESTMENTS — 97.8% (Cost $144,295,144) | $ | 139,492,594 | ||||||
| Other Assets in Excess of Liabilities — 2.2% | 3,333,300 | |||||||
| NET ASSETS — 100.0% | $ | 142,825,894 | ||||||
| (a) | Security exempt from registration under Rule 144A or Section 4(2) of the Securities Act of 1933. The security may be resold in transactions exempt from registration, normally to qualified institutional buyers. As of October 31, 2023 the total market value of 144A securities is $13,939,579 or 9.8% of net assets. |
| (b) | Step-up bond. The interest rate shown is the rate in effect as of October 31, 2023. |
| (c) | Variable rate security. The rate shown represents the rate on October 31, 2023. |
| (d) | Rate disclosed is the seven day effective yield as of October 31, 2023. |
ADR -American Depositary Receipt
See accompanying Notes to Financial Statements.
34
| North Square Strategic Income Fund |
| SCHEDULE OF FUTURES CONTRACTS |
| October 31, 2023 |
| Value and | ||||||||||||
| Unrealized | ||||||||||||
| Expiration | Notional | Appreciation | ||||||||||
| Long Contracts | Contracts | Date | Amount | (Depreciation) | ||||||||
| 10-Year US Treasury Note Future | 256 | 12/19/2023 | $ | 27,180,000 | $ | (500,000 | ) | |||||
| 5-Year US Treasury Note Future | 407 | 12/29/2023 | 42,521,961 | (392,649 | ) | |||||||
| CBOT 2-Year US Treasury Note Future | 262 | 12/29/2023 | 53,034,533 | (128,936 | ) | |||||||
| $ | (1,021,585 | ) | ||||||||||
| Short Contracts | ||||||||||||
| 30-Year US Treasury Long Bond Future | 133 | 12/19/2023 | $ | 14,555,188 | $ | 391,975 | ||||||
| British Pound Future | 39 | 12/18/2023 | 2,962,538 | (4,388 | ) | |||||||
| E-Mini S&P 500 Index | 39 | 12/15/2023 | 8,213,888 | 177,350 | ||||||||
| Euro FX Future | 36 | 12/18/2023 | 4,771,125 | (24,825 | ) | |||||||
| Ultra 10-Year US Treasury Note Future | 40 | 12/19/2023 | 4,353,125 | 106,251 | ||||||||
| $ | 646,363 | |||||||||||
See accompanying Notes to Financial Statements.
35
| North Square Strategic Income Fund |
| SUMMARY OF INVESTMENTS |
| As of October 31, 2023 |
| Percent of Total | ||||
| Security Type/Sector | Net Assets | |||
| Common Stocks | ||||
| Energy | 6.9 | % | ||
| Materials | 1.1 | % | ||
| Total Common Stocks | 8.0 | % | ||
| Asset Backed Securities | 7.2 | % | ||
| Corporate Bonds | ||||
| Energy | 5.3 | % | ||
| Financials | 41.5 | % | ||
| Utilities | 4.5 | % | ||
| Total Corporate Bonds | 51.1 | % | ||
| Mortgage Backed Securities | 27.6 | % | ||
| Purchased Option | 0.2 | % | ||
| Short-Term Investments | 3.7 | % | ||
| Total Investments | 98.3 | % | ||
| Other Assets in Excess of Liabilities | 1.7 | % | ||
| Total Net Assets | 100.0 | % | ||
See accompanying Notes to Financial Statements.
36
| STATEMENTS OF ASSETS AND LIABILITIES |
| As of October 31, 2023 |
| North Square | North Square | |||||||||||||||
| Advisory Research | Altrinsic | North Square | North Square | |||||||||||||
| Small Cap | International | McKee Bond | Strategic | |||||||||||||
| Value Fund | Equity Fund | Fund | Income Fund | |||||||||||||
| Assets | ||||||||||||||||
| Investments, at cost | $ | 18,042,542 | $ | 110,857,592 | $ | 113,305,843 | $ | 144,295,144 | ||||||||
| Investments, at value | $ | 17,074,004 | $ | 107,404,457 | $ | 100,517,613 | $ | 139,492,594 | ||||||||
| Deposits at broker | — | — | — | 1,273,833 | ||||||||||||
| Receivable for fund shares sold | 1,125 | 98 | 1,934 | 113,688 | ||||||||||||
| Receivable for investments sold | — | 133,157 | 547,584 | 865,647 | ||||||||||||
| Dividends and interest receivable | 2,369 | 268,243 | 677,165 | 1,409,469 | ||||||||||||
| Tax reclaims receivable | — | 316,815 | — | 23,036 | ||||||||||||
| Receivable from Advisor | — | — | 15,959 | — | ||||||||||||
| Prepaid expenses | 20,187 | 40,974 | 51,458 | 37,945 | ||||||||||||
| Total Assets | 17,097,685 | 108,163,744 | 101,811,713 | 143,216,212 | ||||||||||||
| Liabilities | ||||||||||||||||
| Payable for fund shares redeemed | — | 997 | — | 133,391 | ||||||||||||
| Payable for investments purchased | — | 96,743 | 1,789,196 | — | ||||||||||||
| Payable for net variation margin on futures contracts | — | — | — | 132,325 | ||||||||||||
| Due to Advisor (Note 4) | 1,193 | 17,607 | — | 33,055 | ||||||||||||
| Distribution fees (Note 8) | — | — | — | 69 | ||||||||||||
| Shareholder servicing fees (Note 7) | 1,613 | 16,655 | 79 | 25,982 | ||||||||||||
| Fund administration fees | 1,547 | 7,008 | 6,383 | 9,783 | ||||||||||||
| Due to Trustees | 19 | 130 | 121 | 176 | ||||||||||||
| Other accrued expenses | 7,575 | 49,937 | 34,271 | 55,537 | ||||||||||||
| Total Liabilities | 11,947 | 189,077 | 1,830,050 | 390,318 | ||||||||||||
| Net Assets | $ | 17,085,738 | $ | 107,974,667 | $ | 99,981,663 | $ | 142,825,894 | ||||||||
| Net Assets consist of: | ||||||||||||||||
| Paid-in capital (par value of $0.01 per share with an unlimited number of shares authorized) | 19,614,433 | 110,523,770 | 123,249,793 | 159,305,916 | ||||||||||||
| Accumulated deficits | (2,528,695 | ) | (2,549,103 | ) | (23,268,130 | ) | (16,480,022 | ) | ||||||||
| Net Assets | $ | 17,085,738 | $ | 107,974,667 | $ | 99,981,663 | $ | 142,825,894 | ||||||||
| Class A Shares:(a) | ||||||||||||||||
| Net assets applicable to shares outstanding | $ | 405,679 | ||||||||||||||
| Shares of beneficial interest issued and outstanding | 49,419 | |||||||||||||||
| Net asset value, redemption and offering price per share | $ | 8.21 | ||||||||||||||
| Class I Shares: | ||||||||||||||||
| Net assets applicable to shares outstanding | $ | 17,085,738 | $ | 107,974,667 | $ | 258,985 | $ | 142,420,215 | ||||||||
| Shares of beneficial interest issued and outstanding | 1,836,575 | 10,851,113 | 31,668 | 17,333,022 | ||||||||||||
| Net asset value, redemption and offering price per share | $ | 9.30 | $ | 9.95 | $ | 8.18 | $ | 8.22 | ||||||||
| Class R6 Shares: | ||||||||||||||||
| Net assets applicable to shares outstanding | $ | 99,722,678 | ||||||||||||||
| Shares of beneficial interest issued and outstanding | 12,140,570 | |||||||||||||||
| Net asset value, redemption and offering price per share | $ | 8.21 | ||||||||||||||
| (a) | A sales charge of 3.75% will be imposed on investments less than $1,000,000. A contingent deferred sales charge of 1.00% on investments over $1,000,000 will be imposed on certain such redemptions of shares within 12 months of the date of purchase. |
See accompanying Notes to Financial Statements.
37
| STATEMENTS OF OPERATIONS |
| For the Year Ended October 31, 2023 |
| North Square | North Square | |||||||||||||||
| Advisory Research | Altrinsic | North Square | North Square | |||||||||||||
| Small Cap | International | McKee Bond | Strategic | |||||||||||||
| Value Fund | Equity Fund | Fund | Income Fund | |||||||||||||
| Investment Income | ||||||||||||||||
| Dividend income | $ | 347,237 | $ | 2,781,493 | $ | — | $ | 126,923 | ||||||||
| Interest income | 13,918 | 219,629 | 3,794,770 | 7,923,572 | ||||||||||||
| Foreign dividend taxes withheld | — | (315,022 | ) | — | (2,023 | ) | ||||||||||
| Total investment income | 361,155 | 2,686,100 | 3,794,770 | 8,048,472 | ||||||||||||
| Expenses | ||||||||||||||||
| Advisor fees (Note 4) | 137,089 | 748,254 | 254,071 | 1,078,462 | ||||||||||||
| Registration fees | 22,879 | 21,676 | 36,680 | 34,309 | ||||||||||||
| Shareholder servicing fees - Class I Shares (Note 7) | 19,949 | 58,084 | 1 | 116,224 | ||||||||||||
| Fund administration fees | 16,407 | 73,872 | 88,944 | 129,451 | ||||||||||||
| Transfer agent fees and expenses | 10,458 | 25,522 | 37,078 | 48,861 | ||||||||||||
| Legal fees | 7,871 | 32,421 | 53,486 | 60,838 | ||||||||||||
| Custody fees | 6,521 | 45,254 | 20,467 | 16,820 | ||||||||||||
| Shareholder reporting fees | 4,417 | 8,322 | 8,281 | 20,279 | ||||||||||||
| Fund accounting fees | 4,385 | 6,544 | 8,269 | 13,421 | ||||||||||||
| Chief compliance officer fees (Note 4) | 3,055 | 18,358 | 9,145 | 15,675 | ||||||||||||
| Trustees’ fees and expenses | 1,945 | 11,645 | 15,831 | 18,488 | ||||||||||||
| Audit fees | 1,747 | 16,167 | 14,858 | 25,109 | ||||||||||||
| Insurance | 936 | 2,773 | 5,428 | 5,262 | ||||||||||||
| Pricing | 185 | 3,218 | 17,682 | 12,007 | ||||||||||||
| Distribution fees - Class A Shares (Note 8) | — | — | — | 281 | ||||||||||||
| Shareholder servicing fees - Class A Shares (Note 7) | — | — | — | 53 | ||||||||||||
| Interest expense | — | — | — | 495 | ||||||||||||
| Other expenses | 6,254 | 20,882 | 21,978 | 23,798 | ||||||||||||
| Total expenses | 244,098 | 1,092,992 | 592,199 | 1,619,833 | ||||||||||||
| Fees contractually waived (reimbursed) by Advisor | (60,005 | ) | (185,890 | ) | (292,672 | ) | (232,600 | ) | ||||||||
| Net operating expenses | 184,093 | 907,102 | 299,527 | 1,387,233 | ||||||||||||
| Net investment income | 177,062 | 1,778,998 | 3,495,243 | 6,661,239 | ||||||||||||
| Net Realized and Change in Unrealized Gain (Loss) on Investments | ||||||||||||||||
| Net realized gain (loss) on: | ||||||||||||||||
| Investments | (1,503,431 | ) | 683,054 | (5,045,601 | ) | (5,266,772 | ) | |||||||||
| Futures contracts | — | — | — | (4,700,806 | ) | |||||||||||
| Purchased options | — | — | — | (222,045 | ) | |||||||||||
| Foreign currency transactions | — | (9,982 | ) | — | 8,663 | |||||||||||
| Net realized gain (loss) | (1,503,431 | ) | 673,072 | (5,045,601 | ) | (10,180,960 | ) | |||||||||
| Net change in unrealized appreciation (depreciation) on: | ||||||||||||||||
| Investments | 740,959 | 6,602,035 | 1,712,146 | 839,385 | ||||||||||||
| Purchased options | — | — | — | 139,392 | ||||||||||||
| Futures contracts | — | — | — | 525,712 | ||||||||||||
| Foreign currency transactions | — | 7,803 | — | — | ||||||||||||
| Net change in unrealized appreciation (depreciation) | 740,959 | 6,609,838 | 1,712,146 | 1,504,489 | ||||||||||||
| Net realized and change in unrealized gain (loss) | (762,472 | ) | 7,282,910 | (3,333,455 | ) | (8,676,471 | ) | |||||||||
| Net increase (decrease) in net assets resulting from operations | $ | (585,410 | ) | $ | 9,061,908 | $ | 161,788 | $ | (2,015,232 | ) | ||||||
See accompanying Notes to Financial Statements.
38
| STATEMENTS OF CHANGES IN NET ASSETS |
| North Square Advisory Research | North Square Altrinsic | |||||||||||||||
| Small Cap Value Fund | International Equity Fund | |||||||||||||||
| For the | For the | For the | For the | |||||||||||||
| Year Ended | Year Ended | Year Ended | Year Ended | |||||||||||||
| October 31, | October 31, | October 31, | October 31, | |||||||||||||
| 2023 | 2022 | 2023 | 2022 | |||||||||||||
| Increase (Decrease) in Net Assets due to: | ||||||||||||||||
| Operations | ||||||||||||||||
| Net investment income | $ | 177,062 | $ | 2,147 | $ | 1,778,998 | $ | 987,230 | ||||||||
| Net realized gain (loss) on investments | (1,503,431 | ) | 1,234,910 | 673,072 | (1,465,265 | ) | ||||||||||
| Net change in unrealized appreciation (depreciation) on investments | 740,959 | (3,832,957 | ) | 6,609,838 | (11,666,682 | ) | ||||||||||
| Net increase (decrease) in net assets resulting from operations | (585,410 | ) | (2,595,900 | ) | 9,061,908 | (12,144,717 | ) | |||||||||
| Distributions to Shareholders | ||||||||||||||||
| Class I Shares | (1,298,708 | ) | (727,531 | ) | (1,012,568 | ) | (831,136 | ) | ||||||||
| Total distributions | (1,298,708 | ) | (727,531 | ) | (1,012,568 | ) | (831,136 | ) | ||||||||
| Capital Transactions - Class I Shares | ||||||||||||||||
| Proceeds from shares sold | 113,053 | 19,177,901 | 40,742,334 | 29,799,973 | ||||||||||||
| Reinvestment of distributions | 1,298,708 | 727,531 | 920,902 | 831,136 | ||||||||||||
| Amount paid for shares redeemed | (3,308,516 | ) | (5,826,812 | ) | (2,306,091 | ) | (1,820,000 | ) | ||||||||
| Total Class I Shares | (1,896,755 | ) | 14,078,620 | 39,357,145 | 28,811,109 | |||||||||||
| Net increase (decrease) in net assets resulting from capital transactions | (1,896,755 | ) | 14,078,620 | 39,357,145 | 28,811,109 | |||||||||||
| Total Increase (Decrease) in Net Assets | (3,780,873 | ) | 10,755,189 | 47,406,485 | 15,835,256 | |||||||||||
| Net Assets | ||||||||||||||||
| Beginning of year | 20,866,611 | 10,111,422 | 60,568,182 | 44,732,926 | ||||||||||||
| End of year | $ | 17,085,738 | $ | 20,866,611 | $ | 107,974,667 | $ | 60,568,182 | ||||||||
| Share Transactions - Class I Shares | ||||||||||||||||
| Shares sold | 11,482 | 1,646,309 | 4,030,452 | 2,949,238 | ||||||||||||
| Shares issued in reinvestment of distributions | 138,526 | 63,892 | 96,103 | 79,806 | ||||||||||||
| Shares redeemed | (336,751 | ) | (515,235 | ) | (222,848 | ) | (194,477 | ) | ||||||||
| Total Class I Shares | (186,743 | ) | 1,194,966 | 3,903,707 | 2,834,567 | |||||||||||
| Net increase (decrease) in shares outstanding | (186,743 | ) | 1,194,966 | 3,903,707 | 2,834,567 | |||||||||||
See accompanying Notes to Financial Statements.
39
| STATEMENTS OF CHANGES IN NET ASSETS – Continued |
| North Square McKee | North Square Strategic | |||||||||||||||
| Bond Fund | Income Fund | |||||||||||||||
| For the | For the | For the | For the | |||||||||||||
| Year Ended | Year Ended | Year Ended | Year Ended | |||||||||||||
| October 31, | October 31, | October 31, | October 31, | |||||||||||||
| 2023 | 2022 | 2023 | 2022 | |||||||||||||
| Increase (Decrease) in Net Assets due to: | ||||||||||||||||
| Operations | ||||||||||||||||
| Net investment income | $ | 3,495,243 | $ | 1,755,113 | $ | 6,661,239 | $ | 2,846,911 | ||||||||
| Net realized loss on investments | (5,045,601 | ) | (4,607,795 | ) | (10,180,960 | ) | (3,024,136 | ) | ||||||||
| Net change in unrealized appreciation (depreciation) on investments | 1,712,146 | (13,504,587 | ) | 1,504,489 | (11,157,503 | ) | ||||||||||
| Net increase (decrease) in net assets resulting from operations | 161,788 | (16,357,269 | ) | (2,015,232 | ) | (11,334,728 | ) | |||||||||
| Distributions to Shareholders | ||||||||||||||||
| From earnings: | ||||||||||||||||
| Class A Shares(a) | — | — | (4,100 | ) | — | |||||||||||
| Class I Shares | (49,830 | ) | (393 | ) | (5,222,210 | ) | (4,738,633 | ) | ||||||||
| Class R6 Shares | (3,508,324 | ) | (2,113,446 | ) | — | — | ||||||||||
| From return of capital: | ||||||||||||||||
| Class A Shares | — | — | (1,661 | ) | — | |||||||||||
| Class I Shares | — | — | (1,446,226 | ) | — | |||||||||||
| Total distributions | (3,558,154 | ) | (2,113,839 | ) | (6,674,197 | ) | (4,738,633 | ) | ||||||||
| Capital Transactions - Class A Shares(a) | ||||||||||||||||
| Proceeds from shares sold | 425,520 | — | ||||||||||||||
| Reinvestment of distributions | 5,761 | — | ||||||||||||||
| Amount paid for shares redeemed | (4,498 | ) | — | |||||||||||||
| Total Class A Shares | 426,783 | — | ||||||||||||||
| Capital Transactions - Class I Shares | ||||||||||||||||
| Proceeds from shares sold | 5,735,885 | 41,109 | 101,927,590 | 62,910,607 | ||||||||||||
| Reinvestment of distributions | 49,934 | 393 | 6,548,802 | 4,660,372 | ||||||||||||
| Amount paid for shares redeemed | (5,429,301 | ) | — | (71,013,141 | ) | (17,332,491 | ) | |||||||||
| Total Class I Shares | 356,518 | 41,502 | 37,463,251 | 50,238,488 | ||||||||||||
| Capital Transactions - Class R6 Shares | ||||||||||||||||
| Proceeds from shares sold | 8,876,820 | 12,872,189 | ||||||||||||||
| Reinvestment of distributions | 3,077,688 | 1,876,338 | ||||||||||||||
| Amount paid for shares redeemed | (16,531,761 | ) | (28,011,568 | ) | ||||||||||||
| Total Class R6 Shares | (4,577,253 | ) | (13,263,041 | ) | ||||||||||||
| Net increase (decrease) in net assets resulting from capital transactions | (4,220,735 | ) | (13,221,539 | ) | 37,890,034 | 50,238,488 | ||||||||||
| Total Increase (Decrease) in Net Assets | (7,617,101 | ) | (31,692,647 | ) | 29,200,605 | 34,165,127 | ||||||||||
| Net Assets | ||||||||||||||||
| Beginning of year | 107,598,764 | 139,291,411 | 113,625,289 | 79,460,162 | ||||||||||||
| End of year | $ | 99,981,663 | $ | 107,598,764 | $ | 142,825,894 | $ | 113,625,289 | ||||||||
See accompanying Notes to Financial Statements.
40
| STATEMENTS OF CHANGES IN NET ASSETS – Continued |
| North Square McKee | North Square Strategic | |||||||||||||||
| Bond Fund | Income Fund | |||||||||||||||
| For the | For the | For the | For the | |||||||||||||
| Year Ended | Year Ended | Year Ended | Year Ended | |||||||||||||
| October 31, | October 31, | October 31, | October 31, | |||||||||||||
| 2023 | 2022 | 2023 | 2022 | |||||||||||||
| Share Transactions - Class A Shares(a) | ||||||||||||||||
| Shares sold | 49,259 | — | ||||||||||||||
| Shares issued in reinvestment of distributions | 680 | — | ||||||||||||||
| Shares redeemed | (520 | ) | — | |||||||||||||
| Total Class A Shares | 49,419 | — | ||||||||||||||
| Share Transactions - Class I Shares | ||||||||||||||||
| Shares sold | 653,356 | 4,633 | 11,563,128 | 6,678,228 | ||||||||||||
| Shares issued in reinvestment of distributions | 5,716 | 44 | 756,054 | 493,729 | ||||||||||||
| Shares redeemed | (633,096 | ) | — | (8,195,001 | ) | (1,837,565 | ) | |||||||||
| Total Class I Shares | 25,976 | 4,677 | 4,124,181 | 5,334,392 | ||||||||||||
| Share Transactions - Class R6 Shares | ||||||||||||||||
| Shares sold | 1,025,551 | 1,396,703 | ||||||||||||||
| Shares issued in reinvestment of distributions | 355,603 | 205,909 | ||||||||||||||
| Shares redeemed | (1,889,456 | ) | (3,102,939 | ) | ||||||||||||
| Total Class R6 Shares | (508,302 | ) | (1,500,327 | ) | ||||||||||||
| Net increase (decrease) in shares outstanding | (482,326 | ) | (1,495,650 | ) | 4,173,600 | 5,334,392 | ||||||||||
| (a) | For the period February 28, 2023 (commencement of operations) to October 31, 2023. |
See accompanying Notes to Financial Statements.
41
| North Square Advisory Research Small Cap Value Fund |
| FINANCIAL HIGHLIGHTS |
| Class I Shares |
| (For a share outstanding during each year) |
| For the Years Ended October 31, | ||||||||||||||||||||
| 2023 | 2022 | 2021 | 2020 | 2019 | ||||||||||||||||
| Selected Per Share Data: | ||||||||||||||||||||
| Net asset value, beginning of year | $ | 10.31 | $ | 12.21 | $ | 9.33 | $ | 11.63 | $ | 14.73 | ||||||||||
| Investment operations: | ||||||||||||||||||||
| Net investment income(a) | 0.09 | — | (b) | 0.04 | 0.08 | 0.07 | ||||||||||||||
| Net realized and unrealized gain (loss) | (0.45 | ) | (1.02 | ) | 3.95 | (1.11 | ) | 0.85 | ||||||||||||
| Total from investment operations | (0.36 | ) | (1.02 | ) | 3.99 | (1.03 | ) | 0.92 | ||||||||||||
| Less distributions: | ||||||||||||||||||||
| Net investment income | (0.01 | ) | (0.03 | ) | (0.10 | ) | (0.07 | ) | (0.07 | ) | ||||||||||
| From net realized gains | (0.64 | ) | (0.85 | ) | (1.01 | ) | (1.20 | ) | (3.95 | ) | ||||||||||
| Total distributions | (0.65 | ) | (0.88 | ) | (1.11 | ) | (1.27 | ) | (4.02 | ) | ||||||||||
| Net asset value, end of year | $ | 9.30 | $ | 10.31 | $ | 12.21 | $ | 9.33 | $ | 11.63 | ||||||||||
| Total Return(c) | (3.51 | )% | (9.05 | )% | 46.09 | % | (10.63 | )% | 12.95 | % | ||||||||||
| Ratios and Supplemental Data: | ||||||||||||||||||||
| Net assets, end of year (in thousands) | $ | 17,086 | $ | 20,867 | $ | 10,111 | $ | 4,378 | $ | 9,385 | ||||||||||
| Ratio of expenses to average net assets: | ||||||||||||||||||||
| Before fee waived and expenses absorbed | 1.25 | % | 1.24 | % | 1.63 | % | 1.97 | % | 1.76 | % | ||||||||||
| After fees waived and expenses absorbed | 0.94 | % | 0.94 | % | 0.95 | % | 0.97 | %(d) | 1.00 | % | ||||||||||
| Ratio of net investment income (loss) to average net assets: | ||||||||||||||||||||
| Before fees waived and expenses absorbed | 0.60 | % | (0.29 | )% | (0.34 | )% | (0.21 | )% | (0.17 | )% | ||||||||||
| After fees waived and expenses absorbed | 0.90 | % | 0.01 | % | 0.34 | % | 0.79 | % | 0.59 | % | ||||||||||
| Portfolio turnover rate | 45 | % | 107 | % | 45 | % | 49 | % | 26 | % | ||||||||||
| (a) | Based on average shares outstanding for the period. |
| (b) | Rounds to less than $0.005 per share. |
| (c) | Total returns would have been lower had expenses not been waived by the Advisor. Returns shown do not reflect the deduction of taxes that a shareholder would pay on Fund distributions or the redemption of Fund shares. |
| (d) | The annual net expense ratio changed from 1.00% to 0.95% of net assets as of the close of business on February 21, 2020. |
See accompanying Notes to Financial Statements.
42
| North Square Altrinsic International Equity Fund |
| FINANCIAL HIGHLIGHTS |
| Class I Shares |
| (For a share outstanding during each period) |
| For the Years Ended | For the | |||||||||||
| October 31, | Period Ended | |||||||||||
| October 31, | ||||||||||||
| 2023 | 2022 | 2021(a) | ||||||||||
| Selected Per Share Data: | ||||||||||||
| Net asset value, beginning of period | $ | 8.72 | $ | 10.88 | $ | 10.00 | ||||||
| Investment operations: | ||||||||||||
| Net investment income(b) | 0.19 | 0.16 | 0.13 | |||||||||
| Net realized and unrealized gain (loss) | 1.18 | (2.12 | ) | 0.76 | ||||||||
| Total from investment operations | 1.37 | (1.96 | ) | 0.89 | ||||||||
| Less distributions: | ||||||||||||
| Net investment income | (0.14 | ) | (0.09 | ) | (0.01 | ) | ||||||
| From net realized gains | — | (0.11 | ) | — | ||||||||
| Total distributions | (0.14 | ) | (0.20 | ) | (0.01 | ) | ||||||
| Net asset value, end of period | $ | 9.95 | $ | 8.72 | $ | 10.88 | ||||||
| Total Return(c) | 15.83 | % | (18.30 | )% | 8.88 | %(d) | ||||||
| Ratios and Supplemental Data: | ||||||||||||
| Net assets, end of period (in thousands) | $ | 107,975 | $ | 60,568 | $ | 44,733 | ||||||
| Ratio of expenses to average net assets: | ||||||||||||
| Before fee waived and expenses absorbed | 1.17 | % | 1.29 | % | 1.43 | %(e) | ||||||
| After fees waived and expenses absorbed | 0.97 | % | 0.97 | % | 0.97 | %(e) | ||||||
| Ratio of net investment income to average net assets: | ||||||||||||
| Before fees waived and expenses absorbed | 1.70 | % | 1.37 | % | 0.92 | %(e) | ||||||
| After fees waived and expenses absorbed | 1.90 | % | 1.69 | % | 1.38 | %(e) | ||||||
| Portfolio turnover rate | 27 | % | 23 | % | 22 | %(d) | ||||||
| (a) | For the period December 4, 2020 (commencement of operations) to October 31, 2021. |
| (b) | Based on average shares outstanding for the period. |
| (c) | Total returns would have been lower had expenses not been waived by the Advisor. Returns shown do not reflect the deduction of taxes that a shareholder would pay on Fund distributions or the redemption of Fund shares. |
| (d) | Not annualized. |
| (e) | Annualized. |
See accompanying Notes to Financial Statements.
43
| North Square McKee Bond Fund |
| FINANCIAL HIGHLIGHTS |
| Class I Shares |
| (For a share outstanding during each period) |
| For the Years Ended | For the | |||||||||||
| October 31, | Period Ended | |||||||||||
| October 31, | ||||||||||||
| 2023 | 2022 | 2021(a) | ||||||||||
| Selected Per Share Data: | ||||||||||||
| Net asset value, beginning of period | $ | 8.48 | $ | 9.84 | $ | 9.89 | ||||||
| Investment operations: | ||||||||||||
| Net investment income(b) | 0.25 | 0.14 | 0.01 | |||||||||
| Net realized and unrealized loss | (0.26 | ) | (1.34 | ) | (0.02 | ) | ||||||
| Total from investment operations | (0.01 | ) | (1.20 | ) | (0.01 | ) | ||||||
| Less distributions: | ||||||||||||
| Net investment income | (0.29 | ) | (0.16 | ) | (0.04 | ) | ||||||
| Total distributions | (0.29 | ) | (0.16 | ) | (0.04 | ) | ||||||
| Net asset value, end of period | $ | 8.18 | $ | 8.48 | $ | 9.84 | ||||||
| Total Return(c) | (0.19 | )% | (12.33 | )% | (0.12 | )%(d) | ||||||
| Ratios and Supplemental Data: | ||||||||||||
| Net assets, end of period (in thousands) | $ | 259 | $ | 48 | $ | 10 | ||||||
| Ratio of expenses to average net assets: | ||||||||||||
| Before fee waived and expenses absorbed | 0.58 | % | 0.77 | % | 0.64 | %(e) | ||||||
| After fees waived and expenses absorbed | 0.47 | % | 0.47 | % | 0.47 | %(e) | ||||||
| Ratio of net investment income to average net assets: | ||||||||||||
| Before fees waived and expenses absorbed | 2.78 | % | 1.28 | % | 0.13 | %(e) | ||||||
| After fees waived and expenses absorbed | 2.90 | % | 1.58 | % | 0.30 | %(e) | ||||||
| Portfolio turnover rate | 104 | % | 129 | % | 321 | %(d)(f) | ||||||
| (a) | For the period May 19, 2021 (commencement of operations) to October 31, 2021. |
| (b) | Based on average shares outstanding for the period. |
| (c) | Total returns would have been lower had expenses not been waived by the Advisor. Returns shown do not reflect the deduction of taxes that a shareholder would pay on Fund distributions or the redemption of Fund shares. |
| (d) | Not annualized. |
| (e) | Annualized. |
| (f) | Securities purchased in-kind were excluded from the computation of the ratio. |
See accompanying Notes to Financial Statements.
44
| North Square McKee Bond Fund |
| FINANCIAL HIGHLIGHTS |
| Class R6 Shares |
| (For a share outstanding during each period) |
| For the Years Ended | For the | |||||||||||
| October 31, | Period Ended | |||||||||||
| October 31, | ||||||||||||
| 2023 | 2022 | 2021(a) | ||||||||||
| Selected Per Share Data: | ||||||||||||
| Net asset value, beginning of period | $ | 8.50 | $ | 9.84 | $ | 10.00 | ||||||
| Investment operations: | ||||||||||||
| Net investment income(b) | 0.29 | 0.13 | 0.03 | |||||||||
| Net realized and unrealized loss | (0.29 | ) | (1.31 | ) | (0.13 | ) | ||||||
| Total from investment operations | — | (1.18 | ) | (0.10 | ) | |||||||
| Less distributions: | ||||||||||||
| Net investment income | (0.29 | ) | (0.16 | ) | (0.06 | ) | ||||||
| Total distributions | (0.29 | ) | (0.16 | ) | (0.06 | ) | ||||||
| Net asset value, end of period | $ | 8.21 | $ | 8.50 | $ | 9.84 | ||||||
| Total Return(c) | (0.07 | )% | (12.14 | )% | 0.91 | %(d) | ||||||
| Ratios and Supplemental Data: | ||||||||||||
| Net assets, end of period (in thousands) | $ | 99,723 | $ | 107,550 | $ | 139,281 | ||||||
| Ratio of expenses to average net assets: | ||||||||||||
| Before fee waived and expenses absorbed | 0.56 | % | 0.58 | % | 0.73 | %(e) | ||||||
| After fees waived and expenses absorbed | 0.28 | % | 0.28 | % | 0.28 | %(e) | ||||||
| Ratio of net investment income (loss) to average net assets: | ||||||||||||
| Before fees waived and expenses absorbed | 3.03 | % | 1.08 | % | (0.04 | )%(e) | ||||||
| After fees waived and expenses absorbed | 3.31 | % | 1.38 | % | 0.41 | %(e) | ||||||
| Portfolio turnover rate | 104 | % | 129 | % | 321 | %(d)(f) | ||||||
| (a) | For the period December 28, 2020 (commencement of operations) to October 31, 2021. |
| (b) | Based on average shares outstanding for the period. |
| (c) | Total returns would have been lower had expenses not been waived by the Advisor. Returns shown do not reflect the deduction of taxes that a shareholder would pay on Fund distributions or the redemption of Fund shares. |
| (d) | Not annualized. |
| (e) | Annualized. |
| (f) | Securities purchased in-kind were excluded from the computation of the ratio. |
See accompanying Notes to Financial Statements.
45
| North Square Strategic Income Fund |
| FINANCIAL HIGHLIGHTS |
| Class A Shares |
| (For a share outstanding during the period) |
| For the | ||||
| Period Ended | ||||
| October 31, | ||||
| 2023(a) | ||||
| Selected Per Share Data: | ||||
| Net asset value, beginning of period | $ | 8.85 | ||
| Investment operations: | ||||
| Net investment income(b) | 0.25 | |||
| Net realized and unrealized loss | (0.64 | ) | ||
| Total from investment operations | (0.39 | ) | ||
| Less distributions: | ||||
| Net investment income | (0.17 | ) | ||
| Return of capital | (0.08 | ) | ||
| Total distributions | (0.25 | ) | ||
| Net asset value, end of period | $ | 8.21 | ||
| Total Return(c) | (4.48 | )%(d) | ||
| Ratios and Supplemental Data: | ||||
| Net assets, end of period (in thousands) | $ | 406 | ||
| Ratio of expenses to average net assets: | ||||
| Before fee waived and expenses absorbed | 1.30 | %(e) | ||
| After fees waived and expenses absorbed | 1.15 | %(e) | ||
| Ratio of net investment income to average net assets: | ||||
| Before fees waived and expenses absorbed | 4.28 | %(e) | ||
| After fees waived and expenses absorbed | 4.41 | %(e) | ||
| Portfolio turnover rate | 152 | %(e) | ||
| (a) | For the period February 28, 2023 (commencement of operations) to October 31, 2023. |
| (b) | Based on average shares outstanding for the period. |
| (c) | Total returns would have been lower had expenses not been waived by the Advisor. Returns shown do not reflect the deduction of taxes that a shareholder would pay on Fund distributions or the redemption of Fund shares. Return does not reflect sales load. |
| (d) | Not annualized. |
| (e) | Annualized. |
See accompanying Notes to Financial Statements.
46
| North Square Strategic Income Fund |
| FINANCIAL HIGHLIGHTS |
| Class I Shares |
| (For a share outstanding during each year) |
| For the Years Ended October 31, | ||||||||||||||||||||
| 2023 | 2022 | 2021 | 2020 | 2019 | ||||||||||||||||
| Selected Per Share Data: | ||||||||||||||||||||
| Net asset value, beginning of year | $ | 8.60 | $ | 10.09 | $ | 9.99 | $ | 9.53 | $ | 8.97 | ||||||||||
| Investment operations: | ||||||||||||||||||||
| Net investment income(a) | 0.38 | 0.27 | 0.24 | 0.23 | 0.32 | |||||||||||||||
| Net realized and unrealized gain (loss) | (0.39 | ) | (1.26 | ) | 0.60 | 0.48 | 0.56 | |||||||||||||
| Total from investment operations | (0.01 | ) | (0.99 | ) | 0.84 | 0.71 | 0.88 | |||||||||||||
| Less distributions: | ||||||||||||||||||||
| Net investment income | (0.29 | ) | (0.26 | ) | (0.28 | ) | (0.25 | ) | (0.32 | ) | ||||||||||
| From net realized gains | — | (0.24 | ) | (0.46 | ) | — | — | |||||||||||||
| Return of capital | (0.08 | ) | — | — | — | — | ||||||||||||||
| Total distributions | (0.37 | ) | (0.50 | ) | (0.74 | ) | (0.25 | ) | (0.32 | ) | ||||||||||
| Paid in capital from redemption fees | — | — | — | — | — | (b) | ||||||||||||||
| Net asset value, end of year | $ | 8.22 | $ | 8.60 | $ | 10.09 | $ | 9.99 | $ | 9.53 | ||||||||||
| Total Return(c) | (0.27 | )% | (10.17 | )% | 8.63 | % | 7.56 | % | 10.00 | % | ||||||||||
| Ratios and Supplemental Data: | ||||||||||||||||||||
| Net assets, end of year (in thousands) | $ | 142,420 | $ | 113,625 | $ | 79,460 | $ | 74,287 | $ | 10,641 | ||||||||||
| Ratio of expenses to average net assets: | ||||||||||||||||||||
| Before fee waived and expenses absorbed | 1.05 | % | 1.14 | % | 1.28 | % | 1.48 | % | 1.76 | % | ||||||||||
| After fees waived and expenses absorbed | 0.90 | % | 0.90 | % | 0.90 | % | 0.90 | % | 0.90 | % | ||||||||||
| Ratio of net investment income to average net assets: | ||||||||||||||||||||
| Before fees waived and expenses absorbed | 4.17 | % | 2.63 | % | 2.06 | % | 1.75 | % | 2.56 | % | ||||||||||
| After fees waived and expenses absorbed | 4.32 | % | 2.87 | % | 2.44 | % | 2.33 | % | 3.42 | % | ||||||||||
| Portfolio turnover rate | 152 | % | 163 | % | 77 | % | 145 | % | 36 | % | ||||||||||
| (a) | Based on average shares outstanding for the period. |
| (b) | Rounds to less than $0.005 per share. |
| (c) | Total returns would have been lower had expenses not been waived by the Advisor. Returns shown do not reflect the deduction of taxes that a shareholder would pay on Fund distributions or the redemption of Fund shares. |
See accompanying Notes to Financial Statements.
47
| North Square Funds |
| NOTES TO FINANCIAL STATEMENTS |
| October 31, 2023 |
Note 1 – Organization
The North Square Advisory Research Small Cap Value Fund (“Small Cap Value” or “Small Cap Value Fund”), North Square Altrinsic International Equity Fund (“International Equity” or “International Equity Fund”), North Square McKee Bond Fund (“McKee Bond” or “McKee Bond Fund”), and North Square Strategic Income Fund (“Strategic Income” or “Strategic Income Fund”)(each a “Fund” and collectively the “Funds”) are organized as a series of the North Square Investments Trust, a Delaware statutory trust (the “Trust”) which is registered as an open-end management investment company under the Investment Company Act of 1940, as amended (the “1940 Act”). Effective January 11, 2022, the North Square Advisory Research All Cap Value Fund changed its name to the North Square Advisory Research Small Cap Value Fund. The Funds are diversified funds.
The Small Cap Value Fund’s primary investment objective is to seek long-term capital appreciation. Effective as of the close of business on February 21, 2020, the Small Cap Value Fund (the “Successor Fund”) acquired the assets and assumed the liabilities of the Advisory Research Small Cap Value Fund (the “Predecessor Fund”), a series of Investment Managers Series Trust, which commenced operations on November 16, 2009.
The International Equity Fund’s primary investment objective is to provide long-term growth of capital. The Fund commenced operations on December 4, 2020.
The McKee Bond Fund’s primary investment objective is to maximize total return and generate consistent outperformance of the Fund’s benchmark, the Bloomberg Intermediate Aggregate Bond Index, with a high quality and highly liquid, well diversified portfolio through opportunistic, risk-controlled management. The Fund’s Class I shares commenced operations on December 28, 2020 and Class Y shares commenced operations on May 19, 2021. Effective on December 1, 2021, the outstanding Class Y shares of the McKee Bond Fund were renamed as Class I shares, and the previously outstanding Class I shares of the Fund were renamed as Class R6 shares. The ticker symbols of the renamed classes did not change.
The Strategic Income Fund’s primary investment objectives are to seek high current income and to seek long-term capital appreciation. Effective as of the close of business on February 21, 2020, the Strategic Income Fund (the “Successor Fund”) acquired the assets and assumed the liabilities of the Advisory Research Strategic Income Fund (the “Predecessor Fund”), a series of Investment Managers Series Trust, which commenced operations on December 31, 2012.
The Strategic Income Fund currently offers Class A Shares. Class A Shares have a maximum sales charge on purchases of 3.75% , as a percentage of the original purchase price, on investments less than $1,000,000. No sales charge applies on investments of $1,000,000 or more, but a Contingent Deferred Sales Charge (“CDSC”) of 1.00% may be imposed on certain redemptions of such shares that were purchased within one year of the redemption date.
Note 2 – Accounting Policies
The following is a summary of the significant accounting policies consistently followed by the Funds in the preparation of their financial statements. The preparation of financial statements in conformity with accounting principles generally accepted in the United States of America (“GAAP”) requires management to make estimates and assumptions that affect the reported amounts and disclosures in the financial statements. Actual results could differ from these estimates.
(a) Valuation of Investments
Each Fund values equity securities at the last reported sale price on the principal exchange or in the principal over the counter (“OTC”) market in which such securities are traded, as of the close of regular trading on the New York Stock Exchange (“NYSE”) on the day the securities are being valued or, if the last-quoted sales price is not readily available, the securities will be valued at the last bid or the mean between the last available bid and ask price. Securities traded on the NASDAQ are valued at the Nasdaq Official Closing Price (“NOCP”). Investments in open-end investment companies are valued at the daily closing net asset value of the respective investment company. Debt securities are valued by utilizing a price supplied by independent pricing service providers. The independent pricing service providers may use various valuation methodologies including matrix pricing and other analytical pricing models as well as market transactions and dealer quotations. These models generally consider such factors as yields or prices of bonds of comparable quality, type of issue, coupon, maturity, ratings and general market conditions. Exchange-traded options on securities and indices purchased or sold by the Funds generally will be valued at the mean of the last bid and ask prices. If a price is not readily available for a portfolio security, the security will be valued at fair value (the amount which the Fund might reasonably expect to receive for the security upon its current
48
| North Square Funds |
| NOTES TO FINANCIAL STATEMENTS – Continued |
| October 31, 2023 |
sale) as determined in good faith by North Square Investments, LLC (the “Advisor” or “NSI”), as Valuation Designee, subject to review and approval by the Valuation Committee, pursuant to procedures adopted by the Board of Trustees (the “Board”). The actions of the Valuation Committee are subsequently reviewed by the Board at its next regularly scheduled board meeting. The Valuation Committee meets as needed.
Fair value pricing may be applied to foreign securities held by the Funds upon the occurrence of an event after the close of trading on non-U.S. markets but before the close of trading on the NYSE when each Fund’s net asset value (“NAV”) is determined. If the event may result in a material adjustment to the price of the Fund’s foreign securities once non-U.S. markets open on the following business day (such as, for example, a significant surge or decline in the U.S. market), the Fund may value such foreign securities at fair value, taking into account the effect of such event, in order to calculate the Fund’s NAV. Other types of portfolio securities that the Fund may fair value include, but are not limited to: (1) investments that are illiquid or traded infrequently, including “restricted” securities and private placements for which there is no public market; (2) investments for which, in the judgment of the Advisor, the market price is stale; (3) securities of an issuer that has entered into a restructuring; (4) securities for which trading has been halted or suspended; and (5) fixed income securities for which there is not a current market value quotation.
The pricing service will use a statistical analyses and quantitative models to adjust local prices using factors such as subsequent movement and changes in the prices of indexes, securities and exchange rates in other markets in determining fair value as of the time the Fund calculates the NAVs. The Board receives a report on all securities that were fair valued by the Advisor during the quarter.
In December 2020, the Securities and Exchange Commission (the “SEC”) adopted a new rule providing a framework for fund valuation practices (“Rule 2a-5”). Rule 2a-5 establishes requirements for determining fair value in good faith for purposes of the 1940 Act. Rule 2a-5 permits fund boards to designate certain parties to perform fair value determinations, subject to board oversight and certain other conditions. Rule 2a-5 also defines when market quotations are “readily available” for purposes of the 1940 Act and the threshold for determining whether a fund must fair value a security. In connection with Rule 2a-5, the SEC also adopted related recordkeeping requirements and rescinded previously issued guidance, including with respect to the role of a board in determining fair value and the accounting and auditing of fund investments. The Funds are in compliance with Rule 2a-5, which had a compliance date of September 8, 2022.
(b) Purchased/Written Option Contracts
The Funds may write or purchase option contracts to adjust risk and return of its overall investment positions. When the Fund writes or purchases an option, an amount equal to the premium received or paid by the Fund is recorded as a liability or an asset and is subsequently adjusted to the current market value of the option written or purchased. Premiums received or paid from writing or purchasing options that expire unexercised are treated by the Fund on the expiration date as realized gains or losses. The difference between the premium and the amount paid or received on affecting a closing purchase or sale transaction, including brokerage commissions, is also treated as a realized gain or loss. If an option is exercised, the premium paid or received is added to or subtracted from the cost of the purchase or proceeds from the sale in determining whether the Fund has realized a gain or loss on investment transactions. Investing in purchased and written options contracts exposes the Fund to equity price risk. The Strategic Income Fund engaged in option contracts. Additional information regarding such activity may be found in Note 10.
(c) Futures Contracts
The Funds may invest in futures contracts to hedge or manage risks associated with the Funds’ securities investments or to obtain market exposure in an effort to generate returns. During the period the futures contracts are open, changes in the value of the contracts are recognized as unrealized gains or losses by “marking to market” on a daily basis to reflect the market value of the contracts at the end of each day’s trading. Variation margin payments are received or made depending upon whether unrealized gains or losses are incurred. When the contracts are closed, the Fund recognizes a realized gain or loss equal to the difference between the proceeds from, or cost of, the closing transaction and the Fund’s basis in the contract. If the Fund is unable to liquidate a futures contract and/or enter into an offsetting closing transaction, the Fund would continue to be subject to market risk with respect to the value of the contracts. The Strategic Income Fund engaged in futures contracts. Additional information regarding such activity may be found in Note 10.
49
| North Square Funds |
| NOTES TO FINANCIAL STATEMENTS – Continued |
| October 31, 2023 |
(d) Deposits with Broker
When trading derivative instruments, such as forward or futures contracts, the Funds are only required to post initial or variation margin with the exchange or clearing broker. The use of margin in trading these instruments has the effect of creating leverage, which can expose the Funds to substantial gains or losses occurring from relatively small price changes in the value of the underlying instrument and can increase the volatility of the Funds’ returns. Volatility is a statistical measure of the dispersion of returns of an investment, where higher volatility generally indicates greater risk.
Upon entering into a futures contract (with the exception of futures contracts traded on the London Metal Exchange (“LME”)), and to maintain the Fund’s open positions in futures contracts, the Fund would be required to deposit with its custodian or futures broker in a segregated account in the name of the futures broker an amount of cash, U.S. government securities, suitable money market instruments, or other liquid securities, known as “initial margin.” The margin required for a particular futures contract is set by the exchange on which the contract is traded, and may be significantly modified from time to time by the exchange during the term of the contract. Futures contracts are customarily purchased and sold on margins that may range upward from less than 5% of the value of the contract being traded. At October 31, 2023, the Strategic Income Fund had $1,273,833 cash and cash equivalents on deposit with brokers for futures.
(e) Investment Transactions, Investment Income and Expenses
Investment transactions are accounted for on the trade date. Realized gains and losses on investments are determined on the identified cost basis. Dividend income is recorded net of applicable withholding taxes on the ex-dividend date and interest income is recorded on an accrual basis. Withholding taxes on foreign dividends, if applicable, are paid (a portion of which may be reclaimable) or provided for in accordance with the applicable country’s tax rules and rates and are disclosed in the Statements of Operations. Withholding tax reclaims are filed in certain countries to recover a portion of the amounts previously withheld. The Funds record a reclaim receivable based on a number of factors, including a jurisdiction’s legal obligation to pay reclaims as well as payment history and market convention. Discounts or premiums on debt securities are accreted or amortized to interest income over the lives of the respective securities using the effective interest method. Income and expenses of the Funds are allocated on a pro rata basis to each class of shares. Expenses incurred by the Trust with respect to more than one fund are allocated in proportion to the net assets of each fund except where allocation of direct expenses to each fund or an alternative allocation method can be more appropriately made. Expenses such as distribution and service fees pursuant to Rule 12b-1, transfer agent fees and expenses with respect to the Funds, that are specific to individual share classes, are accrued directly to the respective share class.
(f) Federal Income Taxes
Each Fund intends to comply with the requirements of Subchapter M of the Internal Revenue Code applicable to regulated investment companies and to distribute substantially all of its net investment income and any net realized gains to its shareholders. Therefore, no provision is made for federal income or excise taxes. Due to the timing of dividend distributions and the differences in accounting for income and realized gains and losses for financial statement and federal income tax purposes, the fiscal year in which amounts are distributed may differ from the year in which the income and realized gains and losses are recorded by the Funds.
Accounting for Uncertainty in Income Taxes (the “Income Tax Statement”) requires an evaluation of tax positions taken (or expected to be taken) in the course of preparing a Fund’s tax returns to determine whether these positions meet a “more-likely-than-not” standard that, based on the technical merits, have a more than fifty percent likelihood of being sustained by a taxing authority upon examination. A tax position that meets the “more-likely-than-not” recognition threshold is measured to determine the amount of benefit to recognize in the financial statements. Each Fund recognizes interest and penalties, if any, related to unrecognized tax benefits as income tax expense in the Statement of Operations.
The Income Tax Statement requires management of the Funds to analyze tax positions taken in the prior three open tax years, if any, and tax positions expected to be taken in the Funds’ current tax year, as defined by the IRS statute of limitations for all major jurisdictions, including federal tax authorities and certain state tax authorities. As of and during the previous three tax year ends and the interim tax period since then, the Funds did not have a liability for any unrecognized tax benefits. The Funds have no examination in progress and are not aware of any tax positions for which it is reasonably possible that the total amounts of unrecognized tax benefits will significantly change in the next twelve months.
The Funds may utilize deemed dividends on redemptions accounting for tax purposes and designate earnings and profits, including net realized gains distributed to shareholders on redemption of shares, as part of the dividends paid deduction for income tax purposes.
50
| North Square Funds |
| NOTES TO FINANCIAL STATEMENTS – Continued |
| October 31, 2023 |
(g) Distributions to Shareholders
The McKee Bond Fund and Strategic Income Fund will make distributions of net investment income monthly. The Advisory Research Small Cap Value Fund and Altrinsic International Equity Fund will make distributions of net investment income, if any, at least annually. Each Fund makes distributions of its net capital gains, if any, at least annually. Distributions to shareholders are recorded on the ex-dividend date. The amount and timing of distributions are determined in accordance with federal income tax regulations, which may differ from GAAP.
The character of distributions made during the year from net investment income or net realized gains may differ from the characterization for federal income tax purposes due to differences in the recognition of income, expense and gain (loss) items for financial statement and tax purposes.
(h) Line of Credit
U.S. Bank, N.A. has made available to the Funds an unsecured line of credit pursuant to a Loan Agreement for the Trust, expiring on June 12, 2024. The line of credit is intended to provide short-term financing, if necessary, subject to certain restrictions, in connection with shareholder redemptions. The Trust may borrow up to the lesser of $50,000,000 or 15% of each Fund’s daily market value (10% for Small Cap Value Fund).
The interest rate paid by the Funds on outstanding borrowings is equal to the Prime Rate. As of October 31, 2023, the Prime Rate was 8.50%. During the year ended October 31, 2023, Strategic Income Fund had two draws on the line of credit for one day each in the amount of $2,098,000 at 8.50% and 628,000 at 8.50%, respectively, and the McKee Bond Fund had one draw on the line of credit for four days in the amount of $4,815,000 at 7.75%.
Note 3 – Investment Advisory and Other Agreements
The Trust, on behalf of the Funds, entered into an Investment Advisory Agreement (the “Agreement”) with the Advisor. Under the terms of the Agreement, the Funds pay a monthly investment advisory fee to the Advisor based on each Fund’s average daily net assets. Fees paid to the Advisor for the period ended October 31, 2023 are reported on the Statements of Operations. The annual rates are listed by Fund in the below table:
| Investment | ||
| Advisory Fees | ||
| Small Cap Value Fund | 0.70% | |
| International Equity Fund | 0.80% | |
| McKee Bond Fund | 0.24% | |
| Strategic Income Fund | 0.70% |
The Advisor engages Advisory Research, Inc. to manage the Small Cap Value Fund, Altrinsic Global Advisors, LLC to manage the International Equity Fund, CSM Advisors, LLC to manage the McKee Bond Fund, and Red Cedar Investment Management, LLC to manage the Strategic Income Fund (each a “Sub Advisor” and collectively the “Sub Advisors”). The Advisor pays the Sub Advisors from its advisory fees.
The Advisor has contractually agreed to waive its fee and, if necessary, to absorb other operating expenses to ensure that total annual operating expenses (excluding taxes, leverage interest, brokerage commissions, dividend and interest expenses on short sales, acquired fund fees and expenses as determined in accordance with Form N-1A, expenses incurred in connection with any merger or reorganization,
51
| North Square Funds |
| NOTES TO FINANCIAL STATEMENTS – Continued |
| October 31, 2023 |
or extraordinary expenses such as litigation expenses) are limited. The agreements are effective until the dates listed below and may be terminated before those dates only by the Board. The table below contains the agreement expiration and expense cap by Fund and by Class:
| Total Limit on Annual Operating Expenses* | ||||||||
| Class A | Class I | Class R6 | ||||||
| Agreement Expires | Shares | Shares | Shares | |||||
| Small Cap Value Fund | February 28, 2025 | — | 0.94% | — | ||||
| International Equity Fund | February 28, 2025 | — | 0.97% | — | ||||
| McKee Bond Fund | February 28, 2025 | — | 0.47% | 0.28% | ||||
| Strategic Income Fund | February 28, 2025 | 1.15% | 0.90% | — | ||||
| * | The total limit on annual operating expenses is calculated based on each Fund’s average daily net assets. |
The Advisor is permitted to seek reimbursement from the Funds, subject to certain limitations, of fees waived or payments made to the Funds for a period ending thirty-six months after the date of the waiver or payment. This reimbursement may be requested from the Funds if the reimbursement will not cause the Funds’ annual expense ratio to exceed the lesser of (a) the expense limitation amount in effect at the time such fees were waived or payments made, or (b) the expense limitation amount in effect at the time of the reimbursement. The Advisor may recapture all or a portion of this amount no later than the dates stated below:
| Small Cap | International | McKee | Strategic | |||||||||||||
| Value | Equity | Bond | Income | |||||||||||||
| October 31, 2024 | $ | 41,637 | $ | 124,314 | $ | 245,202 | $ | 296,122 | ||||||||
| October 31, 2025 | 58,446 | 185,085 | 380,908 | 235,391 | ||||||||||||
| October 31, 2026 | 60,005 | 185,890 | 292,672 | 232,600 | ||||||||||||
Ultimus Fund Solutions, LLC (the “Administrator”) serves as the Funds’ fund accountant, transfer agent and administrator. Prior to May 8, 2023 U.S. Bank Global Fund Services provided administrative, transfer agent and fund accounting services to the Funds. The Funds’ allocated fees incurred for fund accounting, transfer agency and fund administration for the fiscal year ended October 31, 2023 are reported on the Statements of Operations.
Compass Distributors, LLC serves as the Funds’ distributor (the “Distributor”). The Distributor does not receive compensation from the Funds for its distribution services; the Advisor pays the Distributor a fee for its distribution related services.
Northern Lights Compliance Services, LLC (“NLCS”), an affiliate of the Administrator, provides a Chief Compliance Officer to the Trust, as well as related compliance services pursuant to a consulting agreement between NLCS and the Trust. Prior to May 8, 2023, ACA Group provided Chief Compliance Officer services to the Trust. The Funds’ allocated fees incurred for compliance services for the fiscal year ended October 31 2023, are reported on the Statements of Operations.
Each Independent Trustee receives from the Trust an annual retainer of $55,000, plus $5,000 for each regularly scheduled Board meeting attended, $5,000 for each special in-person meeting attended and $2,500 for each special telephonic meeting attended, plus reimbursement of related expenses. The Chairman of the Board receives an additional annual retainer of $10,000, and each of the Chairs of the Audit Committee and the Governance Committee receives an additional annual retainer of $5,000, respectively.
Certain officers and a Trustee of the Trust are also employees of the Administrator or NLCS and such persons are not paid by the Funds for serving in such capacities.
52
| North Square Funds |
| NOTES TO FINANCIAL STATEMENTS – Continued |
| October 31, 2023 |
Note 4 – Federal Income Taxes
At October 31, 2023, gross unrealized appreciation and depreciation of investments, based on cost for federal income tax purposes were as follows:
| Small Cap Value | International | McKee Bond | Strategic Income | |||||||||||||
| Fund | Equity Fund | Fund | Fund | |||||||||||||
| Tax cost of investments | $ | 18,169,179 | $ | 110,988,538 | $ | 113,402,974 | $ | 144,017,313 | ||||||||
| Gross unrealized appreciation | 1,068,619 | 5,435,283 | 13,390 | 1,796,472 | ||||||||||||
| Gross unrealized depreciation | (2,163,794 | ) | (9,019,364 | ) | (12,898,751 | ) | (6,321,191 | ) | ||||||||
| Net unrealized appreciation (depreciation) on investments | $ | (1,095,175 | ) | $ | (3,584,081 | ) | $ | (12,885,361 | ) | $ | (4,524,719 | ) | ||||
The difference between cost amounts for financial statement and federal income tax purposes is due primarily to timing differences in recognizing certain gains and losses in security transactions.
GAAP requires that certain components of net assets be reclassified between financial and tax reporting. These reclassifications have no effect on net assets or net asset value per share. For the fiscal year ended October 31, 2023, the Funds did not make any reclassifications.
As of October 31, 2023, the components of accumulated earnings (deficit) on a tax basis for the Funds were as follows:
| Small Cap Value | International | McKee Bond | Strategic Income | |||||||||||||
| Fund | Equity Fund | Fund | Fund | |||||||||||||
| Undistributed ordinary income | $ | 154,846 | $ | 1,665,057 | $ | 66,585 | $ | — | ||||||||
| Accumulated Capital and Other Losses | (1,588,366 | ) | (619,268 | ) | (10,449,354 | ) | (12,700,863 | ) | ||||||||
| Other Temporary Difference | — | — | — | 745,560 | ||||||||||||
| Unrealized appreciation on investments | (1,095,175 | ) | (3,594,892 | ) | (12,885,361 | ) | (4,524,719 | ) | ||||||||
| Total accumulated earnings | $ | (2,528,695 | ) | $ | (2,549,103 | ) | $ | (23,268,130 | ) | $ | (16,480,022 | ) | ||||
The tax character of distributions paid for the fiscal years ended October 31, 2023 and October 31, 2022 were as follows:
| Small Cap Value Fund | International Equity Fund | |||||||||||||||
| 2023 | 2022 | 2023 | 2022 | |||||||||||||
| Distributions paid from: | ||||||||||||||||
| Ordinary income | $ | 22,216 | $ | 86,927 | $ | 1,012,568 | $ | 831,136 | ||||||||
| Long-term capital gains | 1,276,492 | 640,604 | — | — | ||||||||||||
| Total distributions paid | $ | 1,298,708 | $ | 727,531 | $ | 1,012,568 | $ | 831,136 | ||||||||
| McKee Bond Fund | Strategic Income Fund | |||||||||||||||
| 2023 | 2022 | 2023 | 2022 | |||||||||||||
| Distributions paid from: | ||||||||||||||||
| Ordinary income | $ | 3,558,154 | $ | 2,113,839 | $ | 5,226,310 | $ | 4,180,402 | ||||||||
| Long-term capital gains | — | — | — | 558,231 | ||||||||||||
| Return of capital | — | — | 1,447,887 | — | ||||||||||||
| Total distributions paid | $ | 3,558,154 | $ | 2,113,839 | $ | 6,674,197 | $ | 4,738,633 | ||||||||
53
| North Square Funds |
| NOTES TO FINANCIAL STATEMENTS – Continued |
| October 31, 2023 |
As of October 31, 2023, the following Funds have nonexpiring capital loss carryforwards:
| Short-Term | Long-Term | |||||||
| Small Cap Value Fund | $ | 789,170 | $ | 799,196 | ||||
| International Equity Fund | $ | 501,955 | $ | 117,313 | ||||
| McKee Bond Fund | $ | 6,190,957 | $ | 4,258,397 | ||||
| Strategic Income Fund | $ | 8,498,296 | $ | 4,202,567 | ||||
To the extent that a Fund may realize future net capital gains, those gains will be offset by any of its unused capital loss carryforward.
Future capital loss carryover utilization in any given year may be subject to Internal Revenue Code limitations. For the fiscal year ended October 31, 2023, the International Equity Fund utilized $799,032 of available capital loss carryforwards.
Note 5 – Investment Transactions
For the fiscal year ended October 31, 2023, purchases and sales of investments were as follows:
| Purchases | Sales | |||||||
| Small Cap Value Fund | $ | 8,721,136 | $ | 11,609,633 | ||||
| International Equity Fund | 58,837,973 | 23,853,196 | ||||||
| McKee Bond Fund | 67,288,073 | 65,520,627 | ||||||
| Strategic Income Fund | 179,310,959 | 122,402,784 | ||||||
For the fiscal year ended October 31 2023, the McKee Bond Fund had purchases and sales of long-term U.S. government obligations of $26,653,785 and $26,629,549, respectively, and the Strategic Income Fund had purchases and sales of long-term U.S. government obligations of $11,364,763 and $34,909,607, respectively. Long-term purchases and sales of U.S. Government Obligations are excluded from purchases and sales of investments.
Note 6 – Shareholder Servicing Plan
The Trust, on behalf of the Funds, has adopted a Shareholder Service Plan (the “Shareholder Service Plan”) with respect to each of the Fund’s Class A shares, Class I, and Class R6 shares, as applicable. Under the Shareholder Service Plan, the Funds may pay a fee at an annual rate of up to 0.15% of its average daily net assets attributable to Class A shares, Class I shares, and Class R6 shares, as applicable, to shareholder servicing agents. Shareholder servicing agents provide non-distribution administrative and support services to their customers, which may include establishing and maintaining accounts and records relating to shareholders, processing dividend and distribution payments from the Funds on behalf of shareholders, responding to routine inquiries from shareholders concerning their investments, assisting shareholders in changing dividend options, account designations and addresses, and other similar services.
For the fiscal year ended October 31, 2023, shareholder servicing fees incurred are disclosed on the Statements of Operations.
Note 7 – Distribution Plan
The Trust, on behalf of each Fund, has adopted a Distribution Plan (the “Plan”) pursuant to Rule 12b-1 under the 1940 Act that allows each Fund to pay distribution fees for the sale and distribution of its Class A shares. The Plan provides for the payment of distribution fees at the annual rate of up to 0.25% of each Fund’s average daily net assets attributable to Class A shares.
For the fiscal year ended October 31, 2023, distribution fees incurred with respect to Class A shares are disclosed on the Statements of Operations.
Note 8 – Indemnifications
In the normal course of business, the Funds enter into contracts that contain a variety of representations which provide general indemnifications. The Funds’ maximum exposure under these arrangements is unknown, as this would involve future claims that may be made against the Funds that have not yet occurred. However, the Funds expect the risk of loss to be remote.
54
| North Square Funds |
| NOTES TO FINANCIAL STATEMENTS – Continued |
| October 31, 2023 |
Note 9 – Fair Value Measurements and Disclosure
Fair Value Measurements and Disclosures defines fair value, establishes a framework for measuring fair value in accordance with GAAP, and expands disclosure about fair value measurements. It also provides guidance on determining when there has been a significant decrease in the volume and level of activity for an asset or a liability, when a transaction is not orderly, and how that information must be incorporated into a fair value measurement.
Under Fair Value Measurements and Disclosures, various inputs are used in determining the value of the Funds’ investments. These inputs are summarized into three broad Levels as described below:
| ● | Level 1 – Unadjusted quoted prices in active markets for identical assets or liabilities that the Fund has the ability to access. |
| ● | Level 2 – Observable inputs other than quoted prices included in Level 1 that are observable for the asset or liability, either directly or indirectly. These inputs may include quoted prices for the identical instrument on an inactive market, prices for similar instruments, interest rates, prepayment speeds, credit risk, yield curves, default rates and similar data. |
| ● | Level 3 – Unobservable inputs for the asset or liability, to the extent relevant observable inputs are not available, representing the Fund’s own assumptions about the assumptions a market participant would use in valuing the asset or liability, and would be based on the best information available. |
Futures contracts are carried at fair value using the primary exchange’s closing (settlement) price and are generally categorized in Level 1.
The availability of observable inputs can vary from security to security and is affected by a wide variety of factors, including for example, the type of security, whether the security is new and not yet established in the marketplace, the liquidity of markets, and other characteristics particular to the security. To the extent that valuation is based on models or inputs that are less observable or unobservable in the market, the determination of fair value requires more judgment. Accordingly, the degree of judgment exercised in determining fair value is greatest for instruments categorized in Level 3.
The inputs to measure fair value may fall into different Levels of the fair value hierarchy. In such cases, for disclosure purposes, the Level in the fair value hierarchy within which the fair value measurement falls in its entirety, is determined based on the lowest Level input that is significant to the fair value measurement in its entirety.
The inputs or methodology used for valuing securities are not an indication of the risk associated with investing in those securities. The following is a summary of the inputs used, as of October 31, 2023, in valuing the Funds’ assets carried at fair value:
| Small Cap Value Fund | Valuation Inputs | |||||||||||||||
| Investments | Level 1 | Level 2 | Level 3 | Total | ||||||||||||
| Common Stocks (a) | $ | 16,843,531 | $ | — | $ | — | $ | 16,843,531 | ||||||||
| Short-Term Investments | 230,473 | — | — | 230,473 | ||||||||||||
| Total | $ | 17,074,004 | $ | — | $ | — | $ | 17,074,004 | ||||||||
| International Equity Fund | ||||||||||||||||
| Investments | Level 1 | Level 2 | Level 3 | Total | ||||||||||||
| Common Stocks | $ | 32,820,265 | $ | 66,533,553 | $ | — | $ | 99,353,818 | ||||||||
| Preferred Stocks | 1,435,609 | 1,113,268 | — | 2,548,877 | ||||||||||||
| Short-Term Investments | 5,501,762 | — | — | 5,501,762 | ||||||||||||
| Total | $ | 39,757,636 | $ | 67,646,821 | $ | — | $ | 107,404,457 | ||||||||
55
| North Square Funds |
| NOTES TO FINANCIAL STATEMENTS – Continued |
| October 31, 2023 |
| McKee Bond Fund | ||||||||||||||||
| Investments | Level 1 | Level 2 | Level 3 | Total | ||||||||||||
| Asset Backed Securities | $ | — | $ | 4,146,546 | $ | — | $ | 4,146,546 | ||||||||
| Corporate Bonds(a) | — | 28,279,404 | — | 28,279,404 | ||||||||||||
| Mortgage-Backed Securities | — | 59,730,195 | — | 59,730,195 | ||||||||||||
| Non-U.S. Government & Agencies | — | 1,908,588 | — | 1,908,588 | ||||||||||||
| U.S. Government & Agencies | — | 3,897,742 | — | 3,897,742 | ||||||||||||
| Short-Term Investments | 2,555,138 | — | — | 2,555,138 | ||||||||||||
| Total | $ | 2,555,138 | $ | 97,962,475 | $ | — | $ | 100,517,613 | ||||||||
| Strategic Income Fund | ||||||||||||||||
| Investments | Level 1 | Level 2 | Level 3 | Total | ||||||||||||
| Common Stocks(a) | $ | 11,414,647 | $ | — | $ | — | $ | 11,414,647 | ||||||||
| Asset Backed Securities | — | 10,281,777 | — | 10,281,777 | ||||||||||||
| Corporate Bonds(a) | — | 73,038,295 | — | 73,038,295 | ||||||||||||
| Mortgage-Backed Securities | — | 39,359,765 | — | 39,359,765 | ||||||||||||
| Purchased Options | — | 327,500 | — | 327,500 | ||||||||||||
| Short-Term Investments | 5,220,610 | — | — | 5,220,610 | ||||||||||||
| Total | $ | 16,635,257 | $ | 123,007,337 | $ | — | $ | 139,642,594 | ||||||||
| Futures Contracts(b) | ||||||||||||||||
| Asset | $ | 646,363 | $ | — | $ | — | $ | 646,363 | ||||||||
| Liabilities | (1,021,585 | ) | — | — | (1,021,585 | ) | ||||||||||
| Total | $ | (375,222 | ) | $ | — | $ | — | $ | (375,222 | ) | ||||||
| (a) | Refer to Schedule of Investments for sector and industry classifications. |
| (b) | The amount shown represents the net unrealized appreciation/depreciation of the futures contracts. |
Note 10 – Derivative and Other Financial Instruments
At October 31, 2023, the Strategic Income Fund held derivative and other financial instruments which are not subject to a master netting arrangement. As the tables below illustrate, no positions are netted in the Fund’s financial statements:
The following table provides a summary of offsetting financial liabilities and derivatives and the effect of derivative instruments on the Statement of Assets and Liabilities as of October 31, 2023:
| Gross Amounts not offset in the | ||||||||||||||||||||||||
| Statement of Assets and Liabilities | ||||||||||||||||||||||||
| Gross Amounts | Net Amounts | |||||||||||||||||||||||
| Offset in the | Presented in | |||||||||||||||||||||||
| Gross Amounts | Statement of | the Statements | Collateral | |||||||||||||||||||||
| of Recognized | Assets and | of Assets and | Financial | Received | ||||||||||||||||||||
| Description | Liabilities | Liabilities | Liabilities | Instruments | (Pledged) | Net Amount | ||||||||||||||||||
| Futures contracts* | $ | 132,325 | $ | — | $ | 132,325 | $ | — | $ | 132,325 | $ | — | ||||||||||||
| Total | 132,325 | — | 132,325 | — | 132,325 | — | ||||||||||||||||||
| * | Reflects the current day variation margin as reported on the Fund’s statement of assets and liabilities. |
56
| North Square Funds |
| NOTES TO FINANCIAL STATEMENTS – Continued |
| October 31, 2023 |
The following table presents the fair value of derivative instruments for the Strategic Income Fund as of October 31, 2023 as presented on the Fund’s Statement of Assets and Liabilities:
Location of Derivatives on Statement of Assets and Liabilities
| Derivatives | Asset Derivatives | Liability Derivatives | Fair Value | |||||
| Equity Price Risk: | ||||||||
| Purchased Options | Investments, at value | $ | 327,500 | |||||
| Futures | Payable for net variation margin on futures contracts | 132,325 | ||||||
The following table presents the results of the derivative trading and information related to volume for the fiscal year ended October 31, 2023 for the Strategic Income Fund. The below captions of “Net Realized” and “Net Change in Unrealized” correspond to the captions in the Fund’s Statement of Operations.
| Change in Unrealized | ||||||||||
| Realized | Appreciation | |||||||||
| Location of Gain (Loss) on Derivatives on | Gain (Loss) on | (Depreciation) on | ||||||||
| Derivatives | Statement of Operations | Derivatives | Derivatives | |||||||
| Equity Price Risk: | ||||||||||
| Purchased Options | Net realized gain (loss) and change in unrealized appreciation (depreciation) on purchased options | $ | (222,045 | ) | $ | 139,392 | ||||
| Futures | Net realized gain and change in unrealized appreciation (depreciation) on futures | (5,724,200 | ) | 525,712 | ||||||
The average monthly notional/market value amount is shown as an indicator of volume. The average monthly notional/market value amounts held in the Strategic Income Fund during the fiscal year ended October 31, 2023 were:
| Average Ending | ||||
| Derivatives | Monthly Market Value | |||
| Purchased Options | $ | 403,646 | ||
| Average Ending | ||||
| Derivatives | Monthly Notional | |||
| Futures | $ | 37,834,201 | ||
Note 11 – Accounting Regulations
London Interbank Offered Rate (“LIBOR”)
In March 2020, Financial Accounting Standards Board (“FASB”) issued ASU 2020-04, Reference Rate Reform: Facilitation of the Effects of Reference Rate Reform on Financial Reporting. The main objective of the new guidance is to provide relief to companies that will be impacted by the expected change in benchmark interest rates at the end of 2021, when participating banks will no longer be required to submit LIBOR quotes by the UK Financial Conduct Authority. The new guidance allows companies to, provided the only change to existing contracts are a change to an approved benchmark interest rate, account for modifications as a continuance of the existing contract without additional analysis. In addition, derivative contracts that qualified for hedge accounting prior to modification, will be allowed to continue to receive such treatment, even if critical terms change due to a change in the benchmark interest rate. For new and existing contracts, the Funds may elect to apply the amendments as of March 12, 2020 through December 31, 2022. Management has concluded that the the impact of the ASU’s adoption to the Funds’ financial statements and filings is insignificant.
57
| North Square Funds |
| NOTES TO FINANCIAL STATEMENTS – Continued |
| October 31, 2023 |
Topic 820
In June 2022, the FASB issued ASU 2022-03, “Fair Value Measurement (Topic 820): Fair Value Measurement of Equity Securities Subject to Contractual Sale Restrictions.” The ASU clarifies that a contractual restriction on the sale of an equity security is not considered part of the unit of account of the equity security and, therefore, is not considered in measuring the fair value. The amendments also require additional disclosures related to equity securities subject to contractual sale restrictions. The ASU is effective for fiscal years beginning after December 15, 2023 and interim periods within those fiscal years. Management is evaluating the implications of this guidance to future financial statements.
Regulatory Update
Tailored Shareholder Reports for Mutual Funds and Exchange-Traded Funds (“ETFs”) Effective January 24, 2023, the SEC adopted rule and form amendments to require mutual funds and ETFs to transmit concise and visually engaging streamlined annual and semiannual reports to shareholders that highlight key information. Other information, including financial statements, will no longer appear in a streamlined shareholder report but must be available online, delivered free of charge upon request, and filed on a semiannual basis on Form N-CSR. The rule and form amendments have a compliance date of July 24, 2024. At this time, management is evaluating the impact of these amendments on the shareholder reports for the Funds.
Note 12 – Events Subsequent to the Fiscal Period End
The Funds have adopted financial reporting rules regarding subsequent events which require an entity to recognize in the financial statements the effects of all subsequent events that provide additional evidence about conditions that existed at the date of the balance sheet. Management has evaluated the Funds’ related events and transactions that occurred through the date of issuance of the Funds’ financial statements.
On December 22, 2023, the Funds paid income distributions, as described below, to shareholders of record on December 21, 2023:
| Small Cap Value Fund - Class I Shares | $ | 0.0972 | ||
| International Equity Fund - Class I Shares | $ | 0.1717 | ||
| McKee Bond Fund - Class I Shares | $ | 0.0321 | ||
| McKee Bond Fund - Class R6 Shares | $ | 0.0322 | ||
| Strategic Income Fund - Class A Shares | $ | 0.0275 | ||
| Strategic Income Fund - Class I Shares | $ | 0.0302 |
58
REPORT OF INDEPENDENT REGISTERED PUBLIC ACCOUNTING FIRM
To the Shareholders and Board of Trustees of
North Square Investments Trust
Opinion on the Financial Statements
We have audited the accompanying statements of assets and liabilities, including the schedules of investments and futures contracts of North Square Advisory Research Small Cap Value Fund, North Square Altrinsic International Equity Fund, North Square McKee Bond Fund, and North Square Strategic Income Fund (the “Funds”), each a series of North Square Investments Trust, as of October 31, 2023, the related statements of operations and changes in net assets, the related notes, and the financial highlights for the year then ended (collectively referred to as the “financial statements”). In our opinion, the financial statements present fairly, in all material respects, the financial position of each of the Funds as of October 31, 2023, the results of their operations, the changes in net assets, and the financial highlights for the year then ended, in conformity with accounting principles generally accepted in the United States of America.
The Funds’ financial statements and financial highlights for the years ended October 31, 2022, and prior, were audited by other auditors whose report dated December 30, 2022, expressed an unqualified opinion on those financial statements and financial highlights.
Basis for Opinion
These financial statements are the responsibility of the Funds’ management. Our responsibility is to express an opinion on the Funds’ financial statements based on our audits. We are a public accounting firm registered with the Public Company Accounting Oversight Board (United States) (“PCAOB”) and are required to be independent with respect to the Funds in accordance with the U.S. federal securities laws and the applicable rules and regulations of the Securities and Exchange Commission and the PCAOB.
We conducted our audits in accordance with the standards of the PCAOB. Those standards require that we plan and perform the audits to obtain reasonable assurance about whether the financial statements are free of material misstatement whether due to error or fraud.
Our audits included performing procedures to assess the risks of material misstatement of the financial statements, whether due to error or fraud, and performing procedures that respond to those risks. Such procedures included examining, on a test basis, evidence regarding the amounts and disclosures in the financial statements. Our procedures included confirmation of securities owned as of October 31, 2023, by correspondence with the custodian and brokers; when replies were not received from brokers, we performed other auditing procedures. Our audits also included evaluating the accounting principles used and significant estimates made by management, as well as evaluating the overall presentation of the financial statements. We believe that our audits provide a reasonable basis for our opinion.
We have served as the Funds’ auditor since 2023.
COHEN & COMPANY, LTD.
Cleveland, Ohio
December 30, 2023
59
| North Square Funds |
| SUPPLEMENTAL INFORMATION (Unaudited) |
Corporate Dividends Received Deduction
For corporate shareholders, the percent of ordinary income distributions qualifying for the corporate dividends received deduction for the fiscal year ended October 31, 2023 was as follows:
| Small Cap Value Fund | 100% | International Equity Fund | 100% | |||
| McKee Bond Fund | 0% | Strategic Income Fund | 1.57% |
Qualified Dividend Income
For the fiscal year ended October 31, 2023, certain dividends paid by the Funds may be subject to a maximum tax rate of 23.80%, as provided for by the Jobs and Growth Tax Relief Reconciliation Act of 2003. The percentage of dividends declared from ordinary income designated as qualified dividend income was as follows:
| Small Cap Value Fund | 100% | International Equity Fund | 0% | |||
| McKee Bond Fund | 0% | Strategic Income Fund | 1.37% |
Long-Term Capital Gain Designation
For the fiscal year ended October 31, 2023, the Funds designate a portion of distributions as 20.00% rate gain distributions for the purposed of the dividends paid deduction. The dollar amount by fund was as follows:
| Small Cap Value Fund | $ | 1,276,492 | International Equity Fund | $ | 217,872 | |||||
| McKee Bond Fund | $ | 0 | Strategic Income Fund | $ | 0 |
Foreign Tax Credit Pass Through
The International Equity Fund intends to elect to pass through to shareholders the income tax credit for taxes paid to foreign countries.
The Fund’s foreign source income per share was $0.2513 and the foreign tax expense per share was $0.0201.
60
| North Square Funds |
| SUPPLEMENTAL INFORMATION (Unaudited) – Continued |
Trustees and Officers Information
The current Trustees and officers of the Trust and their years of birth are listed below with their addresses, present positions with the Trust, term of office with the Trust and length of time served, principal occupations over at least the last five years and other directorships/ trusteeships held.
| Name, Addressa, Year of Birth and Position(s) with the Trust | Position with the Trust | Term of Office and Length of Time Servedb | Principal Occupations During the Past Five Years or Longer | Number of Portfolios in Fund Complex Overseen by Trusteec | Other Directorship/ Trusteeship Positions held by Trustee During the Past 5 Years |
| Independent Trustees | |||||
| David B. Boon (1960) | Trustee | 08/2018 to present | Chief Financial Officer and Managing Director, Eagle Capital Management, LLC (since 2018); Chief Financial Officer and Partner, Cedar Capital, LLC (2013 – 2018). | 12 | None |
| Donald J. Herrema (1952) | Chairman of the Board and Trustee | 08/2018 to present | Vice Chair and Chief Investment Officer, Independent Life Insurance Company (since 2018); Financial Services Executive, Advisor and Founder of BlackSterling Partners, LLC (private investments and advisory firm) (since 2004. | 12 | Chairman and Director Emeritus, TD Funds USA (2009 - 2019); Director, Abel Noser Holdings, LLC (since 2016); Member, USC Marshall Business School Board (since 2010); Director, FEG Investment Advisors (since 2017); Director, Independent Life Insurance Company (since 2018); and Director, Independent Insurance Group (since 2023). |
| Catherine A. Zaharis (1960) | Trustee | 08/2018 to present | Professor of Practice (since 2019), Director, Professional/ Employer Development, Finance Department (2015 - 2019), Adjunct Lecturer (2010 - 2019), and Business Director, MBA Finance Career Academy (2008 – 2015), University of Iowa, Tippie College of Business; Chair (2013 – 2016), Director (1999 – 2016), and Investment Committee Member (1999 – 2013) and Chair (2003 – 2013), University of Iowa Foundation. | 12 | Director, The Vantagepoint Funds (2015 – 2016). |
| Interested Trusteed | |||||
| Ian Martin (1968) | Trustee and President | 05/2023 to present | Executive Vice President, Chief Administrative Officer of Ultimus Fund Solutions, LLC (2019 – present); Executive Vice President (1992 – 2019), U.S. Bank Global Fund Services. | 12 | None |
61
| North Square Funds |
| SUPPLEMENTAL INFORMATION (Unaudited) – Continued |
| Name, Addressa, Year of Birth and Position(s) with the Trust | Position with the Trust | Term of Office and Length of Time Servedb | Principal Occupations During the Past Five Years or Longer | Number of Portfolios in Fund Complex Overseen by Trusteec | Other Directorship/ Trusteeship Positions held by Trustee During the Past 5 Years |
| Officers of the Trust: | |||||
| Zachary P. Richmond (1980) | Treasurer | 05/2023 to present | Vice President, Director of Financial Administration of Ultimus Fund Solutions, LLC (2015 – present). | N/A | N/A |
| Karen Jacoppo-Wood (1966) | Secretary | 05/2023 to present | Senior Vice President and Associate General Counsel of Ultimus Fund Solutions, LLC (2022 – present); Managing Director and Managing Counsel of State Street Bank and Trust Company (2019 – 2022) (Vice President and Managing Counsel from 2014 – 2019). | N/A | N/A |
| Martin R. Dean (1963) | Chief Compliance Officer | 05/2023 to present | President of Northern Lights Compliance Services, LLC (January 2023 – present); Senior Vice President, Head of Fund Compliance (2020 – January 2023) of Ultimus Fund Solutions, LLC (Vice President and Director of Fund Compliance from 2016 – 2020). | N/A | N/A |
| a. | The business address of each Trustee and officer is North Square Investments Trust, c/o Ultimus Fund Solutions, LLC, 225 Pictoria Drive, Suite 450, Cincinnati, Ohio 45246. |
| b. | Trustees and officers serve until their successors are duly elected and qualified. |
| c. | The term “Fund Complex” applies to the twelve portfolios that currently comprise the Trust. |
| d. | Mr. Martin is considered to be an “interested person” of the Trust as that term is defined in the 1940 Act by virtue of his positions with the administrator, transfer agent and fund accountant. |
62
| North Square Funds |
| SUPPLEMENTAL INFORMATION (Unaudited) – Continued |
Board Consideration of the Continuation of the Investment Advisory Agreement and Sub-Advisory Agreements and Related Agreements (North Square Advisory Research Small Cap Value Fund and North Square Strategic Income Fund)
Section 15(c) of the Investment Company Act of 1940, as amended (the “1940 Act”), requires that each mutual fund’s board of trustees, including a majority of those trustees who are not “interested persons” of the fund, as defined in the 1940 Act (the “Independent Trustees”), initially approve, and annually review and consider the continuation of, the fund’s investment advisory and sub-advisory agreements. At a meeting held on September 12-13, 2023 and continued on September 20, 2023 (the “Meeting”), the Board of Trustees (the “Board”) of North Square Investments Trust (the “Trust”), including each of the Independent Trustees, unanimously voted to approve the continuation of: (i) the investment advisory agreement (the “Advisory Agreement”) between North Square Investments, LLC (the “Adviser”) and the Trust, on behalf of the North Square Strategic Income Fund and the North Square Advisory Research Small Cap Value Fund; (ii) the investment sub-advisory agreement between the Adviser and Red Cedar Investment Management, LLC (“Red Cedar”) with respect to the North Square Strategic Income Fund and the North Square Preferred and Income Securities Fund; (iii) the investment sub-advisory agreement between the Adviser and Advisory Research, Inc. (“Advisory Research”) with respect to the North Square Advisory Research Small Cap Value Fund and the North Square Advisory Research Small Cap Growth Fund; and (iv) the investment sub-advisory agreement between the Adviser and NSI Real Advisors, LLC (“NSI Retail Advisors” and with both Red Cedar and Advisory Research, the “Sub-Advisers”) with respect to the North Square Multi Strategy Fund and the North Square Spectrum Alpha Fund. The North Square Strategic Income Fund, the North Square Preferred and Income Securities Fund, the North Square Advisory Research Small Cap Value Fund, the North Square Advisory Research Small Cap Growth Fund, the North Square Spectrum Alpha Fund, and the North Square Multi Strategy Fund are collectively referred to as the “Funds.” The Adviser and the Sub-Advisers are collectively referred to as the “Advisers.” The investment sub-advisory agreements with the Sub-Advisers are collectively referred to as the “Sub-Advisory Agreements,” and the Advisory Agreement and the Sub-Advisory Agreements are collectively referred to as the “Agreements.”
In connection with its consideration of the Agreements proposed for continuation at the Meeting, the Board requested and reviewed initial and supplemental responses from the Advisers to the Section 15(c) requests posed to the Advisers on behalf of the Independent Trustees by Independent Trustee Counsel and supporting materials relating to those questions and responses, as well as other information and data provided. In this connection, the Board reviewed and discussed various information and data that had been provided prior to the Meeting, including the Advisory Agreement, the Sub-Advisory Agreements, memoranda provided by both Fund Counsel and Independent Trustee Counsel summarizing the requirements and guidelines relevant to the Board’s consideration of the approvals of such Agreements, each Adviser’s Form ADV Part 1A, brochures and brochure supplements, profitability information, comparative information about the Funds’ performance for periods ended June 30, 2023, advisory fees and expense ratios, and other pertinent information. In addition, the Board considered such additional information as it deemed reasonably necessary, including information and data provided by the Advisers during the course of the year, to evaluate the Agreements, as applicable, with respect to each Fund. The Board reviewed and discussed the Advisers’ Section 15(c) initial and supplemental responses and discussed various questions and information with representatives of the Advisers at the Meeting. The Board also considered the materials and presentations by Trust officers and representatives of the Advisers and Sub-Advisers provided at the Meeting concerning the Agreements. Throughout the process, including at the Meeting, the Board had numerous opportunities to ask questions of, and request additional materials from, the Advisers. The Board met in executive sessions at which no representatives of management were present to consider the renewal of the Agreements and the Independent Trustees were also advised by, and met separately, in executive sessions with Independent Trustee Counsel. The Board further noted that the evaluation process with respect to the Adviser and the Sub-Advisers is an ongoing one. The Board, as noted above, also took into account information reviewed periodically throughout the year and in prior years that was relevant to its consideration of the Agreements, including performance, advisory fee and other expense information and discussions with the Funds’ portfolio managers, as well as such additional information it deemed relevant and appropriate in its judgment. The Board noted that the information received and considered by the Board in connection with the Meeting and throughout the year was both written and oral. Based on its evaluation of this information, the Board, including the Independent Trustees, unanimously approved the continuation of the Agreements for the Funds for an additional one-year period.
In determining whether to approve the continuation of the Agreements, the members of the Board reviewed and evaluated information and factors they believed to be relevant and appropriate in the exercise of their reasonable business judgment. While individual members of the Board may have weighed certain factors differently, the Board’s determination to approve the Agreements at the Meeting was based on a comprehensive consideration of all information provided to the Board with respect to the approval of the Agreements. As noted, the Board was also furnished with an analysis of its fiduciary obligations in connection with its evaluation of the Agreements and, throughout the evaluation process, the Board was assisted by Fund Counsel and Independent Trustee Counsel who, as noted above, each provided and reviewed a legal memorandum to the Board detailing the Board’s duties and responsibilities in connection with the various actions and approvals required in connection with the renewal of the Agreements. A more detailed summary of important, but not necessarily
63
| North Square Funds |
| SUPPLEMENTAL INFORMATION (Unaudited) – Continued |
all, factors the Board considered with respect to its renewal of the Agreements is provided below. The Board also considered other factors, including conditions and trends prevailing generally in the economy, the securities markets, and the industry. The Board’s conclusions may be based in part on its consideration of the advisory arrangements in prior years and on the Board’s ongoing regular review of Fund performance and operations throughout the year.
Nature, Extent and Quality of Services
The Board considered information regarding the nature, extent and quality of services being provided to the Funds by the Advisers. The Board considered, among other things, the terms of the Agreements and the range of services being provided by the Advisers. The Board noted the non-investment advisory services being provided by the Adviser, including the oversight and coordination of the Funds’ service providers and the provision of related administrative and other services. The Board also considered each Adviser’s reputation, organizational structure, resources and overall financial strength (including economic and other support provided by affiliates of the Adviser), and its willingness and commitment to consider and implement organizational and operational changes designed to enhance services to the Funds.
In addition, the Board considered the Advisers’ professional personnel who provide or will provide services to the Funds, including each Adviser’s ability and experience in attracting and retaining qualified personnel to service the Funds. The Board also considered the compliance programs and compliance records and regulatory history of the Advisers. The Board noted the Advisers’ support of the Funds’ compliance control structure, including the resources that are devoted by the Advisers in support of the Funds’ obligations pursuant to Rule 38a-1 under the 1940 Act and the efforts of the Advisers to address matters such as cybersecurity risks to invest in business continuity planning. The Board also noted that on a regular basis it received and reviewed information from the Trust’s Chief Compliance Officer (“CCO”) regarding the Funds’ compliance policies and procedures established pursuant to Rule 38a-1 under the 1940 Act, which included evaluating the regulatory compliance systems of the Advisers and procedures reasonably designed to ensure compliance with the federal securities laws. The Board also noted that it met separately, in executive session, with the CCO on a regular basis.
With respect to the Adviser, the Board considered the Funds’ ongoing and proposed operation in a “manager-of-managers” structure and reviewed the responsibilities that the Adviser has under this structure, including, but not limited to, monitoring and evaluating the performance of the Sub-Advisers, monitoring the Sub-Advisers for adherence to the stated investment objectives, strategies, policies and restrictions of the Funds, and supervising the Sub-Advisers with respect to the services that the Sub-Advisers currently provide under the Sub-Advisory Agreements. In this regard, the Board evaluated information about the nature and extent of responsibilities retained and significant risks assumed by the Adviser and not delegated to or assumed by the Sub-Advisers in connection with the services provided to the Funds, including entrepreneurial risk and ongoing risks, including investment, operational, enterprise, litigation, regulatory and compliance risks. The Board also noted increased regulatory risk which, among other things, can increase cost of operations and introduce legal and administrative challenges. The Board also considered the process used by the Adviser, consistent with this structure, to identify and recommend sub-advisers, and its ability to monitor and oversee sub-advisers and recommend replacement sub-advisers, when necessary, and provide other services under the Advisory Agreement. In addition, the Board considered its familiarity with the Adviser’s personnel obtained from the Board’s oversight of the Funds and of other funds in the Trust advised by the Adviser, as well as the affiliation between the Adviser and NSI Retail Advisors and any potential conflicts of interest.
With respect to the Sub-Advisers, which provide day-to-day portfolio management services for the Funds, subject to oversight by the Adviser, the Board considered, among other things, the quality of each Sub-Adviser’s investment personnel, its investment philosophies and processes, its investment research capabilities and resources, its financial condition, its performance record, its experience, its trade execution capabilities and its approach to managing risk. The Board also considered the experience of each Fund’s portfolio managers, the number of accounts managed by the portfolio managers, and each Sub-Adviser’s approach for compensating the portfolio managers. Moreover, the Board considered that the Adviser has the oversight responsibility for conflicts of interest relating to the Funds. In considering the nature, extent, and quality of the services provided by each of the Sub-Advisers, the Board also took into account its knowledge of each Sub-Adviser’s management and the quality of the performance of its duties as a sub-adviser, acquired through discussions and reports during the preceding year and in past years.
After consideration of the foregoing factors, among others, the Board concluded that the nature, extent and quality of services being provided or to be provided by the Adviser and the Sub-Advisers, taken as a whole, remain appropriate and consistent with the terms of the Advisory Agreement and the Sub-Advisory Agreements, as applicable. In addition, the Board concluded that each Fund was likely to continue to benefit from services being provided, or to be provided, under each of the Agreements.
64
| North Square Funds |
| SUPPLEMENTAL INFORMATION (Unaudited) – Continued |
Fund Performance
The Board reviewed the performance of each Fund for the different time periods presented in the Board meeting materials and throughout the year. The Board considered various data and materials provided to the Board by the Advisers concerning Fund performance, including a comparison of the investment performance of each Fund to its respective benchmark index, as well as comparative fee information provided by Broadridge Financial Solutions, Inc., based on data produced by Morningstar Inc., an independent provider of investment company data (“Morningstar”), comparing the investment performance of each Fund to a universe of peer funds.
The Board received information at the Meeting, and throughout the year, concerning, and discussed factors contributing to, the performance of the Funds relative to their respective benchmarks and universes for the relevant periods. The Board evaluated the explanations for any relative underperformance of a Fund during these periods, as well as with respect to investment decisions and global economic and other factors that affected the Fund’s investment performance and whether each Fund had performed as expected over time, as well as any plans to address underperformance, if applicable. The Board also noted the Adviser’s discussion of any differences in the investment strategies of the Funds relative to their respective peer universe. The Board generally considered longer-term performance to be more important than short-term performance and also took into account factors including general market conditions; the “style” in which the Funds are managed, as applicable, and whether that style is in or out of favor in the market; issuer-specific information; and fund cash flows. In this connection, the Board also noted how selecting different time periods for performance calculations can produce significantly different results in terms of a Fund’s returns and peer ranking on a relative basis. The Board further acknowledged that longer-term performance could be impacted by even one period of significant outperformance or underperformance. In addition, the Board considered that variations in performance among a Fund’s operating classes reflect variations in class expenses, which result in lower performance for higher expense classes.
Based on these considerations, the Board concluded that the Adviser and the Sub-Advisers continue to have the capability of providing satisfactory investment performance for the Funds, as applicable.
Advisory Fees and Expenses
The Board reviewed and considered the advisory fee rate of each Fund that is being paid to the Adviser under the Advisory Agreement and each Fund’s total net expense ratio. The Board also reviewed and considered the sub-advisory fee rates being paid by the Adviser to each Sub-Adviser for sub-advisory services.
The Board reviewed information from Morningstar comparing each Fund’s advisory fee rate and total expense ratio relative to a group of its peer funds. While the Board recognized that comparisons between a Fund and its peer funds may be imprecise, the comparative information provided by Morningstar was helpful to the Board in evaluating the reasonableness of each Fund’s advisory fees and total expense ratio.
The Board also took into account management’s discussion of each Fund’s expenses and also noted certain cost savings initiatives implemented by the Adviser across all of the Funds. The Board also noted that the Adviser had entered into fee waiver and expense reimbursement arrangements with respect to each Fund.
The Board also received and considered information about the portion of the advisory fee that is retained by the Adviser after payment of the fee to each Sub-Adviser for sub-advisory services. In assessing the reasonableness of this amount, the Board received and evaluated information about the nature and extent of responsibilities that are retained and risks that are assumed by Adviser and not delegated to or assumed by the Sub-Advisers, and about the Adviser’s on-going oversight services. The Board also considered that the sub-advisory fees being paid to each Sub-Adviser had been negotiated by the Adviser on an arm’s length basis and were paid by the Adviser and not the respective Fund. The Board considered the Adviser’s explanation that the sub-advisory fees are priced at a competitive level. In the case of each of the North Square Multi Strategy Fund and the North Square Spectrum Alpha Fund, the Board considered and evaluated the fact that NSI Retail Advisors was an affiliated Sub-Adviser.
The Board also received and considered information about the nature and extent of services offered and fee rates charged by the Adviser and the Sub-Advisers to other types of clients with investment strategies similar to those of the Funds, if any. In this regard, the Board received information about the significantly greater scope of services, and compliance, reporting and other legal burdens and risks of managing registered mutual funds compared with those associated with managing assets of other types of clients, including non-mutual fund clients, such as institutional separate accounts.
65
| North Square Funds |
| SUPPLEMENTAL INFORMATION (Unaudited) – Continued |
Based on its consideration of the factors and information it deemed relevant, including those described here, the Board concluded that the compensation payable to the Adviser under the Advisory Agreement and to the Sub-Advisers under the Sub-Advisory Agreements were reasonable.
Profitability
The Board received and considered information concerning the Adviser’s costs of sponsoring the Funds and the profitability to the Adviser and its respective affiliates from providing services to the Funds. The Board noted that the levels of profitability may be affected by numerous factors. In addition, the Board received information relating to the operations and profitability to each Sub-Adviser from providing services to the Funds. The Board considered representations from the Adviser and each Sub-Adviser that the Sub-Adviser’s fees were negotiated at arm’s length on a Fund-by-Fund basis and that the sub-advisory fees are paid by the Adviser and not the Funds. Accordingly, the Board concluded that the profitability of each Sub-Adviser was a less relevant factor with respect to the Board’s consideration of the Sub-Advisory Agreements.
Based on its review, the Board determined that the profits reported by the Advisers from services being provided to the Funds, if any, were not excessive.
Economies of Scale
The Board considered the potential for the Adviser to experience economies of scale in the provision of advisory services to each Fund as the Funds grew. The Board also considered that the Adviser may share potential economies of scale from its advisory business in a variety of ways, including through fee waiver and expense reimbursement arrangements, services that benefit shareholders, competitive advisory fee rates set at the outset without regard to breakpoints, and investments in the business intended to enhance services available to shareholders. The Board observed that each of the Funds continues to remain in a relatively early stage of development that was exacerbated by the intervention of the COVID-19 pandemic. In addition, the Board took into account management’s discussion of the Funds’ fee structures. The Board also considered the effect of each Fund’s growth in size on its performance and fees and that, if the Fund’s assets increase over time, the Fund may realize other economies of scale. The Independent Trustees recognized that, because each Fund’s sub-advisory fees are paid by the Adviser, and not the Fund, an analysis of economies of scale was more appropriate in the context of the Board’s consideration of the Advisory Agreement.
The Board concluded that, especially in light of the current stage of development of the Funds, the Adviser’s arrangements with respect to the Funds constituted a reasonable approach to sharing potential economies of scale with the Funds and their shareholders.
“Fall-Out” Benefits
The Board received and considered information regarding potential “fall-out” or ancillary benefits that the Adviser and its affiliates may receive as a result of their relationships with the Funds. The Board noted that ancillary benefits could include, among others, benefits directly attributable to other relationships with the Fund and benefits potentially derived from an increase in the Adviser’s business as a result of their relationships with the Fund. In addition, the Board considered the potential benefits, other than sub-advisory fees, that the Sub-Advisers and their affiliates may receive because of their relationships with the Funds, including the benefits of research services that may be available to the Sub-Adviser as a result of securities transactions effected for the Funds and other investment advisory clients, as well as other benefits from increases in assets under management.
Based on its consideration of the factors and information it deemed relevant, including those described above, the Board did not find that any ancillary benefits that may be received by the Advisers and their affiliates is unreasonable.
Conclusion
At the Meeting, after considering the above-described material factors and based on its deliberations and its evaluation of the information described above, and assisted by the advice of both Fund Counsel and Independent Trustee Counsel, the Board, including the Independent Trustees acting separately, concluded that the approval of the renewal and continuation of the Agreements with respect to each Fund was in the best interest of each respective Fund and its shareholders.
66
| North Square Funds |
| SUPPLEMENTAL INFORMATION (Unaudited) – Continued |
Board Consideration of the Continuation of the Investment Advisory Agreement and Sub-Advisory Agreements and Related Agreements (North Square Altrinsic International Equity Fund and North Square McKee Bond Fund)
Section 15(c) of the Investment Company Act of 1940, as amended (the “1940 Act”), requires that each mutual fund’s board of trustees, including a majority of those trustees who are not “interested persons” of the fund, as defined in the 1940 Act (the “Independent Trustees”), initially approve, and annually review and consider the continuation of, the fund’s investment advisory and sub-advisory agreements. At a meeting held on June 21-22, 2023 (the “Meeting”), the Board of Trustees (the “Board”) of North Square Investments Trust (the “Trust”), including each of the Independent Trustees, unanimously voted to approve the continuation of: (i) the investment advisory agreement (the “Advisory Agreement”) between North Square Investments, LLC (the “Adviser”) and the Trust, on behalf of the North Square Spectrum Alpha Fund, the North Square Advisory Research Small Cap Growth Fund, the North Square Preferred and Income Securities Fund, the North Square Multi Strategy Fund, the North Square Dynamic Small Cap Fund, the North Square Altrinsic International Equity Fund, and the North Square McKee Bond Fund (each, a “Fund” and collectively, the “Funds”); (ii) the investment sub-advisory agreement between the Adviser and Algert Global, LLC (“Algert”) with respect to the North Square Dynamic Small Cap Fund; (iii) the investment sub-advisory agreement between the Adviser and Altrinsic Global Advisors, LLC (“Altrinsic”) with respect to the North Square Altrinsic International Equity Fund; and (iv) the investment sub-advisory agreement between the Adviser and CSM Advisors, LLC (“CSM” and with both Algert and Altrinsic, the “Sub-Advisers”) with respect to the North Square McKee Bond Fund. The Adviser and the Sub-Advisers are collectively referred to as the “Advisers.” The investment sub-advisory agreements with the Sub-Advisers are collectively referred to as the “Sub-Advisory Agreements,” and the Advisory Agreement and the Sub-Advisory Agreements are collectively referred to as the “Agreements.”
In connection with its consideration of the Agreements proposed for continuation, the Board requested and reviewed responses from the Advisers to the Section 15(c) requests posed to the Advisers on behalf of the Independent Trustees and supporting materials relating to those questions and responses, as well as other information and data provided. In this connection, the Board reviewed and discussed various information that had been provided prior to the Meeting, including the Advisory Agreement, the Sub-Advisory Agreements, memoranda provided by both Fund Counsel and Independent Trustee Counsel summarizing the requirements and guidelines relevant to the Board’s consideration of the approvals of such Agreements, to each Advisers’ Forms ADV Part 1A, brochures and brochure supplements, profitability information, comparative information about the Funds’ performance for periods ended March 31 2023, advisory fees and expense ratios, and other pertinent information. In addition, the Board considered such additional information as it deemed reasonably necessary, including information and data provided by the Advisers during the course of the year, to evaluate the Agreements, as applicable, with respect to each Fund. The Board discussed the Advisers’ 15(c) responses and discussed various questions and information with representatives of the Advisers at the Meeting. The Board also considered the materials and presentations by Trust officers and representatives of the Advisers and Sub-Advisers provided at the Meeting concerning the Agreements. Throughout the process, including at the Meeting, the Board had numerous opportunities to ask questions of and request additional materials from the Advisers. The Board met in executive sessions at which no representatives of management were present to consider the renewal of the Agreements and the Independent Trustees were also advised by, and met separately, in executive sessions with Independent Trustee Counsel. The Board also noted that the evaluation process with respect to the Adviser and the Sub-Advisers is an ongoing one. The Board, as noted above, also took into account information reviewed periodically throughout the year and in prior years that was relevant to its consideration of the Agreements, including performance, advisory fee and other expense information and discussions with the Funds’ portfolio managers, as well as such additional information it deemed relevant and appropriate in its judgement. The Board noted that the information received and considered by the Board in connection with the Meeting and throughout the year was both written and oral. Based on its evaluation of this information, the Board, including the Independent Trustees, unanimously approved the continuation of the Agreements for the Funds for an additional one-year period.
In determining whether to approve the continuation of the Agreements, the members of the Board reviewed and evaluated information and factors they believed to be relevant and appropriate in the exercise of their reasonable business judgment. While individual members of the Board may have weighed certain factors differently, the Board’s determination to approve the Agreements was based on a comprehensive consideration of all information provided to the Board with respect to the approval of the Agreements. As noted, the Board was also furnished with an analysis of its fiduciary obligations in connection with its evaluation of the Agreements and, throughout the evaluation process, the Board was assisted by Fund Counsel and Independent Trustee Counsel who, as noted above, each provided and reviewed a legal memorandum to the Board detailing the duties and responsibilities of the Board in connection with the various actions and approvals required in connection with the renewal of the Agreements. A more detailed summary of important, but not necessarily all, factors the Board considered with respect to its renewal of the Agreements is provided below. The Board also considered
67
| North Square Funds |
| SUPPLEMENTAL INFORMATION (Unaudited) – Continued |
other factors (including conditions and trends prevailing generally in the economy, the securities markets, and the industry). The Board’s conclusions may be based in part on its consideration of the advisory arrangements in prior years and on the Board’s ongoing regular review of Fund performance and operations throughout the year.
Nature, Extent and Quality of Services
The Board considered information regarding the nature, extent and quality of services being provided to the Funds by the Advisers. The Board considered, among other things, the terms of the Agreements and the range of services being provided by the Advisers. The Board noted the non-investment advisory services being provided by the Adviser, including the supervision and coordination of the Funds’ service providers and the provision of related administrative and other services. The Board also considered each Adviser’s reputation, organizational structure, resources and overall financial strength (including economic and other support provided by affiliates of the Adviser), its willingness and commitment to consider and implement organizational and operational changes designed to enhance services to the Funds.
In addition, the Board considered the Advisers’ professional personnel who provide or will provide services to the Funds, including each Adviser’s ability and experience in attracting and retaining qualified personnel to service the Funds. In addition, the Board considered the compliance programs and compliance records and regulatory history of the Advisers. The Board noted the Advisers’ support of the Funds’ compliance control structure, including the resources that are devoted by the Advisers in support of the Funds’ obligations pursuant to Rule 38a-1 under the 1940 Act and the efforts of the Advisers to address cybersecurity risks and invest in business continuity planning. The Board also noted that on a regular basis it received and reviewed information from the Trust’s Chief Compliance Officer (“CCO”) regarding the Funds’ compliance policies and procedures established pursuant to Rule 38a-1 under the 1940 Act, which included evaluating the regulatory compliance systems of the Advisers and procedures reasonably designed to ensure compliance with the federal securities laws.
With respect to the Adviser, the Board considered the Funds’ ongoing and proposed operation in a “manager-of-managers” structure and reviewed the responsibilities that the Adviser has under this structure, including, but not limited to, monitoring and evaluating the performance of the Sub-Advisers, monitoring the Sub-Advisers for adherence to the stated investment objectives, strategies, policies and restrictions of the Funds, and supervising the Sub-Advisers with respect to the services that the Sub-Advisers currently provide under the Sub-Advisory Agreements. In this regard, the Board evaluated information about the nature and extent of responsibilities retained and significant risks assumed by the Adviser and not delegated to or assumed by the Sub-Advisers in connection with the services provided to the Funds, including entrepreneurial risk and ongoing risks, including investment, operational, enterprise, litigation, regulatory and compliance risks. The Board also noted increased regulatory risk. The Board also considered the process used by the Adviser, consistent with this structure, to identify and recommend sub-advisers, and its ability to monitor and oversee subadvisers and recommend replacement sub-advisers, when necessary, and provide other services under the Advisory Agreement. In addition, the Board considered its familiarity with the Adviser’s personnel obtained from the Board’s oversight of the Funds and of other funds in the Trust advised by the Adviser, as well as the affiliation between the Adviser and CSM and any potential conflicts of interest.
With respect to the Sub-Advisers, which provide day-to-day portfolio management services for the Funds, subject to oversight by the Adviser, the Board considered, among other things, the quality of each Sub-Adviser’s investment personnel, its investment philosophies and processes, its investment research capabilities and resources, its financial condition, its performance record, its experience, its trade execution capabilities and its approach to managing risk. The Board also considered the experience of each Fund’s portfolio managers the number of accounts managed by the portfolio managers, and each Sub-Adviser’s approach for compensating the portfolio managers. Moreover, the Board considered that the Adviser has the oversight responsibility for conflicts of interest relating to the Funds. In considering the nature, extent, and quality of the services provided by each of the Sub-Advisers, the Board also took into account its knowledge of each Sub-Advisers management and the quality of the performance of its duties as a sub-adviser, acquired through discussions and reports during the preceding year and in past years.
After consideration of the foregoing factors, among others, the Board concluded that the nature, extent and quality of services being provided or to be provided by the Adviser and the Sub-Advisers, taken as a whole, remain appropriate and consistent with the terms of the Advisory Agreement and the Sub-Advisory Agreements, as applicable. In addition, the Board concluded that each Fund was likely to continue to benefit from services being provided, or to be provided, under each of the Agreements.
68
| North Square Funds |
| SUPPLEMENTAL INFORMATION (Unaudited) – Continued |
Fund Performance
The Board reviewed the performance of each Fund for the different time periods presented in the materials. The Board considered various data and materials provided to the Board by the Advisers concerning Fund performance, including a comparison of the investment performance of each Fund to its respective benchmark index, as well as comparative fee information provided by the Administrator based on data produced by Morningstar Inc., an independent provider of investment company data (“Morningstar”), comparing the investment performance of each Fund to a universe of peer funds.
The Board received information at the Meeting, and throughout the year, concerning, and discussed factors contributing to, the performance of the Funds relative to their respective benchmarks and universes for the relevant periods. The Board evaluated the explanations for any relative underperformance of a Fund during these periods, including with respect to investment decisions and global economic and other factors that affected the Fund’s investment performance and whether each Fund had performed as expected over time, as well as any plans to address underperformance, if applicable. The Board also noted the Adviser’s discussion of any differences in the investment strategies of the Funds relative to their respective peer universe. The Board generally considered longer-term performance to be more important than short-term performance and also took into account factors including general market conditions; the “style” in which the Funds are managed, as applicable, and whether that style is in or out of favor in the market; issuer-specific information; and fund cash flows. In this regard, the Board also noted how selecting different time periods for performance calculations can produce significantly different results in terms of a Fund’s returns and peer ranking on a relative basis. The Board further acknowledged that longer-term performance could be impacted by even one period of significant outperformance or underperformance. The Board also considered that variations in performance among a Fund’s operating classes reflect variations in class expenses, which result in lower performance for higher expense classes.
Based on these considerations, the Board concluded that it was satisfied that the Adviser and the Sub-Advisers continue to have the capability of providing satisfactory investment performance for the Funds, as applicable.
Advisory Fees and Expenses
The Board reviewed and considered the advisory fee rate of each Fund that is being paid to the Adviser under the Advisory Agreement and each Fund’s total net expense ratio. The Board also reviewed and considered the sub-advisory fee rates being paid by the Adviser to each Sub-Adviser for sub-advisory services.
The Board reviewed information from Morningstar comparing each Fund’s advisory fee rate and total expense ratio relative to a group of its peer funds. While the Board recognized that comparisons between a Fund and its peer funds may be imprecise, the comparative information provided by Morningstar was helpful to the Board in evaluating the reasonableness of each Fund’s advisory fees and total expense ratio.
The Board also took into account management’s discussion of each Fund’s expenses and also noted certain cost savings initiatives implemented by the Adviser across the Trust. The Board also noted that the Adviser had entered into fee waiver and expense reimbursement arrangements with respect to each of the Funds.
The Board also received and considered information about the portion of the advisory fee that is being retained by the Adviser after payment of the fee to each Sub-Adviser for sub-advisory services. In assessing the reasonableness of this amount, the Board received and evaluated information about the nature and extent of responsibilities that are retained and risks that are assumed by Adviser and not delegated to or assumed by the Sub-Advisers, and about the Adviser’s on-going oversight services. The Board also considered that the sub-advisory fees being paid to each Sub-Adviser had been negotiated by the Adviser on an arm’s length basis and were paid by the Adviser and not the respective Fund. The Board considered the Adviser’s explanation that the sub-advisory fees are priced at a competitive level. In the case of the McKee Bond Fund, the Board considered and evaluated the fact that CSM was an affiliated Sub-Adviser.
The Board also received and considered information about the nature and extent of services offered and fee rates charged by the Adviser and the Sub-Advisers to other types of clients with investment strategies similar to those of the Funds, if any. In this regard, the Board received information about the significantly greater scope of services, and compliance, reporting and other legal burdens and risks of managing proprietary mutual funds compared with those associated with managing assets of other types of clients, including non-mutual fund clients, such as institutional separate accounts. Based on its consideration of the factors and information it deemed relevant, including those described here, the Board concluded that the compensation payable to the Adviser under the Advisory Agreement and to the Sub-Advisers under the Sub-Advisory Agreements were reasonable.
69
| North Square Funds |
| SUPPLEMENTAL INFORMATION (Unaudited) – Continued |
Profitability
The Board received and considered information concerning the Adviser’s costs of sponsoring the Funds and the profitability to the Adviser and its respective affiliates from providing services to the Funds. The Board noted that the levels of profitability may be affected by numerous factors. The Board also received information relating to the operations and profitability to each Sub-Adviser from providing services to the Funds. The Board considered representations from the Adviser and each Sub-Adviser that the Sub-Adviser’s fees were negotiated at arm’s length on a Fund-by-Fund basis and that the sub-advisory fees are paid by the Adviser and not the Funds. Accordingly, the Board concluded that the profitability of each Sub-Adviser was a less relevant factor with respect to the Board’s consideration of the Sub-Advisory Agreements.
Based on its review, the Board determined that the profits reported by the Advisers from services being provided to the Funds, if any, were not excessive.
Economies of Scale
The Board considered the potential for the Adviser to experience economies of scale in the provision of advisory services to each Fund as the Funds grew. The Board considered that the Adviser may share potential economies of scale from its advisory business in a variety of ways, including through fee waiver and expense reimbursement arrangements, services that benefit shareholders, competitive advisory fee rates set at the outset without regard to breakpoints, and investments in the business intended to enhance services available to shareholders. The Board observed that each of the Funds continues to remain in a relatively early stage of development that was exacerbated by the intervention of the COVID-19 pandemic. The Board also took into account management’s discussion of the Funds’ fee structures. The Board also considered the effect of each Fund’s growth in size on its performance and fees and that if the Fund’s assets increase over time, the Fund may realize other economies of scale. The Independent Trustees recognized that, because each Fund’s sub-advisory fees are paid by the Adviser, and not the Fund, an analysis of economies of scale was more appropriate in the context of the Board’s consideration of the Advisory Agreement.
The Board concluded that, especially in light of the current stage of development of the Funds, the Adviser’s arrangements with respect to the Funds constituted a reasonable approach to sharing potential economies of scale with the Funds and their shareholders.
“Fall-Out” Benefits
The Board received and considered information regarding potential “fall-out” or ancillary benefits that the Adviser and its affiliates may receive as a result of their relationships with the Funds. Ancillary benefits could include, among others, benefits directly attributable to other relationships with the Fund and benefits potentially derived from an increase in the Adviser’s business as a result of their relationships with the Fund. In addition, the Board considered the potential benefits, other than sub-advisory fees, that the Sub-Advisers and their affiliates may receive because of their relationships with the Funds, including the benefits of research services that may be available to the Sub-Adviser as a result of securities transactions effected for the Funds and other investment advisory clients, as well as other benefits from increases in assets under management.
Based on its consideration of the factors and information it deemed relevant, including those described above, the Board did not find that any ancillary benefits that may be received by the Advisers and their affiliates are unreasonable.
Conclusion
At the Meeting, after considering the above-described material factors and based on its deliberations and its evaluation of the information described above, and assisted by the advice of both Fund Counsel and Independent Trustee Counsel, the Board, including the Independent Trustees, concluded that the approval of the renewal and continuation of the Agreements with respect to each Fund was in the best interest of each respective Fund and its shareholders.
70
| North Square Funds |
| SUPPLEMENTAL INFORMATION (Unaudited) – Continued |
Change in Independent Registered Public Accounting Firm
On March 29, 2023, the Audit Committee of the Board of Trustees approved the engagement of Cohen and Company, Ltd. (“Cohen”) to serve as the independent registered public accounting firm for each Fund for the fiscal year ending October 31, 2023, in replacement of Tait Weller & Baker LLP (“Tait”) which served previously as the independent registered public accounting firm for the Funds. Having been notified of the Audit Committee’s intention to make this change, Tait resigned as the independent registered public accounting firm of the Funds.
The reports of Tait on the financial statements of the Funds as of and for the fiscal years ended October 31, 2021 and October 31, 2022 did not contain an adverse opinion or a disclaimer of opinion, and were not qualified or modified as to uncertainties, audit scope or accounting principles. During such fiscal years , and during the subsequent interim period ended March 29, 2023: (i) there were no disagreements between the Trust and Tait on any matter of accounting principles or practices, financial statement disclosure, or auditing scope or procedure, which disagreements, if not resolved to the satisfaction of Tait, would have caused it to make reference to the subject matter of the disagreements in its report on the financial statements of the Fund for such years or interim period; and (ii) there were no “reportable events,” as defined in Item 304(a)(1)(v) of Regulation S-K under the Securities Exchange Act of 1934, as amended.
During the fiscal years ended October 31, 2021 and October 31, 2022, and during the subsequent interim period ended March 29, 2023, neither the Trust, nor anyone acting on its behalf, consulted with Cohen on behalf of the Funds regarding the application of accounting principles to a specified transaction (either completed or proposed), the type of audit opinion that might be rendered on the Funds’ financial statements, or any matter that was either: (i) the subject of a “disagreement,” as defined in Item 304(a)(1)(iv) of Regulation S-K and the instructions thereto; or (ii) “reportable events,” as defined in Item 304(a)(1)(v) of Regulation S-K.
71
| North Square Funds |
| EXPENSE EXAMPLES |
| For the Six Months Ended October 31, 2023 (Unaudited) |
Expense Examples
As a shareholder of the Funds, you incur two types of costs: (1) transaction costs, including sales charges (loads) on purchase payments (Class A only); and redemption fees; and (2) ongoing costs, including management fees; distribution and/or service (12b-1) fees (Class A and C only); and other Fund expenses. The examples below are intended to help you understand your ongoing costs (in dollars) of investing in the Funds and to compare these costs with the ongoing costs of investing in other mutual funds.
These examples are based on an investment of $1,000 invested at the beginning of the period and held for the entire six month period from May 1, 2023 to October 31, 2023.
Actual Expenses
The information in the row titled “Actual Performance” of the table below provides actual account values and actual expenses. You may use the information in these columns, together with the amount you invested, to estimate the expenses that you paid over the period. Simply divide your account value by $1,000 (for example, an $8,600 account value divided by $1,000 = 8.6), then multiply the result by the number in the appropriate row for your share class, in the column titled “Expenses Paid During Period” to estimate the expenses you paid on your account during this period.
Hypothetical Example for Comparison Purposes
The information in the row titled “Hypothetical (5% annual return before expenses)” of the table below provides hypothetical account values and hypothetical expenses based on each Fund’s actual expense ratios and an assumed rate of return of 5% per year before expenses, which is not the Fund’s actual return. The hypothetical account values and expenses may not be used to estimate the actual ending account balance or expenses you paid for the period. You may use this information to compare the ongoing costs of investing in the Fund and other funds. To do so, compare these 5% hypothetical examples with the 5% hypothetical examples that appear in the shareholder reports of the other funds.
Please note that the expenses shown in the table are meant to highlight your ongoing costs only and do not reflect any transaction costs, such as sales charges (loads) or redemption fees. Therefore, the information in the row titled “Hypothetical (5% annual return before expenses)” is useful in comparing ongoing costs only, and will not help you determine the relative total costs of owning different funds. In addition, if these transactional costs were included, your costs would have been higher.
| Beginning | Ending | |||||||
| Account Value, | Account Value, | Expenses Paid | Annualized | |||||
| May 1, 2023 | October 31, 2023 | During Period(a) | Expense Ratio | |||||
| Small Cap Value Fund - Class I Shares | ||||||||
| Actual | $1,000.00 | $994.70 | $4.72 | 0.94% | ||||
| Hypothetical(b) | $1,000.00 | $1,020.47 | $4.79 | 0.94% | ||||
| International Equity Fund - Class I Shares | ||||||||
| Actual | $1,000.00 | $949.40 | $4.77 | 0.97% | ||||
| Hypothetical(b) | $1,000.00 | $1,020.32 | $4.94 | 0.97% | ||||
| McKee Bond Fund - Class I Shares | ||||||||
| Actual | $1,000.00 | $940.60 | $2.31 | 0.47% | ||||
| Hypothetical(b) | $1,000.00 | $1,022.83 | $2.41 | 0.47% | ||||
| McKee Bond Fund - Class R6 Shares | ||||||||
| Actual | $1,000.00 | $940.80 | $1.37 | 0.28% | ||||
| Hypothetical(b) | $1,000.00 | $1,023.79 | $1.43 | 0.28% |
72
| North Square Funds |
| EXPENSE EXAMPLES – Continued |
| For the Six Months Ended October 31, 2023 (Unaudited) |
| Beginning | Ending | |||||||
| Account Value, | Account Value, | Expenses Paid | Annualized | |||||
| May 1, 2023 | October 31, 2023 | During Period(a) | Expense Ratio | |||||
| Strategic Income Fund - Class A Shares | ||||||||
| Actual | $1,000.00 | $964.80 | $5.64 | 1.15% | ||||
| Hypothetical(b) | $1,000.00 | $1,019.19 | $5.80 | 1.15% | ||||
| Strategic Income Fund - Class 1 Shares | ||||||||
| Actual | $1,000.00 | $965.80 | $4.42 | 0.90% | ||||
| Hypothetical(b) | $1,000.00 | $1,020.44 | $4.54 | 0.90% |
| (a) | Expenses are equal to the Funds’ annualized expense ratio, multiplied by the average account value over the period, multiplied by (184/365) (to reflect the one-half year period). |
| (b) | Hypothetical assumes 5% annual return before expenses. |
73
THIS PAGE INTENTIONALLY LEFT BLANK
THIS PAGE INTENTIONALLY LEFT BLANK
THIS PAGE INTENTIONALLY LEFT BLANK
| North Square Funds | |
| Advisor | |
| North Square Investments, LLC | |
| 10 South LaSalle Street, Suite 1925 | |
| Chicago, Illinois 60603 | |
| Sub-Advisor | Sub-Advisor |
| Algert Global LLC | NSI Retail Advisors, LLC |
| 101 California Street, Suite 4225 | One Gateway Center |
| San Francisco, California 94111 | Pittsburgh, Pennsylvania 15222 |
| Sub-Advisor | Sub-Advisor |
| Red Cedar Investment Management, LLC | Advisor Research Inc. |
| 333 Bridge Street NW, Suite 601 | 180 North Stetson Avenue, Suite 5500 |
| Grand Rapids, Michigan 49504 | Chicago, Illinois 60601 |
| Independent Registered Public Accounting Firm | |
| Cohen & Company, Ltd. | |
| 1350 Euclid Avenue, Suite 800 | |
| Cleveland, Ohio 44115 | |
| Custodian | |
| U.S. Bank, N.A. | |
| 1555 North RiverCenter Drive, Suite 300 | |
| Milwaukee, Wisconsin 53212 | |
| Fund Administrator, Transfer Agent and Fund Accountant | |
| Ultimus Fund Solutions | |
| 225 Pictoria Drive, Suite 450 | |
| Cincinnati, Ohio 45246 | |
| Distributor | |
| Compass Distributors LLC | |
| Three Canal Plaza, Suite 100 | |
| Portland, Maine 04101 | |
| www.foreside.com | |
| (b) | Not applicable. |
Item 2. Code of Ethics.
The Registrant has adopted a code of ethics that applies to the Registrant’s principal executive officer and principal financial officer. The Registrant has not made any substantive amendments to its code of ethics during the period covered by this report. The Registrant has not granted any waivers from any provisions of the code of ethics during the period covered by this report.
Item 3. Audit Committee Financial Expert.
The Registrant’s Board of Directors has determined that there is at least one audit committee financial expert serving on its audit committee. David B. Boon is the “audit committee financial expert” and is considered to be “independent” as each term is defined in Item 3 of Form N-CSR.
Item 4. Principle Accountant Fees and Services.
(a) Audit Fees: The aggregate fees billed for the fiscal years ended October 31, 2023 and October 31, 2022 for professional services rendered by the principal accountant for the audit of the Registrant’s annual financial statements or services that are normally provided by the accountant in connection with statutory and regulatory filings or engagements were $74,000 and $35,240, respectively.
(b) Audit-Related Fees: The aggregate fees billed for the fiscal years ended October 31, 2023 and October 31, 2022 for assurance and related services by the principal accountant that are reasonably related to the performance of the audit of the Registrant’s financial statements and are not reported above in Item 4(a) were $0 and $0, respectively.
(c) Tax Fees: The aggregate fees billed for the fiscal years ended October 31, 2023 and October 31, 2022 for professional services rendered by the principal accountant for tax compliance, tax advice and tax planning were $13,000 and $10,000, respectively.
(d) All Other Fees: The aggregate fees billed for the fiscal years ended October 31, 2023 and October 31, 2022 for products and services provided by the principal accountant, other than the services reported above in Items 4(a) through (c) were $0 and $0, respectively.
(e)(1) Pre-Approval Policies and Procedures. T The Audit Committee has adopted pre-approval policies and procedures that require the Audit Committee to pre-approve all audit and non-audit services of the Registrant, including services provided to any entity affiliated with the Registrant.
(e)(2) Percentage of Services Approved by Audit Committee: There were no services described in each of paragraphs (b) through (d) of this Item (including services required to be approved by Registrant’s audit committee pursuant to paragraph (c)(7)(ii) of Rule 2-01 of Regulation S-X) that were approved by Registrant’s audit committee pursuant to paragraph (c)(7)(i)(C) of Rule 2-01 of Regulation S-X.
(f) Not applicable.
(g) Aggregate Non-Audit Services: The aggregate non-audit fees billed during the fiscal years ended October 31, 2023 and October 31, 2022 by the Registrant’s accountant for services rendered to the Registrant, and rendered to the Registrant’s investment adviser (not including any sub-adviser whose role is primarily portfolio management and is subcontracted with or overseen by another investment adviser), and any entity controlling, controlled by, or under common control with the adviser that provides ongoing services to the Registrant were $0 and $0, respectively.
(h) Not applicable. The auditor performed no services for the registrant’s investment adviser or any entity controlling, controlled by, or under common control with the investment adviser that provides ongoing services to the registrant.
(i) Not applicable.
(j) Not applicable.
Item 5. Audit Committee of Listed Companies.
Not applicable to Registrants who are not listed issuers (as defined in Rule 10A-3 under the Securities Exchange Act of 1934).
Item 6. Schedule of Investments.
(a) Schedule of Investments is included as part of the report to shareholders filed under Item 1 of this Form.
(b) Not Applicable.
Item 7. Disclosure of Proxy Voting Policies and Procedures for Closed-End Management Investment Companies.
Not Applicable – applies to closed-end funds only
Item 8. Portfolio Managers of Closed-End Investment Companies.
Not Applicable – applies to closed-end funds only
Item 9. Purchases of Equity Securities by Closed-End Management Investment Company and Affiliated Purchasers.
Not Applicable – applies to closed-end funds only
Item 10. Submission of Matters to a Vote of Security Holders.
There have been no material changes to the procedures by which shareholders may recommend nominees to the Registrant’s board of trustees.
Item 11. Controls and Procedures.
| (a) | The registrant’s President and Treasurer reviewed the Registrant's disclosure controls and procedures (as defined in Rule 30a-3(c) under the Act) are effective in design and operation and are sufficient to form the basis of the certifications required by Rule 30a-2 under the Act, based on their evaluation of these disclosure controls and procedures within 90 days of the filing of this report on Form N-CSR.
|
| (b) | There were no changes in the registrant’s internal control over financial reporting (as defined in Rule 30a-3(d) under the Act (17 CFR 270.30a-3(d)) that occurred during the period covered by this report that have materially affected or are reasonably likely to materially affect, the registrant’s internal control over financial reporting. |
Item 12. Disclosure of Securities Lending Activities for Closed-End Management Investment Companies.
Not Applicable – applies to closed-end funds only
Item 13. Exhibits.
| (a)(1) | Code of Ethics is filed herewith. |
| (a)(3) | Not applicable to Registrant. | |
| (a)(4) | Change in the registrant’s independent public accountant: Attached hereto |
| (b) | Certification pursuant to 18 U.S.C. Section 1350, as adopted pursuant to Section 906 of the Sarbanes-Oxley Act of 2002 is filed herewith. |
SIGNATURES
Pursuant to the requirements of the Securities Exchange Act of 1934 and the Investment Company Act of 1940, the registrant has duly caused this report to be signed on its behalf by the undersigned, thereunto duly authorized.
(Registrant) North Square Investments Trust
| By (Signature and Title) | /s/ Ian Martin |
| Ian Martin, President |
| Date | 1/09/2024 |
Pursuant to the requirements of the Securities Exchange Act of 1934 and the Investment Company Act of 1940, this report has been signed below by the following persons on behalf of the registrant and in the capacities and on the dates indicated.
| By (Signature and Title) | /s/ Ian Martin |
| Ian Martin, President |
| Date | 1/09//2024 |
| By (Signature and Title) | /s/ Zachary P. Richmond |
| Zachary P. Richmond, Treasurer |
| Date | 1/09/2024 |