Exhibit 99.2

APPLOVIN 2Q201 Shareholder Letter
To Our Shareholders: We are pleased to report excellent progress during 2Q21, advancing our Software Platform business at a record rate leading to our best financial performance yet. We remain instrumental to the rapid growth of the mobile app ecosystem, having driven close to 2 billion app downloads so far in 2021. Strong execution in the quarter led to revenue more than doubling year-over-year (+123%) and organic1 revenue growth of +97%. We are especially pleased with the extraordinary growth and acceleration of our Software Platform business where revenue more than tripled year-over-year (+203%) and Software Platform Enterprise Clients more than doubled year-over-year, each excluding Adjust. This was supported by a net-dollar retention rate of +279% from existing Software Platform Enterprise Clients. Sequential growth of Software Platform revenue, excluding Adjust, was +40% from 1Q21 to 2Q21. Based on our top-line performance and mix, Net Income improved to $14 million for 2Q21, a 2% net income margin, and Adjusted EBITDA was a record $184 million, more than tripling year-over year, and equal to a 27% Adjusted EBITDA margin. The inflection in our software business has been powered by our machine learning engine, AXON. This business is now further enhanced by the addition of Adjust, one of the leading mobile attribution and analytics companies. The acquisition of Adjust in April 2021 allows us to meaningfully expand the market opportunity of our software and provides us with both leading technology and a deep customer list to cross-sell using their global go-to-market team. Adjust’s more than 2,000 gaming and non-gaming customers spent approximately $11 billion on mobile marketing in 2020. This presents a unique opportunity to grow our Software Platform business. As a reminder, we have three management objectives and key advantages to grow: 1. Grow software using our leading machine-learning software and large-scale data platform. 2. Grow content leveraging our large network of studios and our differentiated marketing advantages, generating more first-party data. 3. Drive strong revenue and long-term cash flow growth given our attractive cost structure and operating leverage. We believe our success in the quarter and positive outlook across all three of these dimensions gives us confidence in our ability to drive highly attractive long-term shareholder returns. We are also excited to announce that Asha Sharma has joined our Board of Directors. Asha is the Chief Operating Officer of Instacart, where she oversees the Instacart Marketplace, which includes the Instacart App, Instacart Logistics, Growth, and Marketing. Asha is a proven tech operator and leader known for building strong teams in high-growth environments with successful senior roles at Facebook, Porch Group, and Microsoft. We look forward to working with Asha and continuing to build out our Board with outstanding executives. AppLovin Corporation / 2Q 2021 Letter to Shareholders 1
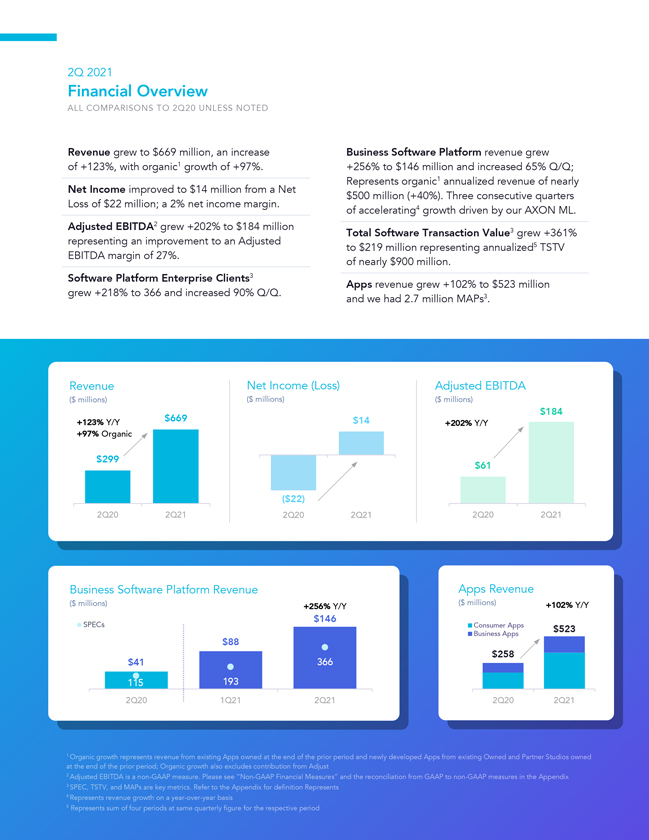
2Q 2021 Financial Overview ALL COMPARISONS TO 2Q20 UNLESS NOTED Revenue grew to $669 million, an increase of +123%, with organic1 growth of +97%. Net Income improved to $14 million from a Net Loss of $22 million; a 2% net income margin. Adjusted EBITDA2 grew +202% to $184 million representing an improvement to an Adjusted EBITDA margin of 27%. Software Platform Enterprise Clients3 grew +218% to 366 and increased 90% Q/Q. Business Software Platform revenue grew +256% to $146 million and increased 65% Q/Q; Represents organic1 annualized revenue of nearly $500 million (+40%). Three consecutive quarters of accelerating4 growth driven by our AXON ML. Total Software Transaction Value3 grew +361% to $219 million representing annualized5 TSTV of nearly $900 million. Apps revenue grew +102% to $523 million and we had 2.7 million MAPs3. Revenue Net Income (Loss) Adjusted EBITDA ($ millions) ($ millions) ($ millions) $184 +123% Y/Y $669 $14 +202% Y/Y +97% Organic $299 $61 ($22) 2Q20 2Q21 2Q20 2Q21 2Q20 2Q21 Business Software Platform Revenue Apps Revenue ($ millions) +256% Y/Y ($ millions) +102% Y/Y SPECs 160 $146 600 Consumer Apps 140 500 Business Apps $523 120 100 $88 400 80 300 $258 60 $41 366 200 40 20 193 100 115 0 0 2Q20 1Q21 2Q21 2Q20 2Q21 1 Organic growth represents revenue from existing Apps owned at the end of the prior period and newly developed Apps from existing Owned and Partner Studios owned at the end of the prior period; Organic growth also excludes contribution from Adjust 2 Adjusted EBITDA is a non-GAAP measure. Please see “Non-GAAP Financial Measures” and the reconciliation from GAAP to non-GAAP measures in the Appendix 3 SPEC, TSTV, and MAPs are key metrics. Refer to the Appendix for definition Represents 4 Represents revenue growth on a year-over-year basis 5 Represents sum of four periods at same quarterly figure for the respective period AppLovin Corporation / 2Q 2021 Letter to Shareholders 2
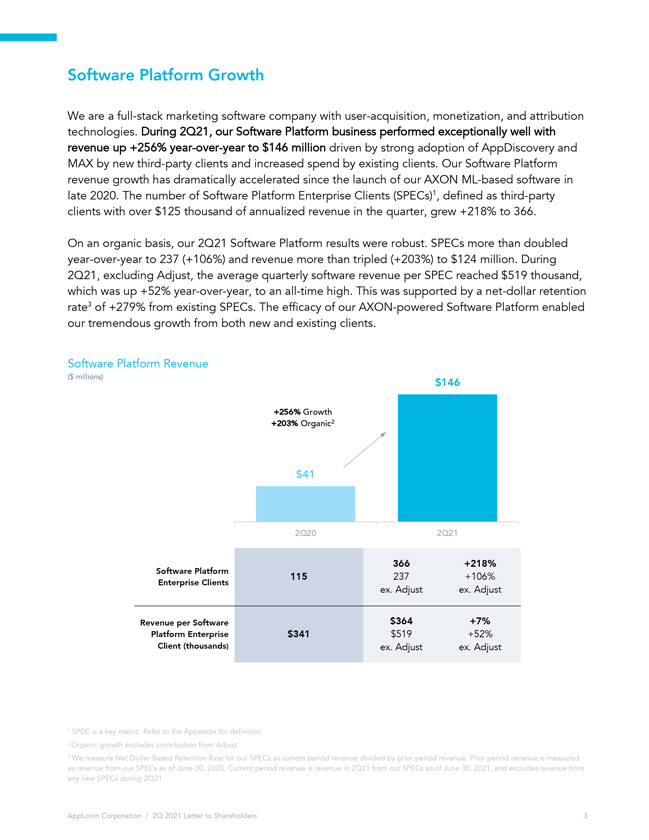
Software Platform Growth We are a full-stack marketing software company with user-acquisition, monetization, and attribution technologies. During 2Q21, our Software Platform business performed exceptionally well with revenue up +256% year-over-year to $146 million driven by strong adoption of AppDiscovery and MAX by new third-party clients and increased spend by existing clients. Our Software Platform revenue growth has dramatically accelerated since the launch of our AXON ML-based software in late 2020. The number of Software Platform Enterprise Clients (SPECs)1, defined as third-party clients with over $125 thousand of annualized revenue in the quarter, grew +218% to 366. On an organic basis, our 2Q21 Software Platform results were robust. SPECs more than doubled year-over-year to 237 (+106%) and revenue more than tripled (+203%) to $124 million. During 2Q21, excluding Adjust, the average quarterly software revenue per SPEC reached $519 thousand, which was up +52% year-over-year, to an all-time high. This was supported by a net-dollar retention rate3 of +279% from existing SPECs. The efficacy of our AXON-powered Software Platform enabled our tremendous growth from both new and existing clients. +202% to $184 million; Adjusted EBITDA margin improved to 27% Software Platform Revenue ($ millions) $146 +256% Growth +203% Organic2 $41 2Q20 2Q21 366 +218% Software Platform 115 237 +106% Enterprise Clients ex. Adjust ex. Adjust Revenue per Software $364 +7% Platform Enterprise $341 $519 +52% Client (thousands) ex. Adjust ex. Adjust 1 SPEC is a key metric. Refer to the Appendix for definition 2 Organic growth excludes contribution from Adjust 3 We measure Net Dollar-Based Retention Rate for our SPECs as current period revenue divided by prior period revenue. Prior period revenue is measured as revenue from our SPECs as of June 30, 2020. Current period revenue is revenue in 2Q21 from our SPECs as of June 30, 2021, and excludes revenue from any new SPECs during 2Q21. AppLovin Corporation / 2Q 2021 Letter to Shareholders 3
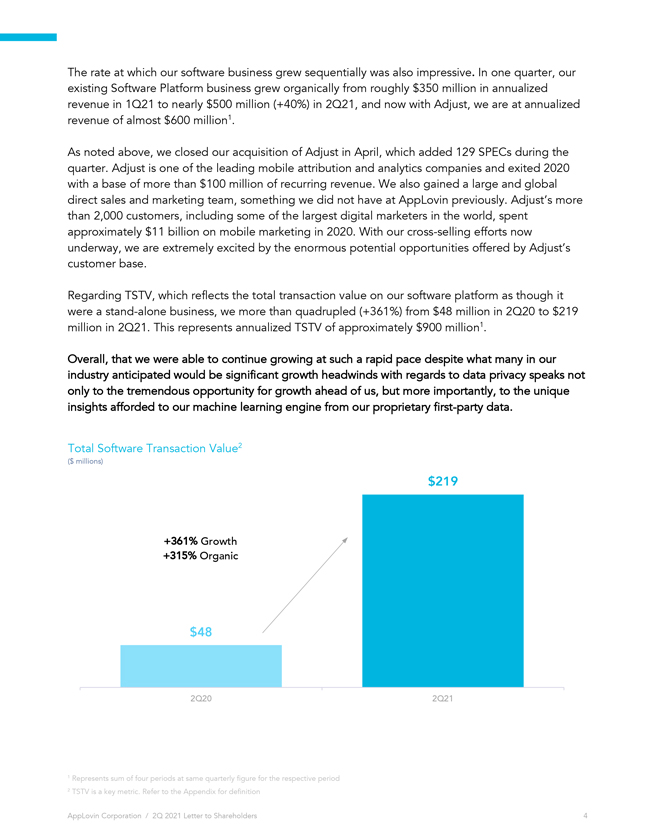
The rate at which our software business grew sequentially was also impressive. In one quarter, our existing Software Platform business grew organically from roughly $350 million in annualized revenue in 1Q21 to nearly $500 million (+40%) in 2Q21, and now with Adjust, we are at annualized revenue of almost $600 million1. As noted above, we closed our acquisition of Adjust in April, which added 129 SPECs during the quarter. Adjust is one of the leading mobile attribution and analytics companies and exited 2020 with a base of more than $100 million of recurring revenue. We also gained a large and global direct sales and marketing team, something we did not have at AppLovin previously. Adjust’s more than 2,000 customers, including some of the largest digital marketers in the world, spent approximately $11 billion on mobile marketing in 2020. With our cross-selling efforts now underway, we are extremely excited by the enormous potential opportunities offered by Adjust’s customer base. Regarding TSTV, which reflects the total transaction value on our software platform as though it were a stand-alone business, we more than quadrupled (+361%) from $48 million in 2Q20 to $219 million in 2Q21. This represents annualized TSTV of approximately $900 million1. Overall, that we were able to continue growing at such a rapid pace despite what many in our industry anticipated would be significant growth headwinds with regards to data privacy speaks not only to the tremendous opportunity for growth ahead of us, but more importantly, to the unique insights afforded to our machine learning engine from our proprietary first-party data. 1 Total Software Transaction Value2 ($ millions) $219 +361% Growth +315% Organic $48 2Q20 2Q21 1 Represents sum of four periods at same quarterly figure for the respective period 2 TSTV is a key metric. Refer to the Appendix for definition AppLovin Corporation / 2Q 2021 Letter to Shareholders
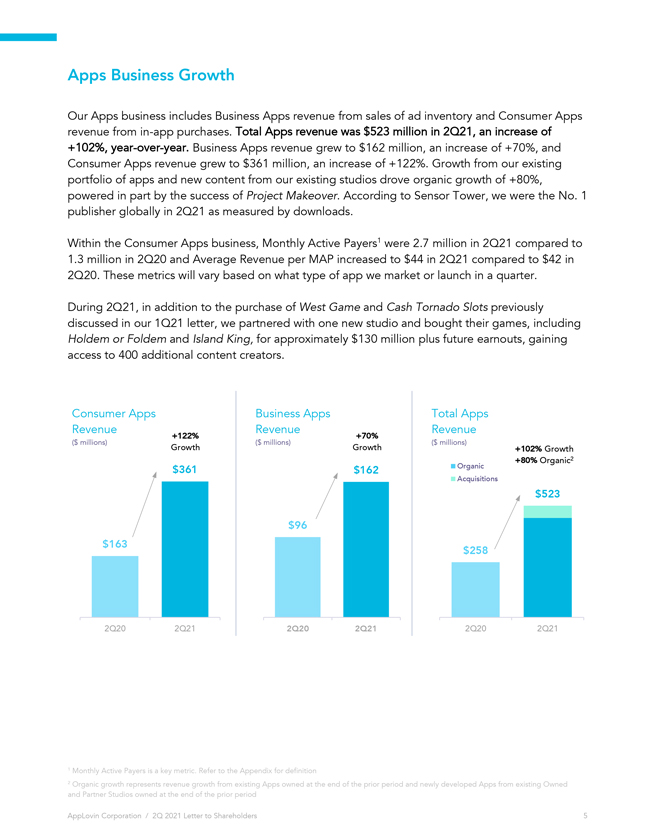
Apps Business Growth Our Apps business includes Business Apps revenue from sales of ad inventory and Consumer Apps revenue from in-app purchases. Total Apps revenue was $523 million in 2Q21, an increase of +102%, year-over-year. Business Apps revenue grew to $162 million, an increase of +70%, and Consumer Apps revenue grew to $361 million, an increase of +122%. Growth from our existing portfolio of apps and new content from our existing studios drove organic growth of +80%, powered in part by the success of Project Makeover. According to Sensor Tower, we were the No. 1 publisher globally in 2Q21 as measured by downloads. Within the Consumer Apps business, Monthly Active Payers1 were 2.7 million in 2Q21 compared to 1.3 million in 2Q20 and Average Revenue per MAP increased to $44 in 2Q21 compared to $42 in 2Q20. These metrics will vary based on what type of app we market or launch in a quarter. During 2Q21, in addition to the purchase of West Game and Cash Tornado Slots previously discussed in our 1Q21 letter, we partnered with one new studio and bought their games, including Holdem or Foldem and Island King, for approximately $130 million plus future earnouts, gaining access to 400 additional content creators. Consumer Apps Business Apps Total Apps Revenue Revenue Revenue +122% +70% ($ millions) ($ millions) ($ millions) Growth Growth +102% Growth Organic +80% Organic2 $361 $162 Acquisitions $523 $96 $163 $258 2Q20 2Q21 2Q20 2Q21 2Q20 2Q21 1 Monthly Active Payers is a key metric. Refer to the Appendix for definition 2 Organic growth represents revenue growth from existing Apps owned at the end of the prior period and newly developed Apps from existing Owned and Partner Studios owned at the end of the prior period AppLovin Corporation / 2Q 2021 Letter to Shareholders 5
Regarding our Apps strategy overall, we are unlike a traditional publisher. We are firstly focused on broad category reach and scaled audience data, followed by long-term cash flow, rather than short-term returns. When we invest in content our focus is to get those apps as large as possible and as quickly as possible by leveraging our marketing scale and cost advantages. Over the past three years, we have quickly scaled to a $2 billion revenue run-rate and have constructed one of the largest pools of mobile development talent with close to 3,000 content developers across 16 global studios. In doing so, we have invested in content across virtually every category of mobile gaming to reach as many mobile users as possible. Our scaled studio resources and experience enable us to organically develop multiple “evergreen” titles in parallel, and we currently anticipate bringing several new evergreen-type apps to market in the second half of 2021. We define an evergreen title as an app with the potential to exceed $100 million in annual revenue over many years, typically requiring meaningful upfront investment in development and user acquisition. Within our Apps portfolio, we have approximately 15 apps that we consider evergreen apps and which have accounted for more than 70% of our Apps revenue in 2Q21. Few pure-play mobile gaming companies can match the breadth, depth, and scale of our portfolio. According to App Annie, we had 11 titles across six genres among the Top-200 grossing games in the US in 2Q21 including Wordscapes, Clockmaker, and Project Makeover. Regarding the recent changes in our industry concerning data privacy and IDFA, overall, the impact on our business remains muted. In-line with what we mentioned last quarter, we have seen material increases in our Software Platform business offset by lower revenue for our Business Apps due to lower CPMs while our Consumer Apps remain generally unaffected.
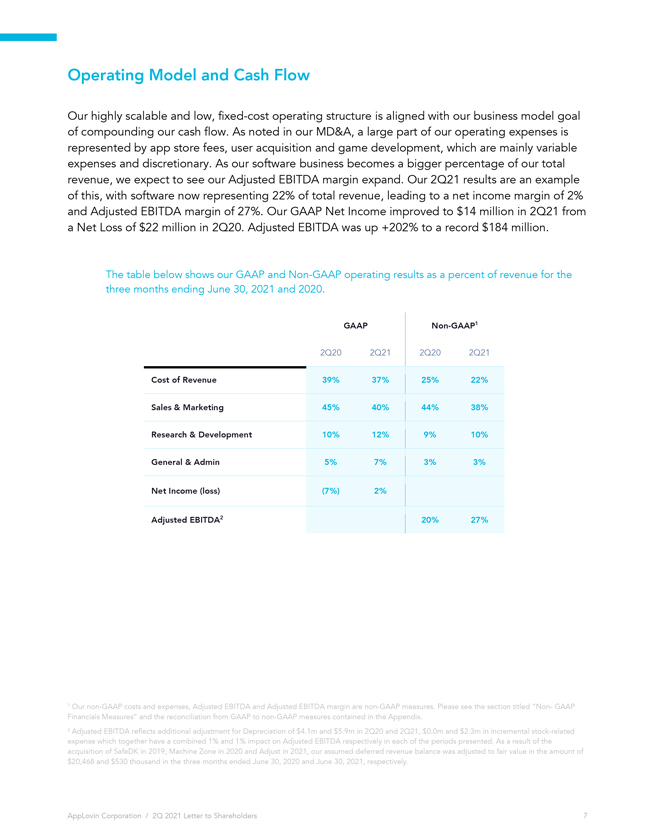
Operating Model and Cash Flow Our highly scalable and low, fixed-cost operating structure is aligned with our business model goal of compounding our cash flow. As noted in our MD&A, a large part of our operating expenses is represented by app store fees, user acquisition and game development, which are mainly variable expenses and discretionary. As our software business becomes a bigger percentage of our total revenue, we expect to see our Adjusted EBITDA margin expand. Our 2Q21 results are an example of this, with software now representing 22% of total revenue, leading to a net income margin of 2% and Adjusted EBITDA margin of 27%. Our GAAP Net Income improved to $14 million in 2Q21 from a Net Loss of $22 million in 2Q20. Adjusted EBITDA was up +202% to a record $184 million. The table below shows our GAAP and Non-GAAP operating results as a percent of revenue for the three months ending June 30, 2021 and 2020. GAAP Non-GAAP1 2Q20 2Q21 2Q20 2Q21 Cost of Revenue 39% 37% 25% 22% Sales & Marketing 45% 40% 44% 38% Research & Development 10% 12% 9% 10% General & Admin 5% 7% 3% 3% Net Income (loss) (7%) 2% Adjusted EBITDA2 20% 27% 1 Our non-GAAP costs and expenses, Adjusted EBITDA and Adjusted EBITDA margin are non-GAAP measures. Please see the section titled “Non- GAAP Financials Measures” and the reconciliation from GAAP to non-GAAP measures contained in the Appendix. 2 Adjusted EBITDA reflects additional adjustment for Depreciation of $4.1m and $5.9m in 2Q20 and 2Q21, $0.0m and $2.3m in incremental stock-related expense which together have a combined 1% and 1% impact on Adjusted EBITDA respectively in each of the periods presented. As a result of the acquisition of SafeDK in 2019, Machine Zone in 2020 and Adjust in 2021, our assumed deferred revenue balance was adjusted to fair value in the amount of $20,468 and $530 thousand in the three months ended June 30, 2020 and June 30, 2021, respectively. AppLovin Corporation / 2Q 2021 Letter to Shareholders 7
Liquidity and Capital Allocation We convert our revenue to profit and cash flow at a high margin. We generated $152 million of operating cash flow for the six-months ending June 30, 2021, compared to $85 million over the same period last year. As of June 30, 2021, we had $1.2 billion of cash and cash equivalents and $1.8 billion in term loan debt outstanding. We have relatively low capital requirements as our capex was less than 1% of revenue for the first six months of 2021. Our strong and consistent cash generation, along with our low capex needs, has enabled us to invest in our team, technology, data, content, and M&A. Our Approach and Outlook Our strategic priority is to construct a high-growth and durable business that can compound our company’s equity value over the long-term. We are fortunate to be a relatively young and dynamic business operating in fast-moving and expanding markets, which offer us tremendous growth opportunities. Our approach to capitalizing on these opportunities is the same that led to our success thus-far: Make strategic decisions focusing on initiatives that can create substantial growth over the long-term with a willingness to take on calculated near-term risk for long-term reward. This approach allows us to focus on two goals: Find and invest in new initiatives that can create substantial new opportunities, ones that can multiply the value of our company. Targeting to deliver cash flow growth of 30%+ over the long-term. For the first 10 years of our history, we did just that—nimbly entering new markets, growing at a rapid pace, and ultimately creating significant shareholder returns. For example, despite some near-term risk, we chose to enter the mobile content business in 2018, and through strong execution vastly improved our strategic position and market opportunity. In the middle of last year, we sacrificed some short-term software revenue by transitioning to our now highly successful ML-based AXON platform. As we reflect on our past, and what helped build some of the greatest companies in the world today, we believe having the flexibility to make bold investments and execute based on a long-term vision creates the best returns. Consistent with that approach, we will provide annual financial guidance early each calendar year, and not offer quarterly guidance. During our quarterly reviews, we will provide an update on our business outlook, but not typically update the annual financial guidance. We will update our financial guidance if we have a substantive acquisition or we expect material underperformance. We enter the second half of 2021 with very strong momentum across our business in software and in apps with the launch of several new evergreen titles, giving us confidence in delivering against the stand-alone financial outlook provided previously: 2021 projected revenue of $2.65 billion to $2.70 billion (over +80% year-over-year growth) and Adjusted EBITDA of $680 million to $700 million (approximately doubling year-over-year). Our one newly announced investment is expected to have an immaterial impact our outlook above. AppLovin Corporation / 2Q 2021 Letter to Shareholders 8
Conclusion We are pleased with our strategic and operational progress in 2Q21 achieving record revenue and Adjusted EBITDA, and we are even more excited by the opportunities for long-term growth ahead in our large and broadening markets. Our confidence stems from the incredibly talented and expanding AppLovin team, who are leading improvements and many innovative new projects across our software platform and app portfolio. Thank you again for your partnership and support and look forward to reporting on our progress in 3Q21. Adam Foroughi, CEO Herald Chen, President & CFO AppLovin Corporation / 2Q 2021 Letter to Shareholders 9
Appendix This letter to shareholders contains forward-looking statements within the meaning of Section 27A of the Securities Act of 1933 and Section 21E of the Securities Exchange Act of 1934. Forward-looking statements generally relate to future events or our future financial or operating performance. In some cases, you can identify forward-looking statements because they contain words such as “may,” “will,” “should,” “expect,” “plan,” “anticipate,” “going to,” “could,” “intend,” “target,” “project,” “contemplate,” “believe,” “estimate,” “predict,” “potential,” or “continue,” or the negative of these words or other similar terms or expressions that concern our expectations, strategy, priorities, plans, or intentions. Forward-looking statements in this letter to shareholders include, but are not limited to, statements regarding our future financial performance, including our expected financial results, guidance and long-term margin goals and the statements in the section titled “Our Approach and Outlook,” our expectations regarding our revenue, enterprise clients, Adjusted EBITDA, and Adjusted EBITDA margin; our ability to achieve or maintain future profitability; our expected synergies regarding our Software Platform and first-party apps; our ability to attract and retain SPECs and consumers of our Apps; the expected benefits of the Adjust acquisition; our expectations regarding the impact of iOS 14.5; our ability to manage risks associated with our business; our expectations regarding future product and app launches, including our ability to expand beyond mobile gaming, and our expectations regarding our market opportunity, including its capacity to allow us to sustain our current rate of growth. Our expectations and beliefs regarding these matters may not materialize, and actual results in future periods are subject to risks and uncertainties, including changes in our plans or assumptions, that could cause actual results to differ materially from those projected. These risks include our inability to forecast our business due to our limited operating history, fluctuations in our results of operations, the competitive mobile app ecosystem, our inability to adapt to emerging technologies and business models. The forward-looking statements contained in this letter to shareholders are also subject to other risks and uncertainties, including those more fully described in our Quarterly Report on Form 10-Q for the fiscal quarter ended March 31, 2021. Additional information will also be set forth in our Quarterly Report on Form 10-Q for the fiscal quarter ended June 30, 2021. The forward-looking statements in this letter to shareholders are based on information available to us as of the date hereof, and we disclaim any obligation to update any forward-looking statements, except as required by law. AppLovin Corporation / 2Q 2021 Letter to Shareholders 10
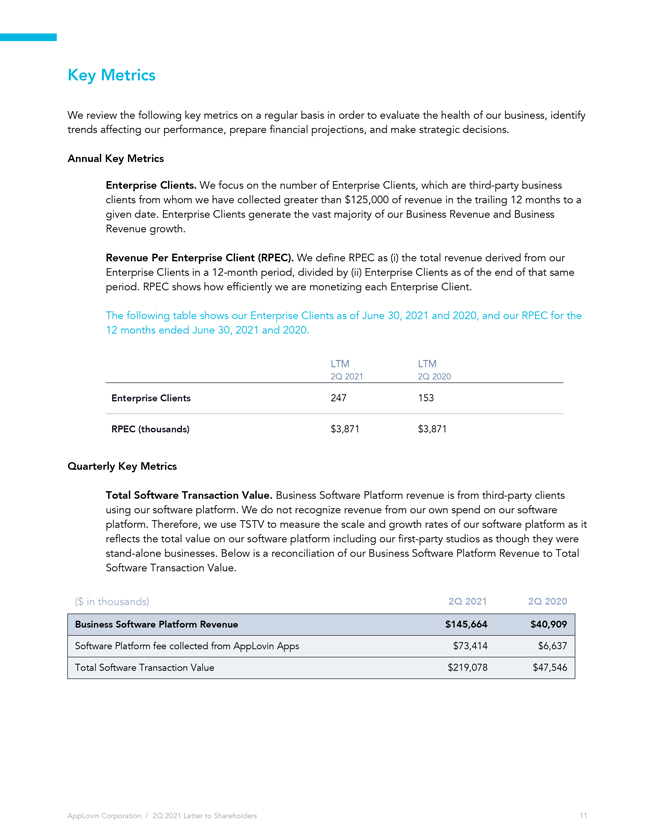
Key Metrics We review the following key metrics on a regular basis in order to evaluate the health of our business, identify trends affecting our performance, prepare financial projections, and make strategic decisions. Annual Key Metrics Enterprise Clients. We focus on the number of Enterprise Clients, which are third-party business clients from whom we have collected greater than $125,000 of revenue in the trailing 12 months to a given date. Enterprise Clients generate the vast majority of our Business Revenue and Business Revenue growth. Revenue Per Enterprise Client (RPEC). We define RPEC as (i) the total revenue derived from our Enterprise Clients in a 12-month period, divided by (ii) Enterprise Clients as of the end of that same period. RPEC shows how efficiently we are monetizing each Enterprise Client. The following table shows our Enterprise Clients as of June 30, 2021 and 2020, and our RPEC for the 12 months ended June 30, 2021 and 2020. LTM LTM 2Q 2021 2Q 2020 Enterprise Clients 247 153 RPEC (thousands) $3,871 $3,871 Quarterly Key Metrics Total Software Transaction Value. Business Software Platform revenue is from third-party clients using our software platform. We do not recognize revenue from our own spend on our software platform. Therefore, we use TSTV to measure the scale and growth rates of our software platform as it reflects the total value on our software platform including our first-party studios as though they were stand-alone businesses. Below is a reconciliation of our Business Software Platform Revenue to Total Software Transaction Value. ($ in thousands) 2Q 2021 2Q 2020 Business Software Platform Revenue $145,664 $40,909 Software Platform fee collected from AppLovin Apps $73,414 $6,637 Total Software Transaction Value $219,078 $47,546 AppLovin Corporation / 2Q 2021 Letter to Shareholders 11
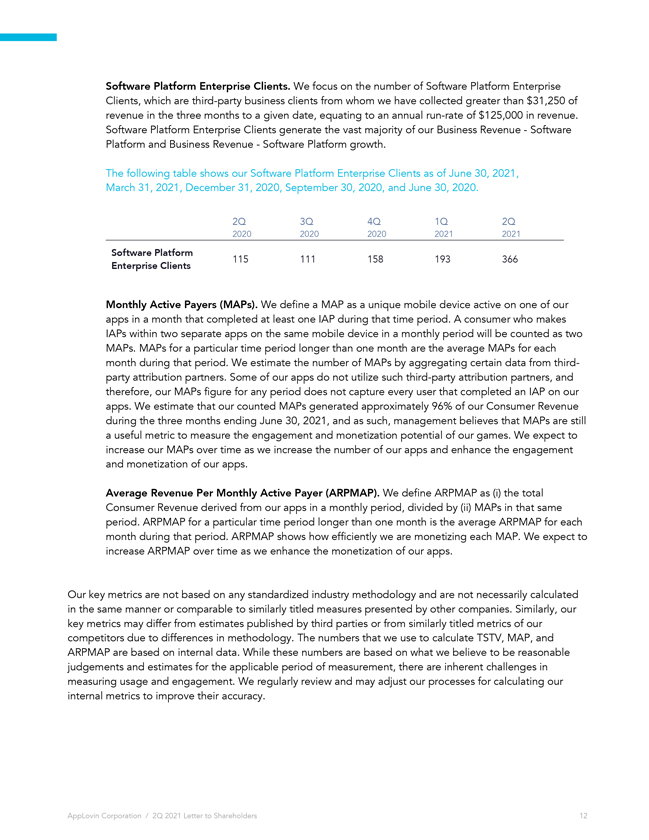
Software Platform Enterprise Clients. We focus on the number of Software Platform Enterprise Clients, which are third-party business clients from whom we have collected greater than $31,250 of revenue in the three months to a given date, equating to an annual run-rate of $125,000 in revenue. Software Platform Enterprise Clients generate the vast majority of our Business Revenue—Software Platform and Business Revenue—Software Platform growth. The following table shows our Software Platform Enterprise Clients as of June 30, 2021, March 31, 2021, December 31, 2020, September 30, 2020, and June 30, 2020. 2Q 3Q 4Q 1Q 2Q 2020 2020 2020 2021 2021 Software Platform 115 111 158 193 366 Enterprise Clients Monthly Active Payers (MAPs). We define a MAP as a unique mobile device active on one of our apps in a month that completed at least one IAP during that time period. A consumer who makes IAPs within two separate apps on the same mobile device in a monthly period will be counted as two MAPs. MAPs for a particular time period longer than one month are the average MAPs for each month during that period. We estimate the number of MAPs by aggregating certain data from third-party attribution partners. Some of our apps do not utilize such third-party attribution partners, and therefore, our MAPs figure for any period does not capture every user that completed an IAP on our apps. We estimate that our counted MAPs generated approximately 96% of our Consumer Revenue during the three months ending June 30, 2021, and as such, management believes that MAPs are still a useful metric to measure the engagement and monetization potential of our games. We expect to increase our MAPs over time as we increase the number of our apps and enhance the engagement and monetization of our apps. Average Revenue Per Monthly Active Payer (ARPMAP). We define ARPMAP as (i) the total Consumer Revenue derived from our apps in a monthly period, divided by (ii) MAPs in that same period. ARPMAP for a particular time period longer than one month is the average ARPMAP for each month during that period. ARPMAP shows how efficiently we are monetizing each MAP. We expect to increase ARPMAP over time as we enhance the monetization of our apps. Our key metrics are not based on any standardized industry methodology and are not necessarily calculated in the same manner or comparable to similarly titled measures presented by other companies. Similarly, our key metrics may differ from estimates published by third parties or from similarly titled metrics of our competitors due to differences in methodology. The numbers that we use to calculate TSTV, MAP, and ARPMAP are based on internal data. While these numbers are based on what we believe to be reasonable judgements and estimates for the applicable period of measurement, there are inherent challenges in measuring usage and engagement. We regularly review and may adjust our processes for calculating our internal metrics to improve their accuracy. AppLovin Corporation / 2Q 2021 Letter to Shareholders12
Non-GAAP Financial Metrics To supplement our financial information presented in accordance with generally accepted accounting principles in the United States (“GAAP”), this letter includes certain financial measures that are not prepared in accordance with GAAP, including Adjusted EBITDA, Adjusted EBITDA margin, and non-GAAP costs and expense. A reconciliation of each such non-GAAP financial measure to the most directly comparable GAAP measure can be found below. We define Adjusted EBITDA for a particular period as net income (loss) before interest expense and loss on settlement of debt, other (income) expense, net, provision for (benefit from) income taxes, amortization, depreciation and write-offs and as further adjusted for stock-based compensation expense, acquisition-related expense and transaction bonuses, loss (gain) on extinguishments of acquisition-related contingent consideration, non-operating foreign exchange (gains) losses, lease modification and abandonment of leasehold improvements, and change in the fair value of contingent consideration. We define Adjusted EBITDA margin as Adjusted EBITDA divided by revenue for the same period. We define non-GAAP costs and expenses as total costs and expenses adjusted to exclude stock-based compensation expense, amortization expense related to acquired intangibles and acquisition-related expense and transaction bonuses. We believe that the presentation of these non-GAAP financial measures provides useful information to investors regarding our results of operations and operating performance, as they are similar to measures reported by our public competitors and are regularly used by securities analysts, institutional investors, and other interested parties in analyzing operating performance and prospects. Adjusted EBITDA, Adjusted EBITDA margin, and non-GAAP costs and expenses are key measures we use to assess our financial performance and are also used for internal planning and forecasting purposes. We believe Adjusted EBITDA, Adjusted EBITDA margin, and non-GAAP costs and expenses are helpful to investors, analysts, and other interested parties because they can assist in providing a more consistent and comparable overview of our operations across our historical financial periods. In addition, these measures are frequently used by analysts, investors, and other interested parties to evaluate and assess performance. We use Adjusted EBITDA, Adjusted EBITDA margin, and non-GAAP costs and expenses in conjunction with GAAP measures as part of our overall assessment of our performance, including the preparation of our annual operating budget and quarterly forecasts, to evaluate the effectiveness of our business strategies, and to communicate with our board of directors concerning our financial performance. Our definitions may differ from the definitions used by other companies and therefore comparability may be limited. In addition, other companies may not publish these or similar metrics. Furthermore, these metrics have certain limitations in that they do not include the impact of certain expenses that are reflected in our consolidated statement of operations that are necessary to run our business. Thus, our non-GAAP financial measures should be considered in addition to, not as substitutes for, or in isolation from, measures prepared in accordance with GAAP. AppLovin Corporation / 2Q 2021 Letter to Shareholders13
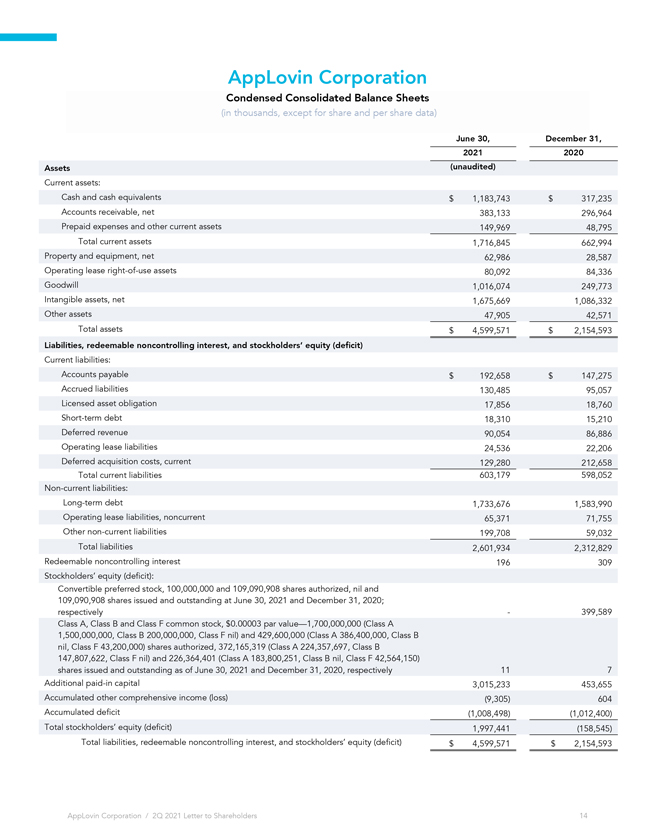
AppLovin Corporation Condensed Consolidated Balance Sheets (in thousands, except for share and per share data) June 30, December 31, 2021 2020 Assets (unaudited) Current assets:Cash and cash equivalents $1,183,743$317,235 Accounts receivable, net 383,133296,964 Prepaid expenses and other current assets 149,96948,795 Total current assets 1,716,845662,994 Property and equipment, net 62,98628,587 Operating lease right-of-use assets 80,09284,336 Goodwill 1,016,074249,773 Intangible assets, net 1,675,6691,086,332 Other assets 47,90542,571 Total assets $4,599,571$2,154,593 Liabilities, redeemable noncontrolling interest, and stockholders’ equity (deficit) Current liabilities: Accounts payable $192,658$147,275 Accrued liabilities 130,48595,057 Licensed asset obligation 17,85618,760 Short-term debt 18,31015,210 Deferred revenue 90,05486,886 Operating lease liabilities 24,53622,206 Deferred acquisition costs, current 129,280212,658 Total current liabilities 603,179598,052 Non-current liabilities: Long-term debt 1,733,6761,583,990 Operating lease liabilities, noncurrent 65,37171,755 Other non-current liabilities 199,70859,032 Total liabilities 2,601,9342,312,829 Redeemable noncontrolling interest 196309 Stockholders’ equity (deficit): Convertible preferred stock, 100,000,000 and 109,090,908 shares authorized, nil and109,090,908 shares issued and outstanding at June 30, 2021 and December 31, 2020; respectively —399,589 Class A, Class B and Class F common stock, $0.00003 par value—1,700,000,000 (Class A 1,500,000,000, Class B 200,000,000, Class F nil) and 429,600,000 (Class A 386,400,000, Class B nil, Class F 43,200,000) shares authorized, 372,165,319 (Class A 224,357,697, Class B 147,807,622, Class F nil) and 226,364,401 (Class A 183,800,251, Class B nil, Class F 42,564,150) shares issued and outstanding as of June 30, 2021 and December 31, 2020, respectively117 Additional paid-in capital 3,015,233453,655 Accumulated other comprehensive income (loss) (9,305) 604 Accumulated deficit (1,008,498)(1,012,400) Total stockholders’ equity (deficit) 1,997,441(158,545) Total liabilities, redeemable noncontrolling interest, and stockholders’ equity (deficit) $4,599,571$2,154,593 AppLovin Corporation / 2Q 2021 Letter to Shareholders 15
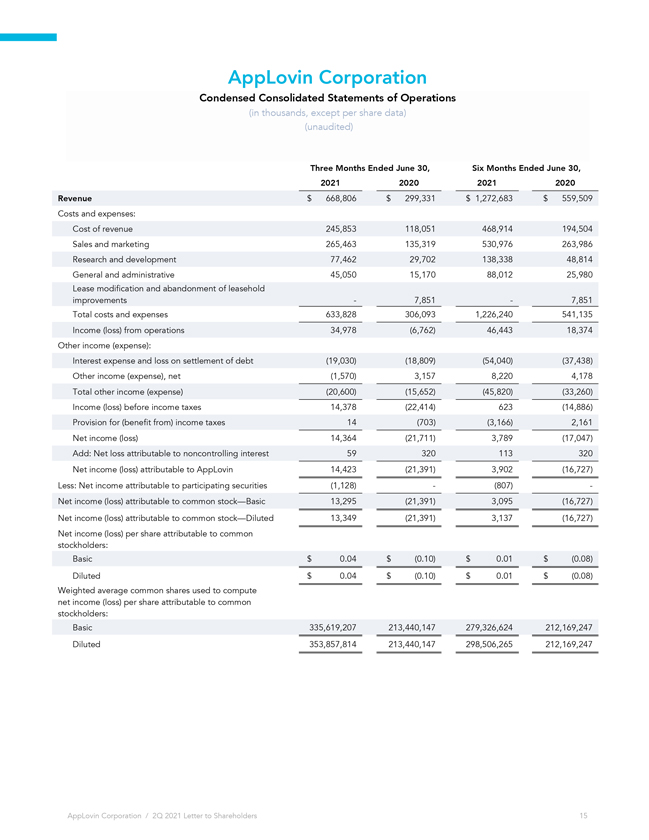
AppLovin Corporation Condensed Consolidated Statements of Operations (in thousands, except per share data) (unaudited) Three Months Ended June 30, Six Months Ended June 30,2021 2020 2021 2020 Revenue $668,806$299,331$ 1,272,683$559,509Costs and expenses:Cost of revenue 245,853118,051468,914194,504Sales and marketing 265,463135,319530,976263,986Research and development 77,46229,702138,33848,814General and administrative 45,05015,17088,01225,980Lease modification and abandonment of leasehold improvements —7,851—7,851Total costs and expenses 633,828306,0931,226,240541,135Income (loss) from operations 34,978(6,762)46,44318,374Other income (expense):Interest expense and loss on settlement of debt (19,030)(18,809)(54,040)(37,438) Other income (expense), net (1,570)3,1578,2204,178Total other income (expense) (20,600)(15,652)(45,820)(33,260) Income (loss) before income taxes 14,378(22,414)623(14,886) Provision for (benefit from) income taxes 14(703)(3,166)2,161Net income (loss) 14,364(21,711)3,789(17,047) Add: Net loss attributable to noncontrolling interest 59320113320Net income (loss) attributable to AppLovin 14,423(21,391)3,902(16,727) Less: Net income attributable to participating securities (1,128) —(807) — Net income (loss) attributable to common stock—Basic 13,295(21,391)3,095(16,727) Net income (loss) attributable to common stock—Diluted 13,349(21,391)3,137(16,727) Net income (loss) per share attributable to common stockholders: Basic $0.04$(0.10)$0.01$(0.08) Diluted $0.04$(0.10)$0.01$(0.08) Weighted average common shares used to computenet income (loss) per share attributable to common stockholders:Basic 335,619,207213,440,147279,326,624212,169,247Diluted 353,857,814213,440,147298,506,265212,169,247 AppLovin Corporation / 2Q 2021 Letter to Shareholders15
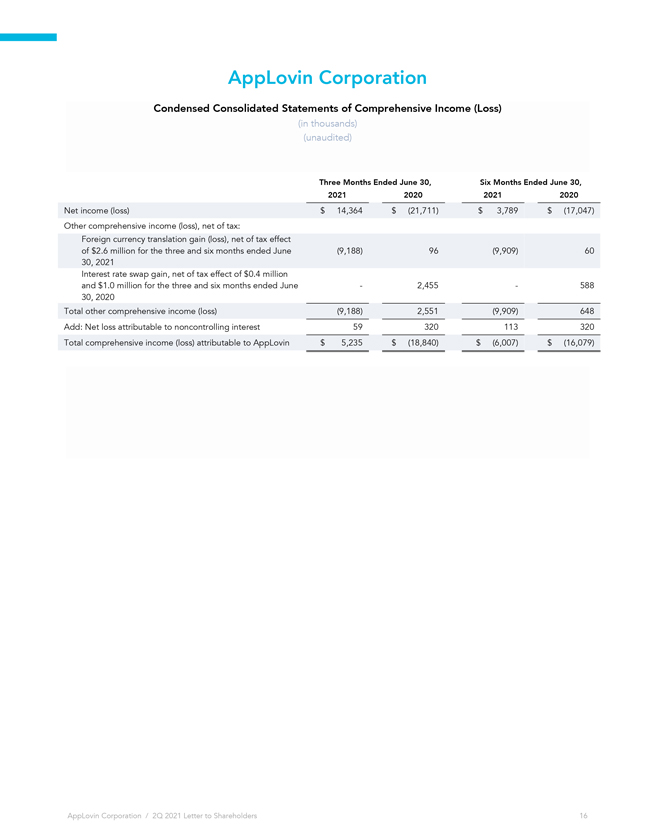
AppLovin Corporation Condensed Consolidated Statements of Comprehensive Income (Loss) (in thousands) (unaudited) Three Months Ended June 30, Six Months Ended June 30, 2021 2020 2021 2020 Net income (loss) $14,364$(21,711)$3,789$(17,047) Other comprehensive income (loss), net of tax:Foreign currency translation gain (loss), net of tax effect of $2.6 million for the three and six months ended June (9,188)96(9,909)60 30, 2021 Interest rate swap gain, net of tax effect of $0.4 million and $1.0 million for the three and six months ended June —2,455—588 30, 2020 Total other comprehensive income (loss) (9,188)2,551(9,909)648 Add: Net loss attributable to noncontrolling interest 59320113320 Total comprehensive income (loss) attributable to AppLovin $5,235$(18,840)$(6,007)$(16,079) AppLovin Corporation / 2Q 2021 Letter to Shareholders16
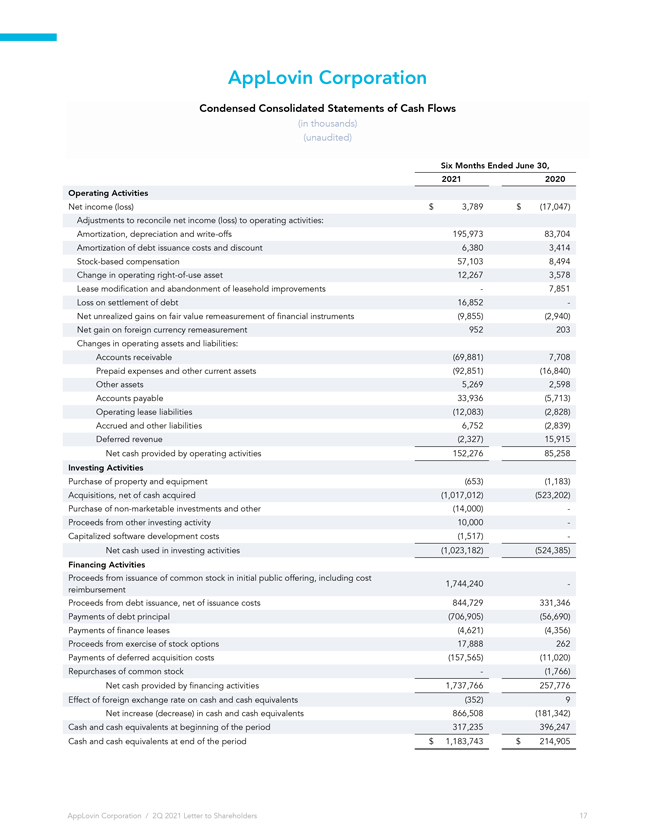
AppLovin Corporation Condensed Consolidated Statements of Cash Flows (in thousands) (unaudited) Six Months Ended June 30, 20212020 Operating Activities Net income (loss) $3,789$(17,047) Adjustments to reconcile net income (loss) to operating activities:Amortization, depreciation and write-offs195,97383,704 Amortization of debt issuance costs and discount6,380 3,414 Stock-based compensation57,103 8,494 Change in operating right-of-use asset12,267 3,578 Lease modification and abandonment of leasehold improvements— 7,851 Loss on settlement of debt16,852— Net unrealized gains on fair value remeasurement of financial instruments(9,855)(2,940) Net gain on foreign currency remeasurement952203 Changes in operating assets and liabilities:Accounts receivable(69,881) 7,708 Prepaid expenses and other current assets(92,851)(16,840) Other assets5,269 2,598 Accounts payable33,936 (5,713) Operating lease liabilities(12,083)(2,828) Accrued and other liabilities6,752 (2,839) Deferred revenue(2,327)15,915 Net cash provided by operating activities152,27685,258 Investing Activities Purchase of property and equipment (653)(1,183) Acquisitions, net of cash acquired(1,017,012)(523,202) Purchase of non-marketable investments and other(14,000)— Proceeds from other investing activity10,000— Capitalized software development costs(1,517)— Net cash used in investing activities(1,023,182)(524,385) Financing Activities Proceeds from issuance of common stock in initial public offering, including cost 1,744,240— reimbursement Proceeds from debt issuance, net of issuance costs844,729331,346 Payments of debt principal(706,905)(56,690) Payments of finance leases(4,621)(4,356) Proceeds from exercise of stock options17,888262 Payments of deferred acquisition costs(157,565)(11,020) Repurchases of common stock—(1,766) Net cash provided by financing activities1,737,766257,776 Effect of foreign exchange rate on cash and cash equivalents (352)9 Net increase (decrease) in cash and cash equivalents866,508(181,342) Cash and cash equivalents at beginning of the period317,235396,247 Cash and cash equivalents at end of the period $1,183,743$214,905 AppLovin Corporation / 2Q 2021 Letter to Shareholders17
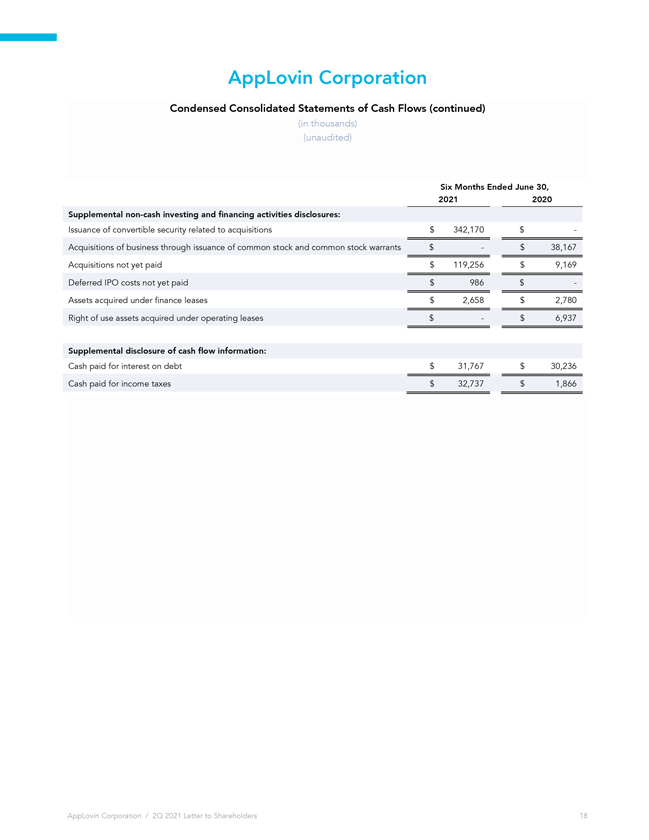
AppLovin Corporation Condensed Consolidated Statements of Cash Flows (continued) (in thousands) (unaudited) Six Months Ended June 30, 2021 2020 Supplemental non-cash investing and financing activities disclosures: Issuance of convertible security related to acquisitions $342,170$— Acquisitions of business through issuance of common stock and common stock warrants $—$38,167 Acquisitions not yet paid $119,256$9,169 Deferred IPO costs not yet paid $986$— Assets acquired under finance leases $2,658$2,780 Right of use assets acquired under operating leases $—$6,937 Supplemental disclosure of cash flow information: Cash paid for interest on debt $31,767$30,236 Cash paid for income taxes $32,737$1,866 AppLovin Corporation / 2Q 2021 Letter to Shareholders18
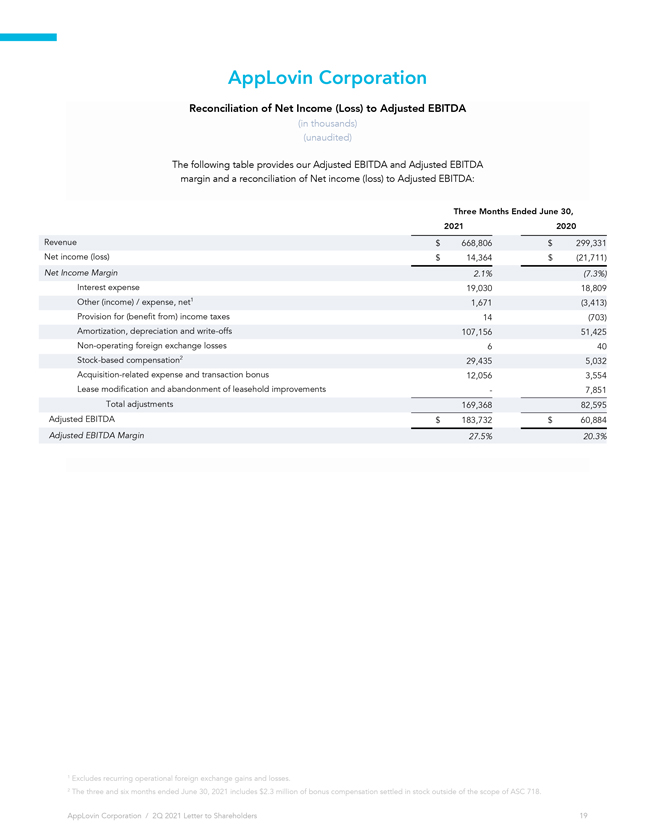
AppLovin Corporation Reconciliation of Net Income (Loss) to Adjusted EBITDA (in thousands) (unaudited) The following table provides our Adjusted EBITDA and Adjusted EBITDA margin and a reconciliation of Net income (loss) to Adjusted EBITDA: Three Months Ended June 30, 2021 2020 Revenue $ 668,806 $ 299,331 Net income (loss) $ 14,364 $ (21,711) Net Income Margin 2.1% (7.3%) Interest expense 19,030 18,809 Other (income) / expense, net1 1,671 (3,413) Provision for (benefit from) income taxes 14 (703) Amortization, depreciation and write-offs 107,156 51,425 Non-operating foreign exchange losses 6 40 Stock-based compensation2 29,435 5,032 Acquisition-related expense and transaction bonus 12,056 3,554 Lease modification and abandonment of leasehold improvements— 7,851 Total adjustments 169,368 82,595 Adjusted EBITDA $ 183,732 $ 60,884 Adjusted EBITDA Margin 27.5% 20.3% 1 Excludes recurring operational foreign exchange gains and losses. 2 The three and six months ended June 30, 2021 includes $2.3 million of bonus compensation settled in stock outside of the scope of ASC 718. AppLovin Corporation / 2Q 2021 Letter to Shareholders 19
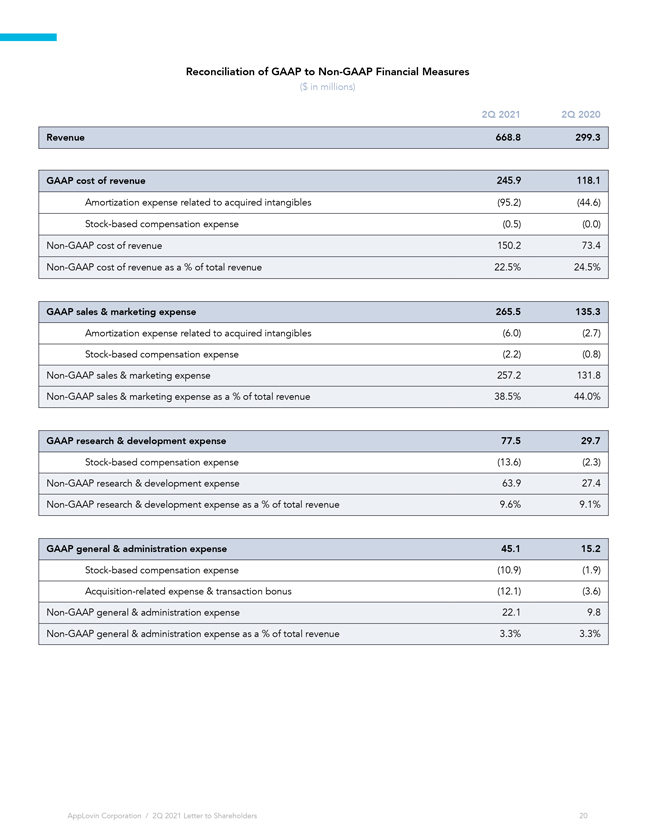
Reconciliation of GAAP to Non-GAAP Financial Measures ($ in millions) 2Q 2021 2Q 2020 Revenue 668.8 299.3 GAAP cost of revenue 245.9 118.1 Amortization expense related to acquired intangibles (95.2) (44.6) Stock-based compensation expense (0.5) (0.0) Non-GAAP cost of revenue 150.2 73.4 Non-GAAP cost of revenue as a % of total revenue 22.5% 24.5% GAAP sales & marketing expense 265.5 135.3 Amortization expense related to acquired intangibles (6.0) (2.7) Stock-based compensation expense (2.2) (0.8) Non-GAAP sales & marketing expense 257.2 131.8 Non-GAAP sales & marketing expense as a % of total revenue 38.5% 44.0% GAAP research & development expense 77.5 29.7 Stock-based compensation expense (13.6) (2.3) Non-GAAP research & development expense 63.9 27.4 Non-GAAP research & development expense as a % of total revenue 9.6% 9.1% GAAP general & administration expense 45.1 15.2 Stock-based compensation expense (10.9) (1.9) Acquisition-related expense & transaction bonus (12.1) (3.6) Non-GAAP general & administration expense 22.1 9.8 Non-GAAP general & administration expense as a % of total revenue 3.3% 3.3% AppLovin Corporation / 2Q 2021 Letter to Shareholders 20