Exhibit 99.1
To Our AppLovin Shareholders:
Our business performed as expected in the fourth quarter with steady results in our Software Platform segment and the operational optimization of our Apps segment nearing completion. Underlying trends in the mobile gaming and app market remained soft but stable as compared to the third quarter. We continue to invest in our strong team who are expanding our leading ad solutions, improving our Apps portfolio and pursuing several growth initiatives.
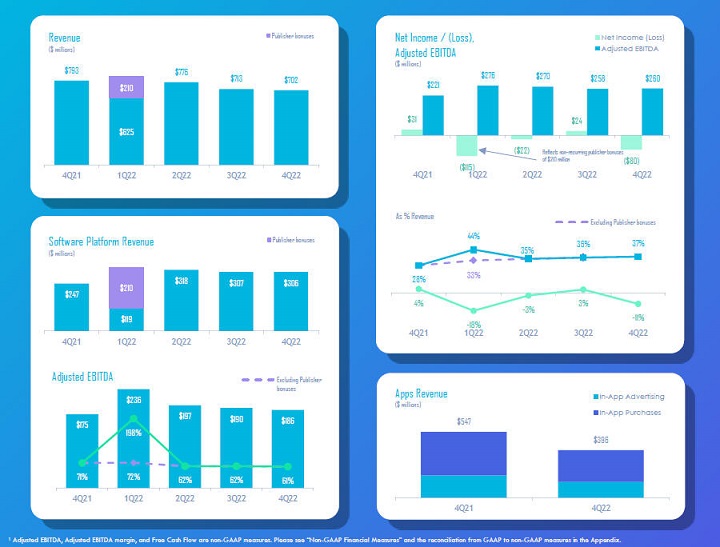
We generated $2.8 billion in revenue in 2022 and a net loss of $193 million, a (7)% net margin. Our Adjusted EBITDA grew to over $1 billion at a 38% Adjusted EBITDA margin. We are pleased with the focus of our team to achieve results in line with the guidance we provided last quarter. Total revenue for the fourth quarter of 2022 was $702 million, slightly above the top end of our quarterly guidance. In the fourth quarter of 2022, net loss was $80 million, net margin was (11)%, and Adjusted EBITDA was $260 million, near the high end of our quarterly guidance, at a 37% Adjusted EBITDA margin. During the quarter, we generated $163 million of net cash from operating activities and $157 million of Free Cash Flow1. Our cash generation and balance sheet cash allow us to reinvest in our business with a long-term value creation mindset.
Our strategic priorities today remain consistent with those provided in our third quarter 2022 Shareholder Letter: (1) attracting and retaining the best talent; (2) improving our core tech; (3) investing in several new initiatives; (4) optimizing our Apps portfolio and overall cost structure; (5) allocating capital efficiently; and (6) building an aligned shareholder base. If we execute well against each of these priorities, we can deepen our market leading position and expand our reach, driving strong returns over the long term.
For the first quarter of 2023, we see the mobile ad market remaining relatively stable. Developers continue to closely monitor their overall profitability and advertisers appear to be maintaining overall ad budgets and return on ad spend goals, informing our outlook for the quarter. For the first quarter of 2023, we expect consistent performance to our fourth quarter of 2022 with total revenue of $685 to $705 million, Adjusted EBITDA of $250 to $270 million, and an Adjusted EBITDA margin of 36% to 38%.
Financial Guidance Summary
| 1Q23 | ||
Total Revenue | $685 to $705 million | |
Adjusted EBITDA | $250 to $270 million | |
Adjusted EBITDA Margin2 | 36% - 38% |
| 1 | This quarter we are introducing a new non-GAAP financial measure, Free Cash Flow, which represents net cash provided by operating activities less purchases of property and equipment and payment of finance leases. We use Free Cash Flow to help manage the health of our business, prepare budgets and for capital allocation purposes. We believe Free Cash Flow provides useful supplemental information to help investors understand underlying trends in our business and our liquidity. We have provided historical reconciliations of GAAP to non-GAAP metrics in tables at the end of this letter. |
| 2 | We have not provided the forward-looking GAAP equivalents for forward-looking non-GAAP metrics, specifically Adjusted EBITDA and Adjusted EBITDA margin, or a GAAP reconciliation as a result of the uncertainty regarding, and the potential variability of, reconciling items such as stock-based compensation expense. Accordingly, a reconciliation of these non-GAAP guidance metrics to their corresponding GAAP equivalents is not available without unreasonable effort. However, it is important to note that material changes to reconciling items could have a significant effect on future GAAP results. We have provided historical reconciliations of GAAP to non-GAAP metrics in tables at the end of this letter. |
| AppLovin Corporation / 4Q22 Shareholder Letter | 2 |
Turning to our balance sheet, we had $1.1 billion of cash and cash equivalents at the end of 2022. We will continue to assess the best use of our balance sheet and cash flow to optimize shareholder returns including investing in key projects, strategic acquisitions, and share repurchases.
| AppLovin Corporation / 4Q22 Shareholder Letter | 3 |
4Q22
Financial Overview
ALL COMPARISONS ARE TO 4Q21 UNLESS OTHERWISE NOTED. WE ACCOUNTED FOR $210 MILLION IN PUBLISHER BONUSES AS A CONTRA-REVENUE ADJUSTMENT IN 1Q22. THIS AMOUNT IS REFLECTED IN FIGURES BELOW BUT IS ADDED BACK TO ADJUSTED EBITDA.
| Revenue was $702 million, a decline of 11%. | Software Platform revenue grew 24% to $306 million. | |
| Software Platform revenue increased to 44% of total revenue compared to 31%. | Segment Adjusted EBITDA grew 6% to $186 million, a 61% margin. | |
| Net Loss was ($80) million, a net margin of (11%) compared to net income of $31 million and a net margin of 4%. | Apps revenue declined 28% to $396 million. Segment Adjusted EBITDA improved 61% to $74 million, a 19% margin. | |
| Adjusted EBITDA1 increased 17% to $260 million and Adjusted EBITDA margin increased to 37% from 28%. | Cash Flow: We generated $163 million of net cash from operating activities and $157 million of Free Cash Flow1. | |
| AppLovin Corporation / 4Q22 Shareholder Letter | 4 |
Software Platform Update
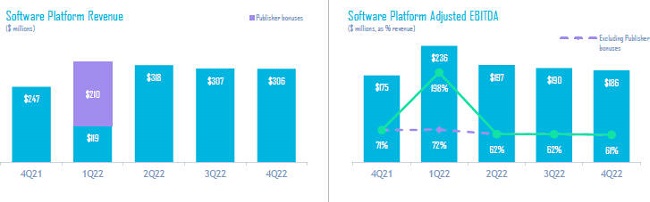
Our Software Platform revenue was up 24% year-over-year to $306 million in the fourth quarter, primarily driven by higher installs and revenue per install from our advertising solutions. Quarterly revenue was flat with the third quarter and in line with our expectations. Software Platform Adjusted EBITDA in the fourth quarter grew 6% year-over-year to $186 million at an Adjusted EBITDA margin of 61%. For the year 2022, we reached $1.0 billion in Software Platform revenue, up 56% year-over-year, and delivered $808 million of Adjusted EBITDA, up 77% year-over-year. This represents a 77% Adjusted EBITDA margin or a 64% Adjusted EBITDA margin excluding $210 million of non-recurring publisher bonuses.
As our Software Platform continues to evolve, we continue to evaluate metrics that facilitate an understanding of our business, which includes AppDiscovery, MAX, AppLovin Exchange (ALX), Adjust, Wurl, and Array. Following the addition and integration of offerings like Adjust and Wurl, as well as the launch of our Array offering, the revenue mix within our Software Platform segment is shifting and we expect this shift will become more pronounced over time as these businesses grow. Given the structural differences in these businesses – in terms of their revenue models as well as the nature of their clients – we believe our current key metrics for the Software Platform will no longer provide a valuable method to understand fluctuations in the performance of our Software Platform revenue. As a result, beginning in the first quarter of 2023, we will no longer report Total Software Transaction Value (TSTV), Software Platform Enterprise Clients (SPEC), and Revenue per Software Platform Enterprise Client. Today, AppDiscovery and ALX revenue still comprise the vast majority of our Software Platform revenue.
For now, we will continue to provide revenue disclosure in our periodic reporting that discusses changes in the volume of advertising installs and revenue per install for AppDiscovery and ALX. For example, for the year ended 2022, our Software Platform revenue increased from the prior year period primarily due to AppDiscovery and ALX, where revenue per installation increased 46% and installations increased 24%. As other initiatives gain scale, we will continue to review our disclosures and add additional metrics and details as appropriate.
| �� AppLovin Corporation / 4Q22 Shareholder Letter | 5 |
Apps Update
Over the past several quarters, we have been actively managing the operational optimization of our Apps portfolio and have nearly completed the key projects identified. This included a reduction of headcount, restructuring of earn out arrangements, and the sale or closure of certain underperforming studios. Our Apps segment is now comprised of 11 studios plus several publishing relationships that we believe can collectively increase enterprise value over time. We will continue to manage these assets for financial return, including investing for growth through new game launches, as well as remain open to evaluating opportunities to drive increased shareholder value through the retention, restructure, or sale of assets in the future.
Beginning with the fourth quarter of 2022, we are changing the terms used to describe our two Apps segment revenue streams to better align with market terminology. We will refer to our Apps “Business” revenue as “In-App Advertising” (“IAA”) and “Consumer” revenue as “In-App Purchases” (“IAP”).
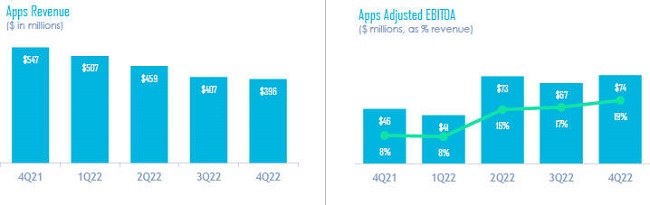
In the fourth quarter of 2022, our Apps segment revenue declined 28% year-over-year to $396 million due primarily to a decline in In-App Purchase revenue. Apps Adjusted EBITDA increased 61% year-over-year to $74 million and Adjusted EBITDA margin improved to 19% from 8% due to a reduction in operating costs and the sale of certain non-strategic assets as part of the optimization of the Apps segment. For the year 2022, the Apps segment revenue was down 17% year-over-year to $1.8 billion while Adjusted EBITDA was down 5% year-over-year to $255 million at a 14% Adjusted EBITDA margin.
| AppLovin Corporation / 4Q22 Shareholder Letter | 6 |
Conclusion
Our team continues to be highly focused on delivering against the priorities we have laid out for our investors. We believe the combination of our market position and strategic investments with our strong cash position and cash generation will allow us to invest wisely through this cycle and prosper when the industry and financial markets recover.
Regards,
 |  | |
| Adam Foroughi, CEO | Herald Chen, President & CFO | |
| AppLovin Corporation / 4Q22 Shareholder Letter | 7 |
Appendix
This shareholder letter contains forward-looking statements within the meaning of Section 27A of the Securities Act of 1933 and Section 21E of the Securities Exchange Act of 1934. Forward-looking statements generally relate to future events or our future financial or operating performance. In some cases, you can identify forward-looking statements because they contain words such as “may,” “will,” “should,” “expect,” “plan,” “anticipate,” “going to,” “could,” “intend,” “target,” “project,” “contemplate,” “believe,” “estimate,” “predict,” “potential,” or “continue,” or the negative of these words or other similar terms or expressions that concern our expectations, strategy, priorities, plans, or intentions. Forward-looking statements in this letter to shareholders include, but are not limited to, statements regarding our future financial performance, including our expected financial results and guidance, short and long-term goals and growth prospects; our expectations regarding our revenue and the financial performance of each of our segments; trends in ad spending; our ongoing review and optimization of our Apps portfolio and actions we may or may not take as a result of our Apps review and optimization efforts; our expectations regarding the impact of macroeconomic and current industry conditions; our expectations regarding future product development and investments in our business; and our expectations regarding our new initiatives and any future transactions. Our expectations and beliefs regarding these matters may not materialize, and actual results in future periods are subject to risks and uncertainties, including changes in our plans or assumptions, which could cause actual results to differ materially from those projected. These risks include our inability to forecast our business due to our limited operating history, the macroeconomic environment, fluctuations in our results of operations, our ability to execute on our operational and financial priorities, our ability to scale our Software Platform to support new users, the competitive mobile app ecosystem, our inability to adapt to emerging technologies and business models, and risks relating to our ongoing review of our Apps portfolio. The forward-looking statements contained in this letter are also subject to other risks and uncertainties, including those more fully described in our Quarterly Report on Form 10-Q for the fiscal quarter ended September 30, 2022. Additional information will also be set forth in our Annual Report on Form 10-K for the fiscal year ended December 31, 2022. The forward-looking statements in this letter are based on information available to us as of the date hereof, and we disclaim any obligation to update any forward-looking statements, except as required by law.
| AppLovin Corporation / 4Q22 Shareholder Letter | 8 |
Non-GAAP Financial Metrics
To supplement our financial information presented in accordance with generally accepted accounting principles in the United States (“GAAP”), this shareholder letter includes certain financial measures that are not prepared in accordance with GAAP, including Adjusted EBITDA, Adjusted EBITDA margin, Free Cash Flow and certain measures adjusted for publisher bonuses. A reconciliation of each such non-GAAP financial measure to the most directly comparable GAAP measure can be found below.
We define Adjusted EBITDA for a particular period as net income (loss) before interest expense and loss on settlement of debt, other (income) expense, net (excluding certain recurring items), provision for (benefit from) income taxes, amortization, depreciation and write-offs and as further adjusted for non-operating foreign exchange (gains) losses, stock-based compensation expense, acquisition-related expense and transaction bonuses, publisher bonuses, MoPub acquisition transition services, restructuring costs, impairment and loss on disposal, loss (gain) on extinguishments of acquisition-related contingent consideration, lease modification and abandonment of leasehold improvements, and change in the fair value of contingent consideration. We define Adjusted EBITDA margin as Adjusted EBITDA divided by revenue for the same period.
We believe that the presentation of these non-GAAP financial measures provides useful information to investors regarding our results of operations and operating performance, as they are similar to measures reported by our public competitors and are regularly used by securities analysts, institutional investors, and other interested parties in analyzing operating performance and prospects.
We define Free Cash Flow as net cash provided by operating activities less purchases of property and equipment and payment of finance leases. We subtract both purchases of property and equipment and payment of finance leases in our calculation of Free Cash Flow because we believe these items represent our ongoing requirements for property and equipment to support our business, regardless of whether we utilize a finance lease to obtain such property or equipment.
Adjusted EBITDA and Adjusted EBITDA margin are key measures we use to assess our financial performance and are also used for internal planning and forecasting purposes. We believe Adjusted EBITDA and Adjusted EBITDA margin are helpful to investors, analysts, and other interested parties because they can assist in providing a more consistent and comparable overview of our operations across our historical financial periods. In addition, these measures are frequently used by analysts, investors, and other interested parties to evaluate and assess performance. We use Adjusted EBITDA and Adjusted EBITDA margin in conjunction with GAAP measures as part of our overall assessment of our performance, including the preparation of our annual operating budget and quarterly forecasts, to evaluate the effectiveness of our business strategies, and to communicate with our board of directors concerning our financial performance. We believe that the presentation of certain measures adjusted for publisher bonuses are useful in understanding the ongoing results of our operations and for comparability to prior periods. We use Free Cash Flow in addition to GAAP measures to help manage our business and prepare budgets and annual planning, and we believe Free Cash Flow provides useful supplemental information to help investors understand underlying trends in our business and our liquidity.
These measures have certain limitations in that they do not include the impact of certain expenses that are reflected in our consolidated statement of operations that are necessary to run our business. Our definitions may differ from the definitions used by other companies and therefore comparability may be limited. In addition, other companies may not publish these or similar metrics. Thus, our non-GAAP financial measures should be considered in addition to, not as substitutes for, or in isolation from, measures prepared in accordance with GAAP.
| AppLovin Corporation / 4Q22 Shareholder Letter | 9 |
Key Metrics
We review the following key metrics on a regular basis to evaluate the health of our business, identify trends affecting our performance, prepare financial projections, and make strategic decisions.
Update to our Key Metrics
Beginning in first quarter of 2023, we will no longer provide certain key metrics related to our Software Platform segment including Total Software Transaction Value, Software Platform Enterprise Clients and Revenue per Software Platform Enterprise Client.
Quarterly Key Metrics
Total Software Transaction Value (TSTV). Software Platform revenue is from third-party clients using our Software Platform to find new customers. We do not recognize revenue from our own spend on our Software Platform. Therefore, we use TSTV to measure the scale and growth rates of our Software Platform as it reflects the total value on our Software Platform including our first-party studios as though they were standalone businesses. Below is a reconciliation of our revenue to TSTV.
($ in thousands) | 4Q 2022 | 4Q 2021 | ||||||
Software Platform Revenue | $ | 306,195 | $ | 246,562 | ||||
Fee collected from AppLovin Apps | $ | 25,333 | $ | 93,088 | ||||
|
|
|
| |||||
Total Software Transaction Value | $ | 331,528 | $ | 339,650 | ||||
|
|
|
| |||||
Software Platform Enterprise Clients (SPECs). We focus on the number of SPECs, which are third-party clients from whom we have collected greater than $125,000 of Software Platform revenue in the trailing twelve months to a given date. SPECs generate the vast majority of our Software Platform revenue and Software Platform revenue growth.
Revenue Per Software Platform Enterprise Client (Revenue per SPEC). We define Revenue per SPEC as (i) the total revenue derived from our Software Platform Enterprise Clients in the trailing twelve months to a given period, divided by (ii) Software Platform Enterprise Clients as of the end of that same period. Revenue per SPEC shows how efficiently we are monetizing each SPEC. We expect to increase Revenue per SPEC over time as we enhance our Software Platform and Apps.
| AppLovin Corporation / 4Q22 Shareholder Letter | 10 |
The following table shows our Software Platform Enterprise Clients as of December 31, 2022, September 30, 2022, June 30, 2022, March 31, 2022, and December 31, 2021.
| 4Q 2022 | 3Q 2022 | 2Q 2022 | 1Q 2021 | 4Q 2021 | ||||||||||||||||
Software Platform Enterprise Clients | 566 | 538 | 503 | 447 | 380 | |||||||||||||||
Revenue per SPEC | $ | 1,907 | $ | 1,903 | $ | 1,823 | $ | 1,701 | $ | 1,634 | ||||||||||
Monthly Active Payers (MAPs). We define a MAP as a unique mobile device active on one of our apps in a month that completed at least one In-App Purchases (IAP) during that time period. A consumer who makes IAPs within two separate apps on the same mobile device in a monthly period will be counted as two MAPs. MAPs for a particular time period longer than one month are the average MAPs for each month during that period. We estimate the number of MAPs by aggregating certain data from third-party attribution partners. Some of our apps do not utilize such third-party attribution partners, and therefore, our MAPs figure for any period does not capture every user that completed an IAP on our apps. We estimate that our counted MAPs generated approximately 98% of our IAP revenue during the three months ending December 31, 2022, and as such, management believes that MAPs are still a useful metric to measure the engagement and monetization potential of our games.
Average Revenue Per Monthly Active Payer (ARPMAP). We define ARPMAP as (i) the total IAP Revenue derived from our Apps in a monthly period, divided by (ii) MAPs in that same period. ARPMAP for a particular time period longer than one month is the average ARPMAP for each month during that period. ARPMAP shows how efficiently we are monetizing each MAP.
| 4Q 2022 | 4Q 2021 | |||||||
Monthly Active Payers (millions) | 1.9 | 2.7 | ||||||
Average Revenue per Monthly Active Payer (ARPMAP) | $ | 46 | $ | 44 | ||||
Our key metrics are not based on any standardized industry methodology and are not necessarily calculated in the same manner or comparable to similarly titled measures presented by other companies. Similarly, our key metrics may differ from estimates published by third parties or from similarly titled metrics of our competitors due to differences in methodology. The numbers that we use to calculate TSTV, MAP, and ARPMAP are based on internal data. While these numbers are based on what we believe to be reasonable judgments and estimates for the applicable period of measurement, there are inherent challenges in measuring usage and engagement. We regularly review and may adjust our processes for calculating our internal metrics to improve their accuracy.
| AppLovin Corporation / 4Q22 Shareholder Letter | 11 |
AppLovin Corporation
Consolidated Balance Sheets
(in thousands, except for share and per share data)
(unaudited)
| December 31, 2022 | December 31, 2021 | |||||||
Assets | ||||||||
Current assets: | ||||||||
Cash and cash equivalents | $ | 1,080,484 | $ | 1,520,504 | ||||
Restricted cash equivalents | — | 1,050,000 | ||||||
Accounts receivable, net | 702,814 | 514,520 | ||||||
Prepaid expenses and other current assets | 155,785 | 150,040 | ||||||
|
|
|
| |||||
Total current assets | 1,939,083 | 3,235,064 | ||||||
Property and equipment, net | 78,543 | 63,608 | ||||||
Operating lease right-of-use assets | 60,379 | 70,975 | ||||||
Goodwill | 1,823,755 | 966,427 | ||||||
Intangible assets, net | 1,677,660 | 1,709,347 | ||||||
Other assets | 268,426 | 118,158 | ||||||
|
|
|
| |||||
Total assets | 5,847,846 | 6,163,579 | ||||||
|
|
|
| |||||
Liabilities, redeemable noncontrolling interest, and stockholders’ equity | ||||||||
Current liabilities: | ||||||||
Accounts payable | $ | 273,196 | $ | 258,220 | ||||
Accrued liabilities | 147,801 | 133,770 | ||||||
Licensed asset obligation | 15,254 | 17,374 | ||||||
Short-term debt | 33,310 | 25,810 | ||||||
Deferred revenue | 64,018 | 78,930 | ||||||
Operating lease liabilities | 14,334 | 18,392 | ||||||
Deferred acquisition costs, current | 31,045 | 107,601 | ||||||
|
|
|
| |||||
Total current liabilities | 578,958 | 640,097 | ||||||
Non-current liabilities: | ||||||||
Long-term debt | 3,178,412 | 3,201,834 | ||||||
Operating lease liabilities, non-current | 54,153 | 62,498 | ||||||
Licensed asset obligation, non-current | 26,970 | 8,039 | ||||||
Other non-current liabilities | 106,676 | 112,820 | ||||||
|
|
|
| |||||
Total liabilities | 3,945,169 | 4,025,288 | ||||||
Redeemable noncontrolling interest | — | 201 | ||||||
Stockholders’ equity: | ||||||||
Class A, Class B and Class F common stock, $0.00003 par value—1,700,000,000 (Class A 1,500,000,000, Class B 200,000,000, Class F nil) and 1,700,000,000 (Class A 1,500,000,000, Class B 200,000,000, Class F nil) shares authorized, 373,873,683 (Class A 302,711,061, Class B 71,162,622, Class F nil) and 375,089,360 (Class A 296,426,738, Class B 78,662,622, Class F nil) shares issued and outstanding as of December 31, 2022 and 2021, respectively | 11 | 11 | ||||||
Additional paid-in capital | 3,155,748 | 3,160,487 | ||||||
Accumulated other comprehensive loss | (83,382 | ) | (45,454 | ) | ||||
Accumulated deficit | (1,169,700 | ) | (976,954 | ) | ||||
|
|
|
| |||||
Total stockholders’ equity | 1,902,677 | 2,138,090 | ||||||
|
|
|
| |||||
Total liabilities, redeemable noncontrolling interest, and stockholders’ equity | 5,847,846 | 6,163,579 | ||||||
|
|
|
| |||||
| AppLovin Corporation / 4Q22 Shareholder Letter | 12 |
AppLovin Corporation
Consolidated Statements of Operations
(in thousands, except per share data)
(unaudited)
| Three Months Ended | Twelve Months Ended | |||||||||||||||
| December 31, | December 31, | |||||||||||||||
| 2022 | 2021 | 2022 | 2021 | |||||||||||||
Revenue | $ | 702,307 | $ | 793,470 | $ | 2,817,058 | $ | 2,793,104 | ||||||||
Costs and expenses: | ||||||||||||||||
Cost of revenue | 369,368 | 265,129 | 1,256,065 | 988,095 | ||||||||||||
Sales and marketing | 200,536 | 313,692 | 919,550 | 1,129,892 | ||||||||||||
Research and development | 118,190 | 119,541 | 507,607 | 366,402 | ||||||||||||
General and administrative | 36,639 | 36,583 | 181,627 | 158,699 | ||||||||||||
|
|
|
|
|
|
|
| |||||||||
Total costs and expenses | 724,733 | 734,945 | 2,864,849 | 2,643,088 | ||||||||||||
|
|
|
|
|
|
|
| |||||||||
Income (loss) from operations | (22,426 | ) | 58,525 | (47,791 | ) | 150,016 | ||||||||||
Other income (expense), net | ||||||||||||||||
Interest expense and loss on settlement of debt | (54,722 | ) | (30,374 | ) | (171,863 | ) | (103,170 | ) | ||||||||
Other income (expense), net | 10,976 | 462 | 14,477 | (535 | ) | |||||||||||
|
|
|
|
|
|
|
| |||||||||
Total other expense | (43,746 | ) | (29,912 | ) | (157,386 | ) | (103,705 | ) | ||||||||
|
|
|
|
|
|
|
| |||||||||
Income (loss) before income taxes | (66,172 | ) | 28,613 | (205,177 | ) | 46,311 | ||||||||||
Provision for (benefit from) income taxes | 13,340 | (2,794 | ) | (12,230 | ) | 10,973 | ||||||||||
|
|
|
|
|
|
|
| |||||||||
Net income (loss) | (79,512 | ) | 31,407 | (192,947 | ) | 35,338 | ||||||||||
Add: Net loss (income) attributable to noncontrolling interest | — | (41 | ) | 201 | 108 | |||||||||||
|
|
|
|
|
|
|
| |||||||||
Net income (loss) attributable to AppLovin | (79,512 | ) | 31,366 | (192,746 | ) | 35,446 | ||||||||||
|
|
|
|
|
|
|
| |||||||||
Less: Net income attributable to participating securities | — | (312 | ) | — | (3,743 | ) | ||||||||||
|
|
|
|
|
|
|
| |||||||||
Net income (loss) attributable to common stock—Basic | (79,512 | ) | 31,054 | (192,746 | ) | 31,703 | ||||||||||
|
|
|
|
|
|
|
| |||||||||
Net income (loss) attributable to common stock—Diluted | (79,512 | ) | 31,068 | (192,746 | ) | 31,879 | ||||||||||
|
|
|
|
|
|
|
| |||||||||
Net income (loss) per share attributable to common stockholders: | ||||||||||||||||
Basic | $ | (0.21 | ) | $ | 0.08 | $ | (0.52 | ) | $ | 0.10 | ||||||
|
|
|
|
|
|
|
| |||||||||
Diluted | $ | (0.21 | ) | $ | 0.08 | $ | (0.52 | ) | $ | 0.09 | ||||||
|
|
|
|
|
|
|
| |||||||||
Weighted average common shares used to compute net income (loss) per share attributable to common stockholders: | ||||||||||||||||
Basic | 371,075,205 | 370,779,521 | 371,568,011 | 324,836,076 | ||||||||||||
|
|
|
|
|
|
|
| |||||||||
Diluted | 371,075,205 | 388,302,231 | 371,568,011 | 342,763,632 | ||||||||||||
|
|
|
|
|
|
|
| |||||||||
| AppLovin Corporation / 4Q22 Shareholder Letter | 13 |
AppLovin Corporation
Consolidated Statements of Cash Flows
(in thousands)
(unaudited)
| Years Ended December 31, | ||||||||
| 2022 | 2021 | |||||||
Operating Activities | ||||||||
Net income (loss) | $ | (192,947 | ) | $ | 35,338 | |||
Adjustments to reconcile net income (loss) to operating activities: | ||||||||
Amortization, depreciation and write-offs | 547,084 | 431,063 | ||||||
Impairment and loss in connection with disposal of long-lived assets | 127,892 | — | ||||||
Amortization of debt issuance costs and discount | 12,678 | 12,825 | ||||||
Stock-based compensation | 191,612 | 133,177 | ||||||
Change in operating right-of-use asset | 17,107 | 26,313 | ||||||
Loss on settlement of debt | — | 18,236 | ||||||
Other | 1,786 | (10,805 | ) | |||||
Changes in operating assets and liabilities: | ||||||||
Accounts receivable | (174,829 | ) | (201,948 | ) | ||||
Prepaid expenses and other current assets | (3,725 | ) | (97,324 | ) | ||||
Other assets | (77,343 | ) | (45,938 | ) | ||||
Accounts payable | 3,479 | 98,612 | ||||||
Operating lease liabilities | (18,898 | ) | (26,854 | ) | ||||
Accrued and other liabilities | (6,412 | ) | 3,063 | |||||
Deferred revenue | (14,711 | ) | (13,907 | ) | ||||
|
|
|
| |||||
Net cash provided by operating activities | 412,773 | 361,851 | ||||||
|
|
|
| |||||
Investing Activities | ||||||||
Purchase of property and equipment | (662 | ) | (1,390 | ) | ||||
Acquisitions, net of cash acquired | (1,339,827 | ) | (1,206,482 | ) | ||||
Purchase of non-marketable investments and other | (66,342 | ) | (15,000 | ) | ||||
Proceeds from other investing activities | 4,312 | 12,009 | ||||||
Capitalized software development costs | (5,949 | ) | (4,067 | ) | ||||
Proceeds from sale of long-lived assets | 37,000 | — | ||||||
|
|
|
| |||||
Net cash used in investing activities | (1,371,468 | ) | (1,214,930 | ) | ||||
|
|
|
| |||||
Financing Activities | ||||||||
Proceeds from issuance of common stock in initial public offering, net of issuance costs as adjusted for cost reimbursement | — | 1,745,228 | ||||||
Proceeds from debt issuance, net of issuance costs | — | 2,329,059 | ||||||
Payments of debt principal | (25,810 | ) | (719,810 | ) | ||||
Principal payments of finance leases | (24,083 | ) | (15,271 | ) | ||||
Payments of withholding taxes related to net share settlement of restricted stock units | (27,535 | ) | — | |||||
Proceeds from exercise of stock options | 25,487 | 31,156 | ||||||
Proceeds from the issuance of common stock under the Employee Stock Purchase Plan | 5,531 | 2,877 | ||||||
Payments of deferred acquisition costs | (124,184 | ) | (234,068 | ) | ||||
Payments of licensed asset obligation | (17,374 | ) | (17,970 | ) | ||||
Payments of related party notes | — | (11,655 | ) | |||||
Repurchases of common stock | (338,880 | ) | — | |||||
|
|
|
| |||||
Net cash provided by (used in) financing activities | (526,848 | ) | 3,109,546 | |||||
|
|
|
| |||||
Effect of foreign exchange rate on cash, cash equivalents and restricted cash equivalents | (4,477 | ) | (3,198 | ) | ||||
Net increase (decrease) in cash, cash equivalents and restricted cash equivalents | (1,490,020 | ) | 2,253,269 | |||||
Cash, cash equivalents and restricted cash equivalents at beginning of the period | 2,570,504 | 317,235 | ||||||
|
|
|
| |||||
Cash, cash equivalents and restricted cash equivalents at end of the period | 1,080,484 | 2,570,504 | ||||||
|
|
|
| |||||
| AppLovin Corporation / 4Q22 Shareholder Letter | 14 |
AppLovin Corporation
Reconciliation of Net Cash Provided By Operating Activities to Free Cash Flow
(in thousands)
The following table provides a reconciliation of net cash provided
by operating activities to free cash flow for the past eight quarters:
| 1Q21 | 2Q21 | 3Q21 | 4Q21 | 1Q22 | 2Q22 | 3Q22 | 4Q22 | |||||||||||||||||||||||||
Net cash provided by (used in) operating activities | 61,819 | 90,457 | 124,560 | 85,015 | (31,719 | ) | 106,811 | 174,482 | 163,199 | |||||||||||||||||||||||
Less: | ||||||||||||||||||||||||||||||||
Purchase of property and equipment | (121 | ) | (532 | ) | (309 | ) | (428 | ) | (285 | ) | (115 | ) | (221 | ) | (41 | ) | ||||||||||||||||
Payments of finance leases | (840 | ) | (3,781 | ) | (5,069 | ) | (5,581 | ) | (6,176 | ) | (6,150 | ) | (5,773 | ) | (5,984 | ) | ||||||||||||||||
|
|
|
|
|
|
|
|
|
|
|
|
|
|
|
| |||||||||||||||||
Free Cash Flow | $ | 60,858 | $ | 86,144 | $ | 119,182 | $ | 79,006 | $ | (38,180 | ) | $ | 100,546 | $ | 168,488 | $ | 157,174 | |||||||||||||||
|
|
|
|
|
|
|
|
|
|
|
|
|
|
|
| |||||||||||||||||
Net cash provided by (used in) investing activities | $ | (18,273 | ) | $ | (1,004,909 | ) | $ | (183,070 | ) | $ | (8,678 | ) | $ | (1,059,743 | ) | $ | (292,001 | ) | $ | (42,010 | ) | $ | 22,286 | |||||||||
Net cash provided by (used in) financing activities | $ | 400,374 | $ | 1,337,392 | $ | (75,159 | ) | $ | 1,446,939 | $ | (65,424 | ) | $ | (269,622 | ) | $ | (136,391 | ) | $ | (55,411 | ) | |||||||||||
| AppLovin Corporation / 4Q22 Shareholder Letter | 15 |
AppLovin Corporation
Reconciliation of Net Income (Loss) to Adjusted EBITDA
(in thousands)
The following table provides our Adjusted EBITDA and Adjusted EBITDA
margin and a reconciliation of Net Income (Loss) to Adjusted EBITDA for the periods presented:
| Three months ended | Twelve months ended | |||||||||||||||||||||||||||
| 4Q21 | 1Q22 | 2Q22 | 3Q22 | 4Q22 | 2022 | 2021 | ||||||||||||||||||||||
Revenue | $ | 793,470 | $ | 625,421 | $ | 776,231 | $ | 713,099 | $ | 702,307 | $ | 2,817,058 | $ | 2,793,104 | ||||||||||||||
Net income (loss) | $ | 31,407 | $ | (115,298 | ) | $ | (21,799 | ) | $ | 23,662 | $ | (79,512 | ) | $ | (192,947 | ) | $ | 35,338 | ||||||||||
|
|
|
|
|
|
|
|
|
|
|
|
|
| |||||||||||||||
Net Margin | 4.0 | % | (18.4 | )% | (2.8 | )% | 3.3 | % | (11.3 | )% | (6.8 | )% | 1.3 | % | ||||||||||||||
Interest expense and loss on settlement of debt, net | 30,374 | 32,009 | 36,505 | 48,627 | 54,722 | 171,863 | 103,170 | |||||||||||||||||||||
Other (income) expense, net1 | (693 | ) | (2,417 | ) | (2,452 | ) | (3,604 | ) | (10,174 | ) | (18,647 | ) | (7,545 | ) | ||||||||||||||
Provision for (benefit from) income taxes | (2,794 | ) | (42,684 | ) | 39,167 | (22,053 | ) | 13,340 | (12,230 | ) | 10,973 | |||||||||||||||||
Amortization, depreciation and write-offs | 115,654 | 128,989 | 152,688 | 136,094 | 129,313 | 547,084 | 431,063 | |||||||||||||||||||||
Impairment and loss on dispositions | — | — | — | 27,736 | 100,156 | 127,892 | — | |||||||||||||||||||||
Non-operating foreign exchange loss (gain) | (27 | ) | (458 | ) | (819 | ) | (406 | ) | 1,519 | (164 | ) | (1,537 | ) | |||||||||||||||
Stock-based compensation | 41,349 | 44,640 | 57,156 | 42,147 | 47,669 | 191,612 | 135,468 | |||||||||||||||||||||
Acquisition-related expense and transaction bonus | 2,827 | 14,814 | 1,921 | 4,317 | 227 | 21,279 | 16,887 | |||||||||||||||||||||
Publisher bonuses2 | 3,227 | 209,635 | — | — | — | 209,635 | 3,227 | |||||||||||||||||||||
MoPub acquisition transition services3 | — | 6,999 | — | — | — | 6,999 | — | |||||||||||||||||||||
Restructuring costs | — | — | 7,377 | 1,117 | 2,340 | 10,834 | — | |||||||||||||||||||||
Change in the fair value of contingent consideration | — | — | — | — | — | — | (230 | ) | ||||||||||||||||||||
|
|
|
|
|
|
|
|
|
|
|
|
|
| |||||||||||||||
Total adjustments | 189,917 | 391,527 | 291,543 | 233,975 | 339,112 | 1,256,157 | 691,476 | |||||||||||||||||||||
|
|
|
|
|
|
|
|
|
|
|
|
|
| |||||||||||||||
Adjusted EBITDA | $ | 221,324 | $ | 276,229 | $ | 269,744 | $ | 257,637 | $ | 259,600 | $ | 1,063,210 | $ | 726,814 | ||||||||||||||
|
|
|
|
|
|
|
|
|
|
|
|
|
| |||||||||||||||
Adjusted EBITDA Margin | 27.9 | % | 44.2 | % | 34.8 | % | 36.1 | % | 37.0 | % | 37.7 | % | 26.0 | % | ||||||||||||||
Note: Totals may not sum due to rounding
| 1 | Excludes recurring operational foreign exchange gains and losses and write-off investments included in Amortization, depreciation and write-offs. |
| 2 | In association with the MoPub acquisition, we incurred certain costs to incentivize publishers to migrate to our MAX mediation solution including existing publishers of MoPub as well as publishers on other competitor offerings, and to retain certain existing MAX publishers. These costs were reflected as a reduction to revenue in the period. We have not historically incurred significant publisher migration costs, nor do we currently intend to incur significant publisher migration costs in the future. As such, we have removed the impact of these costs from Adjusted EBITDA. |
| 3 | Reflects one-time transition services provided by Twitter to AppLovin. |
| AppLovin Corporation / 4Q22 Shareholder Letter | 16 |
AppLovin Corporation
Segment Information
(in thousands)
The following table provides selected financial data for our reportable segments for the periods indicated:
| 4Q21 | 1Q22 | 2Q22 | 3Q22 | 4Q22 | ||||||||||||||||
Revenue: | ||||||||||||||||||||
Software Platform | $ | 246,562 | $ | 118,840 | $ | 317,540 | $ | 306,592 | $ | 306,195 | ||||||||||
Apps | 546,908 | 506,581 | 458,691 | 406,507 | 396,112 | |||||||||||||||
|
|
|
|
|
|
|
|
|
| |||||||||||
Total Revenue | $ | 793,470 | $ | 625,421 | $ | 776,231 | $ | 713,099 | $ | 702,307 | ||||||||||
Segment Adjusted EBITDA: | ||||||||||||||||||||
Software Platform | $ | 175,398 | $ | 235,555 | $ | 196,744 | $ | 190,256 | $ | 185,860 | ||||||||||
Apps | 45,926 | 40,674 | 73,000 | 67,381 | 73,740 | |||||||||||||||
|
|
|
|
|
|
|
|
|
| |||||||||||
Total Segment Adjusted EBITDA | $ | 221,324 | $ | 276,229 | $ | 269,744 | $ | 257,637 | $ | 259,600 | ||||||||||
|
|
|
|
|
|
|
|
|
| |||||||||||
Interest expense and loss on settlement of debt, net | (30,374 | ) | (32,009 | ) | (36,505 | ) | (48,627 | ) | (54,722 | ) | ||||||||||
Other income (expense),net | 693 | 2,417 | 2,452 | 3,604 | 10,174 | |||||||||||||||
Amortization, depreciation and write-offs | (115,654 | ) | (128,989 | ) | (152,688 | ) | (136,094 | ) | (129,313 | ) | ||||||||||
Impairment and loss on dispositions | — | — | — | (27,736 | ) | (100,156 | ) | |||||||||||||
Non-operating foreign exchange gain (loss) | 27 | 458 | 819 | 406 | (1,519 | ) | ||||||||||||||
Stock-based compensation | (41,349 | ) | (44,640 | ) | (57,156 | ) | (42,147 | ) | (47,669 | ) | ||||||||||
Acquisition-related expense | (2,827 | ) | (14,814 | ) | (1,921 | ) | (4,317 | ) | (227 | ) | ||||||||||
Publisher bonuses | (3,227 | ) | (209,635 | ) | — | — | — | |||||||||||||
MoPub acquisition transition services | — | (6,999 | ) | — | — | — | ||||||||||||||
Restructuring Costs | — | — | (7,377 | ) | (1,117 | ) | (2,340 | ) | ||||||||||||
|
|
|
|
|
|
|
|
|
| |||||||||||
Income (loss) before provision for tax | $ | 28,613 | $ | (157,982 | ) | $ | 17,368 | $ | 1,609 | $ | (66,172 | ) | ||||||||
|
|
|
|
|
|
|
|
|
| |||||||||||
Segment Adjusted EBITDA Margin: | ||||||||||||||||||||
Software Platform | 71 | % | 198 | % | 62 | % | 62 | % | 61 | % | ||||||||||
Apps | 8 | % | 8 | % | 16 | % | 17 | % | 19 | % | ||||||||||
| AppLovin Corporation / 4Q22 Shareholder Letter | 17 |