Exhibit 99.2

THIRD QUARTER 2020 EARNINGS PRESENTATION November 9, 2020
The statements contained in this presentation that are not purely historical are forward - looking statements. Our forward - looking statements include, but are not limited to, statements regarding our or our management team’s expectations, hopes, beliefs, intentions or strategies regarding the future. The information included in this presentation in relation to Atlas has been pr ovi ded by Atlas and its management team, and forward - looking statements include statements relating to Atlas’ management team’s expectations, hopes, beliefs, intentions or strategies regarding the future. In addition, any statements that refer to projec tio ns, forecasts or other characterizations of future events or circumstances, including any underlying assumptions, are forward - lookin g statements. The words “anticipate,” “believe,” “continue,” “could,” “estimate,” “expect,” “ intend,” “may,” “might,” “plan,” “possible,” “potential,” “predict,” “project,” “should,” “would” and similar expressions may identify forward - looking statements, but the ab sence of these words does not mean that a statement is not forward - looking. The forward - looking statements contained in this presentation are based on our current expectations and beliefs concerning future developments and their potential effects on us. There can be no assurance that future developments affecting us will be those that we have anticipated. These forward - looking statements involve a number of risks, uncertainties (some of which are beyond our control) or other assumptions that may cause actual results or performance to be materially different from those expressed or implied by these forward - looking statements. These risks and uncertainties include, but are not limited to: (1) the ability to maintain the listing of the Company’s shares of Class A com mon stock and warrants on Nasdaq; (2) the ability to recognize the anticipated benefits of the business combination or acquisitions, wh ich may be affected by, among other things, competition, the ability of the Company to grow and manage growth profitably, maintain relationships with customers and suppliers and retain management and key employees; (3) costs related to the business combination and acquisitions; (4) changes in applicable laws or regulations; (5) the possibility that the Company may be adve rse ly affected by other economic, business, and/or competitive factors; and (6) other risks and uncertainties indicated from time t o t ime in the Company’s filings with the U.S. Securities and Exchange Commission, including those under “Risk Factors” therein. You are cautioned not to place undue reliance on any forward - looking statements, which speak only as of the date of this presentation. Except as otherwise required by applicable law, we disclaim any duty to update any forward - looking statements, all of which are expressly qualified by the statements in this section, to reflect events or circumstances after the date of this presentation . FORWARD LOOKING STATEMENTS 2

3 AGENDA Business Overview L. Joe Boyer Chief Executive Officer Financial Overview & Outlook David Quinn Chief Financial Officer
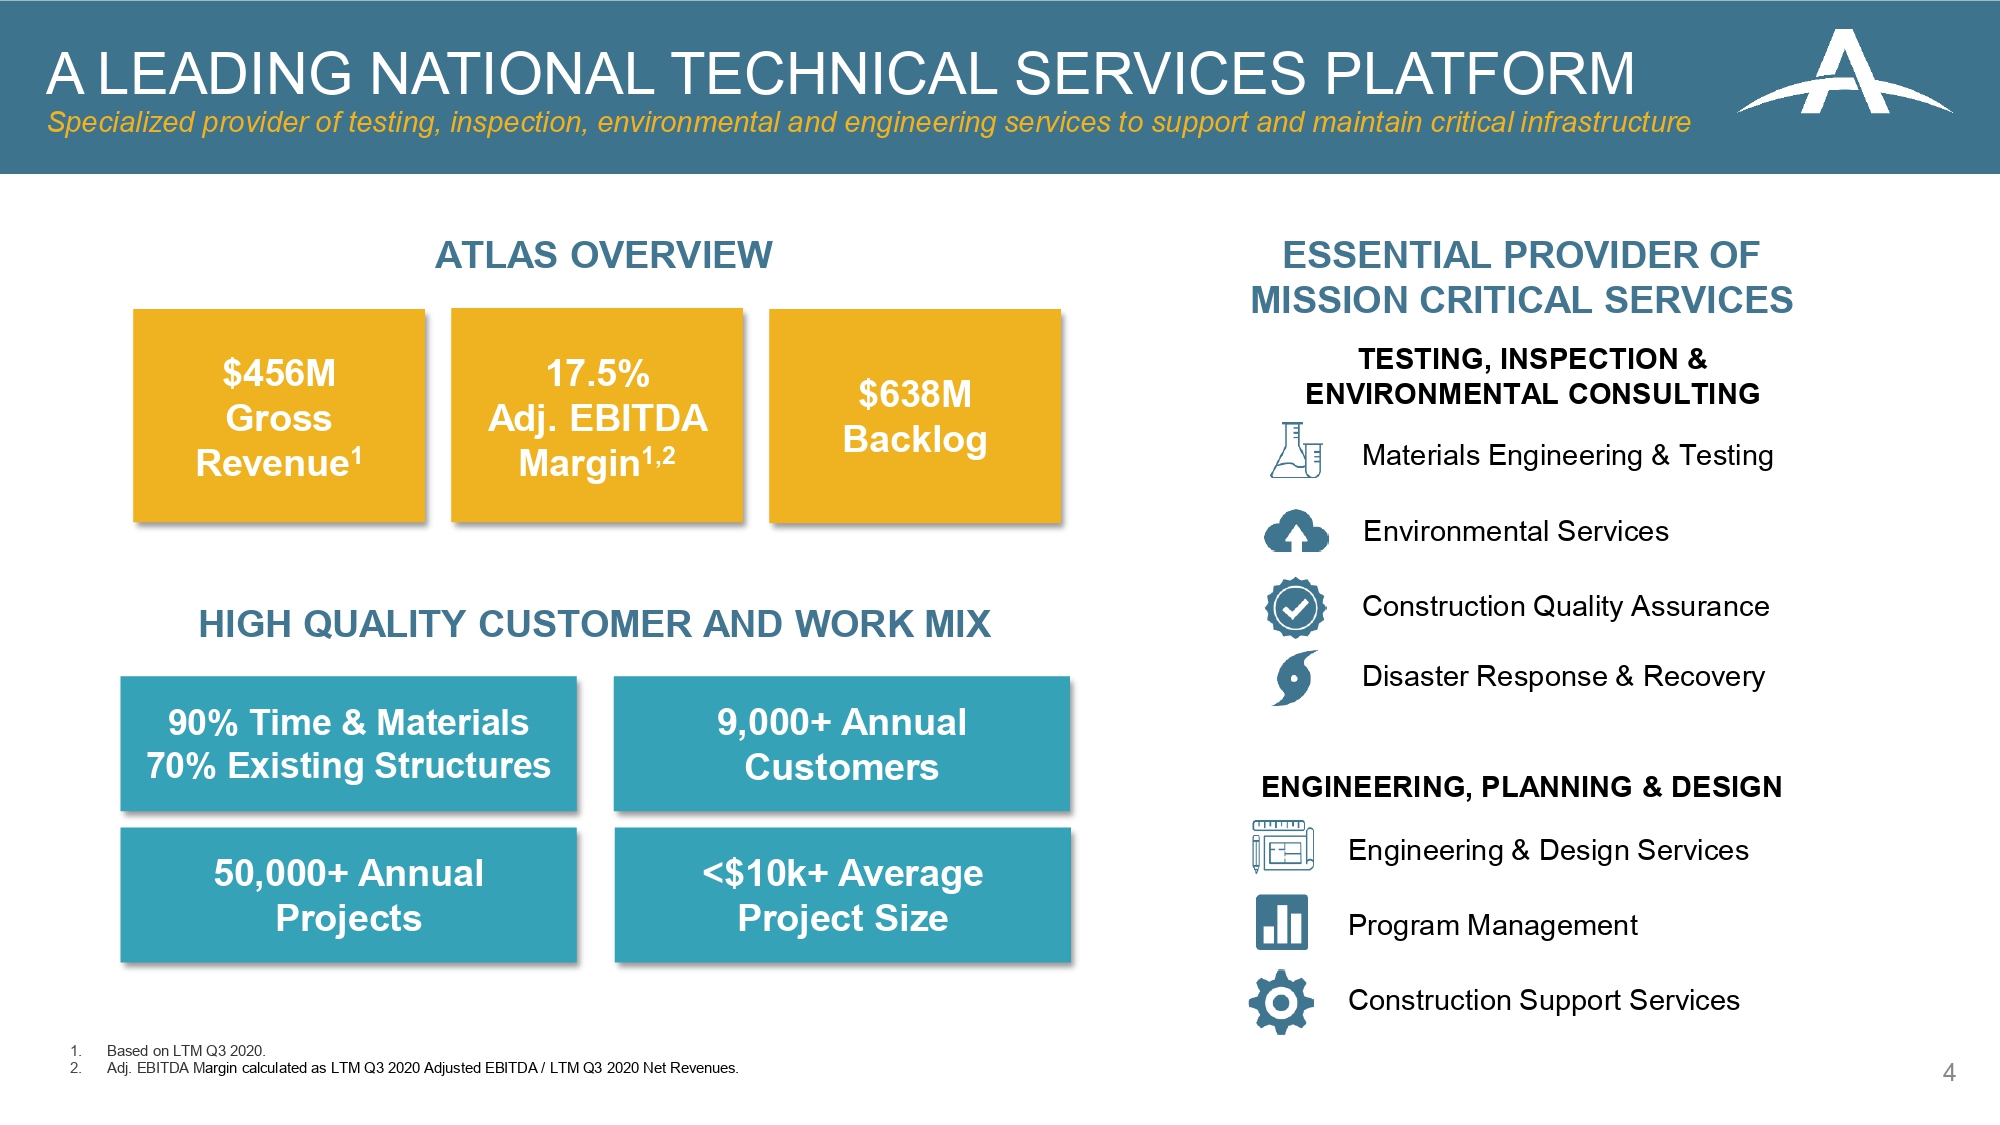
TESTING, INSPECTION & ENVIRONMENTAL CONSULTING ESSENTIAL PROVIDER OF MISSION CRITICAL SERVICES HIGH QUALITY CUSTOMER AND WORK MIX ATLAS OVERVIEW $456M Gross Revenue 1 17.5% Adj. EBITDA Margin 1,2 $ 638M Backlog 90% Time & Materials 70% Existing Structures 9,000+ Annual Customers 50,000+ Annual Projects <$10k+ Average Project Size Materials Engineering & Testing Environmental Services Construction Quality Assurance Disaster Response & Recovery ENGINEERING, PLANNING & DESIGN Engineering & Design Services Program Management Construction Support Services 1. Based on LTM Q3 2020. 2. Adj. EBITDA M argin calculated as LTM Q3 2020 Adjusted EBITDA / LTM Q3 2020 Net Revenues. 4 A LEADING NATIONAL TECHNICAL SERVICES PLATFORM Specialized provider of testing, inspection, environmental and engineering services to support and maintain critical infrastr uct ure
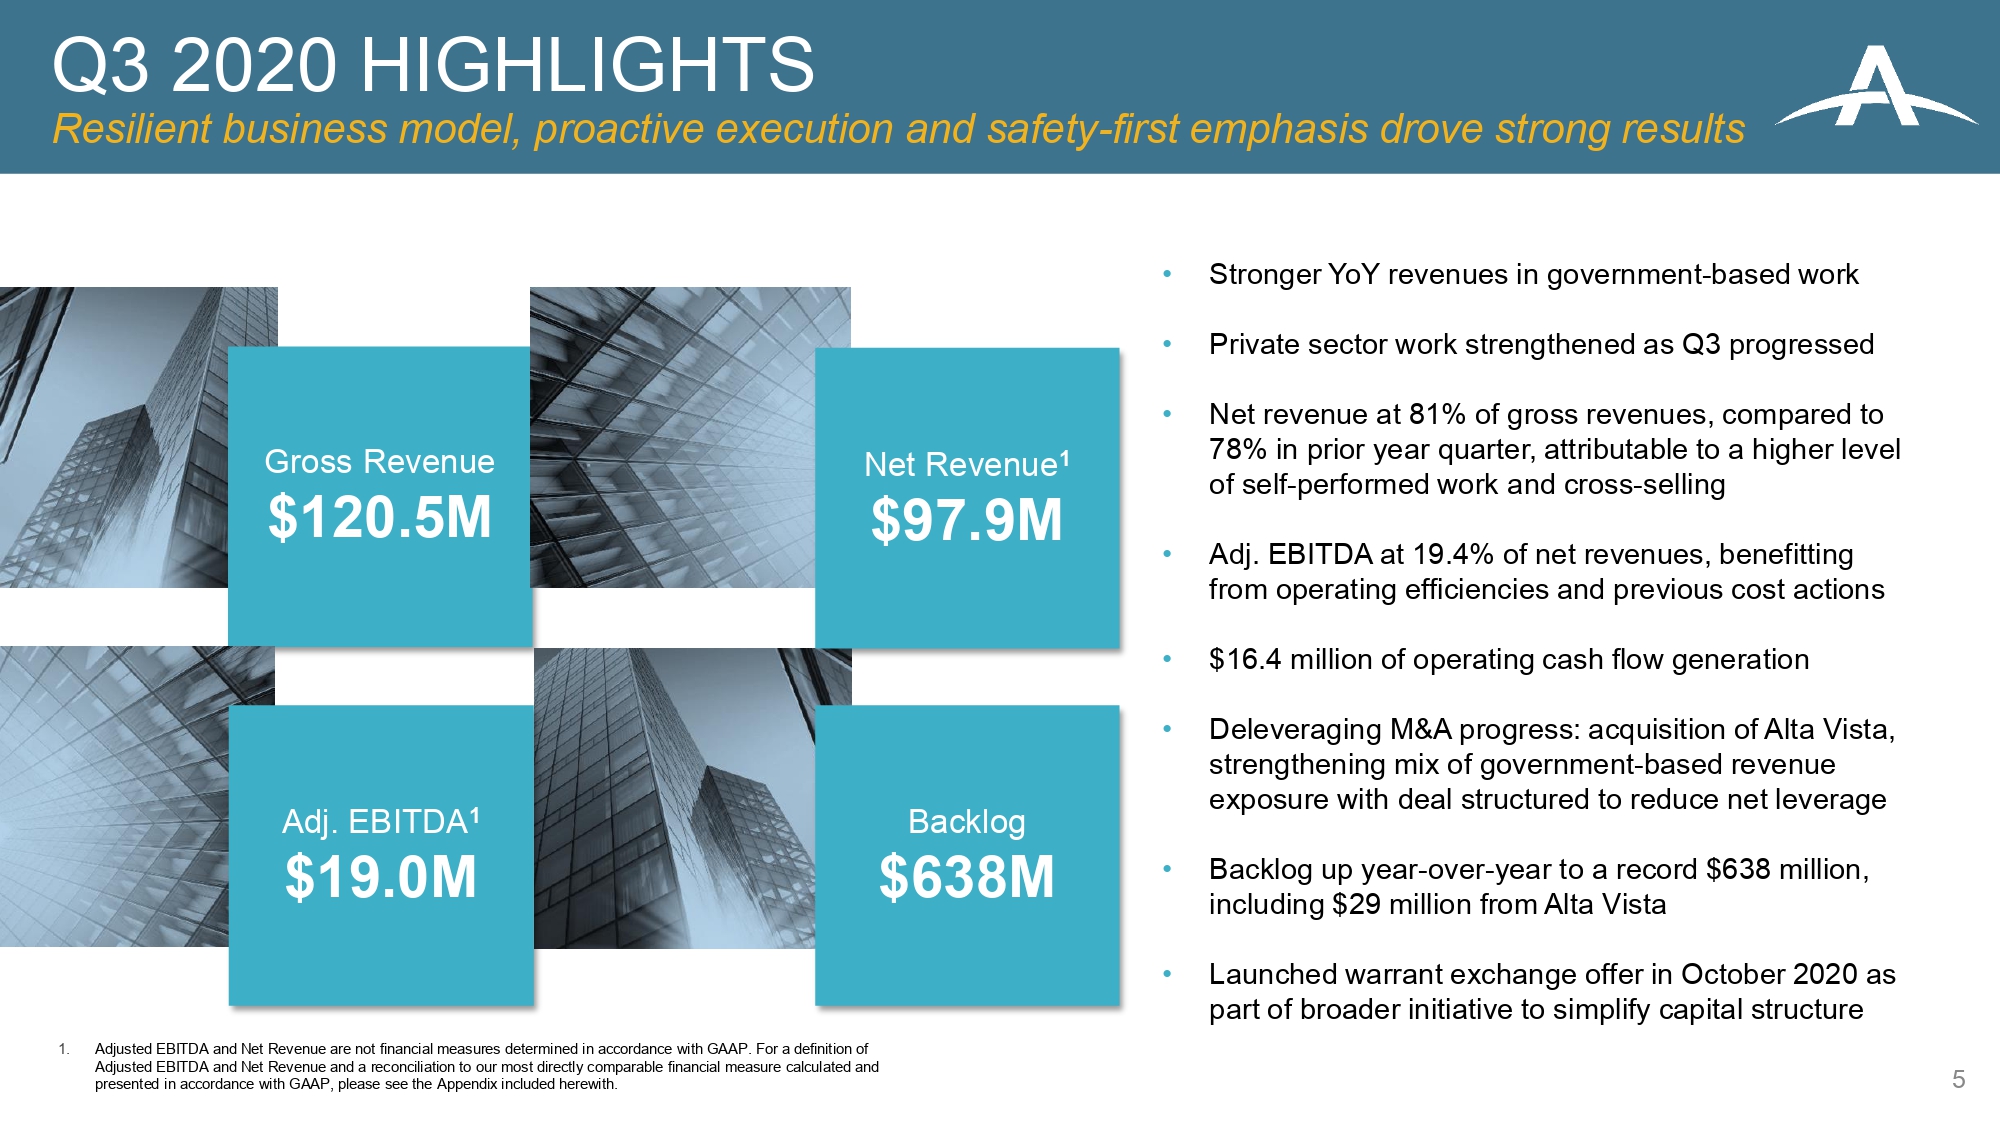
5 • Stronger YoY revenues in government - based work • Private sector work strengthened as Q3 progressed • Net revenue at 81% of gross revenues, compared to 78% in prior year quarter, attributable to a higher level of self - performed work and cross - selling • Adj. EBITDA at 19.4% of net revenues, benefitting from operating efficiencies and previous cost actions • $ 16.4 million of operating cash flow generation • Deleveraging M&A progress: acquisition of Alta Vista, strengthening mix of government - based revenue exposure with deal structured to reduce net leverage • Backlog up year - over - year to a record $ 638 million, including $29 million from Alta Vista • Launched warrant exchange offer in October 2020 as part of broader initiative to simplify capital structure Q3 2020 HIGHLIGHTS Resilient business model, proactive execution and safety - first emphasis drove strong results Gross Revenue $120.5M Backlog $ 638M Net Revenue 1 $97.9M Adj. EBITDA 1 $ 19.0M 1. Adjusted EBITDA and Net Revenue are not financial measures determined in accordance with GAAP. For a definition of Adjusted EBITDA and Net Revenue and a reconciliation to our most directly comparable financial measure calculated and presented in accordance with GAAP, please see the Appendix included herewith.

36% 15% 38% 6% 4% 6 Atlas’ mission critical services support infrastructure and other essential industries CURRENT MARKET LANDSCAPE Non - discretionary and government - based work remained strong throughout 2020 NET REVENUE BY END MARKET 1,2 1. Net Revenue is not a financial measure determined in accordance with GAAP. For a definition of Net Revenue and a reconciliation to our most directly comparable financial measure calculated and presented in accordance with GAAP, please see the Appendix included herewith. 2. Management estimates based on FY 2019. • Transportation • Government • Education • Water • Commercial • Industrial No material contracted backlog projects have been cancelled Highly variable cost structure to align resources with market activity Preciously enacted cost savings to benefit 2020E by $6 - 8M ~50% Government Based No Material COVID - 19 Impact Government - based volume improved YoY in Q3 2020 Localized COVID - 19 Impact Localized geographic work delays, most notably in the Northeast and Northern California ~50% PRIVATE SECTOR ~50% GOVERNMENT - BASED

BACKLOG 2017 $502M Q3 2020 $ 638 M Building strong pipeline of work, providing favorable trajectory into 2021 BACKLOG & KEY WINS Record backlog fueled by key wins across Atlas service offerings and geographies 7 Q3 KEY WINS VALUE SERVICES Gwinnett County, GA GDOT Highway $7M Program Management United States Army Corp of Engineers, Los Angeles District $5M Material s Engineering, Consulting & Testing Construction Management Services for BART Projects $5M Material s Engineering, Consulting & Testing TxDOT Highway $3.5M Construction Quality Assurance County of Los Angeles Department of Public Works $3M Material s Engineering, Consulting & Testing Environmental Protection Agency – Groundwater Treatment $2.5M Environmental Services United States Postal Service – Water/Tank Compliance $2.5M Environmental Services
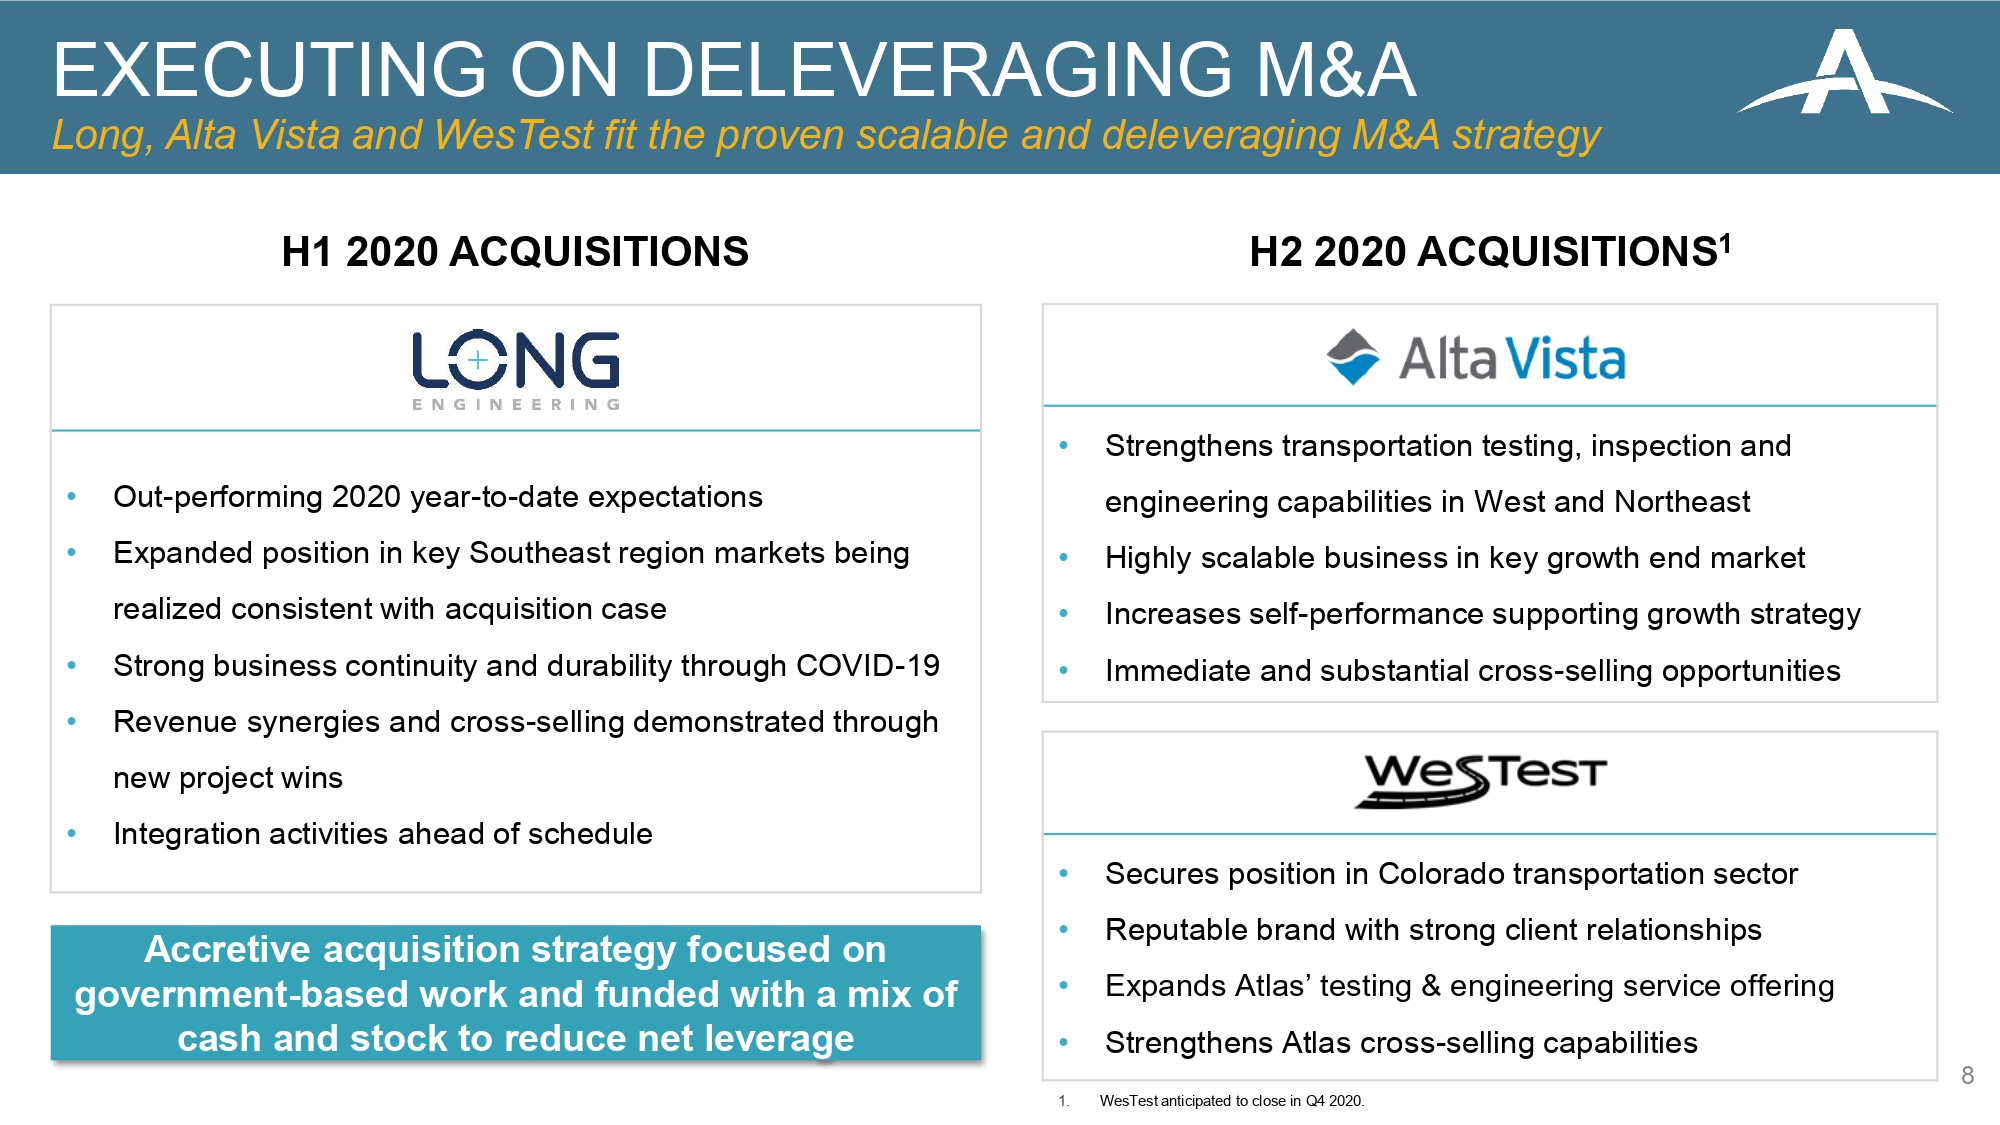
• Out - performing 2020 year - to - date expectations • Expanded position in key Southeast region markets being realized consistent with acquisition case • Strong business continuity and durability through COVID - 19 • Revenue synergies and cross - selling demonstrated through new project wins • Integration activities ahead of schedule H1 2020 ACQUISITIONS • Secures position in Colorado transportation sector • Reputable brand with strong client relationships • Expands Atlas’ testing & engineering service offering • Strengthens Atlas cross - selling capabilities • Strengthens transportation testing, inspection and engineering capabilities in West and Northeast • Highly scalable business in key growth end market • Increases self - performance supporting growth strategy • Immediate and substantial cross - selling opportunities 8 EXECUTING ON DELEVERAGING M&A Long, Alta Vista and WesTest fit the proven scalable and deleveraging M&A strategy H2 2020 ACQUISITIONS 1 Accretive acquisition strategy focused on government - based work and funded with a mix of cash and stock to reduce net leverage 1. WesTest anticipated to close in Q4 2020.
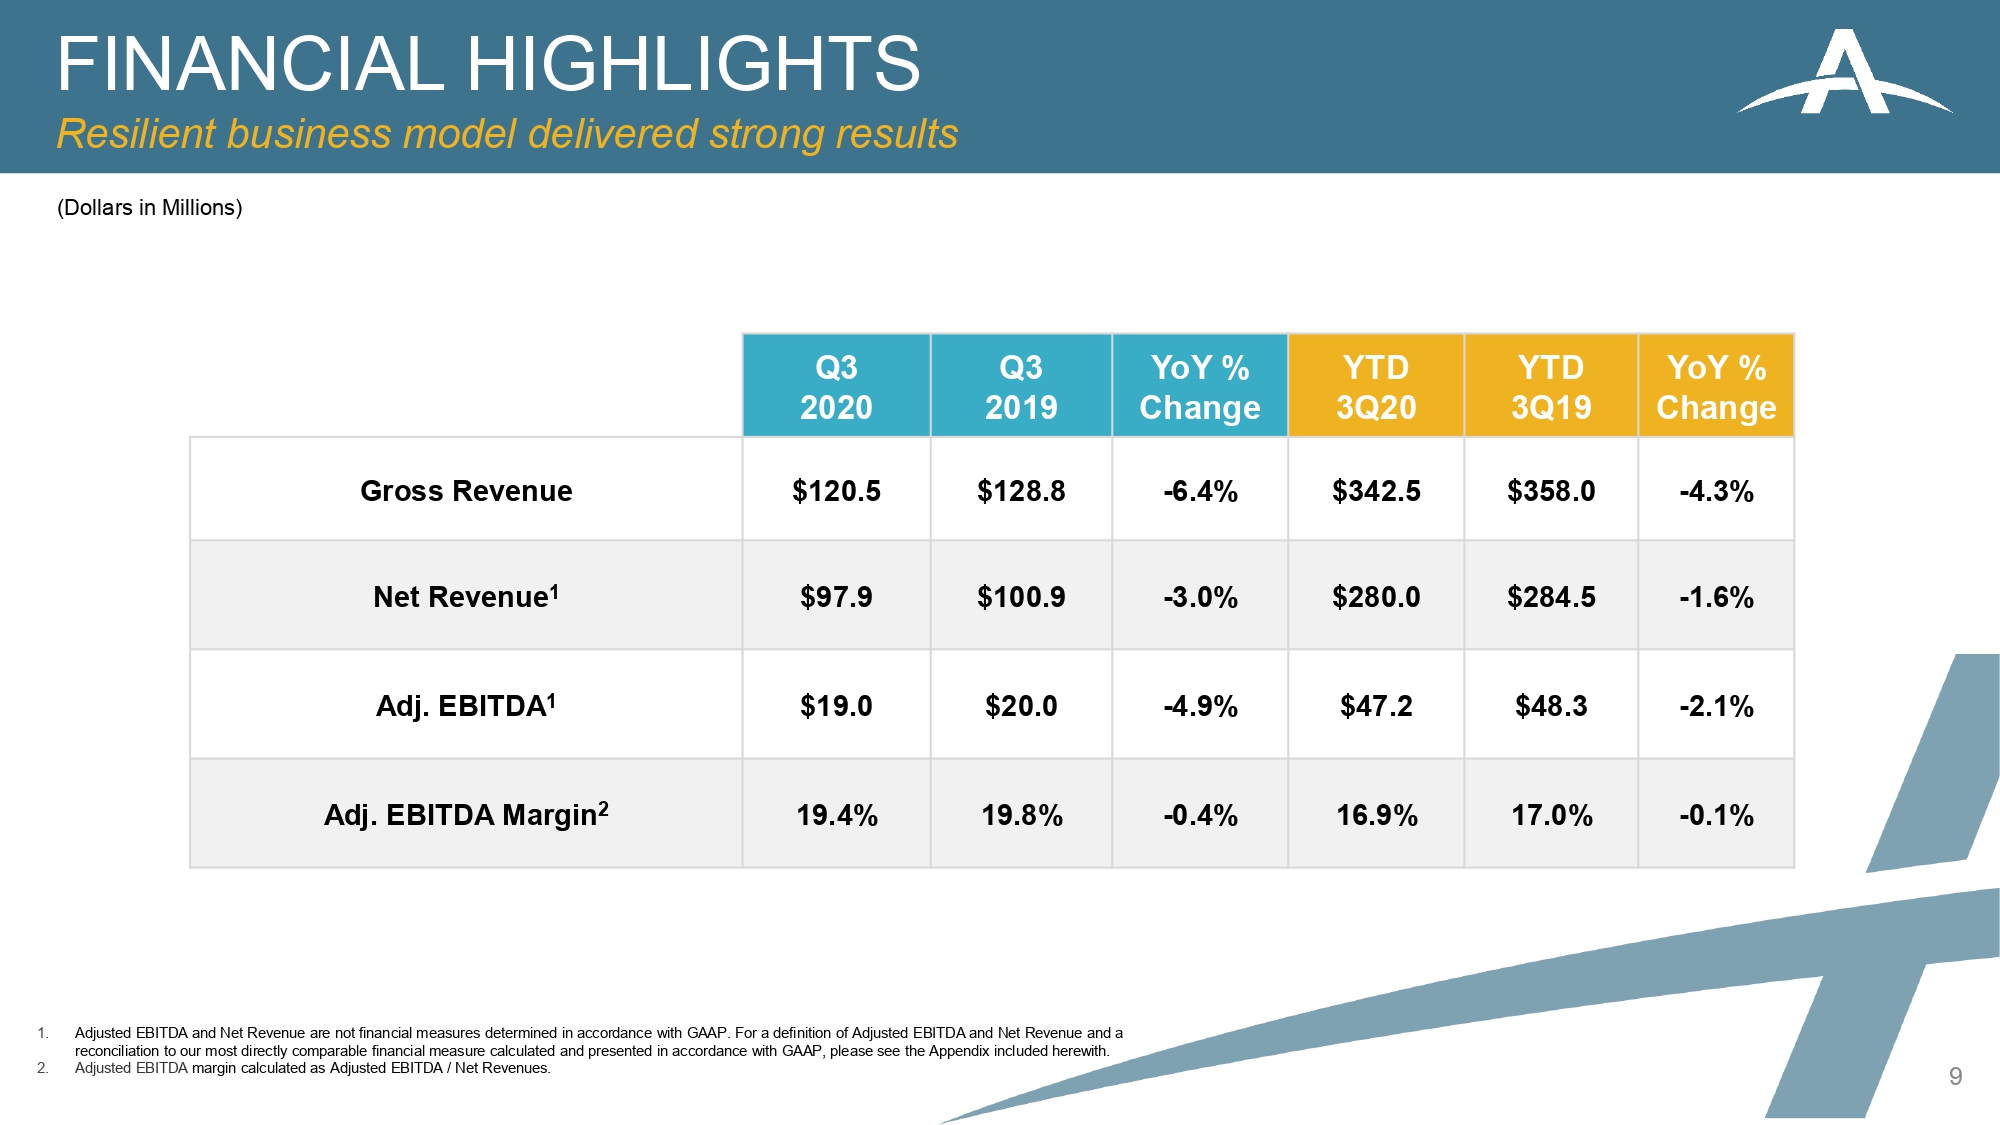
FINANCIAL HIGHLIGHTS Resilient business model delivered strong results 9 (Dollars in Millions) 1. Adjusted EBITDA and Net Revenue are not financial measures determined in accordance with GAAP. For a definition of Adjusted E BIT DA and Net Revenue and a reconciliation to our most directly comparable financial measure calculated and presented in accordance with GAAP, plea se see the Appendix included herewith. 2. Adjusted EBITDA margin calculated as Adjusted EBITDA / Net Revenues. Q3 2020 Q3 2019 YoY % Change YTD 3Q20 YTD 3Q19 YoY % Change Gross Revenue $120.5 $128.8 - 6.4% $342.5 $358.0 - 4.3% Net Revenue 1 $97.9 $ 100.9 - 3.0% $280.0 $284.5 - 1.6% Adj. EBITDA 1 $ 19.0 $20.0 - 4.9% $47.2 $ 48.3 - 2.1% Adj. EBITDA Margin 2 19.4% 19.8% - 0.4% 16.9% 17.0% - 0.1%
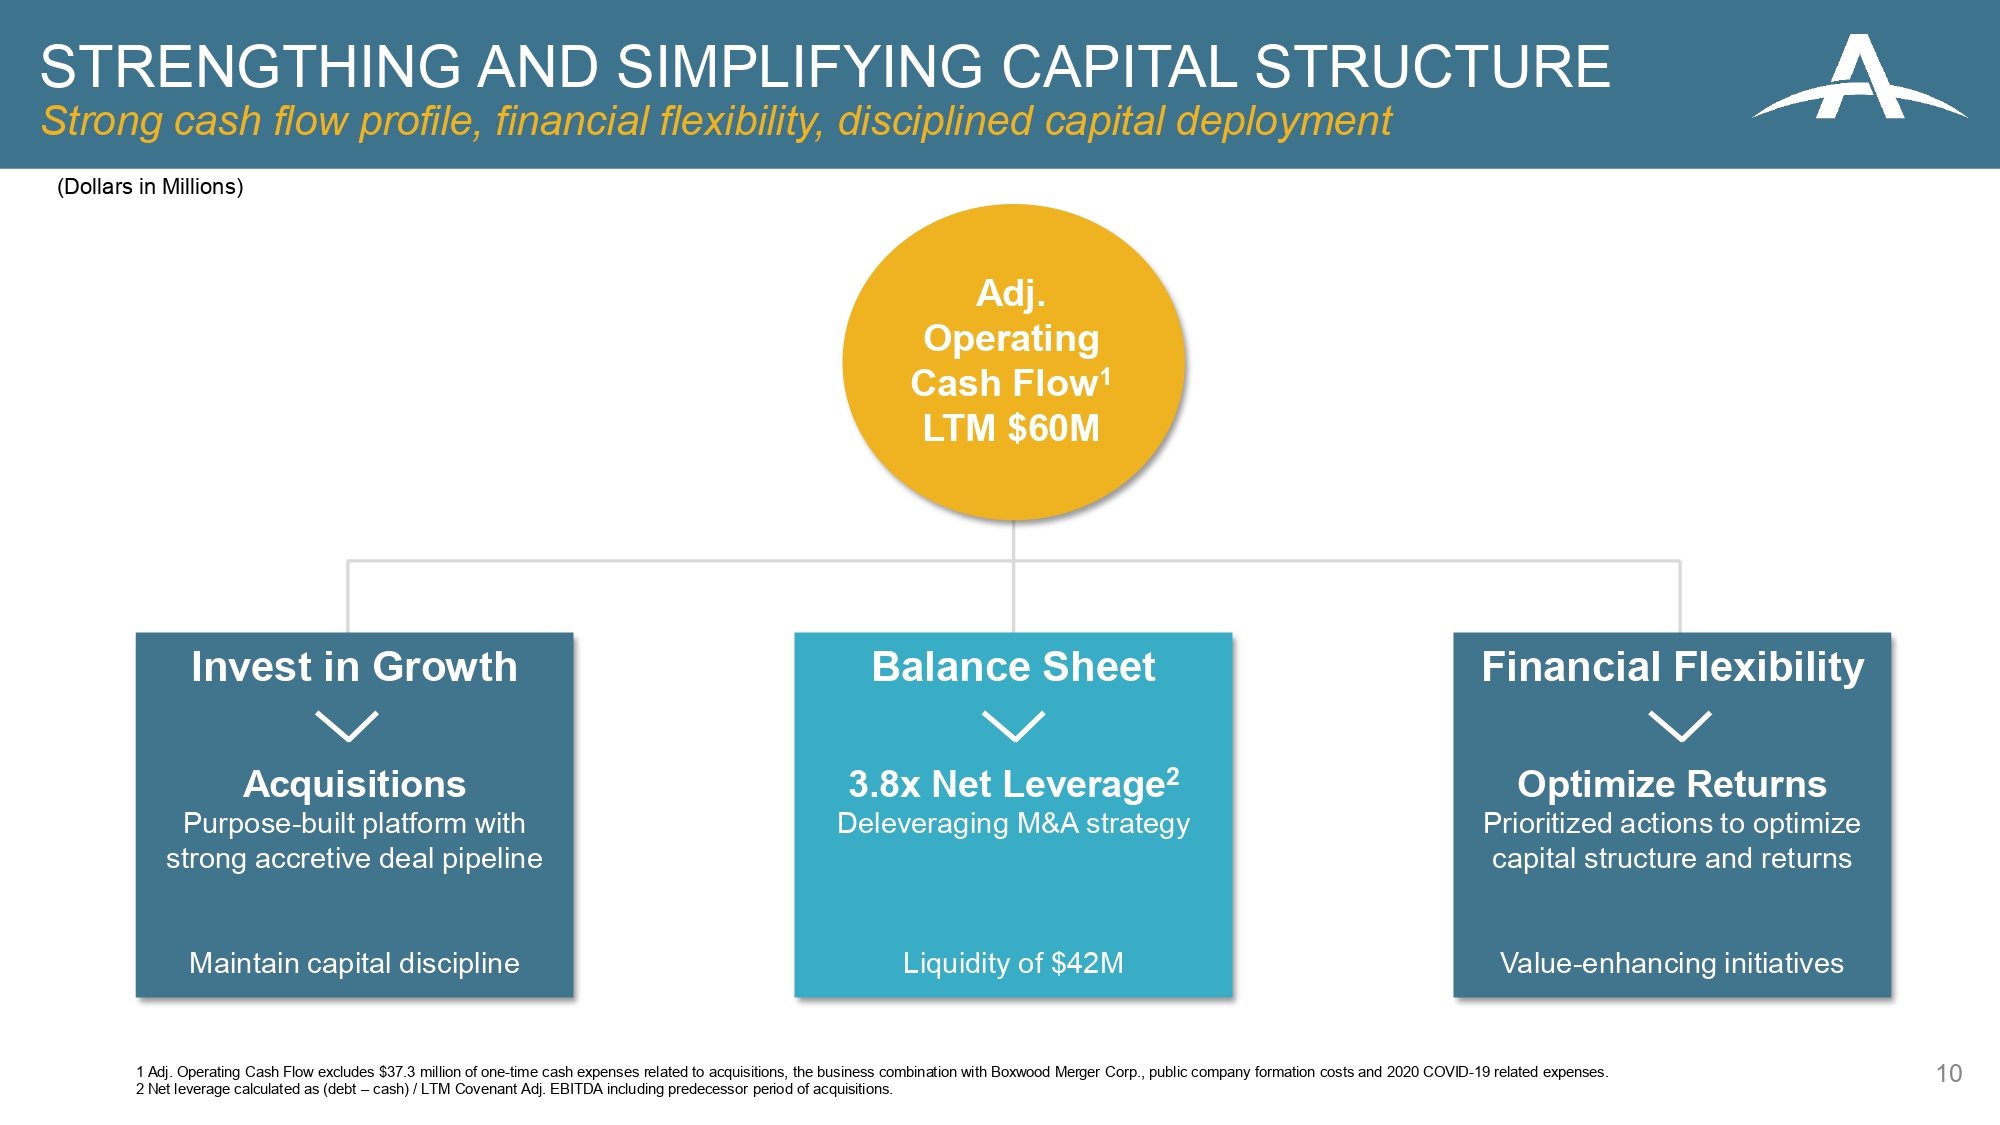
Invest in Growth Acquisitions Purpose - built platform with strong accretive deal pipeline Maintain capital discipline Financial Flexibility Optimize Returns Prioritized actions to optimize capital structure and returns Value - enhancing initiatives Adj. Operating Cash Flow 1 LTM $60M 1 Adj. Operating Cash Flow excludes $37.3 million of one - time cash expenses related to acquisitions, the business combination with Boxwood Merger Corp., public company fo rmation costs and 2020 COVID - 19 related expenses. 2 Net leverage calculated as (debt – cash) / LTM Covenant Adj . EBITDA including predecessor period of acquisitions. Balance Sheet 3.8x Net Leverage 2 Deleveraging M&A strategy Liquidity of $42M 10 STRENGTHING AND SIMPLIFYING CAPITAL STRUCTURE Strong cash flow profile, financial flexibility, disciplined capital deployment (Dollars in Millions)
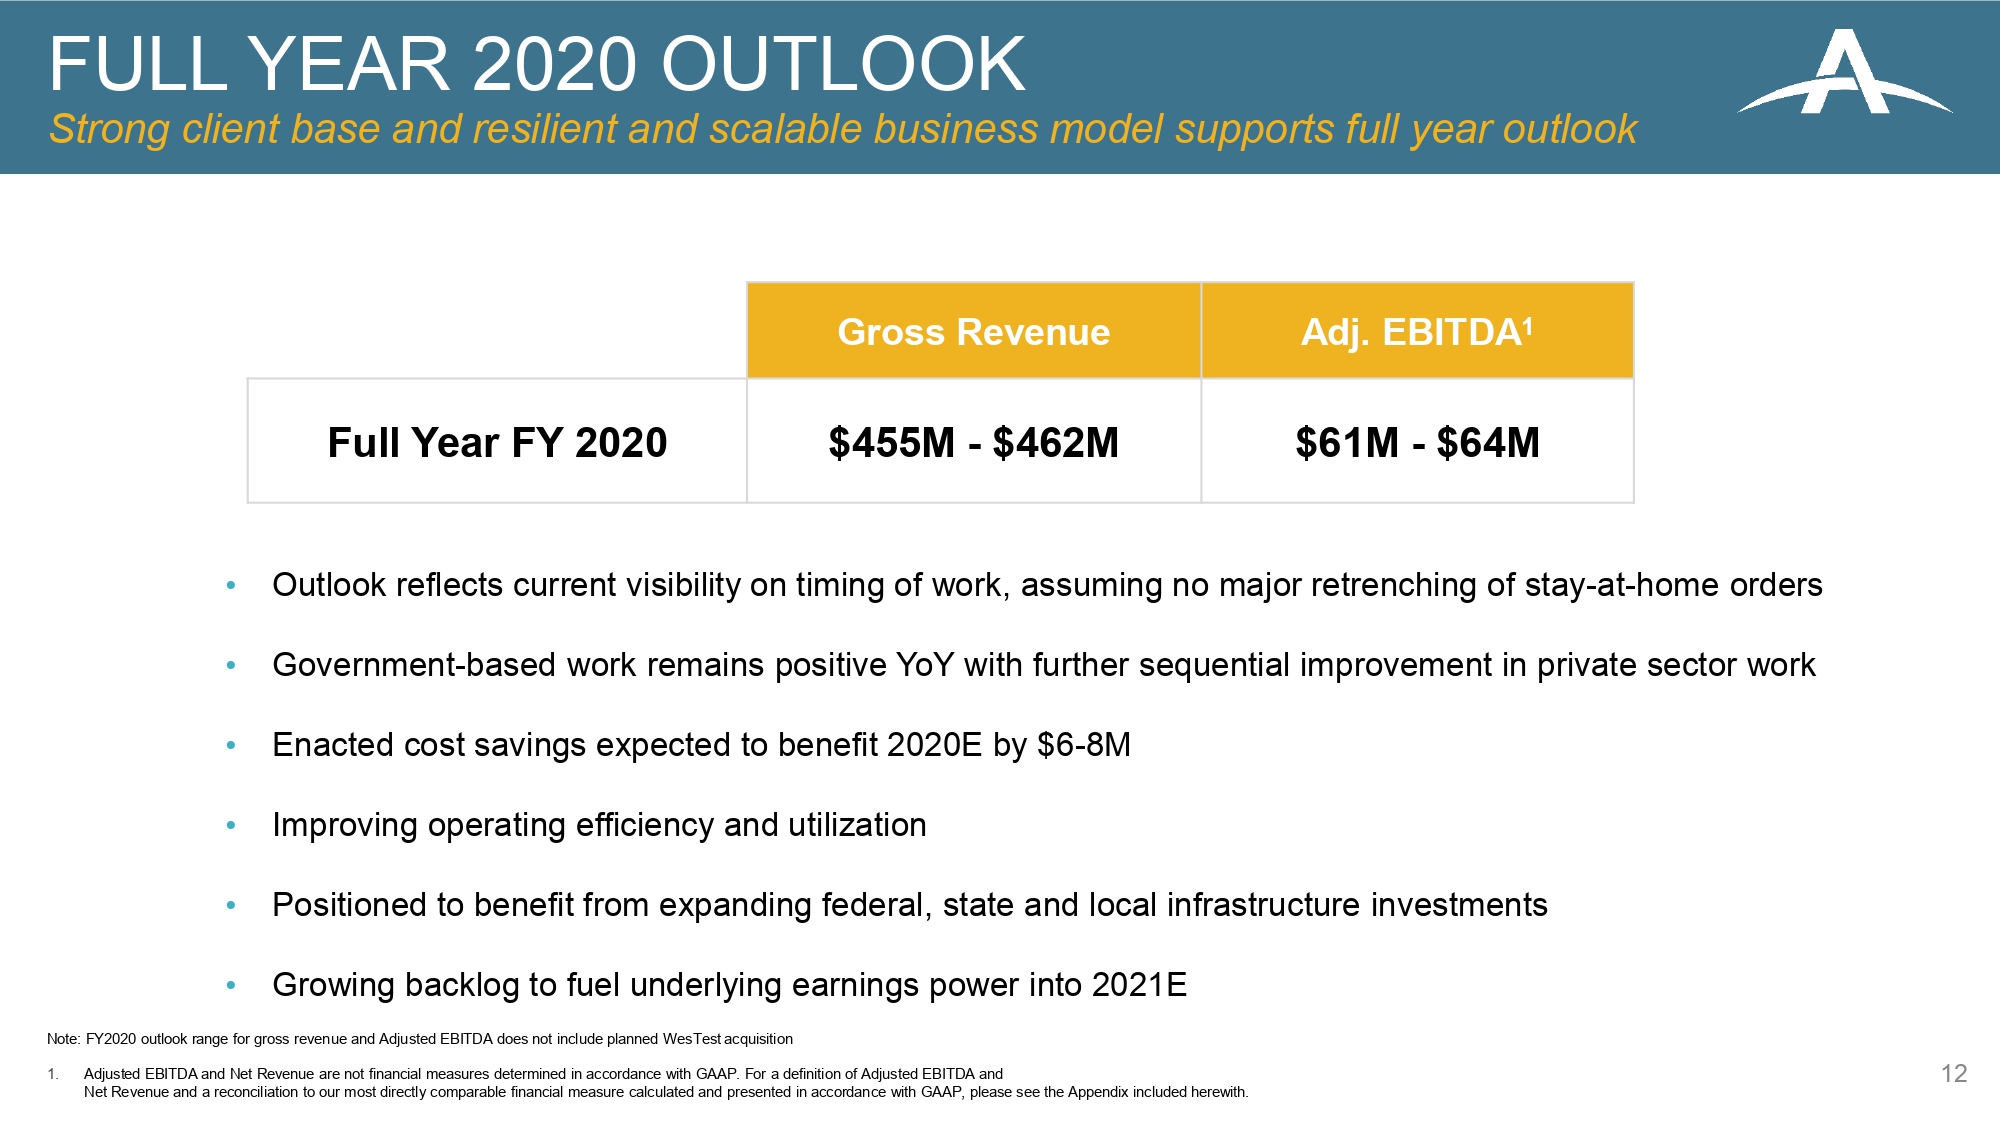
FULL YEAR 2020 OUTLOOK Strong client base and resilient and scalable business model supports full year outlook 12 • Outlook reflects current visibility on timing of work, assuming no major retrenching of stay - at - home orders • Government - based work remains positive YoY with further sequential improvement in private sector work • Enacted cost savings expected to benefit 2020E by $6 - 8M • Improving operating efficiency and utilization • Positioned to benefit from expanding federal, state and local infrastructure investments • Growing backlog to fuel underlying earnings power into 2021E Gross Revenue Adj. EBITDA 1 Full Year FY 2020 $455M - $462M $61M - $ 64M Note: FY2020 outlook range for gross revenue and Adjusted EBITDA does not include planned WesTest acquisition 1. Adjusted EBITDA and Net Revenue are not financial measures determined in accordance with GAAP. For a definition of Adjusted E BIT DA and Net Revenue and a reconciliation to our most directly comparable financial measure calculated and presented in accordan ce with GAAP, please see the Appendix included herewith.
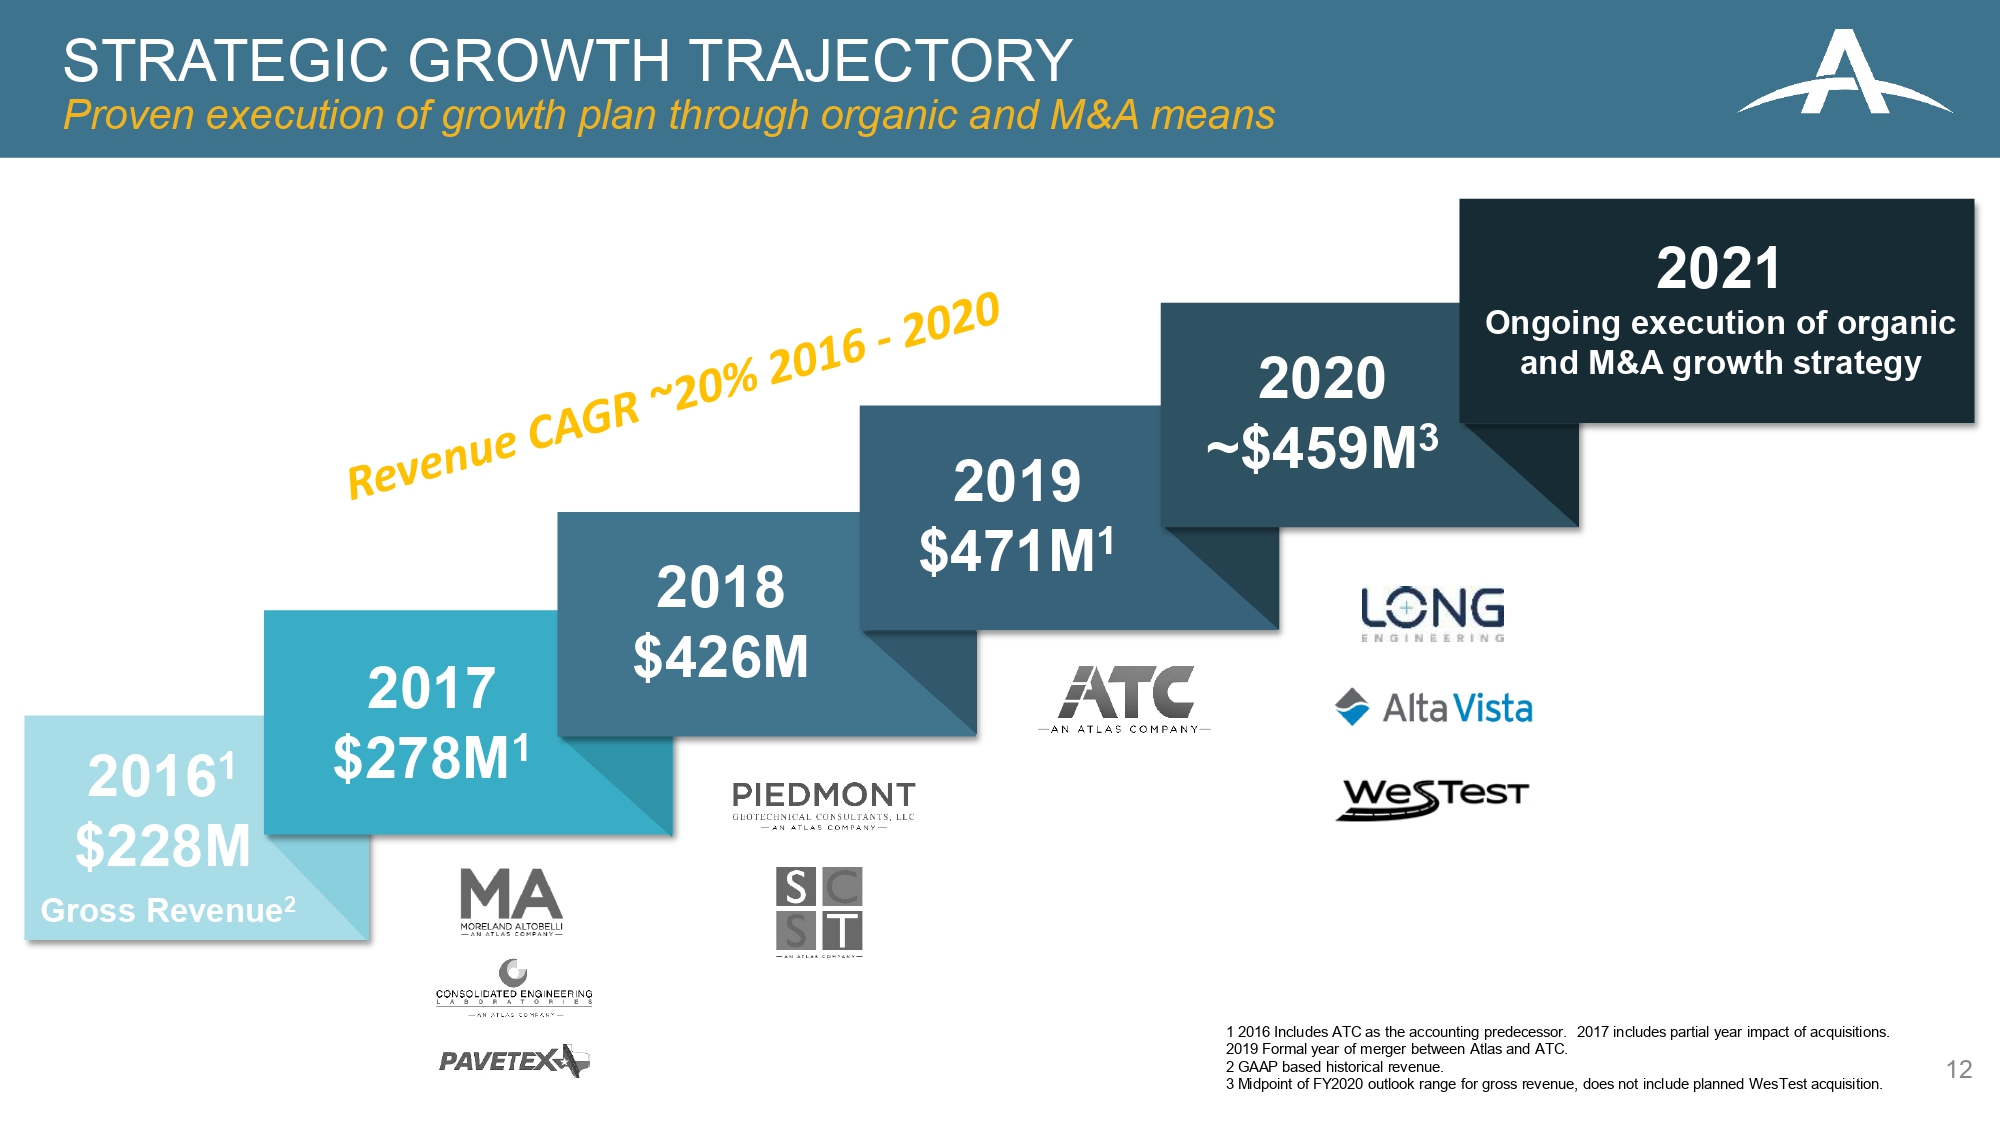
12 2016 1 $228M 2017 $ 278M 1 2018 $426M 2019 $ 471M 1 2020 ~$ 459M 3 2021 Ongoing execution of organic and M&A growth strategy STRATEGIC GROWTH TRAJECTORY Proven execution of growth plan through organic and M&A means Gross Revenue 2 1 2016 Includes ATC as the accounting predecessor. 2017 includes partial year impact of acquisitions. 2019 Formal year of merger between Atlas and ATC. 2 GAAP based historical revenue. 3 Midpoint of FY2020 outlook range for gross revenue, does not include planned WesTest acquisition.
Executing on pipeline of accretive and net leverage reducing acquisitions to further strengthen our resilient, purpose - built platform Strong underlying fundamentals with fully - funded backlog at record level and no cancelled projects Dependable government - based work moving forward and positioned for improvement in private sector work Actively managing costs, cash and capital deployment to efficiently accelerate growth as economies continue to recover SUMMARY 13

APPENDIX 14
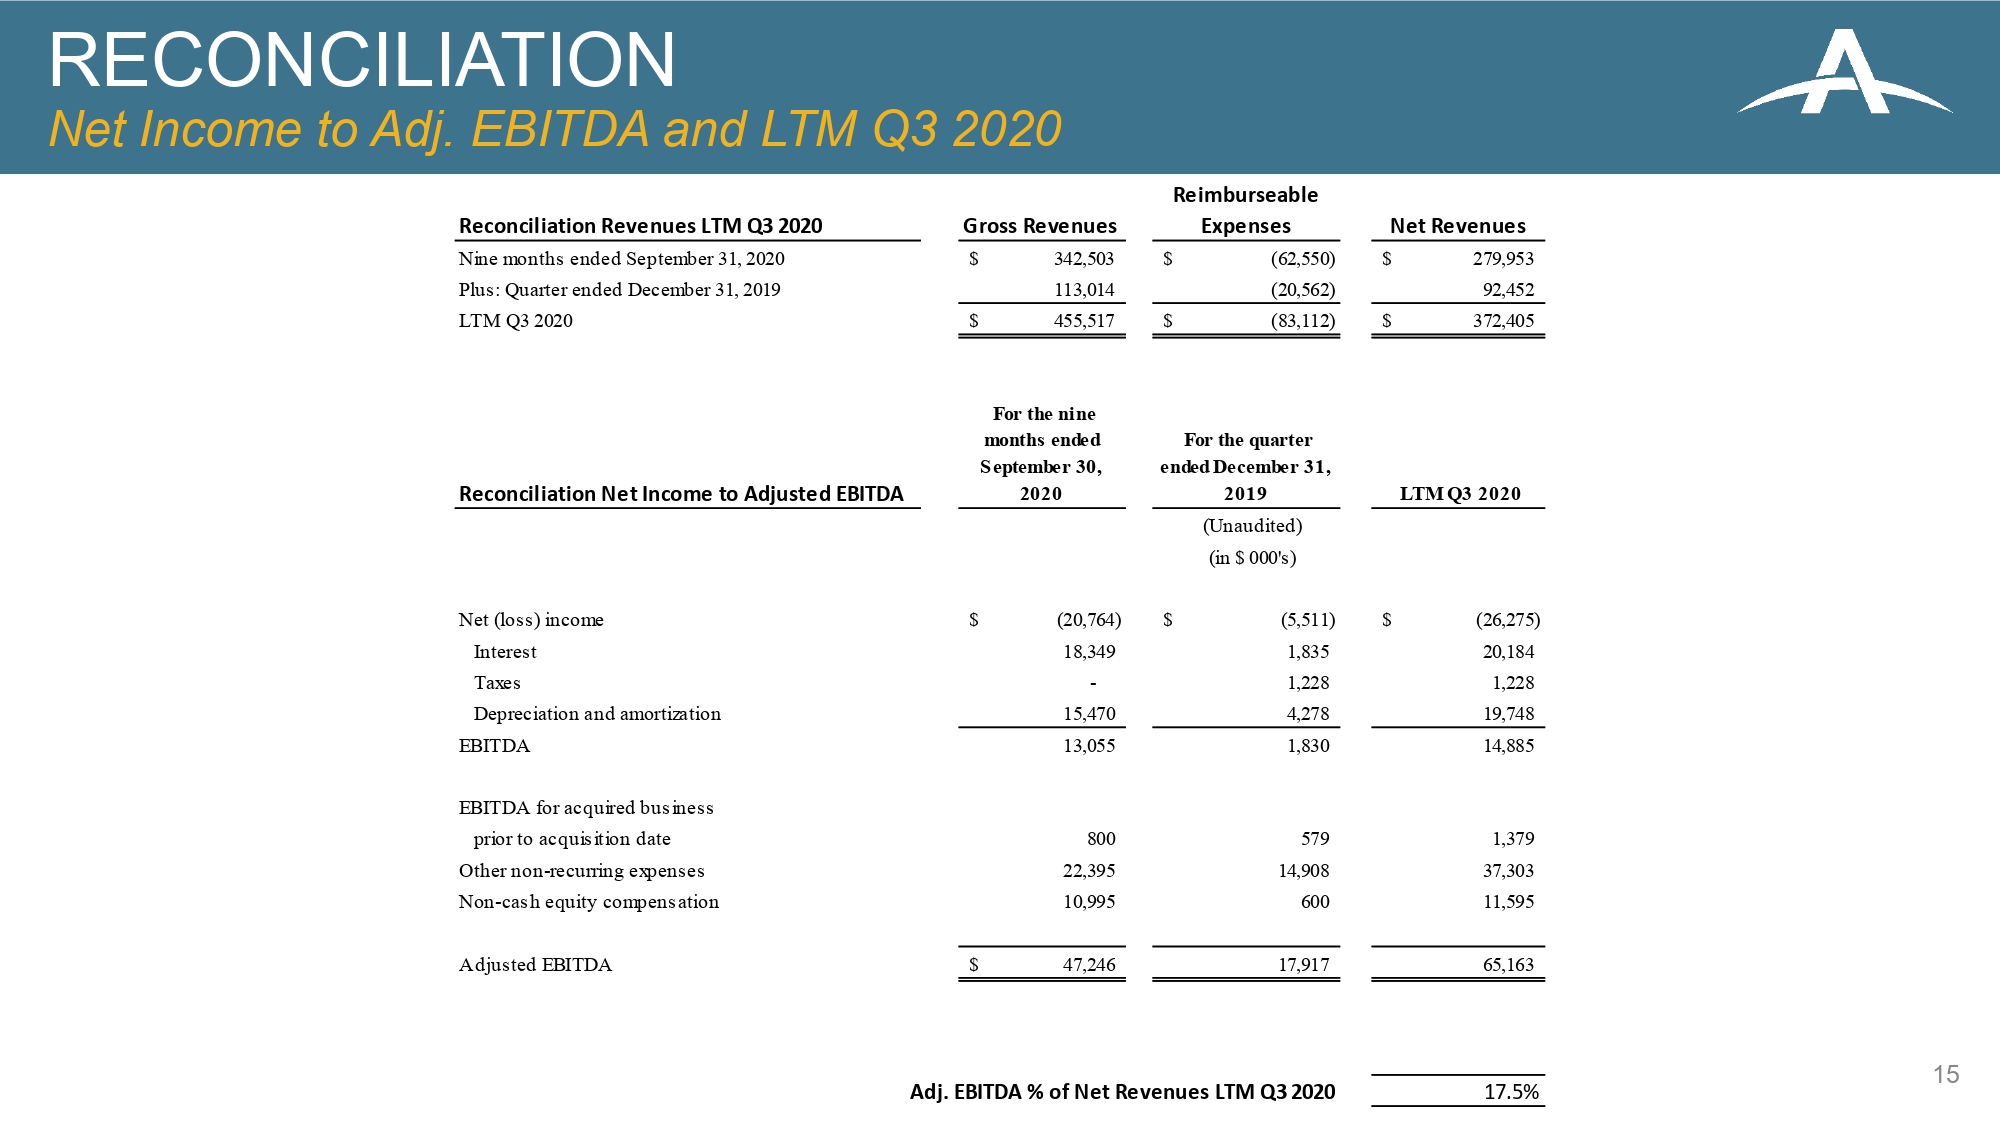
RECONCILIATION Net Income to Adj. EBITDA and LTM Q3 2020 15 Reconciliation Revenues LTM Q3 2020 Gross Revenues Reimburseable Expenses Net Revenues Nine months ended September 31, 2020 342,503$ (62,550)$ 279,953$ Plus: Quarter ended December 31, 2019 113,014 (20,562) 92,452 LTM Q3 2020 455,517$ (83,112)$ 372,405$ Reconciliation Net Income to Adjusted EBITDA For the nine months ended September 30, 2020 For the quarter ended December 31, 2019 LTM Q3 2020 Net (loss) income (20,764)$ (5,511)$ (26,275)$ Interest 18,349 1,835 20,184 Taxes - 1,228 1,228 Depreciation and amortization 15,470 4,278 19,748 EBITDA 13,055 1,830 14,885 EBITDA for acquired business prior to acquisition date 800 579 1,379 Other non-recurring expenses 22,395 14,908 37,303 Non-cash equity compensation 10,995 600 11,595 Adjusted EBITDA 47,246$ 17,917 65,163 Adj. EBITDA % of Net Revenues LTM Q3 2020 17.5% (Unaudited) (in $ 000's)