Exhibit 99.2
November 9, 2022 THIRD QUARTER 2022 EARNINGS PRESENTATION

FORWARD LOOKING STATEMENTS The statements contained in this presentation that are not purely historical are forward - looking statements and involve a number of risks and uncertainties. Our forward - looking statements include, but are not limited to, statements regarding our or our managem ent team’s expectations, hopes, beliefs, intentions or strategies regarding the future. The information included in this presenta tio n in relation to Atlas has been provided by Atlas and its management team, and forward - looking statements include statements relating to Atlas’ management team’s expectations, hopes, beliefs, intentions or strategies regarding the future. In addition, any sta tem ents that refer to projections, forecasts or other characterizations of future events or circumstances, including any underlying assumptions, are forward - looking statements. The words “anticipate,” “believe,” “continue,” “could,” “estimate,” “expect,” “inte nd,” “may,” “might,” “plan,” “possible,” “potential,” “predict,” “project,” “should,” “would” and variations of such words and sim ila r expressions may identify forward - looking statements, but the absence of these words does not mean that a statement is not forward - looking. The forward - looking statements contained in this presentation are based on our current expectations and beliefs concerning future developments and their potential effects on us. There can be no assurance that future developments affectin g u s will be those that we have anticipated. These forward - looking statements involve a number of risks, uncertainties (some of which are beyond our control) or other assumptions that may cause actual results or performance to be materially different from tho se expressed or implied by these forward - looking statements. These risks and uncertainties include, but are not limited to: (1) the ability to maintain the listing of the Company’s shares of Class A common stock on Nasdaq; (2) the ability to recognize the anticipated benefits of the business combination or acquisitions, which may be affected by, among other things, competition, the ability of the Company to grow and manage growth profitably, maintain relationships with customers and suppliers and retain management and key employees; (3) costs related to acquisitions; (4) changes in applicable laws or regulations; (5) the possi bil ity that the Company may be adversely affected by other economic, business, and/or competitive factors, including as a result of COVID - 19; and (6) other risks and uncertainties indicated from time to time in the Company’s filings with the U.S. Securities an d Exchange Commission, including those under “Risk Factors” therein. Given these risks and uncertainties, you are cautioned not to place undue reliance on any forward - looking statements, which speak only as of the date of this presentation. Except as otherwis e required by applicable law, we disclaim any duty to update any forward - looking statements, all of which are expressly qualified by the statements in this section, to reflect events or circumstances after the date of this presentation. 2
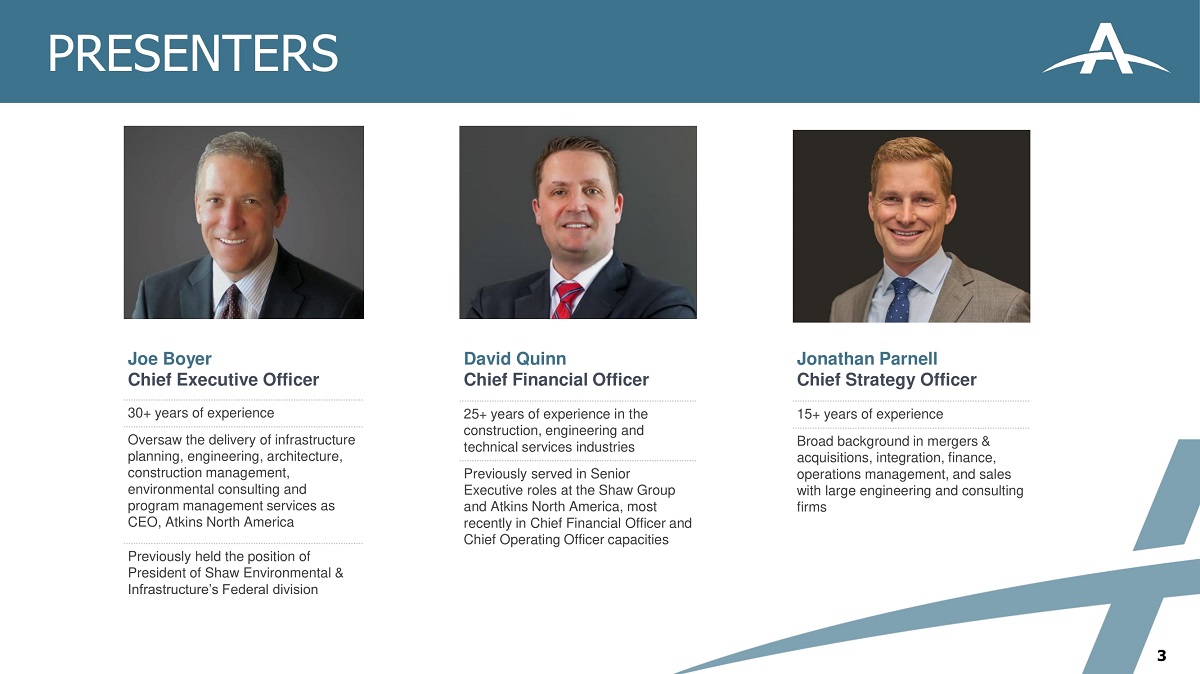
PRESENTERS Joe Boyer Chief Executive Officer 30+ years of experience Oversaw the delivery of infrastructure planning, engineering, architecture, construction management, environmental consulting and program management services as CEO, Atkins North America Previously held the position of President of Shaw Environmental & Infrastructure’s Federal division David Quinn Chief Financial Officer 25+ years of experience in the construction, engineering and technical services industries Previously served in Senior Executive roles at the Shaw Group and Atkins North America, most recently in Chief Financial Officer and Chief Operating Officer capacities 3 Jonathan Parnell Chief Strategy Officer 15+ years of experience Broad background in mergers & acquisitions, integration, finance, operations management, and sales with large engineering and consulting firms
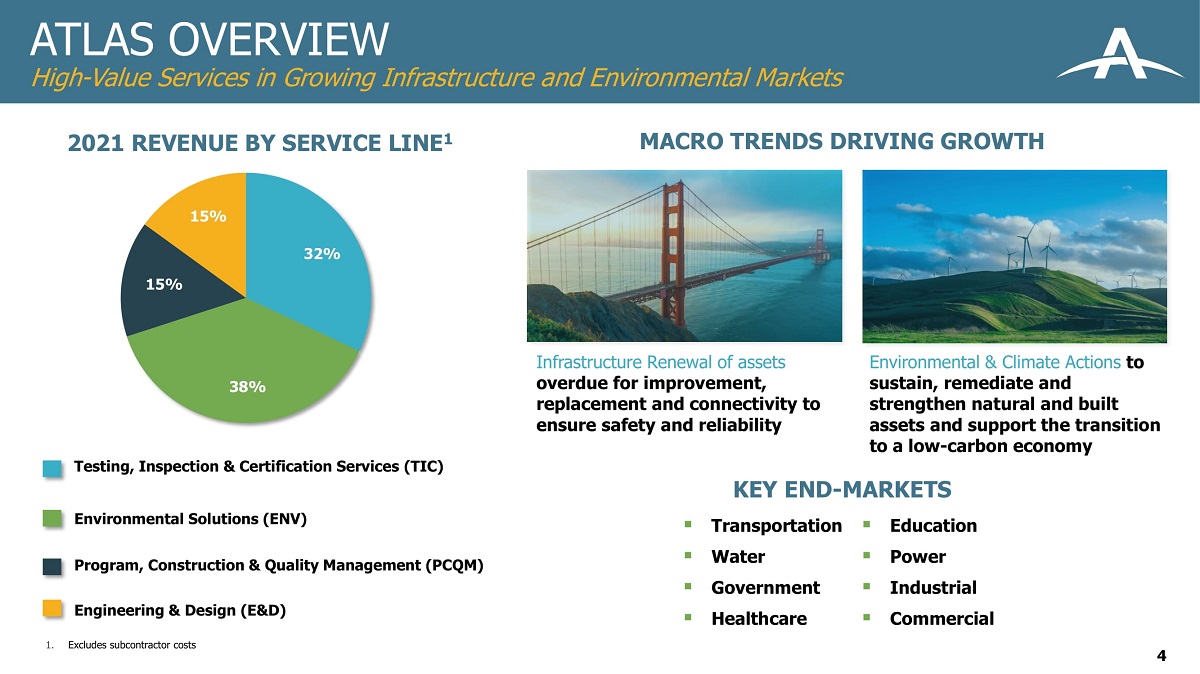
Infrastructure Renewal of assets overdue for improvement, replacement and connectivity to ensure safety and reliability Environmental & Climate Actions to sustain, remediate and strengthen natural and built assets and support the transition to a low - carbon economy ATLAS OVERVIEW High - Value Services in Growing Infrastructure and Environmental Markets 4 Testing, Inspection & Certification Services (TIC) Environmental Solutions (ENV) Program, Construction & Quality Management (PCQM) Engineering & Design (E&D) 32% 38% 15% 15% 2021 REVENUE BY SERVICE LINE 1 MACRO TRENDS DRIVING GROWTH KEY END - MARKETS ▪ Transportation ▪ Education ▪ Water ▪ Power ▪ Government ▪ Industrial ▪ Healthcare ▪ Commercial 1. Excludes subcontractor costs
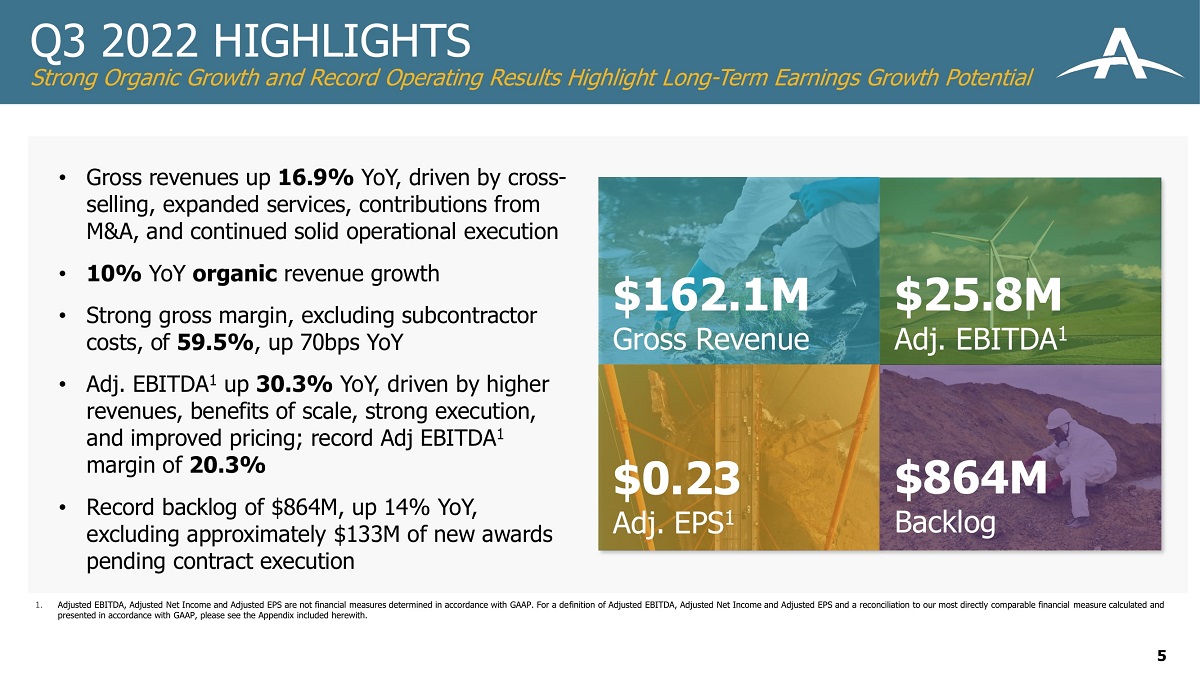
Q3 2022 HIGHLIGHTS Strong Organic Growth and Record Operating Results Highlight Long - Term Earnings Growth Potential 1. Adjusted EBITDA, Adjusted Net Income and Adjusted EPS are not financial measures determined in accordance with GAAP. For a de fin ition of Adjusted EBITDA, Adjusted Net Income and Adjusted EPS and a reconciliation to our most directly comparable financial me asure calculated and presented in accordance with GAAP, please see the Appendix included herewith. • Gross revenues up 16.9% YoY, driven by cross - selling, expanded services, contributions from M&A, and continued solid operational execution • 10% YoY organic revenue growth • Strong gross margin, excluding subcontractor costs, of 59.5% , up 70bps YoY • Adj. EBITDA 1 up 30.3% YoY, driven by higher revenues, benefits of scale, strong execution, and improved pricing; record Adj EBITDA 1 margin of 20.3% • Record backlog of $864M , up 14 % YoY, excluding approximately $133M of new awards pending contract execution $162.1M Gross Revenue $0.23 Adj. EPS 1 $ 25.8 M Adj. EBITDA 1 $864M Backlog 5
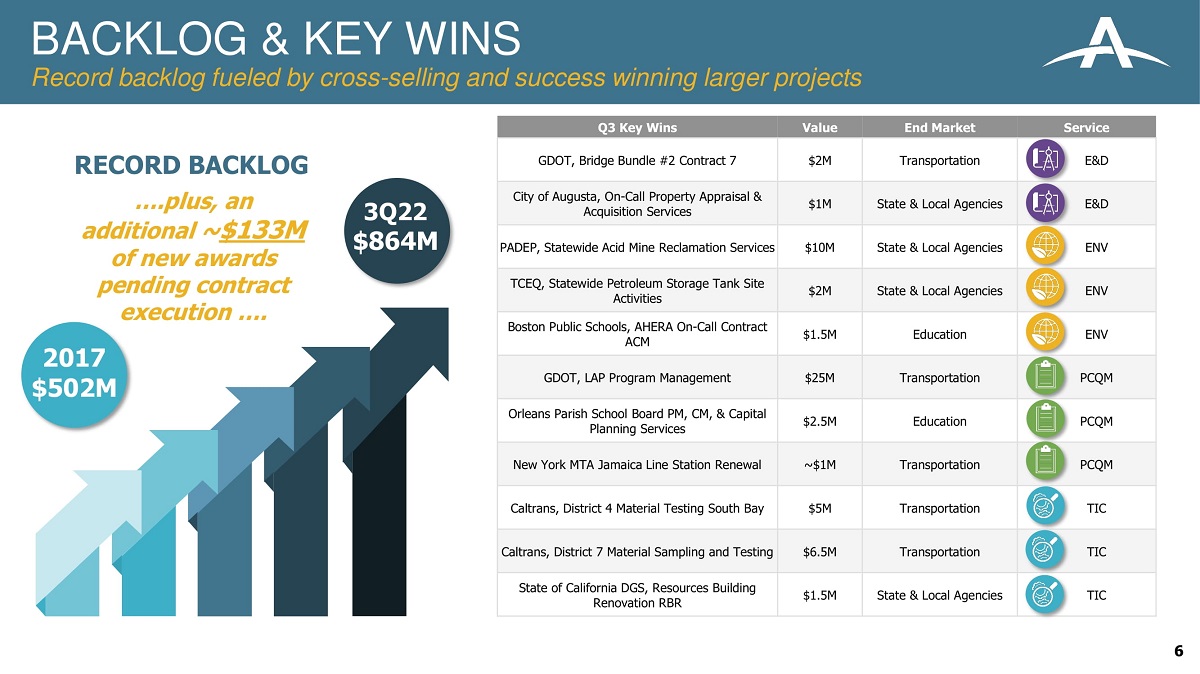
Q3 Key Wins Value End Market Service GDOT, Bridge Bundle #2 Contract 7 $2M Transportation E&D City of Augusta, On - Call Property Appraisal & Acquisition Services $1M State & Local Agencies E&D PADEP, Statewide Acid Mine Reclamation Services $10M State & Local Agencies ENV TCEQ, Statewide Petroleum Storage Tank Site Activities $2M State & Local Agencies ENV Boston Public Schools, AHERA On - Call Contract ACM $1.5M Education ENV GDOT, LAP Program Management $25M Transportation PCQM Orleans Parish School Board PM, CM, & Capital Planning Services $2.5M Education PCQM New York MTA Jamaica Line Station Renewal ~$1M Transportation PCQM Caltrans, District 4 Material Testing South Bay $5M Transportation TIC Caltrans, District 7 Material Sampling and Testing $6.5M Transportation TIC State of California DGS, Resources Building Renovation RBR $1.5M State & Local Agencies TIC RECORD BACKLOG 2017 $502M 3 Q22 $864M ….plus, an additional ~ $ 133 M of new awards pending contract execution …. BACKLOG & KEY WINS Record backlog fueled by cross - selling and success winning larger projects 6

GDOT Local Administered Projects 7 Boston Public Schools Asbestos Project Monitoring and AHERA Management and Consulting Services RECENT PROJECT WINS Highlighting our Diverse Technical Service Offerings Atlas was awarded a contract for Asbestos Project Monitoring and AHERA Management and Consulting Services. This includes lead - based paint testing and remediation oversight, as well as indoor air quality at Boston Public School buildings. Atlas is also developing an LBP protocol for compliance with the Lead Renovation, Repair and Painting (RRP) program, and has also performed on - call & emergency indoor air quality sensor calibrations to maintain a COVID - 19 related classroom indoor air program. Atlas awarded a three - year (plus two, one - year extension options) contract with a maximum value of $25 million to provide project management services for ongoing and future transportation projects throughout Georgia. Atlas will assist GDOT and local public agencies that receive Federal - aid funding through a set of standard practices from award of funding through construction. Positions Atlas to benefit from Infrastructure Investment and Jobs Act (IIJA) funding.
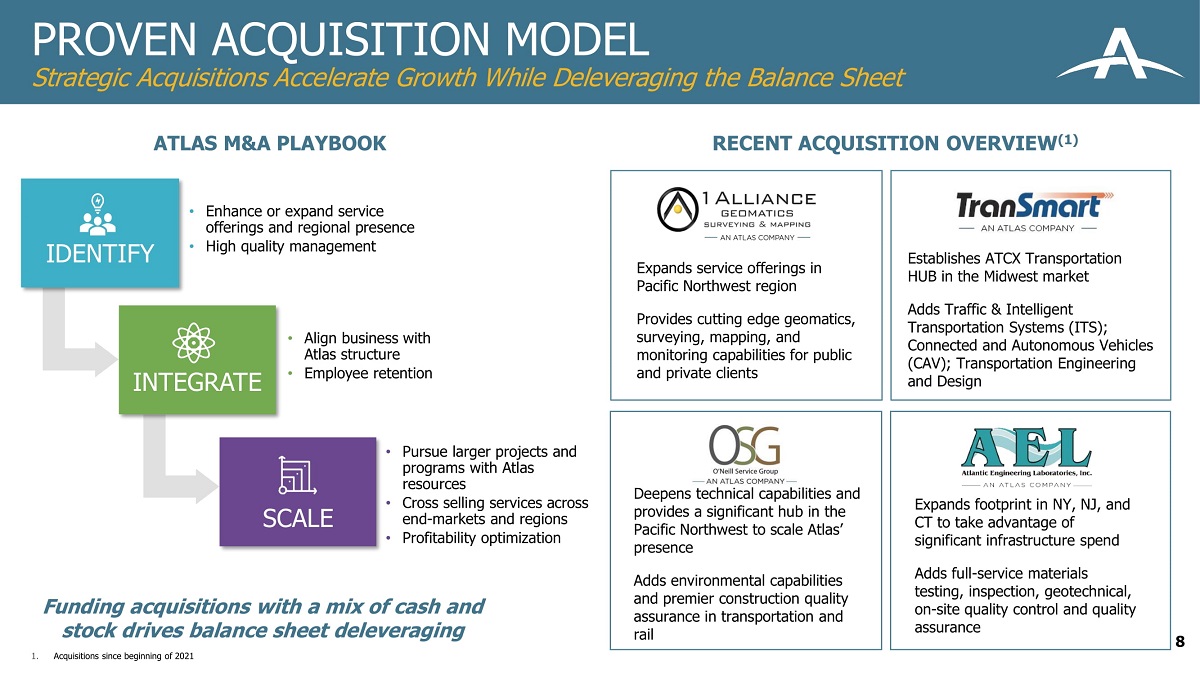
PROVEN ACQUISITION MODEL Strategic Acquisitions Accelerate Growth While Deleveraging the Balance Sheet 8 RECENT ACQUISITION OVERVIEW (1) Expands service offerings in Pacific Northwest region Provides cutting edge geomatics, surveying, mapping, and monitoring capabilities for public and private clients Deepens technical capabilities and provides a significant hub in the Pacific Northwest to scale Atlas’ presence Adds environmental capabilities and premier construction quality assurance in transportation and rail Expands footprint in NY, NJ, and CT to take advantage of significant infrastructure spend Adds full - service materials testing, inspection, geotechnical, on - site quality control and quality assurance Establishes ATCX Transportation HUB in the Midwest market Adds Traffic & Intelligent Transportation Systems (ITS); Connected and Autonomous Vehicles (CAV); Transportation Engineering and Design ATLAS M&A PLAYBOOK Funding acquisitions with a mix of cash and stock drives balance sheet deleveraging IDENTIFY INTEGRATE SCALE • Enhance or expand service offerings and regional presence • High quality management • Align business with Atlas structure • Employee retention • Pursue larger projects and programs with Atlas resources • Cross selling services across end - markets and regions • Profitability optimization 1. Acquisitions since beginning of 2021
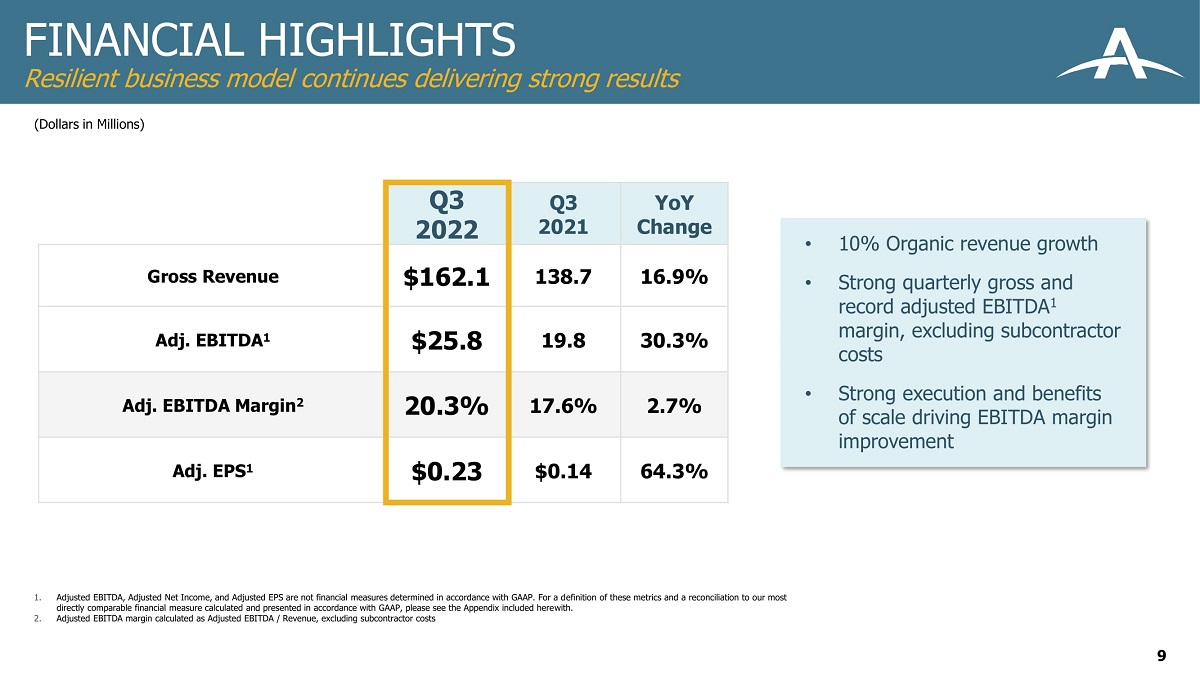
(Dollars in Millions) 1. Adjusted EBITDA, Adjusted Net Income, and Adjusted EPS are not financial measures determined in accordance with GAAP. For a d efi nition of these metrics and a reconciliation to our most directly comparable financial measure calculated and presented in accordance with GAAP, please see the Appendix included here wit h. 2. Adjusted EBITDA margin calculated as Adjusted EBITDA / Revenue, excluding subcontractor costs Q3 2022 Q3 2021 YoY Change Gross Revenue $162.1 138.7 16.9% Adj. EBITDA 1 $25.8 19.8 30.3% Adj. EBITDA Margin 2 20.3% 17.6% 2.7% Adj. EPS 1 $0 .23 $0.14 64.3% FINANCIAL HIGHLIGHTS Resilient business model continues delivering strong results 9 • 10% Organic revenue growth • Strong quarterly gross and record adjusted EBITDA 1 margin, excluding subcontractor costs • Strong execution and benefits of scale driving EBITDA margin improvement
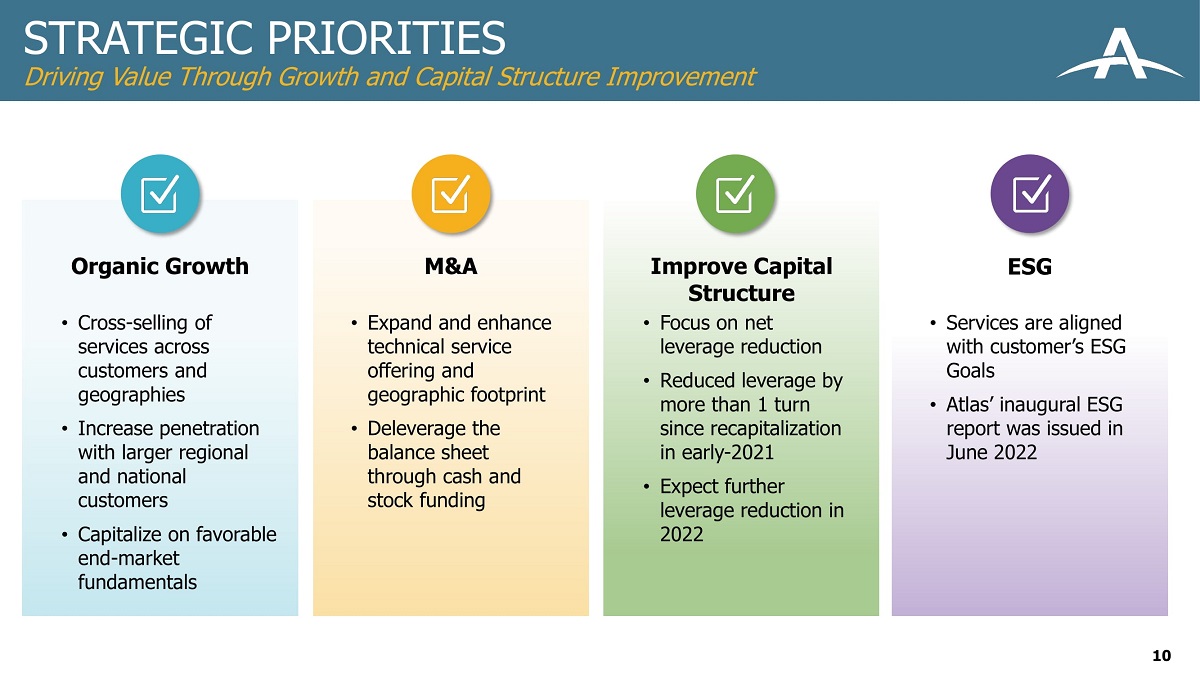
STRATEGIC PRIORITIES Driving Value Through Growth and Capital Structure Improvement 10 Organic Growth M&A Improve Capital Structure ESG • Cross - selling of services across customers and geographies • Increase penetration with larger regional and national customers • Capitalize on favorable end - market fundamentals • Expand and enhance technical service offering and geographic footprint • Deleverage the balance sheet through cash and stock funding • Focus on net leverage reduction • Reduced leverage by more than 1 turn since recapitalization in early - 2021 • Expect further leverage reduction in 2022 • Services are aligned with customer’s ESG Goals • Atlas’ inaugural ESG report was issued in June 2022
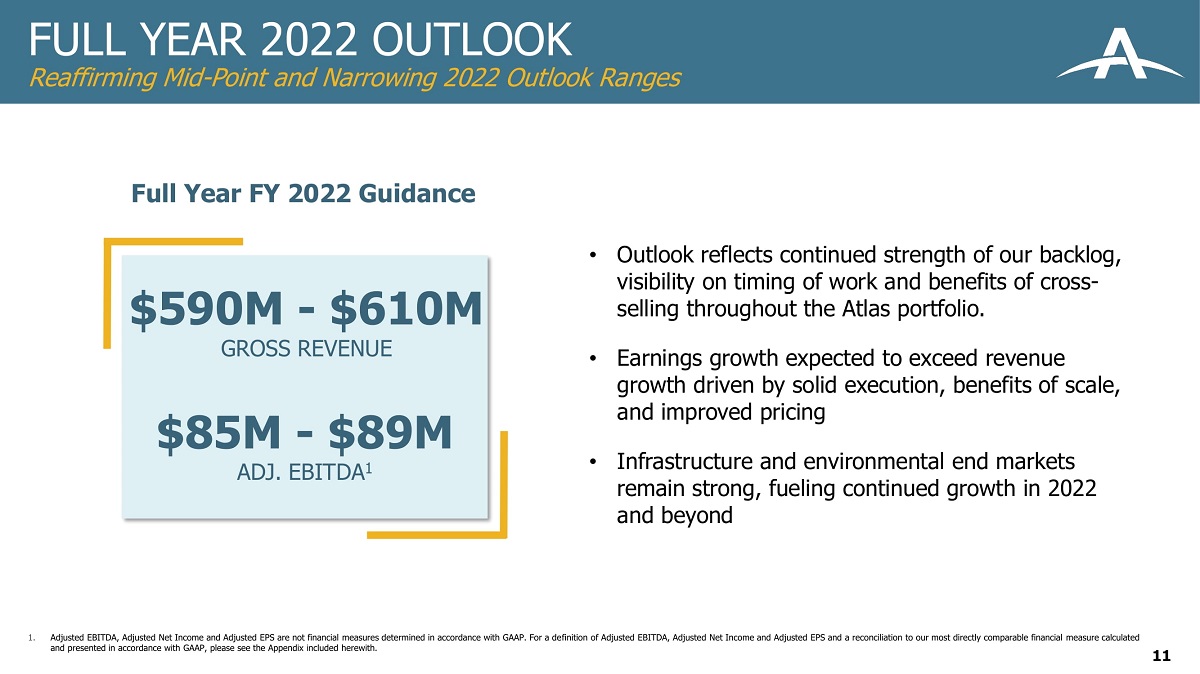
FULL YEAR 2022 OUTLOOK Reaffirming Mid - Point and Narrowing 2022 Outlook Ranges 1. Adjusted EBITDA, Adjusted Net Income and Adjusted EPS are not financial measures determined in accordance with GAAP. For a de fin ition of Adjusted EBITDA, Adjusted Net Income and Adjusted EPS and a reconciliation to our most directly comparable financial me asure calculated and presented in accordance with GAAP, please see the Appendix included herewith. • Outlook reflects continued strength of our backlog, visibility on timing of work and benefits of cross - selling throughout the Atlas portfolio. • Earnings growth expected to exceed revenue growth driven by solid execution, benefits of scale, and improved pricing • Infrastructure and environmental end markets remain strong, fueling continued growth in 2022 and beyond Full Year FY 2022 Guidance $590M - $610M GROSS REVENUE $85M - $89M ADJ. EBITDA 1 11
Executing on cross selling - initiatives, winning larger projects, integration efforts and accretive and deleveraging M&A Strong third quarter and YTD results in 2022 highlight successes of our growth strategy and demonstrate long - term earnings growth potential Growth is being driven by increased demand from both public and private sector customers, supported by secular trends such as the aging of infrastructure and increased focus on environmental sustainability. Atlas is well positioned to benefit from Federal Stimulus funding Positioned for continued progress in the reduction of net leverage. SUMMARY 12

APPENDIX 13
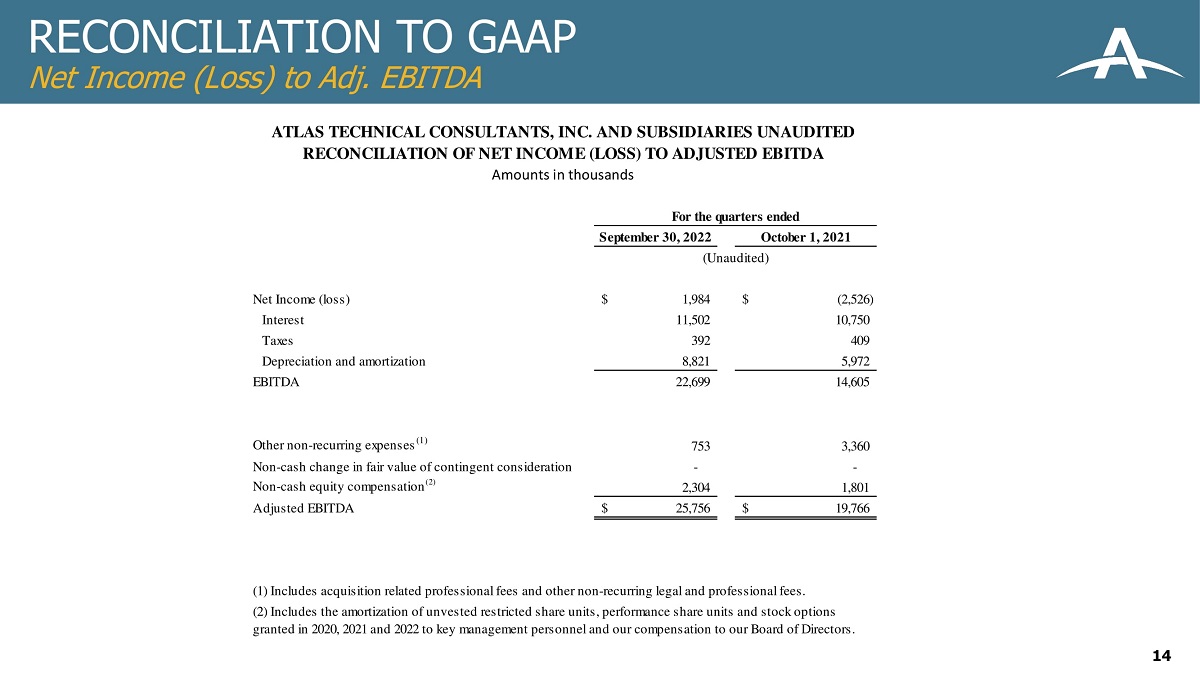
RECONCILIATION TO GAAP Net Income (Loss) to Adj. EBITDA 14 September 30, 2022 October 1, 2021 Net Income (loss) 1,984$ (2,526)$ Interest 11,502 10,750 Taxes 392 409 Depreciation and amortization 8,821 5,972 EBITDA 22,699 14,605 Other non-recurring expenses (1) 753 3,360 Non-cash change in fair value of contingent consideration - - Non-cash equity compensation (2) 2,304 1,801 Adjusted EBITDA 25,756$ 19,766$ ATLAS TECHNICAL CONSULTANTS, INC. AND SUBSIDIARIES UNAUDITED RECONCILIATION OF NET INCOME (LOSS) TO ADJUSTED EBITDA Amounts in thousands (2) Includes the amortization of unvested restricted share units, performance share units and stock options granted in 2020, 2021 and 2022 to key management personnel and our compensation to our Board of Directors. For the quarters ended (Unaudited) (1) Includes acquisition related professional fees and other non-recurring legal and professional fees.
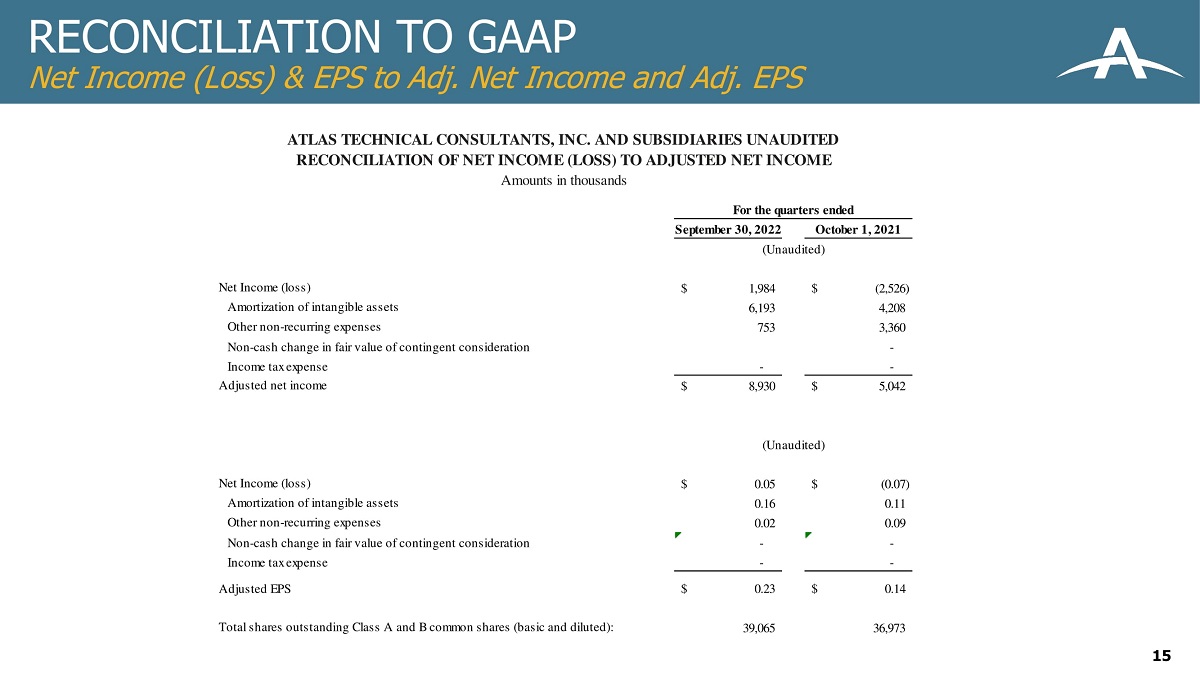
RECONCILIATION TO GAAP Net Income (Loss) & EPS to Adj. Net Income and Adj. EPS 15 September 30, 2022 October 1, 2021 Net Income (loss) 1,984$ (2,526)$ Amortization of intangible assets 6,193 4,208 Other non-recurring expenses 753 3,360 Non-cash change in fair value of contingent consideration - Income tax expense - - Adjusted net income 8,930$ 5,042$ Net Income (loss) 0.05$ (0.07)$ Amortization of intangible assets 0.16 0.11 Other non-recurring expenses 0.02 0.09 Non-cash change in fair value of contingent consideration - - Income tax expense - - Adjusted EPS 0.23$ 0.14$ Total shares outstanding Class A and B common shares (basic and diluted): 39,065 36,973 ATLAS TECHNICAL CONSULTANTS, INC. AND SUBSIDIARIES UNAUDITED RECONCILIATION OF NET INCOME (LOSS) TO ADJUSTED NET INCOME Amounts in thousands (Unaudited) For the quarters ended (Unaudited)