UNITED STATES
SECURITIES AND EXCHANGE COMMISSION
Washington, D.C. 20549
FORM N-CSR
CERTIFIED SHAREHOLDER REPORT OF REGISTERED MANAGEMENT
INVESTMENT COMPANIES
Investment Company Act file number: 811-23380
| Name of Fund: | | BlackRock Credit Strategies Fund |
| Fund Address: | | 100 Bellevue Parkway, Wilmington, DE 19809 |
Name and address of agent for service: John M. Perlowski, Chief Executive Officer, BlackRock Credit
Strategies Fund, 50 Hudson Yards, New York, NY 10001
Registrant’s telephone number, including area code: (800) 882-0052, Option 4
Date of fiscal year end: 12/31/2022
Date of reporting period: 12/31/2022
Item 1 – Report to Stockholders
(a) The Report to Shareholders is attached herewith.
| | |

| | DECEMBER 31, 2022 |
BlackRock Credit Strategies Fund
|
| Not FDIC Insured • May Lose Value • No Bank Guarantee |
The Markets in Review
Dear Shareholder,
Significant economic headwinds emerged during the 12-month reporting period ended December 31, 2022, as investors navigated changing economic conditions and volatile markets. The U.S. economy shrank in the first half of 2022 before returning to modest growth in the third quarter, marking a shift to a more challenging post-reopening economic environment. Changes in consumer spending patterns and a tight labor market led to elevated inflation, which reached a 40-year high before beginning to moderate. Moreover, while the foremost effect of Russia’s invasion of Ukraine has been a severe humanitarian crisis, the ongoing war continued to present challenges for both investors and policymakers.
Equity prices fell as interest rates rose, particularly during the first half of the reporting period. Both large- and small-capitalization U.S. stocks fell, although equities began to recover in the second half of the year as inflation eased and economic growth resumed. Emerging market stocks and international equities from developed markets declined overall, pressured by rising interest rates and a strengthening U.S. dollar.
The 10-year U.S. Treasury yield rose notably during the reporting period, driving its price down, as investors reacted to fluctuating inflation data and attempted to anticipate its impact on future interest rate changes. The corporate bond market also faced inflationary headwinds, and heightened uncertainty led to higher corporate bond spreads (the difference in yield between U.S. Treasuries and similarly-dated corporate bonds).
The U.S. Federal Reserve (the “Fed”), acknowledging that inflation has been more persistent than expected, raised interest rates seven times. Furthermore, the Fed wound down its bond-buying programs and is accelerating the reduction of its balance sheet. While the Fed suggested that additional rate hikes were likely, it also gave indications that the pace of increases would slow if inflation continued to subside.
The pandemic’s restructuring of the economy brought an ongoing mismatch between supply and demand, contributing to the current inflationary regime. While growth slowed in 2022, we believe that taming inflation requires a more dramatic economic decline to bring demand back to a level more in line with the economy’s capacity. The Fed has been raising interest rates at the fastest pace in decades, and seems set to overtighten in its effort to get inflation back to target. With this in mind, we believe the possibility of a U.S. recession in the near-term is high, but this prospect has not yet been fully priced in by markets. Investors should expect a period of higher volatility as markets adjust to the new economic reality and policymakers attempt to adapt to rapidly changing conditions.
In this environment, while we favor an overweight to equities in the long-term, the market’s concerns over excessive rate hikes from central banks moderate our outlook. Rising input costs and a deteriorating economic backdrop are likely to challenge corporate earnings, so we are underweight equities overall in the near term. However, we see better opportunities in credit, where valuations are attractive and higher yields provide income opportunities. We believe that global investment-grade corporates, global inflation-linked bonds, and U.S. mortgage-backed securities offer strong opportunities for a six- to twelve-month horizon.
Overall, our view is that investors need to think globally, position themselves to be prepared for a decarbonizing economy, and be nimble as market conditions change. We encourage you to talk with your financial advisor and visit blackrock.com for further insight about investing in today’s markets.
Sincerely,

Rob Kapito
President, BlackRock Advisors, LLC

Rob Kapito
President, BlackRock Advisors, LLC
| | | | |
Total Returns as of December 31, 2022 |
| | | |
| | | 6-Month | | 12-Month |
| | |
U.S. large cap equities
(S&P 500® Index) | | 2.31% | | (18.11)% |
| | |
U.S. small cap equities
(Russell 2000® Index) | | 3.91 | | (20.44) |
| | |
International equities
(MSCI Europe, Australasia, Far East Index) | | 6.36 | | (14.45) |
| | |
Emerging market equities
(MSCI Emerging Markets Index) | | (2.99) | | (20.09) |
| | |
3-month Treasury bills
(ICE BofA 3-Month U.S. Treasury Bill Index) | | 1.32 | | 1.47 |
| | |
U.S. Treasury securities
(ICE BofA 10-Year U.S. Treasury Index)
| | (5.58) | | (16.28) |
| | |
U.S. investment grade bonds
(Bloomberg U.S. Aggregate Bond Index) | | (2.97) | | (13.01) |
| | |
Tax-exempt municipal bonds
(Bloomberg Municipal Bond Index) | | 0.50 | | (8.53) |
| | |
U.S. high yield bonds
(Bloomberg U.S. Corporate High Yield 2% Issuer Capped Index) | | 3.50 | | (11.18) |
Past performance is not an indication of future results. Index performance is shown for illustrative purposes only. You cannot invest directly in an index.
| | |
| 2 | | T H I S P A G E I S N O T P A R T O F Y O U R F U N D R E P O R T |
Table of Contents
| | |
| The Benefits and Risks of Leveraging | | |
The Fund may utilize leverage to seek to enhance the distribution rate on, and net asset value (“NAV”) of, its common shares (“Common Shares”). However, there is no guarantee that these objectives can be achieved in all interest rate environments.
In general, the concept of leveraging is based on the premise that the financing cost of leverage, which is based on short-term interest rates, is normally lower than the income earned by the Fund on its longer-term portfolio investments purchased with the proceeds from leverage. To the extent that the total assets of the Fund (including the assets obtained from leverage) are invested in higher-yielding portfolio investments, the Fund’s shareholders benefit from the incremental net income. The interest earned on securities purchased with the proceeds from leverage (after paying the leverage costs) is paid to shareholders in the form of dividends, and the value of these portfolio holdings (less the leverage liability) is reflected in the per share NAV.
To illustrate these concepts, assume the Fund’s capitalization is $100 million and it utilizes leverage for an additional $30 million, creating a total value of $130 million available for investment in longer-term income securities. If prevailing short-term interest rates are 3% and longer-term interest rates are 6%, the yield curve has a strongly positive slope. In this case, the Fund’s financing costs on the $30 million of proceeds obtained from leverage are based on the lower short-term interest rates. At the same time, the securities purchased by the Fund with the proceeds from leverage earn income based on longer-term interest rates. In this case, the Fund’s financing cost of leverage is significantly lower than the income earned on the Fund’s longer-term investments acquired from such leverage proceeds, and therefore the holders of Common Shares (“Common Shareholders”) are the beneficiaries of the incremental net income.
However, in order to benefit shareholders, the return on assets purchased with leverage proceeds must exceed the ongoing costs associated with the leverage. If interest and other costs of leverage exceed the Fund’s return on assets purchased with leverage proceeds, income to shareholders is lower than if the Fund had not used leverage. Furthermore, the value of the Fund’s portfolio investments generally varies inversely with the direction of long-term interest rates, although other factors can influence the value of portfolio investments. In contrast, the amount of the Fund’s obligations under its leverage arrangement generally does not fluctuate in relation to interest rates. As a result, changes in interest rates can influence the Fund’s NAVs positively or negatively. Changes in the future direction of interest rates are very difficult to predict accurately, and there is no assurance that the Fund’s intended leveraging strategy will be successful.
The use of leverage also generally causes greater changes in the Fund’s NAV, market price and dividend rates than comparable portfolios without leverage. In a declining market, leverage is likely to cause a greater decline in the NAV and market price of the Fund’s shares than if the Fund were not leveraged. In addition, the Fund may be required to sell portfolio securities at inopportune times or at distressed values in order to comply with regulatory requirements applicable to the use of leverage or as required by the terms of leverage instruments, which may cause the Fund to incur losses. The use of leverage may limit the Fund’s ability to invest in certain types of securities or use certain types of hedging strategies. The Fund incurs expenses in connection with the use of leverage, all of which are borne by shareholders and may reduce income to the shareholders. Moreover, to the extent the calculation of the Fund’s investment advisory fees includes assets purchased with the proceeds of leverage, the investment advisory fees payable to the Fund’s investment adviser will be higher than if the Fund did not use leverage.
The Fund may utilize leverage through a credit facility or reverse repurchase agreements as described in the Notes to Consolidated Financial Statements, if applicable.
Under the Investment Company Act of 1940, as amended (the “1940 Act”), the Fund is permitted to borrow money (including through the use of TOB Trusts) or issue debt securities up to 33 1/3% of its total managed assets. The Fund may voluntarily elect to limit its leverage to less than the maximum amount permitted under the 1940 Act. In addition, the Fund may also be subject to certain asset coverage, leverage or portfolio composition requirements imposed by its credit facility, which may be more stringent than those imposed by the 1940 Act.
Derivative Financial Instruments
The Fund may invest in various derivative financial instruments. These instruments are used to obtain exposure to a security, commodity, index, market, and/or other assets without owning or taking physical custody of securities, commodities and/or other referenced assets or to manage market, equity, credit, interest rate, foreign currency exchange rate, commodity and/or other risks. Derivative financial instruments may give rise to a form of economic leverage and involve risks, including the imperfect correlation between the value of a derivative financial instrument and the underlying asset, possible default of the counterparty to the transaction or illiquidity of the instrument. Pursuant to Rule 18f-4 under the 1940 Act, among other things, the Fund must either use derivative financial instruments with embedded leverage in a limited manner or comply with an outer limit on fund leverage risk based on value-at-risk. The Fund’s successful use of a derivative financial instrument depends on the investment adviser’s ability to predict pertinent market movements accurately, which cannot be assured. The use of these instruments may result in losses greater than if they had not been used, may limit the amount of appreciation the Fund can realize on an investment and/or may result in lower distributions paid to shareholders. The Fund’s investments in these instruments, if any, are discussed in detail in the Notes to Consolidated Financial Statements.
| | |
| 4 | | 2 0 2 2 BLACK ROCK ANNUAL REPORT TO SHAREHOLDERS |
| | |
| Fund Summary as of December 31, 2022 | | BlackRock Credit Strategies Fund |
Investment Objective
BlackRock Credit Strategies Fund’s (the “Fund”) investment objective is to seek to provide high income and attractive risk-adjusted returns. The Fund seeks to achieve its investment objective by investing, under normal circumstances, at least 80% of its managed assets in fixed income securities, with an emphasis on public and private corporate credit.
The Fund’s common shares are not listed on any securities exchange. The Fund is designed for long-term investors, and an investment in the common shares, unlike an investment in a traditional listed closed-end fund, should be considered illiquid.
No assurance can be given that the Fund’s investment objective will be achieved.
Net Asset Value Per Share Summary
| | | | | | | | | | | | | | | | | | | | |
| | | | 12/31/22 | | | | 12/31/21 | | | | Change | | | | High | | | | Low | |
| | | | | |
Net Asset Value — Institutional | | $ | 8.48 | | | $ | 9.96 | | | | (14.86 | )% | | $ | 9.96 | | | $ | 8.36 | |
| | | | | |
Net Asset Value — Class A | | | 8.50 | | | | 9.97 | | | | (14.74 | ) | | | 9.97 | | | | 8.38 | |
| | | | | |
Net Asset Value — Class U | | | 8.50 | | | | 9.97 | | | | (14.74 | ) | | | 9.97 | | | | 8.38 | |
Net Asset Value — Class W | | | 8.50 | | | | 9.97 | | | | (14.74 | ) | | | 9.97 | | | | 8.38 | |
GROWTH OF $10,000 INVESTMENT
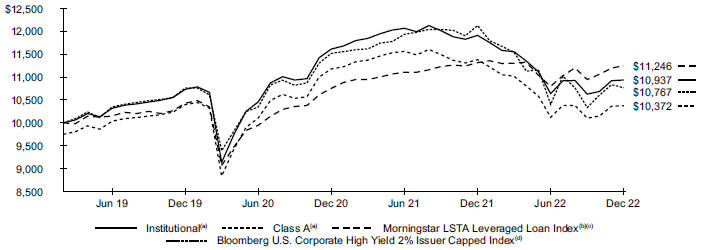
The Fund commenced operations on February 28, 2019.
| | (a) | Assuming maximum sales charges, if any, transaction costs and other operating expenses, including investment advisory fees. Institutional Shares do not have a sales charge. | |
| | (b) | Morningstar LSTA Leveraged Loan Index (formerly S&P/LSTA Leveraged Loan Index), an unmanaged market value-weighted index designed to measure the performance of the U.S. leveraged loan market based upon market weightings, spreads and interest payments. | |
| | (c) | The Fund changed its reporting benchmark from Bloomberg U.S. Corporate High Yield 2% Issuer Capped Index to Morningstar LSTA Leveraged Loan Index (formerly S&P®/LSTA Leveraged Loan Index). The investment adviser believes the new benchmark is a more appropriate reporting benchmark for the Fund. | |
| | (d) | Bloomberg U.S. Corporate High Yield 2% Issuer Capped Index, an unmanaged index comprised of issues that meet the following criteria: at least $150 million par value outstanding; maximum credit rating of Ba1; at least one year to maturity; and no issuer represents more than 2% of the index. | |
| | |
| Fund Summary as of December 31, 2022 (continued) | | BlackRock Credit Strategies Fund |
Performance
Returns for the period ended December 31, 2022 were as follows:
| | | | | | | | | | | | | | | | | | | | | | | | |
| | | | | | | | | Average Annual Total Returns(a) | |
| | | | |
| | | | | | | | | 1 Year | | | Since
Inception(b) | |
| | | | | | |
| | | Standardized
30-Day Yields | | | Unsubsidized
30-Day Yields | | | Without
Sales
Charge | | | With
Sales
Charge | | | Without
Sales
Charge | | | With
Sales
Charge | |
Institutional(c) | | | 9.24 | % | | | 9.23 | % | | | (8.17 | )% | | | N/A | | | | 2.36 | % | | | N/A | |
Class A(c) | | | 8.35 | | | | 8.34 | | | | (8.87 | ) | | | (11.14 | )% | | | 1.62 | | | | 0.96 | % |
Class U(c) | | | 8.57 | | | | 8.57 | | | | (8.87 | ) | | | N/A | | | | 1.62 | | | | N/A | |
Class W(c) | | | 8.25 | | | | 8.25 | | | | (8.87 | ) | | | (12.05 | ) | | | 1.62 | | | | 0.68 | |
Morningstar LSTA Leveraged Loan Index | | | — | | | | — | | | | (0.60 | ) | | | N/A | | | | 3.11 | | | | N/A | |
Bloomberg U.S. Corporate High Yield 2% Issuer Capped Index | | | — | | | | — | | | | (11.18 | ) | | | N/A | | | | 1.95 | | | | N/A | |
| | (a) | Assuming maximum sales charges, if any. Average annual total returns with and without sales charges reflect reductions for distribution and service fees. See “About Fund Performance” for a detailed description of share classes, including any related sales charges and fees, and how performance was calculated for certain share classes. | |
| | (b) | The Fund commenced operations on February 28, 2019. | |
| | (c) | All returns reflect reinvestment of dividends and/or distributions at NAV on the payable date. Performance results reflect the Fund’s use of leverage. | |
N/A — Not applicable as share class and index do not have a sales charge.
Performance results may include adjustments made for financial reporting purposes in accordance with U.S. generally accepted accounting principles. Past performance is not an indication of future results.
The Fund is presenting the performance of one or more indices for informational purposes only. The Fund is actively managed and does not seek to track or replicate the performance of any index. The index performance shown is not intended to be indicative of the Fund’s investment strategies, portfolio components or past or future performance.
The following discussion relates to the Fund’s absolute performance based on NAV:
What factors influenced performance?
Exposure to global high yield corporate bonds detracted from performance as markets experienced volatility throughout the year. Global investment grade corporate bonds also detracted from performance, along with preferred securities (which share characteristics of both stocks and bonds). While benefiting from their floating rate nature in the rising interest rate environment, floating rate loan interest and collateralized loan obligations (“CLOs”) also detracted from performance. Finally, the Fund’s interest rate positioning weighed on return.
Contributors to performance for the period were limited as financial markets dealt with persistently elevated inflation and hawkish global central banks. Nonetheless, private credit exposure was accretive to performance as the asset class delivered strong yields and more stable returns than liquid credit assets as risk assets sold off throughout the period.
The Fund utilizes various derivatives positions as part of its investment strategy, including employing leverage, forward contracts to hedge foreign currency exposure of non-U.S. positions back to U.S. dollars, interest rate futures to adjust duration positioning tactically as needed, and credit default swaps to gain access to or to hedge broad market exposure. The use of derivatives had a positive impact on performance, particularly through the use of forward currency contracts.
Describe recent portfolio activity.
The Fund meaningfully reduced its non-U.S. exposure, particularly through the reduction of allocations to European high yield corporate bonds and Asian high yield and investment grade corporates. After starting the period with an above average allocation to floating rate loan interest, the Fund increased this allocation to its historical high in the first half of the period before trimming the exposure into the end of the period back to near its historical average. Additionally, the Fund increased exposure to U.S. high yield and investment grade corporate bonds, private credit and CLOs, while reducing exposure to preferred securities.
Describe portfolio positioning at period end.
The Fund ended the period with a continued tilt toward floating rate assets such as private credit, floating rate loan interest and CLOs, which stand to do well in rising rate environments. Additionally, the Fund also continued to have a domestic bias, with above average exposure to the U.S. and below average exposure to non-U.S. regions, most notably Europe and Asia. Lastly, while still below historical average levels, the Fund ended the period with a greater allocation to U.S. high yield corporate bonds relative to the beginning of the period.
The views expressed reflect the opinions of BlackRock as of the date of this report and are subject to change based on changes in market, economic or other conditions. These views are not intended to be a forecast of future events and are no guarantee of future results.
| | |
| 6 | | 2 0 2 2 BLACK ROCK ANNUAL REPORT TO SHAREHOLDERS |
| | |
| Fund Summary as of December 31, 2022 (continued) | | BlackRock Credit Strategies Fund |
Overview of the Fund’s Total Investments
PORTFOLIO COMPOSITION
| | | | |
| Asset Type(a) | | 12/31/22 | |
Floating Rate Loan Interests | | | 57.9 | % |
Corporate Bonds | | | 30.0 | |
Asset-Backed Securities | | | 7.0 | |
Preferred Securities | | | 2.8 | |
Common Stocks | | | 1.7 | |
Other* | | | 0.6 | |
CREDIT QUALITY ALLOCATION
| | | | |
| Credit Rating(a)(b) | | 12/31/22 | |
AA/Aa | | | 1.3 | % |
A | | | 4.7 | |
BBB/Baa | | | 7.3 | |
BB/Ba | | | 9.1 | |
B | | | 22.8 | |
CCC/Caa | | | 9.7 | |
C | | | — | (c) |
D | | | — | (c) |
N/R(d) | | | 45.1 | |
| (a) | Excludes short-term securities. |
| (b) | For financial reporting purposes, credit quality ratings shown above reflect the highest rating assigned by either S&P Global Ratings or Moody’s Investors Service, Inc. if ratings differ. These rating agencies are independent, nationally recognized statistical rating organizations and are widely used. Investment grade ratings are credit ratings of BBB/Baa or higher. Below investment grade ratings are credit ratings of BB/Ba or lower. Investments designated N/R are not rated by either rating agency. Unrated investments do not necessarily indicate low credit quality. Credit quality ratings are subject to change. |
| (c) | Rounds to less than 0.1%. |
| (d) | The investment adviser evaluates the credit quality of unrated investments based upon certain factors including, but not limited to, credit ratings for similar investments and financial analysis of sectors and individual investments. Using this approach, the investment adviser has deemed certain of these unrated securities as investment grade quality. As of December 31, 2022, the market value of unrated securities deemed by the investment adviser to be investment grade represents less than 1.0% of the Fund’s total investments. |
| * | Includes one or more investment categories that individually represents less than 1.0% of the Fund’s total investments. Please refer to the Consolidated Schedule of Investments for details. |
Institutional Shares are not subject to any sales charge. These shares bear no ongoing distribution or service fees but are only available through the Fund’s distributor or an asset-based fee program sponsored by a registered broker-dealer or registered investment adviser (also known as a “wrap fee” program) that has an agreement with the Fund’s distributor.
Class A Shares are subject to a maximum initial sales charge (front-end load) of 2.50% and servicing and distribution fee of 0.75% per year. A contingent deferred sales charge of 1.50% is assessed on Fund repurchases of Class A Shares made within 18 months after purchase where no initial sales load was paid at the time of purchase as part of an investment of $250,000 or more. Class A Shares performance shown prior to the Class A Shares inception date of April 1, 2020 is that of Institutional Shares (which have no distribution or service fees) and was restated to reflect Class A Shares fees.
Class U Shares are not subject to any sales charge. These shares are subject to a servicing and distribution fee of 0.75% per year. These shares are available only to clients of financial intermediaries with which the Fund has a selling agreement to distribute such shares. Class U Shares performance shown prior to the Class U Shares inception date of July 12, 2021 is that of Institutional Shares (which have no distribution or service fees) and was restated to reflect Class U Shares fees.
Class W Shares are subject to a maximum initial sales charge (front-end load) of 3.50% and servicing and distribution fee of 0.75% per year. These shares are available only through brokerage, transactional-based accounts. Class W Shares performance shown prior to the Class W Shares inception date of July 12, 2021 is that of Institutional Shares (which have no distribution or service fees) and was restated to reflect Class W Shares fees.
Past performance is not an indication of future results. Financial markets have experienced extreme volatility and trading in many instruments has been disrupted. These circumstances may continue for an extended period of time and may continue to affect adversely the value and liquidity of the Fund’s investments. As a result, current performance may be lower or higher than the performance data quoted. Refer to blackrock.com to obtain performance data current to the most recent month-end. Performance results do not reflect the deduction of taxes that a shareholder would pay on Fund distributions or the redemption of Fund shares. Figures shown in the performance table(s) assume reinvestment of all distributions, if any, at net asset value (“NAV”) on the ex-dividend date or payable date, as applicable. Investment return and principal value of shares will fluctuate so that shares, when redeemed, may be worth more or less than their original cost. Distributions paid to each class of shares will vary because of the different levels of service, distribution and transfer agency fees applicable to each class, which are deducted from the income available to be paid to shareholders.
BlackRock Advisors, LLC (the “Manager”), the Fund’s investment adviser, has contractually and/or voluntarily agreed to waive and/or reimburse a portion of the Fund’s expenses. Without such waiver(s) and/or reimbursement(s), the Fund’s performance would have been lower. With respect to the Fund’s voluntary waiver(s), if any, the Manager is under no obligation to waive and/or reimburse or to continue waiving and/or reimbursing its fees and such voluntary waiver(s) may be reduced or discontinued at any time. With respect to the Fund’s contractual waiver(s), if any, the Manager is under no obligation to continue waiving and/or reimbursing its fees after the applicable termination date of such agreement. See the Notes to Consolidated Financial Statements for additional information on waivers and/or reimbursements.
The standardized 30-day yield includes the effects of any waivers and/or reimbursements. The unsubsidized 30-day yield excludes the effects of any waivers and/or reimbursements.
Disclosure of Expenses for Continuously Offered Closed-End Funds
Shareholders of the Fund may incur the following charges: (a) transactional expenses, including sales charges and early withdrawal fees; and (b) operating expenses, including investment advisory fees, and other fund expenses. The example below (which is based on a hypothetical investment of $1,000 invested at the beginning of the period and held through the end of the period) is intended to assist shareholders both in calculating expenses based on an investment in the Fund and in comparing these expenses with similar costs of investing in other funds.
The expense example provides information about actual account values and actual expenses. Annualized expense ratios reflect contractual and voluntary fee waivers, if any. In order to estimate the expenses a shareholder paid during the period covered by this report, shareholders can divide their account value by $1,000 and then multiply the result by the number corresponding to their Fund and share class under the heading entitled “Expenses Paid During the Period.”
The expense example also provides information about hypothetical account values and hypothetical expenses based on the Fund’s actual expense ratio and an assumed rate of return of 5% per year before expenses. In order to assist shareholders in comparing the ongoing expenses of investing in the Fund and other funds, compare the 5% hypothetical example with the 5% hypothetical examples that appear in shareholder reports of other funds.
The expenses shown in the expense example are intended to highlight shareholders’ ongoing costs only and do not reflect transactional expenses, such as sales charges and early withdrawal fees, if any. Therefore, the hypothetical example is useful in comparing ongoing expenses only and will not help shareholders determine the relative total expenses of owning different funds. If these transactional expenses were included, shareholder expenses would have been higher.
| | |
| 8 | | 2 0 2 2 BLACK ROCK ANNUAL REPORT TO SHAREHOLDERS |
|
| Disclosure of Expenses for Continuously Offered Closed-End Funds (continued) |
Expense Example for Continuously Offered Closed-End Funds
| | | | | | | | | | | | | | | | | | | | | | | | | | | | | | | | | | | | | | | | | | | | | | | | |
| | | | | Actual | | | Hypothetical 5% Return | | | | | | |
| | | | | | | | | |
| | | | | | | | | | | Expenses Paid During the
Period | | | | | | Including Interest
Expense
and Fees | | | Excluding Interest
Expense
and Fees | | | Annualized Expense Ratio | | | |
| | | | | | | | | | | | | |
| | | | | Beginning
Account
Value
(07/01/22) | | | Ending
Account
Value
(12/31/22) | | | Including
Interest
Expense
and Fees(a) | | | Excluding
Interest
Expense
and Fees(a) | | | Beginning
Account
Value
(07/01/22) | | | Ending
Account
Value
(12/31/22) | | | Expenses
Paid
During
the
Period(a) | | | Ending
Account
Value
(12/31/22) | | | Expenses
Paid
During
the
Period(a) | | | Including
Interest
Expense
and Fees | | | Excluding
Interest
Expense
and Fees | | | |
| | Institutional | | | $ 1,000.00 | | | | $ 1,028.10 | | | | $ 11.30 | | | | $ 7.57 | | | | $ 1,000.00 | | | | $ 1,014.06 | | | | $ 11.22 | | | | $ 1,017.74 | | | | $ 7.51 | | | | 2.21 | % | | | 1.48 | % | | |
| | Class A | | | 1,000.00 | | | | 1,024.50 | | | | 14.65 | | | | 10.92 | | | | 1,000.00 | | | | 1,010.74 | | | | 14.55 | | | | 1,014.42 | | | | 10.85 | | | | 2.87 | | | | 2.14 | | | |
| | Class U | | | 1,000.00 | | | | 1,024.50 | | | | 14.75 | | | | 11.02 | | | | 1,000.00 | | | | 1,010.64 | | | | 14.65 | | | | 1,014.32 | | | | 10.95 | | | | 2.89 | | | | 2.16 | | | |
| | Class W | | | 1,000.00 | | | | 1,024.50 | | | | 14.70 | | | | 10.97 | | | | 1,000.00 | | | | 1,010.69 | | | | 14.60 | | | | 1,014.37 | | | | 10.90 | | | | 2.88 | | | | 2.15 | | | |
| (a) | For each class of the Fund, expenses are equal to the annualized expense ratio for the class, multiplied by the average account value over the period, multiplied by 184/365 (to reflect the one-half year period shown). |
| | |
D ISCLOSURE OF EXPENSES FOR CONTINUOUSLY OFFERED CLOSED - END FUNDS | | 9 |
| | |
Consolidated Schedule of Investments December 31, 2022 | | BlackRock Credit Strategies Fund (Percentages shown are based on Net Assets) |
| | | | | | | | | | | | |
| Security | | | | | Par
(000) | | | Value | |
| | | |
Asset-Backed Securities | | | | | | | | | | | | |
AGL CLO 12 Ltd., Series 2021-12A, Class B, (3 mo. LIBOR US + 1.60%), 5.84%, 07/20/34(a)(b) | | | USD | | | | 1,000 | | | $ | 956,943 | |
AIG CLO LLC, Series 2020-1A, Class CR, (3 mo. LIBOR US + 2.00%), 6.08%, 04/15/34(a)(b) | | | | | | | 2,000 | | | | 1,863,145 | |
Anchorage Capital CLO 11 Ltd., Series 2019-11A, Class A, (3 mo. LIBOR US + 2.30%), 6.62%, 07/22/32(a)(b) | | | | | | | 1,000 | | | | 942,672 | |
Ares LIII CLO Ltd., Series 2019-53A, Class D, (3 mo. LIBOR US + 3.75%), 8.07%, 04/24/31(a)(b) | | | | | | | 500 | | | | 465,465 | |
Bain Capital Credit CLO Ltd.(a)(b) | | | | | | | | | | | | |
Series 2019-2A, Class CR, (3 mo. LIBOR US + 2.10%), 6.18%, 10/17/32 | | | | | | | 1,000 | | | | 943,003 | |
Series 2021-4A, Class B, (3 mo. LIBOR US + 1.65%), 5.89%, 10/20/34 | | | | | | | 1,000 | | | | 952,292 | |
Series 2021-6A, Class B, (3 mo. LIBOR US + 1.65%), 5.93%, 10/21/34 | | | | | | | 1,500 | | | | 1,427,581 | |
Battalion CLO X Ltd., Series 2016-10A, Class BR2, (3 mo. LIBOR US + 2.05%), 6.37%, 01/25/35(a)(b) | | | | | | | 1,000 | | | | 907,737 | |
CarVal CLO II Ltd., Series 2019-1A, Class DR, (3 mo. LIBOR US + 3.20%), 7.44%, 04/20/32(a)(b) | | | | | | | 1,000 | | | | 940,064 | |
CarVal CLO IV Ltd., Series 2021-1A, Class D, (3 mo. LIBOR US + 3.25%), 7.49%, 07/20/34(a)(b) | | | | | | | 1,000 | | | | 923,071 | |
CIFC Funding I Ltd., Series 2015-1A, Class CRR, (3 mo. LIBOR US + 1.90%), 6.22%, 01/22/31(a)(b) | | | | | | | 1,000 | | | | 948,690 | |
CIFC Funding Ltd., Series 2019-1A, Class CR, (3 mo. LIBOR US + 2.05%), 6.29%, 04/20/32(a)(b) | | | | | | | 1,000 | | | | 945,499 | |
CIFC Funding V Ltd., Series 2019-5A, Class A2RS, (3 mo. LIBOR US + 1.75%), 5.83%, 01/15/35(a)(b) | | | | | | | 800 | | | | 767,903 | |
Cook Park CLO Ltd., Series 2018-1A, Class C, (3 mo. LIBOR US + 1.75%), 5.83%, 04/17/30(a)(b) | | | | | | | 250 | | | | 233,133 | |
Elmwood CLO I Ltd., Series 2019-1A, Class DR, (3 mo. LIBOR US + 4.40%), 8.64%, 10/20/33(a)(b) | | | | | | | 1,000 | | | | 989,351 | |
Flatiron CLO 21 Ltd., Series 2021-1A, Class D, (3 mo. LIBOR US + 2.90%), 7.13%, 07/19/34(a)(b) | | | | | | | 1,000 | | | | 944,668 | |
Golub Capital Partners 48 LP, Series 2020-48A, Class C, (3 mo. LIBOR US + 2.80%), 6.88%, 04/17/33(a)(b) | | | | | | | 900 | | | | 862,422 | |
Greywolf CLO V Ltd., Series 2015-1A, Class CR, (3 mo. LIBOR US + 3.00%), 7.36%, 01/27/31(a)(b) | | | | | | | 500 | | | | 438,365 | |
HalseyPoint CLO 4 Ltd., Series 2021-4A, Class C, (3 mo. LIBOR US + 2.15%), 6.39%, 04/20/34(a)(b) | | | | | | | 750 | | | | 696,653 | |
KKR CLO 41 Ltd., Series 2022-41A, Class D, (3 mo. SOFR + 3.25%), 7.11%, 04/15/35(a)(b) | | | | | | | 1,000 | | | | 891,672 | |
NYACK Park CLO Ltd., Series 2021-1A, Class C, (3 mo. LIBOR US + 1.95%), 6.19%, 10/20/34(a)(b) | | | | | | | 1,250 | | | | 1,155,765 | |
OHA Credit Funding 2 Ltd., Series 2019-2A, Class DR, (3 mo. LIBOR US + 3.30%), 7.58%, 04/21/34(a)(b) | | | | | | | 1,000 | | | | 927,248 | |
OHA Loan Funding Ltd.(a)(b) | | | | | | | | | | | | |
Series 2013-1A, Class DR2, (3 mo. LIBOR US + 3.05%), 7.37%, 07/23/31 | | | | | | | 750 | | | | 698,651 | |
Series 2015-1A, Class DR3, (3 mo. LIBOR US + 3.20%), 7.43%, 01/19/37 | | | | | | | 1,000 | | | | 912,297 | |
Palmer Square CLO Ltd.(a)(b) | | | | | | | | | | | | |
Series 2022-1A, Class D, (3 mo. SOFR + 3.05%), 7.01%, 04/20/35 | | | | | | | 1,000 | | | | 940,491 | |
| | | | | | | | | | | | |
| Security | | | | | Par
(000) | | | Value | |
|
Asset-Backed Securities (continued) | |
Palmer Square CLO Ltd.(a)(b) (continued) | | | | | | | | | | | | |
Series 2022-4A, Class C, (3 mo. LIBOR US + 1.95%), 6.03%, 10/15/34 | | | USD | | | | 1,000 | | | $ | 932,267 | |
Post CLO Ltd., Series 2022-1A, Class D, (3 mo. SOFR + 3.20%), 7.16%,
04/20/35(a)(b) | | | | | | | 1,000 | | | | 920,831 | |
Rad CLO 15 Ltd., Series 2021-15A, Class D, (3 mo. LIBOR US + 3.05%), 7.29%, 01/20/34(a)(b) | | | | | | | 1,000 | | | | 924,263 | |
Regatta X Funding Ltd., Series 2017-3A, Class D, (3 mo. LIBOR US + 2.75%), 6.83%, 01/17/31(a)(b) | | | | | | | 250 | | | | 232,843 | |
Signal Peak CLO 5 Ltd., Series 2018-5A, Class D, (3 mo. LIBOR US + 2.65%), 7.01%, 04/25/31(a)(b) | | | | | | | 700 | | | | 629,777 | |
Signal Peak CLO 8 Ltd., Series 2018-8A, Class C, (3 mo. LIBOR US + 2.00%), 6.24%, 04/20/33(a)(b) | | | | | | | 1,000 | | | | 941,182 | |
Sixth Street CLO XIX Ltd., Series 2021-19A, Class D, (3 mo. LIBOR US + 3.00%), 7.24%, 07/20/34(a)(b) | | | | | | | 1,000 | | | | 915,373 | |
TCW CLO Ltd., Series 2021-1A, Class D2, (3 mo. LIBOR US + 3.88%), 8.12%, 03/18/34(a)(b) | | | | | | | 1,000 | | | | 903,936 | |
TICP CLO V Ltd., Series 2016-5A, Class DR, (3 mo. LIBOR US + 3.15%), 7.23%, 07/17/31(a)(b) | | | | | | | 500 | | | | 465,014 | |
TICP CLO XIII Ltd., Series 2019-13A, Class DR, (3 mo. LIBOR US + 3.15%), 7.23%, 04/15/34(a)(b) | | | | | | | 1,000 | | | | 932,359 | |
Webster Park CLO Ltd., Series 2015-1A, Class CR, (3 mo. LIBOR US + 2.90%), 7.14%, 07/20/30(a)(b) | | | | | | | 690 | | | | 607,756 | |
Whitebox CLO I Ltd., Series 2019-1A, Class ANBR, (3 mo. LIBOR US + 1.70%), 6.02%, 07/24/32(a)(b) | | | | | | | 2,000 | | | | 1,931,405 | |
Whitebox CLO II Ltd., Series 2020-2A, Class CR, (3 mo. LIBOR US + 2.20%), 6.52%, 10/24/34(a)(b) | | | | | | | 640 | | | | 601,071 | |
| | | | | | | | | | | | |
| | | |
Total Asset-Backed Securities — 7.8%
(Cost: $35,297,765) | | | | | | | | | | | 33,612,858 | |
| | | | | | | | | | | | |
| | | |
| | | | | | Shares | | | | |
| | | |
Common Stocks | | | | | | | | | | | | |
| | | |
| Construction & Engineering — 0.0% | | | | | | | | | |
McDermott International Ltd.(c) | | | | | | | 2,158 | | | | 691 | |
| | | | | | | | | | | | |
|
| Equity Real Estate Investment Trusts (REITs) — 0.8% | |
Ashford Hospitality Trust, Inc., Series D(c)(d) | | | | | | | 2,989 | | | | 61,005 | |
Ashford Hospitality Trust, Inc., Series F(c)(d) | | | | | | | 3,040 | | | | 51,346 | |
Ashford Hospitality Trust, Inc., Series G(c)(d) | | | | | | | 1,207 | | | | 24,297 | |
Ashford Hospitality Trust, Inc., Series H(c)(d) | | | | | | | 4,000 | | | | 68,240 | |
iStar, Inc. | | | | | | | 150,000 | | | | 1,144,500 | |
Park Hotels & Resorts, Inc. | | | | | | | 157,000 | | | | 1,851,030 | |
Safehold, Inc. | | | | | | | 11,482 | | | | 328,615 | |
| | | | | | | | | | | | |
| | | |
| | | | | | | | | | | 3,529,033 | |
| | | |
| Household Durables — 1.0% | | | | | | | | | |
Lennar Corp., Class A | | | | | | | 24,000 | | | | 2,172,000 | |
Taylor Morrison Home Corp.(c) | | | | | | | 66,000 | | | | 2,003,100 | |
| | | | | | | | | | | | |
| | | |
| | | | | | | | | | | 4,175,100 | |
| | | |
| Pharmaceuticals — 0.1% | | | | | | | | | |
Milestone Pharmaceuticals, Inc.(c) | | | | | | | 141,000 | | | | 558,360 | |
| | | | | | | | | | | | |
| | |
| 10 | | 2 0 2 2 BLACK ROCK ANNUAL REPORT TO SHAREHOLDERS |
| | |
Consolidated Schedule of Investments (continued) December 31, 2022 | | BlackRock Credit Strategies Fund (Percentages shown are based on Net Assets) |
| | | | | | | | | | | | |
| Security | | | | | Shares | | | Value | |
| | | |
Specialty Retail — 0.0% | | | | | | | | | | | | |
NMG Parent LLC | | | | | | | 78 | | | $ | 11,797 | |
| | | | | | | | | | | | |
| | | |
Total Common Stocks — 1.9%
(Cost: $9,219,241) | | | | | | | | | | | 8,274,981 | |
| | | | | | | | | | | | |
| | | |
| | | | | | Par
(000) | | | | |
| | | |
Corporate Bonds | | | | | | | | | | | | |
| | | |
| Aerospace & Defense — 0.7% | | | | | | | | | |
Bombardier, Inc.(b) | | | | | | | | | | | | |
7.50%, 03/15/25 | | | USD | | | | 3 | | | | 2,971 | |
7.13%, 06/15/26 | | | | | | | 457 | | | | 443,388 | |
7.88%, 04/15/27 | | | | | | | 287 | | | | 278,383 | |
6.00%, 02/15/28 | | | | | | | 182 | | | | 168,299 | |
Rolls-Royce PLC, 5.75%, 10/15/27(b) | | | | | | | 384 | | | | 365,760 | |
Spirit AeroSystems, Inc. | | | | | | | | | | | | |
7.50%, 04/15/25(b) | | | | | | | 4 | | | | 3,953 | |
9.38%, 11/30/29 | | | | | | | 118 | | | | 124,219 | |
TransDigm, Inc. | | | | | | | | | | | | |
8.00%, 12/15/25(b) | | | | | | | 203 | | | | 206,002 | |
6.25%, 03/15/26(b) | | | | | | | 1,092 | | | | 1,076,919 | |
6.38%, 06/15/26 | | | | | | | 13 | | | | 12,648 | |
7.50%, 03/15/27 | | | | | | | 16 | | | | 15,831 | |
4.63%, 01/15/29 | | | | | | | 123 | | | | 108,150 | |
4.88%, 05/01/29 | | | | | | | 53 | | | | 46,229 | |
Triumph Group, Inc., 8.88%, 06/01/24(b) | | | | | | | 98 | | | | 99,715 | |
| | | | | | | | | | | | |
| | | |
| | | | | | | | | | | 2,952,467 | |
| | | |
| Airlines — 0.4% | | | | | | | | | |
Air Canada, 3.88%, 08/15/26(b) | | | | | | | 94 | | | | 83,259 | |
Allegiant Travel Co., 7.25%, 08/15/27(b) | | | | | | | 29 | | | | 27,584 | |
American Airlines, Inc., 11.75%, 07/15/25(b) | | | | | | | 450 | | | | 482,670 | |
American Airlines, Inc./AAdvantage Loyalty IP Ltd.(b) | | | | | | | | | | | | |
5.50%, 04/20/26 | | | | | | | 44 | | | | 42,143 | |
5.75%, 04/20/29 | | | | | | | 314 | | | | 286,986 | |
Avianca Midco 2 PLC, 9.00%, 12/01/28(b) | | | | | | | 222 | | | | 162,140 | |
Delta Air Lines, Inc., 7.00%, 05/01/25(b) | | | | | | | 20 | | | | 20,439 | |
Hawaiian Brand Intellectual Property Ltd./HawaiianMiles Loyalty Ltd., 5.75%, 01/20/26(b) | | | | | | | 89 | | | | 80,545 | |
Mileage Plus Holdings LLC/Mileage Plus Intellectual Property Assets Ltd., 6.50%, 06/20/27(b) | | | | | | | 105 | | | | 104,689 | |
Spirit Loyalty Cayman Ltd./Spirit IP Cayman Ltd., 8.00%, 09/20/25(b) | | | | | | | 42 | | | | 42,628 | |
United Airlines Pass-Through Trust | | | | | | | | | | | | |
Series 2020-1, Class A, 5.88%, 10/15/27 | | | | | | | 93 | | | | 91,175 | |
Series 2020-1, Class B, 4.88%, 01/15/26 | | | | | | | 12 | | | | 10,874 | |
United Airlines, Inc.(b) | | | | | | | | | | | | |
4.38%, 04/15/26 | | | | | | | 80 | | | | 74,154 | |
4.63%, 04/15/29 | | | | | | | 388 | | | | 337,830 | |
| | | | | | | | | | | | |
| | | |
| | | | | | | | | | | 1,847,116 | |
| | | |
| Auto Components — 0.5% | | | | | | | | | |
Aptiv PLC/Aptiv Corp., 4.15%, 05/01/52 | | | | | | | 1,160 | | | | 834,640 | |
Clarios Global LP, 6.75%, 05/15/25(b) | | | | | | | 45 | | | | 45,104 | |
Clarios Global LP/Clarios U.S. Finance
Co.(b) | | | | | | | | | | | | |
6.25%, 05/15/26 | | | | | | | 185 | | | | 180,838 | |
8.50%, 05/15/27 | | | | | | | 962 | | | | 939,390 | |
Dealer Tire LLC/DT Issuer LLC, 8.00%, 02/01/28(b) | | | | | | | 33 | | | | 29,036 | |
| | | | | | | | | | | | |
Security | | | | | Par (000) | | | Value | |
| | | |
| Auto Components (continued) | | | | | | | | | |
Goodyear Tire & Rubber Co. | | | | | | | | | | | | |
5.00%, 07/15/29 | | | USD | | | | 12 | | | $ | 10,010 | |
5.63%, 04/30/33 | | | | | | | 12 | | | | 9,795 | |
Titan International, Inc., 7.00%, 04/30/28 | | | | | | | 11 | | | | 10,385 | |
| | | | | | | | | | | | |
| | | |
| | | | | | | | | | | 2,059,198 | |
| | | |
| Automobiles — 0.1% | | | | | | | | | |
Asbury Automotive Group, Inc. | | | | | | | | | | | | |
4.50%, 03/01/28 | | | | | | | 12 | | | | 10,565 | |
4.75%, 03/01/30 | | | | | | | 15 | | | | 12,545 | |
5.00%, 02/15/32(b) | | | | | | | 66 | | | | 54,298 | |
Ken Garff Automotive LLC, 4.88%, 09/15/28(b) | | | | | | | 24 | | | | 20,077 | |
LCM Investments Holdings II LLC, 4.88%, 05/01/29(b) | | | | | | | 91 | | | | 72,872 | |
Lithia Motors, Inc., 3.88%, 06/01/29(b) | | | | | | | 23 | | | | 18,908 | |
MajorDrive Holdings IV LLC, 6.38%, 06/01/29(b) | | | | | | | 44 | | | | 32,832 | |
Nissan Motor Co. Ltd., 4.81%, 09/17/30(b) | | | | | | | 350 | | | | 297,035 | |
Wabash National Corp., 4.50%, 10/15/28(b) | | | | | | | 90 | | | | 76,643 | |
| | | | | | | | | | | | |
| | | |
| | | | | | | | | | | 595,775 | |
| | | |
| Banks(e) — 0.4% | | | | | | | | | |
Axis Bank Ltd./Gift City, (5 year CMT + 3.32%), 4.10%(a)(d) | | | | | | | 200 | | | | 172,000 | |
Bangkok Bank PCL, (5 year CMT + 1.90%), 3.73%, 09/25/34(a) | | | | | | | 200 | | | | 166,725 | |
Bank Negara Indonesia Persero Tbk PT, 3.75%, 03/30/26 | | | | | | | 200 | | | | 182,022 | |
Bank of Communications Co. Ltd., (5 year CMT + 3.35%), 3.80%(a)(d) | | | | | | | 400 | | | | 382,000 | |
Chong Hing Bank Ltd., (5 year CMT + 3.86%), 5.70%(a)(d) | | | | | | | 250 | | | | 235,906 | |
HDFC Bank Ltd., (5 year CMT + 2.93%),
3.70%(a)(d) | | | | | | | 200 | | | | 170,500 | |
Kasikornbank PCL, (5 year CMT + 1.70%), 3.34%, 10/02/31(a) | | | | | | | 200 | | | | 174,750 | |
Krung Thai Bank PCL, (5 year CMT + 3.53%), 4.40%(a)(d) | | | | | | | 200 | | | | 178,225 | |
Nanyang Commercial Bank Ltd., (5 year CMT + 3.51%), 6.50%, 12/31/99(a)(d) | | | | | | | 250 | | | | 233,485 | |
| | | | | | | | | | | | |
| | | |
| | | | | | | | | | | 1,895,613 | |
| | | |
| Beverages(b) — 0.3% | | | | | | | | | |
ARD Finance SA, (6.50% Cash or 7.25% PIK), 6.50%, 06/30/27(f) | | | | | | | 200 | | | | 139,107 | |
Ardagh Metal Packaging Finance USA LLC/Ardagh Metal Packaging Finance PLC, 4.00%, 09/01/29 | | | | | | | 600 | | | | 475,516 | |
Mauser Packaging Solutions Holding Co., 5.50%, 04/15/24 | | | | | | | 105 | | | | 102,096 | |
Trivium Packaging Finance BV | | | | | | | | | | | | |
5.50%, 08/15/26 | | | | | | | 200 | | | | 183,387 | |
8.50%, 08/15/27 | | | | | | | 617 | | | | 566,113 | |
| | | | | | | | | | | | |
| | | |
| | | | | | | | | | | 1,466,219 | |
| | | |
| Building Materials(b) — 0.1% | | | | | | | | | |
Camelot Return Merger Sub, Inc., 8.75%, 08/01/28 | | | | | | | 30 | | | | 27,529 | |
New Enterprise Stone & Lime Co., Inc. | | | | | | | | | | | | |
5.25%, 07/15/28 | | | | | | | 120 | | | | 106,557 | |
9.75%, 07/15/28 | | | | | | | 19 | | | | 17,555 | |
Smyrna Ready Mix Concrete LLC, 6.00%, 11/01/28 | | | | | | | 292 | | | | 261,252 | |
Standard Industries, Inc. | | | | | | | | | | | | |
4.75%, 01/15/28 | | | | | | | 143 | | | | 128,684 | |
4.38%, 07/15/30 | | | | | | | 34 | | | | 27,707 | |
| | |
CONSOLIDATED SCHEDULE OF INVESTMENTS | | 11 |
| | |
Consolidated Schedule of Investments (continued) December 31, 2022 | | BlackRock Credit Strategies Fund (Percentages shown are based on Net Assets) |
| | | | | | | | | | | | |
Security | | | | | Par (000) | | | Value | |
|
Building Materials (continued) | |
Standard Industries, Inc. (continued) 3.38%, 01/15/31 | | | USD | | | | 3 | | | $ | 2,258 | |
Summit Materials LLC/Summit Materials Finance Corp., 5.25%, 01/15/29 | | | | | | | 34 | | | | 31,655 | |
| | | | | | | | | | | | |
| | | |
| | | | | | | | | | | 603,197 | |
|
| Building Products — 0.8% | |
Advanced Drainage Systems, Inc., 5.00%, 09/30/27(b) | | | | | | | 28 | | | | 26,110 | |
Foundation Building Materials, Inc., 6.00%, 03/01/29(b) | | | | | | | 24 | | | | 17,969 | |
GYP Holdings III Corp., 4.63%, 05/01/29(b) | | | | | | | 40 | | | | 32,659 | |
LBM Acquisition LLC, 6.25%, 01/15/29(b) | | | | | | | 8 | | | | 5,091 | |
Lowe’s Cos., Inc., 5.63%, 04/15/53 | | | | | | | 1,200 | | | | 1,148,754 | |
Specialty Building Products Holdings LLC/SBP Finance Corp., 6.38%, 09/30/26(b) | | | | | | | 26 | | | | 20,934 | |
SRS Distribution, Inc.(b) | | | | | | | | | | | | |
4.63%, 07/01/28 | | | | | | | 337 | | | | 298,740 | |
6.13%, 07/01/29 | | | | | | | 1,405 | | | | 1,135,971 | |
6.00%, 12/01/29 | | | | | | | 135 | | | | 107,440 | |
White Cap Buyer LLC, 6.88%, 10/15/28(b) | | | | | | | 455 | | | | 393,579 | |
White Cap Parent LLC, (8.25% PIK), 8.25%, 03/15/26(b)(f) | | | | | | | 64 | | | | 55,327 | |
| | | | | | | | | | | | |
| | | |
| | | | | | | | | | | 3,242,574 | |
|
| Capital Markets — 0.4% | |
AG TTMT Escrow Issuer LLC, 8.63%, 09/30/27(b) | | | | | | | 30 | | | | 30,150 | |
Aretec Escrow Issuer, Inc., 7.50%, 04/01/29(b) | | | | | | | 16 | | | | 13,204 | |
Blackstone Private Credit Fund, 3.25%, 03/15/27 | | | | | | | 15 | | | | 12,629 | |
Compass Group Diversified Holdings LLC, 5.25%, 04/15/29(b) | | | | | | | 47 | | | | 40,222 | |
GLP Capital LP/GLP Financing II, Inc., 3.25%, 01/15/32 | | | | | | | 120 | | | | 95,926 | |
Icahn Enterprises LP/Icahn Enterprises Finance Corp. | | | | | | | | | | | | |
6.25%, 05/15/26 | | | | | | | 67 | | | | 64,380 | |
5.25%, 05/15/27 | | | | | | | 353 | | | | 323,207 | |
4.38%, 02/01/29 | | | | | | | 7 | | | | 5,920 | |
NFP Corp.(b) | | | | | | | | | | | | |
4.88%, 08/15/28 | | | | | | | 381 | | | | 324,344 | |
6.88%, 08/15/28 | | | | | | | 544 | | | | 448,408 | |
7.50%, 10/01/30 | | | | | | | 27 | | | | 25,390 | |
Owl Rock Core Income Corp. | | | | | | | | | | | | |
5.50%, 03/21/25 | | | | | | | 30 | | | | 29,082 | |
3.13%, 09/23/26 | | | | | | | 7 | | | | 5,957 | |
7.75%, 09/16/27(b) | | | | | | | 76 | | | | 75,754 | |
| | | | | | | | | | | | |
| | | |
| | | | | | | | | | | 1,494,573 | |
|
| Chemicals — 0.4% | |
Avient Corp., 7.13%, 08/01/30(b) | | | | | | | 143 | | | | 139,787 | |
Chemours Co., 5.75%, 11/15/28(b) | | | | | | | 20 | | | | 17,965 | |
Diamond BC BV, 4.63%, 10/01/29(b) | | | | | | | 214 | | | | 171,735 | |
Element Solutions, Inc., 3.88%, 09/01/28(b) | | | | | | | 140 | | | | 119,000 | |
HB Fuller Co., 4.25%, 10/15/28 | | | | | | | 129 | | | | 114,165 | |
Herens Holdco SARL, 4.75%, 05/15/28(b) | | | | | | | 400 | | | | 298,964 | |
Illuminate Buyer LLC/Illuminate Holdings IV, Inc., 9.00%, 07/01/28(b) | | | | | | | 89 | | | | 74,513 | |
Kobe U.S. Midco 2, Inc., (9.25% Cash or 10.00% PIK), 9.25%, 11/01/26(b)(f) | | | | | | | 82 | | | | 57,400 | |
LSF11 A5 HoldCo LLC, 6.63%, 10/15/29(b) | | | | | | | 20 | | | | 16,522 | |
Minerals Technologies, Inc., 5.00%, 07/01/28(b) | | | | | | | 69 | | | | 61,451 | |
SK Invictus Intermediate II Sarl, 5.00%, 10/30/29(b) | | | | | | | 96 | | | | 78,720 | |
| | | | | | | | | | | | |
| Security | | | | | Par (000) | | | Value | |
|
Chemicals (continued) | |
WR Grace Holdings LLC(b) | | | | | | | | | | | | |
4.88%, 06/15/27 | | | USD | | | | 145 | | | $ | 128,489 | |
5.63%, 08/15/29 | | | | | | | 685 | | | | 552,980 | |
| | | | | | | | | | | | |
| | | |
| | | | | | | | | | | 1,831,691 | |
|
| Commercial Services & Supplies — 0.6% | |
ADT Security Corp., 4.88%, 07/15/32(b) | | | | | | | 149 | | | | 126,624 | |
AMN Healthcare, Inc., 4.00%, 04/15/29(b) | | | | | | | 16 | | | | 13,692 | |
APX Group, Inc.(b) | | | | | | | | | | | | |
6.75%, 02/15/27 | | | | | | | 220 | | | | 211,761 | |
5.75%, 07/15/29 | | | | | | | 71 | | | | 58,801 | |
Avis Budget Car Rental LLC/Avis Budget Finance, Inc., 5.38%, 03/01/29(b) | | | | | | | 8 | | | | 6,844 | |
Bank of New York Mellon Corp., (1 day SOFR + 2.07%), 5.83%, 10/25/33(a) | | | | | | | 1,420 | | | | 1,471,963 | |
Fortress Transportation & Infrastructure Investors LLC(b) | | | | | | | | | | | | |
6.50%, 10/01/25 | | | | | | | 12 | | | | 11,282 | |
9.75%, 08/01/27 | | | | | | | 8 | | | | 8,020 | |
5.50%, 05/01/28 | | | | | | | 236 | | | | 201,334 | |
Herc Holdings, Inc., 5.50%, 07/15/27(b) | | | | | | | 4 | | | | 3,731 | |
Hertz Corp.(b) | | | | | | | | | | | | |
4.63%, 12/01/26 | | | | | | | 22 | | | | 18,425 | |
5.00%, 12/01/29 | | | | | | | 24 | | | | 18,206 | |
Metis Merger Sub LLC, 6.50%, 05/15/29(b) | | | | | | | 20 | | | | 16,790 | |
NESCO Holdings II, Inc., 5.50%, 04/15/29(b) | | | | | | | 57 | | | | 49,875 | |
Prime Security Services Borrower LLC/Prime Finance, Inc.(b) | | | | | | | | | | | | |
5.75%, 04/15/26 | | | | | | | 15 | | | | 14,438 | |
6.25%, 01/15/28 | | | | | | | 289 | | | | 263,036 | |
Sotheby’s/Bidfair Holdings, Inc., 5.88%, 06/01/29(b) | | | | | | | 200 | | | | 167,940 | |
Williams Scotsman International, Inc., 4.63%, 08/15/28(b) | | | | | | | 46 | | | | 41,515 | |
| | | | | | | | | | | | |
| | | |
| | | | | | | | | | | 2,704,277 | |
|
| Communications Equipment(b) — 0.1% | |
Ciena Corp., 4.00%, 01/31/30 | | | | | | | 19 | | | | 16,722 | |
CommScope Technologies LLC, 6.00%, 06/15/25 | | | | | | | 259 | | | | 235,690 | |
CommScope, Inc. | | | | | | | | | | | | |
6.00%, 03/01/26 | | | | | | | 91 | | | | 83,983 | |
8.25%, 03/01/27 | | | | | | | 43 | | | | 33,325 | |
7.13%, 07/01/28 | | | | | | | 77 | | | | 55,045 | |
4.75%, 09/01/29 | | | | | | | 124 | | | | 99,969 | |
Viasat, Inc. | | | | | | | | | | | | |
5.63%, 09/15/25 | | | | | | | 42 | | | | 38,967 | |
6.50%, 07/15/28 | | | | | | | 41 | | | | 30,759 | |
| | | | | | | | | | | | |
| | | |
| | | | | | | | | | | 594,460 | |
|
| Construction & Engineering — 0.1% | |
Celestial Miles Ltd., (5 year CMT + 8.21%), 5.75%(a)(d)(e) | | | | | | | 200 | | | | 191,287 | |
| | | | | | | | | | | | |
|
| Construction Materials(b) — 0.0% | |
BCPE Empire Holdings, Inc., 7.63%, 05/01/27 | | | | | | | 28 | | | | 25,110 | |
Resideo Funding, Inc., 4.00%, 09/01/29 | | | | | | | 8 | | | | 6,468 | |
| | | | | | | | | | | | |
| | | |
| | | | | | | | | | | 31,578 | |
|
| Consumer Discretionary(b) — 2.3% | |
APi Group DE, Inc. | | | | | | | | | | | | |
4.13%, 07/15/29 | | | | | | | 24 | | | | 19,892 | |
4.75%, 10/15/29 | | | | | | | 18 | | | | 15,603 | |
Carnival Corp. | | | | | | | | | | | | |
10.50%, 02/01/26 | | | | | | | 152 | | | | 152,724 | |
7.63%, 03/01/26 | | | | | | | 22 | | | | 17,437 | |
| | |
| 12 | | 2 0 2 2 BLACK ROCK ANNUAL REPORT TO SHAREHOLDERS |
| | |
Consolidated Schedule of Investments (continued) December 31, 2022 | | BlackRock Credit Strategies Fund (Percentages shown are based on Net Assets) |
| | | | | | | | | | | | |
Security | | | | | Par (000) | | | Value | |
| | | |
| Consumer Discretionary (continued) | | | | | | | | | |
Carnival Corp. (continued) | | | | | | | | | | | | |
5.75%, 03/01/27 | | | USD | | | | 270 | | | $ | 192,791 | |
9.88%, 08/01/27 | | | | | | | 68 | | | | 64,260 | |
4.00%, 08/01/28 | | | | | | | 67 | | | | 54,632 | |
6.00%, 05/01/29 | | | | | | | 119 | | | | 79,299 | |
Carnival Holdings Bermuda Ltd., 10.38%, 05/01/28 | | | | | | | 5,236 | | | | 5,375,330 | |
CoreLogic, Inc., 4.50%, 05/01/28 | | | | | | | 78 | | | | 59,842 | |
Legends Hospitality Holding Co. LLC/Legends Hospitality Co.-Issuer, Inc., 5.00%, 02/01/26 | | | | | | | 25 | | | | 22,250 | |
Life Time, Inc. | | | | | | | | | | | | |
5.75%, 01/15/26 | | | | | | | 51 | | | | 47,456 | |
8.00%, 04/15/26 | | | | | | | 1,291 | | | | 1,161,900 | |
Lindblad Expeditions LLC, 6.75%, 02/15/27 | | | | | | | 57 | | | | 51,709 | |
NCL Corp. Ltd. | | | | | | | | | | | | |
5.88%, 03/15/26 | | | | | | | 49 | | | | 38,488 | |
7.75%, 02/15/29 | | | | | | | 13 | | | | 9,783 | |
NCL Finance Ltd., 6.13%, 03/15/28 | | | | | | | 29 | | | | 21,408 | |
Neptune Bidco U.S., Inc., 9.29%, 04/15/29 | | | | | | | 44 | | | | 41,470 | |
Royal Caribbean Cruises Ltd. | | | | | | | | | | | | |
11.50%, 06/01/25 | | | | | | | 27 | | | | 28,958 | |
4.25%, 07/01/26 | | | | | | | 10 | | | | 8,083 | |
5.50%, 08/31/26 | | | | | | | 42 | | | | 35,333 | |
5.38%, 07/15/27 | | | | | | | 20 | | | | 16,194 | |
11.63%, 08/15/27 | | | | | | | 45 | | | | 45,190 | |
5.50%, 04/01/28 | | | | | | | 7 | | | | 5,586 | |
8.25%, 01/15/29 | | | | | | | 49 | | | | 49,122 | |
9.25%, 01/15/29 | | | | | | | 2,322 | | | | 2,386,087 | |
Viking Ocean Cruises Ship VII Ltd., 5.63%, 02/15/29 | | | | | | | 13 | | | | 10,465 | |
| | | | | | | | | | | | |
| | | |
| | | | | | | | | | | 10,011,292 | |
| | | |
| Consumer Finance — 0.7% | | | | | | | | | |
American Express Co., (5 year CMT + 2.85%), 3.55%(a)(d) | | | | | | | 440 | | | | 361,460 | |
Global Payments, Inc. | | | | | | | | | | | | |
2.90%, 05/15/30 | | | | | | | 265 | | | | 217,132 | |
5.95%, 08/15/52 | | | | | | | 1,395 | | | | 1,261,305 | |
HealthEquity, Inc., 4.50%, 10/01/29(b) | | | | | | | 161 | | | | 140,698 | |
MPH Acquisition Holdings LLC, 5.50%, 09/01/28(b) | | | | | | | 38 | | | | 29,644 | |
Navient Corp., 5.50%, 03/15/29 | | | | | | | 37 | | | | 30,192 | |
OneMain Finance Corp. | | | | | | | | | | | | |
6.88%, 03/15/25 | | | | | | | 94 | | | | 90,304 | |
6.63%, 01/15/28 | | | | | | | 35 | | | | 32,229 | |
5.38%, 11/15/29 | | | | | | | 16 | | | | 13,086 | |
4.00%, 09/15/30 | | | | | | | 15 | | | | 11,192 | |
Sabre Global, Inc.(b) | | | | | | | | | | | | |
9.25%, 04/15/25 | | | | | | | 56 | | | | 55,783 | |
7.38%, 09/01/25 | | | | | | | 61 | | | | 58,623 | |
11.25%, 12/15/27 | | | | | | | 120 | | | | 123,567 | |
Shift4 Payments LLC/Shift4 Payments Finance Sub, Inc., 4.63%, 11/01/26(b) | | | | | | | 213 | | | | 201,240 | |
Verscend Escrow Corp., 9.75%, 08/15/26(b) | | | | | | | 555 | | | | 543,739 | |
| | | | | | | | | | | | |
| | | |
| | | | | | | | | | | 3,170,194 | |
| | | |
| Containers & Packaging — 0.4% | | | | | | | | | |
Clydesdale Acquisition Holdings, Inc.(b) | | | | | | | | | | | | |
6.63%, 04/15/29 | | | | | | | 276 | | | | 262,407 | |
8.75%, 04/15/30 | | | | | | | 158 | | | | 135,244 | |
| | | | | | | | | | | | |
| Security | | | | | Par (000) | | | Value | |
| | | |
| Containers & Packaging (continued) | | | | | | | | | |
iQIYI, Inc., 4.00%, 12/15/26(g) | | | USD | | | | 1,796 | | | $ | 1,104,540 | |
LABL, Inc., 5.88%, 11/01/28(b) | | | | | | | 108 | | | | 94,097 | |
| | | | | | | | | | | | |
| | | |
| | | | | | | | | | | 1,596,288 | |
| | | |
| Diversified Consumer Services(b) — 0.5% | | | | | | | | | |
Allied Universal Holdco LLC/Allied Universal Finance Corp. | | | | | | | | | | | | |
6.63%, 07/15/26 | | | | | | | 637 | | | | 582,855 | |
9.75%, 07/15/27 | | | | | | | 473 | | | | 411,510 | |
Allied Universal Holdco LLC/Allied Universal Finance Corp./Atlas Luxco 4 SARL, 4.63%, 06/01/28 | | | | | | | 400 | | | | 330,372 | |
Clarivate Science Holdings Corp. | | | | | | | | | | | | |
3.88%, 07/01/28 | | | | | | | 311 | | | | 269,449 | |
4.88%, 07/01/29 | | | | | | | 307 | | | | 261,058 | |
Sotheby’s, 7.38%, 10/15/27 | | | | | | | 442 | | | | 414,432 | |
| | | | | | | | | | | | |
| | | |
| | | | | | | | | | | 2,269,676 | |
| | | |
| Diversified Financial Services — 2.1% | | | | | | | | | |
Ally Financial, Inc., Series B, (5 year CMT + 3.87%), 4.70%(a)(d) | | | | | | | 550 | | | | 367,812 | |
Citigroup, Inc., Series W, (5 year CMT + 3.60%), 4.00%(a)(d) | | | | | | | 325 | | | | 283,114 | |
Global Aircraft Leasing Co. Ltd.(b)(f) | | | | | | | | | | | | |
(6.50% Cash or 7.25% PIK), 6.50%, 09/15/24 | | | | | | | 35 | | | | 29,712 | |
Series 2021, (6.50% Cash or 7.25% PIK), 6.50%, 09/15/24 | | | | | | | 51 | | | | 43,160 | |
HSBC Holdings PLC, (1 day SOFR + 3.35%), 7.39%, 11/03/28(a) | | | | | | | 2,292 | | | | 2,408,778 | |
JPMorgan Chase & Co., (1 day SOFR + 2.58%), 5.72%, 09/14/33(a) | | | | | | | 4,400 | | | | 4,294,635 | |
Ladder Capital Finance Holdings LLLP/Ladder Capital Finance Corp., 4.75%, 06/15/29(b) | | | | | | | 13 | | | | 10,496 | |
Morgan Stanley, (1 day SOFR + 2.62%), 5.30%, 04/20/37(a) | | | | | | | 820 | | | | 749,774 | |
Spectrum Brands, Inc.(b) | | | | | | | | | | | | |
5.00%, 10/01/29 | | | | | | | 17 | | | | 14,712 | |
5.50%, 07/15/30 | | | | | | | 13 | | | | 11,473 | |
UBS Group AG, (1 year CMT + 1.55%), 4.49%, 05/12/26(a)(b) | | | | | | | 885 | | | | 864,967 | |
VistaJet Malta Finance PLC/XO Management Holding, Inc., 6.38%, 02/01/30(b) | | | | | | | 24 | | | | 19,244 | |
| | | | | | | | | | | | |
| | | |
| | | | | | | | | | | 9,097,877 | |
|
| Diversified Telecommunication Services — 0.8% | |
Consolidated Communications, Inc., 6.50%, 10/01/28(b). | | | | | | | 146 | | | | 113,451 | |
Level 3 Financing, Inc.(b) | | | | | | | | | | | | |
3.40%, 03/01/27 | | | | | | | 43 | | | | 36,334 | |
4.63%, 09/15/27 | | | | | | | 29 | | | | 24,143 | |
4.25%, 07/01/28 | | | | | | | 53 | | | | 41,748 | |
3.63%, 01/15/29 | | | | | | | 37 | | | | 27,093 | |
3.75%, 07/15/29 | | | | | | | 213 | | | | 153,226 | |
Lumen Technologies, Inc.(b) | | | | | | | | | | | | |
4.00%, 02/15/27 | | | | | | | 227 | | | | 192,372 | |
4.50%, 01/15/29 | | | | | | | 120 | | | | 82,826 | |
5.38%, 06/15/29 | | | | | | | 11 | | | | 7,919 | |
Sprint Capital Corp. | | | | | | | | | | | | |
6.88%, 11/15/28 | | | | | | | 27 | | | | 28,024 | |
8.75%, 03/15/32 | | | | | | | 81 | | | | 96,398 | |
Telecom Italia Capital SA | | | | | | | | | | | | |
6.38%, 11/15/33 | | | | | | | 13 | | | | 10,635 | |
| | |
CONSOLIDATED SCHEDULE OF INVESTMENTS | | 13 |
| | |
Consolidated Schedule of Investments (continued) December 31, 2022 | | BlackRock Credit Strategies Fund (Percentages shown are based on Net Assets) |
| | | | | | | | | | | | |
Security | | | | | Par (000) | | | Value | |
|
| Diversified Telecommunication Services (continued) | |
Telecom Italia Capital SA (continued) 7.72%, 06/04/38 | | | USD | | | | 2 | | | $ | 1,660 | |
Uniti Group LP/Uniti Group Finance, Inc./CSL Capital LLC, 4.75%, 04/15/28(b) | | | | | | | 58 | | | | 46,400 | |
Verizon Communications, Inc. | | | | | | | | | | | | |
2.88%, 11/20/50 | | | | | | | 150 | | | | 94,044 | |
3.70%, 03/22/61 | | | | | | | 247 | | | | 172,280 | |
Zayo Group Holdings, Inc.(b) | | | | | | | | | | | | |
4.00%, 03/01/27 | | | | | | | 707 | | | | 522,169 | |
6.13%, 03/01/28 | | | | | | | 3,169 | | | | 1,797,072 | |
| | | | | | | | | | | | |
| | | |
| | | | | | | | | | | 3,447,794 | |
|
| Electric Utilities — 0.3% | |
Dominion Energy, Inc., Series C, (5 year CMT + 3.20%), 4.35%(a)(d) | | | | | | | 355 | | | | 298,176 | |
Edison International, Series A, (5 year CMT + 4.70%), 5.38%(a)(d) | | | | | | | 350 | | | | 286,437 | |
Greenko Solar Mauritius Ltd., 5.55%, 01/29/25 | | | | | | | 200 | | | | 187,000 | |
JSW Hydro Energy Ltd., 4.13%, 05/18/31(e) | | | | | | | 177 | | | | 147,275 | |
Pacific Gas and Electric Co., 4.20%, 06/01/41 | | | | | | | 310 | | | | 229,468 | |
| | | | | | | | | | | | |
| | | |
| | | | | | | | | | | 1,148,356 | |
|
| Electrical Equipment — 0.0% | |
Gates Global LLC/Gates Corp., 6.25%, 01/15/26(b) | | | | | | | 104 | | | | 100,360 | |
GrafTech Finance, Inc., 4.63%, 12/15/28(b) | | | | | | | 29 | | | | 23,815 | |
Pearl Holding II Ltd., (6.00% Cash or 8.00% PIK), 6.00%(d)(e)(f) | | | | | | | 95 | | | | 2,774 | |
Pearl Holding III Ltd., 9.00%, 10/22/25(e) | | | | | | | 76 | | | | 26,505 | |
| | | | | | | | | | | | |
| | | |
| | | | | | | | | | | 153,454 | |
|
| Electronic Equipment, Instruments & Components(b) — 0.1% | |
Imola Merger Corp., 4.75%, 05/15/29 | | | | | | | 88 | | | | 76,350 | |
Vertiv Group Corp., 4.13%, 11/15/28 | | | | | | | 252 | | | | 214,200 | |
| | | | | | | | | | | | |
| | | |
| | | | | | | | | | | 290,550 | |
|
| Energy Equipment & Services — 0.2% | |
Archrock Partners LP/Archrock Partners Finance Corp.(b) | | | | | | | | | | | | |
6.88%, 04/01/27 | | | | | | | 40 | | | | 38,187 | |
6.25%, 04/01/28 | | | | | | | 257 | | | | 235,158 | |
USA Compression Partners LP/USA Compression Finance Corp. | | | | | | | | | | | | |
6.88%, 04/01/26 | | | | | | | 154 | | | | 147,731 | |
6.88%, 09/01/27 | | | | | | | 389 | | | | 363,715 | |
Weatherford International Ltd.(b) | | | | | | | | | | | | |
11.00%, 12/01/24 | | | | | | | 2 | | | | 2,040 | |
6.50%, 09/15/28 | | | | | | | 72 | | | | 70,582 | |
8.63%, 04/30/30 | | | | | | | 86 | | | | 82,586 | |
| | | | | | | | | | | | |
| | | |
| | | | | | | | | | | 939,999 | |
|
| Entertainment — 0.4% | |
iQIYI, Inc., 2.00%, 04/01/25(g) | | | | | | | 2,151 | | | | 1,747,687 | |
| | | | | | | | | | | | |
|
| Environmental, Maintenance & Security Service — 0.2% | |
Covanta Holding Corp. | | | | | | | | | | | | |
4.88%, 12/01/29(b) | | | | | | | 22 | | | | 18,024 | |
5.00%, 09/01/30 | | | | | | | 15 | | | | 12,113 | |
GFL Environmental, Inc.(b) | | | | | | | | | | | | |
5.13%, 12/15/26 | | | | | | | 243 | | | | 232,383 | |
4.00%, 08/01/28 | | | | | | | 4 | | | | 3,420 | |
4.75%, 06/15/29 | | | | | | | 54 | | | | 47,264 | |
| | | | | | | | | | | | |
Security | | | | | Par (000) | | | Value | |
|
| Environmental, Maintenance & Security Service (continued) | |
GFL Environmental, Inc.(b) (continued) | | | | | | | | | | | | |
4.38%, 08/15/29 | | | USD | | | | 69 | | | $ | 58,474 | |
Tervita Corp., 11.00%, 12/01/25(b) | | | | | | | 18 | | | | 19,351 | |
Waste Pro USA, Inc., 5.50%, 02/15/26(b) | | | | | | | 273 | | | | 241,086 | |
| | | | | | | | | | | | |
| | | |
| | | | | | | | | | | 632,115 | |
|
| Equity Real Estate Investment Trusts (REITs) — 0.7% | |
American Tower Corp. | | | | | | | | | | | | |
3.10%, 06/15/50 | | | | | | | 743 | | | | 467,526 | |
2.95%, 01/15/51 | | | | | | | 859 | | | | 531,817 | |
Brookfield Property REIT, Inc./BPR Cumulus LLC/BPR Nimbus LLC/GGSI Sellco LLC, 4.50%, 04/01/27(b) | | | | | | | 31 | | | | 25,910 | |
HAT Holdings I LLC/HAT Holdings II LLC, 3.38%, 06/15/26(b) | | | | | | | 28 | | | | 24,326 | |
Iron Mountain, Inc.(b) | | | | | | | | | | | | |
5.25%, 07/15/30 | | | | | | | 30 | | | | 26,070 | |
5.63%, 07/15/32 | | | | | | | 40 | | | | 34,665 | |
MPT Operating Partnership LP/MPT Finance Corp., | | | | | | | | | | | | |
4.63%, 08/01/29 | | | | | | | 170 | | | | 129,639 | |
RHP Hotel Properties LP/RHP Finance Corp. | | | | | | | | | | | | |
4.75%, 10/15/27 | | | | | | | 308 | | | | 278,744 | |
4.50%, 02/15/29(b) | | | | | | | 15 | | | | 12,939 | |
RLJ Lodging Trust LP, 4.00%, 09/15/29(b) | | | | | | | 17 | | | | 13,781 | |
Service Properties Trust | | | | | | | | | | | | |
4.35%, 10/01/24 | | | | | | | 158 | | | | 143,633 | |
4.50%, 03/15/25 | | | | | | | 1,262 | | | | 1,088,534 | |
| | | | | | | | | | | | |
| | | |
| | | | | | | | | | | 2,777,584 | |
|
| Food & Staples Retailing — 0.1% | |
Albertsons Cos., Inc./Safeway, Inc./New Albertsons LP/Albertsons LLC(b) | | | | | | | | | | | | |
5.88%, 02/15/28 | | | | | | | 38 | | | | 36,126 | |
4.88%, 02/15/30 | | | | | | | 72 | | | | 64,257 | |
Kraft Heinz Foods Co. | | | | | | | | | | | | |
4.88%, 10/01/49 | | | | | | | 30 | | | | 26,041 | |
5.50%, 06/01/50 | | | | | | | 68 | | | | 64,987 | |
Lamb Weston Holdings, Inc., 4.38%, 01/31/32(b) | | | | | | | 45 | | | | 39,317 | |
Performance Food Group, Inc., 4.25%, 08/01/29(b) | | | | | | | 60 | | | | 51,997 | |
Post Holdings, Inc.(b) | | | | | | | | | | | | |
5.50%, 12/15/29 | | | | | | | 8 | | | | 7,239 | |
4.63%, 04/15/30 | | | | | | | 22 | | | | 18,980 | |
4.50%, 09/15/31 | | | | | | | 29 | | | | 24,379 | |
U.S. Foods, Inc., 4.75%, 02/15/29(b) | | | | | | | 68 | | | | 60,379 | |
United Natural Foods, Inc., 6.75%, 10/15/28(b) | | | | | | | 15 | | | | 14,413 | |
| | | | | | | | | | | | |
| | | |
| | | | | | | | | | | 408,115 | |
|
| Food Products — 0.2% | |
Aramark Services, Inc.(b) | | | | | | | | | | | | |
5.00%, 04/01/25 | | | | | | | 93 | | | | 90,748 | |
6.38%, 05/01/25 | | | | | | | 40 | | | | 39,508 | |
5.00%, 02/01/28 | | | | | | | 80 | | | | 74,635 | |
Chobani LLC/Chobani Finance Corp., Inc., 7.50%, 04/15/25(b) | | | | | | | 401 | | | | 390,474 | |
Knight Castle Investments Ltd., 7.99%, 01/23/21(c)(e)(h) . | | | | 300 | | | | 210,000 | |
Simmons Foods, Inc./Simmons Prepared Foods, Inc./Simmons Pet Food, Inc./Simmons Feed, 4.63%, 03/01/29(b) | | | | | | | 31 | | | | 25,236 | |
| | | | | | | | | | | | |
| | | |
| | | | | | | | | | | 830,601 | |
| | |
| 14 | | 2 0 2 2 BLACK ROCK ANNUAL REPORT TO SHAREHOLDERS |
| | |
Consolidated Schedule of Investments (continued) December 31, 2022 | | BlackRock Credit Strategies Fund (Percentages shown are based on Net Assets) |
| | | | | | | | | | | | |
| Security | | | | | Par
(000) | | | Value | |
| | | |
| Gas Utilities — 0.0% | | | | | | | | | |
Suburban Propane Partners LP/Suburban Energy Finance Corp., 5.00%, 06/01/31(b) | | | USD | | | | 17 | | | $ | 14,450 | |
| | | | | | | | | | | | |
|
| Health Care Equipment & Supplies(b) — 0.1% | |
Avantor Funding, Inc. | | | | | | | | | | | | |
4.63%, 07/15/28 | | | | | | | 85 | | | | 77,235 | |
3.88%, 11/01/29 | | | | | | | 55 | | | | 46,186 | |
Embecta Corp., 6.75%, 02/15/30 | | | | | | | 12 | | | | 10,830 | |
Garden Spinco Corp., 8.63%, 07/20/30 | | | | | | | 126 | | | | 133,560 | |
| | | | | | | | | | | | |
| | | |
| | | | | | | | | | | 267,811 | |
|
| Health Care Providers & Services — 0.6% | |
Acadia Healthcare Co., Inc.(b) | | | | | | | | | | | | |
5.50%, 07/01/28 | | | | | | | 23 | | | | 21,816 | |
5.00%, 04/15/29 | | | | | | | 7 | | | | 6,438 | |
AdaptHealth LLC(b) | | | | | | | | | | | | |
6.13%, 08/01/28 | | | | | | | 14 | | | | 12,834 | |
5.13%, 03/01/30 | | | | | | | 5 | | | | 4,256 | |
AHP Health Partners, Inc., 5.75%, 07/15/29(b) | | | | | | | 77 | | | | 60,156 | |
Cano Health LLC, 6.25%, 10/01/28(b) | | | | | | | 41 | | | | 24,805 | |
CHS/Community Health Systems, Inc.(b) | | | | | | | | | | | | |
5.63%, 03/15/27 | | | | | | | 85 | | | | 72,884 | |
6.00%, 01/15/29 | | | | | | | 279 | | | | 233,378 | |
5.25%, 05/15/30 | | | | | | | 80 | | | | 60,323 | |
4.75%, 02/15/31 | | | | | | | 11 | | | | 7,986 | |
Encompass Health Corp. | | | | | | | | | | | | |
4.50%, 02/01/28 | | | | | | | 7 | | | | 6,359 | |
4.75%, 02/01/30 | | | | | | | 10 | | | | 8,781 | |
HCA, Inc., 4.63%, 03/15/52(b) | | | | | | | 1,355 | | | | 1,054,591 | |
Legacy LifePoint Health LLC(b) | | | | | | | | | | | | |
6.75%, 04/15/25 | | | | | | | 38 | | | | 35,761 | |
4.38%, 02/15/27 | | | | | | | 33 | | | | 27,912 | |
Medline Borrower LP(b) | | | | | | | | | | | | |
3.88%, 04/01/29 | | | | | | | 10 | | | | 8,060 | |
5.25%, 10/01/29 | | | | | | | 415 | | | | 329,622 | |
Surgery Center Holdings, Inc.(b) | | | | | | | | | | | | |
6.75%, 07/01/25 | | | | | | | 185 | | | | 182,365 | |
10.00%, 04/15/27 | | | | | | | 75 | | | | 76,312 | |
Tenet Healthcare Corp.(b) | | | | | | | | | | | | |
4.88%, 01/01/26 | | | | | | | 31 | | | | 29,315 | |
6.25%, 02/01/27 | | | | | | | 154 | | | | 147,919 | |
5.13%, 11/01/27 | | | | | | | 255 | | | | 237,211 | |
4.63%, 06/15/28 | | | | | | | 17 | | | | 15,211 | |
6.13%, 10/01/28 | | | | | | | 50 | | | | 44,766 | |
4.25%, 06/01/29 | | | | | | | 14 | | | | 12,128 | |
| | | | | | | | | | | | |
| | | |
| | | | | | | | | | | 2,721,189 | |
|
| Health Care Services — 0.2% | |
Elevance Health, Inc., 6.10%, 10/15/52 | | | | | | | 605 | | | | 644,973 | |
| | | | | | | | | | | | |
| | | |
| Health Care Technology(b) — 0.1% | | | | | | | | | |
AthenaHealth Group, Inc., 6.50%, 02/15/30 | | | | | | | 662 | | | | 487,849 | |
Syneos Health, Inc., 3.63%, 01/15/29 | | | | | | | 5 | | | | 3,982 | |
| | | | | | | | | | | | |
| | | |
| | | | | | | | | | | 491,831 | |
|
| Hotels, Restaurants & Leisure — 1.8% | |
Boyd Gaming Corp. | | | | | | | | | | | | |
4.75%, 12/01/27 | | | | | | | 35 | | | | 32,598 | |
4.75%, 06/15/31(b) | | | | | | | 136 | | | | 118,320 | |
Boyne USA, Inc., 4.75%, 05/15/29(b) | | | | | | | 52 | | | | 46,022 | |
| | | | | | | | | | | | |
Security | | | | | Par (000) | | | Value | |
| | | |
Hotels, Restaurants & Leisure (continued) | | | | | | | | | | | | |
Burger King (Restaurant Brands Int)/New Red Finance, Inc., 4.00%, 10/15/30(b) | | | USD | | | | 10 | | | $ | 8,098 | |
Caesars Entertainment, Inc.(b) | | | | | | | | | | | | |
6.25%, 07/01/25 | | | | | | | 210 | | | | 204,052 | |
8.13%, 07/01/27 | | | | | | | 524 | | | | 514,856 | |
4.63%, 10/15/29 | | | | | | | 331 | | | | 269,371 | |
Caesars Resort Collection LLC/CRC Finco, Inc., 5.75%, 07/01/25(b) | | | | | | | 92 | | | | 90,059 | |
CCM Merger, Inc., 6.38%, 05/01/26(b) | | | | | | | 30 | | | | 28,270 | |
CDI Escrow Issuer, Inc., 5.75%, 04/01/30(b) | | | | | | | 94 | | | | 84,264 | |
Cedar Fair LP/Canada’s Wonderland Co./Magnum Management Corp./Millennium Op | | | | | | | | | | | | |
5.50%, 05/01/25(b) | | | | | | | 72 | | | | 71,216 | |
6.50%, 10/01/28 | | | | | | | 10 | | | | 9,675 | |
Champion Path Holdings Ltd., 4.50%, 01/27/26(e) | | | | | | | 200 | | | | 172,000 | |
Churchill Downs, Inc., 4.75%, 01/15/28(b) | | | | | | | 229 | | | | 204,925 | |
Codere Finance 2 Luxembourg SA, (8.00% Cash or 3.00% PIK), 11.00%, 09/30/26(e)(f) | | | EUR | | | | 154 | | | | 147,044 | |
Constellation Merger Sub, Inc., 8.50%, 09/15/25(b) | | | USD | | | | 3,469 | | | | 3,052,720 | |
Fertitta Entertainment LLC/Fertitta Entertainment Finance Co., Inc.(b) | | | | | | | | | | | | |
4.63%, 01/15/29 | | | | | | | 59 | | | | 49,928 | |
6.75%, 01/15/30 | | | | | | | 21 | | | | 16,939 | |
Fortune Star BVI Ltd., 5.95%, 10/19/25(e) | | | | | | | 200 | | | | 157,225 | |
Hilton Domestic Operating Co., Inc., 3.75%, 05/01/29(b) | | | | | | | 5 | | | | 4,325 | |
Melco Resorts Finance Ltd.(e) | | | | | | | | | | | | |
4.88%, 06/06/25 | | | | | | | 200 | | | | 183,538 | |
5.63%, 07/17/27 | | | | | | | 200 | | | | 169,788 | |
Merlin Entertainments Ltd., 5.75%, 06/15/26(b) | | | | | | | 200 | | | | 187,248 | |
MGM China Holdings Ltd.(e) | | | | | | | | | | | | |
5.38%, 05/15/24 | | | | | | | 200 | | | | 192,000 | |
5.88%, 05/15/26 | | | | | | | 200 | | | | 185,225 | |
Midco GB SASU, (8.50% Cash or 7.75% PIK), 7.75%, 11/01/27(e)(f) | | | EUR | | | | 150 | | | | 144,506 | |
Midwest Gaming Borrower LLC/Midwest Gaming Finance Corp., 4.88%, 05/01/29(b) | | | USD | | | | 43 | | | | 36,587 | |
Premier Entertainment Sub LLC/Premier Entertainment Finance Corp.(b) | | | | | | | | | | | | |
5.63%, 09/01/29 | | | | | | | 21 | | | | 15,485 | |
5.88%, 09/01/31 | | | | | | | 21 | | | | 14,855 | |
Raptor Acquisition Corp./Raptor Co.-Issuer LLC, 4.88%, 11/01/26(b) | | | | | | | 31 | | | | 27,540 | |
Sands China Ltd. | | | | | | | | | | | | |
5.63%, 08/08/25 | | | | | | | 200 | | | | 192,000 | |
5.90%, 08/08/28 | | | | | | | 200 | | | | 187,818 | |
Scientific Games International, Inc.(b) | | | | | | | | | | | | |
8.63%, 07/01/25 | | | | | | | 40 | | | | 40,808 | |
7.00%, 05/15/28 | | | | | | | 40 | | | | 38,156 | |
7.25%, 11/15/29 | | | | | | | 33 | | | | 31,680 | |
Six Flags Entertainment Corp., 5.50%, 04/15/27(b) | | | | | | | 137 | | | | 123,389 | |
Six Flags Theme Parks, Inc., 7.00%, 07/01/25(b) | | | | | | | 56 | | | | 56,382 | |
Station Casinos LLC(b) | | | | | | | | | | | | |
4.50%, 02/15/28 | | | | | | | 29 | | | | 25,212 | |
4.63%, 12/01/31 | | | | | | | 49 | | | | 39,307 | |
Studio City Finance Ltd., 6.00%, 07/15/25(e) | | | | | | | 200 | | | | 171,100 | |
Vail Resorts, Inc., 6.25%, 05/15/25(b) | | | | | | | 31 | | | | 31,000 | |
Wyndham Hotels & Resorts, Inc., 4.38%, 08/15/28(b) | | | | | | | 14 | | | | 12,561 | |
Wynn Las Vegas LLC/Wynn Las Vegas Capital Corp., 5.25%, 05/15/27(b) | | | | | | | 36 | | | | 32,489 | |
| | |
CONSOLIDATED SCHEDULE OF INVESTMENTS | | 15 |
| | |
Consolidated Schedule of Investments (continued) December 31, 2022 | | BlackRock Credit Strategies Fund (Percentages shown are based on Net Assets) |
| | | | | | | | | | | | |
Security | | | | | Par (000) | | | Value | |
| | | |
Hotels, Restaurants & Leisure (continued) | | | | | | | | | | | | |
Wynn Macau Ltd., 4.88%, 10/01/24(e) | | | USD | | | | 300 | | | $ | 281,850 | |
Wynn Resorts Finance LLC/Wynn Resorts Capital Corp.(b) | | | | | | | | | | | | |
7.75%, 04/15/25 | | | | | | | 41 | | | | 40,773 | |
5.13%, 10/01/29 | | | | | | | 74 | | | | 63,428 | |
| | | | | | | | | | | | |
| | | |
| | | | | | | | | | | 7,806,632 | |
| | | |
| Household Durables — 0.2% | | | | | | | | | |
Ashton Woods USA LLC/Ashton Woods Finance Co.(b) | | | | | | | | | | | | |
6.63%, 01/15/28 | | | | | | | 10 | | | | 8,798 | |
4.63%, 08/01/29 | | | | | | | 43 | | | | 34,431 | |
4.63%, 04/01/30 | | | | | | | 30 | | | | 24,078 | |
Brookfield Residential Properties, Inc./Brookfield Residential U.S. LLC(b) | | | | | | | | | | | | |
5.00%, 06/15/29 | | | | | | | 37 | | | | 28,911 | |
4.88%, 02/15/30 | | | | | | | 72 | | | | 56,136 | |
Installed Building Products, Inc., 5.75%, 02/01/28(b) | | | | | | | 18 | | | | 16,185 | |
K Hovnanian Enterprises, Inc.(b) | | | | | | | | | | | | |
10.00%, 11/15/25 | | | | | | | 12 | | | | 12,390 | |
7.75%, 02/15/26 | | | | | | | 59 | | | | 56,640 | |
KB Home, 7.25%, 07/15/30 | | | | | | | 10 | | | | 9,717 | |
Mattamy Group Corp.(b) | | | | | | | | | | | | |
5.25%, 12/15/27 | | | | | | | 20 | | | | 17,737 | |
4.63%, 03/01/30 | | | | | | | 34 | | | | 27,556 | |
NCR Corp.(b) | | | | | | | | | | | | |
5.75%, 09/01/27 | | | | | | | 4 | | | | 3,828 | |
5.00%, 10/01/28 | | | | | | | 21 | | | | 17,903 | |
5.13%, 04/15/29 | | | | | | | 38 | | | | 31,780 | |
6.13%, 09/01/29 | | | | | | | 36 | | | | 33,662 | |
Newell Brands, Inc., 5.75%, 04/01/46 | | | | | | | 650 | | | | 518,098 | |
SWF Escrow Issuer Corp., 6.50%, 10/01/29(b) | | | | | | | 134 | | | | 77,646 | |
Tri Pointe Homes, Inc., 5.70%, 06/15/28 | | | | | | | 11 | | | | 9,964 | |
| | | | | | | | | | | | |
| | | |
| | | | | | | | | | | 985,460 | |
| | | |
| Household Products — 0.0% | | | | | | | | | |
Central Garden & Pet Co. | | | | | | | | | | | | |
4.13%, 10/15/30 | | | | | | | 2 | | | | 1,643 | |
4.13%, 04/30/31(b) | | | | | | | 35 | | | | 28,974 | |
| | | | | | | | | | | | |
| | | |
| | | | | | | | | | | 30,617 | |
|
| Independent Power and Renewable Electricity Producers — 0.3% | |
Azure Power Solar Energy Pvt Ltd., 5.65%, 12/24/24(e) | | | | | | | 200 | | | | 175,000 | |
Calpine Corp.(b) | | | | | | | | | | | | |
5.13%, 03/15/28 | | | | | | | 242 | | | | 215,935 | |
4.63%, 02/01/29 | | | | | | | 22 | | | | 18,877 | |
5.00%, 02/01/31 | | | | | | | 79 | | | | 66,274 | |
Clearway Energy Operating LLC, 4.75%, 03/15/28(b) | | | | | | | 36 | | | | 33,226 | |
Greenko Dutch BV, 3.85%, 03/29/26(e) | | | | | | | 191 | | | | 165,693 | |
Greenko Power II Ltd., 4.30%, 12/13/28(e) | | | | | | | 191 | | | | 159,485 | |
NRG Energy, Inc. | | | | | | | | | | | | |
5.75%, 01/15/28 | | | | | | | 8 | | | | 7,509 | |
5.25%, 06/15/29(b) | | | | | | | 4 | | | | 3,531 | |
3.63%, 02/15/31(b) | | | | | | | 6 | | | | 4,561 | |
ReNew Power Pvt Ltd., 5.88%, 03/05/27(e) | | | | | | | 200 | | | | 191,100 | |
| | | | | | | | | | | | |
| | | |
| | | | | | | | | | | 1,041,191 | |
| | | |
| Insurance — 0.6% | | | | | | | | | |
Acrisure LLC/Acrisure Finance, Inc., 6.00%, 08/01/29(b) | | | | 41 | | | | 33,506 | |
Alliant Holdings Intermediate LLC/Alliant Holdings Co-Issuer(b) | | | | | | | | | | | | |
4.25%, 10/15/27 | | | | | | | 206 | | | | 184,499 | |
6.75%, 10/15/27 | | | | | | | 951 | | | | 854,816 | |
5.88%, 11/01/29 | | | | | | | 469 | | | | 385,706 | |
| | | | | | | | | | | | |
Security | | | | | Par (000) | | | Value | |
| | | |
Insurance (continued) | | | | | | | | | | | | |
AmWINS Group, Inc., 4.88%, 06/30/29(b) | | | USD | | | | 148 | | | $ | 125,526 | |
FWD Group Ltd., 5.75%, 07/09/24(e) | | | | | | | 200 | | | | 189,000 | |
GTCR AP Finance, Inc., 8.00%, 05/15/27(b) | | | | | | | 100 | | | | 95,788 | |
HUB International Ltd.(b) | | | | | | | | | | | | |
7.00%, 05/01/26 | | | | | | | 374 | | | | 366,142 | |
5.63%, 12/01/29 | | | | | | | 7 | | | | 6,114 | |
Jones Deslauriers Insurance Management, Inc., 10.50%, 12/15/30 | | | | | | | 69 | | | | 67,955 | |
Ryan Specialty Group LLC, 4.38%, 02/01/30(b) | | | | | | | 24 | | | | 20,781 | |
| | | | | | | | | | | | |
| | | |
| | | | | | | | | | | 2,329,833 | |
| | | |
| Interactive Media & Services — 0.7% | | | | | | | | | |
Arches Buyer, Inc., 4.25%, 06/01/28(b) | | | | | | | 23 | | | | 17,988 | |
Cablevision Lightpath LLC, 3.88%, 09/15/27(b) | | | | | | | 200 | | | | 164,829 | |
Northwest Fiber LLC/Northwest Fiber Finance Sub, Inc.(b) | | | | | | | | | | | | |
4.75%, 04/30/27 | | | | | | | 172 | | | | 151,336 | |
6.00%, 02/15/28 | | | | | | | 136 | | | | 105,303 | |
10.75%, 06/01/28 | | | | | | | 19 | | | | 17,668 | |
Vnet Group, Inc., 0.00%, 02/01/26(g)(i) | | | | | | | 3,000 | | | | 2,430,000 | |
| | | | | | | | | | | | |
| | | |
| | | | | | | | | | | 2,887,124 | |
| | | |
| Internet Software & Services(b) — 0.3% | | | | | | | | | |
Match Group Holdings II LLC | | | | | | | | | | | | |
5.63%, 02/15/29 | | | | | | | 110 | | | | 102,300 | |
3.63%, 10/01/31 | | | | | | | 19 | | | | 14,570 | |
Uber Technologies, Inc. | | | | | | | | | | | | |
8.00%, 11/01/26 | | | | | | | 153 | | | | 153,527 | |
7.50%, 09/15/27 | | | | | | | 191 | | | | 191,134 | |
6.25%, 01/15/28 | | | | | | | 141 | | | | 135,360 | |
4.50%, 08/15/29 | | | | | | | 531 | | | | 462,636 | |
| | | | | | | | | | | | |
| | | |
| | | | | | | | | | | 1,059,527 | |
| | | |
| IT Services — 0.5% | | | | | | | | | |
Ahead DB Holdings LLC, 6.63%, 05/01/28(b) | | | | | | | 31 | | | | 24,916 | |
Booz Allen Hamilton, Inc., 4.00%, 07/01/29(b) | | | | | | | 62 | | | | 54,569 | |
CA Magnum Holdings | | | | | | | | | | | | |
5.38%, 10/31/26(b) | | | | | | | 203 | | | | 183,741 | |
5.38%, 10/31/26(e) | | | | | | | 200 | | | | 181,026 | |
Condor Merger Sub, Inc., 7.38%, 02/15/30(b) | | | | | | | 1,746 | | | | 1,403,838 | |
Dun & Bradstreet Corp., 5.00%, 12/15/29(b) | | | | | | | 350 | | | | 299,517 | |
Fair Isaac Corp., 4.00%, 06/15/28(b) | | | | | | | 35 | | | | 31,763 | |
Science Applications International Corp., 4.88%, 04/01/28(b) | | | | | | | 47 | | | | 43,475 | |
Tempo Acquisition LLC/Tempo Acquisition Finance Corp., 5.75%, 06/01/25(b) | | | | | | | 22 | | | | 22,038 | |
ZoomInfo Technologies LLC/ZoomInfo Finance Corp., 3.88%, 02/01/29(b) | | | | | | | 50 | | | | 42,019 | |
| | | | | | | | | | | | |
| | | |
| | | | | | | | | | | 2,286,902 | |
| | | |
| Leisure Products — 0.0% | | | | | | | | | |
Mattel, Inc. | | | | | | | | | | | | |
6.20%, 10/01/40 | | | | | | | 29 | | | | 25,032 | |
5.45%, 11/01/41 | | | | | | | 65 | | | | 52,909 | |
| | | | | | | | | | | | |
| | | |
| | | | | | | | | | | 77,941 | |
| | | |
| Machinery — 0.3% | | | | | | | | | |
Chart Industries, Inc. | | | | | | | | | | | | |
7.50%, 01/01/30(b) | | | | | | | 156 | | | | 156,825 | |
9.50%, 01/01/31 | | | | | | | 24 | | | | 24,615 | |
Husky III Holding Ltd., (13.00% Cash or 13.75% PIK), 13.00%, 02/15/25(b)(f) | | | | | | | 23 | | | | 20,355 | |
Madison IAQ LLC, 5.88%, 06/30/29(b) | | | | | | | 85 | | | | 58,259 | |
OT Merger Corp., 7.88%, 10/15/29(b) | | | | | | | 21 | | | | 11,130 | |
| | |
| 16 | | 2 0 2 2 BLACK ROCK ANNUAL REPORT TO SHAREHOLDERS |
| | |
Consolidated Schedule of Investments (continued) December 31, 2022 | | BlackRock Credit Strategies Fund (Percentages shown are based on Net Assets) |
| | | | | | | | | | | | |
Security | | | | | Par (000) | | | Value | |
| | | |
Machinery (continued) | | | | | | | | | | | | |
Terex Corp., 5.00%, 05/15/29(b) | | | USD | | | | 101 | | | $ | 90,774 | |
Titan Acquisition Ltd./Titan Co.-Borrower LLC, 7.75%, 04/15/26(b) | | | | | | | 292 | | | | 262,972 | |
TK Elevator Holdco GmbH, 7.63%, 07/15/28(b) | | | | | | | 229 | | | | 186,981 | |
TK Elevator U.S. Newco, Inc., 5.25%, 07/15/27(b) | | | | | | | 495 | | | | 439,332 | |
| | | | | | | | | | | | |
| | | |
| | | | | | | | | | | 1,251,243 | |
| | | |
| Media — 2.9% | | | | | | | | | |
Altice Financing SA, 5.75%, 08/15/29(b) | | | | | | | 400 | | | | 314,625 | |
Altice France Holding SA, 10.50%, 05/15/27(b) | | | | | | | 300 | | | | 228,750 | |
AMC Networks, Inc., 4.25%, 02/15/29 | | | | | | | 26 | | | | 16,201 | |
Block Communications, Inc., 4.88%, 03/01/28(b) | | | | | | | 6 | | | | 5,235 | |
Cable One, Inc. | | | | | | | | | | | | |
0.00%, 03/15/26(g)(i) | | | | | | | 22 | | | | 17,281 | |
4.00%, 11/15/30(b) | | | | | | | 15 | | | | 11,771 | |
CCO Holdings LLC/CCO Holdings Capital Corp. | | | | | | | | | | | | |
4.75%, 03/01/30(b) | | | | | | | 18 | | | | 15,524 | |
4.50%, 08/15/30(b) | | | | | | | 132 | | | | 109,052 | |
4.25%, 02/01/31(b) | | | | | | | 117 | | | | 93,847 | |
4.75%, 02/01/32(b) | | | | | | | 66 | | | | 53,506 | |
4.50%, 05/01/32 | | | | | | | 104 | | | | 82,784 | |
4.50%, 06/01/33(b) | | | | | | | 41 | | | | 31,456 | |
4.25%, 01/15/34(b) | | | | | | | 480 | | | | 354,262 | |
Cengage Learning, Inc., 9.50%, 06/15/24(b) | | | | | | | 2,200 | | | | 2,098,250 | |
Charter Communications Operating LLC/Charter Communications Operating Capital | | | | | | | | | | | | |
3.70%, 04/01/51 | | | | | | | 105 | | | | 63,847 | |
4.40%, 12/01/61 | | | | | | | 600 | | | | 383,804 | |
Clear Channel Outdoor Holdings, Inc.(b) | | | | | | | | | | | | |
5.13%, 08/15/27 | | | | | | | 636 | | | | 551,094 | |
7.75%, 04/15/28 | | | | | | | 353 | | | | 257,693 | |
7.50%, 06/01/29 | | | | | | | 255 | | | | 187,239 | |
CMG Media Corp., 8.88%, 12/15/27(b) | | | | | | | 167 | | | | 125,701 | |
Comcast Corp. | | | | | | | | | | | | |
3.75%, 04/01/40 | | | | | | | 110 | | | | 90,720 | |
2.94%, 11/01/56 | | | | | | | 54 | | | | 33,395 | |
2.99%, 11/01/63 | | | | | | | 925 | | | | 559,308 | |
Connect Finco SARL/Connect U.S. Finco LLC, 6.75%, 10/01/26(b) | | | | | | | 585 | | | | 542,154 | |
CSC Holdings LLC | | | | | | | | | | | | |
5.25%, 06/01/24 | | | | | | | 9 | | | | 8,379 | |
4.13%, 12/01/30(b) | | | | | | | 400 | | | | 282,332 | |
4.50%, 11/15/31(b) | | | | | | | 200 | | | | 138,763 | |
Directv Financing LLC/Directv Financing Co.-Obligor, Inc., 5.88%, 08/15/27(b) | | | | | | | 83 | | | | 74,257 | |
DISH DBS Corp. | | | | | | | | | | | | |
5.25%, 12/01/26(b) | | | | | | | 392 | | | | 330,195 | |
5.75%, 12/01/28(b) | | | | | | | 162 | | | | 129,296 | |
5.13%, 06/01/29 | | | | | | | 123 | | | | 79,349 | |
DISH Network Corp., 11.75%, 11/15/27(b) | | | | | | | 96 | | | | 98,870 | |
Frontier Communications Holdings LLC(b) | | | | | | | | | | | | |
5.88%, 10/15/27 | | | | | | | 51 | | | | 47,357 | |
5.00%, 05/01/28 | | | | | | | 110 | | | | 95,922 | |
6.75%, 05/01/29 | | | | | | | 322 | | | | 266,378 | |
6.00%, 01/15/30 | | | | | | | 64 | | | | 50,277 | |
8.75%, 05/15/30 | | | | | | | 197 | | | | 200,300 | |
Globe Telecom, Inc., (5 year CMT + 5.53%), 4.20%(a)(d)(e) | | | | | | | 200 | | | | 178,350 | |
Iliad Holding SASU(b) | | | | | | | | | | | | |
6.50%, 10/15/26 | | | | | | | 200 | | | | 185,491 | |
| | | | | | | | | | | | |
Security | | | | | Par (000) | | | Value | |
| | | |
Media (continued) | | | | | | | | | | | | |
Iliad Holding SASU(b) (continued) | | | | | | | | | | | | |
7.00%, 10/15/28 | | | USD | | | | 489 | | | $ | 441,953 | |
Intrado Corp., 8.50%, 10/15/25(b) | | | | | | | 473 | | | | 413,875 | |
LCPR Senior Secured Financing DAC(b) | | | | | | | | | | | | |
6.75%, 10/15/27 | | | | | | | 180 | | | | 168,300 | |
5.13%, 07/15/29 | | | | | | | 200 | | | | 165,682 | |
Ligado Networks LLC, (15.50% PIK), 15.50%, 11/01/23(b)(f) | | | | | | | 1,929 | | | | 568,249 | |
Lions Gate Capital Holdings LLC, 5.50%, 04/15/29(b) | | | | | | | 212 | | | | 122,917 | |
Live Nation Entertainment, Inc.(b) | | | | | | | | | | | | |
4.88%, 11/01/24 | | | | | | | 6 | | | | 5,810 | |
6.50%, 05/15/27 | | | | | | | 292 | | | | 285,737 | |
4.75%, 10/15/27 | | | | | | | 230 | | | | 204,775 | |
3.75%, 01/15/28 | | | | | | | 18 | | | | 15,337 | |
Network i2i Ltd., (5 year CMT + 4.27%), 5.65%(a)(d)(e) | | | | | | | 200 | | | | 189,850 | |
Outfront Media Capital LLC/Outfront Media Capital Corp.(b) | | | | | | | | | | | | |
5.00%, 08/15/27 | | | | | | | 148 | | | | 133,237 | |
4.25%, 01/15/29 | | | | | | | 128 | | | | 106,205 | |
4.63%, 03/15/30 | | | | | | | 32 | | | | 26,474 | |
Radiate Holdco LLC/Radiate Finance, Inc.(b) | | | | | | | | | | | | |
4.50%, 09/15/26 | | | | | | | 164 | | | | 120,491 | |
6.50%, 09/15/28 | | | | | | | 289 | | | | 121,095 | |
Sinclair Television Group, Inc., 4.13%, 12/01/30(b) | | | | | | | 262 | | | | 196,418 | |
Sirius XM Radio, Inc.(b) | | | | | | | | | | | | |
5.00%, 08/01/27 | | | | | | | 67 | | | | 61,932 | |
4.00%, 07/15/28 | | | | | | | 56 | | | | 48,737 | |
3.88%, 09/01/31 | | | | | | | 60 | | | | 46,810 | |
Stagwell Global LLC, 5.63%, 08/15/29(b) | | | | | | | 48 | | | | 39,580 | |
Univision Communications, Inc.(b) | | | | | | | | | | | | |
6.63%, 06/01/27 | | | | | | | 182 | | | | 175,595 | |
7.38%, 06/30/30 | | | | | | | 44 | | | | 42,051 | |
Virgin Media Vendor Financing Notes IV DAC, 5.00%, 07/15/28(b) | | | | | | | 200 | | | | 174,821 | |
Ziggo BV, 4.88%, 01/15/30(b) | | | | | | | 200 | | | | 167,354 | |
| | | | | | | | | | | | |
| | | |
| | | | | | | | | | | 12,436,300 | |
| | | |
| Metals & Mining — 0.7% | | | | | | | | | |
ABJA Investment Co. Pte. Ltd., 5.95%, 07/31/24(e) | | | | | | | 200 | | | | 199,250 | |
Arconic Corp., 6.13%, 02/15/28(b) | | | | | | | 242 | | | | 227,060 | |
ATI, Inc. | | | | | | | | | | | | |
4.88%, 10/01/29 | | | | | | | 18 | | | | 15,907 | |
5.13%, 10/01/31 | | | | | | | 48 | | | | 42,269 | |
Big River Steel LLC/BRS Finance Corp., 6.63%, | | | | | | | | | | | | |
01/31/29(b) | | | | | | | 495 | | | | 471,599 | |
Carpenter Technology Corp. | | | | | | | | | | | | |
6.38%, 07/15/28 | | | | | | | 5 | | | | 4,755 | |
7.63%, 03/15/30 | | | | | | | 38 | | | | 38,091 | |
Commercial Metals Co., 4.38%, 03/15/32 | | | | | | | 14 | | | | 12,179 | |
Constellium SE, 5.88%, 02/15/26(b) | | | | | | | 500 | | | | 481,635 | |
ERO Copper Corp., 6.50%, 02/15/30(b) | | | | | | | 32 | | | | 25,780 | |
JSW Steel Ltd., 3.95%, 04/05/27(e) | | | | | | | 200 | | | | 171,000 | |
Kaiser Aluminum Corp.(b) | | | | | | | | | | | | |
4.63%, 03/01/28 | | | | | | | 29 | | | | 25,306 | |
4.50%, 06/01/31 | | | | | | | 129 | | | | 103,684 | |
New Gold, Inc., 7.50%, 07/15/27(b) | | | | | | | 100 | | | | 87,756 | |
Novelis Corp.(b) | | | | | | | | | | | | |
3.25%, 11/15/26 | | | | | | | 146 | | | | 130,891 | |
4.75%, 01/30/30 | | | | | | | 344 | | | | 304,978 | |
3.88%, 08/15/31 | | | | | | | 179 | | | | 146,134 | |
| | |
CONSOLIDATED SCHEDULE OF INVESTMENTS | | 17 |
| | |
Consolidated Schedule of Investments (continued) December 31, 2022 | | BlackRock Credit Strategies Fund (Percentages shown are based on Net Assets) |
| | | | | | | | | | | | |
Security | | | | | Par (000) | | | Value | |
| | | |
Metals & Mining (continued) | | | | | | | | | | | | |
Periama Holdings LLC, 5.95%, 04/19/26(e) | | | USD | | | | 250 | | | $ | 232,547 | |
Roller Bearing Co. of America, Inc., 4.38%, 10/15/29(b) | | | | | | | 22 | | | | 19,023 | |
Vedanta Resources Finance II PLC, 13.88%, 01/21/24(e) | | | | | | | 412 | | | | 357,230 | |
| | | | | | | | | | | | |
| | | |
| | | | | | | | | | | 3,097,074 | |
| | | |
| Multiline Retail(b) — 0.2% | | | | | | | | | |
LSF9 Atlantis Holdings LLC/Victra Finance Corp., 7.75%, 02/15/26 | | | | | | | 773 | | | | 684,151 | |
NMG Holding Co., Inc./Neiman Marcus Group LLC, 7.13%, 04/01/26 | | | | | | | 69 | | | | 64,672 | |
| | | | | | | | | | | | |
| | | |
| | | | | | | | | | | 748,823 | |
| | | |
| Multi-Utilities — 0.1% | | | | | | | | | |
ENN Clean Energy International Investment Ltd., 3.38%, 05/12/26(e) | | | | | | | 200 | | | | 170,250 | |
TransAlta Corp., 7.75%, 11/15/29 | | | | | | | 23 | | | | 23,489 | |
| | | | | | | | | | | | |
| | | |
| | | | | | | | | | | 193,739 | |
| | | |
| Oil, Gas & Consumable Fuels — 4.7% | | | | | | | | | |
Aethon United BR LP/Aethon United Finance Corp., 8.25%, 02/15/26(b) | | | | | | | 169 | | | | 167,639 | |
Antero Midstream Partners LP/Antero Midstream Finance Corp.(b) | | | | | | | | | | | | |
5.75%, 03/01/27 | | | | | | | 32 | | | | 30,251 | |
5.75%, 01/15/28 | | | | | | | 6 | | | | 5,566 | |
5.38%, 06/15/29 | | | | | | | 37 | | | | 33,827 | |
Antero Resources Corp., 7.63%, 02/01/29(b) | | | | | | | 19 | | | | 19,105 | |
Apache Corp. | | | | | | | | | | | | |
4.25%, 01/15/30 | | | | | | | 35 | | | | 30,972 | |
5.35%, 07/01/49 | | | | | | | 11 | | | | 8,887 | |
Arcosa, Inc., 4.38%, 04/15/29(b) | | | | | | | 68 | | | | 58,968 | |
Ascent Resources Utica Holdings LLC/ARU Finance Corp.(b) | | | | | | | | | | | | |
9.00%, 11/01/27 | | | | | | | 100 | | | | 123,000 | |
5.88%, 06/30/29 | | | | | | | 316 | | | | 281,755 | |
Buckeye Partners LP | | | | | | | | | | | | |
4.13%, 03/01/25(b) | | | | | | | 5 | | | | 4,762 | |
5.85%, 11/15/43 | | | | | | | 28 | | | | 20,862 | |
5.60%, 10/15/44 | | | | | | | 18 | | | | 13,144 | |
Callon Petroleum Co. | | | | | | | | | | | | |
6.38%, 07/01/26 | | | | | | | 35 | | | | 32,622 | |
8.00%, 08/01/28(b) | | | | | | | 363 | | | | 346,042 | |
7.50%, 06/15/30(b) | | | | | | | 178 | | | | 162,870 | |
Cheniere Energy Partners LP | | | | | | | | | | | | |
4.50%, 10/01/29 | | | | | | | 345 | | | | 310,231 | |
3.25%, 01/31/32 | | | | | | | 8 | | | | 6,358 | |
Chesapeake Energy Corp.(b) | | | | | | | | | | | | |
5.88%, 02/01/29 | | | | | | | 5 | | | | 4,737 | |
6.75%, 04/15/29 | | | | | | | 79 | | | | 76,914 | |
Citgo Holding, Inc., 9.25%, 08/01/24(b) | | | | | | | 4,360 | | | | 4,349,849 | |
CITGO Petroleum Corp.(b) | | | | | | | | | | | | |
7.00%, 06/15/25 | | | | | | | 87 | | | | 84,856 | |
6.38%, 06/15/26 | | | | | | | 51 | | | | 49,158 | |
Civitas Resources, Inc., 5.00%, 10/15/26(b) | | | | | | | 16 | | | | 14,628 | |
CNX Midstream Partners LP, 4.75%, 04/15/30(b) | | | | | | | 49 | | | | 40,213 | |
CNX Resources Corp.(b) | | | | | | | | | | | | |
6.00%, 01/15/29 | | | | | | | 85 | | | | 78,212 | |
7.38%, 01/15/31 | | | | | | | 53 | | | | 50,800 | |
Colgate Energy Partners III LLC(b) | | | | | | | | | | | | |
7.75%, 02/15/26 | | | | | | | 34 | | | | 32,981 | |
| | | | | | | | | | | | |
Security | | | | | Par (000) | | | Value | |
| | | |
Oil, Gas & Consumable Fuels (continued) | | | | | | | | | | | | |
Colgate Energy Partners III LLC(b) (continued) | | | | | | | | | | | | |
5.88%, 07/01/29 | | | USD | | | | 165 | | | $ | 141,712 | |
Comstock Resources, Inc.(b) | | | | | | | | | | | | |
6.75%, 03/01/29 | | | | | | | 170 | | | | 153,425 | |
5.88%, 01/15/30 | | | | | | | 119 | | | | 102,304 | |
CQP Holdco LP/BIP-V Chinook Holdco LLC, 5.50%, 06/15/31(b) | | | | | | | 342 | | | | 298,740 | |
Crescent Energy Finance LLC, 7.25%, 05/01/26(b) | | | | | | | 230 | | | | 216,738 | |
Crestwood Midstream Partners LP/Crestwood Midstream Finance Corp.(b) | | | | | | | | | | | | |
5.63%, 05/01/27 | | | | | | | 11 | | | | 10,230 | |
6.00%, 02/01/29 | | | | | | | 10 | | | | 9,175 | |
8.00%, 04/01/29 | | | | | | | 46 | | | | 45,774 | |
CrownRock LP/CrownRock Finance, Inc.(b) | | | | | | | | | | | | |
5.63%, 10/15/25 | | | | | | | 143 | | | | 137,995 | |
5.00%, 05/01/29 | | | | | | | 7 | | | | 6,290 | |
DCP Midstream Operating LP, 6.75%, 09/15/37(b) | | | | | | | 74 | | | | 74,591 | |
Diamondback Energy, Inc., 6.25%, 03/15/33 | | | | | | | 885 | | | | 898,245 | |
DT Midstream, Inc.(b) | | | | | | | | | | | | |
4.13%, 06/15/29 | | | | | | | 66 | | | | 56,701 | |
4.38%, 06/15/31 | | | | | | | 103 | | | | 86,407 | |
Dycom Industries, Inc., 4.50%, 04/15/29(b) | | | | | | | 22 | | | | 19,149 | |
Earthstone Energy Holdings LLC, 8.00%, 04/15/27(b) | | | | | | | 94 | | | | 89,925 | |
Enerflex Ltd., 9.00%, 10/15/27 | | | | | | | 1,753 | | | | 1,748,170 | |
Energy Transfer LP | | | | | | | | | | | | |
5.40%, 10/01/47 | | | | | | | 150 | | | | 127,059 | |
Series G, (5 year CMT + 5.31%), 7.13%(a)(d) | | | | | | | 159 | | | | 132,765 | |
Series H, (5 year CMT + 5.69%), 6.50%(a)(d) | | | | | | | 114 | | | | 98,040 | |
EnLink Midstream LLC | | | | | | | | | | | | |
5.63%, 01/15/28(b) | | | | | | | 41 | | | | 39,052 | |
5.38%, 06/01/29 | | | | | | | 2 | | | | 1,851 | |
EnLink Midstream Partners LP | | | | | | | | | | | | |
5.60%, 04/01/44 | | | | | | | 24 | | | | 19,794 | |
5.05%, 04/01/45 | | | | | | | 5 | | | | 3,789 | |
5.45%, 06/01/47 | | | | | | | 8 | | | | 6,426 | |
EQM Midstream Partners LP | | | | | | | | | | | | |
6.00%, 07/01/25(b) | | | | | | | 27 | | | | 26,055 | |
4.13%, 12/01/26 | | | | | | | 14 | | | | 12,452 | |
6.50%, 07/01/27(b) | | | | | | | 40 | | | | 38,230 | |
7.50%, 06/01/30(b) | | | | | | | 15 | | | | 14,453 | |
Genesis Energy LP/Genesis Energy Finance Corp. | | | | | | | | | | | | |
6.50%, 10/01/25 | | | | | | | 50 | | | | 47,785 | |
8.00%, 01/15/27 | | | | | | | 13 | | | | 12,279 | |
7.75%, 02/01/28 | | | | | | | 36 | | | | 33,137 | |
Gulfport Energy Corp., 8.00%, 05/17/26(b) | | | | | | | 7 | | | | 6,825 | |
Harvest Midstream I LP, 7.50%, 09/01/28(b) | | | | | | | 12 | | | | 11,453 | |
Hess Corp., 5.80%, 04/01/47 | | | | | | | 248 | | | | 236,757 | |
Hess Midstream Operations LP, 4.25%, 02/15/30(b) | | | | | | | 42 | | | | 35,907 | |
Hilcorp Energy I LP/Hilcorp Finance Co.(b) | | | | | | | | | | | | |
6.25%, 11/01/28 | | | | | | | 44 | | | | 39,820 | |
5.75%, 02/01/29 | | | | | | | 29 | | | | 25,812 | |
6.00%, 04/15/30 | | | | | | | 1 | | | | 889 | |
6.00%, 02/01/31 | | | | | | | 3 | | | | 2,588 | |
6.25%, 04/15/32 | | | | | | | 1 | | | | 863 | |
ITT Holdings LLC, 6.50%, 08/01/29(b) | | | | | | | 99 | | | | 83,372 | |
Magnolia Oil & Gas Operating LLC/Magnolia Oil & Gas Finance Corp., 6.00%, 08/01/26(b) | | | | | | | 8 | | | | 7,680 | |
MasTec, Inc., 4.50%, 08/15/28(b) | | | | | | | 28 | | | | 25,079 | |
Medco Oak Tree Pte. Ltd., 7.38%, 05/14/26(e) | | | | | | | 200 | | | | 189,750 | |
MPLX LP, 4.95%, 03/14/52 | | | | | | | 1,275 | | | | 1,041,476 | |
| | |
| 18 | | 2 0 2 2 BLACK ROCK ANNUAL REPORT TO SHAREHOLDERS |
| | |
Consolidated Schedule of Investments (continued) December 31, 2022 | | BlackRock Credit Strategies Fund (Percentages shown are based on Net Assets) |
| | | | | | | | | | | | |
| Security | | | | | Par (000) | | | Value | |
| | | |
| Oil, Gas & Consumable Fuels (continued) | | | | | | | | | |
Murphy Oil Corp., 6.13%, 12/01/42 | | | USD | | | | 2 | | | $ | 1,560 | |
Murphy Oil USA, Inc., 4.75%, 09/15/29 | | | | | | | 24 | | | | 21,961 | |
Nabors Industries Ltd.(b) | | | | | | | | | | | | |
7.25%, 01/15/26 | | | | | | | 64 | | | | 60,314 | |
7.50%, 01/15/28 | | | | | | | 89 | | | | 81,426 | |
Nabors Industries, Inc. | | | | | | | | | | | | |
5.75%, 02/01/25 | | | | | | | 153 | | | | 145,902 | |
7.38%, 05/15/27(b) | | | | | | | 151 | | | | 146,273 | |
New Fortress Energy, Inc.(b) | | | | | | | | | | | | |
6.75%, 09/15/25 | | | | | | | 313 | | | | 296,035 | |
6.50%, 09/30/26 | | | | | | | 2,388 | | | | 2,217,736 | |
NGL Energy Operating LLC/NGL Energy Finance Corp., 7.50%, 02/01/26(b) | | | | | | | 36 | | | | 32,054 | |
NGPL PipeCo LLC, 7.77%, 12/15/37(b) | | | | | | | 74 | | | | 76,998 | |
Northern Oil & Gas, Inc., 8.13%, 03/01/28(b) | | | | | | | 253 | | | | 242,929 | |
NuStar Logistics LP | | | | | | | | | | | | |
5.75%, 10/01/25 | | | | | | | 20 | | | | 19,227 | |
6.00%, 06/01/26 | | | | | | | 68 | | | | 65,478 | |
6.38%, 10/01/30 | | | | | | | 5 | | | | 4,623 | |
Occidental Petroleum Corp. | | | | | | | | | | | | |
6.95%, 07/01/24 | | | | | | | 7 | | | | 7,133 | |
8.88%, 07/15/30 | | | | | | | 15 | | | | 16,935 | |
6.63%, 09/01/30 | | | | | | | 81 | | | | 83,704 | |
7.50%, 05/01/31 | | | | | | | 13 | | | | 13,890 | |
6.45%, 09/15/36 | | | | | | | 2 | | | | 2,040 | |
6.20%, 03/15/40 | | | | | | | 118 | | | | 115,474 | |
6.60%, 03/15/46 | | | | | | | 5 | | | | 5,145 | |
Parkland Corp., 5.88%, 07/15/27(b) | | | | | | | 29 | | | | 27,536 | |
PDC Energy, Inc., 6.13%, 09/15/24 | | | | | | | 2 | | | | 1,989 | |
Permian Resources Operating LLC, 6.88%, 04/01/27(b) . | | | | | | | 41 | | | | 38,632 | |
Precision Drilling Corp., 6.88%, 01/15/29(b) | | | | | | | 2 | | | | 1,862 | |
Range Resources Corp., 4.88%, 05/15/25 | | | | | | | 8 | | | | 7,599 | |
Rockcliff Energy II LLC, 5.50%, 10/15/29(b) | | | | | | | 205 | | | | 187,565 | |
Shelf Drilling North Sea Holdings Ltd., 10.25%, 10/31/25(b) | | | | | | | 1,000 | | | | 984,875 | |
SM Energy Co. | | | | | | | | | | | | |
5.63%, 06/01/25 | | | | | | | 17 | | | | 16,320 | |
6.75%, 09/15/26 | | | | | | | 30 | | | | 29,126 | |
6.63%, 01/15/27 | | | | | | | 2 | | | | 1,926 | |
6.50%, 07/15/28 | | | | | | | 2 | | | | 1,918 | |
Southwestern Energy Co. | | | | | | | | | | | | |
5.38%, 02/01/29 | | | | | | | 63 | | | | 58,405 | |
4.75%, 02/01/32 | | | | | | | 29 | | | | 24,783 | |
Summit Midstream Holdings LLC/Summit Midstream Finance Corp., 8.50%, 10/15/26(b) | | | | | | | 1,596 | | | | 1,520,062 | |
Sunoco LP/Sunoco Finance Corp., 6.00%, 04/15/27 | | | | | | | 2 | | | | 1,969 | |
Tallgrass Energy Partners LP/Tallgrass Energy Finance Corp.(b) | | | | | | | | | | | | |
6.00%, 03/01/27 | | | | | | | 6 | | | | 5,602 | |
6.00%, 12/31/30 | | | | | | | 4 | | | | 3,459 | |
6.00%, 09/01/31 | | | | | | | 20 | | | | 17,196 | |
Tap Rock Resources LLC, 7.00%, 10/01/26(b) | | | | | | | 376 | | | | 349,718 | |
Transocean, Inc., 11.50%, 01/30/27(b) | | | | | | | 21 | | | | 21,053 | |
Venture Global Calcasieu Pass LLC(b) | | | | | | | | | | | | |
3.88%, 08/15/29 | | | | | | | 139 | | | | 121,625 | |
4.13%, 08/15/31 | | | | | | | 122 | | | | 103,943 | |
3.88%, 11/01/33 | | | | | | | 97 | | | | 79,239 | |
Vermilion Energy, Inc., 6.88%, 05/01/30(b) | | | | | | | 29 | | | | 26,465 | |
Western Midstream Operating LP | | | | | | | | | | | | |
5.45%, 04/01/44 | | | | | | | 86 | | | | 71,442 | |
| | | | | | | | | | | | |
| Security | | | | | Par (000) | | | Value | |
| | | |
| Oil, Gas & Consumable Fuels (continued) | | | | | | | | | |
Western Midstream Operating LP (continued) | | | | | | | | | | | | |
5.30%, 03/01/48 | | | USD | | | | 54 | | | $ | 44,400 | |
5.50%, 08/15/48 | | | | | | | 6 | | | | 4,980 | |
5.50%, 02/01/50 | | | | | | | 89 | | | | 73,318 | |
| | | | | | | | | | | | |
| | | |
| | | | | | | | | | | 20,340,062 | |
| | | |
| Pharmaceuticals — 0.1% | | | | | | | | | |
Cheplapharm Arzneimittel GmbH, 5.50%, 01/15/28(b) | | | | | | | 200 | | | | 167,240 | |
Option Care Health, Inc., 4.38%, 10/31/29(b) | | | | | | | 42 | | | | 36,738 | |
Organon & Co./Organon Foreign Debt Co.-Issuer BV, 5.13%, 04/30/31(b) | | | | | | | 400 | | | | 346,352 | |
Teva Pharmaceutical Finance Netherlands III BV, 3.15%, 10/01/26 | | | | | | | 22 | | | | 19,088 | |
| | | | | | | | | | | | |
| | | |
| | | | | | | | | | | 569,418 | |
|
| Real Estate Management & Development — 1.2% | |
Agile Group Holdings Ltd., (5 year CMT + 11.29%), 7.88%(a)(d)(e) | | | | | | | 200 | | | | 48,500 | |
China Aoyuan Group Ltd.(c)(e)(h) | | | | | | | | | | | | |
5.98%, 08/18/25 | | | | | | | 200 | | | | 15,500 | |
6.20%, 03/24/26 | | | | | | | 200 | | | | 15,500 | |
China SCE Group Holdings Ltd.(e) | | | | | | | | | | | | |
7.38%, 04/09/24 | | | | | | | 200 | | | | 98,000 | |
5.95%, 09/29/24 | | | | | | | 200 | | | | 84,750 | |
Country Garden Holdings Co. Ltd.(e) | | | | | | | | | | | | |
8.00%, 01/27/24 | | | | | | | 200 | | | | 150,250 | |
5.40%, 05/27/25 | | | | | | | 200 | | | | 132,000 | |
7.25%, 04/08/26 | | | | | | | 300 | | | | 190,500 | |
4.80%, 08/06/30 | | | | | | | 200 | | | | 106,000 | |
Cushman & Wakefield U.S. Borrower LLC, 6.75%, 05/15/28(b) | | | | | | | 62 | | | | 59,170 | |
Fantasia Holdings Group Co. Ltd.(c)(h) | | | | | | | | | | | | |
11.75%, 04/17/22(e) | | | | | | | 710 | | | | 55,025 | |
12.25%, 10/18/22 | | | | | | | 200 | | | | 15,500 | |
Howard Hughes Corp.(b) | | | | | | | | | | | | |
5.38%, 08/01/28 | | | | | | | 24 | | | | 21,618 | |
4.13%, 02/01/29 | | | | | | | 37 | | | | 30,988 | |
4.38%, 02/01/31 | | | | | | | 34 | | | | 27,508 | |
KWG Group Holdings Ltd. | | | | | | | | | | | | |
7.88%, 08/30/24 | | | | | | | 250 | | | | 116,250 | |
5.88%, 11/10/24(e) | | | | | | | 200 | | | | 85,500 | |
Modern Land China Co. Ltd., 12.85%, 10/25/21(c)(e)(h) | | | | | | | 200 | | | | 11,350 | |
New Metro Global Ltd., 4.80%, 12/15/24(e) | | | | | | | 200 | | | | 153,500 | |
NWD Finance BVI Ltd., (5 year CMT + 7.89%), 5.25%(a)(d)(e) | | | | | | | 200 | | | | 172,500 | |
NWD MTN Ltd., 4.13%, 07/18/29(e) | | | | | | | 200 | | | | 162,250 | |
Pakuwon Jati Tbk PT, 4.88%, 04/29/28(e) | | | | | | | 200 | | | | 175,975 | |
PCPD Capital Ltd., 5.13%, 06/18/26(e) | | | | | | | 200 | | | | 150,000 | |
Powerlong Real Estate Holdings Ltd., 6.25%, 08/10/24(e) | | | | | | | 200 | | | | 60,475 | |
Realogy Group LLC/Realogy Co.-Issuer Corp.(b) | | | | | | | | | | | | |
5.75%, 01/15/29 | | | | | | | 61 | | | | 46,140 | |
5.25%, 04/15/30 | | | | | | | 24 | | | | 17,508 | |
RKPF Overseas Ltd., Series 2019, Class A, 7.88%, 02/01/23(e) | | | | | | | 250 | | | | 245,000 | |
Shui On Development Holding Ltd., 5.50%, 03/03/25(e) . | | | | | | | 200 | | | | 169,000 | |
Sinic Holdings Group Co. Ltd., 10.50%, 06/18/22(c)(h) | | | | | | | 200 | | | | 2,000 | |
Starwood Property Trust, Inc., 4.38%, 01/15/27(b) | | | | | | | 14 | | | | 12,251 | |
Theta Capital Pte. Ltd., 8.13%, 01/22/25(e) | | | | | | | 200 | | | | 150,788 | |
Times China Holdings Ltd., 6.75%, 07/08/25(e) | | | | | | | 200 | | | | 32,850 | |
VICI Properties LP, 5.13%, 05/15/32 | | | | | | | 990 | | | | 916,690 | |
VLL International, Inc., 5.75%, 11/28/24(e) | | | | | | | 200 | | | | 187,162 | |
| | |
CONSOLIDATED SCHEDULE OF INVESTMENTS | | 19 |
| | |
Consolidated Schedule of Investments (continued) December 31, 2022 | | BlackRock Credit Strategies Fund (Percentages shown are based on Net Assets) |
| | | | | | | | | | | | |
| Security | | | | | Par (000) | | | Value | |
| |
| Real Estate Management & Development (continued) | | | | |
Wanda Group Overseas Ltd., 8.88%, 03/21/23(e) | | | USD | | | | 200 | | | $ | 196,000 | |
WeWork Cos., Inc., 7.88%, 05/01/25(b) | | | | | | | 2,691 | | | | 1,022,580 | |
Yanlord Land HK Co. Ltd., 6.80%, 02/27/24(e) | | | | | | | 200 | | | | 192,000 | |
| | | | | | | | | | | | |
| | | |
| | | | | | | | | | | 5,328,578 | |
| | | |
| Road & Rail — 0.0% | | | | | | | | | |
Seaspan Corp., 5.50%, 08/01/29(b) | | | | | | | 57 | | | | 43,195 | |
| | | | | | | | | | | | |
|
| Semiconductors & Semiconductor Equipment(b) — 0.3% | |
Broadcom, Inc., 3.75%, 02/15/51 | | | | | | | 1,765 | | | | 1,218,519 | |
Synaptics, Inc., 4.00%, 06/15/29 | | | | | | | 188 | | | | 158,399 | |
| | | | | | | | | | | | |
| | | |
| | | | | | | | | | | 1,376,918 | |
| | | |
| Software — 1.7% | | | | | | | | | |
Boxer Parent Co., Inc.(b) | | | | | | | | | | | | |
7.13%, 10/02/25 | | | | | | | 91 | | | | 88,499 | |
9.13%, 03/01/26 | | | | | | | 313 | | | | 295,289 | |
Central Parent, Inc./CDK Global, Inc., 7.25%,
06/15/29(b) | | | | | | | 352 | | | | 344,299 | |
Cloud Software Group Holdings, Inc., 6.50%,
03/31/29(b) | | | | | | | 2,065 | | | | 1,739,311 | |
Elastic NV, 4.13%, 07/15/29(b) | | | | | | | 66 | | | | 53,308 | |
Iron Mountain Information Management Services, Inc.,
5.00%, 07/15/32(b) | | | | | | | 44 | | | | 36,551 | |
MicroStrategy, Inc. | | | | | | | | | | | | |
0.00%, 02/15/27(g)(i) | | | | | | | 123 | | | | 44,747 | |
6.13%, 06/15/28(b) | | | | | | | 4,090 | | | | 2,924,554 | |
Oracle Corp., 3.95%, 03/25/51 | | | | | | | 630 | | | | 448,837 | |
Skillz, Inc., 10.25%, 12/15/26(b) | | | | | | | 1,550 | | | | 1,023,000 | |
Veritas U.S., Inc./Veritas Bermuda Ltd., 7.50%,
09/01/25(b) | | | | | | | 130 | | | | 89,533 | |
| | | | | | | | | | | | |
| | | |
| | | | | | | | | | | 7,087,928 | |
| | | |
| Specialty Retail(b) — 0.3% | | | | | | | | | |
Arko Corp., 5.13%, 11/15/29 | | | | | | | 32 | | | | 25,126 | |
PetSmart, Inc./PetSmart Finance Corp., 7.75%,
02/15/29 | | | | | | | 1,225 | | | | 1,150,511 | |
Staples, Inc., 7.50%, 04/15/26 | | | | | | | 79 | | | | 67,994 | |
| | | | | | | | | | | | |
| | | |
| | | | | | | | | | | 1,243,631 | |
| | | |
| Technology Hardware, Storage & Peripherals — 0.0% | | | | | | | | | |
Coherent Corp., 5.00%, 12/15/29(b) | | | | | | | 76 | | | | 65,545 | |
| | | | | | | | | | | | |
| | | |
| Textiles, Apparel & Luxury Goods — 0.5% | | | | | | | | | |
Calceus Acquisition, Inc., 9.75%, 02/12/25(j) | | | | | | | 1,933 | | | | 1,771,094 | |
Crocs, Inc.(b) | | | | | | | | | | | | |
4.25%, 03/15/29 | | | | | | | 13 | | | | 11,012 | |
4.13%, 08/15/31 | | | | | | | 30 | | | | 24,449 | |
European TopSoho SARL, Series SMCP, 4.00%,
09/21/21(c)(e)(g)(h) | | | EUR | | | | 300 | | | | 278,141 | |
Kontoor Brands, Inc., 4.13%, 11/15/29(b) | | | USD | | | | 18 | | | | 14,690 | |
| | | | | | | | | | | | |
| | | |
| | | | | | | | | | | 2,099,386 | |
| | | |
| Thrifts & Mortgage Finance — 0.1% | | | | | | | | | |
Enact Holdings, Inc., 6.50%, 08/15/25(b) | | | | | | | 73 | | | | 71,639 | |
Home Point Capital, Inc., 5.00%, 02/01/26(b) | | | | | | | 40 | | | | 27,660 | |
MGIC Investment Corp., 5.25%, 08/15/28 | | | | | | | 32 | | | | 29,507 | |
Nationstar Mortgage Holdings, Inc.(b) | | | | | | | | | | | | |
6.00%, 01/15/27 | | | | | | | 28 | | | | 25,060 | |
5.13%, 12/15/30 | | | | | | | 24 | | | | 18,536 | |
5.75%, 11/15/31 | | | | | | | 22 | | | | 17,105 | |
| | | | | | | | | | | | |
| | | |
| | | | | | | | | | | 189,507 | |
| | | | | | | | | | | | |
| Security | | | | | Par (000) | | | Value | |
| |
| Tobacco — 0.0% | | | | |
BAT Capital Corp., 4.54%, 08/15/47 | | | USD | | | | 100 | | | $ | 70,657 | |
| | | | | | | | | | | | |
| | | |
| Transportation Infrastructure — 0.0% | | | | | | | | | |
GMR Hyderabad International Airport Ltd., 4.25%, 10/27/27(e) | | | | | | | 200 | | | | 172,100 | |
| | | | | | | | | | | | |
| | | |
| Utilities — 0.1% | | | | | | | | | |
Consensus Cloud Solutions, Inc.(b) | | | | | | | | | | | | |
6.00%, 10/15/26 | | | | | | | 13 | | | | 12,158 | |
6.50%, 10/15/28 | | | | | | | 15 | | | | 13,796 | |
Mong Duong Finance Holdings BV, 5.13%, 05/07/29(e) | | | | | | | 250 | | | | 207,469 | |
Pattern Energy Operations LP/Pattern Energy
Operations, Inc., 4.50%, 08/15/28(b) | | | | | | | 46 | | | | 41,245 | |
Star Energy Geothermal Wayang Windu Ltd., 6.75%, 04/24/33(e) | | | | | | | 162 | | | | 152,968 | |
Vistra Operations Co. LLC, 4.38%, 05/01/29(b) | | | | | | | 22 | | | | 18,956 | |
| | | | | | | | | | | | |
| | | |
| | | | | | | | | | | 446,592 | |
|
Wireless Telecommunication Services — 0.9% | |
Altice France SA/France(b) | | | | | | | | | | | | |
5.50%, 01/15/28 | | | | | | | 200 | | | | 156,624 | |
5.13%, 07/15/29 | | | | | | | 200 | | | | 149,949 | |
Digicel International Finance Ltd./Digicel international Holdings Ltd., 8.75%, 05/25/24(b) | | | | | | | 3,901 | | | | 3,343,901 | |
SBA Communications Corp., 3.13%, 02/01/29 | | | | | | | 40 | | | | 33,260 | |
Vmed O2 U.K. Financing I PLC, 4.75%, 07/15/31(b) | | | | | | | 400 | | | | 324,940 | |
| | | | | | | | | | | | |
| | | |
| | | | | | | | | | | 4,008,674 | |
| | | | | | | | | | | | |
| |
Total Corporate Bonds — 33.4%
(Cost: $161,422,580) | | | | 143,446,458 | |
| | | | | | | | | | | | |
|
Floating Rate Loan Interests(a) | |
|
| Aerospace & Defense — 0.2% | |
Atlas CC Acquisition Corp. | | | | | | | | | | | | |
Term Loan B, (3 mo. LIBOR + 4.25%, 0.75% Floor), 8.98%, 05/25/28 | | | | | | | 130 | | | | 109,055 | |
Term Loan C, (3 mo. LIBOR + 4.25%, 0.75% Floor), 8.98%, 05/25/28 | | | | | | | 26 | | | | 22,166 | |
Bleriot U.S. Bidco, Inc., 2021 Term Loan B, (3 mo. LIBOR + 4.00%), 8.73%, 10/31/26 | | | | | | | 15 | | | | 15,183 | |
Cobham Ultra U.S. Co-Borrower LLC, USD Term Loan B, (6 mo. LIBOR + 3.75%, 0.50% Floor), 7.06%, 08/03/29 | | | | | | | 34 | | | | 32,898 | |
Dynasty Acquisition Co., Inc. | | | | | | | | | | | | |
2020 CAD Term Loan B2, (1 mo. LIBOR + 3.50%), 7.92%, 04/06/26 | | | | | | | 38 | | | | 35,695 | |
2020 Term Loan B1, (1 mo. LIBOR + 3.50%), 7.92%, 04/06/26 | | | | | | | 54 | | | | 51,287 | |
Nordam Group, Inc., Term Loan B, (1 mo. LIBOR + 5.50%), 9.94%, 04/09/26 | | | | | | | 24 | | | | 18,648 | |
Peraton Corp. | | | | | | | | | | | | |
2nd Lien Term Loan B1, (1 mo. LIBOR + 7.75%, 0.75% Floor), 12.09%, 02/01/29 | | | | | | | 95 | | | | 90,381 | |
Term Loan B, (1 mo. LIBOR + 3.75%, 0.75% Floor), 8.13%, 02/01/28 | | | | | | | 238 | | | | 231,851 | |
TransDigm, Inc., 2020 Term Loan F, (3 mo. LIBOR + 2.25%), 6.98%, 12/09/25 | | | | | | | 111 | | | | 109,140 | |
| | | | | | | | | | | | |
| | | |
| | | | | | | | | | | 716,304 | |
| | |
| 20 | | 2 0 2 2 BLACK ROCK ANNUAL REPORT TO SHAREHOLDERS |
| | |
Consolidated Schedule of Investments (continued) December 31, 2022 | | BlackRock Credit Strategies Fund (Percentages shown are based on Net Assets) |
| | | | | | | | | | | | |
| Security | | | | | Par (000) | | | Value | |
| | | |
| Air Freight & Logistics — 0.0% | | | | | | | | | |
AIT Worldwide Logistics Holdings, Inc., 2021 Term Loan, (3 mo. LIBOR + 4.75%, 0.75% Floor), 8.49%, 04/06/28 | | | USD | | | | 53 | | | $ | 48,792 | |
Kestrel Bidco, Inc., Term Loan B, (1 mo. LIBOR + 3.00%, 1.00% Floor), 7.35%, 12/11/26 | | | | | | | 70 | | | | 63,731 | |
PECF USS Intermediate Holding III Corp., Term Loan B, (1 mo. LIBOR + 4.25%, 0.50% Floor), 8.63%, 12/15/28 | | | | | | | 53 | | | | 43,832 | |
| | | | | | | | | | | | |
| | | |
| | | | | | | | | | | 156,355 | |
| | | |
| Airlines — 0.2% | | | | | | | | | |
AAdvantage Loyalty IP Ltd., 2021 Term Loan, (3 mo. LIBOR + 4.75%, 0.75% Floor), 8.99%, 04/20/28 | | | | | | | 142 | | | | 140,789 | |
Air Canada, 2021 Term Loan B, (3 mo. LIBOR + 3.50%, 0.75% Floor), 8.13%, 08/11/28 | | | | | | | 144 | | | | 141,997 | |
American Airlines, Inc. | | | | | | | | | | | | |
2017 1st Lien Term Loan, (1 mo. LIBOR + 1.75%), 6.14%, 01/29/27 | | | | | | | 169 | | | | 160,395 | |
2018 Term Loan B, (1 mo. LIBOR + 1.75%), 6.14%, 06/27/25 | | | | | | | 68 | | | | 65,238 | |
Mileage Plus Holdings LLC, 2020 Term Loan B, (3 mo. LIBOR + 5.25%, 1.00% Floor), 10.00%, 06/21/27 | | | | | | | 151 | | | | 155,546 | |
United Airlines, Inc., 2021 Term Loan B, (3 mo. LIBOR + 3.75%, 0.75% Floor), 8.11%, 04/21/28 | | | | | | | 112 | | | | 110,032 | |
| | | | | | | | | | | | |
| | | |
| | | | | | | | | | | 773,997 | |
| | | |
| Auto Components — 0.4% | | | | | | | | | |
Adient U.S. LLC, 2021 Term Loan B, (1 mo. LIBOR + 3.25%), 7.63%, 04/10/28 | | | | | | | 59 | | | | 58,380 | |
Clarios Global LP, 2021 USD Term Loan B, (1 mo. LIBOR + 3.25%), 7.63%, 04/30/26 | | | | | | | 193 | | | | 188,200 | |
Sonny’s Enterprises LLC, 2020 Term Loan, (3 mo. SOFR CME + 5.50%, 1.00% Floor), 10.47%, 08/05/26(j) | | | | | | | 1,032 | | | | 1,044,103 | |
USI, Inc. | | | | | | | | | | | | |
2019 Incremental Term Loan B, (3 mo. LIBOR + 3.25%), 7.98%, 12/02/26 | | | | | | | 5 | | | | 4,808 | |
2022 Incremental Term Loan, (3 mo. SOFR CME + 3.75%, 0.50% Floor), 8.33%, 11/22/29 | | | | | | | 172 | | | | 172,041 | |
Wand NewCo 3, Inc., 2020 Term Loan, (1 mo. LIBOR + 3.00%), 7.38%, 02/05/26 | | | | | | | 144 | | | | 136,610 | |
| | | | | | | | | | | | |
| | | |
| | | | | | | | | | | 1,604,142 | |
| | | |
| Automobiles(j) — 0.7% | | | | | | | | | |
Emerald Technologies (U.S.) Acquisition., Inc., (3 mo. SOFR CME + 6.00%), 10.42%, 12/29/26 | | | | | | | 253 | | | | 229,692 | |
Sonny’s Enterprises LLC, 2020 Delayed Draw Term Loan, (1 mo. LIBOR + 6.75%, 1.00% Floor), 11.05%, 08/05/26 | | | | | | | 2,927 | | | | 2,867,978 | |
| | | | | | | | | | | | |
| | | |
| | | | | | | | | | | 3,097,670 | |
| | | |
| Banks — 1.3% | | | | | | | | | |
CivicPlus LLC(j) | | | | | | | | | | | | |
Delayed Draw Term Loan, (3 mo. LIBOR + 6.75%, 0.75% Floor), 11.48%, 08/24/27 | | | | | | | 361 | | | | 351,508 | |
Term Loan, (3 mo. LIBOR + 6.25%, 0.75% Floor, 2.50% PIK), 8.98%, 08/24/27(f) | | | | | | | 770 | | | | 749,883 | |
DirecTV Financing LLC, Term Loan, (1 mo. LIBOR + 5.00%, 0.75% Floor), 9.38%, 08/02/27 | | | | | | | 140 | | | | 136,377 | |
| | | | | | | | | | | | |
| Security | | | | | Par (000) | | | Value | |
| | | |
| Banks (continued) | | | | | | | | | |
LABL, Inc., 2021 USD 1st Lien Term Loan, (1 mo. LIBOR + 5.00%, 0.50% Floor), 9.38%, 10/29/28 | | | USD | | | | 81 | | | $ | 76,313 | |
OpenMarket, Inc., Term Loan, (3 mo. LIBOR + 6.25%, 0.75% Floor), 10.98%, 09/17/26(j) | | | | | | | 4,444 | | | | 4,303,326 | |
| | | | | | | | | | | | |
| | | |
| | | | | | | | | | | 5,617,407 | |
| | | |
| Beverages — 0.1% | | | | | | | | | |
Naked Juice LLC | | | | | | | | | | | | |
2nd Lien Term Loan, (3 mo. SOFRTE + 6.00%, 0.50% Floor), 10.68%, 01/24/30 | | | | | | | 139 | | | | 109,470 | |
Term Loan, (3 mo. SOFRTE + 3.25%, 0.50% Floor), 7.93%, 01/24/29 | | | | | | | 80 | | | | 70,967 | |
| | | | | | | | | | | | |
| | | |
| | | | | | | | | | | 180,437 | |
| | | |
| Building Materials — 0.0% | | | | | | | | | |
Cornerstone Building Brands, Inc., 2021 Term Loan B, (1 mo. LIBOR + 3.25%, 0.50% Floor), 7.57%, 04/12/28 | | | | | | | 9 | | | | 8,426 | |
| | | | | | | | | | | | |
| | | |
| Building Products — 0.1% | | | | | | | | | |
CP Atlas Buyer, Inc., 2021 Term Loan B, (1 mo. LIBOR + 3.50%, 0.50% Floor), 7.88%, 11/23/27 | | | | | | | 84 | | | | 73,167 | |
CPG International LLC, 2022 Term Loan B, (1 mo. SOFR CME + 2.50%, 0.50% Floor), 6.92%, 04/28/29 | | | | | | | 45 | | | | 43,641 | |
Jeld-Wen, Inc., 2021 Term Loan B, (1 mo. LIBOR + 2.25%), 6.63%, 07/28/28 | | | | | | | 61 | | | | 56,568 | |
New AMI I LLC, 2022 Term Loan B, (1 mo. SOFRTE + 6.00%, 0.50% Floor), 10.32%, 03/08/29 | | | | | | | 34 | | | | 28,958 | |
Standard Industries, Inc., 2021 Term Loan B, (3 mo. LIBOR + 2.25%, 0.50% Floor), 6.43%, 09/22/28 | | | | | | | 62 | | | | 61,444 | |
Wilsonart LLC, 2021 Term Loan E, (3 mo. LIBOR + 3.25%, 1.00% Floor), 7.98%, 12/31/26 | | | | | | | 151 | | | | 143,453 | |
| | | | | | | | | | | | |
| | | |
| | | | | | | | | | | 407,231 | |
| | | |
| Capital Markets — 0.5% | | | | | | | | | |
Ascensus Holdings, Inc. | | | | | | | | | | | | |
2021 2nd Lien Term Loan, (3 mo. LIBOR + 6.50%, 0.50% Floor), 10.25%, 08/02/29 | | | | | | | 75 | | | | 65,000 | |
Term Loan, (3 mo. LIBOR + 3.50%, 0.50% Floor), 8.25%, 08/02/28 | | | | | | | 161 | | | | 153,686 | |
Corestates, Inc., Term Loan, (3 mo. LIBOR + 6.00%, 1.00% Floor), 10.84%, 03/31/28(j) | | | | | | | 334 | | | | 321,537 | |
Deerfield Dakota Holding LLC | | | | | | | | | | | | |
2020 USD Term Loan B, (1 mo. SOFR CME + 3.75%, 1.00% Floor), 8.07%, 04/09/27 | | | | | | | 251 | | | | 234,484 | |
2021 USD 2nd Lien Term Loan, (1 mo. LIBOR + 6.75%, 0.75% Floor), 11.13%, 04/07/28 | | | | | | | 170 | | | | 161,075 | |
Eagle Broadband Investments LLC, Term Loan, (3 mo. LIBOR + 3.00%, 0.75% Floor), 7.75%, 11/12/27 | | | | | | | 32 | | | | 30,509 | |
Focus Financial Partners LLC, 2021 Term Loan B4, (1 mo. SOFR CME + 2.50%, 0.50% Floor), 6.82%, 06/30/28 | | | | | | | 79 | | | | 76,971 | |
GC Champion Acquisition LLC, 1st Lien Term Loan, (3 mo. SOFR CME + 6.75%, 1.00% Floor), 11.15%, 08/21/28(j) | | | | | | | 174 | | | | 169,067 | |
Giving Home Health Care(j) Revolver, (1 mo. SOFR CME + 6.50%, 1.00% Floor), 10.87%, 08/19/27 | | | | | | | 3 | | | | 3,071 | |
| | |
CONSOLIDATED SCHEDULE OF INVESTMENTS | | 21 |
| | |
Consolidated Schedule of Investments (continued) December 31, 2022 | | BlackRock Credit Strategies Fund (Percentages shown are based on Net Assets) |
| | | | | | | | | | | | |
| Security | | | | | Par (000) | | | Value | |
| | | |
| Capital Markets (continued) | | | | | | | | | |
Giving Home Health Care(j) (continued) | | | | | | | | | | | | |
Term Loan, (3 mo. SOFR CME + 6.50%, 1.00% Floor), 11.18%, 08/19/27 | | | USD | | | | 171 | | | $ | 167,812 | |
Pico Quantitative Trade Holding LLC, Term Loan, (3 mo. LIBOR + 7.25%, 1.50% Floor), 11.78%, 02/07/25(j) | | | | | | | 931 | | | | 939,976 | |
| | | | | | | | | | | | |
| | | |
| | | | | | | | | | | 2,323,188 | |
| | | |
| Chemicals — 0.6% | | | | | | | | | |
Ascend Performance Materials Operations LLC, 2021 Term Loan B, (6 mo. SOFR CME + 4.75%, 0.75% Floor), 8.83%, 08/27/26 | | | | | | | 93 | | | | 87,717 | |
Axalta Coating Systems U.S. Holdings, Inc., 2022 USD Term Loan B, (3 mo. SOFR CME + 3.00%, 0.50% Floor), 7.51%, 12/20/29 | | | | | | | 58 | | | | 58,000 | |
CPC Acquisition Corp., Term Loan, (3 mo. LIBOR + 3.75%, 0.75% Floor), 8.48%, 12/29/27 | | | | | | | 16 | | | | 11,303 | |
Discovery Purchaser Corp., Term Loan, (3 mo. SOFR CME + 4.375%, 0.50% Floor), 7.97%, 10/04/29 | | | | | | | 60 | | | | 54,555 | |
Element Solutions, Inc., 2019 Term Loan B1, (1 mo. LIBOR + 2.00%), 6.38%, 01/31/26 | | | | | | | 77 | | | | 76,680 | |
INH Buyer, Inc., 2021 Term Loan, (3 mo. LIBOR + 7.00%, 1.00% Floor), 11.73%, 06/28/28(j) | | | | | | | 2,686 | | | | 2,095,632 | |
Lonza Group AG, USD Term Loan B, (3 mo. LIBOR + 4.00%, 0.75% Floor), 8.73%, 07/03/28 | | | | | | | 35 | | | | 32,283 | |
Messer Industries GmbH, 2018 USD Term Loan, (3 mo. LIBOR + 2.50%), 7.23%, 03/02/26 | | | | | | | 57 | | | | 55,849 | |
OQ Chemicals Corp., 2017 USD Term Loan B2, (3 mo. LIBOR + 3.25%), 7.00%, 10/14/24 | | | | | | | 32 | | | | 30,299 | |
PQ Corp., 2021 Term Loan B, (3 mo. LIBOR + 2.50%, 0.50% Floor), 6.91%, 06/09/28 | | | | | | | 63 | | | | 62,168 | |
SCIH Salt Holdings, Inc., 2021 Incremental Term Loan B, (3 mo. LIBOR + 4.00%, 0.75% Floor), 8.41%, 03/16/27 | | | | | | | 49 | | | | 47,477 | |
Sparta U.S. HoldCo LLC, 2021 Term Loan, (1 mo. LIBOR + 3.25%, 0.75% Floor), 7.39%, 08/02/28 | | | | | | | 96 | | | | 93,321 | |
Starfruit Finco BV, 2018 USD Term Loan B, (3 mo. LIBOR + 2.75%), 7.16%, 10/01/25 | | | | | | | 5 | | | | 4,515 | |
W.R. Grace Holdings LLC, 2021 Term Loan B, (3 mo. LIBOR + 3.75%, 0.50% Floor), 8.50%, 09/22/28 | | | | | | | 41 | | | | 39,753 | |
| | | | | | | | | | | | |
| | | |
| | | | | | | | | | | 2,749,552 | |
| | | |
| Commercial Services & Supplies — 2.7% | | | | | | | | | |
Allied Universal Holdco LLC, 2021 USD Incremental Term Loan B, (1 mo. LIBOR + 3.75%, 0.50% Floor), 8.17%, 05/12/28 | | | | | | | 228 | | | | 216,044 | |
Amentum Government Services Holdings LLC, 2022 Term Loan, (3 mo. SOFR CME + 4.00%), 8.64%, 02/15/29 | | | | | | | 32 | | | | 30,868 | |
Aramark Services, Inc., 2021 Term Loan B, (1 mo. LIBOR + 2.50%), 6.88%, 04/06/28 | | | | | | | 127 | | | | 124,968 | |
Asurion LLC | | | | | | | | | | | | |
2018 Term Loan B7, (1 mo. LIBOR + 3.00%), 7.38%, 11/03/24 | | | | | | | 32 | | | | 30,715 | |
2020 Term Loan B8, (1 mo. LIBOR + 3.25%), 7.63%, 12/23/26 | | | | | | | 70 | | | | 62,098 | |
2021 2nd Lien Term Loan B3, (1 mo. LIBOR + 5.25%), 9.63%, 01/31/28 | | | | | | | 144 | | | | 111,719 | |
Covanta Holding Corp. | | | | | | | | | | | | |
2021 Term Loan B, (1 mo. SOFR CME + 2.50%, 0.50% Floor), 6.82%, 11/30/28 | | | | | | | 58 | | | | 57,790 | |
| | | | | | | | | | | | |
| Security | | | | | Par (000) | | | Value | |
|
| Commercial Services & Supplies (continued) | |
Covanta Holding Corp. (continued) | | | | | | | | | | | | |
2021 Term Loan C, (1 mo. SOFR CME + 2.50%, 0.50% Floor), 6.82%, 11/30/28 | | | USD | | | | 4 | | | $ | 4,365 | |
Creative Artists Agency LLC, 2020 Incremental Term Loan B1, (1 mo. LIBOR + 4.25%, 1.00% Floor), 8.63%, 11/27/26 | | | | | | | 63 | | | | 62,786 | |
Intrado Corp., 2017 Term Loan, (3 mo. LIBOR + 4.00%, 1.00% Floor), 8.41%, 10/10/24 | | | | | | | 2,133 | | | | 1,959,730 | |
Oak Purchaser, Inc.(j) | | | | | | | | | | | | |
Delayed Draw Term Loan, (1 mo. SOFR CME + 5.50%, 0.75% Floor), 9.48%, 04/28/28 | | | | | | | 484 | | | | 468,082 | |
Term Loan, (3 mo. SOFR CME + 5.50%, 0.75% Floor), 9.48%, 04/28/28 | | | | | | | 2,159 | | | | 2,089,651 | |
Oversight Systems, Inc., Term Loan, (1 mo. LIBOR + 5.25%, 1.00% Floor), 9.64%, 09/23/26(j) | | | | | | | 967 | | | | 927,808 | |
Packers Holdings LLC, 2021 Term Loan, (3 mo. LIBOR + 3.25%, 0.75% Floor), 7.54%, 03/09/28 | | | | | | | 69 | | | | 60,455 | |
Prime Security Services Borrower LLC, 2021 Term Loan, (3 mo. LIBOR + 2.75%, 0.75% Floor), 6.50%, 09/23/26 | | | | | | | 16 | | | | 15,997 | |
Security Services Acquisition Sub Corp., Term Loan, (1 mo. LIBOR + 6.00%, 1.00% Floor), 10.42%, 02/15/24(j) | | | | | | | 2,284 | | | | 2,231,087 | |
Terraboost Media, Term Loan, (3 mo. LIBOR + 4.00%, 1.00% Floor), 8.77%, 08/21/26(j) | | | | | | | 2,553 | | | | 2,366,733 | |
Verscend Holding Corp., 2021 Term Loan B, (1 mo. LIBOR + 4.00%), 8.38%, 08/27/25 | | | | | | | 63 | | | | 62,751 | |
Viad Corp., Initial Term Loan, (1 mo. LIBOR + 5.00%, 0.50% Floor), 9.38%, 07/30/28 | | | | | | | 49 | | | | 45,938 | |
VT Topco, Inc., 2021 2nd Lien Term Loan, (1 mo. LIBOR + 6.75%, 0.75% Floor), 11.13%, 07/31/26(j) | | | | | | | 623 | | | | 596,729 | |
| | | | | | | | | | | | |
| | | |
| | | | | | | | | | | 11,526,314 | |
| | | |
| Communications Equipment — 0.0% | | | | | | | | | |
ViaSat, Inc., Term Loan, (1 mo. SOFR CME + 4.50%, 0.50% Floor), 8.94%, 03/02/29 | | | | | | | 116 | | | | 112,317 | |
| | | | | | | | | | | | |
| | | |
| Construction & Engineering — 0.3% | | | | | | | | | |
Arc Falcon I, Inc., 2021 2nd Lien Term Loan, (1 mo. LIBOR + 7.00%, 0.50% Floor), 11.38%, 09/30/29(j) | | | | | | | 91 | | | | 78,487 | |
Brand Energy & Infrastructure Services, Inc., 2017 Term Loan, (3 mo. LIBOR + 4.25%, 1.00% Floor), 8.49%, 06/21/24 | | | | | | | 129 | | | | 114,893 | |
Pueblo Mechanical and Controls, LLC(j) | | | | | | | | | | | | |
2022 Delayed Draw Term Loan, (3 mo. SOFR CME + 6.00%, 0.75% Floor), 10.47%, 08/23/28 | | | | | | | 500 | | | | 259,288 | |
2022 Term Loan, (3 mo. SOFR CME + 6.00%, 0.75% Floor), 10.32%, 08/23/28 | | | | | | | 723 | | | | 706,265 | |
SRS Distribution, Inc., 2021 Term Loan B, (1 mo. LIBOR + 3.50%, 0.50% Floor), 7.88%, 06/02/28 | | | | | | | 139 | | | | 132,180 | |
USIC Holdings, Inc., 2021 Term Loan, (1 mo. LIBOR + 3.50%, 0.75% Floor), 7.88%, 05/12/28 | | | | | | | 65 | | | | 62,067 | |
| | | | | | | | | | | | |
| | | |
| | | | | | | | | | | 1,353,180 | |
| | | |
| Construction Materials — 0.8% | | | | | | | | | |
Core & Main LP, 2021 Term Loan B, (6 mo. LIBOR + 2.50%), 7.07%, 07/27/28 | | | | | | | 191 | | | | 187,721 | |
Filtration Group Corp., 2018 1st Lien Term Loan, (1 mo. LIBOR + 3.00%), 7.38%, 03/29/25 | | | | | | | 97 | | | | 96,201 | |
| | |
| 22 | | 2 0 2 2 BLACK ROCK ANNUAL REPORT TO SHAREHOLDERS |
| | |
Consolidated Schedule of Investments (continued) December 31, 2022 | | BlackRock Credit Strategies Fund (Percentages shown are based on Net Assets) |
| | | | | | | | | | | | |
| Security | | | | | Par (000) | | | Value | |
| | | |
| Construction Materials (continued) | | | | | | | | | |
Kellermeyer Bergensons Services LLC(j) | | | | | | | | | | | | |
2019 Term Loan, (3 mo. LIBOR + 6.00%, 1.00% Floor), 10.41%, 11/07/26 | | | USD | | | | 416 | | | $ | 372,798 | |
2020 Delayed Draw Term Loan, (3 mo. LIBOR + 6.00%, 1.00% Floor), 10.41%, 11/07/26 | | | | | | | 92 | | | | 82,230 | |
2021 Delayed Draw Term Loan, (3 mo. LIBOR + 6.00%, 1.00% Floor), 10.41%, 11/07/26 | | | | | | | 127 | | | | 113,885 | |
Oscar AcquisitionCo. LLC, Term Loan B, (3 mo. SOFR CME + 4.50%, 0.50% Floor), 9.18%, 04/29/29 | | | | | | | 57 | | | | 54,320 | |
PTSH Intermediate Holdings LLC, Term Loan, (3 mo. LIBOR + 5.75%, 0.75% Floor), 10.48%, 12/17/27(j) | | | | | | | 2,507 | | | | 2,438,416 | |
Tamko Building Products LLC, Term Loan B, (3 mo. LIBOR + 3.00%), 7.57%, 06/01/26 | | | | | | | 20 | | | | 18,885 | |
| | | | | | | | | | | | |
| | | |
| | | | | | | | | | | 3,364,456 | |
| | | |
| Consumer Finance — 0.1% | | | | | | | | | |
Freedom Financial Network Funding LLC, 1st Lien Term Loan, (6 mo. SOFR CME + 9.00%, 1.00% Floor), 13.95%, 09/21/27(j) | | | | | | | 375 | | | | 364,688 | |
| | | | | | | | | | | | |
| | | |
| Containers & Packaging — 0.7% | | | | | | | | | |
Brook & Whittle Holding Corp., 2021 First Lien Term Loan, (3 mo. SOFR CME + 4.00%, 0.50% Floor), 8.55%, 12/14/28 | | | | | | | 3,079 | | | | 2,692,421 | |
Charter Next Generation, Inc., 2021 Term Loan, (1 mo. LIBOR + 3.75%, 0.75% Floor), 8.13%, 12/01/27 | | | | | | | 162 | | | | 156,799 | |
Mauser Packaging Solutions Holding Co., 2017 Term Loan B, (1 mo. LIBOR + 3.25%), 7.37%, 04/03/24 | | | | | | | 118 | | | | 115,129 | |
Pregis TopCo Corp., 1st Lien Term Loan, (1 mo. SOFR CME + 3.75%), 8.19%, 07/31/26 | | | | | | | 16 | | | | 15,542 | |
Tosca Services LLC, 2021 Term Loan, (1 mo. LIBOR + 3.50%, 0.75% Floor), 7.94%, 08/18/27 | | | | | | | 69 | | | | 54,952 | |
Trident TPI Holdings, Inc., 2021 Incremental Term Loan, (3 mo. LIBOR + 4.00%, 0.50% Floor), 8.73%, 09/15/28 | | | | | | | 47 | | | | 49,542 | |
| | | | | | | | | | | | |
| | | |
| | | | | | | | | | | 3,084,385 | |
| | | |
| Distributors — 0.8% | | | | | | | | | |
American Builders & Contractors Supply Co., Inc., 2019 Term Loan, (1 mo. LIBOR + 2.00%), 6.38%, 01/15/27 | | | | | | | 30 | | | | 30,018 | |
Dealer Tire Financial LLC, Term Loan B2, 12/14/27(k) | | | | | | | 95 | | | | 93,079 | |
Kid Distro Holdings LLC, Term Loan, (3 mo. LIBOR + 5.75%, 1.00% Floor), 10.48%, 10/01/27(j) | | | | | | | 1,297 | | | | 1,256,954 | |
Supplyone, Inc., Term Loan, (1 mo. LIBOR + 5.25%, 1.00% Floor), 9.42%, 02/01/24(j) | | | | | | | 1,970 | | | | 1,957,786 | |
TMK Hawk Parent Corp. | | | | | | | | | | | | |
2020 Super Priority First Out Term Loan A, (3 mo. LIBOR + 9.50%, 1.00% Floor), 14.26%, 05/30/24(j) | | | | | | | 22 | | | | 20,210 | |
2020 Super Priority Second Out Term Loan B, (3 mo. LIBOR + 3.50%, 1.00% Floor), 8.26%, 08/28/24 | | | | | | | 70 | | | | 35,882 | |
| | | | | | | | | | | | |
| | | |
| | | | | | | | | | | 3,393,929 | |
| | | |
| Diversified Consumer Services — 2.8% | | | | | | | | | |
2U, Inc., Term Loan, (3 mo. LIBOR + 5.75%, 0.75% Floor), 10.16%, 12/30/24 | | | | | | | 526 | | | | 501,928 | |
Ascend Learning LLC | | | | | | | | | | | | |
2021 2nd Lien Term Loan, (1 mo. LIBOR + 5.75%, 0.50% Floor), 10.13%, 12/10/29 | | | | | | | 129 | | | | 110,134 | |
2021 Term Loan, (1 mo. LIBOR + 3.50%, 0.50% Floor), 7.88%, 12/11/28 | | | | | | | 43 | | | | 40,191 | |
| | | | | | | | | | | | |
| Security | | | | | Par (000) | | | Value | |
| | | |
| Diversified Consumer Services (continued) | | | | | | | | | |
Chronicle Bidco, Inc., 2022 Term Loan, (3 mo. SOFR CME + 6.25%, 1.00% Floor), 10.83%, 05/18/29(j) | | | USD | | | | 2,949 | | | $ | 2,857,355 | |
Emerald Expositions Holding, Inc., 2017 Term Loan B, (1 mo. LIBOR + 2.50%), 6.88%, 05/22/24 | | | | | | | 108 | | | | 105,117 | |
Employ, Inc., Term Loan, (6 mo. SOFR CME + 8.00%), 10.93%, 07/15/29(j) | | | | | | | 250 | | | | 241,525 | |
Laseraway Intermediate Holdings II LLC, Term Loan, (3 mo. LIBOR + 5.75%, 0.75% Floor), 9.76%, 10/14/27 | | | | | | | 2,244 | | | | 2,193,510 | |
OLA Netherlands BV, Term Loan, (1 mo. SOFR CME + 6.25%, 0.75% Floor), 10.67%, 12/15/26 | | | | | | | 113 | | | | 106,656 | |
PAI Holdco, Inc., 2020 Term Loan B, (3 mo. LIBOR + 3.75%, 0.75% Floor), 8.16%, 10/28/27 | | | | | | | 58 | | | | 51,354 | |
Perchhq LLC, Term Loan, (1 mo. LIBOR + 7.00%, 1.00% Floor), 13.20%, 10/15/25(j) | | | | | | | 3,135 | | | | 2,912,346 | |
Serta Simmons Bedding LLC, 2020 Super Priority Second Out Term Loan, (3 mo. LIBOR + 7.50%, 1.00% Floor), 12.27%, 08/10/23 | | | | | | | 513 | | | | 233,390 | |
Sotheby’s, 2021 Term Loan B, (3 mo. LIBOR + 4.50%, 0.50% Floor), 8.58%, 01/15/27 | | | | | | | 159 | | | | 154,761 | |
Thrasio LLC, Term Loan, (3 mo. LIBOR + 7.00%, 1.00% Floor), 11.17%, 12/18/26 | | | | | | | 2,993 | | | | 2,637,336 | |
Voyage Australia Pty. Ltd., USD Term Loan B, (3 mo. LIBOR + 3.50%, 0.50% Floor), 7.74%, 07/20/28(j) | | | | | | | 24 | | | | 23,191 | |
| | | | | | | | | | | | |
| | | |
| | | | | | | | | | | 12,168,794 | |
| | | |
| Diversified Financial Services — 11.8% | | | | | | | | | |
Acuris Finance U.S., Inc., 2021 USD Term Loan B, (3 mo. SOFR CME + 4.00%, 0.50% Floor), 8.73%, 02/16/28 | | | | | | | 36 | | | | 35,568 | |
Advisor Group, Inc., 2021 Term Loan, (1 mo. LIBOR + 4.50%), 8.88%, 07/31/26 | | | | | | | 64 | | | | 62,257 | |
Aerospike, Term Loan, (1 mo. LIBOR + 7.50%), 11.88%, 12/29/25(j) | | | | | | | 1,713 | | | | 1,683,866 | |
AHF Parent Holding, Inc., Term Loan, (3 mo. SOFRTE + 6.25%, 0.75% Floor), 11.09%, 02/01/28 | | | | | | | 1,963 | | | | 1,822,672 | |
AlixPartners LLP, 2021 USD Term Loan B, (1 mo. LIBOR + 2.75%, 0.50% Floor), 7.13%, 02/04/28 | | | | | | | 63 | | | | 62,493 | |
ARAS Corp.(j) | | | | | | | | | | | | |
Revolver, (3 mo. LOC + 6.50%), 6.50%, 04/13/27 | | | | | | | 50 | | | | 48,534 | |
Term Loan, (3 mo. LIBOR + 7.00%, 1.00% Floor), 7.08%, 04/13/27 | | | | | | | 2,189 | | | | 2,106,023 | |
Arrow Purchaser, Inc.(j) | | | | | | | | | | | | |
Revolver, (3 mo. LIBOR + 6.75%, 1.00% Floor), 11.39%, 04/15/26 | | | | | | | 102 | | | | 102,339 | |
Term Loan, (3 mo. LIBOR + 6.75%, 1.00% Floor), 11.45%, 04/15/26 | | | | | | | 982 | | | | 982,454 | |
Astra Acquisition Corp., 2021 1st Lien Term Loan, (1 mo. LIBOR + 5.25%, 0.50% Floor), 9.63%, 10/25/28 | | | | | | | 690 | | | | 608,049 | |
Barri Financial Group LLC, 2022 Term Loan, (3 mo. SOFRTE + 8.50%), 12.86%, 11/15/27 | | | | | | | 462 | | | | 452,308 | |
Castlelake Aviation Ltd., Term Loan B, (3 mo. LIBOR + 2.75%, 0.50% Floor), 7.52%, 10/22/26 | | | | | | | 75 | | | | 74,306 | |
CivicPlus LLC, 2022 Holdco Notes, (3 mo. SOFR CME + 6.75%, 0.75% Floor), 11.33%, 08/24/27(j) | | | | | | | 651 | | | | 634,060 | |
Cogeco Financing 2 LP, 2021 Incremental Term Loan B, (1 mo. LIBOR + 2.50%, 0.50% Floor), 6.88%, 09/01/28 | | | | | | | 80 | | | | 77,451 | |
Comet Bidco Ltd., 2018 USD Term Loan B, (6 mo. LIBOR + 5.00%, 1.00% Floor), 10.21%, 09/30/24 | | | | | | | 2,955 | | | | 2,053,881 | |
| | |
CONSOLIDATED SCHEDULE OF INVESTMENTS | | 23 |
| | |
Consolidated Schedule of Investments (continued) December 31, 2022 | | BlackRock Credit Strategies Fund (Percentages shown are based on Net Assets) |
| | | | | | | | | | | | |
| Security | | | | | Par (000) | | | Value | |
| | | |
| Diversified Financial Services (continued) | | | | | | | | | |
Delta TopCo, Inc. | | | | | | | | | | | | |
2020 2nd Lien Term Loan, (3 mo. LIBOR + 7.25%, 0.75% Floor), 11.65%, 12/01/28 | | | USD | | | | 14 | | | $ | 10,903 | |
2020 Term Loan B, (3 mo. LIBOR + 3.75%, 0.75% Floor), 8.15%, 12/01/27 | | | | | | | 68 | | | | 62,607 | |
EG America LLC, 2018 USD Term Loan, (3 mo. LIBOR + 4.00%), 8.73%, 02/07/25 | | | | | | | 81 | | | | 76,164 | |
Foreside Financial(j) | | | | | | | | | | | | |
Incremental Delayed Draw Term Loan, (1 mo. LIBOR + 5.50%, 1.00% Floor), 9.88%, 09/30/27 | | | | | | | 238 | | | | 43,612 | |
Incremental Term Loan, (1 mo. LIBOR + 5.50%, 1.00% Floor), 9.88%, 09/30/27 | | | | | | | 1,648 | | | | 1,544,840 | |
Gainwell Acquisition Corp., Term Loan B, (3 mo. LIBOR + 4.00%, 0.75% Floor), 8.73%, 10/01/27 | | | | | | | 127 | | | | 118,490 | |
GC Waves Holdings, Inc.(j) | | | | | | | | | | | | |
2020 Delayed Draw Term Loan, (1 mo. LIBOR + 5.25%, 0.75% Floor), 9.88%, 08/13/26 | | | | | | | 883 | | | | 865,474 | |
2021 Delayed Draw Term Loan, (1 mo. LIBOR + 5.50%, 0.75% Floor), 9.88%, 08/13/26 | | | | | | | 2,190 | | | | 2,151,435 | |
Term Loan, (1 mo. LIBOR + 5.25%, 0.75% Floor), 9.63%, 08/13/26 | | | | | | | 885 | | | | 869,958 | |
Greystone Affordable Housing Initiatives LLC(j) | | | | | | | | | | | | |
2022 Term Loan, (1 mo. SOFR CME + 6.50%), 10.94%, 03/08/27 | | | | | | | 1,636 | | | | 1,606,746 | |
Delayed Draw Term Loan, (1 mo. LIBOR + 6.00%), 9.05%, 07/01/26 | | | | | | | 2,800 | | | | 2,766,400 | |
HowlCo LLC, Term Loan, (3 mo. LIBOR + 6.00%, 1.00% Floor), 10.69%, 10/23/26(j) | | | | | | | 1,095 | | | | 1,047,552 | |
IT Parent LLC(j) | | | | | | | | | | | | |
2021 Term Loan, (1 mo. LIBOR + 6.25%, 1.00% Floor), 10.60%, 09/30/26 | | | | | | | 314 | | | | 293,261 | |
Revolver, (1 mo. LIBOR + 6.25%, 1.00% Floor), 10.64%, 10/01/26 | | | | | | | 263 | | | | 245,893 | |
Term Loan, (1 mo. LIBOR + 6.25%, 1.00% Floor), 10.63%, 10/01/26 | | | | | | | 2,460 | | | | 2,300,212 | |
Job & Talent USA, Inc.(j) | | | | | | | | | | | | |
Delayed Draw Term Loan, (1 mo. SOFR CME + 8.75%, 1.00% Floor), 13.19%, 01/27/25 | | | | | | | 500 | | | | 491,500 | |
Term Loan, (1 mo. SOFR CME + 8.75%, 1.00% Floor), 13.19%, 01/27/25 | | | | | | | 1,500 | | | | 1,464,593 | |
Term loan 3, (1 mo. SOFR CME + 8.75%, 1.00% Floor), 13.34%, 02/17/25 | | | | | | | 2,000 | | | | 1,966,000 | |
Kingpin Intermediate Holdings LLC, 2018 Term Loan B, (1 mo. LIBOR + 3.50%, 1.00% Floor), 7.89%, 07/03/24(j) | | | | | | | 70 | | | | 69,494 | |
KKR Apple Bidco LLC | | | | | | | | | | | | |
2021 2nd Lien Term Loan, (1 mo. LIBOR + 5.75%, 0.50% Floor), 10.13%, 09/21/29 | | | | | | | 19 | | | | 18,267 | |
2021 Term Loan, (1 mo. LIBOR + 2.75%, 0.50% Floor), 7.13%, 09/23/28 | | | | | | | 45 | | | | 43,875 | |
Kroll Bonds Rating Agency, Inc., Term Loan, (1 mo. LIBOR + 5.75%, 0.75% Floor), 9.82%, 12/10/27(j) | | | | | | | 3,931 | | | | 3,794,211 | |
LBM Acquisition LLC, Term Loan B, (6 mo. LIBOR + 3.75%, 0.75% Floor), 7.12%, 12/17/27 | | | | | | | 8 | | | | 6,455 | |
MSM Acquisitions, Inc.(j) | | | | | | | | | | | | |
2021 Delayed Draw Term Loan, (3 mo. LIBOR + 6.00%, 1.00% Floor), 10.75%, 12/09/26 | | | | | | | 82 | | | | 78,099 | |
Delayed Draw Term Loan, (1 mo. LIBOR + 6.00%, 1.00% Floor), 10.75%, 12/09/26 | | | | | | | 351 | | | | 335,704 | |
| | | | | | | | | | | | |
| Security | | | | | Par (000) | | | Value | |
| | | |
| Diversified Financial Services (continued) | | | | | | | | | |
MSM Acquisitions, Inc.(j) (continued) | | | | | | | | | | | | |
Revolver, (3 mo. LIBOR + 6.00%, 1.00% Floor), 10.75%, 12/09/26 | | | USD | | | | 67 | | | $ | 63,636 | |
Term Loan, (3 mo. LIBOR + 6.00%, 1.00% Floor), 10.75%, 12/09/26 | | | | | | | 1,064 | | | | 1,018,066 | |
Oasis Financial LLC, 2nd Lien Term Loan, (3 mo. SOFR CME + 8.50%, 1.00% Floor), 12.93%, 06/30/26(j) | | | | | | | 2,000 | | | | 1,948,000 | |
Porcelain Acquisition Corp., Term Loan, (3 mo. LIBOR + 5.75%, 1.00% Floor), 10.48%, 04/01/27(j) | | | | | | | 1,239 | | | | 1,249,503 | |
Radiate Holdco LLC, 2021 Term Loan B, (1 mo. LIBOR + 3.25%, 0.75% Floor), 7.63%, 09/25/26 | | | | | | | 124 | | | | 100,033 | |
RVR Dealership Holdings LLC, Term Loan B, (1 mo. SOFRTE + 3.75%, 0.75% Floor), 8.17%, 02/08/28 | | | | | | | 64 | | | | 58,343 | |
Skopima Merger Sub, Inc., 2nd Lien Term Loan, (1 mo. LIBOR + 7.50%, 0.50% Floor), 11.88%, 04/30/29(j) | | | | | | | 3,000 | | | | 2,877,000 | |
SMG U.S. Midco 2, Inc., 2020 Term Loan, (3 mo. LIBOR + 2.50%), 6.91%, 01/23/25 | | | | | | | 33 | | | | 32,175 | |
Spartan Bidco Pty. Ltd., Term Loan, (3 mo. SOFR CME + 0.75%, 6.50% PIK), 0.05%, 01/24/28(f)(j) | | | | | | | 1,858 | | | | 1,804,693 | |
SSH Group Holdings, Inc., 2018 1st Lien Term Loan, (3 mo. LIBOR + 4.00%), 8.73%, 07/30/25 | | | | | | | 33 | | | | 31,982 | |
Sunland Asphalt & Construction LLC(j) | | | | | | | | | | | | |
Delayed Draw Term Loan, (3 mo. LIBOR + 6.00%, 1.00% Floor), 11.15%, 01/13/26 | | | | | | | 348 | | | | 340,514 | |
Term Loan, (3 mo. LIBOR + 6.00%, 1.00% Floor), 11.15%, 01/13/26 | | | | | | | 1,035 | | | | 1,012,681 | |
Supplyone, Inc., Incremental Term Loan, (1 mo. LIBOR + 5.00%, 1.00% Floor), 9.17%, 02/01/24(j) | | | | | | | 1,250 | | | | 1,238,958 | |
Touchstone Acquisition, Inc., 2021 Term Loan, (1 mo. LIBOR + 6.00%, 0.75% Floor), 10.38%, 12/29/28(j) | | | | | | | 4,466 | | | | 4,289,632 | |
Veritas U.S., Inc., 2021 USD Term Loan B, (3 mo. LIBOR + 5.00%, 1.00% Floor), 9.73%, 09/01/25 | | | | | | | 166 | | | | 116,330 | |
VS Buyer LLC, Term Loan B, (1 mo. LIBOR + 3.00%), 7.38%, 02/28/27 | | | | | | | 47 | | | | 45,761 | |
White Cap Buyer LLC, Term Loan B, (1 mo. SOFR CME + 3.75%), 8.07%, 10/19/27 | | | | | | | 64 | | | | 62,059 | |
Ziggo Financing Partnership, USD Term Loan I, (1 mo. LIBOR + 2.50%), 6.82%, 04/30/28 | | | | | | | 54 | | | | 52,483 | |
Zilliant, Inc., Term Loan, (3 mo. LIBOR + 2.00%), 6.35%, 12/21/27(j) | | | | | | | 1,550 | | | | 1,454,125 | |
| | | | | | | | | | | | |
| | | |
| | | | | | | | | | | 50,873,980 | |
|
| Diversified Telecommunication Services — 0.9% | |
Consolidated Communications, Inc., 2021 Term Loan B, (1 mo. LIBOR + 3.50%, 0.75% Floor), 7.88%, 10/02/27 | | | | | | | 19 | | | | 16,961 | |
Frontier Communications Corp., 2021 1st Lien Term Loan, (3 mo. LIBOR + 3.75%, 0.75% Floor), 8.50%, 05/01/28 | | | | | | | 48 | | | | 45,931 | |
Intelsat Jackson Holdings SA, 2021 Exit Term Loan B, (6 mo. SOFRTE + 4.50%, 0.50% Floor), 7.44%, 02/01/29 | | | | | | | 3,918 | | | | 3,774,951 | |
Iridium Satellite LLC, 2021 Term Loan B2, (1 mo. LIBOR + 2.50%, 0.75% Floor), 6.92%, 11/04/26 | | | | | | | 58 | | | | 57,352 | |
Telesat Canada, Term Loan B5, (3 mo. LIBOR + 2.75%), 7.17%, 12/07/26 | | | | | | | 13 | | | | 5,786 | |
| | | | | | | | | | | | |
| | | |
| | | | | | | | | | | 3,900,981 | |
| | |
| 24 | | 2 0 2 2 BLACK ROCK ANNUAL REPORT TO SHAREHOLDERS |
| | |
Consolidated Schedule of Investments (continued) December 31, 2022 | | BlackRock Credit Strategies Fund (Percentages shown are based on Net Assets) |
| | | | | | | | | | | | |
| Security | | | | | Par
(000) | | | Value | |
| | | |
| Electric Utilities — 0.1% | | | | | | | | | |
Triton Water Holdings, Inc., Term Loan, (3 mo. LIBOR + 3.50%, 0.50% Floor), 8.23%, 03/31/28 | | | USD | | | | 209 | | | $ | 193,147 | |
| | | | | | | | | | | | |
| | | |
| Electrical Equipment — 1.1% | | | | | | | | | |
Arcline FM Holdings LLC, 2021 1st Lien Term Loan, (6 mo. LIBOR + 4.75%, 0.75% Floor), 9.48%, 06/23/28 | | | | | | | 64 | | | | 60,638 | |
AZZ, Inc., Term Loan B, (1 mo. SOFR CME + 4.25%, 0.50% Floor), 8.67%, 05/13/29 | | | | | | | 33 | | | | 32,554 | |
Gates Global LLC, 2021 Term Loan B3, (1 mo. LIBOR + 2.50%, 0.75% Floor), 6.88%, 03/31/27 | | | | | | | 45 | | | | 44,459 | |
Razor Group GmbH(j) | | | | | | | | | | | | |
Delayed Draw Term Loan, (1 mo. LIBOR + 9.00%), 13.93%, 04/23/25 | | | | | | | 4,215 | | | | 3,954,371 | |
Fixed Term Loan, 3.50%, 09/30/23 | | | | | | | 401 | | | | 431,612 | |
| | | | | | | | | | | | |
| | | |
| | | | | | | | | | | 4,523,634 | |
|
| Electronic Equipment, Instruments & Components — 1.2% | |
Coherent Corp., 2022 Term Loan B, (3 mo. LIBOR + 2.75%, 0.50% Floor), 7.13%, 07/02/29 | | | | | | | 62 | | | | 61,354 | |
Emerald Electronics Manufacturing Services, Term Loan, (1 mo. SOFRTE + 6.25%, 1.00% Floor), 10.67%, 12/29/27 | | | | | | | 1,454 | | | | 1,366,712 | |
ESO Solutions, Inc., Term Loan, (3 mo. SOFR CME + 7.00%, 1.00% Floor), 11.59%, 05/03/27(j) | | | | | | | 3,696 | | | | 3,548,467 | |
| | | | | | | | | | | | |
| | | |
| | | | | | | | | | | 4,976,533 | |
| | | |
| Entertainment — 0.0% | | | | | | | | | |
Delta 2 Lux SARL, Term Loan B, (3 mo. SOFR CME + 3.25%, 0.50% Floor), 7.57%, 01/15/30 | | | | | | | 60 | | | | 59,925 | |
Streamland Media Midco LLC, 2022 Term Loan, (3 mo. SOFR CME + 6.75%, 1.00% Floor), 11.11%, 07/28/25(j) | | | | | | | 76 | | | | 72,323 | |
| | | | | | | | | | | | |
| | | |
| | | | | | | | | | | 132,248 | |
|
| Environmental, Maintenance & Security Service — 0.0% | |
Asplundh Tree Expert LLC, 2021 Term Loan B, (1 mo. LIBOR + 1.75%), 6.13%, 09/07/27 | | | | | | | 126 | | | | 125,259 | |
TruGreen LP, 2020 Term Loan, (1 mo. LIBOR + 4.00%, 0.75% Floor), 8.38%, 11/02/27 | | | | | | | 48 | | | | 42,534 | |
| | | | | | | | | | | | |
| | | |
| | | | | | | | | 167,793 | |
|
| Equity Real Estate Investment Trusts (REITs) — 0.3% | |
Colony Display LLC, Term Loan, (3 mo. LIBOR + 6.50%, 1.00% Floor), 6.50%, 06/30/26(j) | | | | | | | 1,322 | | | | 1,222,846 | |
RHP Hotel Properties LP, 2017 Term Loan B, (1 mo. LIBOR + 2.00%), 6.39%, 05/11/24 | | | | | | | 27 | | | | 27,205 | |
| | | | | | | | | | | | |
| | | |
| | | | | | | | | | | 1,250,051 | |
| | | |
| Food & Staples Retailing — 0.3% | | | | | | | | | |
H-Food Holdings LLC, 2020 Incremental Term Loan B3, (1 mo. LIBOR + 5.00%, 1.00% Floor), 9.38%, 05/23/25 | | | | | | | 11 | | | | 9,549 | |
JP Intermediate B LLC, Term Loan, (3 mo. LIBOR + 5.50%, 1.00% Floor), 9.91%, 11/20/25 | | | | | | | 1,670 | | | | 1,202,383 | |
Nomad Foods U.S. LLC, 2022 Term Loan B, 11/12/29(k) | | | | | | | 32 | | | | 31,867 | |
| | | | | | | | | | | | |
| Security | | | | | Par
(000) | | | Value | |
| | | |
| Food & Staples Retailing (continued) | | | | | | | | | |
U.S. Foods, Inc. | | | | | | | | | | | | |
2019 Term Loan B, (1 mo. LIBOR + 2.00%), 6.38%, 09/13/26 | | | USD | | | | 28 | | | $ | 27,143 | |
2021 Term Loan B, (1 mo. LIBOR + 2.75%), 7.13%, 11/22/28 | | | | | | | 109 | | | | 108,609 | |
| | | | | | | | | | | | |
| | | |
| | | | | | | | | | | 1,379,551 | |
| | | |
| Food Products — 0.2% | | | | | | | | | |
8th Avenue Food & Provisions, Inc. | | | | | | | | | | | | |
2018 1st Lien Term Loan, (1 mo. LIBOR + 3.75%), 8.13%, 10/01/25 | | | | | | | 41 | | | | 34,493 | |
2021 Incremental Term Loan, (1 mo. LIBOR + 4.75%, 0.75% Floor), 9.13%, 10/01/25 | | | | | | | 112 | | | | 92,397 | |
B&G Foods, Inc., 2019 Term Loan B4, (1 mo. LIBOR + 2.50%), 6.88%, 10/10/26 | | | | | | | 6 | | | | 5,650 | |
Chobani LLC, 2020 Term Loan B, (1 mo. LIBOR + 3.50%, 1.00% Floor), 7.88%, 10/25/27 | | | | | | | 164 | | | | 160,710 | |
Froneri International Ltd., 2020 USD Term Loan, (1 mo. LIBOR + 2.25%), 6.63%, 01/29/27 | | | | | | | 127 | | | | 123,199 | |
Reynolds Group Holdings, Inc., 2020 Term Loan B2, (1 mo. LIBOR + 3.25%), 7.63%, 02/05/26 | | | | | | | 12 | | | | 12,042 | |
Sovos Brands Intermediate, Inc., 2021 Term Loan, (3 mo. LIBOR + 3.50%, 0.75% Floor), 7.91%, 06/08/28 | | | | | | | 129 | | | | 125,382 | |
UTZ Quality Foods LLC, 2021 Term Loan B, (1 mo. SOFR CME + 3.00%), 7.44%, 01/20/28 | | | | | | | 127 | | | | 125,397 | |
| | | | | | | | | | | | |
| | | |
| | | | | | | | | | | 679,270 | |
| | | |
| Gas Utilities — 0.0% | | | | | | | | | |
Freeport LNG Investments LLLP, Term Loan B, (3 mo. LIBOR + 3.50%, 0.50% Floor), 7.74%, 12/21/28 | | | | | | | 164 | | | | 155,199 | |
| | | | | | | | | | | | |
| | | |
| Health Care Equipment & Supplies — 0.5% | | | | | | | | | |
Appriss Health LLC, Term Loan, (3 mo. LIBOR + 7.25%, 1.00% Floor), 11.54%, 05/06/27(j) | | | | | | | 1,414 | | | | 1,335,885 | |
Electron BidCo, Inc., 2021 Term Loan, (1 mo. LIBOR + 3.00%, 0.50% Floor), 7.38%, 11/01/28 | | | | | | | 159 | | | | 154,139 | |
Gympass, Term Loan, (3 mo. SOFR CME + 3.00%, 4.00% PIK), 8.77%, 06/24/27(f)(j) | | | | | | | 254 | | | | 249,868 | |
Insulet Corp., Term Loan B, (3 mo. SOFR CME + 3.25%), 7.69%, 05/04/28 | | | | | | | 31 | | | | 30,853 | |
Medline Borrower LP, USD Term Loan B, (1 mo. LIBOR + 3.25%, 0.50% Floor), 7.63%, 10/23/28 | | | | | | | 240 | | | | 227,913 | |
Venga Finance SARL, 2021 USD Term Loan B, (3 mo. LIBOR + 4.75%, 0.75% Floor), 9.48%, 12/04/28 | | | | | | | 23 | | | | 21,280 | |
| | | | | | | | | | | | |
| | | |
| | | | | | | | | | | 2,019,938 | |
| | | |
| Health Care Providers & Services — 1.6% | | | | | | | | | |
Alcami Corp., 2022 Term Loan, (3 mo. SOFR CME + 7.10%, 1.00% Floor), 11.42%, 12/21/28(j) | | | | | | | 71 | | | | 70,877 | |
BW NHHC Holdco, Inc.(j) | | | | | | | | | | | | |
2022 Super Priority Term Loan, (3 mo. SOFR CME + 7.50%, 2.00% Floor), 12.01%, 01/15/26 | | | | | | | 426 | | | | 393,764 | |
Term Funded, (3 mo. SOFR CME + 4.38%, 1.00% Floor), 16.39%, 12/20/27 | | | | | | | 1,359 | | | | 611,641 | |
Term Funded, (3 mo. SOFR CME + 4.51%), 12.51%, 01/15/26 | | | | | | | 1,979 | | | | 1,266,770 | |
CBI-Gator Acquisition LLC(j) | | | | | | | | | | | | |
Revolver, (3 mo. LIBOR + 5.75%, 1.00% Floor), 10.31%, 10/25/27 | | | | | | | 177 | | | | 167,875 | |
| | |
CONSOLIDATED SCHEDULE OF INVESTMENTS | | 25 |
| | |
Consolidated Schedule of Investments (continued) December 31, 2022 | | BlackRock Credit Strategies Fund (Percentages shown are based on Net Assets) |
| | | | | | | | | | | | |
| Security | | | | | Par (000) | | | Value | |
|
| Health Care Providers & Services (continued) | |
CBI-Gator Acquisition LLC(j) (continued) Term Loan, (3 mo. LIBOR + 5.75%), 10.48%, 10/25/27 | | | USD | | | | 2,783 | | | $ | 2,639,220 | |
CHG Healthcare Services, Inc., 2021 Term Loan, (1 mo. LIBOR + 3.25%, 0.50% Floor), 7.63%, 09/29/28 | | | | | | | 157 | | | | 153,120 | |
Envision Healthcare Corp. | | | | | | | | | | | | |
2022 First Out Term Loan, (3 mo. SOFR CME + 7.88%, 1.00% Floor), 12.61%, 03/31/27 | | | | | | | 33 | | | | 29,323 | |
2022 Second Out Term Loan, (3 mo. SOFR CME + 4.25%, 1.00% Floor), 8.83%, 03/31/27 | | | | | | | 40 | | | | 13,601 | |
EyeCare Partners LLC, 2021 2nd Lien Term Loan, (3 mo. LIBOR + 6.75%, 0.50% Floor), 11.48%, 11/15/29 | | | | | | | 76 | | | | 61,708 | |
Femur Buyer, Inc., 1st Lien Term Loan, (3 mo. LIBOR + 4.50%), 9.23%, 03/05/26 | | | | | | | 36 | | | | 30,586 | |
Orbcomm, Inc., Term Loan B, (3 mo. LIBOR + 4.25%, 0.75% Floor), 8.81%, 09/01/28 | | | | | | | 66 | | | | 55,967 | |
PetVet Care Centers LLC, 2021 Term Loan B3, (1 mo. LIBOR + 3.50%, 0.75% Floor), 7.88%, 02/14/25 | | | | | | | 2 | | | | 1,836 | |
Quorum Health Corp., 2020 Term Loan, 0.00%, 04/29/25 | | | | | | | 1,373 | | | | 939,316 | |
Sotera Health Holdings LLC, 2021 Term Loan, (3 mo. LIBOR + 2.75%, 0.50% Floor), 7.16%, 12/11/26 | | | | | | | 75 | | | | 68,889 | |
Surgery Center Holdings, Inc., 2021 Term Loan, (3 mo. LIBOR + 3.75%, 0.75% Floor), 8.05%, 08/31/26 | | | | | | | 27 | | | | 26,669 | |
Vizient, Inc., 2022 Term Loan B, (1 mo. SOFR CME + 2.25%, 0.50% Floor), 6.67%, 04/28/29 | | | | | | | 38 | | | | 37,725 | |
WCG Purchaser Corp., 2019 Term Loan, (1 mo. LIBOR + 4.00%, 1.00% Floor), 8.38%, 01/08/27 | | | | | | | 47 | | | | 42,952 | |
WP CityMD Bidco LLC, 2021 1st Lien Term Loan B, (1 mo. LIBOR + 3.25%, 0.50% Floor), 7.63%, 12/22/28 | | | | | | | 156 | | | | 155,327 | |
| | | | | | | | | | | | |
| | | |
| | | | | | | | | | | 6,767,166 | |
| | | |
| Health Care Services — 1.2% | | | | | | | | | |
Medical Solutions Holdings, Inc., 2021 2nd Lien Term Loan, (1 mo. LIBOR + 7.00%, 0.50% Floor), 11.38%, 11/01/29 | | | | | | | 80 | | | | 73,600 | |
Patriot Home Care, Term Loan, (1 mo. LIBOR + 6.00%), 10.38%, 05/05/28(j) | | | | | | | 2,949 | | | | 2,861,805 | |
Team Services Group, Second Lien Term Loan, (6 mo. LIBOR + 9.00%, 1.00% Floor), 13.93%, 12/18/28(j) | | | | | | | 2,265 | | | | 2,128,755 | |
| | | | | | | | | | | | |
| | | |
| | | | | | | | | | | 5,064,160 | |
| | | |
| Health Care Technology — 0.4% | | | | | | | | | |
AthenaHealth Group, Inc. | | | | | | | | | | | | |
2022 Delayed Draw Term loan, (3 mo. SOFR CME + 3.50%), 7.82%, 02/15/29 | | | | | | | 24 | | | | 26,381 | |
2022 Term Loan B, (1 mo. SOFR CME + 3.50%, 0.50% Floor), 7.82%, 02/15/29 | | | | | | | 143 | | | | 123,804 | |
GoodRx, Inc., 1st Lien Term Loan, (1 mo. LIBOR + 2.75%), 7.13%, 10/10/25 | | | | | | | 32 | | | | 31,400 | |
IQVIA, Inc., 2018 USD Term Loan B3, (3 mo. LIBOR + 1.75%), 6.48%, 06/11/25 | | | | | | | 47 | | | | 46,545 | |
Polaris Newco LLC, USD Term Loan B, (3 mo. LIBOR + 4.00%, 0.50% Floor), 8.73%, 06/02/28 | | | | | | | 129 | | | | 117,615 | |
| | | | | | | | | | | | |
| Security | | | | | Par (000) | | | Value | |
| | | |
| Health Care Technology (continued) | | | | | | | | | |
Press Ganey Holdings, Inc., 2021 Term Loan B, (1 mo. LIBOR + 3.75%, 0.75% Floor), 8.13%, 07/24/26 | | | USD | | | | 158 | | | $ | 144,585 | |
Verscend Holding Corp., 2021 2nd Lien Term Loan, (1 mo. LIBOR + 7.00%, 0.50% Floor), 11.38%, 04/02/29(j) | | | | | | | 1,309 | | | | 1,289,461 | |
| | | | | | | | | | | | |
| | | |
| | | | | | | | | | | 1,779,791 | |
| | | |
| Hotels, Restaurants & Leisure — 1.9% | | | | | | | | | |
Aimbridge Acquisition Co., Inc., 2019 Term Loan B, (1 mo. LIBOR + 3.75%), 8.13%, 02/02/26 | | | | | | | 7 | | | | 6,634 | |
Bally’s Corp., 2021 Term Loan B, (3 mo. LIBOR + 3.25%, 0.50% Floor), 7.54%, 10/02/28 | | | | | | | 64 | | | | 59,379 | |
Burger King (Restaurant Brands Int), Term Loan B4, (1 mo. LIBOR + 1.75%), 6.14%, 11/19/26 | | | | | | | 127 | | | | 124,334 | |
Caesars Resort Collection LLC | | | | | | | | | | | | |
2017 1st Lien Term Loan B, (1 mo. LIBOR + 2.75%), 7.13%, 12/23/24 | | | | | | | 7 | | | | 6,762 | |
2020 Term Loan B1, (1 mo. LIBOR + 3.50%), 7.88%, 07/21/25 | | | | | | | 117 | | | | 116,464 | |
Carnival Corp., USD Term Loan B, (1 mo. LIBOR + 3.00%, 0.75% Floor), 7.38%, 06/30/25 | | | | | | | 129 | | | | 123,555 | |
ClubCorp Holdings, Inc., 2017 Term Loan B, 09/18/24(k) | | | | | | | 965 | | | | 866,071 | |
ECL Entertainment LLC, Term Loan, (1 mo. LIBOR + 7.50%, 0.75% Floor), 11.88%, 05/01/28 | | | | | | | 66 | | | | 65,775 | |
Equinox Holdings, Inc., 2017 1st Lien Term Loan, (3 mo. LIBOR + 3.00%, 1.00% Floor), 7.73%, 03/08/24 | | | | | | | 787 | | | | 589,040 | |
Fertitta Entertainment LLC, 2022 Term Loan B, (1 mo. SOFRTE + 4.00%, 0.50% Floor), 8.32%, 01/27/29 | | | | | | | 207 | | | | 196,811 | |
Flutter Financing B.V., 2022 USD Term Loan B, (3 mo. SOFR CME + 3.25%, 0.50% Floor), 8.09%, 07/22/28 | | | | | | | 67 | | | | 66,452 | |
Four Seasons Hotels Ltd. | | | | | | | | | | | | |
2022 Term Loan B, (1 mo. SOFR CME + 3.25%, 0.50% Floor), 7.67%, 11/30/29 | | | | | | | 110 | | | | 81,969 | |
New 1st Lien Term Loan, (1 mo. LIBOR + 2.00%), 6.38%, 11/30/23 | | | | | | | 29 | | | | 28,467 | |
Hilton Worldwide Finance LLC, 2019 Term Loan B2, (1 mo. LIBOR + 1.75%), 6.17%, 06/22/26 | | | | | | | 26 | | | | 26,174 | |
IRB Holding Corp., 2020 Term Loan B, (1 mo. LIBOR + 2.75%, 1.00% Floor), 7.13%, 02/05/25 | | | | | | | 126 | | | | 125,085 | |
Oravel Stays Singapore Pte. Ltd., Term Loan B, 0.00%, 06/23/26 | | | | | | | 4,297 | | | | 3,709,615 | |
Penn National Gaming, Inc., 2022 Term Loan B, (1 mo. SOFR CME + 2.75%, 0.50% Floor), 7.17%, 05/03/29 | | | | | | | 94 | | | | 92,901 | |
Playa Resorts Holding B.V., 2022 Term Loan B, (3 mo. SOFR CME + 4.25%, 0.50% Floor), 8.58%, 01/05/29 | | | | | | | 22 | | | | 21,409 | |
Playtika Holding Corp., 2021 Term Loan, (1 mo. LIBOR + 2.75%), 7.13%, 03/13/28 | | | | | | | 52 | | | | 49,889 | |
Scientific Games International, Inc., 2022 USD Term Loan, (1 mo. SOFR CME + 3.00%, 0.50% Floor), 7.42%, 04/14/29 | | | | | | | 103 | | | | 100,838 | |
Station Casinos LLC, 2020 Term Loan B, (1 mo. LIBOR + 2.25%, 0.25% Floor), 6.64%, 02/08/27 | | | | | | | 63 | | | | 61,521 | |
| | |
| 26 | | 2 0 2 2 BLACK ROCK ANNUAL REPORT TO SHAREHOLDERS |
| | |
Consolidated Schedule of Investments (continued) December 31, 2022 | | BlackRock Credit Strategies Fund (Percentages shown are based on Net Assets) |
| | | | | | | | | | | | |
| Security | | | | | Par (000) | | | Value | |
| | | |
| Hotels, Restaurants & Leisure (continued) | | | | | | | | | |
Travelport Finance Luxembourg SARL | | | | | | | | | | | | |
2020 Super Priority Term Loan, (3 mo. LIBOR + 1.50%, 1.00% Floor, 7.25% PIK), 6.23%, 02/28/25(f) | | | USD | | | | 125 | | | $ | 130,898 | |
2021 Consented Term Loan, (3 mo. LIBOR + 5.00%), 9.73%, 05/29/26 | | | | | | | 57 | | | | 40,250 | |
Wealth Enhancement Group LLC, 2021 August Delayed Draw Term Loan, (6 mo. SOFR CME + 6.00%, 1.00% Floor), 10.48%, 10/04/27(j) | | | | | | | 1,201 | | | | 1,171,636 | |
Whatabrands LLC, 2021 Term Loan B, (1 mo. LIBOR + 3.25%, 0.50% Floor), 7.63%, 08/03/28 | | | | | | | 112 | | | | 108,494 | |
Wyndham Hotels & Resorts, Inc., Term Loan B, (1 mo. LIBOR + 1.75%), 6.13%, 05/30/25 | | | | | | | 16 | | | | 15,704 | |
| | | | | | | | | | | | |
| | | |
| | | | | | | | | 7,986,127 | |
| | | |
| Household Durables — 0.9% | | | | | | | | | |
ACProducts Holdings, Inc., 2021 Term Loan B, (6 mo. LIBOR + 4.25%, 0.50% Floor), 8.98%, 05/17/28 | | | | | | | 87 | | | | 64,420 | |
HomeRenew Buyer, Inc.(j) | | | | | | | | | | | | |
Delayed Draw Term Loan, (3 mo. LIBOR + 6.50%, 1.00% Floor), 11.54%, 11/19/27 | | | | | | | 1,310 | | | | 1,266,892 | |
Revolver, (3 mo. SOFR CME + 6.50%, 1.00% Floor), 10.92%, 11/19/27 | | | | | | | 113 | | | | 109,136 | |
Term Loan, (3 mo. LIBOR + 6.50%, 1.00% Floor), 11.54%, 11/19/27 | | | | | | | 2,138 | | | | 2,067,066 | |
Hunter Douglas, Inc., USD Term Loan B1, (3 mo. SOFR CME + 3.50%), 7.86%, 02/26/29 | | | | | | | 130 | | | | 114,284 | |
Snap One Holdings Corp., Term Loan B, (1 mo. LIBOR + 4.50%, 0.50% Floor), 8.88%, 12/08/28(j) | | | | | | | 33 | | | | 30,327 | |
Sunset Debt Merger Sub, Inc., 2021 Term Loan B, (3 mo. LIBOR + 4.00%, 0.75% Floor), 8.75%, 10/06/28 | | | | | | | 77 | | | | 63,055 | |
Weber-Stephen Products LLC, Term Loan B, (1 mo. LIBOR + 3.25%, 0.75% Floor), 7.63%, 10/30/27 | | | | | | | 172 | | | | 144,139 | |
| | | | | | | | | | | | |
| | | |
| | | | | | | | | 3,859,319 | |
| | | |
| Household Products — 0.0% | | | | | | | | | |
Spectrum Brands, Inc., 2021 Term Loan, (3 mo. LIBOR + 2.00%, 0.50% Floor), 6.74%, 03/03/28 | | | | | | | 12 | | | | 6,586 | |
| | | | | | | | | | | | |
|
| Independent Power and Renewable Electricity Producers — 0.0% | |
Calpine Construction Finance Co. LP, 2017 Term Loan B, (1 mo. LIBOR + 2.00%), 6.38%, 01/15/25 | | | | | | | 13 | | | | 12,992 | |
| | | | | | | | | | | | |
| | | |
| Industrial Conglomerates — 1.0% | | | | | | | | | |
AVSC Holding Corp. | | | | | | | | | | | | |
2020 Term Loan B1, (3 mo. LIBOR + 3.25%, 1.00% Floor, 0.25% PIK), 7.69%, 03/03/25(f) | | | | | | | 65 | | | | 59,875 | |
2020 Term Loan B3, (3 mo. LIBOR + 15.00%), 15.00%, 10/15/26 | | | | | | | 32 | | | | 33,597 | |
Diamond BC BV, 2021 Term Loan B, (3 mo. LIBOR + 2.75%, 0.50% Floor), 7.16%, 09/29/28 | | | | | | | 97 | | | | 93,341 | |
Reveal Brainspace, Term Loan, (3 mo. LIBOR + 6.00%), 6.00%, 03/10/28(j) | | | | | | | 500 | | | | 483,550 | |
Stitch Aquisition Corp., Term Loan B, (3 mo. LIBOR + 6.75%, 0.75% Floor), 11.48%, 07/28/28 | | | | | | | 118 | | | | 100,331 | |
Thermostat Purchaser III, Inc., 2nd Lien Term Loan, (3 mo. LIBOR + 7.25%, 0.75% Floor), 11.98%, 08/31/29(j) | | | | | | | 1,388 | | | | 1,290,659 | |
| | | | | | | | | | | | |
| Security | | | | | Par (000) | | | Value | |
| | | |
| Industrial Conglomerates (continued) | | | | | | | | | |
Vertical U.S. Newco, Inc., Term Loan B, (6 mo. LIBOR + 3.50%, 0.50% Floor), 6.87%, 07/30/27 | | | USD | | | | 112 | | | $ | 107,148 | |
Vertiv Group Corp., 2021 Term Loan B, (1 mo. LIBOR + 2.75%), 6.89%, 03/02/27 | | | | | | | 122 | | | | 116,702 | |
World Remit Ltd., Term Loan, (1 mo. LIBOR + 9.25%, 1.00% Floor), 14.01%, 01/27/25(j) | | | | | | | 2,000 | | | | 1,990,000 | |
| | | | | | | | | | | | |
| | | |
| | | | | | | | | | | 4,275,203 | |
| | | |
| Insurance — 3.5% | | | | | | | | | |
Alera Group Holdings, Inc.(j) | | | | | | | | | | | | |
2021 1st Lien Delayed Draw Term Loan, (1 mo. SOFRTE + 6.00%), 10.42%, 10/02/28 | | | | | | | 527 | | | | 498,755 | |
2021 Delayed Draw Term Loan, (1 mo. SOFRTE + 6.00%), 10.42%, 10/02/28 | | | | | | | 868 | | | | 820,907 | |
2021 Term Loan, (1 mo. SOFR CME + 6.00%, 0.75% Floor), 10.42%, 10/02/28 | | | | | | | 3,054 | | | | 2,888,600 | |
Alliant Holdings Intermediate LLC | | | | | | | | | | | | |
2018 Term Loan B, (1 mo. LIBOR + 3.25%), 7.63%, 05/09/25 | | | | | | | 286 | | | | 281,447 | |
2021 Term Loan B4, (1 mo. LIBOR + 3.50%, 0.50% Floor), 7.85%, 11/06/27 | | | | | | | 112 | | | | 108,825 | |
AmWINS Group, Inc., 2021 Term Loan B, (1 mo. LIBOR + 2.25%, 0.75% Floor), 6.63%, 02/19/28 | | | | | | | 128 | | | | 125,978 | |
AssuredPartners, Inc. | | | | | | | | | | | | |
2020 Term Loan B, (1 mo. LIBOR + 3.50%), 7.88%, 02/12/27 | | | | | | | 91 | | | | 87,783 | |
2021 Term Loan B, (1 mo. LIBOR + 3.50%, 0.50% Floor), 7.88%, 02/12/27 | | | | | | | 40 | | | | 38,790 | |
Higginbotham Insurance Agency, Inc., 2021 1st Amendment Term Loan, (1 mo. LIBOR + 5.25%, 0.75% Floor), 9.63%, 11/25/26(j) | | | | | | | 2,464 | | | | 2,444,521 | |
Hub International Ltd. | | | | | | | | | | | | |
2021 Term Loan B, (3 mo. LIBOR + 3.25%, 0.75% Floor), 7.53%, 04/25/25 | | | | | | | 204 | | | | 201,542 | |
2022 Term Loan B, (3 mo. SOFR CME + 4.00%, 0.75% Floor), 8.22%, 11/10/29 | | | | | | | 38 | | | | 37,546 | |
Integrity Marketing Acquisition LLC(j) | | | | | | | | | | | | |
2020 3rd Amendment Delayed Draw Term Loan, (3 mo. LIBOR + 6.05%, 0.75% Floor), 10.33%, 08/27/25 | | | | | | | 1,305 | | | | 1,279,338 | |
2021 4th Amendment Delayed Draw Term Loan, (3 mo. LIBOR + 6.05%, 1.00% Floor), 10.77%, 08/27/25 | | | | | | | 658 | | | | 644,958 | |
2021 6th Amendment Delayed Draw Term Loan, (3 mo. LIBOR + 6.05%, 0.75% Floor), 10.81%, 08/27/25 | | | | | | | 990 | | | | 970,547 | |
2021 8th Amendment Delayed Draw Term Loan, (3 mo. LIBOR + 6.02%, 0.75% Floor), 10.43%, 08/27/25 | | | | | | | 845 | | | | 828,195 | |
Peter C. Foy & Associates Insurance Services LLC(j) | | | | | | | | | | | | |
2021 First Lien Delayed Draw Term loan, (1 mo. LIBOR + 6.00%, 0.75% Floor), 11.21%, 11/01/28 | | | | | | | 590 | | | | 561,360 | |
2021 First Lien Term Loan, (1 mo. LIBOR + 6.00%, 0.75% Floor), 11.21%, 11/01/28 | | | | | | | 2,125 | | | | 2,020,894 | |
2022 1st Amendment Delayed Draw Term loan B, (1 mo. SOFRTE + 6.00%, 0.75% Floor), 11.12%, 11/01/28 | | | | | | | 1,150 | | | | 1,098,087 | |
| | |
CONSOLIDATED SCHEDULE OF INVESTMENTS | | 27 |
| | |
Consolidated Schedule of Investments (continued) December 31, 2022 | | BlackRock Credit Strategies Fund (Percentages shown are based on Net Assets) |
| | | | | | | | | | | | |
| Security | | | | | Par
(000) | | | Value | |
| | | |
| Insurance (continued) | | | | | | | | | |
Ryan Specialty Group LLC, Term Loan, (1 mo. SOFR CME + 3.00%, 0.75% Floor), 7.42%, 09/01/27 | | | USD | | | | 135 | | | $ | 133,801 | |
Sedgwick Claims Management Services, Inc. | | | | | | | | | | | | |
2019 Term Loan B, (1 mo. LIBOR + 3.75%), 8.13%, 09/03/26 | | | | | | | 72 | | | | 70,899 | |
2020 Term Loan B3, (1 mo. LIBOR + 4.25%, 1.00% Floor), 8.63%, 09/03/26 | | | | | | | 23 | | | | 22,593 | |
| | | | | | | | | | | | |
| | | |
| | | | | | | | | | | 15,165,366 | |
| | | |
| Interactive Media & Services — 0.1% | | | | | | | | | |
Adevinta ASA, USD Term Loan B, (3 mo. LIBOR + 2.75%, 0.75% Floor), 7.48%, 06/26/28 | | | | | | | 47 | | | | 46,730 | |
Camelot U.S. Acquisition LLC, 2020 Incremental Term Loan B, (1 mo. LIBOR + 3.00%, 1.00% Floor), 7.38%, 10/30/26 | | | | | | | 93 | | | | 91,482 | |
Grab Holdings, Inc., Term Loan B, (1 mo. LIBOR + 4.50%, 1.00% Floor), 8.89%, 01/29/26 | | | | | | | 101 | | | | 99,171 | |
Research Now Group, Inc., 2017 2nd Lien Term Loan, (6 mo. LIBOR + 9.50%, 1.00% Floor), 12.84%, 12/20/25 | | | | | | | 500 | | | | 320,000 | |
| | | | | | | | | | | | |
| | | |
| | | | | | | | | | | 557,383 | |
| | | |
| Internet & Direct Marketing Retail — 0.4% | | | | | | | | | |
CNT Holdings I Corp., 2020 Term Loan, (3 mo. SOFR CME + 3.50%, 0.75% Floor), 7.24%, 11/08/27 | | | | | | | 79 | | | | 76,542 | |
Go Daddy Operating Co. LLC, 2022 Term Loan B5, (1 mo. SOFR CME + 3.25%), 7.57%, 10/21/29 | | | | | | | 70 | | | | 69,815 | |
PUG LLC, 2021 Incremental Term Loan B, (1 mo. LIBOR + 4.25%, 0.50% Floor), 8.63%, 02/12/27(j) | | | | | | | 31 | | | | 25,255 | |
Syndigo LLC, 2020 2nd Lien Term Loan, (6 mo. LIBOR + 8.00%, 0.75% Floor), 13.21%, 12/15/28(j) | | | | | | | 2,000 | | | | 1,540,000 | |
| | | | | | | | | | | | |
| | | |
| | | | | | | | | | | 1,711,612 | |
| | | |
| Internet Software & Services — 0.0% | | | | | | | | | |
Uber Technologies, Inc., 2021 Term Loan B, (3 mo. LIBOR + 3.50%), 8.23%, 02/25/27 | | | | | | | 157 | | | | 156,287 | |
| | | | | | | | | | | | |
| | | |
| IT Services — 4.9% | | | | | | | | | |
Acquia, Inc.(j) | | | | | | | | | | | | |
Revolver, (3 mo. LIBOR + 7.00%, 1.00% Floor), 12.16%, 10/31/25 | | | | | | | 21 | | | | 21,139 | |
Term Loan, (3 mo. LIBOR + 7.00%, 1.00% Floor), 10.74%, 10/31/25 | | | | | | | 481 | | | | 480,902 | |
Alphasense, Inc., 2022 Term Loan, (1 mo. SOFR CME + 7.00%, 1.00% Floor), 11.44%, 03/11/27(j) | | | | | | | 500 | | | | 495,500 | |
Aruba Investments Holdings LLC | | | | | | | | | | | | |
2020 2nd Lien Term Loan, (1 mo. LIBOR + 7.75%, 0.75% Floor), 12.14%, 11/24/28 | | | | | | | 45 | | | | 40,725 | |
2020 USD Term Loan, (1 mo. LIBOR + 3.75%, 0.75% Floor), 8.14%, 11/24/27 | | | | | | | 19 | | | | 18,093 | |
Astra Acquisition Corp., 2021 2nd Lien Term Loan, (1 mo. LIBOR + 8.88%, 0.75% Floor), 13.26%, 10/25/29(j) | | | | | | | 4,702 | | | | 4,185,036 | |
Boxer Parent Co., Inc., 2021 USD Term Loan, (1 mo. LIBOR + 3.75%), 8.13%, 10/02/25 | | | | | | | 95 | | | | 91,304 | |
Bullhorn, Inc., 2020 Term Loan, (3 mo. LIBOR + 5.75%, 1.00% Floor), 10.48%, 09/30/26(j) | | | | | | | 2,411 | | | | 2,333,176 | |
Camelot Finance SA, Term Loan B, (1 mo. LIBOR + 3.00%), 7.38%, 10/30/26 | | | | | | | 108 | | | | 105,926 | |
CCC Intelligent Solutions, Inc., Term Loan, (1 mo. LIBOR + 2.25%, 0.50% Floor), 6.63%, 09/21/28 | | | | | | | 79 | | | | 78,110 | |
| | | | | | | | | | | | |
| Security | | | | | Par
(000) | | | Value | |
| | | |
| IT Services (continued) | | | | | | | | | |
CoreLogic, Inc. | | | | | | | | | | | | |
2nd Lien Term Loan, (1 mo. LIBOR + 6.50%, 0.50% Floor), 10.94%, 06/04/29 | | | USD | | | | 229 | | | $ | 160,261 | |
Term Loan, (1 mo. LIBOR + 3.50%, 0.50% Floor), 7.94%, 06/02/28 | | | | | | | 667 | | | | 554,098 | |
Edifecs, Inc.(j) | | | | | | | | | | | | |
2021 1st Amendment Term Loan, (3 mo. LIBOR + 7.50%, 0.75% Floor), 10.23%, 09/21/26 | | | | | | | 377 | | | | 361,743 | |
2021 2nd Amendment Term Loan, (3 mo. LIBOR + 5.50%, 0.75% Floor), 10.23%, 09/21/26 | | | | | | | 1,554 | | | | 1,490,022 | |
Tranche B Term Loan, (3 mo. LIBOR + 7.50%, 1.00% Floor), 12.23%, 09/21/26 | | | | | | | 1,035 | | | | 1,045,745 | |
Ensono LP, 2021 2nd Lien Term Loan, (3 mo. LIBOR + 8.00%), 13.15%, 05/25/29(j) | | | | | | | 3,000 | | | | 2,775,000 | |
Finalsite, Term Loan, (3 mo. SOFR CME + 6.25%), 10.74%, 09/15/29(j) | | | | | | | 231 | | | | 225,932 | |
Genesys Cloud Services Holdings II LLC, 2020 USD Term Loan B4, (1 mo. LIBOR + 4.00%, 0.75% Floor), 8.38%, 12/01/27 | | | | | | | 241 | | | | 230,947 | |
Grey Orange Interrnational, Inc.(j) | | | | | | | | | | | | |
Delayed Draw Term Loan, (3 mo. LIBOR + 7.25%), 8.25%, 05/01/25 | | | | | | | 150 | | | | 149,100 | |
Term Loan, (3 mo. LIBOR + 7.25%), 12.23%, 05/01/25 | | | | | | | 250 | | | | 248,500 | |
Hyphen Solutions LLC(j) | | | | | | | | | | | | |
2021 Term Loan, (1 mo. LIBOR + 5.50%, 1.00% Floor), 9.88%, 10/27/26 | | | | | | | 1,492 | | | | 1,446,160 | |
Term Loan, (1 mo. LIBOR + 5.50%, 1.00% Floor), 9.88%, 10/27/26 | | | | | | | 1,478 | | | | 1,431,806 | |
Madison Logic Holdings, Inc., Term Loan, (3 mo. SOFR CME + 7.00%, 1.00% Floor), 11.58%, 12/30/27 | | | | | | | 89 | | | | 86,007 | |
PUG LLC, USD Term Loan, (1 mo. LIBOR + 3.50%), 7.88%, 02/12/27 | | | | | | | 103 | | | | 84,683 | |
Smarsh, Inc.(j) | | | | | | | | | | | | |
2022 Delayed Draw Term loan, (3 mo. SOFRTE + 6.50%, 0.75% Floor), 11.29%, 02/16/29 | | | | | | | 190 | | | | 181,904 | |
2022 Term Loan, (3 mo. SOFRTE + 6.50%, 0.75% Floor), 11.29%, 02/16/29 | | | | | | | 1,524 | | | | 1,455,238 | |
Sophia LP, 2020 2nd Lien Term Loan, (3 mo. LIBOR + 8.00%, 1.00% Floor), 12.73%, 10/09/28 | | | | | | | 1,000 | | | | 992,500 | |
Trans Union LLC, 2021 Term Loan B6, (1 mo. LIBOR + 2.25%, 0.50% Floor), 6.63%, 12/01/28 | | | | | | | 175 | | | | 172,756 | |
Virtusa Corp., First Lien Term Loan B, (1 mo. LIBOR + 3.75%, 0.75% Floor), 8.13%, 02/11/28 | | | | | | | 23 | | | | 22,696 | |
WEX, Inc., 2021 Term Loan, (1 mo. LIBOR + 2.25%), 6.63%, 03/31/28 | | | | | | | 23 | | | | 22,431 | |
ZoomInfo LLC, 2021 Term Loan B, (1 mo. SOFR CME + 3.00%), 7.48%, 02/02/26 | | | | | | | 17 | | | | 16,920 | |
| | | | | | | | | | | | |
| | | |
| | | | | | | | | | | 21,004,360 | |
| | | |
| Leisure Products — 1.1% | | | | | | | | | |
Delivery Hero SE, USD Term Loan B, (3 mo. SOFR CME + 5.75%, 0.50% Floor), 10.01%, 08/12/27 | | | | | | | 4,788 | | | | 4,552,544 | |
Fender Musical Instruments Corp., 2021 Term Loan B, (3 mo. SOFRTE + 4.00%, 0.50% Floor), 8.42%, 12/01/28(j) | | | | | | | 64 | | | | 51,715 | |
Peloton Interactive, Inc., Term Loan, (2 mo. SOFR CME + 6.50%, 0.50% Floor), 11.76%, 05/25/27 | | | | | | | 49 | | | | 47,820 | |
| | | | | | | | | | | | |
| | | |
| | | | | | | | | | | 4,652,079 | |
| | |
| 28 | | 2 0 2 2 BLACK ROCK ANNUAL REPORT TO SHAREHOLDERS |
| | |
Consolidated Schedule of Investments (continued) December 31, 2022 | | BlackRock Credit Strategies Fund (Percentages shown are based on Net Assets) |
| | | | | | | | | | | | |
| Security | | | | | Par (000) | | | Value | |
| | | |
| Life Sciences Tools & Services — 0.1% | | | | | | | | | |
Avantor Funding, Inc., 2021 Term Loan B5, (1 mo. LIBOR + 2.25%, 0.50% Floor), 6.63%, 11/08/27 | | | USD | | | | 98 | | | $ | 97,433 | |
eResearchTechnology, Inc., 2020 1st Lien Term Loan, (1 mo. LIBOR + 4.50%, 1.00% Floor), 8.88%, 02/04/27 | | | | | | | 129 | | | | 113,665 | |
ICON Luxembourg SARL, LUX Term Loan, (3 mo. LIBOR + 2.25%, 0.50% Floor), 7.00%, 07/03/28 | | | | | | | 115 | | | | 114,158 | |
Maravai Intermediate Holdings LLC, 2022 Term Loan B, (3 mo. SOFRTE + 3.00%, 0.50% Floor), 6.96%, 10/19/27 | | | | | | | 78 | | | | 76,483 | |
Parexel International Corp., 2021 1st Lien Term Loan, (1 mo. LIBOR + 3.25%, 0.50% Floor), 7.63%, 11/15/28 | | | | | | | 173 | | | | 166,873 | |
PRA Health Sciences, Inc., US Term Loan, (3 mo. LIBOR + 2.25%, 0.50% Floor), 7.00%, 07/03/28 | | | | | | | 29 | | | | 28,662 | |
| | | | | | | | | | | | |
| | | |
| | | | | | | | | | | 597,274 | |
| | | |
| Machinery — 0.4% | | | | | | | | | |
Albion Acquisitions Ltd., USD Term Loan, (3 mo. LIBOR + 5.25%, 0.50% Floor), 9.57%, 08/17/26 | | | | | | | 64 | | | | 60,205 | |
Columbus McKinnon Corp., 2021 Term Loan B, (3 mo. LIBOR + 2.75%, 0.50% Floor), 7.50%, 05/14/28 | | | | | | | 31 | | | | 30,172 | |
Filtration Group Corp., 2021 Incremental Term Loan, (1 mo. LIBOR + 3.50%, 0.50% Floor), 7.88%, 10/21/28 | | | | | | | 141 | | | | 137,973 | |
Fluidra SA, 2022 USD Term Loan B, (1 mo. SOFR CME + 2.00%), 6.42%, 01/29/29 | | | | | | | 127 | | | | 120,099 | |
Gardner Denver, Inc., 2020 USD Term Loan B2, (1 mo. SOFR CME + 1.75%), 6.17%, 03/01/27 | | | | | | | 64 | | | | 63,944 | |
Ingersoll-Rand Services Co., 2020 USD Spinco Term Loan, (1 mo. SOFR CME + 1.75%), 6.17%, 03/01/27. | | | | | | | 94 | | | | 93,011 | |
Madison IAQ LLC, Term Loan, (3 mo. LIBOR + 3.25%, 0.50% Floor), 7.99%, 06/21/28 | | | | | | | 194 | | | | 179,838 | |
RSC Acquisition, Inc., 2020 Incremental Term Loan, (3 mo. SOFR CME + 5.50%, 1.00% Floor), 9.86%, 10/30/26(j) | | | | | | | 806 | | | | 780,232 | |
SPX Flow, Inc., 2022 Term Loan, (1 mo. SOFR CME + 4.50%, 0.50% Floor), 8.92%, 04/05/29 | | | | | | | 98 | | | | 91,398 | |
Titan Acquisition Ltd., 2018 Term Loan B, (6 mo. LIBOR + 3.00%), 8.15%, 03/28/25 | | | | | | | 180 | | | | 167,652 | |
| | | | | | | | | | | | |
| | | |
| | | | | | | | | | | 1,724,524 | |
| | | |
| Media — 1.0% | | | | | | | | | |
Altice Financing SA | | | | | | | | | | | | |
2017 USD Term Loan B, (3 mo. LIBOR + 2.75%), 6.83%, 07/15/25 | | | | | | | 7 | | | | 6,504 | |
USD 2017 1st Lien Term Loan, (3 mo. LIBOR + 2.75%), 6.83%, 01/31/26 | | | | | | | 81 | | | | 77,971 | |
Altice France SA/France, 2018 Term Loan B13, (3 mo. LIBOR + 4.00%), 8.65%, 08/14/26 | | | | | | | 81 | | | | 75,308 | |
AMC Entertainment Holdings, Inc., 2019 Term Loan B, (1 mo. LIBOR + 3.00%), 7.27%, 04/22/26 | | | | | | | 100 | | | | 53,794 | |
Cable One, Inc., 2021 Term Loan B4, (1 mo. LIBOR + 2.00%), 6.38%, 05/03/28 | | | | | | | 62 | | | | 60,461 | |
Charter Communications Operating LLC, Class A, 2019 Term Loan B1, (1 mo. LIBOR + 1.75%), 6.14%, 04/30/25 | | | | | | | — | (l) | | | 447 | |
City Football Group Ltd., Term Loan, (1 mo. LIBOR + 3.00%, 0.50% Floor), 7.36%, 07/21/28 | | | | | | | 79 | | | | 73,650 | |
Clear Channel Outdoor Holdings, Inc., Term Loan B, (3 mo. LIBOR + 3.50%), 7.91%, 08/21/26 | | | | | | | 202 | | | | 183,852 | |
| | | | | | | | | | | | |
| Security | | | | | Par (000) | | | Value | |
| | | |
| Media (continued) | | | | | | | | | |
CMG Media Corp., 2021 Term Loan, (3 mo. LIBOR + 3.50%), 8.23%, 12/17/26 | | | USD | | | | — | (l) | | $ | 78 | |
Connect Finco SARL, 2021 Term Loan B, (1 mo. LIBOR + 3.50%, 1.00% Floor), 7.89%, 12/11/26 | | | | | | | 209 | | | | 205,958 | |
E.W. Scripps Co., 2020 Term Loan B3, (1 mo. LIBOR + 2.75%, 0.75% Floor), 7.13%, 01/07/28 | | | | | | | 17 | | | | 16,954 | |
Learfield Communications LLC, 2016 1st Lien Term Loan, (1 mo. LIBOR + 3.25%, 1.00% Floor), 7.64%, 12/01/23 | | | | | | | 66 | | | | 48,776 | |
Lions Gate Capital Holdings LLC, 2018 Term Loan B, (1 mo. LIBOR + 2.25%), 6.63%, 03/24/25 | | | | | | | 79 | | | | 75,358 | |
Live Nation Entertainment, Inc., Term Loan B4, (1 mo. LIBOR + 1.75%), 6.13%, 10/17/26 | | | | | | | 160 | | | | 155,519 | |
MH Sub I LLC | | | | | | | | | | | | |
2017 1st Lien Term Loan, (1 mo. LIBOR + 3.75%), 8.13%, 09/13/24 | | | | | | | 125 | | | | 120,962 | |
2020 Incremental Term Loan, (1 mo. LIBOR + 3.75%, 1.00% Floor), 8.13%, 09/13/24 | | | | | | | 176 | | | | 171,012 | |
2021 2nd Lien Term Loan, (3 mo. SOFR CME + 6.25%), 10.65%, 02/23/29 | | | | | | | 98 | | | | 87,044 | |
NEP/NCP Holdco, Inc., 2018 2nd Lien Term Loan, (1 mo. LIBOR + 7.00%), 11.38%, 10/19/26 | | | | | | | 141 | | | | 102,539 | |
Sinclair Television Group, Inc., 2021 Term Loan B3, (1 mo. LIBOR + 3.00%), 7.39%, 04/01/28 | | | | | | | 11 | | | | 9,957 | |
Suited Connector LLC(j) | | | | | | | | | | | | |
Revolver, (3 mo. LIBOR + 6.00%), 11.20%, 12/01/27 . | | | | | | | 360 | | | | 288,928 | |
Term Loan, (3 mo. LIBOR + 6.00%, 1.00% Floor), 10.92%, 12/01/27 | | | | | | | 2,213 | | | | 1,774,743 | |
UFC Holdings LLC, 2021 Term Loan B, (3 mo. LIBOR + 2.75%, 0.75% Floor), 7.11%, 04/29/26 | | | | | | | 44 | | | | 43,441 | |
UPC Financing Partnership, 2021 USD Term Loan AX, (1 mo. LIBOR + 2.93%), 7.24%, 01/31/29 | | | | | | | 63 | | | | 61,678 | |
Virgin Media Bristol LLC, 2020 USD Term Loan Q, (1 mo. LIBOR + 3.25%), 7.57%, 01/31/29 | | | | | | | 78 | | | | 77,161 | |
Voyage Digital Ltd., USD Term Loan B, (3 mo. SOFRTE + 4.50%, 0.50% Floor), 8.78%, 05/11/29(j) | | | | | | | 47 | | | | 46,155 | |
William Morris Endeavor Entertainment LLC, 2018 1st Lien Term Loan, (1 mo. LIBOR + 2.75%), 7.14%, 05/18/25 | | | | | | | 161 | | | | 157,678 | |
WMG Acquisition Corp., 2021 Term Loan G, (1 mo. LIBOR + 2.13%), 6.51%, 01/20/28 | | | | | | | 139 | | | | 136,709 | |
Zayo Group Holdings, Inc., USD Term Loan, (1 mo. LIBOR + 3.00%), 7.38%, 03/09/27 | | | | | | | 251 | | | | 202,771 | |
| | | | | | | | | | | | |
| | | |
| | | | | | | | | | | 4,315,408 | |
| | | |
| Multiline Retail — 0.3% | | | | | | | | | |
LSF9 Atlantis Holdings LLC, 2022 Term Loan B, (3 mo. SOFR CME + 7.25%, 0.75% Floor), 11.83%, 03/31/29 | | | | | | | 1,193 | | | | 1,156,836 | |
| | | | | | | | | | | | |
| | | |
| Oil, Gas & Consumable Fuels — 0.1% | | | | | | | | | |
Ascent Resources Utica Holdings LLC, 2020 Fixed 2nd Lien Term Loan, (3 mo. LIBOR + 9.00%, 1.00% Floor), 12.94%, 11/01/25 | | | | | | | 62 | | | | 65,348 | |
Edgewater Generation LLC, Term Loan, (1 mo. LIBOR + 3.75%), 8.13%, 12/13/25 | | | | | | | 18 | | | | 17,433 | |
Lealand Finance Co. BV | | | | | | | | | | | | |
2020 Make Whole Term Loan, (1 mo. LIBOR + 3.00%), 7.38%, 06/28/24 | | | | | | | 1 | | | | 512 | |
2020 Take Back Term Loan, (1 mo. LIBOR + 1.00%, 3.00% PIK), 8.38%, 06/30/25(f) | | | | | | | 5 | | | | 2,738 | |
| | |
CONSOLIDATED SCHEDULE OF INVESTMENTS | | 29 |
| | |
Consolidated Schedule of Investments (continued) December 31, 2022 | | BlackRock Credit Strategies Fund (Percentages shown are based on Net Assets) |
| | | | | | | | | | | | |
| Security | | | | | Par
(000) | | | Value | |
| | | |
| Oil, Gas & Consumable Fuels (continued) | | | | | | | | | |
M6 ETX Holdings II Midco LLC, Term Loan B, (3 mo. SOFR CME + 4.50%, 0.50% Floor), 9.16%, 09/19/29 | | | USD | | | | 11 | | | $ | 10,962 | |
Medallion Midland Acquisition LLC, 2021 Term Loan, (3 mo. SOFR CME + 3.75%, 0.75% Floor), 8.59%, 10/18/28 | | | | | | | 95 | | | | 93,819 | |
Oryx Midstream Services Permian Basin LLC, Term Loan B, (3 mo. LIBOR + 3.25%, 0.50% Floor), 7.92%, 10/05/28 | | | | | | | 126 | | | | 124,042 | |
| | | | | | | | | | | | |
| | | |
| | | | | | | | | | | 314,854 | |
| | | |
| Personal Products — 0.4% | | | | | | | | | |
Kronos Acquisition Holdings, Inc., 2021 1st Lien Term Loan, (3 mo. SOFRTE + 6.00%, 1.00% Floor), 10.51%, 12/22/26 | | | | | | | 82 | | | | 79,089 | |
Sunshine Luxembourg VII SARL, 2021 Term Loan B3, (3 mo. LIBOR + 3.75%, 0.75% Floor), 8.48%, 10/01/26 | | | | | | | 402 | | | | 384,378 | |
Supergoop LLC, Term Loan, (1 mo. LIBOR + 5.75%, 0.75% Floor), 10.13%, 12/22/28(j) | | | | | | | 1,188 | | | | 1,146,776 | |
| | | | | | | | | | | | |
| | | |
| | | | | | | | | | | 1,610,243 | |
| | | |
| Pharmaceuticals — 0.2% | | | | | | | | | |
Amneal Pharmaceuticals LLC, 2018 Term Loan B, (3 mo. LIBOR + 3.50%), 8.09%, 05/04/25 | | | | | | | 66 | | | | 58,843 | |
Bausch Health Cos., Inc., 2022 Term Loan B, (1 mo. SOFR CME + 5.25%, 0.50% Floor), 9.67%, 02/01/27 | | | | | | | 62 | | | | 46,953 | |
Catalent Pharma Solutions, Inc., 2021 Term Loan B3, (1 mo. LIBOR + 2.00%, 0.50% Floor), 6.38%, 02/22/28 | | | | | | | 156 | | | | 152,893 | |
Elanco Animal Health, Inc., Term Loan B, (1 mo. LIBOR + 1.75%), 5.87%, 08/01/27 | | | | | | | 123 | | | | 118,090 | |
Jazz Financing Lux SARL, USD Term Loan, (1 mo. LIBOR + 3.50%, 0.50% Floor), 7.88%, 05/05/28 | | | | | | | 113 | | | | 112,242 | |
Option Care Health, Inc., 2021 Term Loan B, (1 mo. LIBOR + 2.75%, 0.50% Floor), 7.13%, 10/27/28 | | | | | | | 64 | | | | 63,404 | |
Organon & Co., USD Term Loan, (3 mo. LIBOR + 3.00%, 0.50% Floor), 7.75%, 06/02/28 | | | | | | | 80 | | | | 79,151 | |
Precision Medicine Group LLC, 2021 Term Loan, (3 mo. LIBOR + 3.00%, 0.75% Floor), 7.73%, 11/18/27(j) | | | | | | | 114 | | | | 115,859 | |
| | | | | | | | | | | | |
| | | |
| | | | | | | | | | | 747,435 | |
| | | |
| Professional Services — 1.6% | | | | | | | | | |
Accordion Partners LLC(j) | | | | | | | | | | | | |
Delayed Draw Term Loan, 08/29/29(k) | | | | | | | 19 | | | | 34,160 | |
Revolver, 08/29/28(k) | | | | | | | 15 | | | | 14,996 | |
Term Loan, (3 mo. LIBOR + 6.25%), 10.83%, 08/29/29 | | | | | | | 177 | | | | 171,709 | |
Backoffice Associates Holdings LLC(j) | | | | | | | | | | | | |
Revolver, (3 mo. LIBOR + 6.75%, 1.00% Floor), 11.48%, 04/30/26 | | | | | | | 228 | | | | 221,425 | |
Term Loan, (3 mo. SOFR CME + 7.75%, 1.00% Floor), 12.00%, 04/30/26 | | | | | | | 2,112 | | | | 2,111,469 | |
DTI Holdco, Inc., 2022 2nd Lien Term Loan, (3 mo. SOFR CME + 7.75%, 0.75% Floor), 11.84%, 04/26/30 | | | | | | | 4,000 | | | | 3,663,332 | |
Dun & Bradstreet Corp. | | | | | | | | | | | | |
2022 Incremental Term Loan B2, (1 mo. SOFR CME + 3.25%), 7.57%, 01/18/29 | | | | | | | 66 | | | | 64,318 | |
| | | | | | | | | | | | |
| Security | | | | | Par
(000) | | | Value | |
| | | |
| Professional Services (continued) | | | | | | | | | |
Dun & Bradstreet Corp. (continued) | | | | | | | | | | | | |
Term Loan, (1 mo. LIBOR + 3.25%), 7.64%, 02/06/26 | | | USD | | | | 242 | | | $ | 239,767 | |
Element Materials Technology Group U.S. Holdings, Inc. | | | | | | | | | | | | |
2022 USD Delayed Draw Term Loan, (3 mo. SOFR CME + 4.25%, 0.50% Floor), 8.93%, 07/06/29 | | | | | | | 36 | | | | 34,804 | |
2022 USD Term Loan, (3 mo. SOFR CME + 4.25%, 0.50% Floor), 8.93%, 07/06/29 | | | | | | | 77 | | | | 75,409 | |
Galaxy U.S. Opco, Inc., Term Loan, (1 mo. SOFR CME + 4.75%, 0.50% Floor), 9.07%, 04/29/29 | | | | | | | 82 | | | | 73,752 | |
| | | | | | | | | | | | |
| | | |
| | | | | | | | | | | 6,705,141 | |
|
| Real Estate Management & Development — 1.2% | |
2-10 HBW, Term Loan, (1 mo. LIBOR + 6.00%, 0.75% Floor), 10.19%, 03/25/27(j) | | | | | | | 2,148 | | | | 2,126,512 | |
Chariot Buyer LLC, Term Loan B, (1 mo. LIBOR + 3.25%, 0.50% Floor), 7.63%, 11/03/28 | | | | | | | 148 | | | | 139,698 | |
Cushman & Wakefield U.S. Borrower LLC, 2020 Term Loan B, (1 mo. LIBOR + 2.75%), 7.13%, 08/21/25 | | | | | | | 142 | | | | 138,647 | |
SitusAMC Holdings Corp., 2021 1st Lien Term Loan, (3 mo. LIBOR + 5.50%, 0.75% Floor), 10.23%, 12/22/27(j) | | | | | | | 2,978 | | | | 2,831,602 | |
| | | | | | | | | | | | |
| | | |
| | | | | | | | | | | 5,236,459 | |
| | | |
| Road & Rail — 0.0% | | | | | | | | | |
Avis Budget Car Rental LLC, 2020 Term Loan B, (1 mo. LIBOR + 1.75%), 6.14%, 08/06/27 | | | | | | | 66 | | | | 63,944 | |
Genesee & Wyoming, Inc., Term Loan, (3 mo. LIBOR + 2.00%), 6.73%, 12/30/26 | | | | | | | 31 | | | | 30,995 | |
SIRVA Worldwide, Inc., 2018 1st Lien Term Loan, (1 mo. LIBOR + 5.50%), 9.57%, 08/04/25 | | | | | | | 28 | | | | 24,438 | |
| | | | | | | | | | | | |
| | | |
| | | | | | | | | | | 119,377 | |
|
| Semiconductors & Semiconductor Equipment — 0.0% | |
MKS Instruments, Inc., 2022 USD Term Loan B, 08/17/29(k) | | | | | | | 45 | | | | 44,270 | |
ON Semiconductor Corp., 2019 Term Loan B, (1 mo. LIBOR + 2.00%), 6.42%, 09/19/26 | | | | | | | 7 | | | | 7,294 | |
| | | | | | | | | | | | |
| | | |
| | | | | | | | | | | 51,564 | |
| | | |
| Software — 7.5% | | | | | | | | | |
Anaconda, Inc., Term Loan, (3 mo. LIBOR + 7.50%), 11.86%, 07/27/27(j) | | | | | | | 100 | | | | 98,600 | |
Applied Systems, Inc. | | | | | | | | | | | | |
2021 2nd Lien Term Loan, (3 mo. SOFR CME + 6.75%, 0.75% Floor), 11.33%, 09/19/25 | | | | | | | 27 | | | | 26,272 | |
2022 Extended 1st Lien Term Loan, (3 mo. SOFR CME + 4.50%, 0.50% Floor), 9.08%, 09/18/26 | | | | | | | 17 | | | | 10,186 | |
Barracuda Networks, Inc., 2022 Term Loan, (3 mo. SOFR CME + 4.50%, 0.50% Floor), 8.59%, 08/15/29 | | | | | | | 98 | | | | 94,339 | |
Bluefin Holding LLC, Term Loan, (1 mo. LIBOR + 5.75%, 1.00% Floor), 10.13%, 09/04/26(j) | | | | | | | 294 | | | | 290,159 | |
Bullhorn, Inc., 2020 Revolver, (3 mo. LIBOR + 5.75%, 1.00% Floor), 10.48%, 09/30/26(j) | | | | | | | 62 | | | | 57,692 | |
Central Parent, Inc., 2022 USD Term Loan B, (3 mo. SOFR CME + 4.50%, 0.50% Floor), 9.08%, 07/06/29 | | | | | | | 61 | | | | 60,376 | |
| | |
| 30 | | 2 0 2 2 BLACK ROCK ANNUAL REPORT TO SHAREHOLDERS |
| | |
Consolidated Schedule of Investments (continued) December 31, 2022 | | BlackRock Credit Strategies Fund (Percentages shown are based on Net Assets) |
| | | | | | | | | | | | |
| Security | | | | | Par
(000) | | | Value | |
| | | |
| Software (continued) | | | | | | | | | |
Cloudera, Inc. | | | | | | | | | | | | |
2021 Second Lien Term Loan, (1 mo. LIBOR + 6.00%, 0.50% Floor), 10.38%, 10/08/29 | | | USD | | | | 51 | | | $ | 42,415 | |
2021 Term Loan, (1 mo. LIBOR + 3.75%, 0.50% Floor), 8.13%, 10/08/28 | | | | | | | 114 | | | | 107,001 | |
Cornerstone OnDemand, Inc., 2021 Term Loan, (1 mo. LIBOR + 3.75%, 0.50% Floor), 8.13%, 10/16/28 | | | | | | | 66 | | | | 58,699 | |
Cybergrants Holdings LLC(j) | | | | | | | | | | | | |
Revolver, (3 mo. LIBOR + 6.25%, 0.75% Floor), 4.48%, 09/08/27 | | | | | | | 72 | | | | 70,098 | |
Term Loan, (3 mo. LIBOR + 6.25%, 0.75% Floor), 10.98%, 09/08/27 | | | | | | | 3,105 | | | | 3,009,362 | |
Digicel International Finance Ltd., 2017 Term Loan B, (1 mo. LIBOR + 3.25%), 7.63%, 05/28/24 | | | | | | | 71 | | | | 59,050 | |
Elastic Path Software, Inc., Term Loan, (3 mo. SOFR CME + 7.50%), 11.37%, 01/05/26(j) | | | | | | | 1,343 | | | | 1,320,345 | |
Epicor Software Corp. | | | | | | | | | | | | |
2020 2nd Lien Term Loan, (1 mo. LIBOR + 7.75%, 1.00% Floor), 12.13%, 07/31/28 | | | | | | | 31 | | | | 30,845 | |
2020 Term Loan, (1 mo. LIBOR + 3.25%, 0.75% Floor), 7.63%, 07/30/27 | | | | | | | 143 | | | | 137,350 | |
Fusion Risk Management, Inc., Term Loan, (3 mo. SOFR CME + 6.50%, 1.00% Floor), 11.40%, 08/30/28(j) | | | | | | | 181 | | | | 174,910 | |
Helios Software Holdings, Inc., 2021 USD Term Loan B, (3 mo. SOFR CME + 3.75%), 8.48%, 03/11/28 | | | | | | | 50 | | | | 48,539 | |
Informatica LLC, 2021 USD Term Loan B, (1 mo. LIBOR + 2.75%), 7.19%, 10/27/28 | | | | | | | 173 | | | | 169,183 | |
Inmoment, Inc., Term Loan, (3 mo. SOFR CME + 5.00%, 0.75% Floor, 2.50% PIK), 9.08%, 06/08/28(f)(j) | | | | | | | 4,030 | | | | 3,936,204 | |
Instructure Holdings, Inc., 2021 Term Loan B, (3 mo. LIBOR + 2.75%, 0.50% Floor), 6.12%, 10/30/28(j) | | | | | | | 16 | | | | 15,436 | |
IPS Corp. | | | | | | | | | | | | |
2021 2nd Lien Term Loan B, (1 mo. LIBOR + 3.50%, 0.50% Floor), 11.36%, 10/01/29(j) | | | | | | | 115 | | | | 97,476 | |
2021 Term Loan, (1 mo. LIBOR + 3.50%, 0.50% Floor), 7.88%, 10/02/28 | | | | | | | 55 | | | | 48,270 | |
Keep Truckin, Inc.(j) | | | | | | | | | | | | |
Delayed Draw Term Loan, (3 mo. SOFR CME + 7.25%, 1.00% Floor), 11.79%, 04/08/25 | | | | | | | 988 | | | | 981,177 | |
Delayed Draw Term Loan 2, (3 mo. SOFR CME + 7.25%, 1.00% Floor), 11.79%, 04/08/25 | | | | | | | 1,512 | | | | 1,501,323 | |
Term Loan, (1 mo. LIBOR + 7.25%, 1.00% Floor), 11.63%, 10/05/24 | | | | | | | 2,000 | | | | 1,986,000 | |
Kong, Inc, Term Loan, (3 mo. SOFR CME + 5.50%, 1.00% Floor), 9.74%, 11/01/29(j) | | | | | | | 100 | | | | 98,000 | |
Magenta Buyer LLC | | | | | | | | | | | | |
2021 USD 1st Lien Term Loan, (3 mo. LIBOR + 4.75%, 0.75% Floor), 9.17%, 07/27/28 | | | | | | | 95 | | | | 81,168 | |
2021 USD 2nd Lien Term Loan, (3 mo. LIBOR + 8.25%, 0.75% Floor), 12.67%, 07/27/29 | | | | | | | 2,197 | | | | 1,720,727 | |
McAfee Corp., 2022 USD Term Loan B, (1 mo. SOFR CME + 3.75%), 7.97%, 03/01/29 | | | | | | | 176 | | | | 163,503 | |
Persado, Inc., Term Loan, (1 mo. LIBOR + 7.00%), 11.12%, 02/03/27(j) | | | | | | | 177 | | | | 170,552 | |
Planview Parent, Inc. | | | | | | | | | | | | |
2nd Lien Term Loan, (3 mo. LIBOR + 7.25%, 0.75% Floor), 11.98%, 12/18/28 | | | | | | | 76 | | | | 67,260 | |
| | | | | | | | | | | | |
| Security | | | | | Par
(000) | | | Value | |
| | | |
| Software (continued) | | | | | | | | | |
Planview Parent, Inc. (continued) | | | | | | | | | | | | |
Term Loan, (3 mo. LIBOR + 4.00%, 0.75% Floor), 8.73%, 12/17/27 | | | USD | | | | 49 | | | $ | 45,758 | |
Pluralsight, Inc.(j) | | | | | | | | | | | | |
(3 mo. LIBOR + 8.00%, 1.00% Floor), 12.36%, 04/06/27 | | | | | | | 96 | | | | 91,850 | |
Term Loan, (3 mo. LIBOR + 8.00%, 1.00% Floor), 11.83%, 04/06/27 | | | | | | | 3,309 | | | | 3,179,800 | |
Proofpoint, Inc. | | | | | | | | | | | | |
1st Lien Term Loan, (3 mo. LIBOR + 3.25%, 0.50% Floor), 7.98%, 08/31/28 | | | | | | | 86 | | | | 82,728 | |
2nd Lien Term Loan, (3 mo. LIBOR + 6.25%, 0.50% Floor), 10.98%, 08/31/29 | | | | | | | 170 | | | | 162,634 | |
RealPage, Inc. | | | | | | | | | | | | |
1st Lien Term Loan, (1 mo. LIBOR + 3.00%, 0.50% Floor), 7.38%, 04/24/28 | | | | | | | 319 | | | | 302,878 | |
2nd Lien Term Loan, (1 mo. LIBOR + 6.50%, 0.75% Floor), 10.88%, 04/23/29 | | | | | | | 1,034 | | | | 990,107 | |
Restoration Hardware, Inc., Term Loan B, (1 mo. LIBOR + 2.50%, 0.50% Floor), 6.88%, 10/20/28 | | | | | | | 41 | | | | 37,523 | |
Rigup, Inc., Delayed Draw Term Loan, (1 mo. LIBOR + 7.00%, 1.50% Floor), 11.81%, 03/01/24(j) | | | | | | | 1,074 | | | | 1,087,357 | |
SEP Raptor Acquisition, Inc., Term Loan, (3 mo. LIBOR + 4.50%), 12.25%, 03/28/27(j) | | | | | | | 1,713 | | | | 1,682,168 | |
Severin Acquisition LLC, 2018 Term Loan B, (3 mo. SOFR CME + 3.00%), 7.09%, 08/01/25 | | | | | | | 63 | | | | 62,431 | |
Sophia LP, 2021 Term Loan B, (3 mo. LIBOR + 3.50%, 0.50% Floor), 8.23%, 10/07/27 | | | | | | | 58 | | | | 55,572 | |
Superman Holdings LLC, Term Loan, (3 mo. LIBOR + 6.13%, 1.00% Floor), 10.85%, 08/31/27(j) | | | | | | | 1,687 | | | | 1,661,297 | |
Syntellis Performance Solutions LLC, Term Loan, (1 mo. SOFR CME + 6.50%, 0.75% Floor), 10.82%, 08/02/27(j) | | | | | | | 1,266 | | | | 1,228,368 | |
Tempo Acquisition LLC, 2022 Term Loan B, (1 mo. SOFR CME + 3.00%), 7.32%, 08/31/28 | | | | | | | 235 | | | | 234,421 | |
Thunder Purchaser, Inc.(j) | | | | | | | | | | | | |
2021 Delayed Draw Term Loan, (3 mo. LIBOR + 5.75%, 1.00% Floor), 10.48%, 06/30/28 | | | | | | | 83 | | | | 78,337 | |
2021 Term Loan, (3 mo. LIBOR + 5.75%, 1.00% Floor), 10.48%, 06/30/28 | | | | | | | 264 | | | | 248,359 | |
Delayed Draw Term Loan, (3 mo. LIBOR + 5.75%, 1.00% Floor), 10.48%, 06/30/28 | | | | | | | 575 | | | | 541,059 | |
Revolver, (3 mo. LIBOR + 5.75%, 1.00% Floor), 10.48%, 06/30/27 | | | | | | | 70 | | | | 65,916 | |
Term Loan, (3 mo. LIBOR + 5.75%, 1.00% Floor), 10.48%, 06/30/28 | | | | | | | 2,178 | | | | 2,048,452 | |
TIBCO Software, Inc. | | | | | | | | | | | | |
2022 USD Term Loan, (3 mo. SOFR CME + 4.50%, 0.50% Floor), 9.18%, 03/30/29 | | | | | | | 197 | | | | 175,576 | |
2022 USD Term Loan A, 09/29/28(k) | | | | | | | 1,544 | | | | 1,364,529 | |
Ultimate Software Group, Inc. | | | | | | | | | | | | |
2021 2nd Lien Term Loan, (1 mo. LIBOR + 5.25%, 0.50% Floor), 9.00%, 05/03/27 | | | | | | | 62 | | | | 57,126 | |
2021 Term Loan, (3 mo. LIBOR + 3.25%, 0.50% Floor), 7.00%, 05/04/26 | | | | | | | 115 | | | | 109,111 | |
| | | | | | | | | | | | |
| | | |
| | | | | | | | | | | 32,325,874 | |
| | |
CONSOLIDATED SCHEDULE OF INVESTMENTS | | 31 |
| | |
Consolidated Schedule of Investments (continued) December 31, 2022 | | BlackRock Credit Strategies Fund (Percentages shown are based on Net Assets) |
| | | | | | | | | | | | |
| Security | | | | | Par
(000) | | | Value | |
| | | |
| Specialty Retail — 2.2% | | | | | | | | | |
Belron Finance U.S. LLC | | | | | | | | | | | | |
2019 USD Term Loan B3, (3 mo. LIBOR + 2.25%), 6.69%, 10/30/26 | | | USD | | | | 41 | | | $ | 40,485 | |
2021 USD Term Loan B, (3 mo. LIBOR + 2.50%, 0.50% Floor), 7.06%, 04/13/28 | | | | | | | 110 | | | | 108,824 | |
Fanatics Commerce Intermediate Holdco LLC, Term Loan B, (1 mo. LIBOR + 3.25%, 0.50% Floor), 7.63%, 11/24/28(j) | | | | | | | 47 | | | | 46,131 | |
Hanna Andersson LLC, Term Loan, (3 mo. LIBOR + 6.00%, 1.00% Floor), 10.29%, 07/02/26(j) | | | | | | | 3,391 | | | | 3,231,266 | |
James Perse Enterprises, Inc., Term Loan, (3 mo. SOFR CME + 6.25%, 1.00% Floor), 10.93%, 09/02/27(j) | | | | | | | 4,000 | | | | 3,984,000 | |
Mavis Tire Express Services Corp., 2021 Term Loan B, (1 mo. SOFR CME + 4.00%, 0.75% Floor), 8.50%, 05/04/28 | | | | | | | 129 | | | | 122,695 | |
MED ParentCo LP, 1st Lien Term Loan, (1 mo. LIBOR + 4.25%), 8.63%, 08/31/26 | | | | | | | 54 | | | | 46,231 | |
Midas Intermediate Holdco II LLC, (1 mo. SOFR CME + 8.35%, 0.75% Floor), 12.67%, 06/30/27 | | | | | | | 169 | | | | 146,744 | |
PetSmart, Inc., 2021 Term Loan B, (1 mo. LIBOR + 3.75%, 0.75% Floor), 8.13%, 02/11/28 | | | | | | | 160 | | | | 156,033 | |
Research Now Group, Inc., 2017 1st Lien Term Loan, (6 mo. LIBOR + 5.50%, 1.00% Floor), 8.84%, 12/20/24 | | | | | | | 2,103 | | | | 1,558,718 | |
Reverb Buyer, Inc., 2021 1st Lien Term Loan, (1 mo. LIBOR + 3.50%, 0.50% Floor), 7.88%, 11/01/28 | | | | | | | 19 | | | | 18,115 | |
Woof Holdings, Inc. | | | | | | | | | | | | |
1st Lien Term Loan, (1 mo. LIBOR + 3.75%, 0.75% Floor), 8.10%, 12/21/27 | | | | | | | 19 | | | | 17,865 | |
2nd Lien Term Loan, (1 mo. LIBOR + 7.25%, 0.75% Floor), 11.60%, 12/21/28 | | | | | | | 13 | | | | 11,700 | |
| | | | | | | | | | | | |
| | | |
| | | | | | | | | | | 9,488,807 | |
|
| Technology Hardware, Storage & Peripherals — 2.2% | |
Electronics for Imaging, Inc., Term Loan, (1 mo. LIBOR + 5.00%), 9.38%, 07/23/26 | | | | | | | 2,418 | | | | 1,602,792 | |
Integratecom, Inc., Term Loan, (1 mo. LIBOR + 3.00%, 1.00% Floor), 10.35%, 12/15/27(j) | | | | | | | 1,550 | | | | 1,502,753 | |
Lightspeed Solution LLC, Term Loan, (1 mo. SOFRTE + 6.50%, 0.75% Floor), 10.82%, 03/01/28(j) | | | | | | | 379 | | | | 366,940 | |
Sellerx Opco GmbH, Delayed Draw Term Loan, (3 mo. LIBOR + 8.00%, 1.00% Floor), 12.73%, 10/22/25(j) | | | | | | | 2,489 | | | | 2,473,681 | |
SumUp Holdings, 2021 Delayed Draw Term Loan, (3 mo. SOFR CME + 7.00%, 1.00% Floor), 11.68%, 12/20/28(j) | | | | | | | 3,771 | | | | 3,635,657 | |
| | | | | | | | | | | | |
| | | |
| | | | | | | | | | | 9,581,823 | |
| | | |
| Textiles, Apparel & Luxury Goods — 0.7% | | | | | | | | | |
Calceus Acquisition, Inc., Term Loan B, (3 mo. LIBOR + 5.50%), 10.23%, 02/12/25 | | | | | | | 270 | | | | 248,360 | |
| | | | | | | | | | | | |
| Security | | | | | Par
(000) | | | Value | |
|
| Textiles, Apparel & Luxury Goods (continued) | |
Crocs, Inc., Term Loan B, (3 mo. SOFRTE + 3.50%, 0.50% Floor), 7.80%, 02/20/29 | | | USD | | | | 68 | | | $ | 67,035 | |
International Textile Group, Inc., 2022 Delayed Draw Term Loan, (3 mo. LIBOR + 8.50%, 1.00% Floor), 13.23%, 02/14/27(j) | | | | | | | 2,600 | | | | 2,587,000 | |
| | | | | | | | | | | | |
| | | |
| | | | | | | | | | | 2,902,395 | |
| | | |
| Trading Companies & Distributors — 0.3% | | | | | | | | | |
AP Core Holdings II LLC, High-Yield Term Loan B2, (1 mo. LIBOR + 5.50%, 0.75% Floor), 9.88%, 09/01/27 | | | | | | | 1,500 | | | | 1,345,785 | |
ION Trading Finance Ltd., 2021 USD Term Loan, (3 mo. LIBOR + 4.75%), 9.48%, 04/03/28 | | | | | | | 16 | | | | 14,905 | |
SRS Distribution, Inc., 2022 Incremental Term Loan, (1 mo. SOFR CME + 3.50%), 7.92%, 06/02/28 | | | | | | | 88 | | | | 84,246 | |
| | | | | | | | | | | | |
| | | |
| | | | | | | | | | | 1,444,936 | |
| | | |
| Transportation — 0.1% | | | | | | | | | |
Traack Technologies, Inc., Term Loan, (6 mo. SOFR CME + 7.50%), 11.49%, 09/15/25(j) | | | | | | | 500 | | | | 487,300 | |
| | | | | | | | | | | | |
| | | |
| Transportation Infrastructure — 0.2% | | | | | | | | | |
Geo Parent Corp., Term Loan, (1 mo. SOFR CME + 5.25%), 9.66%, 12/19/25(j) | | | | | | | 970 | | | | 911,587 | |
| | | | | | | | | | | | |
|
| Wireless Telecommunication Services — 0.2% | |
Gainwell Acquisition Corp., 2nd Lien Term Loan, (3 mo. LIBOR + 8.00%), 11.74%, 10/02/28(j) | | | | | | | 994 | | | | 936,162 | |
GOGO Intermediate Holdings LLC, Term Loan B, (3 mo. LIBOR + 3.75%, 0.75% Floor), 8.16%, 04/30/28 | | | | | | | 52 | | | | 51,694 | |
SBA Senior Finance II LLC, 2018 Term Loan B, (1 mo. LIBOR + 1.75%), 6.14%, 04/11/25 | | | | | | | 23 | | | | 23,241 | |
| | | | | | | | | | | | |
| | | |
| | | | | | | | | | | 1,011,097 | |
| | | | | | | | | | | | |
| |
Total Floating Rate Loan Interests — 64.4%
(Cost: $288,654,754) | | | | 276,986,462 | |
| | | | | | | | | | | | |
|
Foreign Agency Obligations | |
|
| Mongolia — 0.0% | |
Mongolia Government International Bond, 5.13%, 04/07/26(e) | | | | | | | 200 | | | | 172,022 | |
| | | | | | | | | | | | |
| | | |
| Pakistan — 0.0% | | | | | | | | | |
Pakistan Government International Bond(e) | | | | | | | | | | | | |
6.00%, 04/08/26 | | | | | | | 300 | | | | 120,033 | |
7.38%, 04/08/31 | | | | | | | 200 | | | | 70,522 | |
| | | | | | | | | | | | |
| | | |
| | | | | | | | | | | 190,555 | |
| | | |
| Sri Lanka — 0.1% | | | | | | | | | |
Sri Lanka Government International
Bond(c)(e)(h) | | | | | | | | | | | | |
6.85%, 03/14/24 | | | | | | | 200 | | | | 58,750 | |
6.35%, 06/28/24 | | | | | | | 310 | | | | 90,636 | |
6.85%, 11/03/25 | | | | | | | 200 | | | | 60,038 | |
6.83%, 07/18/26 | | | | | | | 200 | | | | 60,162 | |
6.20%, 05/11/27 | | | | | | | 200 | | | | 57,725 | |
| | | | | | | | | | | | |
| | | | | | | | | | | 327,311 | |
| | |
| 32 | | 2 0 2 2 BLACK ROCK ANNUAL REPORT TO SHAREHOLDERS |
| | |
Consolidated Schedule of Investments (continued) December 31, 2022 | | BlackRock Credit Strategies Fund (Percentages shown are based on Net Assets) |
| | | | | | | | | | | | |
| Security | | | | | Par
(000) | | | Value | |
| | | |
| Vietnam — 0.1% | | | | | | | | | |
Vietnam Government International Bond, 4.80%, 11/19/24(e) | | | USD | | | | 250 | | | $ | 243,778 | |
| | | | | | | | | | | | |
| |
Total Foreign Agency Obligations — 0.2%
(Cost: $1,631,606) | | | | 933,666 | |
| | | | | | | | | | | | |
| | | |
| | | | | | Shares | | | | |
| | | |
Investment Companies | | | | | | | | | | | | |
| | | |
Fixed Income Funds — 0.4% | | | | | | | | | | | | |
Invesco Senior Loan ETF | | | | | | | 2,104 | | | | 43,195 | |
iShares JP Morgan USD Emerging Markets Bond ETF(m)(n) | | | | | | | 18,476 | | | | 1,562,885 | |
| | | | | | | | | | | | |
| | | |
| | | | | | | | | | | 1,606,080 | |
| | | | | | | | | | | | |
| | | |
Total Investment Companies — 0.4%
(Cost: $2,043,797) | | | | | | | | | | | 1,606,080 | |
| | | | | | | | | | | | |
| | | |
| | | | | | Par
(000) | | | | |
| | | |
Preferred Securities | | | | | | | | | | | | |
| | | |
Capital Trusts — 2.0% | | | | | | | | | | | | |
| | | |
| Banks — 1.1% | | | | | | | | | |
Bank of East Asia Ltd., 5.88%(a)(d)(e) | | | USD | | | | 250 | | | | 229,578 | |
Industrial & Commercial Bank of China Ltd., 3.20%(a)(d)(e) | | | | | | | 400 | | | | 373,500 | |
ING Groep NV, 3.88%(a)(d) | | | | | | | 572 | | | | 416,770 | |
SVB Financial Group, 4.10%(a)(d) | | | | | | | 737 | | | | 421,801 | |
Toronto-Dominion Bank, 8.13%, 10/31/82 | | | | | | | 3,052 | | | | 3,174,080 | |
| | | | | | | | | | | | |
| | | |
| | | | | | | | | | | 4,615,729 | |
| | | |
| Diversified Financial Services — 0.9% | | | | | | | | | |
Barclays PLC, 8.00%(a)(d) | | | | | | | 4,150 | | | | 3,880,250 | |
| | | | | | | | | | | | |
|
| Independent Power and Renewable Electricity Producers — 0.0% | |
Vistra Corp., 7.00%(a)(b)(d) | | | | | | | 43 | | | | 39,127 | |
| | | | | | | | | | | | |
| | | |
| | | | | | | | | | | 8,535,106 | |
| | | | | | | | | | | | |
| | | |
| | | | | | Shares | | | | |
| | | |
Preferred Stocks — 1.1% | | | | | | | | | | | | |
|
Commercial Services & Supplies(j) — 0.8% | |
StubHub | | | | | | | 3,000 | | | | 3,479,409 | |
Verscend Intermediate Holding | | | | | | | 33 | | | | 40,745 | |
| | | | | | | | | | | | |
| | | |
| | | | | | | | | | | 3,520,154 | |
|
| Equity Real Estate Investment Trusts (REITs)(d) — 0.0% | |
Ashford Hospitality Trust, Inc., Series I | | | | | | | 4,000 | | | | 68,760 | |
Braemar Hotels & Resorts, Inc., Series B(g) | | | | | | | 4,800 | | | | 74,832 | |
| | | | | | | | | | | | |
| | | |
| | | | | | | | | | | 143,592 | |
| | | |
| Insurance — 0.0% | | | | | | | | | |
Alliant Holdings, Inc.(j) | | | | | | | 55 | | | | 50,104 | |
| | | | | | | | | | | | |
| | | | | | | | | | | | |
| Security | | | | | Shares | | | Value | |
| | | |
| Interactive Media & Services — 0.3% | | | | | | | | | |
ByteDance Ltd., Series E-1, (Acquired 11/11/20, Cost: $744,776)(j)(o) | | | | | | | 6,797 | | | $ | 1,120,193 | |
| | | | | | | | | | | | |
| | | |
| | | | | | | | | | | 4,834,043 | |
| | | | | | | | | | | | |
| | | |
Total Preferred Securities — 3.1%
(Cost: $13,016,925) | | | | | | | | | | | 13,369,149 | |
| | | | | | | | | | | | |
| | | |
Warrants | | | | | | | | | | | | |
| | | |
Capital Markets — 0.0% | | | | | | | | | | | | |
Pico Quantitative Trade Holding LLC, (Issued 02/07/20, Expires 02/07/30) (c)(j) | | | | | | | 6 | | | | 33,814 | |
| | | | | | | | | | | | |
| | | |
| Consumer Discretionary(c) — 0.0% | | | | | | | | | |
SellerX Germany GmbH & Co. KG, Series B, (Issued 11/22/21, Expires 11/22/28)(j) | | | | | | | 19 | | | | 38,768 | |
Service King (Carnelian Point), (Expires 06/30/27, Strike Price USD 10.00) | | | | | | | 202 | | | | — | |
| | | | | | | | | | | | |
| | | |
| | | | | | | | | | | 38,768 | |
| | | |
| Diversified Consumer Services — 0.0% | | | | | | | | | |
PERCHHQ LLC, (Expires 10/15/27)(c)(j)(p) | | | | | | | 21,736 | | | | 121,168 | |
| | | | | | | | | | | | |
| | | |
| Electrical Equipment — 0.1% | | | | | | | | | |
Razor Group GmbH, (Issued 04/30/21, Expires 04/30/28)(c)(j) | | | | | | | 46 | | | | 166,465 | |
| | | | | | | | | | | | |
| | | |
| Industrial Conglomerates — 0.0% | | | | | | | | | |
World Remit Ltd., Series D, (Issued 02/11/21, Expires 02/11/31, Strike Price USD 37.59)(c)(j) | | | | | | | 1,596 | | | | 40,529 | |
| | | | | | | | | | | | |
| | | |
| IT Services — 0.0% | | | | | | | | | |
Grey Orange, (Expires 05/06/32)(c)(j) | | | | | | | 339 | | | | 1,436 | |
| | | | | | | | | | | | |
| | | |
| Oil, Gas & Consumable Fuels — 0.0% | | | | | | | | | |
California Resources Corp., (Issued/Exercisable 11/03/20, 1 Share for 1 Warrant, Expires 10/27/24, Strike Price USD 36.00)(c) | | | | | | | 20 | | | | 252 | |
| | | | | | | | | | | | |
| | | |
| Textiles, Apparel & Luxury Goods(c)(j) — 0.0% | | | | | | | | | |
Elevate Brands Holdco, Inc., (Strike Price USD 0.80) | | | | | | | 10,931 | | | | 8,449 | |
Elevate Textiles, Inc., (Strike Price USD 3.54) | | | | | | | 21,862 | | | | 10,519 | |
| | | | | | | | | | | | |
| | | |
| | | | | | | | | | | 18,968 | |
| | | | | | | | | | | | |
| | | |
Total Warrants — 0.1%
(Cost: $33) | | | | | | | | | | | 421,400 | |
| | | | | | | | | | | | |
| | | |
Total Long-Term Investments — 111.3%
(Cost: $511,286,701) | | | | | | | | | | | 478,651,054 | |
| | | | | | | | | | | | |
| | |
CONSOLIDATED SCHEDULE OF INVESTMENTS | | 33 |
| | |
Consolidated Schedule of Investments (continued) December 31, 2022 | | BlackRock Credit Strategies Fund (Percentages shown are based on Net Assets) |
| | | | | | | | | | | | |
| Security | | | | | Shares | | | Value | |
| | | |
Short-Term Securities | | | | | | | | | | | | |
| | | |
| Money Market Funds — 0.8% | | | | | | | | | |
BlackRock Liquidity Funds, T-Fund, Institutional Class, 4.03%(m)(q) | | | | | | | 3,149,181 | | | $ | 3,149,181 | |
| | | | | | | | | | | | |
| | | |
Total Short-Term Securities — 0.8%
(Cost: $3,149,181) | | | | | | | | | | | 3,149,181 | |
| | | | | | | | | | | | |
| | | |
Options Purchased — 0.0%
(Cost: $81,928) | | | | | | | | | | | 55,460 | |
| | | | | | | | | | | | |
| |
Total Investments Before Options Written — 112.1%
(Cost: $514,517,810) | | | | 481,855,695 | |
| | | | | | | | | | | | |
| | | |
Options Written — (0.0)%
(Premiums Received: $(24,522)) | | | | | | | | | | | (11,210 | ) |
| | | | | | | | | | | | |
| |
Total Investments, Net of Options Written — 112.1%
(Cost: $514,493,288) | | | | 481,844,485 | |
| | | | | | | | | | | | |
| |
Liabilities in Excess of Other Assets — (12.1)% | | | | (51,861,011 | ) |
| | | | | | | | | | | | |
| | | |
Net Assets — 100.0% | | | | | | | | | | $ | 429,983,474 | |
| | | | | | | | | | | | |
| (a) | Variable rate security. Interest rate resets periodically. The rate shown is the effective interest rate as of period end. Security description also includes the reference rate and spread if published and available. |
| (b) | Security exempt from registration pursuant to Rule 144A under the Securities Act of 1933, as amended. These securities may be resold in transactions exempt from registration to qualified institutional investors. |
| (c) | Non-income producing security. |
| (d) | Perpetual security with no stated maturity date. |
| (e) | This security may be resold to qualified foreign investors and foreign institutional buyers under Regulation S of the Securities Act of 1933. |
| (f) | Payment-in-kind security which may pay interest/dividends in additional par/shares and/or in cash. Rates shown are the current rate and possible payment rates. |
| (h) | Issuer filed for bankruptcy and/or is in default. |
| (j) | Security is valued using significant unobservable inputs and is classified as Level 3 in the fair value hierarchy. |
| (k) | Represents an unsettled loan commitment at period end. Certain details associated with this purchase are not known prior to the settlement date, including coupon rate. |
| (l) | Rounds to less than 1,000. |
| (m) | Affiliate of the Fund. |
| (n) | All or a portion of the security has been pledged and/or segregated as collateral in connection with outstanding exchange-traded options written. |
| (o) | Restricted security as to resale, excluding 144A securities. The Fund held restricted securities with a current value of $1,120,193, representing 0.3% of its net assets as of period end, and an original cost of $744,776. |
| (p) | All or a portion of the security is held by a wholly-owned subsidiary. See Note 1 of the Notes to Consolidated Financial Statements for details on the wholly-owned subsidiary. |
| (q) | Annualized 7-day yield as of period end. |
For Fund compliance purposes, the Fund’s industry classifications refer to one or more of the industry sub-classifications used by one or more widely recognized market indexes or rating group indexes, and/or as defined by the investment adviser. These definitions may not apply for purposes of this report, which may combine such industry sub-classifications for reporting ease.
Affiliates
Investments in issuers considered to be affiliate(s) of the Fund during the year ended December 31, 2022 for purposes of Section 2(a)(3) of the Investment Company Act of 1940, as amended, were as follows:
| | | | | | | | | | | | | | | | | | | | | | | | | | | | | | | | | | | | |
| Affiliated Issuer | | Value at
12/31/21 | | | Purchases
at Cost | | | Proceeds
from Sales | | | Net
Realized
Gain (Loss) | | | Change in
Unrealized
Appreciation
(Depreciation) | | | Value at
12/31/22 | | | Shares
Held at
12/31/22 | | | Income | | | Capital Gain
Distributions
from
Underlying
Funds | |
BlackRock Liquidity Funds, T-Fund, Institutional Class | | $ | 10,498,285 | | | $ | — | | | $ | (7,349,104 | )(a) | | $ | — | | | $ | — | | | $ | 3,149,181 | | | | 3,149,181 | | | $ | 31,785 | | | $ | — | |
iShares iBoxx $ High Yield Corporate Bond ETF(b) | | | — | | | | 2,651,110 | | | | (2,636,505 | ) | | | (14,605 | ) | | | — | | | | — | | | | — | | | | 10,294 | | | | — | |
iShares JP Morgan USD Emerging Markets Bond ETF | | | 2,014,993 | | | | — | | | | — | | | | — | | | | (452,108 | ) | | | 1,562,885 | | | | 18,476 | | | | 78,721 | | | | — | |
| | | | | | | | | | | | | | | | | | | | | | | | | | | | | | | | | | | | |
| | | | | | | | | |
| | | | | | | | | | | | | | $ | (14,605 | ) | | $ | (452,108 | ) | | $ | 4,712,066 | | | | | | | $ | 120,800 | | | $ | — | |
| | | | | | | | | | | | | | | | | | | | | | | | | | | | | | | | | | | | |
| | (a) | Represents net amount purchased (sold). | |
| | (b) | As of period end, the entity is no longer held. | |
Derivative Financial Instruments Outstanding as of Period End
Futures Contracts
| | | | | | | | | | | | | | | | |
| Description | | Number of
Contracts | | | Expiration
Date | | | Notional
Amount (000) | | | Value/
Unrealized
Appreciation
(Depreciation) | |
Long Contracts | | | | | | | | | | | | | | | | |
U.S. Long Bond | | | 55 | | | | 03/22/23 | | | $ | 6,894 | | | $ | (13,406 | ) |
Ultra U.S. Treasury Bond | | | 12 | | | | 03/22/23 | | | | 1,612 | | | | 5,996 | |
2-Year U.S. Treasury Note | | | 163 | | | | 03/31/23 | | | | 33,428 | | | | 27,110 | |
5-Year U.S. Treasury Note | | | 582 | | | | 03/31/23 | | | | 62,815 | | | | (59,521 | ) |
| | | | | | | | | | | | | | | | |
| | | | |
| | | | | | | | | | | | | | | (39,821 | ) |
| | | | | | | | | | | | | | | | |
| | |
| 34 | | 2 0 2 2 BLACK ROCK ANNUAL REPORT TO SHAREHOLDERS |
| | |
Consolidated Schedule of Investments (continued) December 31, 2022 | | BlackRock Credit Strategies Fund |
Futures Contracts (continued)
| | | | | | | | | | | | | | | | |
| Description | | Number of
Contracts | | | Expiration
Date | | | Notional
Amount (000) | | | Value/
Unrealized
Appreciation
(Depreciation) | |
Short Contracts | | | | | | | | | | | | | | | | |
10-Year U.S. Treasury Note | | | 542 | | | | 03/22/23 | | | $ | 60,865 | | | $ | 253,297 | |
10-Year U.S. Ultra Long Treasury Note | | | 11 | | | | 03/22/23 | | | | 1,301 | | | | 4,019 | |
U.S. Long Bond | | | 41 | | | | 03/22/23 | | | | 5,139 | | | | (3,912 | ) |
| | | | | | | | | | | | | | | | |
| | | | |
| | | | | | | | | | | | | | | 253,404 | |
| | | | | | | | | | | | | | | | |
| | | | |
| | | | | | | | | | | | | | $ | 213,583 | |
| | | | | | | | | | | | | | | | |
Forward Foreign Currency Exchange Contracts
| | | | | | | | | | | | | | | | | | | | |
| Currency Purchased | | | Currency Sold | | | Counterparty | | Settlement Date | | | Unrealized
Appreciation
(Depreciation) | |
| EUR | | | 200,000 | | | USD | | | 213,607 | | | JPMorgan Chase Bank N.A. | | | 01/13/23 | | | $ | 617 | |
| USD | | | 24,599 | | | GBP | | | 20,000 | | | HSBC Bank PLC | | | 01/13/23 | | | | 414 | |
| | | | | | | | | | | | | | | | | | | | |
| | | | | | |
| | | | | | | | | | | | | | | | | | | 1,031 | |
| | | | | | | | | | | | | | | | | | | | |
| | | | | | |
| USD | | | 135,092 | | | EUR | | | 127,000 | | | HSBC Bank PLC | | | 01/13/23 | | | | (940 | ) |
| USD | | | 708,582 | | | EUR | | | 670,000 | | | HSBC Bank PLC | | | 01/13/23 | | | | (9,068 | ) |
| USD | | | 198,003 | | | EUR | | | 186,000 | | | Morgan Stanley & Co. International PLC | | | 01/13/23 | | | | (1,226 | ) |
| | | | | | | | | | | | | | | | | | | | |
| | | | | | |
| | | | | | | | | | | | | | | | | | | (11,234 | ) |
| | | | | | | | | | | | | | | | | | | | |
| | | | | | |
| | | | | | | | | | | | | | | | | | $ | (10,203 | ) |
| | | | | | | | | | | | | | | | | | | | |
Exchange-Traded Options Purchased
| | | | | | | | | | | | | | | | | | | | | | | | |
| |
| Description | | Number of
Contracts | | Expiration
Date | | Exercise Price | | | Notional Amount (000) | | | Value | |
| |
Call | | | | | | | | | | | | | | | | | | | | | | | | |
iShares China Large-Cap ETF | | 1,180 | | 02/17/23 | | | USD | | | | 32.00 | | | | USD | | | | 3,339 | | | $ | 55,460 | |
| | | | | | | | | | | | | | | | | | | | | | | | |
Exchange-Traded Options Written
| | | | | | | | | | | | | | | | | | | | | | | | |
| |
| Description | | Number of
Contracts | | Expiration
Date | | Exercise Price | | | Notional Amount (000) | | | Value | |
| |
Call | | | | | | | | | | | | | | | | | | | | | | | | |
iShares China Large-Cap ETF | | 1,180 | | 02/17/23 | | | USD | | | | 36.00 | | | | USD | | | | 3,339 | | | $ | (11,210 | ) |
| | | | | | | | | | | | | | | | | | | | | | | | |
Centrally Cleared Credit Default Swaps — Buy Protection
| | | | | | | | | | | | | | | | | | | | | | | | | | | | |
| Reference Obligation/Index | | Financing
Rate Paid
by the Fund | | | Payment
Frequency | | | Termination
Date | | Notional
Amount (000) | | Value | | | Upfront
Premium
Paid
(Received) | | | Unrealized
Appreciation
(Depreciation) | |
CDX.NA.HY.39.V1 | | | 5.00 | % | | | Quarterly | | | 12/20/27 | | | USD | | | 20,800 | | $ | (161,583 | ) | | $ | (49,885 | ) | | $ | (111,698 | ) |
| | | | | | | | | | | | | | | | | | | | | | | | | | | | |
Balances Reported in the Consolidated Statement of Assets and Liabilities for Centrally Cleared Swaps and Options Written
| | | | | | | | | | | | | | | | | | | | |
| Description | | Swap
Premiums
Paid | | | Swap
Premiums
Received | | | Unrealized
Appreciation | | | Unrealized
Depreciation | | | Value | |
Centrally Cleared Swaps(a) | | $ | — | | | $ | (49,885 | ) | | $ | — | | | $ | (111,698 | ) | | $ | — | |
Options Written | | | N/A | | | | N/A | | | | 13,312 | | | | — | | | | (11,210 | ) |
| |
| | (a) | Includes cumulative appreciation (depreciation) on centrally cleared swaps, as reported in the Consolidated Schedule of Investments. Only current day’s variation margin is reported within the Consolidated Statement of Assets and Liabilities and is net of any previously paid (received) swap premium amounts. | |
| | |
CONSOLIDATED SCHEDULE OF INVESTMENTS | | 35 |
| | |
Consolidated Schedule of Investments (continued) December 31, 2022 | | BlackRock Credit Strategies Fund |
Derivative Financial Instruments Categorized by Risk Exposure
As of period end, the fair values of derivative financial instruments located in the Consolidated Statement of Assets and Liabilities were as follows:
| | | | | | | | | | | | | | | | | | | | | | | | | | | | |
| | | Commodity
Contracts | | | Credit
Contracts | | | Equity
Contracts | | | Foreign
Currency
Exchange
Contracts | | | Interest
Rate
Contracts | | | Other
Contracts | | | Total | |
Assets — Derivative Financial Instruments | | | | | | | | | | | | | | | | | | | | | | | | | | | | |
Futures contracts | | | | | | | | | | | | | | | | | | | | | | | | | | | | |
Unrealized appreciation on futures contracts(a) | | $ | — | | | $ | — | | | $ | — | | | $ | — | | | $ | 290,422 | | | $ | — | | | $ | 290,422 | |
Forward foreign currency exchange contracts | | | | | | | | | | | | | | | | | | | | | | | | | | | | |
Unrealized appreciation on forward foreign currency exchange contracts | | | — | | | | — | | | | — | | | | 1,031 | | | | — | | | | — | | | | 1,031 | |
Options purchased | | | | | | | | | | | | | | | | | | | | | | | | | | | | |
Investments at value — unaffiliated(b) | | | — | | | | — | | | | 55,460 | | | | — | | | | — | | | | — | | | | 55,460 | |
| | | | | | | | | | | | | | | | | | | | | | | | | | | | |
| | | | | | | |
| | $ | — | | | $ | — | | | $ | 55,460 | | | $ | 1,031 | | | $ | 290,422 | | | $ | — | | | $ | 346,913 | |
| | | | | | | | | | | | | | | | | | | | | | | | | | | | |
Liabilities — Derivative Financial Instruments | | | | | | | | | | | | | | | | | | | | | | | | | | | | |
Futures contracts | | | | | | | | | | | | | | | | | | | | | | | | | | | | |
Unrealized depreciation on futures contracts(a) | | $ | — | | | $ | — | | | $ | — | | | $ | — | | | $ | 76,839 | | | $ | — | | | $ | 76,839 | |
Forward foreign currency exchange contracts | | | | | | | | | | | | | | | | | | | | | | | | | | | | |
Unrealized depreciation on forward foreign currency exchange contracts | | | — | | | | — | | | | — | | | | 11,234 | | | | — | | | | — | | | | 11,234 | |
Options written | | | | | | | | | | | | | | | | | | | | | | | | | | | | |
Options written at value | | | — | | | | — | | | | 11,210 | | | | — | | | | — | | | | — | | | | 11,210 | |
Swaps — centrally cleared | | | | | | | | | | | | | | | | | | | | | | | | | | | | |
Unrealized depreciation on centrally cleared swaps(a) | | | — | | | | 111,698 | | | | — | | | | — | | | | — | | | | — | | | | 111,698 | |
| | | | | | | | | | | | | | | | | | | | | | | | | | | | |
| | | | | | | |
| | $ | — | | | $ | 111,698 | | | $ | 11,210 | | | $ | 11,234 | | | $ | 76,839 | | | $ | — | | | $ | 210,981 | |
| | | | | | | | | | | | | | | | | | | | | | | | | | | | |
| | (a) | Net cumulative unrealized appreciation (depreciation) on futures contracts and centrally cleared swaps, if any, are reported in the Consolidated Schedule of Investments. In the Consolidated Statement of Assets and Liabilities, only current day’s variation margin is reported in receivables or payables and the net cumulative unrealized appreciation (depreciation) is included in accumulated earnings (loss). | |
| | (b) | Includes options purchased at value as reported in the Consolidated Schedule of Investments. | |
For the period ended December 31, 2022, the effect of derivative financial instruments in the Consolidated Statement of Operations was as follows:
| | | | | | | | | | | | | | | | | | | | | | | | | | | | |
| | | Commodity
Contracts | | | Credit
Contracts | | | Equity
Contracts | | | Foreign
Currency
Exchange
Contracts | | | Interest Rate Contracts | | | Other
Contracts | | | Total | |
Net Realized Gain (Loss) from: | | | | | | | | | | | | | | | | | | | | | |
Futures contracts | | $ | — | | | $ | — | | | $ | — | | | $ | — | | | $ | (2,001,064 | ) | | $ | — | | | $ | (2,001,064 | ) |
Forward foreign currency exchange contracts | | | — | | | | — | | | | — | | | | 9,748,016 | | | | — | | | | — | | | | 9,748,016 | |
Options purchased(a) | | | — | | | | (31,624 | ) | | | (776,656 | ) | | | (181,281 | ) | | | (91,341 | ) | | | — | | | | (1,080,902 | ) |
Options written | | | — | | | | 12,692 | | | | 345,421 | | | | 43,039 | | | | — | | | | — | | | | 401,152 | |
Swaps | | | — | | | | (716,153 | ) | | | — | | | | — | | | | 100 | | | | — | | | | (716,053 | ) |
| | | | | | | | | | | | | | | | | | | | | | | | | | | | |
| | | | | | | |
| | $ | — | | | $ | (735,085 | ) | | $ | (431,235 | ) | | $ | 9,609,774 | | | $ | (2,092,305 | ) | | $ | — | | | $ | 6,351,149 | |
| | | | | | | | | | | | | | | | | | | | | | | | | | | | |
Net Change in Unrealized Appreciation (Depreciation) on: | | | | | | | | | | | | | | | | | | | | | |
Futures contracts | | $ | — | | | $ | — | | | $ | — | | | $ | — | | | $ | 407,762 | | | $ | — | | | $ | 407,762 | |
Forward foreign currency exchange contracts | | | — | | | | — | | | | — | | | | 699,677 | | | | — | | | | — | | | | 699,677 | |
Options purchased(b) | | | — | | | | — | | | | 83,530 | | | | — | | | | — | | | | — | | | | 83,530 | |
Options written | | | — | | | | — | | | | 13,312 | | | | — | | | | — | | | | — | | | | 13,312 | |
Swaps | | | — | | | | (666,374 | ) | | | — | | | | — | | | | — | | | | — | | | | (666,374 | ) |
| | | | | | | | | | | | | | | | | | | | | | | | | | | | |
| | | | | | | |
| | $ | — | | | $ | (666,374 | ) | | $ | 96,842 | | | $ | 699,677 | | | $ | 407,762 | | | $ | — | | | $ | 537,907 | |
| | | | | | | | | | | | | | | | | | | | | | | | | | | | |
| | (a) | Options purchased are included in net realized gain (loss) from investments — unaffiliated. | |
| | (b) | Options purchased are included in net change in unrealized appreciation (depreciation) on investments — unaffiliated. | |
Average Quarterly Balances of Outstanding Derivative Financial Instruments
| | | | |
Futures contracts: | | | | |
Average notional value of contracts — long | | $ | 129,314,555 | |
Average notional value of contracts — short | | $ | 70,817,802 | |
| | |
| 36 | | 2 0 2 2 BLACK ROCK ANNUAL REPORT TO SHAREHOLDERS |
| | |
Consolidated Schedule of Investments (continued) December 31, 2022 | | BlackRock Credit Strategies Fund |
Average Quarterly Balances of Outstanding Derivative Financial Instruments (continued)
| | | | |
Forward foreign currency exchange contracts: | | | | |
Average amounts purchased — in USD | | $ | 39,335,265 | |
Average amounts sold — in USD | | $ | 1,505,616 | |
Options: | | | | |
Average value of option contracts purchased | | $ | 210,480 | |
Average value of option contracts written | | $ | 33,174 | |
Average notional value of swaption contracts purchased | | $ | 1,127,058 | |
Average notional value of swaption contracts written | | $ | 147,008 | |
Credit default swaps: | | | | |
Average notional value — buy protection | | $ | 6,037,013 | |
Average notional value — sell protection | | $ | 39,311,791 | |
Total return swaps: | | | | |
Average notional value | | $ | 659,100 | |
For more information about the Fund’s investment risks regarding derivative financial instruments, refer to the Notes to Consolidated Financial Statements.
Derivative Financial Instruments — Offsetting as of Period End
The Fund’s derivative assets and liabilities (by type) were as follows:
| | | | | | | | |
| | | Assets | | | Liabilities | |
Derivative Financial Instruments | | | | | | | | |
Futures contracts | | $ | 83,313 | | | $ | 91,236 | |
Forward foreign currency exchange contracts | | | 1,031 | | | | 11,234 | |
Options | | | 55,460 | (a) | | | 11,210 | |
Swaps — centrally cleared | | | 3,214 | | | | — | |
| | | | | | | | |
| | |
Total derivative assets and liabilities in the Consolidated Statement of Assets and Liabilities | | | 143,018 | | | | 113,680 | |
| | | | | | | | |
| | |
Derivatives not subject to a Master Netting Agreement or similar agreement (“MNA”) | | | (141,987 | ) | | | (102,446 | ) |
| | | | | | | | |
| | |
Total derivative assets and liabilities subject to an MNA | | $ | 1,031 | | | $ | 11,234 | |
| | | | | | | | |
| | (a) | Includes options purchased at value which is included in Investments at value — unaffiliated in the Consolidated Statement of Assets and Liabilities and reported in the Consolidated Schedule of Investments. | |
The following table presents the Fund’s derivative assets and liabilities by counterparty net of amounts available for offset under an MNA and net of the related collateral received (and pledged) by the Fund:
| | | | | | | | | | | | | | | | | | | | |
Counterparty | |
| Derivative
Assets
Subject to
an MNA by
Counterparty |
| |
| Derivatives
Availablefor Offset |
(a) | |
| Non-Cash
Collateral
Received |
| |
| Cash
Collateral
Received |
| |
| Net Amount
of DerivativeAssets |
(b)(c) |
HSBC Bank PLC | | $ | 414 | | | $ | (414 | ) | | $ | — | | | $ | — | | | $ | — | |
JPMorgan Chase Bank N.A | | | 617 | | | | — | | | | — | | | | — | | | | 617 | |
| | | | | | | | | | | | | | | | | | | | |
| | | | | |
| | $ | 1,031 | | | $ | (414 | ) | | $ | — | | | $ | — | | | $ | 617 | |
| | | | | | | | | | | | | | | | | | | | |
| | | | | | | | | | | | | | | | | | | | |
Counterparty | |
| Derivative
Liabilities
Subject to
an MNA by
Counterparty |
| |
| Derivatives
Available for Offset |
(a) | |
| Non-Cash
Collateral
Pledged |
| |
| Cash
Collateral
Pledged |
| |
| Net Amount
of Derivative
Liabilities |
(b)(d) |
HSBC Bank PLC | | $ | 10,008 | | | $ | (414 | ) | | $ | — | | | $ | — | | | $ | 9,594 | |
Morgan Stanley & Co. International PLC | | | 1,226 | | | | — | | | | — | | | | — | | | | 1,226 | |
| | | | | | | | | | | | | | | | | | | | |
| | | | | |
| | $ | 11,234 | | | $ | (414 | ) | | $ | — | | | $ | — | | | $ | 10,820 | |
| | | | | | | | | | | | | | | | | | | | |
| | (a) | The amount of derivatives available for offset is limited to the amount of derivative asset and/or liabilities that are subject to an MNA. | |
| | (b) | Net amount may also include forward foreign currency exchange contracts that are not required to be collateralized. | |
| | (c) | Net amount represents the net amount receivable from the counterparty in the event of default. | |
| | (d) | Net amount represents the net amount payable due to counterparty in the event of default. Net amount may be offset further by the options written receivable/payable on the Consolidated Statement of Assets and Liabilities. | |
| | |
CONSOLIDATED SCHEDULE OF INVESTMENTS | | 37 |
| | |
Consolidated Schedule of Investments (continued) December 31, 2022 | | BlackRock Credit Strategies Fund |
Fair Value Hierarchy as of Period End
Various inputs are used in determining the fair value of financial instruments. For a description of the input levels and information about the Fund’s policy regarding valuation of financial instruments, refer to the Notes to Consolidated Financial Statements.
The following table summarizes the Fund’s financial instruments categorized in the fair value hierarchy. The breakdown of the Fund’s financial instruments into major categories is disclosed in the Consolidated Schedule of Investments above.
| | | | | | | | | | | | | | | | |
| | | Level 1 | | | Level 2 | | | Level 3 | | | Total | |
Assets | | | | | | | | | | | | | | | | |
Investments | | | | | | | | | | | | | | | | |
Long-Term Investments | | | | | | | | | | | | | | | | |
Asset-Backed Securities | | $ | — | | | $ | 33,612,858 | | | $ | — | | | $ | 33,612,858 | |
Common Stocks | | | | | | | | | | | | | | | | |
Construction & Engineering | | | 691 | | | | — | | | | — | | | | 691 | |
Equity Real Estate Investment Trusts (REITs) | | | 3,529,033 | | | | — | | | | — | | | | 3,529,033 | |
Household Durables | | | 4,175,100 | | | | — | | | | — | | | | 4,175,100 | |
Pharmaceuticals | | | 558,360 | | | | — | | | | — | | | | 558,360 | |
Specialty Retail | | | — | | | | 11,797 | | | | — | | | | 11,797 | |
Corporate Bonds | | | | | | | | | | | | | | | | |
Aerospace & Defense | | | — | | | | 2,952,467 | | | | — | | | | 2,952,467 | |
Airlines | | | — | | | | 1,847,116 | | | | — | | | | 1,847,116 | |
Auto Components | | | — | | | | 2,059,198 | | | | — | | | | 2,059,198 | |
Automobiles | | | — | | | | 595,775 | | | | — | | | | 595,775 | |
Banks | | | — | | | | 1,895,613 | | | | — | | | | 1,895,613 | |
Beverages | | | — | | | | 1,466,219 | | | | — | | | | 1,466,219 | |
Building Materials | | | — | | | | 603,197 | | | | — | | | | 603,197 | |
Building Products | | | — | | | | 3,242,574 | | | | — | | | | 3,242,574 | |
Capital Markets | | | — | | | | 1,494,573 | | | | — | | | | 1,494,573 | |
Chemicals | | | — | | | | 1,831,691 | | | | — | | | | 1,831,691 | |
Commercial Services & Supplies | | | — | | | | 2,704,277 | | | | — | | | | 2,704,277 | |
Communications Equipment | | | — | | | | 594,460 | | | | — | | | | 594,460 | |
Construction & Engineering | | | — | | | | 191,287 | | | | — | | | | 191,287 | |
Construction Materials | | | — | | | | 31,578 | | | | — | | | | 31,578 | |
Consumer Discretionary | | | — | | | | 10,011,292 | | | | — | | | | 10,011,292 | |
Consumer Finance | | | — | | | | 3,170,194 | | | | — | | | | 3,170,194 | |
Containers & Packaging | | | — | | | | 1,596,288 | | | | — | | | | 1,596,288 | |
Diversified Consumer Services | | | — | | | | 2,269,676 | | | | — | | | | 2,269,676 | |
Diversified Financial Services | | | — | | | | 9,097,877 | | | | — | | | | 9,097,877 | |
Diversified Telecommunication Services | | | — | | | | 3,447,794 | | | | — | | | | 3,447,794 | |
Electric Utilities | | | — | | | | 1,148,356 | | | | — | | | | 1,148,356 | |
Electrical Equipment | | | — | | | | 153,454 | | | | — | | | | 153,454 | |
Electronic Equipment, Instruments & Components | | | — | | | | 290,550 | | | | — | | | | 290,550 | |
Energy Equipment & Services | | | — | | | | 939,999 | | | | — | | | | 939,999 | |
Entertainment | | | — | | | | 1,747,687 | | | | — | | | | 1,747,687 | |
Environmental, Maintenance & Security Service | | | — | | | | 632,115 | | | | — | | | | 632,115 | |
Equity Real Estate Investment Trusts (REITs) | | | — | | | | 2,777,584 | | | | — | | | | 2,777,584 | |
Food & Staples Retailing | | | — | | | | 408,115 | | | | — | | | | 408,115 | |
Food Products | | | — | | | | 830,601 | | | | — | | | | 830,601 | |
Gas Utilities | | | — | | | | 14,450 | | | | — | | | | 14,450 | |
Health Care Equipment & Supplies | | | — | | | | 267,811 | | | | — | | | | 267,811 | |
Health Care Providers & Services | | | — | | | | 2,721,189 | | | | — | | | | 2,721,189 | |
Health Care Services | | | — | | | | 644,973 | | | | — | | | | 644,973 | |
Health Care Technology | | | — | | | | 491,831 | | | | — | | | | 491,831 | |
Hotels, Restaurants & Leisure | | | — | | | | 7,806,632 | | | | — | | | | 7,806,632 | |
Household Durables | | | — | | | | 985,460 | | | | — | | | | 985,460 | |
Household Products | | | — | | | | 30,617 | | | | — | | | | 30,617 | |
Independent Power and Renewable Electricity Producers | | | — | | | | 1,041,191 | | | | — | | | | 1,041,191 | |
Insurance | | | — | | | | 2,329,833 | | | | — | | | | 2,329,833 | |
Interactive Media & Services | | | — | | | | 2,887,124 | | | | — | | | | 2,887,124 | |
Internet Software & Services | | | — | | | | 1,059,527 | | | | — | | | | 1,059,527 | |
IT Services | | | — | | | | 2,286,902 | | | | — | | | | 2,286,902 | |
Leisure Products | | | — | | | | 77,941 | | | | — | | | | 77,941 | |
Machinery | | | — | | | | 1,251,243 | | | | — | | | | 1,251,243 | |
Media | | | — | | | | 12,436,300 | | | | — | | | | 12,436,300 | |
Metals & Mining | | | — | | | | 3,097,074 | | | | — | | | | 3,097,074 | |
| | |
| 38 | | 2 0 2 2 BLACK ROCK ANNUAL REPORT TO SHAREHOLDERS |
| | |
Consolidated Schedule of Investments (continued) December 31, 2022 | | BlackRock Credit Strategies Fund |
Fair Value Hierarchy as of Period End (continued)
| | | | | | | | | | | | | | | | |
| | | Level 1 | | | Level 2 | | | Level 3 | | | Total | |
Corporate Bonds (continued) | | | | | | | | | | | | | | | | |
Multiline Retail | | $ | — | | | $ | 748,823 | | | $ | — | | | $ | 748,823 | |
Multi-Utilities | | | — | | | | 193,739 | | | | — | | | | 193,739 | |
Oil, Gas & Consumable Fuels | | | — | | | | 20,340,062 | | | | — | | | | 20,340,062 | |
Pharmaceuticals | | | — | | | | 569,418 | | | | — | | | | 569,418 | |
Real Estate Management & Development | | | — | | | | 5,328,578 | | | | — | | | | 5,328,578 | |
Road & Rail | | | — | | | | 43,195 | | | | — | | | | 43,195 | |
Semiconductors & Semiconductor Equipment | | | — | | | | 1,376,918 | | | | — | | | | 1,376,918 | |
Software | | | — | | | | 7,087,928 | | | | — | | | | 7,087,928 | |
Specialty Retail | | | — | | | | 1,243,631 | | | | — | | | | 1,243,631 | |
Technology Hardware, Storage & Peripherals | | | — | | | | 65,545 | | | | — | | | | 65,545 | |
Textiles, Apparel & Luxury Goods | | | 278,141 | | | | 50,151 | | | | 1,771,094 | | | | 2,099,386 | |
Thrifts & Mortgage Finance | | | — | | | | 189,507 | | | | — | | | | 189,507 | |
Tobacco | | | — | | | | 70,657 | | | | — | | | | 70,657 | |
Transportation Infrastructure | | | — | | | | 172,100 | | | | — | | | | 172,100 | |
Utilities | | | — | | | | 446,592 | | | | — | | | | 446,592 | |
Wireless Telecommunication Services | | | — | | | | 4,008,674 | | | | — | | | | 4,008,674 | |
Floating Rate Loan Interests | | | — | | | | 74,386,114 | | | | 202,600,348 | | | | 276,986,462 | |
Foreign Agency Obligations | | | — | | | | 933,666 | | | | — | | | | 933,666 | |
Investment Companies | | | 1,606,080 | | | | — | | | | — | | | | 1,606,080 | |
Preferred Securities | | | | | | | | | | | | | | | | |
Capital Trusts | | | — | | | | 8,535,106 | | | | — | | | | 8,535,106 | |
Preferred Stocks | | | 143,592 | | | | — | | | | 4,690,451 | | | | 4,834,043 | |
Warrants | | | 252 | | | | — | | | | 421,148 | | | | 421,400 | |
Short-Term Securities | | | | | | | | | | | | | | | | |
Money Market Funds | | | 3,149,181 | | | | — | | | | — | | | | 3,149,181 | |
Options Purchased | | | | | | | | | | | | | | | | |
Equity Contracts | | | 55,460 | | | | — | | | | — | | | | 55,460 | |
Unfunded Floating Rate Loan Interests | | | — | | | | — | | | | 8,427 | | | | 8,427 | |
Liabilities | | | | | | | | | | | | | | | | |
Unfunded Floating Rate Loan Interests | | | — | | | | (112,223 | ) | | | (604,825 | ) | | | (717,048 | ) |
| | | | | | | | | | | | | | | | |
| | | | |
| | $ | 13,495,890 | | | $ | 258,764,541 | | | $ | 208,886,643 | | | $ | 481,147,074 | |
| | | | | | | | | | | | | | | | |
| | | | |
Derivative Financial Instruments(a) | | | | | | | | | | | | | | | | |
Assets | | | | | | | | | | | | | | | | |
Foreign Currency Exchange Contracts | | $ | — | | | $ | 1,031 | | | $ | — | | | $ | 1,031 | |
Interest Rate Contracts | | | 290,422 | | | | — | | | | — | | | | 290,422 | |
Liabilities | | | | | | | | | | | | | | | | |
Credit Contracts | | | — | | | | (111,698 | ) | | | — | | | | (111,698 | ) |
Equity Contracts | | | (11,210 | ) | | | — | | | | — | | | | (11,210 | ) |
Foreign Currency Exchange Contracts | | | — | | | | (11,234 | ) | | | — | | | | (11,234 | ) |
Interest Rate Contracts | | | (76,839 | ) | | | — | | | | — | | | | (76,839 | ) |
| | | | | | | | | | | | | | | | |
| | | | |
| | $ | 202,373 | | | $ | (121,901 | ) | | $ | — | | | $ | 80,472 | |
| | | | | | | | | | | | | | | | |
| | (a) | Derivative financial instruments are swaps, futures contracts, forward foreign currency exchange contracts and options written. Swaps, futures contracts and forward foreign currency exchange contracts are valued at the unrealized appreciation (depreciation) on the instrument and options written are shown at value. | |
The Fund may hold assets and/or liabilities in which the fair value approximates the carrying amount for financial statement purposes. As of period end, bank borrowings payable of $55,850,000 are categorized as Level 2 within the fair value hierarchy.
A reconciliation of Level 3 financial instruments is presented when the Fund had a significant amount of Level 3 investments and derivative financial instruments at the beginning and/or end of the year in relation to net assets. The following table is a reconciliation of Level 3 investments for which significant unobservable inputs were used in determining fair value:
| | | | | | | | | | | | | | | | | | | | | | | | | | | | |
| | | | | | | | |
| | |
| Asset-Backed
Securities |
| |
| Corporate
Bonds |
| |
| Floating
Rate Loan
Interests |
| |
| Preferred
Stocks |
| |
| Unfunded
Floating
Rate Loan
Interests |
| | | Warrants | | | | Total | |
Assets/Liabilities | | | | | | | | | | | | | | | | | | | | | | | | | | | | |
Opening balance, as of December 31, 2021 | | $ | 1,000,000 | | | $ | 1,946,993 | | | $ | 176,802,757 | | | $ | 4,362,140 | | | $ | (95,306) | | | $ | 468,306 | | | $ | 184,484,890 | |
Transfers into Level 3(a) | | | — | | | | — | | | | 11,561,039 | | | | — | | | | (718 | ) | | | — | | | | 11,560,321 | |
Transfers out of Level 3(b) | | | — | | | | (3,817 | ) | | | (5,805,771 | ) | | | — | | | | 27 | | | | — | | | | (5,809,223 | ) |
Accrued discounts/premiums | | | — | | | | 12,060 | | | | 439,756 | | | | — | | | | 365 | | | | — | | | | 451,816 | |
| | |
CONSOLIDATED SCHEDULE OF INVESTMENTS | | 39 |
| | |
Consolidated Schedule of Investments (continued) December 31, 2022 | | BlackRock Credit Strategies Fund |
| | | | | | | | | | | | | | | | | | | | | | | | | | | | |
| | |
| Asset-Backed
Securities |
| |
| Corporate
Bonds |
| |
| Floating
Rate Loan
Interests |
| |
| Preferred
Stocks |
| |
| Unfunded
Floating
Rate Loan
Interests |
| | | Warrants | | | | Total | |
Net realized gain (loss) | | $ | (42,300 | ) | | $ | — | | | $ | 292,832 | | | $ | 12,927 | | | $ | — | | | $ | — | | | $ | 263,459 | |
Net change in unrealized appreciation (depreciation)(c)(d) | | | — | | | | (184,142 | ) | | | (8,739,284 | ) | | | 355,047 | | | | (500,739 | ) | | | (47,191 | ) | | | (9,116,309 | ) |
Purchases | | | — | | | | — | | | | 69,939,632 | | | | — | | | | — | | | | 33 | | | | 69,939,665 | |
Sales | | | (957,700 | ) | | | — | | | | (41,890,613 | ) | | | (39,663 | ) | | | — | | | | — | | | | (42,887,976 | ) |
| | | | | | | | | | | | | | | | | | | | | | | | | | | | |
| | | | | | | |
Closing balance, as of December 31, 2022 | | $ | — | | | $ | 1,771,094 | | | $ | 202,600,348 | | | $ | 4,690,451 | | | $ | (596,398 | ) | | $ | 421,148 | | | $ | 208,886,643 | |
| | | | | | | | | | | | | | | | | | | | | | | | | | | | |
| | | | | | | |
Net change in unrealized appreciation (depreciation) on investments still held at December 31, 2022(d) | | $ | — | | | $ | (184,142) | | | $ | (8,518,144 | ) | | $ | 355,047 | | | $ | (575,737) | | | $ | (47,191 | ) | | $ | (8,970,167 | ) |
| | | | | | | | | | | | | | | | | | | | | | | | | | | | |
| | (a) | As of December 31, 2021, the Fund used observable inputs in determining the value of certain investments. As of December 31, 2022, the Fund used significant unobservable inputs in determining the value of the same investments. As a result, investments at beginning of period value were transferred from Level 2 to Level 3 in the disclosure hierarchy. | |
| | (b) | As of December 31, 2021, the Fund used significant unobservable inputs in determining the value of certain investments. As of December 31, 2022, the Fund used observable inputs in determining the value of the same investments. As a result, investments at beginning of period value were transferred from Level 3 to Level 2 in the disclosure hierarchy. | |
| | (c) | Included in the related net change in unrealized appreciation (depreciation) in the Consolidated Statement of Operations. | |
| | (d) | Any difference between net change in unrealized appreciation (depreciation) and net change in unrealized appreciation (depreciation) on investments still held at December 31, 2022 is generally due to investments no longer held or categorized as Level 3 at period end. | |
The following table summarizes the valuation approaches used and unobservable inputs utilized by the BlackRock Valuation Committee (the “Valuation Committee”) to determine the value of certain of the Fund’s Level 3 financial instruments as of period end. The table does not include Level 3 financial instruments with values based upon unadjusted third-party pricing information in the amount of $18,872,343. A significant change in third party information could result in a significantly lower or higher value of such Level 3 financial instruments.
| | | | | | | | | | | | | | | | | | | | |
| | | | Value | | |
| Valuation
Approach |
| |
| Unobservable
Inputs |
| |
| Range of
Unobservable
InputsUtilized |
(a) | |
| Weighted
Average of
Unobservable
Inputs Based
on Fair Value |
|
Assets | | | | | | | | | | | | | | | | | | | | |
Corporate Bonds | | $ | 1,771,094 | | | | Income | | | | Discount Rate | | | | 15% | | | | — | |
Floating Rate Loan Interests | | | 183,131,607 | | | | Income | | | | Discount Rate | | | | 10% - 18% | | | | 13% | |
| | | | | | | Market | | | | Time to Exit | | | | 2.3 years | | | | — | |
| | | | | | | | | | | Volatility | | | | 65% | | | | — | |
| | | | | |
Preferred Stocks | | | 4,690,451 | | | | Income | | | | Discount Rate | | | | 12 -13% | | | | 13% | |
| | | | | | | Market | | | | Revenue Multiple | | | | 3.45x - 3.95x | | | | 3.70x | |
| | | | | | | | | | | Recent Transactions | | | | (b) | | | | — | |
Warrants | | | 421,148 | | | | Market | | | | Revenue Multiple | | | | 1.50x -12.89x | | | | 2.95x | |
| | | | | | | | | | | Time to Exit | | | | 1.0 -4.3 years | | | | 2.5 years | |
| | | | | | | | | | | Volatility | | | | 55% -65% | | | | 63% | |
| | | | | | | | | | | | | | | | | | | | |
| | | | | |
| | $ | 190,014,300 | | | | | | | | | | | | | | | | | |
| | | | | | | | | | | | | | | | | | | | |
| | (a) | A significant change in unobservable input would have resulted in a correlated (inverse) significant change to value. | |
| | (b) | For the period end December 31, 2022, the valuation technique for certain investments classified as Preferred Stock used recent prior transaction prices as inputs within the model used for the approximation of fair value. | |
See notes to financial statements.
| | |
| 40 | | 2 0 2 2 BLACK ROCK ANNUAL REPORT TO SHAREHOLDERS |
Consolidated Statement of Assets and Liabilities
December 31, 2022
| | | | | | | | |
| | | BlackRock Credit
Strategies Fund | |
| |
| | |
ASSETS | | | | | | | | |
Investments, at value — unaffiliated(a) | | | | | | $ | 477,143,629 | |
Investments, at value — affiliated(b) | | | | | | | 4,712,066 | |
Cash | | | | | | | 315,682 | |
Cash pledged: | | | | | | | | |
Futures contracts | | | | | | | 1,323,000 | |
Centrally cleared swaps | | | | | | | 1,382,000 | |
Foreign currency, at value(c) | | | | | | | 376,466 | |
Receivables: | | | | | | | | |
Investments sold | | | | | | | 2,846,395 | |
Capital shares sold | | | | | | | 1,376,301 | |
Dividends — unaffiliated | | | | | | | 52,022 | |
Dividends — affiliated | | | | | | | 8,825 | |
Interest — unaffiliated | | | | | | | 6,092,334 | |
Due from broker | | | | | | | 600,000 | |
Variation margin on futures contracts | | | | | | | 83,313 | |
Variation margin on centrally cleared swaps | | | | | | | 3,214 | |
Unrealized appreciation on: | | | | | | | | |
Forward foreign currency exchange contracts | | | | | | | 1,031 | |
Unfunded floating rate loan interests | | | | | | | 8,427 | |
Prepaid expenses | | | | | | | 208,717 | |
| | | | | | | | |
| | |
Total assets | | | | | | | 496,533,422 | |
| | | | | | | | |
| | |
LIABILITIES | | | | | | | | |
Options written, at value(d) | | | | | | | 11,210 | |
Payables: | | | | | | | | |
Investments purchased | | | | | | | 6,352,327 | |
Accounting services fees | | | | | | | 31,771 | |
Bank borrowings | | | | | | | 55,850,000 | |
Capital shares redeemed | | | | | | | 264,769 | |
Custodian fees | | | | | | | 23,200 | |
Deferred capital gain tax | | | | | | | 32,715 | |
Income dividend distributions | | | | | | | 2,220,647 | |
Interest expense and fees | | | | | | | 237,355 | |
Investment advisory fees | | | | | | | 416,961 | |
Trustees’ and Officer’s fees | | | | | | | 378 | |
Other accrued expenses | | | | | | | 27,325 | |
Professional fees | | | | | | | 178,781 | |
Service and distribution fees | | | | | | | 82,991 | |
Variation margin on futures contracts | | | | | | | 91,236 | |
Unrealized depreciation on: | | | | | | | | |
Forward foreign currency exchange contracts | | | | | | | 11,234 | |
Unfunded floating rate loan interests | | | | | | | 717,048 | |
| | | | | | | | |
| | |
Total liabilities | | | | | | | 66,549,948 | |
| | | | | | | | |
| | |
NET ASSETS | | | | | | $ | 429,983,474 | |
| | | | | | | | |
| | |
NET ASSETS CONSIST OF | | | | | | | | |
Paid-in capital | | | | | | $ | 509,783,707 | |
Accumulated loss | | | | | | | (79,800,233 | ) |
| | | | | | | | |
| | |
NET ASSETS | | | | | | $ | 429,983,474 | |
| | | | | | | | |
| | |
(a) Investments, at cost — unaffiliated | | | | | | $ | 509,370,423 | |
(b) Investments, at cost — affiliated | | | | | | $ | 5,147,387 | |
(c) Foreign currency, at cost | | | | | | $ | 374,344 | |
(d) Premiums received | | | | | | $ | 24,522 | |
| | |
CONSOLIDATED FINANCIAL STATEMENTS | | 41 |
Consolidated Statement of Assets and Liabilities (continued)
December 31, 2022
| | | | |
| | | BlackRock Credit
Strategies Fund | |
| |
NET ASSET VALUE | | | | |
| |
| Institutional | | | |
| |
Net assets | | $ | 293,515,315 | |
| |
| | | | |
| |
Shares outstanding | | | 34,607,531 | |
| |
| | | | |
| |
Net asset value | | $ | 8.48 | |
| |
| | | | |
| |
Shares authorized | | | Unlimited | |
| |
| | | | |
| |
Par value | | $ | 0.001 | |
| |
| | | | |
| |
| Class A | | | |
| |
Net assets | | $ | 97,062,398 | |
| |
| | | | |
| |
Shares outstanding | | | 11,415,107 | |
| |
| | | | |
| |
Net asset value | | $ | 8.50 | |
| |
| | | | |
| |
Shares authorized | | | Unlimited | |
| |
| | | | |
| |
Par value | | $ | 0.001 | |
| |
| | | | |
| |
| Class U | | | |
| |
Net assets | | $ | 39,203,494 | |
| |
| | | | |
| |
Shares outstanding | | | 4,610,535 | |
| |
| | | | |
| |
Net asset value | | $ | 8.50 | |
| |
| | | | |
| |
Shares authorized | | | Unlimited | |
| |
| | | | |
| |
Par value | | $ | 0.001 | |
| |
| | | | |
| |
| Class W | | | |
| |
Net assets | | $ | 202,267 | |
| |
| | | | |
| |
Shares outstanding | | | 23,787 | |
| |
| | | | |
| |
Net asset value | | $ | 8.50 | |
| |
| | | | |
| |
Shares authorized | | | Unlimited | |
| |
| | | | |
| |
Par value | | $ | 0.001 | |
| | | | |
See notes to consolidated financial statements.
| | |
| 42 | | 2 0 2 2 BLACK ROCK ANNUAL REPORT TO SHAREHOLDERS |
Consolidated Statement of Operations
Year Ended December 31, 2022
| | | | | | | | |
| | | BlackRock Credit
Strategies Fund | |
| |
| | |
INVESTMENT INCOME | | | | | | | | |
Dividends — unaffiliated | | | | | | $ | 467,495 | |
Dividends — affiliated | | | | | | | 120,800 | |
Interest — unaffiliated | | | | | | | 37,325,662 | |
Payment-in-kind interest — unaffiliated | | | | | | | 3,039,127 | |
| | | | | | | | |
| | |
Total investment income | | | | | | | 40,953,084 | |
| | | | | | | | |
| | |
EXPENSES | | | | | | | | |
Investment advisory | | | | | | | 5,194,693 | |
Service and distribution — class specific | | | | | | | 1,063,266 | |
Professional | | | | | | | 376,841 | |
Recoupment of past waived and/or reimbursed fees | | | | | | | 306,794 | |
Transfer agent — class specific | | | | | | | 279,096 | |
Custodian | | | | | | | 217,120 | |
Registration | | | | | | | 124,619 | |
Trustees and Officer | | | | | | | 102,439 | |
Accounting services | | | | | | | 98,649 | |
Offering | | | | | | | 74,504 | |
Printing and postage | | | | | | | 35,771 | |
Recoupment of past waived and/or reimbursed fees — class specific | | | | | | | 2,967 | |
Miscellaneous | | | | | | | 32,399 | |
| | | | | | | | |
| | |
Total expenses excluding interest expense | | | | | | | 7,909,158 | |
Interest expense and fees | | | | | | | 2,753,248 | |
| | | | | | | | |
Total expenses | | | | | | | 10,662,406 | |
Less: | | | | | | | | |
Fees waived and/or reimbursed by the Manager | | | | | | | (18,517 | ) |
| | | | | | | | |
| | |
Total expenses after fees waived and/or reimbursed | | | | | | | 10,643,889 | |
| | | | | | | | |
| | |
Net investment income | | | | | | | 30,309,195 | |
| | | | | | | | |
| | |
REALIZED AND UNREALIZED GAIN (LOSS) | | | | | | | | |
Net realized gain (loss) from: | | | | | | | | |
Investments — unaffiliated | | | | | | | (49,914,373 | ) |
Investments — affiliated | | | | | | | (14,605 | ) |
Forward foreign currency exchange contracts | | | | | | | 9,748,016 | |
Foreign currency transactions | | | | | | | (2,626,286 | ) |
Futures contracts | | | | | | | (2,001,064 | ) |
Options written | | | | | | | 401,152 | |
Swaps | | | | | | | (716,053 | ) |
| | | | | | | | |
| | |
| | | | | | | (45,123,213 | ) |
| | | | | | | | |
Net change in unrealized appreciation (depreciation) on: | | | | | | | | |
Investments — unaffiliated(a) | | | | | | | (24,058,998 | ) |
Investments — affiliated | | | | | | | (452,108 | ) |
Forward foreign currency exchange contracts | | | | | | | 699,677 | |
Foreign currency translations | | | | | | | 2,733 | |
Futures contracts | | | | | | | 407,762 | |
Options written | | | | | | | 13,312 | |
Swaps | | | | | | | (666,374 | ) |
Unfunded floating rate loan interests | | | | | | | (607,829 | ) |
| | | | | | | | |
| | |
| | | | | | | (24,661,825 | ) |
| | | | | | | | |
| | |
Net realized and unrealized loss | | | | | | | (69,785,038 | ) |
| | | | | | | | |
| | |
NET DECREASE IN NET ASSETS RESULTING FROM OPERATIONS | | | | | | $ | (39,475,843 | ) |
| | | | | | | | |
| | |
(a) Net of increase in deferred capital gain tax of | | | | | | $ | (32,715 | ) |
See notes to consolidated financial statements.
| | |
CONSOLIDATED FINANCIAL STATEMENTS | | 43 |
Statements of Changes in Net Assets
| | | | | | | | | | | | | | | | |
| | | BlackRock Credit
Strategies Fund | |
| | | |
| | | | | | |
| Year Ended
12/31/22 | (a)
| |
| Year Ended
12/31/21 |
|
| | | | |
INCREASE (DECREASE) IN NET ASSETS | | | | | | | | | | | | | | | | |
| | | | |
OPERATIONS | | | | | | | | | | | | | | | | |
Net investment income | | | | | | $ | 30,309,195 | | | | | | | $ | 14,407,278 | |
Net realized gain (loss) | | | | | | | (45,123,213 | ) | | | | | | | 5,715,806 | |
Net change in unrealized appreciation (depreciation) | | | | | | | (24,661,825 | ) | | | | | | | (16,822,512 | ) |
| | | | | | | | | | | | | | | | |
| | | | |
Net increase (decrease) in net assets resulting from operations | | | | | | | (39,475,843 | ) | | | | | | | 3,300,572 | |
| | | | | | | | | | | | | | | | |
| | | | |
DISTRIBUTIONS TO SHAREHOLDERS(b) | | | | | | | | | | | | | | | | |
Institutional | | | | | | | (22,591,727 | ) | | | | | | | (14,497,011 | ) |
Class A | | | | | | | (7,027,288 | ) | | | | | | | (5,565,116 | ) |
Class U | | | | | | | (2,367,084 | ) | | | | | | | (405,744 | ) |
Class W | | | | | | | (14,156 | ) | | | | | | | (8,592 | ) |
| | | | | | | | | | | | | | | | |
| | | | |
Decrease in net assets resulting from distributions to shareholders | | | | | | | (32,000,255 | ) | | | | | | | (20,476,463 | ) |
| | | | | | | | | | | | | | | | |
| | | | |
CAPITAL SHARE TRANSACTIONS | | | | | | | | | | | | | | | | |
Shares sold and issued | | | | | | | 132,686,996 | | | | | | | | 268,799,575 | |
Reinvestment of distributions | | | | | | | 8,401,447 | | | | | | | | 7,139,004 | |
Redemption of shares resulting from repurchase offers | | | | | | | (67,853,052 | ) | | | | | | | (5,619,865 | ) |
| | | | | | | | | | | | | | | | |
| | | | |
Net increase in net assets derived from capital share transactions | | | | | | | 73,235,391 | | | | | | | | 270,318,714 | |
| | | | | | | | | | | | | | | | |
| | | | |
NET ASSETS | | | | | | | | | | | | | | | | |
Total increase in net assets | | | | | | | 1,759,293 | | | | | | | | 253,142,823 | |
Beginning of year | | | | | | | 428,224,181 | | | | | | | | 175,081,358 | |
| | | | | | | | | | | | | | | | |
| | | | |
End of year | | | | | | $ | 429,983,474 | | | | | | | $ | 428,224,181 | |
| | | | | | | | | | | | | | | | |
| (a) | Consolidated Statement of Changes in Net Assets. |
| (b) | Distributions for annual periods determined in accordance with U.S. federal income tax regulations. |
See notes to consolidated financial statements.
| | |
| 44 | | 2 0 2 2 BLACK ROCK ANNUAL REPORT TO SHAREHOLDERS |
Consolidated Statement of Cash Flows
Year Ended December 31, 2022
| | | | |
| | | BlackRock Credit
Strategies Fund | |
| |
| |
CASH PROVIDED BY (USED FOR) OPERATING ACTIVITIES | | | | |
Net decrease in net assets resulting from operations | | $ | (39,475,843 | ) |
Adjustments to reconcile net decrease in net assets resulting from operations to net cash used for operating activities: | | | | |
Proceeds from sales of long-term investments and principal paydowns/payups | | | 302,803,015 | |
Purchases of long-term investments | | | (374,495,011 | ) |
Net proceeds from sales of short-term securities | | | 8,050,315 | |
Amortization of premium and accretion of discount on investments and other fees | | | (1,593,941 | ) |
Paid-in-kind income | | | (133,040 | ) |
Premiums paid on closing options written | | | (201,563 | ) |
Premiums received from options written | | | 625,034 | |
Net realized loss on investments and options written | | | 49,527,826 | |
Net unrealized depreciation on investments, options written, swaps, foreign currency translations and unfunded floating rate loan interests | | | 24,355,665 | |
(Increase) Decrease in Assets | | | | |
Receivables | | | | |
Dividends — affiliated | | | (8,765 | ) |
Dividends — unaffiliated | | | (42,538 | ) |
Interest — unaffiliated | | | (4,707 | ) |
Variation margin on futures contracts | | | (76,165 | ) |
Variation margin on centrally cleared swaps | | | 50,404 | |
Swap premiums paid | | | 29,699 | |
Prepaid expenses | | | (163,084 | ) |
Deferred offering costs | | | 74,504 | |
Increase (Decrease) in Liabilities | | | | |
Payables | | | | |
Accounting services fees | | | 12,015 | |
Custodian fees | | | (20,044 | ) |
Deferred capital gain tax | | | 32,715 | |
Interest expense and fees | | | 25,796 | |
Investment advisory fees | | | 14,620 | |
Trustees’ and Officer’s fees | | | 378 | |
Other accrued expenses | | | (533,119 | ) |
Professional fees | | | (47,430 | ) |
Service and distribution fees | | | 2,322 | |
Variation margin on futures contracts | | | 75,038 | |
| | | | |
| |
Net cash used for operating activities | | | (31,115,904 | ) |
| | | | |
| |
CASH PROVIDED BY (USED FOR) FINANCING ACTIVITIES | | | | |
Cash dividends paid to shareholders | | | (22,942,436 | ) |
Payments for bank borrowings | | | (233,800,000 | ) |
Net payments on redemption of capital shares including change in redemptions payable | | | (68,350,354 | ) |
Proceeds from bank borrowings | | | 216,400,000 | |
Decrease in bank overdraft | | | (2,175,359 | ) |
Proceeds from issuance of capital shares | | | 140,767,386 | |
| | | | |
| |
Net cash provided by financing activities | | | 29,899,237 | |
| | | | |
| |
CASH IMPACT FROM FOREIGN EXCHANGE FLUCTUATIONS | | | | |
Cash impact from foreign exchange fluctuations | | | (5,558 | ) |
| | | | |
| |
CASH AND FOREIGN CURRENCY | | | | |
Net decrease in restricted and unrestricted cash and foreign currency | | | (1,222,225 | ) |
Restricted and unrestricted cash and foreign currency at beginning of year | | | 5,219,373 | |
| | | | |
| |
Restricted and unrestricted cash and foreign currency at end of year | | $ | 3,997,148 | |
| | | | |
| |
SUPPLEMENTAL DISCLOSURE OF CASH FLOW INFORMATION | | | | |
Cash paid during the year for interest expense | | $ | 2,727,452 | |
| | | | |
| |
NON-CASH FINANCING ACTIVITIES | | | | |
Reinvestment of distributions | | $ | 8,401,447 | |
| | | | |
| | |
CONSOLIDATED FINANCIAL STATEMENTS | | 45 |
Consolidated Statement of Cash Flows (continued)
Year Ended December 31, 2022
| | | | |
| | | BlackRock Credit
Strategies Fund | |
| |
RECONCILIATION OF RESTRICTED AND UNRESTRICTED CASH AND FOREIGN CURRENCY AT THE END OF YEAR TO THE CONSOLIDATED STATEMENT OF ASSETS AND LIABILITIES | | | | |
Cash | | $ | 315,682 | |
Cash pledged | | | | |
Futures contracts | | | 1,323,000 | |
Centrally cleared swaps | | | 1,382,000 | |
Foreign currency at value | | | 376,466 | |
Due from broker | | | 600,000 | |
| | | | |
| |
| | $ | 3,997,148 | |
| | | | |
See notes to consolidated financial statements.
| | |
| 46 | | 2 0 2 2 BLACK ROCK ANNUAL REPORT TO SHAREHOLDERS |
Financial Highlights
(For a share outstanding throughout each period)
| | | | | | | | | | | | | | | | | | | | | | | | | | | | | | | | | | | | | | | | |
| | | BlackRock Credit Strategies Fund |
| |
| | | Institutional |
| | | | |
| | |
| Year Ended
12/31/22(a) |
| | |
| Year Ended
12/31/21 |
| | |
| Year Ended
12/31/20 |
| | |
| Period from
02/28/19(b) to 12/31/19 |
|
| | | | | | | | | |
Net asset value, beginning of period | | | | | | | | $ | 9.96 | | | | | | | | | $ | 10.41 | | | | | | | | | $ | 10.24 | | | | | | | | | $ | 10.00 | |
| | | | | | | | | | | | | | | | | | | | | | | | | | | | | | | | | | | | | | | | |
| | | | | | | | |
Net investment income(c) | | | | | | | | | 0.63 | | | | | | | | | | 0.55 | | | | | | | | | | 0.53 | | | | | | | | | | 0.38 | |
Net realized and unrealized gain (loss) | | | | | | | | | (1.43 | ) | | | | | | | | | (0.28 | ) | | | | | | | | | 0.25 | | | | | | | | | | 0.35 | |
| | | | | | | | | | | | | | | | | | | | | | | | | | | | | | | | | | | | | | | | |
| | | | | | | | |
Net increase (decrease) from investment operations | | | | | | | | | (0.80 | ) | | | | | | | | | 0.27 | | | | | | | | | | 0.78 | | | | | | | | | | 0.73 | |
| | | | | | | | | | | | | | | | | | | | | | | | | | | | | | | | | | | | | | | | |
| | | | | | | | |
Distributions(d) | | | | | | | | | | | | | | | | | | | | | | | | | | | | | | | | | | | | | | | | |
From net investment income | | | | | | | | | (0.68 | ) | | | | | | | | | (0.67 | ) | | | | | | | | | (0.49 | ) | | | | | | | | | (0.45 | ) |
From net realized gain | | | | | | | | | — | | | | | | | | | | (0.05 | ) | | | | | | | | | (0.12 | ) | | | | | | | | | (0.04 | ) |
| | | | | | | | | | | | | | | | | | | | | | | | | | | | | | | | | | | | | | | | |
| | | | | | | | |
Total distributions | | | | | | | | | (0.68 | ) | | | | | | | | | (0.72 | ) | | | | | | | | | (0.61 | ) | | | | | | | | | (0.49 | ) |
| | | | | | | | | | | | | | | | | | | | | | | | | | | | | | | | | | | | | | | | |
| | | | | | | | |
Net asset value, end of period | | | | | | | | $ | 8.48 | | | | | | | | | $ | 9.96 | | | | | | | | | $ | 10.41 | | | | | | | | | $ | 10.24 | |
| | | | | | | | | | | | | | | | | | | | | | | | | | | | | | | | | | | | | | | | |
| | | | | | | | |
Total Return(e) | | | | | | | | | | | | | | | | | | | | | | | | | | | | | | | | | | | | | | | | |
Based on net asset value | | | | | | | | | (8.17 | )% | | | | | | | | | 2.58 | % | | | | | | | | | 8.09 | % | | | | | | | | | 7.41 | %(f) |
| | | | | | | | | | | | | | | | | | | | | | | | | | | | | | | | | | | | | | | | |
| | | | | | | | |
Ratios to Average Net Assets(g) | | | | | | | | | | | | | | | | | | | | | | | | | | | | | | | | | | | | | | | | |
Total expenses(h) | | | | | | | | | 2.20 | %(i) | | | | | | | | | 2.12 | % | | | | | | | | | 2.90 | % | | | | | | | | | 3.44 | %(j)(k) |
| | | | | | | | | | | | | | | | | | | | | | | | | | | | | | | | | | | | | | | | |
| | | | | | | | |
Total expenses after fees waived and/or reimbursed | | | | | | | | | 2.19 | %(i) | | | | | | | | | 2.11 | % | | | | | | | | | 2.59 | % | | | | | | | | | 1.84 | %(j) |
| | | | | | | | | | | | | | | | | | | | | | | | | | | | | | | | | | | | | | | | |
| | | | | | | | |
Total expenses after fees waived and/or reimbursed and excluding interest expense and fees | | | | | | | | | 1.57 | %(i) | | | | | | | | | 1.66 | % | | | | | | | | | 1.66 | % | | | | | | | | | 1.47 | %(j) |
| | | | | | | | | | | | | | | | | | | | | | | | | | | | | | | | | | | | | | | | |
Net investment income | | | | | | | | | 7.09 | % | | | | | | | | | 5.30 | % | | | | | | | | | 5.40 | % | | | | | | | | | 4.45 | %(j) |
| | | | | | | | | | | | | | | | | | | | | | | | | | | | | | | | | | | | | | | | |
| | | | | | | | |
Supplemental Data | | | | | | | | | | | | | | | | | | | | | | | | | | | | | | | | | | | | | | | | |
Net assets, end of period (000) | | | | | | | | $ | 293,515 | | | | | | | | | $ | 285,729 | | | | | | | | | $ | 128,769 | | | | | | | | | $ | 105,796 | |
| | | | | | | | | | | | | | | | | | | | | | | | | | | | | | | | | | | | | | | | |
| | | | | | | | |
Borrowings outstanding, end of period (000) | | | | | | | | $ | 55,850 | | | | | | | | | $ | 73,250 | | | | | | | | | $ | 39,500 | | | | | | | | | $ | 16,000 | |
| | | | | | | | | | | | | | | | | | | | | | | | | | | | | | | | | | | | | | | | |
| | | | | | | | |
Asset coverage, end of period per $1,000 of bank borrowings | | | | | | | | $ | 8,699 | | | | | | | | | $ | 6,846 | | | | | | | | | $ | 5,432 | | | | | | | | | $ | 7,612 | |
| | | | | | | | | | | | | | | | | | | | | | | | | | | | | | | | | | | | | | | | |
| | | | | | | | |
Portfolio turnover rate | | | | | | | | | 55 | % | | | | | | | | | 55 | % | | | | | | | | | 77 | % | | | | | | | | | 43 | % |
| | | | | | | | | | | | | | | | | | | | | | | | | | | | | | | | | | | | | | | | |
| (a) | Consolidated Financial Highlights. |
| (b) | Commencement of operations. |
| (c) | Based on average shares outstanding. |
| (d) | Distributions for annual periods determined in accordance with U.S. federal income tax regulations. |
| (e) | Where applicable, assumes the reinvestment of distributions. The Fund is a continuously offered closed-end fund, the Shares of which are offered at net asset value. No secondary market for the Fund’s Shares exists. |
| (g) | Excludes fees and expenses incurred indirectly as a result of investments in underlying funds. |
| (h) | Includes recoupment of past waived and/or reimbursed fees. Excluding the recoupment of past waived and/or reimbursed fees, the expense ratios were as follows: |
| | | | | | | | | | | | | | | | |
| | |
| Year Ended
12/31/22 | (a)
| |
| Year Ended
12/31/21 |
| |
| Year Ended
12/31/20 |
| |
| Period from
02/28/19
to 12/31/19 |
(b)
|
Expense ratios | | | 2.13 | % | | | 1.93 | % | | | N/A | | | | N/A | |
| | | | | | | | | | | | | | | | |
| (i) | Includes non-recurring expenses of offering costs. Without these costs, total expenses, total expenses after fees waived and/or reimbursed and total expenses after fees waived and/or reimbursed and excluding interest expense would have been 2.18%, 2.18% and 1.55%, respectively. |
| (k) | Audit and offering costs were not annualized in the calculation of the expense ratio. If these expenses were annualized, total expenses would have been 3.62%. |
See notes to financial statements.
Financial Highlights (continued)
(For a share outstanding throughout each period)
| | | | | | | | | | | | | | | | | | | | | | | | |
| | | BlackRock Credit Strategies Fund (continued) | |
| |
| | | Class A | |
| | | |
| |
| Year Ended
12/31/22(a) |
| |
| Year Ended
12/31/21 |
| |
| Period from
04/01/20(b) to 12/31/20 |
|
| | | | | | | |
Net asset value, beginning of period | | | | | | $ | 9.97 | | | | | | | $ | 10.42 | | | | | | | $ | 8.48 | |
| | | | | | | | | | | | | | | | | | | | | | | | |
| | | | | | |
Net investment income(c) | | | | | | | 0.57 | | | | | | | | 0.47 | | | | | | | | 0.33 | |
Net realized and unrealized gain (loss) | | | | | | | (1.44 | ) | | | | | | | (0.28 | ) | | | | | | | 2.03 | |
| | | | | | | | | | | | | | | | | | | | | | | | |
| | | | | | |
Net increase (decrease) from investment operations | | | | | | | (0.87 | ) | | | | | | | 0.19 | | | | | | | | 2.36 | |
| | | | | | | | | | | | | | | | | | | | | | | | |
| | | | | | |
Distributions(d) | | | | | | | | | | | | | | | | | | | | | | | | |
From net investment income | | | | | | | (0.60 | ) | | | | | | | (0.59 | ) | | | | | | | (0.30 | ) |
From net realized gain | | | | | | | — | | | | | | | | (0.05 | ) | | | | | | | (0.12 | ) |
| | | | | | | | | | | | | | | | | | | | | | | | |
| | | | | | |
Total distributions | | | | | | | (0.60 | ) | | | | | | | (0.64 | ) | | | | | | | (0.42 | ) |
| | | | | | | | | | | | | | | | | | | | | | | | |
| | | | | | |
Net asset value, end of period | | | | | | $ | 8.50 | | | | | | | $ | 9.97 | | | | | | | $ | 10.42 | |
| | | | | | | | | | | | | | | | | | | | | | | | |
| | | | | | |
Total Return(e) | | | | | | | | | | | | | | | | | | | | | | | | |
Based on net asset value | | | | | | | (8.87 | )% | | | | | | | 1.82 | % | | | | | | | 28.09 | %(f) |
| | | | | | | | | | | | | | | | | | | | | | | | |
| | | | | | |
Ratios to Average Net Assets(g) | | | | | | | | | | | | | | | | | | | | | | | | |
Total expenses(h) | | | | | | | 2.87 | %(i) | | | | | | | 2.84 | % | | | | | | | 3.35 | %(j) |
| | | | | | | | | | | | | | | | | | | | | | | | |
| | | | | | |
Total expenses after fees waived and/or reimbursed | | | | | | | 2.87 | %(i) | | | | | | | 2.82 | % | | | | | | | 3.25 | %(j) |
| | | | | | | | | | | | | | | | | | | | | | | | |
| | | | | | |
Total expenses after fees waived and/or reimbursed and excluding interest expense and fees | | | | | | | 2.25 | %(i) | | | | | | | 2.39 | % | | | | | | | 2.38 | %(j) |
| | | | | | | | | | | | | | | | | | | | | | | | |
| | | | | | |
Net investment income | | | | | | | 6.34 | % | | | | | | | 4.57 | % | | | | | | | 4.45 | %(j) |
| | | | | | | | | | | | | | | | | | | | | | | | |
| | | | | | |
Supplemental Data | | | | | | | | | | | | | | | | | | | | | | | | |
| | | | | | |
Net assets, end of period (000) | | | | | | $ | 97,062 | | | | | | | $ | 116,182 | | | | | | | $ | 46,313 | |
| | | | | | | | | | | | | | | | | | | | | | | | |
| | | | | | |
Borrowings outstanding, end of period (000) | | | | | | $ | 55,850 | | | | | | | $ | 73,250 | | | | | | | $ | 39,500 | |
| | | | | | | | | | | | | | | | | | | | | | | | |
| | | | | | |
Asset coverage, end of period per $1,000 of bank borrowings | | | | | | $ | 8,699 | | | | | | | $ | 6,846 | | | | | | | $ | 5,432 | |
| | | | | | | | | | | | | | | | | | | | | | | | |
| | | | | | |
Portfolio turnover rate | | | | | | | 55 | % | | | | | | | 55 | % | | | | | | | 77 | % |
| | | | | | | | | | | | | | | | | | | | | | | | |
| (a) | Consolidated Financial Highlights. |
| (b) | Commencement of operations. |
| (c) | Based on average shares outstanding. |
| (d) | Distributions for annual periods determined in accordance with U.S. federal income tax regulations. |
| (e) | Where applicable, excludes the effects of any sales charges and assumes the reinvestment of distributions. The Fund is a continuously offered closed-end fund, the Shares of which are offered at net asset value. No secondary market for the Fund’s Shares exists. |
| (g) | Excludes fees and expenses incurred indirectly as a result of investments in underlying funds. |
| (h) | Includes recoupment of past waived and/or reimbursed fees. Excluding the recoupment of past waived and/or reimbursed fees, the expense ratios were as follows: |
| | | | | | | | | | | | |
| | | | |
| | | Year Ended(a) 12/31/22 | | | Year Ended
12/31/21 | | | Period from 04/01/20(b) to 12/31/20 | |
Expense ratios | | | 2.80 | % | | | 2.65 | % | | | N/A | |
| | | | | | | | | | | | |
| (i) | Includes non-recurring expenses of offering costs. Without these costs, total expenses, total expenses after fees waived and/or reimbursed and total expenses after fees waived and/or reimbursed and excluding interest expense would have been 2.85%, 2.85% and 2.23%, respectively. |
See notes to financial statements.
| | |
| 48 | | 2 0 2 2 BLACK ROCK ANNUAL REPORT TO SHAREHOLDERS |
Financial Highlights (continued)
(For a share outstanding throughout each period)
| | | | | | | | | | | | | | | | |
| | | BlackRock Credit Strategies Fund (continued) | |
| | | Class U | |
| |
| Year Ended
12/31/22(a) |
| |
| Period from
07/12/21(b) to 12/31/21 |
|
| | | | | |
Net asset value, beginning of period | | | | | | $ | 9.97 | | | | | | | $ | 10.51 | |
| | | | | | | | | | | | | | | | |
Net investment income(c) | | | | | | | 0.58 | | | | | | | | 0.20 | |
Net realized and unrealized gain (loss) | | | | | | | (1.45 | ) | | | | | | | (0.38 | ) |
| | | | | | | | | | | | | | | | |
Net decrease from investment operations | | | | | | | (0.87 | ) | | | | | | | (0.18 | ) |
| | | | | | | | | | | | | | | | |
| | | | |
Distributions(d) | | | | | | | | | | | | | | | | |
From net investment income | | | | | | | (0.60 | ) | | | | | | | (0.31 | ) |
From net realized gain | | | | | | | — | | | | | | | | (0.05 | ) |
| | | | | | | | | | | | | | | | |
| | | | |
Total distributions | | | | | | | (0.60 | ) | | | | | | | (0.36 | ) |
| | | | | | | | | | | | | | | | |
| | | | |
Net asset value, end of period | | | | | | $ | 8.50 | | | | | | | $ | 9.97 | |
| | | | | | | | | | | | | | | | |
| | | | |
Total Return(e) | | | | | | | | | | | | | | | | |
Based on net asset value | | | | | | | (8.87 | )% | | | | | | | (1.74 | )%(f) |
| | | | | | | | | | | | | | | | |
| | | | |
Ratios to Average Net Assets(g) | | | | | | | | | | | | | | | | |
Total expenses(h) | | | | | | | 2.88 | %(i) | | | | | | | 2.80 | %(j) |
| | | | | | | | | | | | | | | | |
| | | | |
Total expenses after fees waived and/or reimbursed | | | | | | | 2.88 | %(i) | | | | | | | 2.80 | %(j) |
| | | | | | | | | | | | | | | | |
| | | | |
Total expenses after fees waived and/or reimbursed and excluding interest expense and fees | | | | | | | 2.24 | %(i) | | | | | | | 2.47 | %(j) |
| | | | | | | | | | | | | | | | |
| | | | |
Net investment income | | | | | | | 6.54 | % | | | | | | | 4.23 | %(j) |
| | | | | | | | | | | | | | | | |
| | | | |
Supplemental Data | | | | | | | | | | | | | | | | |
| | | | |
Net assets, end of period (000) | | | | | | $ | 39,203 | | | | | | | $ | 26,076 | |
| | | | | | | | | | | | | | | | |
| | | | |
Borrowings outstanding, end of period (000) | | | | | | $ | 55,850 | | | | | | | $ | 73,250 | |
| | | | | | | | | | | | | | | | |
| | | | |
Asset coverage, end of period per $1,000 of bank borrowings | | | | | | $ | 8,699 | | | | | | | $ | 6,846 | |
| | | | | | | | | | | | | | | | |
| | | | |
Portfolio turnover rate | | | | | | | 55 | % | | | | | | | 55 | %(k) |
| | | | | | | | | | | | | | | | |
| (a) | Consolidated Financial Highlights. |
| (b) | Commencement of operations. |
| (c) | Based on average shares outstanding. |
| (d) | Distributions for annual periods determined in accordance with U.S. federal income tax regulations. |
| (e) | Where applicable, assumes the reinvestment of distributions. The Fund is a continuously offered closed-end fund, the Shares of which are offered at net asset value. No secondary market for the Fund’s Shares exists. |
| (g) | Excludes fees and expenses incurred indirectly as a result of investments in underlying funds. |
| (h) | Includes recoupment of past waived and/or reimbursed fees. Excluding the recoupment of past waived and/or reimbursed fees, the expense ratios were as follows: |
| | | | | | | | |
| | |
| Year Ended
12/31/22 | (a)
| |
| Period from
07/12/21 to 12/31/21 |
(b) |
Expense ratios | | | 2.82 | % | | | 2.54 | % |
| | | | | | | | |
| (i) | Includes non-recurring expenses of offering costs. Without these costs, total expenses, total expenses after fees waived and/or reimbursed and total expenses after fees waived and/or reimbursed and excluding interest expense would have been 2.87%, 2.86% and 2.23%, respectively. |
| (k) | Portfolio turnover rate is representative of the Fund for the entire year. |
See notes to financial statements.
Financial Highlights (continued)
(For a share outstanding throughout each period)
| | | | | | | | | | | | | | | | |
| | | BlackRock Credit Strategies Fund (continued) | |
| | | Class W | |
| |
| Year Ended
12/31/22(a) |
| |
| Period from
07/12/21(b) to 12/31/21 |
|
| | | | | |
Net asset value, beginning of period | | | | | | $ | 9.97 | | | | | | | $ | 10.51 | |
| | | | | | | | | | | | | | | | |
Net investment income(c) | | | | | | | 0.57 | | | | | | | | 0.22 | |
Net realized and unrealized gain (loss) | | | | | | | (1.44 | ) | | | | | | | (0.40 | ) |
| | | | | | | | | | | | | | | | |
Net decrease from investment operations | | | | | | | (0.87 | ) | | | | | | | (0.18 | ) |
| | | | | | | | | | | | | | | | |
| | | | |
Distributions(d) | | | | | | | | | | | | | | | | |
From net investment income | | | | | | | (0.60 | ) | | | | | | | (0.31 | ) |
From net realized gain | | | | | | | — | | | | | | | | (0.05 | ) |
| | | | | | | | | | | | | | | | |
| | | | |
Total distributions | | | | | | | (0.60 | ) | | | | | | | (0.36 | ) |
| | | | | | | | | | | | | | | | |
| | | | |
Net asset value, end of period | | | | | | $ | 8.50 | | | | | | | $ | 9.97 | |
| | | | | | | | | | | | | | | | |
| | | | |
Total Return(e) | | | | | | | | | | | | | | | | |
Based on net asset value | | | | | | | (8.87 | )% | | | | | | | (1.74 | )%(f) |
| | | | | | | | | | | | | | | | |
| | | | |
Ratios to Average Net Assets(g) | | | | | | | | | | | | | | | | |
Total expenses(h) | | | | | | | 2.87 | %(i) | | | | | | | 2.70 | %(j) |
| | | | | | | | | | | | | | | | |
| | | | |
Total expenses after fees waived and/or reimbursed | | | | | | | 2.87 | %(i) | | | | | | | 2.70 | %(j) |
| | | | | | | | | | | | | | | | |
| | | | |
Total expenses after fees waived and/or reimbursed and excluding interest expense and fees | | | | | | | 2.25 | %(i) | | | | | | | 2.45 | %(j) |
| | | | | | | | | | | | | | | | |
| | | | |
Net investment income | | | | | | | 6.35 | % | | | | | | | 4.64 | %(j) |
| | | | | | | | | | | | | | | | |
| | | | |
Supplemental Data | | | | | | | | | | | | | | | | |
| | | | |
Net assets, end of period (000) | | | | | | $ | 202 | | | | | | | $ | 237 | |
| | | | | | | | | | | | | | | | |
| | | | |
Borrowings outstanding, end of period (000) | | | | | | $ | 55,850 | | | | | | | $ | 73,250 | |
| | | | | | | | | | | | | | | | |
| | | | |
Asset coverage, end of period per $1,000 of bank borrowings | | | | | | $ | 8,699 | | | | | | | $ | 6,846 | |
| | | | | | | | | | | | | | | | |
| | | | |
Portfolio turnover rate | | | | | | | 55 | % | | | | | | | 55 | %(k) |
| | | | | | | | | | | | | | | | |
| (a) | Consolidated Financial Highlights. |
| (b) | Commencement of operations. |
| (c) | Based on average shares outstanding. |
| (d) | Distributions for annual periods determined in accordance with U.S. federal income tax regulations. |
| (e) | Where applicable, excludes the effects of any sales charges and assumes the reinvestment of distributions. The Fund is a continuously offered closed-end fund, the Shares of which are offered at net asset value. No secondary market for the Fund’s Shares exists. |
| (g) | Excludes fees and expenses incurred indirectly as a result of investments in underlying funds. |
| (h) | Includes recoupment of past waived and/or reimbursed fees. Excluding the recoupment of past waived and/or reimbursed fees, the expense ratios were as follows: |
| | | | | | | | |
| | |
| Year Ended
12/31/22 | (a)
| |
| Period from
07/12/21to 12/31/21 |
(b) |
Expense ratios | | | 2.80 | % | | | 2.37 | % |
| | | | | | | | |
| (i) | Includes non-recurring expenses of offering costs. Without these costs, total expense, total expenses after fees waived and/or reimbursed, and total expenses after fees waived and/or reimbursed and excluding interest expense would have been 2.86, 2.85% and 2.24%, respectively. |
| (k) | Portfolio turnover rate is representative of the Fund for the entire year. |
See notes to financial statements.
| | |
| 50 | | 2 0 2 2 BLACK ROCK ANNUAL REPORT TO SHAREHOLDERS |
Notes to Consolidated Financial Statements
BlackRock Credit Strategies Fund (the “Fund”) is registered under the Investment Company Act of 1940, as amended (the “1940 Act”). The Fund is registered as a diversified, closed-end management investment company that has elected to operate as an interval fund. The Fund’s classification changed from non-diversified to diversified during the period. The Fund is organized as a Delaware statutory trust. The Fund engages in a continuous offering of shares and will offer to make quarterly repurchases of shares at net asset value (“NAV”), reduced by any applicable repurchase fee. The Fund determines and makes available for publication the NAV of its shares on a daily basis. The Fund’s shares are offered for sale daily through its Distributor (defined below) at the then-current NAV plus any applicable sales load. The price of the shares during the Fund’s continuous offering will fluctuate over time with the NAV of the shares. The sales load payable by each investor depends upon the amount invested in each share class by the investor in the Fund but may range from 0.00% to 3.50%.
The Fund offers four classes of shares designated as Institutional Shares, Class A Shares, Class U Shares and Class W Shares. Each class of shares have identical voting, dividend, liquidation and other rights and will be subject to the same terms and conditions, except that Class A, Class U and Class W Shares bear expenses related to the shareholder servicing and distribution of such shares.
The Fund, together with certain other registered investment companies advised by BlackRock Advisors, LLC (the “Manager”) or its affiliates, is included in a complex of funds referred to as the BlackRock Fixed-Income Complex.
Basis of Consolidation: The accompanying consolidated financial statements of the Fund include the account of CREDX Subsidiary, LLC (the “Taxable Subsidiary”), which is a wholly-owned taxable subsidiary of the Fund. The Taxable Subsidiary enables the Fund to hold investments that may produce non-qualifying income for tax purposes and satisfy regulated investment company tax requirements. Income earned and gains realized on the investment held by the Taxable Subsidiary are taxable to such subsidiary. A tax provision for income, if any, is shown as income tax in the Consolidated Statement of Operations for the Fund. A tax provision for realized and unrealized gains, if any, is included as a reduction of realized and/or unrealized gain (loss) in the Consolidated Statement of Operations for the Fund. The Fund may invest up to 25% of its total assets in the Taxable Subsidiary. The net assets of the Taxable Subsidiary as of period end were $121,168, which is less than 0.1% of the Fund’s consolidated net assets. Intercompany accounts and transactions, if any, have been eliminated. The Taxable Subsidiary is subject to the same investment policies and restrictions that apply to the Fund.
| 2. | SIGNIFICANT ACCOUNTING POLICIES |
The consolidated financial statements are prepared in conformity with accounting principles generally accepted in the United States of America (“U.S. GAAP”), which may require management to make estimates and assumptions that affect the reported amounts of assets and liabilities in the consolidated financial statements, disclosure of contingent assets and liabilities at the date of the consolidated financial statements and the reported amounts of increases and decreases in net assets from operations during the reporting period. Actual results could differ from those estimates. The Fund is considered an investment company under U.S. GAAP and follows the accounting and reporting guidance applicable to investment companies. Below is a summary of significant accounting policies:
Investment Transactions and Income Recognition: For financial reporting purposes, investment transactions are recorded on the dates the transactions are executed. Realized gains and losses on investment transactions are determined using the specific identification method. Dividend income and capital gain distributions, if any, are recorded on the ex-dividend dates. Non-cash dividends, if any, are recorded on the ex-dividend dates at fair value. Dividends from foreign securities where the ex-dividend dates may have passed are subsequently recorded when the Fund is informed of the ex-dividend dates. Under the applicable foreign tax laws, a withholding tax at various rates may be imposed on capital gains, dividends and interest. Upon notification from issuers, a portion of the dividend income received from a real estate investment trust may be redesignated as a reduction of cost of the related investment and/or realized gain. Interest income, including amortization and accretion of premiums and discounts on debt securities, and payment-in-kind interest is recognized daily on an accrual basis. Income, expenses and realized and unrealized gains and losses are allocated daily to each class based on its relative net assets. For convertible securities, premiums attributable to the debt instrument are amortized, but premiums attributable to the conversion feature are not amortized.
Foreign CurrencyTranslation: The Fund’s books and records are maintained in U.S. dollars. Securities and other assets and liabilities denominated in foreign currencies are translated into U.S. dollars using exchange rates determined as of the close of trading on the New York Stock Exchange (“NYSE”). Purchases and sales of investments are recorded at the rates of exchange prevailing on the respective dates of such transactions. Generally, when the U.S. dollar rises in value against a foreign currency, the investments denominated in that currency will lose value; the opposite effect occurs if the U.S. dollar falls in relative value.
The Fund does not isolate the portion of the results of operations arising as a result of changes in the exchange rates from the changes in the market prices of investments held or sold for financial reporting purposes. Accordingly, the effects of changes in exchange rates on investments are not segregated in the Consolidated Statement of Operations from the effects of changes in market prices of those investments, but are included as a component of net realized and unrealized gain (loss) from investments. Realized currency gains (losses) on foreign currency related transactions are reported as components of net realized gain (loss) for financial reporting purposes, whereas such components are generally treated as ordinary income for U.S. federal income tax purposes. The Fund has elected to treat realized gains (losses) from certain forward foreign currency exchange contracts as capital gain (loss) for U.S. federal income tax purposes.
Foreign Taxes: The Fund may be subject to foreign taxes (a portion of which may be reclaimable) on income, stock dividends, capital gains on investments, or certain foreign currency transactions. All foreign taxes are recorded in accordance with the applicable foreign tax regulations and rates that exist in the foreign jurisdictions in which the Fund invests. These foreign taxes, if any, are paid by the Fund and are reflected in its Consolidated Statement of Operations as follows: foreign taxes withheld at source are presented as a reduction of income, foreign taxes on securities lending income are presented as a reduction of securities lending income, foreign taxes on stock dividends are presented as “Foreign taxes withheld”, and foreign taxes on capital gains from sales of investments and foreign taxes on foreign currency transactions are included in their respective net realized gain (loss) categories. Foreign taxes payable or deferred as of December 31, 2022, if any, are disclosed in the Consolidated Statement of Assets and Liabilities.
| | |
NOTES TO CONSOLIDATED FINANCIAL STATEMENTS | | 51 |
Notes to Consolidated Financial Statements (continued)
The Fund files withholding tax reclaims in certain jurisdictions to recover a portion of amounts previously withheld. The Fund may record a reclaim receivable based on collectability, which includes factors such as the jurisdiction’s applicable laws, payment history and market convention. The Consolidated Statement of Operations includes tax reclaims recorded as well as professional and other fees, if any, associated with recovery of foreign withholding taxes.
Collateralization: If required by an exchange or counterparty agreement, the Fund may be required to deliver/deposit cash and/or securities to/with an exchange, or broker-dealer or custodian as collateral for certain investments.
Distributions: Distributions from net investment income are declared daily and paid monthly. Distributions of capital gains are recorded on the ex-dividend dates and made at least annually. The character and timing of distributions are determined in accordance with U.S. federal income tax regulations, which may differ from U.S. GAAP.
Deferred Compensation Plan: Under the Deferred Compensation Plan (the “Plan”) approved by the Board of Trustees of the Fund (the “Board”), the trustees who are not “interested persons” of the Fund, as defined in the 1940 Act (“Independent Trustees”), may defer a portion of their annual complex-wide compensation. Deferred amounts earn an approximate return as though equivalent dollar amounts had been invested in common shares of certain funds in the BlackRock Fixed-Income Complex selected by the Independent Trustees. This has the same economic effect for the Independent Trustees as if the Independent Trustees had invested the deferred amounts directly in certain funds in the BlackRock Fixed-Income Complex.
The Plan is not funded and obligations thereunder represent general unsecured claims against the general assets of the Fund, as applicable. Deferred compensation liabilities, if any, are included in the Trustees’ and Officer’s fees payable in the Consolidated Statement of Assets and Liabilities and will remain as a liability of the Fund until such amounts are distributed in accordance with the Plan. Net appreciation (depreciation) in the value of participants’ deferral accounts is allocated among the participating funds in the BlackRock Fixed-Income Complex and reflected as Trustees and Officer expense on the Consolidated Statement of Operations. The Trustees and Officer expense may be negative as a result of a decrease in value of the deferred accounts.
Offering Costs: Offering costs are amortized over a 12-month period beginning with the commencement of operations of a class of shares.
Indemnifications: In the normal course of business, the Fund enters into contracts that contain a variety of representations that provide general indemnification. The Fund’s maximum exposure under these arrangements is unknown because it involves future potential claims against the Fund, which cannot be predicted with any certainty.
Other: Expenses directly related to the Fund or its classes are charged to the Fund or the applicable class. Expenses directly related to the Fund and other shared expenses prorated to the Fund are allocated daily to each class based on its relative net assets or other appropriate methods. Other operating expenses shared by several funds, including other funds managed by the Manager, are prorated among those funds on the basis of relative net assets or other appropriate methods.
| 3. | INVESTMENT VALUATION AND FAIR VALUE MEASUREMENTS |
Investment Valuation Policies: The Fund’s investments are valued at fair value (also referred to as “market value” within the consolidated financial statements) each day that the Fund is open for business and, for financial reporting purposes, as of the report date. U.S. GAAP defines fair value as the price a fund would receive to sell an asset or pay to transfer a liability in an orderly transaction between market participants at the measurement date. The Board has approved the designation of the Fund’s Manager as the valuation designee for the Fund. The Fund determines the fair values of its financial instruments using various independent dealers or pricing services under the Manager’s policies. If a security’s market price is not readily available or does not otherwise accurately represent the fair value of the security, the security will be valued in accordance with the Manager’s policies and procedures as reflecting fair value. The Manager has formed a committee (the “Valuation Committee”) to develop pricing policies and procedures and to oversee the pricing function for all financial instruments, with assistance from other BlackRock pricing committees.
Fair Value Inputs and Methodologies: The following methods and inputs are used to establish the fair value of the Fund’s assets and liabilities:
| | • | | Equity investments traded on a recognized securities exchange are valued at that day’s official closing price, as applicable, on the exchange where the stock is primarily traded. Equity investments traded on a recognized exchange for which there were no sales on that day may be valued at the last available bid (long positions) or ask (short positions) price. |
| | • | | Fixed-income investments for which market quotations are readily available are generally valued using the last available bid price or current market quotations provided by independent dealers or third-party pricing services. Floating rate loan interests are valued at the mean of the bid prices from one or more independent brokers or dealers as obtained from a third-party pricing service. Pricing services generally value fixed-income securities assuming orderly transactions of an institutional round lot size, but a fund may hold or transact in such securities in smaller, odd lot sizes. Odd lots may trade at lower prices than institutional round lots. The pricing services may use matrix pricing or valuation models that utilize certain inputs and assumptions to derive values, including transaction data (e.g., recent representative bids and offers), market data, credit quality information, perceived market movements, news, and other relevant information. Certain fixed-income securities, including asset- backed and mortgage related securities may be valued based on valuation models that consider the estimated cash flows of each tranche of the entity, establish a benchmark yield and develop an estimated tranche specific spread to the benchmark yield based on the unique attributes of the tranche. The amortized cost method of valuation may be used with respect to debt obligations with sixty days or less remaining to maturity unless the Manager determines such method does not represent fair value. |
| | • | | Investments in open-end U.S. mutual funds (including money market funds) are valued at that day’s published NAV. |
| | • | | Futures contracts are valued based on that day’s last reported settlement or trade price on the exchange where the contract is traded. |
| | • | | Forward foreign currency exchange contracts are valued at the mean between the bid and ask prices and are determined as of the close of trading on the NYSE based on that day’s prevailing forward exchange rate for the underlying currencies. |
| | |
| 52 | | 2 0 2 2 BLACK ROCK ANNUAL REPORT TO SHAREHOLDERS |
Notes to Consolidated Financial Statements (continued)
| | • | | Exchange-traded options are valued at the mean between the last bid and ask prices at the close of the options market in which the options trade. An exchange-traded option for which there is no mean price is valued at the last bid (long positions) or ask (short positions) price. If no bid or ask price is available, the prior day’s price will be used, unless it is determined that the prior day’s price no longer reflects the fair value of the option. |
| | • | | Swap agreements are valued utilizing quotes received daily by independent pricing services or through brokers, which are derived using daily swap curves and models that incorporate a number of market data factors, such as discounted cash flows, trades and values of the underlying reference instruments. |
Generally, trading in foreign instruments is substantially completed each day at various times prior to the close of trading on the NYSE. Each business day, the Fund uses current market factors supplied by independent pricing services to value certain foreign instruments (“Systematic Fair Value Price”). The Systematic Fair Value Price is designed to value such foreign securities at fair value as of the close of trading on the NYSE, which follows the close of the local markets.
If events (e.g., market volatility, company announcement or a natural disaster) occur that are expected to materially affect the value of such investment, or in the event that application of these methods of valuation results in a price for an investment that is deemed not to be representative of the market value of such investment, or if a price is not available, the investment will be valued by the Valuation Committee in accordance with the Manager’s policies and procedures as reflecting fair value (“Fair Valued Investments”). The fair valuation approaches that may be used by the Valuation Committee include market approach, income approach and cost approach. Valuation techniques such as discounted cash flow, use of market comparables and matrix pricing are types of valuation approaches and are typically used in determining fair value. When determining the price for Fair Valued Investments, the Valuation Committee seeks to determine the price that the Fund might reasonably expect to receive or pay from the current sale or purchase of that asset or liability in an arm’s-length transaction. Fair value determinations shall be based upon all available factors that the Valuation Committee deems relevant and consistent with the principles of fair value measurement.
For investments in equity or debt issued by privately held companies or funds (“Private Company” or collectively, the “Private Companies”) and other Fair Valued Investments, the fair valuation approaches that are used by the Valuation Committee and third-party pricing services utilized by the Valuation Committee include one or a combination of, but not limited to, the following inputs.
| | |
| | | Standard Inputs Generally Considered By The Valuation Committee And Third-Party Pricing Services |
Market approach | | (i) recent market transactions, including subsequent rounds of financing, in the underlying investment or comparable issuers; (ii) recapitalizations and other transactions across the capital structure; and (iii) market multiples of comparable issuers. |
Income approach | | (i) future cash flows discounted to present and adjusted as appropriate for liquidity, credit, and/or market risks; (ii) quoted prices for similar investments or assets in active markets; and (iii) other risk factors, such as interest rates, yield curves, volatilities, prepayment speeds, loss severities, credit risks, recovery rates, liquidation amounts and/or default rates. |
Cost approach | | (i) audited or unaudited financial statements, investor communications and financial or operational metrics issued by the Private Company; (ii) changes in the valuation of relevant indices or publicly traded companies comparable to the Private Company; (iii) relevant news and other public sources; and (iv) known secondary market transactions in the Private Company’s interests and merger or acquisition activity in companies comparable to the Private Company. |
Investments in series of preferred stock issued by Private Companies are typically valued utilizing market approach in determining the enterprise value of the company. Such investments often contain rights and preferences that differ from other series of preferred and common stock of the same issuer. Enterprise valuation techniques such as an option pricing model (“OPM”), a probability weighted expected return model (“PWERM”), current value method or a hybrid of those techniques are used as deemed appropriate under the circumstances. The use of these valuation techniques involve a determination of the exit scenarios of the investment in order to appropriately allocate the enterprise value of the company among the various parts of its capital structure.
The Private Companies are not subject to the public company disclosure, timing, and reporting standards applicable to other investments held by the Fund. Typically, the most recently available information by a Private Company is as of a date that is earlier than the date the Fund is calculating its NAV. This factor may result in a difference between the value of the investment and the price the Fund could receive upon the sale of the investment.
Fair Value Hierarchy: Various inputs are used in determining the fair value of financial instruments. These inputs to valuation techniques are categorized into a fair value hierarchy consisting of three broad levels for financial reporting purposes as follows:
| | • | | Level 1 – Unadjusted price quotations in active markets/exchanges for identical assets or liabilities that the Fund has the ability to access; |
| | • | | Level 2 – Other observable inputs (including, but not limited to, quoted prices for similar assets or liabilities in markets that are active, quoted prices for identical or similar assets or liabilities in markets that are not active, inputs other than quoted prices that are observable for the assets or liabilities (such as interest rates, yield curves, volatilities, prepayment speeds, loss severities, credit risks and default rates) or other market–corroborated inputs); and |
| | • | | Level 3 – Unobservable inputs based on the best information available in the circumstances, to the extent observable inputs are not available (including the Valuation Committee’s assumptions used in determining the fair value of financial instruments). |
The hierarchy gives the highest priority to unadjusted quoted prices in active markets for identical assets or liabilities (Level 1 measurements) and the lowest priority to unobservable inputs (Level 3 measurements). Accordingly, the degree of judgment exercised in determining fair value is greatest for instruments categorized in Level 3. The inputs used to measure fair value may fall into different levels of the fair value hierarchy. In such cases, for disclosure purposes, the fair value hierarchy classification is
| | |
NOTES TO CONSOLIDATED FINANCIAL STATEMENTS | | 53 |
Notes to Consolidated Financial Statements (continued)
determined based on the lowest level input that is significant to the fair value measurement in its entirety. Investments classified within Level 3 have significant unobservable inputs used by the Valuation Committee in determining the price for Fair Valued Investments. Level 3 investments include equity or debt issued by Private Companies that may not have a secondary market and/or may have a limited number of investors. The categorization of a value determined for financial instruments is based on the pricing transparency of the financial instruments and is not necessarily an indication of the risks associated with investing in those securities.
| 4. | SECURITIES AND OTHER INVESTMENTS |
Asset-Backed and Mortgage-Backed Securities: Asset-backed securities are generally issued as pass-through certificates or as debt instruments. Asset-backed securities issued as pass-through certificates represent undivided fractional ownership interests in an underlying pool of assets. Asset-backed securities issued as debt instruments, which are also known as collateralized obligations, are typically issued as the debt of a special purpose entity organized solely for the purpose of owning such assets and issuing such debt. Asset-backed securities are often backed by a pool of assets representing the obligations of a number of different parties. The yield characteristics of certain asset-backed securities may differ from traditional debt securities. One such major difference is that all or a principal part of the obligations may be prepaid at any time because the underlying assets (i.e., loans) may be prepaid at any time. As a result, a decrease in interest rates in the market may result in increases in the level of prepayments as borrowers, particularly mortgagors, refinance and repay their loans. An increased prepayment rate with respect to an asset-backed security will have the effect of shortening the maturity of the security. In addition, a fund may subsequently have to reinvest the proceeds at lower interest rates. If a fund has purchased such an asset-backed security at a premium, a faster than anticipated prepayment rate could result in a loss of principal to the extent of the premium paid.
For mortgage pass-through securities (the “Mortgage Assets”) there are a number of important differences among the agencies and instrumentalities of the U.S. Government that issue mortgage-related securities and among the securities that they issue. For example, mortgage-related securities guaranteed by Ginnie Mae are guaranteed as to the timely payment of principal and interest by Ginnie Mae and such guarantee is backed by the full faith and credit of the United States. However, mortgage-related securities issued by Freddie Mac and Fannie Mae, including Freddie Mac and Fannie Mae guaranteed mortgage pass-through certificates, which are solely the obligations of Freddie Mac and Fannie Mae, are not backed by or entitled to the full faith and credit of the United States, but are supported by the right of the issuer to borrow from the U.S. Treasury.
Non-agency mortgage-backed securities are securities issued by non-governmental issuers and have no direct or indirect government guarantees of payment and are subject to various risks. Non-agency mortgage loans are obligations of the borrowers thereunder only and are not typically insured or guaranteed by any other person or entity. The ability of a borrower to repay a loan is dependent upon the income or assets of the borrower. A number of factors, including a general economic downturn, acts of God, terrorism, social unrest and civil disturbances, may impair a borrower’s ability to repay its loans.
Collateralized Debt Obligations: Collateralized debt obligations (“CDOs”), including collateralized bond obligations (“CBOs”) and collateralized loan obligations (“CLOs”), are types of asset-backed securities. A CDO is an entity that is backed by a diversified pool of debt securities (CBOs) or syndicated bank loans (CLOs). The cash flows of the CDO can be split into multiple segments, called “tranches,” which will vary in risk profile and yield. The riskiest segment is the subordinated or “equity” tranche. This tranche bears the greatest risk of defaults from the underlying assets in the CDO and serves to protect the other, more senior, tranches from default in all but the most severe circumstances. Since it is shielded from defaults by the more junior tranches, a “senior” tranche will typically have higher credit ratings and lower yields than their underlying securities, and often receive investment grade ratings from one or more of the nationally recognized rating agencies. Despite the protection from the more junior tranches, senior tranches can experience substantial losses due to actual defaults, increased sensitivity to future defaults and the disappearance of one or more protecting tranches as a result of changes in the credit profile of the underlying pool of assets.
Multiple Class Pass-Through Securities: Multiple class pass-through securities, including collateralized mortgage obligations (“CMOs”) and commercial mortgage-backed securities, may be issued by Ginnie Mae, U.S. Government agencies or instrumentalities or by trusts formed by private originators of, or investors in, mortgage loans. In general, CMOs are debt obligations of a legal entity that are collateralized by a pool of residential or commercial mortgage loans or Mortgage Assets. The payments on these are used to make payments on the CMOs or multiple pass-through securities. Multiple class pass-through securities represent direct ownership interests in the Mortgage Assets. Classes of CMOs include interest only (“IOs”), principal only (“POs”), planned amortization classes and targeted amortization classes. IOs and POs are stripped mortgage-backed securities representing interests in a pool of mortgages, the cash flow from which has been separated into interest and principal components. IOs receive the interest portion of the cash flow while POs receive the principal portion. IOs and POs can be extremely volatile in response to changes in interest rates. As interest rates rise and fall, the value of IOs tends to move in the same direction as interest rates. POs perform best when prepayments on the underlying mortgages rise since this increases the rate at which the principal is returned and the yield to maturity on the PO. When payments on mortgages underlying a PO are slower than anticipated, the life of the PO is lengthened and the yield to maturity is reduced. If the underlying Mortgage Assets experience greater than anticipated prepayments of principal, a fund’s initial investment in the IOs may not fully recoup.
Stripped Mortgage-Backed Securities: Stripped mortgage-backed securities are typically issued by the U.S. Government, its agencies and instrumentalities. Stripped mortgage-backed securities are usually structured with two classes that receive different proportions of the interest (IOs) and principal (POs) distributions on a pool of Mortgage Assets. Stripped mortgage-backed securities may be privately issued.
Zero-Coupon Bonds: Zero-coupon bonds are normally issued at a significant discount from face value and do not provide for periodic interest payments. These bonds may experience greater volatility in market value than other debt obligations of similar maturity which provide for regular interest payments.
Capital Securities and Trust Preferred Securities: Capital securities, including trust preferred securities, are typically issued by corporations, generally in the form of interest-bearing notes with preferred securities characteristics. In the case of trust preferred securities, an affiliated business trust of a corporation issues these securities, generally in the form of beneficial interests in subordinated debentures or similarly structured securities. The securities can be structured with either a fixed or adjustable coupon that can have either a perpetual or stated maturity date. For trust preferred securities, the issuing bank or corporation pays interest to the trust, which is then distributed to holders of these securities as a dividend. Dividends can be deferred without creating an event of default or acceleration, although maturity cannot take place unless all cumulative payment obligations have been met. The deferral of payments does not affect the purchase or sale of these securities in the open market. These securities generally are rated below that of the issuing company’s senior debt securities and are freely callable at the issuer’s option.
| | |
| 54 | | 2 0 2 2 BLACK ROCK ANNUAL REPORT TO SHAREHOLDERS |
Notes to Consolidated Financial Statements (continued)
Preferred Stocks: Preferred stock has a preference over common stock in liquidation (and generally in receiving dividends as well), but is subordinated to the liabilities of the issuer in all respects. As a general rule, the market value of preferred stock with a fixed dividend rate and no conversion element varies inversely with interest rates and perceived credit risk, while the market price of convertible preferred stock generally also reflects some element of conversion value. Because preferred stock is junior to debt securities and other obligations of the issuer, deterioration in the credit quality of the issuer will cause greater changes in the value of a preferred stock than in a more senior debt security with similar stated yield characteristics. Unlike interest payments on debt securities, preferred stock dividends are payable only if declared by the issuer’s board of directors. Preferred stock also may be subject to optional or mandatory redemption provisions.
Warrants: Warrants entitle a fund to purchase a specified number of shares of common stock and are non-income producing. The purchase price and number of shares are subject to adjustment under certain conditions until the expiration date of the warrants, if any. If the price of the underlying stock does not rise above the strike price before the warrant expires, the warrant generally expires without any value and a fund will lose any amount it paid for the warrant. Thus, investments in warrants may involve more risk than investments in common stock. Warrants may trade in the same markets as their underlying stock; however, the price of the warrant does not necessarily move with the price of the underlying stock.
Floating Rate Loan Interests: Floating rate loan interests are typically issued to companies (the “borrower”) by banks, other financial institutions, or privately and publicly offered corporations (the “lender”). Floating rate loan interests are generally non-investment grade, often involve borrowers whose financial condition is troubled or uncertain and companies that are highly leveraged or in bankruptcy proceedings. In addition, transactions in floating rate loan interests may settle on a delayed basis, which may result in proceeds from the sale not being readily available for a fund to make additional investments or meet its redemption obligations. Floating rate loan interests may include fully funded term loans or revolving lines of credit. Floating rate loan interests are typically senior in the corporate capital structure of the borrower. Floating rate loan interests generally pay interest at rates that are periodically determined by reference to a base lending rate plus a premium. Since the rates reset only periodically, changes in prevailing interest rates (and particularly sudden and significant changes) can be expected to cause some fluctuations in the NAV of a fund to the extent that it invests in floating rate loan interests. The base lending rates are generally the lending rate offered by one or more European banks, such as the London Interbank Offered Rate (“LIBOR”), the prime rate offered by one or more U.S. banks or the certificate of deposit rate. Floating rate loan interests may involve foreign borrowers, and investments may be denominated in foreign currencies. These investments are treated as investments in debt securities for purposes of a fund’s investment policies.
When a fund purchases a floating rate loan interest, it may receive a facility fee and when it sells a floating rate loan interest, it may pay a facility fee. On an ongoing basis, a fund may receive a commitment fee based on the undrawn portion of the underlying line of credit amount of a floating rate loan interest. Facility and commitment fees are typically amortized to income over the term of the loan or term of the commitment, respectively. Consent and amendment fees are recorded to income as earned. Prepayment penalty fees, which may be received by a fund upon the prepayment of a floating rate loan interest by a borrower, are recorded as realized gains. A fund may invest in multiple series or tranches of a loan. A different series or tranche may have varying terms and carry different associated risks.
Floating rate loan interests are usually freely callable at the borrower’s option. A fund may invest in such loans in the form of participations in loans (“Participations”) or assignments (“Assignments”) of all or a portion of loans from third parties. Participations typically will result in a fund having a contractual relationship only with the lender, not with the borrower. A fund has the right to receive payments of principal, interest and any fees to which it is entitled only from the lender selling the Participation and only upon receipt by the lender of the payments from the borrower. In connection with purchasing Participations, a fund generally will have no right to enforce compliance by the borrower with the terms of the loan agreement, nor any rights of offset against the borrower. A fund may not benefit directly from any collateral supporting the loan in which it has purchased the Participation. As a result, a fund assumes the credit risk of both the borrower and the lender that is selling the Participation. A fund’s investment in loan participation interests involves the risk of insolvency of the financial intermediaries who are parties to the transactions. In the event of the insolvency of the lender selling the Participation, a fund may be treated as a general creditor of the lender and may not benefit from any offset between the lender and the borrower. Assignments typically result in a fund having a direct contractual relationship with the borrower, and a fund may enforce compliance by the borrower with the terms of the loan agreement.
In connection with floating rate loan interests, the Fund may also enter into unfunded floating rate loan interests (“commitments”). In connection with these commitments, the fund earns a commitment fee, typically set as a percentage of the commitment amount. Such fee income, which is included in interest income in the Consolidated Statement of Operations, is recognized ratably over the commitment period. Unfunded floating rate loan interests are marked-to-market daily, and any unrealized appreciation
| | |
NOTES TO CONSOLIDATED FINANCIAL STATEMENTS | | 55 |
Notes to Consolidated Financial Statements (continued)
(depreciation) is included in the Consolidated Statement of Assets and Liabilities and Consolidated Statement of Operations. As of period end, the Fund had the following unfunded floating rate loan interests:
| | | | | | | | | | | | | | | | | | |
| |
| Fund Name | | Borrower | | Par | | | Commitment
Amount | | | Value | | | Unrealized
Appreciation
(Depreciation) | |
| |
BlackRock Credit Strategies Fund | | 2-10 HBW | | $ | 105,332 | | | $ | 105,332 | | | $ | 104,026 | | | $ | (1,306) | |
| | Acquia, Inc. | | | 14,812 | | | | 14,678 | | | | 14,812 | | | | 134 | |
| | Alcami Corp. | | | 9,498 | | | | 9,498 | | | | 9,372 | | | | (126 | ) |
| | Alcami Corp. | | | 5,936 | | | | 5,936 | | | | 5,936 | | | | — | |
| | Appriss Health LLC | | | 94,478 | | | | 94,478 | | | | 89,282 | | | | (5,196 | ) |
| | ARAS Corp. | | | 100,902 | | | | 100,902 | | | | 97,068 | | | | (3,834 | ) |
| | AthenaHealth Group, Inc. | | | 17,580 | | | | 17,580 | | | | 15,828 | | | | (1,752 | ) |
| | Backoffice Associates Holdings LLC | | | 60,493 | | | | 60,493 | | | | 58,860 | | | | (1,633 | ) |
| | Bullhorn, Inc. | | | 72,339 | | | | 71,254 | | | | 67,726 | | | | (3,528 | ) |
| | CBI-Gator Acquisition LLC | | | 536,588 | | | | 536,588 | | | | 507,612 | | | | (28,976 | ) |
| | CBI-Gator Acquisition LLC | | | 69,011 | | | | 69,011 | | | | 65,285 | | | | (3,726 | ) |
| | CivicPlus LLC | | | 136,795 | | | | 136,796 | | | | 133,143 | | | | (3,653 | ) |
| | Corestates, Inc. | | | 54,645 | | | | 53,686 | | | | 52,678 | | | | (1,008 | ) |
| | Corestates, Inc. | | | 109,290 | | | | 108,197 | | | | 105,355 | | | | (2,842 | ) |
| | Cybergrants Holdings LLC | | | 122,127 | | | | 122,127 | | | | 118,377 | | | | (3,750 | ) |
| | Cybergrants Holdings LLC | | | 700,880 | | | | 700,258 | | | | 679,363 | | | | (20,895 | ) |
| | Emerald Technologies (U.S.) Acquisition., Inc. | | | 264,250 | | | | 233,271 | | | | 240,132 | | | | 6,861 | |
| | ESO Solutions, Inc. | | | 303,681 | | | | 303,681 | | | | 291,534 | | | | (12,147 | ) |
| | Finalsite | | | 18,868 | | | | 18,468 | | | | 18,868 | | | | 400 | |
| | Foreside Financial | | | 101,695 | | | | 101,695 | | | | 98,746 | | | | (2,949 | ) |
| | Foreside Financial | | | 238,136 | | | | 238,136 | | | | 231,230 | | | | (6,906 | ) |
| | Freedom Financial Network Funding LLC | | | 125,000 | | | | 123,519 | | | | 121,563 | | | | (1,956 | ) |
| | GC Champion Acquisition LLC | | | 48,487 | | | | 48,487 | | | | 47,081 | | | | (1,406 | ) |
| | Giving Home Health Care | | | 12,500 | | | | 12,500 | | | | 12,281 | | | | (219 | ) |
| | Grey Orange Interrnational, Inc. | | | 100,000 | | | | 99,219 | | | | 99,400 | | | | 181 | |
| | Greystone Affordable Housing Initiatives LLC | | | 2,363,636 | | | | 2,363,636 | | | | 2,320,855 | | | | (42,781 | ) |
| | HomeRenew Buyer, Inc. | | | 451,443 | | | | 451,443 | | | | 436,546 | | | | (14,897 | ) |
| | Integratecom, Inc. | | | 133,333 | | | | 133,333 | | | | 129,314 | | | | (4,019 | ) |
| | Integratecom, Inc. | | | 266,667 | | | | 266,667 | | | | 258,627 | | | | (8,040 | ) |
| | International Textile Group, Inc. | | | 2,000,000 | | | | 1,990,204 | | | | 1,990,000 | | | | (204 | ) |
| | IPS Corp. | | | 9,908 | | | | 9,909 | | | | 8,806 | | | | (1,103 | ) |
| | IT Parent LLC | | | 95,631 | | | | 94,419 | | | | 89,415 | | | | (5,004 | ) |
| | James Perse Enterprises, Inc. | | | 500,000 | | | | 500,000 | | | | 498,000 | | | | (2,000 | ) |
| | Kid Distro Holdings LLC | | | 116,769 | | | | 114,844 | | | | 112,858 | | | | (1,986 | ) |
| | Kroll Bonds Rating Agency, Inc. | | | 397,059 | | | | 397,059 | | | | 382,288 | | | | (14,771 | ) |
| | Lightspeed Solution LLC | | | 121,951 | | | | 121,951 | | | | 117,988 | | | | (3,963 | ) |
| | Madison Logic Holdings, Inc | | | 6,363 | | | | 6,363 | | | | 6,363 | | | | — | |
| | MSM Acquisitions, Inc. | | | 76,504 | | | | 76,504 | | | | 73,214 | | | | (3,290 | ) |
| | MSM Acquisitions, Inc. | | | 625,181 | | | | 625,181 | | | | 598,298 | | | | (26,883 | ) |
| | MSM Acquisitions, Inc. | | | 1,716,306 | | | | 1,716,306 | | | | 1,628,774 | | | | (87,532 | ) |
| | Oak Purchaser, Inc. | | | 955,598 | | | | 946,042 | | | | 925,019 | | | | (21,023 | ) |
| | Oak Purchaser, Inc. | | | 287,831 | | | | 284,952 | | | | 278,620 | | | | (6,332 | ) |
| | Patriot Home Care | | | 1,129,074 | | | | 1,129,074 | | | | 1,092,944 | | | | (36,130 | ) |
| | Peter C. Foy & Associates Insurance Services LLC | | | 99,374 | | | | 99,374 | | | | 94,505 | | | | (4,869 | ) |
| | Pluralsight, Inc. | | | 95,577 | | | | 95,577 | | | | 91,850 | | | | (3,727 | ) |
| | PTSH Intermediate Holdings LLC | | | 473,684 | | | | 465,841 | | | | 460,658 | | | | (5,183 | ) |
| | Pueblo Mechanical and Controls, LLC | | | 310,500 | | | | 310,500 | | | | 303,234 | | | | (7,266 | ) |
| | Pueblo Mechanical and Controls, LLC | | | 117,500 | | | | 117,500 | | | | 114,774 | | | | (2,726 | ) |
| | Sellerx Opco GmbH | | | 2,910,678 | | | | 2,893,684 | | | | 2,891,758 | | | | (1,926 | ) |
| | SEP Raptor Acquisition, Inc. | | | 184,668 | | | | 182,048 | | | | 181,344 | | | | (704 | ) |
| | Smarsh, Inc. | | | 190,476 | | | | 188,571 | | | | 181,905 | | | | (6,666 | ) |
| | Smarsh, Inc. | | | 95,238 | | | | 93,564 | | | | 90,952 | | | | (2,612 | ) |
| | Sonny’s Enterprises LLC | | | 85,102 | | | | 85,102 | | | | 85,953 | | | | 851 | |
| | Spartan Bidco Pty. Ltd. | | | 230,769 | | | | 230,769 | | | | 224,123 | | | | (6,646 | ) |
| | Streamland Media Midco LLC | | | 24,000 | | | | 23,580 | | | | 22,896 | | | | (684 | ) |
| | Suited Connector LLC | | | 540,390 | | | | 540,390 | | | | 433,393 | | | | (106,997 | ) |
| | Supergoop LLC | | | 160,800 | | | | 158,083 | | | | 155,220 | | | | (2,863 | ) |
| | Superman Holdings LLC | | | 69,807 | | | | 68,724 | | | | 68,620 | | | | (104 | ) |
| | Thermostat Purchaser III, Inc. | | | 237,485 | | | | 237,486 | | | | 220,861 | | | | (16,625 | ) |
| | Thrasio LLC | | | 961,471 | | | | 956,664 | | | | 847,296 | | | | (109,368 | ) |
| | Thunder Purchaser, Inc. | | | 134,346 | | | | 134,346 | | | | 126,339 | | | | (8,007 | ) |
| | Thunder Purchaser, Inc. | | | 148,837 | | | | 148,837 | | | | 139,967 | | | | (8,870 | ) |
| |
| | |
| 56 | | 2 0 2 2 BLACK ROCK ANNUAL REPORT TO SHAREHOLDERS |
Notes to Consolidated Financial Statements (continued)
| | | | | | | | | | | | | | | | | | |
| |
| | | | | |
| Fund Name | | Borrower | | Par | | | Commitment
Amount | | | Value | | | Unrealized
Appreciation
(Depreciation) | |
| |
| | Wealth Enhancement Group LLC | | $ | 53,330 | | | $ | 53,330 | | | $ | 52,039 | | | $ | (1,291) | |
| | Zilliant, Inc. | | | 148,148 | | | | 148,148 | | | | 138,963 | | | | (9,185 | ) |
| | Zilliant, Inc. | | | 370,370 | | | | 370,370 | | | | 347,407 | | | | (22,963 | ) |
| |
| 5. | DERIVATIVE FINANCIAL INSTRUMENTS |
The Fund engages in various portfolio investment strategies using derivative contracts both to increase the returns of the Fund and/or to manage its exposure to certain risks such as credit risk, equity risk, interest rate risk, foreign currency exchange rate risk, commodity price risk or other risks (e.g., inflation risk). Derivative financial instruments categorized by risk exposure are included in the Consolidated Schedule of Investments. These contracts may be transacted on an exchange or over-the-counter (“OTC”).
Futures Contracts: Futures contracts are purchased or sold to gain exposure to, or manage exposure to, changes in interest rates (interest rate risk) and changes in the value of equity securities (equity risk) or foreign currencies (foreign currency exchange rate risk).
Futures contracts are exchange-traded agreements between the Fund and a counterparty to buy or sell a specific quantity of an underlying instrument at a specified price and on a specified date. Depending on the terms of a contract, it is settled either through physical delivery of the underlying instrument on the settlement date or by payment of a cash amount on the settlement date. Upon entering into a futures contract, the Fund is required to deposit initial margin with the broker in the form of cash or securities in an amount that varies depending on a contract’s size and risk profile. The initial margin deposit must then be maintained at an established level over the life of the contract. Amounts pledged, which are considered restricted, are included in cash pledged for futures contracts in the Consolidated Statement of Assets and Liabilities.
Securities deposited as initial margin are designated in the Consolidated Schedule of Investments and cash deposited, if any, are shown as cash pledged for futures contracts in the Consolidated Statement of Assets and Liabilities. Pursuant to the contract, the Fund agrees to receive from or pay to the broker an amount of cash equal to the daily fluctuation in market value of the contract (“variation margin”). Variation margin is recorded as unrealized appreciation (depreciation) and, if any, shown as variation margin receivable (or payable) on futures contracts in the Consolidated Statement of Assets and Liabilities. When the contract is closed, a realized gain or loss is recorded in the Consolidated Statement of Operations equal to the difference between the notional amount of the contract at the time it was opened and the notional amount at the time it was closed. The use of futures contracts involves the risk of an imperfect correlation in the movements in the price of futures contracts and interest rates, foreign currency exchange rates or underlying assets.
Forward Foreign Currency Exchange Contracts: Forward foreign currency exchange contracts are entered into to gain or reduce exposure to foreign currencies (foreign currency exchange rate risk).
A forward foreign currency exchange contract is an agreement between two parties to buy and sell a currency at a set exchange rate on a specified date. These contracts help to manage the overall exposure to the currencies in which some of the investments held by the Fund are denominated and in some cases, may be used to obtain exposure to a particular market. The contracts are traded OTC and not on an organized exchange.
The contract is marked-to-market daily and the change in market value is recorded as unrealized appreciation (depreciation) in the Consolidated Statement of Assets and Liabilities. When a contract is closed, a realized gain or loss is recorded in the Consolidated Statement of Operations equal to the difference between the value at the time it was opened and the value at the time it was closed. Non-deliverable forward foreign currency exchange contracts are settled with the counterparty in cash without the delivery of foreign currency. The use of forward foreign currency exchange contracts involves the risk that the value of a forward foreign currency exchange contract changes unfavorably due to movements in the value of the referenced foreign currencies, and such value may exceed the amount(s) reflected in the Consolidated Statement of Assets and Liabilities. Cash amounts pledged for forward foreign currency exchange contracts are considered restricted and are included in cash pledged as collateral for OTC derivatives in the Consolidated Statement of Assets and Liabilities. A Fund’s risk of loss from counterparty credit risk on OTC derivatives is generally limited to the aggregate unrealized gain netted against any collateral held by the Fund.
Options: The Fund may purchase and write call and put options to increase or decrease its exposure to the risks of underlying instruments, including equity risk, interest rate risk and/or commodity price risk and/or, in the case of options written, to generate gains from options premiums.
A call option gives the purchaser (holder) of the option the right (but not the obligation) to buy, and obligates the seller (writer) to sell (when the option is exercised) the underlying instrument at the exercise or strike price at any time or at a specified time during the option period. A put option gives the holder the right to sell and obligates the writer to buy the underlying instrument at the exercise or strike price at any time or at a specified time during the option period.
Premiums paid on options purchased and premiums received on options written, as well as the daily fluctuation in market value, are included in investments at value –unaffiliated and options written at value, respectively, in the Consolidated Statement of Assets and Liabilities. When an instrument is purchased or sold through the exercise of an option, the premium is offset against the cost or proceeds of the underlying instrument. When an option expires, a realized gain or loss is recorded in the Consolidated Statement of Operations to the extent of the premiums received or paid. When an option is closed or sold, a gain or loss is recorded in the Consolidated Statement of Operations to the extent the cost of the closing transaction exceeds the premiums received or paid. When the Fund writes a call option, such option is typically “covered,” meaning that it holds the underlying instrument subject to being called by the option counterparty. When the Fund writes a put option, cash is segregated in an amount sufficient to cover the obligation. These amounts, which are considered restricted, are included in cash pledged as collateral for options written in the Consolidated Statement of Assets and Liabilities.
| | |
NOTES TO CONSOLIDATED FINANCIAL STATEMENTS | | 57 |
Notes to Consolidated Financial Statements (continued)
In purchasing and writing options, the Fund bears the risk of an unfavorable change in the value of the underlying instrument or the risk that it may not be able to enter into a closing transaction due to an illiquid market. Exercise of a written option could result in the Fund purchasing or selling a security when it otherwise would not, or at a price different from the current market value.
Swaps: Swap contracts are entered into to manage exposure to issuers, markets and securities. Such contracts are agreements between the Fund and a counterparty to make periodic net payments on a specified notional amount or a net payment upon termination. Swap agreements are privately negotiated in the OTC market and may be entered into as a bilateral contract (“OTC swaps”) or centrally cleared (“centrally cleared swaps”).
For OTC swaps, any upfront premiums paid and any upfront fees received are shown as swap premiums paid and swap premiums received, respectively, in the Consolidated Statement of Assets and Liabilities and amortized over the term of the contract. The daily fluctuation in market value is recorded as unrealized appreciation (depreciation) on OTC Swaps in the Consolidated Statement of Assets and Liabilities. Payments received or paid are recorded in the Consolidated Statement of Operations as realized gains or losses, respectively. When an OTC swap is terminated, a realized gain or loss is recorded in the Consolidated Statement of Operations equal to the difference between the proceeds from (or cost of) the closing transaction and the Fund’s basis in the contract, if any. Generally, the basis of the contract is the premium received or paid.
In a centrally cleared swap, immediately following execution of the swap contract, the swap contract is novated to a central counterparty (the “CCP”) and the CCP becomes the Fund’s counterparty on the swap. The Fund is required to interface with the CCP through the broker. Upon entering into a centrally cleared swap, the Fund is required to deposit initial margin with the broker in the form of cash or securities in an amount that varies depending on the size and risk profile of the particular swap. Securities deposited as initial margin are designated in the Consolidated Schedule of Investments and cash deposited is shown as cash pledged for centrally cleared swaps in the Consolidated Statement of Assets and Liabilities. Amounts pledged, which are considered restricted cash, are included in cash pledged for centrally cleared swaps in the Consolidated Statement of Assets and Liabilities. Pursuant to the contract, the Fund agrees to receive from or pay to the broker variation margin. Variation margin is recorded as unrealized appreciation (depreciation) and shown as variation margin receivable (or payable) on centrally cleared swaps in the Consolidated Statement of Assets and Liabilities. Payments received from (paid to) the counterparty are amortized over the term of the contract and recorded as realized gains (losses) in the Consolidated Statement of Operations, including those at termination.
| | • | | Credit default swaps — Credit default swaps are entered into to manage exposure to the market or certain sectors of the market, to reduce risk exposure to defaults of corporate and/or sovereign issuers or to create exposure to corporate and/or sovereign issuers to which a fund is not otherwise exposed (credit risk). |
The Fund may either buy or sell (write) credit default swaps on single-name issuers (corporate or sovereign), a combination or basket of single-name issuers or traded indexes. Credit default swaps are agreements in which the protection buyer pays fixed periodic payments to the seller in consideration for a promise from the protection seller to make a specific payment should a negative credit event take place with respect to the referenced entity (e.g., bankruptcy, failure to pay, obligation acceleration, repudiation, moratorium or restructuring). As a buyer, if an underlying credit event occurs, the Fund will either (i) receive from the seller an amount equal to the notional amount of the swap and deliver the referenced security or underlying securities comprising the index, or (ii) receive a net settlement of cash equal to the notional amount of the swap less the recovery value of the security or underlying securities comprising the index. As a seller (writer), if an underlying credit event occurs, the Fund will either pay the buyer an amount equal to the notional amount of the swap and take delivery of the referenced security or underlying securities comprising the index or pay a net settlement of cash equal to the notional amount of the swap less the recovery value of the security or underlying securities comprising the index.
| | • | | Total return swaps — Total return swaps are entered into to obtain exposure to a security or market without owning such security or investing directly in such market or to exchange the risk/return of one security or market (e.g., fixed-income) with another security or market (e.g., equity or commodity prices) (equity risk, commodity price risk and/or interest rate risk). |
Total return swaps are agreements in which there is an exchange of cash flows whereby one party commits to make payments based on the total return (distributions plus capital gains/losses) of an underlying instrument, or basket of underlying instruments, in exchange for fixed or floating rate interest payments. If the total return of the instrument(s) or index underlying the transaction exceeds or falls short of the offsetting fixed or floating interest rate obligation, the Fund receives payment from or makes a payment to the counterparty.
Swap transactions involve, to varying degrees, elements of interest rate, credit and market risks in excess of the amounts recognized in the Consolidated Statement of Assets and Liabilities. Such risks involve the possibility that there will be no liquid market for these agreements, that the counterparty to the agreements may default on its obligation to perform or disagree as to the meaning of the contractual terms in the agreements, and that there may be unfavorable changes in interest rates and/or market values associated with these transactions.
Master Netting Arrangements: In order to define its contractual rights and to secure rights that will help it mitigate its counterparty risk, the Fund may enter into an International Swaps and Derivatives Association, Inc. Master Agreement (“ISDA Master Agreement”) or similar agreement with its counterparties. An ISDA Master Agreement is a bilateral agreement between a Fund and a counterparty that governs certain OTC derivatives and typically contains, among other things, collateral posting terms and netting provisions in the event of a default and/or termination event. Under an ISDA Master Agreement, a Fund may, under certain circumstances, offset with the counterparty certain derivative financial instruments’ payables and/or receivables with collateral held and/or posted and create one single net payment. The provisions of the ISDA Master Agreement typically permit a single net payment in the event of default including the bankruptcy or insolvency of the counterparty. However, bankruptcy or insolvency laws of a particular jurisdiction may impose restrictions on or prohibitions against the right of offset in bankruptcy, insolvency or other events.
Collateral Requirements: For derivatives traded under an ISDA Master Agreement, the collateral requirements are typically calculated by netting the mark-to-market amount for each transaction under such agreement and comparing that amount to the value of any collateral currently pledged by the Fund and the counterparty.
Cash collateral that has been pledged to cover obligations of the Fund and cash collateral received from the counterparty, if any, is reported separately in the Consolidated Statement of Assets and Liabilities as cash pledged as collateral and cash received as collateral, respectively. Non-cash collateral pledged by the Fund, if any,
| | |
| 58 | | 2 0 2 2 BLACK ROCK ANNUAL REPORT TO SHAREHOLDERS |
Notes to Consolidated Financial Statements (continued)
is noted in the Consolidated Schedule of Investments. Generally, the amount of collateral due from or to a counterparty is subject to a certain minimum transfer amount threshold before a transfer is required, which is determined at the close of business of the Fund. Any additional required collateral is delivered to/pledged by the Fund on the next business day. Typically, the counterparty is not permitted to sell, re-pledge or use cash and non-cash collateral it receives. The Fund generally agrees not to use non-cash collateral that it receives but may, absent default or certain other circumstances defined in the underlying ISDA Master Agreement, be permitted to use cash collateral received. In such cases, interest may be paid pursuant to the collateral arrangement with the counterparty. To the extent amounts due to the Fund from the counterparties are not fully collateralized, the Fund bears the risk of loss from counterparty non-performance. Likewise, to the extent the Fund has delivered collateral to a counterparty and stands ready to perform under the terms of its agreement with such counterparty, the Fund bears the risk of loss from a counterparty in the amount of the value of the collateral in the event the counterparty fails to return such collateral. Based on the terms of agreements, collateral may not be required for all derivative contracts.
For financial reporting purposes, the Fund does not offset derivative assets and derivative liabilities that are subject to netting arrangements, if any, in the Consolidated Statement of Assets and Liabilities.
| 6. | INVESTMENT ADVISORY AGREEMENT AND OTHER TRANSACTIONS WITH AFFILIATES |
Investment Advisory: The Fund entered into an Investment Advisory Agreement with the Manager, the Fund’s investment adviser and an indirect, wholly-owned subsidiary of BlackRock, Inc. (“BlackRock”), to provide investment advisory and administrative services. The Manager is responsible for the management of the Fund’s portfolio and provides the personnel, facilities, equipment and certain other services necessary to the operations of the Fund.
For such services, the Fund pays the Manager a monthly fee at an annual rate equal to 1.00% of the average daily value of the Fund’s managed assets. For purposes of calculating this fee,“managed assets“are determined as total assets of the Fund (including any assets attributable to money borrowed for investment purposes) less the sum of its accrued liabilities (other than money borrowed for investment purposes).
The Manager provides investment management and other services to the Subsidiary. The Manager does not receive separate compensation from the Subsidiary for providing investment management or administrative services. However, the Fund pays the Manager based on the Fund’snet assets, plus the proceeds of any debt securities or outstanding borrowings used for leveragewhich includes the assets of the Subsidiary.
The Manager entered into sub-advisory agreements with BlackRock Capital Investment Advisors, LLC (“BCIA”), BlackRock International Limited (“BIL”) and BlackRock (Singapore) Limited (“BSL”), each an affiliate of the Manager. The Manager pays BCIA, BIL and BSL for services they provide for that portion of the Fund for which BCIA, BIL and BSL, respectively, acts as sub-adviser a monthly fee that is equal to a percentage of the investment advisory fees paid by the Fund to the Manager.
Service and Distribution Fees: The Fund has entered into a Distribution Agreement (the “Distribution Agreement”) with BlackRock Investments, LLC (the “Distributor”), an affiliate of the Manager, to provide for distribution of the common shares. The Distribution Agreement provides that the Distributor will sell, and will appoint financial intermediaries to sell, common shares on behalf of the Fund on a reasonable efforts basis. The Fund has adopted a distribution and servicing plan (the “Distribution and Servicing Plan”) with respect to certain classes of the common shares and in doing so has voluntarily complied with Rule 12b-1 under the 1940 Act, as if the Fund were an open-end investment company, and will be subject to an ongoing distribution fee and shareholder servicing fee (together, the “Distribution and Servicing Fee”) in respect of the classes of common shares paying such Distribution and Servicing Fee. The maximum annual rates at which the Distribution and Servicing Fees may be paid under the Distribution and Servicing Plan (calculated as a percentage of the Fund’s average daily net assets attributable to the classes of common shares paying such Distribution and Servicing Fee) is 0.75%. 0.25% of such fee is a shareholder service fee and the remaining portion is a distribution fee. Institutional Shares are not subject to a distribution fee or shareholder servicing fee.
For the year ended December 31, 2022, the following table shows the class specific service and distribution fees borne directly by each share class of the Fund:
| | | | | | | | | | | | | | | | |
| |
| | | Class A | | | Class U | | | Class W | | | Total | |
| |
Service and distribution fees — class specific | | $ | 797,554 | | | $ | 264,107 | | | $ | 1,605 | | | $ | 1,063,266 | |
| |
Transfer Agent: Pursuant to written agreements, certain financial intermediaries, some of which may be affiliates, provide the Fund with sub-accounting, recordkeeping, sub-transfer agency and other administrative services with respect to servicing of underlying investor accounts. For these services, these entities receive an asset-based fee or an annual fee per shareholder account, which will vary depending on share class and/or net assets. For the year ended December 31, 2022, the Fund did not pay any amounts to affiliates in return for these services.
For the year ended December 31, 2022, the following table shows the class specific transfer agent fees borne directly by each share class of the Fund:
| | | | | | | | | | | | | | | | | | | | |
| |
| | | Institutional | | | Class A | | | Class U | | | Class W | | | Total | |
| |
Transfer agent fees — class specific | | $ | 256,242 | | | $ | 14,962 | | | $ | 7,851 | | | $ | 41 | | | $ | 279,096 | |
| |
Other Fees: For the year ended December 31, 2022, affiliates received CDSCs of $104,707 for Class A Shares.
Expense Limitations, Waivers, Reimbursements, and Recoupments: With respect to the Fund, the Manager contractually agreed to waive its investment advisory fees by the amount of investment advisory fees the Fund pays to the Manager indirectly through its investment in affiliated money market funds (the “affiliated money market fund waiver”) through June 30, 2023. The contractual agreement may be terminated upon 90 days’ notice by a majority of the Independent Trustees, or by a vote of a majority of the outstanding voting securities of the Fund. The amount of waivers and/or reimbursements of fees and expenses made pursuant to the expense limitation described below will be reduced by the amount of the affiliated money market fund waiver. This amount is included in fees waived and/or reimbursed by the Manager in the Consolidated Statement of Operations. For the year ended December 31, 2022, the amount waived was $1,728.
| | |
NOTES TO CONSOLIDATED FINANCIAL STATEMENTS | | 59 |
Notes to Consolidated Financial Statements (continued)
The Manager contractually agreed to waive its investment advisory fee with respect to any portion of the Fund’s assets invested in affiliated equity and fixed-income mutual funds and affiliated exchange-traded funds that have a contractual management fee through June 30, 2023. The agreement can be renewed for annual periods thereafter, and may be terminated on 90 days’ notice, each subject to approval by a majority of the Fund’s Independent Trustees. This amount is included in fees waived and/or reimbursed by the Manager in the Consolidated Statement of Operations. For the year ended December 31, 2022, the Manager waived $16,789 in investment advisory fees pursuant to these arrangements.
The Manager contractually agreed to waive and/or reimburse certain operating and other expenses of the Fund in order to limit certain expenses to 0.50% of the Fund’s average daily value of the net assets of each share class (“expense limitation”). Expenses covered by the expense limitation include without limitation, custodial, accounting and administrative services, any ongoing organizational expenses, and all initial and ongoing offering expenses (other than any applicable sales load). Expenses excluded from the expense limitation are limited to the investment advisory fee, service and distribution fees, interest expense, portfolio transaction and other investment-related costs (including acquired fund fees and expenses, commitment fees on leverage, prime broker fees and dividend expense) and certain other fund expenses, which constitute extraordinary expenses not incurred in the ordinary course of the Fund’s business. The Manager has agreed not to reduce or discontinue the contractual expense limitations through June 30, 2023. This amount is included in fees waived and/or reimbursed by the Manager in the Consolidated Statement of Operations. For the year ended December 31, 2022, there were no fees waived and/or reimbursed by the Manager pursuant to this arrangement.
With respect to the contractual expense limitation, if during the Fund’s fiscal year the operating expenses of a share class, that at any time during the prior two fiscal years received a waiver and/or reimbursement from the Manager, are less than the current expense limitation for that share class, the Manager is entitled to be reimbursed by such share class up to the lesser of: (a) the amount of fees waived and/or expenses reimbursed during those prior two fiscal years under the agreement and (b) an amount not to exceed either the current expense limitation of that share class or the expense limitation of the share class in effect at the time that the share class received the applicable waiver and/or reimbursement, provided that:
(1) the Fund, of which the share class is a part, has more than $50 million in assets for the fiscal year, and
(2) the Manager or an affiliate continues to serve as the Fund’s investment adviser or administrator.
This repayment applies only to the contractual expense limitation on net expenses and does not apply to the contractual investment advisory fee waiver described above or any voluntary waivers that may be in effect from time to time. Effective March 1, 2026, the repayment arrangement between the Fund and the Manager pursuant to which such Fund may be required to repay amounts waived and/or reimbursed under the Fund’s contractual caps on net expenses will be terminated.
For the year ended December 31, 2022, the Manager recouped the following fund level and class specific waivers and/or reimbursements previously recorded by the Fund:
| | | | | | | | |
| |
| Fund Name | | Fund Level | | | Institutional | |
| |
BlackRock Credit Strategies Fund | | $ | 306,794 | | | $ | 2,967 | |
| |
Trustees and Officers: Certain trustees and/or officers of the Fund are directors and/or officers of BlackRock or its affiliates. The Fund reimburses the Manager for a portion of the compensation paid to the Fund’s Chief Compliance Officer, which is included in Trustees and Officer in the Consolidated Statement of Operations.
For the year ended December 31, 2022, purchases and sales of investments, excluding short-term securities, were $352,073,965 and $299,393,827, respectively.
It is the Fund’s policy to comply with the requirements of the Internal Revenue Code of 1986, as amended, applicable to regulated investment companies, and to distribute substantially all of its taxable income to its shareholders. Therefore, no U.S. federal income tax provision is required.
The Fund files U.S. federal and various state and local tax returns. No income tax returns are currently under examination. The statute of limitations on the Fund’s U.S. federal tax returns generally remains open for a period of three years after they are filed. The statutes of limitations on the Fund’s state and local tax returns may remain open for an additional year depending upon the jurisdiction.
Management has analyzed tax laws and regulations and their application to the Fund as of December 31, 2022, inclusive of the open tax return years, and does not believe that there are any uncertain tax positions that require recognition of a tax liability in the Fund’s consolidated financial statements.
U.S. GAAP requires that certain components of net assets be adjusted to reflect permanent differences between financial and tax reporting. These reclassifications have no effect on net assets or NAVs per share. As of period end, permanent differences attributable to distributions paid in excess of taxable income were reclassified to the following accounts:
| | | | | | | | |
| Fund Name | | Paid-in Capital | | | Accumulated
Earnings (Loss) | |
BlackRock Credit Strategies Fund | | $ | (767,867 | ) | | $ | 767,867 | |
| |
| | |
| 60 | | 2 0 2 2 BLACK ROCK ANNUAL REPORT TO SHAREHOLDERS |
Notes to Consolidated Financial Statements (continued)
The tax character of distributions paid was as follows:
| | | | | | | | |
| Fund Name | | Year Ended
12/31/22 | | | Year Ended
12/31/21 | |
BlackRock Credit Strategies Fund | | | | | | | | |
Ordinary income | | $ | 32,000,255 | | | $ | 19,111,273 | |
Long-term capital gains | | | — | | | | 1,365,190 | |
| | | | | | | | |
| | |
| | $ | 32,000,255 | | | $ | 20,476,463 | |
| | | | | | | | |
As of December 31, 2022, the tax components of accumulated earnings (loss) were as follows:
| | | | | | | | | | | | | | | | |
| |
| Fund Name | |
| Non-Expiring
Capital Loss
Carryforwards |
(a) | |
| Net Unrealized
Gains (Losses) |
(b) | |
| Qualified
Late-Year Losses |
(c) | | | Total | |
| |
BlackRock Credit Strategies Fund | | $ | (42,896,078 | ) | | $ | (36,887,844 | ) | | $ | (16,311 | ) | | $ | (79,800,233 | ) |
| |
| | (a) | Amounts available to offset future realized capital gains. | |
| | (b) | The difference between book-basis and tax-basis net unrealized gains (losses) was attributable primarily to the tax deferral of losses on wash sales and straddles, the realization for tax purposes of unrealized gains/losses on certain futures, options, and foreign currency contracts, the accounting for swap agreements, the classification of investments, the accrual of income on securities in default, and amortization methods for premiums and discounts on fixed income securities. | |
| | (c) | The Fund has elected to defer certain qualified late-year losses and recognize such losses in the next taxable year. | |
As of December 31, 2022, gross unrealized appreciation and depreciation based on cost of investments (including short positions and derivatives, if any) for U.S. federal income tax purposes were as follows:
| | | | | | | | | | | | | | | | |
| |
| Fund Name | | Tax Cost | | | Gross Unrealized
Appreciation | | | Gross Unrealized
Depreciation | | | Net Unrealized
Appreciation
(Depreciation) | |
| |
BlackRock Credit Strategies Fund | | $ | 517,946,112 | | | $ | 857,135 | | | $ | (37,747,099 | ) | | $ | (36,889,964 | ) |
| | | | | | | | | | | | | | | | |
The Fund has entered into a credit agreement with Société Générale (the “Lender”) that established a revolving credit facility with an initial commitment of up to $150 million (the “Facility”). The Facility may be increased to a maximum of $450 million. The Facility has the following terms: an unused commitment fee of 0.25% per annum when amounts borrowed is greater than $75 million or 0.30% per annum when amounts borrowed is less than $75 million and interest at a rate equal to one-month LIBOR on the date the loan is made plus 1.65 % per annum on amounts borrowed. The agreement expires on September 30, 2024 unless extended or renewed. The Fund’s borrowings, if any, are secured by eligible securities held in its portfolio of investments.
During the period, the Fund paid the commitment fee based on the daily unused portion of the Facility and an extension fee for a two-year extension. The fees associated with the agreement are included in the Consolidated Statement of Operations as interest expense and fees, if any. Advances to the Fund as of period end, if any, are shown in the Consolidated Statement of Assets and Liabilities as bank borrowings payable. Based on the short-term nature of the borrowings under the line of credit and the variable interest rate, the carrying amount of the borrowings approximates fair value. For the year ended December 31, 2022, the maximum amount borrowed, the average daily borrowing and the weighted average interest rate, if any, under the credit agreement were as follows:
| | | | | | | | | | | | |
| Fund Name | | Maximum
Amount Borrowed | | | Average Amount
Outstanding | | | Daily Weighted Average
Interest Rate | |
| |
BlackRock Credit Strategies Fund | | $ | 134,350,000 | | | $ | 77,748,904 | | | | 3.09 | % |
| |
In the normal course of business, the Fund invests in securities or other instruments and may enter into certain transactions, and such activities subject the Fund to various risks, including among others, fluctuations in the market (market risk) or failure of an issuer to meet all of its obligations. The value of securities or other instruments may also be affected by various factors, including, without limitation: (i) the general economy; (ii) the overall market as well as local, regional or global political and/or social instability; (iii) regulation, taxation or international tax treaties between various countries; or (iv) currency, interest rate and price fluctuations. Local, regional or global events such as war, acts of terrorism, the spread of infectious illness or other public health issues, recessions, or other events could have a significant impact on the Fund and its investments. The Fund’s prospectus provides details of the risks to which the Fund is subject.
The Fund may invest without limitation in illiquid or less liquid investments or investments in which no secondary market is readily available or which are otherwise illiquid, including private placement securities. The Fund may not be able to readily dispose of such investments at prices that approximate those at which the Fund could sell such investments if they were more widely traded and, as a result of such illiquidity, the Fund may have to sell other investments or engage in borrowing transactions if necessary to raise funds to meet its obligations. Limited liquidity can also affect the market price of investments, thereby adversely affecting the Fund’s NAV and ability to make dividend distributions. Privately issued debt securities are often of below investment grade quality, frequently are unrated and present many of the same risks as investing in below investment grade public debt securities.
| | |
NOTES TO CONSOLIDATED FINANCIAL STATEMENTS | | 61 |
Notes to Consolidated Financial Statements (continued)
Market Risk: The Fund may be exposed to prepayment risk, which is the risk that borrowers may exercise their option to prepay principal earlier than scheduled during periods of declining interest rates, which would force the Fund to reinvest in lower yielding securities. The Fund may also be exposed to reinvestment risk, which is the risk that income from the Fund’s portfolio will decline if the Fund invests the proceeds from matured, traded or called fixed-income securities at market interest rates that are below the Fund portfolio’s current earnings rate.
Infectious Illness Risk: An outbreak of an infectious illness, such as the COVID-19 pandemic, may adversely impact the economies of many nations and the global economy, and may impact individual issuers and capital markets in ways that cannot be foreseen. An infectious illness outbreak may result in, among other things, closed international borders, prolonged quarantines, supply chain disruptions, market volatility or disruptions and other significant economic, social and political impacts.
Valuation Risk: The market values of equities, such as common stocks and preferred securities or equity related investments, such as futures and options, may decline due to general market conditions which are not specifically related to a particular company. They may also decline due to factors which affect a particular industry or industries. The Fund may invest in illiquid investments. An illiquid investment is any investment that the Fund reasonably expects cannot be sold or disposed of in current market conditions in seven calendar days or less without the sale or disposition significantly changing the market value of the investment. The Fund may experience difficulty in selling illiquid investments in a timely manner at the price that it believes the investments are worth. Prices may fluctuate widely over short or extended periods in response to company, market or economic news. Markets also tend to move in cycles, with periods of rising and falling prices. This volatility may cause the Fund’s NAV to experience significant increases or decreases over short periods of time. If there is a general decline in the securities and other markets, the NAV of the Fund may lose value, regardless of the individual results of the securities and other instruments in which the Fund invests.
The price the Fund could receive upon the sale of any particular portfolio investment may differ from the Fund’s valuation of the investment, particularly for securities that trade in thin or volatile markets or that are valued using a fair valuation technique or a price provided by an independent pricing service. Changes to significant unobservable inputs and assumptions (i.e., publicly traded company multiples, growth rate, time to exit) due to the lack of observable inputs may significantly impact the resulting fair value and therefore the Fund’s results of operations. As a result, the price received upon the sale of an investment may be less than the value ascribed by the Fund, and the Fund could realize a greater than expected loss or lesser than expected gain upon the sale of the investment. The Fund’s ability to value its investments may also be impacted by technological issues and/or errors by pricing services or other third-party service providers.
Counterparty Credit Risk: The Fund may be exposed to counterparty credit risk, or the risk that an entity may fail to or be unable to perform on its commitments related to unsettled or open transactions, including making timely interest and/or principal payments or otherwise honoring its obligations. The Fund manages counterparty credit risk by entering into transactions only with counterparties that the Manager believes have the financial resources to honor their obligations and by monitoring the financial stability of those counterparties. Financial assets, which potentially expose the Fund to market, issuer and counterparty credit risks, consist principally of financial instruments and receivables due from counterparties. The extent of the Fund’s exposure to market, issuer and counterparty credit risks with respect to these financial assets is approximately their value recorded in the Consolidated Statement of Assets and Liabilities, less any collateral held by the Fund.
A derivative contract may suffer a mark-to-market loss if the value of the contract decreases due to an unfavorable change in the market rates or values of the underlying instrument. Losses can also occur if the counterparty does not perform under the contract.
For OTC options purchased, the Fund bears the risk of loss in the amount of the premiums paid plus the positive change in market values net of any collateral held by the Fund should the counterparty fail to perform under the contracts. Options written by the Fund do not typically give rise to counterparty credit risk, as options written generally obligate the Fund, and not the counterparty, to perform. The Fund may be exposed to counterparty credit risk with respect to options written to the extent the Fund deposits collateral with its counterparty to a written option.
With exchange-traded options purchased and exchange-traded futures and centrally cleared swaps, there is less counterparty credit risk to the Fund since the exchange or clearinghouse, as counterparty to such instruments, guarantees against a possible default. The clearinghouse stands between the buyer and the seller of the contract; therefore, credit risk is limited to failure of the clearinghouse. While offset rights may exist under applicable law, the Fund does not have a contractual right of offset against a clearing broker or clearinghouse in the event of a default (including the bankruptcy or insolvency). Additionally, credit risk exists in exchange-traded futures and centrally cleared swaps with respect to initial and variation margin that is held in a clearing broker’s customer accounts. While clearing brokers are required to segregate customer margin from their own assets, in the event that a clearing broker becomes insolvent or goes into bankruptcy and at that time there is a shortfall in the aggregate amount of margin held by the clearing broker for all its clients, typically the shortfall would be allocated on a pro rata basis across all the clearing broker’s customers, potentially resulting in losses to the Fund.
Concentration Risk: A diversified portfolio, where this is appropriate and consistent with a fund’s objectives, minimizes the risk that a price change of a particular investment will have a material impact on the NAV of a fund. The investment concentrations within the Fund’s portfolio are disclosed in its Consolidated Schedule of Investments.
The Fund invests a significant portion of its assets in high yield securities. High yield securities that are rated below investment-grade (commonly referred to as “junk bonds”) or are unrated may be deemed speculative, involve greater levels of risk than higher-rated securities of similar maturity and are more likely to default. High yield securities may be issued by less creditworthy issuers, and issuers of high yield securities may be unable to meet their interest or principal payment obligations. High yield securities are subject to extreme price fluctuations, may be less liquid than higher rated fixed-income securities, even under normal economic conditions, and frequently have redemption features.
The Fund invests a significant portion of its assets in fixed-income securities and/or uses derivatives tied to the fixed-income markets. Changes in market interest rates or economic conditions may affect the value and/or liquidity of such investments. Interest rate risk is the risk that prices of bonds and other fixed-income securities will decrease as interest rates rise and increase as interest rates fall. The Fund may be subject to a greater risk of rising interest rates due to the recent period of historically low interest rates. The Federal Reserve has recently begun to raise the federal funds rate as part of its efforts to address inflation. There is a risk that interest rates will continue to rise, which will likely drive down the prices of bonds and other fixed-income securities, and could negatively impact the Fund’s performance.
| | |
| 62 | | 2 0 2 2 BLACK ROCK ANNUAL REPORT TO SHAREHOLDERS |
Notes to Consolidated Financial Statements (continued)
LIBOR Transition Risk: The United Kingdom’s Financial Conduct Authority announced a phase out of the LIBOR. Although many LIBOR rates ceased to be published or no longer are representative of the underlying market they seek to measure after December 31, 2021, a selection of widely used USD LIBOR rates will continue to be published through June 2023 in order to assist with the transition. The Fund may be exposed to financial instruments tied to LIBOR to determine payment obligations, financing terms, hedging strategies or investment value. The transition process away from LIBOR might lead to increased volatility and illiquidity in markets for, and reduce the effectiveness of new hedges placed against instruments whose terms currently include LIBOR. The ultimate effect of the LIBOR transition process on the Fund is uncertain.
| 11. | CAPITAL SHARE TRANSACTIONS |
The Fund is authorized to issue an unlimited number of shares, all of which were initially classified as Common Shares. The par value for the Fund’s Common Shares is $0.001.
Transactions in capital shares for each class were as follows:
| | | | | | | | | | | | | | | | |
| |
| | | Year Ended
12/31/22 | | | Year Ended 12/31/21 | |
| | | | |
| Fund Name / Share Class | | Shares | | | Amounts | | | Shares | | | Amounts | |
| |
BlackRock Credit Strategies Fund | | | | | | | | | | | | | | | | |
Institutional | | | | | | | | | | | | | | | | |
Shares sold | | | 11,086,508 | | | $ | 101,945,743 | | | | 16,367,575 | | | $ | 169,085,562 | |
Shares issued from dividend reinvestment | | | 361,932 | | | | 3,214,888 | | | | 249,759 | | | | 2,538,779 | |
Shares redeemed in repurchase offers | | | (5,520,633 | ) | | | (48,804,990 | ) | | | (304,330 | ) | | | (3,122,248 | ) |
| | | | | | | | | | | | | | | | |
| | | | |
| | | 5,927,807 | | | $ | 56,355,641 | | | | 16,313,004 | | | $ | 168,502,093 | |
| | | | | | | | | | | | | | | | |
Class A | | | | | | | | | | | | | | | | |
Shares sold | | | 1,039,703 | | | $ | 9,733,623 | | | | 7,020,768 | | | $ | 73,046,915 | |
Shares issued from dividend reinvestment | | | 582,337 | | | | 5,186,559 | | | | 430,269 | | | | 4,406,091 | |
Shares redeemed in repurchase offers | | | (1,864,057 | ) | | | (16,578,161 | ) | | | (240,237 | ) | | | (2,486,832 | ) |
| | | | | | | | | | | | | | | | |
| | | | |
| | | (242,017 | ) | | $ | (1,657,979 | ) | | | 7,210,800 | | | $ | 74,966,174 | |
| | | | | | | | | | | | | | | | |
Class U(a) | | | | | | | | | | | | | | | | |
Shares sold | | | 2,273,962 | | | $ | 21,007,630 | | | | 2,597,030 | | | $ | 26,417,099 | |
Shares issued from dividend reinvestment | | | — | | | | — | | | | 19,393 | | | | 194,134 | |
Shares redeemed in repurchase offers | | | (278,784 | ) | | | (2,469,901 | ) | | | (1,066 | ) | | | (10,785 | ) |
| | | | | | | | | | | | | | | | |
| | | | |
| | | 1,995,178 | | | $ | 18,537,729 | | | | 2,615,357 | | | $ | 26,600,448 | |
| | | | | | | | | | | | | | | | |
Class W(a) | | | | | | | | | | | | | | | | |
Shares sold | | | — | | | $ | — | | | | 23,787 | | | $ | 249,999 | |
| | | | | | | | | | | | | | | | |
| | | | |
| | | 7,680,968 | | | $ | 73,235,391 | | | | 26,162,948 | | | $ | 270,318,714 | |
| | | | | | | | | | | | | | | | |
| | (a) | The share class commenced operation on July 12, 2021. | |
The Fund will make offers to purchase between 5% and 25% of its outstanding shares at approximate 3 month intervals. Repurchase offer results for the periods shown were as follows:
| | | | | | | | | | | | | | | | | | | | | | | | | | | | | | | | |
| | | | | | | | | |
| | | Commencement Date of Tender
Offer Period(a) | | | Valuation Date | | | Number of Shares Tendered | | | Tendered Shares as a Percentage of Outstanding Shares | | | Number of Tendered Shares Purchased | | | Tendered Shares Purchased as a Percentage of Outstanding Shares | | | Purchase Price | | | Total Amount of Purchases | |
Institutional | | | January 7, 2022 | | | | February 7, 2022 | | | | 476,764 | | | | 1.57 | % | | | 476,764 | | | | 1.57 | % | | $ | 9.70 | | | $ | 4,624,611 | |
Class A | | | January 7, 2022 | | | | February 7, 2022 | | | | 376,008 | | | | 3.14 | | | | 376,008 | | | | 3.14 | | | | 9.71 | | | | 3,651,042 | |
Class U | | | January 7, 2022 | | | | February 7, 2022 | | | | 26,393 | | | | 0.82 | | | | 26,393 | | | | 0.82 | | | | 9.71 | | | | 256,272 | |
Class W | | | January 7, 2022 | | | | February 7, 2022 | | | | — | | | | — | | | | — | | | | — | | | | — | | | | — | |
Institutional | | | April 8, 2022 | | | | May 9, 2022 | | | | 1,752,087 | | | | 5.04 | | | | 1,752,087 | | | | 5.04 | | | | 9.11 | | | | 15,961,512 | |
Class A | | | April 8, 2022 | | | | May 9, 2022 | | | | 234,476 | | | | 1.93 | | | | 234,476 | | | | 1.93 | | | | 9.12 | | | | 2,138,424 | |
Class U | | | April 8, 2022 | | | | May 9, 2022 | | | | 76,616 | | | | 1.97 | | | | 76,616 | | | | 1.97 | | | | 9.13 | | | | 699,501 | |
Class W | | | April 8, 2022 | | | | May 9, 2022 | | | | — | | | | — | | | | — | | | | — | | | | — | | | | — | |
Institutional | | | July 8, 2022 | | | | August 9, 2022 | | | | 1,456,156 | | | | 4.08 | | | | 1,456,156 | | | | 4.08 | | | | 8.79 | | | | 12,799,607 | |
Class A | | | July 8, 2022 | | | | August 9, 2022 | | | | 631,143 | | | | 5.15 | | | | 631,143 | | | | 5.15 | | | | 8.80 | | | | 5,554,063 | |
Class U | | | July 8, 2022 | | | | August 9, 2022 | | | | 87,441 | | | | 2.01 | | | | 87,441 | | | | 2.01 | | | | 8.81 | | | | 770,357 | |
Class W | | | July 8, 2022 | | | | August 9, 2022 | | | | — | | | | — | | | | — | | | | — | | | | — | | | | — | |
Institutional | | | October 7, 2022 | | | | November 8, 2022 | | | | 1,835,626 | | | | 5.16 | | | | 1,835,626 | | | | 5.16 | | | | 8.40 | | | | 15,419,260 | |
Class A | | | October 7, 2022 | | | | November 8, 2022 | | | | 622,430 | | | | 5.23 | | | | 622,430 | | | | 5.23 | | | | 8.41 | | | | 5,234,632 | |
Class U | | | October 7, 2022 | | | | November 8, 2022 | | | | 88,334 | | | | 1.92 | | | | 88,334 | | | | 1.92 | | | | 8.42 | | | | 743,771 | |
Class W | | | October 7, 2022 | | | | November 8, 2022 | | | | — | | | | — | | | | — | | | | — | | | | — | | | | — | |
| | |
NOTES TO CONSOLIDATED FINANCIAL STATEMENTS | | 63 |
Notes to Consolidated Financial Statements (continued)
| | | | | | | | | | | | | | | | | | | | | | | | | | | | | | | | |
| | | | | | | | | |
| | | Commencement Date of Tender
Offer Period(a) | | | Valuation Date | | | Number of Shares Tendered | | | Tendered Shares as a Percentage of Outstanding Shares | | | Number of Tendered Shares Purchased | | | Tendered Shares Purchased as a Percentage of Outstanding Shares | | | Purchase Price | | | Total Amount of Purchases | |
Institutional | | | January 8, 2021 | | | | February 8, 2021 | | | | 2,667 | | | | 0.02 | % | | | 2,667 | | | | 0.02 | % | | $ | 10.50 | | | $ | 28,004 | |
Class A | | | January 8, 2021 | | | | February 8, 2021 | | | | 37,478 | | | | 0.77 | | | | 37,478 | | | | 0.77 | | | | 10.51 | | | | 393,898 | |
Institutional | | | April 9, 2021 | | | | May 10, 2021 | | | | 41,811 | | | | 0.26 | | | | 41,811 | | | | 0.26 | | | | 10.52 | | | | 439,849 | |
Class A | | | April 9, 2021 | | | | May 10, 2021 | | | | 2,552 | | | | 0.04 | | | | 2,552 | | | | 0.04 | | | | 10.52 | | | | 26,850 | |
Institutional | | | July 9, 2021 | | | | August 20, 2021 | | | | 94,075 | | | | 0.45 | | | | 94,075 | | | | 0.45 | | | | 10.40 | | | | 978,380 | |
Class A | | | July 9, 2021 | | | | August 20, 2021 | | | | 144,829 | | | | 1.52 | | | | 144,829 | | | | 1.52 | | | | 10.40 | | | | 1,506,222 | |
Institutional | | | October 8, 2021 | | | | November 9, 2021 | | | | 165,776 | | | | 0.66 | | | | 165,776 | | | | 0.66 | | | | 10.11 | | | | 1,675,991 | |
Class A | | | October 8, 2021 | | | | November 9, 2021 | | | | 55,377 | | | | 0.52 | | | | 55,377 | | | | 0.52 | | | | 10.11 | | | | 559,863 | |
Class U | | | October 8, 2021 | | | | November 9, 2021 | | | | 1,066 | | | | 0.08 | | | | 1,066 | | | | 0.08 | | | | 10.12 | | | | 10,785 | |
Class W | | | October 8, 2021 | | | | November 9, 2021 | | | | — | | | | — | | | | — | | | | — | | | | — | | | | — | |
| | (a) | Date the repurchase offer period began. | |
The amount of the repurchase offers is shown as redemptions of shares resulting from repurchase offers in the Consolidated Statements of Changes in Net Assets.
As of December 31, 2022, shares owned by BlackRock Financial Management, Inc., an affiliate of the Fund, were as follows:
| | | | | | | | | | | | | | | | |
| Fund Name | | Institutional | | | Class A | | | Class U | | | Class W | |
BlackRock Credit Strategies Fund | | | 9,800,000 | | | | 58,962 | | | | 23,787 | | | | 23,787 | |
Management’s evaluation of the impact of all subsequent events on the Fund’s consolidated financial statements was completed through the date the consolidated financial statements were issued and the following items were noted:
The Fund conducted a quarterly repurchase offer for up to 5% of its issued and outstanding common shares. The results of the Fund’s repurchase offer were as follows:
| | | | | | | | | | | | | | | | | | | | | | | | | | | | | | | | |
| | | Commencement Date | | | Valuation Date | | | Number of Shares Tendered | | | Tendered Shares as a Percentage of Outstanding Shares | | | Number of Tendered Shares Purchased | | | Tendered Shares Purchased as a Percentage of Outstanding Shares | | | Purchase Price | | | Total Amount of Purchases | |
Institutional | | | January 9, 2023 | | | | February 8, 2023 | | | | 2,957,747 | | | | 8.44 | % | | | 2,078,408 | | | | 5.93 | % | | $ | 8.72 | | | $ | 18,123,719 | |
Class A | | | January 9, 2023 | | | | February 8, 2023 | | | | 608,674 | | | | 5.29 | | | | 427,776 | | | | 3.72 | | | | 8.74 | | | | 3,738,762 | |
Class U | | | January 9, 2023 | | | | February 8, 2023 | | | | 82,501 | | | | 1.74 | | | | 57,883 | | | | 1.22 | | | | 8.74 | | | | 505,896 | |
Class W | | | January 9, 2023 | | | | February 8, 2023 | | | | — | | | | — | | | | — | | | | — | | | | — | | | | — | |
| | |
| 64 | | 2 0 2 2 BLACK ROCK ANNUAL REPORT TO SHAREHOLDERS |
Report of Independent Registered Public Accounting Firm
To the Shareholders and the Board of Trustees of BlackRock Credit Strategies Fund:
Opinion on the Financial Statements and Financial Highlights
We have audited the accompanying statement of assets and liabilities of BlackRock Credit Strategies Fund (the “Fund”), including the schedule of investments, as of December 31, 2022, the related statements of operations and cash flows for the year then ended, the statements of changes in net assets for each of the two years in the period then ended, the financial highlights for each of the three years in the period then ended and for the period from February 28, 2019 (commencement of operations) through December 31, 2019, and the related notes. Such financial statements and financial highlights are consolidated as of and for the year ended December 31, 2022. In our opinion, the financial statements and financial highlights present fairly, in all material respects, the financial position of the Fund as of December 31, 2022, and the results of its operations and its cash flows for the year then ended, the changes in its net assets for each of the two years in the period then ended and the financial highlights for the each of the three years in the period then ended and for the period from February 28, 2019 (commencement of operations) through December 31, 2019, in conformity with accounting principles generally accepted in the United States of America.
Basis for Opinion
These financial statements and financial highlights are the responsibility of the Fund’s management. Our responsibility is to express an opinion on the Fund’s financial statements and financial highlights based on our audits. We are a public accounting firm registered with the Public Company Accounting Oversight Board (United States) (PCAOB) and are required to be independent with respect to the Fund in accordance with the U.S. federal securities laws and the applicable rules and regulations of the Securities and Exchange Commission and the PCAOB.
We conducted our audits in accordance with the standards of the PCAOB. Those standards require that we plan and perform the audit to obtain reasonable assurance about whether the financial statements and financial highlights are free of material misstatement, whether due to error or fraud. The Fund is not required to have, nor were we engaged to perform, an audit of its internal control over financial reporting. As part of our audits we are required to obtain an understanding of internal control over financial reporting but not for the purpose of expressing an opinion on the effectiveness of the Fund’s internal control over financial reporting. Accordingly, we express no such opinion.
Our audits included performing procedures to assess the risks of material misstatement of the financial statements and financial highlights, whether due to error or fraud, and performing procedures that respond to those risks. Such procedures included examining, on a test basis, evidence regarding the amounts and disclosures in the financial statements and financial highlights. Our audits also included evaluating the accounting principles used and significant estimates made by management, as well as evaluating the overall presentation of the financial statements and financial highlights. Our procedures included confirmation of securities owned as of December 31, 2022, by correspondence with custodians or counterparties; when replies were not received, we performed other auditing procedures. We believe that our audits provide a reasonable basis for our opinion.
Deloitte & Touche LLP
Boston, Massachusetts
February 24, 2023
We have served as the auditor of one or more BlackRock investment companies since 1992.
| | |
REPORT OF INDEPENDENT REGISTERED PUBLIC ACCOUNTING FIRM | | 65 |
Important Tax Information (unaudited)
The following amount, or maximum amount allowable by law, is hereby designated as qualified dividend income for individuals for the fiscal year ended December 31, 2022:
| | | | |
| | |
| Fund Name | | Qualified Dividend
Income | |
BlackRock Credit Strategies Fund | | $ | 833,650 | |
The following percentage, or maximum percentage allowable by law, of ordinary income distributions paid during the fiscal year ended December 31, 2022 qualified for the dividends-received deduction for corporate shareholders:
| | | | |
| | |
| Fund Name | | Dividends-Received
Deduction | |
BlackRock Credit Strategies Fund | | | 1.12% | |
The Fund hereby designates the following amount, or maximum amount allowable by law, as interest income eligible to be treated as a Section 163(j) interest dividend for the fiscal year ended December 31, 2022:
| | | | |
| | |
| Fund Name | | Interest Dividends | |
BlackRock Credit Strategies Fund | | $ | 30,375,068 | |
The Fund hereby designates the following amount, or maximum amount allowable by law, as interest-related dividends eligible for exemption from U.S. withholding tax for nonresident aliens and foreign corporations for the fiscal year ended December 31, 2022:
| | | | |
| | |
| Fund Name | | Interest
Related
Dividends | |
BlackRock Credit Strategies Fund | | $ | 21,231,691 | |
| | |
| 66 | | 2 0 2 2 BLACK ROCK ANNUAL REPORT TO SHAREHOLDERS |
Automatic Dividend Reinvestment Plan
Pursuant to the Fund’s dividend reinvestment plan (the “Reinvestment Plan”), registered shareholders will have all dividends, including any capital gain dividends, reinvested automatically in additional Shares of the Fund by BNY Mellon Investment Servicing (US) Inc. (the “Reinvestment Plan Agent”), unless the shareholder elects to receive cash. Shareholders who elect not to participate in the Reinvestment Plan will receive all dividends in cash paid directly to the shareholder of record (or, if the Shares are held through banks, brokers or other nominee name, then to such banks, brokers or other nominee) by BNY Mellon Investment Servicing (US) Inc., as dividend disbursing agent. You may elect not to participate in the Reinvestment Plan and to receive all dividends in cash by contacting your bank, broker or other nominee who holds your Fund common shares or if your Fund common shares are held directly by the Fund, by contacting the Reinvestment Plan Agent, at the address set forth below. Participation in the Reinvestment Plan is completely voluntary and may be terminated or resumed at any time without penalty by written notice if received and processed by the Reinvestment Plan Agent prior to the dividend record date. Additionally, the Reinvestment Plan Agent seeks to process notices received after the record date but prior to the payable date and such notices often will become effective by the payable date. Where late notices are not processed by the applicable payable date, such termination or resumption will be effective with respect to any subsequently declared dividend.
In the case of record shareholders such as banks, brokers or other nominees that hold Fund common shares for others who are the beneficial owners, the Reinvestment Plan Agent will administer the Reinvestment Plan on the basis of the number of Shares certified from time to time by the record shareholder as representing the total amount registered in such shareholder’s name and held for the account of beneficial owners who are to participate in the Reinvestment Plan. Shareholders whose Shares are held in the name of a bank, broker or other nominee should contact the bank, broker or other nominee for details. Such shareholders may not be able to transfer their shares to another bank, broker or other nominee and continue to participate in the Reinvestment Plan.
The number of newly issued Shares to be credited to each participant’s account will be determined by dividing the dollar amount of the dividend by the net asset value per share on the reinvestment date; there is no sales or other charge for reinvestment.
The Reinvestment Plan Agent’s fees for the handling of the reinvestment of dividends will be paid by the Fund. The Fund reserves the right to amend or terminate the Reinvestment Plan. There is no direct service charge to participants with regard to newly issued Shares in the Reinvestment Plan. Notice of amendments to the Reinvestment Plan will be sent to participants.
All correspondence concerning the Reinvestment Plan should be directed to the Reinvestment Plan Agent, in writing to: BlackRock Funds, C/O BNY Mellon Investment Servicing, PO Box 9819, Providence, RI 02940.
| | |
AUTOMATIC DIVIDEND REINVESTMENT PLAN | | 67 |
Trustee and Officer Information
| | | | | | | | |
Independent Trustees |
| | | | | |
Name Year of Birth(a)(b) | | Position(s) Held (Length of Service)(c) | | Principal Occupation(s) During Past 5 Years | | Number of BlackRock-Advised Registered Investment Companies (“RICs”) Consisting of Investment Portfolios (“Portfolios”) Overseen | | Public Company
and Other
Investment
Company
Directorships
Held During
Past 5 Years |
| | | | | | | | |
| | | | |
W. Carl Kester 1951 | | Chair of the Board and Trustee (Since 2018) | | George Fisher Baker Jr. Professor of Business Administration, Harvard Business School since 2008; Deputy Dean for Academic Affairs from 2006 to 2010; Chairman of the Finance Unit, from 2005 to 2006; Senior Associate Dean and Chairman of the MBA Program from 1999 to 2005; Member of the faculty of Harvard Business School since 1981. | | 72 RICs consisting of 104 Portfolios | | None |
| | | | |
Frank J. Fabozzi 1948 | | Trustee (Since 2018) | | Editor of The Journal of Portfolio Management since 1986; Professor of Finance, EDHEC Business School (France) from 2011 to 2022; Professor of Practice, Johns Hopkins University since 2021; Professor in the Practice of Finance, Yale University School of Management from 1994 to 2011 and currently a Teaching Fellow in Yale’s Executive Programs; Visiting Professor, Rutgers University for the Spring 2019 semester; Visiting Professor, New York University for the 2019 academic year; Adjunct Professor of Finance, Carnegie Mellon University in fall 2020 semester. | | 72 RICs consisting of 104 Portfolios | | None |
| | | | |
Catherine A. Lynch 1961 | | Trustee (Since 2018) | | Chief Executive Officer, Chief Investment Officer and various other positions, National Railroad Retirement Investment Trust from 2003 to 2016; Associate Vice President for Treasury Management, The George Washington University from 1999 to 2003; Assistant Treasurer, Episcopal Church of America from 1995 to 1999. | | 72 RICs consisting of 104 Portfolios | | PennyMac Mortgage Investment Trust. |
| | | |
| | | Interested Trustees(d) | | | | |
| | | | | |
Name Year of Birth(b) | | Position(s) Held (Length of Service)(c) | | Principal Occupation(s) During Past 5 Years | | Number of BlackRock-Advised Registered Investment Companies (“RICs”) Consisting of Investment Portfolios (“Portfolios”) Overseen | | Public Company
and Other
Investment
Company
Directorships
Held During
Past 5 Years |
| | | | |
John M. Perlowski 1964 | | Trustee (Since 2018) and President and Chief Executive Officer (Since 2018) | | Managing Director of BlackRock, Inc. since 2009; Head of BlackRock Global Accounting and Product Services since 2009; Advisory Director of Family Resource Network (charitable foundation) since 2009. | | 100 RICs consisting of 268 Portfolios | | None |
| (a) | The address of each Trustee is c/o BlackRock, Inc., 55 East 52nd Street, New York, New York 10055. |
| (b) | Each Independent Trustee holds office until his or her successor is duly elected and qualifies or until his or her earlier death, resignation, retirement or removal as provided by the Fund’s by-laws or charter or statute, or until December 31 of the year in which he or she turns 75. Trustees who are “interested persons,” as defined in the Investment Company Act serve until their successor is duly elected and qualifies or until their earlier death, resignation, retirement or removal as provided by the Fund’s by-laws or statute, or until December 31 of the year in which they turn 72. The Board may determine to extend the terms of Independent Trustees on a case-by-case basis, as appropriate. |
| (c) | Following the combination of Merrill Lynch Investment Managers, L.P. (“MLIM”) and BlackRock, Inc. in September 2006, the various legacy MLIM and legacy BlackRock fund boards were realigned and consolidated into three new fund boards in 2007. Certain Independent Trustees first became members of the boards of other legacy MLIM or legacy BlackRock funds as follows: Frank J. Fabozzi, 1988; W. Carl Kester, 1995. Certain other Independent Trustees became members of the boards of the close-end funds in the BlackRock Fixed-Income Complex as follows: Catherine A. Lynch, 2016. |
| (d) | Mr. Perlowski is an “interested person,” as defined in the 1940 Act, of the Fund based on his positions with BlackRock, Inc. and its affiliates. Mr. Perlowski is also a board member of the BlackRock Multi-Asset Complex. |
| | |
| 68 | | 2 0 2 2 BLACK ROCK ANNUAL REPORT TO SHAREHOLDERS |
Trustee and Officer Information (continued)
| | | | |
| Officers Who Are Not Trustees(a) |
| | | |
Name Year of Birth(b) | | Position(s) Held (Length of Service) | | Principal Occupation(s) During Past 5 Years |
| | |
Jonathan Diorio 1980 | | Vice President (Since 2018) | | Managing Director of BlackRock, Inc. since 2015; Director of BlackRock, Inc. from 2011 to 2015. |
| | |
Trent Walker 1974 | | Chief Financial Officer (Since 2021) | | Managing Director of BlackRock, Inc. since September 2019; Executive Vice President of PIMCO from 2016 to 2019; Senior Vice President of PIMCO from 2008 to 2015; Treasurer from 2013 to 2019 and Assistant Treasurer from 2007 to 2017 of PIMCO Funds, PIMCO Variable Insurance Trust, PIMCO ETF Trust, PIMCO Equity Series, PIMCO Equity Series VIT, PIMCO Managed Accounts Trust, 2 PIMCO-sponsored interval funds and 21 PIMCO-sponsored closed-end funds. |
| | |
Jay M. Fife 1970 | | Treasurer (Since 2018) | | Managing Director of BlackRock, Inc. since 2007. |
| | |
Charles Park 1967 | | Chief Compliance Officer (Since 2018) | | Anti-Money Laundering Compliance Officer for certain BlackRock-advised Funds from 2014 to 2015; Chief Compliance Officer of BlackRock Advisors, LLC and the BlackRock-advised Funds in the BlackRock Multi-Asset Complex and the BlackRock Fixed-Income Complex since 2014; Principal of and Chief Compliance Officer for iShares® Delaware Trust Sponsor LLC since 2012 and BlackRock Fund Advisors (“BFA”) since 2006; Chief Compliance Officer for the BFA-advised iShares® exchange traded funds since 2006; Chief Compliance Officer for BlackRock Asset Management International Inc. since 2012. |
| | |
Lisa Belle 1968 | | Anti-Money Laundering Compliance Officer (Since 2019) | | Managing Director of BlackRock, Inc. since 2019; Global Financial Crime Head for Asset and Wealth Management of JP Morgan from 2013 to 2019; Managing Director of RBS Securities from 2012 to 2013; Head of Financial Crimes for Barclays Wealth Americas from 2010 to 2012. |
| | |
Janey Ahn 1975 | | Secretary (Since 2018) | | Managing Director of BlackRock, Inc. since 2018; Director of BlackRock, Inc. from 2009 to 2017. |
| (a) | The address of each Officer is c/o BlackRock, Inc., 55 East 52nd Street, New York, New York 10055. |
| (b) | Officers of the Fund serve at the pleasure of the Board. |
Further information about the Fund’s Trustees and Officers is available in the Fund’s Statement of Additional Information, which can be obtained without charge by calling (800) 882-0052.
Effective February 28, 2022, the Fund’s portfolio managers are James Keenan, Jeffrey Cucunato, David Delbos, Patrick Wolfe and Eric Yuan. Mr. Yuan has been a Director at BlackRock since 2018.
| | |
TRUSTEE AND OFFICER INFORMATION | | 69 |
Additional Information
General Information
The Fund’s Statement of Additional Information includes additional information about its Board and is available, without charge upon request by calling (800) 882-0052.
The following information is a summary of certain changes since December 31, 2021. This information may not reflect all of the changes that have occurred since you purchased the Fund.
Except if noted otherwise herein, there were no changes to the Fund’s charter or by-laws that would delay or prevent a change of control of the Fund that were not approved by the shareholders. Except if noted otherwise herein, there have been no changes in the persons who are primarily responsible for the day-to-day management of the Fund’s portfolios.
In accordance with Section 23(c) of the Investment Company Act of 1940, the Fund may from time to time purchase shares of its common stock in the open market or in private transactions.
Quarterly performance, semi-annual and annual reports, current net asset value and other information regarding the Fund may be found on BlackRock’s website, which can be accessed at blackrock.com. Any reference to BlackRock’s website in this report is intended to allow investors public access to information regarding the Fund and does not, and is not intended to, incorporate BlackRock’s website in this report.
Electronic Delivery
Shareholders can sign up for e-mail notifications of quarterly statements, annual and semi-annual shareholder reports and prospectuses by enrolling in the electronic delivery program. Electronic copies of shareholder reports and prospectuses are available on BlackRock’s website.
To enroll in electronic delivery:
Shareholders Who Hold Accounts with Investment Advisers, Banks or Brokerages:
Please contact your financial adviser. Please note that not all investment advisers, banks or brokerages may offer this service.
Householding
The Fund will mail only one copy of shareholder documents, including prospectuses, annual and semi-annual reports, Rule 30e-3 notices and proxy statements, to shareholders with multiple accounts at the same address. This practice is commonly called “householding” and is intended to reduce expenses and eliminate duplicate mailings of shareholder documents. Mailings of your shareholder documents may be householded indefinitely unless you instruct us otherwise. If you do not want the mailing of these documents to be combined with those for other members of your household, please call the Fund at (800) 882-0052.
Availability of Quarterly Schedule of Investments
The Fund files its complete schedule of portfolio holdings with the SEC for the first and third quarters of each fiscal year as an exhibit to its reports on Form N-PORT. The Fund’s Form N-PORT is available on the SEC’s website at sec.gov. Additionally, the Fund makes its portfolio holdings for the first and third quarters of each fiscal year available at blackrock.com/fundreports.
Availability of Proxy Voting Policies, Procedures and Voting Records
A description of the policies and procedures that the Fund uses to determine how to vote proxies relating to portfolio securities and information about how the Fund voted proxies relating to securities held in the Fund’s portfolio during the most recent 12-month period ended June 30 is available without charge, upon request (1) by calling (800) 882-0052; (2) on the BlackRock website at blackrock.com; and (3) on the SEC’s website at sec.gov.
Availability of Fund Updates
BlackRock will update performance and certain other data for the Fund on a monthly basis on its website in the “Closed-end Funds” section of blackrock.com as well as certain other material information as necessary from time to time. Investors and others are advised to check the website for updated performance information and the release of other material information about the Fund. This reference to BlackRock’s website is intended to allow investors public access to information regarding the Fund and does not, and is not intended to, incorporate BlackRock’s website in this report.
Fundamental Periodic Repurchase Policy
The Fund has adopted an “interval fund” structure pursuant to Rule 23c-3 under the 1940 Act as a fundamental policy. As an interval fund, the Fund will make quarterly repurchase offers at net asset value (less a repurchase fee not to exceed 2%) to all Fund shareholders. The percentage of outstanding shares that the Fund can repurchase in each offer will be established by the Fund’s Board shortly before the commencement of each offer and will be between 5% and 25% of the Fund’s then outstanding shares.
The Fund has adopted the following fundamental policies regarding periodic repurchases:
(a) The Fund will make repurchase offers at periodic intervals pursuant to Rule 23c-3 under the 1940 Act.
(b) The periodic interval between repurchase request deadlines will be approximately 3 months.
| | |
| 70 | | 2 0 2 2 BLACK ROCK ANNUAL REPORT TO SHAREHOLDERS |
Additional Information (continued)
Fundamental Periodic Repurchase Policy (continued)
(c) The maximum number of days between a repurchase request deadline and the next repurchase pricing date will be 14 days; provided that if the 14th day after a repurchase request deadline is not a business day, the repurchase pricing date shall be the next business day.
The Board may place such conditions and limitations on a repurchase offer as may be permitted under Rule 23c-3. Repurchase offers may be suspended or postponed under certain circumstances, as provided in Rule 23c-3.
During the fiscal year ended December 31, 2022, the Fund conducted a repurchase offer for up to 5% of its outstanding Common Shares, pursuant to Rule 23c-3 under the 1940 Act, as summarized in the following table:
| | | | | | | | | | | | | | |
| | | | Number of Repurchase Offers | | | Number of Shares Repurchased | | | Number of Shares Tendered | |
| | | | | | 4 | | | | 7,663,474 | | | | 7,663,474 | |
BlackRock Privacy Principles
BlackRock is committed to maintaining the privacy of its current and former fund investors and individual clients (collectively, “Clients”) and to safeguarding their non-public personal information. The following information is provided to help you understand what personal information BlackRock collects, how we protect that information and why in certain cases we share such information with select parties.
If you are located in a jurisdiction where specific laws, rules or regulations require BlackRock to provide you with additional or different privacy-related rights beyond what is set forth below, then BlackRock will comply with those specific laws, rules or regulations.
BlackRock obtains or verifies personal non-public information from and about you from different sources, including the following: (i) information we receive from you or, if applicable, your financial intermediary, on applications, forms or other documents; (ii) information about your transactions with us, our affiliates, or others; (iii) information we receive from a consumer reporting agency; and (iv) from visits to our websites.
BlackRock does not sell or disclose to non-affiliated third parties any non-public personal information about its Clients, except as permitted by law or as is necessary to respond to regulatory requests or to service Client accounts. These non-affiliated third parties are required to protect the confidentiality and security of this information and to use it only for its intended purpose.
We may share information with our affiliates to service your account or to provide you with information about other BlackRock products or services that may be of interest to you. In addition, BlackRock restricts access to non-public personal information about its Clients to those BlackRock employees with a legitimate business need for the information. BlackRock maintains physical, electronic and procedural safeguards that are designed to protect the non-public personal information of its Clients, including procedures relating to the proper storage and disposal of such information.
Fund and Service Providers
| | |
Investment Adviser | | Distributor |
BlackRock Advisors, LLC | | BlackRock Investments, LLC |
Wilmington, DE 19809 | | New York, NY 10022 |
| |
Sub-Adviser | | Independent Registered Public Accounting Firm |
BlackRock Capital Investment Advisors, LLC | | Deloitte & Touche LLP |
Wilmington, DE 19809 | | Boston, MA 02116 |
| |
BlackRock International Limited | | Legal Counsel |
Edinburgh, EH3 8BL | | Willkie Farr & Gallagher LLP |
United Kingdom | | New York, NY 10019 |
| |
BlackRock (Singapore) Limited | | Address of the Fund |
079912 Singapore | | 100 Bellevue Parkway |
| | Wilmington, DE 19809 |
| |
Accounting Agent and Custodian | | |
State Street Bank and Trust Company | | |
Boston, MA 02111 | | |
| |
Transfer Agent | | |
BNY Mellon Investment Servicing (US) Inc. | | |
Wilmington, DE 19809 | | |
| | |
ADDITIONAL INFORMATION | | 71 |
Glossary of Terms Used in this Report
Currency Abbreviation
| | |
| |
| EUR | | Euro |
| |
| GBP | | British Pound |
| |
| USD | | United States Dollar |
Portfolio Abbreviation
| | |
| CDI | | CREST Depository Interest |
| |
| CLO | | Collateralized Loan Obligation |
| |
| CMT | | Constant Maturity Treasury |
| |
| CR | | Custodian Receipt |
| |
| DAC | | Designated Activity Company |
| |
| ETF | | Exchange-Traded Fund |
| |
| LIBOR | | London Interbank Offered Rate |
| |
| LOC | | Letter of Credit |
| |
| MTN | | Medium-Term Note |
| |
| PCL | | Public Company Limited |
| |
| PIK | | Payment-in-Kind |
| |
| REIT | | Real Estate Investment Trust |
| |
| SOFR | | Secured Overnight Financing Rate |
| |
| SOFR CME | | Secured Overnight Financing Rate Chicago Mercantile Exchange |
| |
| SOFRTE | | Term Secured Overnight Financing Rate |
| | |
| 72 | | 2 0 2 2 BLACK ROCK ANNUAL REPORT TO SHAREHOLDERS |
THIS PAGE INTENTIONALLY LEFT BLANK.
THIS PAGE INTENTIONALLY LEFT BLANK.
THIS PAGE INTENTIONALLY LEFT BLANK.
Want to know more?
blackrock.com | 877-275-1255
This report is intended for current holders. It is not authorized for use as an offer of sale or a solicitation of an offer to buy shares of the Fund unless preceded or accompanied by the Fund’s current prospectus. Past performance results shown in this report should not be considered a representation of future performance. Investment returns and principal value of shares will fluctuate so that shares, when repurchased by the Fund in connection with any applicable repurchase offer, may be worth more or less than their original cost. Statements and other information herein are as dated and are subject to change.
CRST-12/22-AR
(b) Not Applicable
| Item 2 – | Code of Ethics – The registrant (or the “Fund”) has adopted a code of ethics, as of the end of the period covered by this report, applicable to the registrant’s principal executive officer, principal financial officer, principal accounting officer or controller, or persons performing similar functions. During the period covered by this report, the code of ethics was amended to update certain information and to make other non-material changes. During the period covered by this report, there have been no waivers granted under the code of ethics. The registrant undertakes to provide a copy of the code of ethics to any person upon request, without charge, who calls 1-800-882-0052, option 4. |
| Item 3 – | Audit Committee Financial Expert – The registrant’s board of directors (the “board of directors”), has determined that (i) the registrant has the following audit committee financial experts serving on its audit committee and (ii) each audit committee financial expert is independent: |
Frank J. Fabozzi
Catherine A. Lynch
Under applicable securities laws, a person determined to be an audit committee financial expert will not be deemed an “expert” for any purpose, including without limitation for the purposes of Section 11 of the Securities Act of 1933, as a result of being designated or identified as an audit committee financial expert. The designation or identification of a person as an audit committee financial expert does not impose on such person any duties, obligations, or liabilities greater than the duties, obligations, and liabilities imposed on such person as a member of the audit committee and board of directors in the absence of such designation or identification. The designation or identification of a person as an audit committee financial expert does not affect the duties, obligations, or liability of any other member of the audit committee or board of directors.
| Item 4 – | Principal Accountant Fees and Services |
The following table presents fees billed by Deloitte & Touche LLP (“D&T”) in each of the last two fiscal years for the services rendered to the Fund:
| | | | | | | | | | | | | | | | |
| | | | | |
| | | (a) Audit Fees | | (b) Audit-Related Fees1 | | (c) Tax Fees2 | | (d) All Other Fees |
| Entity Name | | Current Fiscal Year
End | | Previous Fiscal Year
End | | Current Fiscal Year
End | | Previous Fiscal Year
End | | Current Fiscal Year
End | | Previous Fiscal Year
End | | Current Fiscal Year
End | | Previous Fiscal Year
End |
| BlackRock Credit Strategies Fund | | $84,966 | | $84,133 | | $4,000 | | $8,000 | | $22,000 | | $20,000 | | $0 | | $0 |
The following table presents fees billed by D&T that were required to be approved by the registrant’s audit committee (the “Committee”) for services that relate directly to the operations or financial reporting of the Fund and that are rendered on behalf of BlackRock Advisors LLC (“Investment Adviser” or “BlackRock”) and entities controlling, controlled by, or under common control with BlackRock (not including any sub-adviser whose role is primarily portfolio management and is subcontracted with or overseen by another investment adviser) that provide ongoing services to the Fund (“Affiliated Service Providers”):
2
| | | | |
| | | Current Fiscal Year End | | Previous Fiscal Year End |
(b) Audit-Related Fees1 | | $0 | | $0 |
(c) Tax Fees2 | | $0 | | $0 |
(d) All Other Fees4 | | $2,098,000 | | $2,032,000 |
1 The nature of the services includes assurance and related services reasonably related to the performance of the audit or review of financial statements not included in Audit Fees, including accounting consultations, agreed-upon procedure reports, attestation reports, comfort letters, out-of-pocket expenses and internal control reviews not required by regulators.
2 The nature of the services includes tax compliance and/or tax preparation, including services relating to the filing or amendment of federal, state or local income tax returns, regulated investment company qualification reviews, taxable income and tax distribution calculations.
3 Includes fees for the Fund and the Fund’s subsidiary.
4 Non-audit fees of $2,098,000 and $2,032,000 for the current fiscal year and previous fiscal year, respectively, were paid to the Fund’s principal accountant in their entirety by BlackRock, in connection with services provided to the Affiliated Service Providers of the Fund and of certain other funds sponsored and advised by BlackRock or its affiliates for a service organization review and an accounting research tool subscription. These amounts represent aggregate fees paid by BlackRock and were not allocated on a per fund basis.
(e)(1) Audit Committee Pre-Approval Policies and Procedures:
The Committee has adopted policies and procedures with regard to the pre-approval of services. Audit, audit-related and tax compliance services provided to the registrant on an annual basis require specific pre-approval by the Committee. The Committee also must approve other non-audit services provided to the registrant and those non-audit services provided to the Investment Adviser and Affiliated Service Providers that relate directly to the operations and the financial reporting of the registrant. Certain of these non-audit services that the Committee believes are (a) consistent with the SEC’s auditor independence rules and (b) routine and recurring services that will not impair the independence of the independent accountants may be approved by the Committee without consideration on a specific case-by-case basis (“general pre-approval”). The term of any general pre-approval is 12 months from the date of the pre-approval, unless the Committee provides for a different period. Tax or other non-audit services provided to the registrant which have a direct impact on the operations or financial reporting of the registrant will only be deemed pre-approved provided that any individual project does not exceed $10,000 attributable to the registrant or $50,000 per project. For this purpose, multiple projects will be aggregated to determine if they exceed the previously mentioned cost levels.
Any proposed services exceeding the pre-approved cost levels will require specific pre-approval by the Committee, as will any other services not subject to general pre-approval (e.g., unanticipated but permissible services). The Committee is informed of each service approved subject to general pre-approval at the next regularly scheduled in-person board meeting. At this meeting, an analysis of such services is presented to the Committee for ratification. The Committee may delegate to the Committee Chairman the authority to approve the provision of and fees for any specific engagement of permitted non-audit services, including services exceeding pre-approved cost levels.
(e)(2) None of the services described in each of Items 4(b) through (d) were approved by the Committee pursuant to the de minimis exception in paragraph (c)(7)(i)(C) of Rule 2-01 of Regulation S-X.
(f) Not Applicable
(g) The aggregate non-audit fees, defined as the sum of the fees shown under “Audit-Related Fees,”
3
“Tax Fees” and “All Other Fees,” paid to the accountant for services rendered by the accountant to the registrant, the Investment Adviser and the Affiliated Service Providers were:
| | | | | | |
| | | Entity Name | | Current Fiscal Year
End | | Previous Fiscal Year
End |
| | BlackRock Credit Strategies Fund | | $26,000 | | $28,000 |
Additionally, the amounts billed by D&T in connection with services provided to the Affiliated Service Providers of the Fund and of other funds sponsored or advised by BlackRock or its affiliates during the current and previous fiscal years for a service organization review and an accounting research tool subscription were:
| | |
Current Fiscal
Year End | | Previous Fiscal
Year End |
$2,098,000 | | $2,032,000 |
These amounts represent aggregate fees paid by BlackRock and were not allocated on a per fund basis.
(h) The Committee has considered and determined that the provision of non-audit services that were rendered to the Investment Adviser, and the Affiliated Service Providers that were not pre-approved pursuant to paragraph (c)(7)(ii) of Rule 2-01 of Regulation S-X is compatible with maintaining the principal accountant’s independence.
(i) – Not Applicable
(j) – Not Applicable
| Item 5 – | Audit Committee of Listed Registrant |
(a) Not Applicable
(b) Not Applicable
(a) The registrant’s Schedule of Investments is included as part of the Report to Stockholders filed under Item 1(a) of this Form.
(b) Not Applicable due to no such divestments during the semi-annual period covered since the previous Form N-CSR filing.
| Item 7 – | Disclosure of Proxy Voting Policies and Procedures for Closed-End Management Investment Companies – The board of directors has delegated the voting of proxies for the Fund’s portfolio securities to the Investment Adviser pursuant to the Investment Adviser’s proxy voting guidelines. Under these guidelines, the Investment Adviser will vote proxies related to Fund securities in the best interests of the Fund and its stockholders. From time to time, a vote may present a conflict between the interests of the Fund’s stockholders, on the one hand, and those of the Investment |
4
Adviser, or any affiliated person of the Fund or the Investment Adviser, on the other. In such event, provided that the Investment Adviser’s Equity Investment Policy Oversight Committee, or a sub-committee thereof (the “Oversight Committee”) is aware of the real or potential conflict or material non-routine matter and if the Oversight Committee does not reasonably believe it is able to follow its general voting guidelines (or if the particular proxy matter is not addressed in the guidelines) and vote impartially, the Oversight Committee may retain an independent fiduciary to advise the Oversight Committee on how to vote or to cast votes on behalf of the Investment Adviser’s clients. If the Investment Adviser determines not to retain an independent fiduciary, or does not desire to follow the advice of such independent fiduciary, the Oversight Committee shall determine how to vote the proxy after consulting with the Investment Adviser’s Portfolio Management Group and/or the Investment Adviser’s Legal and Compliance Department and concluding that the vote cast is in its client’s best interest notwithstanding the conflict. A copy of the Fund’s Proxy Voting Policy and Procedures are attached as Exhibit 99.PROXYPOL, a copy of the Fund’s Global Corporate Governance & Engagement Principles are attached as Exhibit 99.GLOBAL.CORP.GOV and a copy of the Fund’s Corporate Governance and Proxy Voting Guidelines for U.S. Securities are attached as Exhibit 99.US.CORP.GOV. Information on how the Fund voted proxies relating to portfolio securities during the most recent 12-month period ended June 30 is available without charge, (i) at www.blackrock.com and (ii) on the SEC’s website at http://www.sec.gov.
| Item 8 – | Portfolio Managers of Closed-End Management Investment Companies |
(a)(1) As of the date of filing this Report:
The registrant is managed by a team of investment professionals comprised of James E. Keenan, Managing Director at BlackRock, Jeffrey Cucunato, Managing Director at BlackRock, David Delbos, Managing Director at BlackRock, Patrick Wolfe, Managing Director at BlackRock and Eric Yuan, Managing Director at BlackRock. Messrs. Keenan, Cucunato, Delbos, Wolfe and Yuan are the Fund’s co-portfolio managers and are responsible for the day-to-day management of the Fund’s portfolio and the selection of its investments. Messrs. Keenan, Cucunato, Delbos and Wolfe have been members of the Fund’s management team since 2019, and Mr. Yuan has been a member of the Fund’s management since 2022.
| | |
| Portfolio Manager | | Biography |
James E. Keenan, CFA | | Managing Director of BlackRock since 2008 and Head of the Leveraged Finance Portfolio team; Director of BlackRock from 2006 to 2007; Vice President of BlackRock, Inc. from 2004 to 2005. |
Jeffrey Cucunato | | Managing Director of BlackRock since 2005. |
David Delbos | | Managing Director of BlackRock, Inc. since 2012; Director of BlackRock, Inc. from 2007 to 2011; Vice President of BlackRock, Inc. from 2005 to 2006. |
Patrick Wolfe | | Managing Director of BlackRock, Inc. since 2019; Director of BlackRock, Inc. from 2018 to 2019; Director of Structured Credit of TCP since 2018; Vice President of Structured Credit of TCP from 2017 to 2018; Senior Associate of TCP from 2016 to 2017; Structured Credit Analyst of TCP from 2013 to 2016; Structured Credit Group of Deutsche Bank from 2007 to 2013. |
Eric Yuan | | Managing Director of BlackRock, Inc. since 2018; Managing Director of TCP from 2015 to 2018. |
5
(a)(2) As of December 31, 2022:
| | | | | | | | | | | | |
| | | (ii) Number of Other Accounts Managed and Assets by Account Type | | (iii) Number of Other Accounts and Assets for Which Advisory Fee is Performance-Based |
(i) Name of Portfolio Manager | | Other Registered Investment Companies | | Other Pooled Investment Vehicles | | Other Accounts | | Other Registered Investment Companies | | Other Pooled Investment Vehicles | | Other Accounts |
James E. Keenan, CFA | | 24 | | 31 | | 18 | | 0 | | 0 | | 5 |
| | | $35.40 Billion | | $12.34 Billion | | $6.94 Billion | | $0 | | $0 | | $802.2 Million |
Jeffrey Cucunato | | 16 | | 4 | | 2 | | 0 | | 0 | | 1 |
| | | $5.75 Billion | | $518.8 Million | | $569.7 Million | | $0 | | $0 | | $4.48 Million |
David Delbos | | 28 | | 26 | | 149 | | 0 | | 0 | | 5 |
| | | $35.24 Billion | | $11.93 Billion | | $16.41 Billion | | $0 | | $0 | | $818.5 Million |
Patrick Wolfe | | 2 | | 9 | | 0 | | 0 | | 0 | | 0 |
| | | $108.4 Million | | $2.64 Billion | | $0 | | $0 | | $0 | | $0 |
Eric Yuan | | 1 | | 0 | | 0 | | 0 | | 0 | | 0 |
| | | $0.12 Million | | $0 | | $0 | | $0 | | $0 | | $0 |
(iv) Portfolio Manager Potential Material Conflicts of Interest
BlackRock has built a professional working environment, firm-wide compliance culture and compliance procedures and systems designed to protect against potential incentives that may favor one account over another. BlackRock has adopted policies and procedures that address the allocation of investment opportunities, execution of portfolio transactions, personal trading by employees and other potential conflicts of interest that are designed to ensure that all client accounts are treated equitably over time. Nevertheless, BlackRock furnishes investment management and advisory services to numerous clients in addition to the Fund, and BlackRock may, consistent with applicable law, make investment recommendations to other clients or accounts (including accounts which are hedge funds or have performance or higher fees paid to BlackRock, or in which portfolio managers have a personal interest in the receipt of such fees), which may be the same as or different from those made to the Fund. In addition, BlackRock, Inc., its affiliates and significant shareholders and any officer, director, shareholder or employee may or may not have an interest in the securities whose purchase and sale BlackRock recommends to the Fund. BlackRock, Inc., or any of its affiliates or significant shareholders, or any officer, director, shareholder, employee or any member of their families may take different actions than those recommended to the Fund by BlackRock with respect to the same securities. Moreover, BlackRock may refrain from rendering any advice or services concerning securities of companies of which any of BlackRock, Inc.’s (or its affiliates’ or significant shareholders’) officers, directors or employees are directors or officers, or companies as to which BlackRock, Inc. or any of its affiliates or significant shareholders or the officers, directors and employees of any of them has any substantial economic interest or possesses material non-public information. Certain portfolio managers also may manage accounts whose investment strategies may at times be opposed to the strategy utilized for a fund. It should also be noted that Messrs. Keenan, Cucunato, Delbos, Wolfe and Yuan may be managing hedge fund and/or long only accounts, or may be part of a team managing hedge fund and/or long only accounts, subject to
6
incentive fees. Messrs. Keenan, Cucunato, Delbos, Wolfe and Yuan may therefore be entitled to receive a portion of any incentive fees earned on such accounts.
As a fiduciary, BlackRock owes a duty of loyalty to its clients and must treat each client fairly. When BlackRock purchases or sells securities for more than one account, the trades must be allocated in a manner consistent with its fiduciary duties. BlackRock attempts to allocate investments in a fair and equitable manner among client accounts, with no account receiving preferential treatment. To this end, BlackRock, Inc. has adopted policies that are intended to ensure reasonable efficiency in client transactions and provide BlackRock with sufficient flexibility to allocate investments in a manner that is consistent with the particular investment discipline and client base, as appropriate.
(a)(3) As of December 31, 2022:
Portfolio Manager Compensation Overview
The discussion below describes the portfolio managers’ compensation as of December 31, 2022.
BlackRock’s financial arrangements with its portfolio managers, its competitive compensation and its career path emphasis at all levels reflect the value senior management places on key resources. Compensation may include a variety of components and may vary from year to year based on a number of factors. The principal components of compensation include a base salary, a performance-based discretionary bonus, participation in various benefits programs and one or more of the incentive compensation programs established by BlackRock.
Base Compensation. Generally, portfolio managers receive base compensation based on their position with the firm.
Discretionary Incentive Compensation
Discretionary incentive compensation is a function of several components: the performance of BlackRock, Inc., the performance of the portfolio manager’s group within BlackRock, the investment performance, including risk-adjusted returns, of the firm’s assets under management or supervision by that portfolio manager relative to predetermined benchmarks, and the individual’s performance and contribution to the overall performance of these portfolios and BlackRock. In most cases, these benchmarks are the same as the benchmark or benchmarks against which the performance of the Funds or other accounts managed by the portfolio managers are measured. Among other things, BlackRock’s Chief Investment Officers make a subjective determination with respect to each portfolio manager’s compensation based on the performance of the funds and other accounts managed by each portfolio manager relative to the various benchmarks. Performance of fixed income funds is measured on a pre-tax and/or after-tax basis over various time periods including 1-, 3- and 5- year periods, as applicable. With respect to these portfolio managers, such benchmarks for the Fund and other accounts are:
7
| | |
| Portfolio Manager | | Benchmark |
James E. Keenan, CFA David Delbos | | A combination of market-based indices (e.g., The Bloomberg U.S. Corporate High Yield 2% Issuer Cap Index), certain customized indices and certain fund industry peer groups. |
| Jeffrey Cucunato | | Bloomberg Barclays US Credit Index. |
Patrick Wolfe Eric Yuan | | None |
Distribution of Discretionary Incentive Compensation. Discretionary incentive compensation is distributed to portfolio managers in a combination of cash, deferred BlackRock, Inc. stock awards, and/or deferred cash awards that notionally track the return of certain BlackRock investment products.
Portfolio managers receive their annual discretionary incentive compensation in the form of cash. Portfolio managers whose total compensation is above a specified threshold also receive deferred BlackRock, Inc. stock awards annually as part of their discretionary incentive compensation. Paying a portion of discretionary incentive compensation in the form of deferred BlackRock, Inc. stock puts compensation earned by a portfolio manager for a given year “at risk” based on BlackRock’s ability to sustain and improve its performance over future periods. In some cases, additional deferred BlackRock, Inc. stock may be granted to certain key employees as part of a long-term incentive award to aid in retention, align interests with long-term shareholders and motivate performance. Deferred BlackRock, Inc. stock awards are generally granted in the form of BlackRock, Inc. restricted stock units that vest pursuant to the terms of the applicable plan and, once vested, settle in BlackRock, Inc. common stock. Messrs. Cucunato, Delbos, and Keenan have deferred BlackRock, Inc. stock awards. Messrs. Wolfe and Yuan are eligible to receive deferred BlackRock, Inc. stock awards.
For certain portfolio managers, a portion of the discretionary incentive compensation is also distributed in the form of deferred cash awards that notionally track the returns of select BlackRock investment products they manage, which provides direct alignment of portfolio manager discretionary incentive compensation with investment product results. Deferred cash awards vest ratably over a number of years and, once vested, settle in the form of cash. Only portfolio managers who manage specified products and whose total compensation is above a specified threshold are eligible to participate in the deferred cash award program.
Other Compensation Benefits. In addition to base salary and discretionary incentive compensation, portfolio managers may be eligible to receive or participate in one or more of the following:
Incentive Savings Plans — BlackRock, Inc. has created a variety of incentive savings plans in which BlackRock, Inc. employees are eligible to participate, including a 401(k) plan, the BlackRock Retirement Savings Plan (RSP), and the BlackRock Employee Stock Purchase Plan (ESPP). The employer contribution components of the RSP include a company match equal to 50% of the first 8% of eligible pay contributed to the plan capped at $5,000 per year, and a company retirement contribution equal to 3-5% of eligible compensation up to the Internal Revenue Service limit ($305,000 for 2022). The RSP offers a range of investment options, including registered investment companies and collective investment funds managed by the firm. BlackRock, Inc. contributions follow the investment direction set by participants for their own contributions or, absent participant investment direction, are invested into a target date fund that corresponds to, or is closest to, the year in which the participant attains age 65. The ESPP allows for investment in
8
BlackRock, Inc. common stock at a 5% discount on the fair market value of the stock on the purchase date. Annual participation in the ESPP is limited to the purchase of 1,000 shares of common stock or a dollar value of $25,000 based on its fair market value on the purchase date. All of the eligible portfolio managers are eligible to participate in these plans.
(a)(4) Beneficial Ownership of Securities – As of December 31, 2022.
| | | | |
| Portfolio Manager | | Dollar Range of Equity Securities of the Fund Beneficially Owned | | |
| James E. Keenan, CFA | | Over $1,000,000 | | |
| Jeffrey Cucunato | | $100,001 - $500,000 | | |
David Delbos | | $100,001 - $500,000 | | |
Patrick Wolfe | | $100,001 - $500,000 | | |
Eric Yuan | | $50,001 - $100,000 | | |
(b) Not Applicable
| Item 9 – | Purchases of Equity Securities by Closed-End Management Investment Company and Affiliated Purchasers – Not Applicable due to no such purchases during the period covered by this report. |
| Item 10 – | Submission of Matters to a Vote of Security Holders – There have been no material changes to these procedures. |
| Item 11 – | Controls and Procedures |
(a) The registrant’s principal executive and principal financial officers, or persons performing similar functions, have concluded that the registrant’s disclosure controls and procedures (as defined in Rule 30a-3(c) under the Investment Company Act of 1940, as amended (the “1940 Act”)) are effective as of a date within 90 days of the filing of this report based on the evaluation of these controls and procedures required by Rule 30a-3(b) under the 1940 Act and Rule 15d-15(b) under the Securities Exchange Act of 1934, as amended.
(b) There were no changes in the registrant’s internal control over financial reporting (as defined in Rule 30a-3(d) under the 1940 Act) that occurred during the period covered by this report that have materially affected, or are reasonably likely to materially affect, the registrant’s internal control over financial reporting.
| Item 12 – | Disclosure of Securities Lending Activities for Closed-End Management Investment Companies --Not Applicable |
| Item 13 – | Exhibits attached hereto |
(a)(1) Code of Ethics – See Item 2
(a)(2) Section 302 Certifications are attached
9
(a)(3) Any written solicitation to purchase securities under Rule 23c-1 – Not Applicable
(a)(4) Change in Registrant’s independent public accountant – Not Applicable
(b) Section 906 Certifications are attached
10
Pursuant to the requirements of the Securities Exchange Act of 1934 and the Investment Company Act of 1940, the registrant has duly caused this report to be signed on its behalf by the undersigned, thereunto duly authorized.
BlackRock Credit Strategies Fund
| | | | |
| | By: | | /s/ John M. Perlowski |
| | | | John M. Perlowski |
| | | | Chief Executive Officer (principal executive officer) of |
| | | | BlackRock Credit Strategies Fund |
Date: February 24, 2023
Pursuant to the requirements of the Securities Exchange Act of 1934 and the Investment Company Act of 1940, this report has been signed below by the following persons on behalf of the registrant and in the capacities and on the dates indicated.
| | | | |
| | By: | | /s/ John M. Perlowski |
| | | | John M. Perlowski |
| | | | Chief Executive Officer (principal executive officer) of |
| | | | BlackRock Credit Strategies Fund |
Date: February 24, 2023
| | | | |
| | By: | | /s/ Trent Walker |
| | | | Trent Walker |
| | | | Chief Financial Officer (principal financial officer) of |
| | | | BlackRock Credit Strategies Fund |
Date: February 24, 2023
11