
Exhibit 99.2 CONFIDENTIAL INVESTOR PRESENTATION 1Exhibit 99.2 CONFIDENTIAL INVESTOR PRESENTATION 1

FORWARD-LOOKING STATEMENTS AND DISCLAIMER This document and any accompanying oral presentation for California BanCorp (the “Company”) may contain statements regarding expectations and beliefs about future financial performance and financial condition, as well as trends in the Company’s business and markets are “forward-looking statements” as defined in the Private Securities Litigation Reform Act of 1995. Forward-looking statements often include words such as “believe,” “expect,” “anticipate,” “intend,” “plan,” “estimate,” “project,” “outlook,” or words of similar meaning, or future or conditional verbs such as “will,” “would,” “should,” “could,” or “may.” The forward-looking statements are based on current information and on assumptions that the Company makes about future events and circumstances that are subject to a number of risks and uncertainties that are often difficult to predict and beyond the Company’s control. As a result of those risks and uncertainties, the Company’s actual financial results in the future could differ, possibly materially, from those expressed in or implied by the forward-looking statements contained herein and could cause the Company to make changes to future plans. Those risks and uncertainties include, but are not limited to, the risk of incurring loan losses, which is an inherent risk of the banking business; the risk that the Company will not be able to continue its internal growth rate; the risk that the United States economy will experience slowed growth or recession or will be adversely affected by domestic or international economic conditions and risks associated with the Federal Reserve Board taking actions with respect to interest rates, any of which could adversely affect, among other things, the values of real estate collateral supporting many of the Company’s loans, interest income and interest rate margins and, therefore, the Company’s future operating results; risks associated with changes in income tax laws and regulations; and risks associated with seeking new client relationships and maintaining existing client relationships. You are encouraged to review the additional information regarding these and other risks and uncertainties to which the Company’s business is subject that are contained in our Annual Report on Form 10-K for the year ended December 31, 2020 which is on file with the Securities and Exchange Commission (the “SEC”) and such other reports that we file with the SEC, particularly under the heading “Risk Factors” therein. The COVID-19 pandemic has created economic and financial disruptions that have adversely affected, and may continue to adversely affect, our business, operations, financial performance and prospects. Even after the COVID-19 pandemic subsides, it is possible that the U.S. and other major economies experience or continue to experience a prolonged recession, which could materially and adversely affect our business, operations, financial performance and prospects. Statements about the effects of the COVID-19 pandemic on our business, operations, financial performance and prospects may constitute forward-looking statements and are subject to the risk that the actual impacts may differ, possibly materially, from what is reflected in those forward- looking statements due to factors and future developments that are uncertain, unpredictable and in many cases beyond our control, including the scope and duration of the pandemic, actions taken by governmental authorities in response to the pandemic, and the direct and indirect impact of the pandemic on our customers, third parties and us. Due to these and other possible uncertainties and risks you are cautioned not to place undue reliance on the forward-looking statements, which speak only as of today’s date, or to make predictions based solely on historical financial performance. The Company disclaims any obligation to update forward-looking statements contained herein, whether as a result of new information, future events or otherwise, except as may be required by law. No Offer or Solicitation. This document is not a prospectus or offering document for any securities. This document does not constitute or form part of any offer or invitation to sell or issue, or any solicitation of any offer to purchase or subscribe for, any securities of the Company, nor shall any part of it nor the fact of its dissemination form part of or be relied on in connection with any contract or investment decision relating thereto. This document is for informational purposes only and is being furnished on a confidential basis to a limited number of institutional accredited investors and qualified institutional buyers. Any such offering may be made only by a purchase agreement and the information contained herein will be superseded in its entirety by such purchase agreement. This document does not contain all the information you should consider before investing in securities of the Company and should not be construed as investment, legal, regulatory or tax advice. Each potential investor should review the purchase agreement, make such investigations as it deems necessary to arrive at an independent evaluation of an investment in the securities mentioned in this document and should consult its own legal counsel and financial, accounting, regulatory and tax advisors to determine the consequences of such an investment prior to making an investment decision and should not rely on any information set forth in this document. SECURITIES NOT REGISTERED. The securities mentioned in this document have not been registered under the Securities Act of 1933, as amended, or any state securities laws, and may not be offered or sold absent registration or exemption from registration under applicable law. Such securities have not been approved or disapproved by the Securities and Exchange Commission, any state securities commission or any regulatory authority, including the Board of Governors of the Federal Reserve System, nor have any of the foregoing authorities passed upon or endorsed the merits of any proposed offering of these securities or the accuracy or adequacy of this document. Any representation to the contrary is a criminal offense. SECURITIES NOT INSURED. The securities mentioned in this presentation are not savings or deposit accounts and are not insured by the Federal Deposit Insurance Corporation or by any other government agency. 2FORWARD-LOOKING STATEMENTS AND DISCLAIMER This document and any accompanying oral presentation for California BanCorp (the “Company”) may contain statements regarding expectations and beliefs about future financial performance and financial condition, as well as trends in the Company’s business and markets are “forward-looking statements” as defined in the Private Securities Litigation Reform Act of 1995. Forward-looking statements often include words such as “believe,” “expect,” “anticipate,” “intend,” “plan,” “estimate,” “project,” “outlook,” or words of similar meaning, or future or conditional verbs such as “will,” “would,” “should,” “could,” or “may.” The forward-looking statements are based on current information and on assumptions that the Company makes about future events and circumstances that are subject to a number of risks and uncertainties that are often difficult to predict and beyond the Company’s control. As a result of those risks and uncertainties, the Company’s actual financial results in the future could differ, possibly materially, from those expressed in or implied by the forward-looking statements contained herein and could cause the Company to make changes to future plans. Those risks and uncertainties include, but are not limited to, the risk of incurring loan losses, which is an inherent risk of the banking business; the risk that the Company will not be able to continue its internal growth rate; the risk that the United States economy will experience slowed growth or recession or will be adversely affected by domestic or international economic conditions and risks associated with the Federal Reserve Board taking actions with respect to interest rates, any of which could adversely affect, among other things, the values of real estate collateral supporting many of the Company’s loans, interest income and interest rate margins and, therefore, the Company’s future operating results; risks associated with changes in income tax laws and regulations; and risks associated with seeking new client relationships and maintaining existing client relationships. You are encouraged to review the additional information regarding these and other risks and uncertainties to which the Company’s business is subject that are contained in our Annual Report on Form 10-K for the year ended December 31, 2020 which is on file with the Securities and Exchange Commission (the “SEC”) and such other reports that we file with the SEC, particularly under the heading “Risk Factors” therein. The COVID-19 pandemic has created economic and financial disruptions that have adversely affected, and may continue to adversely affect, our business, operations, financial performance and prospects. Even after the COVID-19 pandemic subsides, it is possible that the U.S. and other major economies experience or continue to experience a prolonged recession, which could materially and adversely affect our business, operations, financial performance and prospects. Statements about the effects of the COVID-19 pandemic on our business, operations, financial performance and prospects may constitute forward-looking statements and are subject to the risk that the actual impacts may differ, possibly materially, from what is reflected in those forward- looking statements due to factors and future developments that are uncertain, unpredictable and in many cases beyond our control, including the scope and duration of the pandemic, actions taken by governmental authorities in response to the pandemic, and the direct and indirect impact of the pandemic on our customers, third parties and us. Due to these and other possible uncertainties and risks you are cautioned not to place undue reliance on the forward-looking statements, which speak only as of today’s date, or to make predictions based solely on historical financial performance. The Company disclaims any obligation to update forward-looking statements contained herein, whether as a result of new information, future events or otherwise, except as may be required by law. No Offer or Solicitation. This document is not a prospectus or offering document for any securities. This document does not constitute or form part of any offer or invitation to sell or issue, or any solicitation of any offer to purchase or subscribe for, any securities of the Company, nor shall any part of it nor the fact of its dissemination form part of or be relied on in connection with any contract or investment decision relating thereto. This document is for informational purposes only and is being furnished on a confidential basis to a limited number of institutional accredited investors and qualified institutional buyers. Any such offering may be made only by a purchase agreement and the information contained herein will be superseded in its entirety by such purchase agreement. This document does not contain all the information you should consider before investing in securities of the Company and should not be construed as investment, legal, regulatory or tax advice. Each potential investor should review the purchase agreement, make such investigations as it deems necessary to arrive at an independent evaluation of an investment in the securities mentioned in this document and should consult its own legal counsel and financial, accounting, regulatory and tax advisors to determine the consequences of such an investment prior to making an investment decision and should not rely on any information set forth in this document. SECURITIES NOT REGISTERED. The securities mentioned in this document have not been registered under the Securities Act of 1933, as amended, or any state securities laws, and may not be offered or sold absent registration or exemption from registration under applicable law. Such securities have not been approved or disapproved by the Securities and Exchange Commission, any state securities commission or any regulatory authority, including the Board of Governors of the Federal Reserve System, nor have any of the foregoing authorities passed upon or endorsed the merits of any proposed offering of these securities or the accuracy or adequacy of this document. Any representation to the contrary is a criminal offense. SECURITIES NOT INSURED. The securities mentioned in this presentation are not savings or deposit accounts and are not insured by the Federal Deposit Insurance Corporation or by any other government agency. 2

TERMS OF THE PROPOSED OFFERING Issuer California BanCorp Security Subordinated Notes Due 2031 Amount $35 Million Security Rating Egan-Jones Rating of BBB Issuance Type Regulation D Private Placement with Registration Rights Structure Fixed-to-Floating Rate (Fixed During First Five Years) Term 10 Years No Call Period 5 Years General Corporate Purposes; Redeem $5M Bank-Level Use of Proceeds Subordinated Debt Sole Placement Agent Piper Sandler & Co. 3TERMS OF THE PROPOSED OFFERING Issuer California BanCorp Security Subordinated Notes Due 2031 Amount $35 Million Security Rating Egan-Jones Rating of BBB Issuance Type Regulation D Private Placement with Registration Rights Structure Fixed-to-Floating Rate (Fixed During First Five Years) Term 10 Years No Call Period 5 Years General Corporate Purposes; Redeem $5M Bank-Level Use of Proceeds Subordinated Debt Sole Placement Agent Piper Sandler & Co. 3
INVESTMENT HIGHLIGHTS Branch light, commercial- Experienced management focused business bank with team and seasoned C&I Proven organic and strong middle market relationship teams with strong acquisitive growth story relationships throughout ties to the local markets Northern California Strong earnings outlook as Quality core deposit Disciplined underwriting standards with best-in-class efficiencies from investments franchise and commercial relationship strategy asset quality metrics are realized 4 3INVESTMENT HIGHLIGHTS Branch light, commercial- Experienced management focused business bank with team and seasoned C&I Proven organic and strong middle market relationship teams with strong acquisitive growth story relationships throughout ties to the local markets Northern California Strong earnings outlook as Quality core deposit Disciplined underwriting standards with best-in-class efficiencies from investments franchise and commercial relationship strategy asset quality metrics are realized 4 3
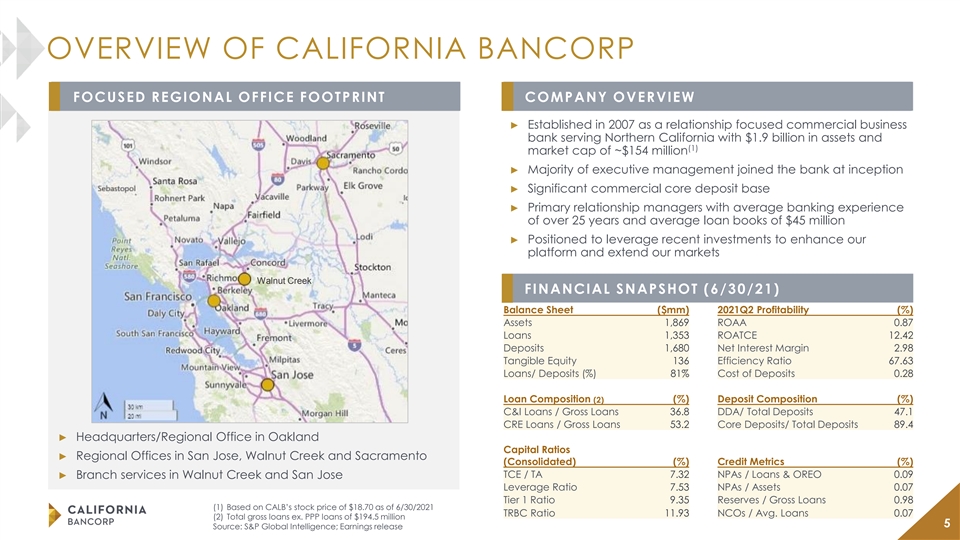
OVERVIEW OF CALIFORNIA BANCORP FOCUSED REGIONAL OFFICE FOOTPRINT COMPANY OVERVIEW ► Established in 2007 as a relationship focused commercial business bank serving Northern California with $1.9 billion in assets and (1) market cap of ~$154 million ► Majority of executive management joined the bank at inception ► Significant commercial core deposit base ► Primary relationship managers with average banking experience of over 25 years and average loan books of $45 million ► Positioned to leverage recent investments to enhance our platform and extend our markets Walnut Creek FINANCIAL SNAPSHOT (6/30/21) Balance Sheet ($mm) 2021Q2 Profitability (%) Assets 1,869 ROAA 0.87 Loans 1,353 ROATCE 12.42 Deposits 1,680 Net Interest Margin 2.98 Tangible Equity 136 Efficiency Ratio 67.63 Loans/ Deposits (%) 81% Cost of Deposits 0.28 Loan Composition (%) Deposit Composition (%) (2) C&I Loans / Gross Loans 36.8 DDA/ Total Deposits 47.1 CRE Loans / Gross Loans 53.2 Core Deposits/ Total Deposits 89.4 ► Headquarters/Regional Office in Oakland Capital Ratios ► Regional Offices in San Jose, Walnut Creek and Sacramento (Consolidated) (%) Credit Metrics (%) TCE / TA 7.32 NPAs / Loans & OREO 0.09 ► Branch services in Walnut Creek and San Jose Leverage Ratio 7.53 NPAs / Assets 0.07 Tier 1 Ratio 9.35 Reserves / Gross Loans 0.98 (1) Based on CALB’s stock price of $18.70 as of 6/30/2021 TRBC Ratio 11.93 NCOs / Avg. Loans 0.07 (2) Total gross loans ex. PPP loans of $194.5 million 5 Source: S&P Global Intelligence; Earnings releaseOVERVIEW OF CALIFORNIA BANCORP FOCUSED REGIONAL OFFICE FOOTPRINT COMPANY OVERVIEW ► Established in 2007 as a relationship focused commercial business bank serving Northern California with $1.9 billion in assets and (1) market cap of ~$154 million ► Majority of executive management joined the bank at inception ► Significant commercial core deposit base ► Primary relationship managers with average banking experience of over 25 years and average loan books of $45 million ► Positioned to leverage recent investments to enhance our platform and extend our markets Walnut Creek FINANCIAL SNAPSHOT (6/30/21) Balance Sheet ($mm) 2021Q2 Profitability (%) Assets 1,869 ROAA 0.87 Loans 1,353 ROATCE 12.42 Deposits 1,680 Net Interest Margin 2.98 Tangible Equity 136 Efficiency Ratio 67.63 Loans/ Deposits (%) 81% Cost of Deposits 0.28 Loan Composition (%) Deposit Composition (%) (2) C&I Loans / Gross Loans 36.8 DDA/ Total Deposits 47.1 CRE Loans / Gross Loans 53.2 Core Deposits/ Total Deposits 89.4 ► Headquarters/Regional Office in Oakland Capital Ratios ► Regional Offices in San Jose, Walnut Creek and Sacramento (Consolidated) (%) Credit Metrics (%) TCE / TA 7.32 NPAs / Loans & OREO 0.09 ► Branch services in Walnut Creek and San Jose Leverage Ratio 7.53 NPAs / Assets 0.07 Tier 1 Ratio 9.35 Reserves / Gross Loans 0.98 (1) Based on CALB’s stock price of $18.70 as of 6/30/2021 TRBC Ratio 11.93 NCOs / Avg. Loans 0.07 (2) Total gross loans ex. PPP loans of $194.5 million 5 Source: S&P Global Intelligence; Earnings release
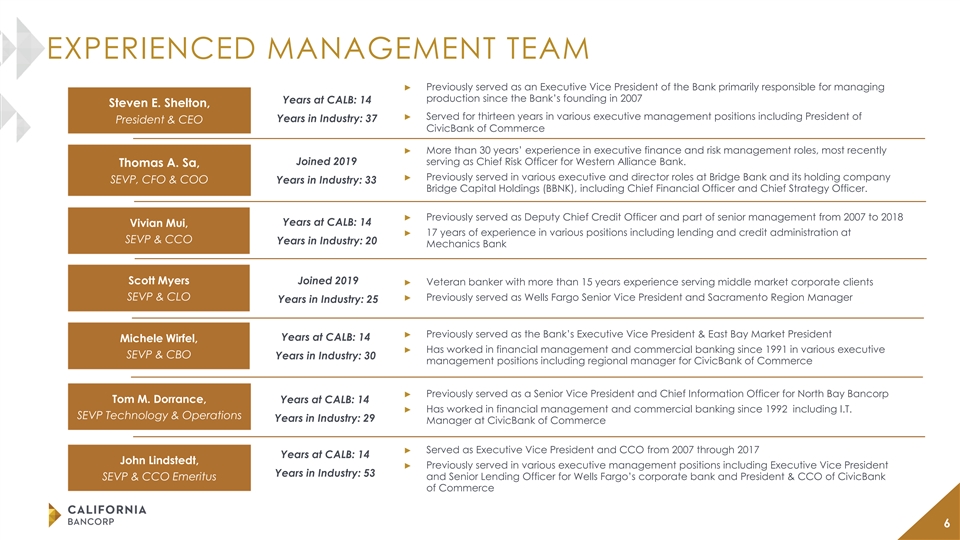
EXPERIENCED MANAGEMENT TEAM ► Previously served as an Executive Vice President of the Bank primarily responsible for managing production since the Bank’s founding in 2007 Years at CALB: 14 Steven E. Shelton, Age : 58 ► Served for thirteen years in various executive management positions including President of Years in Industry: 37 President & CEO CivicBank of Commerce ► More than 30 years’ experience in executive finance and risk management roles, most recently Joined 2019 serving as Chief Risk Officer for Western Alliance Bank. Thomas A. Sa, Age: ► Previously served in various executive and director roles at Bridge Bank and its holding company 57 SEVP, CFO & COO Years in Industry: 33 Bridge Capital Holdings (BBNK), including Chief Financial Officer and Chief Strategy Officer. ► Previously served as Deputy Chief Credit Officer and part of senior management from 2007 to 2018 Years at CALB: 14 Vivian Mui, Age Age ► 17 years of experience in various positions including lending and credit administration at : 84 : 40 SEVP & CCO Years in Industry: 20 Mechanics Bank Scott Myers Joined 2019 ► Veteran banker with more than 15 years experience serving middle market corporate clients Age : 49 SEVP & CLO► Previously served as Wells Fargo Senior Vice President and Sacramento Region Manager Years in Industry: 25 ► Previously served as the Bank’s Executive Vice President & East Bay Market President Years at CALB: 14 Michele Wirfel, Age ► Has worked in financial management and commercial banking since 1991 in various executive : 51 SEVP & CBO Years in Industry: 30 management positions including regional manager for CivicBank of Commerce ► Previously served as a Senior Vice President and Chief Information Officer for North Bay Bancorp Tom M. Dorrance, Years at CALB: 14 Age ► Has worked in financial management and commercial banking since 1992 including I.T. : 57 SEVP Technology & Operations Years in Industry: 29 Manager at CivicBank of Commerce ► Served as Executive Vice President and CCO from 2007 through 2017 Years at CALB: 14 John Lindstedt, ► Previously served in various executive management positions including Executive Vice President Years in Industry: 53 SEVP & CCO Emeritus and Senior Lending Officer for Wells Fargo’s corporate bank and President & CCO of CivicBank of Commerce 6EXPERIENCED MANAGEMENT TEAM ► Previously served as an Executive Vice President of the Bank primarily responsible for managing production since the Bank’s founding in 2007 Years at CALB: 14 Steven E. Shelton, Age : 58 ► Served for thirteen years in various executive management positions including President of Years in Industry: 37 President & CEO CivicBank of Commerce ► More than 30 years’ experience in executive finance and risk management roles, most recently Joined 2019 serving as Chief Risk Officer for Western Alliance Bank. Thomas A. Sa, Age: ► Previously served in various executive and director roles at Bridge Bank and its holding company 57 SEVP, CFO & COO Years in Industry: 33 Bridge Capital Holdings (BBNK), including Chief Financial Officer and Chief Strategy Officer. ► Previously served as Deputy Chief Credit Officer and part of senior management from 2007 to 2018 Years at CALB: 14 Vivian Mui, Age Age ► 17 years of experience in various positions including lending and credit administration at : 84 : 40 SEVP & CCO Years in Industry: 20 Mechanics Bank Scott Myers Joined 2019 ► Veteran banker with more than 15 years experience serving middle market corporate clients Age : 49 SEVP & CLO► Previously served as Wells Fargo Senior Vice President and Sacramento Region Manager Years in Industry: 25 ► Previously served as the Bank’s Executive Vice President & East Bay Market President Years at CALB: 14 Michele Wirfel, Age ► Has worked in financial management and commercial banking since 1991 in various executive : 51 SEVP & CBO Years in Industry: 30 management positions including regional manager for CivicBank of Commerce ► Previously served as a Senior Vice President and Chief Information Officer for North Bay Bancorp Tom M. Dorrance, Years at CALB: 14 Age ► Has worked in financial management and commercial banking since 1992 including I.T. : 57 SEVP Technology & Operations Years in Industry: 29 Manager at CivicBank of Commerce ► Served as Executive Vice President and CCO from 2007 through 2017 Years at CALB: 14 John Lindstedt, ► Previously served in various executive management positions including Executive Vice President Years in Industry: 53 SEVP & CCO Emeritus and Senior Lending Officer for Wells Fargo’s corporate bank and President & CCO of CivicBank of Commerce 6
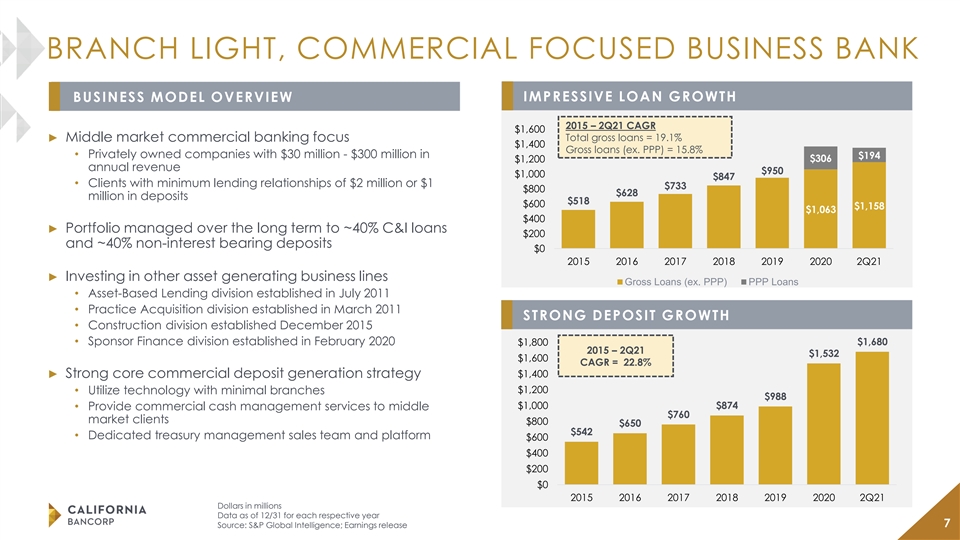
BRANCH LIGHT, COMMERCIAL FOCUSED BUSINESS BANK IMPRESSIVE LOAN GROWTH BUSINESS MODEL OVERVIEW 2015 – 2Q21 CAGR $1,600 Total gross loans = 19.1% ► Middle market commercial banking focus $1,400 Gross loans (ex. PPP) = 15.8% • Privately owned companies with $30 million - $300 million in $194 $306 $1,200 annual revenue $950 $1,000 $847 • Clients with minimum lending relationships of $2 million or $1 $733 $800 $628 million in deposits $518 $600 $1,158 $1,063 $400 ► Portfolio managed over the long term to ~40% C&I loans $200 and ~40% non-interest bearing deposits $0 2015 2016 2017 2018 2019 2020 2Q21 ► Investing in other asset generating business lines Gross Loans (ex. PPP) PPP Loans • Asset-Based Lending division established in July 2011 • Practice Acquisition division established in March 2011 STRONG DEPOSIT GROWTH • Construction division established December 2015 • Sponsor Finance division established in February 2020 $1,680 $1,800 2015 – 2Q21 $1,532 $1,600 CAGR = 22.8% $1,400 ► Strong core commercial deposit generation strategy $1,200 • Utilize technology with minimal branches $988 $1,000 $874 • Provide commercial cash management services to middle $760 market clients $800 $650 $542 • Dedicated treasury management sales team and platform $600 $400 $200 $0 2015 2016 2017 2018 2019 2020 2Q21 Dollars in millions Data as of 12/31 for each respective year 7 Source: S&P Global Intelligence; Earnings releaseBRANCH LIGHT, COMMERCIAL FOCUSED BUSINESS BANK IMPRESSIVE LOAN GROWTH BUSINESS MODEL OVERVIEW 2015 – 2Q21 CAGR $1,600 Total gross loans = 19.1% ► Middle market commercial banking focus $1,400 Gross loans (ex. PPP) = 15.8% • Privately owned companies with $30 million - $300 million in $194 $306 $1,200 annual revenue $950 $1,000 $847 • Clients with minimum lending relationships of $2 million or $1 $733 $800 $628 million in deposits $518 $600 $1,158 $1,063 $400 ► Portfolio managed over the long term to ~40% C&I loans $200 and ~40% non-interest bearing deposits $0 2015 2016 2017 2018 2019 2020 2Q21 ► Investing in other asset generating business lines Gross Loans (ex. PPP) PPP Loans • Asset-Based Lending division established in July 2011 • Practice Acquisition division established in March 2011 STRONG DEPOSIT GROWTH • Construction division established December 2015 • Sponsor Finance division established in February 2020 $1,680 $1,800 2015 – 2Q21 $1,532 $1,600 CAGR = 22.8% $1,400 ► Strong core commercial deposit generation strategy $1,200 • Utilize technology with minimal branches $988 $1,000 $874 • Provide commercial cash management services to middle $760 market clients $800 $650 $542 • Dedicated treasury management sales team and platform $600 $400 $200 $0 2015 2016 2017 2018 2019 2020 2Q21 Dollars in millions Data as of 12/31 for each respective year 7 Source: S&P Global Intelligence; Earnings release

TAKING SHARE FROM NATIONAL/REGIONAL BANKS PRODUCT AND SERVICE DIFFERENTIATION OUR “TYPICAL CLIENT” Combine Capabilities of a Big Bank with the $8M ~$75M $3M High Service Levels of a Community Bank revolving line in annual equipment with $3M average ► Attract top talent with deep market experience to compete revenue term loan outstanding against and win business from large banks ► Professional team with a consultative delivery process $5M $5M $3M ► Invest in systems, tools, and technology for success in niche markets money market commercial real demand deposit accounts to hold ► Offer clients access to key decision makers estate loan operating account surplus deposits ► Ability to execute quickly, with market leading responsiveness Fee income driven by commercial portfolio account analysis and treasury management services INDUSTRY & SPECIALTY LENDING FOCUS MARKET SHARE & DEMOGRAPHICS¹ Deposit 2010-2021 2021 2021-2026 Commercial Banking Focused on Four Core Industries Market Pop Median HH Proj. Change Deps Share Change Income Pop HH Income Manufacturing County ($000) (%) (%) ($) (%) (%) and Professional Contractor Investor CRE Contra Costa 1,217 2.09 10.55 112,715 3.55 14.48 Distribution Santa Clara 173 0.10 9.04 137,720 3.20 14.01 Aggregate: CA 6.67 82,565 2.56 12.24 Specialty Lending Groups nd ► CALB has the 2 largest market share in Contra Costa County among Practice Asset Based Sponsor Construction community banks Acquisition Lending Finance ► Serving customers throughout the greater San Francisco Bay Area with recent expansion into Sacramento (1) Deposit data as of June 30, 2020 Source: S&P Global Intelligence; FDIC; Earnings release 8
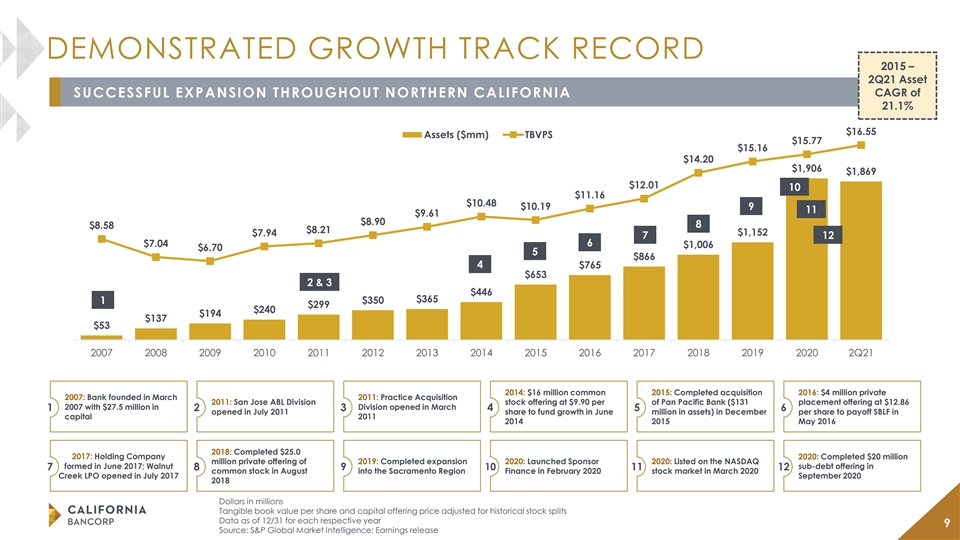
DEMONSTRATED GROWTH TRACK RECORD 2015 – 2Q21 Asset CAGR of SUCCESSFUL EXPANSION THROUGHOUT NORTHERN CALIFORNIA 21.1% $16.55 Assets ($mm) TBVPS $15.77 $15.16 $14.20 $1,906 $1,869 $12.01 10 $11.16 $10.48 $10.19 9 11 $9.61 $8.90 8 $8.58 $8.21 $7.94 $1,152 7 12 6 $7.04 $1,006 $6.70 5 $866 4 $765 $653 2 & 3 $446 $365 1 $350 $299 $240 $194 $137 $53 2007 2008 2009 2010 2011 2012 2013 2014 2015 2016 2017 2018 2019 2020 2Q21 2014: $16 million common 2015: Completed acquisition 2016: $4 million private 2007: Bank founded in March 2011: Practice Acquisition 2011: San Jose ABL Division stock offering at $9.90 per of Pan Pacific Bank ($131 placement offering at $12.86 2007 with $27.5 million in Division opened in March 1 2 3 4 5 6 opened in July 2011 share to fund growth in June million in assets) in December per share to payoff SBLF in capital 2011 2014 2015 May 2016 2018: Completed $25.0 2017: Holding Company 2020: Completed $20 million million private offering of 2019: Completed expansion 2020: Launched Sponsor 2020: Listed on the NASDAQ formed in June 2017; Walnut sub-debt offering in 7 8 9 10 11 12 common stock in August into the Sacramento Region Finance in February 2020 stock market in March 2020 Creek LPO opened in July 2017 September 2020 2018 Dollars in millions Tangible book value per share and capital offering price adjusted for historical stock splits Data as of 12/31 for each respective year 9 Source: S&P Global Market Intelligence; Earnings releaseDEMONSTRATED GROWTH TRACK RECORD 2015 – 2Q21 Asset CAGR of SUCCESSFUL EXPANSION THROUGHOUT NORTHERN CALIFORNIA 21.1% $16.55 Assets ($mm) TBVPS $15.77 $15.16 $14.20 $1,906 $1,869 $12.01 10 $11.16 $10.48 $10.19 9 11 $9.61 $8.90 8 $8.58 $8.21 $7.94 $1,152 7 12 6 $7.04 $1,006 $6.70 5 $866 4 $765 $653 2 & 3 $446 $365 1 $350 $299 $240 $194 $137 $53 2007 2008 2009 2010 2011 2012 2013 2014 2015 2016 2017 2018 2019 2020 2Q21 2014: $16 million common 2015: Completed acquisition 2016: $4 million private 2007: Bank founded in March 2011: Practice Acquisition 2011: San Jose ABL Division stock offering at $9.90 per of Pan Pacific Bank ($131 placement offering at $12.86 2007 with $27.5 million in Division opened in March 1 2 3 4 5 6 opened in July 2011 share to fund growth in June million in assets) in December per share to payoff SBLF in capital 2011 2014 2015 May 2016 2018: Completed $25.0 2017: Holding Company 2020: Completed $20 million million private offering of 2019: Completed expansion 2020: Launched Sponsor 2020: Listed on the NASDAQ formed in June 2017; Walnut sub-debt offering in 7 8 9 10 11 12 common stock in August into the Sacramento Region Finance in February 2020 stock market in March 2020 Creek LPO opened in July 2017 September 2020 2018 Dollars in millions Tangible book value per share and capital offering price adjusted for historical stock splits Data as of 12/31 for each respective year 9 Source: S&P Global Market Intelligence; Earnings release
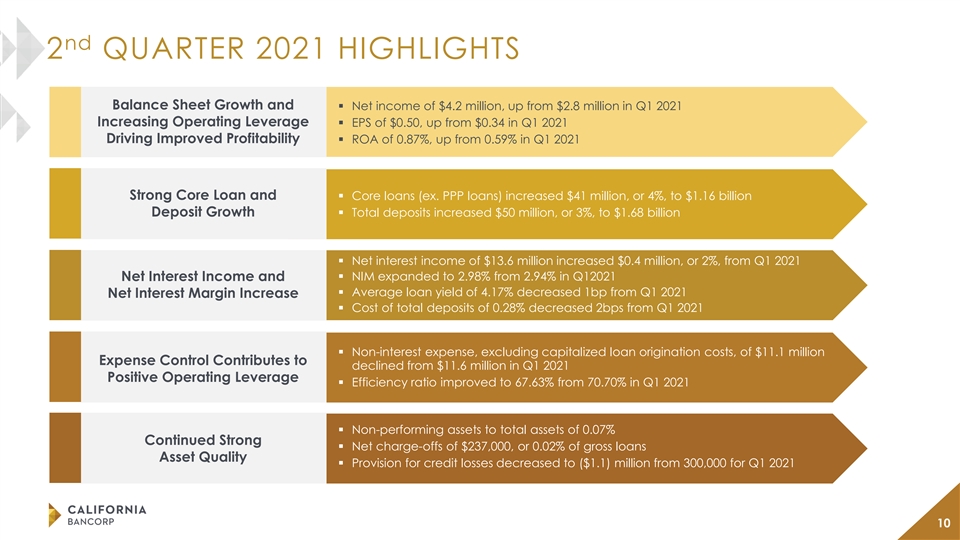
nd 2 QUARTER 2021 HIGHLIGHTS Balance Sheet Growth and § Net income of $4.2 million, up from $2.8 million in Q1 2021 Increasing Operating Leverage § EPS of $0.50, up from $0.34 in Q1 2021 Driving Improved Profitability § ROA of 0.87%, up from 0.59% in Q1 2021 Strong Core Loan and § Core loans (ex. PPP loans) increased $41 million, or 4%, to $1.16 billion Deposit Growth§ Total deposits increased $50 million, or 3%, to $1.68 billion § Net interest income of $13.6 million increased $0.4 million, or 2%, from Q1 2021 Net Interest Income and § NIM expanded to 2.98% from 2.94% in Q12021 § Average loan yield of 4.17% decreased 1bp from Q1 2021 Net Interest Margin Increase § Cost of total deposits of 0.28% decreased 2bps from Q1 2021 § Non-interest expense, excluding capitalized loan origination costs, of $11.1 million Expense Control Contributes to declined from $11.6 million in Q1 2021 Positive Operating Leverage § Efficiency ratio improved to 67.63% from 70.70% in Q1 2021 § Non-performing assets to total assets of 0.07% Continued Strong § Net charge-offs of $237,000, or 0.02% of gross loans Asset Quality § Provision for credit losses decreased to ($1.1) million from 300,000 for Q1 2021 10nd 2 QUARTER 2021 HIGHLIGHTS Balance Sheet Growth and § Net income of $4.2 million, up from $2.8 million in Q1 2021 Increasing Operating Leverage § EPS of $0.50, up from $0.34 in Q1 2021 Driving Improved Profitability § ROA of 0.87%, up from 0.59% in Q1 2021 Strong Core Loan and § Core loans (ex. PPP loans) increased $41 million, or 4%, to $1.16 billion Deposit Growth§ Total deposits increased $50 million, or 3%, to $1.68 billion § Net interest income of $13.6 million increased $0.4 million, or 2%, from Q1 2021 Net Interest Income and § NIM expanded to 2.98% from 2.94% in Q12021 § Average loan yield of 4.17% decreased 1bp from Q1 2021 Net Interest Margin Increase § Cost of total deposits of 0.28% decreased 2bps from Q1 2021 § Non-interest expense, excluding capitalized loan origination costs, of $11.1 million Expense Control Contributes to declined from $11.6 million in Q1 2021 Positive Operating Leverage § Efficiency ratio improved to 67.63% from 70.70% in Q1 2021 § Non-performing assets to total assets of 0.07% Continued Strong § Net charge-offs of $237,000, or 0.02% of gross loans Asset Quality § Provision for credit losses decreased to ($1.1) million from 300,000 for Q1 2021 10
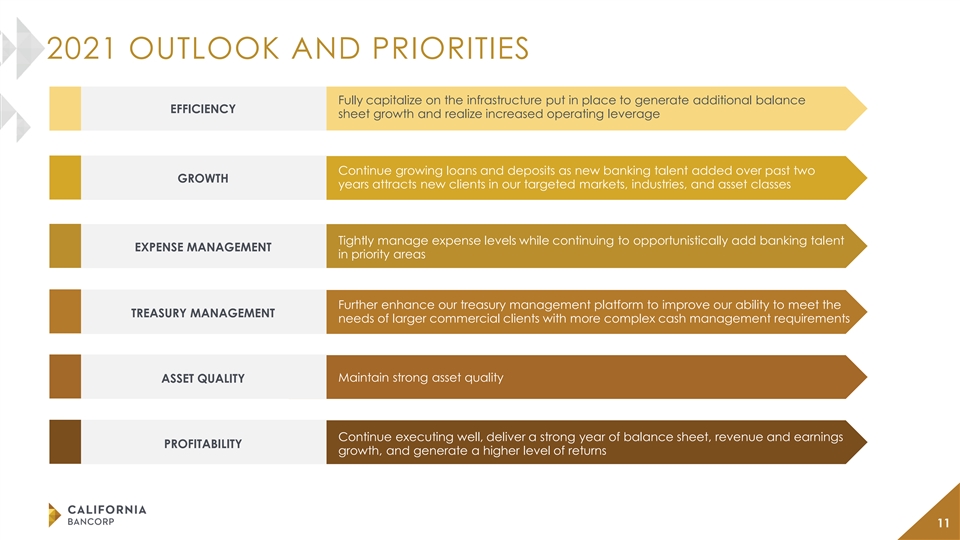
2021 OUTLOOK AND PRIORITIES Fully capitalize on the infrastructure put in place to generate additional balance EFFICIENCY sheet growth and realize increased operating leverage Continue growing loans and deposits as new banking talent added over past two GROWTH years attracts new clients in our targeted markets, industries, and asset classes Tightly manage expense levels while continuing to opportunistically add banking talent EXPENSE MANAGEMENT in priority areas Further enhance our treasury management platform to improve our ability to meet the TREASURY MANAGEMENT needs of larger commercial clients with more complex cash management requirements Maintain strong asset quality ASSET QUALITY Continue executing well, deliver a strong year of balance sheet, revenue and earnings PROFITABILITY growth, and generate a higher level of returns 112021 OUTLOOK AND PRIORITIES Fully capitalize on the infrastructure put in place to generate additional balance EFFICIENCY sheet growth and realize increased operating leverage Continue growing loans and deposits as new banking talent added over past two GROWTH years attracts new clients in our targeted markets, industries, and asset classes Tightly manage expense levels while continuing to opportunistically add banking talent EXPENSE MANAGEMENT in priority areas Further enhance our treasury management platform to improve our ability to meet the TREASURY MANAGEMENT needs of larger commercial clients with more complex cash management requirements Maintain strong asset quality ASSET QUALITY Continue executing well, deliver a strong year of balance sheet, revenue and earnings PROFITABILITY growth, and generate a higher level of returns 11
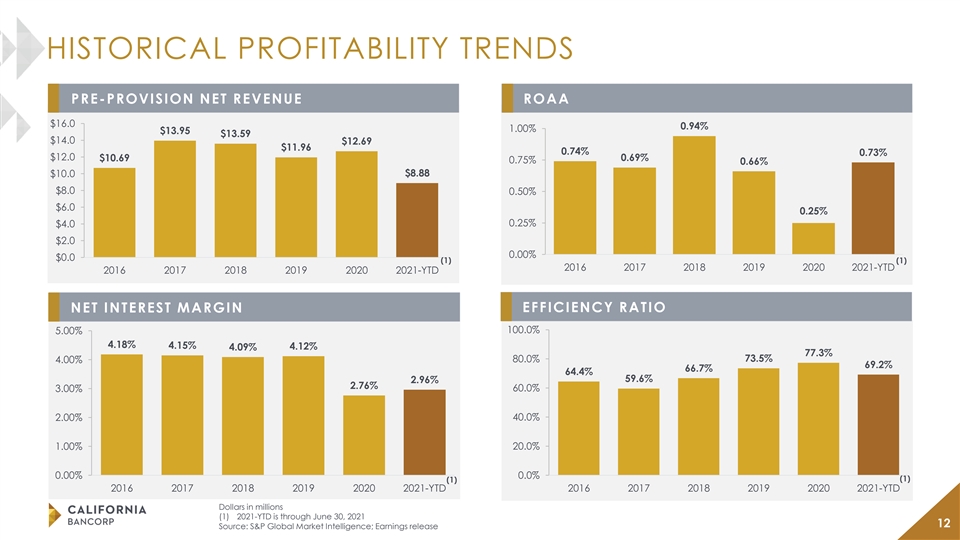
HISTORICAL PROFITABILITY TRENDS PRE-PROVISION NET REVENUE ROAA $16.0 0.94% 1.00% $13.95 $13.59 $14.0 $12.69 $11.96 0.74% 0.73% $12.0 $10.69 0.69% 0.75% 0.66% $10.0 $8.88 $8.0 0.50% $6.0 0.25% 0.25% $4.0 $2.0 0.00% $0.0 (1) (1) 2016 2017 2018 2019 2020 2021-YTD 2016 2017 2018 2019 2020 2021-YTD EFFICIENCY RATIO NET INTEREST MARGIN 100.0% 5.00% 4.18% 4.15% 4.12% 4.09% 77.3% 80.0% 73.5% 4.00% 69.2% 66.7% 64.4% 59.6% 2.96% 2.76% 60.0% 3.00% 2.00% 40.0% 1.00% 20.0% 0.00% 0.0% (1) (1) 2016 2017 2018 2019 2020 2021-YTD 2016 2017 2018 2019 2020 2021-YTD Dollars in millions (1) 2021-YTD is through June 30, 2021 12 Source: S&P Global Market Intelligence; Earnings releaseHISTORICAL PROFITABILITY TRENDS PRE-PROVISION NET REVENUE ROAA $16.0 0.94% 1.00% $13.95 $13.59 $14.0 $12.69 $11.96 0.74% 0.73% $12.0 $10.69 0.69% 0.75% 0.66% $10.0 $8.88 $8.0 0.50% $6.0 0.25% 0.25% $4.0 $2.0 0.00% $0.0 (1) (1) 2016 2017 2018 2019 2020 2021-YTD 2016 2017 2018 2019 2020 2021-YTD EFFICIENCY RATIO NET INTEREST MARGIN 100.0% 5.00% 4.18% 4.15% 4.12% 4.09% 77.3% 80.0% 73.5% 4.00% 69.2% 66.7% 64.4% 59.6% 2.96% 2.76% 60.0% 3.00% 2.00% 40.0% 1.00% 20.0% 0.00% 0.0% (1) (1) 2016 2017 2018 2019 2020 2021-YTD 2016 2017 2018 2019 2020 2021-YTD Dollars in millions (1) 2021-YTD is through June 30, 2021 12 Source: S&P Global Market Intelligence; Earnings release

DIVERSIFIED COMMERCIAL LOAN PORTFOLIO (1) LOAN PORTFOLIO COMPOSITION (6/30/2021) HISTORICAL LOAN COMPOSITION 2016 – 2Q21 CAGR $1,600 $1,369 $1,353 Other 6% C&I: 12.2% (6% ex. PPP) Total Loans: 18.6% PPP $952 $1,100 $847 14% $733 $628 $426 Commercial 31% $415 $600 $390 $341 $329 $254 (37% ex. PPP) Construction 3% 41% 40% 40% 45% 30% 31% $100 (4% ex. PPP) (39% ex.PPP)(37% ex.PPP) -$400 2016 2017 2018 2019 2020 2Q21 CRE - Non-Owner Total Loans C&I Loans Occupied 27% CRE - Owner Yield on Occupied 19% (31% ex. PPP) 5.09% 5.19% 4.22% 4.17% 5.08% 4.88% Loans Loans / (22% ex. PPP) 80% 97% 96% 97% 96% 89% Deposits (2) GROSS LOAN FUNDING VS. NET LOAN GROWTH OPERATING LOC USAGE $120 $700 28% 27% $100 $600 27% 26% $107 $80 $92 $500 26% 25% $88 $60 $78 $70 $400 25% 24% $40 $55 $54 $50 $639 $300 $603 24% 23% $576 $42 $20 $512 $490 $200 23% $0 $100 22% -$31 -$20 $119 $117 $149 $162 $161 $0 21% -$40 2020Q2 2020Q3 2020Q4 2021Q1 2021Q2 2020Q2 2020Q3 2020Q4 2021Q1 2021Q2 Commitment Amount Gross Balance Usage Gross Loan Funding Net Loan Growth Dollars in millions (1) Data as of 12/31 for each respective year (2) Excludes PPP loans 13 Source: S&P Global Market Intelligence; Earnings releaseDIVERSIFIED COMMERCIAL LOAN PORTFOLIO (1) LOAN PORTFOLIO COMPOSITION (6/30/2021) HISTORICAL LOAN COMPOSITION 2016 – 2Q21 CAGR $1,600 $1,369 $1,353 Other 6% C&I: 12.2% (6% ex. PPP) Total Loans: 18.6% PPP $952 $1,100 $847 14% $733 $628 $426 Commercial 31% $415 $600 $390 $341 $329 $254 (37% ex. PPP) Construction 3% 41% 40% 40% 45% 30% 31% $100 (4% ex. PPP) (39% ex.PPP)(37% ex.PPP) -$400 2016 2017 2018 2019 2020 2Q21 CRE - Non-Owner Total Loans C&I Loans Occupied 27% CRE - Owner Yield on Occupied 19% (31% ex. PPP) 5.09% 5.19% 4.22% 4.17% 5.08% 4.88% Loans Loans / (22% ex. PPP) 80% 97% 96% 97% 96% 89% Deposits (2) GROSS LOAN FUNDING VS. NET LOAN GROWTH OPERATING LOC USAGE $120 $700 28% 27% $100 $600 27% 26% $107 $80 $92 $500 26% 25% $88 $60 $78 $70 $400 25% 24% $40 $55 $54 $50 $639 $300 $603 24% 23% $576 $42 $20 $512 $490 $200 23% $0 $100 22% -$31 -$20 $119 $117 $149 $162 $161 $0 21% -$40 2020Q2 2020Q3 2020Q4 2021Q1 2021Q2 2020Q2 2020Q3 2020Q4 2021Q1 2021Q2 Commitment Amount Gross Balance Usage Gross Loan Funding Net Loan Growth Dollars in millions (1) Data as of 12/31 for each respective year (2) Excludes PPP loans 13 Source: S&P Global Market Intelligence; Earnings release

COMMERCIAL AND CRE LOAN PORTFOLIOS WELL-DIVERSIFIED LOAN PORTFOLIO MITIGATES RISK (1) (1) COMMERCIAL LOAN PORTFOLIO CRE LOAN PORTFOLIO Average loan balance of $500K Average loan balance of $1.48M Weighted Avg. LTV of 47% Average loan commitment of $1.1M 3% 3% 1% < 1% 2% Multi-Family Info, Finance Retail Misc. Land 1% & Insurance 13% Residential Industrial 2% Real Estate & 4% Leasing Mixed-Use 2% 14% 2% Wholesale Services Hotel/Motel & Gas Station 3% 3% Other Manufacturing 10% Office 9% 6% Retail Contractors (1) Data as a percent of total loans, $1.35 billion Data as of 6/30/2021 14COMMERCIAL AND CRE LOAN PORTFOLIOS WELL-DIVERSIFIED LOAN PORTFOLIO MITIGATES RISK (1) (1) COMMERCIAL LOAN PORTFOLIO CRE LOAN PORTFOLIO Average loan balance of $500K Average loan balance of $1.48M Weighted Avg. LTV of 47% Average loan commitment of $1.1M 3% 3% 1% < 1% 2% Multi-Family Info, Finance Retail Misc. Land 1% & Insurance 13% Residential Industrial 2% Real Estate & 4% Leasing Mixed-Use 2% 14% 2% Wholesale Services Hotel/Motel & Gas Station 3% 3% Other Manufacturing 10% Office 9% 6% Retail Contractors (1) Data as a percent of total loans, $1.35 billion Data as of 6/30/2021 14

TOP 20 BORROWING RELATIONSHIPS Net Principal Balance Rank DESCRIPTION # of Notes % of Total Loans¹ Risk Rating ($000) 1 Multifamily 3 $23,915 1.8% Pass 2 Industrial CRE /Retail CRE 14 21,095 1.6% Pass 3 Mixed Use / Residential 1 18,209 1.3% Pass 4 Multifamily 1 17,450 1.3% Pass 5 Gas Station 8 17,087 1.3% Pass 6 General Contractor 10 17,000 1.3% Pass 7 Industrial Multi Tenant 1 16,859 1.2% Pass 8 Multifamily 2 16,749 1.2% Pass 9 Industrial CRE /Retail CRE 12 16,693 1.2% Pass 10 Gas Station 10 16,293 1.2% Pass 11 Mixed Use - Other 1 14,396 1.1% Pass 12 Mixed Use - Other 3 13,684 1.0% Pass 13 Commercial Retail Multi Tenant 3 13,629 1.0% Pass 14 Office 5 13,515 1.0% Pass 15 Land / Improved Land /Office 9 13,290 1.0% Pass 16 Business Services (C&I) 2 13,236 1.0% Pass 17 Multifamily 4 13,004 1.0% Pass 18 Business Services (C&I) 8 12,707 0.9% Pass 19 Business Services (C&I) 2 12,688 0.9% Pass 20 Business Services (C&I) 3 12,558 0.9% Pass Total 102 $314,053 23.2% - (1) Reflects net principal balance as a percentage of total loans 15TOP 20 BORROWING RELATIONSHIPS Net Principal Balance Rank DESCRIPTION # of Notes % of Total Loans¹ Risk Rating ($000) 1 Multifamily 3 $23,915 1.8% Pass 2 Industrial CRE /Retail CRE 14 21,095 1.6% Pass 3 Mixed Use / Residential 1 18,209 1.3% Pass 4 Multifamily 1 17,450 1.3% Pass 5 Gas Station 8 17,087 1.3% Pass 6 General Contractor 10 17,000 1.3% Pass 7 Industrial Multi Tenant 1 16,859 1.2% Pass 8 Multifamily 2 16,749 1.2% Pass 9 Industrial CRE /Retail CRE 12 16,693 1.2% Pass 10 Gas Station 10 16,293 1.2% Pass 11 Mixed Use - Other 1 14,396 1.1% Pass 12 Mixed Use - Other 3 13,684 1.0% Pass 13 Commercial Retail Multi Tenant 3 13,629 1.0% Pass 14 Office 5 13,515 1.0% Pass 15 Land / Improved Land /Office 9 13,290 1.0% Pass 16 Business Services (C&I) 2 13,236 1.0% Pass 17 Multifamily 4 13,004 1.0% Pass 18 Business Services (C&I) 8 12,707 0.9% Pass 19 Business Services (C&I) 2 12,688 0.9% Pass 20 Business Services (C&I) 3 12,558 0.9% Pass Total 102 $314,053 23.2% - (1) Reflects net principal balance as a percentage of total loans 15

ASSET QUALITY TRENDS RESERVES / LOANS NET CHARGE-OFFS (RECOVERIES) ($000S) $10,000 1.40% $8,000 1.20% 1.14% ex. PPP 1.28% 1.27% 1.20% 1.17% 1.00% $6,000 1.03% 0.98% 0.80% $4,000 0.60% $2,051 $1,844 $2,000 0.40% $618 $71 $0 0.20% -$247 -$65 -$2,000 0.00% (1) 2016 2017 2018 2019 2020 2021-YTD 2016 2017 2018 2019 2020 2Q21 NCOS (RECOVERIES) / AVG. LOANS (%) NONPERFORMING ASSETS $10,000 1.50% 0.75% 1.25% $8,000 0.50% 1.00% 0.23% $6,000 0.16% 0.25% 0.09% 0.75% 0.01% $4,000 0.00% 0.44% 0.50% -0.01% -0.04% 0.24% -0.25% $2,000 0.25% 0.10% 0.06% 0.07% 0.01% -0.50% $0 0.00% 2016 2017 2018 2019 2020 2Q21 (1) -0.75% (2) 2016 2017 2018 2019 2020 2021-YTD Nonperforming Assets NPAs / Total Assets (1) 2021-YTD is through June 30, 2021 (2) Nonperforming assets are comprised of loans on nonaccrual status, loans 90 days or more past due and still 16 accruing interest, and other real estate owned Source: S&P Global Market Intelligence; Earnings release NPAs ($000S) NPAs /Total AssetsASSET QUALITY TRENDS RESERVES / LOANS NET CHARGE-OFFS (RECOVERIES) ($000S) $10,000 1.40% $8,000 1.20% 1.14% ex. PPP 1.28% 1.27% 1.20% 1.17% 1.00% $6,000 1.03% 0.98% 0.80% $4,000 0.60% $2,051 $1,844 $2,000 0.40% $618 $71 $0 0.20% -$247 -$65 -$2,000 0.00% (1) 2016 2017 2018 2019 2020 2021-YTD 2016 2017 2018 2019 2020 2Q21 NCOS (RECOVERIES) / AVG. LOANS (%) NONPERFORMING ASSETS $10,000 1.50% 0.75% 1.25% $8,000 0.50% 1.00% 0.23% $6,000 0.16% 0.25% 0.09% 0.75% 0.01% $4,000 0.00% 0.44% 0.50% -0.01% -0.04% 0.24% -0.25% $2,000 0.25% 0.10% 0.06% 0.07% 0.01% -0.50% $0 0.00% 2016 2017 2018 2019 2020 2Q21 (1) -0.75% (2) 2016 2017 2018 2019 2020 2021-YTD Nonperforming Assets NPAs / Total Assets (1) 2021-YTD is through June 30, 2021 (2) Nonperforming assets are comprised of loans on nonaccrual status, loans 90 days or more past due and still 16 accruing interest, and other real estate owned Source: S&P Global Market Intelligence; Earnings release NPAs ($000S) NPAs /Total Assets
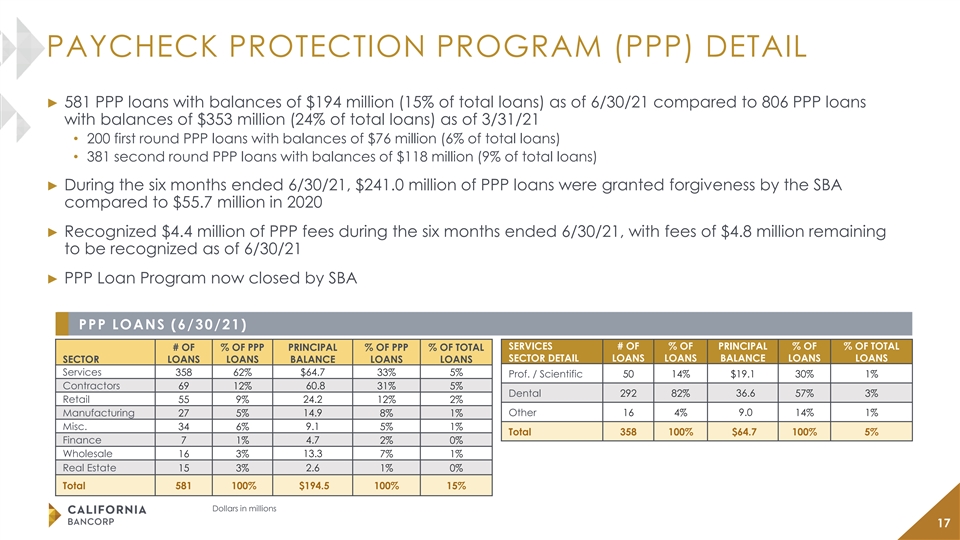
PAYCHECK PROTECTION PROGRAM (PPP) DETAIL ► 581 PPP loans with balances of $194 million (15% of total loans) as of 6/30/21 compared to 806 PPP loans with balances of $353 million (24% of total loans) as of 3/31/21 • 200 first round PPP loans with balances of $76 million (6% of total loans) • 381 second round PPP loans with balances of $118 million (9% of total loans) ► During the six months ended 6/30/21, $241.0 million of PPP loans were granted forgiveness by the SBA compared to $55.7 million in 2020 ► Recognized $4.4 million of PPP fees during the six months ended 6/30/21, with fees of $4.8 million remaining to be recognized as of 6/30/21 ► PPP Loan Program now closed by SBA PPP LOANS (6/30/21) SERVICES # OF % OF PRINCIPAL % OF % OF TOTAL # OF % OF PPP PRINCIPAL % OF PPP % OF TOTAL SECTOR DETAIL LOANS LOANS BALANCE LOANS LOANS SECTOR LOANS LOANS BALANCE LOANS LOANS Services 358 62% $64.7 33% 5% Prof. / Scientific 50 14% $19.1 30% 1% Contractors 69 12% 60.8 31% 5% Dental 292 82% 36.6 57% 3% Retail 55 9% 24.2 12% 2% Manufacturing 14.9 Other 16 4% 9.0 14% 1% 27 5% 8% 1% Misc. 34 6% 9.1 5% 1% Total 358 100% $64.7 100% 5% Finance 7 1% 4.7 2% 0% Wholesale 16 3% 13.3 7% 1% Real Estate 2.6 15 3% 1% 0% Total 581 100% $194.5 100% 15% Dollars in millions 17
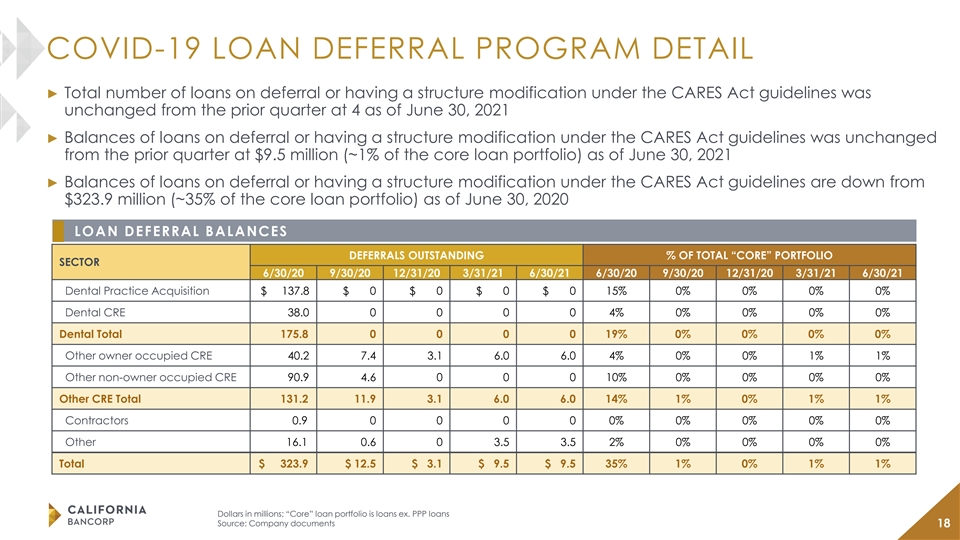
COVID-19 LOAN DEFERRAL PROGRAM DETAIL ► Total number of loans on deferral or having a structure modification under the CARES Act guidelines was unchanged from the prior quarter at 4 as of June 30, 2021 ► Balances of loans on deferral or having a structure modification under the CARES Act guidelines was unchanged from the prior quarter at $9.5 million (~1% of the core loan portfolio) as of June 30, 2021 ► Balances of loans on deferral or having a structure modification under the CARES Act guidelines are down from $323.9 million (~35% of the core loan portfolio) as of June 30, 2020 LOAN DEFERRAL BALANCES DEFERRALS OUTSTANDING % OF TOTAL “CORE” PORTFOLIO SECTOR 6/30/20 9/30/20 12/31/20 3/31/21 6/30/21 6/30/20 9/30/20 12/31/20 3/31/21 6/30/21 Dental Practice Acquisition $ 137.8 $ 0 $ 0 $ 0 $ 0 15% 0% 0% 0% 0% Dental CRE 38.0 0 0 0 0 4% 0% 0% 0% 0% Dental Total 175.8 0 0 0 0 19% 0% 0% 0% 0% Other owner occupied CRE 40.2 7.4 3.1 6.0 6.0 4% 0% 0% 1% 1% Other non-owner occupied CRE 90.9 4.6 0 0 0 10% 0% 0% 0% 0% Other CRE Total 131.2 11.9 3.1 6.0 6.0 14% 1% 0% 1% 1% Contractors 0.9 0 0 0 0 0% 0% 0% 0% 0% Other 16.1 0.6 0 3.5 3.5 2% 0% 0% 0% 0% Total $ 323.9 $ 12.5 $ 3.1 $ 9.5 $ 9.5 35% 1% 0% 1% 1% Dollars in millions; “Core” loan portfolio is loans ex. PPP loans Source: Company documents 18COVID-19 LOAN DEFERRAL PROGRAM DETAIL ► Total number of loans on deferral or having a structure modification under the CARES Act guidelines was unchanged from the prior quarter at 4 as of June 30, 2021 ► Balances of loans on deferral or having a structure modification under the CARES Act guidelines was unchanged from the prior quarter at $9.5 million (~1% of the core loan portfolio) as of June 30, 2021 ► Balances of loans on deferral or having a structure modification under the CARES Act guidelines are down from $323.9 million (~35% of the core loan portfolio) as of June 30, 2020 LOAN DEFERRAL BALANCES DEFERRALS OUTSTANDING % OF TOTAL “CORE” PORTFOLIO SECTOR 6/30/20 9/30/20 12/31/20 3/31/21 6/30/21 6/30/20 9/30/20 12/31/20 3/31/21 6/30/21 Dental Practice Acquisition $ 137.8 $ 0 $ 0 $ 0 $ 0 15% 0% 0% 0% 0% Dental CRE 38.0 0 0 0 0 4% 0% 0% 0% 0% Dental Total 175.8 0 0 0 0 19% 0% 0% 0% 0% Other owner occupied CRE 40.2 7.4 3.1 6.0 6.0 4% 0% 0% 1% 1% Other non-owner occupied CRE 90.9 4.6 0 0 0 10% 0% 0% 0% 0% Other CRE Total 131.2 11.9 3.1 6.0 6.0 14% 1% 0% 1% 1% Contractors 0.9 0 0 0 0 0% 0% 0% 0% 0% Other 16.1 0.6 0 3.5 3.5 2% 0% 0% 0% 0% Total $ 323.9 $ 12.5 $ 3.1 $ 9.5 $ 9.5 35% 1% 0% 1% 1% Dollars in millions; “Core” loan portfolio is loans ex. PPP loans Source: Company documents 18

STRONG AND GROWING CORE DEPOSIT BASE DEPOSIT COMPOSITION (6/30/21) HISTORICAL DEPOSIT COMPOSITION Time deposits 2015 – 2Q21 CAGR 11% $1,800 $1,680 DDA: 25.7% Demand $1,532 $1,600 Total Deposits: 22.8% deposits Money market 47% $1,400 & savings deposits $1,200 40% Interest $988 $1,000 bearing $874 $792 demand $761 deposits $800 $673 2% $650 $542 $600 $387 $352 $400 DEPOSIT PORTFOLIO HIGHLIGHTS (6/30/21) $315 $285 $225 $200 ► Deposits increased $294 million from Q2-2020 to Q2-2021 44% 41% 40% 39% 44% 47% 42% $0 ► Core deposit base driven by commercial clients 2015 2016 2017 2018 2019 2020 2Q21 • 95%+ of commercial relationships hold deposits at the bank • Core deposits comprise 89% of total deposits Total Deposits NIB Deposits ► Utilize remote deposit capture and commercial cash Cost of management to generate and retain deposits 0.23% 0.24% 0.35% 0.55% 0.81% 0.48% 0.28% Deposits Core ► Treasury management division established in Q4-2019 91% 88% 94% 93% 94% 87% 89% Deposit Mix Dollars in millions Core deposits defined as total deposits less time deposits and brokered deposits. Data as of 12/31 for each respective year 19 Source: S&P Global Market Intelligence; Earnings releaseSTRONG AND GROWING CORE DEPOSIT BASE DEPOSIT COMPOSITION (6/30/21) HISTORICAL DEPOSIT COMPOSITION Time deposits 2015 – 2Q21 CAGR 11% $1,800 $1,680 DDA: 25.7% Demand $1,532 $1,600 Total Deposits: 22.8% deposits Money market 47% $1,400 & savings deposits $1,200 40% Interest $988 $1,000 bearing $874 $792 demand $761 deposits $800 $673 2% $650 $542 $600 $387 $352 $400 DEPOSIT PORTFOLIO HIGHLIGHTS (6/30/21) $315 $285 $225 $200 ► Deposits increased $294 million from Q2-2020 to Q2-2021 44% 41% 40% 39% 44% 47% 42% $0 ► Core deposit base driven by commercial clients 2015 2016 2017 2018 2019 2020 2Q21 • 95%+ of commercial relationships hold deposits at the bank • Core deposits comprise 89% of total deposits Total Deposits NIB Deposits ► Utilize remote deposit capture and commercial cash Cost of management to generate and retain deposits 0.23% 0.24% 0.35% 0.55% 0.81% 0.48% 0.28% Deposits Core ► Treasury management division established in Q4-2019 91% 88% 94% 93% 94% 87% 89% Deposit Mix Dollars in millions Core deposits defined as total deposits less time deposits and brokered deposits. Data as of 12/31 for each respective year 19 Source: S&P Global Market Intelligence; Earnings release
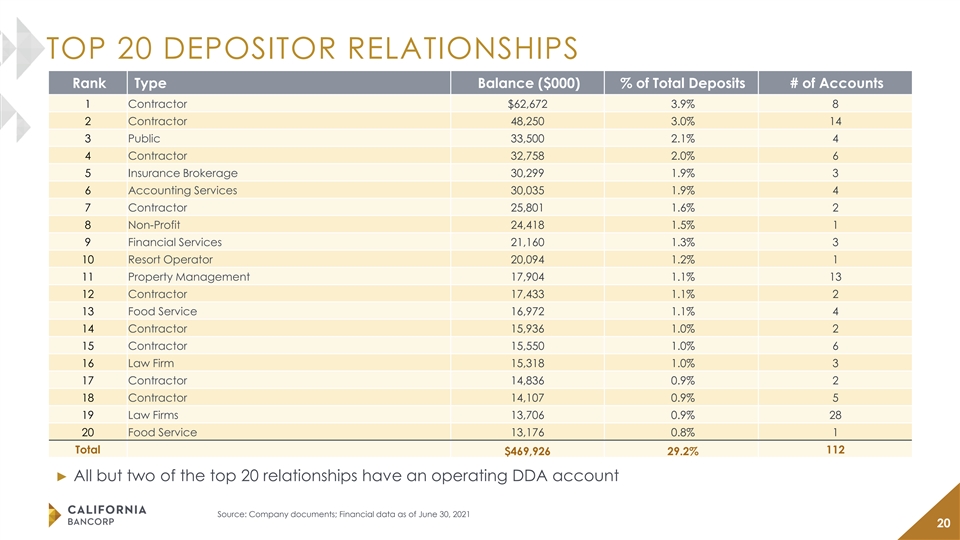
TOP 20 DEPOSITOR RELATIONSHIPS Rank Type Balance ($000) % of Total Deposits # of Accounts 1 Contractor $62,672 3.9% 8 2 Contractor 48,250 3.0% 14 3 Public 33,500 2.1% 4 4 Contractor 32,758 2.0% 6 5 Insurance Brokerage 30,299 1.9% 3 6 Accounting Services 30,035 1.9% 4 7 Contractor 25,801 1.6% 2 8 Non-Profit 24,418 1.5% 1 9 Financial Services 21,160 1.3% 3 10 Resort Operator 20,094 1.2% 1 11 Property Management 17,904 1.1% 13 12 Contractor 17,433 1.1% 2 13 Food Service 16,972 1.1% 4 14 Contractor 15,936 1.0% 2 15 Contractor 15,550 1.0% 6 16 Law Firm 15,318 1.0% 3 17 Contractor 14,836 0.9% 2 18 Contractor 14,107 0.9% 5 19 Law Firms 13,706 0.9% 28 20 Food Service 13,176 0.8% 1 Total 112 $469,926 29.2% ► All but two of the top 20 relationships have an operating DDA account Source: Company documents; Financial data as of June 30, 2021 20TOP 20 DEPOSITOR RELATIONSHIPS Rank Type Balance ($000) % of Total Deposits # of Accounts 1 Contractor $62,672 3.9% 8 2 Contractor 48,250 3.0% 14 3 Public 33,500 2.1% 4 4 Contractor 32,758 2.0% 6 5 Insurance Brokerage 30,299 1.9% 3 6 Accounting Services 30,035 1.9% 4 7 Contractor 25,801 1.6% 2 8 Non-Profit 24,418 1.5% 1 9 Financial Services 21,160 1.3% 3 10 Resort Operator 20,094 1.2% 1 11 Property Management 17,904 1.1% 13 12 Contractor 17,433 1.1% 2 13 Food Service 16,972 1.1% 4 14 Contractor 15,936 1.0% 2 15 Contractor 15,550 1.0% 6 16 Law Firm 15,318 1.0% 3 17 Contractor 14,836 0.9% 2 18 Contractor 14,107 0.9% 5 19 Law Firms 13,706 0.9% 28 20 Food Service 13,176 0.8% 1 Total 112 $469,926 29.2% ► All but two of the top 20 relationships have an operating DDA account Source: Company documents; Financial data as of June 30, 2021 20
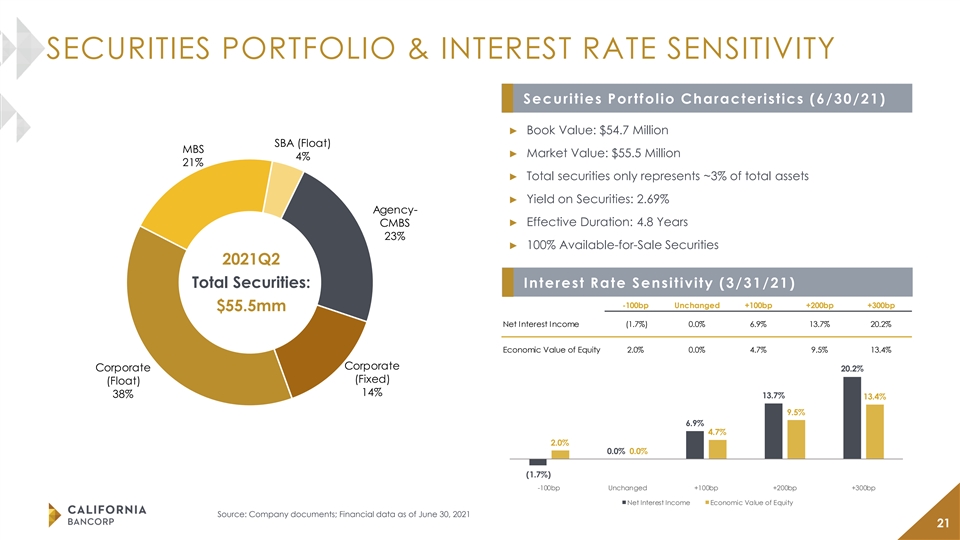
SECURITIES PORTFOLIO & INTEREST RATE SENSITIVITY Securities Portfolio Characteristics (6/30/21) ► Book Value: $54.7 Million SBA (Float) MBS ► Market Value: $55.5 Million 4% 21% ► Total securities only represents ~3% of total assets ► Yield on Securities: 2.69% Agency- ► Effective Duration: 4.8 Years CMBS 23% ► 100% Available-for-Sale Securities 2021Q2 Total Securities: Interest Rate Sensitivity (3/31/21) -100bp Unchanged +100bp +200bp +300bp $55.5mm Net Interest Income (1.7%) 0.0% 6.9% 13.7% 20.2% Economic Value of Equity 2.0% 0.0% 4.7% 9.5% 13.4% Corporate Corporate 20.2% (Fixed) (Float) 14% 38% 13.7% 13.4% 9.5% 6.9% 4.7% 2.0% 0.0% 0.0% (1.7%) -100bp Unchanged +100bp +200bp +300bp Net Interest Income Economic Value of Equity Source: Company documents; Financial data as of June 30, 2021 21SECURITIES PORTFOLIO & INTEREST RATE SENSITIVITY Securities Portfolio Characteristics (6/30/21) ► Book Value: $54.7 Million SBA (Float) MBS ► Market Value: $55.5 Million 4% 21% ► Total securities only represents ~3% of total assets ► Yield on Securities: 2.69% Agency- ► Effective Duration: 4.8 Years CMBS 23% ► 100% Available-for-Sale Securities 2021Q2 Total Securities: Interest Rate Sensitivity (3/31/21) -100bp Unchanged +100bp +200bp +300bp $55.5mm Net Interest Income (1.7%) 0.0% 6.9% 13.7% 20.2% Economic Value of Equity 2.0% 0.0% 4.7% 9.5% 13.4% Corporate Corporate 20.2% (Fixed) (Float) 14% 38% 13.7% 13.4% 9.5% 6.9% 4.7% 2.0% 0.0% 0.0% (1.7%) -100bp Unchanged +100bp +200bp +300bp Net Interest Income Economic Value of Equity Source: Company documents; Financial data as of June 30, 2021 21

CAPITALIZATION AND SOURCES OF LIQUIDITY Funding and Sources of Liquidity ► $25.0 million principal balance of subordinated debt outstanding • $5.0 million issued at bank in 2016 with a 5.875% coupon; currently callable; matures in 2026 • $20.0 million issued at holding company in 2020 with a 5.00% coupon; callable as of September 2025; matures in 2030 ► $6.5 million of cash at the holding company ► No FHLB borrowings outstanding ► At 6/30/2021, the Company had additional borrowing capacity of $481 million¹ • Includes an undrawn $3.0 million holding company line of credit Capital Deployment ► The Company currently does not pay a cash dividend ► The Company has no share repurchase plan currently in place 1: Primarily consists of FRB PPPLF and net loan balances AFS and pledged at FRB and FHLB Financial data as of June 30, 2021 22 Source: Company documents CAPITALIZATION AND SOURCES OF LIQUIDITY Funding and Sources of Liquidity ► $25.0 million principal balance of subordinated debt outstanding • $5.0 million issued at bank in 2016 with a 5.875% coupon; currently callable; matures in 2026 • $20.0 million issued at holding company in 2020 with a 5.00% coupon; callable as of September 2025; matures in 2030 ► $6.5 million of cash at the holding company ► No FHLB borrowings outstanding ► At 6/30/2021, the Company had additional borrowing capacity of $481 million¹ • Includes an undrawn $3.0 million holding company line of credit Capital Deployment ► The Company currently does not pay a cash dividend ► The Company has no share repurchase plan currently in place 1: Primarily consists of FRB PPPLF and net loan balances AFS and pledged at FRB and FHLB Financial data as of June 30, 2021 22 Source: Company documents

CAPITAL RATIOS – CONSOLIDATED TCE / TA LEVERAGE RATIO 16% 16% 12% 12% 11.57% 11.34% 10.64% 10.69% 8% 8% 8.78% 8.74% 9.08% 8.96% 7.49% 7.53% 7.32% 6.77% 4% 4% 0% 0% 2016 2017 2018 2019 2020 2021Q2 2016 2017 2018 2019 2020 2021Q2 TOTAL CAPITAL RATIO TIER 1 RATIO 16% 16% 12% 13.22% 12% 12.76% 11.99% 11.93% 11.18% 10.73% 10.63% 10.58% 10.11% 8% 8% 9.35% 8.96% 8.89% 4% 4% 0% 0% 2016 2017 2018 2019 2020 2021Q2 2016 2017 2018 2019 2020 2021Q2 Data as of 12/31 for each respective year Company does not report consolidated capital ratios 23 Issued $20.0 million of subordinated debt in 2020 Source: S&P Global Market Intelligence; Earnings releaseCAPITAL RATIOS – CONSOLIDATED TCE / TA LEVERAGE RATIO 16% 16% 12% 12% 11.57% 11.34% 10.64% 10.69% 8% 8% 8.78% 8.74% 9.08% 8.96% 7.49% 7.53% 7.32% 6.77% 4% 4% 0% 0% 2016 2017 2018 2019 2020 2021Q2 2016 2017 2018 2019 2020 2021Q2 TOTAL CAPITAL RATIO TIER 1 RATIO 16% 16% 12% 13.22% 12% 12.76% 11.99% 11.93% 11.18% 10.73% 10.63% 10.58% 10.11% 8% 8% 9.35% 8.96% 8.89% 4% 4% 0% 0% 2016 2017 2018 2019 2020 2021Q2 2016 2017 2018 2019 2020 2021Q2 Data as of 12/31 for each respective year Company does not report consolidated capital ratios 23 Issued $20.0 million of subordinated debt in 2020 Source: S&P Global Market Intelligence; Earnings release

CAPITAL RATIOS – BANK ONLY TCE / TA LEVERAGE RATIO 16% 16% 12% 12% 11.31% 10.44% 10.95% 9.92% 10.35% 10.08% 8% 8% 8.78% 8.36% 8.81% 8.02% 8.01% 7.20% 4% 4% 0% 0% 2016 2017 2018 2019 2020 2021Q2 2016 2017 2018 2019 2020 2021Q2 TOTAL CAPITAL RATIO TIER 1 RATIO 16% 16% 12% 12% 12.52% 12.32% 11.79% 11.75% 11.57% 10.63% 10.94% 10.79% 10.38% 10.36% 10.09% 8% 8% 8.96% 4% 4% 0% 0% 2016 2017 2018 2019 2020 2021Q2 2016 2017 2018 2019 2020 2021Q2 Data as of 12/31 for each respective year Issued $20.0 million of subordinated debt in 2020 24 Source: S&P Global Market Intelligence

PRO FORMA REGULATORY CAPITAL $ in thousands Debt / Equity Q2 2021 Adjustments Pro Forma Subordinated Debt $24,745 $34,288 $59,033 Total Consolidated Debt $24,745 $34,288 $59,033 Consolidated Equity $143,741 -- $143,741 Total Debt / Equity 17% -- 41% Bank-Level Tier 1 Capital $150,239 $25,000 $175,239 Bank-Level Total Capital $167,834 $25,000 $192,834 Total Assets for Regulatory Ratios Total Risk-Weighted Assets $1,450,013 $5,000 $1,455,013 Total Assets for Leverage Ratio $1,798,000 $25,000 $1,823,000 Consolidated TCE/TA Tangible Common Equity $136,207 -- $136,207 Tangible Assets $1,861,529 $34,288 $1,900,487 Bank-Level CRE Concentration Commercial RE Loans $410,433 -- $410,433 Bank-Level Total Capital $167,834 $25,000 $192,834 Capital Ratios Consolidated TCE/TA 7.32% 7.17% Bank-Level Leverage Ratio 8.36% 9.61% Bank-Level Tier 1 Ratio 10.36% 12.04% Bank-Level Total Risk Based Capital Ratio 11.57% 13.25% Bank-Level CRE Concentration 245% 213% Assumes $25 million of net proceeds are downstreamed to the bank subsidiary Assumes a 1.75% placement agent fee and $100,000 in other offering expenses Assumes net proceeds are reinvested into securities with a 20% risk-weighting 25 Assumes $35 million gross subordinated debt offering Source: S&P Global Market Intelligence; Earnings releasePRO FORMA REGULATORY CAPITAL $ in thousands Debt / Equity Q2 2021 Adjustments Pro Forma Subordinated Debt $24,745 $34,288 $59,033 Total Consolidated Debt $24,745 $34,288 $59,033 Consolidated Equity $143,741 -- $143,741 Total Debt / Equity 17% -- 41% Bank-Level Tier 1 Capital $150,239 $25,000 $175,239 Bank-Level Total Capital $167,834 $25,000 $192,834 Total Assets for Regulatory Ratios Total Risk-Weighted Assets $1,450,013 $5,000 $1,455,013 Total Assets for Leverage Ratio $1,798,000 $25,000 $1,823,000 Consolidated TCE/TA Tangible Common Equity $136,207 -- $136,207 Tangible Assets $1,861,529 $34,288 $1,900,487 Bank-Level CRE Concentration Commercial RE Loans $410,433 -- $410,433 Bank-Level Total Capital $167,834 $25,000 $192,834 Capital Ratios Consolidated TCE/TA 7.32% 7.17% Bank-Level Leverage Ratio 8.36% 9.61% Bank-Level Tier 1 Ratio 10.36% 12.04% Bank-Level Total Risk Based Capital Ratio 11.57% 13.25% Bank-Level CRE Concentration 245% 213% Assumes $25 million of net proceeds are downstreamed to the bank subsidiary Assumes a 1.75% placement agent fee and $100,000 in other offering expenses Assumes net proceeds are reinvested into securities with a 20% risk-weighting 25 Assumes $35 million gross subordinated debt offering Source: S&P Global Market Intelligence; Earnings release
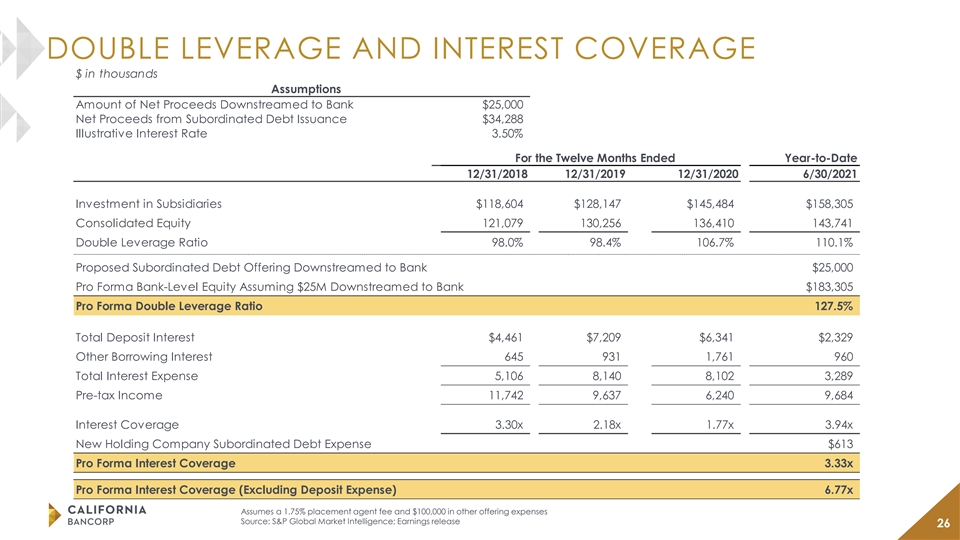
DOUBLE LEVERAGE AND INTEREST COVERAGE $ in thousands Assumptions Amount of Net Proceeds Downstreamed to Bank $25,000 Net Proceeds from Subordinated Debt Issuance $34,288 Illustrative Interest Rate 3.50% For the Twelve Months Ended Year-to-Date 12/31/2018 12/31/2019 12/31/2020 6/30/2021 Investment in Subsidiaries $118,604 $128,147 $145,484 $158,305 Consolidated Equity 121,079 130,256 136,410 143,741 Double Leverage Ratio 98.0% 98.4% 106.7% 110.1% Proposed Subordinated Debt Offering Downstreamed to Bank $25,000 Pro Forma Bank-Level Equity Assuming $25M Downstreamed to Bank $183,305 Pro Forma Double Leverage Ratio 127.5% Total Deposit Interest $4,461 $7,209 $6,341 $2,329 Other Borrowing Interest 645 931 1,761 960 Total Interest Expense 5,106 8,140 8,102 3,289 Pre-tax Income 11,742 9,637 6,240 9,684 Interest Coverage 3.30x 2.18x 1.77x 3.94x New Holding Company Subordinated Debt Expense $613 Pro Forma Interest Coverage 3.33x Pro Forma Interest Coverage (Excluding Deposit Expense) 6.77x Assumes a 1.75% placement agent fee and $100,000 in other offering expenses Source: S&P Global Market Intelligence; Earnings release 26DOUBLE LEVERAGE AND INTEREST COVERAGE $ in thousands Assumptions Amount of Net Proceeds Downstreamed to Bank $25,000 Net Proceeds from Subordinated Debt Issuance $34,288 Illustrative Interest Rate 3.50% For the Twelve Months Ended Year-to-Date 12/31/2018 12/31/2019 12/31/2020 6/30/2021 Investment in Subsidiaries $118,604 $128,147 $145,484 $158,305 Consolidated Equity 121,079 130,256 136,410 143,741 Double Leverage Ratio 98.0% 98.4% 106.7% 110.1% Proposed Subordinated Debt Offering Downstreamed to Bank $25,000 Pro Forma Bank-Level Equity Assuming $25M Downstreamed to Bank $183,305 Pro Forma Double Leverage Ratio 127.5% Total Deposit Interest $4,461 $7,209 $6,341 $2,329 Other Borrowing Interest 645 931 1,761 960 Total Interest Expense 5,106 8,140 8,102 3,289 Pre-tax Income 11,742 9,637 6,240 9,684 Interest Coverage 3.30x 2.18x 1.77x 3.94x New Holding Company Subordinated Debt Expense $613 Pro Forma Interest Coverage 3.33x Pro Forma Interest Coverage (Excluding Deposit Expense) 6.77x Assumes a 1.75% placement agent fee and $100,000 in other offering expenses Source: S&P Global Market Intelligence; Earnings release 26

SUMMARY Northern California Strong commercial loan Experienced management commercial business bank portfolio with corresponding team and seasoned C&I with a disciplined approach commercial relationship relationship managers to credit underwriting deposits Keen focus on relationship Proven organic and core deposits in deposit rich acquisition growth industries capabilities 27 3SUMMARY Northern California Strong commercial loan Experienced management commercial business bank portfolio with corresponding team and seasoned C&I with a disciplined approach commercial relationship relationship managers to credit underwriting deposits Keen focus on relationship Proven organic and core deposits in deposit rich acquisition growth industries capabilities 27 3

THANK YOU 28THANK YOU 28